Detection, diagnosis, and prognosis - Nvlpubs.nist.gov
384
NBS SPECIAL PUBLICATION U.S. DEPARTMENT OF COMMERCE/National Bureau of Standards Detection, Diagnosis, and Prognosis MFPG 28th Meeting
-
Upload
khangminh22 -
Category
Documents
-
view
0 -
download
0
Transcript of Detection, diagnosis, and prognosis - Nvlpubs.nist.gov

NBS SPECIAL PUBLICATION
U.S. DEPARTMENT OF COMMERCE/National Bureau of Standards
Detection, Diagnosis,
and Prognosis
MFPG28th Meeting

NATIONAL BUREAU OF STANDARDS
The National Bureau of Standards 1 was established by an act of Congress March 3, 1901. TheBureau's overall goal is to strengthen and advance the Nation's science and technology andfacilitate their effective application for public benefit. To this end, the Bureau conducts
research and provides: (1) a basis for the Nation's physical measurement system, (2) scientific
and technological services for industry and government, (3) a technical basis for equity in
trade, and (4) technical services to promote public safety. The Bureau's technical work is
performed by the National Measurement Laboratory, the National Engineering Laboratory,
and the Institute for Computer Sciences and Technology.
THE NATIONAL MEASUREMENT LABORATORY provides the national system of
physical and chemical and materials measurement; coordinates the system with measurementsystems of other nations and furnishes essential services leading to accurate and uniform
physical and chemical measurement throughout the Nation's scientific community, industry,
and commerce; conducts materials research leading to improved methods of measurement,
standards, and data on the properties of materials needed by industry, commerce, educational
institutions, and Government; provides advisory and research services to other GovernmentAgencies; develops, produces, and distributes Standard Reference Materials; and provides
calibration services. The Laboratory consists of the following centers:
Absolute Physical Quantities 2 — Radiation Research — Thermodynamics andMolecular Science — Analytical Chemistry — Materials Science.
THE NATIONAL ENGINEERING LABORATORY provides technology and technical
services to users in the public and private sectors to address national needs and to solve
national problems in the public interest; conducts research in engineering and applied science
in support of objectives in these efforts; builds and maintains competence in the necessary
disciplines required to carry out this research and technical service; develops engineering data
and measurement capabilities; provides engineering measurement traceability services;
develops test methods and proposes engineering standards and code changes; develops and
proposes new engineering practices; and develops and improves mechanisms to transfer
results of its research to the utlimate user. The Laboratory consists of the following centers:
Applied Mathematics — Electronics and Electrical Engineering 2 — Mechanical
Engineering and Process Technology 2 — Building Technology — Fire Research —Consumer Product Technology — Field Methods.
THE INSTITUTE FOR COMPUTER SCIENCES AND TECHNOLOGY conducts
research and provides scientific and technical services to aid Federal Agencies in the selection,
acquisition, application, and use of computer technology to improve effectiveness and
economy in Government operations in accordance with Public Law 89-306 (40 U.S.C. 759),
relevant Executive Orders, and other directives; carries out this mission by managing the
Federal Information Processing Standards Program, developing Federal ADP standards
guidelines, and managing Federal participation in ADP voluntary standardization activities;
provides scientific and technological advisory services and assistance to Federal Agencies; and
provides the technical foundation for computer-related policies of the Federal Government.
The Institute consists of the following divisions:
Systems and Software — Computer Systems Engineering — Information Technology.
'Headquarters and Laboratories at Gaithersburg, Maryland, unless otherwise noted;
mailing address Washington,D.C. 20234.!Some divisions within the center are located at Boulder, Colorado, 80303.
The National Bureau of Standards was reorganized, effective April 9, 1978.
MFPGDetection, Diagnosis, and Prognosis
Proceedings of the 28th Meeting of the
Mechanical Failures Prevention Group,
held at San Antonio, Texas
November 28-30, 1978
«ATlOWAt BUREAUOf ffCAtfDASM
U8BABY
JUL 1 3 1981
Ocfoo
no. SV7
/ft?
c. >
Edited by
T.R. Shives and W.A. Willard
National Measurement Laboratory
National Bureau of Standards
Washington, D.C. 20234
The 28th meeting of the MFPG and these proceedings were sponsored by the Center for Materials Science
of the National Bureau of Standards, Washington, DC 20234; the Office of Naval Research, Department of
the Navy, Arlington, VA 22217; the Naval Air Development Center, Department of the Navy, Warminster,
PA 1 8974; the Department of Energy -Fossil Energy, Washington, DC 20545; and the National Aeronautics
and Space Administration, Goddard Space Flight Center, Greenbelt, MD 20771.
U.S. DEPARTMENT 0*F COMMERCE, Juanita M. Kreps, Secretary
Jordan J. Baruch, Assistant Secretary for Science and Technology
NATIONAL BUREAU OF STANDARDS, Ernest Ambler, Director
Issued July 1979

Library of Congress Catalog Card Number: 79-600078
National Bureau of Standards Special Publication 547
Nat. Bur. Stand. (U.S.), Spec. Publ. 547, 368 pages (July 1979)
CODEN: XNBSAV
U.S. GOVERNMENT PRINTING OFFICE
WASHINGTON: 1979
For sale by the Superintendent of Documents. U.S. Government Printing Office, Washington, D.C. 20402
Stock No. 003-003-02083-4 Price $7.00
(Add 25 percent additional for other than U.S. mailing).

FOREWORD
The 28th meeting of the Mechanical Failures Prevention Group was heldNovember 28-30 at the Oak Hills Motor Inn in San Antonio, Texas. Theprogram was organized by the Detection, Diagnosis, and Prognosis Com-mittee under the chairmanship of Henry R. Hegner of the ManTech of NewJersey Corporation. The committee, the session chairmen, and espe-cially the speakers are to be commended for the excellent program.
Most of the papers in these proceedings are presented as submitted bythe author on camera ready copy. Some moderate editorial changes wererequired in a few instances.
The MFPG is grateful for the cooperation and assistance provided by theSouthwest Research Institute in hosting the meeting. Special thanks goto Richard B. Curtin, Director, Data Systems Department of SwRI forcoordinating the meeting, and to David Black of the SwRI SpecialPrograms Office and Mrs. Thelma Greene for making the hotel and meetingarrangements
.
Special appreciation is extended to Jerry Philips of the Naval ShipResearch and Development Center for his handling of the meetingpublicity and to Robert M. Whittier, Endevco Corporation, for assistancein the mailing and distribution of the meeting announcements.
Appreciation also is extended to the following members of the NBSFracture and Deformation Division: T. Robert Shives and William A.
Willard for their editing, organization, and preparation of theproceedings, and Leonard C. Smith and Joel C. Sauter for photographicwork. Gratitude is expressed to the following members of the NBSCenter for Materials Science. Larry W. Ketron for drafting work andMarian L. Slusser for typing.
HARRY C. BURNETTExecutive Secretary, MFPG
Center for Materials ScienceNational Bureau of Standards
III

TABLE OF CONTENTS
Page
FOREWORD III
SESSION I: AEROSPACE APPLICATIONS
1. Space Shuttle Diagnostics. Dennis J. Webb 3
2. Multispectral Scanner on LANDSAT. Stephen M. Gritton 17and A. Bernard Marchant*
3. Drivetrain Bearing Analysis. Thomas C. Belrose and 31David Board*
4. Light Helicopter Detection, Diagnosis and Prognosis 36Objectives and Applications. Henry G. Smith*and Robert E. Rohtert
5. Gas Turbines and Millimeter-Wave Radar. N. Bruce Kramer 58
SESSION II: LAND BASED APPLICATIONS
1. Improving Vehicle Life-Cycle Reliability by Prognostic 65
Maintenance Management through Geriometry.Richard G. Salter
2. Motor Vehicle Fault Detection and Diagnosis. 78
Joseph J. Innes
3. Diagnosis of Combat Vehicle Systems Using Simplified 98
Test Equipment. T. E. Fitzpatrick, R. E. Hanson,and F. W. Hohn (paper was presented by Richard T.
Cowley, RCA)
4. Automated Vehicular Test Equipment. L. Thomas Carter 111
SESSION III: MARINE APPLICATIONS
1. The Acoustic Valve Leak Detector - A New Tool for 129
Fluid Systems Maintenance. Joseph G. Dimmick*and Joseph W. Dickey
2. Pielstick Engine Diagnostics. A. Genot 153
3. Machinery Condition Analysis for Maintenance Planning - 167
The Aircraft Carrier Experience. Michael D.
Dougherty (paper was presented by Mark Libby,U.S. Navy - PERA (CV)
)
IV

4. Diesel Engine Analysis: Past Experience and Future 176Plans. Harold W. Rethmann
5. Fiber Optics for Bearing Performance Monitoring. 191Gerald J. Philips
SESSION IV: INDUSTRIAL APPLICATIONS
1. Statistical Techniques for Automating the Detection 203of Anomalous Performance in Rotating Machinery.K. R. Piety* and T. E. Magette
2. Vibration Analysis Method for Detection of Abnormal 232Movement of Material in a Rotary Dissolver.C. M. Smith*, D. N. Fry, and W. T. King
3. Monitoring Inlet Steam Valves of PWR 900 MW Turbo- 250generators. A. Jaudet and J. C. Sol*
4. An Approach to Monitoring Existing Utility Turbo- 280generators . S . Doughty
5. Enhancing Machinery Protection through Automated 286Diagnostics. J. L. Frarey
SESSION V: NEW TECHNOLOGY
1. Report on Industry/Joint Services Project Task 299Group 1-d. J. P. Wright
2. A Polymer Sensor for Monitoring Bail-Bearing Condition. 303
Seymour Edelman, James M. Kenney, John F. Mayo-Wells,and Steven C. Roth*
3. An Instrumentation Technique to Evaluate Spectra for 315
Engine Diagnostics. Tony Carolan
4. The Direct Reading Ferrograph. Daniel P. Anderson 323
5. An Advanced Real-Time Oil Debris Monitor. T. E. Tauber 330
6. A Practical Approach to Aircraft System Component 345
Malfunction Diagnosis. F. E. Bishop
APPENDIX
List of Registrants for the 28th MFPG Meeting. 361
MFPG Publications 368
*Indicates speaker when a paper had more than one author.
V

ABSTRACT
These proceedings consist of a group of twenty five submittedpapers from the 28th meeting of the Mechanical Failures PreventionGroup which was held in San Antonio, Texas, November 28-30, 1978. Thecentral theme of the proceedings deals with detection, diagnosis, andprognosis as related to mechanical failure prevention. Special emphasisis on aerospace applications, land based applications, marine appli-cations and industrial applications.
Key Words : Bearing analysis; condition monitoring; engine diagnosis;failure detection; failure diagnosis; failure prevention; maintenance;performance monitoring.
UNITS AND SYMBOLS
Customary United States units and symbols appear in some of thepapers in these proceedings. The participants in the 28th meeting ofthe Mechanical Failures Prevention Group have used the establishedunits and symbols commonly employed in their professional fields.However, as an aid to the reader in increasing familiarity with andusage of the metric system of units (SI) , the following references aregiven
:
NBS Special Publication, SP330, 1977 Edition, "The International Systemof Units."
ISO International Standard 1000 (1973 Edition) , "SI Units and Recommen-dations for Use of Their Multiples."
E380-76 ASTM/IEEE Standard Metric Practice (Institute of Electrical andElectronics Engineers, Inc ., Standard 268-1976).
Disclaimer
:
Certain trade names and company products are identified in order
to adequately specify the experimental procedure. In no case does such
identification imply recommendation or endorsement by the NationalBureau of Standards, nor does it imply that the products are necessarilythe best available for the purpose. Views expressed by the variousauthors are their own and do not necessarily represent those of the
National Bureau of Standards.
VI

j
SESSION I
AEROSPACE APPLICATIONS
Chairman: Robert R. Holden
Hughes Aircraft Company
Co-Chairman: John George
Parks College of St. Louis University


SPACE SHUTTLE DIAGNOSTICS
Dennis J. WebbNASA Johnson Space Center
Flight Operations DirectorateHouston, Texas 77058
Abstract : The Space Shuttle Orbiter employs an elaborate onboard fail-ure diagnosis system. Failure detection, accomplished in a variety ofways by the vehicle's data processing system, provides aural and visualcues to the flight crew on vehicle anomalies. In some cases, redundancymanagement is automatically performed to compensate for the failure.The flight crew then refers to a comprehensive body of malfunction pro-cedures, developed by mission control center personnel, to analyze thedetailed symptoms, identify the scope of the failure, and reconfigurethe vehicle for safe continuation of the mission. Operational verifica-tion of the diagnosis system and training in its use by the flight crewand mission control center personnel is accomplished by classroom in-
struction and simulation experience. Examples and philosophy of thediagnosis system design and the responsibilities of the flight crew andmission control are discussed.
Key words : Manned spaceflight failures; automatic monitoring; failureannunciation; redundancy management; malfunction procedures; trainingfor diagnosis.
Introduction
The Space Transportation System, with the reuseable Orbiter vehicle,represents a significant challenge to existing procedures and philoso-phies of failure detection and diagnosis in manned spaceflight. TheOrbiter is one of the most complex space vehicles ever built, incorpor-ating many systems new to manned spaceflight; e.g., hydraulic aerosur-face actuation powered by hydrazine energized turbine, a flexible dataprocessing system of five computers capable of redundant program execu-tion, and large reuseable rocket engines. The high volume of flightswith up to three vehicles in orbit simultaneously, indicates a morelimited ground support effort per vehicle and a more autonomous flightcrew and spacecraft. The Orbiter must be flexible enough to supportdifferent payloads or payload combinations with only a seven-day groundturnaround period for vehicle reconfiguration. Clearly the business ofoperating the Orbiter is different from that of previous space programswhere unique, single use vehicles were managed with a large groundsupport effort.
5

The consequences of failures in manned spaceflight range from minorirritation to very serious circumstance. Often the required action is
merely the operation of a switch by the flight crew to engage a redun-dant system, but there are failures which require major reconfigurationof the vehicle or significant change in the management plan.
In order to effectively cope with the serious implications of failurein spaceflight, NASA has taken a number of significant steps. First,although a description is beyond the scope of this paper, the Orbiterhas been designed and is being built and qualified by the exhaustiveprocesses which have become standard in the high technology aerospaceindustry. A significant design feature is the implementation of an ex-tensive and flexible system of redundancy. Second, the Orbiter hasbeen endowed with a powerful onboard data processing system which is
tasked with a significant share of the monitoring and control activity.Finally, the flight crew and ground support team prepare for the mis-sion through participation in the Orbiter design process, developmentof operational and malfunction procedures and guidelines, classroomtraining, and a comprehensive sequence of flight simulations.
Failure Detection System
The central element in the failure detection system is the data proces-sing system (DPS) which is composed of five unique computers interfacedwith a variety of input/output devices so that the computers can moni-tor vehicle status and send commands to the hardware subsystems whichinclude a cathode ray tube (CRT) display and keyboard system for crewinteraction. For the critical phases of ascent, on-orbit maneuvers,and entry, the computers are run redundantly, synchronously executingthe same programs to protect against DPS failures. The flight softwareutilization is divided between flight critical functions (guidance,navigation, and flight control) and mission critical functions (elec-trical power, environmental control, communications, mechanical systemsand payload support). Included across all of these programs is a fail-ure detection and identification system.
Fault Detection and Annunciation
To use the DPS resources and design effort most efficiently, automaticmonitoring is accomplished where possible by processors operatingrepetitively on tabularly formatted data. One such processor is faultdetection and annunciation (FDA), a part of the mission critical sys-tems management program. FDA processes approximately 450 measurementsincluding discretes, analogs (voltages, currents, pressures, tempera-tures, flow rates, etc.), and other more unique indicators.
FDA detects failures by comparing the current value of each measurementto a specified set of high and low limits which bound an acceptable
range of system behavior. If the referenced value is outside of this
range for more than a specified number of samples, the out-of-1 imits
k

condition is annunciated. Orbiter standard annunciation (Table 1) iscomposed of a scale of critical ity which maps to a priority scheme ofcrew response. In case of a rapid sequence of annunciation, the crewmust respond to the most critical failures first.
ALARM CLASS/TITLE IMPLICATION AURAL CUE VISUAL CUES
1 : EMERGENCY RAPID LOSS OF CABIN PRESS
DETECTION OF SMOKE
KLAXONSIREN
RAPID AP LIGHTSMOKE LIGHTSMASTER ALARM LIGHTS
2: CAUTION &
WARNINGIMMEDIATE CREW SAFETY
EVENTUAL LOSS OF VEHICLE
DUAL TONE INDIVIDUAL C&W LIGHTBACKUP C&W LIGHTRED MASTER ALARM LIGHTSFAULT MESSAGE!
3: ALERT LOSS OF CAPABILITY SINGLE TONE^.rlALLl UUI\nl lull j
BLUE ALERT LIGHTrnUL 1 1 iLo jMul
4: (SPARE) NONE FAULT MESSAGE
5: OPERATOR
ERROR
ILLEGAL OPERATORCOMMAND TO DATAPROCESSING SYSTEM
NONE FAULT MESSAGE ONLY ON
CRT WHERE ERROR OCCURED"ILLEGAL ENTRY"
Table 1 Orbiter Annunciation
Two classes of computer annunciation are of particular interest. Class2 is a backup to the traditional caution and warning system which de-tects and annunciates failures which relate directly to crew safety.Class 3 or "Alert" annunciation signifies the loss or impending loss ofa capability which by itself does not relate immediately to crew safety.Each class provides unique aural and visual cues which include a faultmessage which indicates the time of occurrence, the general area offailure, and the number of the appropriate display format that can beviewed by the crew on the CRT's. The fault message appears flashing atthe bottom of each of the four CRT units and remains until acknowledgedby the crew via the keyboard.
In many cases, systems and parameter behavior is a function of changingvehicle or systems configuration as well as failure. To cope with thisproblem, FDA allows a measurement to have multiple limit sets, eachequipped with a logical statement which defines the corresponding con-figuration. The logical statements are composed of a logical combina-tion of one to four configuration measurements, usually discretes.This process of automatic limit set selection is called precondition-ing.
5

A useful example of the FDA process is the design for monitoring thepressure across one of the water coolant loop pumps. As a critical com-ponent in the vehicle cooling system, the water pump must be monitoredto detect line blockage or leaks, pump degradation or failure, so thatthe system may be reconfigured to compensate for or correct the problem.Pump 2 (Figure 1) is controlled by a three-position switch which allowsON, OFF, and GPC (general purpose computer) modes of operation. ON andOFF are self-evident and GPC mode enables the DPS to periodically turnon the pump. One water loop is circulating all the time, leaving theredundant loop stagnated. To prevent the stagnated loop from freezing,the computer automatically commands the pump on for four minutes every 6
hours. The computer subtracts the pump inlet pressure from the outletpressure to give a delta pressure value that indicates pump and loophealth as well as on/off status of the pump. Further, the position ofthe switch is monitored via discrete indicators wired from the ON andGPC positions.
The FDA process is illustrated in Figure 2. First, the configuration is
determined. The pump should be running if either the switch is in the
ON position, or if the switch is in the GPC position, and the computerhas commanded the pump ON. This logical statement, when true, will
select the "pump running" limit set. The pump will not be running if
H20 PUMP
LOOP 2
V 30 AC
GPC
OFF
ON
V DC
WATERPUMP 2
NOTE: CIRCUIT REDUNDANCY HASBEEN ELIMINATED FORCLARITY
GPC COMMAND:PUMP ON
SWITCH:ON POSITION
SWITCH:
GPC POSITIONINLET
PRESSUREOUTLETPRESSURE
INPUT/OUTPUTSYSTEM
HARDWARE
SOFTWARE
WATER LOOP
CONTROL SEQUENCER FDA
Figure 1 Water Pump 2 Control and Monitoring,
6

the switch is in the OFF position (not ON and not 6PC) or if the switchis in the GPC position but the computer has not commanded the pump on.
This logical statement, when true, will select the pump not-runninglimit set. Should both statements be true or false due to failure ofthe switch, power source, or data acquisition device, the "pump running"limit set will be selected. FDA then compares the current sample of thedelta pressure across the pump to the selected limit set, and if thevalue is greater than the high limit or less than the low limit, FDAwill initiate annunciation. As this is a class 3 alert parameter,annunciation takes the form of the 4-second 500 Hz alert tone, illumina-tion of the blue alert light at the front of the cockpit, which persistsuntil acknowledged by the crew via the keyboard, and the fault message"S88 THERMAL H2O" flashing on the crew CRT which refers the crew to CRTpage 88 where they may view the delta pressure value and associatedmeasurements and proceed with the diagnosis.
REDUNDANCY MANAGEMENT
The Orbiter uses an extensive system of redundancy across all vehiclesystems. The flight critical systems which control the vehicle are re-
quired to be tolerant to one failure with no loss of capability and a
second failure leaving the vehicle in a safe configuration; this attri-bute is called fail -operational , fail-safe. Due to the complexity of
• PUMP RUNNING: (SWITCH=0N) OR [(SWITCH=GPC) AND (GPC C0MMAND=0N)]
ACCEPTABLE RANGE: 35 TO 50 PSID
• PUMP NOT RUNNING: [(SWITCH^ON) AND (SWITCH^GPC)] OR [(SWITCH=GPC) AND (GPC C0MMAND=0FF)]
ACCEPTABLE RANGE: 0 TO 5 PSID
Figure 2 Water Pump 2 Fault Detection and Annunciation
7

the redundancy scheme in these systems, the DPS often performs automaticredundancy management (RM) to reconfigure around a failure. This pro-cessing is particularly beneficial because the crew is freed to make the
decisions which are beyond the capability of the simple logic and thecomputer can respond faster than the crew could. In some cases, fail-ures of redundant data or control items are annunciated either as infor-mation to the crew or as a request for a decision.
While RM is performed on a variety of devices (inertia! measurementunits, engine control systems, switches), the RM program which processesthe rotation hand controllers (RHC) is a useful illustration. The RHC,loosely defined, is the "stick" which enables the crew to manually con-trol the vehicle attitude as is occasionally required during on-orbitmaneuvers and the glide to the landing field as a conventional aircraft.As a failure of the RHC capability could lead to loss of the crew andvehicle, RM is performed on three redundant stick position channels foreach of the three degrees of freedom of pitch, roll, and yaw.
Figure 3 is a block diagram illustrating the hardware and associated RMdesign for each of the three RHC's. Each degree of freedom (pitch ilr
lustrated) has three independent redundantly powered transducers which
i
PITCH CHANNEL(SAME FORYAW AND ROLL)
NOTE: TRANSDUCERSARE ACTUALLYLINEAR VARIABLEDIFFERENTIALTRANSFORMERS
DATAACQUISITIONSYSTEM
COMM-FAULTS
HARDWARE
DETECTION,
MIS-COMPARES
AB
BC
CA
IDENT
FAILS
SOFTWARE
SELECTION FILTER
VALUESELECTION
SELECTED
VALUE
MODE SELECT
MODES
3 GOOD: MID VAL
2 GOOD: AVERAGE
1 GOOD: PASS
0 GOOD: INVALDATA BAD
CLASS 2 OR 3 ANNUNCIATION:
"RHC L"
Figure 3 Rotation Hand Controller Redundancy Management (RHC RM)
8

put out a -5-volt to +5-volt signal which is a function of position ofthe RHC. These measurements are made available to the software by thedata acquisition system; the signals are routed through redundant dataacquisition units and data buses to the computers which are also opera-ting redundantly for failure tolerance. Should the failure of acquisi-tion hardware or timing cause loss of current data to the computers, a
"commfault" bit associated with each affected parameter is set so thatsubsequent processing may be aware that the data should not be used.Failures in the data acquisition system are annunciated by other pro-grams as class 3 alerts.
RM first processes the values and their commfaults to determine if anyof the transducers have failed. This fault detection is accomplished bycomparing the position values (A, B, and C) and providing signals whichindicate which of the three comparisons (AB, BC, CA) indicate that twosignals disagree by more than a specified amount. A miscompare is notdeclared if one of the two parameters is commfaulted because this doesnot positively represent a transducer failure. The commfault is fac-tored into the selection filter processing discussed later. The miscom-pares are evaluated to determine which of the transducers is failed; forexample, if AB and BC miscompares are flagged, transducer B is identi-fied as failed. This information is passed on for annunciation as a
class 3 alert with fault message "RHC X" where "X" is "A" for AFT, "L"
for left (commander), and "R" for right (pilot) indicating which RHC has
a single failure. On the second failure, class 2 caution and warningannunciation (with the same fault message as the class 3) is issued
which would warn the crew that RHC is unuseable. The fail/not fail
states of the three transducers are passed, with the commfaults and
values, to the selection filter which ultimately determines the pitch
command value to be used by subsequent processing which rotates the ve-hicle to the desired attitude. The fail /not fail states and commfaultsare processed to determine the current level of redundancy. For a sig-
nal to be considered, it must not be failed and not be commfaulted. Ifall signals are good, then the middle value of the three is sent out as
the position of the RHC. If one of the signals is bad, the average ofthe other two is sent out. If only one value is good, it is sent out.If all are bad, no value is sent out and a data bad flag is set as an
indication to the subsequent processing which subsequently ignores thatRHC.
This system of RM is representative of the generic capability. In morecomplex systems, more failure indicators are available in the form ofbuilt in test equipment (BITE) which is a part of many of the more com-plex devices. BITE indicators are usually formed from a group of bi-level indicators, each indicating the result of a particular self-testoperation within the device. A simpler form of RM processes redundantswitch contacts, where switch position is determined by two-out-of-three voting, "or" operations or "and" operations depending on the cir-cumstance and level of redundancy.
9

Other Failure Detection Methods
In many cases, failure detection cannot be accomplished by a standard-ized process such as FDA or RM, due to the complexity of subtlety of themonitored hardware or transducers. Here, unique software accomplishesthe necessary monitoring. Where the subsystem hardware and software areclosely bound in a closed-loop control system, the detection is often im-bedded in this unique software as an integral part of the control pro-cess, in many cases, automatically safing the system until the crew cantake corrective action. Some failures generate symptoms that are read-ily apparent to the flight crew and therefore require no software moni-toring. Such symptoms include "cabin uncomfortably hot" or "loss ofcommunications with the ground."
Failure Diagnosis
Once a failure has been detected and recognized, the flight crew beginsthe failure diagnosis. Having determined the general area of the anom-aly from the fault message, the crew refers to a malfunction procedureassociated with the symptom. The malfunction procedures form one volumeof the onboard library of documentation which also includes normal op-erating procedures, checklists, and reference data that the crew uses as
r 2 0 1 1 / / 0 8 8 A P U / E N V I RON T H E R M 2 0 8 3 / 1 6 : 0 5 : 2 6
0 0 0 / 0 1 2 6 : 4 2
F R E 0 N LOOP 1 2 H 2 0 L OOP 1 2
A C C U M Q T Y 7 8 8 1 P U M P 0 U T P 7 0 1 5 +
F R E 0 N FLOW 1 5 0 0 0 0 U T T 6 0 7 6 +
P L H X FLOW 5 0 0 0 + A P 5 5 0
A F T C P FLOW 5 5 0 0 + I C H F L 0 W 5 0 5 5
R A D I N T 1 0 0 9 5 0 U T T 5 9 6 2
C N T L R OUT T 3 8 3 8 CAB H X I N T 5 6 7 6 +
E V A P OUT T 3 7 7 8 A C C U M Q T Y 8 7 8 8
D F I F LOW 4 6 0
E V A P TEMP D U C T N 0 Z A P U
H I LOAD I N B D 9 0 2 6 0 F U E L T 1 2 3
0 U T B D 9 0 8 9 T K S U R F + 6 0 + 6 1 + 6 0
T 0 P P I N G F W D 2 6 0 T K H T R + 6 1 + 6 2 + 5 9
AFT 2 6 0 I S 0 L V L V + 6 0 + 6 3 + 5 8
L 1 5 5 5 0 T E S T L N + 5 9 + 5 9 + 5 8
R 1 5 5 5 0 FEE D L N + 6 1 + 6 0 + 6 3
E V A P F D L N T A B P U M P I N + 6 2 + 5 9 + 6 4
F W D 7 0 7 0 D R N L N + 6 1 + 6 0 + 6 1
MID 1 7 0 7 0 0 U T + 1 0 0 + 1 0 2 + 1 0 1
MID 2 7 0 7 0 B Y P L N + 1 0 0 + 1 0 1 + 1 0 2
AFT 7 0 7 0
S 8 8 THERMAL H 2 0 4 0 8 3 /0 9 1 !
+
Figure 4 - APU/ENVIRON THERM Typical Display
10

"paper memory" in their operation of the vehicle. A malfunction proce-dure is a flow diagram which guides the crew through a logical processof anlaysis and decision to identify the cause of the anomaly and speci-fy appropriate system reconfiguration to prevent further system damageand to minimize the effect of the failure on the mission.
A failure of the previously discussed water pump is a convenient exampleof this diagnosis process. The fault message "S88 THERMAL H2O" signalsan anomaly in the thermal control system water coolant loop. The crewcalls up display format 88 (Figure 4) on one of the computer-driven CRT'sby request through the keyboard. This display, titled APU/ENVIRON THERMdisplays each current measurement value to the right of a descriptivetitle. The H2O loop section is at the upper right of the display. In
this case, FDA has determined that the H2O loop 2 pump P has droppedbelow the low limit and has flagged the anomaly with a "down-arrow"character to the right of the displayed value. The crew then locatesthe associated malfunction procedure (Figure 5) and proceeds with thediagnosis.
The malfunction procedure starts with a statement of the symptom, indi-cated at the lower left of Figure 5. The crew refers to display 88(Figure 4) as the procedure guides them through the analysis which, forthis example, is shown with darkened flow lines. Note that for effici-ency, analysis which is common to more than one procedure appears onlyonce, in this case, on Figure 6. Throughout the analysis, other measure-ments, pump outlet pressure and accumulator quantity, are examined tovalidate the out-of-1 imits condition and determine its precise cause.Figure 6, block 10, has the crew perform a test by manual operation of a
switch with the system response making the next decision. In this case,the diagnosis led to Figure 6, block 13, which identifies the failure asa short in pump winding or loss of one phase of the three-phase AC powersupply and indicates that the effect is degraded thermal control. Otherfailures that could have been diagnosed include failure or shift of oneof the two pressure transducers, leakage at the interchanger or a block-age of the lines. Since the failure is a pump degradation, the pump is
shut down (block 16) and the water loops are reconfigured to minimizethe effect of the failure.
Several features of the malfunction procedure are apparent. First, the
language is very terse for maximum use of page space so that the crewneed not flip back and forth as they diagnose the symptom. Identifica-tion of switches or display nomenclature is in capitals to separate ac-tion from object of action. Also, the conclusion blocks, which completethe diagnosis, are shown in bold outline. Clarifying remarks (see ex-planation of preconditioning, note 6, Figure 5) appear at the right toexplain system behavior or subtleties which may not be readily obviousto the crew. This basic format has been used as far back as the Apolloprogram and is the result of manned spaceflight experience.
11

SYMPTOM PROCEDURE REMARKSECLSS (ARS H20)
7 (Cont)
BLUE
Light on if:
7b _0S88 H20 PUMP
P 1(2)
1 1 H20 LOOP 1(2)PUMP OUT P 1' ?
H20 LOOP 1(2) PUMP
OUT P
< 50 psia> 75 psia
7a
NiYES
2 |H20 LOOP 1(2) NO*.
POmp out P ?
YES
7a 5
^TlTSTTaTaWsoftware fault orsnsr failure
7c J0S88 H20 PUMP
P 1(2)_J1 |
H20 LOOP 1(2)PUMP OUT P 1
H20 LOOP 1(2) PUMPOUT P < 20 psia
YES
3 | H20 LOOP 1(2)ATCUM QTY ' + ' 7
NO,
NO.
2 |CLASS 3 ALARM
SOFTWARE FAULT OR
SNSRJFAILURE
YES
4 | FAILED OR
SHIFTED H20 LOOP
1(2) PUMP OUT P
TRANSDUCER
RIEXTERNAL LEAK
IDTPLETED ACCUM
7d
S88 THERMAL H20 1| H20 LOOP 1(2)
PUMP AP '+' ?
H20 LOOP 1(2) PUMP
AP< 35 ps1d> 50 psid
(> 5 psid - dormant
I Htomp apH20 LOOP 1(2)
?
YES YES
4 | H20 LOOP 1(2)PUMP OUT P ?
iliss 3 ALAftH
SOFTWARE FAULTOR SNSR FAILURE
7a
NO.7a
YES
5 | H20 LOOP 1(2)Pump out p
I
NO,
YES
6 | SHIFT OF H20T7J0P 1(2) PUMP IN
PRESS SENSOR
7a
To Figure 6
Preconditioningwill inhibit thischeck unless the(LI) H20 PUMP LOOP1(2) switch is in
the GPC positionand 1A OR IB GPC ONsignal is present.Preconditioningwill default tothis set of limitsIf the H20 PUMPLOOP 1(2) switch 1s
In the ON position
(A) Preconditioningwill inhibit thischeck unless (LI)H20 PUMP LOOP 1(2)sw 1s in the OFFposition or in theGPC position with-out the presence ofGPC ON signal (usedto check for staticloop leaks)
Preconditioningwill inhibit thelimit range of35-50 psid to anupper limit of 5
psid when the pumpswitches are in theOFF position or in
the GPC positionwithout presence ofGPC ON signal (usedto check for out ofconfiguration orblockage)
0V102/ECLSS/7b-dPRELIM PCN1
Figure 5 Water Pump 2 Malfunction Procedure
12

ECLSS (ARS H20)
7
H20 LOOP
YELLOW
Light on if:
LOOP 1(2) H20 PUMPOUT P
< 45 psia> 79.5(81.0) psia
RED
7a
S88 H20 PUMP
P K2)
Light on if:
LOOP 1(2)H20 PUMPOUT P
< 45 psia> 79(80) psia
NominalConfiguration :
(L4:F)H20 LOOP PUMP
cb 1A/2 (three) -
closecb IB (three) -
closecb 2 (three) -
close
(L4:K)
cb H20 CNTLR 1 -
close
(L4:J)
cb H20 CNTLR 2 -
close
(014:B)
cb H20 BYPASS LOOP1 SNSR - close
(015:B)cb H20 BYPASS LOOP2 SNSR - close
(LI)
H20 PUMPLOOP 2(1) - ONLOOP 1(2) - GPCLOOP 1 - B(A)
LOOP 1,2 BYPASSMODE - MAN
D• SM, SPEC 88 PRO
(APU/ENVIRON
THERMAL)H20 LOOP 1(2) PUMPOUT P ' ?
7b
NO 2|H20 LOOP 1(2)
PUMP OUT P '' ?
noJ 5Ic7U FAILURE
YES
7d
ATJCUM QTY '' ?
7b
NO YES
5 | H20ATCUM QTV
NOJ
YES
7d
LOOP 1(2)
7|EXTERNAL
IFAK DEPLETEDACCUMULATOR
7d
16
YES,,
NO
11rtmim
UAKAGE AT THEINTERCHANGER
I16
8 1H20 flow check
TUT)• H20 LOOP 1(2)
BYPASS MAN -
INCR (obtain minICH Flow'
H20 LOOP 1(2) ICH
FLOW > 550 Ib/hr ?
YES^
9 | SHIFT n mLOOP 1(2) PUMPOUT P SENSOR
NO
161 H20 flow check
xa.• H20 LOOP 1(2)
BYPASS MAN -
INCR (obtain minICH Flow)
H20 LOOP 1(2) ICH
FLOW >550 lb/hr ?
!N0
111 m LMP 1(2)BTOCKAGE OR FLOWRESTRICTION
YES
TSf SHORT IN
PUMP WINDINGOR LOSS OF
ONE AC PHASE.
DEGRADEDTHERMALCONTROL
LOOP 1
LOOP 1
16
14|H20 Loop 1
Tump shutdown or
reconfiguration
TTTT• H20 PUMP LOOP 1
A/B - A(B)H20 LOOP 1 ICHFLOW > 550 lb/hr ?
I LOOP 2 NO
! Finn!; . . IT1®^^^^^^^^]16| H20 Loop 1(2)
Pump shutdown(LI)
12| H20 Loop 1(2)reconfigurationHTt H20 LOOP 1(2)
BYPASS MAN -
DECR(CRT)
t Verify H20 LOOP
1(2) ICH FLOW =
950 lb/hr(R13)
• Reset C/W low
limit on H20PUMP OUT P basedon shift [item
105(115)]
YES.
11
H20 PUMP• LOOP 1(2) - OFF• LOOP 2(1) - ONt H20 LOOP 2(1)
BYPASS MAN -
DECR (INCR)until H20 LOOP
2(1) ICH FLOW =
950 lb/hr(R13)
• Inhibit Loop 1
(2) C/W lowlimit on PUMPOUT P [Item 105
(115)1
15| Adjust H20loop 1 ICH flow
nn
—
• H20 LOOP 1 BY-
PASS MAN - DECR(INCR)
(CRT)
• Verify H20 LOOP1 ICH FLOW =
950 lb/hr
® Meter on Pnl 01
is an alternatereadout source
© The upper B/UC/W FDA limits are
slightly differentfrom prime C/W (seeSYMPTOM column).The logic flow andsubsequent actions/failures are thesame as for primeC/W
As pumpsutilize H20 flowfor active cooling,extreme or totalflow blockage willresult in overheat-ing and failure of
pump in a matter of
minutes.
OV102/ECLSS/7aPRELIM PCN1
Figure 6 Water Pump 2 Malfunction Procedure (cont'd)
13
Detection and Diagnosis System Philosophy
The failure detection and diagnosis system has been designed using sev-eral ground rules for consistency to simplify training and to maximizethe design effectiveness within the DPS and flight crew capabilities.First, although an apparently obvious consideration, is the exclusion ofthose failures for which there is no corrective action or effect on thecontinuation of the mission,, Second, is the exclusion of failures whichdo not require corrective intervention within two hours, the longest ex-pected period without communication with the mission control center.The Houston facility receives telemetered vehicle systems data at a
greater level of detail than is displayed onboard the Orbiter, and is
therefore responsible for "catching" these failures. Also, while thedetection system will indicate any anomaly which occurs, the malfunctionprocedures are designed for diagnosis of only single failures within a
unit or subsystem. This rule is grounded in the fact that the probabil-ity of several independent failures occuring within a system is equal to
the product of their individual probabilities, a value which decreasesrapidly as the number of failures increases. Experience has shown thatthe amount of analysis (or complexity of malfunction procedures) is
approximately proportional to the power of the number of failures. Mul-tiple failures are therefore also the responsibility of the mission con-trol center, thus simplifying the onboard malfunction procedures andcrew training. Where the malfunction procedure cannot diagnose the
actual failure, it instructs the crew to invoke a redundant unit or tosafe the system. With these rules enforced, the detection and diagnosiswill yield a rapid and effective response to failure.
Training for Diagnosis
The flight crews and mission control center personnel follow an inten-sive program of training for each mission, the primary goal being an
integrated common base of understanding of vehicle systems and onboardand ground procedures among the personnel involved in actual missionoperations. This, of course, includes training in the detection and
diagnosis system described in this paper.
Training is composed of a sequence of classes produced within the mis-sion control organizations for informal crosstraining among specialistsand formal classroom training by an independent training division formore general use. Detailed exercises in the interaction with the detec-tion system and use of malfunction procedures first occur in the varioussimulator facilities.
The first facility which exercises procedures is a low cost mediumfidelity simulator called the Single Systems Trainer (SST), which can
model at a given time one of the major subsystems (electrical, environ-mental, navigation, etc.) with a computer modeling the subsystem hard-ware and software. The simulator is under the control of an instructorwho initiates simulated failures for the student to diagnose. This
Ik

facility has been instrumental in debugging not only malfunction proce-dures but normal systems operations as well. This provides early feed-back to correct the procedures prior to their use in the actual vehicle.
The final stage of training is the integrated simulation which has theflight crew stationed in the Shuttle Mission Simulator (SMS) and themission controllers at their consoles in the mission control center(MCC). The SMS is a high fidelity flight deck simulator which featurescomputer generated visuals, a motion base to give the appropriate "feel"of vehicle dynamics and Orbiter GPC's, processing flight software, inter-faced with other computers simulating input/output devices which in turnconnect with software models of the vehicle subsystems. The SMS pro-vides a two-way voice and data link with the MCC, just as the Orbiterwould during a mission. The MCC, configured as it would be for a mis-sion, is staffed by the mission controllers who can view simulated sys-tems data to perform the detailed analysis and management function. Thesimulation is conducted by the training division personnel who createfailures for the crew and MCC to diagnose. Generally, over the courseof integrated simulations, all onboard and MCC procedures are exercisedas a final premission verification and test of compatibility among theelements of the operational system.
Conclusion
The Orbiter failure detection and diagnosis system, composed of the dataprocessing system, the flight crew, the mission control center, and the
malfunction procedures, is responsible for reaction to failure occur-rence during a Space Transportation System mission. Failure detectionis usually the responsibility of the data processing system, which pro-
vides, through a variety of programs, a standardized annunciation in
response to an anomaly. The crew, aided by the malfunction procedure,performs the detailed diagnosis to identify the cause of the symptom.The mission control center provides any monitoring and analysis which is
beyond the capability of the Orbiter and crew. The flight crew and mis-sion control personnel follow a sequence of training activities whichprovides commonality of knowledge and verification of the detection anddiagnosis system.
Currently, NASA is preparing for the first orbital test of the SpaceShuttle. Although the Approach and Landing Test flights, during thefall of 1977, verified the airworthiness of the vehicle and its fly-by-wire control system for landing, the program only began to scratch thesurface of automatic onboard failure detection. The design discussedwill be used for the first few orbital flights and therefore reflects a
healthy caution that is due a test vehicle during shakedown trials. Asin past programs, these missions will be conducted with extensive real-time monitoring, management and troubleshooting by the Houston missioncontrol center. The present design is the response to this particularchallenge.
15

The mature Space Transportation System will rely heavily on the inde-pendence of the spacecraft and crew to accomplish the mission objectiveswithout exhaustive MCC support.. Coincident with the increasing confi-dence in the basic vehicle systems will be an increase in payload supportactivities which include detection, diagnosis, and action for recovery.The standards and methods discussed here will be applied to the designof this Orbiter support of the payloads which, on examination of presentcommitments, form a wide-ranging spectrum of unique mission requirements.The standardization of the response to failure, with remote autonomy, areessential to the cost-effectiveness of a truly operational Space Trans-portation System. This is the challenge of the immediate future.
16

MULTISPECTRAL SCANNER ON LANDSAT
Stephen M. GrittonA. Bernard Marchant
Hughes Aircraft CompanyCulver City, California 90230
Abstract: The multispectral scanner (MSS) is described; it is an instru-ment onboard the earth resources satellite that was formerly calledERTS, but is now referred to as LANDSAT. Since July 1972, three scan-ners have been launched that have provided tens of thousands of picturesof the earth. The scanning mechanism that produces these pictures hasproven to be extremely reliable and repeatable. After the first scannerwas turned off after five years of operation in orbit, the scan mirrorhad accumulated 90 million cycles and was still performing flawlessly.The design approach that was taken in order to achieve reliability is
discussed as well as the scan monitor that serves both to provide a cor-rection signal for data processing on the ground and as a diagnosticdevice to detect impending trouble.
SCANNER OBJECTIVES
The four-band multispectral scanner (MSS) system is designed to providethe capability for collecting earth imagery from the LANDSAT spacecraft.The scanner portion of the system employs all reflective optics to
accommodate the four spectral bands, which occupy a broad spectralrange from visible to near infrared. Use of a single optical system forall spectral bands ensures the excellent registration needed for signa-ture analysis of agricultural scenes. Systematic coverage of the earthwith nearly uniform lighting is obtained via the near-polar sun synchro-nous orbit. The 496-nmi altitude permits the scanner to image theentire earth every 18 days with a usable resolution of 225 ft.
SCANNER
The scanner is designed to scan a 100-nmi swath on the earth and to
record imagery in each of four spectral bands simultaneously. Anoscillating mirror provides the crosstrack scan, and the orbital prog-ress of the spacecraft provides the scan along the track. The scanmirror, shown schematically in Figure 1, is at 45° with respect to the
earth and the double-reflector, Ritchey Cretien type telescope. The±2.9° motion of the mirror scans a field of view of 11.6°.
IT

A four by six fiber optics array is placed in the focal plane of thetelescope: there are six fibers in a column and there is one column foreach of four colors. Each fiber defines an instantaneous field of view(IFOV) of the earth. The image of the earth is swept across the fiberarray each mirror scan. Light impinging on the glass fiber is conductedto an individual detector. An optical filter is combined with eachdetector to determine the spectral band. By operating the mirror at a
rate of 13.62 Hz, the orbital velocity is precisely such that the sub-spacecraft ground track advances six IFOVs , and the next line imaged bythe first detector in each band is contiguous to the sixth line of theprevious scan.
The 13.62-Hz mirror drive signal is derived by the multiplexer from itsmaster oscillator, which operates at approximately 30 MHz. Word andbit rates are derived from internal division of the 13.62-Hz scan fre-quency and are maintained uniformly from scan to scan. Only the linestart synchronization pulse need be acquired in each scan. The linestart pulse, generated by the scan monitor, is used to reset and initiatethe multiplexer sampling sequence. Resetting the sampling frame withthe scan monitor makes the start of sampling completely angle dependentand therefore immune to small timing variations that could arise fromthe scan mechanism. The 24 channels are multiplexed into a 15-Mbpsstream, which is sent along with a bit clock to the spacecraft recordersand transmitters.
SCAN MONITOR
Angle crossings of the scan mirror, which denote the west edge, center,and east edge of the 100-nmi swath, are indicated by means of an opticalpickoff situated so as to view the scan mirror. The beginning pulse is
supplied to the multiplexer wherein it is used to initiate videosampling. The center pulse can be transmitted upon command and is pro-vided for checkout and troubleshooting. The end of line pulse is trans-mitted in the data to allow line-to-line corrections should the scanningmirror show minor variations in time to scan a line.
The scan monitor system shown in Figure 2 consists of a gallium arsenidelaser diode emitter (operating in a sublasing mode) , an optical pro-jection system, a series of reflectors, and a pair of detectors. The
system has a built-in redundancy in the form of two light sources in onepackage, only one of which will operate at any given time; one is
installed on-axis, while the backup must be offset by their minimumcenter-to-center dimension. If one source fails, the redundant unit is
selectable by ground-originated commands.
Any malfunction of the scan mirror mechanism will show up as a sudden or
erratic change in the time needed to scan a line. Except for tempera-ture sensors, the scan monitor is the only diagnostic device on the scanmirror mechanism.
18

SCAN MIRROR MECHANISM AND OPERATION
The MSS scan mirror mechanism is shown schematically in Figure 3. It
consists of a lightweight beryllium mirror suspended on a pair of flexpivots. There are bumpers, return springs and dampers, an electro-magnetic torquer, and an optical switch. Figure 4 is a drawing of theMSS scan mirror assembly.
The requirement for the scan mirror assembly is that it provide a
constant-velocity scan that is repeatable from one scan to the next.This ensures a ground picture free of distortion with the resolutionelements of one scan lined up with the appropriate resolution elementsof another scan. The design has the mirror rotate on a "frictionlessbearing" with no drive forces acting on it during scan. A flexurepivot is, for the accuracies required of this device, a frictionlessbearing over the scan angles required. It has a small repeatabletorsional spring constant that results in a small but predictable pic-ture distortion. For most user requirements the distortion is insig-nificant. For the most accurate mapping a correction can be made duringground processing to remove this nonlinearity
.
At the end of scan the mirror impacts the bumpers and compresses theturnaround springs. Most of the kinetic energy of the mirror is storedin the springs and returned to the mirror in the retrace direction.During retrace, an electromagnetic torquer adds the energy lost duringthe turnarounds. During the forward scan the mirror coasts. Imagery is
produced only during this half of the cycle. The dampers eliminate anyresidual motion in the bumper/spring assembly before the next impact in
order to ensure repeatable turnaround performance.
The mirror is controlled by a 13.62-Hz mirror drive signal that is
developed from a high-frequency clock aboard the spacecraft and by anoptical switch. The optical switch consists of a light source with a
slit that is imaged onto a photodiode. A reflective surface attached to
the scan mirror is part of the optical path. Motion of the scan mirrorcauses the photodiode to see or not see the slit. The mirror positionat which the signal goes off is determined by the location of theoptical switch.
The relationship of mirror position to the mirror drive and opticalswitch signals is shown in Figure 5. The torquer is turned on by themirror drive signal and turned off by the optical switch. The result is
a simple but stable control system. If the mirror scans too fast its
position advances relative to the mirror drive and the torquer turnsitself off sooner by means of the position-sensitive optical switch.
Less energy is added to the mirror, thus reducing its net velocity. Theopposite is true for a mirror that runs slow. The mirror position is
stable relative to the mirror drive to less than 3 yrad or 4% of a
resolution element.
19

BUMPERS AND SPRINGS
A cross-sectional view of the bumper, spring, and damper assembly is
shown in Figure 6. The bumper impact interface consists of an impactbar made of 17-4 stainless steel and a nylon bumper surface bonded in
the turnaround cups. Nylon was chosen because of its good wear andimpact resistance, suitability for adhesive bonding, and acceptableproperties in a space environment.
A reliability test was conducted by using a bumper/spring/damper unitwith a reduced travel bumper cup assembly driven against the impact bar.The impact velocity and the force-time history of mirror turnaroundwere increased 20% over unit operation. A total of 142,000,000 cycleswere run. The acceptable wear was 2.0 mils; the measured wear was only0.2 mils. Besides indicating acceptable wear the test proved theintegrity of the bond between the nylon and aluminum bumper cup. Aspart of the test, the turnaround springs were also tested at a deflec-tion 20% above their normal deflection. In addition to these tests anintensive analysis of the spring was conducted to make sure that thestress levels were well within values for indefinite life.
DAMPERS
Two elastomeric dampers operate with each bumper/spring unit. Thesedampers dissipate energy via shear distortion as they are displaced±0.019 inch during each scan cycle. A damping coefficient of 0.020 lb-
i
sec/in at a frequency of 125 Hz is specified to correspond with 4-msechalf sine wave turnaround. The dampers must have acceptable outgassingcharacteristics for space environment, maintain an acceptable dampingcoefficient, and show no failure in the elastomer-metal bond. A numberof materials and configurations were tested during the development phaseof the program.
Checks were made during the thermal vacuum test for condensablematerials after four days at the real-time temperature and in a vacuumenvironment of 10~6 torr. For a silicone damper to pass this test, a
postcure at elevated temperature was required. From the results of
tests on the Surveyor, it had been determined that silicone elastomerspostcured at 350°F showed the least change from the initial physicalproperties while still reducing the outgassing to an acceptable level.
Tests made on dampers showed that after a 5-day bake at 350°F in air the
parts had less than a 0.1% weight loss when exposed to 4 days in hard
vacuum, and no oily deposits or condensables could be found.
Life tests were performed on an apparatus that was designed to
simultaneously flex six pairs of dampers. The life test was conductedwith a cyclic shear displacement amplitude of ±0.023 inch. This dis-placement is approximately 20% greater than that actually producedduring impact in the scan mirror mechanism. Three pairs of dampers
20

were tested in the condition in which they were received, and two
additional pairs were tested after an elevated temperature postcure.Dampers were test cycled under the conditions of no prestress, a 0.030-inch compression prestress, and a 0.046-inch shear offset prestress.These mounting variations were evaluated to determine the effect theywould have on the damper fatigue life: no fatigue failures occurred andthe damping changes were comparable; therefore, no prestress was usedin the system. The postcure dampers were harder and had higher dampingconstants. At equal displacements, the postcured dampers received a
higher stress under the test conditions than the dampers in originalcondition. The actual values of the damping constant are compared inFigure 7 for two pairs of dampers from the commercial source that werepostcured. A damping value constant within 5% was maintained. As a
result of the vacuum tests and life testing, the dampers produced by theLord Manufacturing Company of Erie, Pennsylvania, were selected for useon the flight system.
Specifications were generated to provide the necessary controls andscreening procedures. The manufacturer is required to produce partsfrom one controlled lot of materials. After receipt, the dampers are
subjected to a postcure at 350°F. As a lot-acceptance test, ten % of
the lot is tested for condensables and outgassing. Each device that is
used in the system has the damping characteristics measured on a pairbasis.
FLEXURE PIVOTS
Two flexure pivots provide the suspension points for the scan mirror.
These pivots must withstand the launch environment and subsequently
operate at ±2.9° rotation for 150,000,000 cycles. These commercially
available devices are 90° symmetrical two-strip pivots; one of the
strips has been divided to ensure greater lateral rigidity. The
stationary portion of the pivot is brazed to a cylindrical barrel and
the rotating portion is brazed to another cylindrical barrel. The
flexing elements bend to allow rotation of one barrel with respect to
the other. The flexure elements are stamped from close tolerance, cold-
rolled spring stock of type 420 stainless steel. Flexure pivots do not
have a fixed center of rotation. The amount of the change of center of
rotation during rotational displacement of one sleeve with respect to
the other is called centershift. The flexure pivots being used are
5/8 inch in diameter and are designed for flexing up to ±15 . Theflexing strips are 0.0135 inch thick.
The two important tests that these parts must pass before being includedin any flight system are vibration and life testing. The pivots usedon MSS have successfully passed tests that simulate the launch environ-ment. Vibration tests were conducted on an early engineering model and
later on the systems using the final design. There is negligibleinherent damping in flexural pivots, and this results in high
21

!
transmissibilities of input vibration levels. The pivots passed vibra-tion levels in the qualification unit that were twice those expectedin the launch environment
.
To demonstrate compliance with the system life requirement, it wasnecessary to determine the fatigue-life characteristics of the flexurepivots. A test program to produce a curve of stress as a function ofcycles to failure for the parts was performed. The results are shown inFigure 8. The equivalent angle is included on the right of the figurefor the +15° pivot design, and the MSS operation required is also noted.
The expression used to calculate the stress for pure rotation is
where S = stress, E = modulus of elasticity (29 x 10 b psi for 420 CRES)
,
t = flexure thickness, 6 = angle through which pivot is rotated(radians), and L = effective length of flexure.
The test grouping is typical of fatigue testing. Some scatter in
results is expected because of the inhomogeneous nature of metals andtolerances used in manufacturing the parts. These particular pivotsclosely follow the life curve that is predicted by the manufacturingdata.
In addition to meeting life and environmental requirements, the pivotsmust meet critical parameters regarding mirror support. Two pivotsfrom each manufacturer lot are subjected to destructive static-loadtest and to a metallurgical examination. Each pivot is visuallyexamined with both a conventional microscope and a small-diameter bore-scope for surface defects - it is examined for burrs, nicks, or scratchesthat might reduce the strength or life of the part. Each pivot is sub-jected to a dye-penetrated inspection for evidence of surface and sub-surface cracks. All flight pivots are subjected to a radial load of
220 pounds to test for defective braze joints.
To ensure minimum stress and satisfactory mirror alinement under scanconditions, each pivot is tested for center-shift and torsional springrate at ±3° rotation. Pivots are then paired to have closely matchedtorsional spring rates so that when they are rotated the center shiftsare of the same magnitude and in the same direction. Only matched pairsof pivots that pass all visual and physical tests were used in theflight units.
LIFE TEST PROGRAM
A flight quality scan mirror assembly (as shown in Figure 2) was sub-
jected to a life test program. The purpose of this test was to verifythat the scan mirror assembly would reliably support the mission
22

requirement of one year in space at a 20% operational duty cycle(approximately 20 minutes on and 80 minutes off).
The unit was subjected to a complete acceptance program involving unittest and vibration and thermal vacuum testing. Space operation wassimulated by operating the unit at a pressure of less than 10 ~ 5 torr anda base temperature of 90°F. To compress the test time, the operational
i duty cycle was raised to 50% (20 minutes on and 20 minutes off) . TheI unit was operated on a full-time basis with periodic performance checksat approximately 4-week intervals with more frequent checks at thebeginning of the life test. During these performance checks elevenparameters were measured and compared to specifications. Changes frominitially measured values were carefully monitored. At the conclusion
|
of the test the scan assembly had been operated for 140% of therequired mission life without a failure or degraded performance. Theactive scan time had decreased by less than 1%, which was within
' allowable limits.
LINE LENGTH MEASUREMENTS
Line length is defined as the time elapsed from the star t-of-scan pulse! to the end-of-scan pulse. Line length measurements have been madeIfor extended periods of operation for the engineering model during lifetesting and for both LANDSAT I and II. LANDSAT III has been success-fully operated in orbit but line length trends have not been established.Table I lists the pertinent information.
TABLE I. LINE LENGTH VARIATIONS
LaunchDate
Data Span,
years
Number of
Scan Cyclesx 106
Line LengthVariation,
ysec
Life Test (1972) <1 120 -200
LANDSAT I 7/23/72 >5 90 -100
LANDSAT II 1/22/75 >2 52 -80
LANDSAT III 3/5/78 <1 3
The trend seems to be clearly established toward shorter line lengthsfor longer periods of operation. Table II compares line lengths withtime for LANDSAT I and II.
i
i
23

TABLE II. LINE LENGTH IN ORBIT
Line Length,msec LANDSAT I LANDSAT II
At launch 32.21 32.50
First year 32.19 32.49
Second year 32.17 32.48
A more detailed description of line length variation as a function oftime can be seen in Figure 9, in which data for the first three yearson orbit for LANDSAT I is shown. The fluctuations are not understood.The general trend towards shorter line lengths is attributed primarilyto changes in the elastomer damper. LANDSAT I was turned off inJanuary 1978 because of difficulties with the spacecraft control system.The scan mirror mechanism was still performing as designed. The speci-fied mission life was one year.
CONCLUSIONS
The long life of the scan mirror assemblies without failure or degrada-tion may be attributed to the exhaustive .development program - con-sisting of analysis and test that preceded their construction. A keyfactor was the design approach, wherein stress levels were kept wellbelow allowable limits. This was combined with a philosophy of testingto levels above normal expected values and careful screening of manu-factured parts.
ACKNOWLEDGEMENTS
We wish to thank J. Olson and W. Quinn for their descriptions of the
bumpers and dampers published in the article referenced, and to J. Ballaof NASA, Goddard, for supplying the on orbit data.
REFERENCE
Olson, J.L. and Quinn, W.S; "Mechanical Component Screening for Scanner."7th Aerospace Mechanisms Symposium, NASA Manned Spacecraft Center,Sept. 7 and 8, 1972.
2k

4 VIDEOUTPUTS
11.6° VIEW TOEARTH
Figure 1. Simplified schematic of scanner
Figure 2. MSS scan monitor optical system
25

FLEX PIVOT
OPTICAL SWITCH OPTICAL SWITCHDETECTOR LAMP
Figure 3. Schematic of MSS scan mirror mechanism
Figure 4. MSS scan mirror assembly
26

TURNAROUND
MIRROR
—— SCAN —*> —— RETRACE —
POSITION
SCAN 11 1 1
MONITOR
rMIRROR DRIVE CLOCK
TORQUER CURRENT
Figure 5. Timing diagram
27

r
DAMPER
SPRING
Figure 6. Sectional view of combined bumper, spring,
and damper
28

I
o
h\-~
Z £C
< UJ
h- «W 0)Z QO Z0 0o oz w£ toa.
5<Q
0.250
0.240
0.230
0.220
0.210
0.200
0.190
0.180
—I I I I I I I I I I | I I I
!
• PAIR 1
PAIR 2— ••
—• • • • •
•
— A_i
AA A A_
I I I I I I I I I I I
0 10 20 30 40 50 60 70 80 90 100 110 120 130 140 150
MILLIONS OF CYCLES
NOTE: DAMPING TEST FREQUENCY - 144Hz
Figure 7. Damping as a function of life
NUMBER OF CYCLES
Figure 8. Flexure pivot fatigue test results
29

II I I I I I I I
I
I I I I I I II II I
I
I I I I I I I I I I I
I 1 I I I I I I I I I I I 1 I I I I I I I I I I I
TIME, YEARS
Figure 9. Line length variation for LANDSAT I
30

DRIVETRAIN BEARING ANALYSIS
Thomas C. BelroseUS Array Aviation Researchand Development Command
St. Louis, MO 63166
DAVID BOARDSKF Industries
King of Prussia, PA 19406
!Key Words: Aircraft Diagnostics, Diagnostic Equipment, Condition Moni-toring, Bearing, Shock Pulse.
' Introduction: The US Army has recognized for some time the need forimproved condition monitoring and diagnostic equipment for helicopterdrivetrain systems. Recent studies-'- have confirmed that an unaccept-ably high false removal rate exists on many helicopter drivetrain com-ponents and that "phenomonal savings" would accrue to the Army by im-proving the diagnostic effectiveness. There have been several attemptsat developing cost effective, affordable and reliable equipment. It
now appears that such a system exists. It is the Small PortableAnalyzer Diagnostic Equipment (SPADE). The equipment has been underdevelopment for several years and is currently in a Development Testat Ft. Rucker and an Operational Test at Ft. Hood. The purpose of thispaper is to briefly review the program, the equipment characteristicsand to review in detail the results of the Contractor DemonstrationPhase.
System Description: The SPADE is an item of ground support equipmentdesigned to semi-automatically inspect and diagnose bearing faults in
selected aircraft components. It functions on the principle of detect-ing and measuring shock pulses generated by the release of kinetic andfrictional energy within the monitored component. The history of theshock pulse^ has been discussed in earlier MFPG proceedings as has its
j
application to helicopter drivetrain diagnostics. Briefly the theory
j
is that when the rolling elements in a bearing contact a surface dis-continuity, repetitive impacts of short duration and very short risetime are created, hence the shock pulse. This signal then propagatesthrough the mechanical structure. It decays as a function of the
distance it travels and is further attenuated at each mechanical in-terface. The signal is detected with an accelerometer and with appro-priate processing is correlateable to mechanical condition.
The SPADE is a derivative of the commercial SKF MEPA-10A. It functionson the shock pulse principle as does the MEPA-10A but it is implementedin a slightly different fashion. Where the MEPA-10A requires manualdata collection and interpretation of data, the SPADE is automated.Specifically, the MEPA-10A requires the interpretation of a plot of
51

the rate of the shocks vs. the amplitude of the shocks. The criticalfactors are the area under the resultant curve and the shape of thecurve. The SPADE measures the area by driving a voltage to frequencyconverter with a demodulated signal and measuring the output directlywith a counter. This measurement is proportional to the level of the
defect and is compared to preset limits that are representative of
good, marginal and discrepant conditions. The status of the monitoredcomponents is then displayed on the instrument control panel.
Contractor Demonstration Phase: This phase began with delivery offirst SPADE in February of 1978 and was concluded in September 1978.During this time parts with known defects were implanted in variousUH-1 gearboxes. Baseline data was also taken on the UH-1, AH-1 andOH-58. The purpose of this phase was to finalize the limits and to
demonstrate that the SPADE was ready for the Government testing phase.The SPADE was operated without preprogrammed limits so that the maxi-mum amount of information would be available for correlating the
SPADE measurement with the actual part condition. Three differentaccelerometers were also evaluated.
The following is a summary of the implant testing results on the UH-1Hdrivetrain components:
Correct Incorrect Instantaneous ProbabilityComponent Indication Indication of Detection (P^)
Main Trans 15 3 .83
42 Gearbox 10 0 1.0090 Gearbox 9 1 .90
Hangar Bearings 0 0 0
TOTALS 34 4 .89
NOTE: The results of the hangar bearing test will not be proven un-til after the bearings are analyzed.
SPADE Fault Detection Capability: The implant approach is not a per-fect test technique in that certain variables which are difficult to
quantify are introducted. Thus each case must be carefully evaluatedto eliminate as many of these as possible. The process of implantinga discrepant component into an "alien" gearbox results in decreasedlevels of kinetic energy due to misindexing of the defect relative to
its natural location in its "native" gearbox, removal of trapped de-bris generated by the defect, and various tolerance and clearancechanges which are a direct result of the component disassembly.
This above data was, for the most part, accumulated from bearings withdefects that were small relative to the levels of damage which wouldresult in loss of load carrying capability for a bearing. Since SPADEreadings are proportional to the level of damage within a bearing,higher readings and higher detection rates would result if larger de-
32

fects were implanted or if implants when tested were allowed to pro-gress to more significant levels of damage. Therefore, the actualaccuracy of naturally occuring defects may be different and would bebetter determined by a different test technique.
Although these results approach the design requirements, another con-cept should be considered; that is the cumulative probability of de-tection. The detection probabilities listed are for each time thata SPADE measurement is taken on a discrepant bearing. However, sincebearings do not fail instantaneously, the SPADE can be used severaltimes (on a regularly scheduled basis) between the time an intialdiscrepancy appears and the time a bearing is so badly damaged that it
loses its load carrying capability. This period between initialdiscrepancy and loss of function for a bearing is called the FailureProgression Interval (1^). The number of aircraft operating hoursbetween scheduled SPADE inspections is known as the Utilization In-terval (U). The cumulative detection probability (P^ ) for SPADE is
greater that its instantaneous value (P^.) because during the failureprogression interval there are several cnances (I^/U) for finding the
defect, and only one detection is required to remove the failing com-ponent from service. The mathematical relationship between the cumu-lative probability of detecting an ongoing failure and these otherdiagnostic parameters is:
P, = 1- (1 -p, .) i./u4c 4i f
Given this relationship and the experimental values for it re-
mains to estimate the failure progression interval, 1^, for bearings,and to select a SPADE Utilization Interval (U) that yields a satis-factory cumulative probability of fault detection. Of the twenty-
eight (28) bearings used for implant testing during this and precedingArmy diagnostic test programs, none have shown evidence of significantfailure progression. Of these same bearings, eleven have been operatedfor times in excess of 100 hours and three in excess of 200 hours witha maximum spalled bearing operating time of just over 290 hours.Figure 1 shows SPADE' s cumulative probability of fault detection as a
function of its utilization interval. The curves in this Figure re-present a range of instantaneous fault detection probabilities which"bracket" the results of testing during the Contractor Evaluation ofSPADE. The important message from this Figure is that even for theworst case estimate of SPADE accuracy, a high cumulative probability of
fault detection can be achieved with a 25 hour SPADE inspection inter-val. For example an accuracy of P^ = .45 would indicate a cumulativeprobability of fault detection in excess of 99% at a 25 hour inspectioninterval and better than 90% at a 50 hour interval. In addition, anyincrease of the failure progression interval above 200 hours will re-sult in an- increase in the cumulative probability of fault detection.
The other side of the coin, of course, is the false indication ratethat can be expected when employing the same limits that are associated
55

with the detection accuracy just discussed. The caution and removeindication limits in SPADE are set at the mean plus 2-sigma (m + Iff)and mean plus 3-sigma (m + 3 if ) values respectively of all the con-firmed baseline data accumulated for four (4) UH-1H aircraft duringthe Contractor Evaluation. Assuming a normal distribution of measure-ments, this should result in an instantaneous probability of falseremoval indication (P^) °^ »0027. The cumulative probability of
false removal indication (P^ ) would then be the product of the numberof SPADE measurements times ^P„.). Over one hundred SPADE measurementsof baseline components were made during the Contractor Evaluation butno removal limit exceedances were observed. This record tends to con-firm that P for SPADE is .0027 or less. The Mean Time Between Re-movals due to false indications or (MTBR^
. ) for each drivetrain com-ponent monitored by SPADE can be calculated from the equation:
SPADE UTILIZATION INTERVALMTBR
f . = No. of sensors on component X P9 .
Table I lists the MTBR and corresponding false removal rate for
each aircraft component at two SPADE Utilization Intervals (U=25 hr& U=50 hr). This Table also summarizes false removal rates for the
total UH-1H drivetrain and the gearboxes vs. tail rotor driveshafthangar bearings as separate component classes. It is important tonote from this Table that even for a 25 flight hour SPADE UtilizationInterval, the false removal rate is only slightly over one removalper thousand aircraft flight hours.
Conclusion: In summary then, even a pessimistic assessment of SPADEContractor Evaluation test results indicates a high fault detectioncapability and a false removal rate of one per thousand flight hours.This accuracy exceeds the design requirements of 90% fault detectioncapability and 2 false removals per thousand flight hours.
REFERENCES
:
1. J.E. Marsh, "Evaluation of Aircraft Equipment Monitoring Devices,Procedures, and Techniques". US Army Aviation Research and Dev-elopment Command, Applied Technology Laboratory Technical ReportNo. USARTL-TR-78-31, July 1978.
2. P.L. Howard, "Shock Pulse Instrumentation". Proceedings of the
14th Mechanical Failures Prevention Group Meeting, Los Angeles, CA,
Jan 1971.
3. J. A. George, T.C. Mayer, E.F. Covill, "Applications of the Shock
Pulse Techniques to Helicopter Diagnostics". Paper Presented at
the 22nd Mechanical Failures Prevention Group Meeting, Anaheim, CA,
April 1975.
3k

AIRCRAFT COMPONENT
Main Transmission
42 Gearbox
90 Gearbox
Hangar Bearings(4)
TOTAL DRIVETRAIN
MTBR _ . - Fit Hr False Removals/1000 Fit Hrf i —
U = 25
3086
4630
9259
2315
U = 50
6173
9259
18519
4630
U = 25
.324
.216
.108
.432
926 1852 1.080
U - SPADE UTILIZATION INTERVAL
D - 50
.162
.108
.054
.216
.540
SPADE CAUSED FALSE REMOVAL RATES
TABLE I
•
paopL, I 1 1 1 i f-
20 40 60 80 100
SPADE UTILIZATION INTERVAL
CUMULATIVE FAULT DETECTION CAPABILITY VERSUS SPADEUTILIZATION INTERVAL
FIGURE I
35

I
LIGHT HELICOPTER DETECTION, DIAGNOSIS ANDPROGNOSIS OBJECTIVES AND APPLICATIONS
Henry G. SmithEngineering Consultant
Redondo Beach, California 90277
Robert E. RohtertHughes Helicopters
Culver City, California 90230
Abstract: The need for obtaining adequate diagnostic data on aircraft
and helicopters and the processing thereof for practical utilization haslong been recognized by both the airlines and the military. The impli-
cations in regard to flight safety, operational availability of the vehicle,
and maintenance and logistics economics are too tremendous to ignore.
The techniques for obtaining and processing such diagnostic informa-tion have been the subject of considerable experimental research anddevelopment over the past several years. The advent of reliable minia-turized transducers as well as data processors /computers has nowmade onboard diagnostics a current technical feasibility for even a light
helicopter such as the Hughes 500D.
Data projected to be measured and processed include engine condition,
gearbox condition, vibration levels, rotor hub and swashplate bearings
condition, and flight structural envelope exceedance.
Detection, diagnosis and prognosis (DD&P) applications that either havebeen, or are being, considered by Hughes Helicopters in regard to its
500D light helicopter are:
1. Use of the recently developed and FAA certificated onboard com-puter system.
2. Installation of a system for providing a quantitative display in the
cockpit in the event of tail rotor imbalance.
3. Development of an engine data recording and analysis system with
the objective of establishing criteria and method for substantially
extending the time between overhaul (TBO) on all engine components.
36

k. Sampling and analysis of oil from main transmission and tail rotorgearbox at regular intervals with the objective of developingcriteria and technique for extending the TBO.
Key words : Detection; diagnosis; prognosis.
jIntroduction; For many years the military services and the airlines
have been testing and using DD&P systems on the larger, moresophisticated aircraft and helicopters. Within the last few yearsfurther technological advances in regard to both sensors and data
processors /computers have, through miniaturization, reduced the
j
size, weight, and cost of such equipment to the point where it is now' feasible and practical to apply it to a light helicopter such as the
' Hughes 500D (Figure 1). The type of data to be detected, diagnosed,
and prognosed ranges from engine condition and performance data to
tail rotor imbalance.
|
Objectives for such a DD&P system for helicopters can be subdivided' under three major headings: (1) in-flight, onboard DD&P; (2) test-
flight, onboard DD&P; and (3) on-ground-interrogative DD&P for
maintenance and record purposes. Because of the unusual extent of
rotating mechanical systems in a helicopter, as compared to a fixed-
wing aircraft, helicopter DD&P is much more concerned with rotor
imbalance, vibration levels, and gears and bearings deterioration.
Therefore, the greatest program effort at Hughes Helicopters has beenin these areas
.
This paper will consider, first, the needs /objectives for a light heli-
copter DD&P system, and second, the DD&P applications, either
existing or in work, at Hughes Helicopters for the 500D light helicopter.
Discussion : The need for obtaining adequate onboard diagnostics data
and the processing thereof for practical utilization has long beenrecognized by both helicopter manufacturers and operators. Until
recently, this type of equipment was too large, too heavy, and too
costly to consider for installation in a light helicopter such as the
Hughes 500D. However, the advent of reliable miniaturized trans-
ducers, as well as miniaturized solid-state computer /data processing
technology, has now made onboard DD&P systems technically feasible,
and even practical, for light helicopters. The benefits to be derivedfrom such a system include: improved safety, improved operational
availability, reduced maintenance costs, etc.
37

As an example, miniature vibratory transducers are now available that
are roughly the size of a pencil eraser. Similarly improved sensorsare also available for pressure, temperature, noise, displacement andthe like. Even so, an onboard detection, processing, and display/
warning system should be held to the practical minimum consistent with
flight safety and operational needs. More detailed and more sophisti-
cated DD&sP equipment could be installed or added to only as requiredfor occasional test flights or for specific problem analysis and cor-rection. Also, additional data in unprocessed form could be simplyrecorded for interrogation and analysis by ground based equipment at
a later convenient time, or for occasional sampling and reporting onthe ground.
The three main categories of DD&P systems are shown in Figure 2.
The objectives for the overall DD&P system have been so categorizedin order to provide the most important in-flight information first, with
the test flight portion to be installed only as needed for more detailed
troubleshooting. The on-ground portion would be interrogated andanalyzed at a convenient time and location for routine maintenance andoperational purposes. These would include prediction of neededreplacements or overhauls. Economics, as well as safety, of opera-tion would benefit significantly from greater reliance upon"on- condition, " instead of arbitrary, replacements and overhauls.
Needs /Objectives of a Light Helicopter DDfaP System ; First, a list
of potentially critical helicopter mechanical and structural problemareas was compiled and broken down into the three aforementionedcategories, as shown in Table I and diagramed in figure 3. Thesepotential problem areas were broken down by (1) system or majorcomponent, (2) description of the potential problem in each case, and
(3) the type of information in need of detection by the DD&P system.Then the type of sensor /transducer needed for measuring each type
of data was considered. The type of processing and presentation of
the DD&P results was then considered, including the display thereof.
Table II shows a summary of the DD&P objectives for a light helicopter.
It is evident that, in the area of structural information, we are mostconcerned with the structural deterioration of the main and tail rotor
blades and with the vibratory loads imposed on the remainder of the
airframe structure by rotor imbalance, out of track, etc. In the areaof mechanical/propulsion systems, on the other hand, we are con-
cerned with gears, bearings and engine deterioration. The methods of
38

sensing these items are also indicated in the table. Other factors;
such as, counting the number of engine/rotor stop/starts, and the
number of exceedances of design rpms, speeds, g-limits, yaw limits,
blade flapping limits, hard landings, etc, would also be very useful
both to the pilot and to the owner /operator. Once such informationhas been detected and measured, it must be processed and comparedto some preestablished norm to determine whether it is of sufficient
magnitude for either display or warning to the pilot. The type of
display and/or warning is also a factor to be considered. Figure 4
diagrams a typical helicopter DD&P system from sensor to display
and/or warning.
DD&iP Applications : The remainder of this paper deals with variousDD&tP applications on the Hughes 500D light helicopter (Figure 5).
Onboard Computer : In mid- 1978, the FAA issued to Computer AvionicsCorporation of Santa Clara, California, a supplementary-type certi-
ficate for installation of its helicopter computer system (HCS) on the
Hughes Model 500 helicopters (Figure 6).
This small computer system starts with a basic manual mode configura-
tion. It accepts inputs from the pilot which are the basis for feeding
back to the pilot flight status information. Safety of operation of the
helicopter is thus substantially enhanced. The pilot does not have to
depend on memory. He is not distracted by the necessity of thumbingthrough pages of graphs or tables to obtain vital information regarding
the condition or performance capability of his helicopter in regard to
speed, power available, external load carrying capability, hovercapability in- or out-of-ground effect, fuel utilization, etc.
In the more sophisticated optional automatic mode, a sensor support
package is added to the basic system. This automatic mode systemaccepts information not only from the pilot but also from a number of
sensors located throughout the helicopter, such as pressure altitude,
outside air temperature, engine torque, turbine outlet temperature,fuel flow, airspeed, sling weight, etc. All these serve as the basis
for computing; data storage; supplying immediate flight information to
the pilot; and, subsequent to the flight, supplying information to the
maintenance crew when interrogated.
39

By a suitable choice of sensors and programming relative to the
typical flight scenarios of the operator, the display can bring to the
attention of the pilot conditions which warrant his immediate attention;
such as, overtemperature, overtorque, rotor overspeed, unusualunbalance conditions, excessive sling load weight relative to hovercapability, etc. Moreover, the storage mode provides the capability
of accumulating these data for later retrieval on interrogation by the
maintenance personnel. These latter are thus informed as to the
magnitude, duration, and frequency of exceedance events. Appro-priate inspections and corrective action can then be promptly initiated.
The weight of this complete onboard computer system is approximately15 pounds, (0. 5 percent of the gross weight) including the various
sensors located throughout the helicopter. The basic manual modesystem is several pounds lighter. The display, located above the
cockpit instrument panel, is approximately 3 inches high by 9 inches
wide. Electrical power required is approximately 50 watts.
Tail Rotor Balance Indicator ; A system is currently under develop-ment by Chadwick-Helmuth, Inc. , which, when installed on the 500DHelicopter, will provide quantitative indications in the cockpit of the
status of the tail rotor balance. This system consists of an accelerom-eter located at the tail rotor gearbox, suitable electronic circuitry
(black box), and a cockpit display (Figure 7). This display will providean indication of vibration velocity in inches per second.
A proper level of tail rotor balance is essential. The level represents
a compromise between practical production balancing techniques andthe adverse effects of unbalance on the fatiguing of blades, stabilizing
surfaces, and tail boom. Because of the tail rotor speed (normally
2933 rpm), the effect on vibration level due to small changes in the
blade mass, either in initial production or subsequent service, is
substantially magnified.
Limits of unbalance, format for the monitor display, and the circuitry
time delays will be finalized during the testing of the prototype instal-
lation. The production installation will enable the pilot to immediatelydetermine, by reference to his cockpit display, the status of tail rotor
balance. The monitor will indicate the vibration level normal for
cruise flight and provide a caution indication when it is approaching an
unsatisfactory level and a warning indication when corrective rebalancingshould be initiated. A more detailed presentation of the system capa-bilities is provided in the Appendix.

lEngine Condition Monitoring: Hughes Helicopters has under study the
development of an electronic data recording and analysis system to
monitor the gas turbine engine in its 500D helicopter. The objectives
of this system are the extension of time on components, the extension
.of TBO, and establishing "on-condition" maintenance. Such objectives
lappear attainable on completion of an initial data collecting and analysis
j
phase in which the correlation is established between the cumulativeoperating history of an engine and the state of its health at that time.
This would be in lieu of the current situation wherein the fixed TBO as
specified by the engine manufacturer requires overhaul no matter howexcellent the state of health of specific engine may be.
The favorable impact on operational costs is obvious. The type heli-
copter which delivers payload with less horsepower demands on the
engine, and the user, whose operational scenario does not cause a
succession of exceedances, will be able to take advantage of these
factors in terms of a longer engine life and less maintenance costs.
Improved safety will also result because of an increased awareness of
engine condition at any point in time.
There are a number of detailed engine criteria which apply in establish-
ing the TBO. Typical criteria are the limitations for the first- andsecond-stage gas producer wheels; i.e. , 1775 maximum operating
hours or 3000 cycles, whichever first occurs. A cycle is defined as
a start or start attempt. It is recorded by means of an engine -furnished
counter which records the number of times the ignition exciter is
energized. It is reasonable to assume that a cold start is harder on
the engine than one starting from an elevated temperature, such as mayexist within a short period following a normal shutdown. The rationale
for such an assumption is that in the cold start the engine experiencesa much greater temperature gradient on each cycle. Similarly, anengine whose history is one of operating through wide, rapid excursionsin (gas producer rpm), a large percentage of the time at or near the
limiting turbine outlet temperature (TOT), or with a number of or
temperature exceedances, will be degraded lifewise more rapidly than
one more conservatively operated.
Currently under study is the defining of a suitable data acquisition
system. Its "black box" will provide the capability of recording the
following data (Figure 8):
1 . Start cycles .
f'' (gas producer rpm) excursions.

3. Time at temperature (TAT).
4. Engine start temperature peak.
5. Engine start AT (incremental temperature).
Items 1 and 2 contribute to the low cycle fatigue failure mode due to
cyclic mechanical stresses imposed on the turbine wheels. Item 3
contributes to the stress rupture failure mode due to thermal stress
imposed on the turbine blades. Items 4 and 5 contribute to the thermalmechanical fatigue (rim cracks) failure mode, a function of engine start
temperature gradients.
The next phase in the development of the system requires the collecting
of a substantial amount of data from a number of helicopter users for
operating hours over a time period of up to 2 years. Choice of these
users will be such as to provide a wide range of environmental condi-
tions and operational scenarios. The analyses of the operational data
will be correlated with data collected during subsequent engine over-hauls. Based on these correlations, criteria will be established
dealing with each of the detail specifications which currently define
the TBO for all engines. Once established, these criteria will permitappropriate extension to the TBO of a specific engine based on its actual
operational history.
The end hardware (black box) system which will ultimately be used to
monitor the engine condition will be defined based on the data analysis,
correlations, and criteria established by the initial phases outlined
above. Such end hardware will also provide suitable cockpit displays.
Extension of Time Between Overhaul (TBO) : The long-term objective
is to increase the TBOs of the main rotor transmission (Figure 9) andthe tail rotor gear box (Figure 10) to on- condition overhaul. Currently
inspection and overhaul are at 1800 hours. Current oil changes are at
3 00-hour intervals. Extension of time between oil changes is a short-
term objective. A program has been established to document data
obtained from TBO transmissions returned from service to determineproblem areas. As such discrepant conditions are uncovered, cor-
rective action will be incorporated. Extensions to the TBO will be
possible once an adequate data base from Field Service has beencompiled.
14-2
Implementation of this program has been initiated through a cooperative
plan between Hughes Helicopters and a fleet operator of the Model 500D.
This operator is achieving a utilization of approximately 1500 hours peryear per helicopter. The oil changes for the helicopters of this fleet
have been increased from the maintenance manual interval of 3 00 hours
to a 600-hour interval. Oil samples are taken from the main transmis-sion (100 cc out of 6 quarts) and the tail rotor gearbox (100 cc out of
0. 4 pint) at 100-hour intervals. A single oil analysis firm has a con-
tract to conduct a spectrochemical analysis of each of these sampleswith reports being sent to Hughes Helicopters and to the appropriate
helicopter service center. On one helicopter the 600-hour spectro-
chemical analysis has already been completed. To date none of these
spectrochemical analyses have indicated any measurable wear.
When the main transmissions and tail rotor gearboxes of any of these
helicopters reach the present factory recommended overhaul (1800
hours), Hughes Helicopters will provide an exchange transmission for
use while the fleet operator's transmission or gearbox is at HughesHelicopters. Hughes Helicopters will tear down and examine the unit
and, upon reassembly without overhaul, return it to the same service
center for reinstallation and continued service in the same helicopter
from which it was removed. The accumulation of reports from the
oil samples in conjunction with inspections of TBO transmissions and
gearboxes will provide a basis for increasing the usable service timeon the helicopters of this specific operator. Instead of specific periodic
overhauls, maintenance will be a direct function of the actual condition
of the transmission.
A program has been established for systematically logging the results
obtained on inspection of each transmission returned for overhaul at
1800 hours. This covers the helicopters of all operators. Action will
be taken to initiate corrective action on all discrepant conditions
uncovered by these TBO inspections. Thus, a data bank will be
accumulated covering a very wide range of service environment for
the main rotor transmission and the tail rotor gearbox.
The criteria which must be met prior to an increase in TBO beyond1800 hours or to "on-condition, " may be summarized as follows:
1. All discrepant conditions revealed by the fleet service experienceshall be corrected and incorporated into the fleet.
h3

2. Inspections of not less than 10 transmis sions / gearboxes at
1800 hours must prove that all components appear to be satis-
factory for at least another 1800 hours of operation.
3. Analysis of results of abusive testing, i. e. , overload horsepowerruns in a test cell, must support such an extension.
Caution and Warning Indicators: A number of caution and warninglights are located across the top of the cockpit instrument panel (Fig-
ure 11). These indicator light circuits are completed through their
respective fault sensors. They function as follows:
1. Engine out. The warning light flashes when engine speed decreasesto approximately 55 percent Np (gas producer rpm) or less, and/or when the rotor speed (Nj^) decreases to approximately 98 per-cent or less
.
2. Main transmission oil temperature . If transmission oil tempera-ture rises to 250°F, a temperature-sensing switch actuates to
energize the flashing warning light.
3. Main transmission oil pressure. In case of reduction or loss of
transmission oil pressure (below approximately 15 psi), a pressuresensing sender energizes the warning light.
4. Battery temperature . The warning light illuminates at a battery
temperature of 160°F. The caution light illuminates at 140°F.
5. Chip detector caution lights. When sufficient loose ferrous
material is magnetically accumulated on the chip detectors, the
appropriate caution light illuminates. There are two detectors in
the engine oil system, two in the main transmission, and one in
the tail rotor gearbox.
6. Fuel low. When supply fuel weight decreases to 35 pounds, a
spring wire contact is made by the tank unit float arm to completea ground circuit and illuminate the warning light.
7. Fuel filter . If the engine fuel pump filter becomes clogged, a
warning light is illuminated by a case-grounded differential pres-
sure switch.
kk

8. Generator out . If the generator output voltage falls belowbattery voltage, a reverse current relay disconnects generator
from the 28-vdc bus and causes the light to illuminate.
Because of the obvious serious nature of "engine out, " an audible
warning horn is activated in conjunction with the panel warning light.
In addition, available as a separate kit, there is an engine automaticreignition system. It provides a means to automatically reignite the
engine when either or both of the following conditions exist:
1. Engine N-^ (gas producer rpm) is less than 55 percent or
2. The N-^ (rotor rpm) is less than 98 percent (i. e. , less than
approximately 460 rpm).
Conclusions : DD&P applications are now feasible for a light helicopter
such as the Hughes 500D. This results from miniaturization and cost
reduction of the system components, all the way from the sensors to
the displays. Improved flight safety, improved operational availability,
and reduced maintenance costs are the significant benefits to be
expected.

APPENDIX
ON BOARD VIBRATION MONITOR SYSTEM
CHADWICK-HELMUTH COMPANY of Monrovia, California is actively
engaged in developing a miniaturized version of their VIBREX heli-
copter vibration measuring equipment. The new version is designed to
be used as a continuously operating "on-board" monitor to indicate
in-flight conditions and trending of from one to six vibration modes in
either or both the main and/or tail-rotor drive trains and mechanisms.
The approach taken consists of detecting of the vibration signals by oneor more accelerometers permanently mounted on the rotor mounts andfeeding these signals into a set of miniaturized active "band-pass"filters and amplitude detectors. These filters are pre-set to respondonly to the pertinent frequencies at selected aircraft operating speeds.
The pass bank shaping of the filters is such that normal tolerance
variations of speed of the helicopter components will not affect the
output significantly.
Cockpit indication of vibration level is observed on a vertical set of
five Light Emitting Diode (L.E.D. ) indicators for each channel. Thethreshold levels of the detectors are set such that the second light fromthe bottom, a green indicator, will be lit in normal operation. Thebottom indicator will only be lit when the channel is not receiving anysignals, thus indicating a faulty channel or accelerometer. Third fromthe bottom is a yellow L. E. D. to indicate "above normal" operation,
or caution. The fourth light is red to show excessive vibration. Thefifth, or top, L.E.D. is also red, but "latches on" to show that the
excessive level has been reached for a time considered to suggest a
dangerous vibration/time level.
Only one light per channel is lit at any time except when the time limit
at excessive level has been passed. A reset switch is provided to
"unlatch" any exceedance indicator so that the pilot can restore normalindication if vibration levels fall back to safe ranges as indicated by
the green indicator. The pilot might do this, for example, if the exces-sive vibration level were knowingly exceeded in a necessary violent
maneuver as would occur in an emergency or in violent weather condi-
tions. The latched "danger" indicator would have shown the exceedance
k6

of maximum level/time conditions, after the event, even if the pilot
had not noticed the fourth level red light at the time of occurrence.
The instrument is packaged in two configurations at this time. Thefirst one is a single unit to be mounted in the instrument panel. This
unit is 2-1/2 inches high and its width is dependent upon the numberof channels desired. Each channel is a plug-in module, three quartersof an inch wide, with one additional module for power and reset switchesin each frame. In this configuration a four channel, a vertical and a
horizontal tail rotor, and a vertical and a horizontal main rotor indi-
cator set for example, would require a panel space of 3-3/4 inches
wide by 2-1/2 inches high. Depth behind the panel is approximatelyseven inches including relief for cables and connectors. Weight of
the four-channel indicator is slightly under 14 ounces. A six channel
unit would be 5-1/4 inches wide and weigh approximately 18 ounces.
The alternate model puts four channels in a one pound package placed
somewhere conveniently behind the instrument pod or elsewhere on the
aircraft with the indicator L. E. D. 's, all twenty of them, mounted in aninstrument indicator bracket, approximately 3/4 inch high by one and1/4 inch wide, with the push button "Power On" and "Reset" switchesmounted nearby. The L.E.D.'s are 1/8 inch by 1/4 inch rectangular
units so that a normal flight indication would be an almost continuous
line of green horizontally, with yellow or red vertical excursions abovethe normal position at the indicating channel position.
In both configurations, the instrument operates from the ship's 24-volt
d. c. power with a power consumption of less than 10 watts.
The band-pass filters in both configurations of the instrument are smallplug-in modules. Each module can be tuned to any frequency within a
twenty-to-one range and the series of modules are available from5 R. P. M. to 100, 000 R. P. M. , for measuring rotating mechanisms,and from approximately 1 Hz to 1 0 KHz for other types of higher ordervibration.
The accelerometers are either Chadwick-Helmuth standard piezo-
electric units for single axis monitoring or a new two-axis unit for
simultaneous vertical and horizontal channels from one mounting.
These same accelerometers and cables can then be used with the full
Vibrex equipment to correct an "out-of-balance" or "out-of-track"
condition when indicated by the in-flight monitor.

Preliminary flight tests of the prototype units have been performed andfurther, more extensive "permanent" mountings and flight tests arescheduled within the next two months. Release of the product is fore-
cast to be early to mid 1979.
1+8

Jh
0)
u
XCO
fl
rdJh
Hjh
oCO
p
CO
Xp
JH*
I § I? 8
XPcd
0
CD
••-I
<+H (TJ
a 32 ou g
Jh
O
PhoJh
O
^ 4) P CD
(1)
o
oJh
U
Jh \Oi 0)H-> 1—
I
d) PhG 3
ocj
o
5-t
CD
Jh
O+JCJ
<Dh->
0)
xo
yP
CD1—4
Ph CD
3 po ooO Ph£ O
GO Jh ti
od cd .ih
g £ g
0.—
)
Ph3ouo
gJh
CD
£iH->
CD
Jh
3CO
CO
CD
Jh
Ph
g sPh *
CDr—
4
Ph <D
3 po oU jpO Ph
oJh
CJ
Jh Jh
CD CD
CO H-> +->
OJCD CD
% g g
M Jh Jh
rj CD CD
.3 i—i i—
i
d CD CD
S CJ CJ
H-J O CJ
CO cti Cd
cd
PCD
gOpCD
-P
Ph
rQcd-t->
cj
CDH->
0P
Po
• i-H
CJ
CDH->
CD
X
CD CD
CO CO• i-H •i-H
onno no
on se•I-H
H-> X X • rHH->
• rH
cd P p P Cd OPJh cd Cd 0 Jh
CD • rH CDi—
i
CD CD H->i—4 CD
CD Jh Jh o Jh
CJ 3 3 CDCJ 3
CJ H-> H->del
CJ H->
cd ra ra IT) ra
CJ CD CD
ckCJ CD
•i-i—
i
Ph Ph •i-H
I—
1
PhCJ g g cd CJ g>^ CD CD
Jh >^ CDu +-> H-> U CJ
Jh
& «^ Jh
CD
Jh
3CO cCO PCD PhJh Jh
Ph^
Cd
Jh
CD
Ph
CD CD CD
CO CO
3 oO P
Jh
CD
CJ
3XO cd
jh aft
gCO CD
ccj
bO
3 cd
™ cp
Ph
gCD CD
CO
1—1• -< OO P
CDCO CO
i-H i—4> CD CD
3 > >CO « »CD- 1 ^
cj r rX M Mcd r r
XCD
Jh• rH
CO
CD
PPO
• rH-(->
agJh
O
• rH
3P
XPOO
CO
bOP
P ^° 3 MCJ <o (o
rP CD
CD CO ,£5
—4 3 3« X X
XpoCJ
bOp
• rH
Jh
cd
CD
CD4Jcd1—1
Ph-PCO
cd
CO
Jh
O4->
OPh
P• rH
cd
+>• rH
3P
XPoCJ
P•rH
Jh
cd
CD
XI
CDH (U '
CD CO
X
X)Pou
.2 «»
+3 cd
co cd n•r* y w(H .rH
X Jh
CD XX) 3
XP
Ph
^ X cd
CQ H! CO
h O A;—I -rH
Cd CO Jh
ir! co cd0 O CD
S J CQ
Jh
CD
&OPh
3OCD
gcd
i—
i
PO
• rHH->• rH
XJP0y
CO
on rin
• rHH-> cd
cd CD
u Xi•rH
Jh X)p
3 cd—
i
<+H Xo o
CO Jh
CO cd
0 CD
J a
Jh
OH->
oPh
cd
xPcd
co
CD
O
j5 cd <D
S h a
um
CD Jh
U -4->
P ucd
CD
X aCD
CO
CD Jhy
CDX >CD 3CD
CD• rH
Ph P Jh
O cd CDi—
1
g >CD
CD> bO COP PCD •rH bO
;ht rat din
OjU• rH
CD P1—
1
Ph cd
Ui O i
—
h!
y
yP
• rH
gcd
Jh
4HbOP
Jh
• rH
w
k9

TABLE II. SUMMARY - HELICOPTER DD&P OBJECTIVE
I. Fli^rht Operations Onboard DD&P
A. Vibration levels.
B. Structural deterioration.
C. Primary bearings deterioration.
D. Gearbox deterioration.
E. Engine deterioration.
F. Flight envelope exceedances.
II. Test Flight Onboard DD&P
A. Vibration analyzer.
B. Rotor track/pattern analyzer
C. Stres s / strain analyzer.
D. Performance analyzer.
E. Stability/control analyzer.
III. Ground Interrogative DD&P
A. Rotor balance analyzer.
B. Engine gearboxes oil analyzer.
C. Flight controls rigging and wear data.
D. Landing gear oleos condition.
E. Function and continuity of detection/warning system.
50

gure 1. Hughes 500D Light Turbine Helicopter
• FLIGHT OPERATIONS ONBOARD DD&P
•TEST FLIGHT ONBOARD DD&P
• GROUND INTERROGATIVE DD&P
Figure 2. Categories of HelicopterDiagnostic Systems
51

I
I
Figure 3. Hughes Model 500D Helicopter - Potential DD&P Items
52

Figure 4. Block Diagram of Typical DD&P System
• ONBOARD COMPUTER
• TAIL ROTOR IMBALANCE INDICATOR
• ENGINE CONDITION MONITORING
• TRANSMISSION TBO EXTENSION
• CAUTION AND WARNING INDICATORS
Figure 5. Hughes 500D Helicopter
DD&P Applications
53

Figure 6. Hughes 500D Helicopter — On Board Computer
ACCELEROMETER DISCRIMINATORPROCESSOR— COCKPIT
DISPLAY
Figure 7. Tail Rotor Imbalance System — Hughes 500D Helicopter
5^

s<D
-PCO
CO
wa•H
o-p•Haosao•H-P•H
OaCO
a•H
a
CO
a>
•H
55

I
!
56

Figure 10. Hughes Model 500D Helicopter —
Tail Rotor Gearbox
57

GAS TURBINES AND MILLIMETER-WAVE RADAR
N. Bruce KramerHughes Aircraft Company
Electron Dynamics DivisionTorrance, California 90509
Abstract: The Doppler Effect is widely used for detection and analysisof remote moving objects via radar, sonar and beacon systems. Dopplerradar at millimeter wavelengths has been used to measure vibrationamplitude and frequency in physically confined systems at short ranges.Methods for calibration of the radar for accurate vibration amplitudeand static displacements have been worked out in principle. Limitedtesting has been done on an operating gas turbine proving the feasi-bility of the millimeter radar technique.
Some background to support the doppler radar technique is presented.However, the principal point to be made is that in the last several years,significant advances have been made in extending the frequency range ofpractical millimeter hardware to 100 GHz and above and in buildingextremely tiny and simple radar sensors to operate at these frequencies.This means that sensors for a wide variety of applications can betailored to exact requirements and produced at low cost. Practicalconsiderations for gas turbine measurements include probe design andtransmission and absorption of millimeter radiation in various materialsand gases.
Key Words: Advanced sensors; gas turbine monitoring; vibration measure-ment; doppler millimeter radar; remote motion detection; staticdisplacement measurement.
The Doppler Effect is widely used for detection and analysis of remotemoving objects via radar, sonar and beacon systems. Doppler radar atmillimeter wavelengths can also be used to measure motion, includingvibration amplitude and frequency, of mechanical systems at shortranges. Radial motion of the object (target) relative to the radarresults in frequency shift (doppler shift) of the reflected signal (echo)
that is proportional to the relative target velocity. No frequencyshift results from purely angular motion of the target relative to theradar. A simple radar can be constructed (See Figure 1) that employs a
non-linear element (mixer diode) as a detector. The transmitted signaland the echo signal are combined and applied to the mixer diode. Sumand difference frequencies of the two signals and their harmonics areproduced by the non-linearity of the diode. Filtering can eliminateall but the difference, Af, of the fundamental frequencies. This signalat the frequency Af can then be amplified and analyzed. For purelyradial motion of the target at velocity v the doppler shift is
58

Af = 2f0 —— where f0 is the transmitted radar frequency, and c is thevelocity of light.
When the echo from a vibrating target is mixed with the transmittedsignal the filtered output of the diode can be expressed as a voltage,V, with two components.
V = V0 + V1
cos277 ft (1)
Both dc component, V0 , and ac component, V]_, depend on target size andposition, i.e., the amount of reflected RF power and its phase. Fortarget vibration amplitudes that are a small fraction of an FF wave-length it turns out that is directly proportional to the vibrationamplitude and vibration frequency is simply f. This provides aconvenient and accurate way of measuring vibration waveforms remotely.For example, if a doppler radar is pointed at a distant operating hi-fispeaker and the mixer diode output is amplified and fed into an earphonean excellent rendition of the music is heard.
A key feature of a radar system is directivity achieved by columnatingthe electromagnetic energy into a confined beam. In this way reflectionfrom the desired target can be enhanced and reflections from nearbyunwanted reflectors near the target can be minimized. As the wavelengthof the radiated energy is decreased the size of the radiating probe orantenna can be made smaller (in direct proportion to the wavelength)while preserving the same degree of beam confinement. Thus radar atmillimeter wavelengths (X = 1 to 10 mm) is convenient to use where smallsize probes are desired ( See Figure 2) . This is an important advantagefor the utilization of radar probes on turbines or other rotatingmachinery where introduction of large perturbing mechanical structurescould degrade turbine performance.
Practical millimeter-wave radar techniques for mechanical diagnosticsdepend critically on the availability, cost and performance of semi-conductor devices and RF components to perform the functions indicatedin the block diagram of Figure 1. All of the necessary components arenow available from Hughes and from other manufacturers. Hughes hasalso developed a simple, single-diode, self-mixing doppler sensor thataccomplishes all of the functions shown in Figure 1.
A prototype doppler radar operating at 50 GHz corresponding to Figure 1
has been built and tested. Initial experiments were conducted usingoff-set round stock in a lathe with attachments to simulate rotorblades. It was verified that the signal output from the mixer wasproportional to the amount of off-set and the frequency was the rotationfrequency of the lathe. The rotor blades were apparent as a harmonic ofthe rotation frequency.
59

A probe was constructed with an open ended waveguide antenna that couldbe screwed into a gas turbine case. Experiments on an operating gasturbine in an engine test stand showed that the radar output waveformcould be directly correlated with the output from magnetic probes thathad been previously installed in the turbine. Thus the feasibility ofmillimeter-wave doppler radar for measuring vibration in operating gasturbines has been demonstrated.
The questions remaining about the usefulness of this general techniquefor the analysis of mechanical systems operating in adverse environmentscan be listed as follows
:
1. Can an accurate method for in-situ calibration be implemented?
2. Can static displacements, e. g. , shaft expansion, be measured accurately?
3. Will reflections from surfaces other than the target surface causeerrors or ambiguities in data interpretation?
4. Can a simple, accurate and reliable radar probe capable of with-standing the harsh environment of an operating turbine be manufac-tured at a reasonable cost?
All of these questions have already been examined in detail and tech-niques have been devised that give promise of providing all of thedesired features. What remains to be done is to couple a radar probedesign effort tightly with an engine test program so that theseproblems can be worked out in an orderly and thorough manner.
Acknowledgements : The contributions of Harry Northern of Detroit-Diesel Allison Division of General Motors in testing the prototyperadar are gratefully acknowledged.
6o

61

62

SESSION II
LAND BASED APPLICATIONS
Chairman: Richard G. Salter
Rand Corporation
Co-chairman: William J. Whelan
Rand Corporation


IMPROVING VEHICLE LIFE-CYCLE RELIABILITYBY PROGNOSTIC MAINTENANCE MANAGEMENT
THROUGH GERIOMETRY
Richard G. SalterThe Rand Corporation
Santa Monica, California 90406
Abstract: Land vehicle life cycle reliability is a topical subject.The military is recognizing the necessity to survive the peacetimeenvironment in order to improve combat readiness. Government inter-vention in the automotive world increases on behalf of energy, theenvironment, and the consumer. This intervention forces the imple-
Imentation of revolutionary* designs and technology while insisting onconcurrent reductions in consumer maintenance problems and costs.Automobile first costs are showing the effects.
On-vehicle computing instrumentation technology now offers new
|
capabilities to fight the battle through prognostic maintenance manage-ment (PMM) . Prognosis enables the selection of the best time formaintenance while reducing inspection requirements, vehicle breakdownsand secondary failures. A PMM program enables an improved user confi-dence while maximizing the productivity of scarce maintenance resources.
On-vehicle microdata systems enable two prognostic techniques: (1)
the automation of condition trend analysis, and (2) a new capability
—
geriometric accounting—the cumulative recording of stress energy andcyclic stress functions which contribute to wear and fatigue damage.
Some homework is required, however—on-vehicle data acquisitionsufficient to identify the service parameters to monitor and the neces-sary maintenance criteria expressed in terms of these parameters. Ina practical sense, a bootstrap program is required in which an initialsystem design will provide for both an operational PMM program as wellas the acquisition of data with which to improve both the hardware andthe software of the evolving system. We are now in a position todesign such an initial system.
The Problem Context
The problem is to reduce the cost of maintaining vehicles whileimproving their reliability and availability for service. The diffi-culty is that maintenance systems are falling far short of the desired
*As opposed to evolutionary changes on a time scale consistent with goodautomotive development practice
.
65

goals of vehicle users. New maintenance management techniques are nowpossible through the employment of on-vehicle microcomputers. Thispaper describes an approach using condition trend analysis and gerio-metric accounting.-^ This approach is made possible by recent develop-ments in LSI electronic technology.
A key part of the problem is the vehicle itself. Good vehicle develop-ment practice requires a deliberate evolution of the vehicle design sothat new design concepts can be thoroughly tested in the hands of theuser. With this technique, each incremental change and its effect onthe entire vehicle system can be evaluated without potentially complexinteractions among a great many concurrent changes. This ideal conceptis currently practiced only in the commercial trucking industry. Themilitary produces vehicles that are designed for worst-case combatconditions, which means they are not ideally suited to survive the peace-time environment. The combat vehicles are usually of revolutionarydesign in order to benefit from the latest advances in technology anddoctrine. The tactical vehicles tend to be of traditional design, nothaving benefited from even evolutionary trends. The automotive industryis of course highly competitive and tends to introduce revolutionarydesigns in order to beat the competition in styling, performance andprice. In recent years another influence, emissions and fuel consumptionregulations , has strongly forced the implementation of revolutionarytechnology in new car designs.
The resources expended in maintaining vehicle fleets are significant,but the results obtained are not satisfactory. The Army spends $1.3billion each year below depot to maintain a $13 billion inventory. Theachieved availability is often quoted at the 90 percent level, howevermost unit commanders would be happy to see 60 percent of their vehiclesrise to any given occasion. As for automobiles, the NHTSA has estimated^that consumers spend $50 billion annually for maintenance on a $500
billion investment. They estimate that $20 billion of this maintenancecost is improper or unnecessary. It is possible that even more of the
cost is avoidable; that increment that is due to the tendency of auto-mobile owners to delay the maintenance of their cars and to drive themuntil failure occurs. This delay is primarily due to a hesitancy to
commit themselves to the time, inconvenience, and expense of the process,
particularly when uncertainty surrounds these factors as well as the
necessity for the maintenance itself.
There is considerable interest and activity ongoing in the improvementof the maintenance systems. The Defense Advanced Research ProjectsAgency (DARPA) has been sponsoring the Vehicle Monitoring System (VMS)
project which is concerned with the on-vehicle acquisition of use patterncondition and maintenance data on Army vehicles operating in the field.
This effort has been broadened to include geriometric data for use in
the development of prognostic maintenance management. The Army is
currently fielding the STE-ICE diagnostic test system for better off-
vehicle condition assessment and fault isolation of Army vehicles. The
66

i NHTSA is actively investigating the commercial maintenance system, andin particular the potential for diagnostic inspection as a solution tosome of the problems. Both the automotive and test equipment industriesare implementing new equipment and techniques based on advanced tech-nology and on evolving consumer requirements.
A Taxonomy
Vehicle maintenance^ is required to offset degradation which occurs asthe vehicle is employed. The causes of this degradation are componentsof normal use, abnormal use or abuse, storage, neglect and the drive-to-failure ethic. Deterioration mechanisms include fractures, fatigue (due
to mechanical, electrical, chemical and thermal stresses), wear, age,corrosion, etc. The effects of deterioration are manifested as noise,low power, stalling, breakdown, and secondary failures.
Detection of degradation can be accomplished by visual, audio, ortactile observation by the people involved, employing in some cases anadministrative record-keeping system; by testing the system foremissions, function, or alignment with testers such as STE-ICE, Auto-sense, or built-in test equipment (BITE) ; or by monitoring the systemin-use for status, mileage, or cumulative stress by panel instrumentsand on-vehicle systems such as VMS.
Maintenance can be categorized as corrective, preventive, or prognostic.Corrective maintenance is the repair of obvious problems and failures.It fixes the effects extant—the failure that has already occurred. Itis performed as necessary. Preventive maintenance is intended to slowthe deterioration mechanisms—changing the oil will reduce the wearrates. It is usually performed on a time or mileage criteria. Prog-nostic maintenance is the interception of the deterioration mechanismbefore the effect happens, thus forestalling the effect altogether.Prognosis can be based on two criteria: condition trends, and cumulativegeriometric accounts.
Why Geriometry
Geriometry is the measurement of the causes of vehicle degradation,whereas all other maintenance techniques measure effects. Geriometrycan provide prognostic criteria for vehicle subsystems with: unpre-dictable degradation trend patterns—the degradation curve for thesesubsystems might, for example, drop so suddenly that anticipation isnot possible; wear or fatigue failure mechanisms which represent themost significant failure mode; and inspection difficulties representedby a requirement for significant dissassembly with risk of maintenance-induced failure.
It is estimated that several vehicle subsystems are prime candidatesfor prognosis based on Geriometry. Brake wearout has been determined
6?

to be a function of cumulative energy absorption.-' Electrical andstarting system life might be expected to correlate with their cumu-lative load-energy flux. Power plants might have several parametersthat would correlate with life. These may include a piston travelfunction for upper cylinder life in reciprocating engines, and a thermalcycle function for both reciprocating and gas turbine engines.
Why Prognosis
Even assuming that Geriometry is important to prognosis, why isprognosis important to maintenance management? The answer, of course,is that some technique is necessary to choose the time for maintenancewhich will minimize maintenance costs while achieving a desired reli-ability and availability. The technique must be quantified in termsof measurable parameters and the precision and variance with which theseparameters describe the subsystem life must yield decision criteriawith close confidence limits. The rationale for prognosis as an effec-tive technique for vehicle maintenance is somewhat subjective sincedata to prove the contention do not yet exist. It is anticipated bymany persons in the maintenance field, however, that a number ofbenefits will accrue to the implementation of prognosis. Among thesebenefits are the reduction of secondary failures—the anticipation ofthe primary failure obviates the possibility of its causing the second-ary failure; the reduction of physical inspection requirements—thecontinuous measurement of the trends and geriometric accounts can bethought of as continuous inspection; and the reduction of "unnecessary"maintenance--by definition, maintenance based on 'optimized' criteriawill eliminate premature actions and reduce the tendency to delayedaction. It is also anticipated that a proven prognosis technique willimprove vehicle owner confidence in the basis for maintenance decisionsand indeed allow the owner to concur in and even initiate the mainte-nance decision. Also, given a cost-benefit criteria, the owner canchoose to increase the reliability and availability of his vehicle (s).
And finally, these benefits would lead to a better productivity of the
maintenance resource system, which is currently highly overtaxed.
Instrumentation Attributes
It is appropriate to comment on the differing attributes of on-vehicleand off-vehicle instrumentation systems. Obviously, on-vehicle systems
can measure variables and compute parameters essentially continuously.
This capability allows for the automation of trend analysis and the
accumulation of geriometric accounts. On-vehicle systems can also
advise the operator of emergency situations and perform the functions
of the currently popular trip/fuel management computers . All monitoringis accomplished during the normal vehicle use.
Negative attributes for on-vehicle systems include the fact that one
system is required for each vehicle to be monitored and thus the cost
of the system must be low. Also, the sensors to which the system
68

connects must not only be of low cost, but must also be capable oflliving continuously in a very difficult environment. The same can besaid, however, for the systems and sensors the industry is developingfor electronic engine controls and so we may anticipate early solutions.
-
(Off-vehicle instrumentation systems, on the other hand, cannot monitor'continuously, but rather must engage in periodic testing, which can(support, along with a record keeping system, trend analyses of at leastcertain variables. Although this capability is more limited, it maystill be useful in the overall scheme of maintenance management.Another difficulty is that testing sessions must be scheduled outsideof the normal vehicle operating/use patterns. At these sessions, the.vehicle must be warmed up and the sensor harness installed. The off-vehicle system however has a number of positive attributes. Chief among
I these is the capability, through the use of more pervasive sensors, toI perform more detailed fault isolation than on-vehicle systems. Thus,off-vehicle systems can be thought of as competent to fault isolate atthe component level, whereas, on-vehicle systems are in a practicalsense limited to fault isolation at the subsystem level. A finalpositive attribute of off-vehicle systems is the fact that they can be
j
used across many vehicles and for this reason can contain more expensivecomponents with the attendant advantage of higher precision, etc.
In consideration of the relative attributes, it may be anticipated thata rational maintenance system will contain both on-vehicle and off-vehicle systems and facilities.
Implementation Problems
Primary to the difficulty of implementing prognostic maintenancemanagement is the complexity of existing vehicle systems and theirmaintenance systems. Compounding the problem is the variability of theuse and maintenance patterns in which the vehicles are employed. Andfundamental to all of these is a lack of data with which to quantifythe system from a cost and performance standpoint. Without thisquantification, the benefits of improvements as compared to their costof implementation cannot be assessed.
Implementation Procedure
Given the frailty of existing data, an implementation program must bedesigned to bootstrap, that is to take all possible advantage of existingintuition, based on experience, to estimate the actual data requirementsand to perform the initial system designs. These designs must not onlyserve the prime objective of providing owners with a meaningfulprognostic maintenance management capability but they must also helpto create a better data base with which to evolve and assess the hard-ware and software of better future systems.
69

Prognostic Data Development
The size of the "experiment" necessary to achieve a confidentcharacterization of the prognostic parameters for a given vehiclemodel is determined by the maximum number of variables in any oneparameter used to characterize any of the life/failure functions of thevehicle system, and by the inherent variance of this characterization.For most vehicles it is assumed that a maximum of one, two or threevariables will be required for any parameter, and that a factor ofthree will handle the variance of the parameter. Thus, an experimentcomprised of ten life/failure cycles should suffice to prove theparameter formulation hypotheses. It might also be assumed that theexperiment necessary to prove the generic character of these parametersacross various vehicle types would require the testing of ten vehicletypes for ten life/failure cycles each.
The engineering of prognostic parameters requires an understanding ofthe physical degradation process and how the significant variablesenter into the motivation of the process. It is expected that thisunderstanding will derive from the experience gained from the many yearsof vehicle development and use. As an example, we might define a param-eter for upper cylinder wear in a reciprocating engine. Engine develop-ment lore suggests that the parameter will be a function of theaccumulation of engine revolutions, each weighted by its piston speed,
its Brake Mean Effective Pressure (BMEP) (a torque function) , and byits clearance situation as characterized by its cooling temperature.
An expression for this parameter is defined as the product of these
factors summed over the engine running history. The formulation must,
of course, incorporate estimates of the coefficients and exponents to
be used. In this case, nominal values for RPM, EGT, and coolant
temperature (CT) (selected to represent the three factors) are estimated
at 1000 RPM, 200°F, and the thermostat control temperature. Exponents
are assumed to be square, linear and cube for the three factors respect-
ively. The memory requirement needed to accumulate this parameter is
quite nominal—essentially just one register which is continually
updated so that it always represents the total sum to date..
In the early period of developing parameters to characterize significantvehicle life/failure functions, multiple parameter formulations can berecorded simultaneously—employing different variable sets, coefficients,
exponents and even basic formulations. This is possible because of the
aforementioned modest memory requirement for each parameter.
The purely statistical technique for developing a prognostic data baserequires the continuous time recording of a comprehensive set offundamental variables, so that they can be analyzed with a regressionmodel. This will allow the derivation by correlation techniques of the
significant parameters describing the various life/degradation/failurefunctions. An alternative technique is to "engineer" these parameters
70

using intuitive engineering judgment. The benefits of using the lattertechnique are compelling when considering that the memory requirementsof the former are over 100 times greater for a similar achievement.
Variables/Parameters
Chart 9 lists a set of variables/parameters, some of which are directlysensed and some of which are computed from sensed variables and/ortime, which have been distilled from a much larger set of possibilities.The current list, subject to change as time and experience are accu-mulated, requires 18 vehicle connections or transducers, most of whichwill be common with those needed to provide data to engine, spark, andfuel control systems . The prospects for concurrent use of sensors forrealtime control and for prognostics reduces considerably the number ofadditional sensors dedicated only to prognostics.
A Preliminary System Specification
It is now possible to specify and design an initial system with whichto begin the implementation process. The system would need approximately18 sensed inputs and would sense or compute on the order of 30 parameters,incorporating approximately 10 formulations for each parameter. Facil-ities would include continuous display of critical variables, such asoil pressure, demand display of all variables and parameter registers,and would include the features of trip and fuel management computers.(For rally buffs, it could also provide rally computations.) Otherfeatures would include a short term high resolution realtime record,similar to the airline flight recorder, in order to ascertain whathappened in the 30 minutes prior to and during a traumatic occurrence.Also, long term trend and geriometric function registers would beincorporated. Trends would be characterized by three values: a timeor distance parameter since initialization, a degradation since initial-ization, and the instantaneous slope or derivative of the degradationcurve
.
In order to support prognostic maintenance management, the system wouldbe programmed to annunciate the fact that a parameter has reached itsmaintenance decision criteria level. The display would identify whichparameter (s) has reached its criteria. Reset of system oould berelegated to an inspection system (or a motor sergeant) if appropriate.The system would also be designed to enable a readout device to inter-rogate the memory and store useful data so that it can be incorporatedin a general data base for use in parameter development. This datamust be read out in computer-readable format and the readout device mustbe capable of receiving input describing the maintenance actions thatwere required. In the case of component overhaul or replacement, thereadout device must also be capable of initializing the necessaryparameters. Many of these features are now incorporated in the DARPAVehicle Monitoring System.
71

Based on the VMS experience and on that with the after-market tripcomputer devices, it is estimated that the memory requirements for sucha system will be of the order of 8k BYTES. Early design might requiremore memory in order to support program flexibility.
References
1. Salter, Richard G. , Geriometry: A Cumulative Stress/Damage Measure-ment of Useful Life, The Rand Corporation, P-5952, March 1978.
2. Claybrook, Joan B., (Administrator), Statement before the HouseCommittee on Interstate and Foreign Problems concerning Auto RepairProblems and Titles II and III of the Motor Vehicle Information andCost Savings Act, NHTSA/DOT , September 14, 1978.
3. Salter, Richard G. , Maintenance Management Through Diagnosis , TheRand Corporation, P-5867, June 1977.
72

VEHICLE MAINTENANCE: THE PROBLEM CONTEXT
THE VEHICLES
• MILITARY (DESIGNED FOR WORST-CASE COMBAT):- COMBAT - REVOLUTIONARY DESIGNS- TACTICAL - TRADITIONAL DESIGNS
• NON-MILITARY.-
- AUTOMOBILES - REVOLUTIONARY DESIGNS- TRUCKS - EVOLUTIONARY DESIGNS
THE MAINTENANCE SYSTEM• MILITARY:
- $1.3 B ANNUAL MAINTENANCE ON $13 B INVENTORY- LOW AVAILABILITY, SHORT VEHICLE LIFE
• NON-MILITARY:- $50 B ANNUAL MAINTENANCE ON $500 B INVENTORY- $20 B (+) UNNECESSARY, MUCH CONSUMER FRUSTRATION
ACT I V IT I ES
• DARPA:
- VMS PROGRAM- USE PATTERN AND PROGNOSTIC DATA
• ARMY STE-ICE/ATEPS DEVELOPMENTS
• NHTSA:
- DIAGNOSTIC INSPECTION EFFORTS
• AUTOMOTIVE /TEST EQUIPMENT INDUSTRIES:
- MANY COMPUTERIZED TESTERS
CHART 1
VEHICLE DEGRADATION
CAUSES
USE
ABUSESTORAGE
NEGLECT
DRIVE-TO-FAILURE
A TAXONOMY
MECHANISMSFRACTURE
FATIGUE
WEARAGE
CORROSION
EFFECTS
NOISE
LOW POWER
STALLING
BREAKDOWNSECONDARY FAILURE
DETECTION
OBSERVATIONVISUAL
AUDIOTACTILE
BY
PEOPLE
ADM. RECORDS
TESTING
BY
EMISSIONSFUNCTION
ALIGNMENT
STE-ICE
AUTO-SENSE
BITE
MONITORING
BY
STATUS
MILEAGE
CUMULATIVE STRESS
PANEL
VMSINSTRUMENTS
MAINTENANCE
CORRECTIVE
FIXES EFFECTS
CRITERIA
"AS NECESSARY'
PREVENTIVE
SLOWS MECHANISMSCRITERIA
TIME
MILEAGE
PROGNOSTICFORESTALLS EFFECTS
CRITERIA
CONDITION /TREND
GERIOMETRIC ACCOUNT
CHART 2
73
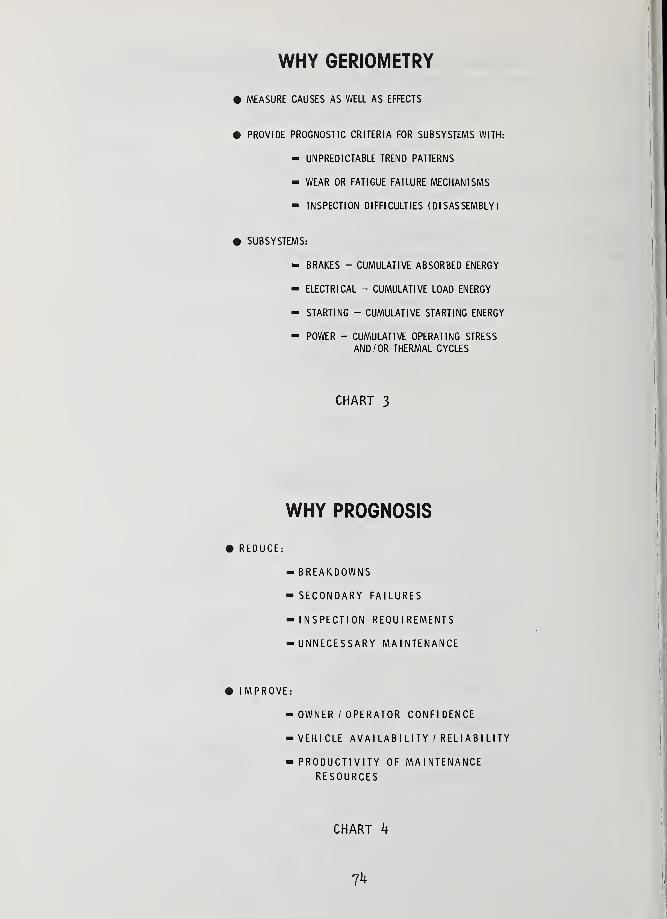
WHY GERIOMETRY
• MEASURE CAUSES AS WELL AS EFFECTS
• PROVIDE PROGNOSTIC CRITERIA FOR SUBSYSTEMS WITH:
- UNPREDICTABLE TREND PATTERNS
- WEAR OR FATIGUE FAILURE MECHANISMS
- INSPECTION DIFFICULTIES (DISASSEMBLY)
• SUBSYSTEMS:
- BRAKES - CUMULATIVE ABSORBED ENERGY
- ELECTRICAL - CUMULATIVE LOAD ENERGY
- STARTING - CUMULATIVE STARTING ENERGY
- POWER - CUMULATIVE OPERATING STRESS
AND /OR THERMAL CYCLES
CHART 3
WHY PROGNOSIS
• REDUCE:
- BREAKDOWNS
- SECONDARY FAILURES
- INSPECTION REQUIREMENTS
-UNNECESSARY MAINTENANCE
• IMPROVE:
- OWNER / OPERATOR CONFIDENCE
-VEHICLE AVAILABILITY / RELIABILITY
-PRODUCTIVITY OF MAINTENANCERESOURCES
CHART k
1^

INSTRUMENT ATTRIBUTES
ON VEHICLE OFF VEHICLE
CONTINUOUS MONITORING PERIODIC TESTING
• GERIOMETRIC ACCOUNTING • COMPONENT DIAGNOSIS(FAULT ISOLATION)• SUBSYSTEM DIAGNOSIS
• EMERGENCY WARNING• TREND TESTING WITH
ADMINISTRATIVE PROCEDURE• AUTOMATED TREND TESTING
• ONE FOR MANY VEHICLES
• OPERATING PARAMETER DISPLAY
(TRIP COMPUTER)• SPECIAL TEST SESSIONS
-VEHICLE WARM-UP-HARNESS HOOK-UP• ONE FOR EACH VEHICLE
• SENSORS MUST LIVE ON VEHICLE
• TESTS WHILE OPERATING
IMPLEMENTATION PROBLEMS
• COMPLEX VEHICLE SYSTEMS
• COMPLEX MAINTENANCE SYSTEMS
• HIGHLY VARIABLE EMPLOYMENT
- USE- ABUSE- ENVIRONMENT- NEGLECT
• DATA
- EMPLOYMENT PATTERNS- DEGRADATION/ FAILURE MODELS
• PROGNOSTIC PARAMETERS /CRITERIA
CHART 5
• SENSORS
CHART 6
75

PROPOSED IMPLEMENTATION PROCEDURE
VEHICLE
ENGINEERING
EXPERIENCE
ESTIMATED
DATA
REQUIREMENTS
INITIAL DESIGN
PROGNOSTIC
MAINTENANCE
MONITOR
ON-VEHICLE
MICROCOMPUTERAND
SENSOR TECHNOLOGY
DEVELOPING
PROGNOSTICDATA BASE
VEHICLE DESIGN
ANDPMM TECHNIQUES
PMMDEVELOPMENT
LOOP
ON-VEHICLE
MAI NT. DATA
SYSTEM DESIGN
COST-BENEFIT
EVALUATIONS
CHART 7
PROGNOSTIC DATA DEVELOPMENT
• FOR EACH VEHICLE MODEL TEST FOR N FAILURE/LIFE CYCLES
- N =MAX. NUMBER OF VARIABLES IN ANY PARAMETER TIMES f( VARIANCE)
• ASSUME: N = 3 AND f = 3 OR 10 LIFE CYCLES REQUIRED
• TO ESTABLISH GENERIC CHARACTER OF PARAMETERS
• ASSUME: 10 VEHICLE MODELS
• "ENGINEERING" A PROGNOSTIC PARAMETER
- ENGINE CYCLE LIFE: i= n
^2 (REVOLUTION)|
(RPMJRPMq)3
< EGTj /EGTQ
)
b(CTq/CT-)'
i=0
• ASSUME: a ? 2, PISTON SPEED IS SQUARE FUNCTION, RPMo = 1000
b-1, BMEP IS LINEAR FUNCTION, EGTo = 200° F
C = 3, CLEARANCE IS CUBE FUNCTION, CTo = THERMOSTAT TEMP.
- USE MULTIPLE FORMULATIONS
• DATA MEMORY
ENGINEERING PARAMETERS(VARIANCE MODEL)
= 10-2 STATISTICAL PARAMETERS
(REGRESSION MODEL)
CHART 8
76

VARIABLES/PARAMETERS
SENSED COMPUTED
FUEL FLOW (C)
DISTANCE (C)
BRAKE SWITCH (C)
REVOLUTIONS (C)
EXHAUST GAS TEMPERATURE (2) (C/D)
COOLANT TEMPERATURE (C/E)
OIL PRESSURE (C/E)
BEARING TEMPERATURE (S) (T, C/E)
VERTICAL ACCELEROMETER (C)
IGNITION SWITCH (C)
STARTER SWITCHBATTERY VOLTS (T)
START CURRENT (T)
CHARGING CURRENT (T)
AIR FILTER AP (T)
MILES PER GALLON (T)
BRAKING ENERGY (C)
RPM (C/E)
EGT MANIFOLD BALANCE (T)
ENGINE WEAR FUNCTION (C)
RUNNING TIME FRACTION (C)
NO. COLD STARTS (NO. TRIPS) (C)
TOTAL STARTS (C)
STARTING SYSTEM POWER (T)
STARTING SYSTEM ENERGY (C)
COMPRESSION BALANCE (T)
ENGINE POWER (T)
COOL DOWN TIME (C/D)
TRIP LENGTH (C/D)
TRIP SPEED (C/D)
OIL FILTER AP (T)
COOLANT LEVEL (T)
OIL LEVEL (T)
C - Cumulative T - Trend E - Excursions D - Distribution Moments
A PRELIMINARY DATA ACQUISITION SYSTEMSPECIFICATION
• 18 SENSED VARIABLES
• 30 SENSED OR COMPUTED PARAMETERS
• TRIP /FUEL MANAGEMENT FUNCTIONS
• CONTINUOUS OR DEMAND DISPLAY
• SHORT TERM HIGH RESOLUTION TIME RECORDING
• LONG TERM STORED DATA:
- TREND FUNCTIONS
- CUMULATIVE GERIOMETRIC ACCOUNTS
• PROGRAMMED WARNING AT CRITERIA FOR TREND /CUM
• COMPUTER READABLE OUTPUT
• MEMORY - 8 K
CHART 9
CHART 10
77

MOTOR VEHICLE FAULT DETECTION AND DIAGNOSIS
Joseph J. InnesNational Highway Traffic Safety Administration
Washington, DC 20590
Abstract: Motor vehicle diagnostic inspection demonstration projectsconducted by the National Highway Traffic Safety Administration underTitle III of the Motor Vehicle Information and Cost Savings Actindicate that high volume diagnostic inspections can result in greatersafety, improve fuel economy, and reduce the number of faulty andunnecessary repairs and the amount of motor vehicle pollutants. Theprojects conducted periodic safety and emissions inspections for a
period of 15 months. They provided direct experience and documentationof the benefits and costs of diagnostic motor vehicle inspection.
INTRODUCTION
The National Highway Traffic Safety Administration (NHTSA) , U.S. Department of Transportation, recently completed phase one of a multi-million dollar motor vehicle diagnostic inspection (MVDI) demonstrationprogram. The goal of the federally funded demonstration was to deter-mine if a national system of diagnostic inspection centers would becost effective in the sense that the public benefits would exceed theprogram costs. The specific objectives of the program were to provideinformation and data on the following subjects:
1. The relative costs and benefits of the project.2. The capability of the motor vehicle repair industry to correct
diagnosed deficiencies or malfunctions and the cost of such repairs3. Vehicle-in-use standards and feasible reject levels.4. The efficiency of facility designs employed.5. The degree of standardization of diagnostic systems and test equip-
ment .
6. The development of diagnostic equipment designed to maximize the
interchangeability and interface capability, and7. Vehicle designs which facilitate or hinder inspection and repair.
To meet these objectives, NHTSA established a comprehensive program for
the acquisition, processing and analysis of information and data. Atthe Federal level, NHTSA provided the basic support — It establishedtest criteria and diagnostic inspection procedures, designed the
experiment and provided the overall technical management to assuretimely and successful implementation of the projects. To satisfy the
provisions of the Motor Vehicle Information and Cost Savings Act, five
such demonstration sites were selected competitively; and throughcooperative agreements , Federal funds were awarded to the states in
the form of grants with matching state contributions. The five
78

I projects selected for the demonstration were located in the States ofAlabama, Arizona, Tennessee, the District of Columbia and the Common-wealth of Puerto Rico. Under the technical supervision of NHTSA'sstaff the D.C. motor vehicle diagnostic inspection pilot lane wasdedicated to the demonstration and six new facilities were constructed
I and equipped with modern diagnostic equipment to conduct safety andemission inspections. While much of the diagnostic equipment employedin this demonstration was of necessity off-the-shelf, some modificationswere encouraged to improve system performance.
Two contractors were engaged to provide essential support activities.An engineering support contractor monitored the quality control andreported on project operations and equipment calibration throughperiodic on-site audits. The focal point for collecting, processingand analyzing data was provided by a program evaluation support con-tractor. This source was responsible for the ADP activities includingperiodic data evaluation reports as prescribed by NHTSA to aid overallproject management. Although these early data returns could not beused to reach definite conclusions concerning diagnostic inspection,the data were useful in identifying and explaining certain trends withregard to vehicle failure rates, outages by system, subsystem andcomponents as well as the vehicle recruiting efforts. Thus, these earlytrends facilitated corrective measures in vehicle recruiting activitiesby identifying hard to fill cells and aided in the assessment of thepass/fail criteria and repair cost information to assure statisticalvalidity of data.
MOTOR VEHICLE DIAGNOSTIC INSPECTION CONCEPT
Inspection/Maintenance Cycle
In order to make a meaningful evaluation of the relative costs andbenefits of the projects, two similar groups of vehicles were estab-lished at each site. One group was designated the diagnostic or"treatment" group, i.e., the group of vehicles which received specifictechnical diagnostic information in order to facilitate correction ofany component failing inspection. The second group was designated the"control" group, i.e., the group against which the costs and benefitsof diagnosis were measured. This group received only pass-fail infor-mation. Both groups received a periodic safety and emission inspectionin accordance with established criteria. However, only the vehicles in
the treatment group received the diagnostic information. A flow chartof the inspection and repair cycle for vehicles enrolled in the demon-stration is shown in Figure 1. In addition to the normal periodicinspection, vehicles were inspected whenever the title was transferredto another person, unless the transfer was for the purpose of resale,or whenever the vehicle sustained substantial damage to any safety oremission-related system as prescribed by regulation.
79

Data Collection and Reporting
Inspection forms were designed to facilitate transfer of information to80-column punch cards. Although the projects in areas with mandatoryperiodic motor vehicle inspection (PMVI) were permitted to use theirnormal (PMVI) inspection forms for the control group and compatibleforms for the diagnostic group, NHTSA had the final word on the designto assure uniformity and to facilitate data processing and evaluation.The flow of information is shown in Figure 2
.
In addition to the pass/fail and diagnostic information, it was extreme-ly important that repair and maintenance costs were gathered over theentire time span that a vehicle was in the program, not only forinspection-related repairs , but repair costs for normal maintenancebetween inspections were also reported. This was necessary for boththe control and diagnostic groups so that a comparison could be madebetween the two to see if a reduction in overall repair costs is
achieved by the diagnostic group. To the extent possible, parts andlabor costs were listed separately for each operation so that inspection-related costs could be separated from owner-requested repairs notassociated with the inspection.
THE COMPUTERIZED DIAGNOSTIC INSPECTION LANE
Computer System
Although participating States were provided latitude in the design offacilities and selection of diagnostic equipment, only the District ofColumbia engineering pilot lane was designed and equipped with acomputerized AVCO 210 diagnostic inspection system (Figure 3)
.
The system was designed to provide on-line , real time computer controlover all inspection sequences. The AVCO System 210 was built around aDigital Equipment Corporation Minicomputer (PDP 11/05) with a 20,000word memory and a (DEC RK05) disc system with unformatted capacity of24.4 million bits which interfaces the computer with DEC RKll-DE/DJdisc controller.
In addition to directing all inspection sequences, the computer systemacquired manually fed inspection data from visual observations anddirect outputs of major pieces of test equipment, and made pass-advise/reject decisions against stored tables of limits. It also compiledlane statistics, and transmitted data to a master computer bank oncommand
.
A motor vehicle to be inspected is first identified to the computersystem by entry of pertinent vehicle information via a cathode ray tube
(CRT) keyboard terminal at the entrance to the inspection lane (Figure
4) . The system then establishes a data file for the vehicle and
80
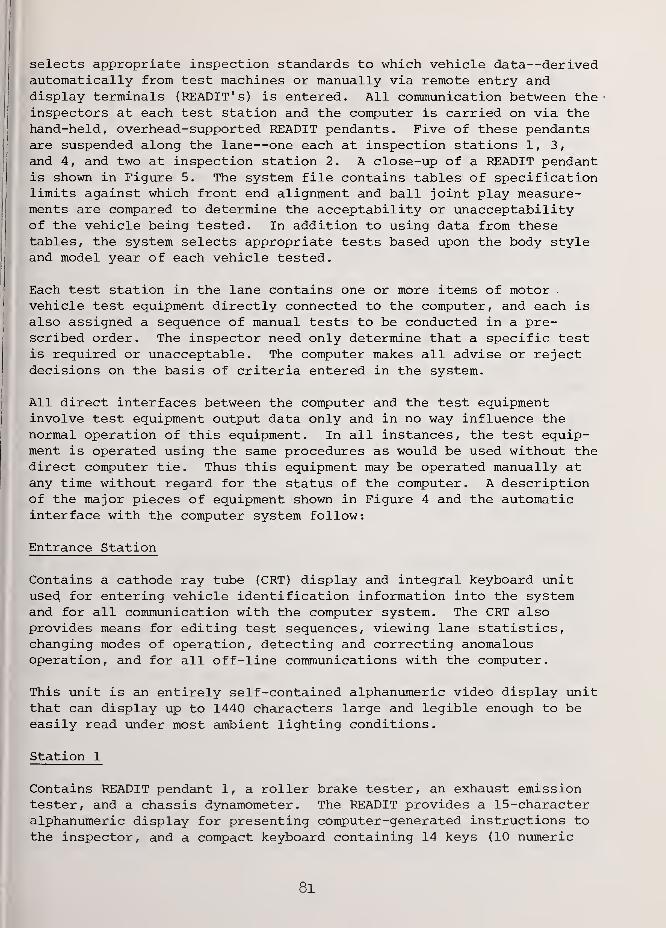
selects appropriate inspection standards to which vehicle data—derivedautomatically from test machines or manually via remote entry anddisplay terminals (READIT's) is entered. All communication between the •
inspectors at each test station and the computer is carried on via thehand-held, overhead-supported READIT pendants. Five of these pendantsare suspended along the lane—one each at inspection stations 1, 3,
and 4, and two at inspection station 2. A close-up of a READIT pendantis shown in Figure 5. The system file contains tables of specificationlimits against which front end alignment and ball joint play measure-ments are compared to determine the acceptability or unacceptabilityof the vehicle being tested. In addition to using data from thesetables, the system selects appropriate tests based upon the body styleand model year of each vehicle tested.
Each test station in the lane contains one or more items of motorvehicle test equipment directly connected to the computer, and each is
also assigned a sequence of manual tests to be conducted in a pre-scribed order. The inspector need only determine that a specific testis required or unacceptable. The computer makes all advise or rejectdecisions on the basis of criteria entered in the system.
All direct interfaces between the computer and the test equipmentinvolve test equipment output data only and in no way influence thenormal operation of this equipment. In all instances, the test equip-ment is operated using the same procedures as would be used without thedirect computer tie. Thus this equipment may be operated manually atany time without regard for the status of the computer. A descriptionof the major pieces of equipment shown in Figure 4 and the automaticinterface with the computer system follow:
Entrance Station
Contains a cathode ray tube (CRT) display and integral keyboard unitused for entering vehicle identification information into the systemand for all communication with the computer system. The CRT alsoprovides means for editing test sequences, viewing lane statistics,changing modes of operation, detecting and correcting anomalousoperation, and for all off-line communications with the computer.
This unit is an entirely self-contained alphanumeric video display unitthat can display up to 1440 characters large and legible enough to beeasily read under most ambient lighting conditions.
Station 1
Contains READIT pendant 1, a roller brake tester, an exhaust emissiontester, and a chassis dynamometer. The READIT provides a 15-characteralphanumeric display for presenting computer-generated instructions tothe inspector, and a compact keyboard containing 14 keys (10 numeric
81

and 4 special function) used by the inspector to enter judgments andcommands to the system. A code book affixed to the front of the READIT(see Figure 5) provides a complete listing of all GENERAL, SPECIAL, andTEST ID codes for convenient reference.
Roller Brake Tester . The system interfaces directly with the output ofthe minicomputer-controller of the tester. All front panel MARGINALand FAIL light indicators of that equipment are monitored directly bythe AVCO System 210 computer upon command of the inspector via theREADIT. The system records all MARGINAL and FAIL lamps operated duringthe brake test. In April 1975, this minicomputer-controller was shutdown and the brake analyzer was operated manually. The chassis dyna-mometer described next is integral with this brake analyzer.
Chassis Dynamometer . The system interfaces directly with the chassisdynamometer, and both the ROADSPEED and HORSEPOWER analog meters ofthat device are monitored by the computer. Upon command of theinspector via the READIT, the system records the meter values andstores them in the Vehicle Processing File for the vehicle under test.These readings are taken simultaneously with the exhaust emissionreadings in response to a single inspector command.
Exhaust Emissions Tester . The system interfaces directly with the
exhaust emissions analyzer, and both the Hydrocarbon (HC) and CarbonMonoxide (CO) analog meters and their associated range switches aremonitored by the computer. Upon command of the inspector via the
READIT, the system records the meter values and compares them to
standard values for the model year of the vehicle under test.
Station 2
Contains READIT pendants 2 and 3, and a scuff gauge. Since READITs 2
and 3 are used in the same station, they are so coupled into the systemthat all testing assigned to each READIT at that station must be accom-
panied before a vehicle can be logically cleared from this station.
They operate as independent READITs in all other respects.
Scuff Gauge . The system interfaces directly with the scuff gauge, and
both the scuff value and direction are monitored by the computer. Uponcommand of the inspector via the READIT, the system records the peakscuff value and direction of scuff and compares these values to thestandard value stored in the system.
Station 3
Contains READIT pendant 4 and a dynamic front end alignment tester.
Front-End Alignment Tester . The system interfaces directly with the
dynamic front-end alignment tester, and all CAMBER, CASTER, and TOE
82

analog meter outputs are monitored by the computer. Upon command ofthe inspector via the KEADIT, the system records the meter values andcompares the caster, camber, and toe values to the specification valuesfor the make, model, and year of the vehicle under test.
Station 4
Contains READIT pendant 5 and a platform brake tester.
Platform Brake Tester . The system interfaces directly with the platformbrake tester, and the force levels on all four platforms are monitoredby the computer. Upon command of the inspector via the READIT, thesystem records the peak platform force levels; computes the side-to-side imbalance ratios of both axles, and the front to rear imbalance;and compares these imbalance values with standard values. The systemalso compares the imbalance values with those determined during theroller brake test (conducted earlier in the lane)
.
Exit Station
Contains a line printer with an integral keyboard unit.
The printer generates a concise report (with a carbon copy) of inspec-tion results at the lane exit. One copy is given to the vehicle ownerand the other is retained on file at the inspection facility. Theprint-out is made automatically on special forms pre-printed with gen-eral information. The form used by the District of Columbia, Bureau ofMotor Vehicle Services is extremely functional in relaying diagnosticinformation to owner and garage
.
This unit prints from a set of 64 characters at speeds of up to 30
characters per second. Data is entered from a 96-character keyboard.It is also used in changing the number of sequence of the stickersused to indicate that vehicles have satisfactorily completed inspection.
ASSESSMENT OF MOTOR VEHICLE DIAGNOSTIC INSPECTION
Impact on Safety
One of the objectives of the MDVI demonstration projects was to providea comprehensive analysis concerning vehicle-in-use (VIU) standards andthe sensitivity of rejection rates to changes in these standards.Degradation data were analyzed at the system and component levels, andrelated quantitative data were analyzed by site. Life-cycle data werelimited to the first, second and third periodic inspections of approx-imately six month duration for each cycle.
Although each project site was required to perform certain basicdiagnostic inspections, they were allowed to expand the list of criteria,
83

e.g., states or cities with PMVI programs were allowed to includemandatory system or component inspections. All projects also performedinspections of additional safety-related items not addressed by theFederal VIU Standard. These varied somewhat among the projects, andincluded headlamp function and aim, other lamps and reflectors, seat-belts, body condition, glazing condition, exhaust system, fuel system,underhood and electrical items. The criteria common to all projectsites as promulgated by the NHTSA is expressed in Part 570, Vehicle InUse Inspection Standards, of Chapter V, Title 49, Code of FederalRegulations. The VIU Standards address the brakes, steering system,suspension system, and tire and wheel components. These are thesystems and components which vehicle safety research has shown to besafety critical.
An analysis of the data from over 125,000 in-depth inspections (includ-ing reinspections after repairs) covering a 15-month period yields somestartling statistics. One the average, 74 percent of the vehicles in
the program failed the initial periodic inspection. In states withouta mandatory PMVI program, over 90 percent of the vehicles failed theinitial inspection (Table 1) . It is encouraging to note that thesafety and emissions systems of vehicles in the program show a 23 per-cent reduction in the reject rates for the relatively short period ofthe demonstration. Furthermore, the reject rate decrease from theinitial inspection to the third cycle inspection is statisticallysignificant to a high level of confidence. The values shown in Table 2
reflect inspection failure rates for the Federal VIU safety and emissionsystems criteria. Again, in all cases a significant improvement in themechanical condition of the systems and components was realized fromthe initial (P 1) to the final (P 3) inspection. Analysis of the pass/fail rate data from the first and third periodic diagnostic inspectionsshow 57 percent improvement in the condition of the vehicle safety andemissions systems. In the safety critical brake system area alone, 35
percent of vehicles diagnosed had unacceptable system or componentdegradation. This unusually high failure rate has substantial safetyimplications, as brake problems account for nearly half of the vehicularfactors which caused accidents. However, it is noteworthy that thereject rates were steadily decreasing over the life of the demonstrationA low reject rate is a measure of the roadworthiness of a vehicle fromthe safety point of view. One final point that must be made is thefact that advisories, which are an important part of the long-termsafety condition of vehicles, were not reflected in the above tablesbut could enhance safety under extended life cycle test conditions.
Impact on Emissions
In addition to periodic safety inspections, the demonstration projectswere required to conduct emissions inspections pursuant to the criteriapromulgated by NHTSA in consultation with the Environmental ProtectionAgency. The pass/fail levels for emissions were based on EPA
84

recommendations and on comments from the private sector. As such, thecriteria represent a fair balance between low and high rejection ratesto avert adverse public reaction to the demonstrations . The compromiseemissions criteria and test procedures provided for both the no-loador idle test and the loaded-mode test conditions. In each case twomajor air pollutants were measured — carbon monoxide (CO) and hydro-carbons (HC) . The relative HC and CO emission levels determined underloaded mode inspection were also used in diagnosing engine malfunctions
Although NHTSA did not issue standards concerning specific emission-related components and systems, the Guidelines for State Proposalssuggested that the projects consider inspection of the PCV valve, airfilter, idle speed, sparkplug firing voltage, available coil voltage,coil/condenser oscillations, ignition point operation and dwell,ignition timing and variation, vacuum advance condition, mechanicaladvance condition, dynamic cylinder balance, and manifold vacuumcondition.
No project inspected all items suggested, and there was some variationamong the projects. Most of the projects inspected the PCV valve, idlespeed, sparkplug firing voltage, available coil voltage, ignition pointdwell, ignition timing variation, and dynamic cylinder balance, in-spections of the battery and charging system were also frequentlyperformed. Those projects which conducted loaded-mode emission inspec-tions used the results in a "truth chart" matrix to further identifycarburetion or ignition problems as the probable source of the highemissions
.
Table 3 shows the average emission levels reported for the loaded andno-load modes for each of the inspection cycles. The combined averageHC and CO levels were down 22% and 12%, respectively, from the initialto the final inspection. The composite failure rates for the emissiontests shown in Table 2 were also reduced significantly, from 22.8% to
9.9%, over the program duration. Results of loaded mode testing showthat :
• Idle test failures accounted for 60 to 80 percent ofall emissions outages
• CO failures accounted for 48 to 65 percent of allemissions failures
• Idle CO accounted for 26.5 to 48.7 percent of allemissions failures, and
• Idle CO and HC accounted for from 50 to 64 percentof all emission failures.
85
Program results support the claim that specific diagnostic informationon the condition of the engine help the industry to properly correctemissions. The information provided apparently assisted the repairindustry in providing adequate repairs at reasonable cost. During thefirst inspection cycle the rate of faulty emission repairs was about25 percent for both the diagnostic and control groups. During thesecond cycle, however, the diagnostic group had a faulty emissionsrepair rate of only 11.5 percent, which was nearly 30 percent less thanthe 16.3 percent rate experienced by the control group.
In addition to the clean air benefits resulting from the reduced pollu-tion reported by the data evaluation contractor, fuel consumption dataunder day-to-day driving conditions indicate a significant improvementin fuel economy (Table 4) . The results are based on a representativesample of all model years and vehicle weight classes. The before/after tune-up analysis was conducted for all sites by model year, byweight, class, and by diagnostic versus control groups. The majorfindings were:
• All vehicles combined resulted in before/aftertune-up fuel economy of 4.7%.
• Diagnostic group generally exhibited a greaterimprovement in fuel economy than the control group(non-diagnostic)
.
The encouraging fuel economy results based on participant fuel con-sumption before-and-after tune-ups were substantiated by a joint EPA/NHTSA audit of 57 vehicles enrolled in the Phoenix, Arizona project.These vehicles were subjected to the standard EPA Federal TestProcedures (FTP) urban and highway driving cycle tests. As in the caseof the owner-submitted fuel consumption data, the EPA test results show
an improvement of 4.9% in fuel economy for compact cars and a FTPcomposite of 5.3% for intermediate cars.
Conclusions drawn from these data are that periodic diagnosis followedby corrective maintenance reduced exhaust pollution levels of HC and
CO, and significantly improved fuel economy for vehicles in the dem-onstration program.
Impact on Repairs
One measure of the impact on the repair process is an assessment of the
capability of the repair industry to repair diagnosed deficiencies and
the cost of such repairs. The capability of the repair industry to
repair specific outages was determined by reinspecting each iteminitially rejected. The reinspection failure rate can be a directnumerical measure of the industry's inability to perform adequaterepairs in response to inspection results. A vehicle is considered to
86
have failed reinspection of the repair of a defect was attemptedunsuccessfully or if no repair was performed on the vehicle. Thevehicle reinspection failure rates for the five diagnostic demonstrationprojects are shown in Table 5. The rates are presented by project andby periodic inspection cycle. The values range from a low of 1.1 per-
!cent for the first cycle D.C. control group, to a high of 50.0 percentfor the first cycle Alabama control group.
The objective of this task was to determine if detailed knowledge ofthe specific problem can facilitate correction and impact repair costs.The brake and emissions systems were particularly sensitive to theeffect of diagnosis. Analysis showed that approximately 6 percentcost savings was realized from tune-ups and carburetor work for thegroup with diagnostic information. In other areas, only a marginalsavings can be observed. Some of the true value of diagnostic inspec-
I tion appears to be lost, either as a result of the short duration ofthe program or the dependence on the consumer and repair industry toeffectively use diagnostic information. However, in spite of the modestcost benefits, the concept of an independent, objective diagnosticinspection with no vested interest in the actual repair process was wellreceived by both the consumer and the repair industry. Program par-ticipants voluntarily spent approximately $2.4 million on vehiclerepairs, many of them spent money for repairs that were clearly discre-tionary. Furthermore, a closer examination of the results indicatethat a vehicle owner armed with diagnostic information has a greaterlikelihood of receiving correct repairs, particularly for emissionssystems. The distribution of repair dollars by subsystems is shown inFigure 6. Brakes, tires and wheels, emissions, and suspension systemsaccount for two-thirds of the repair cost dollars. The average expen-diture for vehicle repaired in response to inspection during the pro-gram was 57 dollars.
CONCLUSION
The results of the demonstration show that the use of this technologyto determine the condition of vehicle safety and emissions systems is
viable and that it offers great promise to consumers and repair industryalike. Diagnostic motor vehicle inspection will benefit consumers byproviding them information on the condition of vehicles, which if usedproperly, can result in greater safety, lower pollution, improved gasmileage and in the case of complex vehicle systems generally loweroverall repair and maintenance costs.
Perhaps the most gratifying aspect of the demonstration was the consumerreaction to the diagnostic inspection program. A survey of consumerdemographic attitudes and experience conducted by a nationally prom-inent market research group shows that over 78 percent of a nationalsample of vehicle owners agreed that vehicle inspection should berequired by law. When participants were asked if they would join a
8T

diagnostic inspection program again, 93 percent said they would. Whenasked about the amount they would be willing to pay for a diagnosticinspection, over 60 percent were willing to pay $10 or more. Obviously;the concepts of an independent, objective diagnostic inspection with novested interest in the actual repair process was well received by boththe consumer and the repair industry. Furthermore, the benefits ofdiagnostic inspection can be considerably greater by improving com-munication between the inspection facility and the repair industry.Since the consumer and the repair industry play key roles in theeffective use of diagnostic information, further improvement in thiscritical communication link is highly desirable.
During 1979 NHTSA will continue its diagnostic inspection conceptprogram to compile , analyze , and document a practical set of alter-natives by which States, local governments, or consumer groups couldmake unbiased automotive diagnostic inspection more available to motor-ists. NHTSA' s planning for diagnostic inspection programs is especiallytimely now because of related activities of the Environmental ProtectionAgency (EPA) . Section 105 of the Clean Air Act authorizes the EPA tomake grants to the States to develop and maintain motor vehicle in-spection and maintenance programs for vehicle emissions. To date, $5
million have been authorized for this effort and additional funds wereappropriated should the need arise. The EPA's program must be con-sistent with the Periodic Motor Vehicle Inspection program under ourHighway Safety Act. That Act authorizes the Secretary of Transportationto make grants to the States to inspect vehicles for safety purposes,
and to set minimum Federal standards
.
88

I
.3mmrH OP f-j
-P *• OKG $
•Hin
5! -m 6u O
a•H(A
vo o\ in on m• • • • •m ^ h r» r»
co co * cj cs m
o> vo cn oo «h r-»
00 00 VO fO CM VO
cn cn o cn• •••••
i-i o r-» oo *rat crt o\ p>
fits
0) wrH
a a
0) > (0
£-• «w (3
ID >Q
as
•r-»C0
2
I-P
a.
fi
m
6«H-P
(0
fi
dp
•H
(0
fi
rH
g-P(0
>ito
a\ oo r-» cr>• •••••
"3* >x> co ro en
H 00 vo o> O Oi• •••••
i—I «H o m m nCN r—I rH rH
OM^ H vc in 00• • • • • •
co in h vo m(*>H H H CN
89

0)
CD
•8
omCM
0)
9J•H
6•H
0)
id
8 *
8£
ul
8s
as
8
MS
8^
§H
I 0)
in u
OCM
•
ro
CTioco
OCM
CTi
CM
rHCM
GOon
co
CM
CM
CO
CO
CO
o00
CXiO
o
CO
mCM
CM
CD 0\ <T\
*r r-i mCM CM rH
inCO
CO
CM
T 00O CO
CMr-
CMO
CO
CM
COCMCM
CO
CO
-P&Q
&i
<D
a3Eh
PhCD
-pCh.<!
cd
o
CD
PQ
ao
T}CD
CO
cd
pq
-pflCD
S0>O
Oaoo
CD
CD
Hcd
Eh
i
8-
Si
tfi tff e- tf> tfi
9 I S $ IS
«-» ^ r»
3 i 5 1 Is s s a a
<p e o o eS £ $ I 8a a a a a*
s « 9
8 S § 3
« o o r- e2 s § s a• • « * *
a s s a a
or-©"* ** 9to *- oam r» m m
•4 art «•] *J
3 a 9 9 3
a
• s
a
90

LD
1
jntrol• • • • t
oo h ^CM rH
21.6
Q
Peric -p
O iH (M <T» <T\
Treatr
• • • • •o n o\ co (Ncm
•
rH
ontrol
o vo oo in h• • • • •OfOMOrl
in n h H31.8'
i—
i
o
Peria -p
CM CM ON O r-
Treatr
• • • • •
Ch fl f) ON Mt n h•om
D.C. srage
Project
Alabama Arizona
Puerto
Rioo
Tennessee
Washington,
Weighted
Ave
91

FASSDIAGNOSIS FAIL OR
ADVISEPASS FAIL I
Figure 1. Vehicle Inspection and Repair Cycle Flow Chart
92

CONSUMERPARTICIPATION
ANALYSISOF REPAIRADEQUACY
REPAIR
IREINSPECTION CYCLE)
POST INSPECTION
ACCIDENT A REPAIRDATA
CONSUMER REPORTSDMV FILES
ON SITE ACCIDENTINVESTIGATION
VEHICLE OATA
OUTAGE ft REJECTLEVELSEMISSION LEVELSREPAIR COST ft ADEQUACYEASE OF DIAGNOSISINFO ON STANDARDS
PROJECT INFORMATION
OPERATING COSTSEQUIPMENT INFO.
FACILITY DESIGNSMANPOWER REQUIREMENTS
COST IENEFIT ANALYSIS
PROGRAM COSTS VI•ENEFITS FROMREOUCED REPAIRCOSTS, ACCIDENTS,ANO EMISSION
Figure 2. Motor Vehicle Diagnostic Inspection Data Flow Chart
93


95

Figure 5. Remote Entry and Display Inspection Terminal (READIT)
96

97

DIAGNOSIS OF COMBAT VEHICLE SYSTEMS USING SIMPLIFIED TEST EQUIPMENT
T.E. FitzpatrickR.E. HansonF.W. Hohn
RCA, Government Systems DivisionAutomated Systems
Burlington, Massachusetts
Abstract: In response to the current requirement to improve both theefficiency and the effectiveness of U.S. Army vehicle maintenance, theU.S. Army Tank-Automotive Research and Development Command has developedSimplified Test Equipment for Internal Combustion Engines (STE/ICE)*.Although the STE/ICE system has been developed for applicability acrossthe entire Army vehicle fleet, this paper describes the STE/ICE applica-tion to combat vehicles only. Because of the complexity of combat vehi-cle systems and attendant problems associated with test accessibility,maintenance training and documentation, combat vehicle maintenance rep-resents the most demanding challenge to the U.S. Army vehicle combatservice support mission.
This paper discusses the STE/ICE application to Combat Vehicle Hull sys-i
terns. A specific vehicle application is described as an example ofSTE/ICE test capability within the framework of the standard vehicle di-agnostic connector interface definition.
A newly developed extension of STE/ICE test capability to Turret Systems
is also presented. This extension demonstrates that test of the entireCombat Vehicle with a single test system is possible.
The STE/ICE System, capable of hull system test of the existing combatvehicle fleet, and its demonstrated suitability for turret test exten-sion provides a basis for conclusions relative to test system and vehi-cle design approaches for enhanced combat vehicle maintenance.
Key words: Combat vehicles; Diagnostic Connector Assembly; Fighting Ve-hicle Systems; generic DCA; Hull systems; Simplified Test Equipment forInternal Combustion Engines; Turret Systems; vehicle maintenance.
*STE/ICE was developed for the U.S. Army Tank Automotive Research and
Development Command by RCA Government Systems Division, Automated
Systems
.

INTRODUCTION . Simplified Test Equipment for Internal Combustion Engines(STE/ICE) has been described in detail at several points in its develop-ment process and it is not proposed to repeat that description herein.Rather, the principal thrust of this paper is to report recent STE/ICEdevelopments which have verified and facilitated STE/ICE application to
the existing U.S. Army Combat vehicle fleet in the conventional STE/ICErole of power pack diagnosis and to report on an extension of STE/ICE
1 application to the mission of total vehicle test support.
' Through recently completed Design/ Operational Testing, the STE/ICE Sys-
tem capability to test U.S. Army vehicles has been confirmed. The defi-nition of a new and "adaptable" vehicle/ test system interface has facil-itated vehicle design for "testability". Finally, an application ofSTE/ICE to test a fighting vehicle system has demonstrated that the
STE/ICE system is capable of filling the mission need of a single test
system for organizational or "on-vehicle" support of the total combat
|vehicle system.
Given the STE/ICE test capability to support the power packs in the
present U.S. Army combat vehicle fleet and the system's ability to ex-tend beyond the power pack into turret system test, a prospective exists
|
from which to view a new and now viable possibility; organizational sup-port of the total combat vehicle fleet via a single simplified test sys-tem. While this possibility is yet to be achieved, the progress report-ed here-in seems to bring this essential goal a significant step closerto accomplishment.
Both the use of the "adaptable" vehicle - STE/ICE interface and theextension of STE/ICE capability into turret system test have been demon-strated in the development of a new family of U.S. Army Fighting Vehi-cles o
Two of these vehicles are the XM2 Infantry Fighting Vehicle (IFV) and
the XM3 Cavalry Fighting Vehicle (CFV).
The IFV and CFV vehicles combine high mobility and fire-power. Mobilityis achieved by the combination of a 500 HP turbocharged diesel engineand a hydro-mechanical transmission. Firepower is provided by the fol-
lowing vehicle subsystems:
o All electric stabilized turret
o 25 MM automatic cannon
o 7.62 MM machine gun
o Two turret mounted TOW anti-tank missiles
o A day/night integrated sighting system employing thermal imagingtechniques
o Six firing port weapons - 5.56 MM (IFV only)
99

An early focus of vehicle design addressed forward maintenance supportand the human factors considerations associated with both the vehicle'soperational crew and the vehicle mechanic. Consistent with the goal of
simplified, facile vehicle maintenance, a single test system STE/ICE,was designated for "on-vehicle" or organizational diagnosis of all hulland turret equipment problems.
In the following sections, the application of STE/ICE to combat vehiclehull systems and the FVS turret system is described. The concludingsection summarizes the benefits of the FVS test equipment approach, the
concepts validated in the course of test equipment implementation andthe future steps in the evolution of a user optimized test system fororganizational support of the combat vehicle fleet.
STE/ICE - COMBAT VEHICLE HULL SYSTEM TEST CAPABILITY . The Combat Ve-hicle Hull diagnostic problem is complicated by the restricted accessi-bility characteristic of armored combat vehicles. Figure 1 illustratesthe major systems and subsystems of the vehicle hull and indicates the
main areas of diagnostic significance and test equipment requirements(faults in drive, suspension, and armor are more readily apparent anddiagnosable without aids). The STE/ICE system (Simplified Test Equip-ment/internal Combustion Engine) was developed by RCA to meet just thoserequirements for the U.S. Army Tank-Automotive Research and DevelopmentCommand (TARADCOM)
.
AIR
INDUCTION FUEL
COOLING ENGINE
STARTING
TRANSMISSION
CHARGING
DIAGNOSTICSIGNIFICANCE
Figure 1. Combat Vehicle
TRACK DRIVES
SUSPENSIONARMOR
100

The heart of the STE/ICE system is the VTM (Vehicle Test Meter) shown inFigure 2. It has been carefully designed to be simple to operate andunderstand. The man-machine interface has been limited to a digitalreadout for displaying measurement results, two ten digit indexingswitches used to select the desired test, a test initiation button andan on-off switch. This microprocessor controlled device measures param-eters and displays the results as either a pass /fail message or as digi-tal values in appropriate units familiar to the mechanic (i.e. psi, rpm»volts, ohms, amps, etc.).
Figure 2. STE/ICE VTM
The VTM interfaces to the vehicle in two modes: built in DiagnosticConnector Assembly (DCA) and Transducer Kit (TK) . Although the DCA modeis the mechanic optimized mode of operation, practical limitations pre-clude pre-wiring of all possible measurement parameters. Therefore, thetransducer kit (TK) has been included as a part of the STE/ICE Set to
supplement DCA measurements as well as to provide test capability forthe present vehicle fleet which is not yet equipped with DCAs.
The transducer kit consists of four sensors; two pressure transducers(vacuum to 25 PSI, and 25 to 1,000 PSI), a Hall effect clamp-on currentprobe (0 - 1500 amps) and a tachometer pick-up for diesel engine speedmeasurement. Also provided as a part of the transducer kit are cablesand fittings required to connect the test system to the vehicle undertest.
While the transducer kit affords less than the optimum connection to thevehicle under test, it remains both a simple and powerful test approach.As an example of the effectiveness of the TK operating mode, with three
101
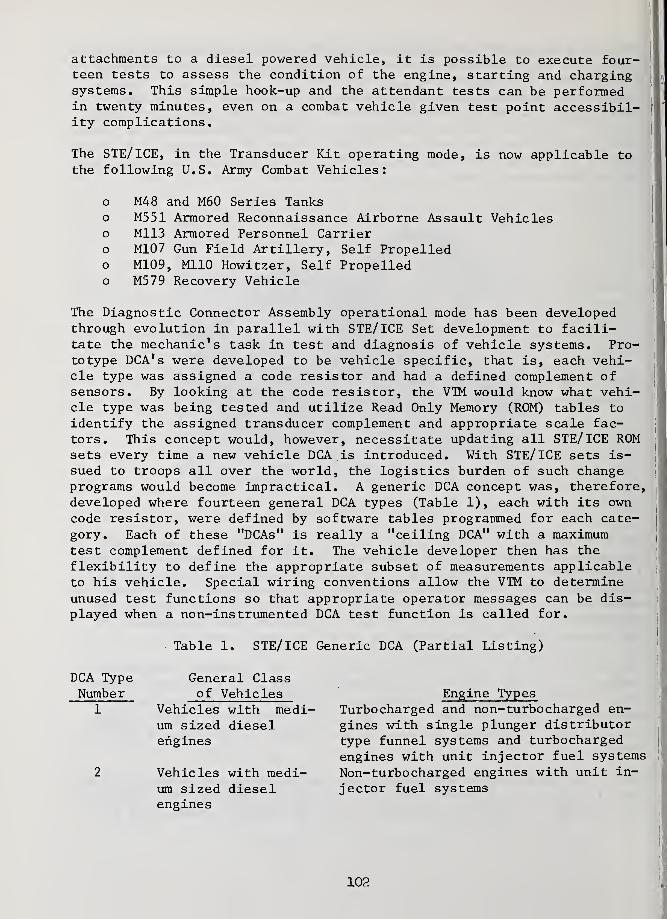
attachments to a diesel powered vehicle, it is possible to execute four-teen tests to assess the condition of the engine, starting and chargingsystems. This simple hook-up and the attendant tests can be performedin twenty minutes, even on a combat vehicle given test point accessibil-ity complications.
The STE/ICE, in the Transducer Kit operating mode, is now applicable to
the following U.S. Army Combat Vehicles:
o M48 and M60 Series Tankso M551 Armored Reconnaissance Airborne Assault Vehicleso M113 Armored Personnel Carriero M107 Gun Field Artillery, Self Propelledo M109, Ml10 Howitzer, Self Propelledo M579 Recovery Vehicle
The Diagnostic Connector Assembly operational mode has been developedthrough evolution in parallel with STE/ICE Set development to facili-tate the mechanic's task in test and diagnosis of vehicle systems. Pro-totype DCA's were developed to be vehicle specific, that is, each vehi-cle type was assigned a code resistor and had a defined complement ofsensors. By looking at the code resistor, the VTM would know what vehi-cle type was being tested and utilize Read Only Memory (ROM) tables to
identify the assigned transducer complement and appropriate scale fac-tors. This concept would, however, necessitate updating all STE/ICE ROMsets every time a new vehicle DCA is introduced. With STE/ICE sets is-sued to troops all over the world, the logistics burden of such changeprograms would become impractical. A generic DCA concept was, therefore,developed where fourteen general DCA types (Table 1), each with its owncode resistor, were defined by software tables programmed for each cate-gory. Each of these "DCAs" is really a "ceiling DCA" with a maximumtest complement defined for it. The vehicle developer then has the
flexibility to define the appropriate subset of measurements applicableto his vehicle. Special wiring conventions allow the VTM to determineunused test functions so that appropriate operator messages can be dis-played when a non-instrumented DCA test function is called for.
Table 1. STE/ICE Generic DCA (Partial Listing)
DCA Type General ClassNumber of Vehicles
1 Vehicles with medi-
um sized dieselengines
2 Vehicles with medi-um sized dieselengines
Engine TypesTurbocharged and non-turbocharged en-
gines with single plunger distributortype funnel systems and turbochargedengines with unit injector fuel systems
Non-turbocharged engines with unit in-
jector fuel systems
102
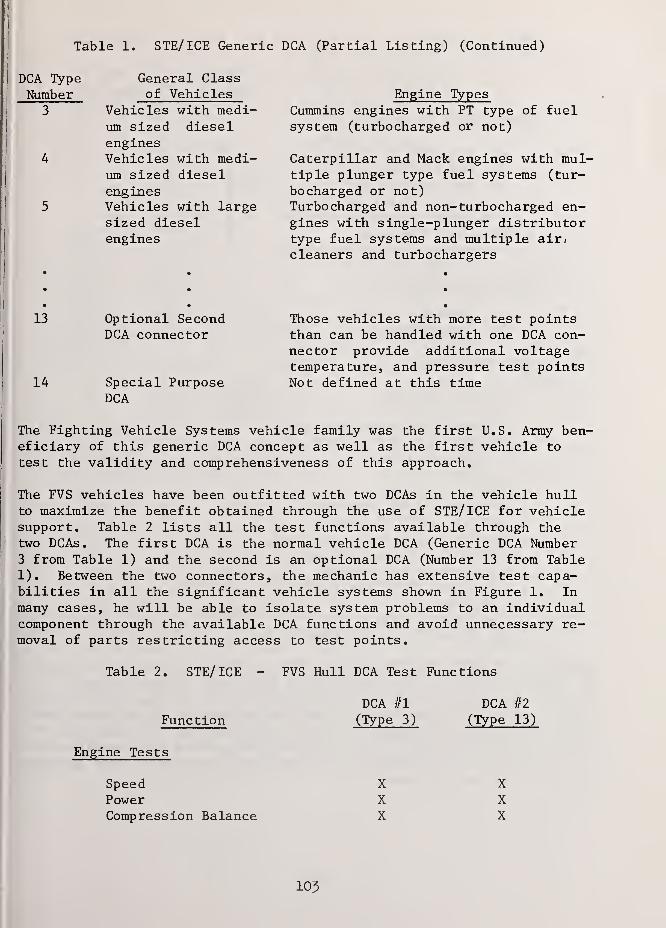
Table 1. STE/ICE Generic DCA (Partial Listing) (Continued)
DCA Type General Class
Number of Vehicles3 Vehicles with medi-
um sized dieselengines
4 Vehicles with medi-um sized dieselengines
5 Vehicles with largesized dieselengines
Engine TypesCummins engines with PT type of fuelsystem (turbocharged or not)
Caterpillar and Mack engines with mul-
tiple plunger type fuel systems (tur-
bocharged or not)Turbocharged and non- turbocharged en-gines with single-plunger distributortype fuel systems and multiple air.
cleaners and turbochargers
13
14
Optional SecondDCA connector
Special PurposeDCA
Those vehicles with more test pointsthan can be handled with one DCA con-nector provide additional voltagetemperature, and pressure test pointsNot defined at this time
The Fighting Vehicle Systems vehicle family was the first U.S. Army ben-
eficiary of this generic DCA concept as well as the first vehicle to
test the validity and comprehensiveness of this approach.
The FVS vehicles have been outfitted with two DCAs in the vehicle hullto maximize the benefit obtained through the use of STE/ICE for vehiclesupport. Table 2 lists all the test functions available through thetwo DCAs. The first DCA is the normal vehicle DCA (Generic DCA Number3 from Table 1) and the second is an optional DCA (Number 13 from Table1). Between the two connectors, the mechanic has extensive test capa-bilities in all the significant vehicle systems shown in Figure 1. Inmany cases, he will be able to isolate system problems to an individualcomponent through the available DCA functions and avoid unnecessary re-moval of parts restricting access to test points.
Table 2. STE/ICE - FVS Hull DCA Test Functions
DCA #1 DCA #2
Function (Type 3) (Type 13)
Engine Tests
Speed X XPower X XCompression Balance X X
103

Table 2. STE/ICE - FVS Hull DCA Test Functions (Continued)
Function
Engine Tests (Continued)
Oil PressureOil TemperatureCoolant TemperatureAir Cleaner Pressure (switch)Fuel Filter Pressure (switch)Fuel Rail PressureTurbocharger Outlet Pressure
Transmission Tests
Oil PressureOil Temperature
Electrical Tests
Battery VoltageBattery CurrentBattery/Starter ResistancesBattery Electrolyte Level
Series Pair #1
Series Pair #2
Starter VoltageStarter Solenoid VoltageStarter Switch VoltageStarter Switch Return VoltageAlternator Output VoltageAlternator Field VoltageAlternator Field ControlVoltage
Fuel Pump VoltageFan Speed Solenoid Voltage
DCA #1
(Type 3)
XXXXXXX
DCA #2
(Type 13)
XXX
X
XX
XX
X
XX
XX
X
STE/FVS - TURRET TEST CAPABILITY . The FVS Turret presented the vehi-cle developer with a different and more complex diagnostic problem.Figure 3 illustrates the complexity of the turret in terms of its elec-trical components. The initial parameter measurement requirements de-fined for maintenance support of this turret included 241 differenttest signals. The rest of this section describes how the SimplifiedTest Equipment concept was extended to include full turret test capabil-ities for this vehicle family.
10k

GUN/TOWROTORSWITCH
TURRETCONTROL
BACK-UPBATTERY
TOWCONTROL
GUN/GRENADECONTROL
MOTIONDETECTCKT
VEHICLEBATTERY
DIGITALENCODER
SLIP
RING
HATCHSWITCHES
HULLGYRO
TURRET
DIST
BOX
(HULL)
TURRET
POS IND(GNR)
25 MM
TURRET
POS IND(CMDR)
ANNUNCPANEL
CGE
GUNRX
TOWRX
POWERSUPPLY
INTEGRATEDSIGHT
iRRORDETECT
LIN
ACT
MLX
LIFT
ACT
ELECTRONICCONTROLASSY
GNRHANDSTATION
CMDRHANDSTATION
GUNGYRO
TURRETGYRO
GUN ELEV
SERVO
ELEV
GEARBOX
TRAVERSE
SERVO
I
TRAVERSE
GEARBOX
TOW ELEVSERVO
TOW ELEV
GEARBOX
Figure 3. IFV Turret Components
The extension of the STE/ICE test and measurement capability to include
complete turret testing was effected through changes internal and ex-
ternal to the standard STE/ICE set. Internal changes are primarily in
microprocessor program memory. External changes are concentrated m a
Controllable Interface Box (CIB) that expands the normal STE/ICE mea-
surement capability to 291 channels with full scale capabilities rang-
ing from +5 to +187 volts, some single ended, some differential, some
shielded, and some with special overvoltage protection. The interface
between the turret and the test equipment is through 3 standardized 128
pin test connectors and a power connector as shown in Figure 4.
105

Figure 4. STE/FVS - Turret Test Configuration
The simplicity of the system is best illustrated by describing its oper-ational characteristics. Recommended procedure for use of the system is
connect all cables (PI, CI, C2, C3, DCA) , turn system on with VehicleTest Meter power switch, select appropriate test numbers, and observedisplayed results. Once all cables have been connected, full turrettest capability is available at the standard soldier-tested (and accep-ted) VTM man-machine interface. The CIB has no control or display func-tions on it. Designing the system so that all test points can be con-nected simultaneously (3 cables) permits the mechanic to use the sameset up procedure for turret testing regardless of fault symptoms.
The operation of the VTM in its Turret Test mode makes use of 600, 700,and 800 series test numbers. Normal vehicle testing uses test numbersless than 100 (only two digiswitches available for input). To use the
systems for turret testing, the mechanic must first enter a "number se-ries indicator" (06 for 600, 07 for 700, 08 for 800) and then enterother test numbers within the series. The "number series indicator"need be entered only once for a whole group of tests within a series.Entering a "99" returns the VTM to its normal Vehicle Test Meter mode ofoperation where it is possible to enter another number series. All 600series test parameters come through a common test connector and the sameis true for 700 and 800 series parameters. Table 3 shows the distribu-tion of turret system parameters within test and connector number series
Table 3. Turret Systems Test Points
Turret SystemsNumber of Test Points per Test
and Connector Number Series600 700 800
Turret Power Control, and InterlockDistribution Systems 80 15
Turret Electric Drive andStabilization Systems 69
Integrated Sight and Fire ControlElectronic Systems 77
106

This distribution of systems within the number series permits much of thetesting to be confined to a single number series. Thus, the mechanicis only required to make a single entry for most tests.
The types of measurements called for are DC voltage, AC/RMS voltage, peakvoltage, and peak-to-peak voltage. Table 4 shows the distribution ofthese types of tests.
Table 4. STE/FVS Test Capability
Test Number SeriesMeasurement Type 600 700 800 Total
Volts DC 79 82 58 219Volts AC/RMS 15 15
Volts Peak 1 2 1 4
Volts Peak-to-Peak 3 3
241
Standardization of the test connectors and their interface made severaldesirable features possible including operational simplicity, redundantparts, and a complete system self test. The turret test and self testconnectors are all coded; the three test cables and three CIB multiplex-ing interfaces are all identical. Thus, it was possible to include a
connector search routine in the software so that it does not matter howthe using mechanic connects the cables. The microprocessor determineswhich turret test connector is connected to which CIB connector and thenaddresses the appropriate input channel. There is no wrong way to hookup the three cables.
The CIB contains seven boards as shown in Figure 5. All six of the in-put multiplexer boards are identical and completely interchangeable. Innormal operation, there are three identical sets of hardware (cables,connectors, boards, and wires) connecting the three turret test connec-tors to the CIB Receiver/ Interface Board. Given this redundancy, the
mechanic could have two faulty cables and four faulty Mux Boards but as
long as one of the CIB Test Connectors was fully operational, he couldstill perform all vehicle tests with the only penalty being the requiredmovement of the remaining cable each time the number series was switched.Should he connect the one cable to the wrong connector, the VTM would soindicate by an error message.
The CIB self test is a full compensated system test which includes a testof its own cables. Any one of the three test cables can be mated to the
self test connector. The self-test then checks out all input channelsand indicates either PASS or how many bad channels were found and whichones they were. By simply interchanging cables, the support mechaniccan then fault isolate to a single board or cable. If necessary, the
same information will often allow isolation of the fault to a singlechip or few chips. Thus, no new support equipment is required to sup-port the test system itself.
107

TEST
1
TEST
5TEST
EMUXBOARD
1
MUXBOARD
MUXBOARD
/
MUX MUX MUXBOARD BOARD BOARD
i1 c5
Figure 5. Simplified CIB Block Diagram
CONCLUSIONS . The progress in extending STE/ICE application and applica-bility as described here-in are most significant when viewed in concept-ual terms. STE/ICE applications (TK mode) now encompass power pack sup-port for virtually all of the U.S. Army Combat Vehicle Fleet. In addi-tion this simplified test system has been demonstrated to be capable of
providing all required organizational or "on-vehicle" test capabilityfor a modern, sophisticated combat vehicle. Among the benefits expectedfrom the FVS test system approach are the following:
o Reduced vehicle logistics support costs from multiple use of a
single organizational level test system.
o Hull systems mechanics will be trained in the use of STE/ICE inthe course of normal MOS training. The FVS will impose no addi-tional test equipment interface training on the Army Mechanic.
o The interface between Simplified Test Equipment and the mechanicinitially designed for automotive mechanics will now be avail-able to turret mechanics.
o The task of maintaining an inoperable vehicle in the field is
made manageable by the ability to bring only one test system to
the vehicle.
108

In the process of this demonstration, the STE/ICE application to FVS hullsystems has confirmed the validity of the STE/ICE Generic DCA concept.
It is possible to field STE/ICE in support of the existing Army vehiclefleet while anticipating the future vehicle fleet in generic terms suchthat future DCA equipped vehicles can be accommodated without change to
the test system.
From the perspective afforded by this demonstration, it is possible to
visualize additional characteristics of the test system that are desir-able and achievable without significant additional test system complexity
„
The next desirable test system feature is selective automation of turretdiagnostics. The microprocessor resident in the STE/ICE VTM provides the
potential to automate turret test sequences to simplify the turret me-chanic's task by making him significantly less dependent on technicalmanuals. This automation should increase diagnostic accuracy while de-creasing test time. The STE/ICE-CIB system now executes tests on a "one-
at-a-time" basis 0 The turret mechanic depends on a technical manualdiagnostic procedure to link test results to form diagnostic conclusions.One way to automate this diagnostic process is to validate the manualdiagnostics contained in technical manuals, await the "frozen" productionvehicle configurations and convert technical manual diagnostic proceduresto test system program memory 0 In this way, a well validated diagnosticprocedure can be obtained for the proper vehicle configuration whileminimizing the cost associated with software maintenance 0
It seems clear that the extended FVS test system approach described here-in may have application to other combat vehicles; some of which are nowsupported in part by STE/ICE. In the absence of direct applicability,it may be concluded that two project concepts apply:
o It is possible for a single simplified test system to perform allorganizational level on-vehicle tests for a combat vehicle.
o It is possible for a test system to be developed, or applied, inparallel with the development of the prime weapon system.
Given some standardization of diagnostic connector interfaces in turretsystems (perhaps employing a generic interface concept) it seems practi-cal to configure a single simplified test system for on-vehicle test ofthe entire combat vehicle fleet.
109

REFERENCES
1. Donald S. Sarna and Joseph W. Steyaert, "Diagnostic Equipment Develop'
ment for Military Vehicle Applications". Paper 780029 presented atSAE Automatic Engineering Congress, Detroit, February 1978.
2. R.E. Hanson and H.L Q Fischer, "New Techniques for Automated EngineDiagnostics" presented at AUTOTESTCON, Hyannis, November 1977.
3. HoL. Fischer/T.Eo Fitzpatrick, "Simplified Automatic Test Equipment".Unpublished RCA paper presented at the Industry/Joint Services Auto-matic Test Conference and Workshop, San Diego, April 1978.
4. Angelo Muzi, "Sensor Selection for Automatic Diagnosis of Vehicles".Paper 770403 presented at SAE International Automotive EngineeringCongress, Detroit, March 1977.
5. H.E. Fineman, T Q E. Fitzpatrick, and A.H. Fortin, "Simplifying Auto-motive Test Equipment through use of Advanced Electronics" 0 Pre-sented at IEEE NEREM, Boston, November 1974
„
110

AUTOMATED VEHICULAR TEST EQUIPMENT
L. Thomas CarterNational Account Manager
Hamilton Test Systems, Inc.
Windsor Locks, Connecticut
Abstract: Motor vehicles are becoming increasingly more complex as rad-ically new vehicle systems are being incorporated as standard equipmentwith each new model year. Government regulation of vehicle performanceis having a significant impact upon the design and maintenance of thesevehicles. Ever-increasing fuel costs are becoming a tremendous incen-tive to keep vehicles in an optimum state of tune to reduce fuel consump-tion and minimize pollution. These situations have combined to form a
formidable challenge to the automotive repair industry. To meet thischallenge, the automotive repair industry will have to define a revisedapproach to vehicle test and diagnostics. Any new approach must be costeffective, minimize dependence on mechanic's skill and experience whileincreasing the quality of diagnosis and subsequent repair; it must be
adaptable to new vehicle systems with minimum test equipment obsoles-cence; and it must be compatible with Government regulations and provideacceptable service to the customer. One such approach to vehicle testand diagnosis, which is described in this paper, involves one piece ofself-contained computerized test equipment - Autosense® - which performsboth the test and diagnosis.
Key Words: Automotive test and diagnostics; vehicle test and diagnos-
tics; automated test and diagnostics.
INTRODUCTION
The present day automotive repair industry is faced with a number ofsignificant problems. Motor vehicles are becoming increasingly complex.Radically new vehicle systems are being incorporated as standard equip-ment with each new model year. These new systems, such as HEI, Lean-Burn, EFI, etc., accelerate test equipment obsolescence and worsen theshortage of skilled mechanics. The availability of skilled mechanics is
also limited by promotion to levels of supervision and lack of adequatetraining from the industry.
Government regulation of vehicle performance is also having an impact onthe repair industry. The Federal Government is involved in establish-ing fuel efficiency requirements for vehicles. When these requirementsare generated, they will require the industry to design and maintainvehicles specified performance tolerances. Many state governments arealready incorporating mandatory vehicle emission and safety inspections
ill

and require that vehicle test equipment itself be designed and certifiedin accordance with state law. Some states have imposed requirements forwritten records of work carried out during repair of vehicles as a
further step to protect the public and improve the quality of vehiclerepair work. In addition, ever-increasing fuel cost is a tremendousincentive to keep vehicles in an optimum state of tune to reduce fuel
consumption and minimize air pollution. Manufacturing problems, whichresult in more recalls and subsequent apprehension by the public towardvehicle safety and performance, also add to the repair problem.
The new vehicle systems and a trend toward increased maintenance to
obtain better fuel economy and to meet warranty obligations have forced
the repair industry to rely more heavily on the professional mechanic.
The repair industry, in turn, is short of the skilled personnel and
equipment necessary to maintain service quality on the ever-increasing
quantity of new and used vehicles,, The result is an increase in come-
back problems and a reduction in vehicle availability.
A NEW APPROACH TO VEHICLE TEST & DIAGNOSIS
One solution to the problems faced by the automotive repair industryis to define a revised approach to vehicle test and diagnosis. Any newapproach must be cost effective (i.e., lower total time for vehicleservice), minimize dependence on mechanic's skill and experience whileincreasing the quality of diagnosis and subsequent repair. It must be
adaptable to new vehicle systems with minimum test equipment obsoles-cence. It must be compatible with Government regulations and provideacceptable service to the customer.
Conventional methods of vehicle problem diagnosis rely on the mechanic'sautomotive experience and his skill to operate and interpret variouspieces of test equipment. The vehicle is tested by the equipment butit is diagnosed by the mechanic
The new approach to vehicle test and diagnosis, which is described in
this paper, involves only one piece of self-contained computerized test
equipment^- Autosense - which performs both the test and diagnosis.
The Autosense system is the first fully computerized digital automotivetest and diagnostic system. The interaction of mechanic and machine is
simply this:
* Hook Up - The mechanic makes the simple connections to thevehicle.
* Test - The Autosense system guides the mechanic through a numberof tests and collects and prints the results of each test.
* Diagnosis - The Autosense system interprets the results andrecommends the necessary repairs.
112

* Repairs - The mechanic repairs the vehicle and uses the
Autosense system to help make any required adjustments.
* Quality Check - The mechanic uses the Autosense system to
test the quality of his work and the Autosense unit printsthe results of this check for vehicle records.
The vehicle user will then have a computer printout showing the actual! test results and specification range for all the tests carried out on
! the vehicle, the recommended repair and the final test results followingrepair.
The equipment can be readily adapted to interface with new car and truck
|
systems at the user location. Most new vehicle systems and model yearchanges can be accommodated by modifying the computer software. These
changes are accomplished by mailing a new cassette tape to the user' location. This tape, when installed in the machine, will modify the
computer program to enable the Autosense system to test the new model
year vehicles. This ability to reprogram the Autosense computer by
simply inserting a new cassette allows the machine to be easily updatedto take advantage of new diagnostic methodology as it develops.
AUTOSENSE SYSTEM DESCRIPTION
The Hamilton Test System's Autosense system brings to the repair indus-try a new system designed for rapid and efficient testing of automotiveengine and vehicle systems. It provides for accurate test and diagnos-tic capability, thus resulting in an increase in customer satisfaction,and fewer "come backs". The Autosense unit systematically evaluatesproblems and identifies repair needs with minimum operator interpreta-tion. The system offers the repairman an efficient, reliable tool, andthe vehicle owner an accurate, printed test report on the vehicle.
The Autosense system utilizes the latest in solid state electronics forhigh reliability and it consists of the following subassemblies.
1. Vehicle Instrumentation Harness
2. Autosense Console
3. Hand Held Controller
4. HC/CO Infrared Emissions Analyzer
Vehicle Instrumentation Harness - The connections to the vehicle aremade via the Vehicle Instrumentation Harness. This harness consists ofthe basic electrical harness which quickly attaches to 5 points in theengine compartment and the 4 sensors used to measure current, secondaryvoltages and timing. Additional connections and probes are available
113
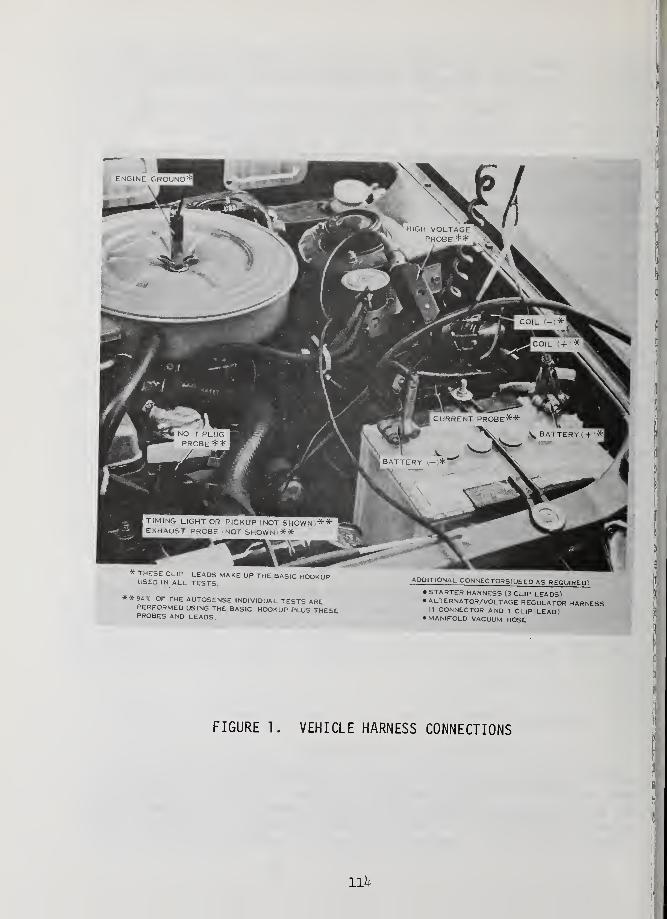
FIGURE 1. VEHICLE HARNESS CONNECTIONS
111+

for specific tests or diagnostic purposes: e.g., Manifold vacuum, alter-
nators, starters, emissions, etc. The Vehicle Harness Connections are
shown in Figure 1
.
The complete hook up is normally made only when a total vehicle health
check is being run. The basic hook up used for normal problem diagnosis
or post-tune up and quality checks can be made in 1 to 2 minutes.
One of the unique features of the Autosense unit is the current sensor.
It is an easy-to-connect "clamp-around" instrument which senses current
flowing through the wire to which it is attached. It has a computer
selectable range from 0 to 50 amps or 0 to 200 amps. It has a computer
used for measuring low current flows such as lamp circuits or to check
i for leakage current which can inadvertently drain the vehicle batteryI over a period of hours.
Autosense Console - The Autosense Console is a metal enclosure for the
printer, the integrated diagnostic computer unit and the Exhaust Gas
(HC/CO) infrared gas analyzer. It is depicted in Figure 2.
j
The printer consists of a Teletype Model 33 typing unit and a call unit.
It receives communication signals from the diagnostic unit and prints the
identification codes and messages on a Vehicle Test Report as shown in
Figure 3. The printout shows the vehicle identification, the test num-ber, the vehicle specifications and the actual test results. Repaircodes are referenced which indicate the necessary corrective action that
should be taken.
The integrated diagnostic unit is a three-bay chassis into which thesystem power supply, automatic ignition defeat module, tape cassettedrive module, and printed circuit board assemblies are installed. An
eight thousand word random access memory provides the computer with the
necessary capacity to perform its tests, computation and diagnosis.Analog signals are received by the integrated diagnostic unit from the
sensors and converted to digital signals prior to processing by the com-puter while the digital signals are processed directly. The signals arecompared with the vehicle's specifications, the results displayed on the
j
operator's hand held control unit and printed upon request. All enginedata and vehicle specifications for the over 2000 domestic vehiclesmanufactured in the U.S.A. in the last five years are stored on a singletape cassette. Tape Cassettes are also available for domestic lighttrucks and over 25 different makes of imported automobiles. Tapecassettes are available for domestic vehicles dating back to 1966 andfor trucks and imported vehicles back to 1970. This data is availableto the operator from the computer's memory after he has entered the Auto-
j
mobile Identification Number (AIDN). The AIDN is obtained from theHamilton Test Systems supplied AIDN manual which is categorized byyear, make and model of vehicle.
115

PrinterR033 Teletype
PowerSwitch
Service Light
EmissionsAnalyzerDual BeamInfraredHC/COComputerControl led
PaperStorage
Computer,Electronics, andTape CassetteSystem forVehicle
SpecificationStorage
FIGURE 2. AUTOSENSE® CONSOLE
116

cratosenseCOMPUTER REPORT
TEST RUN ON YOUR VEHICLE
-ffl
TEST NUMBERACCEPTABLELOW LIMIT
YOURVEHICLE
ACCEPTABLEHIGH LIMIT
AIDN-3010 CH 250A,S6
904 GENERAL HEALTH CHECK
1 12. 1 12.614 9. 0 10.531 75 74* 10032 75 86 too33 75 65* 13034 75 78 10035 75 100 13036 75 86 10040 540 610 66051 7. 0 14. 2 16. 0
52 7. 0 17. 3* 16. 0
53 7. 0 15. 0 16. 0
54 7. 0 15.6 16. 0
55 7. 0 16. 7* 16. 0
56 7. 0 16. 8* 16. 0
67 780* 28068 6. 45* 2.5050 5. 0 11.0* 7. 0
90 40. 0 47. 5 48. 0
95 12.7 12. 6* 15. 0
7 1 3. 1 8. 0
72 4. 1 8. 0
73 3. 6 8. 0
74 4.5 8. 0
75 3.5 8. 0
76 3. 0 8. 0
0 R/C - BATTERY/ STARTER114 R/C - TIMING122 R/C - IGNITION131 R/C - ENGINE145 R/C - IGN ITION/CARB155 R/C - CHARGING
TESTNUMBER
TEST DESCRIPTION
IGNITION OFF1 Battery Voltage - Preconditioned (Volts)
2 Battery Current Leakage (Amps)KEY ON. ENGINE OFF POINTS CLOSED
3 Primary Ignition Current (Amps)4 Battery to Ignition Switch - Voltage Drop (Volts)
5 Coil Primary Voltage (Volts)
6 Distributor Point Voltage Drop (Volts)
(Electronic Ignition Coil Negative Voltage)7 Ignition Switch Voltage Drop (Volts)
ENGINE CRANKING OR ATTEMPT CRANKING8 Starter Solenoid/Relay Current (Amps)9 Starter Cranking Current (Low Limit) (Amps)10 Starter Cranking Current (High Limit) (Amps)11 Voltage Drop - Battery to Starter (Volts)
12 Voltage Drop - Battery to Starter Solenoid (Volts)
13 Starter Solenoid Voltage (Volts)
14 Battery Cranking Voltage (Volts)
15 Battery to Coil Voltage Drop (Volts
16 Cranking RPM (RPM)17 Engine Rotation (RPM)
STABILIZED ENGINE CRANKING18 Coil Output Voitage at Coil (Kilovolts)
19 Coil Output Voltage at Distributor (Kilovolts)
20 Distributor Rotor to Cap Voltage Drop (Kilovolts)
21-28 Spark Plug Firing Voltage (Kilovolts)
29 Distributor Point Dwell (Degrees)30 Basic Timing-Vacuum Disconnected (Degrees)31-38 Relative Cylinder Compression (Percent)
39 Ignition Switch Voltage Drop (Volts)
ENGINE AT IDLE ACCESSORIES OFF4041-48
Curb Idle (RPM)Cylinder Power Contribution - Fast Idle (Percent)
49 Distributor Point Dwell (Degrees)50 Basic Timing - Vacuum Disconnected (Degrees)51-58 Spark Plug Firing Voltage (Kilovolts)
. 59 Coil Output Voltage at Coil (Kilovolts)
60 Coil Output Voltage at Distributor (Kilovolts)
61 Distributor Rotor to Cap Voltage Drop (Kilovolts)
62 Distributor Condenser Test (Counts)63 Coil Test (Level)
64 Fast Idle (RPM)65 Low Curb Idle (RPM)66 Manilold Vacuum (IN HG
)
67 Hydrocarbon Content (PPM)68 Carbon Monoxide Content (Percent)
69 Headlight Switch Voltage - Any RPM iVolts)
70 Battery to Coil Voltage Drop (Volts)
SNAP ENGINE ACCELERATION71-78 Spark Plug Load Test (Kilovolts)
ENGINE AT 2500 RPM ACCESSORIES OFF80 Timing - Any RPM (Degrees)
86 Hydrocarbon Content (PPM)87 Carbon Monoxide Content (Percent)
88 Distributor Poml Dwell - Any RPM (Degrees)
89 Basic Timing with Mechanical Advance (Degrees)90 Total Timing --Basic * Mech « Vacuum Adv (Degrees)93 Coil Outpul Voltage (Kilovolts)
ENGINE AT 2500 RPM ACCESSORIES ON95 Battery Voltage (Volts)
96 Regulator Battery Voltage (Volts)
98 Alternator Oulput Voltage IVolts)
99 Alternator Output Current - Any RPM (Amps)
R0 «_
Mileage.
VIN »_ .Operator
» INDICATES OUT OF LIMIT CONDITIONM INDICATES DATA ENTERED BY OPERATOR
'59465-iF Aulosense is a registered trademark ol United Technoldflies Co'poiatior
HAMILTON TEST SYSTEMS
FIGURE 3. TEST REPORT PRINTOUT
117

Hand Held Controller - The hand held controller consists of a lightweight
plastic housing which contains the displays and keyboard. This control-
ler is the means by which the operator and the system communicate with
each other. It is connected to the Autosense console by a 17-foot cable.
This arrangement makes it possible for the operator to conduct tests
from inside or outside the vehicle. The hand held control provides the
operator with a portable meter capable of reading all engine parameters.The information is displayed in three, 4-digit alphanumeric displays.Using the hand held controller, the operator is able to call up thevehicle specification and compare these to the actual test results.. Theunit has 8 light emitting diode (LED) "Status Indicators" which are com-puter driven to automatically step the operator through a sequence oftests. The Hand Held Controller is shown in Figure 4.
Exhaust Emissions Analyzer - The exhaust emissions analyzer is a nondis-persive infrared gas analyzer that measures the hydrocarbon and carbonmonoxide content of the automobile's exhaust gases. The response timeof this analyzer is less than 10 seconds to 90$ of full scale (FS) read-ing. This response time provides rapid and accurate indication of over-all power plant efficiency and makes this system ideal for a quick vehi-cle check to identify the need for further testing or adjustment andservice. The computer provides the analyzer with automatic zero andspan calibration as well as automatic temperature and pressure compensa-tion. It ensures easier and more accurate operation by the mechanicbecause the computer obviates the need for manual "span" and "zero"adjustments.
AUTOSENSE SYSTEM OPERATION
The operation of the Autosense system is simple and is outlined asfollows
:
1. Turn On Power - Initial power turn on causes the computer toread its operating program from the cassette memory tape, andcarry out the internal self -checking routines to ensure the
Autosense unit is ready for operation. This cycle of taperead, program load and check takes about 30 seconds and, whencompleted, the computer lights the appropriate cue light on
the hand held control.
2. Identify Vehicle - To ensure that the correct vehicle speci-
fications are instantly available to the computer, a four-
digit AIDN is entered by the operator to tell the computer to
search the data stored on the cassette tape and load a speci-
fic group of specifications into memory. When the desired
specifications are in memory, the computer types out the
vehicle identification and signifies to the operator it is
ready to proceed by lighting the appropriate cue light on
the hand held control.
118

Bracket on back for
hooking to steeringwheel , hood, etc
.
Operator instructions and
status indicators to guide
operator through test.
Re ference,test and limit
data displays.
When manual data
is entered, this key
is pressed first if
the data to be
entered is negative.
AID, testnumber, and
manual data
entry key
board.
Pressing"Start" keyclears all
data;systemrequestsnew AIDnumber
Pressingkey advancesprinter paperand al lows
manual dataentry.
Pressingkey clears
all displays;system requestsnew data.
Pressing key
displays high
and low 1 irni ts
.
Pressing key
again returns
data and refer-
ence displays.
FIGURE 4. HAND HELD CONTROLLER
119

3. Vehicle Hook Up - The connections to the vehicle specifiedin the manual for the particular test sequence are made.The connections are typically clips to the vehicle coil andbattery, current probe, secondary voltage sensor, timingsensor, and exhaust probe. The vehicle hook up takestypically 1 to 2 minutes.
4. Test Sequence - The operator enters the test sequence appro-priate to the problem to be diagnosed. The computer willthen sequence the individual tests which it requires the op-erator to carry out. As each test is completed, the operatorpresses the "print" key on the hand held control unit. Thedata is stored in the computer's memory and also printedalong with the high and low specification limits on theVehicle Test Report.
5. Diagnosis - Upon completion of the printing of the last testresults in the selected sequence, the computer lights theappropriate cue light and displays the first repair code in
the center display of the hand held control. The operatorpresses the "Print" key and prints out all the remainingrepair codes.
6. Repai
r
- The mechanic obtains the parts and carries out therepairs to the vehicle recommended by the Autosense system.He then uses the machine to set up the vehicle and make thenecessary post-repair adjustments.
7. Quality Check - After the repairs and adjustments have beenmade, the mechanic re-enters the automatic sequence numberand the Autosense unit guides him through the appropriatetests and prints out the results to verify that the repairhas indeed corrected the vehicle's problems. This automaticsequence feature of the Autosense system ensures a uniformhigh quality of testing and diagnosis and removes the varia-tions that can occur with different operators. The Autosenseunit rapidly trains and improves the discipline of the mech-anics. It increases the rate at which a skilled mechanic candiagnose and repair vehicles. It further has the advantageof providing a hard copy of the result of the tests conductedon the vehicle and evidence of it being within. recommendedperformance levels after the repair work is completed. Thisfeature is significant in preparing shops to comply withlegislation which requires written evidence of work carriedout and improving their vehicle maintenance record keeping.
120

TABLE 1
USES OF THE AUTOSENSE SYSTEM
TUNE UPS
PERIODIC ROUTINE MAINTENANCE
CUSTOMER COMPLAINTS
PRE-DELIVERY VEHICLE PREPARATION
USED CAR PRE-SALE PREPARATION
SELECTIVE MAINTENANCE
INVENTORY & COST CONTROL
FUEL ECONOMY ADJUSTMENTS
121

USES OF THE AUTOSENSE SYSTEM
The typical ways in which the Autosense system is being used are listedin Table 1. The use of the Autosense system for tune up or regularmaintenance checks in a typical 2 or 3 bay garage or specialty shopensures that rapid, accurate tune ups are completed and enables thevehicle to be returned to the owner with the assurance that the workhas been correctly done. It further provides a printout of the datawhich the owner can review.
When used as a troubleshooting device to attack specific complaints,the Autosense unit ensures rapid identification of the vehicle problemand the necessary repair, and can provide hard copy proof of the vehiclecondition after the repair has been carried out. This ensures fewercomebacks for unsatisfactory service as it provides evidence at thetime of vehicle pick up of satisfactory completion of work.
The use of the Autosense system as a predelivery vehicle checkingsystem by both dealerships and fleet or rental companies to ensurethe satisfactory condition of a vehicle before the new owner or renterpicks it up is expected to increase sharply in the next year. Alreadymany Autosense users are taking advantage of the ability to completelycheck out a used vehicle and provide hard copy evidence which is
displayed in the vehicle on the sales lot to show that it has beenproperly serviced and meets recommended specifications. This givesthe prospective purchaser confidence that the vehicle he or she may beconsidering buying is in satisfactory condition.
Because the Autosense system also indicates which parts are good, arbi-
trary parts replacement is eliminated. The use of the Autosense system
for selective maintenance, therefore, reduces parts usage and labor
hours because you replace only those parts that need to be replaced.
The Autosense printout becomes a valuable tool not only in quality con-trol but also for the monitoring of parts and labor hours for mainte-nance managers.
In addition, many vehicle owners are losing money due to unnecessary,poor fuel consumption. The Autosense system acts as a unique qualifierin that its regimented nature allows for detection of problems normallymissed by mechanics using conventional equipment. Even as low as a 5%fuel consumption improvement can mean savings of thousands of dollarsper year to fleet operators.
There are now many Autosense units in the field both in the UnitedStates as well as many other parts of the world. Dealerships, ServiceStations, Repair Garages, Diagnostic Tune Up Centers, Specialty Shops(tires, mufflers, etc.), National Corporations/Fleets, State/Municipal-ities, Federal /Mil itary, Universities and others are the categories ofusers that have put the Autosense system to profitable use in theiroperation.
122
AUTOS ENSE SYSTEM USERS
One of the major Autosense system users in the United States is AvisRent A Car. Since last June, Avis has been using 30 Autosense systemsat 21 of its service centers across the United States. As stated in an
article which appeared in the June, 1978 edition of Automotive FleetMagazine, the results after less than a year point to substantial
j
reductions in maintenance costs and customer complaints.
At the maintenance centers where Autosense units have been installed,Avis uses them chiefly to_evaluate new cars being delivered by dealers
and manufacturers. From this experience, Avis has learned that no lessthan 40-percent of its new cars fail to meet specified requirements.The Autosense system allows Avis to get their new cars fixed before
they send them out on the road, and it also has given them leverage
in going back to the dealers to point out what's wrong with the cars.
Periodic maintenance is Avis' second priority in its use of the Auto-sense system. Using figures from the company's Chicago service center,85-percent of the cars that received an Autosense evaluation when theywere new were able to pass a mandatory 7,000-mile maintenance check.
!
Previously, only 30-percent of the Chicago Fleet could pass the test.
To the fleet owner this, quite simply, means more cars on the road gen-erating more revenue.
Besides using Autosense units for periodic maintenance, Avis has alsoinstructed its mechanics to use the system as often as they can for un-scheduled curative maintenance.
Finally, Avis uses the Autosense system in evaluating vehicles beingsold to the general public under its "Young Used Car" program. Aviscurrently sells about 50-percent of its domestic auto rental fleet a?
part of a fleet recycling program. On the cars being inspected, the
Autosense system helps them guarantee that the used cars they areselling are in excellent mechanical condition.
j
Initially, Avis field-tested five Autosense units at service centers in
ifour cities: New York, Philadelphia, Chicago and San Francisco. The
j
three-month evaluation was completed successfully, and the additionalunits were delivered to maintenance centers throughout the country andintegrated into the Avis Car Care program.
In New York, Avis also has an Autosense unit in a small van that movesamong several area service centers that don't have Autosense units oftheir own. In that way, service personnel aren't forced to waste time
i driving to Avis' main service center in Queens for a diagnostic test.The van also exposes more mechanics to the Autosense system, which Avisconsiders to be an effective training and motivational tool.
Cost-effectiveness and improved fleet utilization continue to be Avis'prime considerations.
123

Figure 5 depicts a mechanic using an Autosense unit to check out a car
at one of Avis' fleet maintenance centers.
FIGURE 5. AVIS FLEET MAINTENANCE CENTER
Another major Autosense user is the Canadian Armed Forces (CAF). CAFprocured commercial 1-1/4 ton trucks for their fleet in late 1974.These vehicles incorporated a High Energy Ignition (HEI) system as wellas some military options. Seyeral unforeseen maintenance problems oc-curred with these vehicles. An in-depth study of in-house CAF test equip-!
ment indicated that the CAF test equipment inventory was obsolete inso- 1
far as HEI systems were concerned. An evaluation of commerciallyavailable test equipment was conducted and all except the Autosensesystem fell short in the areas of prime importance to the CAF. Afield trial was authorized to determine the appl icabil ity of Autosenseto other vehicles in the CAF inventory and to determine the best methodof employing the Autosense unit in the field and base environment. As
a result of the favorable field evaluation, a contract was signed forprocurement of 58 Autosense systems in early 1978 with delivery ofsystems to commence in March, 1978, training to commence in April 1978and initiation of fielding the Autosense systems in May 1978.
At the time of this writing, the fielding of Autosense units is about90% complete. The CAF, as stated in a technical paper entitled "Vehiculai
Automatic Test Equipment for the CAF" and presented at the AUT0TESTC0N'78 meeting, believes that a comprehensive and valid assessment of the
introduction and employment of the Autosense system can be made onlyafter at least two years of use. However, some positive trends arealready starting to develop and were reported in that paper as follows:
12k

a. Parts Savings - The time honored use of parts to diagnosefaults has been largely stopped where the Autosense systemis employed. Parts replacement is expected to rise initiallyas the machine diagnosis identifies unsatisfactory partsthat could not otherwise be detected. However, after all
vehicles have been initially checked and brought back to
recommended specifications, the rate of parts replacementis expected to drop and fuel consumption reduced.
b. Labor Saving - The accurate and very quick diagnostic actionof the Autosense system was immediately obvious to all whosaw and used it. The machine has yet to be proven wrong in
any of the operations witnessed by the fielding team or anyof the base maintenance supervisors with whom results havebeen discussed. Each base had vehicles which did not run
well or had a peculiar failure that defied diagnosis. Some ofthese cases had been present for several years. In everycase, the machine diagnosed the problem within twentyminutes of start and the problem was resolved by eitheran adjustment or replacement of a small part.
c. New Tools - The Autosense system has an inherent abilityto correlate engine subassembly functions that cannot be
demonstrated by any other means. In particular, the relation-ship of carburetor balance, exhaust emissions and fuel
consumption cannot be grasped much less controlled withoutthis equipment. Mechanics have not had a tool that diagnosedengine functions when the motor is running at high RPM orthe engine is hot. Senior technicians have come to realizethat they have a new tool for better performance, while it
serves as a very useful training instrument for junior trades-men.
d. Acceptance - The Autosense system has been receivedvery well in all but isolated instances. All servicepersonnel and civilians employed by the Department ofNational Defense (DND) maintenance system who areforward thinking and confident about their trade aredelighted to have a new and sophisticated piece ofequipment that moves auto mechanics into the "twentiethcentury" as one senior foreman exclaimed. This attituderuns right through the rank structure from Corporal to
Colonel and includes the conversion of many skeptics.
125

FUTURE DEVELOPMENTS
The basic design philosophy of the Autosense system was to construct abasic unit which is capable of being expanded by the addition of bothsoftware and hardware packages to interface with new vehicle systems anddifferent types of vehicles. New software packages are available annu-ally to update the machine to interface with the new model year vehicles.These packages are in the form of cassette tapes and amendments to theOperator Manual. They are mailed to the user facility for the user toinstall in the Autosense console. New hardware features are also beingmade available to take advantage of improvements in diagnostic inform-ation available from on-board sensors. These features speed up theoperation of vehicle diagnosis and simplify the mechanic's task ofconnecting to the vehicle.
With the ease of expansion provided by the basic Autosense system con-struction, we have also easily provided custom systems to meet particularcustomer requirements. These custom systems have improved operationalcharacteristics which tend to maximize the economic return to theirusers.
i
126

SESSION III
MARINE APPLICATIONS
Chairman: Raymond A. Coulombe
Naval Ship Engineering Center
Co-chairman: Rudie Hohenberg
Mechanical Technology, Inc.


THE ACOUSTIC VALVE LEAK DETECTORA NEW TOOL FOR FLUID SYSTEMS MAINTENANCE
Joseph G. Dimmick and Joseph W. DickeyPropulsion and Auxiliary Systems Department
David W. Taylor Naval Ship R&D CenterAnnapolis, Maryland 21402
Abstract: The operations, limitations and successful applications of a portable, non- intrusive instrument currentlyin use by the U.S. Navy to detect internal leakage throughshipboard steam, water, hydraulic and high-pressure airvalves are described. The Acoustic Valve Leak Detector(AVLD), developed by the David W. Taylor Naval Ship R&DCenter, listens for the ultrasonic emissions characteristicof internal valve leakage. The AVLD is being used fortroubleshooting, for overhaul planning, and in a systematicpreventive maintenance monitoring program.
Key words: Preventive maintenance, Failure detection,Acoustic emission
Introduction: Work on the Acoustic Valve Leak Detector(AVLD) began in November 1973* One year later, the firstprototype was delivered to a repair ship for field evalua-tion. Following the success of the first instrument,several more were built and delivered to other repair shipsLater models incorporated evolutionary changes developed onthe basis of practical experience. Originally developed todetect leakage through large seawater ball valves, the AVLDhas been successfully used to detect leakage through valvesin a variety of fluids in shipboard and shore installationpiping systems. Additional research and development arebeing conducted to extend the concept to include measuringas well as detecting internal valve leakage.
The Acoustic Valve Leak Detector is a portable, non intru-sive instrument developed by the David W. Taylor Naval ShipR&D Center in response to a requirement for an instrumentwhich would reduce the need for opening piping systems toinspect valves. Applied in a systematic preventive maintenance program, the AVLD has begun to reduce the number ofcostly and time-consuming inspections previously required.Savings have also resulted from its ability to detect smallleaks before they become large enough to necessitate more
129

expensive repair procedures. The AVLD has proven effectivefor troubleshooting by identifying the leaking valves inparallel arrangements where it is not normally possible to
\
determine which valve is leaking. It has also been used bynaval shipyards to identify ship valves requiring repairduring scheduled overhauls.
The AVLD listens for the ultrasonic acoustic emissionscharacteristic of internal valve leakage. Transducers areattached to the valve and connected to the AVLD. Types offluids to which the instrument has been successfully appliedinclude steam, water, hydraulic oil and high-pressure air.Since the transducers are attached to the outside of thevalves, the time and expense of dismantling the valves orremoving them from the systems are eliminated.
The purpose of this paper is to introduce the Acoustic ValveLeak Detector to potential industrial users. The underlyingtheory, principles of operation and circuit design arebriefly described. Specific examples of some successfulapplications of the instrument are described in detail,including performance limitations. The preliminary resultsof some current research and development are summarized.Conclusions and recommendations with regard to performanceand industrial applications are presented.
Background: The U.S. Navy is attempting to extend the timebetween major overhauls of ships, while simultaneously reduc-ing repair costs and improving the material condition ofoperating ships. To achieve this objective, there must beinstruments and procedures available which are able toidentify maintenance problems in their incipient stages andto establish a record from which it may be concluded con-fidently that a ship should be continued in service beyondits formerly scheduled overhaul date. By following asimilar program, aircraft industries have increased theinterval between scheduled disassembly, inspection andremanufacture of commercial airline engines from a fewhundred to several thousand operating hours.
"Open-and- inspect" procedures are expensive and time-consuming, especially if the equipment is complex or rela-tively inaccessible. There is also the risk of damage or ofintroduction of contamination. Another disadvantage is thefact that equipment or systems must be taken out of servicefor the duration of the inspection. High standards ofquality assurance add to the cost and duration of such pro-cedures. Opening and reclosing are often the major timeand cost factors, and these factors are wasted if it isfound that no repairs are required.
130
Ships operate at sea for several months, followed by anupkeep period of a few weeks. During the upkeep period,inspection, repair, reprovis ioning, and post-upkeep seatrials take place, followed by another period at sea. Since •
there is a limit to the amount of work that can be doneduring the upkeep period, it is important to concentrate thelimited repair resources on those systems and equipment thatactually need repair. Equally important is the ability toconclude that the other equipment is not in need of repairbefore the ship returns to sea.
A typical ship has several hundred valves, holding variousfluids at pressures up to several thousand pounds per squareinch. Many are welded in place, and most are difficult toremove because of the cramped quarters. There are manyvalves for which the removal, inspection, replacement andquality assurance costs exceed $50,000 per valve. Althoughmost valves are not in that category, large savings arerealized each time it is determined that a valve does notrequire repair, or leakage is detected while it is stillpossible to repair the valve in place.
Major shipyard overhauls present another opportunity forsavings. They are performed at intervals of several yearsand require a year or more to accomplish. Shipboard surveysthat identify leaking and non-leaking valves prior to thescheduled overhaul provide a rational basis for schedulingand budgeting. The surveys also ensure that repair time,labor and parts are not wasted on valves that are alreadyin working order.
Thus, the decision to develop the Acoustic Valve LeakDetector was made on the basis of a need for a non-intrusive,portable instrument to support a systematic preventivemaintenance monitoring program for fluid valves.
Sources and Distribution of Sound in a Piping System: Soundsource mechanisms in a leaking valve and piping system maybe classified as follows:
m Unsteady flow (turbulence)„ Cavitationm Flashing of liquid to vapor« Mechanical movement of parts
Although each source mechanism is treated separately, itmust be understood that the generating mechanisms themselvesinteract and that the total acoustic emission generated istherefore a sum from all sources.
131

In addition to the noise source itself, the amplitude andspectral distribution of the acoustic emission signal arefurther influenced by: (1) the transducer's sensitivity andspectral response; and by (2) cavity and mechanical reson-ances in the valve and its associated piping.
The various source mechanisms are not well covered in theliterature and there has been little reported work analyzingthe effects of temperature, vapor pressure or other physicalcharacteristics which have been found important to someaspects of this work. Although the following discussion ofleakage sound sources are necessarily brief, the attentionof the interested reader is invited to reference [l] , where-in the theory is treated in greater detail.
Fluid Dynamic Sources: Sounds are end products of the decayof turbulent eddies created just downstream from the orificewhich is causing the leak. The acoustic power generated byturbulence in a fluid is given by the following equation. [2]
A 2Acoustic Power = p — (1)
where P is the fluid density, c the sound velocity in thefluid and i is a characteristic length of the system boundedby the orifice size and the downstream pipe diameter.
Since the extreme values for -l are unchanged with pressure,a lower limit to the frequency spectrum expected from fluiddynamic noise can be estimated by taking I to be the down-stream pipe diameter and using the following values for thefrequency:
3 kHz for gasfrequency = -j 15 kHz for water (2)
12 kHz for oil
Cavitation Sources: Cavitation in a liquid will occur when-ever the local pressure drops below the vapor pressure forthe liquid or for any dissolved gas in that liquid. Thedegree to which cavitation occurs in leakage through anorifice is directly proportional to the pressure across theorifice and inversely proportional to the difference betweenthe local static pressure and the sum of the partial pres-sures of vapors and dissolved gases. The acoustic powerradiated by cavitation resulting from flow through orificesis generally taken to be proportional to the square of thepressure drop across the orifice. [3
J
132

(For both water and hydraulic fluid, there is experimental[evidence [l] to show that cavitation often occurs under the'fluid conditions found in many piping systems. There areI very little data on the dissolved gas content or vapor pres-sure of water or hydraulic fluid at a valve. This, couplediwith the fact that the theory cannot handle real (impure)i liquids such as tapwater, seawater and hydraulic fluid,j suggests that the previously reported [lj observations beI accepted. It was observed that cavitation occurs very
I
irregularly in the seawater valves at 7 psi and leaking to| atmosphere; and that cavitation usually does occur for
j
hydraulic valves leaking to pressures which are lower thanj
system backpressure (the pressure at which the fluid hasbeen stored in the sump, normally above atmospheric pressure).However, it was observed that cavitation usually does notoccur for hydraulic valves leaking to pressures substantiallyabove the system backpressure. At system backpressure,cavitation in hydraulic valves is very erratic.
Flashing Sources: The flashing of pressurized water to steamas it leaks through a valve is known to be a very noisy pro-cess, but no information has been found regarding theintensity or frequency distribution from this source, nor hasit been experimentally observed in this work. It is expectedto be broadband and very intense since the energy associatedwith the phase transition is many (about eight) orders ofmagnitude greater than that of turbulence under typical steamplant conditions.
Mechanical Sources: Mechanical sources in leaking valvesarise from pressure fluctuations that pass from the fluid tothe valve, rattles of loose parts of the valve, and modifica-tion of the sound field due to cavity resonances. Valverattle has not been observed, but occasional inadvertentmetal-to-metal external contacts are easily identified,indicating that rattles would be easily detected by the AVLD.
Equipment Description: The Acoustic Valve Leak Detectormonitors leak-associated acoustic energy in the frequencyrange of 10 kHz to 100 kHz. This frequency range was chosenbecause there is significant energy emitted by leaky valvesin this range and because acoustic energy in this range isstrongly attenuated with increasing distance from the source.Therefore, background noise often can be electronicallyseparated from the signal. The detector permits the operatorto observe the acoustic energy density as an analog meterreading or to listen to it on headphones. The audio outputis derived from the ultrasonic frequencies by beating theinput with a controlled frequency oscillator and amplifyingthe resulting beat frequencies for the headphones. The
133

internal reference oscillator may be swept automatically orheld at a fixed center frequency of 25 kHz. Two outputs areprovided to permit recording the acoustic amplitude versusfrequency on a standard X-Y plotter.
The acoustic signals are obtained by temporarily attachingcommercially available piezoelectric transducers to the valvor nearby piping. Since the transducers are attached to theoutside of the valves, the time and expense of dismantlingthe valves or removing them from the systems are eliminated.
The detector unit is of all solid-state construction and fitin a small case about 18 cm (7 inches) high by 2j5 cm (9inches) wide by 25 cm (10 inches) long. The entire instru-ment, with all accessories stored in the case cover, weighsless than 7 kg (15 lb). Two transducers, a set of head-phones and a detector unit are shown in Figure 1. Otheraccessories, which will be described separately, includetransducer holders, transducer standoffs, mounting discs, anda hand-held probe. The case, when closed, is watertight andbuoyant. Power is supplied by rechargeable 6-volt batteries
Figure 1 - Acoustic Valve Leak Detector, Model C
Electronic Construction: The detector unit, which is mountedin the bottom half of the case, is covered by the controlsand displays on the front panel. A functional block diagram
151+

of the detector unit is shown in Figure 2. Electricalsignals from each transducer are fed to preamplifiersthrough coaxial cables. Signals from a local oscillator andfrom one of the preamplifiers are then fed to a mixer stagevia a high-pass filter which eliminates low-frequency struc-tureborne noise. The mixer stage outputs, which are thedifferences between the amplified transducer signals and thelocal oscillator signal, are in the audio spectrum. Thisheterodyne technique allows the operator to hear a repre-sentation of the ultrasonic acoustic emissions on the ear-phones. The amplitude of the audio signal is also displayedon the analog acoustic amplifier meter located on the frontpanel.
TO PHONES
REFERENCEVOLTAGE FIXED 1
RAMP SWEEP fGENERATOR
OSCILLATOR
TRANSDUCERB
METER
TO PHONES
Figure 2 - Acoustic Valve LeakDetector Block Diagram
An amplitude output is provided to drive an X-Y plotter witha d-c voltage proportional to the average rms value of theinput energy in a selectable bandwidth of ±J> kHz or ±10 kHz,with a center frequency selectable from 10 kHz to 100 kHzor from 20 kHz to 200 kHz. The frequency output provides ad-c voltage proportional to the center frequency of theamplitude output. In the sweep mode, a voltage ramp drivesthe variable control local oscillator over the required 10:1range in approximately 30 seconds.
Power is supplied at ±12 volts from four series-connected,sealed, 6-volt, lead-acid storage batteries. The detector
135

unit draws 60 ma and will operate continuously for 8 hourson a 16-hour charge.
The electronics are mounted on two printed-circuit boardslocated in the bottom half of the case along with thebatteries and charging transformer. Rectifiers and thebattery charging control circuits are mounted on the powerboard. The preamplifiers, ramp circuit, local oscillator,mixers and the audio amplifier are mounted on the mainprinted circuit board.
Front Panel: All of the controls, connectors and displaysrequired to operate the detector unit are mounted on thefront panel. Two input attenuators, one for each channel,each with 12 fixed steps of 5 ^B per step provide a maximumof 60 dB attenuation to allow adjustment to the noise levelspresent. The function selector is a rotary switch whichselects the input to the local oscillator. The sweep/resettoggle switch starts and resets the voltage ramp to the localoscillator when the sweep mode is selected. Either channelmay be monitored on the headphones. The volume controladjusts the amplitude of the signal to the headphones. Theon/off power switch must be in the off position to allowbattery charging with the a-c power cord connected. Thebattery test toggle switch allows the front panel meter tomomentarily monitor the battery condition. The test switchapplies power to an internal noise generator for a completesystem self-test without any additional test equipment.
Accessories: The transducer used with the AVLD is an EndevcoModel 2217E, and suitable headphones are available fromnumerous manufacturers. Several unique accessories have beendesigned to improve the means of acoustically coupling thetransducer to the pipes or valves. The devices include aclamp for hands-free operation, a standoff for thermal pro-tection of the transducer, and a hand-held probe. Basic toall is a ball-and-socket connection which allows repeatableacoustic coupling to be obtained reliably without requiringaccurate or even steady alignment.
Figure 3 shows a socket and a transducer attached to a stand-off. The end of the standoff is a half-inch diameter ballwhich fits the spherical indentation in the socket disc.The standoff, which is a 3/8-inch drill rod with a 1/2-inchball bearing welded to one end, is attached to the trans-ducer by a threaded mounting stud. The socket disc may beepoxy-bonded to the valve to be tested, or it may be heldby a spring to the ball end of the standoff, forming a hand-held probe, as shown in Figure 4. Note also the threadedmounting stud for attaching the transducer.
136

Figure 3 - Mounting Disc, Standoff and Transducer
\JjtflTll - nn.il. r i ,
,
,
Figure 4 - Hand-Held Probe Parts
The circumferential groove around the socket disc is forholding the disc to the standoff rod by means of the springshown in Figure 4, or for clamping the transducer to theepoxy-bonded socket disc shown in Figure 5* The transducerholder shown in Figure 5 uses a coil spring to clamp thetransducer to a socket disc which has been epoxy-bonded tothe test piece. When used as shown in Figure 5# a sectorof a 1/2-inch sphere is bolted into the face of the trans-ducer to provide the ball portion of the connection. In allcases, a small amount of acoustic coupling compound isapplied between mating metal surfaces.
137

Figure 5 ~ Transducer Clampedto Mounting Disc
Operation: Due to the large variety of fluids, valves andfluid conditions, it is considered important, at this pointin the program, to have trained operators conduct leak checksIn some Navy applications where a large number of identicalvalves are to be checked, the breadth of experience requiredto interpret properly the results is much less. Most of theleakage detection programs are still in the stage where base-line data for specific valve and fluid types are still beinggathered and plots of acoustic amplitude versus frequencyare still being correlated with independent leakage ratemeasurements where possible.
Basis for Detection: Useful frequency ranges for leakagemeasurement were determined from measuring the acoustic
138

emissions of various valve and fluid combinations at ultra-sonic frequencies up to 1 megahertz. It has been found thatleakage noise is generated from audio frequencies up to
I
several hundred kilohertz. The signature depends on fluidtype and pressure, leakage rate, and valve type and condition.The AVLD was designed to reject frequencies below 10 kHz(because high levels of structureborne noise in most systems' gave a poor signal-to-noise ratio there, and to rejectj
signals above 200 kHz because in most systems the signallevels in this range became quite small.
Normally, two transducers are employed for detection. One isplaced on the valve or adjacent piping to pick up leakage-
I
generated noise which will be mixed with structureborne back-
I
ground noise and the second is located either upstream or! downstream of the valve to pick up structureborne noise only.
I This process is illustrated by Figure 6, which shows typicalsignatures obtained from a leaking seawater ball valve. Tothe extent that the leakage generated noise is attenuated bythe time it reaches the background transducer, and thestructureborne background noise is the same at the two trans-
I ducer locations, the subtraction of the two signals willj
result in the leakage noise only.
LEAKAGE SIGNATURE BACKGROUND
Figure 6 - Basis for Detection
139

Attaching Transducers: The location and method of attachmenof transducers depends on the nature of the application. ifthe surface of the pipe or valve is hot (above 177° C), asis the case with steam valves, the standoff must be used.The hand-held probe with attached socket disc is especiallyhelpful for determining the most sensitive location forattachment of epoxy-bonded discs. Its use is illustrated byFigure J.
Figure 7 _ Use of Hand-Held Probe
To detect leaks in a typical seawater ball valve, a mount-ing disc should be epoxy-bonded to the downstream side ofthe valve to be checked. Additional discs should beattached, one each, approximately 30 cm upstream and down-stream of the respective flanges, as illustrated by Figure8, when noise is present. As with any bonding process, it

is necessary to have the surfaces clean and free of any-
lagging, dirt or grease. The epoxy should be appliedsmoothly and evenly to the disc to eliminate air gaps. Theepoxy should then be squeezed as thin as possible to assuremetal-to-metal contact at the center of the disc for goodacoustical coupling. Take care that the epoxy does notenter the groove on the side of the disc.
_m_
TRANSDUCER "A"
TRANSDUCER "13"\ABOUT TO BE PLACED IN
THE DOWNSTREAM POSITION
UPSTREAM POSITION
FOR TRANSDUCER "8730 cm
OR MORE
FLOW
Figure 8 - Typical Transducer Locations
With the mounting discs in place, the transducers may beclamped to the disc as shown in Figure 5/ or tne ball end ofthe standoff shown in Figure 3 may t*e hand-held against thesocket in the mounting disc. The ball-and-socket connectionbetween the rod and the disc makes the acoustic measurementindependent of the angle between the rod and the disc. Inall cases, small amounts of coupling compound should beapplied to the transducer-rod, rod-disc, or transducer-discinterfaces as appropriate to insure good acoustical coupling,
Interpreting Results: A complete system self-test, whichincludes cables, transducers, detector unit and X-Y plottershould be conducted at the beginning of each day's work,using the internal noise source. Each test begins with adetermination of the transducer sensitivity (a partial self-test), followed by a measurement of the meter offset. Thetransducer test uses the internal noise generator. Meteroffset at zero input attenuation with no signal present isthen recorded for comparison with later readings.
The next step is to determine if significant backgroundnoise is present. This is done by attaching transducer A,as shown in Figure 8, and decreasing the attenuation until
ikl

mid-scale meter deflection occurs with zero differential{
pressure across the valve. The attenuation and meter readinglare then recorded for comparison with readings to be taken i
with normal differential pressure across the valve. If, with!normal differential pressure across the valve, the meterreading and attenuation setting indicate a signal above thebackground noise level, it may be concluded that the valveis leaking. If the results of the single-transducer pro-cedure are inconclusive, both transducers and possibly the
jX-Y plotter will have to be used to determine if the valveis leaking.
I
The next step is to attempt to electronically separate thej
background noise from the leakage signal, using the differ-f
ential (A-B) function of the detector unit. Transducer B)
is first tested in the same manner as described for trans- I
ducer A. Then, transducer A is moved to the upstream mount- 1
ing disc, and then to the downstream mounting disc, recording)the signal levels observed, to determine which mounting discis nearest the dominant background noise source. Using theattenuator controls and the panel meter, the signal levelsfrom both transducers successively placed at the mountingdisc nearest the dominant background noise source are matchedto compensate for differences in transducer sensitivity.With the input selector in the "A-B" position, the A trans-ducer is placed on the valve flange, and the panel meterlevels are recorded with the B transducer placed first up-stream and then downstream. If a positive meter deflectionis observed at both the upstream and downstream locationsfor the B transducer, or if there is a positive deflectionat one location and zero at the other, it may be concludedthat the valve is leaking. If zero deflection occurs atboth locations, it may be concluded that the valve is not I
leaking. If a negative deflection (meter pegged below zero)is observed at either location of the B transducer, thesituation is still ambiguous and a spectral plot must be made.
If, having recorded the amplitude versus frequency spectrawith the X-Y plotter, it is observed that the signals arehigher with normal differential pressure applied than withzero differential pressure, it may be concluded that thevalve is leaking. If no differences are observed the results i
remain inconclusive unless some way can be found to reducethe background noise level to obtain a more positive indica-tion. However, experience with shipboard systems indicatesthat inconclusive results are rare.
I
I
lh2

Application Experience: U. S. Navy experience with theAcoustic Valve Leak Detector has been of three distincttypes
:
m Monitoring programs for preventive maintenance* Laboratory work• Emergent applications
The AVLD is in general use by trained survey teams at severalshipyards and onboard submarine tenders, on both coasts andat overseas bases. It is being used to detect leaky valvesas part of systematic preventive maintenance monitoring pro-grams and for overhaul planning, scheduling and budgeting.The survey teams are often called upon to determine whichof two or more parallel-connected valves are leaking, tosave the time and expense of removing or dismantling all ofthe suspected valves. Although most experience in thiscategory has been limited to valves for water and steam, itis planned to expand the systematic survey programs tohydraulic and compressed gas valves also.
Experience has been gained under controlled laboratory condi-tions with water, steam, hydraulic and compressed air valves.Most of the laboratory work has been done in connection witha research and development program to extend existing detec-tion technology to provide a leakage rate measurement capa-bility. With a leakage rate measurement capability, it willbe possible to establish repair priorities and to supportlong-term trend monitoring programs.
As a result of the increasing availability and acceptance ofthe AVLD, several requests have been received to exploreother applications. Laboratory work has been found necessaryto confirm field results in some cases, but initial resultshave often been good enough to support expansion of existingsystematic survey programs to include additional valves andfluids
.
Water Valve Experience: The original purpose for theAcoustic Valve Leak Detector was to detect leaks in seawaterball valves of 4- to 12-inch diameters. In this application,the differential pressures across the valves to be leak-checked are in the 5~7 Ps i range. Leaks are caused by marinefouling on the ball, by wear of the resilient seats and by acombination of corrosion and erosion between the seats andthe valve body. Small leaks tend to remain small for longperiods, but there is a threshold in the range of severalhundred milliliters per minute per inch of pipe size, beyondwhich leakage rates tend to increase rapidly. The AVLD isnot normally capable of differentiating between ball-seal orseal-body leaks.
Ik3

Since the AVLD can detect leaks of a few hundred millilitersper minute consistently, periodic leak checks have made itpossible to identify leakers while it is still easy to repairthem by simple replacement of seats. Time and budget con-straints make it impossible to repair all of the valves in aship at one time except during a regular shipyard overhaul.Use of the AVLD makes it possible to maintain the pipingsystems in a high state of readiness by concentrating thelimited repair resources on the few valves that actuallyneed repair at a given time. The systematic monitoring andpreventive maintenance program is resulting in a yearlymaintenance savings of tens of thousands of dollars per ship.
A typical troubleshooting application of the AVLD is illustrated by Figure 9* Without the AVLD, it might have beennecessary to dismantle and inspect nine large valves. Inthe example shown, a few minutes work with the AVLD elimina-ted two-thirds of the time and labor which would otherwisehave been required.
Figure 9 - Example of Leak DetectorApplication on Ship
Ikk

With the epoxy-bonded discs in place, it takes less than2 minutes to determine if a valve is leaking, even if it isnecessary to make a spectral plot. In this application,spectral plots are seldom required. A comparison of meterreadings at a center frequency of 25 kHz is usually suffici-ent for leak detection.
In the course of laboratory experiments [l] undertaken todetermine what characteristics of the acoustic emission wererelated to leak rate, large variations were observed in theamplitude of the acoustic emissions of leaking seawater ballvalves. No means were found to measure by acoustic emissionsthe leakage rate through the seawater ball valves at constantdifferential pressures in the 5~7 psi range because the vari-ations in the acoustic amplitude were so large, but leakagerates of a few hundred milliliters per minute were consis-tently detectable.
It was observed that the large variations in acoustic ampli-tude were caused by several phenomena loosely related to aircoming out of solution from water that had become super-saturated with dissolved air due to the pressure drop acrossthe leaking valve. It was concluded that means must befound to predict, measure or control those phenomena beforeleakage through seawater ball valves <. can be measured acousti-cally at differential pressures of 5_7 psi. [ l]
On the basis of the experiments at low differential pressures,it has been hypothesized that the 5~7 psi range is at or nearthe lower limit of detectable differential pressures and thathigher differential pressures may produce acoustic emissionsmore consistently related to leakage rates. Experiments totest this hypothesis, using differential pressures up to 200psi, are still in progress.
Shipboard surveys of water valves at even higher differentialpressures are also in progress. Although there is good con-fidence in the initial results, the valves suspected to beleaking have not been examined internally and there are noother means to detect leakage while the valves remain inplace.
Steam Valve Experience: Shipboard and laboratory experienceindicates that steam valve leaks are easier to detect thanwater valve leaks. There are at least three factors whichcontribute to the ease of detecting steam valve leaks:
• High pressures• All-metal construction• Low background noise
1U5

The relatively high differential pressures across a typicalleaking steam valve increases the acoustic power and fre-quency range of the noise source. The all-metal construction(no resilient seats) results in low transmission lossesbetween the noise source and the point of transducer attach-ment on the valve body or valve stem. Background noise isseldom a problem with steam piping systems. The signal-to-(background) noise ratio for steam valves is furtherincreased by lagging which tends to damp structureborne noisefrom other sources.
Another important consideration is that many shipboard steamsystems are at least doubly redundant. This means that incase of doubt, it is often possible to compare the acousticsignatures of two ostensibly identical valves in identicalservice.
Because of redundancy requirements and other reasons, ship-board steam valves are often connected in parallel. Beforethe introduction of the AVLD, steam leaks detected or sus-pected through other means were often impossible to attri-bute to a single valve. The AVLD is usually capable ofdetermining which valve is not leaking, thereby saving thetime and expense of removing or dismantling it. In the case
,
of large stop valves paralleled by much smaller warmup valves,valve size must be considered in drawing conclusions. Thesignatures of the large valves must be compared with thesignatures of the bypass valves and other large valves. Ifthe large valve signature is greater than the small valvesignature, it is reasonable to conclude that the large valveis leaking. However, if the small valve is leaking also,its signature will often be greater than the signature ofthe large valve. In general, very large signatures fromlarge valves indicate large leaks, and very small signaturesfrom small valves indicate no leakage.
In attaching the transducer, it is sometimes necessary toremove a small amount of lagging; however, in valves wherethe stem connects directly with the noise source the exposedvalve stem is often a good point of attachment. Becausesteam and piping temperatures exceed the temperature limitsof the transducer, it is necessary to use the standoff,usually as a hand-held probe, as illustrated by Figure J.Once the best locations for the transducers have been identi-fied, it is possible to leak-check steam valves, includingpoppet-type turbine throttles at the rate of about one valveper minute.
The original purpose of systematic valve surveys was toincrease overall system operating life, reliability and
lk6

availability by determining where to concentrate limitedmaintenance resources. Subsequently, requirements forreduction of energy consumption have led to proposals to use.the AVLD to minimize energy losses.
Laboratory experience with the AVLD indicates that it isfeasible to measure leakage rate through steam valves. How-ever, since there is evidence that small steam leaks grow
! rapidly, a decision was made to abandon that effort in favorof development of a simpler instrument capitalizing on thehigh signal-to-noise ratios present in steam piping systems,but capable of detection only. It is hoped that increaseduse of the less expensive instrument will enable small leaks
j
to be identified and repaired before they become so large asto require more expensive repair procedures.
' A prototype of the simplified steam leak detector instrumentis currently being evaluated aboard ship. It is basicallyan rms acoustic amplitude meter, operating in the 20 kHz to80 kHz range and capable of an extremely large dynamic range.
In addition to the basic conclusion that steam valve leakagerate measurement by analysis of ultrasonic emissions isfeasible, some other useful information was developed. Witha 3 1/2 inch globe valve mounted in a test stand and pres-surized about 600 psi, it was possible to measure acousti-cally leakage rates as low as 0.2 ml/min of condensate, whichwas collected at the valve discharge. Since a steam loss of0.2 ml/min corresponds roughly to a fuel waste of about 0.002pounds per hour, it is obvious that leaks causing significantenergy losses are easily detectable. Several spontaneouschanges in leakage rate were observed. It is suspected theywere caused by differential thermal expansion of the parts,implying that acoustic measurements made for trend analysesshould be taken after the valve is thoroughly warmed up.
I
Compressed Gas Valve Experience: Shipboard applications ofjthe Acoustic Valve Leak Detector to 4000 psi compressed airvalves have been hindered by the high levels of backgroundnoise typically present. The pipes and valves are so wellcoupled acoustically that leakage noise and other noisepicked up from external sources tend to spread throughoutthe system. The valves which have been of primary interestin the program so far are 2- inch ball valves with resilientseats, connected by steel pipe. No lagging is present.
I There is very little transmission loss of the ultrasonicacoustic energy. The result is that with the presentlyoperational instrument, it is always difficult and sometimesimpossible to determine which of several valves is leaking.
1*4-7

Laboratory work is currently in progress to determinewhich of several candidate signal processing schemes willpermit the AVLD or new techniques to work better in the highnoise environment.
Experience in the laboratory with the 2-inch ball valvesand aboard ship with smaller valves has been much moresuccessful. Leaks in smaller valves are more easily detectedFor instance, the AVLD was recently used to locate a leak ina shipboard oxygen generator system. A 1/2-inch valve pres-surized at 1800 psi was cracked open to leak at a measuredrate of about 1 ml/min (at atmospheric pressure) . It wasalso monitored by bleeding the leakage through a piece offlexible tubing into a beaker of water. The leaking valvewas easily found by the AVLD from among several dozen othervalves in less than 2 minutes. Prior to the introduction ofthe AVLD # troubleshooting the system for a leak of that sizetook an average of 20 man-hours, and occasionally took 100man-hours or more. Signfiicant leaks which are initiallydetected by monitoring system pressure losses over time,occur about four times a year per system.
Leaks smaller than the 1 ml/min rate were also detected.There was an interesting phenomenon observed with very smallleakage rates. From monitoring the leakage noise on theAVLD audio output, it was observed that the acoustic emissionwas intermittent. This phenomenon had been observed pre-viously in hydraulic and high-pressure water leaks. If theleaks are as intermittent as their acoustic emission, thatcould explain why some leaks in this system are very elusiveto traditional leak-finding procedures involving water andsoap.
Laboratory work with the 2-inch ball valve at 4000 psi hasshown that in the absence of high levels of background noise,leakage rates as small as 100 ml/min can be detected reliablyon the basis of ultrasonic acoustic emissions, and that thesignals increase with increasing leakage rate. As a resultof this finding, work is in progress to develop an opera-tional instrument capable of measuring high-pressure airvalve leakage rates by analysis of ultrasonic acousticemissions
.
Since the background noise levels in shipboard high-pressureair systems are high, a successful instrument must incorpo-?.rate noise rejection features. At least three techniquesto reduce the effects of background noise are being con-sidered. Because detectable ultrasonic signals from leakinghigh-pressure air valves have been observed at frequenciesas high as 400 kHz, and because there is a theoretical
ike

increase in transmission attenuation with increasingfrequency, surveys will be conducted to determine the extentto which shipboard background noise is attenuated at higherfrequencies. A technique being investigated with some suc-cess in the laboratory is to damp the ultrasonic acousticemissions in the vicinity of a valve being leak-checked byattaching sound-absorbing materials to nearby pipes.
A third approach being developed uses the cross-correlatedsignal between two transducers mounted at different distancesalong the pipe. The signal is different depending on thedirection of the noise and this difference is sensed toindicate the direction from which the dominant noise is com-ing.
The objective of this development effort is to produce aninstrument which can detect a leak, isolate it to a singlesource, and then measure the leakage rate; all by analysisof ultrasonic acoustic emissions. The leakage rate informa-tion will then be used for trend analysis and for establish-ment of repair priorities and criteria.
Hydraulic Valve Experience: The Acoustic Valve Leak Detectoris currently being used to identify leaking hydraulic valveson a troubleshooting basis if leakage is detected or sus-pected as a result of other evidence. Laboratory experimentshave determined that the minimum detectable leakage rate isabout 10 ml/min at 2800 psi, and have established the feasi-bility of measuring hydraulic valve leakage rates by analysisof the ultrasonic acoustic emissions.
Laboratory work to date has the objective of developing anoperational instrument capable of measuring, as well asdetecting, internal leakage rates of hydraulic valves byanalysis of ultrasonic acoustic emissions. It has beendetermined that there are detectable ultrasonic signalsassociated with hydraulic valve leakage and that the signalamplitudes increase with increasing leakage rate, [l] On thebasis of this finding, it was concluded that a quantitativeinstrument is feasible. A capability to differentiate oneleaking manifold valve from the non-leaking valves was alsodemonstrated. [1]
Despite the progress made in the laboratory and aboard ship,some important aspects of the acoustic emissions of leakinghydraulic valves remain incompletely understood and arecurrently being investigated. In particular, signatureamplitude was observed to increase with decreasing valvebackpressure, [l] Another important factor is the sump pres-sure, usually above atmospheric pressure, at which the
lk9

hydraulic oil is stored for long periods in contact with air.In some instances, large acoustic signature amplitude varia-tions were observed at backpressures hear the sump pressure. [l]
Future Developments: Improvements to the existing AcousticValve Leak Detector are being developed in four major areas:
. Leakage rate measurement (as opposed todirection)
m Background noise rejectionm Accessories for ease of operationm Design simplification
Leakage rate measurement as an extension of the existingtechnology will permit a trend-monitoring program to beestablished. This capability will be especially importantwhen applied to valves and fluids with a leakage ratethreshold, above which valve damage and leakage ratesincrease rapidly. Experimental data reported elsewhere [l]show that there are detectable ultrasonic acoustic signalsassociated with hydraulic, steam and high-pressure air valveleakage, and that the signals increase with increasing leak-age rate. The known ranges of acoustically measurable leak-age rates for the three fluids are tabulated in Table 1.Note that the greater of the leakage rates listed are notnecessarily upper limits. They are simply the greatest leak-age rates observed in the laboratory experiments which werethe basis for the data shown.
Table 1 - Known Range of AcousticallyMeasurable Leakage Rates
Fluid ValveType
ValveSize
DifferentialPressure
AcousticallyMeasurable Leakage
Rate fml/min)Hydraulic Spool 1/2-1 in. 2800 psi 10.0-1000
Steam Globe 3-1/2 in. 600 psi 0.2- 30 (conden-sate)
Air Ball 2 in. 4000 psi 100.0-3000 (measuredat atmospheric pres-sure)
Despite the progress reported, many factors affecting therelationship of acoustic signatures to leakage rates remainincompletely understood. These factors are related to valvesize, background noise, and fluid characteristics such as 1
pressure, temperature and dissolved gas content. Current
150

development work is directed toward obtaining a better under-i standing of these factors and toward developing instrumentscapable of measuring leakage through 2-inch ball valves forhigh-pressure air and through hydraulic directional controlspool valves.
!
Background noise rejection improvements are being developed1 for shipboard high-pressure air systems. Methods being|
developed for rejection of excessive structureborne noiseinclude local damping, electronic signal processing and theuse of higher frequency signals.
Accessories which make the AVLD easier to operate have been: developed as the need arose. A current example is a trans-ducer clamp which will not require mounting discs to be
I epoxy-bonded to the pipe or valve surface, but will stillI permit hands-free operation.
Design simplification is a normal evolutionary process forany new development. The existing AVLD is a very versatileinstrument which can be used for a variety of valves and
j
fluids. By including only the features needed for a parti-]
cular application, it is possible to make a simpler, but lessversatile instrument. An example of this is the prototypesteam valve leak detector which was recently completed.
Summary: Detection and measurement of the internal leakageof fluid valves by analysis of ultrasonic acoustic emissionsare rapidly expanding technologies within the U. S. Navy.The Acoustic Valve Leak Detector, when applied in asystematic program of preventive maintenance monitoring, caneliminate most of the cost and downtime associated withdetermining the internal condition of valves by traditionalmethods of removal, disassembly and inspection. In trouble-shooting applications, it enables repair efforts to be con-centrated quickly on the actual cause of the problem, ratherthan wasted in a long search for the leaking valves. In someapplications, the AVLD can be used to detect small leaks
|before they become too large to repair by simple methods.
The Acoustic Valve Leak Detector also has great potential forenergy savings when applied in a preventive maintenance pro-gram aimed at detecting and eliminating leakage losses,particularly in steam systems and other piping systems whichuse fluids to transport heat.
j
Research and development efforts are continuing to expand thecapabilities of fluids, pressures, temperatures, valve typesand valve sizes. Since none of the fluids or valves areparticularly unique to the Navy, it is expected that the
151

instrument will find even wider commercial and industrialapplications
.
Technical References
:
1. Dickey, J. W. , et al , "Acoustic Measurement of ValveLeakage Rates," Research Supplement, Materials Evalua-tion , Jan 1978
2. Morse, P. M. and K. U. Ingard, Theoretical Acoustics,McGraw-Hill, I968
3. Boguslavski, Y. Y. , et al , "Sound Radiation by aCavitation Zone," Sci. Phy. Acoustics , Vol. 16, No. 1,
pp. 17-20, 1970
152

PIELSTICK ENGINE DIAGNOSTICS
A. GenotS,E.M.T. - Pielstick
2 , quai de Seine93202 Saint-Denis, France
Abstract: In order to improve engine reliability and reduce maintenanceexpenses on ships, S.E.M.T. has developed a monitoring and diagnosticsystem for medium speed diesel engines used in marine propulsion. Thesystem was designed to monitor ship's engines automatically, and withoutmanual intervention, while underway. The aim was both to preventfailures and to perform maintenance only when necessary. The PielstickEngine Diagnostic system automatically monitors wear of the piston topring, main bearing alignment and shell wear, pressure charging circuitfouling condition, and exhaust gas temperatures. The use of the systemwill result in the extension of piston on-line time between inspections,in the elimination of alongside monitoring of the shafting, and in theimprovement of the operating environment of the engine. The economicaljustification will be extended engine life while eliminating unnecessarylabor and engine outages
.
This paper describes the monitoring arrangement, including data acqui-sition and processing, with results from both land tests and a sea-going vessel.
Key Words: Crankshaft displacement; medium speed diesel engine, pistonring wear; turbocharging monitoring.
Introduction
The Pielstick Engine Diagnostic system (P.E.D.) monitors the on-linecondition of certain components of medium speed diesel engines withoutputs ranging from 480 to 1100 kw per cylinder. The system usespickups, "AND" circuits, and a data microprocessor to supply users withinformation about piston ring wear, crankshaft bearing alignment andwear, turbocharger fouling, and exhaust gas temperatures (fig. 1)
.
Some of the benefits of this system are: (1) automatic monitoring ofengine conditions which eliminates several hours of labor and engineoutages that are required for manual inspections; (2) helping to preventfailures which would have serious consequences to ship operations; and
(3) permitting corrective actions to be taken only when actual weardamage has occurred.
153

Research on the P.E.D. system started in May 1977 using a 12 cylinderpower station engine for the development of the system software. Atthe end of December 1977 , a first prototype system was fitted onto an18 cylinder propulsion engine of the container ship M/V "RENOIR" whichwas commissioned in January 1978. A second prototype system has beenfitted onto a test engine in S.E.M.T.'s laboratory.
Piston Ring Wear Monitoring
Two cylinders from every Pielstick engine are inspected at 6000 hourintervals for piston ring wear; all engine cylinders are inspected after
j
12000 hours of operation. The main purpose of these inspections is tocheck the amount of wear in the chromium layer covering the top ringface . Chromium plating wear depends to a large extent on the engineworking conditions such as rotation speed, lube oil nature, coolingwater temperature, on/off cycles, etc.
The dismantling of a piston and con-rod assembly for checking pistonring wear is a long and tiresome operation and therefore it is verydesirable to extend the inspection interval. In a great number ofcases, after dismantling, inspection shows that the interval could havebeen extended without detrimental effects. But, once the top ringprotective chromium layer is worn, the cast iron ring rapidly deteri-
orates necessitating the replacement of the piston ring set. Therefore,
the intervals between inspections cannot be extended without some kind
of monitoring system such as the Pielstick Engine Diagnostic system.
This system continually measures the top ring chromium ring plating
thickness. The expected cost of the system will be recovered if the
piston ring service life can be increased by 1000 hours per set, based
on the smallest PC engine and monitoring one cylinder out of 3 or 4.
Inductive sensors are used in the P.E.D. system to measure the thickness
of the chromium plating on the piston rings. These sensors produce a
signal whose amplitude varies with both the thickness and the magneticproperties of the coating material (fig. 2)
.
These sensors are placed in the cylinder liner of the engine flush with!
the cylinder liner wall (fig. 3) . The sensor is placed in such a waythat all the piston rings pass successively in front of the sensor.
This allows the sensor to scan each ring and generate an appropriateoutput signal. If one of the piston rings is pure cast iron (no coat-ing) , then it is possible to measure the thickness of the coatings bycomparing the amplitude of the signals given by the passage of each ring.
The accuracy of this technique is such that it has been possible to
compute a 0.044 mm reduction in coating thickness compared with an
actual wear reduction measurement of 0.047 mm.
Figure 4 shows the signal from the piston rings transducer as displayedby the data microprocessor. The computer is programmed to eliminate
15%

I
abnormal values resulting from the passage of ring gaps before thesensor. The signal is analyzed vs time and the wear rate of the pistonring is computed to help determine the next scheduled overhaul.
Measurements from the system installed on the M/V "RENOIR" reveal a
|
slight chromium wear on the piston rings after 3400 operational hours,iNo dismantling has taken place since the installation of the P.E.D.
j
system. Therefore, no direct measurements are available for comparison.
Crankshaft Monitoring
At the present time, crankshaft alignment and wear inspections areachieved by measuring crank deflections and under journal clearances.
!This inspection is performed after every 3000 operational hours, and
|
while this is adequate for proper engine operation, it does not predict
I
or prevent failures such as delamination of anti-friction metal, faultytightening, poor lubrication, faulty filtering, etc. Furthermore, these
I
scheduled inspections require relatively long downtimes which often areunnecessary because no anomalies are found.
I
From the economical standpoint, the new P.E.D. monitoring systemieliminates time consuming inspection and reduces outages due to compo-
inent failure. Its chief value may be its ability to detect imminentfailures because a shafting breakdown could stop the engine , and therebyput the ship out of service for a long time.
Monitoring of the crankshaft is based on the analysis of the verticalcomponent of the crankshaft motion in the bearings. A contact freedisplacement transducer is fitted in each main bearing on the engine veeaxis (fig. 5) . From the signals emitted by the transducers, the fol-lowing parameters are computed: the total amplitude of the displacement(a) from peak to peak during a cycle (two engine revolutions) ; themean position of the crankshaft (b) during these same revolutions; andthe minimum lift (c) of the. crankshaft in the bearing. These threeparameters differ from one bearing to another and vary with the enginespeed (fig. 6)
.
Results from the M/V "RENOIR" show that for a given rotation speed,amplitude "a" decreases slightly when the engine power demand increases;this amplitude also decreases by 3/100 when the ship's displacementincreases from 16000 to 29600 tons. The ship's cargo seems to have noeffect on "b" and "c" values.
In order to ascertain that the signal indicating crankshaft journalmovement in its bearing was affected by wear of the bearing anti-
!friction metal, we recorded the signals given by a transducer installedon the bearings of a 12 cylinder engine operating under normal conditionsand after having removed the bearing shell of one of the bearings. It
!was observed that the signal amplitude doubled for the bearing with the
155

shell removed. Figure 6 shows that an increase in the rotation speedresults in an increase in the journal movement amplitude. As a result,crankshaft monitoring is only done while the ship is at "full speed".At "full speed", the engine rotates between 475 and 500 rpm dependingon the wind, the load, and hull fouling leading to a variation inparameter "a" of about 0.03 mm or 10 percent.
Analyses of "b" and "c" values are used to monitor main bearing align-ment by comparing the mean position "b" of a bearing with that of theneighboring ones. The values of parameters "b" and "c" are not affectedby the roughness of the ocean over the range from a calm sea to aBeaufort number of 9. The value of "a" is not affected since it ismeasured over two crankshaft revolutions which is a much shorter periodthan one swell.
Exhaust Gas TemperaturesI
Monitoring of exhaust gas temperature is an usual practice aboard ships.We have found it to be practicable, both technically and economically, i
to replace the analog equipment with a simple indicator and to performmonitoring and analysis using the computer provided for the crankshaftand piston ring monitoring. The exhaust gas temperature is measured ateach cylinder outlet. The readings are averaged and the individualdeviations with respect to the mean value are computed. The computerverifies that each temperature does not deviate from the control valuesestablished for a new engine, taking the control rack position intoconsideration. The computing program also takes into account the sys-:
tematic deviation among the cylinders which is specific to each engine.Practical experience indicates that with a fixed-pitch propeller therotation speed should also be taken into account in addition to thecontrol rack position.
The alarm threshold varies as the temperature average with the permis-sible deviation being larger for the low averages . Figure 7 shows theinfluence of the after-cooler air temperature. Both experimental curvesplotted for 31 and 39 °C air temperatures bracket the ideal curve.
Survey of the Supercharging System
The aim of this survey is to determine fouling of the superchargingsystem and to predict the evolution of this fouling. The survey systemapplies to the air-cooler, the turbine and the compressor. The econ-omical advantage of the system rests on the fact that any anomaly .in the j
pressure charging entails a loss of engine efficiency and, in extreme
cases, damage to the valves.
The survey system measures the following parameters: $
• air temperature after cooler
156

• water temperature at cooler inlet
• air pressure after cooler
• difference in air pressure, before and after cooler
• fuel rack position
• revolutions of the turbo-blower.
Fouling of the air cooler will be determined by the difference betweenthe water temperature and the air temperature, and by pressure loss atair side. These readings are subject to trend analysis in order to warnthe servicing staff that corrective measures must be undertaken.
Air filter or compressor fouling may be found by comparing the airpressure value read before the compressor and that found by applicationof the law giving that pressure in terms of turbocharger rotation speed.Figure 8 shows the experimental results and also that the linearfunction first adopted as the pressure - rotation speed relation wasover-simplified, as the difference between the measured and computedpressures may exceed the alarm threshold fixed at 0.13 bar. The linearfunction will be superseded by two straight line segments. The exhaustgas side of the turbocharging system is monitored by comparing chargeair pressure at the compressor outlet with the theoretical pressuregiven by the law relating the air pressure to the engine speed multipliedby the control rack stroke. The product of the control rack stroke androtation speed is sufficiently accurate to be used for the power de-veloped by the engine. Insofar as their installation has been antic-ipated by the builders, the system may be completed with accelerometersto monitor turbocharger bearings. These accelerometers may either tripan alarm for too severe vibrations or be used, with a particular routine,to determine the time when the rolling bearing should be replaced.
Computation Means
The microprocessor is located in the control room a few meters distancefrom the engine. It receives analog signals from the various sensors,handles the data according to computation programs, compares the obtainedvalues with the reference values stored, commands sound and light alarms,and prints instructions for the servicing staff. Computer storagefacilities are either unalterable ones or active ones fed by batteriesor the ship's electric circuit, depending on the importance of the datato be stored and on the consequences of their being erased.
Hardware Problems
The first objection raised by the shipowners regarding monitoringsystems is the problem of the maintenance of these systems. It is
therefore necessary to search for sensors that are more rugged thanprecise and to provide for easy access to the sensors. Wires should be
157
easily accessible and well protected against the shocks they might sufferduring dismantling of engine components. Since the system was put intoservice, we have recorded the destruction of one air temperature sensor, i
the drift of an "AND" circuit for a main bearing sensor, and the shutoff of the microprocessor electric supply due to vibrations. Thesefailures show that great care must be taken, especially from the vi-bration standpoint, when fitting electronic equipment into a mediumspeed diesel engine machine room.
Conclusion
The results of the P.E.D. prototype system being tested aboard the M/V"RENOIR" are promising. They show that the monitoring of a medium speeddiesel engine used for marine propulsion is possible. It was necessaryto try it at sea so that the system prototype would be subjected to a
machine room environment. It is too soon to reach a conclusion aboutpiston ring wear reading accuracy and long term sensitivity of shaftingmonitoring. The economical advantage of the P.E.D. system is not yetestablished, but the system is a sound base for further research anddevelopment.
158


INFLUENCE OF THE COATING THICKNESS ON THESIGNAL GIVEN BY THE PISTON RING
160

l6l

162

CRANKSHAFT SENSOR
Figure 5
163

DISPLACEMENT OF THE CRANKSHAFTINFLUENCE OF ENGINE SPEED

Exhaust gas temperature
450
1 Average
Temp.
400
350
300
4
/Air temperatureafter cooler 31°C
_ Calculated low
.Individual limit
Experimental resiilt
250
Air temperature
after cooler 39°C
25 50 75 F.R.xrpm 100%
Figure 7.
I65

166

MACHINERY CONDITION ANALYSIS FOR MAINTENANCE PLANNING—THEAIRCRAFT CARRIER EXPERIENCE
Michael D. DoughertyProgram Manager for Machinery Condition Analysis and
System TestingPERA (CV), Code 1861
Naval Sea Systems Commandc/o Puget Sound Naval Shipyard
Bremerton, WA 98314
|
Abstract: In 1970, Machinery Condition Analysis (MCA) began toI replace the more traditional methods of planning the overhaul ofI aircraft carrier machinery. These traditional methods included
overhauling all machines, opening each machine up and inspecting tosee what was wrong, or running until failure. None of these methods,however, was particularly conservative in either money or time, andMCA was intended to take a more objective look at high cost, mission
[
critical machines, and identify which ones were most in need ofoverhaul
.
This paper addresses the evolution of MCA at PERA (CV), the process as
it is conducted today, and the varied uses of its results. Particu-larly addressed are the benefits derived from the program and thepossible expansion of the program in the future.
Key words: Aircraft carrier; condition analysis; machinery; mainte-nance; monitoring; repairs; vibration.
WHY PLAN MAINTENANCE? The Navy, like every major firm that relies on
machinery for production, processing or services, spends a considerableamount of time, effort and money keeping them operational. From themaintenance done by the operators on the ships, to the complete over-hauls done in public and private shipyards, $2.5 billion will be spentthis year keeping the ships operational.
All of the planning that goes into the maintenance of ships is donefor one reason - neither the Navy nor the taxpayers can afford thealternative of no planning. Ships have become too complex, materialsand parts take too long to buy, and the money is not available, forships to simply come into a shipyard without tremendous preparation,and the Navy is the first to recognize this.
In 1967, the office for .Planning and Engineering for Repairs andAlterations of Aircraft Carriers (PERA (CV)) was established at PugetSound Naval Shipyard in Bremerton, Washington. The purpose of this
167

I
organization was to do the advanced planning for all Aircraft CarrierIndustrial availabilities, both for maintenance of equipment and mod-ernization.
EARLY MAINTENANCE PLANNING FOR AIRCRAFT CARRIERS.Whether intuitively or analytically, it is fairly well known thatmachine failures occur in a manner similar to the "bathtub" curve(FIG. 1). Most failures occur when a machine is new or recentlyworked on (break in), or when it has run for a considerable length oftime (wear out). The challenge of maintenance planning is to determine
|
when to overhaul a particular machine. Some give you clear signals,such as poor performance, high vibration, or strange noises. But I
others give no indication that is obvious or apparent prior to failure,j
Early maintenance planning at PERA (CV), and much of the presentplanning also, took one of the following directions depending on thecriticality of the equipment, the length of overhaul, and the amountof funds available.
2. Select a certain number of machines to be overhauled(i.e., 4 of 12 Main Feed Pumps) and allow Shipyardinspectors or Ship's Force to select the specific units.
3. Open and inspect machines when they arrived in the Ship-yard.
4. Fix at failure.
With the exceptions of nos. 1 and 4, there was little objectivedata on which to base the actions taken on a particular machine, andoften the complaint arose from the operator, "My machines were in
better shape before I came into the overhaul," and possibly he wascorrect. At a minimum, the failure rate of the machines overhauledwill be greater than upon arrival, and, until the breakin time is
over, the failure rate will not be at its previous level.
MACHINERY CONDITION ANALYSIS (MCA) BEGINS.In 1970, it was proposed that Machinery Condition Analysis (MCA) be used
to determine which high-cost, miss ion-critical machines required over-
haul. Vibration Analysis was chosen as the prime element in this pro-
gram for several reasons.
T. Vibration Analysis had been used since 1939 for detectingproblems with rotating machinery in petrochemical plants. I
2. It had been very successful in the submarine noisereduction program.
1 . Overhaul all machines of a certain type on a fixedschedule (i.e., every major overhaul).
168

3. It could be done without taking the machine off the lineor interrupting ship's operation.
In January of 1971, the first MCA survey was conducted on 40 machinesin the USS FORRESTAL (CV 59) in support of its FY 1972 Regular Over-haul. The report was basically a priority listing of machines by needfor overhaul, and a simple OVERHAUL/DON'T OVERHAUL recommendation on
each machine. Since 1971, 84 MCA surveys have been conducted onAircraft Carriers - 72 prior to availabilities and 12 immediatelyafter availabilities.
MCA IN SUPPORT OF MAINTENANCE PLANNING TODAY.To support Maintenance Planning today, two surveys are conductedbetween each availability - one 30-60 days after the completion of anavailability, and one five to six months before the next (FIG. 2).This allows some trend analysis and provides quality assurance forthe past availability. During these surveys, between 150-250 machinesare tested. Accel erometers are attached to welded or glued blocks oneach machine and vibration signatures are recorded on magnetic tape.In conjunction with vibration, visual inspections and discussionswith the operators are held during the survey, and all the datagathered goes on a single report. The survey itself takes from 4-8
days depending on the number of machines, the ship's operations, andthe number of compartments the machines are in.
The vibration data is then transferred to hard copy for analysis.A typical survey will result in 2000-3000 vibration signatures (FIG.
3). Each signature is: (1) analyzed for high vibration, (2) com-pared to similar machines, and (3) compared to its previous signa-tures. Significant increases in vibration, or high peaks, areanalyzed and recommendations are made for correction.
Within thirty days of the completion of a survey, a final report is
forwarded to PERA (CV). This report is then provided to the main-tenance planner, the Navy customer and ship for use at the pre-arrival conference where machines are selected for overhaul.
The final report contains analyzed vibration information, visualinspection and historical data, and detailed recommendations forrepair. This allows the flexibility to do selected repairs, such as
changing bearings or aligning machines, rather than complete over-hauls only. In many cases, overhauls have been deferred and minorrepairs have been assigned to Ship's Force.
WHAT BENEFITS HAVE BEEN SEEN? The primary benefits of MCA can bebest seen in conjunction with the rest of maintenance planning. Arepair profile is used to order material for machine overhauls 1^years ahead of the availability. During the pre-arrival conference,the customer decides the specific machines to repair, and MCA allowsthe latitude to do less than the number scheduled by the profile, and
169

put the money and mandays where it can do the most good. Since MCAbegan in 1970, the entire program has cost approximately $3.5 million.This includes all development and the conduct of 84 surveys. However,the funds reallocated thru the use of MCA for ]_4 avail abil i ties overthe past 4 years have totaled $10.3 million. This represents a
return of $18.84 for every $1 spent on the 14 surveys.
In August of this year, the long range maintenance plans officer forthe Naval -Air Force, Atlantic (AIRLANT) stated that two years ago,when he began to keep a list of the top 10 areas of casualties on-
board AIRLANT ships, Main Feed Pumps and Forced Draft Blowers werenear the top. Since that time, they have disappeared from the list,and he attributes this to the success of the MCA program for detectingproblems before casualties occur.
MCA IN THE FUTURE. MCA has become more accepted by the Navy cus-tomers in the past few years, as evidenced by the increase in the numberof machines requested for survey, the addition of post-overhaulsurveys to the program, and the increased use of the reports. MCAidentifies problems in machines, but, more importantly, it identifiesthe cause of the problems, and this is the area to direct our atten-tion. Ninety percent of the problems we see in rotating machinerybegins with either imbalance or misalignment, both of which can be
corrected if caught soon enough. Programs to improve the balance andalignment of machinery immediately after overhaul are in the earlydevelopment stages.
Automatic processing of the enormous volume of vibration data gath-ered in each survey is also in the development stages. Up to thispoint, every graph had to be physically screened by the analyst for
significant anomolies and obvious problems. These were then comparedto similar machines and previous survey of the machines in question.At best, the task is formatible, at worst, impossible. By using a
computer to do the initial screening and provide only the large devi-ations for analysis, the analyst is free to do more investigation.This will also identify low level vibration problems that the analystcannot see under the present system.
CONCLUSIONS. Machinery Condition Analysis as used by PERA (CV), has
proven itself to be an extremely cost effective maintenance planningtool over the past 8 years. With returns in excess of 18:1 the
program has been well accepted and used by both the Navy customersand the carrier fleet. With modification, the program could easilybe adapted to any ship, manufacturing plant, or processing facilitywith similar success.
170

171

o
CO
o
Q-O
CM
•H
172

173


DIESEL ENGINE ANALYZER: PAST EXPERIENCE AND FUTURE PLANS
Harold W. RethmannSouthwest Research InstituteP.O. Drawer 28510, Div. 14
San Antonio, Texas 78284
Abstract: A computer-automated diesel engine analyzer system with four.\
test cells was developed in 1973-74 for use at the Long Beach Naval[
Shipyard. As originally designed, the system performed fully automatici
final testing of nine specific type diesel engines or manual testing ofjj
any diesel engines which could be fit into one of the four test cells.The nearly four years of operation has proven many of the original de-
jj
sign concepts, as well as revealed some areas where changes were neededif the full potential of the system was to be realized. Operation of i
the automated diesel engine analyzer has also stirred the imaginationsof both the original designers and the test system operators as to howthe existing system might be augmented to perform final test after over- :
haul on equipments other than diesel engines. This paper gives a briefj
description of the system as originally constructed and implemented. Itij
points out those facets of original design that have proven to be help-;
ful in updating and modifying the system to perform the task at hand.
It also points out areas where major changes will be made both in hard-[
ware and software to take advantage of the experience gained over the|
several years of testing, as well as those required to cope with chang-ing Navy test requirements. The final portion of the paper deals withaugmentations that will be made to the system to test shipboard air ]
compressors. The description of a proposed fifth engine test cell for\
testing large diesel engine subsystems is also included. a
The Diesel Engine Analyzer (DEA) to be discussed in this paper was in-
stalled at the Long Beach Naval Shipyard in 1975 as part of the Navy'sjj
modernization program. The technical aspects of this system have been a
covered in detail in other publications (references 1 and 2) and will notj
be repeated here. A brief description of the system is included for
those who might not have had access to the earlier publications.
f
The purpose of the DEA, as spelled out in the LBNSY Request for Techm-|
cal Proposal, is to evaluate the quality of repair of diesel engines i
under test in terms of (1) satisfactory performance within specifica- \
tions and (2) reliable operation with respect to run in test data. i
Another feature of the DEA is to shut down an engine test when unreli-
able operation is detected prior to a catastrophic failure of the engine.
;
Key words: Automatic test system; Diesel Engine Analyzer.
176 1
i
1

The system was originally designed to conduct automatic tests on the fol-lowing types of engines.
1. Cummins VT-122. Fairbanks Morse 38D83. GM 6-71
i4. Packard V-12
I
5. Waukesha L1616
Figures 1-6 provide an overview of the system as installed.
Figure 1 is a diagram of the entire DEA area. The four test cells areplaced around the control area on three sides. Not shown are the cool-ing water towers and fuel storage facilities which are outside thebuildings near cell 2.
Figure 2 is a block diagram of the entire DEA system. The basic compu-ter equipment is connected directly to the control consoles which are in
turn connected through the junction box to the engine/dynamometer com-bination for a particular cell.
Figure 3 shows the insides of the engine junction box. The large box atthe top is a 24-well , 150°F reference junction for the thermocoupletemperature probes. The smaller box and heat sink device are a 40 ampsolid state contactor and rectifier for providing pulsed DC to load theeddy current dynamometer. The tank and piping at the bottom form a
pneumatic shut down system that sequences the engine to a minimum throt-tle minimum load condition with timed cool down in case of electricalpower failure.
Figure No. 4 shows the test console arrangement in the control roomwhile Figure No. 5 is an enlarged view of one of the test consoles. Thetest consoles are used primarily in the manual mode. The direct viewgauges across the top row display crankcase pressure, turbocharger pres-sure, exhaust back pressure, oil pressure, dyno water pressure, andwater pump pressure. Twenty-four separate temperatures can be read onthe digital read out at the left side of the console. Engine RPM is
shown both digitally and in analog form near the center of the console.Exhaust smoke opacity is measured by the device at the lower left sideof the panel. The two large round controls are for manual adjustmentsof speed and load. The remaining push button controls perform varioushousekeeping functions.
Figure 6 is the associated computer equipment. Rack No. 1 at the leftcontains the HP 2100S minicomputer, associated disc storage unit andpaper tape equipment. The rack at the right contains the calibrationrelay/line driver/line receiver equipment, low level mul tiplexer/A-Dsystem and the mul ti programmer. All of this equipment, except the cali-bration relay section are standard off-the-shelf Hewlett-Packard items.
Interconnection of the three main equipment locations is by means of
177

multiple twisted shielded pair lines with hermaphrodite (Elco varicon)multi -contact connectors. There are also some pressure tubes (PVC ornylon depending on pressures involved) which run from the Junction boxesto their associated control console.
As originally configured, cells 1 and 2 were equipped with eddy currentj
dynamometers while water brake dynamometers were installed in cells 3
and 4.
Operation of the equipment is possible in either the full automatic modeor in a manual mode. Each test cell function is entirely independent ofthe other three cells with one minor exception. Test area barometricpressure is provided for all cells by a pressure transducer in test cell
The preceding overview has, I hope, given you a small insight into theDEA system as it was originally constructed.
Now, after several years of operation, what have we learned about auto-matic testing of diesel engines, and where do we go from here?
First, and I'm sure foremost, we have learned that automatic testing,properly conducted, can be a cost effective way to test overhauled die-
sel engines. A study performed for the Long Beach Naval Shipyard in
October 1972 to determine the requirements for a diesel engine analysis
system reveals that during the years 1971 and 72, seven rebuilt enginessuffered catastrophic failure while on the shipyard engine test stands.
These were all engines of a type that are now tested on the DEA. It is
not possible to say positively that all of these failures would have
been detected and precluded by the DEA, but we do know that since the
DEA has been installed, there have been no cases of catastrophic fail-
ure while engines were being tested in the automatic mode. At least two'
engines have been saved from catastrophic failure. The total value of
saving thus realized from this one facet can only be estimated, but has
to be significant.
Now let me discuss some specific items that we think are significant.
Let me comment first about the automatic test scenario.
As originally designed, the system software program left little latitudefor the equipment operator to make decisions and minor modifications to
the test as it progressed. This type of program did not evolve by acci-\
dent. During the design stage, the LBNSY project technical monitor per-
sonnel were advised of the various scenarios that could be built into
the software. They preferred a system with only a minimum of operatorparticipation possible.
To complement this decision we chose a simple 8-hour test profile that
we felt would provide an adequate test that could be easily completed by
an engine that met the overhaul specifications. If during this test,
178

I
any of the approximately 40 parameters exceeded a specified bounds, thetest was automatically terminated and had to be restarted at the begin-ning after the indicated fix had been made.
In our test profile the engine was started and run at idle until certainkey temperatures had stabilized. The test then proceeded through a set
|
number of phases of increased speed and load until the full load condi-i tion was reached. The full load condition was maintained for a speci-
j
fied time after which the load was slowly decreased to zero, then theRPM was reduced to idle and the engine allowed to cool down. A "good"engine could normally complete the test without exceeding any of theestablished test parameters. This meant that the requirement to restarta failed test did not result in excessive delays in completing the en-gines required tests.
I
Subsequently a more detailed test procedure was superimposed by NAVSEC.
I
This included a much longer test period (28 hours) with several cyclesof load and speed variations both up and down. This resulted in combi-nations of load and RPM that were not originally contemplated, as wellas excursions of temperatures and pressures that were not within thepreviously established limits. As a result, we have encountered numer-
I
ous test interruptions for seemingly inconsequential reasons.
Although it is a simple matter to change a particular limit in the com-puter program, it is not an easy matter to assure a completely adequatetest using a patched up program which has been modified to fit a differ-ent test profile. More about this later when we get around to futureplans.
Some of the diagnostic aids that we included in our original test sce-nario have failed to live up to our expectations.
Instantaneous crankshaft angular velocity (ICAV) is one of the areaswhere we feel more work must be done. In this test we detect top deadcenter, then measure variations in rotational speed of the crankshaft as
the individual pistons progress through the various strokes. The testcan be performed either in the cranking mode or while the engine is
idling. Ideally the test can detect loss of compression in a particular
!
piston/cylinder pair or faulty fuel delivery to a particular cylinder orgroup of cylinders. These measurements appear to have considerablediagnostic potential but presently there are no set standards that canbe used to determine when an engine is "bad". We feel that this tech-nique can and should be further developed.
Smoke measurements have been a disappointment. Consider steady statesmoke. We had hoped to be able to measure total energy into the enginein the form of fuel and compare that with total energy out in the formof torque, heat, and unburned fuel (black carbon smoke). So far we have
i been unable to do this because the installed opacity meter cannot tell
the difference between black carbon smoke and blue smoke caused by burn-
179

i
ing oil in the exhaust system. This further complicates the problem be- I
cause oil smoke can show up at times that are not directly related toj
the engine performance at that particular instance. The location andcomplexity of the smoke meter stack unit makes it almost impossible tokeep the optical system free of the foreign matter. Naturally, thiscreates errors in the readings. We feel that steady state black smokemeasurements can contain significant information but so far we feel
there is a way to go to before we can reliably get this information in
an automatic test. Dynamic smoke measurements have also proven to be
disappointing. As stated before, oil deposits in the exhaust system|
tend to create smoke that is not directly related to the instantaneousoperating conditions within the engine.
A diagnostic phase was provided in the original test program. This pro-cedure could be called for when an engine failed to achieve rated horse-power. The diagnostic phase included a post test idling ICAV, a dynamiccrankcase pressure measurement and a print-out of all those parameterswhich were within 10% of their limits when the rated horsepower failureoccurred. Dissatisfaction with the current ICAV test seriously weakensthe diagnostic phase.
Other minor items such as an automated cooling system pressure test and
an automated rack and fuel cut off cylinder adjustment are in the pro-
cess of being eliminated. It was found that it was much simpler to do
these items manually than try to include them in the automatic test.
Long pressure tubes from the engine into the test console have also re-sulted in some problems. Delays can be created in important parameterslike oil pressure. Low pressures such as crankcase pressure (1-2 inchesof water) can be completely negated by a drop of oil in the line. Plas-tic pressure tubes are also subject to breakage.
So far I have only mentioned those items that we have found to be in
need of change. Let me now tell you about some of the things that wefound worked very successfully. The general manner in which the systemwas constructed has, we think, served well in keeping the system notonly functioning, but developing as well. As you may know, the DEA, as !
developed at SwRI, is a one-of-a-kind item. This required . that the con-j
struction technique lend itself to ease of maintenance and expectedmodification. To support this requirement we installed a large number
(20-25%) of spare cable runs between the three major locations (junction I
box, console and computer) affecting each test cell. All interconnect-ing lines for a particular cell were passed through a cross connectboard in the console (see Figure 7) so that they were readily available, f
To make maintenance of the system as simple as possible, we kept the
table of differences between the four cells at an absolute minimum. In
essence all four cells were fabricated identically. Since there were
two types of dynamometers to operate (eddy current and water brake), all|;
four cells were designed to be capable of operation with either type of
unit. We deviated from this practice only where unused high value itemsj
would have been included, but even then the mechanical layouts were the
180 l

same with the unneeded parts merely left out.
The same techniques were used in the computer program. Look-up tableswere used wherever possible to catalog test cell particulars. When a
test is initiated, the engine type and cell number are both entered.
The engine type selects the proper test parameters and limits while the
j
cell number selects the dynamometer type and establishes the correct1 dynamometer constants so that load can be read properly. This procedure
|
made it possible to test some engines in more than one particular cell.
This system of construction and programming greatly simplified the re-
cent conversion of the two water brake test cells to eddy current dyna-mometers. The mechanical modification was limited to adding the few re-quired high value parts (D/A converter in multi programmer, rectifier and
contactor in J-box), modifying the control console to accommodate the
additional LOAD control and removing a few grounds in the console logic.
I Equally simple changes in software were required. The look-up table for
these cells now references the eddy current subroutines, and the newdynamometer factors replace the old water brake factors.
Successful operation in a heavy industrial area is another area where I
j
feel we were successful. As everyone knows, in an industrial area youmust anticipate electrical noise problems. To counter this we used
twisted shielded pair wiring and filtered differential inputs for all
low level signals. We religiously kept track of our signal grounds, and
optically isolated our logic signals. To date we have had no problemsthat we could trace to electromagnetic or conducted interference. Thesystem has continued to operate for approximately four years with a
minimum of maintenance. Dirt, grease, diesel fuel, etc. are all items
that must continually be controlled though if successful operation is to
continue.
So much for past experiences, now to the "future plans" portion of the
presentation. This will be further subdivided into two portions: fu-
ture plans that are directly related to the analyzing of diesel engines
and future plans that relate only to the utilization of the DEA hardware.
First, as applies to analyzing diesel engines.i
i
We are currently in the midst of a major rework of the entire computer
program. Under this program, which we refer to as "fast restart", we
plan to revise the software to simplify and speed up the completion of a
given test. A major part of this rework involves the function of limit
setting. We currently have an upper and a lower limit on most para-
meters. If either of these are exceeded, the test is automaticallyhalted and must be started again from scratch. Under the new program
!we will still have an upper and a lower absolute limit, but within these
limits will be an upper and lower warning limit. When any parameter ex-
ceeds the warning limit, a flashing yellow light will be lighted on the
particular console and a flashing asterisk will identify the offending
181

limit on the CRT read out. The operator can then analyze the situation, i
He will have the option of making running adjustments, taking other ac-tion that seems appropriate, or just watching the particular parameter. !
We feel that this warning will help us to counter those simple problemswhich can be corrected before they can interrupt an otherwise satisfac- I
tory test. Things such as loose thermocouples, leaky pressure fittings,|
improperly set valves, etc.
The second major change in software will allow the immediate restart ofa test that has been halted for a non-debilitating reason. For example:when changing from one test phase to another, we have occasionally ex-perienced conditions where the speed and load combination resulted in
horsepower, pressure or temperature readings that were momentarily out- i
side the desired limits. Should a situation such as this occur in thefuture, the operator will be able to immediately resume the test wherethe interruption occurred and continue on through the run as soon as
certain key temperatures stabilize. We feel that with the lengthy tests,
specified by NAVSEC that a system such as this will greatly speed up
testing without endangering the engine or the quality of the test.
Another feature of our redesigned software will permit a more thoroughcalibration of the DEA system. Calibration so far has been carried outonly on the console gauges which are used primarily in manual operation.In the future a software change will allow calibration of the computerread values to be conducted simultaneously with the console gauges.
A fifth engine test cell is also on the horizon. This cell will be de-[
dicated exclusively to the testing of GM 149 series 16 cylinder enginej
subsystems. The cell will be equipped with a complete GM Detroit Diesel|
16V-149TI engine extensively modified by Stewart Stevenson to serve as a
1000 kw generator on the Navy FFG-7 series ships. The engine will be
used as a test bed for hot checking the various subsystems utilized on
this series equipment. The hardware used in this cell will be much the
same as the other four cells with one major exception. In this cell we|
will be equipped to measure air intake volume on each of the four turbo- ;
charger inputs. Also, on the Control Console we plan to read all pres-
sures on remote digital panel meters when in manual mode. We will not
run pressure tubes into the control room for the reasons previouslystated.
i
To handle the increase in memory requirements for this fifth cell (and
for some other requirements which I will mention in a minute) we are
also changing out the HP 2100S computer and replacing it with an HP 21MX
with a much larger memory capacity. In this same modernization program
we are also replacing the 2.5 M byte disc recording system with 4.9 M
byte device.
I
There are also future plans that apply to the DEA equipment but are not
concerned with testing diesel engines.
182

At the request of LBNSY a study was performed to see if it would be pos-sible and economically feasible to use the DEA computer equipment toconduct automated test after overhaul on devices other than diesel en-gines. Specifically, could the system be augmented to test multi-stageair compressors, sealed hydraulic transmissions, and cryogenic genera-tors. The study revealed that while testing all of these items was pos-sible with certain hardware additions to the computer, only the air com-pressor and cryogenic generator testing appeared to be economically
I
feasible. As a result of this study, the LBNSY has contracted to en-large the system to encompass the air compressor testing.
The manner in which the software was originally written (with maximumuse of look-up tables) lends itself well to this addition. Although theair compressor test will be different than a diesel engine test, the aircompressor cell will be generally treated as just another test cell withperiodic servicing by the computer. This cell will feature both manual
I and automatic operations just as the engine cells do. All parameterswill be available for display on digital meters on the console duringmanual operation and additionally on an associated CRT read-out duringautomatic operation.
I This concludes our look at where we are in the automatic testing of die-sel engines and other pieces of Navy gear. Before closing though, I
would be remiss if I did not say a few kind words about the people whohave operated the equipment over the past four years. Any system suchas this will not operate efficiently unless the people operating it be-lieve in it and want it to work. We have been very fortunate in thisrespect, and look forward to many more years of friendly cooperation.
ACKNOWLEDGEMENT
The author expresses his appreciation to Mr. R.B. Curtin and Mr. V.R.
Sturdivant of Southwest Research Institute for their contributions in
the preparation of this paper.
REFERENCES
1. Clark, John M., Jr., Hambright, Robert N., Curtin, Richard B., and
Sturdivant, Vernon R., "Marine Diesel Engine Analyzer (D.E.A.)". Pro-ceedings of the International Symposium on Automotive Technology and
Automation, Rome, Italy, 27 September 1976.
2. "Computerized Evaluation of Engine Overhaul Operation", Diesel andGas Turbine Progress , January 1977, pp. 10-11.
3. Sturdivant, Vernon R., Curtin, Richard B., and Hambright, Robert N.,"A Diesel Engine Analyzer", Instrumentation in Machinery ApplicationsSession, 23rd International Instrumentation Symposium, Las Vegas, Nevada,3 May 1977.
183

UTILITY ROOM CELL 3, 4
JUNCTIONBOX
TELETYPE
CELL 1
,T+UTILITY ROOM CELL
OIL RESERVOIR
(TYP 3 PLACES)
INERTIA BLOCK(TYP 4 PLACES)
DYNAMOMETER(TYP 4 PLACES)
JUNCTIONBOX
'JUNCTIONBOX
UTILITY
ROOMCELL 2
TRENCH(TYP 4 PLACES)
FIGURE 1 - THE DEA TEST FACILITY
18k

n
w uX
/— *\
u•
z
z ^3
CO
2oi- </>
Z Zoo
I
Z(5
z° x u
oZo- 06 Q^ <
o <
IV >>>CO
DISCEMO
CN 3
L.
CD
oo
<
CM
CD
J
185


187

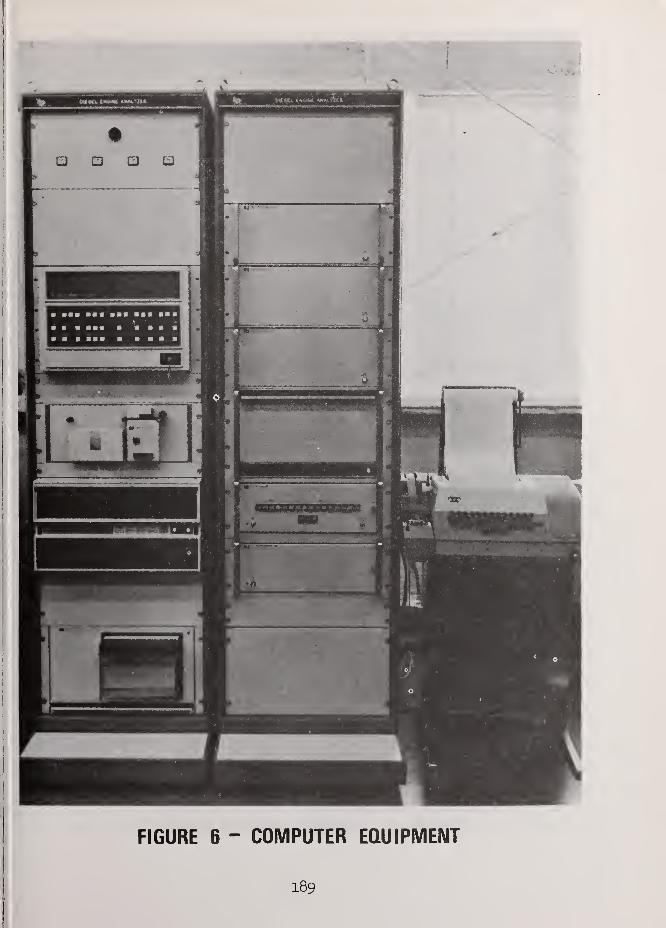
189


FIBER OPTICS FOR BEARING PERFORMANCE MONITORING
Gerald J. PhilipsDavid W. Taylor Naval Ship Research and Development Center
Annapolis LaboratoryAnnapolis, Maryland 21402
Rolling element bearings are used in rotating machinery to separatestationary and rotating components. Commercial and military organiza-tions have sought to improve the reliability of such machinery throughthe detection and diagnosis of bearing problems and hopefully throughthe prognosis of impending bearing failures. Traditional methods ofbearing performance monitoring employ accelerometers mounted somewhereon the machine's external surface. The fiber optic method employsproximity sensors that are mounted in the bearing housing, as shown infigure 1. Data retrieved by such fiber optic sensors are not con-founded by the resonances and vibrations of the surrounding structure.The signal obtained directly from the bearing is found to be relative-ly simple and easy to analyze. For example, an unfiltered bearing sig-nal is shown in figure 2, wherein pattern recognition of the oscillo-scope trace indicates the bearing contains a defective ball. Each waverepresents the deflection of the bearing outer race as a ball passedby the fiber optic sensor. Discontinuities of the otherwise smoothwaveform are clustered about one wave or ball and repeat every eighthwave (there are eight balls in the bearing) . The unfiltered signal ofan 11-ball bearing is shown in the top half of figure 3. Discontinu-ities were found at each eleventh wave, which again is indicative of a
defective ball. When viewing the signal through a 1,000 - 10,000 Hzwindow, the defect is more clearly discernible, as can be seen in the
bottom portion of the figure.
Through pattern recognition it is possible to identify the defect lo-
cation, whether it be on a ball, the inner race, or the outer race.
However, it is usually academic where a defect is and more important to
accurately detect the existence of the defect and predict its effect onthe remaining life of the bearing. Towards that end, the pk/rms ratioof the filtered signal can be measured to indicate the relative magni-tude of the defect. Figure 4 shows the signals from three bearings:one good, one marginal, and one obviously bad. One problem currentlyunder study is the establishment of a fiber-optic pass/fail criteriafor bearings. That will be the pk/rms ratio at which a bearing shouldbe removed from service.
Obtaining a measure of the functional integrity of bearings (pk/rms)
is but one of the uses of the fiber optic sensors. Band-pass filteringin the low frequency end provides important information regarding the
191

mechanical performance of the bearings and the machines in which theyare installed. As applied to a typical electric motor, two proximityprobes are used to measure the vibration on the outer races of each ofthe two ball bearings and another sensor is used to measure the rota-tional speed of the motor's shaft. Two of the principal components ofthe signal produced by the bearing probes are the rate of rotation ofthe shaft and the frequency at which balls in the bearing pass by theprobe. A measure of ball bearing operation is the bearing speed ratiowhich is the ratio of the ball passing frequency to the shaft rotationfrequency. The value of the bearing speed ratio indicates the amountof axial load on the bearing, the extent to which the bearing is in-stalled too loosely or too tightly within the bearing housing, as wellas the condition of the lubricant. Speed ratio limits such as shownin figure 5 based on normal variations of operating loads and clear-ances, can be calculated and used as an overhaul criteria. Too muchgrease is just as bad as too little grease in a bearing. Figure 6illustrates that extreme deviations from calculated speed ratio perfor-mance is encountered for improperly lubricated bearings.
When the rotor of a machine is not perfectly balanced, it will producevibrations at its frequency of rotation. These vibrations are detectedby the proximity sensors. The angular position of the unbalancedweight on the rotor is determined by comparing the phase of the signalwith that from the shaft sensor. This can be done simply on an os-cilloscope screen as illustrated in figure 7. By setting the shafttiming pulse to exactly six screen divisions, the peak amplitude of theunbalance signal can be read directly from the oscilloscope. Thismethod has been found to be of value for in-place balancing of rotatingequipment. Compared to a standard method utilizing externally mountedaccelerometers , the fiber optic method is faster and can result in a
lower residual unbalance level.
Traditional bearing performance monitoring methods normally employ ex-ternally mounted sensors. These sensors are fastened to the machinein various ways such as with epoxy, dental cement, magnets, or handpressure. The fiber optic method sacrifices ease of installation butdelivers much more useful information to the bearing engineer. Someapplications of the fiber optic method are in new bearing inspection,machinery balancing, the detection of ball skidding, bearing loads,
and shaft and housing fits. Therefore, with the fiber optic method it
is not only possible to determine the condition of bearing surfaces,but also to determine if bearings have been properly installed inmachines and therefore given the best chance to survive to theirfatigue lives.
192!

FIBER OPTIC PROBE NUT
Figure 1.
193


DC-10,000 Hz
1,000-10,000 Hz
Figure 3 - Effect of Filtering Illustrated
195

Good BearingPk/rms =1.2
Rejected BearingPk/rms =1.6
Rejected BearingPk/rms =3.0
Figure 4 - Filtered Signals from Three Bearings
196

3.12
THRUST, LBS
Figure 5 - Speed Ratio Overhaul Criteria
197
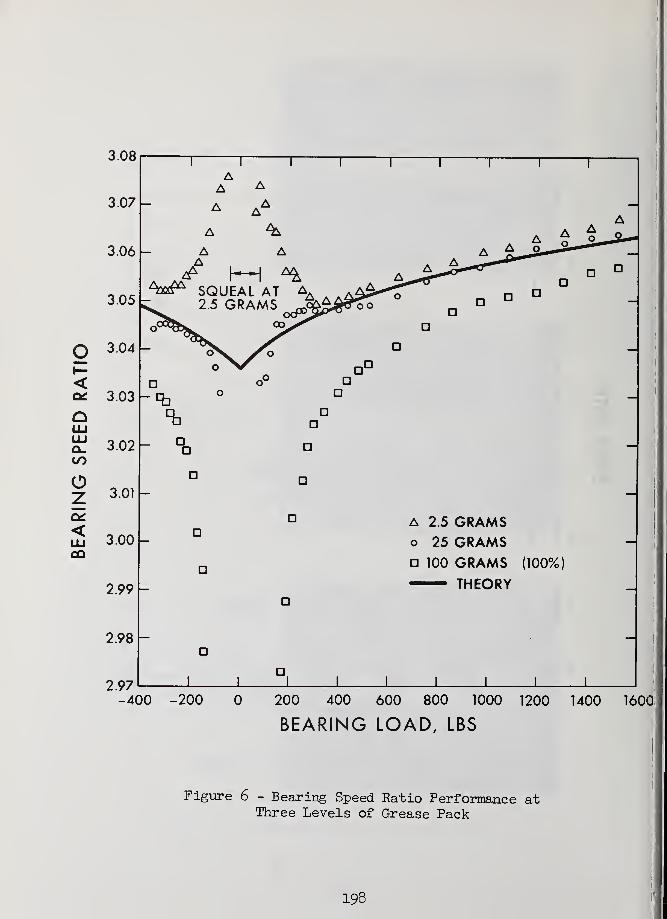
<
CL.
to
oon<LUCO
3.08
3.07
3.06
3.05
3.04
3.03
3.02
3.01
3.00
2.99
2.98
2.97
_
A 2.5 GRAMSo 25 GRAMS
100 GRAMS (100%— THEORY
1-400 -200 0 200 400 600 800 1000 1200 1400 1600
BEARING LOAD, LBS
Figure 6 - Bearing Speed Ratio Performance atThree Levels of Grease Pack
198

199


SESSION IV
INDUSTRIAL APPLICATIONS
Chairman: Robert M. Whittier
Endevco Corporation
Co-Chairman: Robert Leon
Franklin Institute Research Labs

I
I
I
I

STATISTICAL TECHNIQUES FOR AUTOMATING THE DETECTION OF
ANOMALOUS PERFORMANCE IN ROTATING MACHINERY
K. R. PietyOak Ridge National LaboratoryOak Ridge, Tennessee 37830
T. E. MagetteNuclear Engineering Department
University of TennesseeKnoxville, Tennessee 37919
Abstract
We have assessed the level of technology utilized in automated systemsthat monitor industrial rotating equipment and the potential of alter-native surveillance methods. We conclude that changes in surveillancemethodology would upgrade ongoing programs and yet still be practicalfor implementation. We formulated an improved anomaly recognitionmethodology and implemented these methods on a minicomputer system.
The effectiveness of our monitoring system was evaluated in laboratorytests on a small rotor assembly, using vibrational signals from bothdisplacement probes and accelerometers. Time and frequency domaindescriptors are selected to compose an overall signature that charac-terizes the monitored equipment. Limits for normal operation of the
rotor assembly are established automatically during an initial learningperiod. Thereafter, anomaly detection is accomplished by applying anapproximate statistical test to each signature descriptor. As demon-strated over months of testing, this monitoring system is capable of
detecting anomalous conditions while exhibiting a false alarm rate below0.5%.
Key words: Automated surveillance; rotating machinery monitoring;statistical detection algorithm; vibrational signatures.
Introduction
Scope of the work : The purpose of this work is the demonstration of
surveillance techniques that can extend the performance capabilities of
automated systems for monitoring industrial rotating equipment. Inpreparation for this work we have assessed the effectiveness of ongoingmonitoring programs and the potential improvements offered by alterna-tive programs. Based on our evaluation of the merits and deficienciesin existing and proposed surveillance systems, we formulated an improved
203

anomaly recognition methodology. The monitoring system implemented andtested at ORNL offers improved monitoring performance, utilizing methodthat are practical for even large industrial applications.
Background : The practice of monitoring gross vibrational levels as anindication of machinery health began more than 150 years ago. However,it was not until 1939 that vibration sensors and rudimentary signalanalysis techniques enabled the compilation of empirical vibrationalseverity criteria (1-3) . Only in the past 25 years have advancementsin data processing techniques and computer hardware allowed machineryhealth to be evaluated using signatures derived from the detailed structure of vibrational signals (4,5).
Although the advantages of signature analysis techniques are widelyacknowledged, the demands such analytical methods place on plant per-sonnel limit the use of such techniques for general surveillance tasks
(5,6). Computer automation of these monitoring requirements alleviatesthis drawback and allows maintenance personnel to direct their effortstowards equipment most in need of attention. Additionally, a computer-ized surveillance system should provide sufficient sensitivity to giveearly warning of incipient failures, thus enhancing diagnostic capabilities and allowing better scheduling of maintenance. However, whilemonitoring of machinery to detect excessive vibration is a well-established practice, a best approach for automating such monitoringactivities has not gained general acceptance.
Limitations of monitoring systems : There are certain drawbacks associ-
ated with all systems presently used for on-line surveillance of rotat-
ing equipment. The most basic of such systems are those which derive a
set of parameters characterizing the vibration signal (such as its peak
to-peak amplitude, RMS power, or power at the rotational frequency) for
comparison with absolute limits (7-9). To set such limits one must
resort to a vibration severity chart, perform analytical calculations
for the equipment to be monitored, or accumulate the necessary informa-
tion from testing. Since fixed limits must encompass the "worst-case"
conditions over the entire range of normal operations, sensitivity to
anomalous performance at any given operational state is reduced (9,10).
Another disadvantage frequently associated with this approach is a lack
of information on which to base diagnostic decisions (9,11) once an
anomaly has been detected.
To compensate for this deficiency some monitoring systems add trending
capabilities or utilize the detail available with complete spectralanalysis (12-16) . Unfortunately, due to the storage limitations whichexist in systems monitoring several hundred data channels, trending the
entire power spectrum is typically not practical. The storage problems
associated with maintaining full spectral detail are further compoundedif baseline signatures and limiting criteria are to be saved as a func-
tion of operational conditions. A common compromise is to trend only
20k
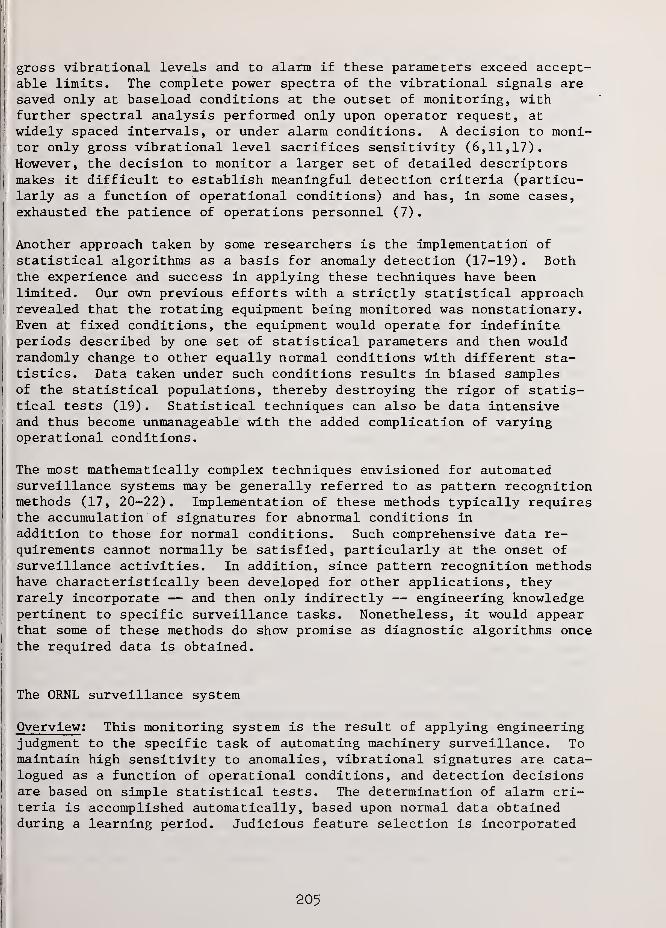
gross vibrational levels and to alarm if these parameters exceed accept-able limits. The complete power spectra of the vibrational signals aresaved only at baseload conditions at the outset of monitoring, withfurther spectral analysis performed only upon operator request, at
widely spaced intervals, or under alarm conditions. A decision to moni-tor only gross vibrational level sacrifices sensitivity (6,11,17).
1 However, the decision to monitor a larger set of detailed descriptors
J
makes it difficult to establish meaningful detection criteria (particu-larly as a function of operational conditions) and has, in some cases,exhausted the patience of operations personnel (7)
.
Another approach taken by some researchers is the implementation of
statistical algorithms as a basis for anomaly detection (17-19) . Boththe experience and success in applying these techniques have beenlimited. Our own previous efforts with a strictly statistical approach
Irevealed that the rotating equipment being monitored was nonstationary.Even at fixed conditions, the equipment would operate for indefiniteperiods described by one set of statistical parameters and then wouldrandomly change to other equally normal conditions with different sta-tistics. Data taken under such conditions results in biased samplesof the statistical populations, thereby destroying the rigor of statis-tical tests (19) . Statistical techniques can also be data intensiveand thus become unmanageable with the added complication of varyingoperational conditions.
The most mathematically complex techniques envisioned for automatedsurveillance systems may be generally referred to as pattern recognitionmethods (17, 20-22). Implementation of these methods typically requiresthe accumulation of signatures for abnormal conditions in
addition to those for normal conditions. Such comprehensive data re-quirements cannot normally be satisfied, particularly at the onset of
surveillance activities. In addition, since pattern recognition methodshave characteristically been developed for other applications, theyrarely incorporate — and then only indirectly — engineering knowledgepertinent to specific surveillance tasks. Nonetheless, it would appearthat some of these methods do show promise as diagnostic algorithms oncethe required data is obtained.
The ORNL surveillance system
Overview : This monitoring system is the result of applying engineeringjudgment to the specific task of automating machinery surveillance. Tomaintain high sensitivity to anomalies, vibrational signatures are cata-logued as a function of operational conditions, and detection decisionsare based on simple statistical tests. The determination of alarm cri-teria is accomplished automatically, based upon normal data obtainedduring a learning period. Judicious feature selection is incorporated
205

to reduce storage requirements; however, data logging adequate fordiagnostic investigations is provided. False alarms are reduced byimplementing processing logic that compensates for normal data varia-tions .
Feature selection : A vibration signature is obtained by selecting onlya subset of the various signal descriptors that might be derived fromthe measured data. This selection process introduces available engi-neering knowledge related to individual equipment, critical fault events,or the signal character into the monitoring system. For example, the
power in the fifth order (five times the rotational speed) would logi-cally be included as a feature describing a fan with five blades. Obvi-ously, the specific set of parameters comprising a signature will varyfor dissimilar applications. Discarding or combining redundant descrip-tors should result in a reduced set of descriptors which enhance theinformation content of the measured data. For our test purposes wechose 48 parameters per signal which define the phase, size, and shapeof the time-averaged waveform, the total power of the signal, the har-monic and nonharmonic power, the power and phase of the first threeorders of rotation, the spectrum-weighted order, and the average har-monic and nonharmonic order. A detailed explanation of these descrip-tors is given in the appendix. Although these features are not proposedas an optimum set for other monitoring applications, many descriptorsin widespread use are included, and the ability to compare the perform-ance of descriptors with different levels of detail is provided.
Reference catalogue of baseline data : Baseline signatures are cata-logued as a function of operational conditions. This procedure necessi-tates access to variables that define the operational state, for example,speed, load, or flow. Discrete intervals are chosen to span the fullrange available to controlling variables; once specified, the intervalstructure determines the maximum number of entries required in the ref-erence catalogue. Since it has been demonstrated that variations in
speed and load can introduce changes in vibration exceeding those asso-ciated with anomalies (10) , compensation for such changes stimulated bycontrol variables is necessary for maintaining sensitivity for anomalydetection and for reducing false alarms. Although most investigationssupport this conclusion (7-10), few monitoring systems implement capa-bilities for handling this complication. We chose the direct catalogueing approach after reviewing various mathematical alternatives and
experimenting with techniques based on principal components analysis and
regression analysis.
Establishing limiting criteria : Baseline signatures and their normalinterval of variation are established automatically by observing equip-ment operation during an initial learning period. During this period,the equipment must be operated at or near all conditions for whichmonitoring capability will be needed. The learning period should be of
sufficient duration to include a representative sample of normal varia-tions. This period was 2-4 days in our investigations. The adequacy of
206

learning appears to be more closely related to elapsed clock time than
to the number of signatures measured, because of the biased samplingpreviously cited (19). Several checks are available to ascertain if the
learning period has been adequate. These include counters which con-servatively estimate the proportion of the learning signatures considerednormal and the number of learning signatures since the last abnormalclassification, as well as the ability to switch to the monitoring modefor a defined period during which a detailed monitoring summary is auto-matically obtained. If necessary, additional learning can be initiatedat any time. Since the system detects deviations from whatever base-lines are established, sensitivity to further degradation is maintainedwhether or not equipment was operating normally during the learningperiod.
Detection logic : During monitoring, each vibration signature is
measured under steady operating conditions and tested to determine if
its deviations from the baseline signatures are statistically signifi-cant. While the application of classical statistics is invalidated bybiased sampling and by lumping differing operations into coarse inter-vals, the deviations calculated in approximate standard deviation unitsdo provide a quantitative measure of problem severity. Approximatemethods of calculating signature deviations, although lacking in mathe-matical elegance, are incorporated because they have proven to reducethe incidence of false alarms.
During learning, the maximum and minimum values encountered for everyfeature are stored for each operational interval. When a signature at
a given operational state is tested, the extreme values normal to thatoperational interval and those values from its nearest neighbors arecombined to obtain a smeared interval that encloses all extremes. Fromthis interval, a pseudo mean, m, and a pseudo standard deviation, a,
are calculated as follows:
The absolute deviations calculated using these quantities are comparedagainst a confidence limit which decreases from C + 3 to C (an inputparameter) as the number of measurements, M, upon which m and a arebased, increases from 0 to 500:
mMax + Min
2
aMax - Min
6
207

Statistical intuition and experience indicate that a value of 0^7 is
most appropriate. For industrial surveillance applications, testing thegross vibration levels against established severity criteria (1-4) is al,
recommended. This additional detection capability would provide limitedprotection during learning when no other performance monitoring is inforce and would inherently set an upper limit on the statisticallyderived criteria.
Comprehensive data logging for diagnosis ; No automatic diagnostic logicis implemented in this system. However, the detection of anomalousevents does automatically initiate procedures that log data to assist in
diagnosis. If a signature is encountered that exceeds normal bounds, ananomaly signature catalogue is begun for all signals from the suspectmachine. The anomaly catalogue allows detailed comparison between data
accumulated following the suspect event with that in the baseline refer-ence catalogue obtained during learning. Additionally, a detectionsummary which tallies suspect events for each signature component andcomputes the average deviation is collected and available on request.Also upon demand, a variety of visual displays from standard signal pro-cessing algorithms (orbits and detailed power spectra) can be obtained,although data from these analysis capabilities are not automaticallyretained. It is expected that the data collected for diagnostic pur-poses will allow the development of algorithms to diagnose the mostprobable faults.
Results
Software implementation : The surveillance software has been implementedon a Digital Equipment Corp., PDP 11/34 minicomputer with 28K words of
memory. Mass storage capability is provided by two disks, each with a
1.2M word capacity. All programs are written in FORTRAN except for the
peripheral handler routines that require assembly language.
A small portion of the disk storage is required for the software system;
the remaining portion, ^2M words, is available for data storage. The
burden of the data storage is associated with cataloguing baseline data.
The total storage requirement, R, for this reference catalogue is given
by
M Si
R = 4 E °i £ % >
1=1 j=i j
where M is the number of machines to be monitored; 0-^, the number of
lumped operational states allowed for the ith machine; S-^, the number of
sensors on the ith machine; and Djj , the number of descriptors used to
describe the information from the jth sensor on the ith machine.
208

I
The mass storage requirements for the monitoring system are withinreason for even large-scale industrial applications. Assume, forexample, that one desired to monitor 100 machines, each equipped witheight sensors. An analysis that assigns 20 lumped operational statesto each machine and characterizes each signal with 25 descriptors would
j
require 1.6M words of storage. This allows one to describe each piece1 of equipment with 200 descriptors and still reserve some storage area
j
for logging diagnostic data.
Evaluation of monitoring system : A laboratory evaluation of the moni-toring software has been accomplished using a small rotor assemblydriven by a fractional horsepower motor.* Three displacement probesand two accelerometers are installed on the rotor as shown in Fig. 1.
One probe ("keyphasor") provides a tach signal and, through supplemen-tary electronics, generates a rotationally synchronized sampling pulse
Ito trigger the analog-to-digital converter. Two other probes, placedat 90° to each other, measure the radial vibration of the shaft. Inaddition, two accelerometers are installed on the inboard bearinghousing to measure the orthogonal components of radial vibration. Inour tests, two signatures describing rotor operation are actually cal-
|
culated, one for the displacement probes and the other for the acceler-ometers. Each signature is composed from descriptors for both thehorizontal and vertical directions.
The rotor can attain speeds from 0 to 200 revolutions per second (rps)
;
this was the only control variable altered during our tests. Lumpedoperational states were defined in 1-rps intervals. This speed resolu-tion was a convenient choice which offered reasonable detail.
In our previous work (19) , the monitoring system was unable to maintaina low false alarm rate over extended periods of testing using the limit-ing criteria which were automatically established. This difficulty wasovercome by modifying the detection logic and by extending the learningperiod. We have, in fact, demonstrated that a learning file composedin a few days can be used to monitor normal operation for periods of
several months without false alarms becoming a difficulty.
The detection capability of the monitoring system was investigated bypurposely introducing fault conditions into the test setup. The fourfault types chosen were shaft rub, imbalance, mechanical looseness, andmisalignments. Each anomaly type could be introduced in varyingdegrees of severity. Some faults introduced no discernible perturbationto the vibration signals; however, detection was always possible as theseverity level was increased. After the anomalous conditions associatedwith fault testing were removed, the return to normal operation wasverified by the monitoring system. Examples of the type of diagnostic
Bently Nevada Corp., Minden, Nevada, Model RK-3.
209

data available from the system are presented as the individual testsare described.
Imbalance test : The balance of the rotor was altered by the addition ofa 1.52-g mass 3.32 cm from the shaft centerline (translating to animbalance force of 0.238 Nt m at 60 rps) . The change in the vibrationwas readily detected by both horizontal and vertical displacement probes,as illustrated by the detection summary shown in Table 1. Any signaturefor which some descriptor was out of normal bounds is considered sus-pect. This was the case for all 1000 comparison signatures of each typecomprising this summary. An interesting detail in this test is that theweight added actually improved the balance of the rotor. This can beseen in both Fig. 2, which shows the time-averaged orbit for both base-line and imbalance conditions, and in the detection summary, which showsa reduction (negative deviation) in the signal descriptors associatedwith the amplitude of the vibration. A change in vibrational amplitudeat the first order is well established as the primary indication of
changes in balance. However, as noted in Table 1, this descriptor wasaffected less dramatically than others. This results from the asymmet-ric domain (always positive) of power descriptors which reduces theirstatistical sensitivity to reductions in their magnitude. This can becorrected by using the log of their magnitudes. The phase of the firstorder does show significant variations throughout the entire speed
range, as demonstrated in Fig. 3. The peak displacement was also sig-nificantly altered by the imbalance; Fig. 4 contrasts normal and anom-alous variations for the peak displacement descriptor as a function of
speed.
Misalignment test : The alignment of the rotor can be altered by placing|
shims under the bearing pedestals. The data shown resulted from raisingj
one side of the inboard bearing pedestal by 1.32 mm, thus offsetting the
centerlines of the motor and rotor shafts. This misalignment was
readily detected, as indicated by most of the descriptors shown in
Table 2. Unexpectedly, all descriptors except nonharmonic power showed
a decrease in their magnitudes. Figure 5 shows this effect in detailfor the power at the second order and is in contrast to Fig. 6 whichshows the increase in the nonharmonic power.
f
The decrease in overall and harmonic vibration levels was not, however,
an indication that the damage potential had been reduced, since the
coupling to the motor destructively failed within 12 hours. The promi-nent peak in the plot of nonharmonic power, Fig. 6, resulted from datataken just prior to the destruction of the coupling. A reduction in
vibration levels was not common to all misalignment tests; nonetheless,this case should serve to caution system designers that would ignore
the importance of such effects.
Mechanical looseness test : This test was accomplished by loosening the
screws that fasten the inboard bearing pedestal to the base plate. In
210I

this case, the accelerometers had a greater sensitivity to the abnormal-ity than did the proximity probes. The rather pronounced effect on the •
accelerometer signatures, tabulated in the detection summary given in
Table 3, most likely resulted from altering the mechanical impedance at
the bearing pedestal (23) . All descriptors influenced by the harmoniccontent of the signal were strongly affected. A plot of the extremevalues experienced under both normal and loose conditions for the powerat the second order as a function of speed is shown in Fig. 7.
Partial shaft rub test : In our tests, the presence of shaft rubs wasindicated most strongly by the accelerometer signals. The data shownin Table 4 are from a partial shaft rub, where the rub screw (see
Fig. 1) was allowed to lightly bounce against the shaft. This anomalyemphasizes again the importance of choosing descriptors which measurenonharmonic signal power (11) . As seen from the detection summary(Table 4) , the nonharmonic power is the only parameter which dependablyindicates the presence of the rub. Detailed power spectra for theaccelerometer under normal and rub conditions are shown in Figs. 8 and
9, respectively. The noise floor of the rub spectrum is raised over a
rather broad order interval; this trait has been characteristic of rubanomalies we tested.
Summary and recommendations
The monitoring system automatically established limiting criteria duringan initial learning period of a few days; subsequently, while monitoringthe test rotor during several months of normal operation, the systemexperienced a false alarm rate of ^0.5%. At the same time, the monitor-ing system successfully detected all fault types introduced into thetest setup. Tests on "real-world" equipment are needed to provide finalverification of the monitoring techniques. The incremental expenserequired to implement hardware for this purpose would be small in anindustrial plant where sensors, electronics, and cabling already existfor vibration monitoring. Furthermore, the data required to make thismonitoring approach effective would not hinder normal industrial opera-tions.
There are areas that could benefit from additional investigation in the
laboratory environment. A comparison of the relative values of alter-native descriptors under given fault conditions would be worthwhile.This should be pursued in conjunction with extending the set of fault
types available, e.g., bearing problems. Other tests should examinethe effects of using fewer (more coarse) intervals to define the lumped
operational states. Finally, techniques to diagnose the most probablefault should be developed by drawing upon the extensive data automati-cally logged by the monitoring system.
211

Appendix
In Table A-l is a list of the descriptors which we chose to include inour vibration signatures. Many of these descriptors are commonly usedand require no additional explanation. However, the following discus-sion and equations should serve to clarify the descriptors we used.
The waveform from a vibration sensor attached to a rotating machine hasa repetitive component. Regardless of magnitude of this component, itspresence can be enhanced by time-averaging the waveform. This processrequires that the raw signal be sampled at some integer multiple of thefrequency of rotation, fQ . These sampled values, X(iAt) , are thenaveraged using the following formula
NREVX. = —~ £ X(iAt + nT) (i = 0, 1, 2, ... NPTS-1) (1)
n=l
where T is the period of rotation
T = NPTS • At = y~ (2)
o
This time-averaging technique is equivalent to applying a comb filter to
the original signal which passes only the fundamental frequency and its
harmonics. The time averaged waveforms from two sensors at 90° to eachother can be used to obtain average orbital plots which describe themotion of the shaft centerline at the monitored position. _ The "NPTS"values (usually 30) that describe the averaged waveform, X., are corre-lated with the averaged waveform obtained initially as a baseline, XB_^,
to derive three additional quantities. The shape factor is the maximumvalue obtained for the normalized correlation function, H(J) , which is
defined by
NPTS _H(J) = i—1 f T _ f\ 1 O \ fi\.
"NPTS 0 NPTS „ i/2
3^2 V x2
_i=lei i=l \
(J = 0, 1, 2, NPTS-1) (3)
Values for Xi+j beyond XjjpTS are obtained by repeating the original
waveform. The point J = L where H(J) is a maximum also defines the lag
212

value, LAG, and the size factor, SZF, according to the following expres-sions:
/_360\.
\NPTSy 'LAG = L * —- ; (4)
NPTS
E X.+L
• XB.
SZF—NPTs : •(5)
E ™li=l
When analyzing the vibrational signals from rotating machinery, order-domain analysis (instead of the more familiar frequency-domain) simpli-fies interpretation of results, especially when variable speed operationexists. The basic relationship that allows conversion between the twodomains is
f- , (6)
o
where f is the fundamental rotational frequency.
Integral orders (Q = 1, 2, 3, etc.) occur at harmonics of the runningspeed. If the vibrational signal is analyzed for NREV revolutions, theminimum order resolution achievable is
The power at any order, Q^, will be denoted by G(Q^) , where Q. = iAQ,
i = 1, NOC (number of orders calculated).
Thus the total power in the vibrational signal up to some desired order,
Qp, is obtained by summing
KTPOW = £ G (Q.s) » (8)
1=11
213

where
The harmonic power in the signal can be obtained by summing the powerspectrum estimates at integral orders:
NHPOW = G (m) » ( 10 )
m=l
where N is the largest integer for which < Q^.
The nonharmonic power is the difference of these two quantities
NHPOW = TPOW - HPOW (11)
When combining power estimates over an order interval, another param-eter of interest is the power-weighted average order. This parameterprovides an indication of the order at which the power in the intervalis concentrated. This is given by
ATO =
-ll/2
E Q- G(Q.)
i=l
i=l
(12)
Similarly the average harmonic order is given by
N,1/2
AHO =
E m G(m)
m=lN
E G(m)
m=l
(13)
21k

and the average nonharmonic order is given by
ANHO = i=i
Nnl/2
E m G (m)m=l
E 6(Q )
i=l1
N- £ G(m)
m=l
(14)
All of the parameters defined above can be calculated from the timedomain signal directly without the need for order domain transforma-tions. The total power can be obtained by integrating the squared timesignal:
TPOW = X CO dt ; (15)
NDAT _ k^ " NDAT .2 *i * £ G«i>
•
1=1 1=1(16)
The total harmonic power can be obtained by integrating the time
averaged waveform
NPTS _2N
HP0W " npts £ *i " £1=1 1=1G(m) (17)
The sums of the squared orders, weighted by their power in Eqs. (12)-
(14) , are equal to integrating the square of the derivative of the timesignal and the time-averaged signals, respectively:
Eq± G«y =I / [
*' (t)]2 dt (18)
Eq? g(q.) NDAT
NDAT /X .- X. /E 1 ~ J (At) ;
i=lAt
(19)
215

£m G(m)NPTS
(At) (20)
References
1. M. P. Blake, "New Vibration Standards for Maintenance," HydrocarbonProcessing and Petroleum Refiner, January 1964, pp. 111-114.
2. R. L. Baxter and D. L. Bernhard, "Vibration Tolerances forIndustry," ASME paper 67-PEM-14 for meeting April 10-12, 1967.
3. C. Jackson, "Vibration Measurement on Turbomachinery , " Chem. Engr.Progress, V68, N3, March 1972, pp. 60-65.
4. C. Jackson, "A Practical Vibration Primer — Parts 1-8," Hydro-carbon Processing, April 1975-April 1978.
5. J. S. Mitchell, "Vibration Analysis — Its Evolution and Use inMachinery Health Monitoring," Society of Environmental EngineersSymposium on Machine Health Monitoring, Imperial College, London,England, September 1975.
6. V. R. Dodd, "Spectral Applications for Petrochemical Plants,"Engineering Foundation Conf. on Applications of New SignatureAnalysis Technology, July 1977.
7. Performance Monitoring and AIDS Seminar/Workshop, AERO Data, Inc.
,
Washington, DC, September 20-24, 1976.
8. Bently-Nevada Machinery Protection Seminar, Cincinnati, Ohio,
May 17-18, 1978.
9. H. P. Koehler, "Vibration Monitoring: Pumpset Reliability at
Pickering GS," Ontario Hydro Report No. 574-11-K, February 1974.
10. M. M. Gupta and P. W. Davall, "Detection and Diagnosis of IncipientFailures in Cyclic Machines," University of Saskatchewan,Saskatoon, Canadian Defense Research Board Grant 9781-04, March 31,
11. E. Makay and 0. Szamody, "Summary of Feed Pump Outages," EPRI-FP-
754, April 1978.
12. R. James, B. Reber, B. Baird, and W. Neal, "Instrumentation for
Predictive Maintenance Monitoring," Mechanical Failure PreventionGroup Proceedings, 22nd meeting, April 23-25, 1975, pp. 114-127.
1976.
216
13. D. S. Wilson and J. L. Frarey, "Automated Machinery Surveillanceand Diagnostics," Progress in Nuclear Energy , VI, Pergamon Press,
pp. 723-733 (1977).
14. "The ICEMS Story — The U.S. Navy Inflight Engine ConditionMonitoring System as Applied to the A7E Aircraft and the TF41-A-2Engine," Detroit Diesel Allison report EDR-8472, April 30, 1975.
15. J. R. Passalacqua, "Description of an Automatic Gas Turbine TRENDSDiagnostic System," ASME Gas Turbine Conf., March 1975.
16. Spectral Dynamics Machinery Vibration Seminar and Course Notes.
17. D. R. Houser and M. Drosjack, "Vibration Signal AnalysisTechniques," USAAMRDL Technical Report No. 73-101, December 1973.
18. R. P. Wallace and W. L. McCarthy, "VIDEC Ship Propulsion SystemPerformance Monitor," Mechanical Failure Prevention GroupProceedings, 22nd meeting, April 23-25, 1975, pp. 221-257.
19. K. R. Piety, "Statistical Algorithm for Automated SignatureAnalysis of Power Spectral Density Data," Progress in NuclearEnergy , V 1, Pergamon Press, pp. 781-802 (1977).
20. E. Cortine, H. L. Engel, and D. K. Scott, "Pattern RecognitionTechniques Applied to Diagnostics," Society of Automotive Engr.
,
Mid-Year Meeting, Detroit, Michigan, May 1970.
21. L. F. Pau, "Adaptive On-Line Failure Diagnosis and PredictivePattern Recognition," Second International J. Conf. PatternRecognition, February 1974.
22. H. E. Hunter, "Demonstration of the Use of ADAPT to DerivePredictive Maintenance Algorithms for KSC Central Heat Plant,"Report No. AVSD-0084-73-RR, AVC0 Systems Division for NASA,Wilmington, Mass., 01887, November 1972.
! 23. Richard Woods, "An Investigation into Vibration Criteria for
Rotary Machinery," Ph.D. Thesis, University of Aston, Birmingham,England, 1968.
Acknowledgment
Research sponsored by the Division of Reactor Research andTechnology, U.S. Department of Energy, under contract W-7405-eng-26 withthe Union Carbide Corporation.
217

4JCO
CU
PCU
CJ
c
HcO
-Q1•3
S-i
om •
CO
—
\
puX! J-l
OJ
4->
CO 000)
4-1 O4-1
CO
QJ O}-i \D
4J mcO o
bO cu
•H bOCO
cO
o 5-i
Oo 13r-H (U
QJ
cxCO
}_|
cO CO
ciX4J
CO ucu
a >o o•H4-1
oQJ4-1
qj
P
•
rH
CU
s
cu
54
d4-1
cO
13bO•H00
Pi
o•rl
4-1
co
5-1
cu
rHcu
oa<!
cu
i-i
34-1
CO
a•HCO
4-)
Pi
CU
aCU
oCO
rH
CD
•HP
>5-1 0)
o pco ^Picu
co
o13
>j-i cu
o pCD ^(3CU 4Jco p)
XI
oS3
5-1
OCO
pi
cu
co
>0)
p
oS3
>j-i cu
o pCD ^>PiCU 4JCO P)
XoS3
5-i
O4-J
fa*
•H
aCD
cu
P
ooooooooooooooooooooooo o o o o o o o o
oo
od
o oo o
oo
oCO
od
o o oo o o
<r o oONON
mon
o o o
ON CO <X> O m CO O vO m o00 vO 00 00 o CN rH O CO 00 OI—
1
1
CM1
rH1
rH rH rH^s
- ' rH1
> ' \«X
CM CO i—
1
rH rH rH O CO CM O rH rH Oo00
CM o ON o ON o oCMrH
1
orH
orH
1
OrH
1
os '
00 00 o orH
1
o o
v—
'
V—
'
* v_/
onON
O v©rH<r
\DrH<r
rH00
rH00
o omCO
ooCO
o rH o o
cu O u CD Uu CD 4-1 o a) CU
p) CU o 4J pi &4-1 CO G rH OCO rH <4H CO CO
Pi CO MH >bO > cu rH•H Q-i 0) CO
CO bO cd N CO 4-1
CO XI •H QJ ohJ CO CO PM H
5-1
OJ
&o&.
o•HPi
OS5-1
cO
PCI
5h
cu
op<
o•HPI
O05-1
cfl
XPi
oS3
54
OJ
XI5-1 Vi
CU OXl5-1 CJ
O •HPi
o•H iPi 5-1
5-i CO
QJ i XIXI 5-1 PI
!-i cO OO XI Pi
cu QJ cu
00 bO bOcO cO cO
5-1 5-i 5-1
QJ QJ QJ
« 5 4
rH CM CO
5-1
QJ
X)5-1
O
PCOP4
P PCO COP-4 PM
o m ono o- oo ** «tfrH
vOvtOiH H tH<r on
o voo CMo r-~
rH CM CO
UQJ
X)5-1
O
QJ
CO
CO
XIPh
ooo
CD
CU
5-1
P)4-1
cO
Pi
bO•rl
CD
4-1
OCU
Q,CO
P)CD
OS3
OOO
CO
QJ5-4
4-1
cO
PibO•HCO
UCJ
QJ
CO
p)CO
<4H
o
oS3
CU
•SrHCU
CD
CO
XI
so5-1mco
ao•rl
4JcO
•rl
>0)
P
218

CU
u34-1
co
a00•iH
CO
3o
cO
54
0)
rH<U
oo<:
CU
J-l
34-1
CO
•HCO
4JtJ
CU
scu
oCtJHcuCO
>u cu
o nCO n_x
3CU 4->
co 3o•
oS3
>5-4 CU
o oCO n^3CU 4->
oX!
•
oS3
>M CU
O Qco ^3CU 4Jco 3o
oS3
o53
O4-
1
(X•rl
5-i
CJ
CO
cu
QCU
5-(
34-1
CO
a•rl
CO
od
oo
od
oo
oo
oo
od
CO
ool
o o oodd
o o o o o o ci o H
00
COI
in O Noo
od
od
oo
od o
<d-
00CO
CT\in o
rH
CM
rHI
00O
mooo o mcm s—
' co
m o <rrH
VO CM vOon cn co<t co
O <r in cn rN in o rN cn o m00 rH vO 00 O 00 o CO 00 00 ll
iH rH rH rH rH rH rH iH 1 rH1 1 m CO
VO Cn rHcn rH mcn
in in IN vovO
IN IN rH IN ON in«vt rH CM 0O O
cn i—i cn
•
> rH IN rH IN ON m vO O IN H o5-1 CU
O a 00 CO CO cn CO CO ON o CO ON INCO rH rH rH rH CO N^ rH 1 CM3 1 1 cn 1
CU 4-1
CO 3O vO o cn o CO in ON CO rH O m rH o CO rH 00X! CM vO rH rH rH in CM rH rH O rH ON CM
• <r cn cn cn CO rH
ucu
O
5-1
CU•35-i
O
O•rl
5-) 3CJ o
% •H p5-i O 3 5-1
CU Pu 5J CO rH Cn] CO5-1 & CU i £1o 5-4 CO 54 O CJ -3 5-1 3 rH CM CO 5-1 5-1 5-1
CO 4J O cu CU a, •rl 5-1 cO O CU <U a)
0) CJ 4-» 3 3 O ,3 3 5-4 5-i 5-i -3 33 CO CJ rH O o CU 01 CU 5-1 54 5-i
rH M-l cO CO a. •rl i CU OJ CU X) *o O O oCO 4H > 3 5-1 00 00 00 u 5-i 54
> CU rH CO cO CO cO o O O cu <U CU
a. cu CO i ,3 5-1 5-i 5-i CO CO CO
bO CO N cO 4-1 5-1 3 CU CU CU p Q a cO cd cO
CO £1 •rH CU O cO O CO CO CO 43 .arJ CO CO P4 H Eti S3 5 Ph Ph Ph
CP
3•rl
rHCU
CO
cO
£>
0o54
MH
CO
3O•rl
4-1
CO
•rl
>CU
a
219

^—
^
>5-j CD
O PCD CO ^u
4J 3 CD uCO 4-1 co 3CD cd O4J
bo>-<
CO •H•
OCO GO jz;
CD
pi
0) oCO •Ho 4-1
o «drH (-1 >
CD 5-i CD,—
1
rH O Pcd a) CD ^—
'
o o•H o CD 4J
c <3 co 3Cfl o
X!O s
CL) CO os Cu
u5_l
o m<4-l ON ^—s.
o4J >
CD S-l CD
4J o pCO <D CO v-^
a) }_i pj4J 4-1 CD 4-1
o 4J co 3CO Cd o0) CD Cj >-<
!-i 00 00 •
9•H o
4J CO |303 5-1
3 4J00 TJ c•H CD CD(0 CD g
CDo CO CJ >o cct S-i CDo CD rH O PrH rC CO *w
4J CO
•H CD 4-1
>> u P co 3S-l CD o03 > X
OO
3 £3
S-l
o4-1
a,•H5-l
CJ
CO
CD
pCD
U34Jcd
•HCO
ON rH CO O rH o o On CM LO ro
on r-s r-- \£) o o CO rHrH rH rH rH V—
'
rH CN r-l*
—
y v—* * > *—
'
'
on o CO vO o o m CM rHCM o rH rH ON rH rH rH CO
CO CM CO rH CM rH
o o o
ON
o 00 rH 00 rH rH CO o o 00
o ON ON o m ON ON rH o <r ^v_x rH rH v—
'
rH LO C\lv_/ •w"
1 rH rH^-y ^> N—
/
o rH <f rH CO rH o r->. rHm CO rH CM rH <t LO OrH rH rH rH CO ON ON
oo
LO o o
CO On \£>
IT) rH v£>
CO -d- CM
OO
o oo o
C7N
ON
oo
o oo o
o o oo o o
o o o On CM OCM CO
vO O -3- m ON o o o m o o00
1
On1
001
oo <rCM
O ov—'
o 00
\s
o oV f
O O 00 r-- O o o o o o o o
>-i
CD
S-i
O
S-i
CD
T3S-i
O
o•H
S-i
CD CJ o•H e
S-i O S-i
CD Pu S-i O cd rH CM COU CD 6 ^2o S-i CO S-i o a S-l a rH CM CO u S-i S-l
co 4-1 o CD CU a- •H S-l cd o CD 0) a)
CD CJ 4J 3 & cs O (3 U S-i t3 -a3 03 CJ rH o a o CD CD CD S-i r4 S-i
rH m 03 a •H S CD CD CD T3 O o o03 m > ti u M 00 00 S-i M U> CD rH o cd cd cd cd O O o CD CD CD
a CD ^! cd S S-i S-i S-i CO CO CO
00 03 N cd 4-> S-i CD CD CD P P p cd cd CO
03 rC •H CD o cd o > CO CO CO 42 rdhJ CO CO P-i H i p-l CM p-l Ph P-i Pm
CD
a•HrHCD
CO
cd
J2
6oS-imCO
Co•H4Jcd
•H>(D
P
220

01
u34-1
cd
•HCO
3o•H4-1
cd
}-i
0)
rH<D
acj
CU
n
4-1
Cti
GO•HCO
4J
3cu
6a)ocd
iHcuCO•HQ
>J-i cu
O OCO ^3
CO
oS3
>U CU
o oCO ^3CU 4JCO 3
X!
oS3
>f-i cu
o oCO ^3cu
co
oS3
>u cu
o oCO
3cu
CO
X!
oS3
Uo4J
a,•rl
HCJ
CO
cu
Qcu
W34Jcd
a•Hin
o rH o\ o 00 o o o o o oo r» o o o o o o o o
CN rH co^>
o OCM
mrH
o oCN
o o o o o o o o o
od
od
oo
od
o o o C^
oo
od
oo
o o oo o o
o o o o o o
o o o od d o o
o o o
mCO
rH
o o oodd o o oo o o
O O O O O rH
o o o o <r o o o o o oo o o o o o o o o o
CN '—
'
'—
'
o o o o o o o o o o o o o
ucu
X)uo
5-1
cu
uo
cj
•H
5-1
cu
UO 5-1 CO r4 o
CO 4-t o cu cu CUCU a 4-1 3 &
crj CJ rH o orH 4-i cd CO cu •H
4-1 > 3> CO rH
CU CU Cti ibO cfl N ct) 4J u
•H cu O cd
h4 CO CO P-I H
3cu o
•H io 3 r4a
er mo harH CN CO
CJ r4 3 rH CM cn 5-1 r4 r-l
•H u cd O CU a) CU
3 o 42 3 r-l 5-i XI "dO CU CU cu r-l r-l u
cu cu CU X) -3 O O or4 60 bO M r-l 5-1 5-i
cd cd cd cd O o o (U CU cu
,3 u 5-1 5-1 CO CO CO
cu CU Q Q Q cd cd cd
g CO CO CO & .3 ,3S3 4 5 3 Pm Cm Pm PM CM
oCM
CO
cu
u34-1
cd
3bO•HCO
acu
cuCO
3CO
IHO
OS3
CO
CU
u34Jcd
3bO•HCO
4->
ocu
cuCO
3CO
4-1
O
oS3
cu
3•HrHcu
CO
cd
42
eoWmCO
3o•H4-1
cd
•H>CU
Q
221

Table A-l. Descriptors in vibration signature
1. Time-averaged waveform ("NPTS" values)
2. Lag value of time-average waveform
3. Shape factor for time-average waveform
4. Size factor for time-average waveform
5. Peak signal value
6. Total signal power
7. Harmonic power in signal
8. Nonharmonic power in signal
9. Average order of signal
10. Average harmonic order of signal
11. Average nonharmonic order of signal
12. Power at first order of signal
13. Power at second order of signal
14. Power at third order of signal
15. Phase of first order of signal
16. Phase of second order of signal
17. Phase of third order of signal
222


22k
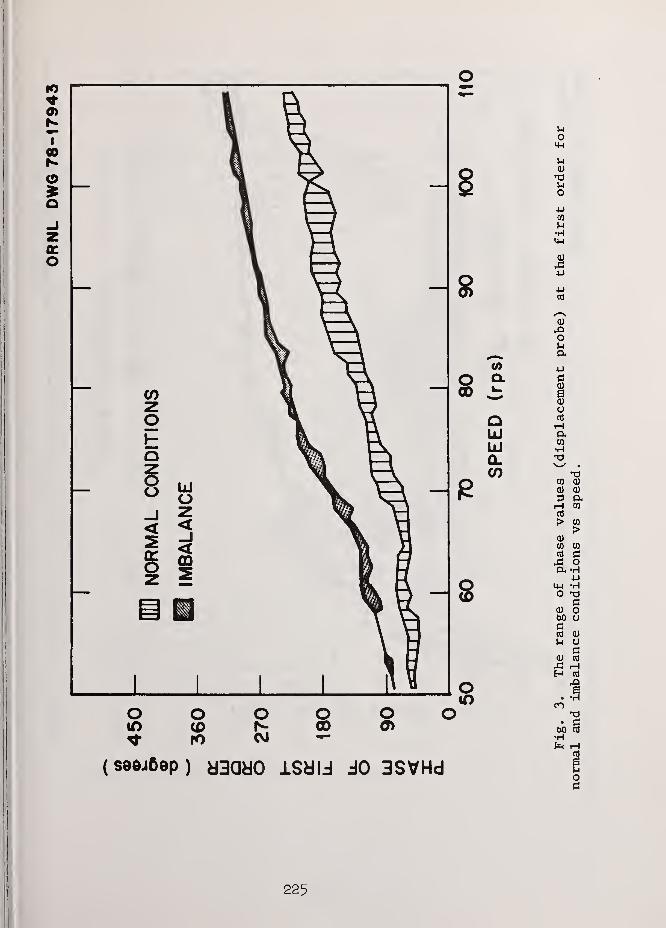
225


227
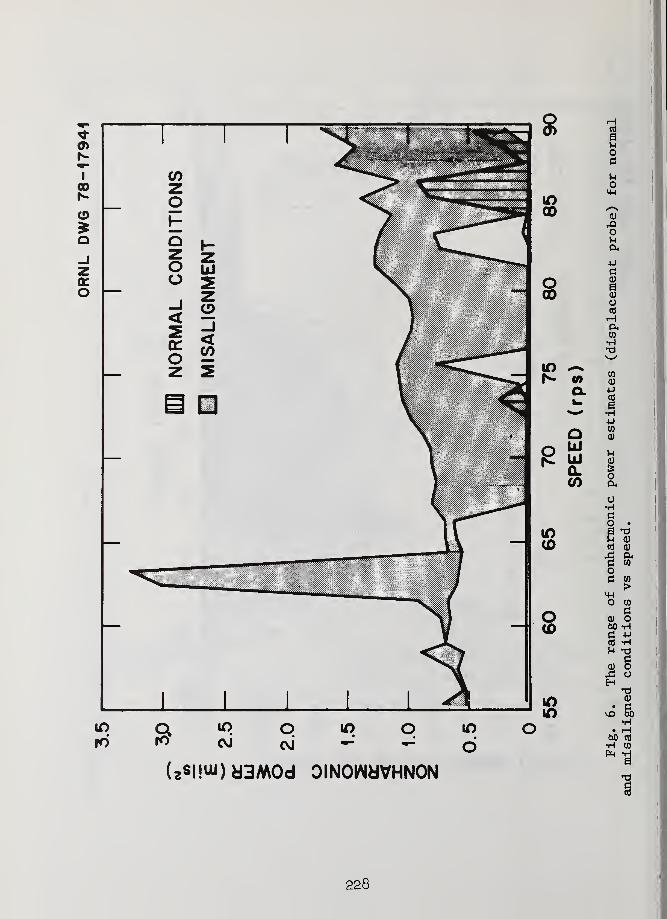
228

o«•
T00
o
O
OO
8
00
o00
- s
a,
OyjLUa.CO
8
d o o oCM
d
uo
<4-\
u
O
GO0COCO
a)
s:4-1
4-J
c0
/—
.
uCU
-U
<D
0OUCD
rHcu 0)
o0 ftcrj CO—
/
CO
CO >CD
4J CO
cfl
o•H •HP 4-1
CO •HCD
u Oo
%o CD& CO
OO
o rH
a)b0 rH
arHcrj
a•H
0) a4^ crj
Ho
• 1
M an
•HrH
( 2*) diQdO 0N003S Nl U3M0d
229

CD
u
( 2 &) U3M0d 1VN9IS «
230

s
P _
o-IzO
(0
CVJ
_ o
— 00
— CD
orUJCO
orUJQoro
CM
bCMIo
ro
b b bCO
bIo
CO
b
d3M0d "IVN9IS
(0
O-J-i
o>mucO
uCO
cu4J
4JmcO
CO
cd
•HPUcO
60
•5M
X)
CU
usoMcu
iHCU
OoCO
CON•rl
O
o
uocu
CO
l-l
IPL.
•H
231

VIBRATION ANALYSIS METHOD FOR DETECTION OF ABNORMALMOVEMENT OF MATERIAL IN A ROTARY DISSOLVER
C. M. Smith and D. N. FryOak Ridge National LaboratoryOak Ridge, Tennessee 37830
W. T. KingDepartment of Nuclear Engineering
University of TennesseeKnoxville, Tennessee 37916
Abstract: Vibration signals generated by the movement of simulatednuclear fuel material through a three-stage, continuous, rotary dis-solver were frequency analyzed to determine whether these signalscontained characteristic signal patterns that would identify each of
five phases of operation in the dissolver and, thus, would indicatethe proper movement of material through the dissolver. This charac-terization of the signals is the first step in the development of asystem for monitoring the flow of material through a dissolver to bedeveloped for reprocessing spent nuclear fuel. Vibration signals fromaccelerometers mounted on the dissolver roller supports were analyzedin a bandwidth from 0 to 10 kHz. The analysis established that (1) allfive phases of dissolver operation can be characterized by vibrationsignatures; (2) four of the five phases of operation can be readilyand directly identified by a characteristic vibration signature duringcontinuous, prototypic operation; (3) the transfer of material fromthe inlet to the dissolution stage can be indirectly monitored by oneof the other four vibration signatures (the mixing signature) duringprototypic operation; (4) a simulated blockage between the dissolutionand exit stages can be detected by changes in one or more characteris-tic vibration signatures; and (5) a simulated blockage of the exit
chute can not be detected.
Key words: Monitor system; rotary dissolver; signature analysis;
vibration analysis.
Introduction: Vibration signals generated by the movement of simulated
nuclear fuel material through a three-stage, continuous, rotary dis-
solver were analyzed to determine whether these signals containedcharacteristic signal patterns that would identify each of five phases
of operation in the dissolver and, thus, would indicate the propermovement of material through the dissolver. This characterization of
the signals is the first step in the development of a system for moni-toring the flow of material through a dissolver to be developed for
232

reprocessing spent nuclear fuel. Five phases of dissolver operationare present during the movement of material through the three-stagedissolver: (1) introduction of material into the inlet stage,
(2) transfer of material from the inlet stage to the dissolution stage,
(3) mixing of material in the dissolution stage, (4) transfer of mate-rial from the dissolution stage to the exit stage, and (5) dischargeof material from the exit stage.
Dissolver description: The dissolver is a three-stage, continuous,rotary drum, 4 ft long and 4 ft in diameter. It rotates around a hori-zontal axis on two roller rings, one of which is V-shaped to providelateral stability. Each roller ring is supported on two rollers. Thedissolver is chain driven at the exit end. Figure 1 shows the internalcomponents of the dissolver.
The dissolver rotates cyclically at a speed of approximately 3 rpm, as
follows: rotate in a "forward" (clockwise) direction for a predeter-mined time period (^20 min) , stop, make one revolution in the "reverse"(counterclockwise) direction, and stop before repeating the cycle.Discrete batches of material (^2 kg) are periodically (every 30 s)
introduced into the dissolver. During forward revolutions, bafflesin the inlet stage move the material into a wedge shaped chute (Fig. 1)
which transfers the material into the dissolution stage. The materialis mixed in the dissolution stage by a mixing-transfer baffle andremains in this stage until the dissolver stops and makes a reverserotation. During this reverse movement, the mixing-transfer baffle in
the dissolution stage moves the material into a conical transfer chute(Fig. 1) which transfers the material into the exit stage. Once thematerial is in the exit stage, the dissolver again rotates forward and
repeats the cycle, and transfer baffles in the exit stage transfer thematerial into the exit chute which discharges the material from thedissolver.
The dissolver is a counterflow device; the fuel and the acid solutionmove in opposite directions. When nuclear fuel is reprocessed, it
(cladding and oxide) will be chopped into pieces about 1 in. long. Thechopped fuel will be introduced into the inlet stage and moved to thedissolution stage where an acid solution will leach the oxide from the
cladding. The empty cladding will be moved to the exit stage and dis-charged from the dissolver. The acid solution will be introduced in
the exit stage; it will flow to the dissolution stage where it willleach the oxide from the cladding, and finally to the entrance stagewhere it will be discharged for further processing.
In these experiments, simulated chopped fuel hulls consisting of stain-less steel tubing packed with a mineral oxide were used instead of
cladded nuclear material, and water was present instead of acid. Thesedifferences are insignificant to the results and conclusions of thisstudy because the important physical properties of the simulated fuel
233
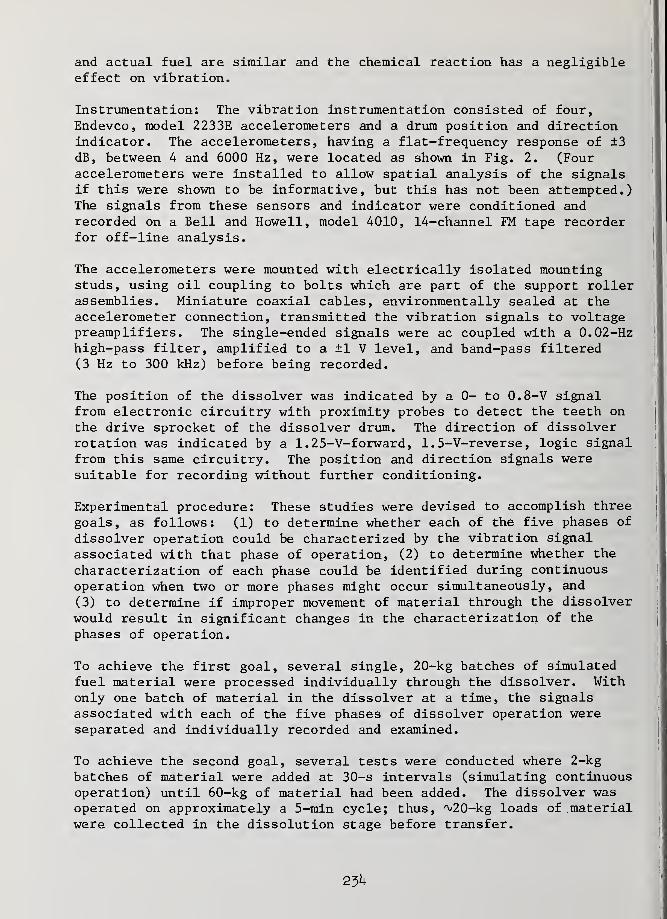
and actual fuel are similar and the chemical reaction has a negligibleeffect on vibration.
Instrumentation: The vibration instrumentation consisted of four,Endevco, model 2233E accelerometers and a drum position and directionindicator. The accelerometers, having a flat-frequency response of ±3dB, between 4 and 6000 Hz, were located as shown in Fig. 2. (Fouraccelerometers were installed to allow spatial analysis of the signalsif this were shown to be informative, but this has not been attempted.)The signals from these sensors and indicator were conditioned andrecorded on a Bell and Howell, model 4010, 14-channel FM tape recorderfor off-line analysis.
The accelerometers were mounted with electrically isolated mountingstuds, using oil coupling to bolts which are part of the support rollerassemblies. Miniature coaxial cables, environmentally sealed at theaccelerometer connection, transmitted the vibration signals to voltagepreamplifiers. The single-ended signals were ac coupled with a 0.02-Hzhigh-pass filter, amplified to a ±1 V level, and band-pass filtered(3 Hz to 300 kHz) before being recorded.
The position of the dissolver was indicated by a 0- to 0.8-V signalfrom electronic circuitry with proximity probes to detect the teeth on
the drive sprocket of the dissolver drum. The direction of dissolverrotation was indicated by a 1. 25-V-forward, 1. 5-V-reverse, logic signalfrom this same circuitry. The position and direction signals weresuitable for recording without further conditioning.
Experimental procedure: These studies were devised to accomplish three
goals, as follows: (1) to determine whether each of the five phases of
dissolver operation could be characterized by the vibration signal
associated with that phase of operation, (2) to determine whether the
characterization of each phase could be identified during continuous
operation when two or more phases might occur simultaneously, and
(3) to determine if improper movement of material through the dissolverwould result in significant changes in the characterization of the
phases of operation.
To achieve the first goal, several single, 20-kg batches of simulatedfuel material were processed individually through the dissolver. Withonly one batch of material in the dissolver at a time, the signalsassociated with each of the five phases of dissolver operation wereseparated and individually recorded and examined.
To achieve the second goal, several tests were conducted where 2-kg
batches of material were added at 30-s intervals (simulating continuousoperation) until 60-kg of material had been added. The dissolver wasoperated on approximately a 5-min cycle; thus, ^20-kg loads of materialwere collected in the dissolution stage before transfer.
23k

Two series of tests were conducted to achieve the third goal: in one,
an artificial blockage was installed in the transfer chute between the
dissolution and exit stages, and, in the second, an artificial blockagewas installed in the exit chute ^2 ft from the entrance. For bothseries, tests were conducted with both single, 20-kg loads and individ-ual 2-kg loads introduced at 30-s intervals.
Data analysis: The recorded vibration signals from the accelerometerswere frequency analyzed over a bandwidth from 0 to 10 kHz, using a fast
Fourier transform (FFT) algorithm. The position indicator was used to
arbitrarily divide each dissolver revolution into sixteen equal angularsegments, or orientations. To correlate the analysis with the dissolverposition, a separate FFT analysis was performed on the vibration signalsreceived during each orientation. Since the drum period was 20 s perrevolution, each orientation spanned ^1.25 s. A frequency analysis wasperformed during each orientation, with a maximum frequency of 10 kHz(sampling rate of 20 kHz) and a resolution of ^40 Hz. Data from only^0.8 s of each orientation were analyzed because of nonreal time pro-cessing which resulted because the computer was unable to finish pro-cessing one set of data before the next was ready to be processed.
For each orientation, the FFT analysis yielded a power spectral density(PSD) , which is the amount of power in the signal at each frequency.Preliminary analysis showed that there were no prominent, discrete fre-quency spectra features, but that each phase of dissolver operationcould be characterized by relatively broad-band (1-2 kHz) changes in
the spectra. Therefore, a method was determined for condensing andextracting useful information from the numerous individual PSD spectra.The individual spectra were subdivided into ten, 1-kHz bandwidths overa range from 0 to 10 kHz, and the PSD values within each bandwidth wereused to form a single, root-mean-square (RMS) quantity for each band-width for each orientation of each revolution. This allowed theorientation-dependent fluctuations in the bandwidth-limited RMS param-eter to be studied. To simplify the analysis, a computer program waswritten which computed the bandwidth-limited RMS value without requir-ing an FFT analysis and plotted it versus dissolver orientation.
Results for single 20-kg charge: The results show that, althoughvibrations were produced over all analyzed frequency ranges, there is
a frequency range for each phase of operation in which the vibrationsignals have a characteristic signature (or pattern) of RMS values whenthese values are plotted versus dissolver revolutions (16 orientationsper revolution). Furthermore, one needs to observe only two frequencyranges, 2 to 3 kHz and 5 to 6 kHz, to determine the characteristic sig-nature for each phase of operation.
Figure 3, a plot of the 2- to 3- and 5- to 6-kHz RMS values versusdissolver revolution, illustrates the characteristic signature for eachphase. The test was started with the dissolver empty. The material
235

was introduced into the inlet stage during revolution 5, transferred tothe dissolution stage during revolutions 6 to 8, and mixed during revo-lutions 9 to 29. The dissolver was stopped at the end of revolution 29,and revolution 30 was a reverse revolution during which the material wastransferred to the exit stage. Forward rotation of the dissolver wasresumed to discharge the material during revolutions 31 to 38.
During revolution 5, the charging (entrance) of material producedvibrations and corresponding RMS spikes in both the 2- to 3- and 5- to6-kHz frequency ranges. This single, large spike is the characteristicsignature for material charging. This signature is identified in the5- to 6-kHz range because of possible confusion with other spikes inthe 2- to 3-kHz range and the better signal-to-noise ratio in the 5- to6-kHz range.
The transfer of material from the inlet to the dissolution stage alsoproduced spikes in both frequency ranges. The characteristic vibrationsignature for this phase of operation consists of spikes during orien-tation 13 for several revolutions after the material is charged(Fig. 3, revolutions 6, 7, and 8). This signature can be identifiedin either frequency range since no other phase of operation produces aspike in orientation 13, and there is no significant difference in thesignal-to-noise ratio for the two frequency ranges.
Mixing in the dissolution stage produced spikes of significant ampli-tude only in the 2- to 3-kHz range, as seen in Fig. 3, revolutions 9
to 29. The signature for mixing is a relatively large spike duringthe last orientation of each revolution (orientation 16). These mixingspikes are periodic, are generated during forward revolutions, and are
similar in amplitude.
The transfer of material from the dissolution stage to the exit stage
also produced spikes of significant amplitude only in the 2- to 3-kHzrange (Fig. 3, revolution 30). This signature is a relatively large
spike during orientation 3 of the reverse revolution. This spike is
similar to a mixing spike, but there are two important differences:
it is generated during a reverse revolution, instead of during a forward
revolution; and it is generated in orientation 3, rather than in orien-
tation 16 (orientation numbers decrease with time during a reverse
cycle)
.
Figure 3 shows that for revolutions 31 to 38 the discharge of material
from the exit stage of the dissolver produced spikes in both frequency
ranges, but these spikes have a better signal-to-noise ratio in the
5- to 6-kHz range. The signature for the discharge phase is four
equally spaced spikes per revolution. These spikes are generated
during forward revolutions following a reverse, and their amplitude
tends to decrease as more material is discharged, leaving less material
in the exit stage. The signature for the discharge of material was
chosen in the 5- to 6-kHz range because the spikes in the 2- to 3-kHz
236

range were similar to those for mixing. Since, in normal operation,mixing and discharge would occur simultaneously, separation of thesetwo signatures in the 2- to 3-kHz range would be more difficult.
The vibration signatures in Fig. 3 were determined from the analysisof only one of the four accelerometers , accelerometer A. The datafrom all accelerometers were analyzed, and the results were similar.However, in general, the amplitudes of vibrations were larger fromaccelerometers located near the source than from those located fartheraway; i.e., for charging, accelerometers A and B on the inlet side hadlarger signals than accelerometers C and D on the exit side. Also,vibrations not caused by material movements (i.e., vibrations fromindividual rollers) could influence an adjacent accelerometer, butbeing attenuated by distance, they had little effect on the otheraccelerometers
.
J
"
Results for 2-kg charges at 30-s intervals: The results in Fig. 4
(2 to 3 kHz) and Fig. 5 (5 to 6 kHz) show that a characteristic signa-ture can be identified for each phase of dissolver operation exceptone during normal, continuous feed operation. In Fig. 5, the single,
|
large-amplitude charging spikes (i.e., the charging signature) areidentifiable because their amplitudes exceed 3 x 10"^ V,* and theiroccurrence is time dependent rather than revolution dependent, i.e.,they do not occur at particular orientations of certain revolutions(see Fig. 5, revolutions 2, 3, 5, 6, and 8). Once these spikes havebeen identified in the 5- to 6-kHz range, their effect in the 2- to3-kHz range can be inferred (i.e., a spike during revolution 2 of
Fig. 5 means that charging also caused the spike during revolution 2
of Fig. 4, and a spike during revolution 6 of Fig. 5 means that charg-ing contributed to the spike during revolution 6 of Fig. 4).
It is difficult to identify a characteristic signature for transfer of
material from the inlet stage to the dissolution stage with a 20-kgcharging load, and such identification is unreliable with 2-kg chargingloads because the amount of material being transferred is less and theassociated signal is smaller. However, this transfer may be indirectlymonitored through the signature for mixing in the dissolution stage.
If the transfer from the inlet stage to the dissolution stage did notoccur, eventually (after the next reverse) there would be no material
j
in the dissolution stage, and the mixing spikes would be absent.
In the analysis with 20-kg loads (Fig. 3) , the signature for mixingin the dissolution stage is identified as a once-per-revolution spikeduring orientation 16 in the 2- to 3-kHz range. In Fig. 4, this same
signature is found, although additional spikes are present. The
!effects of charging and discharging also produced spikes in the 2- to
*The two charges immediately following a reverse have a smalleramplitude because of analytical techniques.
237

3-kHz range, and these additional spikes must be considered (Fig. 4,revolutions 17, 20, 23, and 26). As previously stated, the spikesgenerated during the charging phase can be identified in the 5- to6-kHz range, and similar effects can be found in the 2- to 3-kHz range.Later, it will be shown that the spike generated during the dischargingphase can be handled in the same manner.
Thus, by using this method, one can determine the effects of chargingand discharging in the 2- to 3-kHz range; then, since mixing spikes aregenerated during orientation 16, the mixing signature can be determined(Fig. 4, revolutions 17 to 26). However, possibly there is a problem:if charging or discharging occurs simultaneously with mixing, thisanalytical method is currently unable to separate the effects of each.To determine the mixing signature, enough spikes caused only by mixingmust remain after the spikes caused by a simultaneous occurrence of
phases (mixing and charging or mixing and discharging) are discounted.If a charging period is the same as a period of revolution, and if
mixing and charging occur simultaneously, there will be no spikescaused only by mixing. Therefore, the analytical method is unable to
determine the mixing signature in this instance.
The simultaneous occurrence of mixing and discharging is differentbecause mixing and discharge can occur simultaneously only over a
limited time period. Discharging occurs immediately following a
reverse and lasts only several revolutions, with its effects diminish-ing in latter revolutions. Furthermore, during this same time period,the mixing stage is being refilled, and mixing is producing only smalleffects. Therefore, the simultaneous occurrence of mixing and dis-charging poses no significant problem in determining the mixing signa-ture since the two phases cannot occur simultaneously over long periodsof time.
The signature for transfer of material from the dissolution stage to
the exit stage can also be identified in the 2- to 3-kHz range of
Fig. 4 (revolutions marked "REV") . This signature is relatively easyto identify since it occurs only during a reverse and in orientation 3.
It is possible that charging may occur simultaneously, but this will be
indicated by a charging spike in the 5- to 6-kHz range. If this
happens, the effects are not separable by the analytical method, and
the transfer of material cannot be identified for this reverse revolu-
tion. However, there is an indirect indication of this transfer
because if it did not occur, there would be no material transferred to
the exit stage to be discharged during subsequent forward revolutions.
Thus, the signature for discharging would be absent.
The signature for discharging of material from the exit stage, which is
four equally spaced spikes per revolution, can be identified in the
5- to 6-kHz range of Fig. 5 (revolutions 13-17, 27-32, and 40-44).
Generally, the amplitude of these spikes is less than 3 x 10~^ V, and
it progressively decreases during the revolutions following a reverse.
238

It is possible for material to be charged simultaneously with theobservation of these discharging spikes, and when it is, the amplitudeof the resultant spike is greater than 3 x 10~3 V (Fig. 5, revolutions14 and 16) . The simultaneous presence of a charging spike with a dis-charging spike has no significant effect on the identification of thesignature for discharging since there are four discharging spikes perrevolution. In Fig. 4, it can be seen that the discharging spikes alsoproduce effects in the 2- to 3-kHz range. By reasoning similar to thatpreviously used with charging spikes, the discharging spikes can beidentified in the 5- to 6-kHz range and the effects in the 2- to 3-kHzrange can be found.
Results for artificially induced blockages: The results show thatchanges in the characteristic signatures for the phases of operationcan indicate some, but not all, types of blockages. A blockage in thetransfer chute between the dissolution and exit stages causes definitechanges in some of the characteristic signatures. These changes canbe seen in Figs. 6 and 7 which show the fluctuations in the RMS valuefor the 2- to 3-kHz and 5- to 6-kHz frequency ranges, respectively, forthis blockage test.
Blockage of this transfer chute prevents material from passing to theexit stage where it is discharged from the dissolver. With no materialbeing discharged, there can be no discharge signature in the 5- to
6-kHz range (four spikes per revolution), as indicated in Fig. 7, revo-lutions 13-17, 27-32, and 41-46. Furthermore, since all of the mate-rial collects and remains in the dissolution stage, mixing spikes of
large amplitude are present in the 2- to 3-kHz range in forward revolu-tions immediately following a reverse (Fig. 6, revolutions 14-16, 28-30,and 42-43). Under normal operation, the dissolution stage should berefilling at this time, and the mixing spikes should be small, if
present at all.
The characteristic signatures show no significant changes for a blockageinstalled ^2 ft from the entrance of the exit chute in the exit stage.
Figures 8 and 9 show the fluctuations in the 2- to 3-kHz and 5- to 6-kHzranges, respectively, for this blockage test. Except for the presenceof a blockage, this test was similar to the test of Figs. 4 and 5. Thelack of significant differences in the data is best seen by comparingFig. 4 with Fig. 8, and Fig. 5 with Fig. 9. The discharge of materialis the only phase of operation which should have been affected by theblockage. However, the discharge signature is not significantly dif-ferent between the two tests (Figs. 5 and 9). Also, the effects of
discharging in the 2- to 3-kHz range (Figs. 4 and 8) show no major dif-ferences, and there are no unusual aspects of the data in Figs. 8 or 9
that would indicate abnormal operation of the dissolver. The reasonfor the lack of significant differences in the discharge signaturesduring this blockage test, we believe, is that the blockage is locatedat some distance from the exit chute entrance. This allows the dis-charged material to provide a normal discharge signature because the
239

material moves into and down the chute in a normal manner beforeencountering the blockage. Because of restrictions at the test facil-ity, the blockage could not be moved to the exit chute entrance forfurther testing.
Conclusions: A vibration monitoring system can be developed to detectabnormal material movement in a rotary dissolver. It has been estab-lished that (1) all five phases of dissolver operation can be charac-terized by vibration signatures; (2) four of the five phases of
operation can be readily and directly identified by a characteristicvibration signature during continuous, prototypic operation; (3) thetransfer of material from the inlet to dissolution stage can be indi-rectly monitored by one of the other four vibration signatures (themixing signature) during prototypic operation; (4) a simulated blockagebetween dissolution and exit stages can be detected by changes in oneor more characteristic vibration signatures; and (5) a simulatedblockage of the exit chute can not be detected.
2kO


2k2


I
5 o
o>
COzo
o>
<4-l
O
t>0
C3•rl
CO
CO
CO
oo
P-
60a•HU
co•H4-1
CtJ
OO
<u
cu
goJ-l
cu
rH0)
CJ
OcO
4-1
cO
rHCO
c •
toO CO
•rl rHCO
>Cj UO 0)
4-J
4-1 C3
cO •rl
uXi CO
•rl |
> oC/3
4JCO
N TJ0)
0
enO
CM J-i
4J
£3•rl
<rCO
ci CO
•rl OrH
NOiiviN3iao M3d snoA swy N0llVlN3m0 d3d S110A SWd
00
I
CN
2^


zo
o>
NOIlViN3ldO d3d S110A SWd NOIiVlN3ldO d3d SllOA SWd
CO
bO cfl
•H oPn H
bO
2U6

COzo
o>
NOiiviN3iao «3d snoA swa NouviN3iao d3d siioa sm
14H O0
60 a)
CJ m•H CO
CO
CO
CD
O 4-1
Ou CD
&, too
cri
toO 4-1
rj CO
•Hj_i C3
OT3 •H
4J
(3
0 H•H O4-1 CO
03 CO
O •rl
OrH
CU
<! ^34-1
te inin \CL*
H cu
(J toO
H c3
0!
rH 00) 0O rHO rO03
03
4Jctf
4-1
H •rl
03 £SM CO
rl rHCO 03
>C uO cu
•H 4J4-1 acc!
UCO
> 0CO
4J
N
s ce
v£>
0ID u
4-1
a•H
CO
60 cd
•rl OPm rH
too
MI
CM

o
COzo
N0llViN3ia0 d3d SilOA SWU NOiiviN3iyo aid snoA swa
00CO
•
•H OPn H
00
2kQ

o
o>
CO
o
O>
NOiiviN3iao a3d snoA sm N0llVlN3ld0 tild SlIOA swa
CO
• t3bO CO
•H O
00
I
CM
2^9

MONITORING INLET STEAM VALVES OF PWR 900 MW TURBOGENERATORS
A. JAUDETJ.C. SOL
ELECTRICITE DE FRANCEDirection des Etudes et Recherches
1 , avenue du General de GaulleB.P. 27 - 92141 CLAMART
FRANCE
Abstract :
A study of the reliability of overspeed protection systems for turbinesassociated with nuclear reactors, confirms the essential role of steamvalves in the general reliability of these systems, and consequently inthe operational safety of the units.
Over and above the obvious reasons concerning operational safety, animprovement in investigation and diagnostic methods clearly providesbeneficial spin-off in terms of equipment availability.
Assessment of turbine operational safety, and more particularly evalua-tion of the risks generated by non-closure of steam-valves, has led to
a concentration of interest about three functional characteristics :
- stem movement quality,
- seal-tightness,
- "general condition".
Each of these characteristics can be subject to specific mechanicalfailures for which detection procedures exist, and which are describedin this paper.
In application of these principles, examples of the technologicalsolutions (including automatic surveillance system) adopted for monito-ring the steam-valves of the units of the 900 MW standard are described,together with the first operating results for these methods and this
equipment
.
250

1 - NEW SURVEILLANCE AND DIAGNOSIS METHODS [l]
1.1 - Principles
A study of the reliability of overspeed protection systems for turbinesassociated with pressurized water reactors confirms the essential roleof inlet steam valves ( figure 1 ) in the general reliability of thesesystems and consequently in the operational safety of the units.
Conventional operating tests (on-off type) are performed weekly [2] onall the inlet steam valves of every E.D.F. turbine. These tests are nowcompleted by using endoscopes for inspections during stops (figures 2.3).
New surveillance and diagnosis methods were developed in order toimprove the quality of these classical tests. They are based upon twotypes of complementary actions :
a/ Permanent auscultation of simple parameters.
b/ Specific checking tests, deeper and finer but more complicated andfor that reason performed only periodically (or in case of abnormalitylity detection by the permanent auscultation system)
.
These methods obviously contribute to improve the reliability of the
valves by providing advanced warning in some cases of deterioration;
but they also improve their availability by providing information ontheir behaviour during operation and this information can be used to
optimize preventive maintenance and may even lead, in the future, to
predictive maintenance.
According to the evaluation of the risk generated by non-closure of
valves and to the statistical study of the most probable failures, weconcentrated most of our interest on three fundamental functionalcharacteristics :
- Stems' motion quality,
- Seal tightness,
- "General condition".
1.2 - Stems' motion quality
A statistical study of the fossil fuel thermal plants' incidents showedthat the main risks the stems' motion may be subjected to are incipientseizures or stickings between the stem and its guides.
This type of degradation is one of the most important both for thesafety of the plant because of the possible consequences of a valvenon-closure and for the equipment availability for it is responsiblefor 1/5 of the inlet steam valves' incidents.
251

Consequently, it is particularly interesting to detect such defects andfor this purpose we chose to record, as a permanent auscultation para-meter, the closing time of every cutout valve (HP and LP) at everyclosure
.
On the other hand, the conventional weekly performed checking test of"closure or non-closure" was improved by systematically plotting thestroke/hydraulic pressure curve during the motion.
At last, in case of abnormality detected through one of the two abovementioned methods, more complete closure tests may be performed bymeasuring :
- The instantaneous stem speed with a laser velocimeter.
- The stem vibrations during the motion.
The measurement of the instantaneous stem speed with a laser veloci-meter, by providing very rich information about the dynamics of the
valves' motion during the closure ( figure 4 ) has already led us to a
better knowledge of this motion and allowed us to build up a computa-tion model (figure 5) to explain the main characteristics of this move-ment. Unfortunately, this test needs a heavy equipment to be performedand it will be used only in case of important abnormality.
The stem's vibrations measurement during its motion is, on the contrary,
very simple. The sensor is the accelerometer mounted on the stem for
the permanent monitoring (see below) . The signal processing device is
a mere oscilloscope (or a sonorisation) . In case of normal sliding
motion of the stem between its guides, the vibration level is low
except for the shocks produced by the normal movement ( figure 4 ) . In
case of dry friction or sticking, high levels of stresses are generatedalong the friction area in a very broad frequency band. Many resonancesare excited in the metal (particularly at high frequencies) and the
corresponding vibrations can be easily detected by the piezoelectricaccelerometer which is especially sensitive to high frequencyvibrations. Simulation laboratory tests showed (figure 6 ) an increaseof the vibration level of more than + 46 dB in case of sticking for
an area of only 0.8 cm2 .
1.3 - Seal tightness
Another common possible defect is a seal tightness defect following the
valve plug or seat erosion by the steam. This defect causes, when the valveis supposed to be completely closed, a leak of steam into the inletpipes of the turbine with two important effects :
a/ It brings some residual mechanical energy into the turbine.
b/ It emits a very broad band noise produced both by the jet itself
and by the collision of the jet inside the piping.
252

The first effect induces a motor torque on the turbine shaft and conse-quently modifies the rotor deceleration curve. It has been shown that
the K-coef f icient (coefficient of the tangent hyperbola) of this curve
is the most appropriate representation to detect such modifications. In
this case too, a computational model was built up with several coeffi-cients adjusted on the experimental values. In this way, a leak constantmotor torque has been simulated (figure 7)
.
Consequently, we decided to record the rotor speed during everydeceleration and to compute and plot automatically the K-coef f icientcurve. Any modification of this curve may signify a global tightnessdefect of the turbine.
Then, in order to localize and perhaps quantify the defect, we canperform the specific ckecking test based upon the second effect : themeasurement of the leak noise.
Many studies and tests have been previously performed to characterizethis noise and its transmission through the casing to the outside wallof the valve. In fact the acoustic emission frequency range is verybroad : from a few hertz up to 1 MHz ; for the industrial mechanicalnoise is mostly concentrated under about 100 kHz, the best signal/noiseratio is obtained in the high frequency range and can be measured by a
piezoelectric accelerometer working on its whole frequency rangeincluding its resonance. Even better results can be obtained using anultrasonic piezoelectric sensor (acoustic-emission type) with a higherresonance frequency (figure 8)
.
1.4- "General condition"
Several other defects are liable to affect the steam valves as exces-sive clearances or disunions between parts (seal and casing for instance)
,
cracks (of the stem for instance) and so on.
Very generally, such defects induce modifications of the vibrationalcharacteristics and in most cases increase the energy dissipated byvibrations
.
Consequently, we consider that measurement of the global (RMS) vibrationlevel is an accurate permanent auscultation parameter for the generalmechanical condition of the valve (see below the description of the
measurement)
.
In case of previously detected abnormality a deeper vibration signalanalysis may be performed by using directly the signal from the acce-lerometer .
253

Some laboratory tests showed that in case of excessive (abnormal)clearances between parts, the vibratory excitation by the turbulentsteam flow induces incipient shocks inside the valve which may be easilydetected by the stem accelerometer using only the time representationof the signal (display or sonorisation) (figure 9)
.
An experimental study of the evolution of the first bending modefrequency of a cracked stem with the crack depth Efc-aws (figure 10)
that only major cracks can be detected by this way.~~
2 - PERMANENT AUSCULTATION SYSTEM
Permanent auscultation is obviously the first stage of all the abovedescribed surveillance methods. A specific automatic device was achievedfor this purpose (figure 11 )
.
2.1 - Measurements
As said above three types of permanent auscultation parameters areconsidered :
- closing times of cutout valves ( 1 2/ turbine)
,
- rotor speed (1 /turbine),- overall vibration level of all the valves (24/turbine)
.
Closing times are elaborated from the position information of the
cutout valves. The vibration levels are elaborated by electronic signalconditioners (amplifiers, low pass filter, RMS detector) from the
output signal of the accelerometer mounted on the stem of every valve.
At the same time, some other parameters have to be recorded both to
provide automatically statistical information on the valve operatingconditions and to help us to understand the auscultation parameters'variations
.
These "statistical parameters" are :
- the logical states (open or closed) of the cutout valves (12 binarydata/ turbine)
,
- the positions of the HP control valves (6/turbine),
- the electrical power output of the turbogenerator (1 /turbine).
2.2 - Data recording
All the above mentioned measurements sensors are connected with thecentral data acquisition device (figure 12) and get in through appro-priate electronic interfaces :
- Closing time printed boards compute the closing times from the infor-mation about the position at every closure and record them in a buffer
|
memory.
2$k

- The rotor speed printed board computes the speed value (numerical
data) from the analog signal.
- The logical states of the valves board record in a buffer memory the
new state in case of any change.
All the other analog measurements (overall vibration levels, posi-tion of the control valves, power output) are digitally convertedthrough two multiplexer levels.
The microprocessor monitors all these interfaces and scans all the
measurement inputs with a very short period cycle (a few seconds)
.
Some of them are systematically recorded i.e. everytime there is a
value : the closing times and the logical states of the valves.
The others have continous variations (vibration levels, position of thecontrol valves, power output, rotor speed) and are recorded only whenthe difference between the scanned value and the last recorded one is
larger than a certain previously defined threshold (relative or abso-lute) .
Every record contains the measured value and the instant of measurementThis method allows to record very few values in case of small varia-tions and, on the contrary, a large number. of values in case of impor-tant variations (when it is interesting) ( figure 13 )
.
The record is performed on a magnetic tape cassette which is periodi-cally (every week) sent to a computer system to be processed.
2.3 - Data processing :
During a first stage, simple computer programs were developed in orderto read back the cassette and plot the time-evolution of every para-meter .
Then, from the study of the first results we began to define the principies of the "automatic surveillance" programs. The idea is simple :
first, we calculate, for every surveillance parameter, the "referencestate" from a statistical study (mean and standard deviation) of thefirst results. Sometimes these characteristics are assumed to be depen-dent on another parameter and have to be represented as a function ofit, by a polynomial regression.
For the HP control valves' vibrations, the influent parameter is
obviously their own position.
As to the vibrations of the other valves and the closing times, it is
supposed to be a matter of the power output of the plant.
255
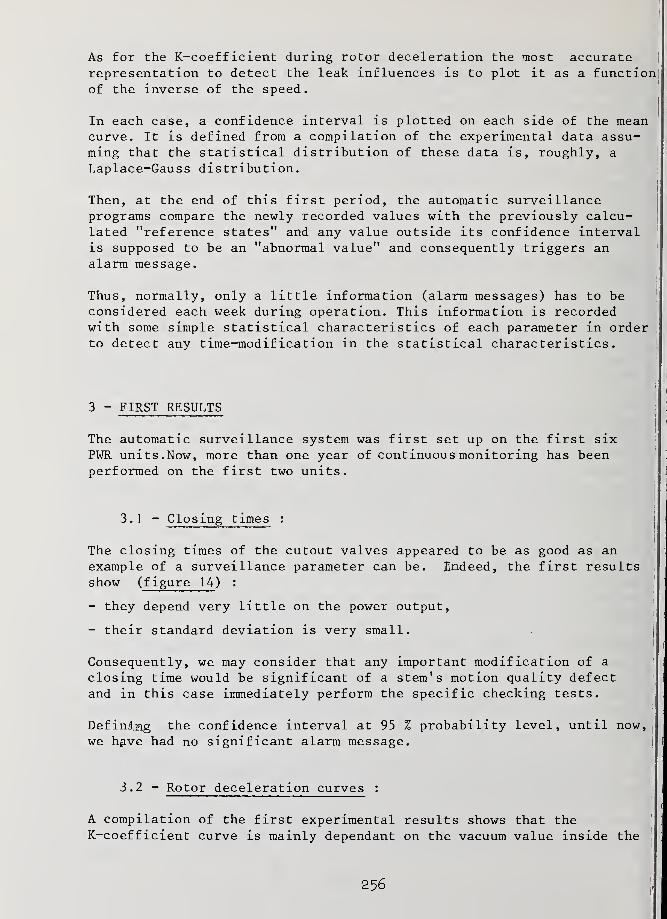
As for the K-coef f icient during rotor deceleration the most accuraterepresentation to detect the leak influences is to plot it as a functionof the inverse of the speed.
In each case, a confidence interval is plotted on each side of the meancurve. It is defined from a compilation of the experimental data assu-ming that the statistical distribution of these data is, roughly, a
Laplace-Gauss distribution.
Then, at the end of this first period, the automatic surveillanceprograms compare the newly recorded values with the previously calcu-lated "reference states" and any value outside its confidence intervalis supposed to be an "abnormal value" and consequently triggers analarm message.
i
Thus, normally, only a little information (alarm messages) has to beconsidered each week during operation. This information is recordedwith some simple statistical characteristics of each parameter in orderto detect any time-modification in the statistical characteristics.
3 - FIRST RESULTS
The automatic surveillance system was first set up on the first six
PWR units. Now, more than one year of continuous monitoring has beenperformed on the first two units.
3.1 - Closing times :
The closing times of the cutout valves appeared to be as good as anexample of a surveillance parameter can be. Jndeed, the first resultsshow (figure 14) :
- they depend very little on the power output,
- their standard deviation is very small.
Consequently, we may consider that any important modification of a
closing time would be significant of a stem's motion quality defectand in this case immediately perform the specific checking tests.
Defining the confidence interval at 95 % probability level, until now,
we have had no significant alarm message.
3.2 - Rotor deceleration curves :
A compilation of the first experimental results shows that theK-coef f icient curve is mainly dependant on the vacuum value inside the
256

turbine and, when this vacuum value is the normal one, roughly constant
(figure 15, figure 16) .
Thus boundary curves have been defined with their fitting theoretical
coefficients in the model. In case of normal vacuum, the experimental
curve must be between these boundaries.
A leak motor torque has been simulated and the model shows the fairly
good sensitivity of the method ( figures 17, 18 ) . Nevertheless the
relation between this theoretical leak torque and some real tightness
defect still has to be established by experimentation on an actual-sizeturbine
.
If an experimental curve exceeds the boundary values, we have first to
look for a vacuum value modification before thinking of a leak defect.
3.3 - Vibration levels :
Here, the above statistical processing method was a little more diffi-cult to perform because the number of recorded values is very muchlarger (permanent scanning) and their f a priori, standard deviation is
very important.
Under these conditions, the direct computation of the "reference states"from all the experimental data gave very large confidence intervals andthus the detection of an "abnormal value" was in most case impossible.
A closer study of these vibration levels showed that they are roughlyconstant during the constant power operation and they are subject to
very large variations during the power variations.
These variations ( figures 19, 20 ) stay for a certain interval of time(say 1 hour) after the power plant variations probably because of thestabilisation (relaxation time) of some operating parameters.
Consequently we decide to consider as non significant and to eliminateall the measurements recorded during the power plant variations.Furthermore in order to avoid electrically or mechanically caused erraticvalues, we also eliminate all the values, the duration of which is
shorter than a certain interval of time.
Finally, we obtained acceptable reference curves (figure 21) and wedefined their confidence interval at 99 % probability level.
I In order to avoid too frequent "statistical" alarms it is necessary to
eliminate the same kind of measurements during the automatic surveil-lance phase. Nevertheless and to minimize the consequent informationloss we consider that these measurements are, in any case, significant
257

of a defect (and trigger an alarm message) when their values are up to
a certain critical level.
4 - CONCLUSIONS
The theoretical and experimental studies as well as the first Operatingresults confirm the interest of the permanent auscultation and theexpected possibilities of the complementary specific checking tests.:
After one year operation, the methods and the important "referencestates" have been defined. We have now to :
- confirm the detections capacity of the method on real defects (if
any ! )
,
- optimize the numerical criteria from a long period operation experi-ment (best probability law, appropriate alarm threshold)
.
In the future, we plan to complete the permanent auscultation systemincluding new operations parameters to improve the permanent ausculta-tion parameters' analysis and otherwise the surveillance of the rotorshaft vibrations (at nominal speed and during decelerations).
Anyway it is a new method applied on new equipment. We have finisheddefining the first operating regulations and now, the method capabi-lities will be improved, following the better knowledge of the reliabi-lity of the equipment, of the main defects and their consequences for
the detection method provided by industrial operation.
REFERENCES
[1] G. SAPY - J. TESSIER. Surveillance des organes d' admission des
turbines associees a des reacteurs nucleaires. A.I.M. Liege 1978.
[2] R. BOUCHERAS, J. CAWART, J. KIESLING. Cycles d'entretien des
turbines a vapeur et moyens d'auscultation permettant de reduire la
frequence des visites. A.I.M. Liege 1974.
258

to a-%> vi if
O II
* c
in9 «u c
Q.ffi
^ IO
5 ^*o *
O V
O Win
C Q.o o
0. o
C> •*> ro
IIA
I
• oin-
ffi u•-ixhxi
3 .J
o
•c
15- ll/-($HXI--
w
o«l
•c99
Q:
««.
*>
D*>
-C«>
o o»» 5«n v*> a.
3 -2
5 *a l.
6 §
•» in
3 in
In in
UJ
Q:
Uj
u.o
o
5:
K.10
Uj
K.
o<o
UJzffi
UJz*
ACr>UJCL
<>
COto
za<
—j a5 t5:
to
fN
Ul5C
o
O
10o
a
o
<UJIuto
Figure 1
259

Endoscope hole
Passage pour endoscope
Hole for ultrasonic sensor
Zone du trou pour fixation
du capteur ultrasonorc
i
Stem accelerometer(permanent)
Zone de fixation des *
accelerometrcs sur
la tige
Sortie vapeur
vers soupape HP
Steam out
(to S.R)
Nairor for laser velocimeter
Reglette pour velocimetre
laser
7/.">nh
HP CUTOUT VALVE (VA)
ROBINET D'ADMISSION HP PRINCIPAL
260
Figure 2

HP CONTROL VALVE (SR)
SOUPAPE DE REGLAGE HP PRINCIPALEFigure 3
26l

Instantaneous speed measured
with laser vetocimeter
Vitesse instantanee
( veloc/metre a laser)
500"-
4 Vibrational acceleration
measured with
piezoelectric accelerometer
Acceleration instantanee
( accelerometre piezoelectrique)
1 Choc d'ouverture Shock by pass clapper-head
2 Effet de l'a mortisseur viqueux Viscous damping
3 Choc de la tete sur le siege Shock head-seal
4 Choc de fermeture Shock by pass clapper -head
CLOSING OF A CUTOUT HP VALVE(VA)
VITESSE ET ACCELERATION INSTANTANEES RELEVEES
LORS DE LA FERMETURE D UN ORGANE EN BON ETAT
Figure A
262
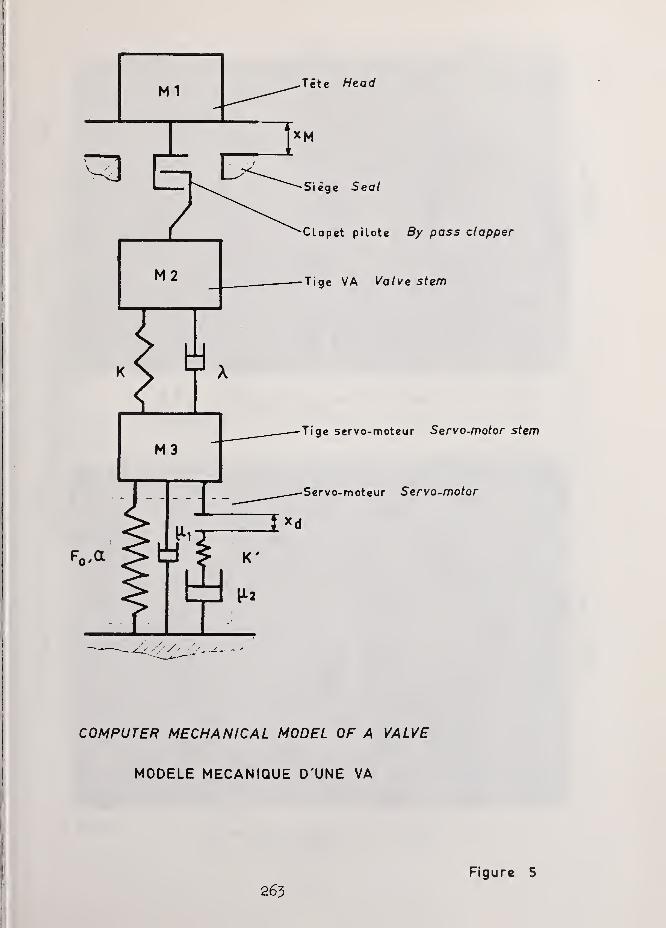
M1
f0 ,cc
-Tete Head
Siege Seal
Clapet pilote By pass clapper
Tige VA Valve stem
Tige servo-moteur Servo-motor stem
Servo-moteur Servo-motor
COMPUTER MECHANICAL MODEL OF A VALVE
MODELE MECANIQUE D'UNE VA
263
Figure 5
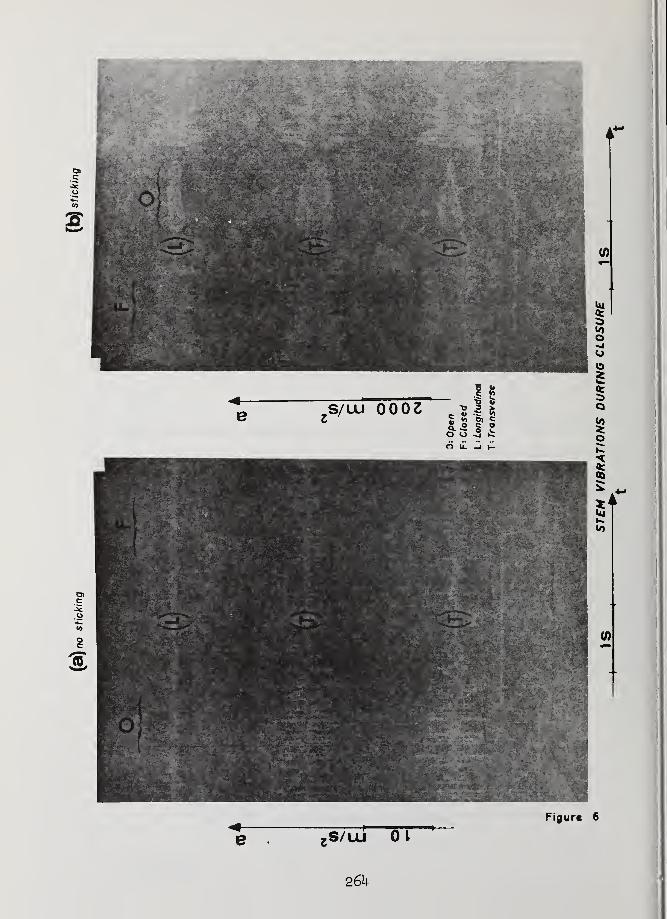
Figure 6
26k

o
o
3Ou
1 •
I*c
o*> c
*• o
— «
e to
a. .©
«; o
-o o
K CMo ci
«_ 3o © ;
w v.
.« o
c co
0
(M) 6°1
co —
it
*» "6i i si
v .2 oQ. 103 CO oo o
©©©©•
Oo
ht ai3*
v? to
Ul Uj
S SiU. t0u. >.
8 I
1 §
Uj Uj-j HUl Ulo pUlQ QQ *^ CO
§ I£>Q
Ul ly
a: u.
S °o
cnCO
zo<
<UJI—
3LL
UJZ3<3Oan3HII-ozUJ—Ia.3Ou3OCOcc3UJ—
1
<>toUJ3a-iUJ3aat3OCL
UJ
toUJma:3Oa
(VPJ) u Figurt 7
265

f(KHz)
(0) Bruit de fond electronique Electronic noise (no teak)
(1) Bruit de fuite Leak noise
Pression amont: 6 bars Upstream pressure
Pression aval : 1 bar Downstream pressure
Section de fuite: 0.46mm2 Leak equivalent section
RMS values ratio leak noise
electronic noise= 43dB
POWER SPECTRUM DENSITY OF A LEAK NOISE
MEASURED WITH A PIEZOELECTRIC ACCELEROMETER
DENSITE SPECTRALE DU BRUIT DE FUITE TRANSMIS PAR VOIE SOLIDE,
MESURE A L' AIDE D'UN ACCELEROMETRE PIEZO-ELECTRIQUE
SUR UN ROBINET D'AIR COMPRIME
Figure 8
266

TYPICAL SIGNAL SHAPE FROM A PIEZOELECTRIC ACCELEROMETER
IN CASE OF MECHANICAL SHOCKS ON THE STRUCTURE
ALLURE TYPIQUE DU SIGNAL DELIVRE PAR UN ACCELEROMETRE
FIXE SUR UNE STRUCTURE QUI EST LE SIEGE
DE CHOCS MECANIQUES REPETES
267
Figure 9

Friqutncy value
100 x initial value
(Encastrtment)/ / / / /
Profondeur relative
d< 1'cntaiU.c (P/D in %)
10 20 30 40 50 60 70
Relative depth of the crack (P/100 x D)
VARIATION OF THE FIRST BENDING MODE FREQUENCYWITH THE CRACK DEPTH FOR A CANTILEVER BEAM
VARIATION DE LA PREMIERE FREQUENCE PROPRE EN FLEXION
D'UNE TI6E ENCASTREE LIBRE EN FONCTION DE LA PROFONDEURD'UNE ENTAILLE A L'ENCASTREMENT
Figure 10
268

Enregistreur-lecteur de
cassette magnetique numenquc
Cassette recorder
Rack d'alimentdtfon stobilisee;|
basse tension :
Low voltage DC power supply
Voyants et fusibles d'alimentation
des boitiers electron iques —locaux (accelerometres
)
Connection (with fuses and
sighting slits) to acceierometers
and associaied electronics
Panier central contenant
le microprocesseur et
ses peripheriques
Main electronic rack
microprocessor and
peripherals boards
Venttlateurs
Electric fans
Tirol" r
Drawer
THE PERMANENT DATA ACQUIS/HON SYSTEM
PHOTO DE LA BAIE D' AUSCULTATION (FACE AVANT)
i
Figure 11
269

Enregistreur 6 cassette
I Cassette -recorder
Front panelFace avant
Interface
Q1 ?
5 S
12 "Logical st ates"(open closed)
of the cutout valves VA-Vi
12 contacts a . ,
'fin de course VA.Vl" Ro\% SpeerfVitesse
LL_1 1EL Vit.
12
MICROPROCESSEUR
MICRO
PROCESSOR
SCAN (U)
MPX (13 MPX (13
rnr tp24 niveau* vibratoires
2< Vibration levels
lnterface(lB) aAuxilliai're
(teletype etc..)
M W
TF (18. TF ©
Auxiliary
6 temps defermeiure VA
MPX (13
TTT
6 temps defermetureVI
6 Closing times VA \ Closing times VI
6 ouvertures des S.R.
6 Position of the HP control valves
Power output of the plant
H : Carte horloge Electronic clock boardSCAN: Multiplexeur 2'm< niveau convert isseur analogique dioital.
Multiplexer + analog-digital converter boardMPX : Multiplexeur 1er niveau Multiplexer boardMW : Carte puissance (amplif icatcur d'isolement) Power output boardTF : Carte temps de fermeture Closing time boardE.L : Carte etats logiques "Logical states" boardVit : Carte vitesse Rotor speed board
PRINCIPLE OF THE DATA ACQUISITION SYSTEM
SCHEMA GENERAL DE PRINCIPE DU SYSTEME D'ACQUISITION
270
Figure 12

«J .eD.
Oo
-c °0. o
o>>*>L.-*-»
-
VO L.
Co (1)
<u
tj 01V. -Qo 1—o 3<u OC£ o
in
en
o.3OU3O%>
CD
0/47V4 ACQUISITION PRINCIPLE
PRINCIPE DE (.'ACQUISITION DES DONNEES
Figure 13
271

CLOSING TIME REFERENCE CURVE
COURBE " POINT ZERO"D'UN TEMPS DE FERMETURE
272
Figure


CO
ec3
i
0»UJ Zh- UJ
O)CM
00
UJuztxto ,
? *
3 o-oi—I
—
—I
—
0'9—p_9*2
a•
to
to
_ t
oCM
o-cP
01* o
Figure 19
277

11
cncn
CO
UJ zUJ
Uj
2E
1
i
sUj
o
1
cnCM\CD
J
oCM
> ?> °— zZ uj
oa
I
I
a*
""" O
2 \o is
0*91 731
01* o
—i
—
o-s
CO
oco
to
oCM
o-cP
Figure 20J
278

VIBRATION LEVELS FUNCTION OF POWER OUTPUT
POINT ZERO NIVEAUX VI BRATOIRES PUISSANCE
279

AN APPROACH TO MONITORING EXISTINGUTILITY TURBOGENERATORS
S. DoughtyRadian CorporationAustin, Texas 78766
Abstract: A three stage program of minicomputer based, continuous moni-toring development and application is currently in progress on severallarge turbogenerators. The first stage is a period of planning the pri-mary development effort in terms of review of existing vibration sensorsselection of additional sensors, and identification of operating param-eters which influence vibration. The second stage involves gatheringdata in many different operating states in order to develop a vibrationcomparison algorithm which removes the effects of the operating state.In the final stage, the machine is monitored quasi-continuously with theintent of detecting progression of failure modes as changes in the vibr-ation response of the machine.
Key words: Vibration monitoring; vibration signal processing; rotatingequipment
INTRODUCTION
The sudden, unplanned outage of a utility turbogenerator resulting frommechanical failure is, in the least severe case, a major hardship forthose served by the utility. In worse cases, castrophic failures canresult in millions of dollars damage and even loss of life. Many equip-ment failure modes are progressive in nature, and thus lend themselvesto detection in a machinery monitoring program. With early detection,only minor repair may be required while the load is shifted elsewhere at
no inconvenience to the customer. The central goal of a machinery moni-toring program is to anticipate failures before they actually occur, and
thus, to allow for a planned, orderly shutdown of the machine. Compari-son of the costs and benefits makes proper monitoring mandatory at the
present time.
A turbogenerator monitoring program begins with assumptions about theinformation available regarding the state of the machine. It is usuallyassumed that a machine with no progressive failures occurring has mini-mal vibration during operation. Increasing vibration is presumed to beassociated with the progression of one or more failure modes. This sug-gests that the measurement, analysis and comparison of present vibrationwith previous vibration will allow the prediction of approaching fail-ures. Many vibration phenomena occur at the fundamental rotational
280

speed of the machine, which is 60 hz for a 3600 rpm machine. For somefailure modes, high frequency spectral components are generated whichbecome apparent earlier than the fundamental components. Detection of
these high frequency components will give a greater lead time for cor-rective action. Other phenomena associated with turbine blading alsooccur at relatively high frequencies. Comprehensive monitoring thus re-quires a broad spectrum approach. The Fast Fourier Transform algorithm,along with signal processing techniques from the sonar, radar, and com-munications fields are the tools for extracting useful information fromthe observed vibration data.
Radian Corporation has undertaken to monitor several large, existingutility turbogenerators using both vibration and acoustic emission in-formation. The vibration monitoring aspects are described below. Thiswork is presently in different stages at several sites.
MONITORING SYSTEM HARDWARE
Monitoring a large turbogenerator entails the rapid acquisition of largeamounts of data, the need for on-site reduction for data acceptance orrejection, and a need for versatility as the monitoring program develops,
i This all points to a minicomputer based monitoring system such as willbe described.
Vibration data is taken from the machine via vibration sensors installedas part of the monitoring program and, in some cases, other pre-existingvibration sensors as well. These sensors are accelerometers , velocime-ters, and various types of displacement sensors as indicated for themeasurement situation. The resulting analog signals are the primary vi-bration data for the monitoring program. A multiplexer sequentiallysamples the various sensors, either singly or in pairs, under computersoftware control. These analog signals are digitized in a high speedanalog to digital converter. Computer selectable low pass filters areprovided between the multiplexer and the computer input to remove thehigh frequency components before the signal is digitized and thus avoidaliasing. Switchable filters are required for compatibility with thevarious sampling rates of the analog to digital converter. The computer
j system consists of a minicomputer with 64 K memory and also a disc unit.A magnetic tape unit is provided to transfer information from the mini-computer monitoring system to a large, central site computer. A graph-ics terminal is included for spectra, orbits, and other displays of in-terest to an analyst at the monitoring site.
All primary vibration data is obtained through the multiplexer and high! speed analog to digital converter acting directly under computer control.
IAt the same time, a low speed, programmable data acquistion system gath-ers operating parameter values. This information is held in the lowspeed system until requested by the computer. The application of thisequipment will be in three steps: an initial study period called PhaseI, a development period called Phase II, and an on-going program of con-tinuous monitoring, Phase III.
281

MONITORING PROCEDURE
Initial Study - Phase I
The initial study, or Phase I, is a period of learning how to monitor aparticular machine. While there are similarities among machines of agiven class, the details of each machine must be considered for a suc-cessful monitoring program. Most utility turbogenerators of recent vin-tage are equipped with some monitoring equipment. In most cases, thesignal processing portion of the existing monitoring system is inade-quate for the present monitoring program, however, the existing vibra-tion sensors may be useful. Remembering that the existing vibrationsensors were, in most cases, designed for low frequency response and on-ly simple signal processing, the initial study begins with an evaluationof the existing vibration sensors in the light of the signal processingto be performed here. This should be an evaluation of the actual trans-ducers as they exist, not simply an evaluation of their specifications.Anticipating the need for additional vibration sensors, a survey is alsomade for supplemental sensor sites. The principal concerns of this sur-vey are access, environment at the sensor site, and value of data fromeach site. On existing machines, access to the rotor is generally limit-
ed to areas adjacent to the bearings or at the couplings. High temper-atures and oil mist are typical adverse sensor environments encountered.A mathematical rotor dynamic analysis may be used to predict vibrationfrequencies, amplitudes, and the location of nodal points. This analy-sis can be of limited value since the required detail design informationis generally considered proprietary. Much of the same information maybe obtained from the pre-existing vibration sensors, within the range of
sensor credibility.
One of the major efforts of Phase II is the correlation of vibrationspectral components with the operating state of the machine. In order
to do this, it is necessary in Phase I to identify those operating para-
meters which may be expected to influence the vibration response. These
include the electrical load, various steam temperatures, stator and cas-
ing temperatures, and the exciter current. The experience of the oper-
ating personnel is valuable in identifying these operating parameterswhich must be monitored in Phase II.
The full hardware complement described in section 2.0 is not required
for Phase I. The operating state parameters to be monitored are select-ed during Phase I, and only in later stages is the low speed data acqui-
sition system required to record them. If the low pass vibration signal
input filters are not available, some aliasing will occur but will not
have a large effect on the results of Phase I. Since all necessaryanalysis can be performed in the minicomputer, the tape system is not
needed to return data to a central site for processing. The requiredcomponents are the minicomputer with disc unit and the high speed analog
to digital converter with multiplexer.
282

Development - Phase II
The emphasis of Phase II is development of the means to extract usefulinformation from the raw vibration data. The full hardware complementdescribed in section 2.0 is required for this effort. The low speeddata acquisition system regularly samples and holds the list of operatingparameters that affect vibration. These are the operating state para-
meters associated with then current vibration spectra. Broadband vibra-tion data is obtained from the vibration sensors that were supplementedon the basis of Phase I results.
The intent of vibration monitoring is to detect failure modes in progressby observing changes occurring in the vibration spectra. Yet, the oper-ating parameter list developed in Phase I clearly recognizes the depen-dence of the spectra on the operating state of the machine. The directcomparison of spectra from two different times will reflect both the dif-
I ferent operating states (probably different electrical loads and associ-ated steam flows) and possible failure mode progression, in an insepara-
I ble fashion. In order to compare spectra obtained at different times andcorrespondingly different operating conditions, it is useful to define a"Standard Operating State". The standard operating state is a machine
|condition defined by specified values for each of the monitored operatingparameters. Associated with the standard operating state are the vibra-tion spectra that would be observed if the machine were actually opera-ted at the standard operating state. These spectra vary only with thestatus of the failure modes. An algorithm is required to translate thespectra associated with an actual operating state to equivalent spectrafor the same machine condition at the standard operating state. Thereis some statistical uncertainty associated with the equivalent spectra.When spectra from different times have been reduced to equivalent spectrain the standard operating state, any differences exceeding the uncertain-ty can properly be ascribed to physical changes in the machine, i.e., the
progression of a failure mode. The development of the necessary algo-rithms begins with the correlation of spectral components and the opera-ting state parameters. The first approximation to the algorithm is a
linear relation between spectral amplitudes and operating state parame-ters. This is extended as a power series expansion about the standard
;
operating state with as many terms as required. For this reason, it is
best for the standard operating state to be chosen as a central, interiorpoint of the operating variable domain, rather than a boundary point ofthat domain. The algorithm development requires acquisition of largequantities of vibration data representing widely varied operating statesfollowed by a regression analysis. The necessary observed spectra arerecorded on tape and returned to a central site for the correlation andalgorithm development work.
!Early in Phase II, vibration measurements are made and processed into
i| the baseline spectra. It is not necessary to know if a progressive fail-
j
ure mode is present at the time the baseline data are taken. It is in-
tended to use this data only for comparison, and not in an absolute
283

sense. When a satisfactory standard operating state reduction algorithmis defined, the baseline spectra are transformed to the standard operat-ing state and stored in the minicomputer to serve as a basis for compar-ison in Phase III.
When a particular spectral component or group of components has attract-ed attention, the question remains, "What does it mean?" One of themost formidable tasks in any monitoring program is the identification ofspectral lines with physical phenomena existing within the machine. Ex-perience is certainly a major tool in this effort. Much is also learnedfrom the manipulation of mathematical models to predict expected spec-tral components, in so far as the necessary physical data is available.Determination of these physical parameters from machine drawings is a
lengthy, expensive process even if the drawings are available. An at-tractive alternative is the determination of these parameters directlyfrom the physical part during an open case inspection modal analysis andidentification procedures.
The final step in the monitoring program development is the establish-ment of warning criteria and threshold values. Here again, experienceand mathematical models each play a roll in the definition of these pa-rameters. The experience of power plant operating personnel may be con-sidered to define upper limits on many of these variables, but in manyrespects, this judgement is too coarse to be employed with the spectralinformation available. Comprehensive, well-verified mathematical modelsprovide a means to assess quantitatively the impact of proposed failuremechanisms as they affect the vibration spectra. The threshold levelsrepresenting significant deviations from the baseline spectra are set asfractions of the warning criteria which have been established.
Continuous Monitoring - Phase III
The final stage in the monitoring program is establishment of quasi-con-tinuous monitoring under computer control to continue indefinitely in
the future. In Phase III, each of the vibration sensors is regularlysampled at frequent intervals by the computer via the high speed analogto digital converter. The low speed data acquisition system continues to
supply the operating variable values. The observed spectra are proces-sed almost in real time, transformed to the standard operating state,
and compared to baseline spectra. Only spectra that deviate from the
baseline by more than a prescribed threshold are saved. These excep-
tional spectra and associated operating states are recorded on tape. If
the deviation exceeds the warning level, this information is relayed to
the operating personnel.
The tape with its record of exceptional spectra and their associated op-
erating parameter values is periodically returned to the central site
for off-line analysis and interpretation. This includes possible recom-
mendations for maintenance work, shut-down of the machine, or other op-
erating changes. The tape also provides the basis for further refine-
ments to the standard operating state reduction algorithm and improve-
281)-

ments to the threshold and warning criteria. The payoff for the entire
monitoring program is expected to occur during this Phase III activity,,
the on-going analysis and interpretation of the data generated leadingto the early detection of problems.
285

ENHANCING MACHINERY PROTECTION THROUGH AUTOMATED DIAGNOSTICS
J. L. FrareyShaker Research CorporationNorthway 10 Executive ParkBallston Lake, NY 12019
Abstract: Shaker Research Corporation under contract to Electric PowerResearch Institute, has installed an automated vibration monitor systemin Northeast Utilities Millstone II Nuclear Power Plant. The objectiveof the program is to demonstrate that the system can provide insightinto the condition of critical pumps and thus guide the planned mainten-ance during scheduled shutdowns. To provide this insight, the systemmust be capable of processing a large amount of vibration data andbased on the results, draw conclusions about the condition of the unit.Both aspects of the system will be discussed.
Key Words: Automatic diagnostics; digitizes data; spectrum analyzers;steady state mode; tolerance vibration levels.
It is becoming quite common for large rotating machinery to be equippedwith some type of vibration transducer along with their associated mon-itors and alarm systems. These systems may have been installed initial-ly as alarm devices to warn of out of tolerance vibration levels or evento automatically shutdown the machine if a given vibration level is
exceeded. It has become readily apparent to the maintenance engineerthat these transducer signals when analyzed periodically by moderndata processing equipment such as real time spectrum analyzers haveprovided additional information on mechanical condition. Signal char-acteristics associated with certain defects may be recognized long be-fore an alarm level. Trend information on the amplitude of vibrationcomponents also provide an insight into the rate of machinery deteriora-tion. All of these data allow better machinery protection and improved
maintenance efficiency during scheduled (or unscheduled) plant downtime.
Two problems are quickly encountered by one starting down this path to
improved maintenance. How does one attain the skill necessary to rec-
ognize significant signal characteristics and even if it can be attain-
ed, how does one inspect, compare with the last inspection and trend the
data from a large number of rotating machines. Under the sponsorshipof the Electric Power Research Institute (EPRI) , Shaker Research Corp.
has installed an Automatic Vibration Monitor System at Northeast Util-
ities Millstone II Nuclear Power Plant. The objective of this programis to demonstrate solutions to both these problems. This paper de-
scribes some of the aspects of the program and the monitor system.
286

System Requirements . Drawing on many years of experience in machinerytroubleshooting, it was concluded that a system could be built thatcould automatically recognize some of the more common signal character- •
istics that are related to machinery defects. In effect the systemwould become an automatic diagnostic system. Additionally, for thosesignals and defects not automatically diagnosed, data must be saved andrecalled in a format that allows a diagnosis to be made. Finally, it
should be easy to "teach" the system new symptoms so that the extent ofautomatic diagnostics will continue to expand.
Clearly, if the automated diagnostics is going to be based on years of
human troubleshooting experience, then the system must be capable ofanalyzing data during machinery operating conditons that have beenfound to be productive in the past. These have included:
1. Normal analysis of vibration spectra for machinery steady stateoperation
.
2. Analysis of transients such as start-stops, amplitude vs. speedand waterfall data processing is included.
3. Demodulation of high frequency resonances to determine thesource of excitation, i.e., rubs, ball bearing defects, etc.
4. Separation of mechanical and electrical runout from true vi-bration data for displacement probes.
This automated monitor system also includes the provision for continuouson line monitoring of overall signals from each sensor. If the signallevel from any sensor exceeds the warning or alarm level, the computeris automatically alerted and the system switches into the transient modeto gather and analyze data from the distressed machine at this time.
System Description . The three modes of operation are shown in Fig. 1.
In start stop mode, the system digitizes data from all sensors onthe machine. After the start or stop the data is processed. Data pre-sentation equivalent to tracking filter plots are calculated using a
Discrete Fourier Transformer for the first three harmonics and are com-pared with the last start or stop. Another presentation known as a
waterfall plot is also produced and stored for future reference. Atypical waterfall plot is shown in Fig. 2.
In the alarm mode, the computer is interrupted when either a warning oralarm level is exceeded on the continuous monitor panel. The systemdigitizes data from the machine sensors, and checks to see if the signallevel is still increasing. When the signal level no longer increases,the trend of the overall amplitude of each sensor is plotted.
The system operates in the steady state mode the overwhelming majorityof the time. In this mode, the system cycles through all sensors andproduces spectra from each sensor. These include low frequency spectraas shown in Fig. 3 and also high frequency spectra as shown in Fig. 4.
Comparisons are made with the last spectrum and with original data. Asnew signals appear or signals always present vary in amplitude thesefacts are printed out along with the source of the signal and its seri-ousness. Fig. 5 is a typical diagnostic printout. The signal ampli-
287

tude is also stored in a trend area. These data may be retrieved andplotted as shown in Fig. 6.
The operator may take control of the system at any time and has severaloptions at his disposal to either change system constants, to extractinformation or to run system diagnostics. A menu is presented to theoperator showing his choices and this is shown in Fig. 7. Using thisoption, the operator may increase the diagnostic capability of thesystem as new symptoms appear and are related to known mechanical deg-radation.
288

3<
H%
uQH H OCO w
289

290


292

CO
o\HI
CJI
co£^
C5 W to to
o
Of
1=4
H H
tO
H
tO
OJ
toH
gCO
CO
K K K K Ko o o o oCO CO CO CO CO& &S & J2J fe|
w M w w wCO CO CO CO CO
293

29h

o


SESSION V
NEW TECHNOLOGY
Chairman: William R. McWhirter, Jr.
Naval Ship Research and Development
Center
Co-Chairman: Henry R. Hegner
Mantech of New Jersey Corporation


REPORT ON INDUSTRY/JOINT SERVICES PROJECTTASK GROUP 1-d
J* P. WrightHughes Aircraft Company-Los Angeles, Ca. 90009
Abstract: Recognition by the armed services of a need fordefinition in Automatic Test Arena led to the establishmentof first a Navy/Industry project and later to the establish-ment of a Tri Service/Industry project. The Tri Serviceproject, started in the last quarter of 1976, includednumerous committee meetings, a general meeting in Januaryof 1977 and a major working symposium in April of 1977. Thesymposium attendance was 860 with an approximate 60/40 ratioof industry/DOD attendance. The project included a specifictask group to deal with the application of Automatic TestTechniques and Equipments to the testing of non-electronicequipments.
The non-electronic testing group, chaired by Donald A. Prueof Hamilton Standard, presented a series of findings re-garding the application of automatic testing to non-elect-ronic equipments. These findings include the recommendationfor:
• Equipment failure mode analysis• Equipment designed for testability• Standardization of test interfaces
The implications of these recommendations in terms ofacquisition costs were recognized by the group and the needfor an effective means of demonstrating cost effectivitywas established.
Key words: Military systems; non-electronic equipment;testing.
In October of 1975, the Navy and Industry established anAd Hoc Automatic Test Equipment project under the jointsponsorship of AIA, EIA, NSIA, SC/A, and WEMA. The effortsof the participants in this project were directed towardsestablishing communication between the Navy and the various
299

members of industry who are concerned with the utilizationand production of the automatic test equipments. The suc-cess of this project led to a tri-service/indus try-briefing in June of 1977 and the formation of the Industry/Joint Service ATE project in the fall of 1977. Thisproject had expanded horizons in that the problems of allthree services were considered with a corresponding ex-pansion of the industrial representation. It is apparentthat this project, like its predecessor, has been highlyproductive and will lead to some major realignment in thefield of ATE.
The organizers of the Navy project, recognizing the needfor some degree of automatic testing or monitoring ofnon-electronic equipments, established a specific taskgroup to collect and present data concerning this field.This task group, designated A-4 Propulsion, Electrical,and Auxiliary Systems Monitoring, concerned itself inmain with these elements as installed in ships. One ofthe major findings of this group, which will come as nosurprise to the MFPG members, is that the need for improvedtest techniques for non- electronic equipments is morepressing than in the area of electronic equipment testing.
As a consequence of this finding, Task Group Id was formedin the joint service project to carry on the work startedby the A-4 group. The Id group was chaired by Don Prueof Hamilton Standard and ably supported by W. (Bill)McWhirter, Jim Johnson, Barney Poppet and Hans Kohler fromthe Navy and J. (Jeep) Hnatczak and R. (Bob) Watts of theArmy.
In the formative stages of Group Id, it was decided tolimit the scope of the task to a small class of complexmachines, rather than the more encompassing field coveredby the previous study. It was hoped that by limiting thescope of the effort, a more in-depth analysis of therequirements could be achieved. As you well know, thefamily of complex machines which have been subject tothe most intensive study and for which the most extensiveset of field test data exists, is the internal combustionengine, i.e. gas turbines, diesels, and spark ignitionengines. Accordingly, the project was limited to a studyof these devices and their associated auxiliaries. Afurther limit introduced in the course of the studyreduced the scope to applications in which these deviceswere used as propulsion units for ships or land vehicles.This excludes, in the case of gas turbines, aircraft
300

applications. This latter restriction was imposed due to asimultaneous study by SAE which provided more depth in thearea than could have been achieved within the frameworkof this project.
The project effort included:
• Task group meetings.• Individual data collection and analysis by
members
.
• A joint workshop in San Diego of all task groups.• Preparation of the final report including
recommendations.
In addition to these activities which were directed to thetechnical effort, there were numerous meetings between thechairmen of the various task groups and an executivesteering committee. These meetings provide a forum atwhich the general policy of the project and specificdirection of the activities of the task groups could bediscussed and developed.
The study showed that within the restricted field consider-ed :
• There are numerous commercial applications in which costeffectivity has been adequately demonstrated.
• The methods used for proving cost effectivity in thecommercial world include setting values on availability.A method of carrying this through to the military isrequired.
• There are numerous military applications which havebeen carried far enough to warrant implementation.
• As a minimum, one major military program must be fullyimplemented - full production implementation. The needfor field data feedback from such a program is requiredfor the development of future programs.
In the more general area concerned with other types of non-electronic equipments, the picture is not so well defined.The major difference is related to the relative attentionwhich has been given to various types of machines. It isapparent from available data that the following elementsrequire consideration:
• There is the same need for a method to assign a dollarvalue to availability.
301

• There is a need for system by system failure modeanalysis
•
• There is a need for standarization of instrumentationand test interfaces.
• There is an opportunity for the military to begin adesign for testability program on new equipment.
Task Group Id will meet in New Orleans in December of 1978to review and approve the final report which will be onesection of the final report for the Industry/Joint ServicesProject Report in 1979. The opportunity to exchange ideasregarding an emerging technology has been a rewardingexperience for the participants and it is hoped that thedata provided to the joint services will aid in solvingsome of the problems associated with the maintenance ofnon-electronic equipment.
502

A POLYMER SENSOR FOR MONITORINGBALL-BEARING CONDITION
Seymour Edelman, James M. Kenney,John F. Mayo-Wells and Steven C. Roth
National Bureau of StandardsWashington, DC 202 34
Abstract: Noise spectra have been used frequently in the past to detectfaulty bearings and to provide some indication of how the faultsworsened with time. Usually accelerometers or microphones were usedto detect the noise spectrum. This paper describes how the use ofpiezoelectric polymer sensors coupled with spectrum analyzers now avail-able make this technique more useful. Improvement in accuracy andreproducibility, lower cost, greater convenience, and speed arepotential benefits.
Key words: Bearing noise; failure prevention; machinery noise; noisesignature; non-destructive evaluation; piezoelectric polymer; spectrumanalysis; strain gage.
Introduction
Non-destructive evaluation of ball and roller bearings by detection andanalysis of their noise spectrum is a well-established procedure. It
has been shown that periodic monitoring of the noise spectrum of a
bearing is a useful diagnostic tool.-^j^ Changes in the relative spec-tral power distribution, and especially an increasing proportion of high-frequency components, can give warning of deterioration long beforefailure occurs. The provision of early failure warning has importanteconomic implications, as it permits an operator to replace damagedbearings at a convenient time (e.g., during a scheduled maintenanceperiod) and may prevent consequent damage to expensive components suchas machine spindles or even to entire machines. All too common areexamples of machine design in- which sudden failure of a bearing (for
example, a bearing supporting a massive rotating assembly or part of a
pump for lubricating fluid) results in extensive damage.
The sensors used in most bearing studies have been either accelerometersor microphones. There are, however, several deficiencies associatedwith the use of these instruments for analyzing bearing condition. Formicrophones, the presence of numerous sound sources in addition to thespecimen bearing itself makes analysis difficult, and requires incon-venient and expensive noise shielding which may not be fully effective.Accelerometers having adequate high-frequency response are usuallyexpensive; more important concerns are that they conventionally requirea machined mounting flat, occupy a not negligible volume, and may havesufficient mass to bring about significant changes in mechanical loading
303

in some applications. Also, it is usually impossible to mount anaccelerometer close enough to the specimen bearing to avoid interfacesin the path between bearing and accelerometer; such interfaces willgenerally constitute discontinuities in acoustic impedance.
A few years ago, Jesse Stern of the NASA Goddard Space Flight Centersuggested that the use of piezoelectric polymer gages (responding toquantities such as strain, force, acceleration) would avoid many ofthe difficulties associated with conventional sensors. Staff of thePolymer Science and Standards Division, NBS, have designed and con-structed a number of polymer sensors, both piezo- and pyroelectric fora variety of applications, and developed means for evaluating theirperformance. This report describes an experiment aimed at investigatingthe usefulness of piezoelectric polymer gages as indicators of bearingcondition. The thesis offered is that polymer gages provide a practicalalternative to accelerometers with advantages of importance in someapplications.
Construction of a Polymer Gage
The sensing element of a polymer gage is made from the poled portions ofa thin sheet of polymer material. "Poled" refers to the process bywhich the material is made piezoelectrically active—in this case, bythe application of an electric field to metal electrodes in contact witheach side of the film while the material is at an elevated temperature(above room ambient) . A simplified picture of the poling process is
that some of the electric dipoles present in the polymer structure tendto become oriented with respect to the applied electric field (which is
of the order of 10^V/m) when the material is heated, and remain orientedwhen the polymer is cooled and the field removed. The result is thatinstead of a random distribution of dipoles pointing in all directions,there is a preferred orientation in one direction, and the materialresponds to strain with a change in its internal electric field andhence with charge appearing at its surface.
Each gage was constructed with the following steps (some of these stepsare shown in figure 1)
:
(1) An aluminum electrode pattern is evaporated onto one surface of the
starting material, which in this case is polyvinylidene fluoride (PVDF)
in sheets 25 ym thick. The pattern for single gage element (each gage
uses two elements) consists of a dot 2 mm in diameter with a 100 X 0.4
mm "tail", which will serve as connection to the dot for poling and in
the completed device.
(2) The reverse surface of the sheet immediately opposite the 2 mmdiameter dot is covered by a second metalization to form the groundelectrode. Care is taken to insure that the ground electrode isopposite as little of the tail electrode as possible so that there is

minimal contribution from the tail to the signal from the completeddevice (only polymer directly between energized electrodes becomespoled)
.
(3) Electrical connections are made to the tail and shield electrodes,the poling field applied, and the material heated to approximately100°C. After 30 minutes, the material is cooled to room temperatureand the field then removed.
(4) Each gage is assembled as a sandwich of two elements bonded togetherwith flexible, insulating epoxy resin, with the dot-and-tail electrodesin contact as the "filling" and the shield electrodes as the outersurfaces. A short length of copper wire is inserted lengthwise betweenthe ends of the lead electrodes and bonded in place with conductiveepoxy resin.
(5) A single large aluminum electrode is evaporated onto each exteriorsurface of the bonded gage. This electrode will serve as part of theelectrical shielding of the completed gage. The wire connecting tothe interior electrodes is masked (together with the end portion of thebonded sandwich) so that no aluminum is evaporated onto it, which wouldresult in a short between the interior electrode and the shield.
(6) A miniature coaxial connector is made an integral part of the gage,with its center conductor soldered to the wire and the body of theconnector and the ends of the PVDF strips potted together with insu-lating epoxy resin.
(7) Electrical connection between the shield of the connector and theshield electrodes is made with conductive paint, which is applied tothe lead structure for half its length or more. When the paint hascured, the gage is complete.
The finished gage is approximately 60 ym thick at the sensor. Gages asthin as 15 ym have been constructed from 6 ym PVDF sheet. Aluminum is
generally used as the electrode material because it is the easiest toapply. However, for applications requiring submersion in water or forbiomedical applications gold electrodes are preferable. Other electrodematerials that are compatible with the fabrication process and with PVDFare nickel and indium. Note that the gage construction places therelatively heavy connector far enough away from the active element tominimize mass loading.
Evaluation of Polymer Gage as Bearing Monitor
Figure 2 shows the apparatus used in this work: a motor-driven testshaft supported by two specimen bearings mounted in pedestals. Apolymer gage is cemented in place directly on the stationary race ofeach bearing, and an accelerometer is mounted above each bearing on an
305

aluminum cross piece that connects the bearing pedestals. Both themethod of mounting and the accelerometer locations are intended tosimulate field installation. The apparatus, with aluminum top andbottom plates and a solid steel shaft between the bearings, constitutesa closely coupled mechanical system. In order to reduce the effects ofvariations in motor speed and torque and the transmission of mechanicalnoise to the bearings, the driving electric motor is mounted onvibration isolators and coupled to the test shaft by a rubber belt.For the experiments, both specimen bearings were degreased; one wasrelubricated to serve as the "quiet" bearing, while the other was rundry as the "noisy" bearing.
Preliminary measurements indicated that for the purposes of this study,the members of each pair of gages—accelerometers or polymer gages
—
could be considered identical.
A consideration in comparing the signals from a crystal accelerometer tothose from a polymer gage, is that both frequency response and direc-tional response differ for the two types of instruments. The acceler-ometers used have, according to the manufacturer's characterization, a
peak response at approximately 90 kHz, whereas the resonance corre-sponding to the thickness of the polymer sensor is considerably above2 MHz, and any resonances at lower frequencies are well damped. Forthe kind of measurements used in this study, the accelerometers respondonly to motion along the designed sensitive axis, for these experimentsin the plane of the speciman bearing; the polymer gage provides anapproximately equal output in response to strain in any direction in
the plane of the sensor, which in these experiments includes the
sensitive axis of the appropriate accelerometer.
Figure 3 shows the output of one accelerometer and one polymer gage as
a function of frequency when, with the shaft stationary, the pedestalsupporting one bearing is excited by a PZT (lead zirconate titanate)
piezoelectric ceramic driver cemented to the vertical surface near the
bearing. The amplifier gain for the accelerometer signal had to bereduced to the point that the signal below 30 kHz is in noise, in order
to avoid overloading the instrumentation at the 75 kHz resonancefrequency of the structure. (An indication of the true instrumentationnoise level can be obtained from the accelerometer trace as being less
than -52 dB referred to 0.1 V) . In contrast the output from the polymergage shows a significantly lower and broader peak to the 70 kHz regionand meaningful signal in the low-frequency range, with an average of-35 dB over 10 to 40 kHz. It is conjectured that the peak at 70 kHz is
the result of a resonance from the PZT exciter and does not derive fromthe polymer gage. (Other experiments have indicated that similar gages
produce nearly constant output over the range 100 kHz to 1 MHz in
response to a hydrostatic pressure pulse; this performance can be
interpreted as demonstrating no resonance behavior to the upper reso-
nance.) This experiment demonstrates that the polymer gage does respond
306

to high-frequency signals while the accelerometer response falls offrapidly above its resonance
.
The next several figures show output as a function of frequency fromboth quiet and noisy running bearings . Figure 4 shows recorded polymergage signals from the quiet and noisy bearings over a frequency rangefrom 0 to 100 kHz. Examination of the two traces shows that there isa definite difference between them, with the level at a given frequencyin the trace from the noisy bearing greater than that from the quietbearing if the difference between the two traces is significant at thatfrequency. It is obvious that the signal falls off rapidly withincreasing frequency. Note also the rather noticeable difference inthe 40-60 kHz region. Figure 5 shows a similar set of traces of theaccelerometer signals from the quiet and noisy bearings. Examinationof the two traces shows less marked differences between them, and atsome frequencies the higher level signal is associated with the quietbearing; there is no roll-off with frequency probably because the highfrequency components are amplified by the mechanical resonance of theaccelerometer. The behavior of the mechanical system which leads tothese four traces can be explained by considering the effect of theinterfaces between the steel stationary race of the bearing and thealuminum pedestal. Unavoidable machining errors, differences in surfacefinish, and difference in specific acoustic impedance cause most of thesound generated in the bearing to be reflected at the interface and buildup a reverberant sound field in the races of the bearing. Little soundis transmitted across the interface to the pedestal and the crosspiecejoining the pedestals. Very much less sound is transmitted across bothinterfaces to the other bearing. Thus most of the sound generated in
each bearing stays in that bearing. Most of the small amount of soundthat gets into the aluminum structure stays there and builds up anotherreverberant sound field which, above about 15 kHz, takes the form of a
standing wave pattern. The signal from either accelerometer at a
particular frequency depends on its location relative to the standingwave pattern and has little relation to the nearer noise source. In
contrast, the polymer gage, in direct contact with its intended noisesource, sees negligible contribution from the second source, and internalreflections of the intended source from the local interface serve to
augment the desired signal.
Discussion and Conclusions
Fundamental work predicting the frequencies to be observed, which resultfrom specific types of defects in specific locations for ball bearingswith given dimensions and numbers of balls, has been reported by a
number of workers. ^ The purpose of our work has not been to carryout any detailed analysis of frequency or mechanical bearing parameters.It has rather been to investigate whether changes in the character ofthe signals from an undamaged and from a damaged bearing can be detectedusing polymer gages and if polymer gages show advantages compared to
307

crystal accelerometers in this application. We believe that the resultsjustify a positive conclusion.
It may be of interest to contrast some of the properties of polymergages with those of crystal accelerometers to see why polymer gagesshould be particularly useful as indicators of bearing performance. Thegages are low in mass with flexible sensing elements that conformreadily to any curved surface; these properties, together with theirmaterials of construction, permit them to be bonded in place in closecontact with the bearing noise source so that sound energy from othersources is attenuated relative to the desired signal. The fabricationprocess lends itself to constructing gages of virtually any desiredshape and in a wide range of sensing areas. The gages tend to be freefrom resonances below several hundred kilohertz (the range of interest)and are in principle inexpensive to construct so that it becomespractical to mount them in place permanently on every critical bearingin a given piece of major equipment.
(A possible disadvantage of polymer gages relates to the temperatureresponse, both with respect to a pyroelectric contribution and to changein gage sensitivity as a function of temperature. Future work maydetermine if this is a problem in practice , as well as provide a moredetailed analysis of gage performance.)
Conventional crystal accelerometers, on the other hand, have much
greater mass than polymer gages, even for relatively small high-fre-
quency types. The accelerometer housing is usually designed to screw
into or be bolted to a flat machined surface, with a requirement for
good contact over the intended mounting surface. Accelerometer mass and
the relative rigidity of signal connections may preclude adhesive bond-
ing. Accelerometers may have sensing crystals of different sizes, but
it is not usually feasible to tailor size to application, except
approximately. As has been noted, crystal accelerometers will have
resonances in their response substantially below 100 kHz.
Accelerometers vary widely in cost, but apart from calibration costs
(which, although by no means a small part of instrument cost, may be
assumed to be the same for polymer gages) , the high-frequency types
most suited for the bearing and other similar applications are rela-tively expensive.
Our overall conclusion is thus that polymer gages have a good potentialfor monitoring bearing and other machinery noise, particularly withrespect to nondestructive evaluation of performance , and that for some
applications the polymer gage has demonstrated distinct advantages over
the use of more conventional sensing instruments.
This work was supported by the Office of Nondestructive Evaluation.
308

References
1. A. S. Babkin and J. J. Anderson, "Mechanical Signature Analysis ofBall Bearings Using Real Time Spectral Analysis", Application Note3, Nicolet Scientific Corp., Northvale, N.J. (Sept. 1973).
2. George F. Lang, "Shake, Rattle, or Tap, or How to Conduct VibrationTests", Application Note 10, Nicolet Scientific Corp., Northvale,N.J. (Oct. 1975)
.
3. J. J. Broderick, R. F. Burchall, and J. F. Clark, "Design andFabrication of Prototype System for Early Warning of ImpendingBearing Failure", MTI Tech. Report # MTI-71TR1, Prepared for NASA-Marshall Space Flight Center, Huntsville, AL, Contract MA58-25706,(Jan. 1972).
4. D. K. Snediker, L. F. Sturgeon, and S. M. Weinberger, "Character-ization of Miniature Ball Bearings by Acoustic Signal Analysis",Proceedings of the 17th Meeting, Mechanical Failure PreventionGroup, Tech. Report #10, (Mar. 1972).
309

310

311

•10 dB
£ -20 dB
-30 dB
5-40 dB
-50 dB
20 40 60 80
FREQUENCY (kHz)
100
2
-10 dB
-20 dB
30 dB
40 dB -
-50 dB •
40 60 80
FREQUENCY (kHz)
100
FIGURE 3. OUTPUTS OF ACCELEROMETER AND POLYMER GAGE IN RESPONSETO EXCITATION BY PZT DRIVER, AS A FUNCTION OF FREQENCY.
312

3
10 dB '
-20 dB
•30 dB
-40 dB -
-50 dB -
40 60 80
FREQUENCY ( kHz )
5
-10 dB
20 dB
•30 dB
-40 dB
50 dB
40 60 80
FREQUENCY (kHz)
FIGURE k. POLYMER GAGE OUTPUTS IN RESPONSE TO SIGNALSFROM BEARINGS AS A FUNCTION OF FREQUENCY.
313

-10 dB
20 dB
-30 dB
-40 dB -
-50 dB
40 60 '80
FREQUENCY (kHz;
-10 dB
-20 dB
-30 dB
40 dB -
-50 dR
40 60 80
FREQUENCY (kHz)
100
FIGURE 5. ACCELEROMETER OUTPUTS IN RESPONSE TO SIGNALSFROM BEARINGS AS A FUNCTION OF FREQUENCY.
31k

AN INSTRUMENTATION TECHNIQUE TOEVALUATE SPECTRA FOR ENGINE DIAGNOSTICS
Tony CardanB & K Instruments, Inc.Cleveland, Ohio "44142
Abstract: This paper describes a method of using a digitalfrequency analyzer as a "sliding time gate" when analyzing com-plex time signatures (e. g. as those produced by reciprocatingmachines) . To isolate individual events such as valves openingand closing, firing and exhaust pulses, rather than take a com-posite frequency analysis of the complete engine signature pro-duced during one rotation, implies a triggered, movable, variablewidth window which can be used to view each occurrence. Timingcan be with reference to any arbitrary occurrence during a cycle,but a known reference such as Top Dead Center (TDC) is normallyused. An integral part of any flexible Digital Narrow BandAnalyzer should be the settable After Trigger Recording facilityallowing the memory contents to be locked at any time relativeto an incoming trigger pulse. If the incremental settingsavailable on the After Trigger Recording are sufficiently small,this will enable the memory length to be used as a window tolook at any part of the incoming time signal. A triggerableGating System with variable delay and window length will alsobe described. The results gathered from using the techniqueon a marine diesel engine will be presented.
Key words: Gated frequency analysis; Gaussian window; Impulsive,complex signals; Linear averaging; Reciprocating; Records aftertrigger; Tape loop; Time signal; Time window.
Complex, impact-like time signatures are common occurrences innature. The pumping action of the human heart, the punch pressin a busy machine shop and, of course, the structural vibrationand cylinder pressure and temperature variations during theoperating cycle of reciprocating machines are typical examples.The time signal for any one revolution is very complex in thelast instance because of the different exciting forces expe-rienced. These are basically the primary force (the cylindergas force due to combustion or compression) , the secondary forces(the crank mechanism, and piston, ring, bearing and timing gearimpacts) , and the forces generated in ancillary machinery(generator, water pump, valve gear, etc.)
.
315

The impulsive signals produced by the combustion process are verylow in repetition rate compared to the natural frequencies of thestiff engine structure. A four-stroke engine will have a firingrate on one cylinder somewhere between 5 and 25 times per secondfor a speed range of 600 to 3000 RPM. Engine block and struc-tural resonant frequency components will be in the 800 to 2000Hz region. Signal pickup can be by a variety of transducers,but most commonly the acoustic signatures (using a good measuringmicrophone)
,cylinder head vibration signatures (using a high
quality accelerometer) , or cylinder pressure signatures aretaken. Each of these is normally related to a "once-per-rev
.
TT
tachometer signal located at some convenient part of the mechan-ical cycle (e. g. TDC) , since each occurrence is uniquely timerelated to the instantaneous flywheel position. Certain occur-rences such as cooling fan noise, coolant cavitation, turbo-charger noise are either non-integra lly related to the rotationalspeed or entirely dependent on other phenomena (e. g. exhaustgas velocity)
„
Noise due to Noise due to Noise due to
Piston Impact K Piston Impact
Noise due to
Pressure Rise
.004 in. Piston Clearance
60Vibration Induced
by Pressure
Fig. 1
.012 in. Piston Clearance
740440
316

To date, most diagnostic techniques are associated with relatingoccurrences on the complex time history to engine timing marks(Fig. 1) . Much experience has been gained in this way, buttechniques do now exist to further extend this valuable technique.
An example of the usefulness of the time-signal analysis tech-nique is shown, relating tight and loose piston clearances. Theimpact noise signal produced by the piston slap is easily identi-fiable. However, this type of analysis precludes the use of thefrequency domain. A doctor listening to a heartbeat with a steth-oscope does not only hear a distinct level but does a runningseries of Fourier analyses of the signal in his mind. He listensfor the low steady "thump- thump" but also for, say, higher fre-quency flutter noises associated with "leaky" valves; each noisetelling him a different story. This series of frequency responseshas up to now only been possible with the use of complexelectronics
.
Tape Recorder
7003 or 7004
plus
Tape Loop Cassette
UD0035
Oscilloscope for Monitoring
Gated Signal
Gaussian Impulse
Multiplier
5623
Signal
to beanalyzed
- * *
Gated
Signal
E * oT>'
4714
To Analyzer
Sinusoidal Trigger Burst Trigger
Use of the Gauss Impulse Multiplier Type 5623 for gating
signals recorded with the 7003 or 7004 Tape Recorders
One of the recorder* fitted with car-
rying case and shoulder strap
Tape Loop Casette Type UD 0035being fitted to one of the tape
recorders
Fig. 2
317

A system developed by B & K Instruments some years ago uses a
Gaussian shaped "time window" to slide along a repeated timesignal. Each repetition was gated at a slightly different pointwith respect to the previous point, and a frequency analysis wasmade of the output of the gate.
The instrumentation required is shown in Fig. 2, and some typi-cal outputs from the Gaussian Impulse Multiplier are shown inFig. 3.
Fig. 3
The Gaussian Impulse Multiplier pulls out individual portions ofthe signal and allows each to be frequency analyzed separately.Without this facility the spectrum obtained would be a smearedamalgamation of all of the separate events occurring in thesignal.
The important factors to note are that 1.) the signal to beanalyzed must be repeated through the analyzer a number of times(this can be by natural repetition if the signal is fully re-peatable or by use of a Cassette Tape Loop addition to an Instru-mentation Tape Recorder, as shown in Fig. 2); 2.) the windowcan be placed anywhere in the time history under review and3.) the width of the gate is variable allowing greater or lessresolution of separately occurring events.
318

Updates of the technique first included replacing the Tape Re-corder by a Digital Transient Recorder, but the most recent ad-vance has been to use the Digital Narrow Band Spectrum AnalyzerType 2031. This consists of a 1024- point digital memory tostore the sampled input analog signal and an FFT processor totransform from the time to the frequency domain. The timehistory length contained in the memory depends on the samplingrate, which in turn defines the upper frequency of the analysis.The memory length can be selected from 40 s to 20 ms, coveringa 0-10 Hz frequency range to a 0-20 kHz frequency range, in a
1-2-5 sequence. External sampling facility is also availablefor other memory lengths. The change in memory length is
equivalent to varying gate widths.
Positioning of the ,rgate"relative to a known point on a fly-wheel is done using the Records After Trigger facility. If theinitiation of a frequency transformation is delayed with respectto the trigger signal, the 2031 Spectrum Analyzer will continueto input data during the delay. The Records After Trigger(R.A.T.) can be varied in 0.1 increments from 0.1 to 9.9 timesmemory length.
The window shape used is not Gaussian in this case but is a
Harming window. The slight degradation of overall filterselectivity is acceptable because of the simplification ofthe hardware used.
The 2031 Spectrum Analyzer has a very significant advantageover previously used techniques in that it has a Linear Averagingmode allowing the Tape Loop to contain a number of firing pulsesand Ttonce-per-rev. " trigger signals. Each firing pulse isslightly different, but since they are analyzed at the sameinstant relative to the trigger pulse, an averaging techniquecan be applied to enhance the repetitive and remove the ran-domness.
A practical measurement was made of a marine diesel enginei rotating at 60 RFM. Each cycle is approximately 1025 ms longand using the 200 ms memory length with the Hanning weightinggives an effective window width of 100 ms. The signal durationwas approximately 5.1 memory lengths and incremental steps of0.3 memory lengths were chosen for the analysis. A LinearAverage of 16 spectra was made at each R.A.T. position. Theresults are shown in Figures M~a and M— b. The signal can beseen to be characterized by an initial high frequency com-ponent and later by a low frequency spike.
319


321

Conclusions
.
Use of modern Spectrum Analyzers with flexible Records AfterTrigger control allows a new dimension in reciprocating ma-chine analysis. Sophisticated and flexible analysis set-upscan be made using the IEEE bus interfacing capacity of ananalyzer such as the 2031 Digital Spectrum Analyzer togetherwith a desk top calculator to control the analysis procedure c
322

THE DIRECT READING FERROGRAPH
Daniel P. AndersonFoxboro Analytical
P.O. Box 435
Burlington, Massachusetts 01803
Abstract: The principle of operation, design, calibration, and a fieldapplication are discussed for the direct reading ferrograph, a systemfor rapid on-site monitoring of wear in oil-lubricated machinery. Theprinciple of operation is the magnetic precipitation of wear particlesfrom an oil sample within a glass tube. Light attenuation measure-ments at two cross sections of the glass tube provide a measure of largeand small wear particles present in the oil sample. Oil samples result-ing in high severity of wear indices may be further scrutinized by ana-lytical ferrography. Calibration of the direct reading ferrograph wasperformed with known weight concentration samples of ferrous wear parti-cles generated in a gear box. Comparison of direct reading ferrographdata to spectrometric data for the same oil samples is made. A typicalfield application and results are discussed.
Key words: Ferrography; machine condition monitoring; oil analysis; oilsampling; wear; wear particles.
Introduction: Ferrography (1), a technique to separate particles fromfluids for microscopic examination and subsequent analysis, was origin-ally developed to magnetically precipitate ferrous wear particles fromlubricating oils, thus the name ferrography. The first application wasto condition monitor military aircraft engines, but now other applica-tions have emerged, including modification of the method to precipitatenon-magnetic particles from both oil and other fluids. This is of in-terest for hydraulic systems where particles of non-magnetic material,such as bits of seal material, found in the hydraulic fluid, may indi-cate impending failure. Recent research on particles found in thesynovial fluid, or lubricating fluid of human joints, offers new un-derstanding of joint diseases, such as degenerative arthritis, offersthe ability to monitor joint implantments and may result in bioengineer-ing improvements. However, established applications are for failureprevention in jet engines, diesel engines, transmissions, bearings, andsimilar oil-lubricated machinery.
The Ferrograph: Two instruments are available for ferrographic analy-sis. The direct-reading (DR) ferrograph (2) provides information on theconcentration and size distribution of fluid borne wear particles. The
323
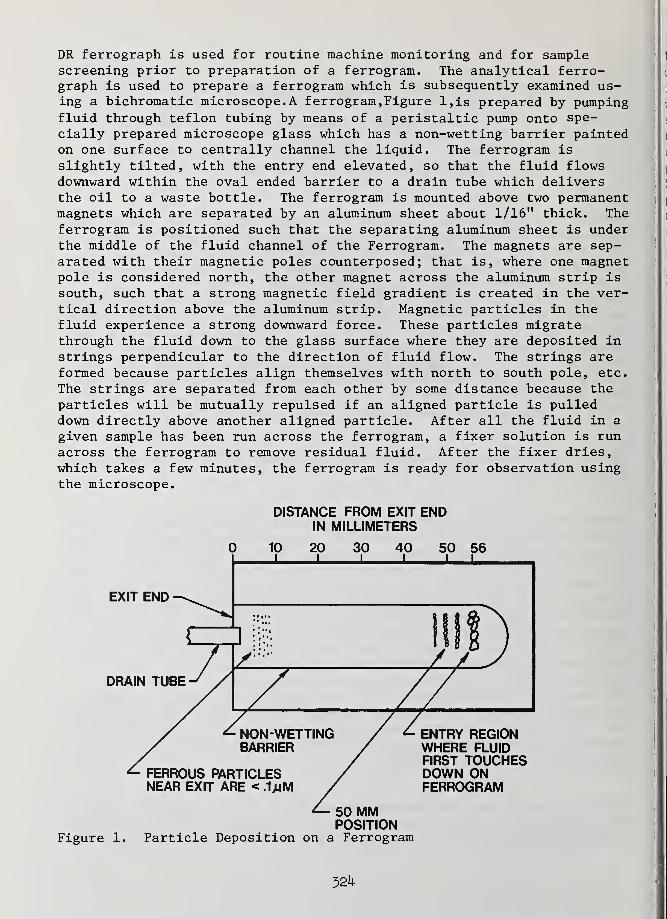
DR ferrograph is used for routine machine monitoring and for samplescreening prior to preparation of a ferrogram. The analytical ferro-graph is used to prepare a ferrogram which is subsequently examined us-ing a bichromatic microscope. A ferrogram, Figure l,is prepared by pumpingfluid through teflon tubing by means of a peristaltic pump onto spe-
cially prepared microscope glass which has a non-wetting barrier paintedon one surface to centrally channel the liquid. The ferrogram is
slightly tilted, with the entry end elevated, so that the fluid flowsdownward within the oval ended barrier to a drain tube which deliversthe oil to a waste bottle. The ferrogram is mounted above two permanentmagnets which are separated by an aluminum sheet about 1/16" thick. Theferrogram is positioned such that the separating aluminum sheet is underthe middle of the fluid channel of the Ferrogram. The magnets are sep-arated with their magnetic poles counterposed; that is, where one magnetpole is considered north, the other magnet across the aluminum strip is
south, such that a strong magnetic field gradient is created in the ver-tical direction above the aluminum strip. Magnetic particles in thefluid experience a strong downward force. These particles migratethrough the fluid down to the glass surface where they are deposited instrings perpendicular to the direction of fluid flow. The strings areformed because particles align themselves with north to south pole, etc.
The strings are separated from each other by some distance because the
particles will be mutually repulsed if an aligned particle is pulleddown directly above another aligned particle. After all the fluid in a
given sample has been run across the ferrogram, a fixer solution is runacross the ferrogram to remove residual fluid. After the fixer dries,
which takes a few minutes, the ferrogram is ready for observation usingthe microscope.
DISTANCE FROM EXIT ENDIN MILLIMETERS
0 10 20 30 40 50 56
EXIT END
DRAIN TUBE
CZ7
^ ENTRY REGIOIWHERE FLUIDFIRST TOUCHDOWN ONFERROGRAM
<— 50 MMPOSITION
Figure 1. Particle Deposition on a Ferrogram
32U

The Microscope: A special microscope is used to examine ferrograms eq-uipped with both reflected and transmitted light sources which may beused simultaneously. This combines features of a biological microscope •
with those of a metallurgical microscope. A recommended method forsorting out metal particles from compounds, organic material, etc., is
to use red reflected and green transmitted light. This lighting scheme,I called bichromatic illumination, will show metal as red and non-metal as
I
green. Polarized light may be used for either light train as well.Metallurgical (dry) objectives are used. The microscope is also equip-ped with camera attachments and a ferrogram reader, which provides a
mechanically determined light extinction measurement which correspondsto particle concentration at various locations on the ferrogram.
Particle Deposition: Ferrous particles are deposited on a ferrogram
I
according to size because the force acting on a particle is proportionalto volume whereas the viscous resistance of the suspending fluid is pro-portional to surface area. Therefore, for spheres, force increases withthe cube of the diameter but resistance increases only with the squareof the diameter. The largest ferrous particles are therefore depositedat the entry region of the ferrogram where the fluid, such as lubricat-ing oil, first touches down on the glass surface. Figure 1 indicates a
typical deposition pattern, although individual particles cannot be seenwith the naked eye. At a position further along the ferrogram, allferrous particles larger than a characteristic size will have alreadybeen precipitated. Near the exit end of the ferrogram, ferrous parti-cles greater than about . 02um (20 nanometers) will have been precipi-tated. For non-ferrous particles, such as aluminum, brass, white metal,etc., precipitation will occur because these materials are weakly mag-netic. However, the deposition of these materials will be less sizeselective. Consequently, large particles of non-ferrous metals may befound anywhere along the length of the ferrogram.
The Particles of Wear: Examination of the ferrogram in the bichromaticmicroscope reveals details of size, shape, and quantity of particlesfrom which the condition of oil-lubricated parts may be assessed (3)
.
Machines operating normally usually generate small flat particles at a
slow steady rate. If the number of particles increases, and particu-larly the ratio of large or small particles, it is an indication that a
more severe mode of wear has begun. The generation of large severe wearparticles signals the imminent failure of the wearing surface. Abrasivewear, which is analogous to a crude machining process, generates par-ticles in the form of loops, spirals, and bent wires. Increase in thenumber and size of these particles shows that an abrasive wear mechanismis progressing rapidly.
Various mechanisms generate characteristic particles. Six regimes ofwear have been identified with sliding wear (4) . Miscellaneous shapedparticles are associated with break-in wear. Small platelets are
325

associated with normal rubbing wear. As operating parameters becomemore arduous, the metallic rubbing wear particles increase in size, be-come oxidized, and finally, just prior to failure, large metallic sev-ere wear particles are produced.
Three types of particles are associated with rolling mechanisms. Theseare spheres, fatigue chunks and laminar particles. Spheres are genera-ted as microcracks open up on rolling surfaces. Fatigue chunks repres-ent material removed as rolling elements spall. Laminar particles,which are large, very thin platelets, result from material being passedthrough the rolling contact.
Combined rolling and sliding, as in gears, produces scuffing particlesand fatigue chunks. Lubricant starvation will result in partially oxi-dized wear particles.
Elemental Identification of Particles: Determination of the compositionof particles can establish their origin. The site of deposition, re-flectivity, and color of particles aid their identification. If avail-able, energy dispersive x-ray analysis in conjunction with a scanningelectron microscope can establish elemental composition. Otherwise, a
simple heating of the ferrogram will allow categorization into broadalloy classes by examination of oxide layer (temper) colors (5).
The Direct Reading Ferrograph: There is general agreement among re-
searchers investigating wear that the particle concentration and size
distribution are critical indicators of machine condition. As a machineruns, particle concentration in the oil increases until the loss rate
equals the generation rate. For many machines, the time for this to
occur is relatively short. If the probability for any one particle
being lost or destroyed is independent of the presence of other parti-
cles, the loss rate is proportional to the concentration. It can be
mathematically demonstrated that the particle concentration in the oil
of any machine reaches an equilibrium concentration (6) if it is assumed
that particle removal mechanisms such as sedimentation, filtration, and
impaction are proportional to the number of particles present. For ex-
ample, in certain jet engines, equilibrium takes about 20 minutes to
establish. If wear increases, the particle concentration during dynamicequilibrium will be greater. The onset of severe wear is accompanied byan increase in the number of large particles, which causes the ratio of
large to small particles to increase. The direct reading ferrographprovides the necessary information about particle concentration and size
distribution to indicate a changing wear situation.
Design: Experience with analytical ferrography, where optical densito-
meter readings of particle deposits are taken in conjunction with the
bichromatic microscope, indicated that the entry point of the oil
326

sample onto the ferrogram, where the largest particles are deposited,and a position some 5 mm down from the entry, where 1 - 2 yM size parti-cles are deposited, are the most sensitive locations for detecting a
changing wear situation. Accordingly, the direct reading ferrograph wasdesigned to quantify particles in these two size ranges. The same cri-teria also apply to the on-line ferrograph, a compact, microprocessorcontrolled instrument intended for airborne use, which is currentlyunder development.
As shown in figure 2, oil from a sample is siphoned through a precipi-tator tube, where a magnet assembly located beneath the tube precipi-tates the wear particles according to size. Virtually all unwanted car-bon dirt particles are not precipitated, but are carried away by theoil.
frI I
DBEDB
Figure 2. Schematic of a direct reading ferrograph optical system.
The large particles are deposited first and the smaller ones furtherdown the tube. Two light beams pass through the precipitator tube.
The first beam is located near the tube's entry where the larger (L)
particles (>5 yM) are deposited, and the second beam crosses the tube
where the smaller (S) particles (1 to 2 yM) are deposited. The
327
reduction in light intensity indicates the amount of wear particles de-posited at each location. The level of light is sensed, amplified anddisplayed in terms of units on a digital meter. The digital meter has arange of 0 to 190 units, where a reading of 100 units, which correspondsto approximately one-half of the area covered, is the recommended upperlimit because, for readings greater than 100, the instrument response isnonlinear due to coincidence effects; that is, particles pile on top ofone another so that less light is attenuated. A switch allows selectionof either the L reading or the S reading.
So that variations in oil opacity will not affect the readings, thesample oil is stopped just after it enters the glass precipitator tubewhile two potentiometers are adjusted to bring the L and S readings tozero. Two neutral density filters are included with the instrument to
allow periodic calibration checks. By inserting one of the filters inthe light path, without the precipitator tube in place, a reading with-in a certain range will result if the instrument is functioning pro-perly.
Interpretation of Results: Recommended sample volume is 1 cm 3. If too
many particles are deposited, the sample must be diluted so that theferrograph readings are within range. Occasionally, oil samples are en-countered which result in low readings, in which case the operator maychoose to run a greater sample volume than 1 cm 3 so that enough parti-cles are precipitated.
The readings obtained from the instrument are assigned the terms D^ andDg, for the large particles and small particles, respectively. The nor-mal wear process generates particles with a maximum size of 15 uM, themajority of which are 2 uM or less. Any abnormal wear mode generatesparticles larger than 15 uM.
In view of this, for normal wear processes, D^ would be similar to Dg.
In practice, D is slightly greater than Dg. However, for abnormalwear, will fee significantly larger than Dg. Consequently, the para-meter D - D may be used as an indicator of abnormality.
J-j O
The onset of an abnormal wear mode results in a significant increase in
the quantity of wear debris. To indicate an increase in particle con-centration, the term D + DQ may be used.
Li O
A single parameter, sensitive to the onset of severe wear, the productof D^ - Dg (severity) and D + Dg (quantity) may be used. This quan-tity, termed the severity or wear index, I , is I = (DT
- D ) (D + D_)= D 2 +D 2
i
s sLbLbXj s
Since different machine lubrication systems exhibit extreme variationsin both particle concentration and size distribution, it is impossibleto use I as an absolute quantity. Instead, the user must establishwhat normal running values of I
gare for each machine he intends to
328

monitor. When comparing I between samples, it is important that ref-
erence be made to the sampfe volume passed through the instrument.
From a practical standpoint, if the readings are reported as nD^ and
nD , where n is the dilution factor (it will be a fraction if more than
1 cm 3 of sample is used), then I - (nD^) 2 - (nDg)2 = n2 (D 2 - D
g2
),
and I will be comparable for samples run with different dilutions.
Instrument Calibration: Samples of known weight concentration of fer-
rous wear particles were prepared and subsequently analyzed by the dir-ect reading ferrograph. These tests were run in order to obtain a cal-ibration of the instrument in which the iron in the oil was weighed by
a balance. The data generated during these tests is available else-where (2) and will be provided by the author upon request. These testsdemonstrated that the direct reading ferrograph responded linearly to
wear particle gravimetric concentration within the recommended operatingrange and produced results consistent with spectrometric oil analysis.
Applications: Certain applications of ferrography have been discussed
in the literature such as gas turbines (7), (8), diesel engines (9),
and gear boxes (2) . Ferrographic analysis service is offered at several
commercial oil analysis labs including the author's lab. Certain otherapplications such as oil additive optimization and military condition
monitoring have not been publicly discussed for obvious and justifiablereasons
.
References
:
(1) E.R. Bowen, D. Scott, W.W. Seifert, and V.C. Westcott, "Ferro-
graphy", Tribology International, j?, (3), 1976, 109 - 115.
(2) D.P. Anderson and R.S. Silva, "The Direct Reading Ferrograph -
Design, Calibration, and a Field Application" presented at the 33rd
Annual Meeting of the American Society of Lubrication Engineers,
April 17 - 20, 1978, Preprint No. 78-AM-1A-1.
(3) E.R. Bowen and V.C. Westcott, "Wear Particle Atlas", prepared for
the Naval Air Engineering Center, Lakehurst, New Jersey, under Contract
No. N00156-74-C01682, July, 1976.
(4) A. A. Reda, E.R. Bowen, and V.C. Westcott, "Characteristics of Par-
ticles Generated at the Interface between Sliding Steel Surfaces", Wear,
34, (1975) 261 - 273.
(5) F.T. Barwell, E.R. Bowen, J. P. Bowen, and V.C. Westcott, "The Useof Temper Colors in Ferrography", Wear, 44 (1977), 163 - 171.
(6) D.P. Anderson and R.D. Driver, "Equilibrium Particle Concentrationin Engine Oil", submitted to Wear magazine for publication.
(7) D. Scott and V.C. Westcott, "Predictive Maintenance by Ferrography"Wear, 44 (1977), 173 - 182.
(8) D. Scott, P.J. McCullagh, and G.W. Campbell, "Condition Monitoring
of Gas Turbines - An Exploratory Investigation of Ferrographic Trend
Analysis", Wear, 49, (1978), 373 - 389.
(9) M.V. Hofman and J.H. Johnson, "The Development of Ferrography as a
Laboratory Wear Measurement Method for the Study of Engine Operating
Conditions on Diesel Engine Wear", Wear, 44 (1977), 183 - 199.
529
AN ADVANCED REAL-TIME OIL DEBRIS MONITOR
T. E. Tauber, Ph.D.TEDECO
Technical Development Company24 E. Glenolden Avenue
Glenolden, Pennsylvania 19036
Abstract: Diagnostic methods based on oil sampling tend todisregard the fact that particles larger than 200 micronsare reliable indicators of incipient failure. This is con-firmed by the success of diagnostic methods which utilizevisual inspection of lube system filters and of magneticchip collectors . Apart from the morphology of such parti-cles, these methods rely on correlating the particle sizeand quantity with data obtained from previous experience.
TEDECO has developed an in-line centrifugal oil monitorwhich separates debris particles above 100 micron from theoil stream and deposits them on a magnetic sensor. Eachparticle is counted individually in accordance with itsmass, magnetic susceptibility and shape. Digital circuitryregisters and stores each event and permits calculation ofdebris production rates. The debris is retained and easilyaccessible for visual inspection.
A number of such systems are currently undergoing fieldevaluation on an Air Force TF-39 engine, on a Navy LM-2500engine and on a Westland Lynx helicopter transmission.
A similar system tested during the Army AIDAPS program on atransmission implanted with defective parts confirmed thesoundness of this diagnostic approach.
Key words: Aircraft component failure; condition monitor-ing; failure detection; diagnostic techniques; debris moni-toring; lubrication system monitoring.
The propulsion system of a helicopter is highly decentral-ized. It usually consists of one or two engines,- a mainrotor transmission, an intermediate and a tailrotor gearbox (Figure 1) . Larger helicopters have even more complexand dispersed drive systems. Each component has its own,self-contained lubrication system. The engine and trans-mission lubrication systems are of the circulating type and
330

have filters, coolers and pumps, while the intermediate andtailrotor gear boxes are usually sump lubricated. Despitethese differences, an integrated helicopter lube debrismonitoring system should detect failures in each componentwith equal reliability. In fact, a failure in the tailrotor drive system is often more critical than a failure inan engine or in the transmission, since it can cause lossof control over the aircraft. An advanced helicopter con-dition monitoring system should therefore consist of rela-tively inexpensive peripheral sensors and a central signalprocessing system.
By comparison, a gas turbine engine has a centralizedlubrication system (Figure 2) . The oil returning from theindividual shaft bearings and from the accessory drivemodule combines on its way back to the reservoir. Sinceeach of these mechanical components is equally critical, amodern gas turbine engine frequently has one full-flowdebris monitor in the main scavenge line. For failure iso-lation on the ground, magnetic chip collectors are install-ed in the individual bearing and gear box sumps or in theirscavenge return lines.
An additional challenge to the lube debris monitoringsystem is the variety of materials and failure modes of oilwetted drive system components. Each engine and transmis-sion may behave differently with respect to its predominantfailure modes. This is especially true for immaturesystems. They frequently have peculiar failure modes whichare not of the surface-fatigue or corrosive wear type butinvolve cracking or abrasive wear. Since these failuremodes tend to reduce mean component life substantially,efforts are generally made to eliminate them through designchanges during the development of the aircraft.
Surface-fatigue type failures, scuffing and corrosive wearare the most frequent wear modes. Extensive experiencewith many jet engines in service with certain European air-linesl) indicates that invariably such failures are charac-terized by particles of steadily increasing mean sizeand by increasing debris production rates. Evencorrosive wear by itself may not produce large debris par-ticles, the local loss of the oil film subsequently leadsto other wear modes which do
.
Figure 3 shows a model for development of the wear particlespectrum with time during a surface-fatigue type failure.Initially, while operating conditions are still normal, asteady "background" of small to medium-sized wear particlesis produced. 2) Some isolated large particles may also be
331

generated from time to time, either as machining debrisleft in the engine or from burrs and other macroscopic com-ponent flaws.
As a failure develops, the debris production rate and themean particle size increase. The European airline experi-ence cited earlier relies completely on the appearance offerrous debris particles 1000 micron in size and largeron magnetic chip collectors which are sampled at regularintervals. At British Airways, this has been a completelyreliable, systematized and fully documented failure detec-tion system for many years. 3) Further clues for failurelocation and severity are obtained from particle morphologyby microscopic analysis and, sometimes, electromicroscopicanalysis. Similar data have been generated by the U.S.Army Research and Development Laboratory Ft. Eustis.4)
The experience with the General Electric T-700 engine hasalso demonstrated the soundness of this model. During therecently completed development program of this engine,every bearing failure was isolated in time (and not prema-turely) through the appearance and detection of such largeparticles in the oil stream.
An illustration of the rapid increase in debris particleproduction rates during a failure is shown in Figure 4.
These data were developed on a large commercial turbofanengine which, as sole debris monitoring device, has amagnetic chip collector in the main scavenge line. Thenormal debris deposit rate lies below .01 mg/hour, as evi-denced by the decline of the curve after replacement of thefailed intermediate gear box. During the development ofthe failure, the deposit rate increased by a factor of atleast 10 3
. Using this same technique, American Airlinesnever removes this type of engine from the aircraft unlessSOAP data are confirmed by the appearance of large debrison the chip collector. 5)
It must be emphasized that all condition monitoring tech-niques based on oil sampling, rather than debris sedimen-tation and collection, of necessity ignore these largeparticles. As is well known, sedimentation rates in reser-voirs are such that in real operating environments parti-cles larger than 100 microns rarely appear in the samples.More importantly, the production rate of large particles is,of course, many orders of magnitude lower than that ofsmall ones and the probability of obtaining one of thelarge particles in a sample is negligible . 6)
Recognizing the reliability of large debris particles as
532

failure indicators, a quantitative debris sensing systemwas developed and has been evaluated in service. Figure 5shows in cross section an oil debris monitor for a gasturbine engine or a helicopter main transmission. The unithas a cylindrical chamber, into which the oil entersthrough a tangential inlet. The resulting vortex flowseparates the debris from the oil and deposits it on thesurface of a magnetic sensor. A quick-disconnect mecha-nism and an automatic shut-off valve permit simple removalof the collected debris for visual or laboratory analysis.The separation efficiency of this cyclonic debris separator,at a flow rate of 16 GPM oil and 10 GPM air is indicated inFigure 6. Figure 7 shows a photograph of the unit.
The sensor is also usable as a sump-type debris detector.As magnetic debris particles are attracted, it generates apulse whose amplitude is a function of the particle mass,magnetic susceptibility and its shape factor. With suit-able electronic circuitry, as shown in Figure 8, this pulseis amplified, converted to a digital count and stored in anaccumulation register. Real-time particle counts aretherefore available for direct read-out or, more usefully,rate calculation by computer.
The system shown in Figure 8 was developed for participa-tion in the Air Force Integrated Engine Condition Monitor-ing System (IECMS) Program. Two units are installed on aGeneral Electric TF-39 engine on an Air Force C-5A aircraft.The preamplifier was required as a result of the 100 ft.distance between engine and signal conditioning equipment.The system is computer-interrogated and also must respondcorrectly to a computer-generated test command which isinjected at the sensor level. System output is 0-5 VDC.In addition, a "large chip" signal is generated if a singleparticle larger than 500 microns in size is captured.
A second system is installed on a General Electric LM-2500engine on the U.S. Navy's "Admiral Callaghan" . The shiphas concluded several voyages to Europe and, after calibra-tion runs, the system is performing well.
Recently, a similar system has been supplied to Westlandfor evaluation. The sensor will be installed in the oilsump of a Lynx helicopter main transmission.
A somewhat less sophisticated system based on magnetic,quantitative debris sensing was evaluated during the U.S.Army AIDAPS program at Bell Helicopter Textron. Excessive-ly worn gears and bearings were implanted into a UH-1 maintransmission and were correctly identified through persist-
333

ent, quantitative indications.
Currently, the resolution of the system is at the level ofparticles of 200 x 200 x 50 microns (.008 x .008 x .002 in.)This size corresponds to spall flakes typically generatedby bearings several tens of hours before secondary failure.The resolution is expected to improve as the system isfurther developed. However, it must be taken into consi-deration that resolution of a range of particles from, say,100 x 100 x 20 to 1000 x 1000 x 200 involves a scale factorof 1000 in mass. The limited dynamic range of electronicequipment (digital or analog) of reasonable size, cost,weight and complexity therefore requires a choice of acertain optimum spectral range in which all particles areto be reproduced in accordance with their actual magneticimprint. Particles above this range are recorded as if theyhad the same size as those at its upper limit.
A simplified system with the capability to classify debrisparticles in real time into three ranges has recently beendeveloped (Figure 9) . Owing to its simple circuitry, smallsize and low cost, such a real-time particle counterpromises an entirely new approach to aircraft lube debrismonitoring
.
Footnotes
1) R. C. Hunter, "Engine Failure Prediction Techniques",Aircraft Engineering, March 1975.A similar method is used with excellent results byCP Air, Vancouver.
2) This background of "normal wear fuzz" is responsiblefor most nuisance indications of conventional electricchip detectors which today are the most widely usedlube debris detection devices in helicopters.. Therecent development of the Pulsed Chip Detector success-fully deals with this problem. This device is now go-ing into production for the Sikorsky S-76, UH-60A Black-hawk, Hughes YAH- 64 and is under development for theBell 222 and 214ST.
3) A visit to the British Airways Condition MonitoringLaboratory at Heathrow Airport, London, is highlyinstructive (Chief: Gordon Grant, British Airways,European Division)
.
4) D. Lubrano, USAMRDL; private communication.
33^

5) P. Roberts, American Airlines, Tulsa, Oklahoma;private communication.
6) The average engine oil system has a capacity of10 liters, while the average oil sample is 10 milli-liters . Even without sedimentation problems , the proba-bility of seeing a large particle in the sample istherefore a factor of 10~3 smaller than its productionprobability.
335

336

JET ENGINE LUBE DEBRIS MONITORING SYSTEM
ACQGEARBOX
N0.1
FILTER
0 TANK
.NO. 2 N0.3I NO. 4
MAIN BEARINGS
a- 1
'MAGNETICCHIP COLLECTOR
COOLER
FULL-FLOWDEBRIS MONITOR
LOGIC
FIGURE 2
337

538

DEBRIS DEPOSIT RATEMAGNETIC CHIP COLLECTOR
100.0-
FIGURE 4
339

IRREGULAR ISECTION I
. OILOUTLET
TANGENTIALINLET PORT
IRREGULARSECTION
SELF-SEALINGVALVE
MAGNETIC DEBRIS—T̂ T^7>y
7
y/y^^j^SENSING AREA ^ff'SSf'SS' (KV\1
HELILOK LOCKINGCAMS
DEBRIS SENSOR
CYCLONIC DEBRIS SEPARATOR
FIGURE 5
3^0


3^3


A PRACTICAL APPROACH TOAIRCRAFT SYSTEM COMPONENTMALFUNCTION DIAGNOSIS
F. E. BishopAircraft Porous Media, Inc.
30 Sea Cliff Avenue, Glen Cove, N.Y. 115426301 49th Street North, Pinellas Park, Fla. 33565
ABSTRACTAircraft fluid system component failures and the
associated costs of unscheduled maintenance and loss ofoperational readiness can be reduced significantly withproper system monitoring. The author describes a multi-function monitoring system built into the aircraft thatwill provide a signal at one central location when themaximum allowable limit has been reached for the systemand/or component function being monitored. The appropriatemaintenance action can then be implemented or scheduledfor a convenient time without interrupting the operationalservice of the aircraft. This concept would give a go-no-go signal and not require interpretation or special train-ing. Another feature is that the monitoring is performedby ground personnel at pre-flight or post-flight checkout.The benefits of a system incorporating instant diagnosisand analysis of fluid system component malfunctions areincreased system operating utility, reliability, and N safetyalong with reduced logistic support and reduced maintenanceand operating costs.
Key Words: Accumulator; analog; centralized; check-outsystem; desiccant; discrete; displacement; fiber optics;filters; flight critical; flow; fluid; go-no-go; groundreadout; hydraulic; IMACS; instantaneous diagnosis andanalysis; level; maintenance oriented; malfunctiondetection; monitoring; onboard; patented; pressure; pumps;reservoirs; sensors; tailorable; temperature.
5^5

INTRODUCTION
:
Increasing costs associated with aircraft maintenanceand unscheduled downtime require a cost effective methodto deal with this problem. Current gas turbine poweredaircraft employ a variety of fluid systems, components,and functions which are critical to the proper operationof these sophisticated systems. Thus, the demand todiagnose system and component critical operating functionshas been growing out of necessity.
Maximum cost effectiveness can be applied by opti-mizing the maintenance inspection 1
. Early identificationof component malfunction and incipient failure is thebasis for a reduction of unscheduled repairs. This typeof repair, in contrast to preventive repairs, is mostcostly because of the secondary damage caused by prematurecomponent failure. An example of this is abrasive particlefluid contamination generated by a failing system componentwhich causes other system components to be damaged andsubsequently fail. However, even without an actual failureof another system component, the overall system repair ismore costly and usually involves preventive componentrepairs and extensive system decontamination.
Much of the aerospace industry effort to providesystem function information has been applied to the enginefluid systems. For over a decade monitoring of the metalwear debris particles taken from fluid samples of lubricat-ing oil systems has been used to predict oil wetted com-ponent failure. But, this methodology is limited as afuture diagnostic tool. The reason for this is that thereis now a better understanding of the mechanisms of wearand how they apply to system components 2
. These principleswere recognized some time ago with the application of 3
micrometre absolute lube oil filters for the Avco Lycoming 3
T-53 Engine and the application of 3 micrometre absolutefilters on G.E.'s T-700 Engine. However, the use of moreefficient fluid system filters to combat the most damagingparticles in film thicknesses of 0.1 micrometres (1000Angstroms) to 1.0 micrometres (10,000 Angstroms) willeffectively remove those sizes of particles presentlymonitored4
. This problem is presently being worked on byvarious research institutes.
More elaborate aircraft engine monitoring systems areevolving 5
. Some transmit information to the cockpit, andsome gather data in-flight and store it for extraction andanalysis by engine diagnostic equipment on the ground 6
.
These monitoring systems along with others in helicoptertransmissions and other fluid systems are testimony tothe increasing awareness and need for reduced costs,increased safety, improved maintainability, reduced
3k6

logistic support and increased operational utility. Thedesired benefits can be achieved through the applicationof conditional monitoring of critical system componentparameters which provide diagnosis of a flyable system andincipient failure analysis.
HYDRAULIC SYSTEMS:Systems which can benefit greatly from a built-in
monitoring system are the aircraft's hydraulic systems.They are composed of a large number of fluid componentswhich are subject to degradation and failure. Let usreview some of the background associated with hydraulicsystem problems
:
It is well known that free and entrained air inhydraulic systems has resulted in serious system mal-functions sometimes terminating in crashes and loss oflife.
Water in pneumatic bottles has frozen at dischargeduring emergency procedures also with disastrous results.
Low fluid level in reservoirs has caused loss ofprime of pumps with the result of a loss of system pressureand flight control.
Improperly performed maintenance has resulted in re-versed control linkages, disconnected linkages and pulleys,reversed installations of check valves, failure to reinstalfilter elements and many others which caused resultsranging from annoyance to catastrophic.
Servoactuators have suffered from loss of meteringedge, seal deterioration, and jamming causing hardoversignals
.
Hydraulic pumps wear out and fail in a variety offailure modes.
Hydraulic fluid which can leak into emergency airbottles during resetting of system, depleting the chargeof the bottles.
Accumulators are subject to blow by and internalleakage
.
Filter elements are often left in the system too longresulting in malfunctions of components such as, high back-pressure on pump cases reducing cooling flow.
Contaminates in the fluid have been responsible for abroad number of component malfunctions and failures suchas, malfunctions of electromechanical servovalves
.
The maintainability of the hydraulic systems con-tributes greatly to the operational utility, reliability,and safety of the aircraft. Pre-flight and post-flightcheckout is an intrinsic part of maintaining these hy-draulic systems, however, a large block of costly manhoursand materials are consumed in the process. Therefore,
3^7

let us examine an approach to providing a cost effectivebuilt-in monitoring system for aircraft hydraulic systems.
THE SYSTEM CONCEPT:Provide at one central location an onboard, light-
weight, self-contained monitoring system to automaticallytest the operability of the hydraulic system.
Provide in-system sensors that can measure componentfunctional parameters to give early warning of malfunctionand failure.
Provide an on-the-ground instantaneous go-no-go on-condition signal identifying what monitored componentand/or system parameter has reached the predeterminedfunctional limit. Let this signal be the basis forplanned maintenance action.
Provide a monitoring system utilizing flight testedhardware which is not only applicable to new aircraftdesigns, but one that is retrofittable into present air-craft to extend vehicle service life economically.
Provide a real time monitoring system with continuousin-flight active sensors which will not affect the hy-draulic system operation, even if a sensor fails.
Provide a programed microprocessor in a self-containedmonitoring system to increase reliability vs integratinginto existing aircraft computer system.
Provide a system which reduces skill level requiredfor routine maintenance and that is universally implement-able in present maintenance systems, minimizing the useof ground support equipment.
Provide a system to instantaneously diagnose andanalyze fluid system component malfunction to decreaseaircraft operating downtime, increase reliability andsafety
.
FLIGHT CRITICAL SYSTEM COMPONENTS:Figure 1 lists the flight critical system components
and necessary functional parameters for system monitoringand diagnosis by maintenance during ground checkout.
The different types of reservoirs used in aircrafthydraulic systems are shown along with the critical para-meters of level and temperature
.
Main system hydraulic filters in the pressure andreturn lines are monitored for differential pressure, andpump case drain lines are monitored for differentialpressure and temperature.
Accumulators are used for a variety of purposes inhydraulic systems for stored energy devices and pump rippleattenuators such as for brakes, ram air turbine, canopyand main system. These are monitored for precharge
3U8

pressure
.
Likewise, pneumatic bottles used for emergency releaseof canopy, landing gear, doors, and tail hooks are mon-itored for pressure, and the presence of moisture.
Shock struts critical to takeoff and landings aremonitored for precharge pressure and fluid level.
The heart of the hydraulic system is the pumps, andthese are monitored for maximum allowable case drain leak-age and discharge pressure. The system leakage is mon-itored for maximum quiescent flow.
For the flight controls; components such as the rudder,stabilizer and flaperon actuators are monitored for para-meters of differential displacement and maximum allowablequiescent flow. These aircraft controls are monitored fordifferential displacement of the controls vs the controlledsurface
.
The utility system will, of course, contain some ofthe same redundant flight control actuators along withactuators for flaps, landing gear and other fluid powerfunctions. These actuators should also be monitored.
The desiccant for reservoir pressurization, windowdefogging and other onboard uses is monitored for moisturesaturation
.
Hydraulic and spoiler type backup packages are mon-itored for over temperature
.
An elapse time meter records system operating hoursand flight duration.
Fluid system contamination monitoring provides forquantity of particles or fluid cleanliness level, waterand chlorine.
System relief valves are monitored for leakage viafluid temperature.
IN-SYSTEM SENSORS:Let us now look at Figure 2 which describes a typical
monitoring system diagram used to determine acceptablesystem operability. The proper reservoir fluid level ischecked automatically, along with external system leakage.In addition, air in a boot strap reservoir is also indi-cated .
Backup fluid power packages are checked for overtemperature operating conditions.
The systems filter elements are checked to determineif they are plugged and should be changed. System fluidsamples can also be obtained to determine contaminationlevels
.
If the system relief valve is leaking fluid, temper-ature will give the required indication.
Accumulator precharge pressure is determined instan-
3U9

taneously without manual system discharge and is auto-matically compensated for temperature.
Onboard emergency pneumatic bottles are checked foracceptable charge pressure and the presence of moistureis conveyed to the panel optically by the use of fiberoptics
.
Hydraulic pump discharge pressure, pump maximumallowable case drain leakage, and maximum temperature aremonitored to indicate malfunction of each pump. Inaddition, maximum allowable system discharge leakage isalso monitored by a quiescent flow sensor.
Rudder control pedal differential displacement andrudder actuator differential displacement are checked toensure mechanical connections are correct prior to flight.Other surfaces can be checked in a similar fashion.
Rudder actuator maximum permissible quiescent leak-age is also indicated. The diagnosis of actuator maximumquiescent flow requires a leakage sensor at each actuator.Sub-systems can be checked for maintenance investigationin the same manner.
Pneumatic desiccant condition is checked for satu-ration by employing fiber optics, to visually transmita color change at remote locations
.
External struts, precharge pressure and fluid levelare also provided for. These functions are particularlycritical for naval aircraft prior to launch.
SYSTEM SIGNAL TRANSMISSION AND INTEGRATION:The signals from the in-system sensors, as shown in
Figure 3, are transmitted to a conveniently locatedground accessible display panel. All of the signals aretransmitted by a low power drain 5 Volt D.C. systemincluding the generation of the fiber optic signals.
The discrete and fiber optic signals monitoring thecomponents shown are received directly into the displaypanel
.
The analog signals from sensors monitoring the com-ponents shown in Figure 3 are fed through analog digitalconverters to a preprogramed microprocessor all containedwithin the display panel.
Provision for tieing into the cockpit warning panelcan also be accomplished from the display panel.
DISPLAY PANEL:Shown in Figure 4 is the diagnostic, analysis and
interrogation display panel installed at some convenientpoint onboard the aircraft for use by ground maintenance.
The display and interrogation black box measures
350

approximately 12 x 6.5 x 4.5 inches and together with theelectronics and batteries weighs approximately 8 lbs.Contained within the panel are:
° a microprocessor° nickel cadmium batteries0 battery heating and charging circuit° analog to digital converters° memory logic° counters° lamp drivers0 display grain of wheat lamps0 fiber optic interface outlets° power interface (115V, 400 Hertz AC)0 circuit and system test circuits° shift registers° elapse time meter
Grouped on the face of the panel are the flightcritical components and functions being monitored fordiagnosis of malfunction and out-of-limits performance.Each function is represented by a red color grain ofwheat bulb which can be seen in direct sunlight as wellas in the dark.
There is also provided on the panel a spring-loaded"center off" three position CIRCUIT TEST switch. In thefirst position it tests all of the grain of wheat bulbs,and in the second position it tests sequentially thewiring to the in-system sensors for each group of mon-itored components
.
A spring-loaded "center off" three position SYSTEMTEST switch is also provided. In the first positionbefore engine start, accumulator and pneumatic bottlesprecharges are checked along with reservoir fluid levelbefore pressurization . Red lights would immediatelyindicate maintenance action for the indicated condition.
The engines are then started and the second positionof the SYSTEM TEST switch is activated. Interrogation ofthe operating hydraulic system then provides instantaneousdiagnosis and analysis of every function being monitored.A red light will instantaneously pinpoint a maintenanceaction
.
The entire maintenance check procedure can literallybe performed in a matter of seconds without the use ofany ground support equipment.
The discrete in-system sensors generate a simul-taneous local visual signal of component malfunction whichmust be cancelled manually. Therefore, the monitoringsystem provides a quality assurance check that the
351

malfunction has been corrected, thus increasing reliabil-ity and safety of operation. Furthermore, the systemrequires no special training or support.
ADVANTAGES OF SYSTEM:
This patented instantaneous maintenance analysischeck-out system can be tailored to any aircraft andmaintenance schedule.
The advantages of the instantaneous maintenanceanalysis check-out system are:
0 reduces pre-flight hydraulic system check-outtime of flight critical components
° display panel identifies malfunctionedcomponents throughout the vehicle
0 reduces skill level required for routinemaintenance
° allows for component removal on "as required"basis between major overhauls as scheduled, thusreducing logistic support and costs
° maintains in-flight check of all criticalcomponents
° identifies faulty components on post-flight check° minimizes use of ground support equipment for
check-out0 increases maintenance efficiency and operational
utility0 proven and available hardware° simple, reliable, practical and essentially
maintenance free0 can be tailored to incorporate additional
design and maintenance requirements
SYSTEM FLEXIBILITY:Additional benefits can be derived from the monitor-
ing system by providing a two bulb display for each mon-itored system function. The red bulb would indicate asbefore that the maximum allowable limit was reachedrequiring an immediate maintenance action. However, anamber warning bulb could also be provided to indicatethat an abnormal condition is being approached andmaintenance should plan to correct it at some convenienttime in the near future. This would further increaseoperational readiness by not delaying the scheduledflight because of a required maintenance action. Itwould also reduce logistic support further.
352

SUMMARY
:
In summary, the instantaneous maintenance analysischeck-out system (IMACS) is a practical cost effectiveand time saving means of attaining fleet operationalreadiness and extending service life of aircraft throughincreased maintainability.
REFERENCES
:
(1) Lieutenant Colonel Carlton L. Schelhorn"Updating Aircraft Inspection"U.S. Army Aviation Digest, May 1974
(2) F.E. Bishop and William Needelman"The Effects Of Fluid Contamination OnComponent Wear"Field Service Report No. 56Aircraft Porous Media, Inc., 1977
(3) C.W. Lynch and R.B. Cooper"The Development of a Three-Micron AbsoluteMain Filter for the T-53 Main Engine"ASME Journal of Lubrication Tech. 93F,430-436, 1971
(4) Richard S. Miller and W.K. Petrovic"Wear Mode Identification and ParticleRemoval in Oil Wetted Systems"American Society of Materials Conference,October 1976
(5) Barry Miller"Inflight Engine Monitoring Use Expands"Aviation Week, October 25, 1976
(6) J.W. Hollaway and Alan K. Olsen"Engineering Methods In Engine Management"Aviation - Engineering and Maintenance,October 1977
353

TYPICAL FLIGHT CRITICAL SYSTEM COMPONENTSFOR MONITORING
MONITOREDPARAMETER SYSTEM COMPONENT
o HYDRAULIC RESERVOIRSL&T — Air oil
L&T — Bootstrap
L — Backup System
o FILTERSAP — Pressure
AP — Return
AP&T — Pump case drain
o ACCUMULATORSPC — Brake
PC — Ram air turbine
PC — CanopyPC — Main system
o PNEUMATIC BOTTLESPM — CanopyPM — Landing gear
PM — DoorP,M — Tail Hook (Dashpot)
o SHOCK STRUTSPC&L — Nose GearPC&L — Main Gear
o HYDRAULIC PUMPSF&T — Case drain (flow)
QF — Pressure, flow (quiescent)
P — Pressure
o FLIGHT CONTROLSD.D.&QF — Rudder Actuator
D.D.&QF — Stabilizer Actuator
D.D. — Control Columnn DMCI IMATir* nCCCIPAMTo riNtUIVIAI UtoolOAIN 1
co. IVIlHolUlt? \OCllUI ailKJIIf
o HYDRAULIC BACKUP PACKAGET — Over Temperature
o SPOILER SYSTEM & HIGHLIFT BACKUP PACKAGET — Over Temperature
0 ELAPSED TIME METERH. — System operational hours
— Flight duration
o FLUID SAMPLINGFS — Particulate matter (cleanliness level)
— Water— Chlorine content
° RELIEF VALVET — Over temperature
LEGENDL Indicates level D.D. Indicates differential displacement
P Indicates pressure S Indicates moisture saturation
AP Indicates differential pressure T Indicates over temperature
PC Indicates precharge pressure H Indicates hours & tenths
F Indicates flow M Indicates mixture hbO/oil in pneumatic bottles
QF Indicates quiescent flow FS Indicates fluid sampling
Figure 1
35^

SIGNAL
TYPE
SWITCHOPTICAL
COUPLER
SWITCH SWITCH SWITCH SWITCH
POTENTIOMETER
SWITCH
POTENTIOMETER
OPTICAL
COUPLER
TRANSDUCER
OPTICAL
COUPLER
IN
SYSTEM
SENSOR
MECH
PRESS
OPTICAL
PROBE
MECH MECH MECH MECH
MECH/ELEC.
MECH
MECH/ELEC.
OPTICAL
PROBE
MECH/ELEC.
OPTICAL
PROBE
MONITORED PARAMETER
PRESS LIQUID PRESS
LEAKAGE
FLOW
TEMP
1
CAklf'F
Fl
C\\hl
DIFF
DISPL
QUIESCENT
FLOW
DIFF
DISPL.
MOISTURE
PRESS LIQUID
LEVEL
SYSTEM
COMPONENT
PNEUMATIC
BOTTLE
PUMP
OUTLET
CASESYSTEM
RUDDER
ACTUATOR
PEDALSDESSICANT
DRIER
(RESERVOIR)
STRUTS
ITEMid a> oi o
SIGNAL
TYPE
POTENTIOMETER POTENTIOMETER
i.e.
TRANSDUCER
SWITCH SWITCH SWITCH SWITCH SWITCH
POTENTIOMETER
i.e.
TRANSDUCER
IN
SYSTEM
SENSOR
MECH/ELECTRICAL MECH/ELECTRICAL
ANALOG
SIGNAL
GEN.
MECH/ELECTRICAL
MECH MECH MECH MECH MECH
MECH/ELEC.
ANALOG
SIGNAL
GEN
MECH/ELEC.
MONITORED PARAMETER
LEVEL
AIRTEMP
PRESS
TEMP
.IP .IPTEMP
PRESS
TEMP DISP
SYSTEM
COMPONENT
RESERVOIR
BACKUP
PACKAGE
FILTERS
PRESS
RETURN
CASE
RELIEF
VALVE
ACCUMULATOR
ITEM

F 1
<cc
<a
oo-jm
LUI-(0
(0
ozCC
P
<oQ.>
COLU
oCD
o.
LU
I§j2tlI
s Si
GC CO1- O DC
COCO
oCO
-J COOCE So
co ODC h-d
SiOQCOl
MICROP
8>
<AIRCRAF
(AN/
CO<rO
I-o<
CODC
o>LU OCO O
COI-Z)DCI-co
CODC
O
Z)
CODC
O< y2 5
COLU
LUDC
ICO
o o< <
=> Z>O LU
ZQ.
356

TYPICAL ON-BOARD DIAGNOSTIC, ANALYSISAND INTERROGATION DISPLAY PANEL
Figure 4
s - C F BY 0 L As M 1 CT B G KE H UM T P
PRECHARGE
Q O O O OBRAKE RAT CANOPY MAIN
DIFF
DISP
o o oRUDDER STAB FLAP
STRUT
PRESS O O O— o o oFILTER
RELIEFVALVE
o FLIGHT
COMB oSYSTEM
OFF
ON 2
OFF
ON 2
^ QUIESCENT FLOW ^INSTRUCTIONS
1 SELECT CIRCUIT TEST 1 • LIGHTS ON2 SELECT CIRCUIT TEST 2 • SEQUENCE ON3 RELEASE CIRCUIT TEST4. SELECT SYSTEM TEST 1 • RELEASE5 PRESSURIZE HYDRAULIC SYSTEM6 SELECT SYSTEM TEST 2 • FAULTY
CONDITION WILL ILLUMINATE • RELEASE7 TAKE APPROPRIATE CORRECTIVE ACTION
357

i
i
I
i

APPENDIX


MECHANICAL FAILURES PREVENTION GROUP
28th Meeting
Detection, Diagnosis and Prognosis
List of Registrants
Daniel P. AndersonFoxboro AnalyticalP. 0. Box 435
Burlington, MA 01803
Terrance E. AndersonBoeing Military Airplane Dev.
15050 SE Fairwood Blvd.
Renton, WA 98055
William H. AustinU. S. Navy Dept.
Naval Ship Engineering CenterWashington, DC 20362
Ron BannisterWestinghouse Electric CorporationMS-N205 LesterP. 0. Box 9175Philadelhpia, PA 19113
John R. BartonSouthwest Research Institute
8500 Culebra Road
San Antonio, TX 78284
John M. BeattyWestinghouse Steam Turbine Div.
P. 0. Box 9175Philadelphia, PA 19113
H. BelmanTechnical Development Company24 E. Glenolden AvenueGlenolden, PA 19036
Baylus BennettRadian Corporation8500 Shoal Creek BoulevardAustin, TX 78758
F. E. BishopAircraft Porous Media, Inc.
30 Sea Cliff AvenueGlen Cove, NY 11542
David B. BoardSKF Industries1100 First AvenueKing of Prussia, PA 19104
D. W. BotstiberTechnical Development Company24 E. Glenolden AvenueGlenolden, PA 19036
John E. BowerU. S. Steel Research125 Jamison Lane, M. S. 53
Monroeville, PA 15146
T. J. BullockColt IndustriesFairbanks Morse Engine Division701 Lawton AvenueBeloit, WI 53511
Harry C. Burnett *
National Bureau of StandardsMaterials Bldg. , Room B-264Washington, DC 20234
Ralph A. BurtonONR800 N. QuincyArlington, VA 22217
Andrew J. CallahanENDEVCORancho Vie jo RoadSan Juan Capistrano, CA 92675
56l

Richard J. CarletonNaval Ship Engineering Center1909 Foxhall RoadMcLean, VA 22101
Tony CarolanB&K Instruments, Inc.
5111 West 164th StreetCleveland, OH 44142
John T. CarrollPratt & Whitney AircraftWest Palm Beach, FL 33402
Tom CarterHamilton Test Systems, Inc.Windsor Locks, CT 06096
Phillip W. CentersU. S. Air ForceAir Force Aero-Propulsion Lab.
(AFAPL/SFL)Wright-Patterson AFB, OH 45433
Rustam ChinoyMechanical Technology Inc.
968 Albany-Shaker RoadLatham, NY 12110
Raymond A. CoulombeNaval Ship Engineering CenterCode 6146B, Room 368, NC-4Washington, DC 20362
Richard T. CowleyRCA «.
P. 0. Box 588Burlington, MA 01803
Richard B. CurtinSouthwest Research InstituteP. O. Drawer 28510San Antonio, TX 78284
L. W. DeablerDetroit Diesel Allison Div.General Motors Corporation1707 Beech Drive NorthPlainfield, IN 46168
Harold 0. DemurenNigeria Civil Aviation Authority122 Oyadiran EstateSabo-Yaba Lagos , Nigeria
J. G. DimmickNaval Ship R. & D. CenterPropulsion & Auxiliary Sys . DeptCode 2732
Annapolis, MD 21402
Maxwell DowCooper Airmotive7555 Lemmon AvenueDallas, TX 75209
Yuri EsakiFugi Electric Co., Ltd.
30 E. 42nd Street, Room 927
New York, NY 10017
James J. FotiU. S. Navy NAVSEC Phila.
733 Brooke Circle, N.
Morton, PA 19070
J. FrareyShaker Research CorporationNorthway 10
Ballston Lake, NY 12019
John A. GeorgeParks College of St. Louis Univ.
Cahokia, IL 62206
Alfred GenotSEMT Pielstick2 Ouai de Seine93202 Saint-Denis, France
Norman GleicherOcean Environmental Systems, Ltd
77 Quaker Ridge Road
New Rochelle, NY 10804
William A. GoldsworthyHughes Aircraft CompanyP. 0. Box 3267
Terminal Island, CA 90731
362

Milton GregoryComputer Avionics Corporation398 Martin AvenueSanta Clara, CA 95050
Robert GullionD-A Lubricant Company1340 West 29th StreetIndianapolis, IN 46208
Larry HargroveLife Cycle Engineering, Inc.
145 King Street, Suite 309
Charleston, SC 29401
Robert H. HawkinsCaterpillar Tractor CompanyTechnical Center, Bldg. A.
Peoria, IL 61629
Henry R. HegnerManTech of New Jersey Corp.2341 Jefferson Davis HighwayArlington, VA 22202
W. K. HerrColt Industries, Inc.
1901 L Street, NW - Suite 303Washington, DC 20036
R. Hohenberg, ManagerElectrical Engineering Dept.Mechanical Technology Inc.
968 Albany-Shaker RoadLatham, NY 12110
Robert R. HoldenHughes Aircraft CompanyBldg. 117, Mail Station 1
P. 0. Box 90515Los Angeles, CA 90009
Joe InnesNational Highway Traffic Safety
AdministrationWashington, DC 20590
R. D. JacobsColt IndustriesFairbanks Morse Engine Div.
701 Lawton AvenueBeloit, WI 53511
P. George JencekAtomics International8900 DeSoto AvenueCanoga Park, CA 91304
S. E. J. JohnsenDetroit Diesel Allison DivisionGeneral Motors CorporationPlant 8, T9
Indianapolis, IN 46206
Robert L. KarlsonENDEVCO505 North Belt - Ste 305
Houston, TX 77060
Rudy 0. KarschNaval Ship Engineering Center7426 Buffalo AvenueTakoma Park, MD 20012
E. E. KlausThe Pennsylvania State University133 Chemical Engineering Bldg.University Park, PA 16802
Bill KoelschChadwick-Helmuth Company, Inc.
Ill East Railroad AvenueMonrovia, CA 91016
Aaron R. KramerThermo Engineering Inc.
338 CarlstadtNew Jersey 07072
Bruce N, KramerHughes Aircraft Company3100 West Lomita BoulevardTorrance, CA 90509
363

Robert S. KulpPratt & Whitney Aircraft GroupUnited Technologies CorporationP. 0. Box 2691West Palm Beach, FL 33402
William D LaingorBell Helicopter Textron614 Arcadia, No. 1409Hurst, TX 76053
Robert W. LeBlancGeneral Electric Apparatus Service
Division, Measurement Services3285 McGaw DriveChamblee, GA 30341
Richard Lee
U. S. Army—JOAP-TSCJOAP-TSC, Pensacola NAS , Bldg. 780
Pensacola, FL 32508
Mark LibbyU.S. Navy—PERA (CV)
C 1861 P SNSBremerton, WA 98314
Daniel ListerPrinceton Gamma-Tech, Inc.
Box 641
Princeton, NJ 08540
Bryan LongBeta Machinery Analysis Ltd.
6425 Bowness Road, N.W.
Calgary, Canada T3B 0E6
Thomas MagetteOak Ridge National LaboratoryBox X, Bldg. 3500Oak Ridge, TN 37830
A. Bernard MarchantHughes Aircraft CompanyStrategic Systems DivisionBldg. 5, Mail Sta. B-146Culver City, CA 90230
Joe A. MclnturffLockheed Georgia CompanySo. Cobb DriveMarietta, GA 30062
William R. McWhirter, Jr.
David W. Taylor Naval ShipResearch & Development Center
Code 2731, Automation & Control Div.
Annapolis, MD 21402
J. H. MeyerAramco Overseas Co.
55 Laan Van MeerdervoortThe Hague, The Netherlands
Les MeyerGeneral Electric Co., Research Ctr.
1 River Road (37-680)
Schenectady, NY 12345
Louis MiletoEngineering Services GroupSystems Engineering Test DirectorateNaval Air Test CenterPatuxent River, MD 20670
Raymond F. MisialekNAVSECPHILADIV, Dept. of the NavyBldg. #633, 2nd FloorDynamic Instrumentation BranchPhiladelphia, PA 19112
Jacques MorelElectricite de France1 Place du General de Gaulle92160-Clamart, France
WayIon A. NeeseGeneral Electric Company1 Neumann Way, Mail Drop G-4Cincinnati, OH 45215
Frank M, NewmanSouthwest Research InstituteP. 0. Drawer 28510
San Antonio, TX 78284
361+

Philip NiosiManTech of New Jersey Corp.
2341 Jefferson Davis HighwaySuite 930Arlington, VA 22202
Asao NishimuraMechanical Engineering Research
Laboratory, Hitachi Ltd.
502 Kandatsu-MachiTsuchiura, Ibaraki 300, Japan
H. O. NorthernDetroit Diesel AllisonP. 0. Box 894
Indianapolis, IN 46206
David H. PageEngineer of Motive Power, CP RailRoom 1000, Windsor StationMontreal, Canada H3C 3E4
G. A. PetersAT&SF Railway Company1237 NavajoBarstow, CA 92311
J. PhilipsNaval Ship R. and D. CenterAnnapolis, MD 21402
John A. PhilosophosAllis-ChalmersP. 0. Box 512
Milwaukee, WI 53201
K. R. PietyOak Ridge National LaboratoryP. 0. Box XOak Ridge, TN 37830
C. PrestonCanadian Pacific Ltd.
Windsor Station, Res. Dept., Rm 369
Montreal, Quebec, Canada
Donald A. PrueUnited TechnologiesBradley Field RoadWindsor Locks, CT 06096
Raul A. RaudalesSAHSA AirlinesTegucigalpa, HondurasSAHSA Pts Control de CalidadQuality Control DptoAirport
H . RethmannSouthwest Research Institute6220 Culebra RoadSan Antonio, TX 78284
W. W. RobinsonPratt & Whitney Aircraft GroupGovernment Products DivisionP. 0. Box 2691
West Palm Beach, FL 33402
Robert E. RohtertHughes HelicoptersMail Station 2 T11ACentinela and Teale StreetsCulver City, CA 90230
Steven C. RothNational Bureau of StandardsPolymers Building, Room B-324Washington, DC 20234
Richard G. SalterRand Corporation1700 Main StreetSanta Monica, CA 90406
Norm A. SamuelsHughes Helicopters2560 Walnut StreetVenice, CA 90291
George S. SchmidtGeneral ElectricBldg. 2-440
Schenectady, NY 12309
T. Robert ShivesNational Bureau of StandardsMaterials Bldg., Room B-120Washington, DC 20234
365

Donald SidatPratt & Whitney AircraftEB3SW Main StreetE. Hartford, CT 06108
C. M. SmithOak Ridge National LaboratoryP. 0. Box X
Oak Ridge, TN 37830
George L. SmithGENRAD, Inc.
Acoustics, Vibration & Analysis D
2855 Bowers AvenueSanta Clara, CA 95051
Henry G. SmithEngineering Consultant201 S. Fronsica, Apt. 1
Redondo Beach, CA 90277
Kempton A. SmithGeneral Electric Co.
Bldg. 6, Room 3281 River RoadSchenectady, NY 12345
R. T. SmithSouthwest Research InstituteP. 0. Drawer 28510San Antonio, TX 78284
J. C. SolElectricite de France1, Avenue du General de Gaulle92141 Clamart, France
Roy W. SpacieHarris Corp./PRD Electronics Div.6801 Jericho TurnpikeSyosset, NY 11791
Leo L. StavinohaSouthwest Research Institute6220 Culebra RoadSan Antonio, TX 78227
J. E. SternNASA/GoddardCode 721
Greenbelt, MD 20771
Vernon SturdivantSouthwest Research InstituteP. O. Drawer 28510San Antonio, TX 78284
Richard W. SweeneyRepublic Steel Corporation.Nassillon, OH 44646
Frank A. TaitRoyal Australian Air ForceEmbassy of Australia1601 Massachusetts Ave., N.W.
Washington, DC 20036
Wm. H. TaitASNT/CSNDTDom. FoundriesHamilton, Ontario, Canada
Tadash TakigawaIshikawajima Harima Heavy
Industries Co. Ltd.
f-Mukohdai ChoTanashi City, Tokyo, Japan
Thomas TauberTEDECO24 E. Glenolden AvenueGlenolden, PA 19036
Tom TaylorRussell Associates8609 N.W. Plaza DriveDallas, TX 75080
Karl G. TippetsE . I . DuPontLouviers 13E30Wilmington, DE 19898
366

Richard I. Trammell
IBMDept G62/1425600 Cottle RoadSan Jose, CA 95193
W. F. WallLockheed Georgia Co.
South Cobb DriveMarietta, GA 30063
Robert A. WalterU. S. Dept. of Trans.—TSL
Kendall Sq.
Cambridge, MA 02142
George A. WardeAir Bus Industries of North
America
630 5th AvenueNew York, NY 10020
Dennis J. WebbJohnson Space Center (NASA)
Houston, TX 70058
Lavern D. WedevenNASA Lewis Research Center21000 Brookpark RoadCleveland, OH 44135
Herbert G. WegnerNaval Ship Engineering CenterPhiladelphia, PA 19112
Fred W. WeidnerU. S. Coast Guard G-DSA-3/TP44400 7th Street, S. W.
Washington, DC 20590
R. L. WidnerThe Timken Company1835 Dueber Avenue, S. W.
Canton, OH 44706
Charles WittEndevco CorporationSan Juan Capistrano, CA 92675
James P. WrightHughes Aircraft CompanyP. 0. Box 90515Los Angeles, CA 90009
Lt. Col. Edward F. YoungJOAP-TSCBldg. 780 NASPensacola, FL 32508
Henry K. WhiteselDavid W. Taylor Naval Ship R&D CenterCode 2732
Annapolis, MD 21402
Robert M. WhittierEndevco CorporationRancho Vie jo RoadSan Juan Capistrano, CA 92675
367

MFPG PUBLICATIONS
Both printed and microfiche copies of the following MFPG publications(1-11) whose catalog numbers start with "AD" or "COM" may be obtainedfrom the NTIS
.
National Technical Information Service5285 Port Royal Road
Springfield, VA 22151
1. Glossary of Terms AD 721 354
2. Proceedings of Meetings 1-9 (set of 5) AD 721 359
Meeting Nos. 1-5 Papers and discussion on failureanalysis and control.
Meeting No. 6 "Detection, Diagnosis and Prognosis",December 6, 1968.
Meeting No. 7 "Failure Mechanisms as Identifiedwith Helicopter Transmissions",March 27, 1969.
Meeting No. 8 "Critical Failure Problem Areas in
the Aircraft Gas Turbine Engine",June 25-26, 1969.
Meeting No. 9 "Potential for Reduction of MechanicalFailure Through Design Methodology",November 5-6, 1969.
3. Proceedings of Meeting No. 10 AD 721 912
"Vibration Analysis Systems"January 21-22, 1970
4. Proceedings of Meeting No. 11 AD 724 475
"Failure Mechanisms: Fatigue"April 7-8, 1970
5. Proceedings of Meeting No. 12 AD 721 913
"Identification and Prevention of MechanicalFailures in Internal Combustion Engines"July 8-9, 1970
368

6. Proceedings of Meeting No. 13 AD 724 637"Standards as a Design Tool in SurfaceSpecification for Mechanical Componentsand Structures"October 19-20, 1970
7. Proceedings of Meeting No. 14 AD 721 355"Advances in Decision-Making Processesin Detection, Diagnosis and Prognosis"January 25-26, 1971
8. Proceedings of Meeting No. 15 AD 725 200
"Failure Mechanisms : Corrosion"April 14-15, 1971
9. Proceedings of Meeting No. 16 AD 738 855"Mechanical Failure Prevention ThroughLubricating Oil Analysis"November 2-4, 1971
10. Proceedings of Meeting No. 17 AD 750 411"Effects of Environment Upon MechanicalFailures, Mechanisms and Detection"April 25-27, 1972
11. Proceedings of Meeting No. 18 AD 772 082
"Detection, Diagnosis and Prognosis"November 8-10, 1972
12. Proceedings of Meeting No. 19 (NBS SP 394) COM-74-50523"The Role of Cavitation in Mechanical Failures"October 21 - November 2, 1973
Printed copies of the following MFPG publications (catalog numbersstarting with SN) may be obtained from the Government Printing Office.
Superintendent of DocumentsU.S. Government Printing Office
Washington, DC 20402
Microfiche copies of these publications (catalog numbers starting withNBS-SP) may be obtained from NTIS.
13. Proceedings of Meeting No. 20 (NBS SP 423)
"Mechanical Failure - Definition of the Problem"May 8-10, 1974Cost: Printed copy $6.10 SN003-003-01451-6
569

14. Proceedings of Meeting No. 21 CNBS SP 433)
"Success By Design: Progress ThroughFailure Analysis"November 7-8, 1974
Cost: Printed copy $3.50 SNQ03-003-01639-0Microfiche copy $2.25 NBS-SP-433
15. Proceedings of Meeting No. 22 (NBS SP 436)
"Detection, Diagnosis and Prognosis"April 23-25, 1975Cost: Printed copy $4.25
Microfiche copy $2.25
16. Proceedings of Meeting No. 23 (NBS SP 452)
"The Role of Coatings in the Preventionof Mechanical Failures"October 29-31, 1975
Cost: Printed copy $2.65 SN003-003-01664-1
17. Proceedings of Meeting No. 24 (NBS SP 468)
"Prevention of Failures in CoalConversion Systems"April 21-23, 1976Cost: Printed copy $3.00 SN003-003-01760-4
18. Proceedings of Meeting No. 25 (NBS SP 487)
"Engineering Design"November 3-5, 1976Cost: Printed copy $5.25 SN003-003-01829-5
19. Proceedings of Meeting No. 26 (NBS SP 494)
"Detection, Diagnosis and Prognosis"May 17-19, 1977
Cost: Printed copy $4.50 SN003-003-01844-9
20. Proceedings of Meeting No. 27 (NBS SP 514)
"Product Durability and Life"November 1-3, 1977Cost: Printed Copy $3.75 SN003-003-01935-6
SN003-003-01556-3NBS-SP-436
370

BS-114A (REV. B-78)
2.Gov»t Accession NoU.S. DEPT. OF COMM.
BIBLIOGRAPHIC DATASHEET
1. PUBLICATION OR REPORT NO.
SP-547. TITLE AND SUBTITLE
Detection, Diagnosis, and Prognosis. Proceedings of the 28th
meeting of the Mechanical Failures Prevention Group, held at
San Antonio, Texas, November 28-30, 1978.
3. Recipient's Accession No.lo.
5. Publication Date
July 1979$. PerfofisiRg Organization Code
>?HKra»X}SX EDITORS
T. Robert Shives and William A. Willard
8. Performing Organ. Report No.
PERFORMING ORGANIZATION NAME AND ADDRESS
NATIONAL BUREAU OF STANDARDSDEPARTMENT OF COMMERCEWASHINGTON, DC 20234
16, f^ect/task/Wor* Unit No.
11. Contract/Grant No.
!. SPONSORING ORGANIZATION NAME AND COMPLETE ADDRESS (Street, City, State, zip)
Center for Matls.Sci., NBS, Wash., DC 20234; ONR, Dept. of
Navy, Arlington, VA 22217; NADC, Dept of Navy, Warminster, PA
18974; DoE, Fossil Energy, Washington, DC 20545; NASA,
Space Flight Ctr., Greenbelt, MD 20771.
13. Type of Report & Period Covered
Goddar$i4, Spispsoricig Agency Code
). SUPPLEMENTARY NOTES
L0C 79-600078I I
Document describes a computer program; SF-185, FIPS Software Summary, is attached.
ABSTRACT (A 200-word or leas (actual summary oi most significant information. If document includes a significant bibliography or
literature survey, mention it here.)
These proceedings consist of a group of twenty five submitted papers from
the 28th meeting of the Mechanical Failures Prevention Group which was
held in San Antonio, Texas, November 28-30, 1978. The central theme of
the proceedings deals with detection, diagnosis, and prognosis as related
to mechanical failure prevention. Special emphasis is on aerospace
applications, land based applications, marine applications and industrial
application.
KEY WORDS (six to twelve entries; alphabetical order; capitalize only the first letter of the first key word unless a proper name
separated by semicolons)
tearing analysis; condition monitoring; engine diagnosis; failure detection;
ailure diagnosis; failure prevention; maintenance; performance monitoring
AVAILABILITY [X] Unlimited
D For Official Distribution. Do Not Release to NTIS
^Order From Sup. of Doc, U.S. Government Printing Office, Washington, DC20402, SD Stock No. SN003-003- 0 20 8 3 - 4
Order From National Technical Information Service (NTIS), Springfield,
VA. 22161
19. SECURITY CLASS(THIS REPORT)
.UNCLASSIFIED
20. SECURITY CLASS(THIS PAGE)
UNCLASSIFIED
21. NO. OFPRINTED PAGES
36822. Price
$7.00
USCOMM-DC
I^U.S. GOVERNMENT PRINTING OFFICEi 19 7 9-281-067/150

; in
I-

oftlx \)t/v//<//'Bttmm ffStmi in.
review copy, write Journal of
irch, National Bureau of Standards,
DEPARTMENT OF COMMERCElington, D.C. 20234
Subscribe now-The newlaiionalBureauefSteudanlsJournalThe expanded Journal of Research of the National
Bureau of Standards reports NBS research anddevelopment in those disciplines of the physical
and engineering sciences in which the Bureau is
active. These include physics, chemistry, engineer-
ing, mathematics, and computer sciences. Paperscover a broad range of subjects, with majoremphasis on measurement methodology, and the
basic technology underlying standardization. Also
included from time to time are survey articles on
topics closely related to the Bureau's technical
and scientific programs. As a special service to
subscribers each issue contains complete citations
to all recent NBS publications in NBS and non-NBS media. Issued six times a year. Annual sub-
scription: domestic $17.00; foreign $21.25. Single
copy, $3.00 domestic; $3.75 foreign.
• Note : The Journal was formerly published in
two sections: Section A "Physics and Chem-istry" and Sectioi. B "Mathematical Sciences."
NBS Board of Editors
Churchill Eisenhart,
Executive Editor (Mathematics)John W. Cooper (Physics)
Donald D. Wagman (Chemistry)Andrew J. Fowell (Engineering)Joseph O. Harrison (Computer Science)Helmut W. Hellwig (Boulder Labs.)
cription Order Form
r my subscription to NBS Journal of Research
7.00. Add $4.25 for foreign mailing. No additional postage is
red for mailing within the United States or its possessions,
t—File Code 2Q)
Subscription to:
Remittance Enclosed
(Make checks payable
to Superintendent of
Documents)
Charge to my Deposit
Account No.
Name-First, Last
1 1 1 1 1 1 1 1 1 1 1 1 1 1 1 1 11 1 1 1 1 1
1 1
Company Name or Additional Address Line
1 1 1 1 1 II 1 1 1 1 1 1 1 1 1 1 1 II 1 1 1 1 1 1 1
Street Address
1 1 1 1 1 1 1 1 1 1 1 1 1 1 1 1 1 II 1 1 1 1 1 1
City State Zip Code
MAIL ORDER FORM TO:Superintendent of DocumentsGovernment Printing Office
Washington, D.C. 20402

1
i

NBS TECHNICAL PUBLICATIONS
PERIODICALS
JOURNAL OF RESEARCH—The Journal of Research
of the National Bureau of Standards reports NBS research
and development in those disciplines of the physical andengineering sciences in which the Bureau is active. These
include physics, chemistry, engineering, mathematics, and
computer sciences. Papers cover a broad range of subjects,
with major emphasis on measurement methodology, and
I
the basic technology underlying standardization. Also in-
I
eluded from time to time are survey articles on topics closely
related to the Bureau's technical and scientific programs. Asa special service to subscribers each issue contains complete
citations to all recent NBS publications in NBS and non-
NBS media. Issued six times a year. Annual subscription:
domestic $17.00; foreign $21.25. Single copy, $3.00 domestic;
$3.75 foreign.
Note: The Journal was formerly published in two sections:
Section A "Physics and Chemistry" and Section B "Mathe-matical Sciences."
I DIMENSIONS/NBSThis monthly magazine is published to inform scientists,
engineers, businessmen, industry, teachers, students, andconsumers of the latest advances in science and technology,
with primary emphasis on the work at NBS. The magazinehighlights and reviews such issues as energy research, fire
j
protection, building technology, metric conversion, pollution
j
abatement, health and safety, and consumer product per-
jformance. In addition, it reports the results of Bureau pro-
grams in measurement standards and techniques, properties
of matter and materials, engineering standards and services,
instrumentation, and automatic data processing.
Annual subscription: Domestic, $1 1.00; Foreign $13.75
NONPERIODICALSMonographs—Major contributions to the technical liter-
ature on various subjects related to the Bureau's scientific
and technical activities.
Handbooks—Recommended codes of engineering and indus-
trial practice (including safety codes) developed in coopera-
tion with interested industries, professional organizations,
and regulatory bodies.
Special Publications—Include proceedings of conferences
Isponsored by NBS, NBS annual reports, and other special
publications appropriate to this grouping such as wall charts,
[pocket cards, and bibliographies.
Applied Mathematics Series—Mathematical tables, man-uals, and studies of special interest to physicists, engineers,
Ichemists, biologists, mathematicians, computer programmers,pad others engaged in scientific and technical work.
National Standard Reference Data Series—Provides quanti-
tative data on the physical and chemical properties ofmaterials, compiled from the world's literature and critically
bvaluated. Developed under a world-wide program co-
ordinated by NBS. Program under authority of NationalStandard Data Act (Public Law 90-396).I
NOTE: At present the principal publication outlet for these-
data is the Journal of Physical and Chemical Reference
Data (JPCRD) published quarterly for NBS by the Ameri-can Chemical Society (ACS) and the American Institute of
Physics (AIP). Subscriptions, reprints, and supplementsavailable from ACS, 1155 Sixteenth St. N.W., Wash., D.C.20056.
Building Science Series—Disseminates technical information
developed at the Bureau on building materials, components,systems, and whole structures. The series presents research
results, test methods, and performance criteria related to the
structural and environmental functions and the durability
and safety characteristics of building elements and systems.
Technical Notes—Studies or reports which are complete in
themselves but restrictive in their treatment of a subject.
Analogous to monographs but not so comprehensive in
scope or definitive in treatment of the subject area. Oftenserve as a vehicle for final reports of work performed at
NBS under the sponsorship of other government agencies.
Voluntary Product Standards—Developed under procedures
published by the Department of Commerce in Part 10,
Title 15, of the Code of Federal Regulations. The purpose
of the standards is to establish nationally recognized require-
ments for products, and to provide all concerned interests
with a basis for common understanding of the characteristics
of the products. NBS administers this program as a supple-
ment to the activities of the private sector standardizing
organizations.
Consumer information Series—Practical information, based
on NBS research and experience, covering areas of interest
to the consumer. Easily understandable language andillustrations provide useful background knowledge for shop-
ping in today's technological marketplace.
Order above NBS publications from: Superintendent of
Documents, Government Printing Office, Washington, D.C.20402.
Order following NBS publications—NBSIR's and FIPS fromthe National Technical Information Services, Springfield,
Va. 22161.
Federal Information Processing Standards Publications
(FIPS PUB)—Publications in this series collectively consti-
tute the Federal Information Processing Standards Register.
Register serves as the official source of information in the
Federal Government regarding standards issued by NBSpursuant to the Federal Property and Administrative Serv-
ices Act of 1949 as amended, Public Law 89-306 (79 Stat.
1127), and as implemented by Executive Order 11717
(38 FR 12315, dated May 11, 1973) and Part 6 of Title 15
CFR (Code of Federal Regulations).
NBS Interagency Reports (NBSIR)—A special series of
interim or final reports on work performed by NBS for
outside sponsors (both government and non-government).
In general, initial distribution is handled by the sponsor;
public distribution is by the National Technical Information
Services (Springfield, Va. 22161) in paper copy or microfiche
form.
BIBLIOGRAPHIC SUBSCRIPTION SERVICES
toe following current-awareness and literature-survey bibli-
ographies are issued periodically by the Bureau:Cryogenic Data Center Current Awareness Service. A litera-
ture survey issued biweekly. Annual subscription: Domes-tic, $25.00; Foreign, $30.00.
'iquified Natural Gas. A literature survey issued quarterly.Annual subscription: $20.00.
Superconducting Devices and Materials. A literature survey
issued quarterly. Annual subscription: $30.00. Send subscrip-
tion orders and remittances for the preceding bibliographic
services to National Bureau of Standards, Cryogenic Data
Center (275.02) Boulder, Colorado 80302.

U.S. DEPARTMENT OF COMMERCENational Bureau of StandardsWashington. D.C. 20234
POSTAGE AND FEES PAIDU.S. DEPARTMENT OF COMMERCE
OFFICIAL BUSINESS COM-215
Penalty for Private Use. $300
SPECIAL FOURTH-CLASS RATEBOOK