
Lapped bar splices in concrete beams - Nvlpubs.nist.gov
35
• U. OF COMMERCE NATIONAL B UREAU OF STANDARDS RESEARCH PAPER RPl669 Part of Journal of Research of the National Bureau of Standards, Volume 35, September 1945 LAPPED BAR SPLICES IN CONCRETE BEAMS By Ralph W. Kluge and Edward C. Tuma ABSTRACT An investigation was conduct ed to determine the general hehavior and strength of lapped bar sp lices that vari ed in length and method of lapping. The bond strength developed in the splice and the slip of bar were determined for two types and two sizes of reinforcement. The res ulting data clearly illustrated the manner in which the stress was transferred from one lapped bar to the other; the relative merits of the two types of bars, as well as the effectiveness of the two methods of lapping, are also shown. CONTENTS I. Introduction __ _______________ ___ __ _________ -- ---- _________ __ __ _ 1. Object and scope of investigation __________ _________ _________ _ II. Description of test specimens __________ _____ _____________ ____ _____ 1. Design of beams ____ ____ ___ __________ ___ _______________ ___ _ 2. Construction of specimens _________ ________________________ _ III. Description of tests ______ __ ___ ______________ _________ ___ _______ _ 1. Procedure _____________ ___ _______ ________________________ _ IV. Test results of series A _____ _________ ___ ___ ___ ___________________ _ 1. Distribution of stress along lapped bars _____________ __ ______ _ 2. Bond strength ______ ___ ____ __ ____ ____ ___ ______________ ___ _ 3. Comparison between methods of lapping ______ ______ ____ _____ 4. Distribution of slip along lapped bars _______________ __ ______ _ V. Test results of series B __________________ ______ ___ ___ ___________ _ 1. General mann er of failure _______________ _________ ___ ____ ___ _ VI. 2. Average bond strength __________________ _____ ____ ___ _______ _ 3. Effect of gage holes on the average bond stress- ______ ________ _ Discussion of results- _________________________________________ ___ 1. General discussion ____________________________________ ____ _ VII. Summary of test results ____________________ ________________ ____ _ 1. INTRODUCTION 1. OBJECT AND SCOPE OF INVESTIGATION Page 187 187 189 189 190 190 190 191 191 208 209 210 213 213 215 216 217 217 218 There is little information available in the technical literature cerning the behavior of lapped reinforcing-bar splices. As far as is known to the authors, such data that have been published pertain to relatively long laps involving plain round bars.l It therefore seemed desirable to conduct a study of this type of splice, including such variables as length, method of lapping, and type of deformed bar. Specifically, the purpose of the tests described in this paper was first, to determine the distribution of stress along the lapped bars and the accompanying bar slip; second, to compare the effectiveness of 1 W. A. Slater, F. E. Richart, and G. G. Scofield, Tests of bond resistance between concrete and steel Tech. Pap. BS (1920) TI73; or W. A. Slater, Structural laboratory investigations in reinforced concrete mad by Concrete Ship Section, Emergency Fleet Corporation, Proc. Am. Concrete Inst. xv (19l9). 663099-45--3 187
-
Upload
khangminh22 -
Category
Documents
-
view
1 -
download
0
Transcript of Lapped bar splices in concrete beams - Nvlpubs.nist.gov
•
U. S.~PEPARTMENT OF COMMERCE NATIONAL B UREAU OF STANDARDS
RESEARCH PAPER RPl669
Part of Journal of Research of the National Bureau of Standards, Volume 35, September 1945
LAPPED BAR SPLICES IN CONCRETE BEAMS By Ralph W. Kluge and Edward C. Tuma
ABSTRACT
An investigation was conducted to determine the general hehavior and strength of lapped bar splices that varied in length and method of lapping. The bond strength developed in the splice and the slip of bar were determined for two types and two sizes of reinforcement. The resulting data clearly illustrated the manner in which the stress was transferred from one lapped bar to the other; the relative merits of the two types of bars, as well as the effectiveness of the two methods of lapping, are also shown.
CONTENTS
I. Introduction __ _______________ ___ __ _________ -- ---- _________ __ __ _ 1. Object and scope of investigation __________ _________ _________ _
II. Description of test specimens __________ _____ _____________ ____ ____ _ 1. Design of beams ____ ____ ___ __________ ___ _______________ ___ _ 2. Construction of specimens _________ ________________________ _
III. Description of tests ______ __ ___ ______________ _________ ___ _______ _ 1. Procedure _____________ ___ _______ ________________________ _
IV. Test results of series A _____ _________ ___ ___ ___ ___________________ _ 1. Distribution of stress along lapped bars _____________ __ ______ _ 2. Bond strength ______ ___ ____ __ ____ ____ ___ ______________ ___ _ 3. Comparison between methods of lapping ______ ______ ____ ____ _ 4. Distribution of slip along lapped bars _______________ __ ______ _
V. Test results of series B __________________ ______ ___ ___ ___________ _ 1. General manner of failure _______________ _________ ___ ____ ___ _
VI.
2. Average bond strength __________________ _____ ____ ___ _______ _ 3. Effect of gage holes on the average bond stress- ______ ________ _
Discussion of results- _________________________________________ __ _ 1. General discussion ____________________________________ ____ _
VII. Summary of test results ____________________ ________________ ____ _
1. INTRODUCTION
1. OBJECT AND SCOPE OF INVESTIGATION
Page 187 187 189 189 190 190 190 191 191 208 209 210 213 213 215 216 217 217 218
There is little information available in the technical literature con~ cerning the behavior of lapped reinforcing-bar splices. As far as is known to the authors, such data that have been published pertain to relatively long laps involving plain round bars.l It therefore seemed desirable to conduct a study of this type of splice, including such variables as length, method of lapping, and type of deformed bar.
Specifically, the purpose of the tests described in this paper was first, to determine the distribution of stress along the lapped bars and the accompanying bar slip; second, to compare the effectiveness of
1 W. A. Slater, F. E. Richart, and G. G. Scofield, Tests of bond resistance between concrete and steel Tech. Pap. BS (1920) TI73; or W. A. Slater, Structural laboratory investigations in reinforced concrete mad by Concrete Ship Section, Emergency Fleet Corporation, Proc. Am. Concrete Inst. xv (19l9).
663099-45--3 187

188 Journal of Research of the National Bureau of Standards .~~
the lapped bars spaced l~~-bar diameters apart with that of the lapped bars in contact with each other; and, third, to compare the behavior of two types of reinforcing bars, one having a relatively greater lug height than the other. Both bars were considered to be among the best available as far as bonding properties were concerned.
The test program was divided into two pa.rts, as indicated in table l. One part covered the tests of large beams containing bars 1 in. in diameter, and the other, tests of small beams reinforced with bars ~ in. in diameter. For each size of bar, two sets of tests were made, designated series A and series B. All tests were made on each of the two types of bars.
The tests of series A were primarily concerned with the manner in which the tensile stress or bond stress varied along the lapped bars and the magnitude of the slip at variou's points.~ The data also served to compare the behavior of the two types of bars and the relative
NOMINAL
IsERIl: SPEC!- l£NerH MEN OF
LAP. IN.
A-50 50 A-40 40 A-30 30 '
TABLE I.-Schedule of tests.
DESIGN DeTAILS OF BEAMS
Bar plo/7
~ A :~:~X ~~ . I a!.,3" ,s!.6" a!.3" ;S ~'" ~ . 1-{S6 s/I.rr{/ps I [ 'J A-30X 30 Dlt' · /tb· 4'cc tb i ..... A-ZOx 20 ,,, :. IA-: : :v.: : :~,.,( : i : I I I +til. \3.. t--+~+"""":::'--j ~ ~ 1'.uJ I " I" I /)V oars? I I III Jz,
• 8-40 40 .. I~ .1-W~"''''' - - .............. 1-1
" 8-30 30 l/.3:1 }-4 w /Z'-O" / 4~ B 8-Z0 ZO t4l/oarshooAed
8-30X. 30 [B~ZO)( eo A-50 Z5 A-40 20 A-30 IS
A ~ZO /0 A-4(JX 20
~ A-30X!5 .... A-ZOX /0 ;!;. 1---+--~--1 'l 8-40 EO
~ 8-30 15 'II\J B-ZO /0
B 8-/0 5 B-30}( /5 B-ZrJ)( /0
l8-/ox 5
8arphn
#0111 :-In SP~ClhH?I7S cTeS/gna/ed' wY,h !he lelkr·:.t' H
(ol/owlng spec//17<~n numos" lapped Pars Were //7 con/act Wli',h eao? o/her. In 0'// or.her ~eo'ms. bars aerl1 spaclld Ii ~O: cillar. '

Lapped Bar Splices in Ooncrete Beams 189
effectiveness of the two methods of lap splicing. The length of splice in this series varied from 20- to 50-bar diameters and only a single test was made for each length of lap, type, and size of bar.
Series B was planned to provide values of average maximum bond stress for several lengths of lap. However, there were few welldefined bond failures and, notwithstanding the use of high-yieldstrength reinforcement, many specimens failed by yielding of the bars beyond the splice. These tests, however, had some value in indicating the effectiveness of the shorter laps. In this series, the length of the splices varied from 10- to 40-bar diameters, and in all but a few instances duplicate tests were made.
II. DESCRIPTION OF TEST SPECIMENS
1. DESIGN OF BEAMS
Details of the test specimens are shown in the diagrams of table 1. As indicated in the bar plan, each beam contained a single lap splice and two continuous bars. The beams were designed to permit a clear spacing of 1}6-bar diameters between all the bars at a section through the splice, and their effective depth was such that theoretically, for a stress of 20,000 psi in the continuous bars, the concrete was stressed to 1,500 psi in compression, assuming a modular ratio of n=8. This design resulted in a section, outside the region of the lap splice, containing 1.4 percent of tensile reinforcement.
The span of the large beams (containing the I-in. bars) was 12 ft and that of the small beams (with the ~-in. bars) was 8 ft. Load was applied to the beams at two points, so spaced as to provide a region of constant moment sufficient in extent to accommodate the longest lap splice of 50-bar diameters. The actual lengths of lap were slightly greater than the given nominal values in order to accommodate an even mUltiple of a 5-in. spacing of gage holes. The exact values were X-in. and ~ in. greater than the nominal lengths for the ~-in. and I-in. bars, respectively.
The reinforcement consisted of two types of bars, illustrated in figure 1, andr designated by number. Bar No. 1 had average lug heights of 0.020 in. and 0.027 in., whereas Bar No.2 had average lug heights of 0.031 in. and 0.063 in. for the ~-in. and I-in. bars, respectively. The approximate bearing areas of the lugs per lineal inch are given in table 2. For the specimens of series A, the reinforcing bars were of intermediate grade or better, whereas the bars used in beams of s~ries B were exclusively of high-strength steel, having a yield point of from 53,000 to 62,000 psi. Their dimensions and mechanical properties tHe listed in tables 2 and 3, respectively.
The concrete was designed for a compressive strength of 4,500 psi at 28 days and consisted of moderate-heat-of-hardening portland cement and washed Potomac River sand and gravel, the latter having a maximum size of % in. The proportions of cement, sand, and gravel in the mix were, respectively, 1:2.5:3.3 by dry weight; and the net water content, 7~ (Sal of water per sack of cement, correspondmg to a water-cement ratIO of 0.67 by weight. The resulting concrete had an average slump of 3~ in. and developed an average compressive strength of 4,700 psi tested dry at 28 days.
190 Journal of R esearch of the National Bureau of Stanaaras
TABLE 2.-Dimensions of reinforcement
Average Bar number Bar size Diameter 1 Area 1 lug Lugs per
height yard
----in. in . in .' in.
2 _________________________ ___ { ~ 0. 49 0. 190 0.031 128 1 1. 00 .787 .063 80
L __________________ _________ { ~ 0.51 .198 . 020 100 1 1. 00 .785 . 027 50
1 As determined by weight-length method.
TABLE 3.-Mechanical properties of reinforcement
[Each value is the average of three tests]
Test series Bar Bar size Yield Tensile numbers point strength
in. psi psi
A ___ ____ __________ _______ __ ________________ { 2 ~ 50, 000 79,800 1 ~ 61,800 90,000 2 1 45,000 71, 600 1 1 51,600 97, 200
B ____ ____ __ ________________________________ { 2 ~ 61,800 97, 400 1 ~ 55, 000 92,C,00 2 1 W,4oo 94.200 1 1 63,000 92,300
2. CONSTRUCTION OF SPECIMENS
Approximate bearing area of lugs per lineal inch
in .'/in. 0.16
. 0
. 11
Elongation in 8 in.
-%
20. 22. 26. 18.
16. 18. 18. 23.
4 o 2 8
6 o 8 1
Four beams were generally cast at one time, two small beams and two large beams, both pairs containing splices of equal length in terms of the bar diameter. One of each pair contained the No.1 bar and the other the No.2 bar. The reinforcement was rigidly supported on wire chairs as well as on tapered wooden inserts. Removal of the latter from the cast beam provided openings to the bars for strain measurements. Spacing of the inserts is shown in figure 2 for beams of series A. The beams of series B contained gage holes, similarly spaced, but confined to the region outside the limits of the splice.
The free ends of the lapped bars were saw cut in order to avoid the distorted ends generally accompanying shear cuts. Where no space was provided between the lapped bars, they were firmly wired together at the center and near the ends of the lap with soft iron wire. The concrete was vibrated into place in the beams and the control cylinders. Twenty-four hours after casting, the side forms of the beams and cylinders were removed. The test specimens were then wrapped with several layers of wet burlap and cured in this condition for a period of 7 days, after which they were permitted to dry in the laboratory for 21 days before testing.
III. DESCRIPTION OF TESTS
1. PROCEDURE
In order to facilitate the measurement of strain, the beams were tested in an inverted position on standard beam supports resting on the platen of a 600,000-lb hydraulic testing machine equipped with

Journal of Research of the National Bureau of;itandards Research Paper 1669
I ~
I FIG URE I. - Reinforcing bal·s . A, Bar ]\0. I ; B, bar No.2.
J

~
Journal of Research of the National Bureau of Standards Research Paper 166Q
FlG UHE 2.- Reinjo1'cement /01' 3D-baT diamete1' splice. Lapped bars in contact. Specimen type A- 3Dx.
L - oS-

Journal or Research of the National Bureau of Standards Research Pap<r 1669
FIG URE 3.- Bight-Joot uea'ln oj series A under load.
FIG UHE 4.- Twelve-foot beam of series A tmder load.

Lapped Bar Splices in Ooncrete Beams 191
a 30,000-lb gage. The load was applied near the ends of the specimens through a pair of wide-flange I-beams resting on rollers and bearing plates, which can be observed in figures 3 and 4. The weight of the loading beams and auxiliary equipment was approximately 2,400 Ib and was considered as part of the total applied load.
Strain-gage readings were obtained with a 5-in. Whittemore gage for 8 to 10 increments of load. In the tests of series A, strain measurements were made at 27~-in. and 5-in. intervals on the H- and I-in. bars, respectively, the intervals extending from the free ends of the lapped bar to the load points and at a number of selected points on the continuous bars. Slip of the lapped bars was determined with the strain gage by observing the relative movement between gage holes on the lapped bars and those on the continuous bars one gage length removed. The readings were corrected for strain in the bars as well as for the angle of the line of measurement. Measurements of strain in the tests of series B were confined to ~age lines outside the region of the splice, thus avoiding the uncertalll effect of openings in the concrete OR the bond stresses along the lapped bars. The avera~e bond stress could be determined from the observed tensile stress III the bars at the ends of the lap.
During the latter stages of the test, the beams were carefully scrutinized for possible longitudinal cracks, which, in some beams, formed in the concrete along the lapped bars when the maximum load was reached.
IV. TEST RESULTS OF SERIES A
1. DISTRIBUTION OF STRESS ALONG LAPPED BARS
The strains at corresponding gage lines on each of the two bars of th e lap were averaged and converted to stress on the assumption that E. was 30,000,000 psi, and load-stress diagrams plotted for all of the gage points along the bar. Typical diagrams are shown in figure 5. The curves are arranged in the order that the gage lines appear on the lapped bar, starting at the free end. After initial cracking of the concrete, the stress in the bar at various points was closely proportional to the load until either the bond stress within the gage line approached a maximum or the yield point of the steel was reached. The curves for the portion of the bar near the free end clearly show the maximum tensile stress, which is also a measure of the maximum bond stress that the bar was capable of developing within the first few inches of embedment.
The variation of tensile stress along the lapped bars of the various speci~ens is shown in figures 6 to 13. The plotted values were taken from the load-stress curves described above for loads near the maximum and for loads that produced a stress of about 18,000 to 20,000 psi in the bars outside the region of the splice. The pair of curves shown on each axis, one for each bar of the splice, are identical except that they are turned end for end. Both the No.1 and No.2 bars are represented in each figure.
The slope at any point on the curves is obviously a measure of the bond stress developed between the bar and the concrete at that point. The greatest bond stress was developed at the free end of the bar, and this stress decreased fairly uniformly in the 20- and 30-diameter laps

192 Journal of Researoh of the National Bureau of Standards
~ ~ z ()..
~ 0 ~
.~ 12
~ ~ '-J
8
6
4
Ten~i/e ';Ire», 200001'.1/ *" I. ~ 1 FIGURE 5.-Typical load-stress curves for successive gage lines along lapped_ bars.
Stress values are the product of the modulus of elasticity and ot-served strains.

Lapped Bar Splices in Ooncrete Beams 193
+ SpeCImens ,4-20 0
I 20 1><11" .,.. y " /0 . .. 8arNo.2 f-
-- " Lood .5000 Ib --. " 0 !
20 ~
~ ~ v
/0 Bar No. , ---
...... LoO'd 5000 Ib
--". : ",
0
50 ~ ~
: x 4f)
I ....
'" /'1' 30
20 'Symbol )( ;~cd/~ sh-es.v~ Bar No.2 -- h com7nuous odrs / i 1\ LOdtf 10000/b
/0 I \ 0
SO x x -...
.~ ........., : V i>'.... "" 3
\ 20 / 80'r No. / -Lood IOCXJO /0 10 /' : "
I f , ,
0 /$ /0 o /0 /5
O/sfO'nce rrol71 ti. In Inches FIGURE 6.-Distribution of stress along lapped bars.
J,ength of splice 20·bar diameters. ~·in. bars. Stress values are the product 01 the modulus of elasticity and observed strains.

•
194 Journal of Researohof the National Bureau of Standards
.30
20
10
0
Zu 10
0
SO
40
.3(.
20
/0
0
6<
"TV
30 '20
/~
0
.1 SpecImens A-3D ,
i ~-
~ :--. 8ar No. 2 ",) " , LOdd 5000/b ,
" • )
'I: v .. -... <
y- """'< /Jar No. /
i ... , 1. Odd 5000 10 " ... ...
~ r-... : ~
V
.~ K Symbol x lame-OMs BorlVo.E s/~ss In CO/l!t/lllOllY ~ L.oad 11000 Ib
bars I
, I \
I \
:
-..... ....... I~X
,,5)..--'"
/ Vi'" ~ BarNo. 1 / ! "\ ~~ Loo'd /1000 16
;
I T \ I \
/5 10 .5 0 S 10 /S O/s/once rro/77 ti //7 //'7ches
FIGURE 7.-Distribution of stress along lapped bars.
-
Length of splice 30-bar diameters. ~-in. bars. Stress values are the product of the modulus of elasticity and observed strains.

~ ~ ~
~ "-
.~
~ ~ ~ ~ ~ ~ ~
Lapped Bar Splices in Ooncrete B eams 195
ie~~l~~i Specimens A-4~ l
30
20
/0
0
20
/0
0
SO
40
30
20
/0
0
SO
40
30
20
/0
0
I ~ 1 y
....-" : r-.. I 80rNo.2 _ , , , ..... J.ood .50001b ., '1. .
! ""111'- -y 'I" V
-< )....., 8arIV0.1_ /' 'J..0o'd 5000 Ib ,,-
I -........; r-, I.--' Y
f'--l\... .......; ~ Symbol x indco'les L/ V,~ f'........
t- sire"" in con/;/7t// i Bar No. 2 I-
bars '\ Load //00016
/. ! \ / \
I'
~ N F--. .-! >--" H .... cV r::-.;
/' V '" ~ : Bar #0. 1
,,< /
1t-. LOO'd 1100010 \
II' sf \
/5 10 5 o 5 /0 /5 OlslO'l7ce rra/77 r§ /n /nch~s
FIGURE 8.-Distribution of stress along lapped bars. Length of splice 40·bar diameters. ).i·in. bars. Stress values are the product of the modulus of elasticity and
observed strains.

196 Journal 'Of R esearch of the N ationaZ Bureau of Standards
~ Q. ~ ~
~ .~
~ ~ ~
~ ~ ~
t f s .1 115. t
30
20
10
0
20
/0
0
..sa 40
30
20
/0
0
..so rv
30
20
/0
0
! I _
80-r IVo.!?, LOO'd 5000lb
! 1
~
/('<'" ear No. 1, Lood 5000 Ib
!
... ... "
,iy-"' .,...,~ Bor !Yo. e t--t-+--+-t-----b""'~q__l_-i_; ~If---=! "I.(-....=-.d Lood 11000 Ib I-
H--+--l---,J;</~"""Sym6o/ x !n~cO'resr L"----"I...------r---r---I4
/ .$lres.3 //7 con17/7t/ous 6 .'11.5 \
I ~ \
/ \
IS 10 s o 5 /0 /5 O/sfance rro/77 ~ In inches
FIGURE g.-Distribution of stress along lapped bars.
Length of splice 50·bar diameters. J.i·in. bars. Stress values are the product of the modulus of elasticity and observed strains.

•
Lapped Bar Splioes in Ooncrete B eams 197
t Specimens A-ZO
30
20 v ... -0--
~~ j..-O"" "" -v
10 8arNo.2
~p" : ["0., Lood 25000/6 0
20 ~ ... -v r-o... ~ ~ "" ""
/0 kif Bar No. /
"if V : 1'0- Load 25000 /b
0
50
4tJ "" .1!;
~ ~ A ...
<T ~ '"' X X ..... '" 30 Symbol )( ina/cales ~ ~. 20 ,ilre3s in conhhuous Bor 1V0. Z
V " Loaa' 45000 /b
10 bdrJ .../ ~
I " I : 0
Sc... ~ x x ~ -8:: -0 t-6- x X
.J<.
~ ~ U"l.
30 t-o... : ~ L.o--
........
10--lfl V 20 BarlVo. /
y:t' ~ Load 4500010 10 ,P ~~ Q., 0
r .30 o 20 30 10 20 /0
O/slo/7ce rro/77 ~ in inches FIGURE lO.-Distribution of stress along lapped bars.
Length of splice 20-bar diameters. loin. bars. Stress value. are the product of the modulus of elasticity and observed strains.
198 Journal of Research of the National Bureau of Standards
'! 30
ZO
/0
o 20
10
o 50
40
30
20
/0
o 50
40
30
20
la o
i . Specimens A-30
" y oJ '" ... ... J("
W ~ - BO'; tVo. E! .rr i"o. ,.if' · i'o ... Load .30000 /b · ...
w "" lit!
0"" L::3> ~ -0-
SO'; tVo. /
,if ..., -vo;;; "o...~oad .30000 /b
: ,.., ,.., 'let
'" '"'l*-. r-.,.,.. .JiiI'" ~ '" ~
Symbol x ina'icqles 1'0) ~ 8ar ./Vo. t? slress ill confinuous V"' Loao' 55000 Ib bdrs J:/ I'Q.
cI · In I \
'" -..{t .&--'loc
U ""' X X u ~
1'0... ~: CY ~ 80'r Ab. / :/ ~"
Loaa' 55000 /b
)? : ~ ,;:5 $ \..I.,
30 20 10 o /0 20 30 O/sfance Trom ct in inches
FIGURE ll.-Distribution of stress along lapped bars.
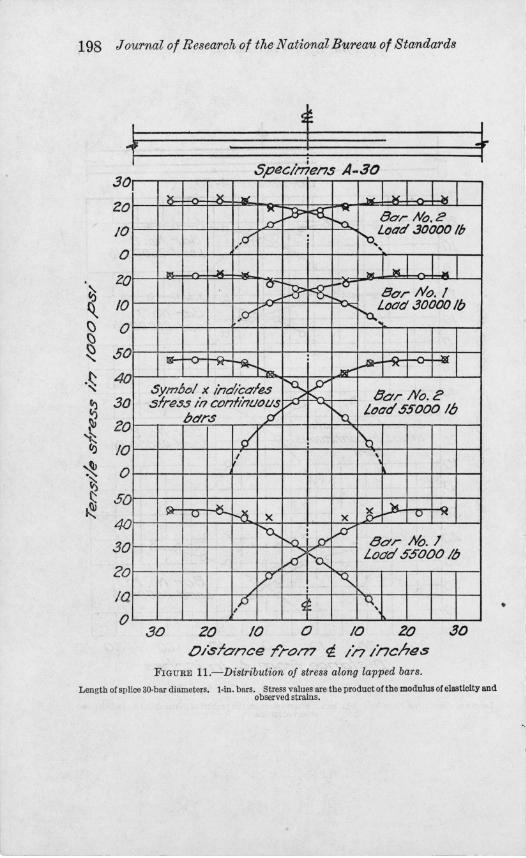
Length of splice 30-bar diameters. I-ln. bars. Stress values are the product oithe modulus of elasticity and observed strains.
•

Lapped Bar Splices in Ooncrete Beams 199
30 "" -"
1"1.. . _
20
10
0
.....
Bar No. c ..,tf" f-O'" -v v -0--~ LoClo' .30000 Ib
,If 10.,
~, ZO
~ 10
~ 0 ~ .sO " .~ 40
~ 30
~ 20 ~ ~ /0 ~ 0 ~ ~ 50 ~
40
30
20
10
0
n. J'I> J'\. ..C> ,.... I'--A. "" '" ----H- ~ ~
~ . Logo' 30000 Ib 8ar No. f .-if ..:o-r-o:-
,if I--'V · v....
1'0-.
sr 1--.0 ~ ..r.-~
t-. :
~ I--Q'"'" Symbol x li7o'icoie';o... t» J<g: ~ 80'rMJ.;:> ."re.1S in conlinv()(/;? ""'0... Logo' 5S01)0lb
belrs r(' t'n I " / · I\..,
I -.., I
n- .1"\. · ~ "- J'> ....
~ X X '"
~ r--o.., ~ k" Bar No. 1
,.if V
~ Load 55000 II;
~ · I~ /J S~ 'Q.,
30 ZO 10 0 10 20 .30 oistance rro/77 i. /n inches
FIGURE 12.-Distribution of stress along lapped bars.
Length of splice 40·bar diameters. loin. bars. Stress values are the product of the modulus of elasticity and observed strains.

200 Journal of R e8earoh of the National Bureau of Standard8
s. .t 'PeC/mel7s A-50 + 30 .
e... ..x Bar No.2 ~ j.....I!! ~
~ ~ l-tJ. ~ ..., v
,e!' : Load 30000 Ib 1'0., ,
Eo 10
0 x.. _ ... tJar M . ;t
)(. ...x .... -" v 20
-a- -0 ~
~
"ef'
........., -u;;::
~. : Load 30000 /b
100'r M:1.c LOdd 50000 /b
~ 10 ({ (.) 0
~ 50 0... ')! )C ~
'"" r-a-~ ~ ~ ~
: ~ ""'-
~ ~ ""'-I't>-.
,.." t--..... )/ Symbol x indttXlles slres:;-t\.
,u 1/7 conhi7t./ot/s Oars 0.., I
.
X I ~ ~
"'= t-o-~ Hs--+-o-~ ~ ~ ~~ 8arNo./
~ ~ "'Q... r-o... LUda' .50000 Ib
.r I--.....
V . ...,
I -v 1'0.., i ~(J ~ ~~
.~ 40
~ 30
~ 20
~ 10 ~ 0 ~ ~ 50 ~
40
30
20
/0
0 30 20 10 o 10 20 .30
FIGURE 13.-Distribution:of stres(along lapped bars.
Length of splice 50·bar diameters. l·in. bars. Stress values are the product of the modulus of elasticity and observed strains.

Lapped Bar Splice8 in Ooncrete Beams 201
over the entire splice. In the longer splices, however, the bond stress, after a similar decrease reached a low value within the middle third, then increased toward the end of the lap. In some instances, where the stresses at the loaded end were less than 30,000 psi, the bars within the middle third of the splice did not develop any bond stress. This was particularly evident in the 40-diameter splices and the 50-diameter splices of the No.2 bars. From the standpoint of efficiency, such a splice is longer than necessary.
The stress in the continuous bars at various points in the region of the splices is also indicated on the diagrams by a small cross. Except for splices 20-bar diameters in length, the effect of the lapped bars was to greatly decrease the stress in the continuous bars within the limits of the lap, in many instances very closely approaching the stress in the portion of the lapped bar from the center of the lap to its loaded end. In beams containing the 20-diameter splices, the stress in the continuous bars was, in general, fairly constant over the entire lap, the effective steel area of the lapped bars apparently being equivalent to a single bar at any section.
A detailed compa,rison between the stress distribution curves for each length of lap is shown in figure 14. The curves represent the stress distIibution for a load of 10,000 Ib on the beams containing the ~-in. bars and 45,000 lb for the beams containing the I-in. bars. These loads stressed the reinforcement beyond the splice to 45,000 and 37,000 psi, respectively. The slopes of the curves in the vicinity of the origin, which represents the free end of the bar, are almost identica.l for each set of curves, consequently the bond stress developed within the first few inches of bar embedment was practically alike, regardless of the length of splice for a given load and type of bar.
It is to be expected that some relationship exists between the bond stress at the free end of the lapped bar and the tensile stress in the bar at the other limit of the splice. Figure 15 indicates, within certain limits, a linear relationship which, for each type of bar, apparently is independent of the length of splice for laps of 30-bar diameters or more. Thus, the data for the 30-, 40-, and 50-diameter laps appear to group themselves about individual straight lines, one for the No.1 bar and one for the No.2 bar, between t~nsile stresses of 5,000 and 40,000 psi. The 20-diameter lap-splices also show a similar relationship, but the slopes of the lines are, in some instances, greater than those of the longer splices. Where they differ, the data for the 20-diameter lap are indicated by a broken line.
The distribution of tensile stresses along the lapped bars for a given load and for various lengths of lap is compared in greater detail for both types of bar in figures 16 and 17. In every instance, the No.2 bars picked up stresses more rapidly at their free ends than the No.1 bar, although the rate of increase of stress beyond an embedment of five-bar diameters was not significantly different. In a well-designed splice, the normal stress, that is, the stress the bar would normally carry if it were continuous, should be reached at the end of the splice. In figures 18 and 19, the observed stresses in the lapped bars at the end of the splice are plotted with respect to the load applied to the beams for each length of lap. Also shown by solid lines is the loadstress relationship that would obtain if the bars were continuous. This normal stress was assumed to be the same as the average stress

202 Journal of Research of the National Bureau of Standards
.so 40
30
20
10
o 40
.~
~ 30 I::) ~ ZO
" /0
/' V
./ 1/ o o
p /
---I=:..-.:~..j:. __ I- -- -I-- ---/ ---~ - ---- ------ -----
-~---------
/' ~~--' Bar No. 2- i-/~ LoO'd 117000;'
- -:.;::: - f- '-::-::
---: --- --- --' -----
----..-'. ~.:::::: ---- -----
k -~ --20ma: 10'# V ---.317.. " Bar No." i-tO.
---40 " " ' LOO'd /0000 Ib ----- 60 " N
5 /0 /5 20 25 Disfunce rrol77 fh:e end or bur Ii? /nches
I--": ,--- - +~_-f-1--- .- --- -_ ........
l.--":::---- .~.:- ---- ---- ---.......-:::;; ~~:. ~ .. = /- Bar /Vo. z.. ~-//7.
L ot7d 4.501717 Ib
-:-- r--- --~::=.- --- ---
~ -- --_.-
~ I-' ~~:. ---- ----- -::::::~
/0
o
40
30
20
/0 L~-':;:';' ~- {Jar No. " ~-/n.
Lood4500Q/b
/' o a 10 20 30 40 so
Oi.sfO'nce !'rom Tree end or bur in inches
FIGURE 14,-Distribution of stress along lapped bars for various lengths of splice.
Stress values are the product of the modulus of elasticity and observed strains.

Lapped Bar Splioes in Ooncrete Beams 203
Z~~--40·~~~-+----~--4----+--~
O~· __ ~ __ ~ __ ~ __ L-__ L-~ __ -J __________ ~
() /0 20 .30 40 50 TensIle sfress or /i'77/r or /0.0 /n /000 psi
IZ~ 801 No.2 /la'IIIo./
000 ill 20 d/d /dP I-- 15. ... 30" ,
¢ • 40" " :>
800 o • 50" ., /""
I. tyo; ~e ~--i 8orllo.Z / ~ v.
600 "" ~ r.;f"' .--
0'" ::r-k?::' • A/VI /;' ~ / 80rll0./
~P.Y v--d~ ~-r 2a?
",,/ 1-in. &:rrs
'$; v 0
o 10 20 30 40 50 Tens/1e s/ress d"./;mlr Or /O'p //7 /000 p.$/'
FIGURE i5.-Relation between bond stress at free end of bar and tensile stress at limit of lap.
Stress values are the product of the modulus of elasticity and observed strains.
663099-45-4

204 Journal of Research of the National Bureau of Standards
-o-BarNo.e
I -e- Bar No. ,
ic.ZO did. lap 0- _~ ...... .- ---
~ Y_....:-r r [.30 clio: lap
~ ",
.~~-- . - ....... -- . .....; -~ V
./ ~1-L----
~ ~ v"" 40o'la lap ~ ~--- -
h ./
~ bJ;:1--r If/ ~ .," (SOda: lap ~ p ---~--...... --1I/ ~ ~-
p: ","' LoO't7 10000/0
1I/ o S /0 IS 20
O/slol7ce Ii-om rree enol DT Ddr, /nch~.s FIGURE 16.-Distribution of stress along lapped bars compared for No.2 and No.1
%-in. bars.
Stress values are the product of the modulus of elasticity and observed strains.

Lapped Bar Spliaes in Ooncrete Beams 205
-0- Bo/' /Vo. 2 -e- /JO'r /Vo. ,
. f0o'lO: lap ~ _.-1=-¥. .~ v
/ ~ ..... ~~- 1--" f--¥' :~ ........
~ v~ ......... .,- .- -- .....
V ./ v .-~ 1-- .... 4O;:d./~ l-----
? Ir ..... --<rl~- .•
If" ~-l--"
\
tY"'"
/. v ......
/50olo./0p L.--- l-4 v ....
1/-- ... .-.--!-tz.::: ~ ..... - ~--'" _.-
~- -- Load 4500010 ./ ..... IF .... o /0 20 .30 40 .so
O/slance li-om rree end O/'Odr, Inches FIGURE 17.-Distribution of stress along lapped bars compared for No. 2 and No.1
1-in. bars.
Stress values are the product of the modulus of elasticity and observed strains.

206 Journal of R esearoh of the National Bureau of Standards
14
12
10
fj 1/ ) j f/ 17 If V
8
6
J j ~j ~J t; V tf. '/- ~'l tt'l 1/ 17
~ 4 ~ ~ 2
C) 0 ~
"
j J .J j
I I I 1/ /JO'r /Yo. I
II II II II J. • ~. z-In. '/0'.
/Yole: Solia'ilne ina'tCdles normO'/ slress
.~ 12
~ /0 1;5 '-I 8
6
4
8ar tVo.Z I • .J' z-tn. c//a
O~. __ ~ __ ~ __ ~ __ ~ __ ~ __ -L __ -L __________ ~
Tens/Ie slres~ zoooOpsi .. I. ..I FIGURE IS.-Load-stress relation for lapped bars at limits of the splice.
Beams of series A. ).i-in. bars. Stress values are the product of the modulus of elasticity and observed strains.

~
Lapped Bar Splices in Ooncrete Beams 207
~'r-------------~-'---r--~--~~--~ -0- 8171:$ spt:ICld Ij tA..
60 -i:r- N in confoef
30
flor No. 1 " J -In. O'/d. !
~ O~~--~~--~~--~~------~ /V()le: So/td' /the //701CO/t!'S ntJrn!t7/ $n;w-
.~ 60r----r---r--.---r-----r--r---.,---....--,6-,,-----.---.,..-,.---..,
~ ~
fJO'rNo. c /-/n.da:
O~ __ ~~ __ ~ __ -L __ ~ __ ~ __ ~ ________ ~
TBI7o$I"k s!r,-'$ ZOOOO ps/ · ~ 1 FIGURE 19.-Load-stress relation for lapped bars at limits of the splice.
Beams of series A. I-in . bars. Stress values are the product of the modulus of elasticity and observed strains.

208 Journal of Researoh of the National Bureau of Standards
observed in both the continuous and lapped bars well outside the limits of the splice. The deviation of the observed stress from the normal stress beyond a value of about 35,000 psi is evident for most of the beams reinforced with No. 1 bars. The exceptions are the 50-diameter lap and possibly the 40-diameter lap. On the other hand, with the exception of the 20-diameter lap, the observed stresses in the No. 2 bars are praetically identical with the normal Rtresses up to the yield point of the steel, which had a value of about 50,000 and 45,000 psi for the ~Hn. and I-in. bars, respectively.
It is evident that, if the stress in the lapped bar at the end of the splice is not equal to the normal stress, the adjacent continuous bars assume a greater proportion of the total tensile stress. Actually, this was not a serious matter in the beams that were tested with laps greater than 20 diameters; for even at the higher stresses the difference between the actual and normal stress was not more than 8 to 10 percent, probably half of which was assumed by the two continuous bars at that point. Consequently, the load which would normally stress the reinforcement, beyond the splice, to its yield point was not materially affected by the slight shifting of stress. This was not true, however, of the beams containing the 20-diameter lap splices, where the load at which yielding of the reinforcement occurred, as a rule was somewhat lower than for the other beams.
2. BOND STRENGTH
The load-stress curves for the gage line nearest the free ends of the lapped bars indicated that the tensile stress there reached a maximum value at approximately the same load in all of the specimens tested. Also, the maximum stresses at this point were reasonably alilre for a given type and size of bar regardless of the length of lap-splice. However, there was a marked difference in the values for the two types of bars. By the use of the maximum tensile stresses scaled from the curves, the bond strength developed by the lapped bars for an embedded length of about 3 in. was computed for each specimen and the bond stresses thus obtained are listed in table 4. The values are somewhat higher than would be expected from standard pull-out tests, but compare favorably with results from unpublished data of similar bars in beam tests.
TABLE 4.-Maximum bond stress developed at free end of lapped bars [Average stress for an embedment of approximately 3 in.]
~-in. bars 1-in. bars Specimen
No.2 No.1 No. 2 No. 1 --------------------------
A-50 _______________________ ___ ______ _ psi psi psi psi 850 745 880 755 A -40 ___ ____ ___ __ _____ ______ ______ __ ._ 970 840 960 655 A-30_. _______ __ _____ • ______ __ ____ ___ _ 880 810 1, 010 705 A-20 __ _________ • __________ __ ________ _ 800 745 1, 010 755
- --- - - - - - ---Average .. _. __ • __ • _______________ _ 895 785 965 720 ------- - - - - -• A-40x ________ ______ __ ________ ____ __
880 675 755 630 • A-30x __ __ ______ . __ __ __ _____ ___ ___ __ 920 675 1,010 755 • A- ZOx. ___________ __ __________ ____ __ 950 810 1, 000 760
- - - - --- -----Average .. __ _____________________ _ 917 720 922 715
• Lapped bars in contact with each other.

Lapped Bar Splioes in Oonorete Beams 209
3. COMPARISON BETWEEN METHODS OF LAPPING
The results of the two methods of lapping, one in which the lapped bars are spaced IH diameters clear and the other where they are in contact, are compared in figures 20 and 21. Here the stress distribution curves are shown for a given load and for each length of splice. There is practically no difference in the stress between the curves representing each type of lap at any point for the I-in. bars and little difference for the H-in. bars. These differences are probably no greater than would be obtained in duplicate tests. A further comparison is shown in figures 18 and 19, in which the load-stress curves for the lapped bars at the limits of the lap are shown for both types of splice.
zodta. .-- --<
......."..
./" ".....
/ 30~ ~
/ ./,~ p-l I V) 40dia. ~ ~ ~ -7' .... ~ ~-
T BorNo.2
/ W~ tOdd /0000 10
I'--0- Lapped bars spaced Ii did. -.-" .. in con/ocl
Z000:
......... n /
..... 800'/0-. ..,....-1 r-
/ " ~ / ~
V 400'/(;. -"""" --
/ V ~ lJo-r No.1
/ ~~. Lou'd 10000 Ib
~v ~ Lapped pars spaced lidto-. -.-" "kl conl'O'cl
o 10 15 20 25 Ol.slunce Tram Tree end or bO'r; i l7ches
FIGURE 20.-Distribution of stress along the lapped bars of two types of lap-8plices. ~·in. bars. Stress values are tho product of the modulus of elasticity and observed strains.

210 Journal of Researoh of the National Bureau of Standards
Here, again, the differences are small and in most instances negligible. It is also evident from table 4 that it made little difference in the bond strength in these tests whether the lapped bars were spaced l~ diameters apart or were in contact.
4. DISTRIBUTION OF SLIP ALONG LAPPED BARS
There were large differences in slip between certain specimens, and these differences were not always consistent. It is highly probable that wide variations in slip data, obtained in the manner described herein, would also be observed in duplicate tests. It should be noted that the slip at each point along the lapped bar was reckoned from a point directly opposite it on the adjacent continuous bar, and
ZOdtd. .-t-r
v v
.,.,., ~ .30tita _ n • • -"'I'
./ V ~. ......
/ / ~
40(/,0. ---- •
r/ ~ ---- "" 8ar No. C
/ ~ Locto' 4.5000 16
T ;' ~ L.oppeo' /;ors -sp«~d /folk
-e- tr tr if? conlO'cf
coddo
• --c-
........--- () ~
~ ~ ... <.1 -.
/' V
/ ~ .....
~ ~ ....
-~- • /V
4<Jo'/a: .-.-~ BarNo./
/ ~ ..-il LOdd 45000 /0
V V -0- Lapped beYrs .spa-ceo' ;j cfra
-e-" "/n con/dcl
o /0 2'0 .30 40 so O/-slonce f}-O/77 rree end or oar, inches
FIGURE 21.-Distribution of stress along Zapped bars of two types of Zap-splices. I-In. bars. Stress values are the product of the modulus of elasticity and observed strains.

Lapped Bar Splices in Ooncrete Beams 211
consequently does not necessarily indicate the relative movement of the bar with respect to the concrete.
Slip starts, quite naturally, at the free end of the bar, where the bond stress is always the greatest, and progresses along the bar as the tensile stresses increase at the loaded end. In ~his respect, the behavior of the bar differs from that in the usual pull-out or beam tests for bond. The distribution of the slip along the lapped bars for various lengths of splice is shown in figures 22 and 23. The data are plotted for two loads, one of which produced a tensile stress of approximately 18,000 psi and the other about 40,000 psi at the loaded ends of the lapped bars. Most of the evidence seems to indicate that the distribution and magnitude of the slip is independent of the length of the splice. There appears to be a serious departure from this principle with the No.1 bars at higher loads. The discrepancy is not readily accounted for except insofar as a part of the variation might be accident,al. Within the range of working stresses, however, the length of lap seems to have little or no effect upon the magnitude of the slip for that bar.
10
-0- ..... 20 dla lop '----fr- -4r- 30., • -<>- +40 ., "
6 -0- -e- 50 • ,.
~ / LoO'd 10000lb I I LOOo'~ 8qrNo.Z
N- ' . ~ . '2-117. lid.
~b o o
y -0
'" ----! '- -t-- I I
I'" 4 ~ 2 r--o
o
2 4 6 8 m Dlsfdoce Trom Tree end Or bO'r in inches
' ...... 5°OQ /0000 Ib Bar No.!
~ i-in. 0'/00
~ v ........ 1---
I'*- 4
t- __
~5~O~/b--~ ----~ 1'-_ f} I 1---
Z' 4 G {1 10 Oislance rran7 rree end or PO'/"" //7 /nGil?es
FIGURE 22.-Distribution of slip along lapped Yz-in. bars.

212 Journal of Research of the National Bureau of Standards
With one exception, there was little difference in slip between the No.1 and No.2 %-in. bars for a given tensile stress at the loaded ends of the lapped bars. The exception was the 20-diameter lapped No.1 bar, which showed a considerably greater slip than any of the other lapped bars of this size. The I-in. No.1 bars, however, exhibited a decidedly greater slip for a given load or end stress than the I-in. No.2 bars or either of the 7~-in. bars. The only explanation that can
10
8
-0- ~ 20 dlQ. lop -6- .30 II M
~+40 " • -0- ...... .50 II .
6
'B 4 .~ "-~ Z ~
~<::) 0
.~
~ /0
~
~ <9
"-~ joad 40000 II; /Jar No.2
/-//,7. did.
~Z5~ ~ ~ Ib ~
-""----l r--~ ~ r-- -() .5 /0 /$ i
I Olslcmce frO/77 rree end or ao-r ;/7 il7ches
~ I
'0
.~ 6 ~
~ ----?LoO'd 40000 /b
J/ I f3arNo./
4
2
I-In. 0';(7-
~ ;;;pd 25000 Ib ........... \
J--:b-o o 5 m $ m
Oi.s/once v-om free end 01' ba-r 10 /nches FIGURE 23.-Distribution of slip along Zapped 1-in. bars.
be offered for the dissimilar behavior of the two sizes of No. 1 bars is the possible effect of the lug height. Table 3 shows that the I-in No.1 bar had a much lower ratio of lug height to diameter of bar than the 7~-in. bar of the same make, whereas this ratio for the two sizes of No. 2 bars was almost alike.
The difference in the slip behavior of the two types and two sizes of bars is more clearly illustrated in figure 24 which shows the relation between slip at the free end of the lapped bar and the bond stress developed within the first few inches of the free end. In the range of bond stresses above 400 psi, the end slip of the %-in. No.2 bar is somewhat less than the I-in. bar of the same make and as previously

Lapped Bar Splices in Ooncrete Beams 213
noted the slip-of ' the'}~-in. No. 1 bar~is very:much less_than the 1-in. No. 1 bar for all bond stresses.
It is to be noted that slip is not directly proportional to the bond stress developed by the bar, but apparently is some exponential function of this stress, the expression for the relationship depending upon the type of bar.
//OOr-~--~--~--~--~---------------r--~ cO dlcx /qo 30 • • 40 If "
/0001---+----+---+----;'1----1 -.50" •
o~--~--~--~--~--~--~--~--~--~--~
I .. 0.0: in. ~I s/Jp
FIGURE 24.-Relation between slip at fre e end of bar and bond stress near free end.
V. TEST RESULTS OF SERIES B
1. GENERAL MANNER OF FAILURE
As stated in section II, 2, the tests of series B were planned to determine the average maximum bond stress developed by the lapped bars for various lengths of lap. Although the specimens contained high-yield-strength reinforcement, many of the beams failed in tension. All the 30- and 40-diameter lap splices developed the yield strength of tbe bar beyond the ends of the lap, and all the 10-diameter splices failed in bond. On the other hand, about half of the 20-bar-diameter splices failed in tension and the remainder failed in bond. Many of the bond failures were not well-defined because, in some instances,

214 Journal of Research of the National Bureau of Standards
there was a gradual shifting of stress from the lapped bar to the continuous bars as the bond strength was reached. Some of the bond failures, however, were very evident from an examination of the load-stress curves of the lapped bars outside the limits of the splice. The strain in the bar at that point reached a maximum, as shown in figures 25 and 26, and either remained at that value or decreased with an increase in load. The breakdown of bond was also
14
t 12 ~-tf
~I J I ~f
JI / V } ~, ) .. i
/0
,#1 S2 If/ ~/ ~"YI- f(P I f-~- 'J. <Q 1/,
f ,7
8
6
j J / Bar #0.1
II II II I I • d' e-1n. /eT.
II II II
I
4
z
o Tens/Ie STress 20000 PSI-' ~~ 1 ... < --rl.1
6
edrNo.2 I' ... /"
Z-1/7. Ulo'. 4r--~-+---~-a~---4--~~--+--rl·~
Ten.!Jl/e sfress 20000 psi-j~*I.--..,.j1 FIGURE 25.-Load-stress relation for lapped bars outside limits of splice.
Beams of series B. ~-in. bars. Stress values are the product of the modulus of elasticity and observed strains.
Lapped Bar Splices in Ooncrete Beams 215
reflected, to some extent, by a change in the slope of the load-strain curves for the continuous bars at this section of the beam.
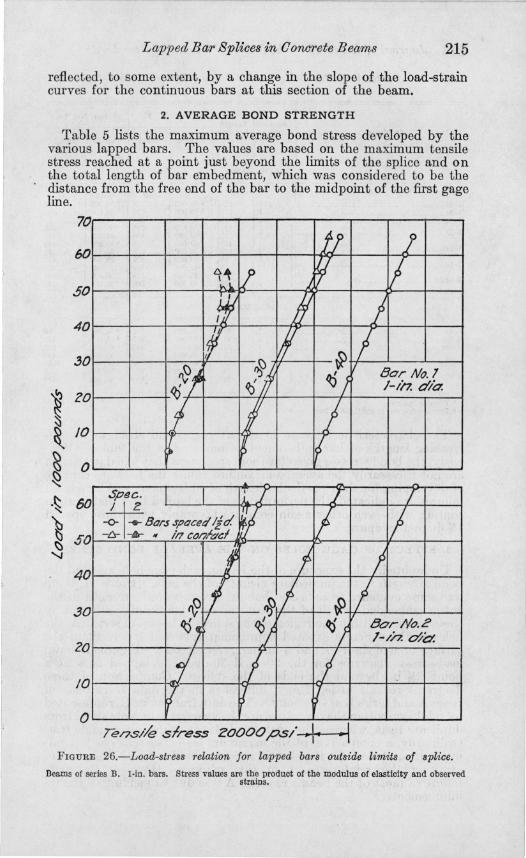
2. AVERAGE BOND STRENGTH
Table 5 lists the maximum average bond stress developed by the various lapped bars. The values are based on the maximum tensile stress reached at a point just beyond the limits of the splice and on the total length of bar embedment, which was considered to be the distance from the free end of the bar to the midpoint of the first gage line.
70
60
50
40
30
~ 20
t 10
§ 0
" ~
fj' 1 ltt J J.V( I If d j ii
~ f ~
! . ~; tQJ Bar No.1
~ ~ I-in. ma:
I I j ~ Il I
.~ 60 " ~ 50 ~ 'J
40
.30
20
/0
m II J J I -0- ....... Bars spacea' Ijd fI f II -fr- --Itr " in conI-del
f I I t& f Jyl ~ I ~i
/ ~ ~ BarNo./? ') ') J-/fl. dd.
_7 I j V ~ ~
0 Te/7s//e slress ZOOOO psi .1. .~
FIGURE 26.-Load-stress relation for lapped bars outside limits of splice.
Beams of series B. l·in. bars. Stress values are the product of the modulus of elasticity and observed strains.

216 Journal of Research of the National Bureau of Standards
TABLE 5.-Average bond stresses developed by lapped bars just before failure [Tests of series BJ
Bar No.2 Bar No. I Specl- Length men of embed-Specimen
number ment Tensile I
B-40 _____________________________________ _ B-30 ___ _____________________ ___ __________ _ B-30x ___ ________ ___ ___ ___________________ _ B-20 ____________________ ___ _______________ {
B-20x ____ _________________________ __ __ ____ {
B-IO ___ _________ _______ ____________ _______ {
B-IOx- __ -- - - -- -- -- - -- --- - -- - -- -- I - - - - - - - - {
B-40 ___________ __ ___________________ _____ _ B-30 _________ _______ ____ ____ ___________ __ _
B-30x. __ ---- -- -- -- --- -- - r - - - - - -- - - - - -- ----B-20 ____________________________________ __ {
B-20x ___ ______ __ __________ ___ ____ _________ {
• Tension failures. b Tension failures In continuous bar.
stress
).i-IN. BARS
in. psi I 22~ ·60,000 I 17~ ·60,000 I 17~ • 60.000 I 12~ ·60,000 2 12~ ·60, 000 I 12~ • 60, 000 2 12~ ·60,000 I 7~ 39,000 2 7~ 45, 000 I 7~ 45, 000 2 7~ 40,500
I-IN. BARS
I I I I 2 I 2
43 a 60,000 33 a 60, 000 33 ·60, 000 23 a 60, 000 23 43,500 23 43,500 23 45,000
Bond Tensile I stress stress
psi psi 325 852,000 420 ·55,000 420 --·55;000-580 580 43,500 580 47,000 580 43,500 625 28,500 720 28,500 720 36,800 650 30,600
350 • 53, 000 455 ·53,000 455 b 49, 000 655 45,000 475 30,000 475 30,000 490 33,800
Bond stress
psi 300 385
---- ---- - -535 425 460 425 455 455 590 490
310 405 370 490 330 330 370
The characteristic increase in the average bond strength for decreasing lengths of bar embedment is indicated in the table. Obviously, the bond stresses given for those specimens that failed in tension are not necessarily the average maximum values the bars are capable of developing for their particular length of embedment. Where bond failures are indicated, the performance of the lapped bars that were in contact with each other again compare favorably with those spaced 1}~ diameters apart.
3. EFFECT OF GAGE HOLES ON THE AVERAGE BOND STRESS
Undoubtedly the exposure of the bar at each gage hole affected the bond strength in the immediate vicinity of the hole. However, there was some evidence to indicate that the average bond strength of the entire embedded length of the bar was not significantly affected by these holes. Within the region of the splices in beams of series A, the holes in the concrete exposed approximately 4 and 7 percent of the surface area of the I-in. and }6-in. bars, respectively. Figure 27 shows load-stress diagrams for the 20- and 30-diameter lapped bars at a point 2}~ in. beyond the ends of the splices. Comparison of these diagrams reveals little, if any, difference in the data from tests of series A and series B at this point. The data from series B, represented by solid symbols in the diagrams, are the average values obtained from duplicate tests, whereas the open symbols represent but a single test. Ordinarily, a comparison of the maximum loads between corresponding beams, at least for the shorter splices, would indicate the effect of exposing the reinforcement in this manner. However, ultimate failure of most of the beams in series A was due to yielding of the reinforcement.

Lapped Bar Splices in Ooncrete Beams 217
30
t .~ ~m~-r-1q-~~~~~.~--~~~ ~ ~ O~--~~~--~~L-__ L-~L-__ L-~~~ __ ~
.~ '" ~ ~~~---r~+-~~~--~~+---~~--~
~ /Or--r-~~-r-~~--~~~~~~~~-~
8
61---·~
O~ __ L-__ ~ __ ~ __ ~ __ ~ __ ~ ____ L-__ L-__ ~~
Tens/Ie sfress 20000 pst" .\- 1 FIGURE 27.-Comparison between load-stress diagrams of series A and!series B.
Stress outside limits of splice. Stress values are the product of the modulus of elasticity and observed strains.
VI. DISCUSSION OF RESULTS
1. GENERAL DISCUSSION
It is recognized that much of the data presented are based on single tests, from which sound conclusions may not always be drawn. It is significant, however, that, except where observations of bar slip were concerned, the data were consistent from specimen to specimen. For example, comparisons of bond stress and its manner of distribu-

218 Journal of R esearoh of the National Bureau of Standards
tion were made between the two types of splices and, although each comparison was based on a single test, the six different specimens exhibited consistently similar charact eristics. Differences in the behavior of the two types of bars were likewise consistent.
Curves showing the distribution of stress along the lapped bals should, to some extent, be considered as qualitative. They indicate the general manner of stress distribution for each length of splice. A verage values from two or more tests would perhaps differ from those shown.
It should be noted also that the splices that were t ested were single bar splices flanked by two continuous bars. Different r esults might have been obtained had the specimens contained multiple lap splices without the accompanying continuous bars. Previous unpublished tests of beams constructed of H aydite concrete and containing only multiple splices indicated that a greater cover than normally provided around the outermost bars of the beam was necessarJ if they were to assume their share of the total stress. Lapping of all bars at a section of a flexural m ember is, of course, not to be recommended in practice. The presence of continuous bars prevents thesudden and violent failure that may occur when all bars are lapped.
VII. SUMMARY OF TEST RESULTS
The following briefly summarizes the results of the tests: 1. The bars lapped 3D-bar diameters or more developed, at the
limits of the splice, the yield strength of the steel, a value which in some instances was as milch as 60,000 psi.
2. There was little difference observed in the behavior of splices containing bars spaced IX-bar diameters clear or with the lapped bars in contact. It should be noted that, as far as bond resistance is concerned, the bars used in these tests contained a type of lug pattern probably superior to many commercial bars.
3. Bond stress was greatest near the free end of the lapped bar. The maximum values occurred at a,pproximately the same tensile stress at the loaded end of the bar, r egardless of the length of h.p. A possible exception to this was the 20-bar-diameter splice.
4. With two exceptions, the magnitude and distribution of the slip along the lapped bars was similar for a given type and size of bar, regardless of the length of lap.
5. The general behavior of the X-in. bars was similar to the I-in. bars, insofa,r as bond and tensile stresses were concerned. Differences in bar slip are noted in item 8.
6. There was some evidence to indicate that the gage holes in the concrete of the beams did not seriously affect the strength of the splice.
7. The No.2 bar which had a considerably greater bearing area of the lug per inch length of bar, not only picked up stress at its free end in the splice more rapidly but developed greater maximum bond strenghts than the No.1 bar.
8. The I-in.-diameter No.1 bar exhibited a considerably greater slip for a given bond stress than any of the other bars. The differences between the two types of bar of the }~-in. size were minor. Both showed slightly less end slip than the I-in. No.2 bar for a given bond stress at the free end of the bar.
WASHINGTON, March 21, 1945.