Fingerprint Vendor Technology Evaluation - Nvlpubs.nist.gov
233
NISTIR 8034 Fingerprint Vendor Technology Evaluation Craig Watson Gregory Fiumara Elham Tabassi Su Lan Cheng Patricia Flanagan Wayne Salamon http://dx.doi.org/10.6028/NIST.IR.8034
-
Upload
khangminh22 -
Category
Documents
-
view
3 -
download
0
Transcript of Fingerprint Vendor Technology Evaluation - Nvlpubs.nist.gov

NISTIR 8034
Fingerprint Vendor Technology EvaluationCraig Watson
Gregory FiumaraElham TabassiSu Lan Cheng
Patricia FlanaganWayne Salamon
http://dx.doi.org/10.6028/NIST.IR.8034

NISTIR 8034
Fingerprint Vendor Technology EvaluationCraig Watson
Gregory FiumaraElham TabassiSu Lan Cheng
Patricia FlanaganWayne Salamon
Information Access DivisionInformation Technology Laboratory
This publication is available free of charge from:http://dx.doi.org/10.6028/NIST.IR.8034
December 2014
U.S. Department of CommercePenny Pritzker, Secretary
National Institute of Standards and TechnologyWillie May, Acting Under Secretary of Commerce for Standards and Technology and Acting Director

Fingerprint Vendor Technology EvaluationEvaluation of Fingerprint Matching Algorithms
NIST Interagency Report 8034
Craig Watson • Gregory Fiumara • Elham Tabassi
Su Lan Cheng • Patricia Flanagan •Wayne Salamon
18 December 2014

iv FPVTE – FINGERPRINT MATCHING
Acknowledgements. Sponsors: The authors would like to thank the sponsors of this project: the Department of Homeland
Security (DHS) and the Federal Bureau of Investigation (FBI).
. Data Providers: The authors would like to thank all the organizations that have shared biometric datawith NIST for this and other evaluations. This data has proven invaluable for benchmarking and ad-vancement of biometric matching technologies through these evaluations. Data used in FpVTE camefrom the FBI, DHS, Los Angeles County Sheriff’s Department (LACNTY), Arizona Department of PublicSafety (AZDPS), and Texas Department of Public Safety (TXDPS).
. Participants: The authors would also like to thank the participants for their time and contribution tothis evaluation. We know that preparing the software for the evaluation is not a trivial task and thevalidation process can be stressful when problems occur. Thank you for your time and participation asthis evaluation would not be possible without it.
DisclaimerCertain commercial equipment, instruments, or materials are identified in this paper in order to specify theexperimental procedure adequately. Such identification is not intended to imply recommendation or endorse-ment by the National Institute of Standards and Technology, nor is it intended to imply that the materials orequipment identified are necessarily the best available for the purpose.
C = afis team D = 3M Cogent E = Neurotechnology F = Papillon G = Dermalog H = Hisign Bio-Info InstituteI = NEC J = Sonda K = Tiger IT L = Innovatrics M = SPEX O = ID SolutionsP = id3 Q = Morpho S = Decatur Industries T = BIO-key U = Aware V = AA Technology

FPVTE – FINGERPRINT MATCHING v
Contents
Acknowledgements iv
Disclaimer iv
Executive Summary xiii
Caveats xv
Release Notes xvi
1 Introduction 1
2 History and Motivation 3
2.1 NIST Biometric Evaluations . . . . . . . . . . . . . . . . . . . . . . . . . . . . . . . . . . . . . . . . . . . . . . . . . . . . . 3
2.2 Purpose . . . . . . . . . . . . . . . . . . . . . . . . . . . . . . . . . . . . . . . . . . . . . . . . . . . . . . . . . . . . . . . . . 3
3 Data 5
3.1 Classes of Participation . . . . . . . . . . . . . . . . . . . . . . . . . . . . . . . . . . . . . . . . . . . . . . . . . . . . . . . . 5
3.2 Datasets . . . . . . . . . . . . . . . . . . . . . . . . . . . . . . . . . . . . . . . . . . . . . . . . . . . . . . . . . . . . . . . . . 6
3.3 Evaluation Scenarios . . . . . . . . . . . . . . . . . . . . . . . . . . . . . . . . . . . . . . . . . . . . . . . . . . . . . . . . . 7
3.4 “Size” of the Test . . . . . . . . . . . . . . . . . . . . . . . . . . . . . . . . . . . . . . . . . . . . . . . . . . . . . . . . . . . . 9
4 Experiment and Test Protocol 10
4.1 API Overview . . . . . . . . . . . . . . . . . . . . . . . . . . . . . . . . . . . . . . . . . . . . . . . . . . . . . . . . . . . . . 10
4.1.1 Feature Extraction . . . . . . . . . . . . . . . . . . . . . . . . . . . . . . . . . . . . . . . . . . . . . . . . . . . . . . . 10
4.1.2 Finalization . . . . . . . . . . . . . . . . . . . . . . . . . . . . . . . . . . . . . . . . . . . . . . . . . . . . . . . . . . 10
4.1.3 Identification . . . . . . . . . . . . . . . . . . . . . . . . . . . . . . . . . . . . . . . . . . . . . . . . . . . . . . . . . . 10
4.2 Test Constraints . . . . . . . . . . . . . . . . . . . . . . . . . . . . . . . . . . . . . . . . . . . . . . . . . . . . . . . . . . . . 11
4.3 Biometric Evaluation Framework . . . . . . . . . . . . . . . . . . . . . . . . . . . . . . . . . . . . . . . . . . . . . . . . . . 11
4.4 Validation . . . . . . . . . . . . . . . . . . . . . . . . . . . . . . . . . . . . . . . . . . . . . . . . . . . . . . . . . . . . . . . . 12
4.5 Pre-Evaluation . . . . . . . . . . . . . . . . . . . . . . . . . . . . . . . . . . . . . . . . . . . . . . . . . . . . . . . . . . . . . 12
4.6 Receiving Submissions . . . . . . . . . . . . . . . . . . . . . . . . . . . . . . . . . . . . . . . . . . . . . . . . . . . . . . . . 13
5 Two-Stage Matching 16
5.1 Enrollment Set Partitioning . . . . . . . . . . . . . . . . . . . . . . . . . . . . . . . . . . . . . . . . . . . . . . . . . . . . . . 16
5.2 Identification — Stage One . . . . . . . . . . . . . . . . . . . . . . . . . . . . . . . . . . . . . . . . . . . . . . . . . . . . . . 16
5.3 Identification — Stage Two . . . . . . . . . . . . . . . . . . . . . . . . . . . . . . . . . . . . . . . . . . . . . . . . . . . . . . 16
6 Metrics 18
6.1 Accuracy . . . . . . . . . . . . . . . . . . . . . . . . . . . . . . . . . . . . . . . . . . . . . . . . . . . . . . . . . . . . . . . . 18
6.2 DET Plots . . . . . . . . . . . . . . . . . . . . . . . . . . . . . . . . . . . . . . . . . . . . . . . . . . . . . . . . . . . . . . . . 19
6.3 Failure to Extract or Match a Template . . . . . . . . . . . . . . . . . . . . . . . . . . . . . . . . . . . . . . . . . . . . . . . 19
6.4 Computational Efficiency . . . . . . . . . . . . . . . . . . . . . . . . . . . . . . . . . . . . . . . . . . . . . . . . . . . . . . . 20
6.5 Ground Truth Errors . . . . . . . . . . . . . . . . . . . . . . . . . . . . . . . . . . . . . . . . . . . . . . . . . . . . . . . . . . 20
C = afis team D = 3M Cogent E = Neurotechnology F = Papillon G = Dermalog H = Hisign Bio-Info InstituteI = NEC J = Sonda K = Tiger IT L = Innovatrics M = SPEX O = ID SolutionsP = id3 Q = Morpho S = Decatur Industries T = BIO-key U = Aware V = AA Technology

vi FPVTE – FINGERPRINT MATCHING
7 Accuracy Results 22
7.1 Class A . . . . . . . . . . . . . . . . . . . . . . . . . . . . . . . . . . . . . . . . . . . . . . . . . . . . . . . . . . . . . . . . . 23
7.1.1 Single-Index Finger Identification . . . . . . . . . . . . . . . . . . . . . . . . . . . . . . . . . . . . . . . . . . . . . . 23
7.1.2 Two-Index Finger Identification . . . . . . . . . . . . . . . . . . . . . . . . . . . . . . . . . . . . . . . . . . . . . . . 27
7.2 Class B . . . . . . . . . . . . . . . . . . . . . . . . . . . . . . . . . . . . . . . . . . . . . . . . . . . . . . . . . . . . . . . . . 31
7.3 Class C . . . . . . . . . . . . . . . . . . . . . . . . . . . . . . . . . . . . . . . . . . . . . . . . . . . . . . . . . . . . . . . . . 36
8 Accuracy/Search Time Tradeoff 41
8.1 Class A . . . . . . . . . . . . . . . . . . . . . . . . . . . . . . . . . . . . . . . . . . . . . . . . . . . . . . . . . . . . . . . . . 42
8.2 Class B . . . . . . . . . . . . . . . . . . . . . . . . . . . . . . . . . . . . . . . . . . . . . . . . . . . . . . . . . . . . . . . . . 51
8.3 Class C . . . . . . . . . . . . . . . . . . . . . . . . . . . . . . . . . . . . . . . . . . . . . . . . . . . . . . . . . . . . . . . . . 57
9 Accuracy Computational Resources Tradeoff 61
9.1 Storage and Memory . . . . . . . . . . . . . . . . . . . . . . . . . . . . . . . . . . . . . . . . . . . . . . . . . . . . . . . . . 61
9.1.1 Class A . . . . . . . . . . . . . . . . . . . . . . . . . . . . . . . . . . . . . . . . . . . . . . . . . . . . . . . . . . . . . 61
9.1.2 Class B . . . . . . . . . . . . . . . . . . . . . . . . . . . . . . . . . . . . . . . . . . . . . . . . . . . . . . . . . . . . . 66
9.1.3 Class C . . . . . . . . . . . . . . . . . . . . . . . . . . . . . . . . . . . . . . . . . . . . . . . . . . . . . . . . . . . . . 69
9.2 Processing Time . . . . . . . . . . . . . . . . . . . . . . . . . . . . . . . . . . . . . . . . . . . . . . . . . . . . . . . . . . . . 74
10 Ranked Results 78
11 How Many Fingers are Needed 82
12 FpVTE 2003 Comparison 83
13 Lessons Learned for Large-Scale Testing 86
14 Way Forward 88
14.1 Related Testing . . . . . . . . . . . . . . . . . . . . . . . . . . . . . . . . . . . . . . . . . . . . . . . . . . . . . . . . . . . . . 88
14.1.1 Forensic Palmprint . . . . . . . . . . . . . . . . . . . . . . . . . . . . . . . . . . . . . . . . . . . . . . . . . . . . . . 88
14.1.2 Mobile Data . . . . . . . . . . . . . . . . . . . . . . . . . . . . . . . . . . . . . . . . . . . . . . . . . . . . . . . . . . 88
14.1.3 Cross-Comparison of Modalities . . . . . . . . . . . . . . . . . . . . . . . . . . . . . . . . . . . . . . . . . . . . . . . 88
References 89
A Individual Participant FNIR Plots 90
B Combined Class DETs and CMCs 109
C Accuracy Time Tradeoff Detailed Tables with Median Values 114
D Accuracy Time Tradeoff Detailed Tables with Mean Values 128
E Progression for Last Two Submissions 142
F Enrollment Size 153
G Search Template Sizes 160
C = afis team D = 3M Cogent E = Neurotechnology F = Papillon G = Dermalog H = Hisign Bio-Info InstituteI = NEC J = Sonda K = Tiger IT L = Innovatrics M = SPEX O = ID SolutionsP = id3 Q = Morpho S = Decatur Industries T = BIO-key U = Aware V = AA Technology

FPVTE – FINGERPRINT MATCHING vii
G.1 Mean Values . . . . . . . . . . . . . . . . . . . . . . . . . . . . . . . . . . . . . . . . . . . . . . . . . . . . . . . . . . . . . . 160
G.2 Median Values . . . . . . . . . . . . . . . . . . . . . . . . . . . . . . . . . . . . . . . . . . . . . . . . . . . . . . . . . . . . . 164
H Template Creation Times 168
I Ranked Results 178
J Relative Combined Results 188
K Relative Accuracy and Number of Fingers 198
K.1 Class A . . . . . . . . . . . . . . . . . . . . . . . . . . . . . . . . . . . . . . . . . . . . . . . . . . . . . . . . . . . . . . . . . 199
K.2 Class B . . . . . . . . . . . . . . . . . . . . . . . . . . . . . . . . . . . . . . . . . . . . . . . . . . . . . . . . . . . . . . . . . 201
K.3 Class C . . . . . . . . . . . . . . . . . . . . . . . . . . . . . . . . . . . . . . . . . . . . . . . . . . . . . . . . . . . . . . . . . 203
K.4 All Classes . . . . . . . . . . . . . . . . . . . . . . . . . . . . . . . . . . . . . . . . . . . . . . . . . . . . . . . . . . . . . . . 205
L Combined Sorted Rankings for a Theoretical Use Case 207
List of Figures
1 NIST Biometric Evaluations . . . . . . . . . . . . . . . . . . . . . . . . . . . . . . . . . . . . . . . . . . . . . . . . . . . . . 3
2 Example of Single-Finger Captures . . . . . . . . . . . . . . . . . . . . . . . . . . . . . . . . . . . . . . . . . . . . . . . . . 5
3 Example of an Identification Flat . . . . . . . . . . . . . . . . . . . . . . . . . . . . . . . . . . . . . . . . . . . . . . . . . . . 5
4 Examples of Live-Scan and Rescanned Ink . . . . . . . . . . . . . . . . . . . . . . . . . . . . . . . . . . . . . . . . . . . . . 5
5 NFIQ Distribution . . . . . . . . . . . . . . . . . . . . . . . . . . . . . . . . . . . . . . . . . . . . . . . . . . . . . . . . . . . 7
6 Number of Submissions Received . . . . . . . . . . . . . . . . . . . . . . . . . . . . . . . . . . . . . . . . . . . . . . . . . . 13
7 Evaluation Workflow . . . . . . . . . . . . . . . . . . . . . . . . . . . . . . . . . . . . . . . . . . . . . . . . . . . . . . . . . 15
9 Example of a Flipped Single-Index Finger Image . . . . . . . . . . . . . . . . . . . . . . . . . . . . . . . . . . . . . . . . . . 20
8 Example of a DET showing a Spike in FPIR . . . . . . . . . . . . . . . . . . . . . . . . . . . . . . . . . . . . . . . . . . . . . 20
10 Example of a Flipped Left Slap Image . . . . . . . . . . . . . . . . . . . . . . . . . . . . . . . . . . . . . . . . . . . . . . . . 21
11 Example of a Flipped Right Slap Image . . . . . . . . . . . . . . . . . . . . . . . . . . . . . . . . . . . . . . . . . . . . . . . 21
12 Rank-sorted FNIR for Class A — Single Index Finger . . . . . . . . . . . . . . . . . . . . . . . . . . . . . . . . . . . . . . . 23
13 DET for Class A — Single Index Finger . . . . . . . . . . . . . . . . . . . . . . . . . . . . . . . . . . . . . . . . . . . . . . . 24
14 CMC for Class A — Single Index Finger . . . . . . . . . . . . . . . . . . . . . . . . . . . . . . . . . . . . . . . . . . . . . . 25
15 Rank-sorted FNIR for Class A — Two Index Fingers . . . . . . . . . . . . . . . . . . . . . . . . . . . . . . . . . . . . . . . . 27
16 DET for Class A — Two Index Fingers . . . . . . . . . . . . . . . . . . . . . . . . . . . . . . . . . . . . . . . . . . . . . . . 28
17 CMC for Class A — Two Index Fingers . . . . . . . . . . . . . . . . . . . . . . . . . . . . . . . . . . . . . . . . . . . . . . . 29
18 Rank-sorted FNIR for Class B . . . . . . . . . . . . . . . . . . . . . . . . . . . . . . . . . . . . . . . . . . . . . . . . . . . . 31
19 DET for Class B . . . . . . . . . . . . . . . . . . . . . . . . . . . . . . . . . . . . . . . . . . . . . . . . . . . . . . . . . . . . 32
20 CMC for Class B . . . . . . . . . . . . . . . . . . . . . . . . . . . . . . . . . . . . . . . . . . . . . . . . . . . . . . . . . . . . 33
21 Rank-sorted FNIR for Class C . . . . . . . . . . . . . . . . . . . . . . . . . . . . . . . . . . . . . . . . . . . . . . . . . . . . 36
22 DET for Class C . . . . . . . . . . . . . . . . . . . . . . . . . . . . . . . . . . . . . . . . . . . . . . . . . . . . . . . . . . . . 37
23 CMC for Class C . . . . . . . . . . . . . . . . . . . . . . . . . . . . . . . . . . . . . . . . . . . . . . . . . . . . . . . . . . . . 38
24 FNIR and Search Time Scatter Plot — Class A — Left Index — Less Than 20-Second Searches . . . . . . . . . . . . . . . . 43
C = afis team D = 3M Cogent E = Neurotechnology F = Papillon G = Dermalog H = Hisign Bio-Info InstituteI = NEC J = Sonda K = Tiger IT L = Innovatrics M = SPEX O = ID SolutionsP = id3 Q = Morpho S = Decatur Industries T = BIO-key U = Aware V = AA Technology

viii FPVTE – FINGERPRINT MATCHING
25 FNIR and Search Time Scatter Plot — Class A — Left Index — Greater Than or Equal To 20-Second Searches . . . . . . . 43
26 FNIR and Search Time Scatter Plot — Class A — Right Index — Less Than 20-Second Searches . . . . . . . . . . . . . . . 44
27 FNIR and Search Time Scatter Plot — Class A — Right Index — Greater Than or Equal To 20-Second Searches . . . . . . 44
28 FNIR and Search Time Scatter Plot — Class A — Left and Right Index — Less Than 20-Second Searches . . . . . . . . . . 45
29 FNIR and Search Time Scatter Plot — Class A — Left and Right Index — Greater Than or Equal To 20-Second Searches . 45
30 Submission Round Progression — Class A — Left Index — Less Than 20-Second Searches . . . . . . . . . . . . . . . . . . 46
31 Submission Round Progression — Class A — Left Index — Greater Than or Equal To 20-Second Searches . . . . . . . . . 46
32 Submission Round Progression — Class A — Right Index — Less Than 20-Second Searches . . . . . . . . . . . . . . . . . 47
33 Submission Round Progression — Class A — Right Index — Greater Than or Equal To 20-Second Searches . . . . . . . . 47
34 Submission Round Progression — Class A — Left and Right Index — Less Than 20-Second Searches . . . . . . . . . . . . 48
35 Submission Round Progression — Class A — Left and Right Index — Greater Than or Equal To 20-Second Searches . . . 48
36 FNIR and Search Time Scatter Plot — Class B — Left Slap . . . . . . . . . . . . . . . . . . . . . . . . . . . . . . . . . . . . 52
37 FNIR and Search Time Scatter Plot — Class B — Right Slap . . . . . . . . . . . . . . . . . . . . . . . . . . . . . . . . . . . 52
38 FNIR and Search Time Scatter Plot — Class B — Left and Right Slap . . . . . . . . . . . . . . . . . . . . . . . . . . . . . . 53
39 FNIR and Search Time Scatter Plot — Class B — Identification Flats . . . . . . . . . . . . . . . . . . . . . . . . . . . . . . . 53
40 Submission Round Progression — Class B — Left Slap . . . . . . . . . . . . . . . . . . . . . . . . . . . . . . . . . . . . . . 54
41 Submission Round Progression — Class B — Right Slap . . . . . . . . . . . . . . . . . . . . . . . . . . . . . . . . . . . . . 54
42 Submission Round Progression — Class B — Left and Right Slap . . . . . . . . . . . . . . . . . . . . . . . . . . . . . . . . 55
43 Submission Round Progression — Class B — IDFlat . . . . . . . . . . . . . . . . . . . . . . . . . . . . . . . . . . . . . . . . 55
44 FNIR and Search Time Scatter Plot — Class C . . . . . . . . . . . . . . . . . . . . . . . . . . . . . . . . . . . . . . . . . . . 58
45 Submission Round Progression — Class C . . . . . . . . . . . . . . . . . . . . . . . . . . . . . . . . . . . . . . . . . . . . . 59
46 FNIR and RAM Used for Enrollment Set Tradeoff Scatter Plot for Class A — Left Index . . . . . . . . . . . . . . . . . . . 62
47 FNIR and RAM Used for Enrollment Set Tradeoff Scatter Plot for Class A — Right Index . . . . . . . . . . . . . . . . . . . 62
48 FNIR and Search Template Size in RAM Tradeoff Scatter Plot for Class A — Left Index . . . . . . . . . . . . . . . . . . . . 63
49 FNIR and Search Template Size in RAM Tradeoff Scatter Plot for Class A — Right Index . . . . . . . . . . . . . . . . . . . 63
50 FNIR and RAM Used for Enrollment Set Scatter Plot for Class A — Left and Right Index . . . . . . . . . . . . . . . . . . . 64
51 FNIR and Search Template Size in RAM Tradeoff Scatter Plot for Class A — Left and Right Index . . . . . . . . . . . . . . 64
52 Enrollment Size in RAM Compared to On Disk for Class A — Left and Right Index . . . . . . . . . . . . . . . . . . . . . . 65
53 Enrollment Size and Search Template Size in RAM Compared to On Disk for Class A — Left and Right Index . . . . . . . 65
54 FNIR and RAM Used for Enrollment Set for Class B — Identification Flats . . . . . . . . . . . . . . . . . . . . . . . . . . . 67
55 FNIR and Search Template Size in RAM Tradeoff Scatter Plot for Class B — Identification Flats . . . . . . . . . . . . . . . 67
56 Enrollment Size in RAM Compared to On Disk for Class B — Identification Flats . . . . . . . . . . . . . . . . . . . . . . . 68
57 Search Template Size in RAM Compared to On Disk for Class B — Identification Flats . . . . . . . . . . . . . . . . . . . . 68
58 FNIR and RAM Used for Enrollment Set Tradeoff Scatter Plot for Class C — Ten-Finger Plain-to-Plain . . . . . . . . . . . 70
59 FNIR and RAM Used for Enrollment Set Tradeoff Scatter Plot for Class C — Ten-Finger Rolled-to-Rolled . . . . . . . . . 70
60 FNIR and Search Template Size in RAM Tradeoff Scatter Plot for Class C — Ten-Finger Plain-to-Plain . . . . . . . . . . . 71
61 FNIR and Search Template Size in RAM Tradeoff Scatter Plot for Class C — Ten-Finger Rolled-to-Rolled . . . . . . . . . . 71
62 Enrollment Size and Search Template Size in RAM Compared to On Disk for Class C — Plain Impression . . . . . . . . . 72
63 Enrollment Size and Search Template Size in RAM Compared to On Disk for Class C — Plain Impression . . . . . . . . . 72
64 Enrollment Size and Search Template Size in RAM Compared to On Disk for Class C — Rolled Impression . . . . . . . . 73
65 Enrollment Size and Search Template Size in RAM Compared to On Disk for Class C — Rolled Impression . . . . . . . . 73
C = afis team D = 3M Cogent E = Neurotechnology F = Papillon G = Dermalog H = Hisign Bio-Info InstituteI = NEC J = Sonda K = Tiger IT L = Innovatrics M = SPEX O = ID SolutionsP = id3 Q = Morpho S = Decatur Industries T = BIO-key U = Aware V = AA Technology

FPVTE – FINGERPRINT MATCHING ix
66 FNIR and Template Creation Time Tradeoff Scatter Plot for Class A — Left Index . . . . . . . . . . . . . . . . . . . . . . . 75
67 FNIR and Template Creation Time Tradeoff Scatter Plot for Class A — Right Index . . . . . . . . . . . . . . . . . . . . . . 75
68 FNIR and Template Creation Time Tradeoff Scatter Plot for Class A — Left and Right Index . . . . . . . . . . . . . . . . . 76
69 FNIR and Template Creation Time Tradeoff Scatter Plot for Class B — Identification Flats . . . . . . . . . . . . . . . . . . 76
70 FNIR and Template Creation Time Tradeoff Scatter Plot for Class C — Ten-Finger Plain-to-Plain . . . . . . . . . . . . . . 77
71 FNIR and Template Creation Time Tradeoff Scatter Plot for Class C — Ten-Finger Rolled-to-Rolled . . . . . . . . . . . . . 77
72 Rank-sorted FNIR for All Classes . . . . . . . . . . . . . . . . . . . . . . . . . . . . . . . . . . . . . . . . . . . . . . . . . . 82
73 FpVTE 2003 SST Results . . . . . . . . . . . . . . . . . . . . . . . . . . . . . . . . . . . . . . . . . . . . . . . . . . . . . . . . 83
74 FpVTE 2003 MST Results . . . . . . . . . . . . . . . . . . . . . . . . . . . . . . . . . . . . . . . . . . . . . . . . . . . . . . . 84
75 FpVTE 2003 LST Results . . . . . . . . . . . . . . . . . . . . . . . . . . . . . . . . . . . . . . . . . . . . . . . . . . . . . . . 84
76 FpVTE 2003 LST Number of Fingers Results . . . . . . . . . . . . . . . . . . . . . . . . . . . . . . . . . . . . . . . . . . . . 85
77 DET for Participant C . . . . . . . . . . . . . . . . . . . . . . . . . . . . . . . . . . . . . . . . . . . . . . . . . . . . . . . . . 91
78 DET for Participant D . . . . . . . . . . . . . . . . . . . . . . . . . . . . . . . . . . . . . . . . . . . . . . . . . . . . . . . . . 92
79 DET for Participant E . . . . . . . . . . . . . . . . . . . . . . . . . . . . . . . . . . . . . . . . . . . . . . . . . . . . . . . . . 93
80 DET for Participant F . . . . . . . . . . . . . . . . . . . . . . . . . . . . . . . . . . . . . . . . . . . . . . . . . . . . . . . . . 94
81 DET for Participant G . . . . . . . . . . . . . . . . . . . . . . . . . . . . . . . . . . . . . . . . . . . . . . . . . . . . . . . . . 95
82 DET for Participant H . . . . . . . . . . . . . . . . . . . . . . . . . . . . . . . . . . . . . . . . . . . . . . . . . . . . . . . . . 96
83 DET for Participant I . . . . . . . . . . . . . . . . . . . . . . . . . . . . . . . . . . . . . . . . . . . . . . . . . . . . . . . . . 97
84 DET for Participant J . . . . . . . . . . . . . . . . . . . . . . . . . . . . . . . . . . . . . . . . . . . . . . . . . . . . . . . . . 98
85 DET for Participant K . . . . . . . . . . . . . . . . . . . . . . . . . . . . . . . . . . . . . . . . . . . . . . . . . . . . . . . . . 99
86 DET for Participant L . . . . . . . . . . . . . . . . . . . . . . . . . . . . . . . . . . . . . . . . . . . . . . . . . . . . . . . . . 100
87 DET for Participant M . . . . . . . . . . . . . . . . . . . . . . . . . . . . . . . . . . . . . . . . . . . . . . . . . . . . . . . . . 101
88 DET for Participant O . . . . . . . . . . . . . . . . . . . . . . . . . . . . . . . . . . . . . . . . . . . . . . . . . . . . . . . . . 102
89 DET for Participant P . . . . . . . . . . . . . . . . . . . . . . . . . . . . . . . . . . . . . . . . . . . . . . . . . . . . . . . . . 103
90 DET for Participant Q . . . . . . . . . . . . . . . . . . . . . . . . . . . . . . . . . . . . . . . . . . . . . . . . . . . . . . . . . 104
91 DET for Participant S . . . . . . . . . . . . . . . . . . . . . . . . . . . . . . . . . . . . . . . . . . . . . . . . . . . . . . . . . 105
92 DET for Participant T . . . . . . . . . . . . . . . . . . . . . . . . . . . . . . . . . . . . . . . . . . . . . . . . . . . . . . . . . 106
93 DET for Participant U . . . . . . . . . . . . . . . . . . . . . . . . . . . . . . . . . . . . . . . . . . . . . . . . . . . . . . . . . 107
94 DET for Participant V . . . . . . . . . . . . . . . . . . . . . . . . . . . . . . . . . . . . . . . . . . . . . . . . . . . . . . . . . 108
95 DET for All Participants in All Classes — First Submissions . . . . . . . . . . . . . . . . . . . . . . . . . . . . . . . . . . . 110
96 DET for All Participants in All Classes — Second Submissions . . . . . . . . . . . . . . . . . . . . . . . . . . . . . . . . . . 111
97 CMC for All Participants in All Classes — First Submissions . . . . . . . . . . . . . . . . . . . . . . . . . . . . . . . . . . . 112
98 CMC for All Participants in All Classes — Second Submissions . . . . . . . . . . . . . . . . . . . . . . . . . . . . . . . . . 113
99 Relative Combined Results — Left Index — Class A . . . . . . . . . . . . . . . . . . . . . . . . . . . . . . . . . . . . . . . . 189
100 Relative Combined Results — Right Index — Class A . . . . . . . . . . . . . . . . . . . . . . . . . . . . . . . . . . . . . . . 190
101 Relative Combined Results — Left and Right Index — Class A . . . . . . . . . . . . . . . . . . . . . . . . . . . . . . . . . . 191
102 Relative Combined Results — Left Slap — Class B . . . . . . . . . . . . . . . . . . . . . . . . . . . . . . . . . . . . . . . . . 192
103 Relative Combined Results — Right Slap — Class B . . . . . . . . . . . . . . . . . . . . . . . . . . . . . . . . . . . . . . . . 193
104 Relative Combined Results — Left and Right Slap — Class B . . . . . . . . . . . . . . . . . . . . . . . . . . . . . . . . . . . 194
105 Relative Combined Results — Identification Flats — Class B . . . . . . . . . . . . . . . . . . . . . . . . . . . . . . . . . . . 195
106 Relative Combined Results — Ten-Finger Plain-to-Plain — Class C . . . . . . . . . . . . . . . . . . . . . . . . . . . . . . . 196
C = afis team D = 3M Cogent E = Neurotechnology F = Papillon G = Dermalog H = Hisign Bio-Info InstituteI = NEC J = Sonda K = Tiger IT L = Innovatrics M = SPEX O = ID SolutionsP = id3 Q = Morpho S = Decatur Industries T = BIO-key U = Aware V = AA Technology

x FPVTE – FINGERPRINT MATCHING
107 Relative Combined Results — Ten-Finger Rolled-to-Rolled — Class C . . . . . . . . . . . . . . . . . . . . . . . . . . . . . 197
108 Relative Accuracy — Class A . . . . . . . . . . . . . . . . . . . . . . . . . . . . . . . . . . . . . . . . . . . . . . . . . . . . . 200
109 Relative Accuracy — Class B . . . . . . . . . . . . . . . . . . . . . . . . . . . . . . . . . . . . . . . . . . . . . . . . . . . . . 202
110 Relative Accuracy — Class C . . . . . . . . . . . . . . . . . . . . . . . . . . . . . . . . . . . . . . . . . . . . . . . . . . . . . 204
111 Relative Accuracy — All Classes (Select Fingers) . . . . . . . . . . . . . . . . . . . . . . . . . . . . . . . . . . . . . . . . . . 206
List of Tables
1 List of Participants . . . . . . . . . . . . . . . . . . . . . . . . . . . . . . . . . . . . . . . . . . . . . . . . . . . . . . . . . . . 2
2 Data Sources . . . . . . . . . . . . . . . . . . . . . . . . . . . . . . . . . . . . . . . . . . . . . . . . . . . . . . . . . . . . . . 6
3 Evaluation Scenarios . . . . . . . . . . . . . . . . . . . . . . . . . . . . . . . . . . . . . . . . . . . . . . . . . . . . . . . . . 7
4 Search and Enrollment Datasets . . . . . . . . . . . . . . . . . . . . . . . . . . . . . . . . . . . . . . . . . . . . . . . . . . . 8
5 Number of Comparisons . . . . . . . . . . . . . . . . . . . . . . . . . . . . . . . . . . . . . . . . . . . . . . . . . . . . . . . 9
6 Finger Position Swapping . . . . . . . . . . . . . . . . . . . . . . . . . . . . . . . . . . . . . . . . . . . . . . . . . . . . . . . 20
7 FNIR @ FPIR = 10−3 — Class A — Left Index . . . . . . . . . . . . . . . . . . . . . . . . . . . . . . . . . . . . . . . . . . . 26
8 FNIR @ FPIR = 10−3 — Class A — Right Index . . . . . . . . . . . . . . . . . . . . . . . . . . . . . . . . . . . . . . . . . . 26
9 FNIR @ FPIR = 10−3 — Class A — Left and Right Index . . . . . . . . . . . . . . . . . . . . . . . . . . . . . . . . . . . . . 30
10 FNIR @ FPIR = 10−3 — Class B — Left Slap . . . . . . . . . . . . . . . . . . . . . . . . . . . . . . . . . . . . . . . . . . . . 34
11 FNIR @ FPIR = 10−3 — Class B — Right Slap . . . . . . . . . . . . . . . . . . . . . . . . . . . . . . . . . . . . . . . . . . . 34
12 FNIR @ FPIR = 10−3 — Class B — Left and Right Slap . . . . . . . . . . . . . . . . . . . . . . . . . . . . . . . . . . . . . . 35
13 FNIR @ FPIR = 10−3 — Class B — Identification Flats . . . . . . . . . . . . . . . . . . . . . . . . . . . . . . . . . . . . . . 35
14 FNIR @ FPIR = 10−3 — Class C — Ten-Finger Plain-to-Plain . . . . . . . . . . . . . . . . . . . . . . . . . . . . . . . . . . . 39
15 FNIR @ FPIR = 10−3 — Class C — Ten-Finger Rolled-to-Rolled . . . . . . . . . . . . . . . . . . . . . . . . . . . . . . . . . 39
16 FNIR @ FPIR = 10−3 — Class C — Ten-Finger Plain-to-Rolled . . . . . . . . . . . . . . . . . . . . . . . . . . . . . . . . . . 40
17 Median Identification Times for Class A . . . . . . . . . . . . . . . . . . . . . . . . . . . . . . . . . . . . . . . . . . . . . . 49
18 Median Identification Times for Class A . . . . . . . . . . . . . . . . . . . . . . . . . . . . . . . . . . . . . . . . . . . . . . 50
19 Median Identification Times for Class B . . . . . . . . . . . . . . . . . . . . . . . . . . . . . . . . . . . . . . . . . . . . . . . 56
20 Median Identification Times for Class C . . . . . . . . . . . . . . . . . . . . . . . . . . . . . . . . . . . . . . . . . . . . . . . 60
21 Ranked Results for Class A — Left and Right Index . . . . . . . . . . . . . . . . . . . . . . . . . . . . . . . . . . . . . . . . 79
22 Ranked Results for Class B — Identification Flats . . . . . . . . . . . . . . . . . . . . . . . . . . . . . . . . . . . . . . . . . 80
23 Ranked Results for Class C — Ten-Finger Rolled-to-Rolled . . . . . . . . . . . . . . . . . . . . . . . . . . . . . . . . . . . . 81
24 Median Identification Time Results for Class A — Left Index — Less Than 20-Second Searches . . . . . . . . . . . . . . . 115
25 Median Identification Time Results for Class A — Left Index — Greater Than or Equal To 20-Second Searches . . . . . . 116
26 Median Identification Time Results for Class A — Right Index — Less Than 20-Second Searches . . . . . . . . . . . . . . 117
27 Median Identification Time Results for Class A — Right Index — Greater Than or Equal To 20-Second Searches . . . . . . 118
28 Median Identification Time Results for Class A — Left and Right Index — Less Than 20-Second Searches . . . . . . . . . 119
29 Median Identification Time Results for Class A — Left and Right Index — Greater Than or Equal To 20-Second Searches 120
30 Median Identification Time Results for Class B — Left Slap . . . . . . . . . . . . . . . . . . . . . . . . . . . . . . . . . . . . 121
31 Median Identification Time Results for Class B — Right Slap . . . . . . . . . . . . . . . . . . . . . . . . . . . . . . . . . . . 122
32 Median Identification Time Results for Class B — Left and Right Slap . . . . . . . . . . . . . . . . . . . . . . . . . . . . . . 123
33 Median Identification Time Results for Class B — Identification Flats . . . . . . . . . . . . . . . . . . . . . . . . . . . . . . 124
C = afis team D = 3M Cogent E = Neurotechnology F = Papillon G = Dermalog H = Hisign Bio-Info InstituteI = NEC J = Sonda K = Tiger IT L = Innovatrics M = SPEX O = ID SolutionsP = id3 Q = Morpho S = Decatur Industries T = BIO-key U = Aware V = AA Technology

FPVTE – FINGERPRINT MATCHING xi
34 Median Identification Time Results for Class C — Ten-Finger Plain-to-Plain . . . . . . . . . . . . . . . . . . . . . . . . . . 125
35 Median Identification Time Results for Class C — Ten-Finger Rolled-to-Rolled . . . . . . . . . . . . . . . . . . . . . . . . 126
36 Median Identification Time Results for Class C — Ten-Finger Plain-to-Rolled . . . . . . . . . . . . . . . . . . . . . . . . . 127
37 Mean Identification Time Results for Class A — Left Index — Less Than 20-Second Searches . . . . . . . . . . . . . . . . 129
38 Mean Identification Time Results for Class A — Left Index — Greater Than or Equal To 20-Second Searches . . . . . . . . 130
39 Mean Identification Time Results for Class A — Right Index — Less Than 20-Second Searches . . . . . . . . . . . . . . . 131
40 Mean Identification Time Results for Class A — Right Index — Greater Than or Equal To 20-Second Searches . . . . . . . 132
41 Mean Identification Time Results for Class A — Left and Right Index — Less Than 20-Second Searches . . . . . . . . . . 133
42 Mean Identification Time Results for Class A — Left and Right Index — Greater Than or Equal To 20-Second Searches . . 134
43 Mean Identification Time Results for Class B — Left Slap . . . . . . . . . . . . . . . . . . . . . . . . . . . . . . . . . . . . . 135
44 Mean Identification Time Results for Class B — Right Slap . . . . . . . . . . . . . . . . . . . . . . . . . . . . . . . . . . . . 136
45 Mean Identification Time Results for Class B — Left and Right Slap . . . . . . . . . . . . . . . . . . . . . . . . . . . . . . . 137
46 Mean Identification Time Results for Class B — Identification Flats . . . . . . . . . . . . . . . . . . . . . . . . . . . . . . . 138
47 Mean Identification Time Results for Class C — Ten-Finger Plain-to-Plain . . . . . . . . . . . . . . . . . . . . . . . . . . . 139
48 Mean Identification Time Results for Class C — Ten-Finger Rolled-to-Rolled . . . . . . . . . . . . . . . . . . . . . . . . . . 140
49 Mean Identification Time Results for Class C — Ten-Finger Plain-to-Rolled . . . . . . . . . . . . . . . . . . . . . . . . . . 141
50 Progression of Identification Timing and Accuracy for Class A — Left Index . . . . . . . . . . . . . . . . . . . . . . . . . . 143
51 Progression of Identification Timing and Accuracy for Class A — Right Index . . . . . . . . . . . . . . . . . . . . . . . . . 144
52 Progression of Identification Timing and Accuracy for Class A — Left and Right Index . . . . . . . . . . . . . . . . . . . . 145
53 Progression of Identification Timing and Accuracy for Class B — Left Slap . . . . . . . . . . . . . . . . . . . . . . . . . . . 146
54 Progression of Identification Timing and Accuracy for Class B — Right Slap . . . . . . . . . . . . . . . . . . . . . . . . . . 147
55 Progression of Identification Timing and Accuracy for Class B — Left and Right Slap . . . . . . . . . . . . . . . . . . . . . 148
56 Progression of Identification Timing and Accuracy for Class B — Identification Flats . . . . . . . . . . . . . . . . . . . . . 149
57 Progression of Identification Timing and Accuracy for Class C — Ten-Finger Plain-to-Plain . . . . . . . . . . . . . . . . . 150
58 Progression of Identification Timing and Accuracy for Class C — Ten-Finger Rolled-to-Rolled . . . . . . . . . . . . . . . . 151
59 Progression of Identification Timing and Accuracy for Class C — Ten-Finger Plain-to-Rolled . . . . . . . . . . . . . . . . 152
60 Storage and RAM Requirements for Class A — Left Index . . . . . . . . . . . . . . . . . . . . . . . . . . . . . . . . . . . . 154
61 Storage and RAM Requirements for Class A — Right Index . . . . . . . . . . . . . . . . . . . . . . . . . . . . . . . . . . . 155
62 Storage and RAM Requirements for Class A — Left and Right Index . . . . . . . . . . . . . . . . . . . . . . . . . . . . . . 156
63 Storage and RAM Requirements for Class B — Identification Flats . . . . . . . . . . . . . . . . . . . . . . . . . . . . . . . 157
64 Storage and RAM Requirements for Class C — Ten-Finger Plain-to-Plain . . . . . . . . . . . . . . . . . . . . . . . . . . . . 158
65 Storage and RAM Requirements for Class C — Ten-Finger Rolled-to-Rolled . . . . . . . . . . . . . . . . . . . . . . . . . . 159
66 Mean Search Template Sizes for Class A . . . . . . . . . . . . . . . . . . . . . . . . . . . . . . . . . . . . . . . . . . . . . . 161
67 Mean Search Template Sizes for Class B . . . . . . . . . . . . . . . . . . . . . . . . . . . . . . . . . . . . . . . . . . . . . . . 162
68 Mean Search Template Sizes for Class C . . . . . . . . . . . . . . . . . . . . . . . . . . . . . . . . . . . . . . . . . . . . . . . 163
69 Median Search Template Sizes for Class A . . . . . . . . . . . . . . . . . . . . . . . . . . . . . . . . . . . . . . . . . . . . . 165
70 Median Search Template Sizes for Class B . . . . . . . . . . . . . . . . . . . . . . . . . . . . . . . . . . . . . . . . . . . . . . 166
71 Median Search Template Sizes for Class C . . . . . . . . . . . . . . . . . . . . . . . . . . . . . . . . . . . . . . . . . . . . . 167
72 Enrollment Time Results for Class A — Left Index . . . . . . . . . . . . . . . . . . . . . . . . . . . . . . . . . . . . . . . . . 169
73 Enrollment Time Results for Class A — Right Index . . . . . . . . . . . . . . . . . . . . . . . . . . . . . . . . . . . . . . . . 170
74 Enrollment Time Results for Class A — Left and Right Index . . . . . . . . . . . . . . . . . . . . . . . . . . . . . . . . . . . 171
C = afis team D = 3M Cogent E = Neurotechnology F = Papillon G = Dermalog H = Hisign Bio-Info InstituteI = NEC J = Sonda K = Tiger IT L = Innovatrics M = SPEX O = ID SolutionsP = id3 Q = Morpho S = Decatur Industries T = BIO-key U = Aware V = AA Technology

xii FPVTE – FINGERPRINT MATCHING
75 Enrollment Time Results for Class B — Left Slap . . . . . . . . . . . . . . . . . . . . . . . . . . . . . . . . . . . . . . . . . . 172
76 Enrollment Time Results for Class B — Right Slap . . . . . . . . . . . . . . . . . . . . . . . . . . . . . . . . . . . . . . . . . 173
77 Enrollment Time Results for Class B — Left and Right Slap . . . . . . . . . . . . . . . . . . . . . . . . . . . . . . . . . . . . 174
78 Enrollment Time Results for Class B — Identification Flats . . . . . . . . . . . . . . . . . . . . . . . . . . . . . . . . . . . . 175
79 Enrollment Time Results for Class C — Ten-Finger Plain-to-Plain . . . . . . . . . . . . . . . . . . . . . . . . . . . . . . . . 176
80 Enrollment Time Results for Class C — Ten-Finger Rolled-to-Rolled . . . . . . . . . . . . . . . . . . . . . . . . . . . . . . . 177
81 Ranked Results for Class A — Left Index . . . . . . . . . . . . . . . . . . . . . . . . . . . . . . . . . . . . . . . . . . . . . . 179
82 Ranked Results for Class A — Right Index . . . . . . . . . . . . . . . . . . . . . . . . . . . . . . . . . . . . . . . . . . . . . 180
83 Ranked Results for Class A — Left and Right Index . . . . . . . . . . . . . . . . . . . . . . . . . . . . . . . . . . . . . . . . 181
84 Ranked Results for Class B — Left Slap . . . . . . . . . . . . . . . . . . . . . . . . . . . . . . . . . . . . . . . . . . . . . . . 182
85 Ranked Results for Class B — Right Slap . . . . . . . . . . . . . . . . . . . . . . . . . . . . . . . . . . . . . . . . . . . . . . 183
86 Ranked Results for Class B — Left and Right Slap . . . . . . . . . . . . . . . . . . . . . . . . . . . . . . . . . . . . . . . . . 184
87 Ranked Results for Class B — Identification Flats . . . . . . . . . . . . . . . . . . . . . . . . . . . . . . . . . . . . . . . . . 185
88 Ranked Results for Class C — Ten-Finger Plain-to-Plain . . . . . . . . . . . . . . . . . . . . . . . . . . . . . . . . . . . . . 186
89 Ranked Results for Class C — Ten-Finger Rolled-to-Rolled . . . . . . . . . . . . . . . . . . . . . . . . . . . . . . . . . . . . 187
90 Operational Ranking for Class A — Left Index . . . . . . . . . . . . . . . . . . . . . . . . . . . . . . . . . . . . . . . . . . . 209
91 Operational Ranking for Class A — Right Index . . . . . . . . . . . . . . . . . . . . . . . . . . . . . . . . . . . . . . . . . . 210
92 Operational Ranking for Class A — Left and Right Index . . . . . . . . . . . . . . . . . . . . . . . . . . . . . . . . . . . . . 211
93 Operational Ranking for Class B — Left Slap . . . . . . . . . . . . . . . . . . . . . . . . . . . . . . . . . . . . . . . . . . . . 212
94 Operational Ranking for Class B — Right Slap . . . . . . . . . . . . . . . . . . . . . . . . . . . . . . . . . . . . . . . . . . . 213
95 Operational Ranking for Class B — Left and Right Slap . . . . . . . . . . . . . . . . . . . . . . . . . . . . . . . . . . . . . . 214
96 Operational Ranking for Class B — Identification Flats . . . . . . . . . . . . . . . . . . . . . . . . . . . . . . . . . . . . . . 215
97 Operational Ranking for Class C — Ten-Finger Plain-to-Plain . . . . . . . . . . . . . . . . . . . . . . . . . . . . . . . . . . 216
98 Operational Ranking for Class C — Ten-Finger Rolled-to-Rolled . . . . . . . . . . . . . . . . . . . . . . . . . . . . . . . . . 217
C = afis team D = 3M Cogent E = Neurotechnology F = Papillon G = Dermalog H = Hisign Bio-Info InstituteI = NEC J = Sonda K = Tiger IT L = Innovatrics M = SPEX O = ID SolutionsP = id3 Q = Morpho S = Decatur Industries T = BIO-key U = Aware V = AA Technology

FPVTE – FINGERPRINT MATCHING xiii
Executive SummaryFpVTE was conducted primarily to assess the current capabilities of fingerprint matching algorithms using operationaldatasets containing several million subjects. There were three classes of participation that examined one-to-many identi-fication using various finger combinations from single finger up to ten fingers. Class A used single-index finger capturedata and evaluated single index finger (right or left) and two index finger (right and left) identification. Class B usedidentification flat (IDFlat) captures (4-4-2; left slap, right slap, and two thumbs simultaneously) and evaluated ten-finger,eight-finger (right and left slap), and four-finger (right or left slap) identification. Class C used rolled and plain impression(4-4-1-1; left slap, right slap, left thumb, and right thumb) captures and evaluated ten-finger rolled-to-rolled, ten-fingerplain-to-plain, and ten-finger plain-to-rolled identification. Enrollment sets used for one-to-many identification varied insize from 5 000 up to 5 000 000 enrolled subjects. Any segmentation of four-finger slap images or two-thumb captures wasperformed by the submitted software. All data used was sequestered operational data that was not shared with any of theparticipants.
The evaluation allowed each participant to make two submissions per class (A, B, and C) of participation over threerounds. After each of the first two rounds of submissions, feedback was provided to the participants and they wereallowed to evaluate their performance, make adjustments to their submissions, and resubmit for the next round. Theresults of the third and final round of submissions are reported in this document.
The evaluation was conducted at the National Institute of Standards and Technology (NIST) using commodity NIST-owned hardware. Participant submissions were compliant to the testing Application Programming Interface (API), whichwere linked to a NIST-developed test driver and run by NIST employees. All submissions went through validation testingto ensure that results generated on NIST’s hardware matched results participants generated on their own hardware.
This was the first large-scale one-to-many fingerprint evaluation since FpVTE 2003. In 2003, participants brought theirown hardware to NIST to process the evaluation data. The datasets in 2003 had approximately 25 000 subjects and re-quired millions of single subject-to-subject matches. The current FpVTE used a testing model closer to real one-to-manyidentification systems by allowing the submitted software to control how it does the one-to-many search and return acandidate list of potential matches. The number of subjects used was also significantly higher, as the current FpVTE had≈ 10 million subjects in the testing datasets.
The results in this report are based on 30 000 (10 000 mates and 20 000 nonmates) search subjects. There will be an addi-tional report with results (lower errors rates) using 350 000 (50 000 mates and 300 000 nonmates) search subjects.
In addition to measuring current performance capabilities of one-to-many identification algorithms, FpVTE was conductedto:
. study open-set identification versus enrolled sample sizes extending into the multiple millions;
. provide a testing framework and API for enrollment sizes that must be spread across the memory of multiple com-pute nodes;
. evaluate on operational datasets containing newer data from live-scan ten-finger “identification flat” capture sys-tems, other live-scan capture devices (e.g., single-finger and multi-finger), and historically significant scanned inkedfingerprints;
. analyze one-to-many identification accuracy, speed, template size, number of fingers, enrollment set sizes, and com-putational resources;
. create a fingerprint testing data repository with a vast majority of data errors corrected.
FpVTE was not intended to:
. measure performance of an operational Automated Fingerprint Identification System (AFIS);
. evaluate scanners or acquisition devices;
. evaluate latent fingerprint or mobile-captured data.
C = afis team D = 3M Cogent E = Neurotechnology F = Papillon G = Dermalog H = Hisign Bio-Info InstituteI = NEC J = Sonda K = Tiger IT L = Innovatrics M = SPEX O = ID SolutionsP = id3 Q = Morpho S = Decatur Industries T = BIO-key U = Aware V = AA Technology

xiv FPVTE – FINGERPRINT MATCHING
Key results from FpVTE were:
. Fingerprint Identification Accuracy: The most accurate fingerprint identification submissions achieved false nega-tive identification rates (FNIR, or “miss rates”) of 1.9% for single index fingers, 0.27% for two index fingers, 0.45%for four-finger identification flats (IDFlats), 0.15% for eight-finger IDFlats, 0.09% for ten-finger IDFlats, 0.1% for ten-finger rolled-to-rolled, 0.13% for ten-finger plain-to-plain, and 0.11% for ten-finger plain-to-rolled. These numbersare reported at a false positive identification rate (FPIR) of 10−3. 30 000 search subjects were used for these results(10 000 mates and 20 000 nonmates). The number of enrolled subjects used for single index fingers was 100 000, 1.6million for two index fingers, 3 million for IDFlats, and 5 million for ten finger plains and rolled. A larger search set(50 000 mates and 300 000 nonmates) is being completed so that an even smaller FPIR can be reported. Those results,when available, will be included in an additional report. Section 7.
. Accuracy versus Speed: The fastest submissions were not the most accurate. The most accurate submissions showedthe ability to decrease search times with minimal loss in accuracy. The format of this evaluation may not have fullyexplored the lower limit of search speed with minimal loss in accuracy. Section 8 and Appendix E.
. Number of Fingers: Not surprisingly, using more fingers improved accuracy. In fact, the most accurate results wereachieved with ten fingers, searching against the largest enrollment sets of 3 and 5 million subjects. An interestingresult that needs further study and analysis is that two-index finger accuracy was better than four-finger IDFlats.Based on some analysis of missed mates, it appears image quality may have played some roll in this result. Section 11.
. Computation Resources: The most accurate submissions were able to achieve their results with similar RandomAccess Memory (RAM) usage to other submissions. These same accurate submissions typically took longer to enroll(i.e., extract features) the fingerprint images used in the evaluation. Section 9.
. Candidate Lists: For most top performers, a majority of the time, the mate appeared within the top three candidatesof the candidate list or did not appear at all. Section 7.
. Ranked Results: Results that group FNIR, enrollment time, search time, and RAM usage all in a single table areshown in Section 10 and Appendix I. The tables are rank-sorted on FNIR, but include ranks in all the other categoriesfor cross-category comparison.
. Number of Subjects in Enrollment Set: Results for different enrollment set population sizes will not be availableuntil the larger search sets are complete, but the initial results across classes of participation showed that eight- andten-finger accuracy was superior versus larger enrollment sets. In fact, the most accurate identification results werealways achieved with the ten-finger search sets. Section 7.
. Data Type: There were three classes of participation in which data from single fingers, IDFlats, and “legacy” ten-finger rolled and plain impression data types were evaluated. Results of IDFlats and ten-finger rolled and plainshowed little variation in the accuracy of the top-performing submissions. This means the best performers couldtune their submissions to accurately match all the data types evaluated. Section 10.
. Accuracy Gap: The “gap” between the most accurate submissions and the “next tier” appears to be much closerthan in FpVTE 2003. Sections 10 and 12.
C = afis team D = 3M Cogent E = Neurotechnology F = Papillon G = Dermalog H = Hisign Bio-Info InstituteI = NEC J = Sonda K = Tiger IT L = Innovatrics M = SPEX O = ID SolutionsP = id3 Q = Morpho S = Decatur Industries T = BIO-key U = Aware V = AA Technology

FPVTE – FINGERPRINT MATCHING xv
Caveats
1. Specific nature of the biometric data: The absolute error rates quoted here were measured over a very large fixedcorpus of operational fingerprint images. The error rates measured here are realistic if the submissions are appliedto this kind of data. However, in other applications, the applicability of the results may differ due to a number offactors legitimately not reflected in the FpVTE experimental design. Among these are:
. how much slap fingerprint segmentation errors contribute to core matching accuracy;
. algorithmic limitations caused by the FpVTE API;
. unknown bugs in the submission;
. image quality from using a different data source.
2. Not an Automated Fingerprint Identification System (AFIS) test: While this evaluation is intended to measure thecore capabilities of matching algorithms in a large one-to-many scenario, it is not intended to be a full assessment ofan operational AFIS.
3. Timing of the submissions: While every attempt was made to perform timing on the exact same hardware with theexact same conditions, it is possible that certain functions of the operating system could have had an unintendednegative effect on timing results. The timing operations reported for each submission submitted were performed inthe exact same manner. Generous “cutoff” times were employed to prevent wasting compute cycles on submissionswhose API functions never returned a value.
4. Aggregate finger positions: When reporting estimated template RAM usage statistics, participants were permittedto return an aggregate template size when the input image contained more than one finger (e.g., “slaps”). Anystatistics over these types of images were reported as-is and the values were not divided by the number of fingersexpected for the capture type. While these participants are not denoted in the report, the actual RAM usage may bea better statistic for comparison.
C = afis team D = 3M Cogent E = Neurotechnology F = Papillon G = Dermalog H = Hisign Bio-Info InstituteI = NEC J = Sonda K = Tiger IT L = Innovatrics M = SPEX O = ID SolutionsP = id3 Q = Morpho S = Decatur Industries T = BIO-key U = Aware V = AA Technology

xvi FPVTE – FINGERPRINT MATCHING
Release Notes
All FpVTE related reports, drafts, announcements, and news items may be found on the websitehttp://fingerprint.nist.gov.
. Application Program Interface and Test Plan: The FpVTE API [15] contains additional details about creating asubmission compatible with the FpVTE test driver. All submissions tested in FpVTE from 2012-2014 were fullycompatible with the FpVTE API and linked without modification to the FpVTE test driver.
. Appendices: Appendix A has full-scale plots for individual participant results that some may prefer to the groupedplots in the main body of the report. Appendices B through L have complete sets of tables for various analyses tohelp reduce the number of tables in the main body of the report.
. Submission identifiers: Throughout this report, submissions are identified by letter code. For reference, the lettersare associated with the providers’ names in a running footnote.
. Typesetting and Graphics: Virtually all of the content in this report was produced automatically. This involved theuse of scripting tools to generate LATEX content and ©©©©©RR graphs directly from the FpVTE test driver’s output. Othergraphics were produced with TikZ. Use of these technologies improved timeliness, flexibility, maintainability, andreduced transcription errors.
. Evaluation Data Ground Truth: Unknown mates within and across datasets create a significant problem and timedelay for large one-to-many data testing.
. Contact: Correspondence regarding this report should be directed to FPVTE at NIST dot GOV.
C = afis team D = 3M Cogent E = Neurotechnology F = Papillon G = Dermalog H = Hisign Bio-Info InstituteI = NEC J = Sonda K = Tiger IT L = Innovatrics M = SPEX O = ID SolutionsP = id3 Q = Morpho S = Decatur Industries T = BIO-key U = Aware V = AA Technology

FPVTE – FINGERPRINT MATCHING 1
1 Introduction
In 2012, NIST launched a new Fingerprint Vendor Technology Evaluation (FpVTE) with two main goals. The first goalwas to assess the current capabilities of matching algorithms using operational datasets with several million subjects. Thesecond goal was to evaluate different operational considerations that could impact matching accuracy. These considera-tions included number of fingers used, data types (live-scan, single-finger capture, slap capture requiring segmentation,and rolled), number of enrolled subjects, and matching speeds.
Evaluating biometric capabilities is an important task, particularly for fingerprint identification, given its widespreadapplications. Large-scale evaluations of core accuracy and functionality of biometric recognition algorithms using oper-ational data will not only reveal the capabilities of the current state of the art but can also identify the limitations andgaps of the current algorithms. The former sets realistic operational expectations and the latter directs future research toimprove and enhance current technologies.
FpVTE was conducted by NIST and sponsored by the Department of Homeland Security (DHS) and the Federal Bureauof Investigation (FBI). All work was performed at the NIST Gaithersburg facility using hardware owned by NIST. FpVTEincludes three rounds of submissions, with participants making algorithm adjustments based on performance reports afterthe first two submissions. Participant submissions were required to conform to the test plan API [15].
The evaluation had three classes of participation. Class A used single-index finger capture data and evaluated singleindex fingers searched against 5 000 up to 100 000 enrolled subjects (“single-finger identification”), and two index fingerssearched against 10 000 up to 1 600 000 enrolled subjects (“two-finger identification”). Class B used IDFlat captures (4-4-2) and evaluated ten-finger, eight-finger (right and left slap), and four-finger (right or left slap) identification searchedagainst 500 000 up to 3 000 000 enrolled subjects. Class C used rolled and plain impression (4-4-1-1) captures and evaluatedten-finger rolled impression, ten-finger plain impression, and ten-finger plain impression matched to rolled impressionidentification searched against 500 000 up to 5 000 000 enrolled subjects. Any segmentation of four-finger slap images ortwo-thumb captures was performed by the submission.
Biometric identification is defined as, “[the] process of searching against a biometric enrollment database to find and returnthe biometric reference identifier(s) attributable to a single individual” [7]. Biometric identification is broadly categorizedinto closed-set and open-set identification.
Closed-set identification refers to cases where all searches have a corresponding enrolled mate in the biometric enrollmentdatabase. An example of a closed-set identification application is a cruise ship on which all passengers are enrolled. Theoutcome of a closed-set identification subsystem is a candidate list that contains the identity of one or more enrolledindividuals whose enrolled samples are most similar to the search (query) sample. Ideally, the correct mate appears inthe first rank. As such, the primary accuracy metric for closed-set identification is hit rate (or its complement, miss rate =
1.0− hit rate), which is the fraction of times the system returns the correct identity within the specified top ranks.
In open-set identification, not all searches have a corresponding enrolled mate in the biometric enrollment database [3].The expected outcome of an open-set identification subsystem is a candidate list of L closest (or most similar) enrolledidentities when the search sample is from an enrolled individual, or an indication that the search sample is from anindividual not in the biometric enrollment database. Therefore, primary accuracy metrics for an open-set identificationare false positive identification (false alarm or Type I error) rate and false negative identification (miss or Type II error)rate. These metrics are described in Section 6.
Closed-set identification applications are very limited because in the majority of real-world identification applications,not all individuals are or can be enrolled. Most real-world biometric identification applications, such as searches against awatch-list or searches for first-time arrestees, are open-set identification. For that reason, FpVTE only evaluated open-setidentification algorithms.
This document reviews metrics for evaluating the performance of open-set identification algorithms and reports perfor-mance for submissions from 18 participants. Three participated in Class A only and the other 15 submitted for all threeclasses. Four participants withdrew before making a submission for testing. Table 1 shows the list of participants and inwhich classes they made submissions for evaluation. These participants are referenced at the bottom of every page withtheir assigned identification letter.
C = afis team D = 3M Cogent E = Neurotechnology F = Papillon G = Dermalog H = Hisign Bio-Info InstituteI = NEC J = Sonda K = Tiger IT L = Innovatrics M = SPEX O = ID SolutionsP = id3 Q = Morpho S = Decatur Industries T = BIO-key U = Aware V = AA Technology

2 FPVTE – FINGERPRINT MATCHING
ID Name Participation Class
C afis team A, B, CD 3M Cogent A, B, CE Neurotechnology A, B, CF Papillon A, B, CG Dermalog A, B, CH Hisign Bio-Info Institute A, B, CI NEC A, B, CJ Sonda A, B, CK Tiger IT AL Innovatrics A, B, CM SPEX A, B, CO ID Solutions A, B, CP id3 AQ Morpho A, B, CS Decatur Industries A, B, CT BIO-key AU Aware A, B, CV AA Technology A, B, C
Table 1: Participant IDs, names, and classes of submission for evaluation.
Section 2 has some history on fingerprint evaluations performed at NIST. Section 3 describes the data used in FpVTE.Section 4 describes the protocol used for submission acceptance and testing. Section 5 gives details on the two-stagematching approach used in FpVTE. Sections 6 through 11 talk about the metrics used to measure accuracy and report theresults from testing. While recognition error rates are important and widely reported, computational resources requiredby algorithms are a significant aspect of performance, especially for large-scale operations. To that end, we report thecomputation time, storage requirements, and their accuracy tradeoffs for each of the submissions. Finally, Section 12examines some FpVTE 2003 results, then Section 13 and Section 14 talk about some lessons learned and future plans.
C = afis team D = 3M Cogent E = Neurotechnology F = Papillon G = Dermalog H = Hisign Bio-Info InstituteI = NEC J = Sonda K = Tiger IT L = Innovatrics M = SPEX O = ID SolutionsP = id3 Q = Morpho S = Decatur Industries T = BIO-key U = Aware V = AA Technology

FPVTE – FINGERPRINT MATCHING 3
2 History and Motivation
2.1 NIST Biometric Evaluations
The first one-to-many fingerprint evaluation conducted at NIST was FpVTE 2003. This evaluation required that par-ticipants bring their own hardware and software to NIST for the evaluation. NIST supplied the data and retained allmatching results for final analysis. FpVTE 2003 had three classes of participation: Small-Scale, Medium-Scale, and Large-Scale. Small-Scale testing used 1 000 single-finger capture images resulting in 1 million subject-to-subject comparisons.Medium-Scale testing used 10 000 single-finger captures resulting in 100 million comparisons. Large-Scale testing used25 000 subjects and various combinations of fingers resulting in 1.044 billion comparisons. The evaluation had 18 partici-pants that submitted 34 systems for testing.
NIST has conducted several fingerprint-related evaluations in the last decade (Figure 1). The first fingerprint evaluationwas called Proprietary Fingerprint Template 2003 (PFT 2003). PFT 2003 was a one-to-one matching evaluation that lookedat the core matching capabilities of fingerprint matching software. It did not evaluate one-to-many capabilities. In 2010,NIST changed the name of PFT 2003 to PFTII, utilizing newer, larger datasets and reporting information on timing andtemplate sizes, in addition to accuracy.
Minutiae Exchange (MINEX), also a one-to-one matching evaluation, began in 2005. MINEX was started to support testingof fingerprint matching technologies using INCITS 378 standard interoperable templates [6]. About a year later, OngoingMINEX was created to support Personal Identity Verification (PIV) by establishing guidelines and measuring accuracy forinteroperable template encoders and matchers.
In addition to fingerprint-related evaluations, NIST has performed evaluations for other biometrics such as face and iris.Additional information and links for all the NIST biometric related evaluations can be found on the NIST biometric eval-uations website [5].
FRVT2002
2003FpVTE
PFT
SlapSeg2004
2005MINEXFRGC
ICE
FRVTBiometricUsability
ICE2006
2007ELFT
MINEX IIMBGC
IREX I2008
2009SlapSeg II
ELFTMBE
IQCEMBEPFTII2010
2011IREX IIINFIQ2
FpVTEFRVT
IREX IV2012
2013
FIVETatt-C
2014
Figure 1: NIST biometric evaluations.
2.2 Purpose
One of the main purposes of this FpVTE evaluation was to provide a refresh on the testing performed in 2003 and allowan opportunity for participation by organizations that missed the previous evaluation. There had been many inquiries inthe past several years on when NIST would perform a similar evaluation. Additionally, the dataset size for FpVTE 2003was around 25 000 total subjects. The current FpVTE testing used enrollment sets ranging from 10 000 subjects to 5 millionsubjects.
NIST has already conducted one-to-many biometric evaluations with enrollment set sizes over 1 million subjects for othermodalities (e.g., Face Recognition Vendor Test (FRVT)/Multiple Biometric Evaluation (MBE) for face and Iris ExchangeEvaluation (IREX III) for iris), in which the sizes of the enrollment templates allowed the entire enrollment set to fit intothe RAM of a single compute node. FpVTE was the first biometric evaluation at NIST that added the ability to partitionthe enrollment set across multiple compute nodes, expanding the possibilities in size and breadth of enrollment sets. Inaddition to broadening the enrollment set, FpVTE strived to:
C = afis team D = 3M Cogent E = Neurotechnology F = Papillon G = Dermalog H = Hisign Bio-Info InstituteI = NEC J = Sonda K = Tiger IT L = Innovatrics M = SPEX O = ID SolutionsP = id3 Q = Morpho S = Decatur Industries T = BIO-key U = Aware V = AA Technology

4 FPVTE – FINGERPRINT MATCHING
. assess the current performance of one-to-many fingerprint matching software using operational fingerprint data;
. provide a testing framework and API for enrollment sizes that must be spread across the memory of multiple com-pute nodes;
. support US Government and other sponsors in setting operational thresholds;
. evaluate on operational datasets containing newer data from live-scan ten-finger IDFlat capture systems, other live-scan capture devices (e.g., single-finger and multi-finger), and historically significant scanned inked fingerprints;
. analyze one-to-many identification accuracy versus, speed, template size, number of fingers, enrollment set sizes,and computational resources.
C = afis team D = 3M Cogent E = Neurotechnology F = Papillon G = Dermalog H = Hisign Bio-Info InstituteI = NEC J = Sonda K = Tiger IT L = Innovatrics M = SPEX O = ID SolutionsP = id3 Q = Morpho S = Decatur Industries T = BIO-key U = Aware V = AA Technology

FPVTE – FINGERPRINT MATCHING 5
3 Data
3.1 Classes of Participation
FpVTE was separated into three classes of participation: A, B, and C. All participants were required to make a Class Asubmission. Along with the Class A submission, a participant could additionally participate in Class B, or both Class Band Class C. These were the only three participation combinations available.
Images were captured via live-scan sensor and rescanned ink. A live-scan sensor refers to the type of sensor that digitallyrecords the friction ridges of a finger through techniques such as electrical or optical sensing. Scanned ink is the process ofcreating a digital image by using an image scanner to optically capture from paper images of friction ridges created by afinger covered with ink.
Class A consisted of live-scan single-finger captures of the left and right index fingers (Figure 2).
Figure 2: Example of single-finger captures of left and right index fingers.
Class B consisted of live-scan IDFlats, which captured left and right four-finger slaps and simultaneous left and rightthumbs, known as “4-4-2” (Figure 3).
Figure 3: Example of an identification flat (4-4-2) capture of a left and right slap and left and right thumbs.
Class C consisted of the rolled and plain impressions from a more traditional 14 print card/record and was a mix oflive-scan and rescanned ink (Figure 4).
Figure 4: Example of live-scan and rescanned ink 14 print card/record that include rolled and plain impressions.
C = afis team D = 3M Cogent E = Neurotechnology F = Papillon G = Dermalog H = Hisign Bio-Info InstituteI = NEC J = Sonda K = Tiger IT L = Innovatrics M = SPEX O = ID SolutionsP = id3 Q = Morpho S = Decatur Industries T = BIO-key U = Aware V = AA Technology

6 FPVTE – FINGERPRINT MATCHING
3.2 Datasets
The evaluation datasets used in FpVTE were from anonymized operational datasets and made available to NIST for fin-gerprint evaluations. The datasets are for government use only and will not be released to the public. The datasets will,to the extent permitted by law, be protected under the Freedom of Information Act (5 U.S.C. § 522) and the Privacy Act (5U.S.C. § 522a) as applicable.
The datasets were comprised of several fingerprint impression types, including rolled, multi-finger plains, and single-finger plains. Rolled images were all individual captures that attempted to record the full width of the fingerprint byrolling from side-to-side during capture. Multi-finger plains captured the four right and four left fingers at the same time.For identification flats, the two thumbs were captured at the same time. Single-finger plains were individual captures ofthe right and left index fingers on a single-finger capture device.
Many of the datasets were larger samples of data used in previous NIST evaluations, such as PFT, MINEX, NIST Fin-gerprint Image Quality (NFIQ), and FpVTE 2003. The single-finger capture and identification flat fingerprint images wereprovided by DHS. The ten-finger rolled and slap fingerprint images included data from the FBI, DHS, Los Angeles CountySheriff’s Department (LACNTY), Arizona Department of Public Safety (AZDPS), and Texas Department of Public Safety(TXDPS). Table 2 shows the source of data for each class in the evaluation.
Class Dataset Enroll Mate Enroll Nonmate Search Mate Search Nonmate
AVISIT-I/POEBVA 25% 5% 25% 25%
DHS2 25% 5% 25% 25%
VISIT-II 50% 90% 50% 50%
BVISIT-II 96% 85% 96% 62.5%
PDR_IDF 4% 15% 4% 37.5%
C
AZDPS 33.3% 4% 33.3% 18.75%
INSBEN 0% 11.5% 0% 12.5%
LACNTY 33.3% 30% 33.3% 18.75%
TXDPS 0% 11.5% 0% 12.5%
PDR-Roll 33.3% 43% 33.3% 37.5%
Table 2: Percentage of data used from each source.
All images in the datasets were 8-bit grayscale. Images were previously compressed using Wavelet Scalar Quantization(WSQ) compression [2], but were passed to the submitted software as reconstructed raw pixel images, decompressed usinglibwsq from NIST’s NIST Biometric Image Software (NBIS) distribution [14]. All images were scanned at 500 pixels perinch. The dimensions of the images varied, but were provided as input information to the participant’s submission. Thedistribution of NIST Fingerprint Image Quality (NFIQ) algorithm [12, 13] values for the evaluation datasets is shown inFigure 5. NIST Fingerprint Segmentation algorithm (NFSEG) was used to segment slap impression images into individualfingers before computing NFIQ values.
Multiple-finger plain captures were not segmented. Submissions were required to perform segmentation of fingerprints,if necessary. Subjects with missing fingers were not removed from the dataset.
C = afis team D = 3M Cogent E = Neurotechnology F = Papillon G = Dermalog H = Hisign Bio-Info InstituteI = NEC J = Sonda K = Tiger IT L = Innovatrics M = SPEX O = ID SolutionsP = id3 Q = Morpho S = Decatur Industries T = BIO-key U = Aware V = AA Technology

FPVTE – FINGERPRINT MATCHING 7
Class Fingers Type 1 2 3 4 5
AL/R Index Enroll 42.8% 32.5% 20.2% 2.2% 2.3%
L/R Index Search 39.5% 32.9% 20.7% 2.2% 4.7%
B
Left Slap Search 44.9% 26.8% 16.0% 6.9% 5.4%
Right Slap Search 50.2% 24.4% 13.0% 5.8% 6.6%
L/R Slap Search 47.6% 25.6% 14.5% 6.3% 6.0%
IDFlats Search 48.3% 25.7% 14.2% 6.4% 5.4%
CTen Plain Search 47.8% 26.6% 16.2% 5.5% 3.9%
Ten Rolled Enroll 34.2% 19.5% 25.0% 8.6% 12.7%
Ten Rolled Search 35.4% 21.3% 23.0% 9.1% 11.2%
0%
25%
50%
75%
100%
L/R Index Left Slap Right Slap L/R Slap ID Flats Ten Plain Ten Rolled
FingerNFIQ 1 2 3 4 5
Figure 5: NFIQ distribution for datasets, after segmentation, where 1 is highest quality and 5 is lowest quality.
3.3 Evaluation Scenarios
Class Scenario
AS1 x E1
S2 x E2
S3 x E3
B
S4 x E4
S5 x E4
S6 x E4
S7 x E4
CS8 x E5
S9 x E5
S9 x E6
Table 3: Evaluation scenarios.Refer to Table 4 for descriptionsof the search and enrollment setcodes.
The three classes of participation had various data type and fingerprint combinationsthat could be evaluated as summarized in autoreftab:data-scenarios. The contents ofTable 4 shows details of the search and enrollment sets used during the evaluation foreach class of participation. The final column of Table 4 shows the various sizes of thedatasets that were tested. The subjects reserved for the search sets contained 200 000
with a known mate and 400 000 with no mate in the enrollment set. This report is basedon a random sample of 10 000 mated and 20 000 nonmated searches from the full searchset.
Table 3 shows the various combinations in which the search sets were searched againstthe enrollment sets listed in Table 4. Those combinations are also described for eachclass as follows.
. Class A — Index Fingers
– One plain index finger searched against an enrollment set of one plain indexfingers. The plain images were from single-finger captures of left and rightindex fingers.
– Two plain index fingers searched against an enrollment set of two plain indexfingers. The plain images were from single-finger captures of left and right index fingers.
. Class B — Identification Flats
– Four-, eight-, and ten-finger identification flats (4-4-2, left/right four-finger plain impressions, and a two-thumbplain impression) searched against an enrollment set of ten-finger identification flats. Any segmentation wasperformed by the submission.
. Class C — Ten-Finger Rolled/Slap
– Ten-finger rolled impressions searched against an enrollment set of ten-finger rolled impressions.
– Ten-finger plain impressions searched against an enrollment set of ten-finger plain impressions. Plain impres-sion images were 4-4-1-1 (left/right four-finger plain impression and left/right single-thumb plain impres-sions). Any segmentation was performed by the submission.
– Ten-finger plain impressions searched against an enrollment set of ten-finger rolled impressions. Plain impres-sion images were 4-4-1-1 (left/right four-finger plain impressions and left/right single-thumb plain impres-sions). Any segmentation was performed by the submission.
C = afis team D = 3M Cogent E = Neurotechnology F = Papillon G = Dermalog H = Hisign Bio-Info InstituteI = NEC J = Sonda K = Tiger IT L = Innovatrics M = SPEX O = ID SolutionsP = id3 Q = Morpho S = Decatur Industries T = BIO-key U = Aware V = AA Technology

8 FPVTE – FINGERPRINT MATCHING
Class Set Description # Images # Fingers Impression # Subjects
Sear
ch
A
S1 Right Index 1 1 PlainMate: 10 000
Nonmate: 20 000
S2 Left Index 1 1 PlainMate: 10 000
Nonmate: 20 000
S3 Left and Right Index 2 2 PlainMate: 10 000
Nonmate: 20 000
B
S4 Right Slap IDFlat 1 4 PlainMate: 10 000
Nonmate: 20 000
S5 Left Slap IDFlat 1 4 PlainMate: 10 000
Nonmate: 20 000
S6 Left and Right Slap IDFlat 28
(4, 4) PlainMate: 10 000
Nonmate: 20 000
S7 Identification Flats 310
(4, 4, 2) PlainMate: 10 000
Nonmate: 20 000
CS8 Ten Finger Rolled 10 10 Rolled
Mate: 10 000Nonmate: 20 000
S9 Ten Finger Plain 410
(4, 4, 1, 1) PlainMate: 10 000
Nonmate: 20 000
Enro
llm
ent
A
E1 Right Index 1 1 Plain10 000
100 000
E2 Left Index 1 1 Plain10 000
100 000
E3 Left and Right Index 2 2 Plain100 000
500 000
1 600 000
B E4 Identification Flats 310
(4, 4, 2) Plain500 000
1 600 000
3 600 000
C
E5 Ten Finger Rolled 10 10 Rolled
500 000
1 600 000
3 000 000
5 000 000
E6 Ten Finger Plain 410
(4, 4, 1, 1) Plain
500 000
1 600 000
3 000 000
5 000 000
Table 4: Search and enrollment datasets used in FpVTE. Class refers to the class of participation, as defined in Subsec-tion 3.1. Set is an identifier used to uniquely identify the various FpVTE datasets in a concise manner. Description indicatesthe finger combinations composing each dataset. # Images specifies the number of images per subject. # Fingers showsthe maximum number of fingers per subject. If a subject’s fingers were spread across multiple images, the maximumnumber of fingers for each image is also shown. Impression refers to the impression type of the imagery in each dataset.Impressions could be either plain or rolled, as defined in Subsection 3.2. # Subjects shows the number of subjects in eachdataset. For ’Search’ datasets, the value has been split into mate and nonmate subjects, referring to whether or not a knownmate for the subject exists in the corresponding enrollment set. For ’Enrollment’ datasets, the # Subjects show the variousenrollment set sizes planned for evaluation.
C = afis team D = 3M Cogent E = Neurotechnology F = Papillon G = Dermalog H = Hisign Bio-Info InstituteI = NEC J = Sonda K = Tiger IT L = Innovatrics M = SPEX O = ID SolutionsP = id3 Q = Morpho S = Decatur Industries T = BIO-key U = Aware V = AA Technology

FPVTE – FINGERPRINT MATCHING 9
3.4 “Size” of the Test
Class EnrollmentsPerformed
Subject to SubjectComparisons
A 5.8 54
B 45.5 362
C 113 452
Table 5: Approximate number (in millions) ofenrollments and comparisons that were com-pleted to evaluate each submission for thatclass of participation.
The overall size of the test had implications on total run time. Table 5shows the number of enrollments and comparisons that were completedfor each submission. Time limits allowed for a maximum of 3 secondsper finger for each enrollment, and up to 500 seconds for Class A and 90
seconds for Class B and C to complete each search. Participants couldmake two submissions for each class of participation. Three of the 18participants submitted for Class A only, while the other 15 submittedfor all three classes, creating a total of 96 submissions analyzed in thisreport. There were three rounds of submissions, with participants re-ceiving results after the first two submissions to analyze before makingtheir next submission. Most submissions shared enrollment templatesbetween both submissions within a class, but two or three submissions ineach round required generating enrollment templates separately.
One unexpected event was that the majority of the submissions required re-enrolling the data for each round of submis-sions. Each round of submissions required approximately 2.5 billion fingerprint enrollments. It took two to three monthsfor each round of submissions to enroll all the data for all the submissions before searching could begin. The 30 000 (20 000nonmate and 10 000 mate) searches took another one to two months to complete for each round of submissions for allclasses across all submissions and finger combinations. The first two rounds resulted in approximately 43 trillion subject-to-subject comparisons, and the final round will have approximately 470 trillion subject-to-subject comparisons. The finalsubmission will be the only one to do searching against variable enrollment set sizes. Total enrollment and search timeswere slightly longer when accounting for submissions that failed in the middle of enrollment or matching and had to befixed and restarted (Subsection 4.4).
C = afis team D = 3M Cogent E = Neurotechnology F = Papillon G = Dermalog H = Hisign Bio-Info InstituteI = NEC J = Sonda K = Tiger IT L = Innovatrics M = SPEX O = ID SolutionsP = id3 Q = Morpho S = Decatur Industries T = BIO-key U = Aware V = AA Technology

10 FPVTE – FINGERPRINT MATCHING
4 Experiment and Test Protocol
4.1 API Overview
The FpVTE API consisted of three major steps: feature extraction, finalization, and identification. During all steps ofthe evaluation, participants had read-only access to a configuration directory, where configuration files, models, or otheralgorithm-specific data could be stored. Not all participants made use of the configuration directory. It was made avail-able as a convenience to those participants who did not wish to store customized traits about their software inside thesubmission itself. In practice, many participants were able to perform changes, such as adjusting identification speed,simply by changing a configuration file within this directory instead of needing to recompile their submission.
4.1.1 Feature Extraction
The first step in the FpVTE evaluation pipeline was feature extraction. During this step, software submissions were giventhe opportunity to turn one or more images of fingerprints into a single fingerprint template. There were no requirementson the format of the fingerprint template, as it was expected that the majority of participants would make use of pro-prietary template formats. The FpVTE API provided a way to distinguish between the images that would be used forsearching and the images used to compose the enrollment set, though participants were free to treat all images in the samefashion.
For each instance of feature extraction, the FpVTE test driver called an initialization method a single time, giving thesubmission an opportunity to load information that might be needed for feature extraction. After the initialization call,the feature extraction method was called N times. The FpVTE API provided the finger position, impression type, NFIQvalue (no value provided for slap images), image dimensions, and raw image bytes for each input image during the call toextract features. As output, participants were to return the finger position, an image quality value, a fingerprint template,and the size of the fingerprint template as it would be stored in RAM. The RAM size was important to determine thenumber of compute nodes needed during identification, because the size of the template on disk might be significantlylarger or smaller than the size of the template in RAM. Participants could optionally return a core and delta coordinate forthe image.
4.1.2 Finalization
As fingerprint templates were returned from feature extraction, the FpVTE test driver added them to a RecordStore (akey-value pair storage mechanism of the Biometric Evaluation Framework). This allowed I/O operations to be excludedwhen calculating the runtime of feature extraction, as well as to allow NIST to store the large quantity of template data inthe most efficient way on NIST’s hardware. Once all features were extracted from enrollment set fingerprint images, theFpVTE test driver called an API method to “finalize” the enrollment set. Based on the sum of the sizes of templates in RAM,NIST calculated the appropriate number of compute nodes and passed this information, along with the RecordStore of alltemplates, to the finalization method. During this method, the submission was to divide the enrollment set into a partitionfor each compute node, as well as perform any sort of indexing, statistics, or other pre-identification tasks required.
Unlike how NIST controlled the storage mechanism for templates in feature extraction, participants had full control ofhow to store their finalized enrollment sets. In many cases, the size of the finalized enrollment set was either much largeror much smaller than the sum of the fingerprint templates sizes returned from feature extraction as stored on disk.
4.1.3 Identification
Once the finalized set was created, its read-only root directory was provided to the identification methods. Searchingthe finalized set for candidates occurred over two stages. The first stage was performed on separate compute nodes (ifnecessary, as determined by the amount of RAM needed), potentially searching subsets of the enrollment set. Output from
C = afis team D = 3M Cogent E = Neurotechnology F = Papillon G = Dermalog H = Hisign Bio-Info InstituteI = NEC J = Sonda K = Tiger IT L = Innovatrics M = SPEX O = ID SolutionsP = id3 Q = Morpho S = Decatur Industries T = BIO-key U = Aware V = AA Technology

FPVTE – FINGERPRINT MATCHING 11
this first stage was coalesced and provided to the second stage, which took place on a single compute node. These twostages of identification are described at length in Section 5.
4.2 Test Constraints
In order to complete the evaluation in a reasonable amount of time, as well as to mimic potential operational requirements,certain constraints were placed on FpVTE submissions. All times are maximum averages over the pre-evaluation datasets(Section 3), though NIST employed reasonable “cutoff” times to prevent processes from never completing. See Caveatsfor additional information about timing.
. Operating System and Compilation Environment: All submitted implementations required 64-bit linkage and weretested on CentOS 6.2 (kernel version 2.6.32-220.7.1.el6.x86_64). NIST linked participant submissions to the FpVTEtest driver written in C++ with GNU g++ 4.4.6-3, using glibcxx 3.4.13 and glibc 2.12.
. Evaluation Hardware: Timing computations were performed on a Dell M610 with two Intel X5690 3.47 GHz proces-sors and 192 GB of RAM.
. Threaded Computations: Threaded computations were only allowed for the finalization step. All other functionswere not to perform multithreaded computations, as the FpVTE test driver handled parallelism efficiently on theNIST compute nodes.
. Feature Extraction Time: Feature extraction was required to complete in 3 seconds or less for each input fingerprint.A four-finger slap was counted as four input fingerprints.
. Finalization Time: Finalization of the enrollment set of fingerprint templates was required to complete in 12 hoursor less on a single compute node.
. Search Time: Search time is the combined time measurement for stage one and stage two identification (not includ-ing initialization times). For Class A data, searches needed to complete in under 500 seconds, though implementa-tions that searched in under 20 seconds were reported separately. For Class B and Class C, all searches needed tocomplete in under 90 seconds.
4.3 Biometric Evaluation Framework
The FpVTE test driver made use of several C++ classes that are part of the NIST Image Group’s Biometric EvaluationFramework [11] designed to make writing code for running biometric evaluations easier and more efficient, especiallyon NIST-owned equipment. Classes from the framework used in the FpVTE API included key-value pair file storage,safe dynamic arrays, error handling, and more. While the framework was mainly provided to participants as a means ofinteracting with the FpVTE API, many participants chose to use some classes internally in their submissions.
In order to process the massive amount of data required for the evaluation, the submission was executed as a scalableparallel job. Within the NIST testbed, an implementation of the Message Passing Interface (MPI) [10] was used to executethe evaluation test programs. By using the MPI software, the size of the parallel job (in terms of participating computenodes) can be matched to the size of the input dataset.
The framework supports parallelism by abstracting and hiding the lower-level communication, error handling, and otherfacets of the MPI library. The framework application need only implement a few functions in order to become an MPIparallel job. One feature of the framework is a set of classes that support the distribution of record keys, or key-valuepairs, across the computation cluster. Key distribution allows for driving the test where all nodes have local access to thedata. Key-value distribution has the advantage of running the job with the data source present only on a single node.
Configuration of the job is managed with a simple text file that specifies the input data source, logging system (either filesor a log server), and the number of data consumers assigned to each compute node. By using a configuration file, testscripts were simpler to invoke, the probability of error was reduced, and replication of the test scenario was implicitlyprovided.
C = afis team D = 3M Cogent E = Neurotechnology F = Papillon G = Dermalog H = Hisign Bio-Info InstituteI = NEC J = Sonda K = Tiger IT L = Innovatrics M = SPEX O = ID SolutionsP = id3 Q = Morpho S = Decatur Industries T = BIO-key U = Aware V = AA Technology

12 FPVTE – FINGERPRINT MATCHING
4.4 Validation
Participants were provided imagery from publicly available datasets in the same format as the full evaluation datasets.These validation datasets were used to test implementation functionality before NIST performed the evaluation on a muchlarger dataset. Participants ran a validation test with the provided data on their own systems and provided NIST with theresulting candidate lists and scores from a set of pre-selected searches. NIST did the same on the machines used for thefull evaluation to confirm that both NIST and the participant produced the same results. Validation also provided a wayto make sure that participants were following the conventions of the evaluation, such as returning appropriate qualityvalues and numbers of candidates, among others.
Care was taken to make the validation process as simple as possible, to let the participant focus more on their submissionthan about intricacies specific to FpVTE. To assist, NIST provided a minimal version of the FpVTE test driver softwareused in the evaluation to aid participants through the expected calling structure of the evaluation API. Scripts were pro-vided to compile the test driver and run the validation test. All a participant needed to do was create a properly namedsoftware submission, run the script, and submit the generated results file to NIST. Additionally, a build of the BiometricEvaluation Framework was provided, and many participants made use of features found in the framework in their APIimplementations.
4.5 Pre-Evaluation
A timing test was performed to make sure no submission was in violation of the required time limits. First, a sample of theevaluation dataset was enrolled using ten processes per compute node and the timing of those enrollments were evaluatedto make sure they did not exceed the average of three seconds per fingerprint. I/O time was not included during this step,as all data was passed to and from the FpVTE test driver in memory. If the submission passed the enrollment timing test,the full set of data was enrolled and finalized for matching. After enrollment, the next timing test was a random sampleof mated and nonmated searches matched against the maximum enrollment set for each evaluation class. If the averagesearch time on this sample test set, using a single process on each compute node, completed under the maximum timelimit, the full search set of 30 000 searches was performed. The formula used to compute the total search time was:
Ts = (t1 × b1) + t2 (1)
where t1 = average identification stage one time
b1 = number of blades required for identification stage one
t2 = identification stage two time
This formula allowed for a fair comparison between submissions that used one compute node for identification stage oneversus others that may have used two or more compute nodes to store the enrollment set. The formula was vetted withthe participants because it assumes that the enrollment set is evenly distributed across all identification stage one bladesand that search time is fairly linear versus enrollment set size.
Every attempt was made to use the same hardware and number of processes for every submission when reporting timingresults. Additionally, the hardware used for timing was dedicated to the FpVTE test driver process with no other jobsrunning on the system except OS related processes.
C = afis team D = 3M Cogent E = Neurotechnology F = Papillon G = Dermalog H = Hisign Bio-Info InstituteI = NEC J = Sonda K = Tiger IT L = Innovatrics M = SPEX O = ID SolutionsP = id3 Q = Morpho S = Decatur Industries T = BIO-key U = Aware V = AA Technology

FPVTE – FINGERPRINT MATCHING 13
4.6 Receiving Submissions
Every FpVTE submission received by NIST went through the FpVTE Validation and Pre-Evaluation processes before com-mitting resources to complete the full evaluation. Figure 7 visualizes the submission process with a flowchart. Manysubmissions underwent the process multiple times due to defects in the initial submission. Potential FpVTE softwaresubmission defects that would require a resubmission include:
. submission incorrectly signed or encrypted;
. participant’s validation results differ from NIST’s;
. software errors during evaluation;
. maximum average time limit exceeded;
. invalid API implementation.
NIST provided no upper bound on the number of times that a participant could resubmit software in the event of a defect.Unfortunately, this created an unpredictably large amount of additional work for NIST, through managing submissions,helping participants debug, reporting status, and the like. Figure 6 details the number of non-debugging submissionsreceived from participants over the course of the evaluation. The general trend of participants not achieving a “valid”submission on the first or second attempt ultimately played a part in forcing NIST to extend the original evaluationdeadlines.
Class A Class B Class C
0
10
20
30
C D E F G H I J K L M O P Q S T U V C D E F G H I J K L M O P Q S T U V C D E F G H I J K L M O P Q S T U V
Participant
Num
ber
of S
ubm
issi
ons
Round 1 Round 2 Round 3
Figure 6: Total number of non-debugging submissions received before the final deadline.
At the conclusion of the evaluation, 733 FpVTE validation submissions were received by NIST, including validationsubmissions from participants who ultimately withdrew from the evaluation. For this total, a submission is considereda discrete transmission of non-debugging software to NIST that required action by a NIST employee, on a per-class basis.
There were three rounds during which participants could make submissions. Participants were given an opportunity toupdate their submissions at the end of the first two submission rounds. Because FpVTE was a black-box evaluation, NIST
C = afis team D = 3M Cogent E = Neurotechnology F = Papillon G = Dermalog H = Hisign Bio-Info InstituteI = NEC J = Sonda K = Tiger IT L = Innovatrics M = SPEX O = ID SolutionsP = id3 Q = Morpho S = Decatur Industries T = BIO-key U = Aware V = AA Technology

14 FPVTE – FINGERPRINT MATCHING
ultimately had no idea what changes to the submissions were made. A number of submissions majorly regressed in theirlack of defects, so it can be anecdotally inferred that large portions or even entire submissions were changed by someparticipants.
NIST imposed certain timing requirements on participants to ensure that the evaluation could be completed on NISThardware in a reasonable amount of time, as well as to mimic a possible operational constraint. Several participants triedto tune their submissions to make use of the maximum amount of time, giving themselves a potential increase in overallaccuracy. While the back-and-forth between NIST and the participants did increase the runtime of the evaluation, timingdefects were the most understandable defect encountered in the evaluation and was primarily caused by NIST-basedevaluation restrictions, not participant error.
During the final submission, participants C, D, E, G, H, I, O, P, Q, and V provided one or more submissions that validatedand ran to completion without NIST encountering defects other than timing restrictions. Participants C, E, G, I, O, andV met this requirement for all classes of participation in the final submission. Participant E was the only participant toachieve no defects other than timing restrictions, for every class during all three submission periods.
C = afis team D = 3M Cogent E = Neurotechnology F = Papillon G = Dermalog H = Hisign Bio-Info InstituteI = NEC J = Sonda K = Tiger IT L = Innovatrics M = SPEX O = ID SolutionsP = id3 Q = Morpho S = Decatur Industries T = BIO-key U = Aware V = AA Technology

FPVTE – FINGERPRINT MATCHING 15
Validation
NIST provides sample inputdata and evaluation source code.
Participants run their submis-sions linked to NIST source
code over provided input data.
Participants send black-box submission and outputfrom sample data to NIST.
NIST runs black-box submissionover the same sample input data
in the real evaluation environment.
Checkresults.
Pre-Evaluation
NIST runs the full evaluationover a set of 2 000 images
from the evaluation dataset.
NIST generates all tem-plates for evaluation dataset.
Perform timing testwith subset of searches.
Full Evaluation
Run remaining (30 000) searches.
Repeat searches for vari-able enrollment set sizes.
Report results.
Bad
Good
Crash
Too Slow
Crash
Good
Good
Good
Good
Figure 7: Evaluation workflow.
C = afis team D = 3M Cogent E = Neurotechnology F = Papillon G = Dermalog H = Hisign Bio-Info InstituteI = NEC J = Sonda K = Tiger IT L = Innovatrics M = SPEX O = ID SolutionsP = id3 Q = Morpho S = Decatur Industries T = BIO-key U = Aware V = AA Technology
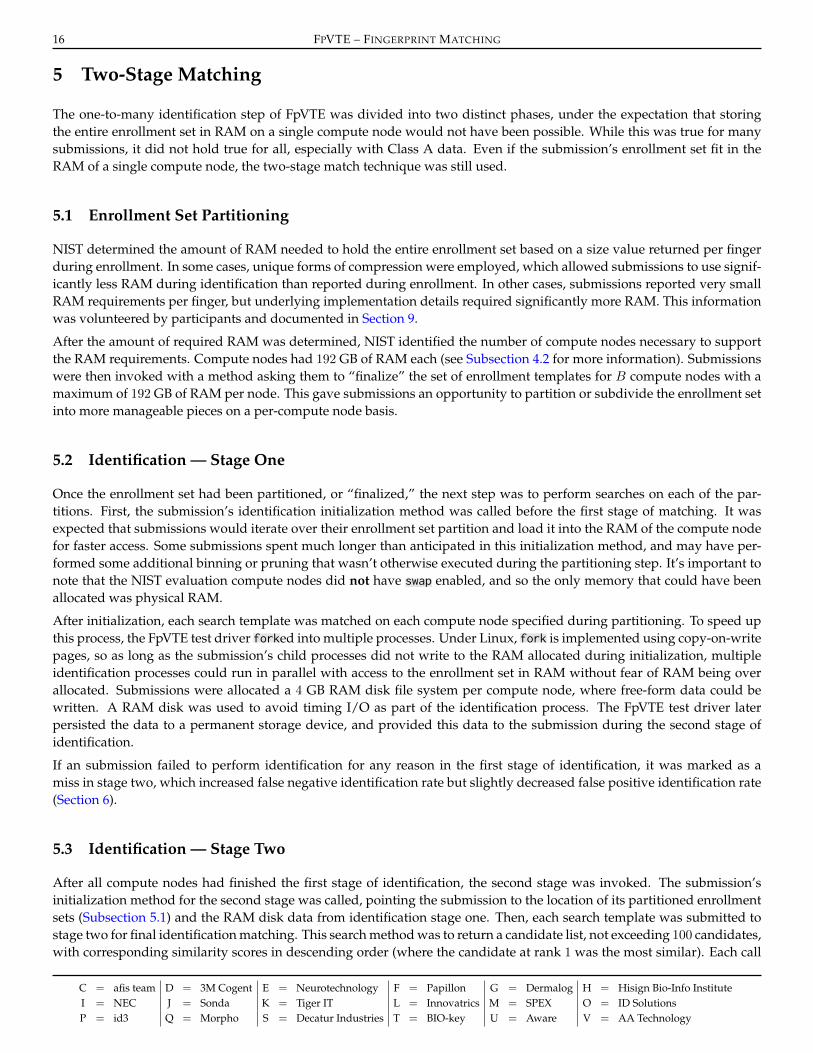
16 FPVTE – FINGERPRINT MATCHING
5 Two-Stage Matching
The one-to-many identification step of FpVTE was divided into two distinct phases, under the expectation that storingthe entire enrollment set in RAM on a single compute node would not have been possible. While this was true for manysubmissions, it did not hold true for all, especially with Class A data. Even if the submission’s enrollment set fit in theRAM of a single compute node, the two-stage match technique was still used.
5.1 Enrollment Set Partitioning
NIST determined the amount of RAM needed to hold the entire enrollment set based on a size value returned per fingerduring enrollment. In some cases, unique forms of compression were employed, which allowed submissions to use signif-icantly less RAM during identification than reported during enrollment. In other cases, submissions reported very smallRAM requirements per finger, but underlying implementation details required significantly more RAM. This informationwas volunteered by participants and documented in Section 9.
After the amount of required RAM was determined, NIST identified the number of compute nodes necessary to supportthe RAM requirements. Compute nodes had 192 GB of RAM each (see Subsection 4.2 for more information). Submissionswere then invoked with a method asking them to “finalize” the set of enrollment templates for B compute nodes with amaximum of 192 GB of RAM per node. This gave submissions an opportunity to partition or subdivide the enrollment setinto more manageable pieces on a per-compute node basis.
5.2 Identification — Stage One
Once the enrollment set had been partitioned, or “finalized,” the next step was to perform searches on each of the par-titions. First, the submission’s identification initialization method was called before the first stage of matching. It wasexpected that submissions would iterate over their enrollment set partition and load it into the RAM of the compute nodefor faster access. Some submissions spent much longer than anticipated in this initialization method, and may have per-formed some additional binning or pruning that wasn’t otherwise executed during the partitioning step. It’s important tonote that the NIST evaluation compute nodes did not have swap enabled, and so the only memory that could have beenallocated was physical RAM.
After initialization, each search template was matched on each compute node specified during partitioning. To speed upthis process, the FpVTE test driver forked into multiple processes. Under Linux, fork is implemented using copy-on-writepages, so as long as the submission’s child processes did not write to the RAM allocated during initialization, multipleidentification processes could run in parallel with access to the enrollment set in RAM without fear of RAM being overallocated. Submissions were allocated a 4 GB RAM disk file system per compute node, where free-form data could bewritten. A RAM disk was used to avoid timing I/O as part of the identification process. The FpVTE test driver laterpersisted the data to a permanent storage device, and provided this data to the submission during the second stage ofidentification.
If an submission failed to perform identification for any reason in the first stage of identification, it was marked as amiss in stage two, which increased false negative identification rate but slightly decreased false positive identification rate(Section 6).
5.3 Identification — Stage Two
After all compute nodes had finished the first stage of identification, the second stage was invoked. The submission’sinitialization method for the second stage was called, pointing the submission to the location of its partitioned enrollmentsets (Subsection 5.1) and the RAM disk data from identification stage one. Then, each search template was submitted tostage two for final identification matching. This search method was to return a candidate list, not exceeding 100 candidates,with corresponding similarity scores in descending order (where the candidate at rank 1 was the most similar). Each call
C = afis team D = 3M Cogent E = Neurotechnology F = Papillon G = Dermalog H = Hisign Bio-Info InstituteI = NEC J = Sonda K = Tiger IT L = Innovatrics M = SPEX O = ID SolutionsP = id3 Q = Morpho S = Decatur Industries T = BIO-key U = Aware V = AA Technology

FPVTE – FINGERPRINT MATCHING 17
to perform a search included a path to a directory rooted on a RAM disk file system, in which the FpVTE test driver placedthe submission’s output from stage one (Subsection 5.2).
There was no intended control on how the second stage of identification reached the final candidate list, but the search timelimit imposed on submissions combined both stage one and stage two search times (see Section 4 for detailed informationon timing constraints and calculations). Stage two could have been as simple as a sort of stage one results, or as complexas an additional level of matching involving templates. Based on the timing figures observed during the evaluation, bothtrivial and complex stage two implementations were used by FpVTE participants.
Stage two took place on an individual compute node, though the pool of search templates may have been partitioned andsearched on multiple compute nodes independently by the FpVTE test driver to increase throughput.
C = afis team D = 3M Cogent E = Neurotechnology F = Papillon G = Dermalog H = Hisign Bio-Info InstituteI = NEC J = Sonda K = Tiger IT L = Innovatrics M = SPEX O = ID SolutionsP = id3 Q = Morpho S = Decatur Industries T = BIO-key U = Aware V = AA Technology

18 FPVTE – FINGERPRINT MATCHING
6 Metrics
The detection error tradeoff (DET) characteristic curve [9] was the primary metric used for comparing accuracy in FpVTE.Specific points along the DET were examined for making comparisons between submissions. For this initial results report,the number of mate searches was limited to 10 000 and the number of nonmate searches was limited to 20 000 subjects,restraining the smallest error rate that could be used with statistical confidence to 10−3.
In addition to the accuracy of the submission, this report compares speed and computational resource usage. Comparisonsbetween all submission are made and reported.
6.1 Accuracy
Open-set identification algorithms can make two types of recognition error:
. Search of a biometric sample of an individual not enrolled in the biometric enrollment set (a nonmated search) returnsthe biometric reference identifier(s) attributable to one or more enrolled person. This is considered Type I, or falsealarm, because it returns a false identity.
. Search of a biometric sample of an enrolled individual (a mated search) returns an incorrect enrolled identity. This isconsidered Type II, or miss, because it misses the correct identity.
FpVTE quantified the accuracy of the open-set identification algorithms as follows:
. False positive identification rate (FPIR), or Type I error rate, is the fraction of the nonmated searches where one ormore enrolled identities are returned at or above threshold (T ) [4]. FPIR is a function of: the size of the enrollmentset (N ), length of candidate lists (L), and score threshold (T ). In the general case, this can be summarized as
FPIR(N,T, L) =
Number of searches with any nonmates returnedabove threshold T on candidate list length L
Number of nonmated searches conducted
(2)
and more precisely notated for this evaluation as
FPIR(T ) =
∑Qq=1 H(dq1 − T )
Q(3)
where Q is the number of searches performed for which there exists no mate in the enrollment set, dq1 is the highestsimilarity score reported by the algorithm for the q-th search. The function H(x) is the Heaviside step function
H(x) =
{0, if x < 0
1, if x ≥ 0(4)
. False negative identification rate (FNIR), or Type II error rate, is the fraction of the mated searches where the en-rolled mate is outside the top R rank or comparison score is below threshold (T ). FNIR is a function of: the sizeof the enrollment set (N ), length of candidate lists (L), score threshold (T ), and the number of top candidates beingconsidered (R). This is summarized in the general case as
FNIR(N,R, T, L) =
Number of mates outside top R ranks or belowthreshold T on candidate list length L
Number of mated searches conducted
(5)
C = afis team D = 3M Cogent E = Neurotechnology F = Papillon G = Dermalog H = Hisign Bio-Info InstituteI = NEC J = Sonda K = Tiger IT L = Innovatrics M = SPEX O = ID SolutionsP = id3 Q = Morpho S = Decatur Industries T = BIO-key U = Aware V = AA Technology

FPVTE – FINGERPRINT MATCHING 19
and is defined formally for this evaluation as
FNIR(T ) = 1− 1
P
P∑p=1
L∑r=1
Ipr[1−H(dpr − T )] (6)
where P is the number of searches performed for which there exists a mate in the enrollment set, dpr is the r-thlowest similarity score reported by the algorithm for the p-th search, and Ipr is 1 if the identity of the r-th candidateis the same as the identity of search p, or 0 otherwise.
Note that FNIR computation does not care about the cause of a miss: failure to correctly identify a sample (e.g., due topoor quality), failure to extract a template, failure to generate a comparison score, and software crashes are all dealt withsimilarly.
The terms “hit rate,” “reliability,” and “sensitivity” that have been mentioned in some literature on automated fingerprintidentification systems (AFIS) [8, 16] are just the complement of FNIR, computed as 1− FNIR.
Another widely used accuracy metric is cumulative match characteristic (CMC), which is the fraction of the mated searcheswhere the enrolled mate is at rank R or better, regardless of its comparison score. CMC is a special case of FNIR, or moreprecisely, hit rate, when the constraint on threshold is removed, as shown in Equation 7.
CMC(N,L,R) = 1− FNIR(N,L, T = 0, R) (7)
Rank-one hit rate, CMC(N,L,R = 1), is the most common accuracy metric reported in academic and AFIS-related litera-ture. While CMC is reported for the tested submissions, it is an inadequate accuracy metric because its makes strong orweak hits indistinguishable by ignoring similarity scores, and does not report Type I errors.
6.2 DET Plots
DET characteristic curves are the primary accuracy metric for offline testing of biometric recognition algorithms. Eachpoint on a DET curve exhibits the false positive identification and false negative identification rates associated with acertain threshold value. The DET curve spans the entire range of possible threshold values, which is normally the rangeof the comparison scores. To reveal the dependence of FNIR and FPIR at a fixed threshold, the DET curves are connectedat points where FNIRs and FPIRs are observed at the same threshold values.
As it is conventional, DET curves are presented for FpVTE submission. In a DET curve, Type I error rates are plotted onthe x-axis and Type II error rates are plotted on the y-axis, giving uniform treatment to both types of error. Both axesuse a logarithmic scale, which spreads out the plot and better distinguishes different well-performing systems. Whencalculating FPIR and FNIR, all ranks were considered (L = R = 100).
6.3 Failure to Extract or Match a Template
Failure to extract is the fraction of images for which a template is not generated. Template generation can fail for theenrollment sample or the search sample. In both cases, failure to extract a template is included as a miss in the computationof FNIR (see section 6.1).
Additionally, recognition algorithms fail to execute one-to-many searches to produce comparison scores. The result is thata valid candidate list is not produced. Such failures might be voluntary (e.g., refusal to process a poor quality image) orinvoluntary (e.g., software crashes). Either way, it is an undesirable behavior, and should be included in computation ofrecognition errors, particularly to allow for fair comparison of submissions. FpVTE treated such failure cases as a missand added them to the Type II errors.
C = afis team D = 3M Cogent E = Neurotechnology F = Papillon G = Dermalog H = Hisign Bio-Info InstituteI = NEC J = Sonda K = Tiger IT L = Innovatrics M = SPEX O = ID SolutionsP = id3 Q = Morpho S = Decatur Industries T = BIO-key U = Aware V = AA Technology

20 FPVTE – FINGERPRINT MATCHING
Right Hand Left Hand
1 62 73 84 95 1011 1213 14
Table 6: Table showing which fin-ger positions were swapped whenthe images were flipped for nonmatesearches.
Figure 9: Example of flipped single-index fingerimage.
6.4 Computational Efficiency
Another aspect of performance is the computational resources required by a submission. This report includes a compar-ison of template generation times, one-to-many search times, and template sizes for the submissions, along with theiraccuracy at a set FPIR point of 10−3. The timing numbers are based on data samples for which all submissions were rununder identical conditions on the same hardware.
6.5 Ground Truth Errors
0FN
IR1
0 1FPIR
Figure 8: Example of a DET show-ing a spike in False Positive Identi-fication Rate. This is usually a signof ground truth errors in nonmatesearches.
There were two types of ground truth errors that had to be resolved for FpVTEdatasets. The first involved nonmate searches that had an unknown mate in theenrollment set. These errors would wrongly increase FPIR (see Section 6). Thesecond involved mated searches that did not match the presumed mate or hadother unknown mates in the enrollment set. Either of these mated search errorscould wrongly increase FNIR. An example of the effect on a DET curve is shownin Figure 8. Once the errors show up at a certain threshold, the error rate sharplyincreases and remains erroneously high.
The nonmate search errors were resolved by flipping fingerprint images on thevertical axis for nonmated searches. In order to have the correct topography of thefinger, left/right hand labelings and finger positions were reversed after flipping.Table 6 shows how the finger positions were swapped to keep the correct fingertopography. Example images are shown in Figure 9, Figure 10, and Figure 11.
The mated search errors had to be resolved through manual inspection. A large cause of the unknown mates resultedfrom FpVTE using data from multiple sources. These ground truth errors had to be detected by examining the unexpectedhigh-scoring alleged nonmates produced by the submissions. The results from the submissions were grouped togetherto determine which unexpected high-scoring alleged nonmates needed manual inspection. The first step was to look atsearches where all the submissions had an unexpected high-scoring alleged nonmate above a certain threshold. Next,cases were examined for which only some of the submissions had a high-scoring alleged nonmate. After examining thesecases, if the majority were true mates, the thresholds used were decreased and the process repeated until very few or nomore true mates were found. Not all submissions were used for this process as some produced results that would haverequired too much manual work to inspect all of the potential errors produced. This process was repeated for low scoringalleged mates. The mate searches with low scores were examined to determine if the alleged mate was truly a mate or ifthere was a ground truth error. Very low quality images were not removed from the datasets.
C = afis team D = 3M Cogent E = Neurotechnology F = Papillon G = Dermalog H = Hisign Bio-Info InstituteI = NEC J = Sonda K = Tiger IT L = Innovatrics M = SPEX O = ID SolutionsP = id3 Q = Morpho S = Decatur Industries T = BIO-key U = Aware V = AA Technology

FPVTE – FINGERPRINT MATCHING 21
Figure 10: Example of flipped left slap image. Note that the flipped image was used as a right slap.
Figure 11: Example of flipped right slap image. Note that the flipped image was used as a left slap.
C = afis team D = 3M Cogent E = Neurotechnology F = Papillon G = Dermalog H = Hisign Bio-Info InstituteI = NEC J = Sonda K = Tiger IT L = Innovatrics M = SPEX O = ID SolutionsP = id3 Q = Morpho S = Decatur Industries T = BIO-key U = Aware V = AA Technology

22 FPVTE – FINGERPRINT MATCHING
7 Accuracy Results
Subsections 7.1 through 3 show the identification accuracy results, from round 3 submissions, for all three classes of partic-ipation. The sections include plots sorted by rank for FNIR at a fixed FPIR of 10−3, Detection Error Tradeoff (DET) curvesshowing accuracy over a range of threshold values, Cumulative Match Characteristic (CMC) curves showing accuracyover a range of candidate list ranks, and tables with FNIR values at a fixed FPIR. A complete set of full-size DET curvesfor each participant are included in Appendix A. Appendix B shows DET and CMC plots for all submissions and classesgrouped on a single page.
This section (7) is followed by sections showing accuracy tradeoff results. Section 8 shows FNIR compared to searchtime statistics. Appendix C and Appendix D have a complete set of tables for search time statistics. Appendix E showsthe progression of timing and results from the second to third round of submissions. Section 9 shows FNIR comparedto computational resources such as RAM usage and enrollment (i.e., template creation) times. Appendices F to H havedetailed tables on templates sizes and creation times.
These results are coalesced in Section 10, with tables combining ranked results for each category (FNIR, search time, RAM,enrollment time). Appendix I has the complete set of tables for ranked results in all classes of participation. Appendix Kplots relative comparisons of FNIR, RAM usage, template creation times, and search times.
Section 11 combines results across classes of participation showing how accuracy varied based on the number of fingersavailable for searching. Appendix J plots relative comparisons, by class, for each search set used in FpVTE.
C = afis team D = 3M Cogent E = Neurotechnology F = Papillon G = Dermalog H = Hisign Bio-Info InstituteI = NEC J = Sonda K = Tiger IT L = Innovatrics M = SPEX O = ID SolutionsP = id3 Q = Morpho S = Decatur Industries T = BIO-key U = Aware V = AA Technology

FPVTE – FINGERPRINT MATCHING 23
7.1 Class A
7.1.1 Single-Index Finger Identification
The accuracy of single-finger identification is shown with rank-sorted FNIR points (based on right index finger results) inFigure 12, DET curves in Figure 13, CMC plots in Figure 14, and tables of FNIR points at a fixed FPIR in Tables 7 through8.
Some observations for Class A single-finger identification include (all FNIR values are at FPIR =10−3):
. The most accurate submissions were D, Q, I, V and L2.
. The right index finger was more accurate than the left index finger.
. The most accurate submission D achieved a FNIR of 1.97% for the left index finger and 1.9% for the right indexfinger searched against an enrollment set of 100 000 subjects.
. There is a measurable accuracy gap between the top performers and the next level of performers.
. The CMC plots in Figure 14 are not as flat as the other classes. This indicates that while most mates appear withinthe top three candidates on the list, there are some that appear further down the list when using single-finger iden-tification.
●●
●●
●●●●
●
●
●
●
●
●
●
●●
● ●
●●
●●
●●
●●
●
● ●
●
● ●
● ●
●
●
●
●
●●
●●
●● ●
●
●●
●●
● ●● ●
●●
●●
●●
●●
●●
●●
● ●
● ●
0.02
0.05
0.10
0.20
D1 D2 I2 Q2 I1 Q1 V2 V1 L2 S1 S2 L1 T2 E2 E1 J2 O2 K1 K2 J1 O1 F2 G2 G1 F1 U1 U2 P2 C2 C1 P1 H1 H2 T1 M2 M1
Submission
FN
IR @
FP
IR =
10−3
● ●Left Index Right Index
Figure 12: Rank-sorted FNIR @ FPIR = 10−3 for Class A — Single Index Finger searching 30 000 subjects against 100 000subjects. Submissions “1” and “2” from round 3.
C = afis team D = 3M Cogent E = Neurotechnology F = Papillon G = Dermalog H = Hisign Bio-Info InstituteI = NEC J = Sonda K = Tiger IT L = Innovatrics M = SPEX O = ID SolutionsP = id3 Q = Morpho S = Decatur Industries T = BIO-key U = Aware V = AA Technology

24 FPVTE – FINGERPRINT MATCHING
False Positive Identification R
ate
False Negative Identification Rate
0.0050
0.0100
0.0200
0.0500
0.1000
0.2000
0.5000
0.00050.00100.0020
0.00500.01000.0200
0.05000.10000.2000
0.5000
●●
●●●
●●
●●
●●
●●
●●
●
P
●●●
●●
●●
●
●●
●●
●●
●●
Q
0.00050.00100.0020
0.00500.01000.0200
0.05000.10000.2000
0.5000
●●
●●
●●
●●
●●
●●
●●
●●
S●
●
●●
●●
●●
T
0.00050.00100.0020
0.00500.01000.0200
0.05000.10000.2000
0.5000
●●
●●
●●● ●●●● ●
●●● ●
U
●●●●
●●●●●●●●
●●
●●
V
●
● ●
●
●
●●
●
●
●●
●●
●●
I
●● ●
●●
●●
●●
●●
●
●
●●
●
J
●●●●●●● ●
● ●● ●●●●●
K
●
●
●
● ●
●
●
● ●
●
●
●
●
●
●
●
L●●
●●
●●
●●
●●
●●
●
●●
●
M
●●
●●
●●
●●
●
●●
●●
●
●
●
O0.0050
0.0100
0.0200
0.0500
0.1000
0.2000
0.5000
●●
●●
●●
●●
●●
●●
●
●●
●
C
●●●●
●●●●
●● ●●
●● ●●
D
●●●●●●
●●●●
●●
●●
●●
E
●●
●●
●●
●●
●●
●●
●●
●●
F
●●
●●●●
●●●●
●●●●
●●
G
●●
●●
●●
●●
●●●●
●●●●
H
Left Index (1) Left Index (2)
Right Index (1)
Right Index (2)
Figure13:D
ETfor
Class
A—
SingleIndex
Fingersearching
30000
subjectsagainst
100000
subjects.Submissions
“1”and
“2”from
round3.
C = afis team D = 3M Cogent E = Neurotechnology F = Papillon G = Dermalog H = Hisign Bio-Info InstituteI = NEC J = Sonda K = Tiger IT L = Innovatrics M = SPEX O = ID SolutionsP = id3 Q = Morpho S = Decatur Industries T = BIO-key U = Aware V = AA Technology

FPVTE – FINGERPRINT MATCHING 25
Ran
k
Miss Rate
0.00
10
0.00
20
0.00
50
0.01
00
0.02
00
0.05
00
0.10
00
0.20
00
510
15
PQ
510
15
ST
510
15
UV
IJ
KL
MO
0.00
10
0.00
20
0.00
50
0.01
00
0.02
00
0.05
00
0.10
00
0.20
00C
DE
FG
H
Left
Inde
x (1
)Le
ft In
dex
(2)
Rig
ht In
dex
(1)
Rig
ht In
dex
(2)
Figu
re14
:CM
Cfo
rC
lass
A—
Sing
leIn
dex
Fing
erse
arch
ing30000
subj
ects
agai
nst1
00000
subj
ects
.Sub
mis
sion
s“1
”an
d“2
”fr
omro
und
3.
C = afis team D = 3M Cogent E = Neurotechnology F = Papillon G = Dermalog H = Hisign Bio-Info InstituteI = NEC J = Sonda K = Tiger IT L = Innovatrics M = SPEX O = ID SolutionsP = id3 Q = Morpho S = Decatur Industries T = BIO-key U = Aware V = AA Technology

26 FPVTE – FINGERPRINT MATCHING
ParticipantFNIR @ FPIR = 10−3
Letter Sub. #
1 30 0.1335C
2 31 0.1337
1 1 0.0197D
2 1 0.0197
1 16 0.0745E
2 15 0.0723
1 25 0.1111F
2 22 0.1082
1 24 0.1089G
2 23 0.1086
1 32 0.1576H
2 33 0.1607
1 7 0.0257I
2 8 0.0278
1 18 0.0786J
2 14 0.0712
1 21 0.0883K
2 20 0.0875
1 11 0.0625L
2 9 0.0351
1 35 0.2995M
2 34 0.2921
1 19 0.0818O
2 17 0.0766
1 29 0.1308P
2 28 0.1272
1 3 0.0222Q
2 4 0.0226
1 10 0.0571S
2 12 0.0650
1 36 NAT
2 13 0.0685
1 27 0.1218U
2 26 0.1178
1 6 0.0253V
2 5 0.0252
Table 7: Tabulation of results for Class A — Left Index, with anenrollment set size of 100 000. Letter refers to the participant’s let-ter code found on the footer of this page. Sub. # is an identifierused to differentiate between the two submissions each participantcould make. FNIR was computed at the score threshold that gaveFPIR = 10−3. NA indicates that the operations required to pro-duce the value could not be performed. The number to the left of avalue provides the value’s column-wise ranking, with the best per-formance shaded in green and the worst in pink.
ParticipantFNIR @ FPIR = 10−3
Letter Sub. #
1 30 0.1132C
2 29 0.1124
1 1 0.0190D
2 1 0.0190
1 15 0.0630E
2 14 0.0624
1 25 0.0933F
2 22 0.0903
1 24 0.0910G
2 23 0.0909
1 32 0.1230H
2 33 0.1249
1 5 0.0215I
2 3 0.0214
1 20 0.0708J
2 16 0.0643
1 18 0.0682K
2 19 0.0685
1 12 0.0505L
2 9 0.0295
1 36 0.2615M
2 35 0.2526
1 21 0.0776O
2 17 0.0675
1 31 0.1133P
2 28 0.1100
1 6 0.0218Q
2 3 0.0214
1 10 0.0442S
2 11 0.0503
1 34 0.1929T
2 13 0.0562
1 26 0.0996U
2 27 0.1007
1 8 0.0223V
2 7 0.0222
Table 8: Tabulation of results for Class A — Right Index, with anenrollment set size of 100 000. Letter refers to the participant’s lettercode found on the footer of this page. Sub. # is an identifier usedto differentiate between the two submissions each participant couldmake. FNIR was computed at the score threshold that gave FPIR =10−3. The number to the left of a value provides the value’s column-wise ranking, with the best performance shaded in green and theworst in pink.
C = afis team D = 3M Cogent E = Neurotechnology F = Papillon G = Dermalog H = Hisign Bio-Info InstituteI = NEC J = Sonda K = Tiger IT L = Innovatrics M = SPEX O = ID SolutionsP = id3 Q = Morpho S = Decatur Industries T = BIO-key U = Aware V = AA Technology

FPVTE – FINGERPRINT MATCHING 27
7.1.2 Two-Index Finger Identification
The accuracy of two-finger identification is shown with rank-sorted FNIR points in Figure 15, DET curves in Figure 16,CMC plots in Figure 17, and a table of FNIR points at a fixed FPIR in Table 9.
Some observations for Class A two-finger identification include (all FNIR values are at FPIR =10−3):
. The most accurate submissions were Q, V, D, and I.
. The most accurate submission Q achieved a FNIR of 0.27% searched against an enrollment set of 1.6 million subjects.
. The accuracy gap between the top performers and the second tier, while still measurable, was not as large as single-finger identification.
. Two-finger identification was far superior to single-finger identification and scaled to much larger enrollment sets.
. The CMC plots in Figure 17 flatten out faster than in single-finger identification. In most cases, the mate is withinthe top three candidates of the list or doesn’t appear at all. There were a few submissions that extend down to thetop five to ten candidates.
●
●
● ●
●
●
●●
●
●
●
●
●
● ●
●
●
●
●
●●
● ●
● ●
●●
●●
●
●
●●
0.005
0.010
0.020
0.050
Q1 Q2 V2 D1 D2 I2 V1 I1 L2 J1 J2 L1 S2 E2 E1 O2 O1 S1 K2 G2 P2 U1 U2 K1 T2 C1 P1 C2 F1 F2 G1 H2 H1 M2 M1 T1
Submission
FN
IR @
FP
IR =
10−3
● Left and Right Index
Figure 15: Rank-sorted FNIR @ FPIR = 10−3 for Class A — Two Index Fingers searching 30 000 subjects against 1 600 000subjects. Submissions “1” and “2” from round 3.
C = afis team D = 3M Cogent E = Neurotechnology F = Papillon G = Dermalog H = Hisign Bio-Info InstituteI = NEC J = Sonda K = Tiger IT L = Innovatrics M = SPEX O = ID SolutionsP = id3 Q = Morpho S = Decatur Industries T = BIO-key U = Aware V = AA Technology
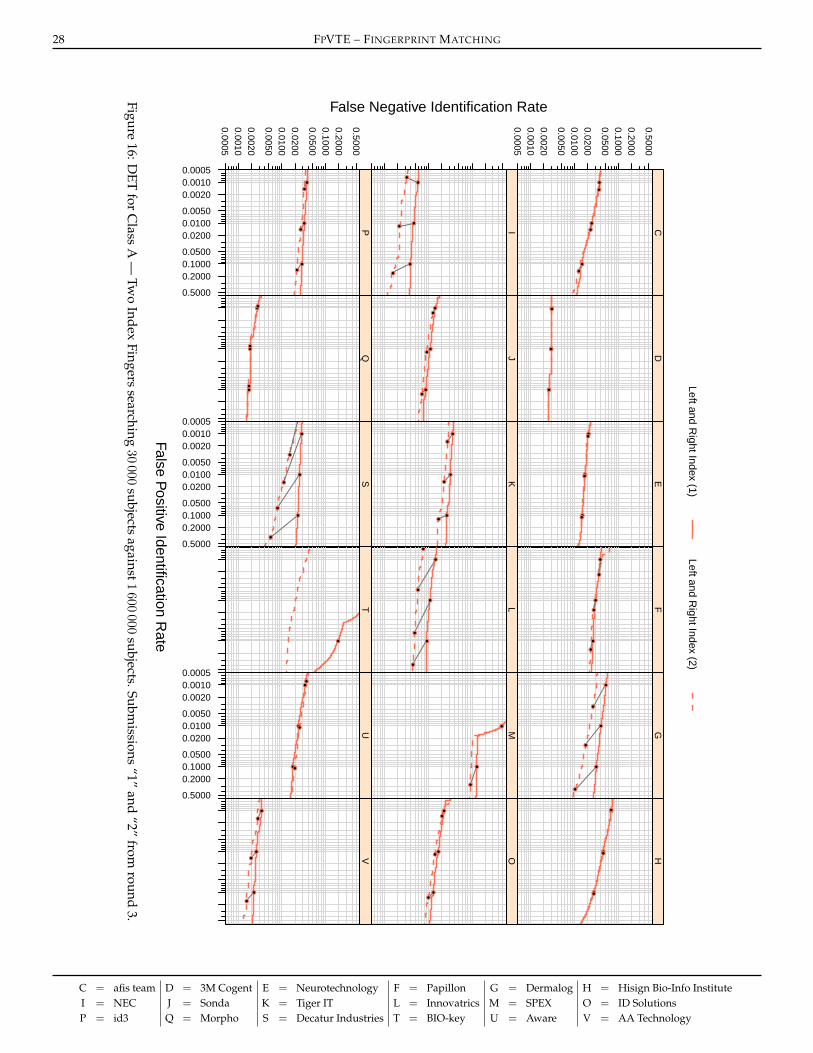
28 FPVTE – FINGERPRINT MATCHING
False Positive Identification R
ate
False Negative Identification Rate
0.00050.00100.0020
0.00500.01000.0200
0.05000.10000.2000
0.5000
0.00050.00100.0020
0.00500.01000.0200
0.05000.10000.2000
0.5000
●●
●●
●●
●●
P
● ●
● ●
●●
●●
Q
0.00050.00100.0020
0.00500.01000.0200
0.05000.10000.2000
0.5000
●
●
●
●
●
●
●
●
S●
●●
●
T
0.00050.00100.0020
0.00500.01000.0200
0.05000.10000.2000
0.5000
● ●
●●
● ●
● ●
U
●●
●●
●●
●
●
V
●
●
●
●
●
●
●
●
I
●●
●●
●●
●●
J
●●
●●
●
●●
●
K
●
●
●
●
●
●
●
●
L●●
●●
●●
●
●
M
●●
●●
●●
●●
O0.00050.00100.0020
0.00500.01000.0200
0.05000.10000.2000
0.5000
●●
●●
●●
●●
C
●●
●●●●
●●
D
●●
●●
●●●●
E
●●
●●
●●
●●
F
●
●
●
●
●
●
●
●
G
●●
●●
●●
●●
H
Left and Right Index (1)
Left and Right Index (2)
Figure16:D
ETfor
Class
A—
Two
IndexFingers
searching30000
subjectsagainst
1600000
subjects.Submissions
“1”and
“2”from
round3.
C = afis team D = 3M Cogent E = Neurotechnology F = Papillon G = Dermalog H = Hisign Bio-Info InstituteI = NEC J = Sonda K = Tiger IT L = Innovatrics M = SPEX O = ID SolutionsP = id3 Q = Morpho S = Decatur Industries T = BIO-key U = Aware V = AA Technology

FPVTE – FINGERPRINT MATCHING 29
Rank
Miss Rate
0.00
100.
0020
0.00
500.
0100
0.02
00
0.05
000.
1000
0.20
00
510
15
PQ
510
15
ST
510
15
UV
IJ
KL
MO
0.00
100.
0020
0.00
500.
0100
0.02
00
0.05
000.
1000
0.20
00C
DE
FG
H
Left
and
Righ
t Ind
ex (1
)Le
ft an
d Ri
ght I
ndex
(2)
Figu
re17
:CM
Cfo
rC
lass
A—
Two
Inde
xFi
nger
sse
arch
ing30000
subj
ects
agai
nst1
600000
subj
ects
.Sub
mis
sion
s“1
”an
d“2
”fr
omro
und
3.
C = afis team D = 3M Cogent E = Neurotechnology F = Papillon G = Dermalog H = Hisign Bio-Info InstituteI = NEC J = Sonda K = Tiger IT L = Innovatrics M = SPEX O = ID SolutionsP = id3 Q = Morpho S = Decatur Industries T = BIO-key U = Aware V = AA Technology

30 FPVTE – FINGERPRINT MATCHING
ParticipantFNIR @ FPIR = 10−3
Letter Sub. #
1 26 0.0368C
2 28 0.0374
1 4 0.0030D
2 4 0.0030
1 15 0.0207E
2 14 0.0202
1 29 0.0386F
2 30 0.0412
1 31 0.0515G
2 20 0.0311
1 33 0.0686H
2 32 0.0684
1 8 0.0058I
2 4 0.0030
1 10 0.0143J
2 10 0.0143
1 24 0.0360K
2 19 0.0286
1 12 0.0146L
2 9 0.0072
1 35 NAM
2 34 NA
1 17 0.0229O
2 16 0.0214
1 27 0.0370P
2 21 0.0333
1 1 0.0027Q
2 1 0.0027
1 18 0.0281S
2 13 0.0195
1 36 NAT
2 25 0.0366
1 22 0.0336U
2 23 0.0358
1 7 0.0034V
2 3 0.0028
Table 9: Tabulation of results for Class A — Left and Right Index, with an enrollment set size of 1 600 000. Letter refers to the participant’s letter codefound on the footer of this page. Sub. # is an identifier used to differentiate between the two submissions each participant could make. FNIR wascomputed at the score threshold that gave FPIR = 10−3. NA indicates that the operations required to produce the value could not be performed. Thenumber to the left of a value provides the value’s column-wise ranking, with the best performance shaded in green and the worst in pink.
C = afis team D = 3M Cogent E = Neurotechnology F = Papillon G = Dermalog H = Hisign Bio-Info InstituteI = NEC J = Sonda K = Tiger IT L = Innovatrics M = SPEX O = ID SolutionsP = id3 Q = Morpho S = Decatur Industries T = BIO-key U = Aware V = AA Technology

FPVTE – FINGERPRINT MATCHING 31
7.2 Class B
The accuracy results for Class B, which included four-finger, eight-finger, and ten-finger identification, are shown withrank-sorted FNIR points (based on ten finger results) in Figure 18, DET curves in Figure 19, CMC plots in Figure 20, andtables of FNIR points at fixed FPIR in Tables 10 through 13.
Some observations for Class B include (all FNIR values are at FPIR =10−3):
. The most accurate submissions with all ten fingers were I, Q, and D, with FNIRs ranging from 0.09% to 0.2%.
. The next level of submissions were V, E, L, J, O, and G, with FNIRs ranging from 0.24% to 0.4%. The separationbetween the top performers and next level of performers was noticeably lower as more fingers are used.
. Right slaps (FNIR = 0.45%, I2) were more accurate than left slaps (FNIR = 0.94%, I2).
. Four-finger identification (FNIR = 0.45%) performed worse than two-finger identification (FNIR = 0.27%), as re-ported in Subsubsection 7.1.2. Two potential causes for this result are that the submissions in Class B had to performsegmentation as part of the feature extraction process, and possibly a variation in image quality between the datasets.Further study will be needed to determine the primary reason four-finger slaps performed worse than two index fin-gers.
. The matching accuracy improved significantly going from four fingers to eight fingers.
. The best submission I2 achieved FNIRs as follows: left slap (0.94%), right slap (0.45%), left and right slaps (0.15%),and identification slaps (0.09%).
. The CMC plots in Figure 20 generally show very flat responses. This indicates that for most submissions, the mateis within the top three candidates on the list or the mate doesn’t appear on the list at all.
●●
●●
●●
●
●
● ●
● ●
● ●
● ●
● ●
● ●
●
●
●
●
●●
● ●
●●
●
●
●●
●●
●●
●●
●●
●●
●
●
●
●
● ●
● ●
● ●
● ●
●
●
●
●
●
●
●
●
●
●
●
●
●
● ●
●
● ●
●
●
●●
●●
●●
●●
●●
●●
●●
●●
●●
●
●
●
●
●
●
●
●
●
●
●
●●
●
● ●
● ●
● ●
● ●
0.001
0.002
0.005
0.010
0.020
0.050
0.100
I2 D2 I1 Q1 Q2 D1 E2 V2 V1 L1 J2 L2 O2 G2 O1 E1 J1 G1 U1 S1 S2 U2 H1 H2 M2 M1 F1 F2 C2 C1
Submission
FN
IR @
FP
IR =
10−3
● ● ● ●Identification Flats Left and Right Slap Left Slap Right Slap
Figure 18: Rank-sorted FNIR @ FPIR = 10−3 for Class B — Left Slap, Right Slap, Left and Right Slap, and IDFlats searching30 000 subjects against 3 000 000 subjects. Submissions “1” and “2” from round 3.
C = afis team D = 3M Cogent E = Neurotechnology F = Papillon G = Dermalog H = Hisign Bio-Info InstituteI = NEC J = Sonda K = Tiger IT L = Innovatrics M = SPEX O = ID SolutionsP = id3 Q = Morpho S = Decatur Industries T = BIO-key U = Aware V = AA Technology

32 FPVTE – FINGERPRINT MATCHING
False Positive Identification R
ate
False Negative Identification Rate
0.0005
0.0010
0.0020
0.0050
0.0100
0.0200
0.0500
0.1000
0.2000
0.0005
0.0010
0.0020
0.0050
0.0100
0.0200
0.0500
0.1000
0.2000
0.5000
●●
●●
●●
●●
●●
●●
●●
●●
●●
●●
●●
●●●
●●
●
O
●●
●●
●●
●●
● ●
●●
● ●
●●
● ●
●●
● ●
●●
● ●
●●
Q
0.0005
0.0010
0.0020
0.0050
0.0100
0.0200
0.0500
0.1000
0.2000
0.5000
● ●
●●●
●●
●●
●●
●●
●●
●●
●●
●●
●
●
●●
●●
●
●
●
●
S
●●●
●
●●
●●
●●●
●
●●
●●
●●
●
●
●●
●●
●●
●
●
U
0.0005
0.0010
0.0020
0.0050
0.0100
0.0200
0.0500
0.1000
0.2000
0.5000
●●
●●●●●●
●●
●●
●●
●●
●●
●●
●●
●●
●●
●●
●
●●
●
V
●
●
●
●●
●
●
●
●
●
●
●
●
●
●
●
●
●
●
●●
●
●
●
●
●
●
●
●
●
●
●
G
●●
●●
●●
●●
●●●●
●●
●●
●●●●
●●
●●
●●
●●
●●
●●
H
●
●
●
●
●
●
●
●●
●
●
●
●
●
●
●●
●●
I
●●
●
●●
●●
●
●●
●
●
●
●
●
●
●●
●
●
●●
●
●
●●
●
J
●●
● ●
●●
●●
●●
●●
●●
●●
●●● ●
● ●● ●
●●● ●
● ●● ●
L0.0005
0.0010
0.0020
0.0050
0.0100
0.0200
0.0500
0.1000
0.2000●
●
●●
●●
●●
●●
●●
●●
●●
●●
●●
●●
●●
●●
M
●●
●●
●
●●
●
●●
●●
●
●●
●
●●
●●
●
●●
●
●●
●●
●
●●
●
C
●
●
●
●●
●
●
●
●
●
●●
●●
●●
●●
●●
●●
●●
●●
●
●
●
●
D
●
●●
●●
●
●
●
●●●
●
●
●
●●●
●
●
●●●●
E●●
●●
●●●
●
●●●●
●●
●●
●●
F
Left Slap (1)
Left Slap (2)
Right S
lap (1) R
ight Slap (2)
Left and Right S
lap (1) Left and R
ight Slap (2)
Identification Flats (1)
Identification Flats (2)
Figure19:D
ETfor
Class
B—
LeftSlap,RightSlap,Leftand
RightSlap,and
IDFlats
searching30000
subjectsagainst
3000
000subjects.Subm
issions“1”
and“2”
fromround
3.
C = afis team D = 3M Cogent E = Neurotechnology F = Papillon G = Dermalog H = Hisign Bio-Info InstituteI = NEC J = Sonda K = Tiger IT L = Innovatrics M = SPEX O = ID SolutionsP = id3 Q = Morpho S = Decatur Industries T = BIO-key U = Aware V = AA Technology

FPVTE – FINGERPRINT MATCHING 33
Ran
k
Miss Rate
0.00
10
0.00
20
0.00
50
0.01
00
0.02
00
0.05
00
0.10
00
0.20
00
510
15
OQ
510
15
SU
510
15
V
GH
IJ
L
0.00
10
0.00
20
0.00
50
0.01
00
0.02
00
0.05
00
0.10
00
0.20
00M
CD
EF
Left
Sla
p (1
)Le
ft S
lap
(2)
Rig
ht S
lap
(1)
Rig
ht S
lap
(2)
Left
and
Rig
ht S
lap
(1)
Left
and
Rig
ht S
lap
(2)
Iden
tific
atio
n F
lats
(1)
Iden
tific
atio
n F
lats
(2)
Figu
re20
:CM
Cfo
rC
lass
B—
Left
Slap
,Rig
htSl
ap,L
efta
ndR
ight
Slap
,and
IDFl
ats
sear
chin
g30000
subj
ects
agai
nst3
000000
subj
ects
.Sub
mis
sion
s“1
”an
d“2
”fr
omro
und
3.
C = afis team D = 3M Cogent E = Neurotechnology F = Papillon G = Dermalog H = Hisign Bio-Info InstituteI = NEC J = Sonda K = Tiger IT L = Innovatrics M = SPEX O = ID SolutionsP = id3 Q = Morpho S = Decatur Industries T = BIO-key U = Aware V = AA Technology

34 FPVTE – FINGERPRINT MATCHING
ParticipantFNIR @ FPIR = 10−3
Letter Sub. #
1 22 0.0654C
2 21 0.0647
1 6 0.0163D
2 5 0.0142
1 13 0.0259E
2 7 0.0187
1 29 0.1684F
2 28 0.1681
1 18 0.0371G
2 17 0.0325
1 23 0.0998H
2 24 0.1008
1 4 0.0116I
2 1 0.0094
1 15 0.0287J
2 10 0.0236
1 16 0.0288L
2 14 0.0276
1 30 0.1736M
2 27 0.1634
1 12 0.0257O
2 11 0.0254
1 2 0.0098Q
2 3 0.0099
1 25 0.1089S
2 26 0.1133
1 20 0.0500U
2 19 0.0461
1 9 0.0192V
2 8 0.0190
Table 10: Tabulation of results for Class B — Left Slap, with an enroll-ment set size of 3 000 000. Letter refers to the participant’s letter codefound on the footer of this page. Sub. # is an identifier used to differ-entiate between the two submissions each participant could make.FNIR was computed at the score threshold that gave FPIR = 10−3.The number to the left of a value provides the value’s column-wiseranking, with the best performance shaded in green and the worst inpink.
ParticipantFNIR @ FPIR = 10−3
Letter Sub. #
1 24 0.0403C
2 23 0.0392
1 6 0.0072D
2 2 0.0052
1 13 0.0151E
2 7 0.0083
1 29 0.1222F
2 28 0.1220
1 18 0.0212G
2 16 0.0198
1 25 0.0641H
2 26 0.0647
1 5 0.0058I
2 1 0.0045
1 14 0.0156J
2 10 0.0126
1 15 0.0167L
2 17 0.0202
1 30 0.1259M
2 27 0.1155
1 12 0.0142O
2 11 0.0132
1 3 0.0057Q
2 3 0.0057
1 21 0.0369S
2 22 0.0381
1 19 0.0266U
2 20 0.0273
1 8 0.0106V
2 9 0.0110
Table 11: Tabulation of results for Class B — Right Slap, with anenrollment set size of 3 000 000. Letter refers to the participant’s lettercode found on the footer of this page. Sub. # is an identifier usedto differentiate between the two submissions each participant couldmake. FNIR was computed at the score threshold that gave FPIR =10−3. The number to the left of a value provides the value’s column-wise ranking, with the best performance shaded in green and theworst in pink.
C = afis team D = 3M Cogent E = Neurotechnology F = Papillon G = Dermalog H = Hisign Bio-Info InstituteI = NEC J = Sonda K = Tiger IT L = Innovatrics M = SPEX O = ID SolutionsP = id3 Q = Morpho S = Decatur Industries T = BIO-key U = Aware V = AA Technology

FPVTE – FINGERPRINT MATCHING 35
ParticipantFNIR @ FPIR = 10−3
Letter Sub. #
1 30 NAC
2 29 NA
1 6 0.0031D
2 5 0.0024
1 15 0.0063E
2 10 0.0049
1 28 0.0910F
2 26 0.0901
1 18 0.0106G
2 17 0.0084
1 23 0.0349H
2 24 0.0361
1 3 0.0022I
2 1 0.0015
1 16 0.0068J
2 9 0.0047
1 12 0.0054L
2 14 0.0062
1 27 0.0904M
2 25 0.0882
1 13 0.0057O
2 11 0.0051
1 2 0.0021Q
2 3 0.0022
1 21 0.0160S
2 22 0.0190
1 20 0.0139U
2 19 0.0124
1 7 0.0036V
2 7 0.0036
Table 12: Tabulation of results for Class B — Left and Right Slap, withan enrollment set size of 3 000 000. Letter refers to the participant’sletter code found on the footer of this page. Sub. # is an identifierused to differentiate between the two submissions each participantcould make. FNIR was computed at the score threshold that gaveFPIR = 10−3. NA indicates that the operations required to pro-duce the value could not be performed. The number to the left of avalue provides the value’s column-wise ranking, with the best per-formance shaded in green and the worst in pink.
ParticipantFNIR @ FPIR = 10−3
Letter Sub. #
1 30 NAC
2 29 NA
1 6 0.0020D
2 2 0.0012
1 16 0.0043E
2 7 0.0024
1 27 0.0591F
2 27 0.0591
1 18 0.0062G
2 14 0.0040
1 23 0.0203H
2 24 0.0204
1 2 0.0012I
2 1 0.0009
1 17 0.0049J
2 11 0.0033
1 10 0.0031L
2 11 0.0033
1 26 0.0543M
2 25 0.0515
1 15 0.0041O
2 13 0.0035
1 2 0.0012Q
2 2 0.0012
1 20 0.0108S
2 21 0.0136
1 19 0.0099U
2 22 0.0141
1 9 0.0027V
2 7 0.0024
Table 13: Tabulation of results for Class B — Identification Flats, withan enrollment set size of 3 000 000. Letter refers to the participant’sletter code found on the footer of this page. Sub. # is an identifierused to differentiate between the two submissions each participantcould make. FNIR was computed at the score threshold that gaveFPIR = 10−3. NA indicates that the operations required to pro-duce the value could not be performed. The number to the left of avalue provides the value’s column-wise ranking, with the best per-formance shaded in green and the worst in pink.
C = afis team D = 3M Cogent E = Neurotechnology F = Papillon G = Dermalog H = Hisign Bio-Info InstituteI = NEC J = Sonda K = Tiger IT L = Innovatrics M = SPEX O = ID SolutionsP = id3 Q = Morpho S = Decatur Industries T = BIO-key U = Aware V = AA Technology

36 FPVTE – FINGERPRINT MATCHING
7.3 Class C
The accuracy results for Class C, which included ten-finger identification for plain and rolled impression types usingscanned ink and livescan data, are shown with rank-sorted FNIR points (based on ten-finger rolled-to-rolled impressionresults) in Figure 21, DET curves in Figure 22, CMC plots in Figure 23, and tables of FNIR points at a fixed FPIR in Tables 14through 16.
Some observations for Class C include (all FNIR values are at FPIR =10−3):
. The most accurate submissions were I, Q, D, and V (ten-finger rolled-to-rolled), with FNIRs ranging from 0.1% to0.19% for ten-finger plain impressions and ten-finger rolled impressions.
. There was not a clear difference between ten-finger plain-to-plain and ten-finger rolled-to-rolled results. This is a bitof a surprise, as the ten-finger plain data had to be segmented by the submission and the ten-finger rolled data didnot. It also is a surprise after the observations of lower accuracy seen in Class B four-finger slaps versus the ClassA two index finger accuracy (Subsection 7.2). It might be interesting to perform a similar Class C test with onlyfour-finger slaps to see if the results are similar to Class B four-finger slap results.
. The second level of performers were E2, J, O, and V (ten-finger plain) with FNIRs ranging from 0.25% to 0.50% forten-finger plain-to-plain and ten-finger rolled-to-rolled impressions.
. The best performers were able to handle both rolled and plain impression images with little variation in FNIR, therewas a slight decrease when comparing plain-to-rolled impressions.
. Similar to Class B, the Class C CMC plots in Figure 23 are very flat, indicating the mate is within the top two positionson the candidate list or it is completely missed.
●●
●●
●●
●●
●●
●●
●
●
●
●
●
●
●●
●●●
●
● ●
●●
●
●
●
●
●
●
●
●
●●
●●
●●
●
●
●●●
●
●
●
●
●
●
●
●● ●●
●●
●● ●●
●
●
●
●●
●●
●
●
●●
●
●
●
●
●
●
●
●
● ●
● ●
● ●
0.002
0.005
0.010
0.020
0.050
0.100
0.200
I1 I2 Q2 D1 Q1 V1 D2 V2 J2 O2 O1 E2 J1 L2 C2 C1 L1 E1 H2 H1 G2 U2 U1 G1 F1 F2 M2 M1 S1 S2
Submission
FN
IR @
FP
IR =
10−3
● ● ●Ten−Finger Plain−to−Plain Ten−Finger Plain−to−Rolled Ten−Finger Rolled−to−Rolled
Figure 21: Rank-sorted FNIR @ FPIR = 10−3 for Class C — Ten-Finger plain-to-plain, rolled-to-rolled, and plain-to-rolledsearching 30 000 subjects against 5 000 000 subjects. Submissions “1” and “2” from round 3.
C = afis team D = 3M Cogent E = Neurotechnology F = Papillon G = Dermalog H = Hisign Bio-Info InstituteI = NEC J = Sonda K = Tiger IT L = Innovatrics M = SPEX O = ID SolutionsP = id3 Q = Morpho S = Decatur Industries T = BIO-key U = Aware V = AA Technology

FPVTE – FINGERPRINT MATCHING 37
Fals
e P
ositi
ve Id
entif
icat
ion
Rat
e
False Negative Identification Rate
0.00
050.
0010
0.00
20
0.00
500.
0100
0.02
00
0.05
000.
1000
0.20
00
0.50
00
0.0005
0.0010
0.0020
0.0050
0.0100
0.0200
0.0500
0.1000
0.2000
0.5000
●●
●●●
●●
●●
●●
●●
●●
●●
●●
●●
●●
O
●●
●●
●●
●●
● ●
●●
●●● ●
●●
●●●
●
●●
Q
0.0005
0.0010
0.0020
0.0050
0.0100
0.0200
0.0500
0.1000
0.2000
0.5000
●
●
●
●
●
●
●
●
●
●
●
●
●
●
●
●
●
●
●
●
S
●●●
●
●●
●●●
●
● ●
●●● ●
● ●
●●● ●
U
0.0005
0.0010
0.0020
0.0050
0.0100
0.0200
0.0500
0.1000
0.2000
0.5000
●●●
●
● ●
●●
●●
●●
●
●●
V
●●
● ●
●●
●
●
●
●
●●
●
●
●
●
●●
●
●●
●
●
●
G
● ●● ●
● ●
● ●● ●
● ●● ●
● ●
H
●●
●●
●●
●●
●●
●● ●
●●
●●
●
●
I
●
●●●
●
●
●
●
●
●●
●
●
●
●
●●
●
●
●
●
●
J
● ●
●●
● ●
●●
●●
● ●
● ●
● ●
●●
L0.
0005
0.00
100.
0020
0.00
500.
0100
0.02
00
0.05
000.
1000
0.20
00
0.50
00
●●
●●
●●
●●
●●
M●
●●
●●
● ●●●
●●
● ●
●
●
C
●●
●●
●● ●
●●
●
●
●
●●
●●
●
●
D
●●
●●
●
E
●●
●●
●
●●
●
●●
●●
F
Ten
−F
inge
r P
lain
−to
−P
lain
(1)
Ten
−F
inge
r P
lain
−to
−P
lain
(2)
Ten
−F
inge
r R
olle
d−to
−R
olle
d (1
) T
en−
Fin
ger
Rol
led−
to−
Rol
led
(2)
Ten
−F
inge
r P
lain
−to
−R
olle
d (1
) T
en−
Fin
ger
Pla
in−
to−
Rol
led
(2)
Figu
re22
:DET
for
Cla
ssC
—Te
n-Fi
nger
plai
n-to
-pla
in,r
olle
d-to
-rol
led,
and
plai
n-to
-rol
led
sear
chin
g30000
subj
ects
agai
nst5
000000
subj
ects
.Sub
mis
-si
ons
“1”
and
“2”
from
roun
d3.
C = afis team D = 3M Cogent E = Neurotechnology F = Papillon G = Dermalog H = Hisign Bio-Info InstituteI = NEC J = Sonda K = Tiger IT L = Innovatrics M = SPEX O = ID SolutionsP = id3 Q = Morpho S = Decatur Industries T = BIO-key U = Aware V = AA Technology

38 FPVTE – FINGERPRINT MATCHING
Rank
Miss Rate
0.0010
0.0020
0.0050
0.0100
0.0200
0.0500
0.1000
0.2000
510
15
OQ
510
15
SU
510
15
V
GH
IJ
L
0.0010
0.0020
0.0050
0.0100
0.0200
0.0500
0.1000
0.2000M
CD
EF
Ten−F
inger Plain−
to−P
lain (1)Ten−
Finger P
lain−to−
Plain (2)
Ten−F
inger Rolled−
to−R
olled (1)Ten−
Finger R
olled−to−
Rolled (2)
Ten−F
inger Plain−
to−R
olled (1)Ten−
Finger P
lain−to−
Rolled (2)
Figure23:C
MC
forC
lassC
—Ten-Finger
plain-to-plain,rolled-to-rolled,andplain-to-rolled
searching30000
subjectsagainst
5000
000subjects.Subm
is-sions
“1”and
“2”from
round3.
C = afis team D = 3M Cogent E = Neurotechnology F = Papillon G = Dermalog H = Hisign Bio-Info InstituteI = NEC J = Sonda K = Tiger IT L = Innovatrics M = SPEX O = ID SolutionsP = id3 Q = Morpho S = Decatur Industries T = BIO-key U = Aware V = AA Technology

FPVTE – FINGERPRINT MATCHING 39
ParticipantFNIR @ FPIR = 10−3
Letter Sub. #
1 30 NAC
2 24 0.0711
1 6 0.0015D
2 2 0.0011
1 14 0.0088E
2 13 0.0048
1 25 0.0734F
2 25 0.0734
1 23 0.0368G
2 20 0.0276
1 20 0.0276H
2 19 0.0275
1 4 0.0013I
2 1 0.0010
1 12 0.0047J
2 10 0.0027
1 16 0.0102L
2 15 0.0095
1 28 0.0934M
2 27 0.0826
1 9 0.0025O
2 10 0.0027
1 2 0.0011Q
2 4 0.0013
1 22 0.0311S
2 29 0.1680
1 18 0.0163U
2 17 0.0155
1 7 0.0024V
2 7 0.0024
Table 14: Tabulation of results for Class C — Ten-Finger Plain-to-Plain, with an enrollment set size of 5 000 000. Letter refers to theparticipant’s letter code found on the footer of this page. Sub. # isan identifier used to differentiate between the two submissions eachparticipant could make. FNIR was computed at the score thresholdthat gave FPIR = 10−3. NA indicates that the operations requiredto produce the value could not be performed. The number to the leftof a value provides the value’s column-wise ranking, with the bestperformance shaded in green and the worst in pink.
ParticipantFNIR @ FPIR = 10−3
Letter Sub. #
1 16 0.0094C
2 15 0.0085
1 4 0.0015D
2 7 0.0018
1 18 0.0106E
2 12 0.0050
1 25 0.0536F
2 25 0.0536
1 24 0.0447G
2 21 0.0333
1 20 0.0201H
2 19 0.0199
1 1 0.0013I
2 2 0.0014
1 13 0.0051J
2 9 0.0033
1 17 0.0097L
2 14 0.0083
1 28 0.0783M
2 27 0.0716
1 11 0.0034O
2 9 0.0033
1 5 0.0017Q
2 2 0.0014
1 29 0.0860S
2 30 0.2462
1 23 0.0358U
2 22 0.0351
1 5 0.0017V
2 8 0.0019
Table 15: Tabulation of results for Class C — Ten-Finger Rolled-to-Rolled, with an enrollment set size of 5 000 000. Letter refers to theparticipant’s letter code found on the footer of this page. Sub. # isan identifier used to differentiate between the two submissions eachparticipant could make. FNIR was computed at the score thresholdthat gave FPIR = 10−3. The number to the left of a value providesthe value’s column-wise ranking, with the best performance shadedin green and the worst in pink.
C = afis team D = 3M Cogent E = Neurotechnology F = Papillon G = Dermalog H = Hisign Bio-Info InstituteI = NEC J = Sonda K = Tiger IT L = Innovatrics M = SPEX O = ID SolutionsP = id3 Q = Morpho S = Decatur Industries T = BIO-key U = Aware V = AA Technology

40 FPVTE – FINGERPRINT MATCHING
ParticipantFNIR @ FPIR = 10−3
Letter Sub. #
1 17 0.0149C
2 18 0.0169
1 6 0.0028D
2 3 0.0018
1 16 0.0137E
2 12 0.0056
1 27 0.2514F
2 27 0.2514
1 24 0.0649G
2 23 0.0521
1 20 0.0291H
2 19 0.0285
1 2 0.0014I
2 1 0.0011
1 13 0.0071J
2 7 0.0034
1 15 0.0136L
2 14 0.0129
1 30 0.3067M
2 27 0.2514
1 10 0.0041O
2 8 0.0036
1 4 0.0020Q
2 5 0.0022
1 25 0.1017S
2 26 0.2366
1 22 0.0378U
2 21 0.0295
1 11 0.0052V
2 9 0.0039
Table 16: Tabulation of results for Class C — Ten-Finger Plain-to-Rolled, with an enrollment set size of 5 000 000. Letter refers to the participant’s lettercode found on the footer of this page. Sub. # is an identifier used to differentiate between the two submissions each participant could make. FNIR wascomputed at the score threshold that gave FPIR = 10−3. The number to the left of a value provides the value’s column-wise ranking, with the bestperformance shaded in green and the worst in pink.
C = afis team D = 3M Cogent E = Neurotechnology F = Papillon G = Dermalog H = Hisign Bio-Info InstituteI = NEC J = Sonda K = Tiger IT L = Innovatrics M = SPEX O = ID SolutionsP = id3 Q = Morpho S = Decatur Industries T = BIO-key U = Aware V = AA Technology

FPVTE – FINGERPRINT MATCHING 41
8 Accuracy/Search Time Tradeoff
This section examines the tradeoff between FNIR and the amount of time each submission needed to perform identificationsearches. The only time restriction placed on the submissions were they must complete searches before a maximum timelimit (Class A: 500 seconds, Class B/C: 90 seconds). NIST allowed for and encouraged two submissions per round. Theintent of this decision was to demonstrate the tradeoff between accuracy and speed, but there was no requirement that thesame basic algorithm be used for the intended “fast” and “slow” submission. It was possible that two completely differentalgorithmic approaches were used by a participant, which could introduce other factors when comparing accuracy tosearch time for a given participant. As such, the two submissions are simply labeled “1” and “2” in this report. The timingtables shown in this section are based on the detailed timing tables in Appendix C that show the timing for each stage ofidentification.
In addition to the accuracy/timing tradeoffs plots and timing tables in this section, Appendix E contains a full set oftables that show timing changes that occurred between the last two rounds of submissions. Those tables provide moredata to analyze tradeoffs between search time and accuracy. Again, the algorithm could have changed from one round ofsubmissions to the next, but it is generally assumed that the basic algorithmic approach stayed the same, while “controls”were tweaked to improve accuracy.
One general observation noticed across classes of participation was that increased search times are not a guarantee ofincreased accuracy. This turned out to be inconsistent across the test. In general, most submissions obtain some improve-ment in accuracy with increased search times, but most gains are modest, and a few cases had no gain or a slight loss inaccuracy. There are other cases where submissions decreased search time yet still improved accuracy.
It might be useful in future evaluations to encourage competition over extremely fast searches and see which submissionshave a search time vs accuracy advantage, as opposed to tweaking for maximum accuracy, as was done in the currentFpVTE protocol.
C = afis team D = 3M Cogent E = Neurotechnology F = Papillon G = Dermalog H = Hisign Bio-Info InstituteI = NEC J = Sonda K = Tiger IT L = Innovatrics M = SPEX O = ID SolutionsP = id3 Q = Morpho S = Decatur Industries T = BIO-key U = Aware V = AA Technology

42 FPVTE – FINGERPRINT MATCHING
8.1 Class A
Tabulated comparisons of identification times for index finger identification submissions are shown in Tables 17 and 18.The search times shown in these tables are from the “Total/One” column in Tables 24 through 29 included in Appendix C.For reference, the FNIR values from Section 7 are reprinted to the right of the search times. Class A tables were split intotwo groups. The first group includes submissions that performed searches on average in less than 20 seconds, and thesecond includes those that took, on average, 20 seconds or longer.
The tables were used to create scatter plots showing accuracy, search times, and search template creation times. Thoseplots are shown in Figures 24 through 29.
Some observations for Class A identification times include:
. For single index fingers, there was essentially no accuracy improvement observed with larger search times.
. For two index fingers, there was improvement shown by some participants with increased search time. The overallbenefit might depend on the application.
. It is difficult to compare single-finger identification results to two-finger identification results here, as the enrollmentset sizes used were not the same (100 000 and 1.6 million, respectively).
. The number of processes running (one or ten) didn’t appear to have a major effect on throughput for Class A singleindex fingers, and only a slight increase in processing time was observed for two-finger searches. See Appendix Cand Appendix D for complete details.
. Tables 50 through 52 in Appendix E and Figures 30 through 35 show differences between the last two rounds ofsubmissions. Most submissions lowered FNIR for single finger but required longer search times. The results for twoindex fingers were not as consistent. Most lowered FNIR, but some had a significant increase in search time for littlegain in FNIR. While it is not known what changes were made between submissions, there is some indication thathigh accuracy can be achieved with some of the fast submissions. The absolute best accuracy is achieved by slightlyslower submissions.
C = afis team D = 3M Cogent E = Neurotechnology F = Papillon G = Dermalog H = Hisign Bio-Info InstituteI = NEC J = Sonda K = Tiger IT L = Innovatrics M = SPEX O = ID SolutionsP = id3 Q = Morpho S = Decatur Industries T = BIO-key U = Aware V = AA Technology
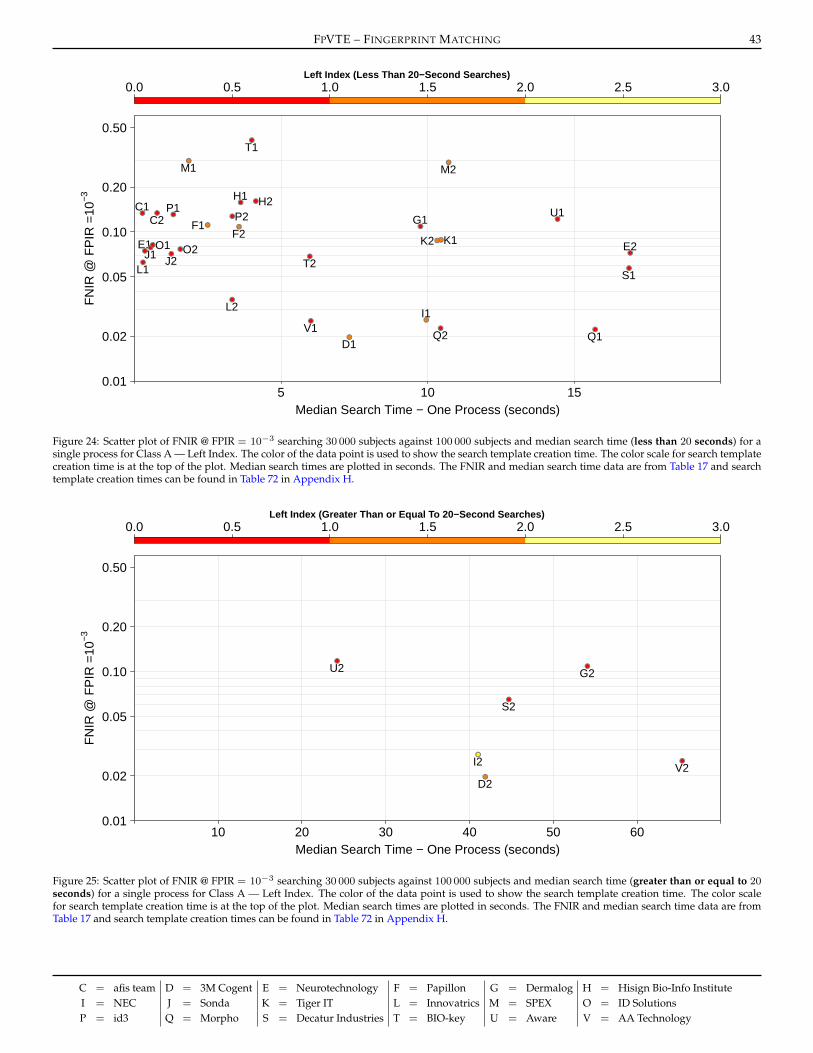
FPVTE – FINGERPRINT MATCHING 43
Left Index (Less Than 20−Second Searches)
Median Search Time − One Process (seconds)
FN
IR @
FP
IR =
10−3
0.01
0.02
0.05
0.10
0.20
0.50
5 10 15
H2
K1O1 O2
P2C1
E1 E2
G1
H1
I1
P1 U1F1
K2
C2
D1
F2
J1 J2L1
L2
M1 M2
Q1Q2
S1
T1
T2
V1
● ●
●
● ●
● ● ●
● ●
●
●●
●●
●
●
● ●
●●
● ●
●●
●
●
●
●
●
0.0 0.5 1.0 1.5 2.0 2.5 3.0
Figure 24: Scatter plot of FNIR @ FPIR = 10−3 searching 30 000 subjects against 100 000 subjects and median search time (less than 20 seconds) for asingle process for Class A — Left Index. The color of the data point is used to show the search template creation time. The color scale for search templatecreation time is at the top of the plot. Median search times are plotted in seconds. The FNIR and median search time data are from Table 17 and searchtemplate creation times can be found in Table 72 in Appendix H.
Left Index (Greater Than or Equal To 20−Second Searches)
Median Search Time − One Process (seconds)
FN
IR @
FP
IR =
10−3
0.01
0.02
0.05
0.10
0.20
0.50
10 20 30 40 50 60
D2
G2
I2
S2
U2
V2●
●
●
●
●
●
0.0 0.5 1.0 1.5 2.0 2.5 3.0
Figure 25: Scatter plot of FNIR @ FPIR = 10−3 searching 30 000 subjects against 100 000 subjects and median search time (greater than or equal to 20seconds) for a single process for Class A — Left Index. The color of the data point is used to show the search template creation time. The color scalefor search template creation time is at the top of the plot. Median search times are plotted in seconds. The FNIR and median search time data are fromTable 17 and search template creation times can be found in Table 72 in Appendix H.
C = afis team D = 3M Cogent E = Neurotechnology F = Papillon G = Dermalog H = Hisign Bio-Info InstituteI = NEC J = Sonda K = Tiger IT L = Innovatrics M = SPEX O = ID SolutionsP = id3 Q = Morpho S = Decatur Industries T = BIO-key U = Aware V = AA Technology

44 FPVTE – FINGERPRINT MATCHING
Right Index (Less Than 20−Second Searches)
Median Search Time − One Process (seconds)
FN
IR @
FP
IR =
10−3
0.01
0.02
0.05
0.10
0.20
0.50
5 10 15
F2
H2
J1 K1O2
Q2
C1 H1
O1
P1
Q1
U1F1 G1
I1
K2
C2
D1
E1 E2J2L1
L2
M1 M2
P2
S1
T1
T2
V1
● ●
●
● ●
● ● ●
● ●
●
●●
●●
●
●
● ●
●
●
● ●
●●
●
●
●
●
●
0.0 0.5 1.0 1.5 2.0 2.5 3.0
Figure 26: Scatter plot of FNIR @ FPIR = 10−3 searching 30 000 subjects against 100 000 subjects and median search time (less than 20 seconds) for asingle process. The color of the data point is used to show the search template creation time. The color scale for search template creation time is at thetop of the plot. Median search times are plotted in seconds. The FNIR and median search time data are from Table 17 and search template creation timescan be found in Table 73 in Appendix H.
Right Index (Greater Than or Equal To 20−Second Searches)
Median Search Time − One Process (seconds)
FN
IR @
FP
IR =
10−3
0.01
0.02
0.05
0.10
0.20
0.50
10 20 30 40 50 60
D2
G2
I2
S2
U2
V2●
●
●
●
●
●
0.0 0.5 1.0 1.5 2.0 2.5 3.0
Figure 27: Scatter plot of FNIR @ FPIR = 10−3 searching 30 000 subjects against 100 000 subjects and median search time (greater than or equal to 20seconds) for a single process for Class A — Right Index. The color of the data point is used to show the search template creation time. The color scalefor search template creation time is at the top of the plot. Median search times are plotted in seconds. The FNIR and median search time data are fromTable 17 and search template creation times can be found in Table 73 in Appendix H.
C = afis team D = 3M Cogent E = Neurotechnology F = Papillon G = Dermalog H = Hisign Bio-Info InstituteI = NEC J = Sonda K = Tiger IT L = Innovatrics M = SPEX O = ID SolutionsP = id3 Q = Morpho S = Decatur Industries T = BIO-key U = Aware V = AA Technology

FPVTE – FINGERPRINT MATCHING 45
Left and Right Index (Less Than 20−Second Searches)
Median Search Time − One Process (seconds)
FN
IR @
FP
IR =
10−3
0.001
0.002
0.005
0.010
0.020
0.050
0.100
5 10 15
K1
O1
C1 C2
E1
G1
I1
J1L1
V1
● ●
●
●
●
●
●
●
●
●
0 1 2 3 4 5
Figure 28: Scatter plot of FNIR @ FPIR = 10−3 searching 30 000 subjects against 1 600 000 subjects and median search time (less than 20 seconds) fora single process for Class A — Left and Right Index. The color of the data point is used to show the search template creation time. The color scale forsearch template creation time is at the top of the plot. Median search times are plotted in seconds. The FNIR and median search time data are fromTable 18 and search template creation times can be found in Table 74 in Appendix H.
Left and Right Index (Greater Than or Equal To 20−Second Searches)
Median Search Time − One Process (seconds)
FN
IR @
FP
IR =
10−3
0.001
0.002
0.005
0.010
0.020
0.050
0.100
100 200 300 400 500
F2
L2
D2
E2
F1
Q2
U2
V2
S1T2
D1
G2
H1 H2
I2
J2
K2
O2
P1 P2
Q1
S2
U1
● ●
●
●●
●
● ●
●
●
●
●
●
●●
●●
●
●
●●
●
●
0 1 2 3 4 5
Figure 29: Scatter plot of FNIR @ FPIR = 10−3 searching 30 000 subjects against 1 600 000 subjects and median search time (greater than or equal to 20seconds) for a single process for Class A — Left and Right Index. The color of the data point is used to show the search template creation time. The colorscale for search template creation time is at the top of the plot. Median search times are plotted in seconds. The FNIR and median search time data arefrom Table 18 and search template creation times can be found in Table 74 in Appendix H.
C = afis team D = 3M Cogent E = Neurotechnology F = Papillon G = Dermalog H = Hisign Bio-Info InstituteI = NEC J = Sonda K = Tiger IT L = Innovatrics M = SPEX O = ID SolutionsP = id3 Q = Morpho S = Decatur Industries T = BIO-key U = Aware V = AA Technology

46 FPVTE – FINGERPRINT MATCHING
+ +
−
− −
− −−
+ +
−
−−
− − + +
−
− −
−
+
−
0.02
0.05
0.10
0.20
C1 C2 D1 E1 E2 F1 F2 G1 H1 H2 I1 J1 J2 L1 L2 O1 O2 P2 Q1 Q2 S1 U1 V1
Submission
FN
IR @
FP
IR =
10−3
0 5
Left Index (Less Than 20−Second Searches)
Figure 30: Plots showing difference in FNIR @ FPIR = 10−3 searching 30 000 subjects against 1 600 000 subjects and difference in search times, for asingle search process, between round 2 and round 3 submissions for Class A — Left Index. The “+” symbol indicates that FNIR increased from round 2to round 3 and “-” indicates a decrease in FNIR. The color of the bar shows the change in search time. The color scale for difference in search time is atthe top of the plot and the units are in seconds. The data for the plots are taken from the tables in Appendix E.
−
−
+
−
−
0.02
0.05
0.10
D2 G2 I2 S2 V2
Submission
FN
IR @
FP
IR =
10−3
10 20 30
Left Index (Greater Than or Equal To 20−Second Searches)
Figure 31: Plots showing difference in FNIR @ FPIR = 10−3 searching 30 000 subjects against 1 600 000 subjects and difference in search times, for asingle search process, between round 2 and round 3 submissions for Class A — Left Index. The “+” symbol indicates that FNIR increased from round 2to round 3 and “-” indicates a decrease in FNIR. The color of the bar shows the change in search time. The color scale for difference in search time is atthe top of the plot and the units are in seconds. The data for the plots are taken from the tables in Appendix E.
C = afis team D = 3M Cogent E = Neurotechnology F = Papillon G = Dermalog H = Hisign Bio-Info InstituteI = NEC J = Sonda K = Tiger IT L = Innovatrics M = SPEX O = ID SolutionsP = id3 Q = Morpho S = Decatur Industries T = BIO-key U = Aware V = AA Technology

FPVTE – FINGERPRINT MATCHING 47
+ +
−
− −
− − −+ +
−
−− − − +
+
−
− −
−
+
−
−
0.02
0.05
0.10
0.20
C1 C2 D1 E1 E2 F1 F2 G1 H1 H2 I1 J1 J2 L1 L2 O1 O2 P2 Q1 Q2 S1 T1 U1 V1
Submission
FN
IR @
FP
IR =
10−3
−5 0 5
Right Index (Less Than 20−Second Searches)
Figure 32: Plots showing difference in FNIR @ FPIR = 10−3 searching 30 000 subjects against 1 600 000 subjects and difference in search times, for asingle search process, between round 2 and round 3 submissions for Class A — Right Index. The “+” symbol indicates that FNIR increased from round2 to round 3 and “-” indicates a decrease in FNIR. The color of the bar shows the change in search time. The color scale for difference in search time is atthe top of the plot and the units are in seconds. The data for the plots are taken from the tables in Appendix E.
−
−
−
−
−
0.02
0.05
0.10
D2 G2 I2 S2 V2
Submission
FN
IR @
FP
IR =
10−3
10 20 30
Right Index (Greater Than or Equal To 20−Second Searches)
Figure 33: Plots showing difference in FNIR @ FPIR = 10−3 searching 30 000 subjects against 1 600 000 subjects and difference in search times, for asingle search process, between round 2 and round 3 submissions for Class A — Right Index. The “+” symbol indicates that FNIR increased from round2 to round 3 and “-” indicates a decrease in FNIR. The color of the bar shows the change in search time. The color scale for difference in search time is atthe top of the plot and the units are in seconds. The data for the plots are taken from the tables in Appendix E.
C = afis team D = 3M Cogent E = Neurotechnology F = Papillon G = Dermalog H = Hisign Bio-Info InstituteI = NEC J = Sonda K = Tiger IT L = Innovatrics M = SPEX O = ID SolutionsP = id3 Q = Morpho S = Decatur Industries T = BIO-key U = Aware V = AA Technology

48 FPVTE – FINGERPRINT MATCHING
+ +
−
−
−
−+
−0.005
0.010
0.020
0.050
0.100
C1 C2 G1 I1 J1 L1 O1 V1
Submission
FN
IR @
FP
IR =
10−3
−40 −30 −20 −10 0
Left and Right Index (Less Than 20−Second Searches)
Figure 34: Plots showing difference in FNIR @ FPIR = 10−3 searching 30 000 subjects against 1 600 000 subjects and difference in search times, for asingle search process, between round 2 and round 3 submissions for Class A — Left and Right Index. The “+” symbol indicates that FNIR increasedfrom round 2 to round 3 and “-” indicates a decrease in FNIR. The color of the bar shows the change in search time. The color scale for difference insearch time is at the top of the plot and the units are in seconds. The data for the plots are taken from the tables in Appendix E.
−−
− −
− +−
+ +
−
+
−
+
−
− −
−−
−
−
−0.005
0.010
0.020
0.050
0.100
0.200
D1 D2 E1 E2 F1 F2 G2 H1 H2 I2 J2 L2 O2 P2 Q1 Q2 S1 S2 U1 U2 V2
Submission
FN
IR @
FP
IR =
10−3
0 100 200 300
Left and Right Index (Greater Than or Equal To 20−Second Searches)
Figure 35: Plots showing difference in FNIR @ FPIR = 10−3 searching 30 000 subjects against 1 600 000 subjects and difference in search times, for asingle search process, between round 2 and round 3 submissions for Class A — Left and Right Index. The “+” symbol indicates that FNIR increasedfrom round 2 to round 3 and “-” indicates a decrease in FNIR. The color of the bar shows the change in search time. The color scale for difference insearch time is at the top of the plot and the units are in seconds. The data for the plots are taken from the tables in Appendix E.
C = afis team D = 3M Cogent E = Neurotechnology F = Papillon G = Dermalog H = Hisign Bio-Info InstituteI = NEC J = Sonda K = Tiger IT L = Innovatrics M = SPEX O = ID SolutionsP = id3 Q = Morpho S = Decatur Industries T = BIO-key U = Aware V = AA Technology

FPVTE – FINGERPRINT MATCHING 49
Participant Left Index Right IndexLetter Sub. # Time FNIR Time FNIR
<20
seco
nds
1 1 0.26 24 0.1335 1 0.24 24 0.1132C
2 6 0.76 25 0.1337 6 0.69 23 0.1124
D 1 20 7.32 1 0.0197 20 7.46 1 0.0190
1 3 0.35 12 0.0745 3 0.32 11 0.0630E
2 30 16.90 11 0.0723 29 16.27 10 0.0624
1 11 2.49 20 0.1111 11 2.38 20 0.0933F
2 14 3.56 18 0.1082 15 3.60 18 0.0903
G 1 21 9.74 19 0.1089 24 10.10 19 0.0910
1 15 3.61 26 0.1576 14 3.56 26 0.1230H
2 17 4.13 27 0.1607 17 4.05 27 0.1249
I 1 22 9.94 5 0.0257 22 9.83 3 0.0215
1 4 0.54 14 0.0786 4 0.51 16 0.0708J
2 7 1.25 10 0.0712 7 1.13 12 0.0643
1 25 10.44 17 0.0883 26 10.42 14 0.0682K
2 23 10.32 16 0.0875 25 10.27 15 0.0685
1 2 0.29 8 0.0625 2 0.26 8 0.0505L
2 12 3.32 6 0.0351 13 3.26 6 0.0295
1 10 1.84 29 0.2995 10 1.78 30 0.2615M
2 26 10.70 28 0.2921 21 9.39 29 0.2526
1 5 0.62 15 0.0818 5 0.56 17 0.0776O
2 9 1.56 13 0.0766 9 1.36 13 0.0675
1 8 1.32 23 0.1308 8 1.24 25 0.1133P
2 13 3.33 22 0.1272 12 3.07 22 0.1100
1 28 15.70 2 0.0222 28 14.24 4 0.0218Q
2 24 10.43 3 0.0226 23 9.98 2 0.0214
S 1 29 16.86 7 0.0571 30 16.55 7 0.0442
1 16 3.99 30 NA 16 3.73 28 0.1929T
2 18 5.97 9 0.0685 19 5.87 9 0.0562
U 1 27 14.42 21 0.1218 27 10.76 21 0.0996
V 1 19 6.01 4 0.0253 18 5.60 5 0.0223
≥20
seco
nds
D 2 3 41.84 1 0.0197 2 28.64 1 0.0190
G 2 5 54.03 5 0.1086 5 59.55 5 0.0909
I 2 2 40.99 3 0.0278 3 40.35 2 0.0214
S 2 4 44.66 4 0.0650 4 46.05 4 0.0503
U 2 1 24.16 6 0.1178 1 20.10 6 0.1007
V 2 6 65.35 2 0.0252 6 61.24 3 0.0222
Table 17: Tabulation of median identification times for Class A. Submissions were split into two groups. The first group includes submissions thatperformed searches on average in less than 20 seconds, and the second includes those that took, on average, 20 seconds or longer. Letter refers to theparticipant’s letter code found on the footer of this page. Sub. # is an identifier used to differentiate between the two submissions each participant couldmake. The Time column shows the time used to perform a search over an enrollment set of 100 000. Time values are median times reported in seconds,but were originally recorded to microsecond precision. The FNIR column shows FNIR for each submission at FPIR = 10−3. NA indicates that theoperations required to produce the value could not be performed. The number to the left of a value provides the value’s column-wise ranking, with thebest performance shaded in green and the worst in pink.
C = afis team D = 3M Cogent E = Neurotechnology F = Papillon G = Dermalog H = Hisign Bio-Info InstituteI = NEC J = Sonda K = Tiger IT L = Innovatrics M = SPEX O = ID SolutionsP = id3 Q = Morpho S = Decatur Industries T = BIO-key U = Aware V = AA Technology

50 FPVTE – FINGERPRINT MATCHING
Participant Left and Right IndexLetter Sub. # Time FNIR
<20
seco
nds
1 1 2.08 7 0.0368C
2 4 6.35 8 0.0374
G 1 3 5.22 9 0.0515
I 1 8 17.87 2 0.0058
J 1 6 13.64 3 0.0143
K 1 9 18.01 6 0.0360
L 1 2 2.19 4 0.0146
O 1 7 14.46 5 0.0229
V 1 5 9.29 1 0.0034
≥20
seco
nds
1 15 70.99 4 0.0030D
2 23 237.43 4 0.0030
1 1 16.35 11 0.0207E
2 27 518.11 10 0.0202
1 13 60.66 21 0.0386F
2 16 73.95 22 0.0412
G 2 22 221.16 15 0.0311
1 8 36.71 24 0.0686H
2 12 52.25 23 0.0684
I 2 25 338.88 4 0.0030
J 2 7 33.35 8 0.0143
K 2 6 32.93 14 0.0286
L 2 3 23.42 7 0.0072
1 5 31.44 26 NAM
2 20 171.24 25 NA
O 2 10 43.53 12 0.0214
1 14 63.65 20 0.0370P
2 17 101.16 16 0.0333
1 21 212.69 1 0.0027Q
2 19 161.02 1 0.0027
1 2 23.00 13 0.0281S
2 26 495.50 9 0.0195
1 4 25.68 27 NAT
2 9 37.23 19 0.0366
1 11 45.51 17 0.0336U
2 24 240.40 18 0.0358
V 2 18 127.65 3 0.0028
Table 18: Tabulation of median identification times for Class A. Submissions were split into two groups. The first group includes submissions thatperformed searches on average in less than 20 seconds, and the second includes those that took, on average, 20 seconds or longer. Letter refers to theparticipant’s letter code found on the footer of this page. Sub. # is an identifier used to differentiate between the two submissions each participant couldmake. The Time column shows the time used to perform a search over an enrollment set of 1 600 000. Time values are median times reported in seconds,but were originally recorded to microsecond precision. The FNIR column shows FNIR for each submission at FPIR = 10−3. NA indicates that theoperations required to produce the value could not be performed. The number to the left of a value provides the value’s column-wise ranking, with thebest performance shaded in green and the worst in pink.
C = afis team D = 3M Cogent E = Neurotechnology F = Papillon G = Dermalog H = Hisign Bio-Info InstituteI = NEC J = Sonda K = Tiger IT L = Innovatrics M = SPEX O = ID SolutionsP = id3 Q = Morpho S = Decatur Industries T = BIO-key U = Aware V = AA Technology
FPVTE – FINGERPRINT MATCHING 51
8.2 Class B
Tabulated comparisons of identification times for IDFlat submissions are shown in Table 19. The search times shown inthis table are from the “Total/One” column in Tables 30 through 33 included in Appendix C. For reference, the FNIRvalues from Section 7 are reprinted to the right of the identification times.
The tables were used to create scatter plots showing accuracy, search times, and search template creation times. Thoseplots are shown in Figures 36 through 39.
Some observations for Class B identification times include:
. Most submissions had some improvement in accuracy with longer search times.
. Results vary, but some submissions (D, G, I1, Q1) performed searches faster when more fingers were available, whileothers (H, L, S) required longer search times with more fingers.
. Most search times increased modestly when ten processes were running in parallel, compared to the single processtiming test. See Appendix C and Appendix D for complete details.
. Tables 30 through 33 in Appendix E and Figures 40 through 43 show differences between the last two rounds ofsubmissions. There are a variety of results in these tables. Again, most had improvement in FNIRs, but some withlonger search times and some with dramatically shorter search times. Like Class A, there are certainly indicationsthat high accuracy can be achieved with some fast submissions.
C = afis team D = 3M Cogent E = Neurotechnology F = Papillon G = Dermalog H = Hisign Bio-Info InstituteI = NEC J = Sonda K = Tiger IT L = Innovatrics M = SPEX O = ID SolutionsP = id3 Q = Morpho S = Decatur Industries T = BIO-key U = Aware V = AA Technology

52 FPVTE – FINGERPRINT MATCHING
Left Slap
Median Search Time − One Process (seconds)
FN
IR @
FP
IR =
10−3
0.0005
0.0010
0.0020
0.0050
0.0100
0.0200
0.0500
0.1000
0.2000
20 40 60 80
C2
D2
H2
J2
M1
V1 D1
G2
I1
L1
M2
O1
S2
U1
V2
F1
H1
O2
Q1
U2C1
E1E2
F2
G1
I2
J1L2
Q2
S1● ●
●●
●
●
● ●
●●
● ●
●
●
●
●
● ●
● ●
● ●
●●
●●
●●
● ●
0 2 4 6 8 10 12 14
Figure 36: Scatter plot of FNIR @ FPIR = 10−3 searching 30 000 subjects against 3 000 000 subjects and median search time for a single process for ClassB — Left Slap. The color of the data point is used to show the search template creation time. The color scale for search template creation time is at thetop of the plot. Median search times are plotted in seconds. The FNIR and median search time data are from Table 19 and search template creation timescan be found in Table 75 in Appendix H.
Right Slap
Median Search Time − One Process (seconds)
FN
IR @
FP
IR =
10−3
0.0005
0.0010
0.0020
0.0050
0.0100
0.0200
0.0500
0.1000
0.2000
20 40 60 80
C2
H2
L2O1
Q1D1
G2
I1
L1
M1
O2
Q2
S2
V2
H1
U1U2
V1
C1
D2
E1
E2
F1 F2
G1
I2
J1J2
M2
S1● ●
●
●
●
●
● ●
● ●
● ●
●
●
●
●
●
●
●●
●●
●●
●●
●●
● ●
0 2 4 6 8 10 12 14
Figure 37: Scatter plot of FNIR @ FPIR = 10−3 searching 30 000 subjects against 3 000 000 subjects and median search time for a single process for ClassB — Right Slap. The color of the data point is used to show the search template creation time. The color scale for search template creation time is at thetop of the plot. Median search times are plotted in seconds. The FNIR and median search time data are from Table 19 and search template creation timescan be found in Table 76 in Appendix H.
C = afis team D = 3M Cogent E = Neurotechnology F = Papillon G = Dermalog H = Hisign Bio-Info InstituteI = NEC J = Sonda K = Tiger IT L = Innovatrics M = SPEX O = ID SolutionsP = id3 Q = Morpho S = Decatur Industries T = BIO-key U = Aware V = AA Technology

FPVTE – FINGERPRINT MATCHING 53
Left and Right Slap
Median Search Time − One Process (seconds)
FN
IR @
FP
IR =
10−3
0.0005
0.0010
0.0020
0.0050
0.0100
0.0200
0.0500
0.1000
0.2000
20 40 60 80
F1
H2
M2
O1
Q1
U1
V1 D1
G2
O2
S2
V2
D2
H1
M1
S1U2
C1 C2
E1E2
F2
G1
I1
I2
J1J2L1 L2
Q2
● ●
●
●
●
●
● ●
●
●
● ●
●
●
●
●●
●
● ●
●●
●●
●
●
●●
● ●
0 5 10 15 20 25
Figure 38: Scatter plot of FNIR @ FPIR = 10−3 searching 30 000 subjects against 3 000 000 subjects and median search time for a single process for ClassB — Left and Right Slap. The color of the data point is used to show the search template creation time. The color scale for search template creation time isat the top of the plot. Median search times are plotted in seconds. The FNIR and median search time data are from Table 19 and search template creationtimes can be found in Table 77 in Appendix H.
IDFlat
Median Search Time − One Process (seconds)
FN
IR @
FP
IR =
10−3
0.0005
0.0010
0.0020
0.0050
0.0100
0.0200
0.0500
0.1000
0.2000
20 40 60 80
D2 Q2
V2E2
F1
G2
H2
J1O1
O2
S2H1
Q1
U1U2
C1C2
D1
E1
F2
G1
I1I2
J2L1 L2
M1 M2
S1
V1
●●
●
●
●
●
● ●
●
●
● ●
●
●
●
●●
●
● ●
●●
● ●
●
●
●
●
●●
0 5 10 15 20
Figure 39: Scatter plot of FNIR @ FPIR = 10−3 searching 30 000 subjects against 3 000 000 subjects and median search time for a single process for ClassB — Identification Flats. The color of the data point is used to show the search template creation time. The color scale for search template creation time isat the top of the plot. Median search times are plotted in seconds. The FNIR and median search time data are from Table 19 and search template creationtimes can be found in Table 78 in Appendix H.
C = afis team D = 3M Cogent E = Neurotechnology F = Papillon G = Dermalog H = Hisign Bio-Info InstituteI = NEC J = Sonda K = Tiger IT L = Innovatrics M = SPEX O = ID SolutionsP = id3 Q = Morpho S = Decatur Industries T = BIO-key U = Aware V = AA Technology

54 FPVTE – FINGERPRINT MATCHING
− −
−
−
−
−
− −
+ +
−−
−
−
− −
+
− −
− −
−
0.01
0.02
0.05
0.10
0.20
C1 C2 D1 D2 E1 E2 G1 G2 H1 H2 I1 I2 J1 J2 L1 L2 M2 O1 O2 Q1 Q2 V1
Submission
FN
IR @
FP
IR =
10−3
0 20 40
Left Slap
Figure 40: Plots showing difference in FNIR @ FPIR = 10−3 searching 30 000 subjects against 3 000 000 subjects and difference in search times, for asingle search process, between round 2 and round 3 submissions for Class B — Left Slap. The “+” symbol indicates that FNIR increased from round 2 toround 3 and “-” indicates a decrease in FNIR. The color of the bar shows the change in search time. The color scale for difference in search time is at thetop of the plot and the units are in seconds. The data for the plots are taken from the tables in Appendix E.
+ +
−−
−
−
− −
+ +
−−
−
−
− −
−
− −
− −
−
0.005
0.010
0.020
0.050
0.100
C1 C2 D1 D2 E1 E2 G1 G2 H1 H2 I1 I2 J1 J2 L1 L2 M2 O1 O2 Q1 Q2 V1
Submission
FN
IR @
FP
IR =
10−3
−20 0 20 40
Right Slap
Figure 41: Plots showing difference in FNIR @ FPIR = 10−3 searching 30 000 subjects against 3 000 000 subjects and difference in search times, for asingle search process, between round 2 and round 3 submissions for Class B — Right Slap. The “+” symbol indicates that FNIR increased from round 2to round 3 and “-” indicates a decrease in FNIR. The color of the bar shows the change in search time. The color scale for difference in search time is atthe top of the plot and the units are in seconds. The data for the plots are taken from the tables in Appendix E.
C = afis team D = 3M Cogent E = Neurotechnology F = Papillon G = Dermalog H = Hisign Bio-Info InstituteI = NEC J = Sonda K = Tiger IT L = Innovatrics M = SPEX O = ID SolutionsP = id3 Q = Morpho S = Decatur Industries T = BIO-key U = Aware V = AA Technology

FPVTE – FINGERPRINT MATCHING 55
− −
−−
−
−+ +
− −
−
−
−−
+
−−
+ +
−
0.002
0.005
0.010
0.020
0.050
0.100
D1 D2 E1 E2 G1 G2 H1 H2 I1 I2 J1 J2 L1 L2 M2 O1 O2 Q1 Q2 V1
Submission
FN
IR @
FP
IR =
10−3
−20 0 20 40
Left and Right Slap
Figure 42: Plots showing difference in FNIR @ FPIR = 10−3 searching 30 000 subjects against 3 000 000 subjects and difference in search times, for asingle search process, between round 2 and round 3 submissions for Class B — Left and Right Slap. The “+” symbol indicates that FNIR increased fromround 2 to round 3 and “-” indicates a decrease in FNIR. The color of the bar shows the change in search time. The color scale for difference in searchtime is at the top of the plot and the units are in seconds. The data for the plots are taken from the tables in Appendix E.
− −
−
−
−
−− −
−
−
−
−
−
−
+
−
−
+ +
−
0.001
0.002
0.005
0.010
0.020
0.050
D1 D2 E1 E2 G1 G2 H1 H2 I1 I2 J1 J2 L1 L2 M2 O1 O2 Q1 Q2 V1
Submission
FN
IR @
FP
IR =
10−3
−40 −20 0 20 40
Identification Flats
Figure 43: Plots showing difference in FNIR @ FPIR = 10−3 searching 30 000 subjects against 3 000 000 subjects and difference in search times, for asingle search process, between round 2 and round 3 submissions for Class B — IDFlat. The “+” symbol indicates that FNIR increased from round 2 toround 3 and “-” indicates a decrease in FNIR. The color of the bar shows the change in search time. The color scale for difference in search time is at thetop of the plot and the units are in seconds. The data for the plots are taken from the tables in Appendix E.
C = afis team D = 3M Cogent E = Neurotechnology F = Papillon G = Dermalog H = Hisign Bio-Info InstituteI = NEC J = Sonda K = Tiger IT L = Innovatrics M = SPEX O = ID SolutionsP = id3 Q = Morpho S = Decatur Industries T = BIO-key U = Aware V = AA Technology

56 FPVTE – FINGERPRINT MATCHING
ParticipantLeftSlap
RightSlap
LeftandR
ightSlapIdentification
FlatsLetter
Sub.#Tim
eFN
IRTim
eFN
IRTim
eFN
IRTim
eFN
IR
12
3.74
22
0.0654
23.67
24
0.0403
36.40
30
NA
37.92
30
NA
C2
46.74
21
0.0647
46.50
23
0.0392
510.70
29
NA
410.21
29
NA
118
52.23
60.0163
19
53.32
60.0072
20
61.24
60.0031
17
45.15
60.0020
D2
22
58.10
50.0142
21
57.19
20.0052
21
63.05
50.0024
18
46.70
20.0012
11
2.82
13
0.0259
12.97
13
0.0151
26.12
15
0.0063
26.76
16
0.0043
E2
10
34.37
70.0187
10
34.47
70.0083
10
33.09
10
0.0049
15
43.61
70.0024
18
30.09
29
0.1684
831.87
29
0.1222
927.27
28
0.0910
12
37.56
27
0.0591
F2
14
43.59
28
0.1681
15
45.92
28
0.1220
12
36.36
26
0.0901
20
49.34
27
0.0591
16
16.24
18
0.0371
510.13
18
0.0212
13.89
18
0.0106
14.26
18
0.0062
G2
23
59.49
17
0.0325
13
37.28
16
0.0198
11
34.55
17
0.0084
616.26
14
0.0040
116
49.75
23
0.0998
17
50.16
25
0.0641
25
70.38
23
0.0349
26
82.66
23
0.0203
H2
17
51.77
24
0.1008
18
52.84
26
0.0647
26
73.06
24
0.0361
27
86.56
24
0.0204
121
55.96
40.0116
20
55.87
50.0058
13
37.19
30.0022
719.07
20.0012
I2
13
38.26
10.0094
14
41.13
10.0045
17
46.13
10.0015
16
43.86
10.0009
17
25.61
15
0.0287
724.14
14
0.0156
726.15
16
0.0068
825.38
17
0.0049
J2
27
74.38
10
0.0236
27
74.09
10
0.0126
24
69.28
90.0047
22
60.13
11
0.0033
13
5.56
16
0.0288
35.47
15
0.0167
410.48
12
0.0054
514.50
10
0.0031
L2
512.37
14
0.0276
612.66
17
0.0202
620.78
14
0.0062
928.59
11
0.0033
19
31.17
30
0.1736
932.03
30
0.1259
827.15
27
0.0904
13
38.87
26
0.0543
M2
29
87.21
27
0.1634
29
87.41
27
0.1155
16
45.91
25
0.0882
23
65.91
25
0.0515
112
37.01
12
0.0257
12
35.61
12
0.0142
14
38.34
13
0.0057
11
35.64
15
0.0041
O2
26
73.15
11
0.0254
26
73.93
11
0.0132
23
68.46
11
0.0051
21
60.02
13
0.0035
119
53.24
20.0098
23
64.04
30.0057
22
65.02
20.0021
14
42.92
20.0012
Q2
20
54.02
30.0099
22
61.94
30.0057
19
53.40
30.0022
24
66.01
20.0012
124
71.69
25
0.1089
24
70.54
21
0.0369
29
83.33
21
0.0160
29
87.60
20
0.0108
S2
25
71.77
26
0.1133
25
70.84
22
0.0381
27
82.13
22
0.0190
30
88.46
21
0.0136
128
80.03
20
0.0500
30
89.26
19
0.0266
30
83.62
20
0.0139
28
86.60
19
0.0099
U2
30
89.07
19
0.0461
28
80.11
20
0.0273
28
82.40
19
0.0124
25
75.28
22
0.0141
111
36.07
90.0192
11
35.43
80.0106
15
38.93
70.0036
10
34.96
90.0027
V2
15
47.97
80.0190
16
48.51
90.0110
18
52.80
70.0036
19
49.30
70.0024
Table19:Tabulation
ofmedian
identificationtim
esfor
Class
B.Letterrefers
tothe
participant’sletter
codefound
onthe
footerofthis
page.Sub.#is
anidentifier
usedto
differentiatebetw
eenthe
two
submissions
eachparticipant
couldm
ake.The
Time
column
shows
thetim
eused
toperform
asearch
overan
enrollment
setof
3000
000.Tim
evalues
arem
ediantim
esreported
inseconds,butw
ereoriginally
recordedto
microsecond
precision.TheFN
IRcolum
nshow
sFN
IRfor
eachsubm
issionatFPIR
=10−3.N
Aindicates
thattheoperations
requiredto
producethe
valuecould
notbeperform
ed.The
number
tothe
leftofavalue
providesthe
value’scolum
n-wise
ranking,with
thebestperform
anceshaded
ingreen
andthe
worstin
pink.
C = afis team D = 3M Cogent E = Neurotechnology F = Papillon G = Dermalog H = Hisign Bio-Info InstituteI = NEC J = Sonda K = Tiger IT L = Innovatrics M = SPEX O = ID SolutionsP = id3 Q = Morpho S = Decatur Industries T = BIO-key U = Aware V = AA Technology

FPVTE – FINGERPRINT MATCHING 57
8.3 Class C
Tabulated comparisons of identification times for ten-finger identification submissions are shown in Table 20. The searchtimes shown in this table are from the “Total/One” column in Tables 34 through 36 included in Appendix C. For reference,FNIR values from Section 7 are reprinted to the right of the identification times.
The tables were used to create scatter plots showing accuracy, search times, and search template creation times. Thoseplots are shown in Figure 44.
Some observations for Class C identification times include:
. Like classes A and B, gains varied across the participants, but most had some level of improvement in accuracy withlonger search times.
. Results for some submissions varied between ten-finger plain-to-plain and ten-finger rolled-to-rolled impressions.Some were faster with plain impressions and others were faster with rolled impressions. The most accurate submis-sions appeared to match both types accurately.
. Tables 34 through 36 in Appendix E and Figure 45 show differences between the last two rounds of submissions.Like classes A and B, these results indicate that high accuracy can be achieved with some fast submissions, but theabsolute best accuracy was not the fastest submission.
C = afis team D = 3M Cogent E = Neurotechnology F = Papillon G = Dermalog H = Hisign Bio-Info InstituteI = NEC J = Sonda K = Tiger IT L = Innovatrics M = SPEX O = ID SolutionsP = id3 Q = Morpho S = Decatur Industries T = BIO-key U = Aware V = AA Technology

58 FPVTE – FINGERPRINT MATCHING
Plain−to−Plain
Median Search Time − One Process (seconds)
FN
IR @
FP
IR =
10−3
0.0005
0.0010
0.0020
0.0050
0.0100
0.0200
0.0500
0.1000
0.2000
20 40 60 80
D1
E2
H1
J2
U1
M1
O2
Q1
S1H2
Q2
V2
C1
C2
D2
E1
F1 F2
G1G2
I1I2
J1
L1 L2
M2
O1
S2
U2
V1
●
●
●
●
●
●
● ●
●
● ●●
●
●
●
●
● ●
●●
● ●
●●
●
●
●●
● ●
0 5 10 15 20 25 30
Rolled−to−Rolled
Median Search Time − One Process (seconds)
FN
IR @
FP
IR =
10−3
0.0005
0.0010
0.0020
0.0050
0.0100
0.0200
0.0500
0.1000
0.2000
20 40 60 80
C2
D2
H2
M2
O2
C1
D1
M1
U1
H1
J2
Q1
E1
E2
F1 F2G1
G2
I1I2
J1
L1L2
O1
Q2
S1
S2
U2
V1 V2
●●
●●
●
●
● ●
●
●
●●
●●
●
●
●●
●●
● ●
●●
●
●
●●
●●
0 5 10 15 20 25 30
Plain−to−Rolled
Median Search Time − One Process (seconds)
FN
IR @
FP
IR =
10−3
0.0005
0.0010
0.0020
0.0050
0.0100
0.0200
0.0500
0.1000
0.2000
20 40 60 80
D1
D2
F2
H2
J1
U2
V2
C2
O1
U1
V1E2
H1
M1M2
O2
Q2
S1
S2
C1E1
F1
G1G2
I1I2
J2
L1L2
Q1
●●
●
●
●
●
● ●
●
●
● ●
●
●
●
●
●●
●
●
●●
●●
●
●
●
●
●
●
0 5 10 15 20 25 30
Figure 44: Scatter plot of FNIR @ FPIR = 10−3 searching 30 000 subjects against 5 000 000 subjects and median search time for a single process for ClassC. The color of the data point is used to show the search template creation time. The color scale for search template creation time is at the top of the plot.Median search times are plotted in seconds. The FNIR and median search time data are from Table 20 and search template creation times can be foundin Tables 79 and 80 in Appendix H.
C = afis team D = 3M Cogent E = Neurotechnology F = Papillon G = Dermalog H = Hisign Bio-Info InstituteI = NEC J = Sonda K = Tiger IT L = Innovatrics M = SPEX O = ID SolutionsP = id3 Q = Morpho S = Decatur Industries T = BIO-key U = Aware V = AA Technology

FPVTE – FINGERPRINT MATCHING 59
+
−−
−
−
+ +
−
−
− −
−−
−
−
−−
− −
−
0.001
0.002
0.005
0.010
0.020
0.050
0.100
0.200
C2 D1 D2 E1 E2 F1 F2 G1 G2 H1 H2 I1 I2 J1 J2 L1 L2 Q1 Q2 V1
Submission
FN
IR @
FP
IR =
10−3
−20 0 20 40
Ten−Finger Plain−to−Plain
− −
−−
−
−
+ ++
+− −
−
−
−
−
−−
+ − −0.002
0.005
0.010
0.020
0.050
0.100
C1 C2 D1 D2 E1 E2 F1 F2 G1 G2 H1 H2 I1 I2 J1 J2 L1 L2 Q1 Q2 V1
Submission
FN
IR @
FP
IR =
10−3
−60 −40 −20 0 20 40
Ten−Finger Rolled−to−Rolled
− −
−−
−
−
+ + −−
− −
− −
−
−
−−
− −+
0.001
0.002
0.005
0.010
0.020
0.050
0.100
0.200
C1 C2 D1 D2 E1 E2 F1 F2 G1 G2 H1 H2 I1 I2 J1 J2 L1 L2 Q1 Q2 V1
Submission
FN
IR @
FP
IR =
10−3
−40 −20 0 20
Ten−Finger Plain−to−Rolled
Figure 45: Plots showing difference in FNIR @ FPIR = 10−3 searching 30 000 subjects against 5 000 000 subjects and difference in search times, for asingle search process, between round 2 and round 3 submissions for Class C. The “+” symbol indicates that FNIR increased from round 2 to round 3 and“-” indicates a decrease in FNIR. The color of the bar shows the change in search time. The color scale for difference in search time is at the top of theplot and the units are in seconds. The data for the plots are taken from the tables in Appendix E.
C = afis team D = 3M Cogent E = Neurotechnology F = Papillon G = Dermalog H = Hisign Bio-Info InstituteI = NEC J = Sonda K = Tiger IT L = Innovatrics M = SPEX O = ID SolutionsP = id3 Q = Morpho S = Decatur Industries T = BIO-key U = Aware V = AA Technology

60 FPVTE – FINGERPRINT MATCHING
Participant Ten-Finger Plain-to-Plain Ten-Finger Rolled-to-Rolled Ten-Finger Plain-to-RolledLetter Sub. # Time FNIR Time FNIR Time FNIR
1 4 18.30 30 NA 4 20.15 16 0.0094 6 33.68 17 0.0149C
2 5 18.38 24 0.0711 6 21.97 15 0.0085 8 34.85 18 0.0169
1 25 73.93 6 0.0015 17 58.92 4 0.0015 13 41.67 6 0.0028D
2 26 74.36 2 0.0011 27 74.97 7 0.0018 16 57.36 3 0.0018
1 2 12.77 14 0.0088 2 8.63 18 0.0106 1 8.99 16 0.0137E
2 17 52.91 13 0.0048 11 42.73 12 0.0050 7 34.06 12 0.0056
1 15 51.69 25 0.0734 16 55.79 25 0.0536 19 58.57 27 0.2514F
2 18 60.86 25 0.0734 20 68.20 25 0.0536 21 61.87 27 0.2514
1 1 7.71 23 0.0368 1 7.78 24 0.0447 2 16.78 24 0.0649G
2 7 23.69 20 0.0276 3 19.46 21 0.0333 4 22.14 23 0.0521
1 21 68.07 20 0.0276 30 84.51 20 0.0201 22 64.83 20 0.0291H
2 20 65.36 19 0.0275 29 84.50 19 0.0199 23 65.74 19 0.0285
1 16 52.41 4 0.0013 15 54.56 1 0.0013 15 52.47 2 0.0014I
2 10 38.28 1 0.0010 7 30.82 2 0.0014 12 41.48 1 0.0011
1 12 43.57 12 0.0047 9 33.02 13 0.0051 9 38.41 13 0.0071J
2 28 77.75 10 0.0027 19 67.98 9 0.0033 25 67.88 7 0.0034
1 3 17.51 16 0.0102 8 31.68 17 0.0097 5 27.47 15 0.0136L
2 6 23.53 15 0.0095 5 20.25 14 0.0083 3 20.18 14 0.0129
1 11 43.37 28 0.0934 12 48.08 28 0.0783 17 57.63 30 0.3067M
2 13 46.70 27 0.0826 13 48.80 27 0.0716 18 57.91 27 0.2514
1 23 68.54 9 0.0025 14 54.42 11 0.0034 20 59.05 10 0.0041O
2 24 73.41 10 0.0027 21 69.30 9 0.0033 24 66.80 8 0.0036
1 9 36.86 2 0.0011 26 74.40 5 0.0017 11 39.76 4 0.0020Q
2 8 35.35 4 0.0013 25 74.22 2 0.0014 10 39.37 5 0.0022
1 29 86.56 22 0.0311 22 69.71 29 0.0860 30 88.48 25 0.1017S
2 30 91.74 29 0.1680 23 70.77 30 0.2462 29 88.07 26 0.2366
1 27 74.94 18 0.0163 28 82.61 23 0.0358 28 82.88 22 0.0378U
2 22 68.30 17 0.0155 24 72.48 22 0.0351 27 74.56 21 0.0295
1 14 47.02 7 0.0024 10 40.74 5 0.0017 14 48.40 11 0.0052V
2 19 62.26 7 0.0024 18 65.07 8 0.0019 26 69.87 9 0.0039
Table 20: Tabulation of median identification times for Class C. Letter refers to the participant’s letter code found on the footer of this page. Sub. # is anidentifier used to differentiate between the two submissions each participant could make. The Time column shows the time used to perform a searchover an enrollment set of 5 000 000. Time values are median times reported in seconds, but were originally recorded to microsecond precision. The FNIRcolumn shows FNIR for each submission at FPIR = 10−3. NA indicates that the operations required to produce the value could not be performed. Thenumber to the left of a value provides the value’s column-wise ranking, with the best performance shaded in green and the worst in pink.
C = afis team D = 3M Cogent E = Neurotechnology F = Papillon G = Dermalog H = Hisign Bio-Info InstituteI = NEC J = Sonda K = Tiger IT L = Innovatrics M = SPEX O = ID SolutionsP = id3 Q = Morpho S = Decatur Industries T = BIO-key U = Aware V = AA Technology

FPVTE – FINGERPRINT MATCHING 61
9 Accuracy Computational Resources Tradeoff
This section discusses the computational resources used by each submission, mainly looking for trends in accuracy of asubmission versus the load it created on the compute nodes. Statistics include how large the stored/finalized templatesare on disk versus in memory and how much time it took to create feature templates. Detailed tables in Appendix F showenrollment set sizes, in Appendix G show search template sizes, and in Appendix H show template creation times. Allthese tables were used to create the scatter plots used in this section. Appendix K plots relative comparisons of FNIR,RAM usage, template creation times, and search times.
Addtionally, all the numbers in Tables 60 through 65 in Appendix F are based on the maximum enrollment set sizes foreach class shown in Table 4. The RAM values reported are the best estimate based on the information recorded. It ispossible that a submission used more or less RAM depending on the internal operations of the submitted software. Seethe Lessons Learned for Large-Scale Testing section for more details.
9.1 Storage and Memory
It is important to note that the Actual RAM used (Appendix F) is the sum of the resident enrollment set sizes of identifica-tion stage one processes after returning from the identification stage one initialization method. More information on thiscan be found in the FpVTE API [15].
Every attempt was made to run each submission on the minimum number of compute nodes needed to successfullycomplete the evaluation. This generally meant multiple passes of running enrollment set finalization and redoing timingvalidation tests to determine the minimum number of compute nodes needed. If too few compute nodes were used, thesubmission would crash and not work properly.
When looking at the results, there are submissions like those from participant Q that had large finalized enrollment set,but used a lot less Actual RAM during stage one identification. In fact, Q always ran on a single compute node despitethe Finalized storage size. Participant L, on the other hand, clearly compressed templates, so they used more Actual RAMthan Finalized storage. This behavior was pre-reported to NIST, which made it easier to plan ahead when testing thesubmission.
9.1.1 Class A
Scatter plots comparing FNIR and computational resources used by index finger identification submissions are shown inFigures 46 through 51.
Figures 52 through 53 shows a comparison of the templates (right and left index) as stored on disk with the actual sizeused in RAM. For the majority of participants, the numbers were very similar but there were exceptions such as T, P, G,L, and Q.
Some observations for Class A computational resources include:
. The most accurate submissions were Q, V, I, D and L2.
. The most accurate submissions used the same or less RAM as other submissions with I2 being an exception.
. It appears that high accuracy can be achieved without using a large amount of storage.
. Participant T’s submissions consistently used the least computational resources but with the least accuracy.
. Of the most accurate submissions, participant V used the least amount of storage space.
. Participant K consumed the most RAM and disk space, significantly higher than all other participants.
. Participant Q used the least amount of RAM and achieved the highest accuracy of the most accurate submissions.
C = afis team D = 3M Cogent E = Neurotechnology F = Papillon G = Dermalog H = Hisign Bio-Info InstituteI = NEC J = Sonda K = Tiger IT L = Innovatrics M = SPEX O = ID SolutionsP = id3 Q = Morpho S = Decatur Industries T = BIO-key U = Aware V = AA Technology

62 FPVTE – FINGERPRINT MATCHING
Left Index
RAM Used for Enrollment Set (gigabytes)
FN
IR @
FP
IR =
10−3
0.01
0.02
0.05
0.10
0.20
0.50
1 2 3
C2
D2
E2
F2 G2
H2
O2
P2
T1
T2
V2
G1
I1
K1
M1
O1
P1
S2
V1
C1
E1
F1
H1
J1
Q2D1
I2
J2K2
L1
L2
M2
Q1
S1
U1U2
●●
●●
●●
●● ●●
●●
●●
●●
●●
●
●
●●
●●
●●
●●
●
●
●
●
●●
●●
0 1 2 3 4 5
Figure 46: Scatter plot of FNIR @ FPIR = 10−3 searching 30 000 subjects against 100 000 subjects and RAM used for enrollment set for Class A — LeftIndex. The color of the data point is used to show the On Disk Finalized Enrollment Size. The color scale for the On Disk Finalized Enrollment Size is at thetop of the plot and the units are in gigabytes. The data for the scatter plot comes from Table 60 in Appendix F. RAM Used for Enrollment Set is from theRAM/Actual column and On Disk Finalized Enrollment is from the On Disk/Finalized column.
Right Index
RAM Used for Enrollment Set (gigabytes)
FN
IR @
FP
IR =
10−3
0.01
0.02
0.05
0.10
0.20
0.50
1 2 3
D2
E2
G2
H1
M2
O2
P2
T1
T2
V1
C1G1
H2
I1
K2
M1
O1
P1
S2
V2
C2
E1
F1
J1
Q1D1
F2
I2
J2 K1
L1
L2
Q2
S1
U1U2
●●
●●
●●
●● ●●
●●
● ●
●●
●●
●
●
●●
●
●
●●
●●
●
●
●
●
●●
●●
0 1 2 3 4 5
Figure 47: Scatter plot of FNIR @ FPIR = 10−3 searching 30 000 subjects against 100 000 subjects and RAM used for enrollment set for Class A — RightIndex. The color of the data point is used to show the On Disk Finalized Enrollment Size. The color scale for the On Disk Finalized Enrollment Size is at thetop of the plot and the units are in gigabytes. The data for the scatter plot comes from Table 61 in Appendix F. RAM Used for Enrollment Set is from theRAM/Actual column and On Disk Finalized Enrollment is from the On Disk/Finalized column.
C = afis team D = 3M Cogent E = Neurotechnology F = Papillon G = Dermalog H = Hisign Bio-Info InstituteI = NEC J = Sonda K = Tiger IT L = Innovatrics M = SPEX O = ID SolutionsP = id3 Q = Morpho S = Decatur Industries T = BIO-key U = Aware V = AA Technology

FPVTE – FINGERPRINT MATCHING 63
Left Index
Search Template Size Per Subject In RAM (bytes)
FN
IR @
FP
IR =
10−3
0.01
0.02
0.05
0.10
0.20
0.50
2000 4000 6000 8000 10000
C2
D2
E2
F2
H2
K2
M2
O2
V2
G2
I1
O1
P1
Q2
U2C1
D1
E1
F1
H1
J1K1
M1
S2
V1
G1
I2
J2L1
L2
P2
Q1
S1
T1
T2
U1●●
●●
●●
●● ●●
●●
●●
●●
●●
●
●
●●
●●
●●
●●
●
●
●
●
●●
●●
0 2000 4000 6000 8000 10000
Figure 48: Scatter plot of FNIR @ FPIR = 10−3 searching 30 000 subjects against 100 000 subjects and search template size in RAM for Class A — LeftIndex. The color of the data point is used to show Search Template Size On Disk. The color scale for Search Template Size On Disk is at the top of the plotand the units are in bytes. On Disk comes from table Table 66 in Appendix G.
Right Index
Search Template Size Per Subject In RAM (bytes)
FN
IR @
FP
IR =
10−3
0.01
0.02
0.05
0.10
0.20
0.50
2000 4000 6000 8000 10000
C2
E2
F2
H1
I1
M2
O2
D2
G2
H2
K2O1
P1
Q2
U1
V2
C1F1
I2
J1 K1
M1
S2
D1
E1
G1
J2L1
L2
P2
Q1
S1
T1
T2
U2
V1
●●
●●
●●
●● ●●
●●
● ●
●●
●●
●
●
●●
●
●
●●
●●
●
●
●
●
●●
●●
0 2000 4000 6000 8000 10000
Figure 49: Scatter plot of FNIR @ FPIR = 10−3 searching 30 000 subjects against 100 000 subjects and search template size in RAM for Class A — RightIndex. The color of the data point is used to show Search Template Size On Disk. The color scale for Search Template Size On Disk is at the top of the plotand the units are in bytes. On Disk comes from table Table 66 in Appendix G.
C = afis team D = 3M Cogent E = Neurotechnology F = Papillon G = Dermalog H = Hisign Bio-Info InstituteI = NEC J = Sonda K = Tiger IT L = Innovatrics M = SPEX O = ID SolutionsP = id3 Q = Morpho S = Decatur Industries T = BIO-key U = Aware V = AA Technology

64 FPVTE – FINGERPRINT MATCHING
Left and Right Index
RAM Used for Enrollment Set (gigabytes)
FN
IR @
FP
IR =
10−3
0.001
0.002
0.005
0.010
0.020
0.050
0.100
20 40 60
C2
H2
J2
T2
V2D1
E1
F2G1
G2K1
O1
P1
Q1V1
F1
H1
J1
C1
D2
E2
I1
I2
K2
L1
L2
O2
P2
Q2
S1
S2
U1U2●●
●●
●●
●●
●
●
●●
●
●
●●
●
●
●
●
●●
●●
●●
●
●
●●
●
●
●
0 10 20 30 40 50 60 70
Figure 50: Scatter plot of FNIR @ FPIR = 10−3 searching 30 000 subjects against 1 600 000 subjects and RAM used for enrollment set for Class A — Leftand Right Index. The color of the data point is used to show the On Disk Finalized Enrollment Set size. The color scale for the On Disk Finalized EnrollmentSet is at the top of the plot and the units are in gigabytes. The data for the enrollment set size comes from Table 62 in Appendix F. RAM used for EnrollmentSet is from the RAM/Actual column and On Disk Finalized Enrollment Set is from the On Disk/Finalized column.
Left and Right Index
Search Template Size Per Subject In RAM (bytes)
FN
IR @
FP
IR =
10−3
0.001
0.002
0.005
0.010
0.020
0.050
0.100
5000 10000 15000 20000
C2
E2
H2
I1
J2
K2U1
V2D1
E1
F2G1
O1
P1
Q1
U2
V1
F1
H1
I2
J1
K1S1
S2
C1
D2
G2
L1
L2
O2
P2
Q2
T2●●
●●
●●
●●
●
●
●●
●
●
●●
●
●
●
●
●●
●●
●●
●
●
●●●
●
●
0 5000 10000 15000 20000
Figure 51: Scatter plot of FNIR @ FPIR = 10−3 searching 30 000 subjects against 1 600 000 subjects and search template size in RAM. The color of thedata point is used to show Search Template Size On Disk. The color scale for Search Template Size On Disk is at the top of the plot and the units are in bytes.On Disk comes from Table 66 in Appendix G.
C = afis team D = 3M Cogent E = Neurotechnology F = Papillon G = Dermalog H = Hisign Bio-Info InstituteI = NEC J = Sonda K = Tiger IT L = Innovatrics M = SPEX O = ID SolutionsP = id3 Q = Morpho S = Decatur Industries T = BIO-key U = Aware V = AA Technology

FPVTE – FINGERPRINT MATCHING 65
●
●
●
●
●
● ●
●
●
● ●●
●
●
●
●
●
●●
●
●
●C
E
F
G HJ
K
M
OPQS
T
VD1
D2
I1I2L1 L2 U1
U2
32 MB
1 GB
32 GB
1 GB 4 GB 16 GB 64 GB
Finalized Directory Size
Act
ual R
AM
Con
sum
ptio
n
Left and Right Index
Figure 52: Comparison of enrollment size in RAM and on disk. The x- and y-axes use log scales. The data for enrollment size comes from Table 62 inAppendix F. Actual RAM Consumption is from the RAM/Actual column and Finalized Directory Size is from the On Disk/Finalized column.
●
●
●
●
●
●●
●
●
●
●
●
●
●
●
●
●
●
●
●
C
D
E
F
G
HJ
K
M
O
P Q
S
T
U
V
I1
I2
L1
L2
0 B
5 kB
10 kB
15 kB
20 kB
0 B 5 kB 10 kB 15 kB 20 kB
Disk Size
RA
M S
ize
Left and Right Index
Figure 53: Comparison of search template size in RAM and on disk. On Disk comes from Table 66 in Appendix G.
C = afis team D = 3M Cogent E = Neurotechnology F = Papillon G = Dermalog H = Hisign Bio-Info InstituteI = NEC J = Sonda K = Tiger IT L = Innovatrics M = SPEX O = ID SolutionsP = id3 Q = Morpho S = Decatur Industries T = BIO-key U = Aware V = AA Technology

66 FPVTE – FINGERPRINT MATCHING
9.1.2 Class B
Scatter plots comparing FNIR and computational resources used by IDFlat identification submissions are shown in Fig-ures 54 through 55.
Figures 56 through 57 shows a comparison of the templates as stored on disk with the actual size used in RAM. Like classA results, this plot highlights submissions where on disk and in RAM usage differed such as E, G, L, and Q.
Some observations for Class B computational resources include:
. The lowest RAM usage is also one of the top performers (Q).
. Other top performers (participants D and I) do not have the largest RAM usage.
. Participant I cut RAM usage in half with minimal drop in accuracy.
. Like Class A, high accuracy can be achieved while keeping RAM usage relatively low.
C = afis team D = 3M Cogent E = Neurotechnology F = Papillon G = Dermalog H = Hisign Bio-Info InstituteI = NEC J = Sonda K = Tiger IT L = Innovatrics M = SPEX O = ID SolutionsP = id3 Q = Morpho S = Decatur Industries T = BIO-key U = Aware V = AA Technology

FPVTE – FINGERPRINT MATCHING 67
IDFlat
RAM Used for Enrollment Set (gigabytes)
FN
IR @
FP
IR =
10−3
0.0005
0.0010
0.0020
0.0050
0.0100
0.0200
0.0500
0.1000
0.2000
100 200 300 400 500
D1
F1
H2
L1 L2O1
S1
V1
F2
G1
G2J1
Q2
S2 U2
E1
H1
M1
O2V2
C1C2
D2
E2
I1I2
J2
M2
Q1
U1
●●
●
●
●
●
●●
●
●
●●
●
●
●
●●
●
●●
●●
●●
●
●
●
●
●●
0 100 200 300 400 500 600
Figure 54: Scatter plot of FNIR @ FPIR = 10−3 searching 30 000 subjects against 3 000 000 subjects and RAM used for enrollment set for Class B —Identification Flats. The color of the data point is used to show On Disk Finalized Enrollment Set size. The color scale for the on disk finalized enrollmentsize is at the top of the plot and the units are in gigabytes. The data for the enrollment set size comes from Table 63 in Appendix F. RAM Used forEnrollment Set is from the RAM/Actual column and On Disk Finalized Enrollment Set is from the On Disk/Finalized column.
IDFlat
Search Template Size Per Subject In RAM (bytes)
FN
IR @
FP
IR =
10−3
0.0005
0.0010
0.0020
0.0050
0.0100
0.0200
0.0500
0.1000
0.2000
20000 40000 60000 80000
C2
F2
O2
U2
D1
F1
G1
H2
J1L2
Q2
S2
V1
C1
M1
O1
S1
D2
E1
E2
G2
H1
I1I2
J2L1
M2
Q1
U1
V2
●●
●
●
●
●
●●
●
●
●●
●
●
●
●●●
●●
●●
●●
●
●
●
●
●●
0 10000 20000 30000 40000 50000 60000 70000 80000
Figure 55: Scatter plot of FNIR @ FPIR = 10−3 searching 30 000 subjects against 3 000 000 subjects and search template size in RAM for Class B —Identification Flats. The color of the data point is used to show Search Template Size On Disk. The color scale for Search Template Size On Disk is at the topof the plot and the units are in bytes. On Disk comes from Table 67in Appendix G.
C = afis team D = 3M Cogent E = Neurotechnology F = Papillon G = Dermalog H = Hisign Bio-Info InstituteI = NEC J = Sonda K = Tiger IT L = Innovatrics M = SPEX O = ID SolutionsP = id3 Q = Morpho S = Decatur Industries T = BIO-key U = Aware V = AA Technology
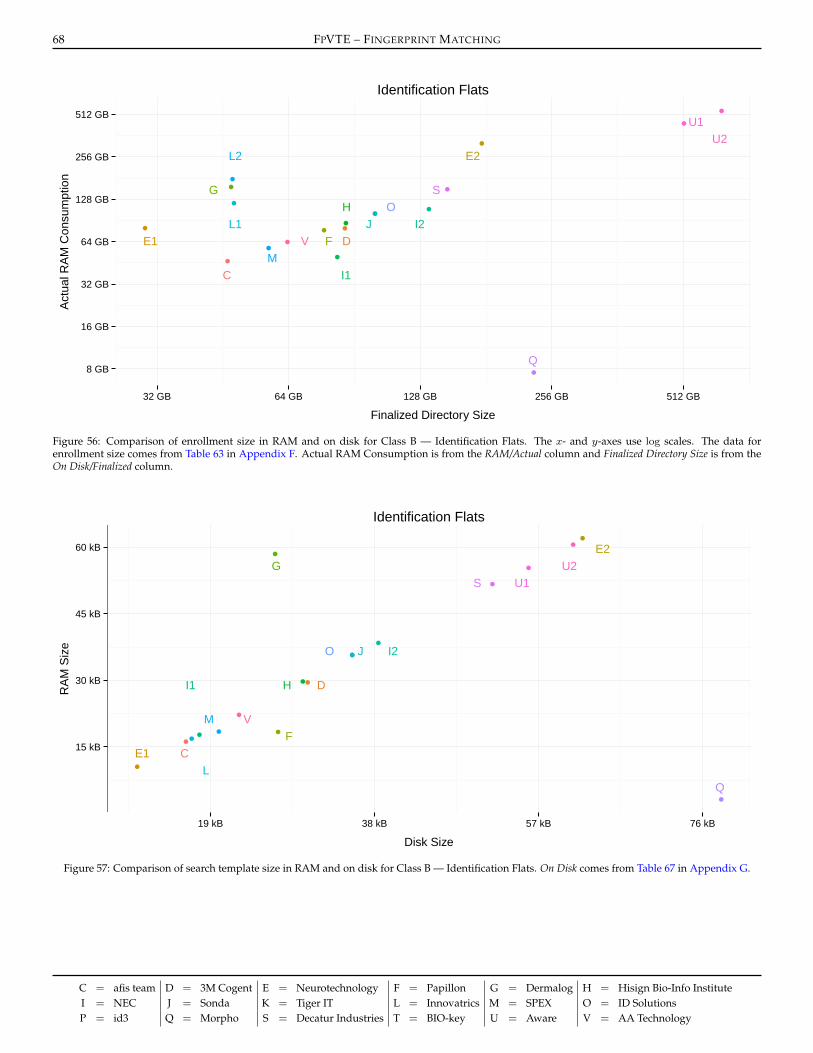
68 FPVTE – FINGERPRINT MATCHING
●
●
●
●
●
●
●
●
●
●
●
●
●
●
●
●
●
●
●
C
DF
GH
J
M
O
Q
S
VE1
E2
I1
I2L1
L2
U1U2
8 GB
16 GB
32 GB
64 GB
128 GB
256 GB
512 GB
32 GB 64 GB 128 GB 256 GB 512 GB
Finalized Directory Size
Act
ual R
AM
Con
sum
ptio
n
Identification Flats
Figure 56: Comparison of enrollment size in RAM and on disk for Class B — Identification Flats. The x- and y-axes use log scales. The data forenrollment size comes from Table 63 in Appendix F. Actual RAM Consumption is from the RAM/Actual column and Finalized Directory Size is from theOn Disk/Finalized column.
●
●
●
●
●
●
●
●●
●
●
●
●
●
●
●
●
●
C
D
F
G
H
J
L
M
O
Q
S
V
E1
E2
I1
I2
U1U2
15 kB
30 kB
45 kB
60 kB
19 kB 38 kB 57 kB 76 kB
Disk Size
RA
M S
ize
Identification Flats
Figure 57: Comparison of search template size in RAM and on disk for Class B — Identification Flats. On Disk comes from Table 67 in Appendix G.
C = afis team D = 3M Cogent E = Neurotechnology F = Papillon G = Dermalog H = Hisign Bio-Info InstituteI = NEC J = Sonda K = Tiger IT L = Innovatrics M = SPEX O = ID SolutionsP = id3 Q = Morpho S = Decatur Industries T = BIO-key U = Aware V = AA Technology

FPVTE – FINGERPRINT MATCHING 69
9.1.3 Class C
Scatter plots comparing FNIR and computational resources used by plain and rolled impression submissions are shownin Figures 58 through 61.
Figures 62 through 65 show a comparison of the templates as stored on disk with the actual size used in RAM. Like classA and B results, these plot highlight submissions where on disk and in RAM usage differed for several submissions.
Some observations for Class C computational resources include:
. Like classes A and B, the top performers do not use the largest amount of RAM.
. High accuracy can be achieved with relatively low RAM usage.
. Ten-finger rolled data used more RAM than ten-finger plain data, but is not more accurate.
C = afis team D = 3M Cogent E = Neurotechnology F = Papillon G = Dermalog H = Hisign Bio-Info InstituteI = NEC J = Sonda K = Tiger IT L = Innovatrics M = SPEX O = ID SolutionsP = id3 Q = Morpho S = Decatur Industries T = BIO-key U = Aware V = AA Technology

70 FPVTE – FINGERPRINT MATCHING
Plain
RAM Used for Enrollment Set (gigabytes)
FN
IR @
FP
IR =
10−3
0.0005
0.0010
0.0020
0.0050
0.0100
0.0200
0.0500
0.1000
0.2000
200 400 600 800
C1
C2
D1D2
H2
J2
Q1
G1
I1
J1
M1
O2
Q2
U1
V1
F1
H1
M2
S1
S2
V2
E1
E2
F2
G2
I2
L1 L2
O1
U2
●
●
●
●
●
●
●●
●
●●●
●
●
●
●
● ●
●●
●●
●●
●
●
●●
●●
0 100 200 300 400 500 600 700 800 900
Figure 58: Scatter plot of FNIR @ FPIR = 10−3 searching 30 000 subjects against 5 000 000 subjects and RAM used for enrollment set for Class C —Ten-Finger Rolled-to-Rolled. The color of the data point is used to show the On Disk Finalized Enrollment Set size. The color scale for the On Disk FinalizedEnrollment Size is at the top of the plot and the units are in gigabytes. The data for the scatter plot comes from Table 64 in Appendix F. RAM used forEnrollment Set is from the RAM/Actual column and On Disk Finalized Enrollment Set is from the On Disk/Finalized column.
Rolled
RAM Used for Enrollment Set (gigabytes)
FN
IR @
FP
IR =
10−3
0.0005
0.0010
0.0020
0.0050
0.0100
0.0200
0.0500
0.1000
0.2000
200 400 600 800
F2
H2
I2
J2
L2
M2
D2
E1
G1
J1
L1
M1
O1
Q1
U2
V2
C1
D1
E2
F1
H1
O2
C2
G2
I1Q2
S1
S2
U1
V1
●●
●●
●
●
●●
●
●
●●
●●
●
●
●●
●●
●●
●●
●
●
●●
●●
0 100 200 300 400 500 600 700 800 900
Figure 59: Scatter plot of FNIR @ FPIR = 10−3 searching 30 000 subjects against 5 000 000 subjects and RAM used for enrollment set for Class C —Ten-Finger Rolled-to-Rolled. The color of the data point is used to show the On Disk Finalized Enrollment Set size. The color scale for the On Disk FinalizedEnrollment Size is at the top of the plot and the units are in gigabytes. The data for the scatter plot comes from Table 65 in Appendix F. RAM used forEnrollment Set is from the RAM/Actual column and On Disk Finalized Enrollment Set is from the On Disk/Finalized column.
C = afis team D = 3M Cogent E = Neurotechnology F = Papillon G = Dermalog H = Hisign Bio-Info InstituteI = NEC J = Sonda K = Tiger IT L = Innovatrics M = SPEX O = ID SolutionsP = id3 Q = Morpho S = Decatur Industries T = BIO-key U = Aware V = AA Technology

FPVTE – FINGERPRINT MATCHING 71
Plain
Search Template Size Per Subject In RAM (bytes)
FN
IR @
FP
IR =
10−3
0.0005
0.0010
0.0020
0.0050
0.0100
0.0200
0.0500
0.1000
0.2000
20000 40000 60000 80000 100000 120000
C2
D2
F1
H2
O2
G1
J1
L1
M1
Q2
U1
V1
C1
D1
E1
G2
J2
M2
S1
S2
E2
F2
H1
I1I2
L2
O1
Q1
U2
V2
●
●
●
●
●
●
●●
●
●●●
●
●
●
●
●●
●●
●●
●●
●
●
●●
●●
0 20000 40000 60000 80000 100000 120000 140000
Figure 60: Scatter plot of FNIR @ FPIR = 10−3 searching 30 000 subjects against 5 000 000 subjects and search template size in RAM for Class C —Ten-Finger Plain-to-Plain. The color of the data point is used to show Search Template Size On Disk. The color scale for Search Template Size On Disk is atthe top of the plot and the units are in bytes. On Disk comes from Table 68 in Appendix G.
Rolled
Search Template Size Per Subject In RAM (bytes)
FN
IR @
FP
IR =
10−3
0.0005
0.0010
0.0020
0.0050
0.0100
0.0200
0.0500
0.1000
0.2000
20000 40000 60000 80000 100000 120000
D2
F2G1G2
H2
O1
C1
J1
L1
M1
Q1
U2
V2D1
E1
F1
H1
M2
O2
S1
S2
C2
E2
I1 I2
J2
L2
Q2
U1
V1
●●
●●
●
●
●●
●
●
●●
●●
●
●
●●
●●
●●
●●
●
●
●●
●●
0 20000 40000 60000 80000 100000 120000 140000
Figure 61: Scatter plot of FNIR @ FPIR = 10−3 searching 30 000 subjects against 5 000 000 subjects and search template size in RAM for Class C —Ten-Finger Rolled-to-Rolled. The color of the data point is used to show Search Template Size On Disk. The color scale for Search Template Size On Disk isat the top of the plot and the units are in bytes. On Disk comes from Table 68 in Appendix G.
C = afis team D = 3M Cogent E = Neurotechnology F = Papillon G = Dermalog H = Hisign Bio-Info InstituteI = NEC J = Sonda K = Tiger IT L = Innovatrics M = SPEX O = ID SolutionsP = id3 Q = Morpho S = Decatur Industries T = BIO-key U = Aware V = AA Technology

72 FPVTE – FINGERPRINT MATCHING
●
●
●
●
●
●
●
●
●
●●
●●
●
●
●
●
●
●
CD
F
GH J
M
O
Q
U
VE1
E2
I1 I2
L1
L2S1
S2
16 GB
32 GB
64 GB
128 GB
256 GB
512 GB
64 GB 128 GB 256 GB 512 GB 1 TB
Finalized Directory Size
Act
ual R
AM
Con
sum
ptio
n
Ten−Finger Plain Impression
Figure 62: Comparison of enrollment size in RAM and on disk for Class C — Plain Impression. The x- and y-axes use log scales. The data for enrollmentsize comes from Table 64 in Appendix F. Actual RAM Consumption is from the RAM/Actual column and Finalized Directory Size is from the OnDisk/Finalized column.
●
●
●
●
●
●●
●
●●
●
●
●
●
●
●
●
●
C
F
G
H
J
LM
O
Q
S
U
V
D1
D2
E1
E2
I1I2
16 kB
32 kB
48 kB
64 kB
20 kB 40 kB 60 kB 80 kB
Disk Size
RA
M S
ize
Ten−Finger Plain Impression
Figure 63: Comparison of search template size in RAM and on disk for Class C — Plain Impression. On Disk comes from Table 68 in Appendix G.
C = afis team D = 3M Cogent E = Neurotechnology F = Papillon G = Dermalog H = Hisign Bio-Info InstituteI = NEC J = Sonda K = Tiger IT L = Innovatrics M = SPEX O = ID SolutionsP = id3 Q = Morpho S = Decatur Industries T = BIO-key U = Aware V = AA Technology

FPVTE – FINGERPRINT MATCHING 73
●
●
●
●
●
●
●
●
●
●
●
●
●
●
●
●
●
●
●
CDF
GH
J
M
O
Q
U
V
E1
E2
I1 I2
L1
L2 S1
S2
32 GB
64 GB
128 GB
256 GB
512 GB
1 TB
128 GB 256 GB 512 GB 1 TB
Finalized Directory Size
Act
ual R
AM
Con
sum
ptio
n
Ten−Finger Rolled Impression
Figure 64: Comparison of enrollment size in RAM and on disk for Class C — Rolled Impression. The x- and y-axes use log scales. The data forenrollment size comes from Table 65 in Appendix F. Actual RAM Consumption is from the RAM/Actual column and Finalized Directory Size is from the OnDisk/Finalized column.
●
●
●
●●
●●
●
●●
●
●
●
●
●
●
●
●
C
F
G
H
J
L
M
O
Q
S
UV D1
D2
E1
E2
I1
I227 kB
54 kB
81 kB
108 kB
33 kB 66 kB 99 kB 132 kB
Disk Size
RA
M S
ize
Ten−Finger Rolled Impression
Figure 65: Comparison of search template size in RAM and on disk for Class C — Rolled Impression. On Disk comes from Table 68 in Appendix G.
C = afis team D = 3M Cogent E = Neurotechnology F = Papillon G = Dermalog H = Hisign Bio-Info InstituteI = NEC J = Sonda K = Tiger IT L = Innovatrics M = SPEX O = ID SolutionsP = id3 Q = Morpho S = Decatur Industries T = BIO-key U = Aware V = AA Technology

74 FPVTE – FINGERPRINT MATCHING
9.2 Processing Time
This section shows the time required to enroll fingerprints images also referred to as template creation time. The templatecreation times were recorded by enrolling a common sample of the datasets on common hardware, with 100 processesrunning in parallel across 10 compute nodes (10 processes per compute node). Any segmentation time for slap captureswas included in the template creation times.
The detailed tables (Tables 72 and 80) used to make the scatter plots (Figures 66 through 71) in this section are included inAppendix H. The Enrollment columns give some idea as to the required system capacity needed to enroll a large dataset ina reasonable time frame. As an example, if a submission takes the full time allowed per image (3 seconds) and 16 computenodes are used for the enrollment process, it will take approximately 16 days to process all the enrollment sets for all threeclasses.
In an operational sense, enrollment only occurs a single time for the entire dataset, and then on an as-needed basis whennew subjects are added to the dataset. The Search columns are different, as they show the time needed to create a templateevery time a new search is performed. This time would be factored in as part of the overall search time process.
Some observations from tables and plots include:
. The most accurate submissions did not have the fastest enrollment times. In fact, the best performers tend to havelonger enrollment times.
. Enrollment time appears to be proportional to finger type and impression. For example, single-finger captures arefaster than ten-finger plain impressions, which are faster than ten-finger rolled impressions.
. Segmentation does not appear to significantly increase enrollment times, as noted by comparing ten-finger plainimpressions to ten-finger rolled impressions.
C = afis team D = 3M Cogent E = Neurotechnology F = Papillon G = Dermalog H = Hisign Bio-Info InstituteI = NEC J = Sonda K = Tiger IT L = Innovatrics M = SPEX O = ID SolutionsP = id3 Q = Morpho S = Decatur Industries T = BIO-key U = Aware V = AA Technology

FPVTE – FINGERPRINT MATCHING 75
Left Index
Enrollment Template Creation Time (seconds)
FN
IR @
FP
IR =
10−3
0.01
0.02
0.05
0.10
0.20
0.50
0.5 1.0 1.5 2.0
C2
E1E2
D1
F1
H2
J1K1
M1
O1
P1
Q2
S2
U1
V1
G1
H1
J2O2
P2 C1
D2
F2G2
I1 I2
K2
L1
L2
M2
Q1
S1
T1
T2
U2
V2
●●
●●
●●
●●●●
●●
●●
●●
●●
●
●
●●
●●
●●
●●
●
●
●
●
●●
●●
0.0 0.5 1.0 1.5 2.0 2.5 3.0
Figure 66: Scatter plot of FNIR @ FPIR = 10−3 searching 30 000 subjects against 100 000 subjects and enrollment template creation time for Class A —Left Index. The color of the data point is used to show the search template creation time. The color scale for search template creation time is at the top ofthe plot and the units are in seconds. The template creation time data is from Table 72 in Appendix H.
Right Index
Enrollment Template Creation Time (seconds)
FN
IR @
FP
IR =
10−3
0.01
0.02
0.05
0.10
0.20
0.50
0.5 1.0 1.5 2.0
C1
D2
E1E2
G2
C2F1
H2
J1 K1
M1
Q2
S2
U1
V1
D1
H1
J2O1O2
P1
F2G1
I1 I2
K2
L1
L2
M2
P2
Q1
S1
T1
T2
U2
V2
●●
●●
●●
●●●●
●●
● ●
●●
●●
●
●
●●
●
●
●●
●●
●
●
●
●
●●
●●
0.0 0.5 1.0 1.5 2.0 2.5 3.0
Figure 67: Scatter plot of FNIR @ FPIR = 10−3 searching 30 000 subjects against 100 000 subjects and enrollment template creation time for Class A —Right Index. The color of the data point is used to show the search template creation time. The color scale for search template creation time is at the topof the plot and the units are in seconds. The template creation time data is from Table 73 in Appendix H.
C = afis team D = 3M Cogent E = Neurotechnology F = Papillon G = Dermalog H = Hisign Bio-Info InstituteI = NEC J = Sonda K = Tiger IT L = Innovatrics M = SPEX O = ID SolutionsP = id3 Q = Morpho S = Decatur Industries T = BIO-key U = Aware V = AA Technology

76 FPVTE – FINGERPRINT MATCHING
Left and Right Index
Enrollment Template Creation Time (seconds)
FN
IR @
FP
IR =
10−3
0.001
0.002
0.005
0.010
0.020
0.050
0.100
1 2 3 4
C1
D1
E1
G1
H2
J2
P2C2 F2
K1
O1
Q1
S1U2
V1D2
H1
J1
O2
P1T2
E2
F1G2
I1
I2
K2
L1
L2
Q2
S2
U1
V2
●●
●●
●●
●●
●
●
●●
●
●
●●
●
●
●
●
●●
●●
●●
●
●
●●●
●
●
0 1 2 3 4 5
Figure 68: Scatter plot of FNIR @ FPIR = 10−3 searching 30 000 subjects against 1 600 000 subjects and enrollment template creation time for Class A —Left and Right Index. The color of the data point is used to show the search template creation time. The color scale for search template creation time isat the top of the plot and the units are in seconds. The template creation time data is from Table 74 in Appendix H.
IDFlat
Enrollment Template Creation Time (seconds)
FN
IR @
FP
IR =
10−3
0.0005
0.0010
0.0020
0.0050
0.0100
0.0200
0.0500
0.1000
0.2000
5 10 15
G1
G2J2
M1
O1
V1 E2
F1
H2
J1
Q1
S2U2
E1
F2
L1O2
C1C2
D1
D2
H1
I1I2
L2
M2
Q2
S1U1
V2
●●
●
●
●
●
●●
●
●
●●
●
●
●
●●
●
●●
●●
●●
●
●
●
●
●●
0 5 10 15 20
Figure 69: Scatter plot of FNIR @ FPIR = 10−3 searching 30 000 subjects against 3 000 000 subjects and enrollment template creation time for Class B —Identification Flats. The color of the data point is used to show the search template creation time. The color scale for search template creation time is atthe top of the plot and the units are in seconds. The template creation time data is from Table 78 in Appendix H.
C = afis team D = 3M Cogent E = Neurotechnology F = Papillon G = Dermalog H = Hisign Bio-Info InstituteI = NEC J = Sonda K = Tiger IT L = Innovatrics M = SPEX O = ID SolutionsP = id3 Q = Morpho S = Decatur Industries T = BIO-key U = Aware V = AA Technology

FPVTE – FINGERPRINT MATCHING 77
Plain
Enrollment Template Creation Time (seconds)
FN
IR @
FP
IR =
10−3
0.0005
0.0010
0.0020
0.0050
0.0100
0.0200
0.0500
0.1000
0.2000
5 10 15 20 25 30
G2
M2
O1
U2
G1
I1
L1
M1
O2
Q2
F1
H1
J1
J2
U1
V2
C1
C2
D1D2
E1
E2
F2
H2
I2
L2
Q1
S1
S2
V1
●
●
●
●
●
●
●●
●
●●●
●
●
●
●
●●
●●
●●
●●
●
●
●●
●●
0 5 10 15 20 25 30
Figure 70: Scatter plot of FNIR @ FPIR = 10−3 searching 30 000 subjects against 5 000 000 subjects and enrollment template creation time for Class C –Ten-Finger Plain-to-Plain. The color of the data point is used to show the search template creation time. The color scale for search template creation timeis at the top of the plot and the units are in seconds. The template creation time data is from Table 79 in Appendix H.
Rolled
Enrollment Template Creation Time (seconds)
FN
IR @
FP
IR =
10−3
0.0005
0.0010
0.0020
0.0050
0.0100
0.0200
0.0500
0.1000
0.2000
5 10 15 20 25 30
F2
H2
J2
M2
V2
C1
G1
J1
L1
M1
O1
Q1
U2
D2
F1
H1
O2
V1
C2
D1
E1
E2
G2
I1I2
L2
Q2
S1
S2
U1
●●
●●
●
●
●●
●
●
●●
●●
●
●
●●
●●
●●
●●
●
●
●●
●●
0 5 10 15 20 25 30
Figure 71: Scatter plot of FNIR @ FPIR = 10−3 searching 30 000 subjects against 5 000 000 subjects and enrollment template creation time for Class C –Ten-Finger Rolled-to-Rolled. The color of the data point is used to show the search template creation time. The color scale for search template creationtime is at the top of the plot and the units are in seconds. The template creation time data is from Table 80 in Appendix H.
C = afis team D = 3M Cogent E = Neurotechnology F = Papillon G = Dermalog H = Hisign Bio-Info InstituteI = NEC J = Sonda K = Tiger IT L = Innovatrics M = SPEX O = ID SolutionsP = id3 Q = Morpho S = Decatur Industries T = BIO-key U = Aware V = AA Technology

78 FPVTE – FINGERPRINT MATCHING
10 Ranked Results
This section combines tables from Sections 7 and 9 into a single table. The resulting tables are rank-sorted based on FNIRvalues.
There is one table from each class of participation included in the main body of this report. The full set of tables for allclasses and search set scenarios are included in Appendix I.
These tables are useful because they combine all the high-level information in a single table. They are rank-sorted on FNIR,as accuracy is generally considered the most important goal for an identification algorithm to achieve. The reader can thenlook across and see how a participant ranked in other areas such as search time (Identification), search template creationtime (Search Enrollment), and memory usage (RAM). As stated in previous sections, the most accurate submissions arenot the fastest. In all three classes, there is a two to three times increase in the error rate when comparing the most accuratesubmission with one of the top three fastest in search speed.
Appendix K plots relative comparisons of FNIR, RAM usage, template creation times, and search times.
Appendix L is one attempt to take the tables in this section and apply some relative weight or importance to each column.The tables in Appendix L use these weights to produce a score for each submission and then sort the results based onthose scores. Refer to Appendix L for more details.
C = afis team D = 3M Cogent E = Neurotechnology F = Papillon G = Dermalog H = Hisign Bio-Info InstituteI = NEC J = Sonda K = Tiger IT L = Innovatrics M = SPEX O = ID SolutionsP = id3 Q = Morpho S = Decatur Industries T = BIO-key U = Aware V = AA Technology

FPVTE – FINGERPRINT MATCHING 79
ParticipantFNIR
Identification Search EnrollmentRAM
Letter Sub. # Mean Median Mean Median<
20
seco
nds
V 1 1 0.0034 5 9.50 5 9.29 4 0.68 3 0.64 5 11.77
I 1 2 0.0058 9 18.92 8 17.87 9 2.96 9 2.93 6 15.83
J 1 3 0.0143 6 14.00 6 13.64 3 0.66 4 0.65 3 8.30
L 1 4 0.0146 1 2.20 2 2.19 1 0.11 1 0.11 8 18.76
O 1 5 0.0229 7 15.34 7 14.46 2 0.55 2 0.53 4 9.05
K 1 6 0.0360 8 18.32 9 18.01 8 2.11 8 2.09 9 61.81
C 1 7 0.0368 2 2.39 1 2.08 5 0.80 5 0.78 2 4.87
C 2 8 0.0374 4 6.34 4 6.35 5 0.80 5 0.78 1 4.87
G 1 9 0.0515 3 6.27 3 5.22 7 1.13 7 1.09 7 16.38
≥20
seco
nds
Q 1 1 0.0027 21 213.08 21 212.69 16 1.13 15 1.08 10 9.14
Q 2 1 0.0027 19 163.65 19 161.02 16 1.13 15 1.08 9 9.14
V 2 3 0.0028 18 133.45 18 127.65 10 0.68 9 0.64 13 11.77
I 2 4 0.0030 25 385.14 25 338.88 27 4.37 27 4.30 21 30.83
D 2 4 0.0030 23 234.52 23 237.43 26 3.12 26 2.84 17 18.58
D 1 4 0.0030 16 73.01 15 70.99 25 3.10 25 2.84 17 18.58
L 2 7 0.0072 3 23.54 3 23.42 3 0.33 3 0.31 26 53.98
J 2 8 0.0143 7 36.19 7 33.35 9 0.66 10 0.65 7 8.30
S 2 9 0.0195 26 429.02 26 495.50 18 1.77 18 1.75 14 14.82
E 2 10 0.0202 27 500.30 27 518.11 11 0.70 11 0.70 23 33.41
E 1 11 0.0207 2 22.27 1 16.35 11 0.70 11 0.70 22 33.40
O 2 12 0.0214 10 45.52 10 43.53 4 0.55 4 0.53 8 9.05
S 1 13 0.0281 1 20.11 2 23.00 18 1.77 18 1.75 14 14.82
K 2 14 0.0286 6 32.68 6 32.93 20 2.11 20 2.09 27 61.81
G 2 15 0.0311 22 227.27 22 221.16 15 1.13 17 1.09 16 16.38
P 2 16 0.0333 17 114.37 17 101.16 13 0.77 13 0.72 19 21.41
U 1 17 0.0336 11 47.60 11 45.51 1 0.30 1 0.30 25 44.63
U 2 18 0.0358 24 252.04 24 240.40 1 0.30 1 0.30 24 37.35
T 2 19 0.0366 9 38.91 9 37.23 5 0.65 7 0.62 1 0.01
P 1 20 0.0370 14 63.41 14 63.65 13 0.77 13 0.72 20 21.42
F 1 21 0.0386 13 59.30 13 60.66 21 2.23 21 2.15 5 4.86
F 2 22 0.0412 15 71.45 16 73.95 21 2.23 21 2.15 5 4.86
H 2 23 0.0684 12 53.77 12 52.25 7 0.66 5 0.60 11 9.36
H 1 24 0.0686 8 37.65 8 36.71 7 0.66 5 0.60 12 9.36
M 2 25 NA 20 183.20 20 171.24 23 2.25 23 2.16 4 3.76
M 1 26 NA 5 32.59 5 31.44 23 2.25 23 2.16 3 3.75
T 1 27 NA 4 26.96 4 25.68 5 0.65 7 0.62 1 0.01
Table 21: Tabulation of ranked results for Class A — Left and Right Index. Submissions were split into two groups. The first group includes submissionsthat performed searches on average in less than 20 seconds, and the second includes those that took, on average, 20 seconds or longer. Letter refers to theparticipant’s letter code found on the footer of this page. Sub. # is an identifier used to differentiate between the two submissions each participant couldmake. The FNIR column was computed at the score threshold that gave FPIR = 10−3. NA indicates that the operations required to produce the valuecould not be performed. The Identification column shows the time used to perform a search over an enrollment set of 1 600 000, as seen in Table 18. TheSearch Enrollment column shows the time used to create a search template to be used for a query, as seen in Table 74. Identification and Search Enrollmentdurations are reported in seconds, but were originally recorded to microsecond precision. RAM refers to the sum of the resident set sizes of the stageone identification processes over all compute nodes after returning from the identification stage one initialization method, as seen in Table 62. RAM isreported in gigabytes, where 1 GB is equal to 1 073 741 824 bytes. The number to the left of a value provides the value’s column-wise ranking, with thebest performance shaded in green and the worst in pink. The table is sorted on the FNIR column-wise ranking.
C = afis team D = 3M Cogent E = Neurotechnology F = Papillon G = Dermalog H = Hisign Bio-Info InstituteI = NEC J = Sonda K = Tiger IT L = Innovatrics M = SPEX O = ID SolutionsP = id3 Q = Morpho S = Decatur Industries T = BIO-key U = Aware V = AA Technology

80 FPVTE – FINGERPRINT MATCHING
ParticipantFNIR
Identification Search EnrollmentRAM
Letter Sub. # Mean Median Mean Median
I 2 1 0.0009 20 60.01 16 43.86 30 19.36 30 19.36 21 108.71
Q 1 2 0.0012 14 48.85 14 42.92 20 8.89 20 8.92 1 7.54
Q 2 2 0.0012 24 71.67 24 66.01 20 8.89 20 8.92 2 7.54
I 1 2 0.0012 6 24.57 7 19.07 25 16.50 25 16.52 5 49.68
D 2 2 0.0012 19 54.37 18 46.70 24 11.90 24 11.86 13 79.43
D 1 6 0.0020 17 52.42 17 45.15 17 6.19 17 6.16 12 79.43
V 2 7 0.0024 15 49.72 19 49.30 3 3.35 7 3.36 9 63.53
E 2 7 0.0024 18 52.88 15 43.61 16 5.95 16 5.93 28 317.95
V 1 9 0.0027 10 35.51 10 34.96 3 3.35 7 3.36 8 63.53
L 1 10 0.0031 5 14.42 5 14.50 2 3.05 2 3.05 22 119.79
L 2 11 0.0033 8 28.56 9 28.59 1 0.88 1 0.88 27 177.48
J 2 11 0.0033 22 64.38 22 60.13 7 3.38 3 3.35 17 101.00
O 2 13 0.0035 21 63.87 21 60.02 5 3.38 5 3.36 20 101.00
G 2 14 0.0040 9 31.67 6 16.26 18 7.89 18 7.90 26 156.12
O 1 15 0.0041 11 37.04 11 35.64 5 3.38 5 3.36 19 101.00
E 1 16 0.0043 2 8.76 2 6.76 13 5.35 13 5.34 14 79.73
J 1 17 0.0049 7 26.31 8 25.38 7 3.38 3 3.35 18 101.00
G 1 18 0.0062 1 6.33 1 4.26 18 7.89 18 7.90 25 156.12
U 1 19 0.0099 30 88.83 28 86.60 15 5.90 15 5.82 29 440.68
S 1 20 0.0108 28 86.50 29 87.60 22 10.24 22 10.31 24 150.35
S 2 21 0.0136 29 88.70 30 88.46 22 10.24 22 10.31 23 150.35
U 2 22 0.0141 25 80.14 25 75.28 14 5.80 14 5.73 30 540.60
H 1 23 0.0203 26 82.43 26 82.66 9 4.37 9 4.37 15 86.46
H 2 24 0.0204 27 85.74 27 86.56 9 4.37 9 4.37 16 86.46
M 2 25 0.0515 23 70.45 23 65.91 26 18.36 28 18.11 6 57.53
M 1 26 0.0543 13 41.37 13 38.87 26 18.36 28 18.11 6 57.53
F 1 27 0.0591 12 39.12 12 37.56 28 18.36 26 18.07 10 77.02
F 2 27 0.0591 16 51.59 20 49.34 28 18.36 26 18.07 10 77.02
C 2 29 NA 4 10.28 4 10.21 11 5.16 11 5.13 4 46.49
C 1 30 NA 3 9.00 3 7.92 11 5.16 11 5.13 3 46.49
Table 22: Tabulation of ranked results for Class B — Identification Flats. Letter refers to the participant’s letter code found on the footer of this page. Sub.# is an identifier used to differentiate between the two submissions each participant could make. The FNIR column was computed at the score thresholdthat gave FPIR = 10−3. NA indicates that the operations required to produce the value could not be performed. The Identification column shows thetime used to perform a search over an enrollment set of 3 000 000, as seen in Table 19. The Search Enrollment column shows the time used to create asearch template to be used for a query, as seen in Table 78. Identification and Search Enrollment durations are reported in seconds, but were originallyrecorded to microsecond precision. RAM refers to the sum of the resident set sizes of the stage one identification processes over all compute nodes afterreturning from the identification stage one initialization method, as seen in Table 63. RAM is reported in gigabytes, where 1 GB is equal to 1 073 741 824bytes. The number to the left of a value provides the value’s column-wise ranking, with the best performance shaded in green and the worst in pink.The table is sorted on the FNIR column-wise ranking.
C = afis team D = 3M Cogent E = Neurotechnology F = Papillon G = Dermalog H = Hisign Bio-Info InstituteI = NEC J = Sonda K = Tiger IT L = Innovatrics M = SPEX O = ID SolutionsP = id3 Q = Morpho S = Decatur Industries T = BIO-key U = Aware V = AA Technology

FPVTE – FINGERPRINT MATCHING 81
ParticipantFNIR
Identification Search EnrollmentRAM
Letter Sub. # Mean Median Mean Median
I 1 1 0.0013 24 79.04 15 54.56 25 20.21 25 20.23 4 113.80
Q 2 2 0.0014 27 83.35 25 74.22 17 12.95 17 13.06 2 20.22
I 2 2 0.0014 9 40.53 7 30.82 24 18.72 24 18.73 11 137.03
D 1 4 0.0015 17 65.97 17 58.92 23 17.44 21 17.39 10 132.40
Q 1 5 0.0017 26 83.25 26 74.40 17 12.95 17 13.06 1 20.22
V 1 5 0.0017 10 40.94 10 40.74 9 8.48 9 8.50 17 234.03
D 2 7 0.0018 30 86.39 27 74.97 30 30.43 30 30.47 9 132.37
V 2 8 0.0019 16 65.47 18 65.07 9 8.48 9 8.50 18 234.03
O 2 9 0.0033 19 72.55 21 69.30 6 6.80 6 6.71 23 303.13
J 2 9 0.0033 20 72.62 19 67.98 8 6.82 8 6.74 24 303.13
O 1 11 0.0034 15 59.01 14 54.42 6 6.80 6 6.71 25 303.13
E 2 12 0.0050 14 57.02 11 42.73 11 9.89 11 9.91 30 930.48
J 1 13 0.0051 8 36.09 9 33.02 5 6.78 5 6.69 22 303.13
L 2 14 0.0083 3 19.52 5 20.25 3 4.36 3 4.36 26 367.82
C 2 15 0.0085 5 25.91 6 21.97 13 10.79 13 10.69 15 183.36
C 1 16 0.0094 4 25.25 4 20.15 13 10.79 13 10.69 14 183.36
L 1 17 0.0097 7 31.42 8 31.68 3 4.36 3 4.36 21 280.49
E 1 18 0.0106 1 9.52 2 8.63 12 9.90 12 9.92 16 191.66
H 2 19 0.0199 29 84.26 29 84.50 15 12.08 15 12.17 12 144.02
H 1 20 0.0201 28 84.14 30 84.51 15 12.08 15 12.17 13 144.02
G 2 21 0.0333 6 30.61 3 19.46 19 15.55 19 15.50 19 261.29
U 2 22 0.0351 23 74.39 24 72.48 1 2.94 1 2.87 28 806.17
U 1 23 0.0358 25 82.76 28 82.61 1 2.94 1 2.87 28 806.17
G 1 24 0.0447 2 11.67 1 7.78 19 15.55 19 15.50 20 261.29
F 1 25 0.0536 13 55.63 16 55.79 28 21.07 28 20.92 7 130.29
F 2 25 0.0536 18 68.61 20 68.20 28 21.07 28 20.92 6 130.29
M 2 27 0.0716 12 48.71 13 48.80 26 21.02 26 20.89 5 130.29
M 1 28 0.0783 11 47.38 12 48.08 26 21.02 26 20.89 8 130.29
S 1 29 0.0860 22 74.01 22 69.71 21 17.43 22 17.57 27 382.88
S 2 30 0.2462 21 72.95 23 70.77 21 17.43 22 17.57 3 78.28
Table 23: Tabulation of ranked results for Class C — Ten-Finger Rolled-to-Rolled. Letter refers to the participant’s letter code found on the footer of thispage. Sub. # is an identifier used to differentiate between the two submissions each participant could make. The FNIR column was computed at thescore threshold that gave FPIR = 10−3. The Identification column shows the time used to perform a search over an enrollment set of 5 000 000, as seenin Table 20. The Search Enrollment column shows the time used to create a search template to be used for a query, as seen in Table 80. Identification andSearch Enrollment durations are reported in seconds, but were originally recorded to microsecond precision. RAM refers to the sum of the resident setsizes of the stage one identification processes over all compute nodes after returning from the identification stage one initialization method, as seen inTable 65. RAM is reported in gigabytes, where 1 GB is equal to 1 073 741 824 bytes. The number to the left of a value provides the value’s column-wiseranking, with the best performance shaded in green and the worst in pink. The table is sorted on the FNIR column-wise ranking.
C = afis team D = 3M Cogent E = Neurotechnology F = Papillon G = Dermalog H = Hisign Bio-Info InstituteI = NEC J = Sonda K = Tiger IT L = Innovatrics M = SPEX O = ID SolutionsP = id3 Q = Morpho S = Decatur Industries T = BIO-key U = Aware V = AA Technology

82 FPVTE – FINGERPRINT MATCHING
11 How Many Fingers are Needed
It is already well known that using more fingers results in a lower FNIR [17]. This section combines the results fromFigures 12, 15, 18, and 21 into a single plot in Figure 72.
The reader is reminded that enrollment set sizes were 100 000 subjects for single index fingers, 1.6 million subjects for twoindex fingers, 3 million subjects for IDFlats, and 5 million for ten-finger rolled and plain impressions. The search set sizewas 30 000 that included 20 000 nonmate and 10 000 mate searches.
Additionally, Appendix J plots relative comparisons, by class, for each search set used in FpVTE.
Some observations regarding numbers of fingers include:
. More fingers were better and produced the most accurate results.
. More fingers took more time to enroll (Subsection 9.2)
. Ten-finger plain-to-plain impressions were as accurate as ten-finger rolled-to-rolled impressions with higher per-forming submissions.
. More fingers generally produce faster search times against very large enrollment sets (Section 8).
. Class B four-finger slap identification appeared to be less accurate than Class A two-finger identification. This needsfurther investigation as to the cause. Two possibilities are slap segmentation errors or fingerprint image quality.After manually inspecting some of the errors and considering the ten finger IDFlat and plain-to-plain results, itwould appear that image quality may have been the largest contributing factor.
● ●● ●
● ●● ●
●●
●●
●
●
●
● ●● ●
●●●●
●●
●●
●● ●●
● ●
● ●●
●
●
●
●●●●
●● ●●
●●●●
●● ●●
●●●●
● ●● ●
●●●●
● ●
● ●
●●
● ●
●
●
●● ●
●
●
●
●
●●
●
●
●
●
●●
●●
●●
●●
● ●
●
●
● ●
●●
●●
●●
●●
● ●
● ●
● ●
● ●
● ●
● ●
●●
●
●
●●
● ●
●●
●
●
●●
●●
●●
●●
●●
●●
●
●
●
●
● ●
● ●
● ●
● ●
●
●
●
●
●
●●
●
●
●
●
●
●
● ●
●
● ●
●
●
●●
●●
●●
●●
●●
●●
●●
●●
●●
●
●
●
●●
●
●
●
●
●
●
●●
●
● ●
● ●
● ●
● ●
●●
●●
●●
●●
●●
● ●
●
●
●
●
●
●
● ●
● ●●
●
●●
●●
●
●
●
●
●
●
●
●
● ●
● ●
● ●
●
●
●● ●
●
●
●
●
●
●
●
● ●●●
● ●
●● ●●
●
●
●
●●
●●
●
●
●●
●
●
●
●
●
●
●
●
● ●
● ●
● ●
0.001
0.002
0.005
0.010
0.020
0.050
0.100
0.200
I2 D2 I1 Q1 Q2 D1 E2 V2 V1 L1 J2 L2 O2 G2 O1 E1 J1 G1 U1 S1 S2 U2 H1 H2 M2 M1 F1 F2 C2 C1 K1 K2 P1 P2 T1 T2
Submission
FN
IR @
FP
IR =
10−3
●
●
●
●
●
●
●
●
●
●
Identification Flats
Left and Right Index
Left and Right Slap
Left Index
Left Slap
Right Index
Right Slap
Ten−Finger Plain−to−Plain
Ten−Finger Plain−to−Rolled
Ten−Finger Rolled−to−Rolled
Figure 72: Rank-sorted FNIR @ FPIR = 10−3 for All Classes. Submissions “1” and “2” from round 3.
C = afis team D = 3M Cogent E = Neurotechnology F = Papillon G = Dermalog H = Hisign Bio-Info InstituteI = NEC J = Sonda K = Tiger IT L = Innovatrics M = SPEX O = ID SolutionsP = id3 Q = Morpho S = Decatur Industries T = BIO-key U = Aware V = AA Technology
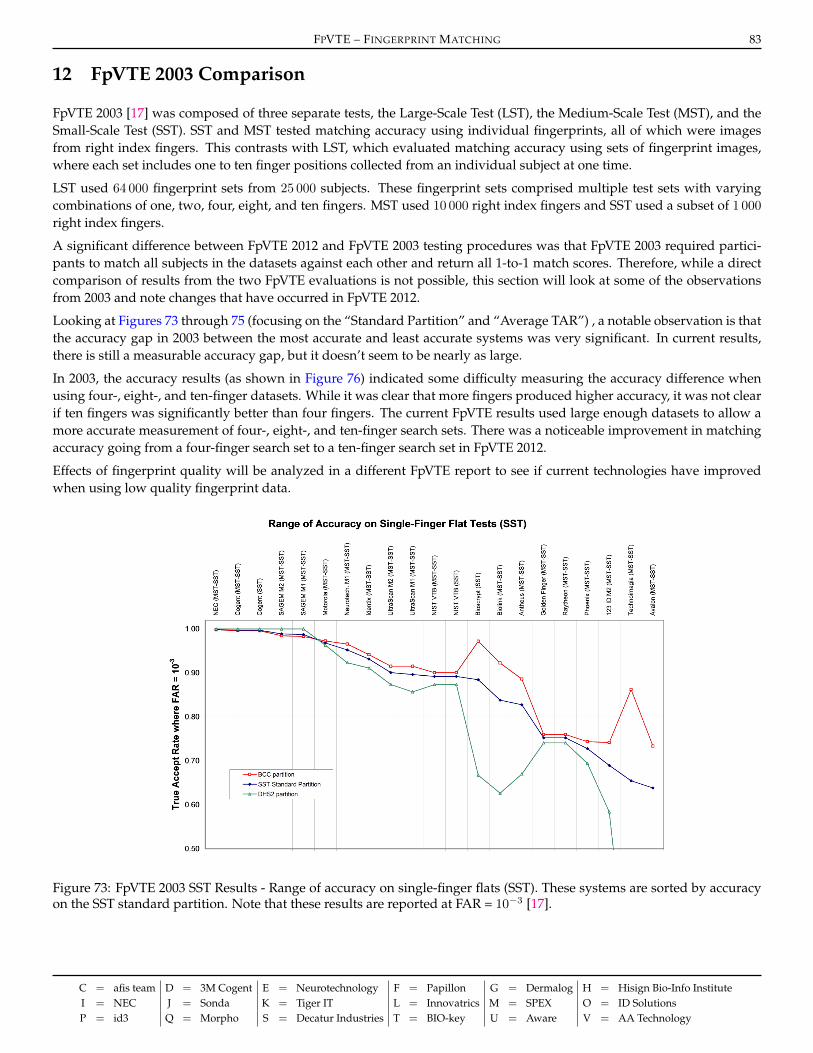
FPVTE – FINGERPRINT MATCHING 83
12 FpVTE 2003 Comparison
FpVTE 2003 [17] was composed of three separate tests, the Large-Scale Test (LST), the Medium-Scale Test (MST), and theSmall-Scale Test (SST). SST and MST tested matching accuracy using individual fingerprints, all of which were imagesfrom right index fingers. This contrasts with LST, which evaluated matching accuracy using sets of fingerprint images,where each set includes one to ten finger positions collected from an individual subject at one time.
LST used 64 000 fingerprint sets from 25 000 subjects. These fingerprint sets comprised multiple test sets with varyingcombinations of one, two, four, eight, and ten fingers. MST used 10 000 right index fingers and SST used a subset of 1 000right index fingers.
A significant difference between FpVTE 2012 and FpVTE 2003 testing procedures was that FpVTE 2003 required partici-pants to match all subjects in the datasets against each other and return all 1-to-1 match scores. Therefore, while a directcomparison of results from the two FpVTE evaluations is not possible, this section will look at some of the observationsfrom 2003 and note changes that have occurred in FpVTE 2012.
Looking at Figures 73 through 75 (focusing on the “Standard Partition” and “Average TAR”) , a notable observation is thatthe accuracy gap in 2003 between the most accurate and least accurate systems was very significant. In current results,there is still a measurable accuracy gap, but it doesn’t seem to be nearly as large.
In 2003, the accuracy results (as shown in Figure 76) indicated some difficulty measuring the accuracy difference whenusing four-, eight-, and ten-finger datasets. While it was clear that more fingers produced higher accuracy, it was not clearif ten fingers was significantly better than four fingers. The current FpVTE results used large enough datasets to allow amore accurate measurement of four-, eight-, and ten-finger search sets. There was a noticeable improvement in matchingaccuracy going from a four-finger search set to a ten-finger search set in FpVTE 2012.
Effects of fingerprint quality will be analyzed in a different FpVTE report to see if current technologies have improvedwhen using low quality fingerprint data.
Figure 73: FpVTE 2003 SST Results - Range of accuracy on single-finger flats (SST). These systems are sorted by accuracyon the SST standard partition. Note that these results are reported at FAR = 10−3 [17].
C = afis team D = 3M Cogent E = Neurotechnology F = Papillon G = Dermalog H = Hisign Bio-Info InstituteI = NEC J = Sonda K = Tiger IT L = Innovatrics M = SPEX O = ID SolutionsP = id3 Q = Morpho S = Decatur Industries T = BIO-key U = Aware V = AA Technology

84 FPVTE – FINGERPRINT MATCHING
Figure 74: FpVTE 2003 MST Results - Range of accuracy across 7 MST partitions. These systems are sorted by accuracy onthe standard MST, which is simply the combination of the other partitions [17].
Figure 75: FpVTE 2003 LST Results - Range of accuracy over 27 operational LST partitions. The systems are sorted by theiraverage accuracy over the 27 partitions. Note that sorting by median accuracy would change the order for some systems[17].
C = afis team D = 3M Cogent E = Neurotechnology F = Papillon G = Dermalog H = Hisign Bio-Info InstituteI = NEC J = Sonda K = Tiger IT L = Innovatrics M = SPEX O = ID SolutionsP = id3 Q = Morpho S = Decatur Industries T = BIO-key U = Aware V = AA Technology
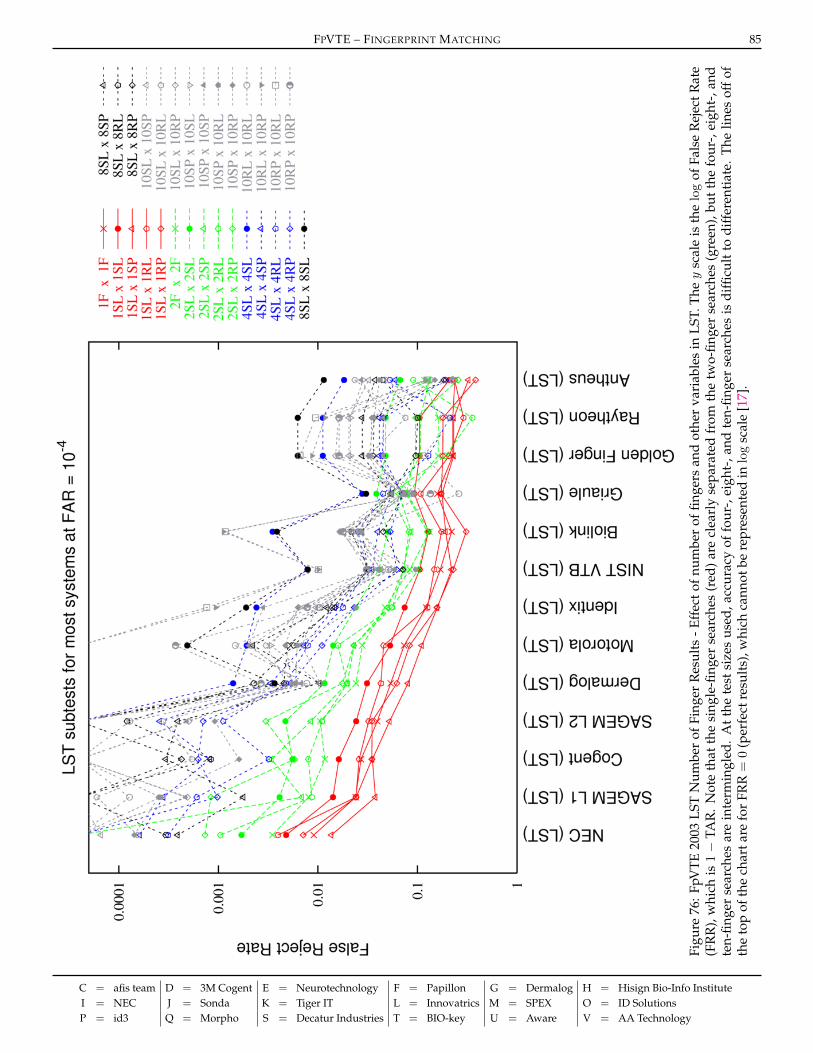
FPVTE – FINGERPRINT MATCHING 85
Figu
re76
:Fp
VTE
2003
LST
Num
ber
ofFi
nger
Res
ults
-Eff
ecto
fnum
ber
offin
gers
and
othe
rva
riab
les
inLS
T.Th
ey
scal
eis
thelog
ofFa
lse
Rej
ectR
ate
(FR
R),
whi
chis
1−
TAR
.N
ote
that
the
sing
le-fi
nger
sear
ches
(red
)ar
ecl
earl
yse
para
ted
from
the
two-
finge
rse
arch
es(g
reen
),bu
tthe
four
-,ei
ght-
,and
ten-
finge
rse
arch
esar
ein
term
ingl
ed.
Att
hete
stsi
zes
used
,acc
urac
yof
four
-,ei
ght-
,and
ten-
finge
rse
arch
esis
diffi
cult
todi
ffer
enti
ate.
The
lines
off
ofth
eto
pof
the
char
tare
for
FRR=
0(p
erfe
ctre
sult
s),w
hich
cann
otbe
repr
esen
ted
inlog
scal
e[1
7].
C = afis team D = 3M Cogent E = Neurotechnology F = Papillon G = Dermalog H = Hisign Bio-Info InstituteI = NEC J = Sonda K = Tiger IT L = Innovatrics M = SPEX O = ID SolutionsP = id3 Q = Morpho S = Decatur Industries T = BIO-key U = Aware V = AA Technology

86 FPVTE – FINGERPRINT MATCHING
13 Lessons Learned for Large-Scale Testing
. Failure Feedback: One of the most difficult aspects of validation was providing useful feedback to participants whenfailures occurred. The data used in FpVTE was sequestered operational data that could not be shared with partic-ipants. Some progress was made in FpVTE by allowing participants to write text-only logs, from their submissionexecuted at NIST, that could then be returned for analysis. NIST reviewed all logs to ensure the logs did not includeinformation related to the imagery or the NIST internal computing environment. Enhancements could be made tothe FpVTE API to allow the FpVTE test driver to toggle logging on and off, preventing participants from submittinga separate logging build while maintaining the speed of not logging under normal use.
. Two-Stage Matching Data Transfer: The FpVTE API specifies a 4 GB RAM disk to allow submissions to write dataduring the first stage of identification that could be referred to during the second stage. The intent was for allprocesses running on a compute node to share the same 4 GB RAM disk. As NIST did not say how many processeswould be run in parallel, it created problems for submissions that wrote a large amount of data per process duringthe first stage of identification. Without increasing the RAM disk size, NIST was forced to run fewer processes oneach compute node to avoid overfilling the RAM disk, which increased the evaluation time and wasted computenode resources. For instance, a compute node that would typically run twenty stage one identification processesmight be limited to running just two or three. Future evaluations should better define the expected RAM disk usage,a minimum number of concurrent processes, and other requirements needed to safely and effectively run multiplesearches in parallel.
. Shared Memory: A key feature of the FpVTE API was that a large enrollment set could be loaded in memory andshared among multiple processes in parallel. An important aspect in allowing this shared memory useage wasthat the memory must remain static after initialization (see Section 5 for details). This caused problems for someparticipants and took several validation iterations to correct.
. Additional Computational Statistics: The FpVTE test driver recorded the resident enrollment set size of identifi-cation stage one processes after returning from the identification stage one initialization method. It was expectedthat participants would use this method to load the entire enrollment set partition into RAM. While this was afairly good indicator of RAM requirements, some submissions allocated significantly more memory during the coreidentification stage one method, which in many cases required re-partitioning the enrollment set with an additionalcompute node. Should FpVTE be repeated, it would be more fair to record additional computational statistics, suchas peak RAM consumption over the execution time of the submission, since the RAM usage after initialization didnot completely represent the RAM resources required for some submissions to run.
. Timing Submissions: Keeping timing fair is a difficult task. The baseline of performing a timing test with only asingle FpVTE process running proved most successful at keeping timing fair for all participants. The timing test wasrun against the full enrollment set with the assumption that using a smaller enrollment set would cause the searchtimes to decrease. In cases where any unusual results were noticed, the timing tests were repeated to verify that theresults remained consistent.
. Enrollment and Re-enrollment: Enrolling the full datasets (≈ 11.4 million total subjects across all three classes) wasnot a trivial task. The original assumption was that this enrollment would only be performed for the first submis-sion and not need to be repeated with later submissions. This was not the case and greatly increased the overall timerequired to complete the evaluation. Any future evaluations of this magnitude should explore performing a “maxi-mum size” template extraction up front, then allowing for adjustments during the finalization stage to only use theminimum amount of information needed by the submissions. This could greatly reduce the need for re-enrollments.Care would need to be taken when reporting the “size” of the enrollment templates for each submission.
. Enrollment Size — Disk vs. RAM: Another failed assumption was that reporting the size of the template at extrac-tion would be a good indicator of how much RAM the enrollment set required (i.e., the Actual RAM and ReportedRAM columns from the tables Section 9 should be relatively close). For most submissions, this was true. Othersubmissions either compressed the templates and required more memory than it appeared they would need (at least
C = afis team D = 3M Cogent E = Neurotechnology F = Papillon G = Dermalog H = Hisign Bio-Info InstituteI = NEC J = Sonda K = Tiger IT L = Innovatrics M = SPEX O = ID SolutionsP = id3 Q = Morpho S = Decatur Industries T = BIO-key U = Aware V = AA Technology

FPVTE – FINGERPRINT MATCHING 87
one participant warned NIST that this would be the case) or they required less storage than the template sizes indi-cated they would need (again, at least one participant sent a warning about this issue). While the FpVTE API triedto prevent this by asking for both memory usage in RAM and on disk, there was confusion among the participantson what values, if any, to return. For example, many participants were confused on how to report memory usage ofslap images—the participant would segment the fingers and return a single template, but report back four separateRAM usage values. Future evaluations will need to provide better guidance on this issue.
. Consolidations of Nonmate Searches: A large amount of unexpected time was spent performing consolidations onthe “back-end” of the searches. There proved to be a lot more consolidations to examine than originally expected. Ittook two to three months to clean these up before meaningful results could be produced. A significant improvementto this issue was the decision to flip nonmate search images, as discussed in Subsection 6.5.
. Operational Sequestered Data: Participants were able to learn things about their specific submissions even thoughthey may not have been one of the top performers. Some participants shared with NIST that they were grateful to teston the large sample of sequestered operational data to which they might not otherwise have access. They may nothave had the best performance, but they were looking to learn about limitations with their submissions and makeimprovements, which was one of stated goals of FpVTE. This should continue to help advance fingerprint matchingtechnologies and support the NIST mission of, “promoting U.S. innovation and industrial competitiveness”.
C = afis team D = 3M Cogent E = Neurotechnology F = Papillon G = Dermalog H = Hisign Bio-Info InstituteI = NEC J = Sonda K = Tiger IT L = Innovatrics M = SPEX O = ID SolutionsP = id3 Q = Morpho S = Decatur Industries T = BIO-key U = Aware V = AA Technology
88 FPVTE – FINGERPRINT MATCHING
14 Way Forward
NIST plans to publish further research and analysis in addition to this initial results report, including:
. running larger search sets (300 000 nonmates and 50 000 mates) so that DET curves can show accuracy with FPIRrates below 10−3;
. performing failure analysis in an attempt to determine if there are common failures among submissions and whatcauses those failures. Some things to examine during failure analysis include image quality, segmentation errors,gender differences, and consolidation errors;
. performing analysis of results based on NFIQ values for the datasets;
. looking at accuracy of subgroups of metadata, such as male versus female.
. performing further analysis and testing to determine possible causes for four-finger IDFlat slap images being lessaccurate than two-index finger single-capture images;
If FpVTE were to be repeated, it might be useful to concentrate more on throughput versus accuracy. For instance, ratherthan set a single maximum search time of 90 seconds, the evaluation could have several search time maximums in an effortto see how different search times impact matching accuracy. It was clear during this evaluation that some participants havefiner-grained control over the speed in which searches were performed. A speed-vs-accuracy track/competition wouldbe useful.
14.1 Related Testing
14.1.1 Forensic Palmprint
As data becomes available, the protocols from this evaluation could be applied to perform an evaluation for latent palm-print matching.
14.1.2 Mobile Data
NIST has performed some testing with simulated mobile data, but future evaluations should look at using operationalmobile data in the search sets to see how it impacts performance of matching algorithms.
14.1.3 Cross-Comparison of Modalities
Additional testing will compare the performance of fingerprint, face, and iris matching algorithms, in which all use asearch set of 1.6 million subjects. While the datasets will be captured from different sources and subjects, this will be oneof the first steps in comparing different modalities on similar sample sizes.
C = afis team D = 3M Cogent E = Neurotechnology F = Papillon G = Dermalog H = Hisign Bio-Info InstituteI = NEC J = Sonda K = Tiger IT L = Innovatrics M = SPEX O = ID SolutionsP = id3 Q = Morpho S = Decatur Industries T = BIO-key U = Aware V = AA Technology

FPVTE – FINGERPRINT MATCHING 89
References
[1] CHAMBERS, J., CLEVELAND, W., KLEINER, B., AND TUKEY, P. Graphical Methods for Data Analysis. WadsworthBrooks/Cole, 1983. 198
[2] CRIMINAL JUSTICE INFORMATION SERVICES DIVISION — FEDERAL BUREAU OF INVESTIGATION. IAFIS-IC-0110(V3.1) WSQ Gray-scale Fingerprint Image Compression Specification, 2010. 6
[3] GROTHER, P., MICHAELS, R., AND PHILLIPS, P. J. Face Recognition Vendor Test 2002 Performance Metrics. In Audio-and Video-Based Biometric Person Authentication: 4th International Conference, AVBPA 2003, Guildford, UK, June 9–11, 2003Proceedings (June 2003), J. Kittler and M. S. Nixon, Eds., vol. 2688, Springer Berlin Heidelberg, pp. 937–945. 1
[4] GROTHER, P., QUINN, G., MATEY, J., NGAN, M., SALAMON, W., FIUMARA, G., AND WATSON, C. Iris Exchange III.NIST Interagency Report 7836 (2012). 18
[5] IMAGE GROUP — NIST. NIST Biometric Evaluations Website. http://www.nist.gov/itl/iad/ig/biometric_
evaluations.cfm. 3
[6] INTERNATIONAL COMMITTEE FOR INFORMATION TECHNOLOGY STANDARDS. American National Standard for Infor-mation Technology - Finger Minutiae Format for Data Interchange, ANSI/INCITS 378-2004, 2004. 3
[7] ISO/IEC JTC 1 SC 37. Information technology – Vocabulary – Part 37: Biometrics. http://standards.iso.org/
ittf/PubliclyAvailableStandards/c055194_ISOIEC_2382-37_2012.zip, 2012. 1
[8] KOMARINSKI, P. Automated Fingerprint Identification Systems (AFIS), 1st ed. Elsevier, 2004. ISBN 9780080475981. 19
[9] MARTIN, A. F., DODDINGTON, G. R., TERRI KAMM, M. O., AND PRZYBOCKI, M. A. The DET curve in assessmentof detection task performance, 1997. 18
[10] OPEN MPI PROJECT. Open MPI: Open Source High Performance Computing. http://www.open-mpi.org/, 2014.[Online; accessed 22 October 2014]. 11
[11] SALAMON, W., AND FIUMARA, G. Biometric Evaluation Framework. http://www.nist.gov/itl/iad/ig/framework.cfm, 2014. [Online; accessed 28 August 2014]. 11
[12] TABASSI, E., AND WILSON, C. L. A novel approach to fingerprint image quality. In Image Processing, 2005. ICIP 2005.IEEE International Conference on (Sept 2005), vol. 2, pp. II–37–40. 6
[13] TABASSI, E., WILSON, C. L., AND WATSON, C. I. Fingerprint Image Quality. NIST Interagency Report 7151 (2004). 6
[14] WATSON, C., GARRIS, M. D., TABASSI, E., WILSON, C. L., MCCABE, R. M., JANET, S., AND KO, K. User’s Guide toExport Controlled Distribution of NIST Biometric Image Software (NBIS-EC). NIST Interagency Report 7391 (2007). 6
[15] WATSON, C., SALAMON, W., AND FIUMARA, G. Fingerprint Vendor Technology Evaluation Implementer’s Guide. Na-tional Institute of Standards and Technology, http://nigos.nist.gov:8080/evaluations/fpvte2012/FPVTE2012_API_Plan_full_060712.pdf, July 2012. xvi, 1, 61
[16] WAYMAN, J., JAIN, A., MALTONI, D., AND MAI, D. Biometric Systems: Technology, Design and PerformanceEvaluation, 2005. ISBN 1852335963. 19
[17] WILSON, C., HICKLIN, R. A., BONE, M., KORVES, H., GROTHER, P., ULERY, B., MICHEALS, R., ZOEPFL, M., OTTO,S., AND WATSON, C. Fingerprint Vendor Technology Evaluation 2003. NIST Interagency Report 7123 (2004). 82, 83,84, 85
C = afis team D = 3M Cogent E = Neurotechnology F = Papillon G = Dermalog H = Hisign Bio-Info InstituteI = NEC J = Sonda K = Tiger IT L = Innovatrics M = SPEX O = ID SolutionsP = id3 Q = Morpho S = Decatur Industries T = BIO-key U = Aware V = AA Technology

90 FPVTE – FINGERPRINT MATCHING
A Individual Participant FNIR Plots
This appendix contains a full size DET curve for every participant in FpVTE. The reader is reminded that enrollment setsizes were 100 000 subjects for single index fingers, 1.6 million subjects for two index fingers, 3 million subjects for IDFlats,and 5 million for ten-finger rolled and plain impressions.
C = afis team D = 3M Cogent E = Neurotechnology F = Papillon G = Dermalog H = Hisign Bio-Info InstituteI = NEC J = Sonda K = Tiger IT L = Innovatrics M = SPEX O = ID SolutionsP = id3 Q = Morpho S = Decatur Industries T = BIO-key U = Aware V = AA Technology

FPVTE – FINGERPRINT MATCHING 91
Fals
e P
ositi
ve Id
entif
icat
ion
Rat
e
False Negative Identification Rate
0.00
05
0.00
10
0.00
20
0.00
50
0.01
00
0.02
00
0.05
00
0.10
00
0.20
00
0.50
00
0.00
050.
0010
0.00
200.
0050
0.01
000.
0200
0.05
000.
1000
0.20
000.
5000
Left
Inde
x (1
)R
ight
Inde
x (1
)Le
ft an
d R
ight
Inde
x (1
)R
ight
Sla
p (1
)Le
ft S
lap
(1)
Left
and
Rig
ht S
lap
(1)
Iden
tific
atio
n F
lats
(1)
Ten−
Fin
ger
Pla
in−
to−
Pla
in (
1)Te
n−F
inge
r R
olle
d−to
−R
olle
d (1
)Te
n−F
inge
r P
lain
−to
−R
olle
d (1
)
Left
Inde
x (2
)R
ight
Inde
x (2
)Le
ft an
d R
ight
Inde
x (2
)R
ight
Sla
p (2
)Le
ft S
lap
(2)
Left
and
Rig
ht S
lap
(2)
Iden
tific
atio
n F
lats
(2)
Ten−
Fin
ger
Pla
in−
to−
Pla
in (
2)Te
n−F
inge
r R
olle
d−to
−R
olle
d (2
)Te
n−F
inge
r P
lain
−to
−R
olle
d (2
)
Figu
re77
:DET
for
Part
icip
antC
—A
llfin
gers
wit
hm
axim
umen
rollm
ents
ets
for
each
clas
s.
C = afis team D = 3M Cogent E = Neurotechnology F = Papillon G = Dermalog H = Hisign Bio-Info InstituteI = NEC J = Sonda K = Tiger IT L = Innovatrics M = SPEX O = ID SolutionsP = id3 Q = Morpho S = Decatur Industries T = BIO-key U = Aware V = AA Technology

92 FPVTE – FINGERPRINT MATCHING
False Positive Identification R
ate
False Negative Identification Rate
0.0005
0.0010
0.0020
0.0050
0.0100
0.0200
0.0500
0.1000
0.2000
0.50000.00050.0010
0.00200.0050
0.01000.0200
0.05000.1000
0.20000.5000
Left Index (1)R
ight Index (1)Left and R
ight Index (1)R
ight Slap (1)
Left Slap (1)
Left and Right S
lap (1)Identification F
lats (1)Ten−
Finger P
lain−to−
Plain (1)
Ten−F
inger Rolled−
to−R
olled (1)Ten−
Finger P
lain−to−
Rolled (1)
Left Index (2)R
ight Index (2)Left and R
ight Index (2)R
ight Slap (2)
Left Slap (2)
Left and Right S
lap (2)Identification F
lats (2)Ten−
Finger P
lain−to−
Plain (2)
Ten−F
inger Rolled−
to−R
olled (2)Ten−
Finger P
lain−to−
Rolled (2)
Figure78:D
ETfor
ParticipantD—
Allfingers
with
maxim
umenrollm
entsetsfor
eachclass.
C = afis team D = 3M Cogent E = Neurotechnology F = Papillon G = Dermalog H = Hisign Bio-Info InstituteI = NEC J = Sonda K = Tiger IT L = Innovatrics M = SPEX O = ID SolutionsP = id3 Q = Morpho S = Decatur Industries T = BIO-key U = Aware V = AA Technology

FPVTE – FINGERPRINT MATCHING 93
Fals
e P
ositi
ve Id
entif
icat
ion
Rat
e
False Negative Identification Rate
0.00
05
0.00
10
0.00
20
0.00
50
0.01
00
0.02
00
0.05
00
0.10
00
0.20
00
0.50
00
0.00
050.
0010
0.00
200.
0050
0.01
000.
0200
0.05
000.
1000
0.20
000.
5000
Left
Inde
x (1
)R
ight
Inde
x (1
)Le
ft an
d R
ight
Inde
x (1
)R
ight
Sla
p (1
)Le
ft S
lap
(1)
Left
and
Rig
ht S
lap
(1)
Iden
tific
atio
n F
lats
(1)
Ten−
Fin
ger
Pla
in−
to−
Pla
in (
1)Te
n−F
inge
r R
olle
d−to
−R
olle
d (1
)Te
n−F
inge
r P
lain
−to
−R
olle
d (1
)
Left
Inde
x (2
)R
ight
Inde
x (2
)Le
ft an
d R
ight
Inde
x (2
)R
ight
Sla
p (2
)Le
ft S
lap
(2)
Left
and
Rig
ht S
lap
(2)
Iden
tific
atio
n F
lats
(2)
Ten−
Fin
ger
Pla
in−
to−
Pla
in (
2)Te
n−F
inge
r R
olle
d−to
−R
olle
d (2
)Te
n−F
inge
r P
lain
−to
−R
olle
d (2
)
Figu
re79
:DET
for
Part
icip
antE
—A
llfin
gers
wit
hm
axim
umen
rollm
ents
ets
for
each
clas
s.
C = afis team D = 3M Cogent E = Neurotechnology F = Papillon G = Dermalog H = Hisign Bio-Info InstituteI = NEC J = Sonda K = Tiger IT L = Innovatrics M = SPEX O = ID SolutionsP = id3 Q = Morpho S = Decatur Industries T = BIO-key U = Aware V = AA Technology

94 FPVTE – FINGERPRINT MATCHING
False Positive Identification R
ate
False Negative Identification Rate
0.0005
0.0010
0.0020
0.0050
0.0100
0.0200
0.0500
0.1000
0.2000
0.50000.00050.0010
0.00200.0050
0.01000.0200
0.05000.1000
0.20000.5000
Left Index (1)R
ight Index (1)Left and R
ight Index (1)R
ight Slap (1)
Left Slap (1)
Left and Right S
lap (1)Identification F
lats (1)Ten−
Finger P
lain−to−
Plain (1)
Ten−F
inger Rolled−
to−R
olled (1)Ten−
Finger P
lain−to−
Rolled (1)
Left Index (2)R
ight Index (2)Left and R
ight Index (2)R
ight Slap (2)
Left Slap (2)
Left and Right S
lap (2)Identification F
lats (2)Ten−
Finger P
lain−to−
Plain (2)
Ten−F
inger Rolled−
to−R
olled (2)Ten−
Finger P
lain−to−
Rolled (2)
Figure80:D
ETfor
ParticipantF—
Allfingers
with
maxim
umenrollm
entsetsfor
eachclass.
C = afis team D = 3M Cogent E = Neurotechnology F = Papillon G = Dermalog H = Hisign Bio-Info InstituteI = NEC J = Sonda K = Tiger IT L = Innovatrics M = SPEX O = ID SolutionsP = id3 Q = Morpho S = Decatur Industries T = BIO-key U = Aware V = AA Technology

FPVTE – FINGERPRINT MATCHING 95
Fals
e P
ositi
ve Id
entif
icat
ion
Rat
e
False Negative Identification Rate
0.00
05
0.00
10
0.00
20
0.00
50
0.01
00
0.02
00
0.05
00
0.10
00
0.20
00
0.50
00
0.00
050.
0010
0.00
200.
0050
0.01
000.
0200
0.05
000.
1000
0.20
000.
5000
Left
Inde
x (1
)R
ight
Inde
x (1
)Le
ft an
d R
ight
Inde
x (1
)R
ight
Sla
p (1
)Le
ft S
lap
(1)
Left
and
Rig
ht S
lap
(1)
Iden
tific
atio
n F
lats
(1)
Ten−
Fin
ger
Pla
in−
to−
Pla
in (
1)Te
n−F
inge
r R
olle
d−to
−R
olle
d (1
)Te
n−F
inge
r P
lain
−to
−R
olle
d (1
)
Left
Inde
x (2
)R
ight
Inde
x (2
)Le
ft an
d R
ight
Inde
x (2
)R
ight
Sla
p (2
)Le
ft S
lap
(2)
Left
and
Rig
ht S
lap
(2)
Iden
tific
atio
n F
lats
(2)
Ten−
Fin
ger
Pla
in−
to−
Pla
in (
2)Te
n−F
inge
r R
olle
d−to
−R
olle
d (2
)Te
n−F
inge
r P
lain
−to
−R
olle
d (2
)
Figu
re81
:DET
for
Part
icip
antG
—A
llfin
gers
wit
hm
axim
umen
rollm
ents
ets
for
each
clas
s.
C = afis team D = 3M Cogent E = Neurotechnology F = Papillon G = Dermalog H = Hisign Bio-Info InstituteI = NEC J = Sonda K = Tiger IT L = Innovatrics M = SPEX O = ID SolutionsP = id3 Q = Morpho S = Decatur Industries T = BIO-key U = Aware V = AA Technology

96 FPVTE – FINGERPRINT MATCHING
False Positive Identification R
ate
False Negative Identification Rate
0.0005
0.0010
0.0020
0.0050
0.0100
0.0200
0.0500
0.1000
0.2000
0.50000.00050.0010
0.00200.0050
0.01000.0200
0.05000.1000
0.20000.5000
Left Index (1)R
ight Index (1)Left and R
ight Index (1)R
ight Slap (1)
Left Slap (1)
Left and Right S
lap (1)Identification F
lats (1)Ten−
Finger P
lain−to−
Plain (1)
Ten−F
inger Rolled−
to−R
olled (1)Ten−
Finger P
lain−to−
Rolled (1)
Left Index (2)R
ight Index (2)Left and R
ight Index (2)R
ight Slap (2)
Left Slap (2)
Left and Right S
lap (2)Identification F
lats (2)Ten−
Finger P
lain−to−
Plain (2)
Ten−F
inger Rolled−
to−R
olled (2)Ten−
Finger P
lain−to−
Rolled (2)
Figure82:D
ETfor
ParticipantH—
Allfingers
with
maxim
umenrollm
entsetsfor
eachclass.
C = afis team D = 3M Cogent E = Neurotechnology F = Papillon G = Dermalog H = Hisign Bio-Info InstituteI = NEC J = Sonda K = Tiger IT L = Innovatrics M = SPEX O = ID SolutionsP = id3 Q = Morpho S = Decatur Industries T = BIO-key U = Aware V = AA Technology

FPVTE – FINGERPRINT MATCHING 97
Fals
e P
ositi
ve Id
entif
icat
ion
Rat
e
False Negative Identification Rate
0.00
05
0.00
10
0.00
20
0.00
50
0.01
00
0.02
00
0.05
00
0.10
00
0.20
00
0.50
00
0.00
050.
0010
0.00
200.
0050
0.01
000.
0200
0.05
000.
1000
0.20
000.
5000
Left
Inde
x (1
)R
ight
Inde
x (1
)Le
ft an
d R
ight
Inde
x (1
)R
ight
Sla
p (1
)Le
ft S
lap
(1)
Left
and
Rig
ht S
lap
(1)
Iden
tific
atio
n F
lats
(1)
Ten−
Fin
ger
Pla
in−
to−
Pla
in (
1)Te
n−F
inge
r R
olle
d−to
−R
olle
d (1
)Te
n−F
inge
r P
lain
−to
−R
olle
d (1
)
Left
Inde
x (2
)R
ight
Inde
x (2
)Le
ft an
d R
ight
Inde
x (2
)R
ight
Sla
p (2
)Le
ft S
lap
(2)
Left
and
Rig
ht S
lap
(2)
Iden
tific
atio
n F
lats
(2)
Ten−
Fin
ger
Pla
in−
to−
Pla
in (
2)Te
n−F
inge
r R
olle
d−to
−R
olle
d (2
)Te
n−F
inge
r P
lain
−to
−R
olle
d (2
)
Figu
re83
:DET
for
Part
icip
antI
—A
llfin
gers
wit
hm
axim
umen
rollm
ents
ets
for
each
clas
s.
C = afis team D = 3M Cogent E = Neurotechnology F = Papillon G = Dermalog H = Hisign Bio-Info InstituteI = NEC J = Sonda K = Tiger IT L = Innovatrics M = SPEX O = ID SolutionsP = id3 Q = Morpho S = Decatur Industries T = BIO-key U = Aware V = AA Technology

98 FPVTE – FINGERPRINT MATCHING
False Positive Identification R
ate
False Negative Identification Rate
0.0005
0.0010
0.0020
0.0050
0.0100
0.0200
0.0500
0.1000
0.2000
0.50000.00050.0010
0.00200.0050
0.01000.0200
0.05000.1000
0.20000.5000
Left Index (1)R
ight Index (1)Left and R
ight Index (1)R
ight Slap (1)
Left Slap (1)
Left and Right S
lap (1)Identification F
lats (1)Ten−
Finger P
lain−to−
Plain (1)
Ten−F
inger Rolled−
to−R
olled (1)Ten−
Finger P
lain−to−
Rolled (1)
Left Index (2)R
ight Index (2)Left and R
ight Index (2)R
ight Slap (2)
Left Slap (2)
Left and Right S
lap (2)Identification F
lats (2)Ten−
Finger P
lain−to−
Plain (2)
Ten−F
inger Rolled−
to−R
olled (2)Ten−
Finger P
lain−to−
Rolled (2)
Figure84:D
ETfor
ParticipantJ—A
llfingersw
ithm
aximum
enrollmentsets
foreach
class.
C = afis team D = 3M Cogent E = Neurotechnology F = Papillon G = Dermalog H = Hisign Bio-Info InstituteI = NEC J = Sonda K = Tiger IT L = Innovatrics M = SPEX O = ID SolutionsP = id3 Q = Morpho S = Decatur Industries T = BIO-key U = Aware V = AA Technology

FPVTE – FINGERPRINT MATCHING 99
Fals
e P
ositi
ve Id
entif
icat
ion
Rat
e
False Negative Identification Rate
0.00
05
0.00
10
0.00
20
0.00
50
0.01
00
0.02
00
0.05
00
0.10
00
0.20
00
0.50
00
0.00
050.
0010
0.00
200.
0050
0.01
000.
0200
0.05
000.
1000
0.20
000.
5000
Left
Inde
x (1
)R
ight
Inde
x (1
)Le
ft an
d R
ight
Inde
x (1
)Le
ft In
dex
(2)
Rig
ht In
dex
(2)
Left
and
Rig
ht In
dex
(2)
Figu
re85
:DET
for
Part
icip
antK
—A
llfin
gers
wit
hm
axim
umen
rollm
ents
ets
for
each
clas
s.
C = afis team D = 3M Cogent E = Neurotechnology F = Papillon G = Dermalog H = Hisign Bio-Info InstituteI = NEC J = Sonda K = Tiger IT L = Innovatrics M = SPEX O = ID SolutionsP = id3 Q = Morpho S = Decatur Industries T = BIO-key U = Aware V = AA Technology

100 FPVTE – FINGERPRINT MATCHING
False Positive Identification R
ate
False Negative Identification Rate
0.0005
0.0010
0.0020
0.0050
0.0100
0.0200
0.0500
0.1000
0.2000
0.50000.00050.0010
0.00200.0050
0.01000.0200
0.05000.1000
0.20000.5000
Left Index (1)R
ight Index (1)Left and R
ight Index (1)R
ight Slap (1)
Left Slap (1)
Left and Right S
lap (1)Identification F
lats (1)Ten−
Finger P
lain−to−
Plain (1)
Ten−F
inger Rolled−
to−R
olled (1)Ten−
Finger P
lain−to−
Rolled (1)
Left Index (2)R
ight Index (2)Left and R
ight Index (2)R
ight Slap (2)
Left Slap (2)
Left and Right S
lap (2)Identification F
lats (2)Ten−
Finger P
lain−to−
Plain (2)
Ten−F
inger Rolled−
to−R
olled (2)Ten−
Finger P
lain−to−
Rolled (2)
Figure86:D
ETfor
ParticipantL—
Allfingers
with
maxim
umenrollm
entsetsfor
eachclass.
C = afis team D = 3M Cogent E = Neurotechnology F = Papillon G = Dermalog H = Hisign Bio-Info InstituteI = NEC J = Sonda K = Tiger IT L = Innovatrics M = SPEX O = ID SolutionsP = id3 Q = Morpho S = Decatur Industries T = BIO-key U = Aware V = AA Technology

FPVTE – FINGERPRINT MATCHING 101
Fals
e P
ositi
ve Id
entif
icat
ion
Rat
e
False Negative Identification Rate
0.00
05
0.00
10
0.00
20
0.00
50
0.01
00
0.02
00
0.05
00
0.10
00
0.20
00
0.50
00
0.00
050.
0010
0.00
200.
0050
0.01
000.
0200
0.05
000.
1000
0.20
000.
5000
Left
Inde
x (1
)R
ight
Inde
x (1
)Le
ft an
d R
ight
Inde
x (1
)R
ight
Sla
p (1
)Le
ft S
lap
(1)
Left
and
Rig
ht S
lap
(1)
Iden
tific
atio
n F
lats
(1)
Ten−
Fin
ger
Pla
in−
to−
Pla
in (
1)Te
n−F
inge
r R
olle
d−to
−R
olle
d (1
)Te
n−F
inge
r P
lain
−to
−R
olle
d (1
)
Left
Inde
x (2
)R
ight
Inde
x (2
)Le
ft an
d R
ight
Inde
x (2
)R
ight
Sla
p (2
)Le
ft S
lap
(2)
Left
and
Rig
ht S
lap
(2)
Iden
tific
atio
n F
lats
(2)
Ten−
Fin
ger
Pla
in−
to−
Pla
in (
2)Te
n−F
inge
r R
olle
d−to
−R
olle
d (2
)Te
n−F
inge
r P
lain
−to
−R
olle
d (2
)
Figu
re87
:DET
for
Part
icip
antM
—A
llfin
gers
wit
hm
axim
umen
rollm
ents
ets
for
each
clas
s.
C = afis team D = 3M Cogent E = Neurotechnology F = Papillon G = Dermalog H = Hisign Bio-Info InstituteI = NEC J = Sonda K = Tiger IT L = Innovatrics M = SPEX O = ID SolutionsP = id3 Q = Morpho S = Decatur Industries T = BIO-key U = Aware V = AA Technology

102 FPVTE – FINGERPRINT MATCHING
False Positive Identification R
ate
False Negative Identification Rate
0.0005
0.0010
0.0020
0.0050
0.0100
0.0200
0.0500
0.1000
0.2000
0.50000.00050.0010
0.00200.0050
0.01000.0200
0.05000.1000
0.20000.5000
Left Index (1)R
ight Index (1)Left and R
ight Index (1)R
ight Slap (1)
Left Slap (1)
Left and Right S
lap (1)Identification F
lats (1)Ten−
Finger P
lain−to−
Plain (1)
Ten−F
inger Rolled−
to−R
olled (1)Ten−
Finger P
lain−to−
Rolled (1)
Left Index (2)R
ight Index (2)Left and R
ight Index (2)R
ight Slap (2)
Left Slap (2)
Left and Right S
lap (2)Identification F
lats (2)Ten−
Finger P
lain−to−
Plain (2)
Ten−F
inger Rolled−
to−R
olled (2)Ten−
Finger P
lain−to−
Rolled (2)
Figure88:D
ETfor
ParticipantO—
Allfingers
with
maxim
umenrollm
entsetsfor
eachclass.
C = afis team D = 3M Cogent E = Neurotechnology F = Papillon G = Dermalog H = Hisign Bio-Info InstituteI = NEC J = Sonda K = Tiger IT L = Innovatrics M = SPEX O = ID SolutionsP = id3 Q = Morpho S = Decatur Industries T = BIO-key U = Aware V = AA Technology

FPVTE – FINGERPRINT MATCHING 103
Fals
e P
ositi
ve Id
entif
icat
ion
Rat
e
False Negative Identification Rate
0.00
05
0.00
10
0.00
20
0.00
50
0.01
00
0.02
00
0.05
00
0.10
00
0.20
00
0.50
00
0.00
050.
0010
0.00
200.
0050
0.01
000.
0200
0.05
000.
1000
0.20
000.
5000
Left
Inde
x (1
)R
ight
Inde
x (1
)Le
ft an
d R
ight
Inde
x (1
)Le
ft In
dex
(2)
Rig
ht In
dex
(2)
Left
and
Rig
ht In
dex
(2)
Figu
re89
:DET
for
Part
icip
antP
—A
llfin
gers
wit
hm
axim
umen
rollm
ents
ets
for
each
clas
s.
C = afis team D = 3M Cogent E = Neurotechnology F = Papillon G = Dermalog H = Hisign Bio-Info InstituteI = NEC J = Sonda K = Tiger IT L = Innovatrics M = SPEX O = ID SolutionsP = id3 Q = Morpho S = Decatur Industries T = BIO-key U = Aware V = AA Technology

104 FPVTE – FINGERPRINT MATCHING
False Positive Identification R
ate
False Negative Identification Rate
0.0005
0.0010
0.0020
0.0050
0.0100
0.0200
0.0500
0.1000
0.2000
0.50000.00050.0010
0.00200.0050
0.01000.0200
0.05000.1000
0.20000.5000
Left Index (1)R
ight Index (1)Left and R
ight Index (1)R
ight Slap (1)
Left Slap (1)
Left and Right S
lap (1)Identification F
lats (1)Ten−
Finger P
lain−to−
Plain (1)
Ten−F
inger Rolled−
to−R
olled (1)Ten−
Finger P
lain−to−
Rolled (1)
Left Index (2)R
ight Index (2)Left and R
ight Index (2)R
ight Slap (2)
Left Slap (2)
Left and Right S
lap (2)Identification F
lats (2)Ten−
Finger P
lain−to−
Plain (2)
Ten−F
inger Rolled−
to−R
olled (2)Ten−
Finger P
lain−to−
Rolled (2)
Figure90:D
ETfor
ParticipantQ—
Allfingers
with
maxim
umenrollm
entsetsfor
eachclass.
C = afis team D = 3M Cogent E = Neurotechnology F = Papillon G = Dermalog H = Hisign Bio-Info InstituteI = NEC J = Sonda K = Tiger IT L = Innovatrics M = SPEX O = ID SolutionsP = id3 Q = Morpho S = Decatur Industries T = BIO-key U = Aware V = AA Technology

FPVTE – FINGERPRINT MATCHING 105
Fals
e P
ositi
ve Id
entif
icat
ion
Rat
e
False Negative Identification Rate
0.00
05
0.00
10
0.00
20
0.00
50
0.01
00
0.02
00
0.05
00
0.10
00
0.20
00
0.50
00
0.00
050.
0010
0.00
200.
0050
0.01
000.
0200
0.05
000.
1000
0.20
000.
5000
Left
Inde
x (1
)R
ight
Inde
x (1
)Le
ft an
d R
ight
Inde
x (1
)R
ight
Sla
p (1
)Le
ft S
lap
(1)
Left
and
Rig
ht S
lap
(1)
Iden
tific
atio
n F
lats
(1)
Ten−
Fin
ger
Pla
in−
to−
Pla
in (
1)Te
n−F
inge
r R
olle
d−to
−R
olle
d (1
)Te
n−F
inge
r P
lain
−to
−R
olle
d (1
)
Left
Inde
x (2
)R
ight
Inde
x (2
)Le
ft an
d R
ight
Inde
x (2
)R
ight
Sla
p (2
)Le
ft S
lap
(2)
Left
and
Rig
ht S
lap
(2)
Iden
tific
atio
n F
lats
(2)
Ten−
Fin
ger
Pla
in−
to−
Pla
in (
2)Te
n−F
inge
r R
olle
d−to
−R
olle
d (2
)Te
n−F
inge
r P
lain
−to
−R
olle
d (2
)
Figu
re91
:DET
for
Part
icip
antS
—A
llfin
gers
wit
hm
axim
umen
rollm
ents
ets
for
each
clas
s.
C = afis team D = 3M Cogent E = Neurotechnology F = Papillon G = Dermalog H = Hisign Bio-Info InstituteI = NEC J = Sonda K = Tiger IT L = Innovatrics M = SPEX O = ID SolutionsP = id3 Q = Morpho S = Decatur Industries T = BIO-key U = Aware V = AA Technology

106 FPVTE – FINGERPRINT MATCHING
False Positive Identification R
ate
False Negative Identification Rate
0.0005
0.0010
0.0020
0.0050
0.0100
0.0200
0.0500
0.1000
0.2000
0.50000.00050.0010
0.00200.0050
0.01000.0200
0.05000.1000
0.20000.5000
Left Index (1)R
ight Index (1)Left and R
ight Index (1)Left Index (2)
Right Index (2)
Left and Right Index (2)
Figure92:D
ETfor
ParticipantT—
Allfingers
with
maxim
umenrollm
entsetsfor
eachclass.
C = afis team D = 3M Cogent E = Neurotechnology F = Papillon G = Dermalog H = Hisign Bio-Info InstituteI = NEC J = Sonda K = Tiger IT L = Innovatrics M = SPEX O = ID SolutionsP = id3 Q = Morpho S = Decatur Industries T = BIO-key U = Aware V = AA Technology
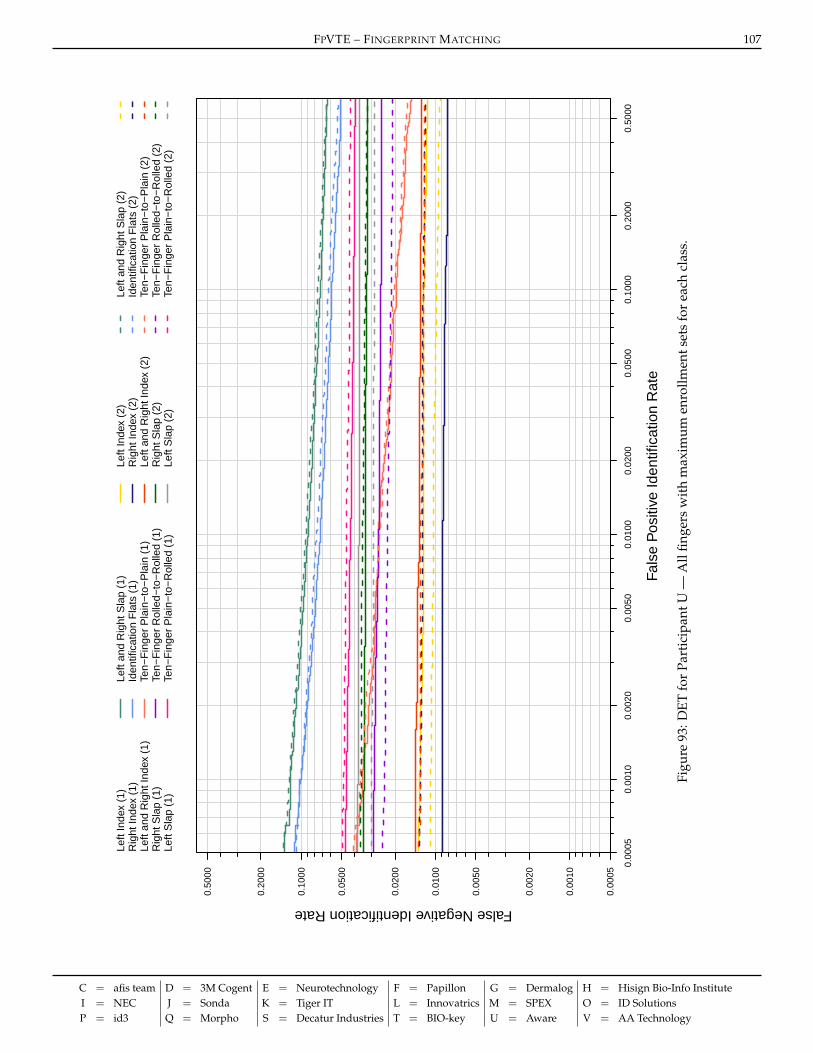
FPVTE – FINGERPRINT MATCHING 107
Fals
e P
ositi
ve Id
entif
icat
ion
Rat
e
False Negative Identification Rate
0.00
05
0.00
10
0.00
20
0.00
50
0.01
00
0.02
00
0.05
00
0.10
00
0.20
00
0.50
00
0.00
050.
0010
0.00
200.
0050
0.01
000.
0200
0.05
000.
1000
0.20
000.
5000
Left
Inde
x (1
)R
ight
Inde
x (1
)Le
ft an
d R
ight
Inde
x (1
)R
ight
Sla
p (1
)Le
ft S
lap
(1)
Left
and
Rig
ht S
lap
(1)
Iden
tific
atio
n F
lats
(1)
Ten−
Fin
ger
Pla
in−
to−
Pla
in (
1)Te
n−F
inge
r R
olle
d−to
−R
olle
d (1
)Te
n−F
inge
r P
lain
−to
−R
olle
d (1
)
Left
Inde
x (2
)R
ight
Inde
x (2
)Le
ft an
d R
ight
Inde
x (2
)R
ight
Sla
p (2
)Le
ft S
lap
(2)
Left
and
Rig
ht S
lap
(2)
Iden
tific
atio
n F
lats
(2)
Ten−
Fin
ger
Pla
in−
to−
Pla
in (
2)Te
n−F
inge
r R
olle
d−to
−R
olle
d (2
)Te
n−F
inge
r P
lain
−to
−R
olle
d (2
)
Figu
re93
:DET
for
Part
icip
antU
—A
llfin
gers
wit
hm
axim
umen
rollm
ents
ets
for
each
clas
s.
C = afis team D = 3M Cogent E = Neurotechnology F = Papillon G = Dermalog H = Hisign Bio-Info InstituteI = NEC J = Sonda K = Tiger IT L = Innovatrics M = SPEX O = ID SolutionsP = id3 Q = Morpho S = Decatur Industries T = BIO-key U = Aware V = AA Technology

108 FPVTE – FINGERPRINT MATCHING
False Positive Identification R
ate
False Negative Identification Rate
0.0005
0.0010
0.0020
0.0050
0.0100
0.0200
0.0500
0.1000
0.2000
0.50000.00050.0010
0.00200.0050
0.01000.0200
0.05000.1000
0.20000.5000
Left Index (1)R
ight Index (1)Left and R
ight Index (1)R
ight Slap (1)
Left Slap (1)
Left and Right S
lap (1)Identification F
lats (1)Ten−
Finger P
lain−to−
Plain (1)
Ten−F
inger Rolled−
to−R
olled (1)Ten−
Finger P
lain−to−
Rolled (1)
Left Index (2)R
ight Index (2)Left and R
ight Index (2)R
ight Slap (2)
Left Slap (2)
Left and Right S
lap (2)Identification F
lats (2)Ten−
Finger P
lain−to−
Plain (2)
Ten−F
inger Rolled−
to−R
olled (2)Ten−
Finger P
lain−to−
Rolled (2)
Figure94:D
ETfor
ParticipantV—
Allfingers
with
maxim
umenrollm
entsetsfor
eachclass.
C = afis team D = 3M Cogent E = Neurotechnology F = Papillon G = Dermalog H = Hisign Bio-Info InstituteI = NEC J = Sonda K = Tiger IT L = Innovatrics M = SPEX O = ID SolutionsP = id3 Q = Morpho S = Decatur Industries T = BIO-key U = Aware V = AA Technology

FPVTE – FINGERPRINT MATCHING 109
B Combined Class DETs and CMCs
This appendix contains DET and CMC curves for all classes and participants grouped together. There is one grouping forthe participant’s first submission and another for their second submission. The submissions are split for visibility only—“first” and “second” submissions do not imply any sort of logical grouping. The reader is reminded that enrollment setsizes were 100 000 subjects for single index fingers, 1.6 million subjects for two index fingers, 3 million subjects for IDFlats,and 5 million for ten-finger rolled and plain impressions.
C = afis team D = 3M Cogent E = Neurotechnology F = Papillon G = Dermalog H = Hisign Bio-Info InstituteI = NEC J = Sonda K = Tiger IT L = Innovatrics M = SPEX O = ID SolutionsP = id3 Q = Morpho S = Decatur Industries T = BIO-key U = Aware V = AA Technology

110 FPVTE – FINGERPRINT MATCHING
False Positive Identification R
ate
False Negative Identification Rate
0.00050.00100.0020
0.00500.01000.0200
0.05000.10000.2000
0.5000
0.00050.00100.0020
0.00500.01000.0200
0.05000.10000.2000
0.5000
PQ
0.00050.00100.0020
0.00500.01000.0200
0.05000.10000.2000
0.5000
ST
0.00050.00100.0020
0.00500.01000.0200
0.05000.10000.2000
0.5000
UV
IJ
KL
MO
0.00050.00100.0020
0.00500.01000.0200
0.05000.10000.2000
0.5000C
DE
FG
H
Left Index (1)R
ight Index (1)Left and R
ight Index (1)
Right S
lap (1)Left S
lap (1)Left and R
ight Slap (1)
Identification Flats (1)
Ten−F
inger Plain−
to−P
lain (1)Ten−
Finger R
olled−to−
Rolled (1)
Ten−F
inger Plain−
to−R
olled (1)
Figure95:D
ETsfrom
thefirstsubm
issionfor
allparticipantsin
allclasses.
C = afis team D = 3M Cogent E = Neurotechnology F = Papillon G = Dermalog H = Hisign Bio-Info InstituteI = NEC J = Sonda K = Tiger IT L = Innovatrics M = SPEX O = ID SolutionsP = id3 Q = Morpho S = Decatur Industries T = BIO-key U = Aware V = AA Technology

FPVTE – FINGERPRINT MATCHING 111
Fals
e Po
sitiv
e Id
entif
icat
ion
Rat
e
False Negative Identification Rate
0.00
050.
0010
0.00
200.
0050
0.01
000.
0200
0.05
000.
1000
0.20
000.
5000
0.00050.00100.00200.00500.01000.02000.05000.10000.20000.5000
PQ
0.00050.00100.00200.00500.01000.02000.05000.10000.20000.5000
ST
0.00050.00100.00200.00500.01000.02000.05000.10000.20000.5000
UV
IJ
KL
MO
0.00
050.
0010
0.00
200.
0050
0.01
000.
0200
0.05
000.
1000
0.20
000.
5000
CD
EF
GH
Left
Inde
x (2
)R
ight
Inde
x (2
)Le
ft an
d R
ight
Inde
x (2
)
Rig
ht S
lap
(2)
Left
Slap
(2)
Left
and
Rig
ht S
lap
(2)
Iden
tific
atio
n Fl
ats
(2)
Ten−
Fing
er P
lain−t
o−Pl
ain
(2)
Ten−
Fing
er R
olle
d−to−R
olle
d (2
)
Ten−
Fing
er P
lain−t
o−R
olle
d (2
)
Figu
re96
:DET
sfr
omth
ese
cond
subm
issi
onfo
ral
lpar
tici
pant
sin
allc
lass
es.
C = afis team D = 3M Cogent E = Neurotechnology F = Papillon G = Dermalog H = Hisign Bio-Info InstituteI = NEC J = Sonda K = Tiger IT L = Innovatrics M = SPEX O = ID SolutionsP = id3 Q = Morpho S = Decatur Industries T = BIO-key U = Aware V = AA Technology

112 FPVTE – FINGERPRINT MATCHING
Rank
Miss Rate
0.0010
0.0020
0.0050
0.0100
0.0200
0.0500
0.1000
0.2000
510
15
PQ
510
15
ST
510
15
UV
IJ
KL
MO
0.0010
0.0020
0.0050
0.0100
0.0200
0.0500
0.1000
0.2000C
DE
FG
H
Left Index (1)R
ight Index (1)Left and R
ight Index (1)
Right S
lap (1)Left S
lap (1)Left and R
ight Slap (1)
Identification Flats (1)
Ten−F
inger Plain−
to−P
lain (1)Ten−
Finger R
olled−to−
Rolled (1)
Ten−F
inger Plain−
to−R
olled (1)
Figure97:C
MC
sfrom
thefirstsubm
issionfor
allparticipantsin
allclasses.
C = afis team D = 3M Cogent E = Neurotechnology F = Papillon G = Dermalog H = Hisign Bio-Info InstituteI = NEC J = Sonda K = Tiger IT L = Innovatrics M = SPEX O = ID SolutionsP = id3 Q = Morpho S = Decatur Industries T = BIO-key U = Aware V = AA Technology
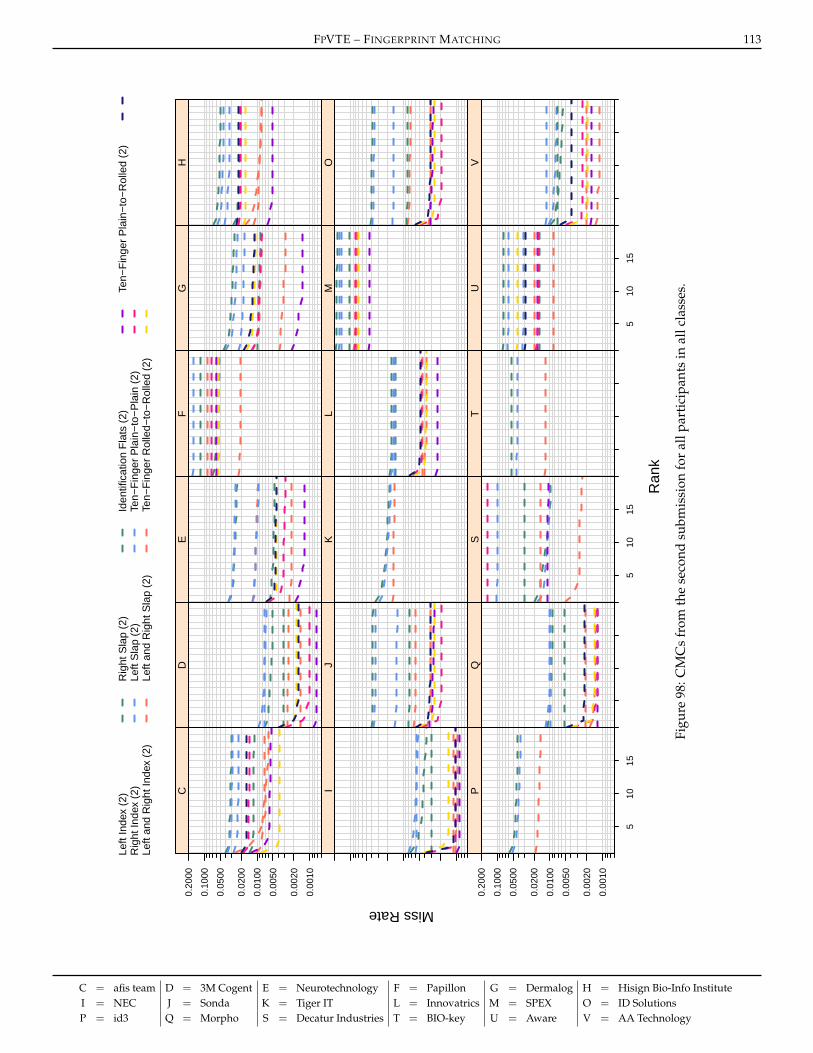
FPVTE – FINGERPRINT MATCHING 113
Ran
k
Miss Rate
0.00
10
0.00
20
0.00
50
0.01
00
0.02
00
0.05
00
0.10
00
0.20
00
510
15
PQ
510
15
ST
510
15
UV
IJ
KL
MO
0.00
10
0.00
20
0.00
50
0.01
00
0.02
00
0.05
00
0.10
00
0.20
00C
DE
FG
H
Left
Inde
x (2
)R
ight
Inde
x (2
)Le
ft an
d R
ight
Inde
x (2
)
Rig
ht S
lap
(2)
Left
Sla
p (2
)Le
ft an
d R
ight
Sla
p (2
)
Iden
tific
atio
n F
lats
(2)
Ten−
Fin
ger
Pla
in−
to−
Pla
in (
2)Te
n−F
inge
r R
olle
d−to
−R
olle
d (2
)
Ten−
Fin
ger
Pla
in−
to−
Rol
led
(2)
Figu
re98
:CM
Cs
from
the
seco
ndsu
bmis
sion
for
allp
arti
cipa
nts
inal
lcla
sses
.
C = afis team D = 3M Cogent E = Neurotechnology F = Papillon G = Dermalog H = Hisign Bio-Info InstituteI = NEC J = Sonda K = Tiger IT L = Innovatrics M = SPEX O = ID SolutionsP = id3 Q = Morpho S = Decatur Industries T = BIO-key U = Aware V = AA Technology
114 FPVTE – FINGERPRINT MATCHING
C Accuracy Time Tradeoff Detailed Tables with Median Values
In order to reduce the number of tables in the main body of the report (Section 8), this appendix contains tables that showthe search times for each stage of identification, for both a single process and ten processes.
The tables in this appendix report median times. For readers interested in mean times, please refer to Appendix D.
Class A results are in Tables 24 through 29, Class B results are in Tables 30 through 33, and Class C results are in Tables 34through 36.
C = afis team D = 3M Cogent E = Neurotechnology F = Papillon G = Dermalog H = Hisign Bio-Info InstituteI = NEC J = Sonda K = Tiger IT L = Innovatrics M = SPEX O = ID SolutionsP = id3 Q = Morpho S = Decatur Industries T = BIO-key U = Aware V = AA Technology

FPVTE – FINGERPRINT MATCHING 115Pa
rtic
ipan
tSt
age
One
Stag
eTw
oTo
tal
Lett
erSu
b.#
One
Ten
One
Ten
One
Ten
<20seconds
11
0.26
10.26
1—
1—
10.26
10.26
C2
60.76
60.72
1—
1—
60.76
60.72
D1
17
3.89
16
3.90
28
3.54
27
1.62
20
7.32
18
5.56
13
0.35
30.38
1—
1—
30.35
30.38
E2
30
16.90
29
16.93
1—
1—
30
16.90
28
16.93
112
2.49
12
2.40
1—
1—
11
2.49
11
2.40
F2
15
3.56
14
3.52
1—
1—
14
3.56
13
3.52
G1
23
9.74
24
10.10
1—
1—
21
9.74
23
10.10
116
3.61
17
4.54
1—
1—
15
3.61
15
4.54
H2
19
4.13
18
5.09
1—
1—
17
4.13
16
5.09
I1
24
9.94
25
10.36
1—
1—
22
9.94
24
10.36
14
0.54
40.56
1—
1—
40.54
40.56
J2
71.25
81.28
1—
1—
71.25
71.28
126
10.44
27
11.21
1—
1—
25
10.44
26
11.21
K2
25
10.32
26
11.18
1—
1—
23
10.32
25
11.18
12
0.28
20.27
1—
1—
20.29
20.27
L2
13
3.32
15
3.79
1—
1—
12
3.32
14
3.79
111
1.84
11
1.78
1—
1—
10
1.84
10
1.78
M2
27
10.70
23
9.58
1—
1—
26
10.70
22
9.58
15
0.62
50.61
1—
1—
50.62
50.61
O2
10
1.56
10
1.62
1—
1—
91.56
91.62
18
1.32
91.36
1—
1—
81.32
81.36
P2
14
3.33
13
3.20
1—
1—
13
3.33
12
3.20
128
11.25
28
11.61
29
4.48
29
1.79
28
15.70
27
13.44
Q2
22
7.67
22
7.73
27
2.64
28
1.70
24
10.43
21
9.45
S1
29
16.86
30
17.66
1—
1—
29
16.86
29
17.66
118
3.99
19
5.43
1—
1—
16
3.99
17
5.44
T2
20
5.97
21
7.15
1—
1—
18
5.97
20
7.15
U1
91.41
71.14
30
12.96
30
17.63
27
14.42
30
18.76
V1
21
6.01
20
5.81
1—
1—
19
6.01
19
5.81
FNIR
@FP
IR=
10−3
24
0.1335
25
0.1337
10.0197
12
0.0745
11
0.0723
20
0.1111
18
0.1082
19
0.1089
26
0.1576
27
0.1607
50.0257
14
0.0786
10
0.0712
17
0.0883
16
0.0875
80.0625
60.0351
29
0.2995
28
0.2921
15
0.0818
13
0.0766
23
0.1308
22
0.1272
20.0222
30.0226
70.0571
30
NA
90.0685
21
0.1218
40.0253
Tabl
e24
:Tab
ulat
ion
ofm
edia
nid
enti
ficat
ion
tim
ere
sult
sfo
rC
lass
A—
Left
Inde
x—
less
than
20
-sec
ond
sear
ches
.Let
ter
refe
rsto
the
part
icip
ant’s
lett
erco
defo
und
onth
efo
oter
ofth
ispa
ge.
Sub.
#is
anid
enti
fier
used
todi
ffer
enti
ate
betw
een
the
two
subm
issi
ons
each
part
icip
ant
coul
dm
ake.
Stag
eO
nean
dSt
age
Two
refe
rto
the
stag
esof
iden
tific
atio
nde
fined
inSe
ctio
n5,
wit
hTo
tali
ndic
atin
gth
eco
mbi
ned
sear
chti
me.
One
and
Ten
refe
rto
the
num
ber
ofco
ncur
rent
iden
tific
atio
npr
oces
ses
run
ona
com
pute
node
.A
llva
lues
are
med
ian
dura
tion
sar
ere
port
edin
seco
nds,
butw
ere
orig
inal
lyre
cord
edto
mic
rose
cond
prec
isio
n.A
—in
dica
tes
that
the
oper
atio
nco
mpl
eted
fast
erth
anco
uld
bere
liabl
ym
easu
red.
The
num
ber
toth
ele
ftof
ava
lue
prov
ides
the
valu
e’s
colu
mn-
wis
era
nkin
g,w
ith
the
best
perf
orm
ance
shad
edin
gree
nan
dth
ew
orst
inpi
nk.F
orre
fere
nce,
the
FNIR
valu
esfr
omTa
ble
7ar
ere
prin
ted
toth
eri
ghto
fthi
sta
ble.
C = afis team D = 3M Cogent E = Neurotechnology F = Papillon G = Dermalog H = Hisign Bio-Info InstituteI = NEC J = Sonda K = Tiger IT L = Innovatrics M = SPEX O = ID SolutionsP = id3 Q = Morpho S = Decatur Industries T = BIO-key U = Aware V = AA Technology

116 FPVTE – FINGERPRINT MATCHING
ParticipantStage
One
StageTw
oTotal
LetterSub.#
One
TenO
neTen
One
Ten
≥ 20 seconds
D2
118.19
118.37
622.44
63.14
341.84
121.60
G2
554.03
556.40
1—
1—
554.03
556.40
I2
340.99
343.35
1—
1—
240.99
343.35
S2
444.66
447.82
1—
1—
444.66
447.82
U2
223.74
239.38
50.41
50.35
124.16
239.70
V2
665.35
664.02
1—
1—
665.35
664.02
FNIR
@FPIR
=10−3
10.0197
50.1086
30.0278
40.0650
60.1178
20.0252
Table25:
Tabulationof
median
identificationtim
eresults
forC
lassA
—Left
Index—
greaterthan
orequalto
20-second
searches.Letter
refersto
theparticipant’s
lettercode
foundon
thefooter
ofthispage.
Sub.#is
anidentifier
usedto
differentiatebetw
eenthe
two
submissions
eachparticipantcould
make.
StageO
neand
StageTw
orefer
tothe
stagesofidentification
definedin
Section5,w
ithTotalindicating
thecom
binedsearch
time.
One
andTen
referto
thenum
berofconcurrentidentification
processesrun
ona
compute
node.A
llvaluesare
median
durationsare
reportedin
seconds,butwere
originallyrecorded
tom
icrosecondprecision.
A—
indicatesthatthe
operationcom
pletedfaster
thancould
bereliably
measured.
Thenum
berto
theleftof
avalue
providesthe
value’scolum
n-wise
ranking,with
thebestperform
anceshaded
ingreen
andthe
worstin
pink.For
reference,theFN
IRvalues
fromTable
7are
reprintedto
therightof
thistable.
C = afis team D = 3M Cogent E = Neurotechnology F = Papillon G = Dermalog H = Hisign Bio-Info InstituteI = NEC J = Sonda K = Tiger IT L = Innovatrics M = SPEX O = ID SolutionsP = id3 Q = Morpho S = Decatur Industries T = BIO-key U = Aware V = AA Technology

FPVTE – FINGERPRINT MATCHING 117Pa
rtic
ipan
tSt
age
One
Stag
eTw
oTo
tal
Lett
erSu
b.#
One
Ten
One
Ten
One
Ten
<20seconds
11
0.24
10.24
1—
1—
10.24
10.24
C2
60.69
60.68
1—
1—
60.69
60.68
D1
18
3.77
15
3.68
29
3.69
27
1.56
20
7.46
17
5.27
13
0.32
30.35
1—
1—
30.32
30.35
E2
29
16.27
29
16.58
1—
1—
29
16.27
29
16.58
112
2.38
12
2.34
1—
1—
11
2.38
11
2.34
F2
16
3.60
14
3.36
1—
1—
15
3.60
13
3.36
G1
25
10.10
25
10.23
1—
1—
24
10.10
24
10.23
115
3.56
17
4.58
1—
1—
14
3.56
15
4.59
H2
19
4.05
18
5.05
1—
1—
17
4.05
16
5.06
I1
24
9.83
24
9.86
1—
1—
22
9.83
23
9.86
14
0.51
40.53
1—
1—
40.51
40.53
J2
71.13
81.20
1—
1—
71.13
71.20
127
10.42
26
10.81
1—
1—
26
10.42
25
10.81
K2
26
10.26
27
10.91
1—
1—
25
10.27
26
10.91
12
0.26
20.27
1—
1—
20.26
20.27
L2
14
3.26
16
3.71
1—
1—
13
3.26
14
3.71
111
1.78
11
1.64
1—
1—
10
1.78
10
1.64
M2
23
9.39
23
8.24
1—
1—
21
9.39
21
8.24
15
0.56
50.58
1—
1—
50.56
50.58
O2
10
1.36
10
1.53
1—
1—
91.36
91.53
19
1.24
91.28
1—
1—
81.24
81.28
P2
13
3.07
13
3.20
1—
1—
12
3.07
12
3.20
128
10.94
28
11.33
28
3.24
29
1.73
28
14.24
27
13.09
Q2
22
7.39
22
7.57
27
2.53
28
1.67
23
9.98
22
9.24
S1
30
16.55
30
16.75
1—
1—
30
16.55
30
16.75
117
3.73
20
5.66
1—
1—
16
3.73
19
5.66
T2
21
5.86
21
7.21
1—
1—
19
5.87
20
7.21
U1
81.24
71.01
30
9.19
30
14.92
27
10.76
28
15.85
V1
20
5.60
19
5.61
1—
1—
18
5.60
18
5.61
FNIR
@FP
IR=
10−3
24
0.1132
23
0.1124
10.0190
11
0.0630
10
0.0624
20
0.0933
18
0.0903
19
0.0910
26
0.1230
27
0.1249
30.0215
16
0.0708
12
0.0643
14
0.0682
15
0.0685
80.0505
60.0295
30
0.2615
29
0.2526
17
0.0776
13
0.0675
25
0.1133
22
0.1100
40.0218
20.0214
70.0442
28
0.1929
90.0562
21
0.0996
50.0223
Tabl
e26
:Ta
bula
tion
ofm
edia
nid
enti
ficat
ion
tim
ere
sult
sfo
rC
lass
A—
Rig
htIn
dex
—le
ssth
an20
-sec
ond
sear
ches
.Le
tter
refe
rsto
the
part
icip
ant’s
lett
erco
defo
und
onth
efo
oter
ofth
ispa
ge.
Sub.
#is
anid
enti
fier
used
todi
ffer
enti
ate
betw
een
the
two
subm
issi
ons
each
part
icip
antc
ould
mak
e.St
age
One
and
Stag
eTw
ore
fer
toth
est
ages
ofid
enti
ficat
ion
defin
edin
Sect
ion
5,w
ith
Tota
lind
icat
ing
the
com
bine
dse
arch
tim
e.O
nean
dTe
nre
fer
toth
enu
mbe
rof
conc
urre
ntid
enti
ficat
ion
proc
esse
sru
non
aco
mpu
teno
de.A
llva
lues
are
med
ian
dura
tion
sar
ere
port
edin
seco
nds,
butw
ere
orig
inal
lyre
cord
edto
mic
rose
cond
prec
isio
n.A
—in
dica
tes
that
the
oper
atio
nco
mpl
eted
fast
erth
anco
uld
bere
liabl
ym
easu
red.
The
num
ber
toth
ele
ftof
ava
lue
prov
ides
the
valu
e’s
colu
mn-
wis
era
nkin
g,w
ith
the
best
perf
orm
ance
shad
edin
gree
nan
dth
ew
orst
inpi
nk.F
orre
fere
nce,
the
FNIR
valu
esfr
omTa
ble
8ar
ere
prin
ted
toth
eri
ghto
fthi
sta
ble.
C = afis team D = 3M Cogent E = Neurotechnology F = Papillon G = Dermalog H = Hisign Bio-Info InstituteI = NEC J = Sonda K = Tiger IT L = Innovatrics M = SPEX O = ID SolutionsP = id3 Q = Morpho S = Decatur Industries T = BIO-key U = Aware V = AA Technology

118 FPVTE – FINGERPRINT MATCHING
ParticipantStage
One
StageTw
oTotal
LetterSub.#
One
TenO
neTen
One
Ten
≥ 20 seconds
D2
117.43
117.53
611.53
63.02
228.64
120.55
G2
559.55
558.30
1—
1—
559.55
558.30
I2
340.35
342.08
1—
1—
340.35
342.08
S2
446.05
445.80
1—
1—
446.05
445.80
U2
219.74
234.25
50.33
50.32
120.10
234.54
V2
661.24
660.53
1—
1—
661.24
660.53
FNIR
@FPIR
=10−3
10.0190
50.0909
20.0214
40.0503
60.1007
30.0222
Table27:
Tabulationof
median
identificationtim
eresults
forC
lassA
—R
ightIndex
—greater
thanor
equalto20-second
searches.Letter
refersto
theparticipant’s
lettercode
foundon
thefooter
ofthispage.
Sub.#is
anidentifier
usedto
differentiatebetw
eenthe
two
submissions
eachparticipantcould
make.
StageO
neand
StageTw
orefer
tothe
stagesofidentification
definedin
Section5,w
ithTotalindicating
thecom
binedsearch
time.
One
andTen
referto
thenum
berofconcurrentidentification
processesrun
ona
compute
node.A
llvaluesare
median
durationsare
reportedin
seconds,butwere
originallyrecorded
tom
icrosecondprecision.
A—
indicatesthatthe
operationcom
pletedfaster
thancould
bereliably
measured.
Thenum
berto
theleftof
avalue
providesthe
value’scolum
n-wise
ranking,with
thebestperform
anceshaded
ingreen
andthe
worstin
pink.For
reference,theFN
IRvalues
fromTable
8are
reprintedto
therightof
thistable.
C = afis team D = 3M Cogent E = Neurotechnology F = Papillon G = Dermalog H = Hisign Bio-Info InstituteI = NEC J = Sonda K = Tiger IT L = Innovatrics M = SPEX O = ID SolutionsP = id3 Q = Morpho S = Decatur Industries T = BIO-key U = Aware V = AA Technology

FPVTE – FINGERPRINT MATCHING 119
Part
icip
ant
Stag
eO
neSt
age
Two
Tota
l
Lett
erSu
b.#
One
Ten
One
Ten
One
Ten
<20seconds
11
2.08
12.23
1—
1—
12.08
12.23
C2
46.35
36.54
1—
1—
46.35
36.54
G1
35.22
46.62
1—
1—
35.22
46.62
I1
817.87
818.87
1—
1—
817.87
818.87
J1
613.64
614.42
1—
1—
613.64
614.42
K1
918.01
918.95
1—
1—
918.01
918.95
L1
22.19
25.05
1—
1—
22.19
25.05
O1
714.46
715.50
1—
1—
714.46
715.50
V1
59.29
59.45
1—
1—
59.29
59.45
FNIR
@FP
IR=
10−3
70.0368
80.0374
90.0515
20.0058
30.0143
60.0360
40.0146
50.0229
10.0034
Tabl
e28
:Tab
ulat
ion
ofm
edia
nid
enti
ficat
ion
tim
ere
sult
sfo
rC
lass
A—
Left
and
Rig
htIn
dex
—le
ssth
an20
-sec
ond
sear
ches
.Let
ter
refe
rsto
the
part
icip
ant’s
lett
erco
defo
und
onth
efo
oter
ofth
ispa
ge.S
ub.#
isan
iden
tifie
rus
edto
diff
eren
tiat
ebe
twee
nth
etw
osu
bmis
sion
sea
chpa
rtic
ipan
tcou
ldm
ake.
Stag
eOne
and
Stag
eTw
ore
fer
toth
est
ages
ofid
enti
ficat
ion
defin
edin
Sect
ion
5,w
ith
Tota
lind
icat
ing
the
com
bine
dse
arch
tim
e.O
nean
dTe
nre
fer
toth
enu
mbe
rof
conc
urre
ntid
enti
ficat
ion
proc
esse
sru
non
aco
mpu
teno
de.A
llva
lues
are
med
ian
dura
tion
sar
ere
port
edin
seco
nds,
butw
ere
orig
inal
lyre
cord
edto
mic
rose
cond
prec
isio
n.A
—in
dica
tes
that
the
oper
atio
nco
mpl
eted
fast
erth
anco
uld
bere
liabl
ym
easu
red.
The
num
ber
toth
ele
ftof
ava
lue
prov
ides
the
valu
e’s
colu
mn-
wis
era
nkin
g,w
ith
the
best
perf
orm
ance
shad
edin
gree
nan
dth
ew
orst
inpi
nk.F
orre
fere
nce,
the
FNIR
valu
esfr
omTa
ble
9ar
ere
prin
ted
toth
eri
ghto
fthi
sta
ble.
C = afis team D = 3M Cogent E = Neurotechnology F = Papillon G = Dermalog H = Hisign Bio-Info InstituteI = NEC J = Sonda K = Tiger IT L = Innovatrics M = SPEX O = ID SolutionsP = id3 Q = Morpho S = Decatur Industries T = BIO-key U = Aware V = AA Technology

120 FPVTE – FINGERPRINT MATCHING
ParticipantStage
One
StageTw
oTotal
LetterSub.#
One
TenO
neTen
One
Ten≥ 20 seconds
12
19.27
219.30
24
52.34
24
19.23
15
70.99
637.59
D2
21
164.19
21
169.73
26
68.09
23
7.29
23
237.43
21
182.69
11
16.35
118.25
1—
1—
116.35
118.25
E2
27
518.11
27
512.28
1—
1—
27
518.11
27
512.28
114
60.66
11
57.10
1—
1—
13
60.66
11
57.10
F2
16
73.95
13
68.04
1—
1—
16
73.95
13
68.04
G2
23
221.16
23
233.70
1—
1—
22
221.16
22
233.71
110
36.71
839.83
1—
1—
836.71
739.83
H2
13
52.25
10
54.92
1—
1—
12
52.25
10
54.92
I2
25
338.88
24
377.30
1—
1—
25
338.88
24
377.31
J2
933.35
736.28
1—
1—
733.35
536.28
K2
832.93
633.62
1—
1—
632.93
433.62
L2
423.42
14
69.95
1—
1—
323.42
14
69.95
17
31.44
530.23
1—
1—
531.44
330.23
M2
22
171.24
22
169.90
1—
1—
20
171.24
19
169.90
O2
12
43.53
946.77
1—
1—
10
43.53
846.77
115
63.65
12
62.81
1—
1—
14
63.65
12
62.81
P2
18
101.16
17
105.73
1—
1—
17
101.16
16
105.73
120
153.61
20
160.28
25
57.36
26
80.55
21
212.69
23
242.28
Q2
17
86.83
16
89.06
27
69.98
27
83.71
19
161.02
20
175.09
13
23.00
322.50
1—
1—
223.00
222.50
S2
26
495.50
26
487.65
1—
1—
26
495.50
26
487.65
15
25.68
15
88.07
1—
1—
425.68
15
88.13
T2
11
37.23
19
131.01
1—
1—
937.23
18
131.08
16
28.49
427.53
23
17.03
25
25.27
11
45.51
952.79
U2
24
239.62
25
407.47
22
0.68
22
0.63
24
240.40
25
407.99
V2
19
127.65
18
128.23
1—
1—
18
127.65
17
128.23
FNIR
@FPIR
=10−3
40.0030
40.0030
11
0.0207
10
0.0202
21
0.0386
22
0.0412
15
0.0311
24
0.0686
23
0.0684
40.0030
80.0143
14
0.0286
70.0072
26
NA
25
NA
12
0.0214
20
0.0370
16
0.0333
10.0027
10.0027
13
0.0281
90.0195
27
NA
19
0.0366
17
0.0336
18
0.0358
30.0028
Table29:Tabulation
ofmedian
identificationtim
eresults
forC
lassA
—Leftand
RightIndex
—greater
thanor
equalto20-second
searches.Letterrefers
tothe
participant’sletter
codefound
onthe
footerof
thispage.
Sub.#is
anidentifier
usedto
differentiatebetw
eenthe
two
submissions
eachparticipant
couldm
ake.Stage
One
andStage
Two
referto
thestages
ofidentification
definedin
Section5,w
ithTotalindicating
thecom
binedsearch
time.
One
andTen
referto
thenum
berof
concurrentidentification
processesrun
ona
compute
node.A
llvaluesare
median
durationsare
reportedin
seconds,butwere
originallyrecorded
tom
icrosecondprecision.
A—
indicatesthatthe
operationcom
pletedfaster
thancould
bereliably
measured.
Thenum
berto
theleftofa
valueprovides
thevalue’s
column-w
iseranking,w
iththe
bestperformance
shadedin
greenand
thew
orstinpink.For
reference,theFN
IRvalues
fromTable
9are
reprintedto
therightofthis
table.
C = afis team D = 3M Cogent E = Neurotechnology F = Papillon G = Dermalog H = Hisign Bio-Info InstituteI = NEC J = Sonda K = Tiger IT L = Innovatrics M = SPEX O = ID SolutionsP = id3 Q = Morpho S = Decatur Industries T = BIO-key U = Aware V = AA Technology

FPVTE – FINGERPRINT MATCHING 121Pa
rtic
ipan
tSt
age
One
Stag
eTw
oTo
tal
Lett
erSu
b.#
One
Ten
One
Ten
One
Ten
12
3.74
23.88
1—
1—
23.74
23.88
C2
46.74
37.03
1—
1—
46.74
37.03
117
47.93
22
70.13
25
3.29
27
6.08
18
52.23
24
76.64
D2
23
52.89
27
80.04
28
4.05
28
9.04
22
58.10
27
89.04
11
2.82
13.19
1—
1—
12.82
13.19
E2
11
34.37
10
35.02
1—
1—
10
34.37
10
35.02
18
30.09
832.85
1—
1—
830.09
832.85
F2
16
43.59
14
47.82
1—
1—
14
43.59
14
47.82
16
16.24
517.59
1—
1—
616.24
517.59
G2
25
59.49
18
60.00
1—
1—
23
59.49
18
60.00
119
49.75
20
61.05
1—
1—
16
49.75
20
61.05
H2
22
51.77
19
60.07
1—
1—
17
51.77
19
60.07
124
55.96
21
66.74
1—
1—
21
55.96
21
66.74
I2
14
38.26
13
42.90
1—
1—
13
38.26
13
42.90
17
25.61
627.09
1—
1—
725.61
627.09
J2
29
74.38
26
78.75
1—
1—
27
74.38
26
78.75
13
5.56
410.01
1—
1—
35.56
410.01
L2
512.37
730.25
1—
1—
512.37
730.25
19
31.17
933.44
1—
1—
931.17
933.44
M2
30
87.21
28
92.65
1—
1—
29
87.21
28
92.65
113
37.01
12
39.34
1—
1—
12
37.01
12
39.34
O2
28
73.15
25
77.48
1—
1—
26
73.15
25
77.48
120
50.00
17
54.90
26
3.49
25
3.20
19
53.24
17
58.21
Q2
21
50.78
16
53.59
27
3.55
26
3.32
20
54.02
16
57.02
126
71.69
23
74.67
1—
1—
24
71.69
22
74.67
S2
27
71.77
24
74.84
1—
1—
25
71.77
23
74.84
110
33.57
—N
A30
47.07
—N
A28
80.03
—N
AU
215
42.79
—N
A29
45.59
—N
A30
89.07
—N
A
112
36.07
11
36.78
1—
1—
11
36.07
11
36.78
V2
18
47.97
15
50.36
1—
1—
15
47.97
15
50.37
FNIR
@FP
IR=
10−3
22
0.0654
21
0.0647
60.0163
50.0142
13
0.0259
70.0187
29
0.1684
28
0.1681
18
0.0371
17
0.0325
23
0.0998
24
0.1008
40.0116
10.0094
15
0.0287
10
0.0236
16
0.0288
14
0.0276
30
0.1736
27
0.1634
12
0.0257
11
0.0254
20.0098
30.0099
25
0.1089
26
0.1133
20
0.0500
19
0.0461
90.0192
80.0190
Tabl
e30
:Ta
bula
tion
ofm
edia
nid
enti
ficat
ion
tim
ere
sult
sfo
rC
lass
B—
Left
Slap
.Le
tter
refe
rsto
the
part
icip
ant’s
lett
erco
defo
und
onth
efo
oter
ofth
ispa
ge.
Sub.
#is
anid
enti
fier
used
todi
ffer
enti
ate
betw
een
the
two
subm
issi
ons
each
part
icip
ant
coul
dm
ake.
Stag
eO
nean
dSt
age
Two
refe
rto
the
stag
esof
iden
tific
atio
nde
fined
inSe
ctio
n5,
wit
hTo
tali
ndic
atin
gth
eco
mbi
ned
sear
chti
me.
One
and
Ten
refe
rto
the
num
ber
ofco
ncur
rent
iden
tific
atio
npr
oces
ses
run
ona
com
pute
node
.A
llva
lues
are
med
ian
dura
tion
sar
ere
port
edin
seco
nds,
but
wer
eor
igin
ally
reco
rded
tom
icro
seco
ndpr
ecis
ion.
A—
indi
cate
sth
atth
eop
erat
ion
com
plet
edfa
ster
than
coul
dbe
relia
bly
mea
sure
d.N
Ain
dica
tes
that
the
oper
atio
nsre
quir
edto
prod
uce
the
valu
eco
uld
not
bepe
rfor
med
.Th
enu
mbe
rto
the
left
ofa
valu
epr
ovid
esth
eva
lue’
sco
lum
n-w
ise
rank
ing,
wit
hth
ebe
stpe
rfor
man
cesh
aded
ingr
een
and
the
wor
stin
pink
.Fo
rre
fere
nce,
the
FNIR
valu
esfr
omTa
ble
10ar
ere
prin
ted
toth
eri
ghto
fthi
sta
ble.
C = afis team D = 3M Cogent E = Neurotechnology F = Papillon G = Dermalog H = Hisign Bio-Info InstituteI = NEC J = Sonda K = Tiger IT L = Innovatrics M = SPEX O = ID SolutionsP = id3 Q = Morpho S = Decatur Industries T = BIO-key U = Aware V = AA Technology

122 FPVTE – FINGERPRINT MATCHINGParticipant
StageO
neStage
Two
Total
LetterSub.#
One
TenO
neTen
One
Ten
12
3.67
23.74
1—
1—
23.67
23.75
C2
46.50
36.78
1—
1—
46.50
36.78
118
48.43
22
69.48
26
3.56
27
5.79
19
53.32
24
76.16
D2
21
52.47
27
82.56
28
4.41
28
8.74
21
57.19
27
92.10
11
2.97
13.23
1—
1—
12.97
13.23
E2
11
34.47
10
34.32
1—
1—
10
34.47
10
34.32
18
31.87
833.38
1—
1—
831.87
833.38
F2
17
45.92
15
48.57
1—
1—
15
45.92
15
48.57
15
10.13
410.56
1—
1—
510.13
410.56
G2
14
37.28
12
39.25
1—
1—
13
37.28
12
39.25
120
50.16
18
61.42
1—
1—
17
50.16
18
61.42
H2
22
52.84
17
60.56
1—
1—
18
52.84
17
60.56
123
55.87
21
66.70
1—
1—
20
55.87
20
66.70
I2
16
41.13
14
48.17
1—
1—
14
41.13
14
48.17
17
24.14
626.83
1—
1—
724.14
626.83
J2
29
74.08
26
80.24
1—
1—
27
74.09
26
80.24
13
5.47
510.64
1—
1—
35.47
510.64
L2
612.66
731.80
1—
1—
612.66
731.81
19
32.03
934.25
1—
1—
932.03
934.25
M2
30
87.41
28
92.89
1—
1—
29
87.41
28
92.89
113
35.61
13
39.42
1—
1—
12
35.61
13
39.42
O2
28
73.93
25
78.87
1—
1—
26
73.93
25
78.87
125
60.64
20
66.42
27
3.65
25
3.25
23
64.04
21
69.69
Q2
24
58.39
19
63.34
25
3.54
26
3.30
22
61.94
19
66.61
126
70.54
23
74.64
1—
1—
24
70.54
22
74.64
S2
27
70.84
24
75.02
1—
1—
25
70.84
23
75.02
110
34.38
—N
A30
54.61
—N
A30
89.26
—N
AU
215
40.66
—N
A29
40.70
—N
A28
80.11
—N
A
112
35.43
11
37.08
1—
1—
11
35.43
11
37.08
V2
19
48.51
16
50.24
1—
1—
16
48.51
16
50.24
FNIR
@FPIR
=10−3
24
0.0403
23
0.0392
60.0072
20.0052
13
0.0151
70.0083
29
0.1222
28
0.1220
18
0.0212
16
0.0198
25
0.0641
26
0.0647
50.0058
10.0045
14
0.0156
10
0.0126
15
0.0167
17
0.0202
30
0.1259
27
0.1155
12
0.0142
11
0.0132
30.0057
30.0057
21
0.0369
22
0.0381
19
0.0266
20
0.0273
80.0106
90.0110
Table31:
Tabulationofm
edianidentification
time
resultsfor
Class
B—
RightSlap.
Letterrefers
tothe
participant’sletter
codefound
onthe
footerofthis
page.Sub.
#is
anidentifier
usedto
differentiatebetw
eenthe
two
submissions
eachparticipant
couldm
ake.Stage
One
andStage
Two
referto
thestages
ofidentification
definedin
Section5,w
ithTotalindicating
thecom
binedsearch
time.
One
andTen
referto
thenum
berof
concurrentidentification
processesrun
ona
compute
node.A
llvalues
arem
ediandurations
arereported
inseconds,but
were
originallyrecorded
tom
icrosecondprecision.
A—
indicatesthatthe
operationcom
pletedfaster
thancould
bereliably
measured.
NA
indicatesthatthe
operationsrequired
toproduce
thevalue
couldnot
beperform
ed.T
henum
berto
theleft
ofa
valueprovides
thevalue’s
column-w
iseranking,w
iththe
bestperform
anceshaded
ingreen
andthe
worst
inpink.
Forreference,the
FNIR
valuesfrom
Table11
arereprinted
tothe
rightofthistable.
C = afis team D = 3M Cogent E = Neurotechnology F = Papillon G = Dermalog H = Hisign Bio-Info InstituteI = NEC J = Sonda K = Tiger IT L = Innovatrics M = SPEX O = ID SolutionsP = id3 Q = Morpho S = Decatur Industries T = BIO-key U = Aware V = AA Technology

FPVTE – FINGERPRINT MATCHING 123Pa
rtic
ipan
tSt
age
One
Stag
eTw
oTo
tal
Lett
erSu
b.#
One
Ten
One
Ten
One
Ten
13
6.40
36.63
1—
1—
36.40
36.63
C2
510.70
411.10
1—
1—
510.70
411.10
122
59.32
27
104.95
27
1.34
27
2.40
20
61.24
27
108.01
D2
23
60.79
28
106.49
28
2.28
28
4.43
21
63.05
28
111.35
12
6.12
26.09
1—
1—
26.12
26.09
E2
11
33.09
10
35.61
1—
1—
10
33.09
10
35.61
19
27.27
830.15
1—
1—
927.27
830.15
F2
13
36.36
11
40.13
1—
1—
12
36.36
11
40.13
11
3.89
14.17
1—
1—
13.89
14.17
G2
12
34.55
934.99
1—
1—
11
34.55
934.99
127
70.38
26
86.18
1—
1—
25
70.38
26
86.18
H2
28
73.06
24
85.16
1—
1—
26
73.06
24
85.16
114
37.19
14
42.38
1—
1—
13
37.19
14
42.38
I2
19
46.13
16
54.07
1—
1—
17
46.13
16
54.07
17
26.15
628.45
1—
1—
726.15
628.45
J2
26
69.28
22
74.42
1—
1—
24
69.28
22
74.42
14
10.47
522.48
1—
1—
410.48
522.48
L2
620.78
19
63.81
1—
1—
620.78
19
63.82
18
27.15
730.00
1—
1—
827.15
730.01
M2
18
45.91
15
51.07
1—
1—
16
45.91
15
51.07
115
38.34
13
41.51
1—
1—
14
38.34
13
41.51
O2
25
68.46
21
73.17
1—
1—
23
68.46
21
73.17
124
63.79
20
69.86
26
1.07
26
0.79
22
65.02
20
70.73
Q2
20
52.39
18
57.81
25
1.05
25
0.76
19
53.40
18
58.57
130
83.33
25
85.38
1—
1—
29
83.33
25
85.38
S2
29
82.13
23
85.11
1—
1—
27
82.13
23
85.11
110
29.82
—N
A30
53.54
—N
A30
83.62
—N
AU
216
38.83
—N
A29
43.88
—N
A28
82.40
—N
A
117
38.93
12
41.09
1—
1—
15
38.93
12
41.09
V2
21
52.79
17
55.29
1—
1—
18
52.80
17
55.29
FNIR
@FP
IR=
10−3
30
NA
29
NA
60.0031
50.0024
15
0.0063
10
0.0049
28
0.0910
26
0.0901
18
0.0106
17
0.0084
23
0.0349
24
0.0361
30.0022
10.0015
16
0.0068
90.0047
12
0.0054
14
0.0062
27
0.0904
25
0.0882
13
0.0057
11
0.0051
20.0021
30.0022
21
0.0160
22
0.0190
20
0.0139
19
0.0124
70.0036
70.0036
Tabl
e32
:Tab
ulat
ion
ofm
edia
nid
enti
ficat
ion
tim
ere
sult
sfo
rC
lass
B—
Left
and
Rig
htSl
ap.L
ette
rre
fers
toth
epa
rtic
ipan
t’sle
tter
code
foun
don
the
foot
erof
this
page
.Sub
.#is
anid
enti
fier
used
todi
ffer
enti
ate
betw
een
the
two
subm
issi
ons
each
part
icip
ant
coul
dm
ake.
Stag
eO
nean
dSt
age
Two
refe
rto
the
stag
esof
iden
tific
atio
nde
fined
inSe
ctio
n5,
wit
hTo
tali
ndic
atin
gth
eco
mbi
ned
sear
chti
me.
One
and
Ten
refe
rto
the
num
ber
ofco
ncur
rent
iden
tific
atio
npr
oces
ses
run
ona
com
pute
node
.A
llva
lues
are
med
ian
dura
tion
sar
ere
port
edin
seco
nds,
but
wer
eor
igin
ally
reco
rded
tom
icro
seco
ndpr
ecis
ion.
A—
indi
cate
sth
atth
eop
erat
ion
com
plet
edfa
ster
than
coul
dbe
relia
bly
mea
sure
d.N
Ain
dica
tes
that
the
oper
atio
nsre
quir
edto
prod
uce
the
valu
eco
uld
notb
epe
rfor
med
.Th
enu
mbe
rto
the
left
ofa
valu
epr
ovid
esth
eva
lue’
sco
lum
n-w
ise
rank
ing,
wit
hth
ebe
stpe
rfor
man
cesh
aded
ingr
een
and
the
wor
stin
pink
.Fo
rre
fere
nce,
the
FNIR
valu
esfr
omTa
ble
12ar
ere
prin
ted
toth
eri
ghto
fthi
sta
ble.
C = afis team D = 3M Cogent E = Neurotechnology F = Papillon G = Dermalog H = Hisign Bio-Info InstituteI = NEC J = Sonda K = Tiger IT L = Innovatrics M = SPEX O = ID SolutionsP = id3 Q = Morpho S = Decatur Industries T = BIO-key U = Aware V = AA Technology

124 FPVTE – FINGERPRINT MATCHINGParticipant
StageO
neStage
Two
Total
LetterSub.#
One
TenO
neTen
One
Ten
13
7.92
37.99
1—
1—
37.92
37.99
C2
410.21
410.62
1—
1—
410.21
410.62
119
44.48
22
79.06
25
0.86
27
1.33
17
45.15
22
80.68
D2
20
45.79
23
83.76
26
1.43
28
2.30
18
46.70
24
86.69
12
6.76
27.23
1—
1—
26.76
27.24
E2
17
43.61
13
48.02
1—
1—
15
43.61
13
48.02
113
37.56
11
40.93
1—
1—
12
37.56
11
40.93
F2
22
49.34
17
54.18
1—
1—
20
49.34
17
54.18
11
4.26
14.52
1—
1—
14.26
14.52
G2
616.26
514.99
1—
1—
616.26
514.99
127
82.66
27
97.33
1—
1—
26
82.66
27
97.33
H2
28
86.56
28
98.56
1—
1—
27
86.56
28
98.56
17
19.07
621.52
1—
1—
719.07
621.52
I2
18
43.86
16
54.10
1—
1—
16
43.86
16
54.10
18
25.38
726.88
1—
1—
825.38
726.88
J2
24
60.13
19
64.19
1—
1—
22
60.13
19
64.19
15
14.49
834.38
1—
1—
514.50
834.39
L2
928.59
24
86.01
1—
1—
928.59
23
86.02
114
38.87
12
42.78
1—
1—
13
38.87
12
42.78
M2
26
65.91
20
72.75
1—
1—
23
65.91
20
72.75
112
35.64
10
38.07
1—
1—
11
35.64
10
38.07
O2
23
60.02
18
63.40
1—
1—
21
60.02
18
63.40
116
41.50
14
49.75
28
1.48
25
1.00
14
42.92
14
50.75
Q2
25
64.62
21
78.68
27
1.48
26
1.02
24
66.01
21
79.70
129
87.60
25
90.62
1—
1—
29
87.60
25
90.62
S2
30
88.46
26
92.93
1—
1—
30
88.46
26
92.93
110
29.91
—N
A30
57.06
—N
A28
86.60
—N
AU
215
41.20
—N
A29
35.79
—N
A25
75.28
—N
A
111
34.96
937.51
1—
1—
10
34.96
937.51
V2
21
49.30
15
51.13
1—
1—
19
49.30
15
51.13
FNIR
@FPIR
=10−3
30
NA
29
NA
60.0020
20.0012
16
0.0043
70.0024
27
0.0591
27
0.0591
18
0.0062
14
0.0040
23
0.0203
24
0.0204
20.0012
10.0009
17
0.0049
11
0.0033
10
0.0031
11
0.0033
26
0.0543
25
0.0515
15
0.0041
13
0.0035
20.0012
20.0012
20
0.0108
21
0.0136
19
0.0099
22
0.0141
90.0027
70.0024
Table33:Tabulation
ofmedian
identificationtim
eresults
forC
lassB
—Identification
Flats.Letter
refersto
theparticipant’s
lettercode
foundon
thefooter
ofthispage.
Sub.#
isan
identifierused
todifferentiate
between
thetw
osubm
issionseach
participantcould
make.
StageO
neand
StageTw
orefer
tothe
stagesof
identificationdefined
inSection
5,with
Totalindicatingthe
combined
searchtim
e.O
neand
Tenrefer
tothe
number
ofconcurrent
identificationprocesses
runon
acom
putenode.
All
valuesare
median
durationsare
reportedin
seconds,butw
ereoriginally
recordedto
microsecond
precision.A
—indicates
thatthe
operationcom
pletedfaster
thancould
bereliably
measured.
NA
indicatesthat
theoperations
requiredto
producethe
valuecould
notbeperform
ed.T
henum
berto
theleftof
avalue
providesthe
value’scolum
n-wise
ranking,with
thebestperform
anceshaded
ingreen
andthe
worstin
pink.For
reference,the
FNIR
valuesfrom
Table13
arereprinted
tothe
rightofthistable.
C = afis team D = 3M Cogent E = Neurotechnology F = Papillon G = Dermalog H = Hisign Bio-Info InstituteI = NEC J = Sonda K = Tiger IT L = Innovatrics M = SPEX O = ID SolutionsP = id3 Q = Morpho S = Decatur Industries T = BIO-key U = Aware V = AA Technology

FPVTE – FINGERPRINT MATCHING 125Pa
rtic
ipan
tSt
age
One
Stag
eTw
oTo
tal
Lett
erSu
b.#
One
Ten
One
Ten
One
Ten
14
18.30
419.19
1—
1—
418.30
419.19
C2
518.38
319.05
1—
1—
518.38
319.05
126
72.26
28
141.45
25
1.36
27
1.85
25
73.93
28
143.53
D2
25
71.36
27
137.48
26
1.63
28
2.10
26
74.36
27
140.57
12
12.77
213.68
1—
1—
212.77
213.68
E2
19
52.91
15
54.82
1—
1—
17
52.91
15
54.82
117
51.69
14
51.98
1—
1—
15
51.69
14
51.98
F2
20
60.86
16
61.46
1—
1—
18
60.86
16
61.46
11
7.71
18.79
1—
1—
17.71
18.79
G2
723.69
530.21
1—
1—
723.69
530.21
123
68.07
22
78.40
1—
1—
21
68.07
22
78.40
H2
22
65.36
20
73.09
1—
1—
20
65.36
19
73.10
118
52.41
17
63.47
1—
1—
16
52.41
17
63.47
I2
10
38.28
940.63
1—
1—
10
38.28
940.63
112
43.57
12
47.12
1—
1—
12
43.57
12
47.12
J2
28
77.75
24
84.93
1—
1—
28
77.75
24
84.93
13
17.50
839.57
1—
1—
317.51
739.58
L2
620.73
19
66.62
1—
1—
623.53
21
74.43
111
43.37
10
43.13
1—
1—
11
43.37
10
43.13
M2
13
46.70
11
46.86
1—
1—
13
46.70
11
46.86
124
68.54
21
74.17
1—
1—
23
68.54
20
74.17
O2
27
73.41
23
83.44
1—
1—
24
73.41
23
83.44
19
35.17
738.39
27
1.63
26
1.51
936.86
839.96
Q2
833.71
635.06
28
1.70
25
1.36
835.35
636.23
129
86.56
25
95.71
1—
1—
29
86.56
25
95.71
S2
30
91.74
26
98.32
1—
1—
30
91.74
26
98.32
115
47.96
—N
A30
26.89
—N
A27
74.94
—N
AU
216
51.07
—N
A29
17.32
—N
A22
68.30
—N
A
114
47.02
13
48.95
1—
1—
14
47.02
13
48.95
V2
21
62.26
18
65.76
1—
1—
19
62.26
18
65.76
FNIR
@FP
IR=
10−3
30
NA
24
0.0711
60.0015
20.0011
14
0.0088
13
0.0048
25
0.0734
25
0.0734
23
0.0368
20
0.0276
20
0.0276
19
0.0275
40.0013
10.0010
12
0.0047
10
0.0027
16
0.0102
15
0.0095
28
0.0934
27
0.0826
90.0025
10
0.0027
20.0011
40.0013
22
0.0311
29
0.1680
18
0.0163
17
0.0155
70.0024
70.0024
Tabl
e34
:Ta
bula
tion
ofm
edia
nid
enti
ficat
ion
tim
ere
sult
sfo
rC
lass
C—
Ten-
Fing
erPl
ain-
to-P
lain
.Le
tter
refe
rsto
the
part
icip
ant’s
lett
erco
defo
und
onth
efo
oter
ofth
ispa
ge.
Sub.
#is
anid
enti
fier
used
todi
ffer
enti
ate
betw
een
the
two
subm
issi
ons
each
part
icip
antc
ould
mak
e.St
age
One
and
Stag
eTw
ore
fer
toth
est
ages
ofid
enti
ficat
ion
defin
edin
Sect
ion
5,w
ith
Tota
lind
icat
ing
the
com
bine
dse
arch
tim
e.O
nean
dTe
nre
fer
toth
enu
mbe
rof
conc
urre
ntid
enti
ficat
ion
proc
esse
sru
non
aco
mpu
teno
de.
All
valu
esar
em
edia
ndu
rati
ons
are
repo
rted
inse
cond
s,bu
twer
eor
igin
ally
reco
rded
tom
icro
seco
ndpr
ecis
ion.
A—
indi
cate
sth
atth
eop
erat
ion
com
plet
edfa
ster
than
coul
dbe
relia
bly
mea
sure
d.N
Ain
dica
tes
that
the
oper
atio
nsre
quir
edto
prod
uce
the
valu
eco
uld
notb
epe
rfor
med
.Th
enu
mbe
rto
the
left
ofa
valu
epr
ovid
esth
eva
lue’
sco
lum
n-w
ise
rank
ing,
wit
hth
ebe
stpe
rfor
man
cesh
aded
ingr
een
and
the
wor
stin
pink
.Fo
rre
fere
nce,
the
FNIR
valu
esfr
omTa
ble
14ar
ere
prin
ted
toth
eri
ghto
fthi
sta
ble.
C = afis team D = 3M Cogent E = Neurotechnology F = Papillon G = Dermalog H = Hisign Bio-Info InstituteI = NEC J = Sonda K = Tiger IT L = Innovatrics M = SPEX O = ID SolutionsP = id3 Q = Morpho S = Decatur Industries T = BIO-key U = Aware V = AA Technology

126 FPVTE – FINGERPRINT MATCHINGParticipant
StageO
neStage
Two
Total
LetterSub.#
One
TenO
neTen
One
Ten
15
20.15
421.10
1—
1—
420.15
421.10
C2
621.97
522.27
1—
1—
621.97
522.27
119
56.37
25
81.93
28
2.42
25
1.40
17
58.92
25
83.71
D2
28
73.52
28
126.56
25
1.86
26
1.79
27
74.97
28
128.86
12
8.63
29.82
1—
1—
28.63
29.82
E2
11
42.73
944.54
1—
1—
11
42.73
944.54
118
55.79
14
59.83
1—
1—
16
55.79
13
59.83
F2
22
68.20
20
72.22
1—
1—
20
68.20
19
72.22
11
7.78
17.67
1—
1—
17.78
17.67
G2
319.46
318.47
1—
1—
319.46
318.47
130
84.51
26
94.60
1—
1—
30
84.51
26
94.60
H2
29
84.50
27
95.02
1—
1—
29
84.50
27
95.02
117
54.56
12
56.96
1—
1—
15
54.56
12
56.96
I2
730.82
630.34
1—
1—
730.82
630.34
19
33.02
736.39
1—
1—
933.02
736.39
J2
21
67.98
23
75.20
1—
1—
19
67.98
23
75.20
18
31.68
16
64.80
1—
1—
831.68
15
64.81
L2
419.64
13
57.57
1—
1—
520.25
16
66.39
112
48.08
10
50.93
1—
1—
12
48.08
10
50.93
M2
14
48.80
11
52.10
1—
1—
13
48.80
11
52.10
116
54.41
15
60.77
1—
1—
14
54.42
14
60.77
O2
23
69.30
22
75.08
1—
1—
21
69.30
22
75.08
127
72.31
19
71.41
26
2.22
27
2.49
26
74.40
21
73.83
Q2
26
72.05
17
67.31
27
2.27
28
2.51
25
74.22
18
69.95
124
69.71
24
77.04
1—
1—
22
69.71
24
77.04
S2
25
70.77
21
72.56
1—
1—
23
70.77
20
72.56
113
48.12
—N
A30
34.90
—N
A28
82.61
—N
AU
215
52.49
—N
A29
21.02
—N
A24
72.48
—N
A
110
40.74
842.25
1—
1—
10
40.74
842.25
V2
20
65.07
18
67.32
1—
1—
18
65.07
17
67.33
FNIR
@FPIR
=10−3
16
0.0094
15
0.0085
40.0015
70.0018
18
0.0106
12
0.0050
25
0.0536
25
0.0536
24
0.0447
21
0.0333
20
0.0201
19
0.0199
10.0013
20.0014
13
0.0051
90.0033
17
0.0097
14
0.0083
28
0.0783
27
0.0716
11
0.0034
90.0033
50.0017
20.0014
29
0.0860
30
0.2462
23
0.0358
22
0.0351
50.0017
80.0019
Table35:
Tabulationofm
edianidentification
time
resultsfor
Class
C—
Ten-FingerR
olled-to-Rolled.
Letterrefers
tothe
participant’sletter
codefound
onthe
footerofthis
page.Sub.
#is
anidentifier
usedto
differentiatebetw
eenthe
two
submissions
eachparticipantcould
make.Stage
One
andStage
Two
referto
thestages
ofidentificationdefined
inSection
5,with
Totalindicatingthe
combined
searchtim
e.O
neand
Tenrefer
tothe
number
ofconcurrentidentificationprocesses
runon
acom
putenode.
Allvalues
arem
ediandurations
arereported
inseconds,butw
ereoriginally
recordedto
microsecond
precision.A
—indicates
thatthe
operationcom
pletedfaster
thancould
bereliably
measured.
NA
indicatesthat
theoperations
requiredto
producethe
valuecould
notbeperform
ed.T
henum
berto
theleftof
avalue
providesthe
value’scolum
n-wise
ranking,with
thebestperform
anceshaded
ingreen
andthe
worstin
pink.For
reference,the
FNIR
valuesfrom
Table15
arereprinted
tothe
rightofthistable.
C = afis team D = 3M Cogent E = Neurotechnology F = Papillon G = Dermalog H = Hisign Bio-Info InstituteI = NEC J = Sonda K = Tiger IT L = Innovatrics M = SPEX O = ID SolutionsP = id3 Q = Morpho S = Decatur Industries T = BIO-key U = Aware V = AA Technology

FPVTE – FINGERPRINT MATCHING 127Pa
rtic
ipan
tSt
age
One
Stag
eTw
oTo
tal
Lett
erSu
b.#
One
Ten
One
Ten
One
Ten
16
33.68
535.85
1—
1—
633.68
535.85
C2
834.85
636.23
1—
1—
834.85
636.23
112
41.16
20
69.81
25
0.60
25
0.58
13
41.67
20
70.49
D2
18
56.17
28
109.60
26
1.04
26
1.16
16
57.36
28
110.64
11
8.99
19.76
1—
1—
18.99
19.76
E2
734.06
435.00
1—
1—
734.06
435.00
121
58.57
16
60.32
1—
1—
19
58.57
15
60.32
F2
23
61.87
17
62.74
1—
1—
21
61.87
17
62.74
12
16.78
220.00
1—
1—
216.78
220.00
G2
422.14
326.40
1—
1—
422.14
326.40
124
64.83
25
77.97
1—
1—
22
64.83
25
77.97
H2
25
65.74
21
73.89
1—
1—
23
65.74
21
73.89
116
52.47
19
67.66
1—
1—
15
52.47
19
67.66
I2
13
41.48
10
45.62
1—
1—
12
41.48
10
45.62
111
38.41
941.85
1—
1—
938.41
941.85
J2
27
67.88
24
75.26
1—
1—
25
67.88
24
75.26
15
27.47
14
58.46
1—
1—
527.47
13
58.47
L2
318.30
11
48.54
1—
1—
320.18
16
60.35
119
57.63
13
58.09
1—
1—
17
57.63
12
58.09
M2
20
57.91
15
59.52
1—
1—
18
57.91
14
59.52
122
59.05
18
64.96
1—
1—
20
59.05
18
64.96
O2
26
66.80
23
74.41
1—
1—
24
66.80
23
74.41
19
36.83
839.07
28
1.91
27
1.70
11
39.76
840.80
Q2
10
37.74
736.93
27
1.89
28
2.36
10
39.37
739.44
130
88.48
27
95.29
1—
1—
30
88.48
27
95.29
S2
29
88.07
26
92.90
1—
1—
29
88.07
26
92.90
115
48.76
—N
A30
33.16
—N
A28
82.88
—N
AU
217
53.93
—N
A29
20.09
—N
A27
74.56
—N
A
114
48.40
12
50.40
1—
1—
14
48.40
11
50.40
V2
28
69.87
22
73.98
1—
1—
26
69.87
22
73.98
FNIR
@FP
IR=
10−3
17
0.0149
18
0.0169
60.0028
30.0018
16
0.0137
12
0.0056
27
0.2514
27
0.2514
24
0.0649
23
0.0521
20
0.0291
19
0.0285
20.0014
10.0011
13
0.0071
70.0034
15
0.0136
14
0.0129
30
0.3067
27
0.2514
10
0.0041
80.0036
40.0020
50.0022
25
0.1017
26
0.2366
22
0.0378
21
0.0295
11
0.0052
90.0039
Tabl
e36
:Ta
bula
tion
ofm
edia
nid
enti
ficat
ion
tim
ere
sult
sfo
rC
lass
C—
Ten-
Fing
erPl
ain-
to-R
olle
d.Le
tter
refe
rsto
the
part
icip
ant’s
lett
erco
defo
und
onth
efo
oter
ofth
ispa
ge.
Sub.
#is
anid
enti
fier
used
todi
ffer
enti
ate
betw
een
the
two
subm
issi
ons
each
part
icip
antc
ould
mak
e.St
age
One
and
Stag
eTw
ore
fer
toth
est
ages
ofid
enti
ficat
ion
defin
edin
Sect
ion
5,w
ith
Tota
lind
icat
ing
the
com
bine
dse
arch
tim
e.O
nean
dTe
nre
fer
toth
enu
mbe
rof
conc
urre
ntid
enti
ficat
ion
proc
esse
sru
non
aco
mpu
teno
de.
All
valu
esar
em
edia
ndu
rati
ons
are
repo
rted
inse
cond
s,bu
twer
eor
igin
ally
reco
rded
tom
icro
seco
ndpr
ecis
ion.
A—
indi
cate
sth
atth
eop
erat
ion
com
plet
edfa
ster
than
coul
dbe
relia
bly
mea
sure
d.N
Ain
dica
tes
that
the
oper
atio
nsre
quir
edto
prod
uce
the
valu
eco
uld
notb
epe
rfor
med
.Th
enu
mbe
rto
the
left
ofa
valu
epr
ovid
esth
eva
lue’
sco
lum
n-w
ise
rank
ing,
wit
hth
ebe
stpe
rfor
man
cesh
aded
ingr
een
and
the
wor
stin
pink
.Fo
rre
fere
nce,
the
FNIR
valu
esfr
omTa
ble
16ar
ere
prin
ted
toth
eri
ghto
fthi
sta
ble.
C = afis team D = 3M Cogent E = Neurotechnology F = Papillon G = Dermalog H = Hisign Bio-Info InstituteI = NEC J = Sonda K = Tiger IT L = Innovatrics M = SPEX O = ID SolutionsP = id3 Q = Morpho S = Decatur Industries T = BIO-key U = Aware V = AA Technology
128 FPVTE – FINGERPRINT MATCHING
D Accuracy Time Tradeoff Detailed Tables with Mean Values
In order to reduce the number of tables in the main body of the report (Section 8), this appendix contains tables that showthe search times for each stage of identification, for both a single process and ten processes.
The tables in this appendix report mean times. For readers interested in median times, please refer to Appendix C.
Class A results are in Tables 37 through 42, Class B results are in Tables 43 through 46, and Class C results are in Tables 47through 49.
C = afis team D = 3M Cogent E = Neurotechnology F = Papillon G = Dermalog H = Hisign Bio-Info InstituteI = NEC J = Sonda K = Tiger IT L = Innovatrics M = SPEX O = ID SolutionsP = id3 Q = Morpho S = Decatur Industries T = BIO-key U = Aware V = AA Technology

FPVTE – FINGERPRINT MATCHING 129Pa
rtic
ipan
tSt
age
One
Stag
eTw
oTo
tal
Lett
erSu
b.#
One
Ten
One
Ten
One
Ten
<20seconds
11
0.29
20.29
1—
1—
10.29
20.29
C2
60.87
60.84
1—
1—
60.87
60.84
D1
17
3.87
16
3.90
28
3.65
27
1.69
20
7.52
18
5.59
14
0.57
30.54
1—
1—
40.57
30.54
E2
30
16.71
30
16.88
1—
1—
30
16.71
29
16.88
112
2.52
12
2.48
1—
1—
11
2.52
11
2.48
F2
16
3.78
14
3.73
1—
1—
15
3.78
13
3.73
G1
23
9.52
23
10.08
1—
1—
21
9.52
22
10.08
115
3.65
17
4.62
1—
1—
14
3.65
15
4.62
H2
19
4.26
18
5.16
1—
1—
17
4.26
16
5.16
I1
24
10.36
24
10.52
1—
1—
22
10.36
23
10.52
13
0.56
40.59
1—
1—
30.56
40.59
J2
71.34
81.42
1—
1—
71.34
71.42
126
10.48
25
10.97
1—
1—
25
10.48
24
10.97
K2
25
10.47
26
11.04
1—
1—
24
10.47
25
11.04
12
0.30
10.27
1—
1—
20.30
10.28
L2
13
3.34
15
3.81
1—
1—
12
3.34
14
3.81
111
2.07
11
1.88
1—
1—
10
2.07
10
1.88
M2
28
15.19
28
12.82
1—
1—
27
15.19
26
12.82
15
0.64
50.65
1—
1—
50.64
50.65
O2
10
1.63
10
1.77
1—
1—
91.63
91.77
18
1.38
91.45
1—
1—
81.38
81.45
P2
14
3.43
13
3.65
1—
1—
13
3.43
12
3.65
127
11.44
27
11.82
29
4.46
29
1.84
29
15.90
27
13.65
Q2
22
7.71
22
7.83
27
2.71
28
1.74
23
10.42
21
9.57
S1
29
15.37
29
15.90
1—
1—
28
15.37
28
15.90
118
4.18
19
5.47
1—
1—
16
4.18
17
5.47
T2
20
5.96
21
6.72
1—
1—
18
5.96
20
6.72
U1
91.45
71.18
30
13.27
30
18.84
26
14.72
30
20.02
V1
21
6.22
20
6.08
1—
1—
19
6.22
19
6.08
FNIR
@FP
IR=
10−3
24
0.1335
25
0.1337
10.0197
12
0.0745
11
0.0723
20
0.1111
18
0.1082
19
0.1089
26
0.1576
27
0.1607
50.0257
14
0.0786
10
0.0712
17
0.0883
16
0.0875
80.0625
60.0351
29
0.2995
28
0.2921
15
0.0818
13
0.0766
23
0.1308
22
0.1272
20.0222
30.0226
70.0571
30
NA
90.0685
21
0.1218
40.0253
Tabl
e37
:Tab
ulat
ion
ofm
ean
iden
tific
atio
nti
me
resu
lts
for
Cla
ssA
—Le
ftIn
dex
—le
ssth
an20
-sec
ond
sear
ches
.Le
tter
refe
rsto
the
part
icip
ant’s
lett
erco
defo
und
onth
efo
oter
ofth
ispa
ge.
Sub.
#is
anid
enti
fier
used
todi
ffer
enti
ate
betw
een
the
two
subm
issi
ons
each
part
icip
antc
ould
mak
e.St
ageO
nean
dSt
ageT
wo
refe
rto
the
stag
esof
iden
tific
atio
nde
fined
inSe
ctio
n5,
wit
hTo
tal
indi
cati
ngth
eco
mbi
ned
sear
chti
me.
One
and
Ten
refe
rto
the
num
ber
ofco
ncur
rent
iden
tific
atio
npr
oces
ses
run
ona
com
pute
node
.All
valu
esar
em
ean
dura
tion
sar
ere
port
edin
seco
nds,
but
wer
eor
igin
ally
reco
rded
tom
icro
seco
ndpr
ecis
ion.
A—
indi
cate
sth
atth
eop
erat
ion
com
plet
edfa
ster
than
coul
dbe
relia
bly
mea
sure
d.T
henu
mbe
rto
the
left
ofa
valu
epr
ovid
esth
eva
lue’
sco
lum
n-w
ise
rank
ing,
wit
hth
ebe
stpe
rfor
man
cesh
aded
ingr
een
and
the
wor
stin
pink
.For
refe
renc
e,th
eFN
IRva
lues
from
Tabl
e7
are
repr
inte
dto
the
righ
toft
his
tabl
e.
C = afis team D = 3M Cogent E = Neurotechnology F = Papillon G = Dermalog H = Hisign Bio-Info InstituteI = NEC J = Sonda K = Tiger IT L = Innovatrics M = SPEX O = ID SolutionsP = id3 Q = Morpho S = Decatur Industries T = BIO-key U = Aware V = AA Technology

130 FPVTE – FINGERPRINT MATCHING
ParticipantStage
One
StageTw
oTotal
LetterSub.#
One
TenO
neTen
One
Ten
≥ 20 seconds
D2
118.26
118.50
624.39
63.25
242.64
121.75
G2
554.24
554.61
1—
1—
554.24
554.61
I2
343.24
344.66
1—
1—
343.24
344.66
S2
445.59
446.37
1—
1—
445.59
446.37
U2
225.20
239.74
50.46
50.40
125.66
240.14
V2
666.23
666.39
1—
1—
666.23
666.39
FNIR
@FPIR
=10−3
10.0197
50.1086
30.0278
40.0650
60.1178
20.0252
Table38:Tabulation
ofmean
identificationtim
eresults
forC
lassA
—LeftIndex
—greater
thanor
equalto20-second
searches.Letterrefers
tothe
participant’sletter
codefound
onthe
footerof
thispage.
Sub.#is
anidentifier
usedto
differentiatebetw
eenthe
two
submissions
eachparticipant
couldm
ake.Stage
One
andStage
Two
referto
thestages
ofidentification
definedin
Section5,w
ithTotalindicating
thecom
binedsearch
time.
One
andTen
referto
thenum
berof
concurrentidentification
processesrun
ona
compute
node.A
llvaluesare
mean
durationsare
reportedin
seconds,butw
ereoriginally
recordedto
microsecond
precision.A
—indicates
thatthe
operationcom
pletedfaster
thancould
bereliably
measured.
Thenum
berto
theleft
ofa
valueprovides
thevalue’s
column-w
iseranking,w
iththe
bestperformance
shadedin
greenand
thew
orstinpink.For
reference,theFN
IRvalues
fromTable
7are
reprintedto
therightofthis
table.
C = afis team D = 3M Cogent E = Neurotechnology F = Papillon G = Dermalog H = Hisign Bio-Info InstituteI = NEC J = Sonda K = Tiger IT L = Innovatrics M = SPEX O = ID SolutionsP = id3 Q = Morpho S = Decatur Industries T = BIO-key U = Aware V = AA Technology

FPVTE – FINGERPRINT MATCHING 131Pa
rtic
ipan
tSt
age
One
Stag
eTw
oTo
tal
Lett
erSu
b.#
One
Ten
One
Ten
One
Ten
<20seconds
11
0.25
10.27
1—
1—
10.25
10.27
C2
60.76
60.77
1—
1—
60.76
60.77
D1
17
3.72
15
3.72
29
3.96
27
1.63
20
7.68
17
5.36
13
0.45
30.51
1—
1—
30.45
30.51
E2
30
15.89
30
16.40
1—
1—
30
15.89
29
16.40
112
2.52
12
2.37
1—
1—
11
2.52
11
2.37
F2
16
3.71
14
3.52
1—
1—
15
3.71
13
3.52
G1
23
10.12
24
10.32
1—
1—
21
10.12
23
10.32
115
3.58
17
4.61
1—
1—
14
3.58
15
4.61
H2
19
4.13
18
5.13
1—
1—
17
4.13
16
5.13
I1
24
10.19
23
10.06
1—
1—
23
10.19
22
10.06
14
0.53
40.55
1—
1—
40.53
40.55
J2
71.25
81.33
1—
1—
71.25
71.33
126
10.42
25
10.65
1—
1—
25
10.42
24
10.65
K2
25
10.30
26
10.73
1—
1—
24
10.30
25
10.73
12
0.29
20.27
1—
1—
20.29
20.28
L2
13
3.26
16
3.74
1—
1—
12
3.26
14
3.74
111
1.75
11
1.71
1—
1—
10
1.75
10
1.71
M2
28
11.31
27
10.80
1—
1—
26
11.31
26
10.80
15
0.59
50.62
1—
1—
50.59
50.62
O2
10
1.48
10
1.67
1—
1—
91.48
91.67
19
1.38
91.37
1—
1—
81.38
81.37
P2
14
3.49
13
3.48
1—
1—
13
3.49
12
3.48
127
11.10
28
11.54
28
3.34
29
1.76
28
14.44
27
13.30
Q2
22
7.43
22
7.66
27
2.71
28
1.72
22
10.15
21
9.37
S1
29
15.08
29
15.12
1—
1—
29
15.08
28
15.12
118
3.82
20
6.12
1—
1—
16
3.82
19
6.12
T2
20
5.64
21
6.83
1—
1—
18
5.64
20
6.83
U1
81.30
71.06
30
10.72
30
16.39
27
12.02
30
17.45
V1
21
5.95
19
5.88
1—
1—
19
5.95
18
5.88
FNIR
@FP
IR=
10−3
24
0.1132
23
0.1124
10.0190
11
0.0630
10
0.0624
20
0.0933
18
0.0903
19
0.0910
26
0.1230
27
0.1249
30.0215
16
0.0708
12
0.0643
14
0.0682
15
0.0685
80.0505
60.0295
30
0.2615
29
0.2526
17
0.0776
13
0.0675
25
0.1133
22
0.1100
40.0218
20.0214
70.0442
28
0.1929
90.0562
21
0.0996
50.0223
Tabl
e39
:Tab
ulat
ion
ofm
ean
iden
tific
atio
nti
me
resu
lts
for
Cla
ssA
—R
ight
Inde
x—
less
than
20
-sec
ond
sear
ches
.Let
ter
refe
rsto
the
part
icip
ant’s
lett
erco
defo
und
onth
efo
oter
ofth
ispa
ge.
Sub.
#is
anid
enti
fier
used
todi
ffer
enti
ate
betw
een
the
two
subm
issi
ons
each
part
icip
antc
ould
mak
e.St
ageO
nean
dSt
ageT
wo
refe
rto
the
stag
esof
iden
tific
atio
nde
fined
inSe
ctio
n5,
wit
hTo
tal
indi
cati
ngth
eco
mbi
ned
sear
chti
me.
One
and
Ten
refe
rto
the
num
ber
ofco
ncur
rent
iden
tific
atio
npr
oces
ses
run
ona
com
pute
node
.All
valu
esar
em
ean
dura
tion
sar
ere
port
edin
seco
nds,
but
wer
eor
igin
ally
reco
rded
tom
icro
seco
ndpr
ecis
ion.
A—
indi
cate
sth
atth
eop
erat
ion
com
plet
edfa
ster
than
coul
dbe
relia
bly
mea
sure
d.T
henu
mbe
rto
the
left
ofa
valu
epr
ovid
esth
eva
lue’
sco
lum
n-w
ise
rank
ing,
wit
hth
ebe
stpe
rfor
man
cesh
aded
ingr
een
and
the
wor
stin
pink
.For
refe
renc
e,th
eFN
IRva
lues
from
Tabl
e8
are
repr
inte
dto
the
righ
toft
his
tabl
e.
C = afis team D = 3M Cogent E = Neurotechnology F = Papillon G = Dermalog H = Hisign Bio-Info InstituteI = NEC J = Sonda K = Tiger IT L = Innovatrics M = SPEX O = ID SolutionsP = id3 Q = Morpho S = Decatur Industries T = BIO-key U = Aware V = AA Technology

132 FPVTE – FINGERPRINT MATCHING
ParticipantStage
One
StageTw
oTotal
LetterSub.#
One
TenO
neTen
One
Ten
≥ 20 seconds
D2
117.36
117.75
611.90
63.15
229.26
120.89
G2
557.88
556.87
1—
1—
557.88
556.87
I2
341.60
343.20
1—
1—
341.60
343.20
S2
443.56
444.05
1—
1—
443.56
444.05
U2
221.97
235.01
50.42
50.39
122.39
235.39
V2
664.47
663.54
1—
1—
664.47
663.54
FNIR
@FPIR
=10−3
10.0190
50.0909
20.0214
40.0503
60.1007
30.0222
Table40:
Tabulationof
mean
identificationtim
eresults
forC
lassA
—R
ightIndex
—greater
thanor
equalto20-second
searches.Letter
refersto
theparticipant’s
lettercode
foundon
thefooter
ofthispage.
Sub.#is
anidentifier
usedto
differentiatebetw
eenthe
two
submissions
eachparticipantcould
make.
StageO
neand
StageTw
orefer
tothe
stagesofidentification
definedin
Section5,w
ithTotalindicating
thecom
binedsearch
time.O
neand
Tenrefer
tothe
number
ofconcurrentidentificationprocesses
runon
acom
putenode.A
llvaluesare
mean
durationsare
reportedin
seconds,butw
ereoriginally
recordedto
microsecond
precision.A
—indicates
thatthe
operationcom
pletedfaster
thancould
bereliably
measured.
Thenum
berto
theleft
ofa
valueprovides
thevalue’s
column-w
iseranking,w
iththe
bestperformance
shadedin
greenand
thew
orstinpink.For
reference,theFN
IRvalues
fromTable
8are
reprintedto
therightofthis
table.
C = afis team D = 3M Cogent E = Neurotechnology F = Papillon G = Dermalog H = Hisign Bio-Info InstituteI = NEC J = Sonda K = Tiger IT L = Innovatrics M = SPEX O = ID SolutionsP = id3 Q = Morpho S = Decatur Industries T = BIO-key U = Aware V = AA Technology

FPVTE – FINGERPRINT MATCHING 133
Part
icip
ant
Stag
eO
neSt
age
Two
Tota
l
Lett
erSu
b.#
One
Ten
One
Ten
One
Ten
<20seconds
12
2.39
12.66
1—
1—
22.39
12.66
C2
46.34
36.55
1—
1—
46.34
36.55
G1
36.27
47.48
1—
1—
36.27
47.48
I1
918.92
920.61
1—
1—
918.92
920.61
J1
614.00
615.16
1—
1—
614.00
615.16
K1
818.32
818.82
1—
1—
818.32
818.82
L1
12.20
25.03
1—
1—
12.20
25.03
O1
715.34
716.58
1—
1—
715.34
716.58
V1
59.50
59.59
1—
1—
59.50
59.59
FNIR
@FP
IR=
10−3
70.0368
80.0374
90.0515
20.0058
30.0143
60.0360
40.0146
50.0229
10.0034
Tabl
e41
:Tab
ulat
ion
ofm
ean
iden
tific
atio
nti
me
resu
lts
for
Cla
ssA
—Le
ftan
dR
ight
Inde
x—
less
than
20
-sec
ond
sear
ches
.Le
tter
refe
rsto
the
part
icip
ant’s
lett
erco
defo
und
onth
efo
oter
ofth
ispa
ge.S
ub.#
isan
iden
tifie
rus
edto
diff
eren
tiat
ebe
twee
nth
etw
osu
bmis
sion
sea
chpa
rtic
ipan
tcou
ldm
ake.
Stag
eOne
and
Stag
eTw
ore
fer
toth
est
ages
ofid
enti
ficat
ion
defin
edin
Sect
ion
5,w
ith
Tota
lind
icat
ing
the
com
bine
dse
arch
tim
e.O
nean
dTe
nre
fer
toth
enu
mbe
rof
conc
urre
ntid
enti
ficat
ion
proc
esse
sru
non
aco
mpu
teno
de.
All
valu
esar
em
ean
dura
tion
sar
ere
port
edin
seco
nds,
butw
ere
orig
inal
lyre
cord
edto
mic
rose
cond
prec
isio
n.A
—in
dica
tes
that
the
oper
atio
nco
mpl
eted
fast
erth
anco
uld
bere
liabl
ym
easu
red.
The
num
ber
toth
ele
ftof
ava
lue
prov
ides
the
valu
e’s
colu
mn-
wis
era
nkin
g,w
ith
the
best
perf
orm
ance
shad
edin
gree
nan
dth
ew
orst
inpi
nk.F
orre
fere
nce,
the
FNIR
valu
esfr
omTa
ble
9ar
ere
prin
ted
toth
eri
ghto
fthi
sta
ble.
C = afis team D = 3M Cogent E = Neurotechnology F = Papillon G = Dermalog H = Hisign Bio-Info InstituteI = NEC J = Sonda K = Tiger IT L = Innovatrics M = SPEX O = ID SolutionsP = id3 Q = Morpho S = Decatur Industries T = BIO-key U = Aware V = AA Technology

134 FPVTE – FINGERPRINT MATCHING
ParticipantStage
One
StageTw
oTotal
LetterSub.#
One
TenO
neTen
One
Ten≥ 20 seconds
11
19.08
119.21
24
53.93
23
18.74
16
73.01
537.95
D2
21
163.78
21
170.99
26
70.74
24
19.00
23
234.52
21
190.00
13
22.27
323.15
1—
1—
222.27
223.15
E2
27
500.30
27
512.38
1—
1—
27
500.30
27
512.38
114
59.30
11
57.53
1—
1—
13
59.30
11
57.53
F2
16
71.45
13
69.19
1—
1—
15
71.45
13
69.19
G2
23
227.27
23
244.70
1—
1—
22
227.27
22
244.70
110
37.65
840.35
1—
1—
837.65
740.35
H2
13
53.77
10
55.70
1—
1—
12
53.77
10
55.70
I2
25
385.14
24
405.27
1—
1—
25
385.14
24
405.27
J2
936.19
738.86
1—
1—
736.19
638.86
K2
832.68
632.99
1—
1—
632.68
432.99
L2
423.53
14
70.30
1—
1—
323.54
14
70.30
17
32.59
531.32
1—
1—
532.59
331.32
M2
22
183.20
22
174.39
1—
1—
20
183.20
19
174.39
O2
12
45.52
950.30
1—
1—
10
45.52
850.30
115
63.40
12
62.27
1—
1—
14
63.41
12
62.27
P2
18
114.37
17
115.02
1—
1—
17
114.37
16
115.02
120
153.63
20
165.60
25
59.45
26
81.88
21
213.08
23
247.48
Q2
17
88.60
16
95.09
27
75.04
27
85.04
19
163.65
20
180.13
12
20.11
219.75
1—
1—
120.11
119.75
S2
26
429.02
26
432.22
1—
1—
26
429.02
26
432.22
15
26.96
15
88.81
1—
1—
426.96
15
88.81
T2
11
38.91
18
126.53
1—
1—
938.91
17
126.53
16
28.83
428.46
23
18.77
25
26.86
11
47.60
955.33
U2
24
251.26
25
411.92
22
0.79
22
0.72
24
252.04
25
412.64
V2
19
133.45
19
131.53
1—
1—
18
133.45
18
131.53
FNIR
@FPIR
=10−3
40.0030
40.0030
11
0.0207
10
0.0202
21
0.0386
22
0.0412
15
0.0311
24
0.0686
23
0.0684
40.0030
80.0143
14
0.0286
70.0072
26
NA
25
NA
12
0.0214
20
0.0370
16
0.0333
10.0027
10.0027
13
0.0281
90.0195
27
NA
19
0.0366
17
0.0336
18
0.0358
30.0028
Table42:Tabulation
ofmean
identificationtim
eresults
forC
lassA
—Leftand
RightIndex
—greater
thanor
equalto20-second
searches.Letterrefers
tothe
participant’sletter
codefound
onthe
footerofthis
page.Sub.#is
anidentifier
usedto
differentiatebetw
eenthe
two
submissions
eachparticipantcould
make.StageO
neand
StageTwo
referto
thestages
ofidentificationdefined
inSection
5,with
Totalindicatingthe
combined
searchtim
e.One
andTen
referto
thenum
berofconcurrentidentification
processesrun
ona
compute
node.Allvalues
arem
eandurations
arereported
inseconds,but
were
originallyrecorded
tom
icrosecondprecision.
A—
indicatesthat
theoperation
completed
fasterthan
couldbe
reliablym
easured.The
number
tothe
leftof
avalue
providesthe
value’scolum
n-wise
ranking,with
thebestperform
anceshaded
ingreen
andthe
worstin
pink.Forreference,the
FNIR
valuesfrom
Table9
arereprinted
tothe
rightofthistable.
C = afis team D = 3M Cogent E = Neurotechnology F = Papillon G = Dermalog H = Hisign Bio-Info InstituteI = NEC J = Sonda K = Tiger IT L = Innovatrics M = SPEX O = ID SolutionsP = id3 Q = Morpho S = Decatur Industries T = BIO-key U = Aware V = AA Technology

FPVTE – FINGERPRINT MATCHING 135Pa
rtic
ipan
tSt
age
One
Stag
eTw
oTo
tal
Lett
erSu
b.#
One
Ten
One
Ten
One
Ten
12
3.71
13.89
1—
1—
23.71
13.89
C2
46.62
37.00
1—
1—
46.62
37.00
119
48.97
22
72.20
27
4.12
27
6.82
20
53.09
22
79.02
D2
23
55.36
26
84.23
28
4.29
28
9.21
21
59.65
27
93.44
11
3.71
24.13
1—
1—
13.71
24.13
E2
13
41.57
11
41.51
1—
1—
12
41.57
11
41.51
18
31.92
833.70
1—
1—
831.92
833.70
F2
15
46.18
13
48.76
1—
1—
13
46.18
13
48.76
16
19.65
520.00
1—
1—
619.65
520.00
G2
24
62.98
20
64.89
1—
1—
22
62.98
20
64.89
120
49.13
19
61.06
1—
1—
15
49.13
19
61.06
H2
22
52.05
17
60.24
1—
1—
19
52.05
17
60.24
125
63.06
21
71.35
1—
1—
23
63.06
21
71.35
I2
21
51.59
18
60.52
1—
1—
18
51.59
18
60.52
17
26.88
628.69
1—
1—
726.88
628.69
J2
29
80.54
27
85.49
1—
1—
27
80.54
26
85.49
13
5.51
410.07
1—
1—
35.51
410.08
L2
512.52
730.67
1—
1—
512.52
730.67
19
32.39
934.52
1—
1—
932.39
934.52
M2
30
90.51
28
95.91
1—
1—
30
90.51
28
95.91
112
38.17
12
41.76
1—
1—
11
38.17
12
41.76
O2
26
78.80
25
83.65
1—
1—
24
78.80
25
83.65
117
47.81
16
54.11
25
3.52
25
3.24
17
51.33
16
57.34
Q2
16
47.51
15
53.38
26
3.54
26
3.35
16
51.05
15
56.74
127
78.95
24
79.27
1—
1—
25
78.95
24
79.27
S2
28
79.01
23
79.17
1—
1—
26
79.01
23
79.17
110
33.07
—N
A30
48.79
—N
A28
81.85
—N
AU
214
42.62
—N
A29
47.88
—N
A29
90.50
—N
A
111
36.28
10
36.96
1—
1—
10
36.28
10
36.96
V2
18
48.01
14
50.63
1—
1—
14
48.01
14
50.63
FNIR
@FP
IR=
10−3
22
0.0654
21
0.0647
60.0163
50.0142
13
0.0259
70.0187
29
0.1684
28
0.1681
18
0.0371
17
0.0325
23
0.0998
24
0.1008
40.0116
10.0094
15
0.0287
10
0.0236
16
0.0288
14
0.0276
30
0.1736
27
0.1634
12
0.0257
11
0.0254
20.0098
30.0099
25
0.1089
26
0.1133
20
0.0500
19
0.0461
90.0192
80.0190
Tabl
e43
:Ta
bula
tion
ofm
ean
iden
tific
atio
nti
me
resu
lts
for
Cla
ssB
—Le
ftSl
ap.
Lett
erre
fers
toth
epa
rtic
ipan
t’sle
tter
code
foun
don
the
foot
erof
this
page
.Su
b.#
isan
iden
tifie
rus
edto
diff
eren
tiat
ebe
twee
nth
etw
osu
bmis
sion
sea
chpa
rtic
ipan
tco
uld
mak
e.St
age
One
and
Stag
eTw
ore
fer
toth
est
ages
ofid
enti
ficat
ion
defin
edin
Sect
ion
5,w
ith
Tota
lind
icat
ing
the
com
bine
dse
arch
tim
e.O
nean
dTe
nre
fer
toth
enu
mbe
rof
conc
urre
ntid
enti
ficat
ion
proc
esse
sru
non
aco
mpu
teno
de.A
llva
lues
are
mea
ndu
rati
ons
are
repo
rted
inse
cond
s,bu
twer
eor
igin
ally
reco
rded
tom
icro
seco
ndpr
ecis
ion.
A—
indi
cate
sth
atth
eop
erat
ion
com
plet
edfa
ster
than
coul
dbe
relia
bly
mea
sure
d.N
Ain
dica
tes
that
the
oper
atio
nsre
quir
edto
prod
uce
the
valu
eco
uld
not
bepe
rfor
med
.The
num
ber
toth
ele
ftof
ava
lue
prov
ides
the
valu
e’s
colu
mn-
wis
era
nkin
g,w
ith
the
best
perf
orm
ance
shad
edin
gree
nan
dth
ew
orst
inpi
nk.F
orre
fere
nce,
the
FNIR
valu
esfr
omTa
ble
10ar
ere
prin
ted
toth
eri
ghto
fthi
sta
ble.
C = afis team D = 3M Cogent E = Neurotechnology F = Papillon G = Dermalog H = Hisign Bio-Info InstituteI = NEC J = Sonda K = Tiger IT L = Innovatrics M = SPEX O = ID SolutionsP = id3 Q = Morpho S = Decatur Industries T = BIO-key U = Aware V = AA Technology
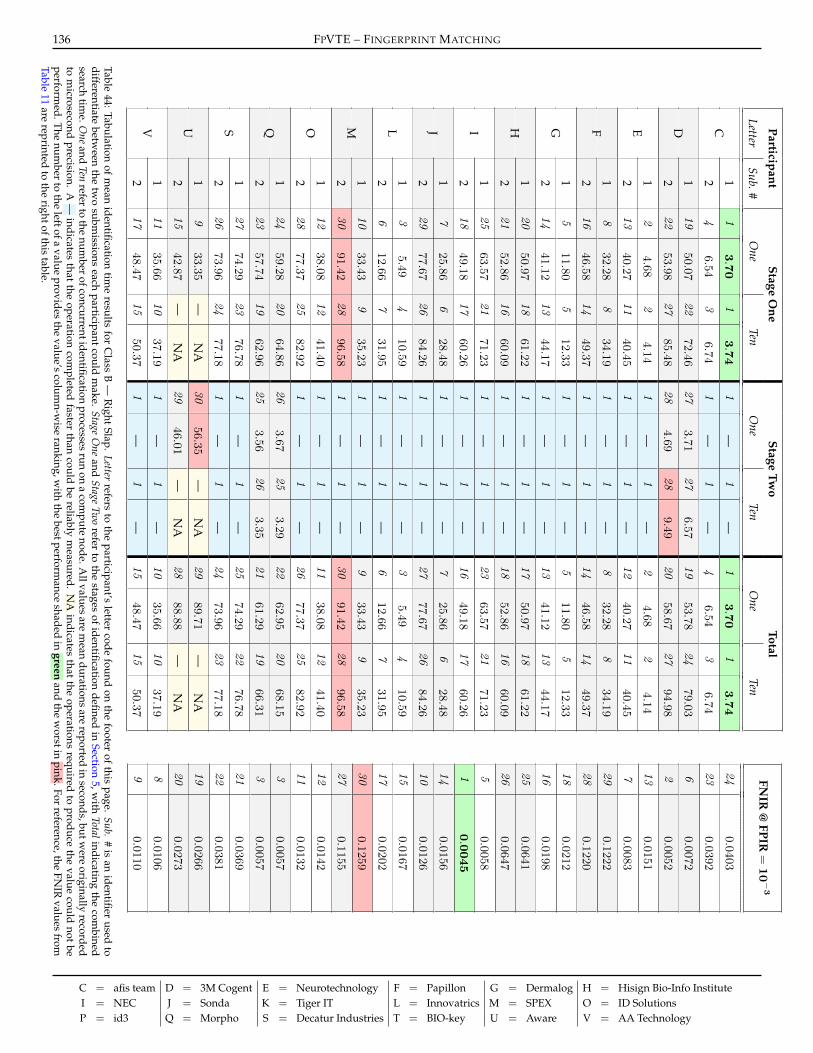
136 FPVTE – FINGERPRINT MATCHINGParticipant
StageO
neStage
Two
Total
LetterSub.#
One
TenO
neTen
One
Ten
11
3.70
13.74
1—
1—
13.70
13.74
C2
46.54
36.74
1—
1—
46.54
36.74
119
50.07
22
72.46
27
3.71
27
6.57
19
53.78
24
79.03
D2
22
53.98
27
85.48
28
4.69
28
9.49
20
58.67
27
94.98
12
4.68
24.14
1—
1—
24.68
24.14
E2
13
40.27
11
40.45
1—
1—
12
40.27
11
40.45
18
32.28
834.19
1—
1—
832.28
834.19
F2
16
46.58
14
49.37
1—
1—
14
46.58
14
49.37
15
11.80
512.33
1—
1—
511.80
512.33
G2
14
41.12
13
44.17
1—
1—
13
41.12
13
44.17
120
50.97
18
61.22
1—
1—
17
50.97
18
61.22
H2
21
52.86
16
60.09
1—
1—
18
52.86
16
60.09
125
63.57
21
71.23
1—
1—
23
63.57
21
71.23
I2
18
49.18
17
60.26
1—
1—
16
49.18
17
60.26
17
25.86
628.48
1—
1—
725.86
628.48
J2
29
77.67
26
84.26
1—
1—
27
77.67
26
84.26
13
5.49
410.59
1—
1—
35.49
410.59
L2
612.66
731.95
1—
1—
612.66
731.95
110
33.43
935.23
1—
1—
933.43
935.23
M2
30
91.42
28
96.58
1—
1—
30
91.42
28
96.58
112
38.08
12
41.40
1—
1—
11
38.08
12
41.40
O2
28
77.37
25
82.92
1—
1—
26
77.37
25
82.92
124
59.28
20
64.86
26
3.67
25
3.29
22
62.95
20
68.15
Q2
23
57.74
19
62.96
25
3.56
26
3.35
21
61.29
19
66.31
127
74.29
23
76.78
1—
1—
25
74.29
22
76.78
S2
26
73.96
24
77.18
1—
1—
24
73.96
23
77.18
19
33.35
—N
A30
56.35
—N
A29
89.71
—N
AU
215
42.87
—N
A29
46.01
—N
A28
88.88
—N
A
111
35.66
10
37.19
1—
1—
10
35.66
10
37.19
V2
17
48.47
15
50.37
1—
1—
15
48.47
15
50.37
FNIR
@FPIR
=10−3
24
0.0403
23
0.0392
60.0072
20.0052
13
0.0151
70.0083
29
0.1222
28
0.1220
18
0.0212
16
0.0198
25
0.0641
26
0.0647
50.0058
10.0045
14
0.0156
10
0.0126
15
0.0167
17
0.0202
30
0.1259
27
0.1155
12
0.0142
11
0.0132
30.0057
30.0057
21
0.0369
22
0.0381
19
0.0266
20
0.0273
80.0106
90.0110
Table44:
Tabulationof
mean
identificationtim
eresults
forC
lassB
—R
ightSlap.
Letterrefers
tothe
participant’sletter
codefound
onthe
footerof
thispage.
Sub.#
isan
identifierused
todifferentiate
between
thetw
osubm
issionseach
participantcould
make.
StageO
neand
StageTw
orefer
tothe
stagesof
identificationdefined
inSection
5,with
Totalindicatingthe
combined
searchtim
e.One
andTen
referto
thenum
berofconcurrentidentification
processesrun
ona
compute
node.Allvalues
arem
eandurations
arereported
inseconds,butw
ereoriginally
recordedto
microsecond
precision.A
—indicates
thatthe
operationcom
pletedfaster
thancould
bereliably
measured.
NA
indicatesthat
theoperations
requiredto
producethe
valuecould
notbe
performed.T
henum
berto
theleftofa
valueprovides
thevalue’s
column-w
iseranking,w
iththe
bestperformance
shadedin
greenand
thew
orstinpink.For
reference,theFN
IRvalues
fromTable
11are
reprintedto
therightofthis
table.
C = afis team D = 3M Cogent E = Neurotechnology F = Papillon G = Dermalog H = Hisign Bio-Info InstituteI = NEC J = Sonda K = Tiger IT L = Innovatrics M = SPEX O = ID SolutionsP = id3 Q = Morpho S = Decatur Industries T = BIO-key U = Aware V = AA Technology

FPVTE – FINGERPRINT MATCHING 137Pa
rtic
ipan
tSt
age
One
Stag
eTw
oTo
tal
Lett
erSu
b.#
One
Ten
One
Ten
One
Ten
12
7.36
37.86
1—
1—
27.36
37.86
C2
510.63
411.08
1—
1—
510.63
411.08
123
67.64
27
120.11
27
1.72
27
3.14
21
69.35
27
123.25
D2
25
71.41
28
124.70
28
2.80
28
5.36
24
74.21
28
130.06
13
8.18
27.40
1—
1—
38.18
27.40
E2
13
39.56
940.38
1—
1—
12
39.56
940.38
18
28.72
730.42
1—
1—
828.72
730.42
F2
11
38.37
10
40.60
1—
1—
10
38.37
10
40.60
11
5.52
15.43
1—
1—
15.52
15.43
G2
16
42.86
13
43.96
1—
1—
14
42.86
13
43.96
124
70.12
24
85.94
1—
1—
22
70.12
24
85.94
H2
26
72.35
23
84.76
1—
1—
23
72.35
23
84.76
117
47.35
15
53.29
1—
1—
15
47.35
15
53.29
I2
21
57.94
20
73.10
1—
1—
19
57.94
20
73.10
17
27.52
629.91
1—
1—
727.52
629.91
J2
28
75.92
22
80.17
1—
1—
26
75.92
22
80.17
14
10.37
522.54
1—
1—
410.37
522.54
L2
620.85
18
63.37
1—
1—
620.85
18
63.37
19
28.89
830.58
1—
1—
928.89
830.58
M2
18
49.50
14
52.63
1—
1—
16
49.50
14
52.63
115
40.42
12
43.46
1—
1—
13
40.42
12
43.46
O2
27
74.57
21
78.24
1—
1—
25
74.57
21
78.24
122
62.90
19
71.42
26
1.10
26
0.84
20
63.99
19
72.27
Q2
19
52.85
17
61.10
25
1.03
25
0.78
18
53.88
17
61.88
130
85.05
26
87.49
1—
1—
28
85.05
26
87.49
S2
29
84.02
25
87.27
1—
1—
27
84.02
25
87.27
110
30.21
—N
A30
56.68
—N
A29
86.88
—N
AU
214
40.05
—N
A29
50.99
—N
A30
91.04
—N
A
112
39.24
11
41.22
1—
1—
11
39.24
11
41.22
V2
20
52.97
16
55.45
1—
1—
17
52.97
16
55.45
FNIR
@FP
IR=
10−3
30
NA
29
NA
60.0031
50.0024
15
0.0063
10
0.0049
28
0.0910
26
0.0901
18
0.0106
17
0.0084
23
0.0349
24
0.0361
30.0022
10.0015
16
0.0068
90.0047
12
0.0054
14
0.0062
27
0.0904
25
0.0882
13
0.0057
11
0.0051
20.0021
30.0022
21
0.0160
22
0.0190
20
0.0139
19
0.0124
70.0036
70.0036
Tabl
e45
:Tab
ulat
ion
ofm
ean
iden
tific
atio
nti
me
resu
lts
for
Cla
ssB
—Le
ftan
dR
ight
Slap
.Let
terr
efer
sto
the
part
icip
ant’s
lett
erco
defo
und
onth
efo
oter
ofth
ispa
ge.S
ub.#
isan
iden
tifie
rus
edto
diff
eren
tiat
ebe
twee
nth
etw
osu
bmis
sion
sea
chpa
rtic
ipan
tcou
ldm
ake.
Stag
eO
nean
dSt
age
Two
refe
rto
the
stag
esof
iden
tific
atio
nde
fined
inSe
ctio
n5,
wit
hTo
tali
ndic
atin
gth
eco
mbi
ned
sear
chti
me.
One
and
Ten
refe
rto
the
num
ber
ofco
ncur
rent
iden
tific
atio
npr
oces
ses
run
ona
com
pute
node
.All
valu
esar
em
ean
dura
tion
sar
ere
port
edin
seco
nds,
butw
ere
orig
inal
lyre
cord
edto
mic
rose
cond
prec
isio
n.A
—in
dica
tes
that
the
oper
atio
nco
mpl
eted
fast
erth
anco
uld
bere
liabl
ym
easu
red.
NA
indi
cate
sth
atth
eop
erat
ions
requ
ired
topr
oduc
eth
eva
lue
coul
dno
tbe
perf
orm
ed.T
henu
mbe
rto
the
left
ofa
valu
epr
ovid
esth
eva
lue’
sco
lum
n-w
ise
rank
ing,
wit
hth
ebe
stpe
rfor
man
cesh
aded
ingr
een
and
the
wor
stin
pink
.For
refe
renc
e,th
eFN
IRva
lues
from
Tabl
e12
are
repr
inte
dto
the
righ
toft
his
tabl
e.
C = afis team D = 3M Cogent E = Neurotechnology F = Papillon G = Dermalog H = Hisign Bio-Info InstituteI = NEC J = Sonda K = Tiger IT L = Innovatrics M = SPEX O = ID SolutionsP = id3 Q = Morpho S = Decatur Industries T = BIO-key U = Aware V = AA Technology

138 FPVTE – FINGERPRINT MATCHINGParticipant
StageO
neStage
Two
Total
LetterSub.#
One
TenO
neTen
One
Ten
13
9.00
39.11
1—
1—
39.00
39.11
C2
410.28
410.71
1—
1—
410.28
410.71
118
51.42
25
96.25
25
1.00
27
1.80
17
52.42
26
98.05
D2
20
52.57
28
101.77
28
1.80
28
3.26
19
54.37
28
105.02
12
8.76
28.63
1—
1—
28.76
28.63
E2
21
52.88
15
54.84
1—
1—
18
52.88
15
54.84
113
39.12
11
40.86
1—
1—
12
39.12
11
40.86
F2
19
51.59
14
54.45
1—
1—
16
51.59
14
54.45
11
6.33
15.99
1—
1—
16.33
15.99
G2
10
31.67
527.42
1—
1—
931.67
527.42
127
82.43
26
97.35
1—
1—
26
82.43
25
97.35
H2
28
85.74
27
98.29
1—
1—
27
85.74
27
98.29
16
24.57
729.56
1—
1—
624.57
729.56
I2
22
60.01
20
78.97
1—
1—
20
60.01
20
78.97
17
26.31
628.07
1—
1—
726.31
628.07
J2
24
64.38
18
69.51
1—
1—
22
64.38
18
69.51
15
14.42
834.20
1—
1—
514.42
834.20
L2
828.56
22
86.45
1—
1—
828.56
22
86.45
114
41.37
12
43.38
1—
1—
13
41.37
12
43.38
M2
26
70.45
19
74.53
1—
1—
23
70.45
19
74.53
112
37.04
10
39.70
1—
1—
11
37.04
10
39.70
O2
23
63.87
17
68.54
1—
1—
21
63.87
17
68.54
116
47.38
16
56.48
27
1.47
25
1.02
14
48.85
16
57.50
Q2
25
70.21
21
81.92
26
1.46
26
1.05
24
71.67
21
82.97
129
86.50
23
91.50
1—
1—
28
86.50
23
91.50
S2
30
88.70
24
93.61
1—
1—
29
88.70
24
93.61
19
30.33
—N
A30
58.50
—N
A30
88.83
—N
AU
215
42.51
—N
A29
37.63
—N
A25
80.14
—N
A
111
35.50
937.75
1—
1—
10
35.51
937.75
V2
17
49.72
13
51.37
1—
1—
15
49.72
13
51.37
FNIR
@FPIR
=10−3
30
NA
29
NA
60.0020
20.0012
16
0.0043
70.0024
27
0.0591
27
0.0591
18
0.0062
14
0.0040
23
0.0203
24
0.0204
20.0012
10.0009
17
0.0049
11
0.0033
10
0.0031
11
0.0033
26
0.0543
25
0.0515
15
0.0041
13
0.0035
20.0012
20.0012
20
0.0108
21
0.0136
19
0.0099
22
0.0141
90.0027
70.0024
Table46:Tabulation
ofmean
identificationtim
eresults
forC
lassB
—Identification
Flats.Letterrefers
tothe
participant’sletter
codefound
onthe
footerofthis
page.Sub.#is
anidentifier
usedto
differentiatebetw
eenthe
two
submissions
eachparticipantcould
make.Stage
One
andStage
Two
referto
thestages
ofidentificationdefined
inSection
5,with
Totalindicatingthe
combined
searchtim
e.One
andTen
referto
thenum
berofconcurrentidentification
processesrun
ona
compute
node.Allvalues
arem
eandurations
arereported
inseconds,butw
ereoriginally
recordedto
microsecond
precision.A
—indicates
thatthe
operationcom
pletedfaster
thancould
bereliably
measured.
NA
indicatesthat
theoperations
requiredto
producethe
valuecould
notbe
performed.T
henum
berto
theleftofa
valueprovides
thevalue’s
column-w
iseranking,w
iththe
bestperformance
shadedin
greenand
thew
orstinpink.For
reference,theFN
IRvalues
fromTable
13are
reprintedto
therightofthis
table.
C = afis team D = 3M Cogent E = Neurotechnology F = Papillon G = Dermalog H = Hisign Bio-Info InstituteI = NEC J = Sonda K = Tiger IT L = Innovatrics M = SPEX O = ID SolutionsP = id3 Q = Morpho S = Decatur Industries T = BIO-key U = Aware V = AA Technology

FPVTE – FINGERPRINT MATCHING 139Pa
rtic
ipan
tSt
age
One
Stag
eTw
oTo
tal
Lett
erSu
b.#
One
Ten
One
Ten
One
Ten
15
21.04
422.92
1—
1—
521.04
422.92
C2
418.31
319.18
1—
1—
418.31
319.18
128
85.52
28
173.53
25
1.55
27
2.52
28
87.07
28
176.06
D2
25
82.82
27
166.16
28
2.09
28
2.98
25
84.92
27
169.13
12
15.94
215.93
1—
1—
215.94
215.93
E2
27
85.50
22
88.32
1—
1—
27
85.50
22
88.32
116
50.99
12
50.83
1—
1—
14
50.99
12
50.83
F2
18
60.33
14
60.33
1—
1—
16
60.34
14
60.33
11
11.21
114.65
1—
1—
111.21
114.65
G2
737.15
10
48.42
1—
1—
737.15
948.42
121
67.90
19
77.93
1—
1—
19
67.91
19
77.93
H2
20
64.90
18
72.52
1—
1—
18
64.90
18
72.52
123
79.70
21
84.04
1—
1—
23
79.70
21
84.04
I2
17
56.93
15
64.06
1—
1—
15
56.93
15
64.06
112
46.32
13
50.85
1—
1—
12
46.32
13
50.85
J2
26
85.17
25
94.45
1—
1—
26
85.17
25
94.45
13
17.53
539.66
1—
1—
317.53
539.67
L2
621.26
17
67.26
1—
1—
621.26
17
67.27
19
42.60
642.17
1—
1—
842.60
642.17
M2
11
45.96
845.71
1—
1—
11
45.96
745.71
122
73.31
20
80.40
1—
1—
21
73.31
20
80.40
O2
24
82.13
23
91.94
1—
1—
24
82.13
23
91.94
110
43.10
947.65
26
1.64
26
1.54
10
44.75
10
49.18
Q2
841.98
745.57
27
1.70
25
1.39
943.67
846.96
129
87.76
26
97.78
1—
1—
29
87.76
26
97.78
S2
30
89.24
24
92.85
1—
1—
30
89.24
24
92.85
113
47.49
—N
A30
27.65
—N
A22
75.14
—N
AU
215
50.30
—N
A29
17.68
—N
A20
67.98
—N
A
114
47.76
11
49.30
1—
1—
13
47.76
11
49.30
V2
19
63.19
16
66.29
1—
1—
17
63.19
16
66.29
FNIR
@FP
IR=
10−3
30
NA
24
0.0711
60.0015
20.0011
14
0.0088
13
0.0048
25
0.0734
25
0.0734
23
0.0368
20
0.0276
20
0.0276
19
0.0275
40.0013
10.0010
12
0.0047
10
0.0027
16
0.0102
15
0.0095
28
0.0934
27
0.0826
90.0025
10
0.0027
20.0011
40.0013
22
0.0311
29
0.1680
18
0.0163
17
0.0155
70.0024
70.0024
Tabl
e47
:Ta
bula
tion
ofm
ean
iden
tific
atio
nti
me
resu
lts
for
Cla
ssC
—Te
n-Fi
nger
Plai
n-to
-Pla
in.
Lett
erre
fers
toth
epa
rtic
ipan
t’sle
tter
code
foun
don
the
foot
erof
this
page
.Su
b.#
isan
iden
tifie
rus
edto
diff
eren
tiat
ebe
twee
nth
etw
osu
bmis
sion
sea
chpa
rtic
ipan
tcou
ldm
ake.
Stag
eO
nean
dSt
age
Two
refe
rto
the
stag
esof
iden
tific
atio
nde
fined
inSe
ctio
n5,
wit
hTo
tali
ndic
atin
gth
eco
mbi
ned
sear
chti
me.
One
and
Ten
refe
rto
the
num
ber
ofco
ncur
rent
iden
tific
atio
npr
oces
ses
run
ona
com
pute
node
.A
llva
lues
are
mea
ndu
rati
ons
are
repo
rted
inse
cond
s,bu
tw
ere
orig
inal
lyre
cord
edto
mic
rose
cond
prec
isio
n.A
—in
dica
tes
that
the
oper
atio
nco
mpl
eted
fast
erth
anco
uld
bere
liabl
ym
easu
red.
NA
indi
cate
sth
atth
eop
erat
ions
requ
ired
topr
oduc
eth
eva
lue
coul
dno
tbe
perf
orm
ed.
The
num
ber
toth
ele
ftof
ava
lue
prov
ides
the
valu
e’s
colu
mn-
wis
era
nkin
g,w
ith
the
best
perf
orm
ance
shad
edin
gree
nan
dth
ew
orst
inpi
nk.
For
refe
renc
e,th
eFN
IRva
lues
from
Tabl
e14
are
repr
inte
dto
the
righ
toft
his
tabl
e.
C = afis team D = 3M Cogent E = Neurotechnology F = Papillon G = Dermalog H = Hisign Bio-Info InstituteI = NEC J = Sonda K = Tiger IT L = Innovatrics M = SPEX O = ID SolutionsP = id3 Q = Morpho S = Decatur Industries T = BIO-key U = Aware V = AA Technology

140 FPVTE – FINGERPRINT MATCHINGParticipant
StageO
neStage
Two
Total
LetterSub.#
One
TenO
neTen
One
Ten
14
25.25
327.50
1—
1—
425.25
327.50
C2
525.91
427.89
1—
1—
525.91
427.89
118
61.79
27
102.45
28
4.17
25
1.91
17
65.97
27
104.36
D2
28
83.58
28
160.54
27
2.81
28
3.02
30
86.39
28
163.56
11
9.52
110.54
1—
1—
19.52
110.54
E2
16
57.01
13
59.56
1—
1—
14
57.02
13
59.56
115
55.63
11
58.39
1—
1—
13
55.63
11
58.39
F2
20
68.61
18
71.58
1—
1—
18
68.61
18
71.58
12
11.67
212.99
1—
1—
211.67
212.99
G2
630.61
531.33
1—
1—
630.61
531.33
129
84.14
25
94.22
1—
1—
28
84.14
25
94.22
H2
30
84.26
26
94.72
1—
1—
29
84.26
26
94.72
125
79.04
19
75.61
1—
1—
24
79.04
19
75.61
I2
940.53
741.07
1—
1—
940.53
741.07
18
36.09
640.14
1—
1—
836.09
640.14
J2
22
72.62
23
81.37
1—
1—
20
72.62
22
81.37
17
31.42
14
64.18
1—
1—
731.42
14
64.19
L2
319.51
12
58.45
1—
1—
319.52
12
58.45
111
47.38
949.47
1—
1—
11
47.38
949.47
M2
13
48.71
10
50.67
1—
1—
12
48.71
10
50.67
117
59.01
15
66.17
1—
1—
15
59.01
15
66.17
O2
21
72.55
22
81.31
1—
1—
19
72.55
21
81.31
126
81.02
24
82.87
25
2.23
26
2.53
26
83.25
24
85.39
Q2
27
81.05
21
81.03
26
2.30
27
2.55
27
83.35
23
83.58
124
74.01
20
80.86
1—
1—
22
74.01
20
80.86
S2
23
72.95
17
71.01
1—
1—
21
72.95
17
71.01
112
48.52
—N
A30
34.24
—N
A25
82.76
—N
AU
214
53.02
—N
A29
21.36
—N
A23
74.39
—N
A
110
40.94
842.49
1—
1—
10
40.94
842.49
V2
19
65.47
16
67.92
1—
1—
16
65.47
16
67.92
FNIR
@FPIR
=10−3
16
0.0094
15
0.0085
40.0015
70.0018
18
0.0106
12
0.0050
25
0.0536
25
0.0536
24
0.0447
21
0.0333
20
0.0201
19
0.0199
10.0013
20.0014
13
0.0051
90.0033
17
0.0097
14
0.0083
28
0.0783
27
0.0716
11
0.0034
90.0033
50.0017
20.0014
29
0.0860
30
0.2462
23
0.0358
22
0.0351
50.0017
80.0019
Table48:
Tabulationof
mean
identificationtim
eresults
forC
lassC
—Ten-Finger
Rolled-to-R
olled.Letter
refersto
theparticipant’s
lettercode
foundon
thefooter
ofthis
page.Sub.
#is
anidentifier
usedto
differentiatebetw
eenthe
two
submissions
eachparticipantcould
make.Stage
One
andStage
Two
referto
thestages
ofidentificationdefined
inSection
5,with
Totalindicatingthe
combined
searchtim
e.O
neand
Tenrefer
tothe
number
ofconcurrent
identificationprocesses
runon
acom
putenode.
Allvalues
arem
eandurations
arereported
inseconds,but
were
originallyrecorded
tom
icrosecondprecision.
A—
indicatesthat
theoperation
completed
fasterthan
couldbe
reliablym
easured.N
Aindicates
thatthe
operationsrequired
toproduce
thevalue
couldnotbe
performed.
The
number
tothe
leftofa
valueprovides
thevalue’s
column-w
iseranking,w
iththe
bestperformance
shadedin
greenand
thew
orstinpink.
Forreference,
theFN
IRvalues
fromTable
15are
reprintedto
therightofthis
table.
C = afis team D = 3M Cogent E = Neurotechnology F = Papillon G = Dermalog H = Hisign Bio-Info InstituteI = NEC J = Sonda K = Tiger IT L = Innovatrics M = SPEX O = ID SolutionsP = id3 Q = Morpho S = Decatur Industries T = BIO-key U = Aware V = AA Technology

FPVTE – FINGERPRINT MATCHING 141Pa
rtic
ipan
tSt
age
One
Stag
eTw
oTo
tal
Lett
erSu
b.#
One
Ten
One
Ten
One
Ten
17
36.55
440.68
1—
1—
736.55
440.68
C2
533.93
335.83
1—
1—
533.93
335.83
114
55.60
27
98.54
25
0.77
25
0.71
12
56.38
27
99.25
D2
25
74.38
28
155.17
26
1.62
27
1.90
25
76.00
28
157.06
11
10.81
111.40
1—
1—
110.81
111.40
E2
18
59.20
15
61.17
1—
1—
16
59.20
15
61.17
117
58.39
14
58.89
1—
1—
15
58.39
14
58.89
F2
19
61.82
16
61.34
1—
1—
17
61.82
16
61.34
13
25.05
232.02
1—
1—
325.05
232.02
G2
634.47
545.09
1—
1—
634.47
545.09
120
65.03
21
78.10
1—
1—
18
65.03
21
78.10
H2
21
65.69
17
73.62
1—
1—
19
65.69
17
73.62
127
76.98
22
82.78
1—
1—
26
76.98
22
82.78
I2
23
66.90
20
76.96
1—
1—
21
66.90
20
76.96
18
42.13
646.98
1—
1—
842.13
646.98
J2
28
79.37
24
89.84
1—
1—
27
79.37
24
89.84
14
27.43
13
58.35
1—
1—
427.43
13
58.36
L2
218.62
750.64
1—
1—
218.62
750.65
115
57.06
11
56.59
1—
1—
13
57.06
11
56.59
M2
16
57.90
12
58.12
1—
1—
14
57.90
12
58.12
122
65.71
18
74.07
1—
1—
20
65.71
18
74.07
O2
26
75.98
23
86.80
1—
1—
24
75.98
23
86.80
19
47.17
10
52.18
28
1.91
26
1.72
10
49.07
10
53.90
Q2
10
47.87
951.32
27
1.85
28
2.36
11
49.72
953.68
130
89.37
26
96.29
1—
1—
30
89.37
26
96.29
S2
29
89.34
25
90.28
1—
1—
29
89.34
25
90.28
111
48.44
—N
A30
34.07
—N
A28
82.50
—N
AU
213
53.32
—N
A29
20.14
—N
A23
73.46
—N
A
112
48.91
850.94
1—
1—
948.91
850.94
V2
24
71.28
19
74.86
1—
1—
22
71.28
19
74.86
FNIR
@FP
IR=
10−3
17
0.0149
18
0.0169
60.0028
30.0018
16
0.0137
12
0.0056
27
0.2514
27
0.2514
24
0.0649
23
0.0521
20
0.0291
19
0.0285
20.0014
10.0011
13
0.0071
70.0034
15
0.0136
14
0.0129
30
0.3067
27
0.2514
10
0.0041
80.0036
40.0020
50.0022
25
0.1017
26
0.2366
22
0.0378
21
0.0295
11
0.0052
90.0039
Tabl
e49
:Ta
bula
tion
ofm
ean
iden
tific
atio
nti
me
resu
lts
for
Cla
ssC
—Te
n-Fi
nger
Plai
n-to
-Rol
led.
Lett
erre
fers
toth
epa
rtic
ipan
t’sle
tter
code
foun
don
the
foot
erof
this
page
.Su
b.#
isan
iden
tifie
rus
edto
diff
eren
tiat
ebe
twee
nth
etw
osu
bmis
sion
sea
chpa
rtic
ipan
tcou
ldm
ake.
Stag
eO
nean
dSt
age
Two
refe
rto
the
stag
esof
iden
tific
atio
nde
fined
inSe
ctio
n5,
wit
hTo
tali
ndic
atin
gth
eco
mbi
ned
sear
chti
me.
One
and
Ten
refe
rto
the
num
ber
ofco
ncur
rent
iden
tific
atio
npr
oces
ses
run
ona
com
pute
node
.A
llva
lues
are
mea
ndu
rati
ons
are
repo
rted
inse
cond
s,bu
tw
ere
orig
inal
lyre
cord
edto
mic
rose
cond
prec
isio
n.A
—in
dica
tes
that
the
oper
atio
nco
mpl
eted
fast
erth
anco
uld
bere
liabl
ym
easu
red.
NA
indi
cate
sth
atth
eop
erat
ions
requ
ired
topr
oduc
eth
eva
lue
coul
dno
tbe
perf
orm
ed.
The
num
ber
toth
ele
ftof
ava
lue
prov
ides
the
valu
e’s
colu
mn-
wis
era
nkin
g,w
ith
the
best
perf
orm
ance
shad
edin
gree
nan
dth
ew
orst
inpi
nk.
For
refe
renc
e,th
eFN
IRva
lues
from
Tabl
e16
are
repr
inte
dto
the
righ
toft
his
tabl
e.
C = afis team D = 3M Cogent E = Neurotechnology F = Papillon G = Dermalog H = Hisign Bio-Info InstituteI = NEC J = Sonda K = Tiger IT L = Innovatrics M = SPEX O = ID SolutionsP = id3 Q = Morpho S = Decatur Industries T = BIO-key U = Aware V = AA Technology

142 FPVTE – FINGERPRINT MATCHING
E Progression for Last Two Submissions
This appendix provides additional information in reference to comments from Section 8 that looked at accuracy versussearch time. The tables in this appendix show search times for the last two of the three submission periods during theevaluation. Generally, participants attempt to improve accuracy with potential tradeoffs in speed and template size. Thetables in this section show the search times and FNIR @ FPIR = 10−3 for the these two submissions.
Class A results are in Tables 50 through 52, Class B results are in Tables 53 through 56, and Class C results are in Tables 57through 59.
C = afis team D = 3M Cogent E = Neurotechnology F = Papillon G = Dermalog H = Hisign Bio-Info InstituteI = NEC J = Sonda K = Tiger IT L = Innovatrics M = SPEX O = ID SolutionsP = id3 Q = Morpho S = Decatur Industries T = BIO-key U = Aware V = AA Technology

FPVTE – FINGERPRINT MATCHING 143
Participant Second ThirdLetter Sub. # Time FNIR Time FNIR
<20
seco
nds
1 1 0.12 16 0.1077 1 0.29 24 0.1335C
2 6 0.75 15 0.0984 6 0.87 25 0.1337
D 1 9 1.79 2 0.0376 20 7.52 1 0.0197
1 3 0.42 10 0.0794 4 0.57 12 0.0745E
2 22 15.40 8 0.0757 30 16.71 11 0.0723
1 11 2.50 18 0.1122 11 2.52 20 0.1111F
2 15 3.64 17 0.1093 15 3.78 18 0.1082
G 1 16 5.30 23 0.1221 21 9.52 19 0.1089
1 5 0.71 20 0.1168 14 3.65 26 0.1576H
2 7 0.94 19 0.1160 17 4.26 27 0.1607
I 1 18 6.19 1 0.0306 22 10.36 5 0.0257
1 2 0.35 13 0.0900 3 0.56 14 0.0786J
2 4 0.60 9 0.0773 7 1.34 10 0.0712
1 — — — — 25 10.48 17 0.0883K
2 — — — — 24 10.47 16 0.0875
1 8 1.76 14 0.0913 2 0.30 8 0.0625L
2 14 3.04 12 0.0881 12 3.34 6 0.0351
1 — — — — 10 2.07 29 0.2995M
2 — — — — 27 15.19 28 0.2921
1 10 1.96 7 0.0751 5 0.64 15 0.0818O
2 13 2.95 6 0.0735 9 1.63 13 0.0766
1 — — — — 8 1.38 23 0.1308P
2 12 2.83 24 0.1343 13 3.43 22 0.1272
1 20 6.97 4 0.0507 29 15.90 2 0.0222Q
2 19 6.42 5 0.0511 23 10.42 3 0.0226
S 1 17 5.99 11 0.0811 28 15.37 7 0.0571
1 23 16.49 21 0.1181 16 4.18 30 NAT
2 — — — — 18 5.96 9 0.0685
U 1 24 18.62 22 0.1209 26 14.72 21 0.1218
V 1 21 10.34 3 0.0402 19 6.22 4 0.0253
≥20
seco
nds
D 2 1 3.99 1 0.0269 2 42.64 1 0.0197
G 2 4 27.35 5 0.1210 5 54.24 5 0.1086
I 2 3 9.04 2 0.0274 3 43.24 3 0.0278
S 2 2 5.94 4 0.0811 4 45.59 4 0.0650
U 2 — — — — 1 25.66 6 0.1178
V 2 5 61.50 3 0.0395 6 66.23 2 0.0252
Table 50: Tabulation of the progression of identification timing and accuracy for Class A — Left Index. Submissions were split into two groups. The firstgroup includes submissions that, in Third, performed searches on average in less than 20 seconds, and the second includes those that took, on average,20 seconds or longer. Letter refers to the participant’s letter code found on the footer of this page. Sub. # is an identifier used to differentiate between thetwo submissions each participant could make. The Time column shows the time used to perform a search over an enrollment set of 100 000 in seconds,but was originally recorded to microsecond precision. The FNIR column shows FNIR for each submission at FPIR = 10−3. NA indicates that theoperations required to produce the value could not be performed. — indicates that there was not a validated submission during that submission period.The number to the left of a value provides the value’s column-wise ranking.
C = afis team D = 3M Cogent E = Neurotechnology F = Papillon G = Dermalog H = Hisign Bio-Info InstituteI = NEC J = Sonda K = Tiger IT L = Innovatrics M = SPEX O = ID SolutionsP = id3 Q = Morpho S = Decatur Industries T = BIO-key U = Aware V = AA Technology

144 FPVTE – FINGERPRINT MATCHING
Participant Second ThirdLetter Sub. # Time FNIR Time FNIR
<20
seco
nds
1 1 0.11 20 0.1022 1 0.25 24 0.1132C
2 6 0.67 15 0.0899 6 0.76 23 0.1124
D 1 9 1.77 5 0.0337 20 7.68 1 0.0190
1 2 0.37 12 0.0733 3 0.45 11 0.0630E
2 23 14.66 10 0.0709 30 15.89 10 0.0624
1 11 2.26 18 0.0945 11 2.52 20 0.0933F
2 15 3.30 17 0.0928 15 3.71 18 0.0903
G 1 16 5.39 19 0.1018 21 10.12 19 0.0910
1 5 0.65 22 0.1035 14 3.58 26 0.1230H
2 7 0.88 21 0.1025 17 4.13 27 0.1249
I 1 17 5.91 1 0.0232 23 10.19 3 0.0215
1 3 0.37 14 0.0800 4 0.53 16 0.0708J
2 4 0.55 9 0.0700 7 1.25 12 0.0643
1 — — — — 25 10.42 14 0.0682K
2 — — — — 24 10.30 15 0.0685
1 8 1.54 13 0.0739 2 0.29 8 0.0505L
2 14 2.94 11 0.0721 12 3.26 6 0.0295
1 — — — — 10 1.75 30 0.2615M
2 — — — — 26 11.31 29 0.2526
1 10 1.89 7 0.0672 5 0.59 17 0.0776O
2 13 2.79 8 0.0673 9 1.48 13 0.0675
1 — — — — 8 1.38 25 0.1133P
2 12 2.62 24 0.1120 13 3.49 22 0.1100
1 22 12.96 3 0.0248 28 14.44 4 0.0218Q
2 19 9.23 2 0.0242 22 10.15 2 0.0214
S 1 18 6.18 6 0.0640 29 15.08 7 0.0442
1 21 12.30 16 0.0924 16 3.82 28 0.1929T
2 — — — — 18 5.64 9 0.0562
U 1 24 15.97 23 0.1048 27 12.02 21 0.0996
V 1 20 9.96 4 0.0331 19 5.95 5 0.0223
≥20
seco
nds
D 2 2 6.25 2 0.0248 2 29.26 1 0.0190
G 2 4 26.76 5 0.1007 5 57.88 5 0.0909
I 2 3 9.31 1 0.0217 3 41.60 2 0.0214
S 2 1 6.20 4 0.0641 4 43.56 4 0.0503
U 2 — — — — 1 22.39 6 0.1007
V 2 5 60.50 3 0.0330 6 64.47 3 0.0222
Table 51: Tabulation of the progression of identification timing and accuracy for Class A — Right Index. Submissions were split into two groups. The firstgroup includes submissions that, in Third, performed searches on average in less than 20 seconds, and the second includes those that took, on average,20 seconds or longer. Letter refers to the participant’s letter code found on the footer of this page. Sub. # is an identifier used to differentiate between thetwo submissions each participant could make. The Time column shows the time used to perform a search over an enrollment set of 100 000 in seconds,but was originally recorded to microsecond precision. The FNIR column shows FNIR for each submission at FPIR = 10−3. — indicates that there wasnot a validated submission during that submission period. The number to the left of a value provides the value’s column-wise ranking.
C = afis team D = 3M Cogent E = Neurotechnology F = Papillon G = Dermalog H = Hisign Bio-Info InstituteI = NEC J = Sonda K = Tiger IT L = Innovatrics M = SPEX O = ID SolutionsP = id3 Q = Morpho S = Decatur Industries T = BIO-key U = Aware V = AA Technology

FPVTE – FINGERPRINT MATCHING 145
Participant Second ThirdLetter Sub. # Time FNIR Time FNIR
<20
seco
nds
1 1 1.48 6 0.0313 2 2.39 7 0.0368C
2 2 6.30 7 0.0354 4 6.34 8 0.0374
G 1 3 7.38 8 0.1426 3 6.27 9 0.0515
I 1 7 19.73 2 0.0073 9 18.92 2 0.0058
J 1 5 9.20 4 0.0161 6 14.00 3 0.0143
K 1 — — — — 8 18.32 6 0.0360
L 1 6 17.81 5 0.0306 1 2.20 4 0.0146
O 1 8 57.36 3 0.0132 7 15.34 5 0.0229
V 1 4 8.56 1 0.0056 5 9.50 1 0.0034
≥20
seco
nds
1 2 14.06 5 0.0046 16 73.01 4 0.0030D
2 9 46.57 1 0.0033 23 234.52 4 0.0030
1 4 17.36 10 0.0216 2 22.27 11 0.0207E
2 22 463.95 9 0.0208 27 500.30 10 0.0202
1 12 56.49 15 0.0392 13 59.30 21 0.0386F
2 13 67.36 16 0.0407 15 71.45 22 0.0412
G 2 19 166.37 21 0.0558 22 227.27 15 0.0311
1 5 18.42 20 0.0538 8 37.65 24 0.0686H
2 6 25.38 19 0.0537 12 53.77 23 0.0684
I 2 18 162.34 4 0.0038 25 385.14 4 0.0030
J 2 3 16.23 8 0.0137 7 36.19 8 0.0143
K 2 — — — — 6 32.68 14 0.0286
L 2 7 34.31 13 0.0365 3 23.54 7 0.0072
1 — — — — 5 32.59 26 NAM
2 — — — — 20 183.20 25 NA
O 2 15 85.37 7 0.0134 10 45.52 12 0.0214
1 — — — — 14 63.41 20 0.0370P
2 16 89.78 17 0.0408 17 114.37 16 0.0333
1 14 85.29 3 0.0035 21 213.08 1 0.0027Q
2 10 48.40 2 0.0034 19 163.65 1 0.0027
1 1 13.37 14 0.0379 1 20.11 13 0.0281S
2 11 54.11 11 0.0316 26 429.02 9 0.0195
1 17 138.43 12 0.0318 4 26.96 27 NAT
2 — — — — 9 38.91 19 0.0366
1 8 38.87 18 0.0532 11 47.60 17 0.0336U
2 21 288.82 22 0.2620 24 252.04 18 0.0358
V 2 20 197.77 6 0.0048 18 133.45 3 0.0028
Table 52: Tabulation of the progression of identification timing and accuracy for Class A — Left and Right Index. Submissions were split into two groups.The first group includes submissions that, in Third, performed searches on average in less than 20 seconds, and the second includes those that took, onaverage, 20 seconds or longer. Letter refers to the participant’s letter code found on the footer of this page. Sub. # is an identifier used to differentiatebetween the two submissions each participant could make. The Time column shows the time used to perform a search over an enrollment set of 1 600 000in seconds, but was originally recorded to microsecond precision. The FNIR column shows FNIR for each submission at FPIR = 10−3. NA indicatesthat the operations required to produce the value could not be performed. — indicates that there was not a validated submission during that submissionperiod. The number to the left of a value provides the value’s column-wise ranking.
C = afis team D = 3M Cogent E = Neurotechnology F = Papillon G = Dermalog H = Hisign Bio-Info InstituteI = NEC J = Sonda K = Tiger IT L = Innovatrics M = SPEX O = ID SolutionsP = id3 Q = Morpho S = Decatur Industries T = BIO-key U = Aware V = AA Technology

146 FPVTE – FINGERPRINT MATCHING
Participant Second ThirdLetter Sub. # Time FNIR Time FNIR
1 1 3.20 14 0.0667 2 3.71 22 0.0654C
2 3 6.18 15 0.0669 4 6.62 21 0.0647
1 14 39.90 5 0.0178 20 53.09 6 0.0163D
2 18 55.83 7 0.0242 21 59.65 5 0.0142
1 2 3.37 12 0.0397 1 3.71 13 0.0259E
2 7 19.68 8 0.0277 12 41.57 7 0.0187
1 — — — — 8 31.92 29 0.1684F
2 — — — — 13 46.18 28 0.1681
1 12 33.42 17 0.0704 6 19.65 18 0.0371G
2 19 61.44 16 0.0677 22 62.98 17 0.0325
1 13 39.16 18 0.0798 15 49.13 23 0.0998H
2 17 46.21 20 0.0813 19 52.05 24 0.1008
1 21 77.87 4 0.0161 23 63.06 4 0.0116I
2 20 67.21 3 0.0127 18 51.59 1 0.0094
1 5 11.15 13 0.0491 7 26.88 15 0.0287J
2 11 31.32 9 0.0340 27 80.54 10 0.0236
1 4 10.66 19 0.0809 3 5.51 16 0.0288L
2 8 23.68 20 0.0813 5 12.52 14 0.0276
1 — — — — 9 32.39 30 0.1736M
2 22 89.64 22 0.1634 30 90.51 27 0.1634
1 6 19.29 11 0.0366 11 38.17 12 0.0257O
2 9 30.71 10 0.0349 24 78.80 11 0.0254
1 16 45.67 1 0.0104 17 51.33 2 0.0098Q
2 10 31.26 2 0.0116 16 51.05 3 0.0099
1 — — — — 25 78.95 25 0.1089S
2 — — — — 26 79.01 26 0.1133
1 — — — — 28 81.85 20 0.0500U
2 — — — — 29 90.50 19 0.0461
1 15 42.01 6 0.0239 10 36.28 9 0.0192V
2 — — — — 14 48.01 8 0.0190
Table 53: Tabulation of the progression of identification timing and accuracy for Class B — Left Slap. Letter refers to the participant’s letter code foundon the footer of this page. Sub. # is an identifier used to differentiate between the two submissions each participant could make. The Time column showsthe time used to perform a search over an enrollment set of 3 000 000 in seconds, but was originally recorded to microsecond precision. The FNIR columnshows FNIR for each submission at FPIR = 10−3. — indicates that there was not a validated submission during that submission period. The number tothe left of a value provides the value’s column-wise ranking.
C = afis team D = 3M Cogent E = Neurotechnology F = Papillon G = Dermalog H = Hisign Bio-Info InstituteI = NEC J = Sonda K = Tiger IT L = Innovatrics M = SPEX O = ID SolutionsP = id3 Q = Morpho S = Decatur Industries T = BIO-key U = Aware V = AA Technology

FPVTE – FINGERPRINT MATCHING 147
Participant Second ThirdLetter Sub. # Time FNIR Time FNIR
1 1 3.16 16 0.0391 1 3.70 24 0.0403C
2 3 6.10 14 0.0386 4 6.54 23 0.0392
1 13 37.74 5 0.0082 19 53.78 6 0.0072D
2 19 56.55 6 0.0100 20 58.67 2 0.0052
1 2 3.71 11 0.0220 2 4.68 13 0.0151E
2 9 25.48 7 0.0134 12 40.27 7 0.0083
1 — — — — 8 32.28 29 0.1222F
2 — — — — 14 46.58 28 0.1220
1 6 19.93 17 0.0423 5 11.80 18 0.0212G
2 15 41.42 15 0.0388 13 41.12 16 0.0198
1 14 39.40 20 0.0554 17 50.97 25 0.0641H
2 17 46.02 21 0.0563 18 52.86 26 0.0647
1 21 79.29 4 0.0074 23 63.57 5 0.0058I
2 20 77.42 1 0.0057 16 49.18 1 0.0045
1 5 11.62 13 0.0313 7 25.86 14 0.0156J
2 11 32.12 9 0.0210 27 77.67 10 0.0126
1 4 11.09 18 0.0526 3 5.49 15 0.0167L
2 8 23.42 19 0.0536 6 12.66 17 0.0202
1 — — — — 9 33.43 30 0.1259M
2 22 90.28 22 0.1157 30 91.42 27 0.1155
1 7 20.12 12 0.0231 11 38.08 12 0.0142O
2 10 32.04 10 0.0212 26 77.37 11 0.0132
1 18 53.98 2 0.0064 22 62.95 3 0.0057Q
2 12 33.57 3 0.0069 21 61.29 3 0.0057
1 — — — — 25 74.29 21 0.0369S
2 — — — — 24 73.96 22 0.0381
1 — — — — 29 89.71 19 0.0266U
2 — — — — 28 88.88 20 0.0273
1 16 42.11 8 0.0148 10 35.66 8 0.0106V
2 — — — — 15 48.47 9 0.0110
Table 54: Tabulation of the progression of identification timing and accuracy for Class B — Right Slap. Letter refers to the participant’s letter code foundon the footer of this page. Sub. # is an identifier used to differentiate between the two submissions each participant could make. The Time column showsthe time used to perform a search over an enrollment set of 3 000 000 in seconds, but was originally recorded to microsecond precision. The FNIR columnshows FNIR for each submission at FPIR = 10−3. — indicates that there was not a validated submission during that submission period. The number tothe left of a value provides the value’s column-wise ranking.
C = afis team D = 3M Cogent E = Neurotechnology F = Papillon G = Dermalog H = Hisign Bio-Info InstituteI = NEC J = Sonda K = Tiger IT L = Innovatrics M = SPEX O = ID SolutionsP = id3 Q = Morpho S = Decatur Industries T = BIO-key U = Aware V = AA Technology

148 FPVTE – FINGERPRINT MATCHING
Participant Second ThirdLetter Sub. # Time FNIR Time FNIR
1 1 3.44 21 0.0365 2 7.36 30 NAC
2 3 4.33 20 0.0356 5 10.63 29 NA
1 13 38.51 5 0.0040 21 69.35 6 0.0031D
2 17 48.86 6 0.0045 24 74.21 5 0.0024
1 4 6.39 11 0.0098 3 8.18 15 0.0063E
2 18 52.30 8 0.0074 12 39.56 10 0.0049
1 — — — — 8 28.72 28 0.0910F
2 — — — — 10 38.37 26 0.0901
1 2 4.27 13 0.0132 1 5.52 18 0.0106G
2 7 22.15 16 0.0235 14 42.86 17 0.0084
1 19 52.34 18 0.0325 22 70.12 23 0.0349H
2 20 61.14 19 0.0340 23 72.35 24 0.0361
1 22 79.56 4 0.0031 15 47.35 3 0.0022I
2 21 69.84 3 0.0027 19 57.94 1 0.0015
1 5 11.06 15 0.0228 7 27.52 16 0.0068J
2 12 32.23 10 0.0090 26 75.92 9 0.0047
1 8 25.03 17 0.0312 4 10.37 12 0.0054L
2 10 26.13 14 0.0216 6 20.85 14 0.0062
1 — — — — 9 28.89 27 0.0904M
2 16 48.74 22 0.0882 16 49.50 25 0.0882
1 6 19.15 12 0.0106 13 40.42 13 0.0057O
2 11 31.55 9 0.0088 25 74.57 11 0.0051
1 15 47.54 1 0.0019 20 63.99 2 0.0021Q
2 9 25.99 2 0.0020 18 53.88 3 0.0022
1 — — — — 28 85.05 21 0.0160S
2 — — — — 27 84.02 22 0.0190
1 — — — — 29 86.88 20 0.0139U
2 — — — — 30 91.04 19 0.0124
1 14 46.90 7 0.0051 11 39.24 7 0.0036V
2 — — — — 17 52.97 7 0.0036
Table 55: Tabulation of the progression of identification timing and accuracy for Class B — Left and Right Slap. Letter refers to the participant’s letter codefound on the footer of this page. Sub. # is an identifier used to differentiate between the two submissions each participant could make. The Time columnshows the time used to perform a search over an enrollment set of 3 000 000 in seconds, but was originally recorded to microsecond precision. The FNIRcolumn shows FNIR for each submission at FPIR = 10−3. NA indicates that the operations required to produce the value could not be performed. —indicates that there was not a validated submission during that submission period. The number to the left of a value provides the value’s column-wiseranking.
C = afis team D = 3M Cogent E = Neurotechnology F = Papillon G = Dermalog H = Hisign Bio-Info InstituteI = NEC J = Sonda K = Tiger IT L = Innovatrics M = SPEX O = ID SolutionsP = id3 Q = Morpho S = Decatur Industries T = BIO-key U = Aware V = AA Technology

FPVTE – FINGERPRINT MATCHING 149
Participant Second ThirdLetter Sub. # Time FNIR Time FNIR
1 2 4.67 20 0.0276 3 9.00 30 NAC
2 3 5.01 19 0.0268 4 10.28 29 NA
1 9 26.83 6 0.0028 17 52.42 6 0.0020D
2 13 33.98 5 0.0027 19 54.37 2 0.0012
1 4 7.71 11 0.0071 2 8.76 16 0.0043E
2 20 70.09 8 0.0043 18 52.88 7 0.0024
1 — — — — 12 39.12 27 0.0591F
2 — — — — 16 51.59 27 0.0591
1 1 2.50 12 0.0101 1 6.33 18 0.0062G
2 6 12.62 14 0.0157 9 31.67 14 0.0040
1 18 56.70 16 0.0220 26 82.43 23 0.0203H
2 19 67.68 17 0.0249 27 85.74 24 0.0204
1 22 75.61 4 0.0021 6 24.57 2 0.0012I
2 17 50.74 2 0.0012 20 60.01 1 0.0009
1 5 8.13 22 0.0614 7 26.31 17 0.0049J
2 11 31.60 9 0.0054 22 64.38 11 0.0033
1 14 36.59 18 0.0250 5 14.42 10 0.0031L
2 12 33.50 13 0.0147 8 28.56 11 0.0033
1 — — — — 13 41.37 26 0.0543M
2 21 70.37 21 0.0515 23 70.45 25 0.0515
1 7 16.34 15 0.0173 11 37.04 15 0.0041O
2 10 30.74 10 0.0056 21 63.87 13 0.0035
1 16 48.59 1 0.0010 14 48.85 2 0.0012Q
2 8 26.38 2 0.0012 24 71.67 2 0.0012
1 — — — — 28 86.50 20 0.0108S
2 — — — — 29 88.70 21 0.0136
1 — — — — 30 88.83 19 0.0099U
2 — — — — 25 80.14 22 0.0141
1 15 42.75 7 0.0041 10 35.51 9 0.0027V
2 — — — — 15 49.72 7 0.0024
Table 56: Tabulation of the progression of identification timing and accuracy for Class B — Identification Flats. Letter refers to the participant’s letter codefound on the footer of this page. Sub. # is an identifier used to differentiate between the two submissions each participant could make. The Time columnshows the time used to perform a search over an enrollment set of 3 000 000 in seconds, but was originally recorded to microsecond precision. The FNIRcolumn shows FNIR for each submission at FPIR = 10−3. NA indicates that the operations required to produce the value could not be performed. —indicates that there was not a validated submission during that submission period. The number to the left of a value provides the value’s column-wiseranking.
C = afis team D = 3M Cogent E = Neurotechnology F = Papillon G = Dermalog H = Hisign Bio-Info InstituteI = NEC J = Sonda K = Tiger IT L = Innovatrics M = SPEX O = ID SolutionsP = id3 Q = Morpho S = Decatur Industries T = BIO-key U = Aware V = AA Technology

150 FPVTE – FINGERPRINT MATCHING
Participant Second ThirdLetter Sub. # Time FNIR Time FNIR
1 3 10.27 16 0.0574 5 21.04 30 NAC
2 2 10.04 17 0.0584 4 18.31 24 0.0711
1 10 44.21 4 0.0024 28 87.07 6 0.0015D
2 20 74.46 3 0.0018 25 84.92 2 0.0011
1 6 27.61 11 0.0143 2 15.94 14 0.0088E
2 21 79.95 9 0.0083 27 85.50 13 0.0048
1 12 50.99 18 0.0734 14 50.99 25 0.0734F
2 17 60.34 18 0.0734 16 60.34 25 0.0734
1 1 8.43 21 0.1923 1 11.21 23 0.0368G
2 5 21.36 20 0.0780 7 37.15 20 0.0276
1 18 68.30 15 0.0377 19 67.91 20 0.0276H
2 15 59.28 14 0.0363 18 64.90 19 0.0275
1 14 56.55 5 0.0033 23 79.70 4 0.0013I
2 9 40.52 7 0.0050 15 56.93 1 0.0010
1 7 35.33 10 0.0104 12 46.32 12 0.0047J
2 19 69.82 7 0.0050 26 85.17 10 0.0027
1 13 54.67 12 0.0159 3 17.53 16 0.0102L
2 11 47.51 13 0.0221 6 21.26 15 0.0095
1 — — — — 8 42.60 28 0.0934M
2 — — — — 11 45.96 27 0.0826
1 — — — — 21 73.31 9 0.0025O
2 — — — — 24 82.13 10 0.0027
1 8 38.03 1 0.0014 10 44.75 2 0.0011Q
2 4 20.02 2 0.0017 9 43.67 4 0.0013
1 — — — — 29 87.76 22 0.0311S
2 — — — — 30 89.24 29 0.1680
1 — — — — 22 75.14 18 0.0163U
2 — — — — 20 67.98 17 0.0155
1 16 59.38 6 0.0034 13 47.76 7 0.0024V
2 — — — — 17 63.19 7 0.0024
Table 57: Tabulation of the progression of identification timing and accuracy for Class C — Ten-Finger Plain-to-Plain. Letter refers to the participant’sletter code found on the footer of this page. Sub. # is an identifier used to differentiate between the two submissions each participant could make.The Time column shows the time used to perform a search over an enrollment set of 5 000 000 in seconds, but was originally recorded to microsecondprecision. The FNIR column shows FNIR for each submission at FPIR = 10−3. NA indicates that the operations required to produce the value couldnot be performed. — indicates that there was not a validated submission during that submission period. The number to the left of a value provides thevalue’s column-wise ranking.
C = afis team D = 3M Cogent E = Neurotechnology F = Papillon G = Dermalog H = Hisign Bio-Info InstituteI = NEC J = Sonda K = Tiger IT L = Innovatrics M = SPEX O = ID SolutionsP = id3 Q = Morpho S = Decatur Industries T = BIO-key U = Aware V = AA Technology

FPVTE – FINGERPRINT MATCHING 151
Participant Second ThirdLetter Sub. # Time FNIR Time FNIR
1 2 19.26 21 0.0826 4 25.25 16 0.0094C
2 7 28.17 20 0.0822 5 25.91 15 0.0085
1 11 46.42 6 0.0028 17 65.97 4 0.0015D
2 16 70.86 5 0.0023 30 86.39 7 0.0018
1 1 12.49 17 0.0285 1 9.52 18 0.0106E
2 8 29.59 9 0.0121 14 57.02 12 0.0050
1 13 55.63 18 0.0536 13 55.63 25 0.0536F
2 15 68.61 18 0.0536 18 68.61 25 0.0536
1 3 20.17 15 0.0239 2 11.67 24 0.0447G
2 5 23.05 13 0.0195 6 30.61 21 0.0333
1 19 77.49 15 0.0239 28 84.14 20 0.0201H
2 17 71.01 14 0.0237 29 84.26 19 0.0199
1 10 40.06 1 0.0015 24 79.04 1 0.0013I
2 4 20.92 7 0.0032 9 40.53 2 0.0014
1 6 26.55 12 0.0168 8 36.09 13 0.0051J
2 12 55.60 8 0.0045 20 72.62 9 0.0033
1 18 75.36 10 0.0123 7 31.42 17 0.0097L
2 20 80.46 11 0.0160 3 19.52 14 0.0083
1 — — — — 11 47.38 28 0.0783M
2 — — — — 12 48.71 27 0.0716
1 — — — — 15 59.01 11 0.0034O
2 — — — — 19 72.55 9 0.0033
1 14 67.74 1 0.0015 26 83.25 5 0.0017Q
2 9 37.87 3 0.0019 27 83.35 2 0.0014
1 — — — — 22 74.01 29 0.0860S
2 — — — — 21 72.95 30 0.2462
1 — — — — 25 82.76 23 0.0358U
2 — — — — 23 74.39 22 0.0351
1 21 91.48 4 0.0022 10 40.94 5 0.0017V
2 — — — — 16 65.47 8 0.0019
Table 58: Tabulation of the progression of identification timing and accuracy for Class C — Ten-Finger Rolled-to-Rolled. Letter refers to the participant’sletter code found on the footer of this page. Sub. # is an identifier used to differentiate between the two submissions each participant could make.The Time column shows the time used to perform a search over an enrollment set of 5 000 000 in seconds, but was originally recorded to microsecondprecision. The FNIR column shows FNIR for each submission at FPIR = 10−3. — indicates that there was not a validated submission during thatsubmission period. The number to the left of a value provides the value’s column-wise ranking.
C = afis team D = 3M Cogent E = Neurotechnology F = Papillon G = Dermalog H = Hisign Bio-Info InstituteI = NEC J = Sonda K = Tiger IT L = Innovatrics M = SPEX O = ID SolutionsP = id3 Q = Morpho S = Decatur Industries T = BIO-key U = Aware V = AA Technology

152 FPVTE – FINGERPRINT MATCHING
Participant Second ThirdLetter Sub. # Time FNIR Time FNIR
1 3 18.23 16 0.0979 7 36.55 17 0.0149C
2 4 19.43 17 0.1124 5 33.93 18 0.0169
1 8 39.02 6 0.0048 12 56.38 6 0.0028D
2 14 58.60 2 0.0034 25 76.00 3 0.0018
1 5 20.29 13 0.0383 1 10.81 16 0.0137E
2 10 55.20 9 0.0164 16 59.20 12 0.0056
1 13 58.39 20 0.2514 15 58.39 27 0.2514F
2 16 61.82 20 0.2514 17 61.82 27 0.2514
1 1 11.46 19 0.2393 3 25.05 24 0.0649G
2 2 11.62 18 0.1455 6 34.47 23 0.0521
1 20 70.66 15 0.0429 18 65.03 20 0.0291H
2 18 62.51 14 0.0411 19 65.69 19 0.0285
1 11 56.80 5 0.0039 26 76.98 2 0.0014I
2 12 58.34 4 0.0037 21 66.90 1 0.0011
1 7 30.56 10 0.0174 8 42.13 13 0.0071J
2 17 62.05 8 0.0053 27 79.37 7 0.0034
1 15 60.76 11 0.0251 4 27.43 15 0.0136L
2 21 72.40 12 0.0358 2 18.62 14 0.0129
1 — — — — 13 57.06 30 0.3067M
2 — — — — 14 57.90 27 0.2514
1 — — — — 20 65.71 10 0.0041O
2 — — — — 24 75.98 8 0.0036
1 9 42.45 1 0.0028 10 49.07 4 0.0020Q
2 6 22.94 2 0.0034 11 49.72 5 0.0022
1 — — — — 30 89.37 25 0.1017S
2 — — — — 29 89.34 26 0.2366
1 — — — — 28 82.50 22 0.0378U
2 — — — — 23 73.46 21 0.0295
1 19 66.49 7 0.0051 9 48.91 11 0.0052V
2 — — — — 22 71.28 9 0.0039
Table 59: Tabulation of the progression of identification timing and accuracy for Class C — Ten-Finger Plain-to-Rolled. Letter refers to the participant’sletter code found on the footer of this page. Sub. # is an identifier used to differentiate between the two submissions each participant could make.The Time column shows the time used to perform a search over an enrollment set of 5 000 000 in seconds, but was originally recorded to microsecondprecision. The FNIR column shows FNIR for each submission at FPIR = 10−3. — indicates that there was not a validated submission during thatsubmission period. The number to the left of a value provides the value’s column-wise ranking.
C = afis team D = 3M Cogent E = Neurotechnology F = Papillon G = Dermalog H = Hisign Bio-Info InstituteI = NEC J = Sonda K = Tiger IT L = Innovatrics M = SPEX O = ID SolutionsP = id3 Q = Morpho S = Decatur Industries T = BIO-key U = Aware V = AA Technology

FPVTE – FINGERPRINT MATCHING 153
F Enrollment Size
C = afis team D = 3M Cogent E = Neurotechnology F = Papillon G = Dermalog H = Hisign Bio-Info InstituteI = NEC J = Sonda K = Tiger IT L = Innovatrics M = SPEX O = ID SolutionsP = id3 Q = Morpho S = Decatur Industries T = BIO-key U = Aware V = AA Technology

154 FPVTE – FINGERPRINT MATCHING
Participant RAM On Disk
Letter Sub. # Actual Reported Finalized Stored
1 7 0.18 10 0.16 8 0.17 8 0.16C
2 8 0.18 10 0.16 8 0.17 8 0.16
1 21 0.61 18 0.33 29 1.25 18 0.34D
2 21 0.61 18 0.33 30 1.40 18 0.34
1 30 1.12 27 0.50 23 0.50 27 0.50E
2 29 1.11 27 0.50 23 0.50 27 0.50
1 6 0.18 7 0.11 10 0.17 10 0.17F
2 5 0.18 7 0.11 10 0.17 10 0.17
1 20 0.57 29 0.50 5 0.15 5 0.15G
2 19 0.57 29 0.50 5 0.15 5 0.15
1 11 0.33 14 0.29 12 0.29 14 0.29H
2 11 0.33 14 0.29 12 0.29 14 0.29
1 23 0.70 35 0.68 31 1.54 35 0.68I
2 28 1.04 36 1.03 32 1.55 36 1.03
1 9 0.32 12 0.27 14 0.31 12 0.28J
2 9 0.32 12 0.27 14 0.31 12 0.28
1 35 3.87 25 0.47 35 4.60 25 0.48K
2 36 3.87 25 0.47 35 4.60 25 0.48
1 31 1.14 9 0.15 7 0.16 7 0.16L
2 34 2.32 22 0.46 20 0.46 22 0.46
1 3 0.14 5 0.11 3 0.13 3 0.13M
2 4 0.14 5 0.11 3 0.13 3 0.13
1 15 0.35 16 0.30 16 0.32 16 0.31O
2 15 0.35 16 0.30 16 0.32 16 0.31
1 27 0.78 3 0.03 1 0.03 1 0.03P
2 26 0.78 3 0.03 1 0.03 1 0.03
1 13 0.34 1 0.03 27 1.07 33 0.68Q
2 14 0.34 1 0.03 27 1.07 33 0.68
1 24 0.72 23 0.47 21 0.47 23 0.47S
2 24 0.72 23 0.47 21 0.47 23 0.47
1 2 0.01 33 0.60 25 0.91 31 0.60T
2 1 0.01 33 0.60 25 0.91 31 0.60
1 33 1.70 31 0.53 33 1.96 29 0.54U
2 32 1.42 31 0.53 33 1.96 29 0.54
1 18 0.39 20 0.38 18 0.39 20 0.38V
2 17 0.39 20 0.38 18 0.39 20 0.38
FNIR @ FPIR = 10−3
30 0.1335
31 0.1337
1 0.0197
1 0.0197
16 0.0745
15 0.0723
25 0.1111
22 0.1082
24 0.1089
23 0.1086
32 0.1576
33 0.1607
7 0.0257
8 0.0278
18 0.0786
14 0.0712
21 0.0883
20 0.0875
11 0.0625
9 0.0351
35 0.2995
34 0.2921
19 0.0818
17 0.0766
29 0.1308
28 0.1272
3 0.0222
4 0.0226
10 0.0571
12 0.0650
36 NA
13 0.0685
27 0.1218
26 0.1178
6 0.0253
5 0.0252
Table 60: Tabulation of storage and RAM requirements for Class A — Left Index, with an enrollment set size of 100 000 subjects. Submissions were split into two groups. Thefirst group includes submissions that performed searches on average in less than 20 seconds, and the second includes those that took, on average, 20 seconds or longer. Letterrefers to the participant’s letter code found on the footer of this page. Sub. # is an identifier used to differentiate between the two submissions each participant could makeduring the final submission period. All values are reported in gigabytes, where 1 GB is equal to 1 073 741 824 bytes. Actual RAM refers to the sum of the resident set sizes ofthe stage one identification processes over all compute nodes after returning from the identification stage one initialization method. Reported RAM is the sum of the predictedRAM consumption returned from the enrollment method when enrolling images for the enrollment set. Finalized Size is the amount of disk storage space used in the finalizedenrollment set directory after the finalization method returned. Stored Size is the actual amount of storage space used to hold the individual enrollment templates on disk,determined by summing the number of bytes written by the FpVTE test driver after each enrollment. The number to the left of a value provides the value’s column-wiseranking, with the best performance shaded in green and the worst in pink. For reference, the FNIR values from Table 7 are reprinted to the right of this table.
C = afis team D = 3M Cogent E = Neurotechnology F = Papillon G = Dermalog H = Hisign Bio-Info InstituteI = NEC J = Sonda K = Tiger IT L = Innovatrics M = SPEX O = ID SolutionsP = id3 Q = Morpho S = Decatur Industries T = BIO-key U = Aware V = AA Technology

FPVTE – FINGERPRINT MATCHING 155
Participant RAM On Disk
Letter Sub. # Actual Reported Finalized Stored
1 7 0.17 10 0.15 8 0.16 8 0.16C
2 8 0.18 10 0.15 8 0.16 8 0.16
1 21 0.61 18 0.33 29 1.25 18 0.33D
2 21 0.61 18 0.33 30 1.40 18 0.33
1 29 1.07 27 0.48 23 0.48 27 0.48E
2 30 1.07 27 0.48 23 0.48 27 0.48
1 6 0.17 7 0.11 10 0.17 10 0.16F
2 5 0.17 7 0.11 10 0.17 10 0.16
1 19 0.57 29 0.48 5 0.15 5 0.15G
2 20 0.57 29 0.48 5 0.15 5 0.15
1 14 0.33 14 0.29 14 0.29 14 0.29H
2 13 0.33 14 0.29 14 0.29 14 0.29
1 23 0.69 35 0.67 31 1.54 35 0.67I
2 28 1.01 36 0.99 32 1.55 36 0.99
1 10 0.31 12 0.26 12 0.29 12 0.27J
2 9 0.31 12 0.26 12 0.29 12 0.27
1 36 3.87 25 0.46 35 4.60 25 0.47K
2 35 3.87 25 0.46 35 4.60 25 0.47
1 31 1.14 9 0.15 7 0.16 7 0.15L
2 34 2.32 22 0.44 20 0.45 22 0.45
1 3 0.14 5 0.11 3 0.13 3 0.12M
2 3 0.14 5 0.11 3 0.13 3 0.12
1 15 0.34 16 0.29 16 0.30 16 0.30O
2 16 0.34 16 0.29 16 0.30 16 0.30
1 26 0.76 3 0.03 1 0.03 1 0.03P
2 27 0.76 3 0.03 1 0.03 1 0.03
1 11 0.33 1 0.03 27 1.03 33 0.66Q
2 11 0.33 1 0.03 27 1.03 33 0.66
1 24 0.71 23 0.46 21 0.46 23 0.46S
2 25 0.71 23 0.46 21 0.46 23 0.46
1 1 0.01 33 0.57 25 0.87 31 0.57T
2 1 0.01 33 0.57 25 0.87 31 0.57
1 33 1.56 31 0.52 33 1.79 29 0.52U
2 32 1.30 31 0.52 33 1.79 29 0.52
1 18 0.39 20 0.38 18 0.38 20 0.38V
2 17 0.39 20 0.38 18 0.38 20 0.38
FNIR @ FPIR = 10−3
30 0.1132
29 0.1124
1 0.0190
1 0.0190
15 0.0630
14 0.0624
25 0.0933
22 0.0903
24 0.0910
23 0.0909
32 0.1230
33 0.1249
5 0.0215
3 0.0214
20 0.0708
16 0.0643
18 0.0682
19 0.0685
12 0.0505
9 0.0295
36 0.2615
35 0.2526
21 0.0776
17 0.0675
31 0.1133
28 0.1100
6 0.0218
3 0.0214
10 0.0442
11 0.0503
34 0.1929
13 0.0562
26 0.0996
27 0.1007
8 0.0223
7 0.0222
Table 61: Tabulation of storage and RAM requirements for Class A — Right Index, with an enrollment set size of 100 000 subjects. Submissions were split into two groups.The first group includes submissions that performed searches on average in less than 20 seconds, and the second includes those that took, on average, 20 seconds or longer.Letter refers to the participant’s letter code found on the footer of this page. Sub. # is an identifier used to differentiate between the two submissions each participant couldmake during the final submission period. All values are reported in gigabytes, where 1 GB is equal to 1 073 741 824 bytes. Actual RAM refers to the sum of the resident setsizes of the stage one identification processes over all compute nodes after returning from the identification stage one initialization method. Reported RAM is the sum of thepredicted RAM consumption returned from the enrollment method when enrolling images for the enrollment set. Finalized Size is the amount of disk storage space used in thefinalized enrollment set directory after the finalization method returned. Stored Size is the actual amount of storage space used to hold the individual enrollment templates ondisk, determined by summing the number of bytes written by the FpVTE test driver after each enrollment. The number to the left of a value provides the value’s column-wiseranking, with the best performance shaded in green and the worst in pink. For reference, the FNIR values from Table 8 are reprinted to the right of this table.
C = afis team D = 3M Cogent E = Neurotechnology F = Papillon G = Dermalog H = Hisign Bio-Info InstituteI = NEC J = Sonda K = Tiger IT L = Innovatrics M = SPEX O = ID SolutionsP = id3 Q = Morpho S = Decatur Industries T = BIO-key U = Aware V = AA Technology

156 FPVTE – FINGERPRINT MATCHING
Participant RAM On Disk
Letter Sub. # Actual Reported Finalized Stored
1 8 4.87 10 4.66 8 4.78 8 4.69C
2 7 4.87 10 4.66 8 4.78 8 4.69
1 24 18.58 18 10.30 30 40.04 18 10.31D
2 24 18.58 18 10.30 31 44.68 18 10.31
1 30 33.40 27 14.95 23 15.02 27 14.96E
2 31 33.41 27 14.95 23 15.02 27 14.96
1 5 4.86 5 3.21 10 4.86 10 4.78F
2 5 4.86 5 3.21 10 4.86 10 4.78
1 23 16.38 31 15.63 6 4.75 6 4.67G
2 22 16.38 31 15.63 6 4.75 6 4.67
1 16 9.36 16 9.19 16 9.32 16 9.19H
2 15 9.36 16 9.19 16 9.32 16 9.19
1 21 15.83 33 15.68 25 24.61 31 15.68I
2 29 30.83 36 30.68 32 46.83 36 30.68
1 9 8.30 12 8.07 12 8.68 12 8.15J
2 10 8.30 12 8.07 12 8.68 12 8.15
1 36 61.81 25 14.74 35 73.67 25 14.80K
2 35 61.81 25 14.74 35 73.67 25 14.80
1 26 18.76 9 4.55 5 4.68 5 4.61L
2 34 53.98 22 13.64 20 13.73 22 13.66
1 3 3.75 5 3.21 3 3.75 3 3.68M
2 4 3.76 5 3.21 3 3.75 3 3.68
1 12 9.05 14 8.82 14 8.84 14 8.90O
2 11 9.05 14 8.82 14 8.84 14 8.90
1 28 21.42 3 0.86 1 0.89 1 0.83P
2 27 21.41 3 0.86 1 0.89 1 0.83
1 14 9.14 1 0.82 28 30.63 34 20.48Q
2 13 9.14 1 0.82 28 30.63 34 20.48
1 19 14.82 23 14.57 21 14.63 23 14.57S
2 19 14.82 23 14.57 21 14.63 23 14.57
1 1 0.01 34 17.99 26 27.40 32 18.02T
2 1 0.01 34 17.99 26 27.40 32 18.02
1 33 44.63 29 15.30 33 51.84 29 15.46U
2 32 37.35 29 15.30 33 51.84 29 15.46
1 18 11.77 20 11.69 18 11.77 20 11.71V
2 17 11.77 20 11.69 18 11.77 20 11.71
FNIR @ FPIR = 10−3
26 0.0368
28 0.0374
4 0.0030
4 0.0030
15 0.0207
14 0.0202
29 0.0386
30 0.0412
31 0.0515
20 0.0311
33 0.0686
32 0.0684
8 0.0058
4 0.0030
10 0.0143
10 0.0143
24 0.0360
19 0.0286
12 0.0146
9 0.0072
35 NA
34 NA
17 0.0229
16 0.0214
27 0.0370
21 0.0333
1 0.0027
1 0.0027
18 0.0281
13 0.0195
36 NA
25 0.0366
22 0.0336
23 0.0358
7 0.0034
3 0.0028
Table 62: Tabulation of storage and RAM requirements for Class A — Left and Right Index, with an enrollment set size of 1 600 000 subjects. Submissions were split into twogroups. The first group includes submissions that performed searches on average in less than 20 seconds, and the second includes those that took, on average, 20 seconds orlonger. Letter refers to the participant’s letter code found on the footer of this page. Sub. # is an identifier used to differentiate between the two submissions each participantcould make during the final submission period. All values are reported in gigabytes, where 1 GB is equal to 1 073 741 824 bytes. Actual RAM refers to the sum of the residentset sizes of the stage one identification processes over all compute nodes after returning from the identification stage one initialization method. Reported RAM is the sum of thepredicted RAM consumption returned from the enrollment method when enrolling images for the enrollment set. Finalized Size is the amount of disk storage space used in thefinalized enrollment set directory after the finalization method returned. Stored Size is the actual amount of storage space used to hold the individual enrollment templates ondisk, determined by summing the number of bytes written by the FpVTE test driver after each enrollment. The number to the left of a value provides the value’s column-wiseranking, with the best performance shaded in green and the worst in pink. For reference, the FNIR values from Table 9 are reprinted to the right of this table.
C = afis team D = 3M Cogent E = Neurotechnology F = Papillon G = Dermalog H = Hisign Bio-Info InstituteI = NEC J = Sonda K = Tiger IT L = Innovatrics M = SPEX O = ID SolutionsP = id3 Q = Morpho S = Decatur Industries T = BIO-key U = Aware V = AA Technology

FPVTE – FINGERPRINT MATCHING 157
Participant RAM On Disk
Letter Sub. # Actual Reported Finalized Stored
1 3 46.49 4 45.92 2 46.34 2 45.98C
2 4 46.49 4 45.92 2 46.34 2 45.98
1 12 79.43 16 84.51 18 86.78 18 86.59D
2 13 79.43 15 83.67 15 85.95 17 85.76
1 14 79.73 3 29.86 1 30.00 1 29.89E
2 28 317.95 30 176.65 26 176.79 28 176.67
1 10 77.02 11 53.02 12 77.01 13 76.88F
2 10 77.02 11 53.02 12 77.01 13 76.88
1 25 156.12 26 152.16 4 47.21 4 47.07G
2 26 156.12 26 152.16 4 47.21 4 47.07
1 15 86.46 17 84.85 16 86.42 15 84.85H
2 16 86.46 17 84.85 16 86.42 15 84.85
1 5 49.68 8 49.40 14 82.58 8 49.40I
2 21 108.71 23 108.43 23 133.80 23 108.43
1 18 101.00 21 101.67 21 100.73 21 100.75J
2 17 101.00 21 101.67 21 100.73 21 100.75
1 22 119.79 7 47.80 7 47.92 7 47.77L
2 27 177.48 6 46.73 6 47.56 6 47.42
1 6 57.53 9 53.02 8 57.52 9 57.39M
2 6 57.53 9 53.02 8 57.52 9 57.39
1 19 101.00 19 101.67 19 100.73 19 100.75O
2 20 101.00 19 101.67 19 100.73 19 100.75
1 1 7.54 1 8.87 27 232.47 29 222.31Q
2 2 7.54 1 8.87 27 232.47 29 222.31
1 24 150.35 24 147.31 24 147.42 24 147.31S
2 23 150.35 24 147.31 24 147.42 24 147.31
1 29 440.68 28 155.98 29 512.65 26 157.35U
2 30 540.60 29 170.16 30 625.07 27 171.53
1 8 63.53 13 63.39 10 63.52 11 63.41V
2 9 63.53 13 63.39 10 63.52 11 63.41
FNIR @ FPIR = 10−3
30 NA
29 NA
6 0.0020
2 0.0012
16 0.0043
7 0.0024
27 0.0591
27 0.0591
18 0.0062
14 0.0040
23 0.0203
24 0.0204
2 0.0012
1 0.0009
17 0.0049
11 0.0033
10 0.0031
11 0.0033
26 0.0543
25 0.0515
15 0.0041
13 0.0035
2 0.0012
2 0.0012
20 0.0108
21 0.0136
19 0.0099
22 0.0141
9 0.0027
7 0.0024
Table 63: Tabulation of storage and RAM requirements for Class B — Identification Flats, with an enrollment set size of 3 000 000 subjects. Letter refersto the participant’s letter code found on the footer of this page. Sub. # is an identifier used to differentiate between the two submissions each participantcould make during the final submission period. All values are reported in gigabytes, where 1 GB is equal to 1 073 741 824 bytes. Actual RAM refers to thesum of the resident set sizes of the stage one identification processes over all compute nodes after returning from the identification stage one initializationmethod. Reported RAM is the sum of the predicted RAM consumption returned from the enrollment method when enrolling images for the enrollmentset. Finalized Size is the amount of disk storage space used in the finalized enrollment set directory after the finalization method returned. Stored Sizeis the actual amount of storage space used to hold the individual enrollment templates on disk, determined by summing the number of bytes writtenby the FpVTE test driver after each enrollment. The number to the left of a value provides the value’s column-wise ranking, with the best performanceshaded in green and the worst in pink. For reference, the FNIR values from Table 13 are reprinted to the right of this table.
C = afis team D = 3M Cogent E = Neurotechnology F = Papillon G = Dermalog H = Hisign Bio-Info InstituteI = NEC J = Sonda K = Tiger IT L = Innovatrics M = SPEX O = ID SolutionsP = id3 Q = Morpho S = Decatur Industries T = BIO-key U = Aware V = AA Technology

158 FPVTE – FINGERPRINT MATCHING
Participant RAM On Disk
Letter Sub. # Actual Reported Finalized Stored
1 9 92.86 11 96.24 10 92.63 11 96.33C
2 10 92.86 11 96.24 10 92.63 11 96.33
1 16 132.37 19 155.88 19 159.68 19 159.37D
2 15 132.37 18 153.13 18 156.93 18 156.62
1 14 127.39 3 57.47 1 57.71 1 57.52E
2 28 573.25 30 318.66 26 318.89 28 318.70
1 7 90.93 6 82.27 6 90.92 7 90.70F
2 6 90.93 6 82.27 6 90.92 7 90.70
1 25 274.35 26 267.49 4 82.40 4 82.17G
2 26 274.35 26 267.49 4 82.40 4 82.17
1 17 144.02 16 142.06 14 143.97 16 142.06H
2 18 144.02 16 142.06 14 143.97 16 142.06
1 4 84.42 10 83.96 16 144.38 6 83.96I
2 11 110.22 13 109.76 17 153.35 13 109.76
1 20 181.00 22 182.11 20 182.47 22 180.58J
2 21 181.00 23 182.11 23 182.47 23 180.58
1 23 192.19 4 72.47 2 72.67 2 72.43L
2 27 274.95 4 72.47 3 72.67 2 72.43
1 5 90.93 8 82.27 8 90.92 9 90.70M
2 8 90.93 8 82.27 8 90.92 9 90.70
1 19 181.00 20 182.11 21 182.47 20 180.58O
2 22 181.00 20 182.11 21 182.47 20 180.58
1 2 13.33 1 15.77 27 412.86 29 395.06Q
2 1 13.33 1 15.77 27 412.86 29 395.06
1 24 260.37 24 257.08 25 257.27 24 257.09S
2 3 61.04 24 257.08 24 257.27 24 257.09
1 29 811.45 28 293.25 29 941.34 26 295.54U
2 29 811.45 28 293.25 29 941.34 26 295.54
1 13 121.80 14 121.56 12 121.79 14 121.60V
2 12 121.79 14 121.56 12 121.79 14 121.60
FNIR @ FPIR = 10−3
30 NA
24 0.0711
6 0.0015
2 0.0011
14 0.0088
13 0.0048
25 0.0734
25 0.0734
23 0.0368
20 0.0276
20 0.0276
19 0.0275
4 0.0013
1 0.0010
12 0.0047
10 0.0027
16 0.0102
15 0.0095
28 0.0934
27 0.0826
9 0.0025
10 0.0027
2 0.0011
4 0.0013
22 0.0311
29 0.1680
18 0.0163
17 0.0155
7 0.0024
7 0.0024
Table 64: Tabulation of storage and RAM requirements for Class C — Ten-Finger Plain-to-Plain, with an enrollment set size of 5 000 000 subjects. Letterrefers to the participant’s letter code found on the footer of this page. Sub. # is an identifier used to differentiate between the two submissions eachparticipant could make during the final submission period. All values are reported in gigabytes, where 1 GB is equal to 1 073 741 824 bytes. Actual RAMrefers to the sum of the resident set sizes of the stage one identification processes over all compute nodes after returning from the identification stage oneinitialization method. Reported RAM is the sum of the predicted RAM consumption returned from the enrollment method when enrolling images for theenrollment set. Finalized Size is the amount of disk storage space used in the finalized enrollment set directory after the finalization method returned.Stored Size is the actual amount of storage space used to hold the individual enrollment templates on disk, determined by summing the number ofbytes written by the FpVTE test driver after each enrollment. The number to the left of a value provides the value’s column-wise ranking, with the bestperformance shaded in green and the worst in pink. For reference, the FNIR values from Table 14 are reprinted to the right of this table.
C = afis team D = 3M Cogent E = Neurotechnology F = Papillon G = Dermalog H = Hisign Bio-Info InstituteI = NEC J = Sonda K = Tiger IT L = Innovatrics M = SPEX O = ID SolutionsP = id3 Q = Morpho S = Decatur Industries T = BIO-key U = Aware V = AA Technology

FPVTE – FINGERPRINT MATCHING 159
Participant RAM On Disk
Letter Sub. # Actual Reported Finalized Stored
1 14 183.36 14 190.50 14 183.11 14 190.59C
2 15 183.36 14 190.50 14 183.11 14 190.59
1 10 132.40 22 302.53 18 303.52 24 303.21D
2 9 132.37 27 309.65 19 310.65 25 310.33
1 16 191.66 3 95.45 1 95.69 1 95.50E
2 30 930.48 30 528.40 26 528.63 28 528.45
1 7 130.29 5 118.45 4 130.29 5 130.07F
2 6 130.29 5 118.45 4 130.29 5 130.07
1 20 261.29 18 254.66 2 97.99 2 97.76G
2 19 261.29 18 254.66 2 97.99 2 97.76
1 13 144.02 10 143.46 8 143.97 10 143.46H
2 12 144.02 10 143.46 8 143.97 10 143.46
1 4 113.80 4 113.34 12 153.41 4 113.34I
2 11 137.03 9 136.57 13 153.69 9 136.57
1 22 303.13 24 304.24 21 355.15 21 302.68J
2 24 303.13 23 304.24 20 355.15 20 302.68
1 21 280.49 12 151.41 10 151.61 12 151.37L
2 26 367.82 12 151.41 11 151.61 12 151.37
1 8 130.29 7 118.45 6 130.29 7 130.07M
2 5 130.29 7 118.45 6 130.29 7 130.07
1 25 303.13 25 304.24 22 355.15 22 302.68O
2 23 303.13 25 304.24 22 355.15 22 302.68
1 1 20.22 1 25.61 27 666.73 29 641.13Q
2 2 20.22 1 25.61 27 666.73 29 641.13
1 27 382.88 28 381.17 25 381.36 26 381.17S
2 3 78.28 28 381.17 24 381.36 26 381.17
1 28 806.17 20 257.87 29 937.76 18 260.17U
2 28 806.17 20 257.87 29 937.76 18 260.17
1 17 234.03 16 233.80 16 234.03 16 233.84V
2 18 234.03 16 233.80 16 234.03 16 233.84
FNIR @ FPIR = 10−3
16 0.0094
15 0.0085
4 0.0015
7 0.0018
18 0.0106
12 0.0050
25 0.0536
25 0.0536
24 0.0447
21 0.0333
20 0.0201
19 0.0199
1 0.0013
2 0.0014
13 0.0051
9 0.0033
17 0.0097
14 0.0083
28 0.0783
27 0.0716
11 0.0034
9 0.0033
5 0.0017
2 0.0014
29 0.0860
30 0.2462
23 0.0358
22 0.0351
5 0.0017
8 0.0019
Table 65: Tabulation of storage and RAM requirements for Class C — Ten-Finger Rolled-to-Rolled, with an enrollment set size of 5 000 000 subjects. Letterrefers to the participant’s letter code found on the footer of this page. Sub. # is an identifier used to differentiate between the two submissions eachparticipant could make during the final submission period. All values are reported in gigabytes, where 1 GB is equal to 1 073 741 824 bytes. Actual RAMrefers to the sum of the resident set sizes of the stage one identification processes over all compute nodes after returning from the identification stage oneinitialization method. Reported RAM is the sum of the predicted RAM consumption returned from the enrollment method when enrolling images for theenrollment set. Finalized Size is the amount of disk storage space used in the finalized enrollment set directory after the finalization method returned.Stored Size is the actual amount of storage space used to hold the individual enrollment templates on disk, determined by summing the number ofbytes written by the FpVTE test driver after each enrollment. The number to the left of a value provides the value’s column-wise ranking, with the bestperformance shaded in green and the worst in pink. For reference, the FNIR values from Table 15 are reprinted to the right of this table.
C = afis team D = 3M Cogent E = Neurotechnology F = Papillon G = Dermalog H = Hisign Bio-Info InstituteI = NEC J = Sonda K = Tiger IT L = Innovatrics M = SPEX O = ID SolutionsP = id3 Q = Morpho S = Decatur Industries T = BIO-key U = Aware V = AA Technology

160 FPVTE – FINGERPRINT MATCHING
G Search Template Sizes
G.1 Mean Values
C = afis team D = 3M Cogent E = Neurotechnology F = Papillon G = Dermalog H = Hisign Bio-Info InstituteI = NEC J = Sonda K = Tiger IT L = Innovatrics M = SPEX O = ID SolutionsP = id3 Q = Morpho S = Decatur Industries T = BIO-key U = Aware V = AA Technology

FPVTE – FINGERPRINT MATCHING 161
Participant Left Index Right Index Left and Right IndexLetter Sub. # Size FNIR Size FNIR Size FNIR
1 5 1.49 30 0.1335 5 1.51 30 0.1132 5 2.98 26 0.0368C
2 5 1.49 31 0.1337 5 1.51 29 0.1124 5 2.98 28 0.0374
1 18 3.31 1 0.0197 18 3.34 1 0.0190 18 6.65 4 0.0030D
2 18 3.31 1 0.0197 18 3.34 1 0.0190 18 6.65 4 0.0030
1 27 4.83 16 0.0745 27 4.89 15 0.0630 27 9.71 15 0.0207E
2 27 4.83 15 0.0723 27 4.89 14 0.0624 27 9.71 14 0.0202
1 8 1.54 25 0.1111 8 1.55 25 0.0933 7 3.00 29 0.0386F
2 8 1.54 22 0.1082 8 1.55 22 0.0903 7 3.00 30 0.0412
1 10 2.51 24 0.1089 10 2.52 24 0.0910 10 5.02 31 0.0515G
2 10 2.51 23 0.1086 10 2.52 23 0.0909 10 5.02 20 0.0311
1 16 3.00 32 0.1576 16 3.00 32 0.1230 16 5.99 33 0.0686H
2 16 3.00 33 0.1607 16 3.00 33 0.1249 16 5.99 32 0.0684
1 35 6.83 7 0.0257 35 6.87 5 0.0215 29 10.19 8 0.0058I
2 36 10.07 8 0.0278 36 10.18 3 0.0214 36 20.17 4 0.0030
1 12 2.68 18 0.0786 12 2.72 20 0.0708 12 5.26 10 0.0143J
2 12 2.68 14 0.0712 12 2.72 16 0.0643 12 5.26 10 0.0143
1 25 4.82 21 0.0883 25 4.85 18 0.0682 25 9.67 24 0.0360K
2 25 4.82 20 0.0875 25 4.85 19 0.0685 25 9.67 19 0.0286
1 7 1.52 11 0.0625 7 1.53 12 0.0505 9 3.01 12 0.0146L
2 22 4.47 9 0.0351 22 4.51 9 0.0295 22 8.93 9 0.0072
1 3 1.21 35 0.2995 3 1.18 36 0.2615 3 2.31 35 NAM
2 3 1.21 34 0.2921 3 1.18 35 0.2526 3 2.31 34 NA
1 14 2.93 19 0.0818 14 2.98 21 0.0776 14 5.77 17 0.0229O
2 14 2.93 17 0.0766 14 2.98 17 0.0675 14 5.77 16 0.0214
1 1 0.28 29 0.1308 1 0.28 31 0.1133 1 0.53 27 0.0370P
2 1 0.28 28 0.1272 1 0.28 28 0.1100 1 0.53 21 0.0333
1 33 6.52 3 0.0222 33 6.57 6 0.0218 34 13.08 1 0.0027Q
2 33 6.52 4 0.0226 33 6.57 3 0.0214 34 13.08 1 0.0027
1 23 4.74 10 0.0571 23 4.77 10 0.0442 23 9.52 18 0.0281S
2 23 4.74 12 0.0650 23 4.77 11 0.0503 23 9.52 13 0.0195
1 31 6.00 36 NA 31 6.09 34 0.1929 32 12.09 36 NAT
2 31 6.00 13 0.0685 31 6.09 13 0.0562 32 12.09 25 0.0366
1 29 5.17 27 0.1218 29 5.20 26 0.0996 30 10.36 22 0.0336U
2 29 5.17 26 0.1178 29 5.20 27 0.1007 30 10.36 23 0.0358
1 20 3.70 6 0.0253 20 3.72 8 0.0223 20 7.41 7 0.0034V
2 20 3.70 5 0.0252 20 3.72 7 0.0222 20 7.41 3 0.0028
Table 66: Tabulation of mean search template sizes for Class A. Letter refers to the participant’s letter code found on the footer of this page. Sub. # isan identifier used to differentiate between the two submissions each participant could make. Size values indicate the mean kilobytes used to store asearch template on disk for a single subject, where 1 kB is equal to 1 024 bytes. The FNIR column shows FNIR for each submission at FPIR = 10−3. NAindicates that the operations required to produce the value could not be performed. The number to the left of a value provides the value’s column-wiseranking, with the best performance shaded in green and the worst in pink.
C = afis team D = 3M Cogent E = Neurotechnology F = Papillon G = Dermalog H = Hisign Bio-Info InstituteI = NEC J = Sonda K = Tiger IT L = Innovatrics M = SPEX O = ID SolutionsP = id3 Q = Morpho S = Decatur Industries T = BIO-key U = Aware V = AA Technology

162 FPVTE – FINGERPRINT MATCHING
ParticipantLeftSlap
RightSlap
LeftandR
ightSlapIdentification
FlatsLetter
Sub.#Size
FNIR
SizeFN
IRSize
FNIR
SizeFN
IR
14
6.59
22
0.0654
46.70
24
0.0403
413.24
30
NA
216.13
30
NA
C2
46.59
21
0.0647
46.70
23
0.0392
413.24
29
NA
216.13
29
NA
116
11.27
60.0163
16
11.31
60.0072
16
22.39
60.0031
18
30.53
60.0020
D2
15
11.18
50.0142
15
11.24
20.0052
15
22.24
50.0024
17
30.22
20.0012
11
3.88
13
0.0259
13.93
13
0.0151
17.78
15
0.0063
110.48
16
0.0043
E2
28
23.22
70.0187
28
23.53
70.0083
28
46.65
10
0.0049
28
62.06
70.0024
111
9.66
29
0.1684
11
9.73
29
0.1222
11
19.21
28
0.0910
13
26.80
27
0.0591
F2
11
9.66
28
0.1681
11
9.73
28
0.1220
11
19.21
26
0.0901
13
26.80
27
0.0591
113
10.25
18
0.0371
13
10.32
18
0.0212
13
20.53
18
0.0106
11
26.45
18
0.0062
G2
13
10.25
17
0.0325
13
10.32
16
0.0198
13
20.53
17
0.0084
11
26.45
14
0.0040
117
11.92
23
0.0998
17
11.90
25
0.0641
17
23.77
23
0.0349
15
29.66
23
0.0203
H2
17
11.92
24
0.1008
17
11.90
26
0.0647
17
23.77
24
0.0361
15
29.66
24
0.0204
110
8.92
40.0116
10
8.97
50.0058
814.37
30.0022
617.69
20.0012
I2
23
14.25
10.0094
23
14.42
10.0045
23
28.60
10.0015
23
38.41
10.0009
121
12.76
15
0.0287
19
12.94
14
0.0156
21
25.51
16
0.0068
21
35.39
17
0.0049
J2
21
12.76
10
0.0236
19
12.94
10
0.0126
21
25.51
90.0047
21
35.39
11
0.0033
13
6.08
16
0.0288
36.14
15
0.0167
312.15
12
0.0054
516.92
10
0.0031
L2
26.02
14
0.0276
26.08
17
0.0202
212.03
14
0.0062
416.79
11
0.0033
16
7.08
30
0.1736
67.13
30
0.1259
614.11
27
0.0904
719.93
26
0.0543
M2
67.08
27
0.1634
67.13
27
0.1155
614.11
25
0.0882
719.93
25
0.0515
119
12.76
12
0.0257
21
12.94
12
0.0142
19
25.51
13
0.0057
19
35.39
15
0.0041
O2
19
12.76
11
0.0254
21
12.94
11
0.0132
19
25.51
11
0.0051
19
35.39
13
0.0035
129
29.00
20.0098
29
29.30
30.0057
29
58.19
20.0021
29
78.12
20.0012
Q2
29
29.00
30.0099
29
29.30
30.0057
29
58.19
30.0022
29
78.12
20.0012
124
20.36
25
0.1089
24
20.56
21
0.0369
24
40.83
21
0.0160
24
51.62
20
0.0108
S2
24
20.36
26
0.1133
24
20.56
22
0.0381
24
40.83
22
0.0190
24
51.62
21
0.0136
126
20.70
20
0.0500
26
20.73
19
0.0266
26
41.34
20
0.0139
26
55.81
19
0.0099
U2
27
21.43
19
0.0461
27
21.60
20
0.0273
27
42.94
19
0.0124
27
60.97
22
0.0141
18
8.61
90.0192
88.65
80.0106
917.22
70.0036
922.27
90.0027
V2
88.61
80.0190
88.65
90.0110
917.22
70.0036
922.27
70.0024
Table67:Tabulation
ofmean
searchtem
platesizes
forC
lassB.Letter
refersto
theparticipant’s
lettercode
foundon
thefooter
ofthispage.Sub.#
isan
identifierused
todifferentiate
between
thetw
osubm
issionseach
participantcouldm
ake.Size
valuesindicate
them
eankilobytes
usedto
storea
searchtem
plateon
diskfor
asingle
subject,where
1kB
isequalto
1024
bytes.The
FNIR
column
shows
FNIR
foreach
submission
atFPIR
=10−3.
NA
indicatesthat
theoperations
requiredto
producethe
valuecould
notbe
performed.
Thenum
berto
theleft
ofa
valueprovides
thevalue’s
column-w
iseranking,w
iththe
bestperformance
shadedin
greenand
thew
orstinpink.
C = afis team D = 3M Cogent E = Neurotechnology F = Papillon G = Dermalog H = Hisign Bio-Info InstituteI = NEC J = Sonda K = Tiger IT L = Innovatrics M = SPEX O = ID SolutionsP = id3 Q = Morpho S = Decatur Industries T = BIO-key U = Aware V = AA Technology

FPVTE – FINGERPRINT MATCHING 163
Participant Ten-Finger Plain-to-Plain Ten-Finger Rolled-to-RolledLetter Sub. # Size FNIR Size FNIR
1 9 20.91 30 NA 14 40.15 16 0.0094C
2 9 20.91 24 0.0711 14 40.15 15 0.0085
1 19 33.66 6 0.0015 24 63.63 4 0.0015D
2 18 33.16 2 0.0011 25 65.36 7 0.0018
1 1 12.10 14 0.0088 1 19.95 18 0.0106E
2 28 67.07 13 0.0048 28 110.22 12 0.0050
1 5 19.45 25 0.0734 3 27.41 25 0.0536F
2 5 19.45 25 0.0734 3 27.41 25 0.0536
1 14 27.52 23 0.0368 10 30.76 24 0.0447G
2 14 27.52 20 0.0276 10 30.76 21 0.0333
1 16 29.72 20 0.0276 8 29.96 20 0.0201H
2 16 29.72 19 0.0275 8 29.96 19 0.0199
1 4 17.76 4 0.0013 2 23.76 1 0.0013I
2 11 23.15 1 0.0010 7 28.49 2 0.0014
1 23 38.56 12 0.0047 23 63.60 13 0.0051J
2 22 38.56 10 0.0027 20 63.60 9 0.0033
1 2 15.74 16 0.0102 12 32.38 17 0.0097L
2 2 15.74 15 0.0095 12 32.38 14 0.0083
1 5 19.45 28 0.0934 3 27.41 28 0.0783M
2 5 19.45 27 0.0826 3 27.41 27 0.0716
1 20 38.56 9 0.0025 21 63.60 11 0.0034O
2 20 38.56 10 0.0027 21 63.60 9 0.0033
1 29 83.85 2 0.0011 29 134.42 5 0.0017Q
2 29 83.85 4 0.0013 29 134.42 2 0.0014
1 24 54.12 22 0.0311 26 80.04 29 0.0860S
2 24 54.12 29 0.1680 26 80.04 30 0.2462
1 26 62.80 18 0.0163 18 54.62 23 0.0358U
2 26 62.80 17 0.0155 18 54.62 22 0.0351
1 12 25.78 7 0.0024 16 48.74 5 0.0017V
2 12 25.78 7 0.0024 16 48.74 8 0.0019
Table 68: Tabulation of mean search template sizes for Class C. Letter refers to the participant’s letter code found on the footer of this page. Sub. # isan identifier used to differentiate between the two submissions each participant could make. Size values indicate the mean kilobytes used to store asearch template on disk for a single subject, where 1 kB is equal to 1 024 bytes. The FNIR column shows FNIR for each submission at FPIR = 10−3. NAindicates that the operations required to produce the value could not be performed. The number to the left of a value provides the value’s column-wiseranking, with the best performance shaded in green and the worst in pink.
C = afis team D = 3M Cogent E = Neurotechnology F = Papillon G = Dermalog H = Hisign Bio-Info InstituteI = NEC J = Sonda K = Tiger IT L = Innovatrics M = SPEX O = ID SolutionsP = id3 Q = Morpho S = Decatur Industries T = BIO-key U = Aware V = AA Technology

164 FPVTE – FINGERPRINT MATCHING
G.2 Median Values
C = afis team D = 3M Cogent E = Neurotechnology F = Papillon G = Dermalog H = Hisign Bio-Info InstituteI = NEC J = Sonda K = Tiger IT L = Innovatrics M = SPEX O = ID SolutionsP = id3 Q = Morpho S = Decatur Industries T = BIO-key U = Aware V = AA Technology

FPVTE – FINGERPRINT MATCHING 165
Participant Left Index Right Index Left and Right IndexLetter Sub. # Size FNIR Size FNIR Size FNIR
1 5 1.49 30 0.1335 5 1.51 30 0.1132 5 2.94 26 0.0368C
2 5 1.49 31 0.1337 5 1.51 29 0.1124 5 2.94 28 0.0374
1 18 3.27 1 0.0197 18 3.30 1 0.0190 18 6.57 4 0.0030D
2 18 3.27 1 0.0197 18 3.30 1 0.0190 18 6.57 4 0.0030
1 27 4.84 16 0.0745 27 4.91 15 0.0630 27 9.71 15 0.0207E
2 27 4.84 15 0.0723 27 4.91 14 0.0624 27 9.71 14 0.0202
1 8 1.52 25 0.1111 8 1.53 25 0.0933 8 2.97 29 0.0386F
2 8 1.52 22 0.1082 8 1.53 22 0.0903 8 2.97 30 0.0412
1 10 2.35 24 0.1089 10 2.36 24 0.0910 10 4.81 31 0.0515G
2 10 2.35 23 0.1086 10 2.36 23 0.0909 10 4.81 20 0.0311
1 16 3.00 32 0.1576 16 3.00 32 0.1230 16 6.00 33 0.0686H
2 16 3.00 33 0.1607 16 3.00 33 0.1249 16 6.00 32 0.0684
1 35 6.84 7 0.0257 35 6.88 5 0.0215 31 10.19 8 0.0058I
2 36 10.02 8 0.0278 36 10.12 3 0.0214 36 20.05 4 0.0030
1 12 2.65 18 0.0786 12 2.68 20 0.0708 12 5.19 10 0.0143J
2 12 2.65 14 0.0712 12 2.68 16 0.0643 12 5.19 10 0.0143
1 25 4.76 21 0.0883 25 4.79 18 0.0682 25 9.55 24 0.0360K
2 25 4.76 20 0.0875 25 4.79 19 0.0685 25 9.55 19 0.0286
1 7 1.50 11 0.0625 7 1.51 12 0.0505 7 2.97 12 0.0146L
2 22 4.41 9 0.0351 22 4.45 9 0.0295 22 8.81 9 0.0072
1 3 1.20 35 0.2995 3 1.17 36 0.2615 3 2.28 35 NAM
2 3 1.20 34 0.2921 3 1.17 35 0.2526 3 2.28 34 NA
1 14 2.90 19 0.0818 14 2.94 21 0.0776 14 5.69 17 0.0229O
2 14 2.90 17 0.0766 14 2.94 17 0.0675 14 5.69 16 0.0214
1 1 0.28 29 0.1308 1 0.28 31 0.1133 1 0.53 27 0.0370P
2 1 0.28 28 0.1272 1 0.28 28 0.1100 1 0.53 21 0.0333
1 33 6.46 3 0.0222 33 6.51 6 0.0218 34 12.94 1 0.0027Q
2 33 6.46 4 0.0226 33 6.51 3 0.0214 34 12.94 1 0.0027
1 23 4.69 10 0.0571 23 4.71 10 0.0442 23 9.40 18 0.0281S
2 23 4.69 12 0.0650 23 4.71 11 0.0503 23 9.40 13 0.0195
1 31 5.81 36 NA 31 5.89 34 0.1929 32 11.73 36 NAT
2 31 5.81 13 0.0685 31 5.89 13 0.0562 32 11.73 25 0.0366
1 29 5.01 27 0.1218 29 5.04 26 0.0996 29 10.05 22 0.0336U
2 29 5.01 26 0.1178 29 5.04 27 0.1007 29 10.05 23 0.0358
1 20 3.63 6 0.0253 20 3.65 8 0.0223 20 7.27 7 0.0034V
2 20 3.63 5 0.0252 20 3.65 7 0.0222 20 7.27 3 0.0028
Table 69: Tabulation of median search template sizes for Class A. Letter refers to the participant’s letter code found on the footer of this page. Sub. # isan identifier used to differentiate between the two submissions each participant could make. Size values indicate the median kilobytes used to store asearch template on disk for a single subject, where 1 kB is equal to 1 024 bytes. The FNIR column shows FNIR for each submission at FPIR = 10−3. NAindicates that the operations required to produce the value could not be performed. The number to the left of a value provides the value’s column-wiseranking, with the best performance shaded in green and the worst in pink.
C = afis team D = 3M Cogent E = Neurotechnology F = Papillon G = Dermalog H = Hisign Bio-Info InstituteI = NEC J = Sonda K = Tiger IT L = Innovatrics M = SPEX O = ID SolutionsP = id3 Q = Morpho S = Decatur Industries T = BIO-key U = Aware V = AA Technology

166 FPVTE – FINGERPRINT MATCHING
ParticipantLeftSlap
RightSlap
LeftandR
ightSlapIdentification
FlatsLetter
Sub.#Size
FNIR
SizeFN
IRSize
FNIR
SizeFN
IR
14
6.56
22
0.0654
46.67
24
0.0403
413.18
30
NA
216.03
30
NA
C2
46.56
21
0.0647
46.67
23
0.0392
413.18
29
NA
216.03
29
NA
116
11.30
60.0163
16
11.35
60.0072
16
22.48
60.0031
18
30.57
60.0020
D2
15
11.18
50.0142
15
11.24
20.0052
15
22.24
50.0024
17
30.17
20.0012
11
3.89
13
0.0259
13.91
13
0.0151
17.78
15
0.0063
110.43
16
0.0043
E2
28
23.35
70.0187
28
23.68
70.0083
28
46.93
10
0.0049
28
62.33
70.0024
111
9.41
29
0.1684
11
9.49
29
0.1222
11
18.78
28
0.0910
13
26.48
27
0.0591
F2
11
9.41
28
0.1681
11
9.49
28
0.1220
11
18.78
26
0.0901
13
26.48
27
0.0591
113
9.99
18
0.0371
13
10.07
18
0.0212
13
20.12
18
0.0106
11
25.93
18
0.0062
G2
13
9.99
17
0.0325
13
10.07
16
0.0198
13
20.12
17
0.0084
11
25.93
14
0.0040
117
12.00
23
0.0998
17
12.00
25
0.0641
17
24.00
23
0.0349
15
30.00
23
0.0203
H2
17
12.00
24
0.1008
17
12.00
26
0.0647
17
24.00
24
0.0361
15
30.00
24
0.0204
110
9.00
40.0116
10
9.05
50.0058
814.52
30.0022
617.87
20.0012
I2
23
14.26
10.0094
23
14.42
10.0045
23
28.63
10.0015
23
38.44
10.0009
119
12.73
15
0.0287
19
12.93
14
0.0156
19
25.46
16
0.0068
19
35.37
17
0.0049
J2
19
12.73
10
0.0236
19
12.93
10
0.0126
19
25.46
90.0047
19
35.37
11
0.0033
13
6.06
16
0.0288
36.11
15
0.0167
312.12
12
0.0054
516.86
10
0.0031
L2
26.00
14
0.0276
26.06
17
0.0202
212.00
14
0.0062
416.74
11
0.0033
16
6.91
30
0.1736
66.97
30
0.1259
613.82
27
0.0904
719.73
26
0.0543
M2
66.91
27
0.1634
66.97
27
0.1155
613.82
25
0.0882
719.73
25
0.0515
119
12.73
12
0.0257
19
12.93
12
0.0142
19
25.46
13
0.0057
19
35.37
15
0.0041
O2
19
12.73
11
0.0254
19
12.93
11
0.0132
19
25.46
11
0.0051
19
35.37
13
0.0035
129
29.00
20.0098
29
29.30
30.0057
29
58.20
20.0021
29
78.05
20.0012
Q2
29
29.00
30.0099
29
29.30
30.0057
29
58.20
30.0022
29
78.05
20.0012
124
20.07
25
0.1089
24
20.25
21
0.0369
24
40.31
21
0.0160
24
51.27
20
0.0108
S2
24
20.07
26
0.1133
24
20.25
22
0.0381
24
40.31
22
0.0190
24
51.27
21
0.0136
126
20.84
20
0.0500
26
20.92
19
0.0266
26
41.58
20
0.0139
26
56.14
19
0.0099
U2
27
21.27
19
0.0461
27
21.43
20
0.0273
27
42.60
19
0.0124
27
60.55
22
0.0141
18
8.62
90.0192
88.66
80.0106
917.26
70.0036
922.46
90.0027
V2
88.62
80.0190
88.66
90.0110
917.26
70.0036
922.46
70.0024
Table70:Tabulation
ofmedian
searchtem
platesizes
forC
lassB.Letter
refersto
theparticipant’s
lettercode
foundon
thefooter
ofthispage.Sub.#
isan
identifierused
todifferentiate
between
thetw
osubm
issionseach
participantcouldm
ake.Sizevalues
indicatethe
median
kilobytesused
tostore
asearch
template
ondisk
fora
singlesubject,w
here1
kBis
equalto1024
bytes.TheFN
IRcolum
nshow
sFN
IRfor
eachsubm
issionat
FPIR=
10−3.
NA
indicatesthat
theoperations
requiredto
producethe
valuecould
notbe
performed.
Thenum
berto
theleft
ofa
valueprovides
thevalue’s
column-w
iseranking,w
iththe
bestperformance
shadedin
greenand
thew
orstinpink.
C = afis team D = 3M Cogent E = Neurotechnology F = Papillon G = Dermalog H = Hisign Bio-Info InstituteI = NEC J = Sonda K = Tiger IT L = Innovatrics M = SPEX O = ID SolutionsP = id3 Q = Morpho S = Decatur Industries T = BIO-key U = Aware V = AA Technology

FPVTE – FINGERPRINT MATCHING 167
Participant Ten-Finger Plain-to-Plain Ten-Finger Rolled-to-RolledLetter Sub. # Size FNIR Size FNIR
1 9 20.80 30 NA 14 40.13 16 0.0094C
2 9 20.80 24 0.0711 14 40.13 15 0.0085
1 19 33.58 6 0.0015 20 63.49 4 0.0015D
2 18 33.00 2 0.0011 25 65.19 7 0.0018
1 1 12.07 14 0.0088 1 19.69 18 0.0106E
2 28 66.94 13 0.0048 28 108.80 12 0.0050
1 5 19.35 25 0.0734 3 27.48 25 0.0536F
2 5 19.35 25 0.0734 3 27.48 25 0.0536
1 14 26.87 23 0.0368 10 30.12 24 0.0447G
2 14 26.87 20 0.0276 10 30.12 21 0.0333
1 16 30.00 20 0.0276 8 30.00 20 0.0201H
2 16 30.00 19 0.0275 8 30.00 19 0.0199
1 4 17.86 4 0.0013 2 23.92 1 0.0013I
2 11 23.17 1 0.0010 7 28.90 2 0.0014
1 20 38.52 12 0.0047 21 63.55 13 0.0051J
2 20 38.52 10 0.0027 21 63.55 9 0.0033
1 2 15.77 16 0.0102 12 32.65 17 0.0097L
2 2 15.77 15 0.0095 12 32.65 14 0.0083
1 5 19.35 28 0.0934 3 27.48 28 0.0783M
2 5 19.35 27 0.0826 3 27.48 27 0.0716
1 20 38.52 9 0.0025 21 63.55 11 0.0034O
2 20 38.52 10 0.0027 21 63.55 9 0.0033
1 29 83.49 2 0.0011 29 135.01 5 0.0017Q
2 29 83.49 4 0.0013 29 135.01 2 0.0014
1 24 53.59 22 0.0311 26 78.67 29 0.0860S
2 24 53.59 29 0.1680 26 78.67 30 0.2462
1 26 63.23 18 0.0163 18 54.73 23 0.0358U
2 26 63.23 17 0.0155 18 54.73 22 0.0351
1 12 25.68 7 0.0024 16 48.85 5 0.0017V
2 12 25.68 7 0.0024 16 48.85 8 0.0019
Table 71: Tabulation of median search template sizes for Class C. Letter refers to the participant’s letter code found on the footer of this page. Sub. # isan identifier used to differentiate between the two submissions each participant could make. Size values indicate the median kilobytes used to store asearch template on disk for a single subject, where 1 kB is equal to 1 024 bytes. The FNIR column shows FNIR for each submission at FPIR = 10−3. NAindicates that the operations required to produce the value could not be performed. The number to the left of a value provides the value’s column-wiseranking, with the best performance shaded in green and the worst in pink.
C = afis team D = 3M Cogent E = Neurotechnology F = Papillon G = Dermalog H = Hisign Bio-Info InstituteI = NEC J = Sonda K = Tiger IT L = Innovatrics M = SPEX O = ID SolutionsP = id3 Q = Morpho S = Decatur Industries T = BIO-key U = Aware V = AA Technology

168 FPVTE – FINGERPRINT MATCHING
H Template Creation Times
C = afis team D = 3M Cogent E = Neurotechnology F = Papillon G = Dermalog H = Hisign Bio-Info InstituteI = NEC J = Sonda K = Tiger IT L = Innovatrics M = SPEX O = ID SolutionsP = id3 Q = Morpho S = Decatur Industries T = BIO-key U = Aware V = AA Technology

FPVTE – FINGERPRINT MATCHING 169
Participant Enrollment Search
Letter Sub. # Mean Median Mean Median
1 21 0.45 19 0.41 19 0.41 19 0.39C
2 21 0.45 19 0.41 19 0.41 19 0.39
1 35 1.79 34 1.46 35 1.57 34 1.43D
2 34 1.79 33 1.46 34 1.55 33 1.42
1 11 0.37 15 0.36 15 0.35 15 0.35E
2 11 0.37 15 0.36 15 0.35 15 0.35
1 31 1.21 31 1.13 29 1.11 29 1.07F
2 31 1.21 31 1.13 29 1.11 29 1.07
1 19 0.43 21 0.41 21 0.57 23 0.55G
2 19 0.43 21 0.41 21 0.57 23 0.55
1 13 0.37 7 0.31 11 0.33 7 0.30H
2 13 0.37 7 0.31 11 0.33 7 0.30
1 33 1.49 35 1.47 33 1.48 35 1.46I
2 36 2.29 36 2.20 36 2.19 36 2.15
1 7 0.35 13 0.34 9 0.33 13 0.32J
2 7 0.35 13 0.34 9 0.33 13 0.32
1 27 1.09 27 1.07 27 1.06 27 1.05K
2 27 1.09 27 1.07 27 1.06 27 1.05
1 1 0.07 1 0.06 1 0.07 1 0.05L
2 4 0.19 4 0.16 4 0.17 4 0.15
1 29 1.21 29 1.13 31 1.12 31 1.07M
2 29 1.21 29 1.13 31 1.12 31 1.07
1 5 0.29 5 0.28 5 0.28 5 0.27O
2 5 0.29 5 0.28 5 0.28 5 0.27
1 17 0.42 17 0.38 17 0.38 17 0.36P
2 17 0.42 17 0.38 17 0.38 17 0.36
1 23 0.64 23 0.56 23 0.57 21 0.54Q
2 23 0.64 23 0.56 23 0.57 21 0.54
1 25 0.91 25 0.89 25 0.90 25 0.88S
2 25 0.91 25 0.89 25 0.90 25 0.88
1 9 0.35 9 0.32 7 0.33 9 0.31T
2 9 0.35 9 0.32 7 0.33 9 0.31
1 2 0.17 2 0.16 2 0.16 2 0.15U
2 2 0.17 2 0.16 2 0.16 2 0.15
1 15 0.37 11 0.33 13 0.34 11 0.32V
2 15 0.37 11 0.33 13 0.34 11 0.32
FNIR @ FPIR = 10−3
30 0.1335
31 0.1337
1 0.0197
1 0.0197
16 0.0745
15 0.0723
25 0.1111
22 0.1082
24 0.1089
23 0.1086
32 0.1576
33 0.1607
7 0.0257
8 0.0278
18 0.0786
14 0.0712
21 0.0883
20 0.0875
11 0.0625
9 0.0351
35 0.2995
34 0.2921
19 0.0818
17 0.0766
29 0.1308
28 0.1272
3 0.0222
4 0.0226
10 0.0571
12 0.0650
36 NA
13 0.0685
27 0.1218
26 0.1178
6 0.0253
5 0.0252
Table 72: Tabulation of enrollment time results for Class A — Left Index. Letter refers to the participant’s letter code found on the footer of this page. Sub.# is an identifier used to differentiate between the two submissions each participant could make. Enrollment shows the time used to create a fingerprinttemplate to be used in an enrollment set. Search shows the time used to create a search template to be used for a query. All values are reported inseconds, but were originally recorded to microsecond precision. The number to the left of a value provides the value’s column-wise ranking, with thebest performance shaded in green and the worst in pink. For reference, the FNIR values from Table 7 are reprinted to the right of this table.
C = afis team D = 3M Cogent E = Neurotechnology F = Papillon G = Dermalog H = Hisign Bio-Info InstituteI = NEC J = Sonda K = Tiger IT L = Innovatrics M = SPEX O = ID SolutionsP = id3 Q = Morpho S = Decatur Industries T = BIO-key U = Aware V = AA Technology

170 FPVTE – FINGERPRINT MATCHING
Participant Enrollment Search
Letter Sub. # Mean Median Mean Median
1 21 0.45 19 0.41 19 0.41 19 0.39C
2 21 0.45 19 0.41 19 0.41 19 0.39
1 34 1.78 33 1.45 35 1.58 34 1.43D
2 35 1.80 34 1.46 34 1.57 33 1.43
1 13 0.37 15 0.37 15 0.37 15 0.36E
2 13 0.37 15 0.37 15 0.37 15 0.36
1 29 1.23 29 1.15 31 1.14 29 1.09F
2 29 1.23 29 1.15 31 1.14 29 1.09
1 19 0.43 21 0.41 21 0.57 23 0.55G
2 19 0.43 21 0.41 21 0.57 23 0.55
1 15 0.38 7 0.31 9 0.34 7 0.30H
2 15 0.38 7 0.31 9 0.34 7 0.30
1 33 1.51 35 1.48 33 1.49 35 1.46I
2 36 2.29 36 2.20 36 2.19 36 2.15
1 7 0.35 13 0.33 11 0.34 13 0.33J
2 7 0.35 13 0.33 11 0.34 13 0.33
1 27 1.09 27 1.06 27 1.06 27 1.05K
2 27 1.09 27 1.06 27 1.06 27 1.05
1 1 0.07 1 0.06 1 0.07 1 0.05L
2 4 0.19 4 0.16 4 0.17 4 0.16
1 31 1.24 31 1.16 29 1.14 31 1.09M
2 31 1.24 31 1.16 29 1.14 31 1.09
1 5 0.29 5 0.28 5 0.28 5 0.27O
2 5 0.29 5 0.28 5 0.28 5 0.27
1 17 0.42 17 0.38 17 0.39 17 0.37P
2 17 0.42 17 0.38 17 0.39 17 0.37
1 23 0.64 23 0.56 23 0.58 21 0.54Q
2 23 0.64 23 0.56 23 0.58 21 0.54
1 25 0.91 25 0.89 25 0.89 25 0.88S
2 25 0.91 25 0.89 25 0.89 25 0.88
1 9 0.35 9 0.32 7 0.33 9 0.31T
2 9 0.35 9 0.32 7 0.33 9 0.31
1 2 0.17 2 0.16 2 0.16 2 0.15U
2 2 0.17 2 0.16 2 0.16 2 0.15
1 11 0.37 11 0.33 13 0.34 11 0.32V
2 11 0.37 11 0.33 13 0.34 11 0.32
FNIR @ FPIR = 10−3
30 0.1132
29 0.1124
1 0.0190
1 0.0190
15 0.0630
14 0.0624
25 0.0933
22 0.0903
24 0.0910
23 0.0909
32 0.1230
33 0.1249
5 0.0215
3 0.0214
20 0.0708
16 0.0643
18 0.0682
19 0.0685
12 0.0505
9 0.0295
36 0.2615
35 0.2526
21 0.0776
17 0.0675
31 0.1133
28 0.1100
6 0.0218
3 0.0214
10 0.0442
11 0.0503
34 0.1929
13 0.0562
26 0.0996
27 0.1007
8 0.0223
7 0.0222
Table 73: Tabulation of enrollment time results for Class A — Right Index. Letter refers to the participant’s letter code found on the footer of this page. Sub.# is an identifier used to differentiate between the two submissions each participant could make. Enrollment shows the time used to create a fingerprinttemplate to be used in an enrollment set. Search shows the time used to create a search template to be used for a query. All values are reported inseconds, but were originally recorded to microsecond precision. The number to the left of a value provides the value’s column-wise ranking, with thebest performance shaded in green and the worst in pink. For reference, the FNIR values from Table 8 are reprinted to the right of this table.
C = afis team D = 3M Cogent E = Neurotechnology F = Papillon G = Dermalog H = Hisign Bio-Info InstituteI = NEC J = Sonda K = Tiger IT L = Innovatrics M = SPEX O = ID SolutionsP = id3 Q = Morpho S = Decatur Industries T = BIO-key U = Aware V = AA Technology

FPVTE – FINGERPRINT MATCHING 171
Participant Enrollment Search
Letter Sub. # Mean Median Mean Median
1 21 0.88 21 0.80 19 0.80 19 0.78C
2 21 0.88 21 0.80 19 0.80 19 0.78
1 35 3.57 34 2.91 34 3.10 33 2.84D
2 34 3.55 33 2.89 35 3.12 34 2.84
1 15 0.74 15 0.73 15 0.70 15 0.70E
2 15 0.74 15 0.73 15 0.70 15 0.70
1 29 2.42 29 2.26 29 2.23 29 2.15F
2 29 2.42 29 2.26 29 2.23 29 2.15
1 19 0.84 19 0.80 21 1.13 23 1.09G
2 19 0.84 19 0.80 21 1.13 23 1.09
1 13 0.74 7 0.62 9 0.66 7 0.60H
2 13 0.74 7 0.62 9 0.66 7 0.60
1 33 2.98 35 2.96 33 2.96 35 2.93I
2 36 4.59 36 4.40 36 4.37 36 4.30
1 7 0.69 13 0.67 11 0.66 13 0.65J
2 7 0.69 13 0.67 11 0.66 13 0.65
1 27 2.17 27 2.13 27 2.11 27 2.09K
2 27 2.17 27 2.13 27 2.11 27 2.09
1 1 0.12 1 0.11 1 0.11 1 0.11L
2 4 0.36 4 0.32 4 0.33 4 0.31
1 31 2.42 31 2.27 31 2.25 31 2.16M
2 31 2.42 31 2.27 31 2.25 31 2.16
1 5 0.57 5 0.55 5 0.55 5 0.53O
2 5 0.57 5 0.55 5 0.55 5 0.53
1 17 0.83 17 0.76 17 0.77 17 0.72P
2 17 0.83 17 0.76 17 0.77 17 0.72
1 23 1.27 23 1.10 23 1.13 21 1.08Q
2 23 1.27 23 1.10 23 1.13 21 1.08
1 25 1.81 25 1.78 25 1.77 25 1.75S
2 25 1.81 25 1.78 25 1.77 25 1.75
1 9 0.70 9 0.64 7 0.65 9 0.62T
2 9 0.70 9 0.64 7 0.65 9 0.62
1 2 0.32 2 0.31 2 0.30 2 0.30U
2 2 0.32 2 0.31 2 0.30 2 0.30
1 11 0.73 11 0.65 13 0.68 11 0.64V
2 11 0.73 11 0.65 13 0.68 11 0.64
FNIR @ FPIR = 10−3
26 0.0368
28 0.0374
4 0.0030
4 0.0030
15 0.0207
14 0.0202
29 0.0386
30 0.0412
31 0.0515
20 0.0311
33 0.0686
32 0.0684
8 0.0058
4 0.0030
10 0.0143
10 0.0143
24 0.0360
19 0.0286
12 0.0146
9 0.0072
35 NA
34 NA
17 0.0229
16 0.0214
27 0.0370
21 0.0333
1 0.0027
1 0.0027
18 0.0281
13 0.0195
36 NA
25 0.0366
22 0.0336
23 0.0358
7 0.0034
3 0.0028
Table 74: Tabulation of enrollment time results for Class A — Left and Right Index. Letter refers to the participant’s letter code found on the footer of thispage. Sub. # is an identifier used to differentiate between the two submissions each participant could make. Enrollment shows the time used to create afingerprint template to be used in an enrollment set. Search shows the time used to create a search template to be used for a query. All values are reportedin seconds, but were originally recorded to microsecond precision. The number to the left of a value provides the value’s column-wise ranking, with thebest performance shaded in green and the worst in pink. For reference, the FNIR values from Table 9 are reprinted to the right of this table.
C = afis team D = 3M Cogent E = Neurotechnology F = Papillon G = Dermalog H = Hisign Bio-Info InstituteI = NEC J = Sonda K = Tiger IT L = Innovatrics M = SPEX O = ID SolutionsP = id3 Q = Morpho S = Decatur Industries T = BIO-key U = Aware V = AA Technology

172 FPVTE – FINGERPRINT MATCHING
Participant Search
Letter Sub. # Mean Median
1 12 2.13 12 2.12C
2 12 2.13 12 2.12
1 14 2.16 14 2.15D
2 24 4.18 24 4.17
1 11 1.95 11 1.95E
2 15 2.21 15 2.21
1 28 6.94 26 6.73F
2 28 6.94 26 6.73
1 18 2.81 18 2.83G
2 18 2.81 18 2.83
1 9 1.68 9 1.67H
2 9 1.68 9 1.67
1 25 6.50 25 6.50I
2 30 7.68 30 7.67
1 7 1.22 3 1.21J
2 7 1.22 3 1.21
1 2 1.13 2 1.11L
2 1 0.33 1 0.33
1 26 6.94 28 6.73M
2 26 6.94 28 6.73
1 5 1.22 5 1.21O
2 5 1.22 5 1.21
1 20 3.41 20 3.41Q
2 20 3.41 20 3.41
1 22 3.97 22 3.96S
2 22 3.97 22 3.96
1 17 2.46 17 2.42U
2 16 2.45 16 2.41
1 3 1.21 7 1.22V
2 3 1.21 7 1.22
FNIR @ FPIR = 10−3
22 0.0654
21 0.0647
6 0.0163
5 0.0142
13 0.0259
7 0.0187
29 0.1684
28 0.1681
18 0.0371
17 0.0325
23 0.0998
24 0.1008
4 0.0116
1 0.0094
15 0.0287
10 0.0236
16 0.0288
14 0.0276
30 0.1736
27 0.1634
12 0.0257
11 0.0254
2 0.0098
3 0.0099
25 0.1089
26 0.1133
20 0.0500
19 0.0461
9 0.0192
8 0.0190
Table 75: Tabulation of enrollment time results for Class B — Left Slap. Letter refers to the participant’s letter code found on the footer of this page. Sub. #is an identifier used to differentiate between the two submissions each participant could make. Search shows the time used to create a search template tobe used for a query. All values are reported in seconds, but were originally recorded to microsecond precision. The number to the left of a value providesthe value’s column-wise ranking, with the best performance shaded in green and the worst in pink. For reference, the FNIR values from Table 10 arereprinted to the right of this table.
C = afis team D = 3M Cogent E = Neurotechnology F = Papillon G = Dermalog H = Hisign Bio-Info InstituteI = NEC J = Sonda K = Tiger IT L = Innovatrics M = SPEX O = ID SolutionsP = id3 Q = Morpho S = Decatur Industries T = BIO-key U = Aware V = AA Technology

FPVTE – FINGERPRINT MATCHING 173
Participant Search
Letter Sub. # Mean Median
1 12 2.10 12 2.09C
2 12 2.10 12 2.09
1 14 2.15 14 2.14D
2 24 4.15 24 4.13
1 11 1.92 11 1.91E
2 15 2.18 15 2.18
1 26 6.86 26 6.68F
2 26 6.86 26 6.68
1 18 2.76 18 2.78G
2 18 2.76 18 2.78
1 9 1.64 9 1.63H
2 9 1.64 9 1.63
1 25 6.47 25 6.47I
2 30 7.65 30 7.65
1 5 1.21 5 1.20J
2 5 1.21 5 1.20
1 2 1.12 2 1.11L
2 1 0.33 1 0.33
1 28 6.88 28 6.69M
2 28 6.88 28 6.69
1 7 1.21 7 1.20O
2 7 1.21 7 1.20
1 20 3.41 20 3.41Q
2 20 3.41 20 3.41
1 22 3.89 22 3.88S
2 22 3.89 22 3.88
1 16 2.43 16 2.39U
2 17 2.43 17 2.39
1 3 1.19 3 1.19V
2 3 1.19 3 1.19
FNIR @ FPIR = 10−3
24 0.0403
23 0.0392
6 0.0072
2 0.0052
13 0.0151
7 0.0083
29 0.1222
28 0.1220
18 0.0212
16 0.0198
25 0.0641
26 0.0647
5 0.0058
1 0.0045
14 0.0156
10 0.0126
15 0.0167
17 0.0202
30 0.1259
27 0.1155
12 0.0142
11 0.0132
3 0.0057
3 0.0057
21 0.0369
22 0.0381
19 0.0266
20 0.0273
8 0.0106
9 0.0110
Table 76: Tabulation of enrollment time results for Class B — Right Slap. Letter refers to the participant’s letter code found on the footer of this page.Sub. # is an identifier used to differentiate between the two submissions each participant could make. Search shows the time used to create a searchtemplate to be used for a query. All values are reported in seconds, but were originally recorded to microsecond precision. The number to the left of avalue provides the value’s column-wise ranking, with the best performance shaded in green and the worst in pink. For reference, the FNIR values fromTable 11 are reprinted to the right of this table.
C = afis team D = 3M Cogent E = Neurotechnology F = Papillon G = Dermalog H = Hisign Bio-Info InstituteI = NEC J = Sonda K = Tiger IT L = Innovatrics M = SPEX O = ID SolutionsP = id3 Q = Morpho S = Decatur Industries T = BIO-key U = Aware V = AA Technology

174 FPVTE – FINGERPRINT MATCHING
Participant Search
Letter Sub. # Mean Median
1 12 4.22 12 4.20C
2 12 4.22 12 4.20
1 14 4.29 14 4.28D
2 24 8.31 24 8.28
1 11 3.86 11 3.85E
2 15 4.39 15 4.38
1 26 13.78 26 13.49F
2 26 13.78 26 13.49
1 18 5.59 18 5.62G
2 18 5.59 18 5.62
1 9 3.31 9 3.31H
2 9 3.31 9 3.31
1 25 12.94 25 12.96I
2 30 15.30 30 15.33
1 7 2.42 5 2.40J
2 7 2.42 5 2.40
1 2 2.24 2 2.23L
2 1 0.66 1 0.66
1 28 13.79 28 13.53M
2 28 13.79 28 13.53
1 5 2.42 3 2.40O
2 5 2.42 3 2.40
1 20 6.84 20 6.84Q
2 20 6.84 20 6.84
1 22 7.82 22 7.83S
2 22 7.82 22 7.83
1 17 4.91 16 4.82U
2 16 4.89 17 4.83
1 3 2.40 7 2.40V
2 3 2.40 7 2.40
FNIR @ FPIR = 10−3
30 NA
29 NA
6 0.0031
5 0.0024
15 0.0063
10 0.0049
28 0.0910
26 0.0901
18 0.0106
17 0.0084
23 0.0349
24 0.0361
3 0.0022
1 0.0015
16 0.0068
9 0.0047
12 0.0054
14 0.0062
27 0.0904
25 0.0882
13 0.0057
11 0.0051
2 0.0021
3 0.0022
21 0.0160
22 0.0190
20 0.0139
19 0.0124
7 0.0036
7 0.0036
Table 77: Tabulation of enrollment time results for Class B — Left and Right Slap. Letter refers to the participant’s letter code found on the footer of thispage. Sub. # is an identifier used to differentiate between the two submissions each participant could make. Search shows the time used to create a searchtemplate to be used for a query. All values are reported in seconds, but were originally recorded to microsecond precision. The number to the left of avalue provides the value’s column-wise ranking, with the best performance shaded in green and the worst in pink. For reference, the FNIR values fromTable 12 are reprinted to the right of this table.
C = afis team D = 3M Cogent E = Neurotechnology F = Papillon G = Dermalog H = Hisign Bio-Info InstituteI = NEC J = Sonda K = Tiger IT L = Innovatrics M = SPEX O = ID SolutionsP = id3 Q = Morpho S = Decatur Industries T = BIO-key U = Aware V = AA Technology

FPVTE – FINGERPRINT MATCHING 175
Participant Enrollment Search
Letter Sub. # Mean Median Mean Median
1 11 4.92 11 5.06 11 5.16 11 5.13C
2 11 4.92 11 5.06 11 5.16 11 5.13
1 19 5.82 19 5.97 17 6.19 17 6.16D
2 24 11.20 24 11.47 24 11.90 24 11.86
1 13 5.11 13 5.28 13 5.35 13 5.34E
2 18 5.69 18 5.89 16 5.95 16 5.93
1 28 17.69 28 17.86 28 18.36 26 18.07F
2 28 17.69 28 17.86 28 18.36 26 18.07
1 14 5.41 14 5.60 18 7.89 18 7.90G
2 14 5.41 14 5.60 18 7.89 18 7.90
1 9 4.15 9 4.28 9 4.37 9 4.37H
2 9 4.15 9 4.28 9 4.37 9 4.37
1 25 15.80 25 16.47 25 16.50 25 16.52I
2 30 18.56 30 19.35 30 19.36 30 19.36
1 3 3.20 3 3.27 7 3.38 3 3.35J
2 3 3.20 3 3.27 7 3.38 3 3.35
1 2 2.94 2 3.02 2 3.05 2 3.05L
2 1 0.84 1 0.87 1 0.88 1 0.88
1 26 17.66 26 17.85 26 18.36 28 18.11M
2 26 17.66 26 17.85 26 18.36 28 18.11
1 7 3.20 5 3.27 5 3.38 5 3.36O
2 7 3.20 5 3.27 5 3.38 5 3.36
1 20 8.50 20 8.85 20 8.89 20 8.92Q
2 20 8.50 20 8.85 20 8.89 20 8.92
1 22 9.80 22 10.19 22 10.24 22 10.31S
2 22 9.80 22 10.19 22 10.24 22 10.31
1 17 5.66 17 5.73 15 5.90 15 5.82U
2 16 5.56 16 5.66 14 5.80 14 5.73
1 5 3.20 7 3.30 3 3.35 7 3.36V
2 5 3.20 7 3.30 3 3.35 7 3.36
FNIR @ FPIR = 10−3
30 NA
29 NA
6 0.0020
2 0.0012
16 0.0043
7 0.0024
27 0.0591
27 0.0591
18 0.0062
14 0.0040
23 0.0203
24 0.0204
2 0.0012
1 0.0009
17 0.0049
11 0.0033
10 0.0031
11 0.0033
26 0.0543
25 0.0515
15 0.0041
13 0.0035
2 0.0012
2 0.0012
20 0.0108
21 0.0136
19 0.0099
22 0.0141
9 0.0027
7 0.0024
Table 78: Tabulation of enrollment time results for Class B — Identification Flats. Letter refers to the participant’s letter code found on the footer of thispage. Sub. # is an identifier used to differentiate between the two submissions each participant could make. Enrollment shows the time used to create afingerprint template to be used in an enrollment set. Search shows the time used to create a search template to be used for a query. All values are reportedin seconds, but were originally recorded to microsecond precision. The number to the left of a value provides the value’s column-wise ranking, with thebest performance shaded in green and the worst in pink. For reference, the FNIR values from Table 13 are reprinted to the right of this table.
C = afis team D = 3M Cogent E = Neurotechnology F = Papillon G = Dermalog H = Hisign Bio-Info InstituteI = NEC J = Sonda K = Tiger IT L = Innovatrics M = SPEX O = ID SolutionsP = id3 Q = Morpho S = Decatur Industries T = BIO-key U = Aware V = AA Technology

176 FPVTE – FINGERPRINT MATCHING
Participant Enrollment Search
Letter Sub. # Mean Median Mean Median
1 15 5.93 13 5.89 13 5.84 13 5.80C
2 15 5.93 13 5.89 13 5.84 13 5.80
1 19 7.10 19 7.09 17 7.12 17 7.10D
2 24 13.55 24 13.52 24 13.69 24 13.66
1 11 5.19 11 5.21 11 5.20 11 5.20E
2 12 5.20 12 5.22 12 5.21 12 5.20
1 27 15.96 25 15.88 27 15.96 27 15.87F
2 27 15.96 25 15.88 27 15.96 27 15.87
1 13 5.93 15 5.91 18 8.35 18 8.32G
2 13 5.93 15 5.91 18 8.35 18 8.32
1 9 5.18 9 5.21 9 5.16 9 5.16H
2 9 5.18 9 5.21 9 5.16 9 5.16
1 29 16.65 29 16.67 29 16.71 29 16.67I
2 30 17.15 30 17.07 30 17.04 30 16.99
1 3 3.61 3 3.58 3 3.62 5 3.62J
2 6 3.63 6 3.60 6 3.64 6 3.62
1 1 3.56 1 3.52 1 3.51 1 3.48L
2 1 3.56 1 3.52 1 3.51 1 3.48
1 25 15.95 27 15.89 25 15.91 25 15.83M
2 25 15.95 27 15.89 25 15.91 25 15.83
1 4 3.63 4 3.60 4 3.63 3 3.61O
2 4 3.63 4 3.60 4 3.63 3 3.61
1 20 9.10 20 9.08 20 9.14 20 9.11Q
2 20 9.10 20 9.08 20 9.14 20 9.11
1 22 10.86 22 10.87 22 10.91 22 10.87S
2 22 10.86 22 10.87 22 10.91 22 10.87
1 17 6.34 17 6.09 15 6.13 15 5.91U
2 17 6.34 17 6.09 15 6.13 15 5.91
1 7 3.68 7 3.67 7 3.69 7 3.66V
2 7 3.68 7 3.67 7 3.69 7 3.66
FNIR @ FPIR = 10−3
30 NA
24 0.0711
6 0.0015
2 0.0011
14 0.0088
13 0.0048
25 0.0734
25 0.0734
23 0.0368
20 0.0276
20 0.0276
19 0.0275
4 0.0013
1 0.0010
12 0.0047
10 0.0027
16 0.0102
15 0.0095
28 0.0934
27 0.0826
9 0.0025
10 0.0027
2 0.0011
4 0.0013
22 0.0311
29 0.1680
18 0.0163
17 0.0155
7 0.0024
7 0.0024
Table 79: Tabulation of enrollment time results for Class C — Ten-Finger Plain-to-Plain. Letter refers to the participant’s letter code found on the footerof this page. Sub. # is an identifier used to differentiate between the two submissions each participant could make. Enrollment shows the time used tocreate a fingerprint template to be used in an enrollment set. Search shows the time used to create a search template to be used for a query. All values arereported in seconds, but were originally recorded to microsecond precision. The number to the left of a value provides the value’s column-wise ranking,with the best performance shaded in green and the worst in pink. For reference, the FNIR values from Table 14 are reprinted to the right of this table.
C = afis team D = 3M Cogent E = Neurotechnology F = Papillon G = Dermalog H = Hisign Bio-Info InstituteI = NEC J = Sonda K = Tiger IT L = Innovatrics M = SPEX O = ID SolutionsP = id3 Q = Morpho S = Decatur Industries T = BIO-key U = Aware V = AA Technology

FPVTE – FINGERPRINT MATCHING 177
Participant Enrollment Search
Letter Sub. # Mean Median Mean Median
1 13 11.18 13 11.00 13 10.79 13 10.69C
2 13 11.18 13 11.00 13 10.79 13 10.69
1 21 17.37 21 17.27 23 17.44 21 17.39D
2 30 30.78 30 30.70 30 30.43 30 30.47
1 12 9.93 12 9.94 12 9.90 12 9.92E
2 11 9.92 11 9.94 11 9.89 11 9.91
1 26 21.06 28 20.95 28 21.07 28 20.92F
2 26 21.06 28 20.95 28 21.07 28 20.92
1 15 11.21 15 11.19 19 15.55 19 15.50G
2 15 11.21 15 11.19 19 15.55 19 15.50
1 17 12.36 17 12.36 15 12.08 15 12.17H
2 17 12.36 17 12.36 15 12.08 15 12.17
1 25 20.25 25 20.25 25 20.21 25 20.23I
2 24 18.75 24 18.76 24 18.72 24 18.73
1 7 6.78 5 6.67 5 6.78 5 6.69J
2 8 6.80 8 6.71 8 6.82 8 6.74
1 3 4.43 3 4.44 3 4.36 3 4.36L
2 3 4.43 3 4.44 3 4.36 3 4.36
1 28 21.08 26 20.92 26 21.02 26 20.89M
2 28 21.08 26 20.92 26 21.02 26 20.89
1 5 6.77 6 6.67 6 6.80 6 6.71O
2 5 6.77 6 6.67 6 6.80 6 6.71
1 19 12.94 19 13.03 17 12.95 17 13.06Q
2 19 12.94 19 13.03 17 12.95 17 13.06
1 22 17.54 22 17.67 21 17.43 22 17.57S
2 22 17.54 22 17.67 21 17.43 22 17.57
1 1 2.95 1 2.88 1 2.94 1 2.87U
2 1 2.95 1 2.88 1 2.94 1 2.87
1 9 8.60 9 8.62 9 8.48 9 8.50V
2 9 8.60 9 8.62 9 8.48 9 8.50
FNIR @ FPIR = 10−3
16 0.0094
15 0.0085
4 0.0015
7 0.0018
18 0.0106
12 0.0050
25 0.0536
25 0.0536
24 0.0447
21 0.0333
20 0.0201
19 0.0199
1 0.0013
2 0.0014
13 0.0051
9 0.0033
17 0.0097
14 0.0083
28 0.0783
27 0.0716
11 0.0034
9 0.0033
5 0.0017
2 0.0014
29 0.0860
30 0.2462
23 0.0358
22 0.0351
5 0.0017
8 0.0019
Table 80: Tabulation of enrollment time results for Class C — Ten-Finger Rolled-to-Rolled. Letter refers to the participant’s letter code found on the footerof this page. Sub. # is an identifier used to differentiate between the two submissions each participant could make. Enrollment shows the time used tocreate a fingerprint template to be used in an enrollment set. Search shows the time used to create a search template to be used for a query. All values arereported in seconds, but were originally recorded to microsecond precision. The number to the left of a value provides the value’s column-wise ranking,with the best performance shaded in green and the worst in pink. For reference, the FNIR values from Table 15 are reprinted to the right of this table.
C = afis team D = 3M Cogent E = Neurotechnology F = Papillon G = Dermalog H = Hisign Bio-Info InstituteI = NEC J = Sonda K = Tiger IT L = Innovatrics M = SPEX O = ID SolutionsP = id3 Q = Morpho S = Decatur Industries T = BIO-key U = Aware V = AA Technology

178 FPVTE – FINGERPRINT MATCHING
I Ranked Results
In order to reduce the number of tables in Section 10 of the main body of the report, this appendix contains the tablesshowing ranked results for all three classes. The tables from the main body of the document are repeated in this appendixso there is a complete set of tables here for the reader to analyze.
Class A results are in Tables 81 through 83, Class B results are in Tables 84 through 87, and Class C results are in Tables 88through 89.
C = afis team D = 3M Cogent E = Neurotechnology F = Papillon G = Dermalog H = Hisign Bio-Info InstituteI = NEC J = Sonda K = Tiger IT L = Innovatrics M = SPEX O = ID SolutionsP = id3 Q = Morpho S = Decatur Industries T = BIO-key U = Aware V = AA Technology

FPVTE – FINGERPRINT MATCHING 179
ParticipantFNIR
Identification Search EnrollmentRAM
Letter Sub. # Mean Median Mean Median<
20
seco
nds
D 1 1 0.0197 20 7.52 20 7.32 30 1.57 29 1.43 19 0.61
Q 1 2 0.0222 29 15.90 28 15.70 20 0.57 19 0.54 13 0.34
Q 2 3 0.0226 23 10.42 24 10.43 20 0.57 19 0.54 14 0.34
V 1 4 0.0253 19 6.22 19 6.01 12 0.34 10 0.32 17 0.39
I 1 5 0.0257 22 10.36 22 9.94 29 1.48 30 1.46 20 0.70
L 2 6 0.0351 12 3.34 12 3.32 3 0.17 3 0.15 28 2.32
S 1 7 0.0571 28 15.37 29 16.86 22 0.90 22 0.88 21 0.72
L 1 8 0.0625 2 0.30 2 0.29 1 0.07 1 0.05 26 1.14
T 2 9 0.0685 18 5.96 18 5.97 6 0.33 8 0.31 1 0.01
J 2 10 0.0712 7 1.34 7 1.25 8 0.33 11 0.32 9 0.32
E 2 11 0.0723 30 16.71 30 16.90 13 0.35 13 0.35 24 1.11
E 1 12 0.0745 4 0.57 3 0.35 13 0.35 13 0.35 25 1.12
O 2 13 0.0766 9 1.63 9 1.56 4 0.28 4 0.27 15 0.35
J 1 14 0.0786 3 0.56 4 0.54 8 0.33 11 0.32 9 0.32
O 1 15 0.0818 5 0.64 5 0.62 4 0.28 4 0.27 15 0.35
K 2 16 0.0875 24 10.47 23 10.32 23 1.06 23 1.05 30 3.87
K 1 17 0.0883 25 10.48 25 10.44 23 1.06 23 1.05 29 3.87
F 2 18 0.1082 15 3.78 14 3.56 25 1.11 25 1.07 5 0.18
G 1 19 0.1089 21 9.52 21 9.74 19 0.57 21 0.55 18 0.57
F 1 20 0.1111 11 2.52 11 2.49 25 1.11 25 1.07 6 0.18
U 1 21 0.1218 26 14.72 27 14.42 2 0.16 2 0.15 27 1.70
P 2 22 0.1272 13 3.43 13 3.33 15 0.38 15 0.36 22 0.78
P 1 23 0.1308 8 1.38 8 1.32 15 0.38 15 0.36 23 0.78
C 1 24 0.1335 1 0.29 1 0.26 17 0.41 17 0.39 7 0.18
C 2 25 0.1337 6 0.87 6 0.76 17 0.41 17 0.39 8 0.18
H 1 26 0.1576 14 3.65 15 3.61 10 0.33 6 0.30 11 0.33
H 2 27 0.1607 17 4.26 17 4.13 10 0.33 6 0.30 11 0.33
M 2 28 0.2921 27 15.19 26 10.70 27 1.12 27 1.07 4 0.14
M 1 29 0.2995 10 2.07 10 1.84 27 1.12 27 1.07 3 0.14
T 1 30 NA 16 4.18 16 3.99 6 0.33 8 0.31 2 0.01
≥20
seco
nds
D 2 1 0.0197 2 42.64 3 41.84 5 1.55 5 1.42 3 0.61
V 2 2 0.0252 6 66.23 6 65.35 2 0.34 2 0.32 1 0.39
I 2 3 0.0278 3 43.24 2 40.99 6 2.19 6 2.15 5 1.04
S 2 4 0.0650 4 45.59 4 44.66 4 0.90 4 0.88 4 0.72
G 2 5 0.1086 5 54.24 5 54.03 3 0.57 3 0.55 2 0.57
U 2 6 0.1178 1 25.66 1 24.16 1 0.16 1 0.15 6 1.42
Table 81: Tabulation of ranked results for Class A — Left Index. Submissions were split into two groups. The first group includes submissions thatperformed searches on average in less than 20 seconds, and the second includes those that took, on average, 20 seconds or longer. Letter refers to theparticipant’s letter code found on the footer of this page. Sub. # is an identifier used to differentiate between the two submissions each participant couldmake. The FNIR column was computed at the score threshold that gave FPIR = 10−3. NA indicates that the operations required to produce the valuecould not be performed. The Identification column shows the time used to perform a search over an enrollment set of 100 000, as seen in Table 17. TheSearch Enrollment column shows the time used to create a search template to be used for a query, as seen in Table 72. Identification and Search Enrollmentdurations are reported in seconds, but were originally recorded to microsecond precision. RAM refers to the sum of the resident set sizes of the stageone identification processes over all compute nodes after returning from the identification stage one initialization method, as seen in Table 60. RAM isreported in gigabytes, where 1 GB is equal to 1 073 741 824 bytes. The number to the left of a value provides the value’s column-wise ranking, with thebest performance shaded in green and the worst in pink. The table is sorted on the FNIR column-wise ranking.
C = afis team D = 3M Cogent E = Neurotechnology F = Papillon G = Dermalog H = Hisign Bio-Info InstituteI = NEC J = Sonda K = Tiger IT L = Innovatrics M = SPEX O = ID SolutionsP = id3 Q = Morpho S = Decatur Industries T = BIO-key U = Aware V = AA Technology
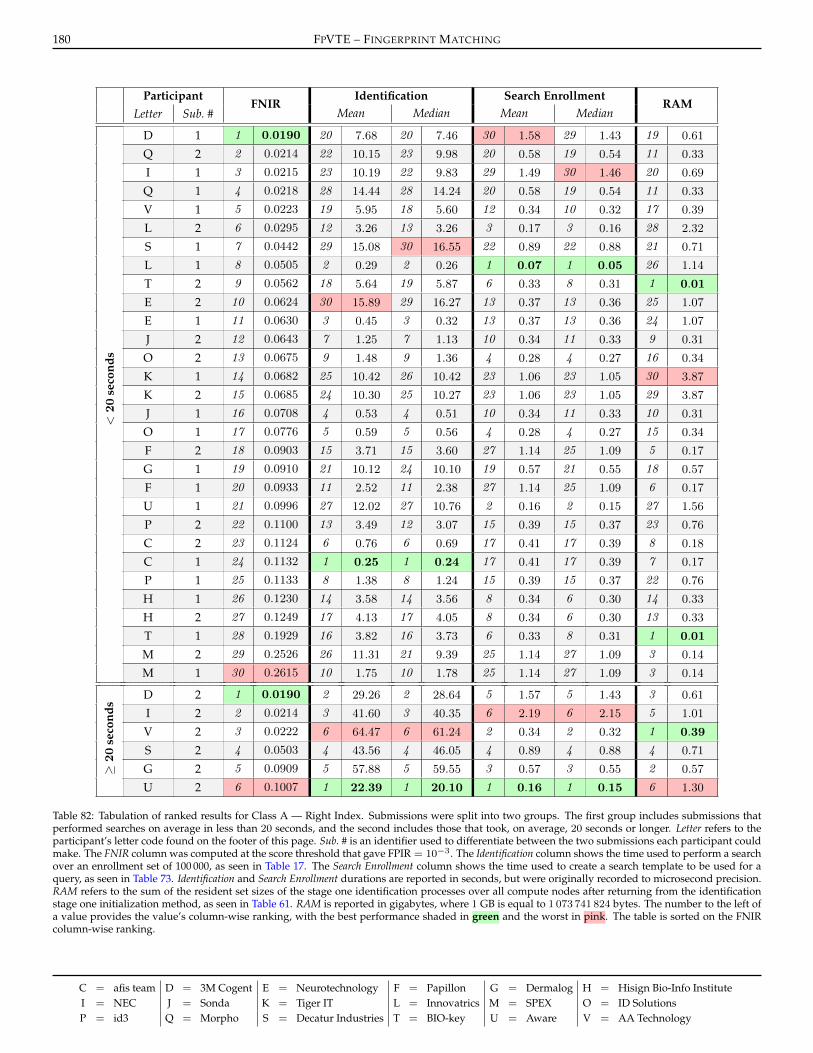
180 FPVTE – FINGERPRINT MATCHING
ParticipantFNIR
Identification Search EnrollmentRAM
Letter Sub. # Mean Median Mean Median<
20
seco
nds
D 1 1 0.0190 20 7.68 20 7.46 30 1.58 29 1.43 19 0.61
Q 2 2 0.0214 22 10.15 23 9.98 20 0.58 19 0.54 11 0.33
I 1 3 0.0215 23 10.19 22 9.83 29 1.49 30 1.46 20 0.69
Q 1 4 0.0218 28 14.44 28 14.24 20 0.58 19 0.54 11 0.33
V 1 5 0.0223 19 5.95 18 5.60 12 0.34 10 0.32 17 0.39
L 2 6 0.0295 12 3.26 13 3.26 3 0.17 3 0.16 28 2.32
S 1 7 0.0442 29 15.08 30 16.55 22 0.89 22 0.88 21 0.71
L 1 8 0.0505 2 0.29 2 0.26 1 0.07 1 0.05 26 1.14
T 2 9 0.0562 18 5.64 19 5.87 6 0.33 8 0.31 1 0.01
E 2 10 0.0624 30 15.89 29 16.27 13 0.37 13 0.36 25 1.07
E 1 11 0.0630 3 0.45 3 0.32 13 0.37 13 0.36 24 1.07
J 2 12 0.0643 7 1.25 7 1.13 10 0.34 11 0.33 9 0.31
O 2 13 0.0675 9 1.48 9 1.36 4 0.28 4 0.27 16 0.34
K 1 14 0.0682 25 10.42 26 10.42 23 1.06 23 1.05 30 3.87
K 2 15 0.0685 24 10.30 25 10.27 23 1.06 23 1.05 29 3.87
J 1 16 0.0708 4 0.53 4 0.51 10 0.34 11 0.33 10 0.31
O 1 17 0.0776 5 0.59 5 0.56 4 0.28 4 0.27 15 0.34
F 2 18 0.0903 15 3.71 15 3.60 27 1.14 25 1.09 5 0.17
G 1 19 0.0910 21 10.12 24 10.10 19 0.57 21 0.55 18 0.57
F 1 20 0.0933 11 2.52 11 2.38 27 1.14 25 1.09 6 0.17
U 1 21 0.0996 27 12.02 27 10.76 2 0.16 2 0.15 27 1.56
P 2 22 0.1100 13 3.49 12 3.07 15 0.39 15 0.37 23 0.76
C 2 23 0.1124 6 0.76 6 0.69 17 0.41 17 0.39 8 0.18
C 1 24 0.1132 1 0.25 1 0.24 17 0.41 17 0.39 7 0.17
P 1 25 0.1133 8 1.38 8 1.24 15 0.39 15 0.37 22 0.76
H 1 26 0.1230 14 3.58 14 3.56 8 0.34 6 0.30 14 0.33
H 2 27 0.1249 17 4.13 17 4.05 8 0.34 6 0.30 13 0.33
T 1 28 0.1929 16 3.82 16 3.73 6 0.33 8 0.31 1 0.01
M 2 29 0.2526 26 11.31 21 9.39 25 1.14 27 1.09 3 0.14
M 1 30 0.2615 10 1.75 10 1.78 25 1.14 27 1.09 3 0.14
≥20
seco
nds
D 2 1 0.0190 2 29.26 2 28.64 5 1.57 5 1.43 3 0.61
I 2 2 0.0214 3 41.60 3 40.35 6 2.19 6 2.15 5 1.01
V 2 3 0.0222 6 64.47 6 61.24 2 0.34 2 0.32 1 0.39
S 2 4 0.0503 4 43.56 4 46.05 4 0.89 4 0.88 4 0.71
G 2 5 0.0909 5 57.88 5 59.55 3 0.57 3 0.55 2 0.57
U 2 6 0.1007 1 22.39 1 20.10 1 0.16 1 0.15 6 1.30
Table 82: Tabulation of ranked results for Class A — Right Index. Submissions were split into two groups. The first group includes submissions thatperformed searches on average in less than 20 seconds, and the second includes those that took, on average, 20 seconds or longer. Letter refers to theparticipant’s letter code found on the footer of this page. Sub. # is an identifier used to differentiate between the two submissions each participant couldmake. The FNIR column was computed at the score threshold that gave FPIR = 10−3. The Identification column shows the time used to perform a searchover an enrollment set of 100 000, as seen in Table 17. The Search Enrollment column shows the time used to create a search template to be used for aquery, as seen in Table 73. Identification and Search Enrollment durations are reported in seconds, but were originally recorded to microsecond precision.RAM refers to the sum of the resident set sizes of the stage one identification processes over all compute nodes after returning from the identificationstage one initialization method, as seen in Table 61. RAM is reported in gigabytes, where 1 GB is equal to 1 073 741 824 bytes. The number to the left ofa value provides the value’s column-wise ranking, with the best performance shaded in green and the worst in pink. The table is sorted on the FNIRcolumn-wise ranking.
C = afis team D = 3M Cogent E = Neurotechnology F = Papillon G = Dermalog H = Hisign Bio-Info InstituteI = NEC J = Sonda K = Tiger IT L = Innovatrics M = SPEX O = ID SolutionsP = id3 Q = Morpho S = Decatur Industries T = BIO-key U = Aware V = AA Technology

FPVTE – FINGERPRINT MATCHING 181
ParticipantFNIR
Identification Search EnrollmentRAM
Letter Sub. # Mean Median Mean Median<
20
seco
nds
V 1 1 0.0034 5 9.50 5 9.29 4 0.68 3 0.64 5 11.77
I 1 2 0.0058 9 18.92 8 17.87 9 2.96 9 2.93 6 15.83
J 1 3 0.0143 6 14.00 6 13.64 3 0.66 4 0.65 3 8.30
L 1 4 0.0146 1 2.20 2 2.19 1 0.11 1 0.11 8 18.76
O 1 5 0.0229 7 15.34 7 14.46 2 0.55 2 0.53 4 9.05
K 1 6 0.0360 8 18.32 9 18.01 8 2.11 8 2.09 9 61.81
C 1 7 0.0368 2 2.39 1 2.08 5 0.80 5 0.78 2 4.87
C 2 8 0.0374 4 6.34 4 6.35 5 0.80 5 0.78 1 4.87
G 1 9 0.0515 3 6.27 3 5.22 7 1.13 7 1.09 7 16.38
≥20
seco
nds
Q 1 1 0.0027 21 213.08 21 212.69 16 1.13 15 1.08 10 9.14
Q 2 1 0.0027 19 163.65 19 161.02 16 1.13 15 1.08 9 9.14
V 2 3 0.0028 18 133.45 18 127.65 10 0.68 9 0.64 13 11.77
I 2 4 0.0030 25 385.14 25 338.88 27 4.37 27 4.30 21 30.83
D 2 4 0.0030 23 234.52 23 237.43 26 3.12 26 2.84 17 18.58
D 1 4 0.0030 16 73.01 15 70.99 25 3.10 25 2.84 17 18.58
L 2 7 0.0072 3 23.54 3 23.42 3 0.33 3 0.31 26 53.98
J 2 8 0.0143 7 36.19 7 33.35 9 0.66 10 0.65 7 8.30
S 2 9 0.0195 26 429.02 26 495.50 18 1.77 18 1.75 14 14.82
E 2 10 0.0202 27 500.30 27 518.11 11 0.70 11 0.70 23 33.41
E 1 11 0.0207 2 22.27 1 16.35 11 0.70 11 0.70 22 33.40
O 2 12 0.0214 10 45.52 10 43.53 4 0.55 4 0.53 8 9.05
S 1 13 0.0281 1 20.11 2 23.00 18 1.77 18 1.75 14 14.82
K 2 14 0.0286 6 32.68 6 32.93 20 2.11 20 2.09 27 61.81
G 2 15 0.0311 22 227.27 22 221.16 15 1.13 17 1.09 16 16.38
P 2 16 0.0333 17 114.37 17 101.16 13 0.77 13 0.72 19 21.41
U 1 17 0.0336 11 47.60 11 45.51 1 0.30 1 0.30 25 44.63
U 2 18 0.0358 24 252.04 24 240.40 1 0.30 1 0.30 24 37.35
T 2 19 0.0366 9 38.91 9 37.23 5 0.65 7 0.62 1 0.01
P 1 20 0.0370 14 63.41 14 63.65 13 0.77 13 0.72 20 21.42
F 1 21 0.0386 13 59.30 13 60.66 21 2.23 21 2.15 5 4.86
F 2 22 0.0412 15 71.45 16 73.95 21 2.23 21 2.15 5 4.86
H 2 23 0.0684 12 53.77 12 52.25 7 0.66 5 0.60 11 9.36
H 1 24 0.0686 8 37.65 8 36.71 7 0.66 5 0.60 12 9.36
M 2 25 NA 20 183.20 20 171.24 23 2.25 23 2.16 4 3.76
M 1 26 NA 5 32.59 5 31.44 23 2.25 23 2.16 3 3.75
T 1 27 NA 4 26.96 4 25.68 5 0.65 7 0.62 1 0.01
Table 83: Tabulation of ranked results for Class A — Left and Right Index. Submissions were split into two groups. The first group includes submissionsthat performed searches on average in less than 20 seconds, and the second includes those that took, on average, 20 seconds or longer. Letter refers to theparticipant’s letter code found on the footer of this page. Sub. # is an identifier used to differentiate between the two submissions each participant couldmake. The FNIR column was computed at the score threshold that gave FPIR = 10−3. NA indicates that the operations required to produce the valuecould not be performed. The Identification column shows the time used to perform a search over an enrollment set of 1 600 000, as seen in Table 18. TheSearch Enrollment column shows the time used to create a search template to be used for a query, as seen in Table 74. Identification and Search Enrollmentdurations are reported in seconds, but were originally recorded to microsecond precision. RAM refers to the sum of the resident set sizes of the stageone identification processes over all compute nodes after returning from the identification stage one initialization method, as seen in Table 62. RAM isreported in gigabytes, where 1 GB is equal to 1 073 741 824 bytes. The number to the left of a value provides the value’s column-wise ranking, with thebest performance shaded in green and the worst in pink. The table is sorted on the FNIR column-wise ranking.
C = afis team D = 3M Cogent E = Neurotechnology F = Papillon G = Dermalog H = Hisign Bio-Info InstituteI = NEC J = Sonda K = Tiger IT L = Innovatrics M = SPEX O = ID SolutionsP = id3 Q = Morpho S = Decatur Industries T = BIO-key U = Aware V = AA Technology

182 FPVTE – FINGERPRINT MATCHING
ParticipantFNIR
Identification Search EnrollmentRAM
Letter Sub. # Mean Median Mean Median
I 2 1 0.0094 18 51.59 13 38.26 30 7.68 30 7.67 21 108.71
Q 1 2 0.0098 17 51.33 19 53.24 20 3.41 20 3.41 1 7.54
Q 2 3 0.0099 16 51.05 20 54.02 20 3.41 20 3.41 2 7.54
I 1 4 0.0116 23 63.06 21 55.96 25 6.50 25 6.50 5 49.68
D 2 5 0.0142 21 59.65 22 58.10 24 4.18 24 4.17 12 79.43
D 1 6 0.0163 20 53.09 18 52.23 14 2.16 14 2.15 13 79.43
E 2 7 0.0187 12 41.57 10 34.37 15 2.21 15 2.21 28 318.03
V 2 8 0.0190 14 48.01 15 47.97 3 1.21 7 1.22 9 63.53
V 1 9 0.0192 10 36.28 11 36.07 3 1.21 7 1.22 8 63.53
J 2 10 0.0236 27 80.54 27 74.38 7 1.22 3 1.21 19 101.00
O 2 11 0.0254 24 78.80 26 73.15 5 1.22 5 1.21 18 101.00
O 1 12 0.0257 11 38.17 12 37.01 5 1.22 5 1.21 17 101.00
E 1 13 0.0259 1 3.71 1 2.82 11 1.95 11 1.95 14 79.72
L 2 14 0.0276 5 12.52 5 12.37 1 0.33 1 0.33 27 177.49
J 1 15 0.0287 7 26.88 7 25.61 7 1.22 3 1.21 20 101.00
L 1 16 0.0288 3 5.51 3 5.56 2 1.13 2 1.11 22 119.79
G 2 17 0.0325 22 62.98 23 59.49 18 2.81 18 2.83 25 156.12
G 1 18 0.0371 6 19.65 6 16.24 18 2.81 18 2.83 26 156.12
U 2 19 0.0461 29 90.50 30 89.07 16 2.45 16 2.41 30 540.60
U 1 20 0.0500 28 81.85 28 80.03 17 2.46 17 2.42 29 440.67
C 2 21 0.0647 4 6.62 4 6.74 12 2.13 12 2.12 4 46.49
C 1 22 0.0654 2 3.71 2 3.74 12 2.13 12 2.12 3 46.49
H 1 23 0.0998 15 49.13 16 49.75 9 1.68 9 1.67 16 86.46
H 2 24 0.1008 19 52.05 17 51.77 9 1.68 9 1.67 15 86.46
S 1 25 0.1089 25 78.95 24 71.69 22 3.97 22 3.96 24 150.35
S 2 26 0.1133 26 79.01 25 71.77 22 3.97 22 3.96 23 150.35
M 2 27 0.1634 30 90.51 29 87.21 26 6.94 28 6.73 7 57.53
F 2 28 0.1681 13 46.18 14 43.59 28 6.94 26 6.73 10 77.02
F 1 29 0.1684 8 31.92 8 30.09 28 6.94 26 6.73 11 77.02
M 1 30 0.1736 9 32.39 9 31.17 26 6.94 28 6.73 6 57.53
Table 84: Tabulation of ranked results for Class B — Left Slap. Letter refers to the participant’s letter code found on the footer of this page. Sub. # isan identifier used to differentiate between the two submissions each participant could make. The FNIR column was computed at the score thresholdthat gave FPIR = 10−3. The Identification column shows the time used to perform a search over an enrollment set of 3 000 000, as seen in Table 19. TheSearch Enrollment column shows the time used to create a search template to be used for a query, as seen in Table 75. Identification and Search Enrollmentdurations are reported in seconds, but were originally recorded to microsecond precision. RAM refers to the sum of the resident set sizes of the stageone identification processes over all compute nodes after returning from the identification stage one initialization method, as seen in Table 63. RAM isreported in gigabytes, where 1 GB is equal to 1 073 741 824 bytes. The number to the left of a value provides the value’s column-wise ranking, with thebest performance shaded in green and the worst in pink. The table is sorted on the FNIR column-wise ranking.
C = afis team D = 3M Cogent E = Neurotechnology F = Papillon G = Dermalog H = Hisign Bio-Info InstituteI = NEC J = Sonda K = Tiger IT L = Innovatrics M = SPEX O = ID SolutionsP = id3 Q = Morpho S = Decatur Industries T = BIO-key U = Aware V = AA Technology

FPVTE – FINGERPRINT MATCHING 183
ParticipantFNIR
Identification Search EnrollmentRAM
Letter Sub. # Mean Median Mean Median
I 2 1 0.0045 16 49.18 14 41.13 30 7.65 30 7.65 21 108.71
D 2 2 0.0052 20 58.67 21 57.19 24 4.15 24 4.13 12 79.43
Q 1 3 0.0057 22 62.95 23 64.04 20 3.41 20 3.41 1 7.54
Q 2 3 0.0057 21 61.29 22 61.94 20 3.41 20 3.41 2 7.54
I 1 5 0.0058 23 63.57 20 55.87 25 6.47 25 6.47 5 49.68
D 1 6 0.0072 19 53.78 19 53.32 14 2.15 14 2.14 13 79.43
E 2 7 0.0083 12 40.27 10 34.47 15 2.18 15 2.18 28 318.00
V 1 8 0.0106 10 35.66 11 35.43 3 1.19 3 1.19 8 63.53
V 2 9 0.0110 15 48.47 16 48.51 3 1.19 3 1.19 9 63.53
J 2 10 0.0126 27 77.67 27 74.09 5 1.21 5 1.20 19 101.00
O 2 11 0.0132 26 77.37 26 73.93 7 1.21 7 1.20 20 101.00
O 1 12 0.0142 11 38.08 12 35.61 7 1.21 7 1.20 17 101.00
E 1 13 0.0151 2 4.68 1 2.97 11 1.92 11 1.91 14 79.72
J 1 14 0.0156 7 25.86 7 24.14 5 1.21 5 1.20 18 101.00
L 1 15 0.0167 3 5.49 3 5.47 2 1.12 2 1.11 22 119.78
G 2 16 0.0198 13 41.12 13 37.28 18 2.76 18 2.78 25 156.12
L 2 17 0.0202 6 12.66 6 12.66 1 0.33 1 0.33 27 177.49
G 1 18 0.0212 5 11.80 5 10.13 18 2.76 18 2.78 26 156.12
U 1 19 0.0266 29 89.71 30 89.26 16 2.43 16 2.39 29 440.67
U 2 20 0.0273 28 88.88 28 80.11 17 2.43 17 2.39 30 540.59
S 1 21 0.0369 25 74.29 24 70.54 22 3.89 22 3.88 23 150.35
S 2 22 0.0381 24 73.96 25 70.84 22 3.89 22 3.88 24 150.35
C 2 23 0.0392 4 6.54 4 6.50 12 2.10 12 2.09 3 46.49
C 1 24 0.0403 1 3.70 2 3.67 12 2.10 12 2.09 4 46.49
H 1 25 0.0641 17 50.97 17 50.16 9 1.64 9 1.63 16 86.46
H 2 26 0.0647 18 52.86 18 52.84 9 1.64 9 1.63 15 86.46
M 2 27 0.1155 30 91.42 29 87.41 28 6.88 28 6.69 6 57.53
F 2 28 0.1220 14 46.58 15 45.92 26 6.86 26 6.68 10 77.02
F 1 29 0.1222 8 32.28 8 31.87 26 6.86 26 6.68 11 77.02
M 1 30 0.1259 9 33.43 9 32.03 28 6.88 28 6.69 7 57.53
Table 85: Tabulation of ranked results for Class B — Right Slap. Letter refers to the participant’s letter code found on the footer of this page. Sub. # isan identifier used to differentiate between the two submissions each participant could make. The FNIR column was computed at the score thresholdthat gave FPIR = 10−3. The Identification column shows the time used to perform a search over an enrollment set of 3 000 000, as seen in Table 19. TheSearch Enrollment column shows the time used to create a search template to be used for a query, as seen in Table 76. Identification and Search Enrollmentdurations are reported in seconds, but were originally recorded to microsecond precision. RAM refers to the sum of the resident set sizes of the stageone identification processes over all compute nodes after returning from the identification stage one initialization method, as seen in Table 63. RAM isreported in gigabytes, where 1 GB is equal to 1 073 741 824 bytes. The number to the left of a value provides the value’s column-wise ranking, with thebest performance shaded in green and the worst in pink. The table is sorted on the FNIR column-wise ranking.
C = afis team D = 3M Cogent E = Neurotechnology F = Papillon G = Dermalog H = Hisign Bio-Info InstituteI = NEC J = Sonda K = Tiger IT L = Innovatrics M = SPEX O = ID SolutionsP = id3 Q = Morpho S = Decatur Industries T = BIO-key U = Aware V = AA Technology

184 FPVTE – FINGERPRINT MATCHING
ParticipantFNIR
Identification Search EnrollmentRAM
Letter Sub. # Mean Median Mean Median
I 2 1 0.0015 19 57.94 17 46.13 30 15.30 30 15.33 21 108.71
Q 1 2 0.0021 20 63.99 22 65.02 20 6.84 20 6.84 2 7.54
Q 2 3 0.0022 18 53.88 19 53.40 20 6.84 20 6.84 1 7.54
I 1 3 0.0022 15 47.35 13 37.19 25 12.94 25 12.96 5 49.68
D 2 5 0.0024 24 74.21 21 63.05 24 8.31 24 8.28 13 79.43
D 1 6 0.0031 21 69.35 20 61.24 14 4.29 14 4.28 12 79.43
V 1 7 0.0036 11 39.24 15 38.93 3 2.40 7 2.40 9 63.53
V 2 7 0.0036 17 52.97 18 52.80 3 2.40 7 2.40 8 63.53
J 2 9 0.0047 26 75.92 24 69.28 7 2.42 5 2.40 17 101.00
E 2 10 0.0049 12 39.56 10 33.09 15 4.39 15 4.38 28 317.99
O 2 11 0.0051 25 74.57 23 68.46 5 2.42 3 2.40 19 101.00
L 1 12 0.0054 4 10.37 4 10.48 2 2.24 2 2.23 22 119.77
O 1 13 0.0057 13 40.42 14 38.34 5 2.42 3 2.40 20 101.00
L 2 14 0.0062 6 20.85 6 20.78 1 0.66 1 0.66 27 177.49
E 1 15 0.0063 3 8.18 2 6.12 11 3.86 11 3.85 14 79.72
J 1 16 0.0068 7 27.52 7 26.15 7 2.42 5 2.40 18 101.00
G 2 17 0.0084 14 42.86 11 34.55 18 5.59 18 5.62 25 156.12
G 1 18 0.0106 1 5.52 1 3.89 18 5.59 18 5.62 26 156.12
U 2 19 0.0124 30 91.04 28 82.40 16 4.89 17 4.83 30 540.59
U 1 20 0.0139 29 86.88 30 83.62 17 4.91 16 4.82 29 440.67
S 1 21 0.0160 28 85.05 29 83.33 22 7.82 22 7.83 23 150.35
S 2 22 0.0190 27 84.02 27 82.13 22 7.82 22 7.83 24 150.35
H 1 23 0.0349 22 70.12 25 70.38 9 3.31 9 3.31 16 86.46
H 2 24 0.0361 23 72.35 26 73.06 9 3.31 9 3.31 15 86.46
M 2 25 0.0882 16 49.50 16 45.91 28 13.79 28 13.53 6 57.53
F 2 26 0.0901 10 38.37 12 36.36 26 13.78 26 13.49 11 77.02
M 1 27 0.0904 9 28.89 8 27.15 28 13.79 28 13.53 7 57.53
F 1 28 0.0910 8 28.72 9 27.27 26 13.78 26 13.49 10 77.02
C 2 29 NA 5 10.63 5 10.70 12 4.22 12 4.20 4 46.49
C 1 30 NA 2 7.36 3 6.40 12 4.22 12 4.20 3 46.49
Table 86: Tabulation of ranked results for Class B — Left and Right Slap. Letter refers to the participant’s letter code found on the footer of this page. Sub.# is an identifier used to differentiate between the two submissions each participant could make. The FNIR column was computed at the score thresholdthat gave FPIR = 10−3. NA indicates that the operations required to produce the value could not be performed. The Identification column shows thetime used to perform a search over an enrollment set of 3 000 000, as seen in Table 19. The Search Enrollment column shows the time used to create asearch template to be used for a query, as seen in Table 77. Identification and Search Enrollment durations are reported in seconds, but were originallyrecorded to microsecond precision. RAM refers to the sum of the resident set sizes of the stage one identification processes over all compute nodes afterreturning from the identification stage one initialization method, as seen in Table 63. RAM is reported in gigabytes, where 1 GB is equal to 1 073 741 824bytes. The number to the left of a value provides the value’s column-wise ranking, with the best performance shaded in green and the worst in pink.The table is sorted on the FNIR column-wise ranking.
C = afis team D = 3M Cogent E = Neurotechnology F = Papillon G = Dermalog H = Hisign Bio-Info InstituteI = NEC J = Sonda K = Tiger IT L = Innovatrics M = SPEX O = ID SolutionsP = id3 Q = Morpho S = Decatur Industries T = BIO-key U = Aware V = AA Technology

FPVTE – FINGERPRINT MATCHING 185
ParticipantFNIR
Identification Search EnrollmentRAM
Letter Sub. # Mean Median Mean Median
I 2 1 0.0009 20 60.01 16 43.86 30 19.36 30 19.36 21 108.71
Q 1 2 0.0012 14 48.85 14 42.92 20 8.89 20 8.92 1 7.54
Q 2 2 0.0012 24 71.67 24 66.01 20 8.89 20 8.92 2 7.54
I 1 2 0.0012 6 24.57 7 19.07 25 16.50 25 16.52 5 49.68
D 2 2 0.0012 19 54.37 18 46.70 24 11.90 24 11.86 13 79.43
D 1 6 0.0020 17 52.42 17 45.15 17 6.19 17 6.16 12 79.43
V 2 7 0.0024 15 49.72 19 49.30 3 3.35 7 3.36 9 63.53
E 2 7 0.0024 18 52.88 15 43.61 16 5.95 16 5.93 28 317.95
V 1 9 0.0027 10 35.51 10 34.96 3 3.35 7 3.36 8 63.53
L 1 10 0.0031 5 14.42 5 14.50 2 3.05 2 3.05 22 119.79
L 2 11 0.0033 8 28.56 9 28.59 1 0.88 1 0.88 27 177.48
J 2 11 0.0033 22 64.38 22 60.13 7 3.38 3 3.35 17 101.00
O 2 13 0.0035 21 63.87 21 60.02 5 3.38 5 3.36 20 101.00
G 2 14 0.0040 9 31.67 6 16.26 18 7.89 18 7.90 26 156.12
O 1 15 0.0041 11 37.04 11 35.64 5 3.38 5 3.36 19 101.00
E 1 16 0.0043 2 8.76 2 6.76 13 5.35 13 5.34 14 79.73
J 1 17 0.0049 7 26.31 8 25.38 7 3.38 3 3.35 18 101.00
G 1 18 0.0062 1 6.33 1 4.26 18 7.89 18 7.90 25 156.12
U 1 19 0.0099 30 88.83 28 86.60 15 5.90 15 5.82 29 440.68
S 1 20 0.0108 28 86.50 29 87.60 22 10.24 22 10.31 24 150.35
S 2 21 0.0136 29 88.70 30 88.46 22 10.24 22 10.31 23 150.35
U 2 22 0.0141 25 80.14 25 75.28 14 5.80 14 5.73 30 540.60
H 1 23 0.0203 26 82.43 26 82.66 9 4.37 9 4.37 15 86.46
H 2 24 0.0204 27 85.74 27 86.56 9 4.37 9 4.37 16 86.46
M 2 25 0.0515 23 70.45 23 65.91 26 18.36 28 18.11 6 57.53
M 1 26 0.0543 13 41.37 13 38.87 26 18.36 28 18.11 6 57.53
F 1 27 0.0591 12 39.12 12 37.56 28 18.36 26 18.07 10 77.02
F 2 27 0.0591 16 51.59 20 49.34 28 18.36 26 18.07 10 77.02
C 2 29 NA 4 10.28 4 10.21 11 5.16 11 5.13 4 46.49
C 1 30 NA 3 9.00 3 7.92 11 5.16 11 5.13 3 46.49
Table 87: Tabulation of ranked results for Class B — Identification Flats. Letter refers to the participant’s letter code found on the footer of this page. Sub.# is an identifier used to differentiate between the two submissions each participant could make. The FNIR column was computed at the score thresholdthat gave FPIR = 10−3. NA indicates that the operations required to produce the value could not be performed. The Identification column shows thetime used to perform a search over an enrollment set of 3 000 000, as seen in Table 19. The Search Enrollment column shows the time used to create asearch template to be used for a query, as seen in Table 78. Identification and Search Enrollment durations are reported in seconds, but were originallyrecorded to microsecond precision. RAM refers to the sum of the resident set sizes of the stage one identification processes over all compute nodes afterreturning from the identification stage one initialization method, as seen in Table 63. RAM is reported in gigabytes, where 1 GB is equal to 1 073 741 824bytes. The number to the left of a value provides the value’s column-wise ranking, with the best performance shaded in green and the worst in pink.The table is sorted on the FNIR column-wise ranking.
C = afis team D = 3M Cogent E = Neurotechnology F = Papillon G = Dermalog H = Hisign Bio-Info InstituteI = NEC J = Sonda K = Tiger IT L = Innovatrics M = SPEX O = ID SolutionsP = id3 Q = Morpho S = Decatur Industries T = BIO-key U = Aware V = AA Technology

186 FPVTE – FINGERPRINT MATCHING
ParticipantFNIR
Identification Search EnrollmentRAM
Letter Sub. # Mean Median Mean Median
I 2 1 0.0010 15 56.93 10 38.28 30 17.04 30 16.99 11 110.22
Q 1 2 0.0011 10 44.75 9 36.86 20 9.14 20 9.11 2 13.33
D 2 2 0.0011 25 84.92 26 74.36 24 13.69 24 13.66 15 132.37
Q 2 4 0.0013 9 43.67 8 35.35 20 9.14 20 9.11 1 13.33
I 1 4 0.0013 23 79.70 16 52.41 29 16.71 29 16.67 4 84.42
D 1 6 0.0015 28 87.07 25 73.93 17 7.12 17 7.10 16 132.37
V 1 7 0.0024 13 47.76 14 47.02 7 3.69 7 3.66 13 121.80
V 2 7 0.0024 17 63.19 19 62.26 7 3.69 7 3.66 12 121.79
O 1 9 0.0025 21 73.31 23 68.54 4 3.63 3 3.61 19 181.00
O 2 10 0.0027 24 82.13 24 73.41 4 3.63 3 3.61 22 181.00
J 2 10 0.0027 26 85.17 28 77.75 6 3.64 6 3.62 21 181.00
J 1 12 0.0047 12 46.32 12 43.57 3 3.62 5 3.62 20 181.00
E 2 13 0.0048 27 85.50 17 52.91 12 5.21 12 5.20 28 573.25
E 1 14 0.0088 2 15.94 2 12.77 11 5.20 11 5.20 14 127.39
L 2 15 0.0095 6 21.26 6 23.53 1 3.51 1 3.48 27 274.95
L 1 16 0.0102 3 17.53 3 17.51 1 3.51 1 3.48 23 192.19
U 2 17 0.0155 20 67.98 22 68.30 15 6.13 15 5.91 29 811.45
U 1 18 0.0163 22 75.14 27 74.94 15 6.13 15 5.91 29 811.45
H 2 19 0.0275 18 64.90 20 65.36 9 5.16 9 5.16 18 144.02
G 2 20 0.0276 7 37.15 7 23.69 18 8.35 18 8.32 26 274.35
H 1 20 0.0276 19 67.91 21 68.07 9 5.16 9 5.16 17 144.02
S 1 22 0.0311 29 87.76 29 86.56 22 10.91 22 10.87 24 260.37
G 1 23 0.0368 1 11.21 1 7.71 18 8.35 18 8.32 25 274.35
C 2 24 0.0711 4 18.31 5 18.38 13 5.84 13 5.80 10 92.86
F 1 25 0.0734 14 50.99 15 51.69 27 15.96 27 15.87 7 90.93
F 2 25 0.0734 16 60.34 18 60.86 27 15.96 27 15.87 6 90.93
M 2 27 0.0826 11 45.96 13 46.70 25 15.91 25 15.83 8 90.93
M 1 28 0.0934 8 42.60 11 43.37 25 15.91 25 15.83 5 90.93
S 2 29 0.1680 30 89.24 30 91.74 22 10.91 22 10.87 3 61.04
C 1 30 NA 5 21.04 4 18.30 13 5.84 13 5.80 9 92.86
Table 88: Tabulation of ranked results for Class C — Ten-Finger Plain-to-Plain. Letter refers to the participant’s letter code found on the footer of thispage. Sub. # is an identifier used to differentiate between the two submissions each participant could make. The FNIR column was computed at the scorethreshold that gave FPIR = 10−3. NA indicates that the operations required to produce the value could not be performed. The Identification columnshows the time used to perform a search over an enrollment set of 5 000 000, as seen in Table 20. The Search Enrollment column shows the time usedto create a search template to be used for a query, as seen in Table 79. Identification and Search Enrollment durations are reported in seconds, but wereoriginally recorded to microsecond precision. RAM refers to the sum of the resident set sizes of the stage one identification processes over all computenodes after returning from the identification stage one initialization method, as seen in Table 64. RAM is reported in gigabytes, where 1 GB is equal to1 073 741 824 bytes. The number to the left of a value provides the value’s column-wise ranking, with the best performance shaded in green and theworst in pink. The table is sorted on the FNIR column-wise ranking.
C = afis team D = 3M Cogent E = Neurotechnology F = Papillon G = Dermalog H = Hisign Bio-Info InstituteI = NEC J = Sonda K = Tiger IT L = Innovatrics M = SPEX O = ID SolutionsP = id3 Q = Morpho S = Decatur Industries T = BIO-key U = Aware V = AA Technology

FPVTE – FINGERPRINT MATCHING 187
ParticipantFNIR
Identification Search EnrollmentRAM
Letter Sub. # Mean Median Mean Median
I 1 1 0.0013 24 79.04 15 54.56 25 20.21 25 20.23 4 113.80
Q 2 2 0.0014 27 83.35 25 74.22 17 12.95 17 13.06 2 20.22
I 2 2 0.0014 9 40.53 7 30.82 24 18.72 24 18.73 11 137.03
D 1 4 0.0015 17 65.97 17 58.92 23 17.44 21 17.39 10 132.40
Q 1 5 0.0017 26 83.25 26 74.40 17 12.95 17 13.06 1 20.22
V 1 5 0.0017 10 40.94 10 40.74 9 8.48 9 8.50 17 234.03
D 2 7 0.0018 30 86.39 27 74.97 30 30.43 30 30.47 9 132.37
V 2 8 0.0019 16 65.47 18 65.07 9 8.48 9 8.50 18 234.03
O 2 9 0.0033 19 72.55 21 69.30 6 6.80 6 6.71 23 303.13
J 2 9 0.0033 20 72.62 19 67.98 8 6.82 8 6.74 24 303.13
O 1 11 0.0034 15 59.01 14 54.42 6 6.80 6 6.71 25 303.13
E 2 12 0.0050 14 57.02 11 42.73 11 9.89 11 9.91 30 930.48
J 1 13 0.0051 8 36.09 9 33.02 5 6.78 5 6.69 22 303.13
L 2 14 0.0083 3 19.52 5 20.25 3 4.36 3 4.36 26 367.82
C 2 15 0.0085 5 25.91 6 21.97 13 10.79 13 10.69 15 183.36
C 1 16 0.0094 4 25.25 4 20.15 13 10.79 13 10.69 14 183.36
L 1 17 0.0097 7 31.42 8 31.68 3 4.36 3 4.36 21 280.49
E 1 18 0.0106 1 9.52 2 8.63 12 9.90 12 9.92 16 191.66
H 2 19 0.0199 29 84.26 29 84.50 15 12.08 15 12.17 12 144.02
H 1 20 0.0201 28 84.14 30 84.51 15 12.08 15 12.17 13 144.02
G 2 21 0.0333 6 30.61 3 19.46 19 15.55 19 15.50 19 261.29
U 2 22 0.0351 23 74.39 24 72.48 1 2.94 1 2.87 28 806.17
U 1 23 0.0358 25 82.76 28 82.61 1 2.94 1 2.87 28 806.17
G 1 24 0.0447 2 11.67 1 7.78 19 15.55 19 15.50 20 261.29
F 1 25 0.0536 13 55.63 16 55.79 28 21.07 28 20.92 7 130.29
F 2 25 0.0536 18 68.61 20 68.20 28 21.07 28 20.92 6 130.29
M 2 27 0.0716 12 48.71 13 48.80 26 21.02 26 20.89 5 130.29
M 1 28 0.0783 11 47.38 12 48.08 26 21.02 26 20.89 8 130.29
S 1 29 0.0860 22 74.01 22 69.71 21 17.43 22 17.57 27 382.88
S 2 30 0.2462 21 72.95 23 70.77 21 17.43 22 17.57 3 78.28
Table 89: Tabulation of ranked results for Class C — Ten-Finger Rolled-to-Rolled. Letter refers to the participant’s letter code found on the footer of thispage. Sub. # is an identifier used to differentiate between the two submissions each participant could make. The FNIR column was computed at thescore threshold that gave FPIR = 10−3. The Identification column shows the time used to perform a search over an enrollment set of 5 000 000, as seenin Table 20. The Search Enrollment column shows the time used to create a search template to be used for a query, as seen in Table 80. Identification andSearch Enrollment durations are reported in seconds, but were originally recorded to microsecond precision. RAM refers to the sum of the resident setsizes of the stage one identification processes over all compute nodes after returning from the identification stage one initialization method, as seen inTable 65. RAM is reported in gigabytes, where 1 GB is equal to 1 073 741 824 bytes. The number to the left of a value provides the value’s column-wiseranking, with the best performance shaded in green and the worst in pink. The table is sorted on the FNIR column-wise ranking.
C = afis team D = 3M Cogent E = Neurotechnology F = Papillon G = Dermalog H = Hisign Bio-Info InstituteI = NEC J = Sonda K = Tiger IT L = Innovatrics M = SPEX O = ID SolutionsP = id3 Q = Morpho S = Decatur Industries T = BIO-key U = Aware V = AA Technology

188 FPVTE – FINGERPRINT MATCHING
J Relative Combined Results
The tables in Appendix I show the detailed values for FNIR at a fixed FPIR of 10−3, identification time, search templateenrollment time, and RAM consumption. While the column-wise ranking for each variable is given, it can be difficult to vi-sualize relative comparisons among submissions for each of these values. Use of star plots can help with this visualization.For more information on how to read star plots, please refer to the explanation in Appendix K.
Class A plots are in Figures 99 through 101, Class B plots are in Figures 102 through 105, and Class C plots are in Figures 106through 107.
Some notable observations based on the plotted shape include that:
. For almost all finger combinations, I uses the longest enrollment times while providing the highest accuracy.
. D’s submission strike a balance between identification time and enrollment time in order to provide high accuracy.
. Class A results are nearly identical, regardless of which index finger combinations are used.
. J1, L1, Q, O1, and V1 provide high accuracy while limiting time and computational resources for most finger com-binations.
. Shapes formed by participants appear to remain similar regardless of finger combination.
. Tradeoffs between a participant’s two submissions are very easily seen. For instance, in class Class A, V1 and S1 usesignificantly shorter identification times than V2 and S2 respectively, but result in similar relative accuracies.
C = afis team D = 3M Cogent E = Neurotechnology F = Papillon G = Dermalog H = Hisign Bio-Info InstituteI = NEC J = Sonda K = Tiger IT L = Innovatrics M = SPEX O = ID SolutionsP = id3 Q = Morpho S = Decatur Industries T = BIO-key U = Aware V = AA Technology

FPVTE – FINGERPRINT MATCHING 189R
AM
Con
sum
ptio
n
FNIR
Enrollment Time
Identification Tim
e
●
●
●
●
●
RA
M C
onsu
mpt
ion
FNIR
Enrollment Time
Identification Tim
e
●
●
●
●
●
RA
M C
onsu
mpt
ion
FNIR
Enrollment Time
Identification Tim
e
●
●
●
●
●
RA
M C
onsu
mpt
ion
FNIR
Enrollment Time
Identification Tim
e
●
●
●
●
●
RA
M C
onsu
mpt
ion
FNIR
Enrollment Time
Identification Tim
e
●
●
●
●
●
RA
M C
onsu
mpt
ion
FNIR
Enrollment Time
Identification Tim
e
●
●
●
●
●
RA
M C
onsu
mpt
ion
FNIR
Enrollment Time
Identification Tim
e
●
●
●
●
●
RA
M C
onsu
mpt
ion
FNIR
Enrollment Time
Identification Tim
e
●
●
●
●
●
RA
M C
onsu
mpt
ion
FNIR
Enrollment Time
Identification Tim
e
●
●
●
●
●
RA
M C
onsu
mpt
ion
FNIR
Enrollment Time
Identification Tim
e
●
●
●
●
●
RA
M C
onsu
mpt
ion
FNIR
Enrollment Time
Identification Tim
e
●
●
●
●
●
RA
M C
onsu
mpt
ion
FNIR
Enrollment Time
Identification Tim
e
●
●
●
●
●
RA
M C
onsu
mpt
ion
FNIR
Enrollment Time
Identification Tim
e
●
●
●
●
●
RA
M C
onsu
mpt
ion
FNIR
Enrollment Time
Identification Tim
e
●
●
●
●
●
RA
M C
onsu
mpt
ion
FNIR
Enrollment Time
Identification Tim
e
●
●
●
●
●
RA
M C
onsu
mpt
ion
FNIR
Enrollment Time
Identification Tim
e
●
●
●
●
●
RA
M C
onsu
mpt
ion
FNIR
Enrollment Time
Identification Tim
e
●
●
●
●
●
RA
M C
onsu
mpt
ion
FNIR
Enrollment Time
Identification Tim
e
●
●
●
●
●
RA
M C
onsu
mpt
ion
FNIR
Enrollment Time
Identification Tim
e
●
●
●
●
●
RA
M C
onsu
mpt
ion
FNIR
Enrollment Time
Identification Tim
e●
●
●
●
●
RA
M C
onsu
mpt
ion
FNIR
Enrollment Time
Identification Tim
e
●
●
●
●
●
RA
M C
onsu
mpt
ion
FNIR
Enrollment Time
Identification Tim
e
●
●
●
●
●
RA
M C
onsu
mpt
ion
FNIR
Enrollment Time
Identification Tim
e
●
●
●
●
●
RA
M C
onsu
mpt
ion
FNIR
Enrollment Time
Identification Tim
e
●
●
●
●
●
RA
M C
onsu
mpt
ion
FNIR
Enrollment Time
Identification Tim
e
●
●
●
●
●
RA
M C
onsu
mpt
ion
FNIR
Enrollment Time
Identification Tim
e
●
●
●
●
●
RA
M C
onsu
mpt
ion
FNIR
Enrollment Time
Identification Tim
e
●
●
●
●
●
RA
M C
onsu
mpt
ion
FNIR
Enrollment Time
Identification Tim
e
●
●
●
●
●
RA
M C
onsu
mpt
ion
FNIR
Enrollment Time
Identification Tim
e
●
●
●
●
●
RA
M C
onsu
mpt
ion
FNIR
Enrollment Time
Identification Tim
e
●
●
●
●
●
RA
M C
onsu
mpt
ion
FNIR
Enrollment Time
Identification Tim
e
●
●
●
●
●
C1 C2 D1 D2 E1 E2
F1 F2 G1 G2 H1 H2
I1 I2 J1 J2 K1 K2
L1 L2 M1 M2 O1 O2
P1 P2 Q1 Q2 S1 S2
T1 T2 U1 U2 V1 V2
Figure 99: Star plot of combined results for Class A — Left Index. The values in this plot have been independently scaled from 0 to 1 from the valuesprinted in Table 81, with the exception of FNIR, whose log10 values were scaled. Any values printed as NA were set to 1 before scaling. The intersectionpoint of a radius and the circumference of a circle indicate the scaled values 0, 0.5, and 1, with 1 resting on the outer dashed-gray circle. The title aboveeach plot represents the participant’s letter code found on the footer of this page and an identifier used to differentiate between the two submissionseach participant could make.
C = afis team D = 3M Cogent E = Neurotechnology F = Papillon G = Dermalog H = Hisign Bio-Info InstituteI = NEC J = Sonda K = Tiger IT L = Innovatrics M = SPEX O = ID SolutionsP = id3 Q = Morpho S = Decatur Industries T = BIO-key U = Aware V = AA Technology

190 FPVTE – FINGERPRINT MATCHING
RA
M C
onsu
mpt
ion
FNIR
Enrollment Time
Identification Tim
e
●
●
●
●
●
RA
M C
onsu
mpt
ion
FNIR
Enrollment Time
Identification Tim
e
●
●
●
●
●
RA
M C
onsu
mpt
ion
FNIR
Enrollment Time
Identification Tim
e
●
●
●
●
●
RA
M C
onsu
mpt
ion
FNIR
Enrollment Time
Identification Tim
e
●
●
●
●
●
RA
M C
onsu
mpt
ion
FNIR
Enrollment Time
Identification Tim
e
●
●
●
●
●
RA
M C
onsu
mpt
ion
FNIR
Enrollment Time
Identification Tim
e
●
●
●
●
●
RA
M C
onsu
mpt
ion
FNIR
Enrollment Time
Identification Tim
e
●
●
●
●
●
RA
M C
onsu
mpt
ion
FNIR
Enrollment Time
Identification Tim
e
●
●
●
●
●
RA
M C
onsu
mpt
ion
FNIR
Enrollment Time
Identification Tim
e
●
●
●
●
●
RA
M C
onsu
mpt
ion
FNIR
Enrollment Time
Identification Tim
e
●
●
●
●
●
RA
M C
onsu
mpt
ion
FNIR
Enrollment Time
Identification Tim
e
●
●
●
●
●
RA
M C
onsu
mpt
ion
FNIR
Enrollment Time
Identification Tim
e
●
●
●
●
●
RA
M C
onsu
mpt
ion
FNIR
Enrollment Time
Identification Tim
e
●
●
●
●
●
RA
M C
onsu
mpt
ion
FNIR
Enrollment Time
Identification Tim
e
●
●
●
●
●
RA
M C
onsu
mpt
ion
FNIR
Enrollment Time
Identification Tim
e
●
●
●
●
●
RA
M C
onsu
mpt
ion
FNIR
Enrollment Time
Identification Tim
e
●
●
●
●
●
RA
M C
onsu
mpt
ion
FNIR
Enrollment Time
Identification Tim
e
●
●
●
●
●
RA
M C
onsu
mpt
ion
FNIR
Enrollment Time
Identification Tim
e
●
●
●
●
●
RA
M C
onsu
mpt
ion
FNIR
Enrollment Time
Identification Tim
e
●
●
●
●
●
RA
M C
onsu
mpt
ion
FNIR
Enrollment Time
Identification Tim
e●
●
●
●
●
RA
M C
onsu
mpt
ion
FNIR
Enrollment Time
Identification Tim
e
●
●
●
●
●
RA
M C
onsu
mpt
ion
FNIR
Enrollment Time
Identification Tim
e
●
●
●
●
●
RA
M C
onsu
mpt
ion
FNIR
Enrollment Time
Identification Tim
e
●
●
●
●
●
RA
M C
onsu
mpt
ion
FNIR
Enrollment Time
Identification Tim
e
●
●
●
●
●
RA
M C
onsu
mpt
ion
FNIR
Enrollment Time
Identification Tim
e
●
●
●
●
●
RA
M C
onsu
mpt
ion
FNIR
Enrollment Time
Identification Tim
e
●
●
●
●
●
RA
M C
onsu
mpt
ion
FNIR
Enrollment Time
Identification Tim
e
●
●
●
●
●
RA
M C
onsu
mpt
ion
FNIR
Enrollment Time
Identification Tim
e
●
●
●
●
●
RA
M C
onsu
mpt
ion
FNIR
Enrollment Time
Identification Tim
e
●
●
●
●
●
RA
M C
onsu
mpt
ion
FNIR
Enrollment Time
Identification Tim
e
●
●
●
●
●
RA
M C
onsu
mpt
ion
FNIR
Enrollment Time
Identification Tim
e
●
●
●
●
●
C1 C2 D1 D2 E1 E2
F1 F2 G1 G2 H1 H2
I1 I2 J1 J2 K1 K2
L1 L2 M1 M2 O1 O2
P1 P2 Q1 Q2 S1 S2
T1 T2 U1 U2 V1 V2
Figure 100: Star plot of combined results for Class A — Right Index. The values in this plot have been independently scaled from 0 to 1 from the valuesprinted in Table 82, with the exception of FNIR, whose log10 values were scaled. The intersection point of a radius and the circumference of a circleindicate the scaled values 0, 0.5, and 1, with 1 resting on the outer dashed-gray circle. The title above each plot represents the participant’s letter codefound on the footer of this page and an identifier used to differentiate between the two submissions each participant could make.
C = afis team D = 3M Cogent E = Neurotechnology F = Papillon G = Dermalog H = Hisign Bio-Info InstituteI = NEC J = Sonda K = Tiger IT L = Innovatrics M = SPEX O = ID SolutionsP = id3 Q = Morpho S = Decatur Industries T = BIO-key U = Aware V = AA Technology

FPVTE – FINGERPRINT MATCHING 191R
AM
Con
sum
ptio
n
FNIR
Enrollment Time
Identification Tim
e
●
●
●
●
●
RA
M C
onsu
mpt
ion
FNIR
Enrollment Time
Identification Tim
e
●
●
●
●
●
RA
M C
onsu
mpt
ion
FNIR
Enrollment Time
Identification Tim
e
●
●
●
●
●
RA
M C
onsu
mpt
ion
FNIR
Enrollment Time
Identification Tim
e
●
●
●
●
●
RA
M C
onsu
mpt
ion
FNIR
Enrollment Time
Identification Tim
e
●
●
●
●
●
RA
M C
onsu
mpt
ion
FNIR
Enrollment Time
Identification Tim
e
●
●
●
●
●
RA
M C
onsu
mpt
ion
FNIR
Enrollment Time
Identification Tim
e
●
●
●
●
●
RA
M C
onsu
mpt
ion
FNIR
Enrollment Time
Identification Tim
e
●
●
●
●
●
RA
M C
onsu
mpt
ion
FNIR
Enrollment Time
Identification Tim
e
●
●
●
●
●
RA
M C
onsu
mpt
ion
FNIR
Enrollment Time
Identification Tim
e
●
●
●
●
●
RA
M C
onsu
mpt
ion
FNIR
Enrollment Time
Identification Tim
e
●
●
●
●
●
RA
M C
onsu
mpt
ion
FNIR
Enrollment Time
Identification Tim
e
●
●
●
●
●
RA
M C
onsu
mpt
ion
FNIR
Enrollment Time
Identification Tim
e
●
●
●
●
●
RA
M C
onsu
mpt
ion
FNIR
Enrollment Time
Identification Tim
e
●
●
●
●
●
RA
M C
onsu
mpt
ion
FNIR
Enrollment Time
Identification Tim
e
●
●
●
●
●
RA
M C
onsu
mpt
ion
FNIR
Enrollment Time
Identification Tim
e
●
●
●
●
●
RA
M C
onsu
mpt
ion
FNIR
Enrollment Time
Identification Tim
e
●
●
●
●
●
RA
M C
onsu
mpt
ion
FNIR
Enrollment Time
Identification Tim
e
●
●
●
●
●
RA
M C
onsu
mpt
ion
FNIR
Enrollment Time
Identification Tim
e
●
●
●
●
●
RA
M C
onsu
mpt
ion
FNIR
Enrollment Time
Identification Tim
e●
●
●
●
●
RA
M C
onsu
mpt
ion
FNIR
Enrollment Time
Identification Tim
e
●
●
●
●
●
RA
M C
onsu
mpt
ion
FNIR
Enrollment Time
Identification Tim
e
●
●
●
●
●
RA
M C
onsu
mpt
ion
FNIR
Enrollment Time
Identification Tim
e
●
●
●
●
●
RA
M C
onsu
mpt
ion
FNIR
Enrollment Time
Identification Tim
e
●
●
●
●
●
RA
M C
onsu
mpt
ion
FNIR
Enrollment Time
Identification Tim
e●
●
●
●
●
RA
M C
onsu
mpt
ion
FNIR
Enrollment Time
Identification Tim
e
●
●
●
●
●
RA
M C
onsu
mpt
ion
FNIR
Enrollment Time
Identification Tim
e
●
●
●
●
●
RA
M C
onsu
mpt
ion
FNIR
Enrollment Time
Identification Tim
e
●
●
●
●
●
RA
M C
onsu
mpt
ion
FNIR
Enrollment Time
Identification Tim
e
●
●
●
●
●
RA
M C
onsu
mpt
ion
FNIR
Enrollment Time
Identification Tim
e
●
●
●
●
●
RA
M C
onsu
mpt
ion
FNIR
Enrollment Time
Identification Tim
e
●
●
●
●
●
RA
M C
onsu
mpt
ion
FNIR
Enrollment Time
Identification Tim
e
●
●
●
●
●
RA
M C
onsu
mpt
ion
FNIR
Enrollment Time
Identification Tim
e
●
●
●
●
●
RA
M C
onsu
mpt
ion
FNIR
Enrollment Time
Identification Tim
e
●
●
●
●
●
RA
M C
onsu
mpt
ion
FNIR
Enrollment Time
Identification Tim
e
●
●
●
●
●
RA
M C
onsu
mpt
ion
FNIR
Enrollment Time
Identification Tim
e
●
●
●
●
●
C1 C2 D1 D2 E1 E2
F1 F2 G1 G2 H1 H2
I1 I2 J1 J2 K1 K2
L1 L2 M1 M2 O1 O2
P1 P2 Q1 Q2 S1 S2
T1 T2 U1 U2 V1 V2
Figure 101: Star plot of combined results for Class A — Left and Right Index. The values in this plot have been independently scaled from 0 to 1 fromthe values printed in Table 21, with the exception of FNIR, whose log10 values were scaled. Any values printed as NA were set to 1 before scaling. Theintersection point of a radius and the circumference of a circle indicate the scaled values 0, 0.5, and 1, with 1 resting on the outer dashed-gray circle.The title above each plot represents the participant’s letter code found on the footer of this page and an identifier used to differentiate between the twosubmissions each participant could make.
C = afis team D = 3M Cogent E = Neurotechnology F = Papillon G = Dermalog H = Hisign Bio-Info InstituteI = NEC J = Sonda K = Tiger IT L = Innovatrics M = SPEX O = ID SolutionsP = id3 Q = Morpho S = Decatur Industries T = BIO-key U = Aware V = AA Technology

192 FPVTE – FINGERPRINT MATCHING
RA
M C
onsu
mpt
ion
FNIR
Enrollment Time
Identification Tim
e
●
●
●
●
●
RA
M C
onsu
mpt
ion
FNIR
Enrollment Time
Identification Tim
e
●
●
●
●
●
RA
M C
onsu
mpt
ion
FNIR
Enrollment Time
Identification Tim
e
●
●
●
●
●
RA
M C
onsu
mpt
ion
FNIR
Enrollment Time
Identification Tim
e
●
●
●
●
●
RA
M C
onsu
mpt
ion
FNIR
Enrollment Time
Identification Tim
e
●
●
●
●
●
RA
M C
onsu
mpt
ion
FNIR
Enrollment Time
Identification Tim
e
●
●
●
●
●
RA
M C
onsu
mpt
ion
FNIR
Enrollment Time
Identification Tim
e
●
●
●
●
●
RA
M C
onsu
mpt
ion
FNIR
Enrollment Time
Identification Tim
e
●
●
●
●
●
RA
M C
onsu
mpt
ion
FNIR
Enrollment TimeIdentification T
ime
●
●
●
●
●
RA
M C
onsu
mpt
ion
FNIR
Enrollment Time
Identification Tim
e
●
●
●
●
●
RA
M C
onsu
mpt
ion
FNIR
Enrollment Time
Identification Tim
e
●
●
●
●
●
RA
M C
onsu
mpt
ion
FNIR
Enrollment Time
Identification Tim
e
●
●
●
●
●
RA
M C
onsu
mpt
ion
FNIR
Enrollment Time
Identification Tim
e
●
●
●
●
●
RA
M C
onsu
mpt
ion
FNIR
Enrollment Time
Identification Tim
e
●
●
●
●
●
RA
M C
onsu
mpt
ion
FNIR
Enrollment Time
Identification Tim
e
●
●
●
●
●
RA
M C
onsu
mpt
ion
FNIR
Enrollment Time
Identification Tim
e
●
●
●
●
●
RA
M C
onsu
mpt
ion
FNIR
Enrollment Time
Identification Tim
e
●
●
●
●
●
RA
M C
onsu
mpt
ion
FNIR
Enrollment Time
Identification Tim
e
●
●
●
●
●
RA
M C
onsu
mpt
ion
FNIR
Enrollment Time
Identification Tim
e
●
●
●
●
●
RA
M C
onsu
mpt
ion
FNIR
Enrollment Time
Identification Tim
e
●
●
●
●
●
RA
M C
onsu
mpt
ion
FNIR
Enrollment Time
Identification Tim
e
●
●
●
●
●
RA
M C
onsu
mpt
ion
FNIR
Enrollment Time
Identification Tim
e
●
●
●
●
●
RA
M C
onsu
mpt
ion
FNIR
Enrollment Time
Identification Tim
e
●
●
●
●
●
RA
M C
onsu
mpt
ion
FNIR
Enrollment Time
Identification Tim
e
●
●
●
●
●
RA
M C
onsu
mpt
ion
FNIR
Enrollment Time
Identification Tim
e
●
●
●
●
●
C1 C2 D1 D2 E1 E2
F1 F2 G1 G2 H1 H2
I1 I2 J1 J2 L1 L2
M1 M2 O1 O2 Q1 Q2
S1 S2 U1 U2 V1 V2
Figure 102: Star plot of combined results for Class B — Left Slap. The values in this plot have been independently scaled from 0 to 1 from the valuesprinted in Table 84, with the exception of FNIR, whose log10 values were scaled. The intersection point of a radius and the circumference of a circleindicate the scaled values 0, 0.5, and 1, with 1 resting on the outer dashed-gray circle. The title above each plot represents the participant’s letter codefound on the footer of this page and an identifier used to differentiate between the two submissions each participant could make.
C = afis team D = 3M Cogent E = Neurotechnology F = Papillon G = Dermalog H = Hisign Bio-Info InstituteI = NEC J = Sonda K = Tiger IT L = Innovatrics M = SPEX O = ID SolutionsP = id3 Q = Morpho S = Decatur Industries T = BIO-key U = Aware V = AA Technology

FPVTE – FINGERPRINT MATCHING 193R
AM
Con
sum
ptio
n
FNIR
Enrollment Time
Identification Tim
e
●
●
●
●
●
RA
M C
onsu
mpt
ion
FNIR
Enrollment Time
Identification Tim
e
●
●
●
●
●
RA
M C
onsu
mpt
ion
FNIR
Enrollment Time
Identification Tim
e
●
●
●
●
●
RA
M C
onsu
mpt
ion
FNIR
Enrollment Time
Identification Tim
e
●
●
●
●
●
RA
M C
onsu
mpt
ion
FNIR
Enrollment Time
Identification Tim
e
●
●
●
●
●
RA
M C
onsu
mpt
ion
FNIR
Enrollment Time
Identification Tim
e
●
●
●
●
●
RA
M C
onsu
mpt
ion
FNIR
Enrollment Time
Identification Tim
e
●
●
●
●
●
RA
M C
onsu
mpt
ion
FNIR
Enrollment Time
Identification Tim
e
●
●
●
●
●
RA
M C
onsu
mpt
ion
FNIR
Enrollment TimeIdentification T
ime
●
●
●
●
●
RA
M C
onsu
mpt
ion
FNIR
Enrollment Time
Identification Tim
e
●
●
●
●
●
RA
M C
onsu
mpt
ion
FNIR
Enrollment Time
Identification Tim
e
●
●
●
●
●
RA
M C
onsu
mpt
ion
FNIR
Enrollment Time
Identification Tim
e
●
●
●
●
●
RA
M C
onsu
mpt
ion
FNIR
Enrollment Time
Identification Tim
e
●
●
●
●
●
RA
M C
onsu
mpt
ion
FNIR
Enrollment Time
Identification Tim
e
●
●
●
●
●
RA
M C
onsu
mpt
ion
FNIR
Enrollment Time
Identification Tim
e
●
●
●
●
●
RA
M C
onsu
mpt
ion
FNIR
Enrollment Time
Identification Tim
e
●
●
●
●
●
RA
M C
onsu
mpt
ion
FNIR
Enrollment Time
Identification Tim
e
●
●
●
●
●
RA
M C
onsu
mpt
ion
FNIR
Enrollment Time
Identification Tim
e
●
●
●
●
●
RA
M C
onsu
mpt
ion
FNIR
Enrollment Time
Identification Tim
e
●
●
●
●
●
RA
M C
onsu
mpt
ion
FNIR
Enrollment Time
Identification Tim
e
●
●
●
●
●
RA
M C
onsu
mpt
ion
FNIR
Enrollment Time
Identification Tim
e
●
●
●
●
●
RA
M C
onsu
mpt
ion
FNIR
Enrollment Time
Identification Tim
e
●
●
●
●
●
RA
M C
onsu
mpt
ion
FNIR
Enrollment Time
Identification Tim
e
●
●
●
●
●
RA
M C
onsu
mpt
ion
FNIR
Enrollment Time
Identification Tim
e
●
●
●
●
●
RA
M C
onsu
mpt
ion
FNIR
Enrollment Time
Identification Tim
e
●
●
●
●
●
C1 C2 D1 D2 E1 E2
F1 F2 G1 G2 H1 H2
I1 I2 J1 J2 L1 L2
M1 M2 O1 O2 Q1 Q2
S1 S2 U1 U2 V1 V2
Figure 103: Star plot of combined results for Class B — Right Slap. The values in this plot have been independently scaled from 0 to 1 from the valuesprinted in Table 85, with the exception of FNIR, whose log10 values were scaled. The intersection point of a radius and the circumference of a circleindicate the scaled values 0, 0.5, and 1, with 1 resting on the outer dashed-gray circle. The title above each plot represents the participant’s letter codefound on the footer of this page and an identifier used to differentiate between the two submissions each participant could make.
C = afis team D = 3M Cogent E = Neurotechnology F = Papillon G = Dermalog H = Hisign Bio-Info InstituteI = NEC J = Sonda K = Tiger IT L = Innovatrics M = SPEX O = ID SolutionsP = id3 Q = Morpho S = Decatur Industries T = BIO-key U = Aware V = AA Technology

194 FPVTE – FINGERPRINT MATCHING
RA
M C
onsu
mpt
ion
FNIR
Enrollment Time
Identification Tim
e
●
●
●
●
●R
AM
Con
sum
ptio
nFNIR
Enrollment Time
Identification Tim
e
●
●
●
●
●
RA
M C
onsu
mpt
ion
FNIR
Enrollment Time
Identification Tim
e
●
●
●
●
●
RA
M C
onsu
mpt
ion
FNIR
Enrollment Time
Identification Tim
e
●
●
●
●
●
RA
M C
onsu
mpt
ion
FNIR
Enrollment Time
Identification Tim
e
●
●
●
●
●
RA
M C
onsu
mpt
ion
FNIR
Enrollment Time
Identification Tim
e
●
●
●
●
●
RA
M C
onsu
mpt
ion
FNIR
Enrollment Time
Identification Tim
e
●
●
●
●
●
RA
M C
onsu
mpt
ion
FNIR
Enrollment Time
Identification Tim
e
●
●
●
●
●
RA
M C
onsu
mpt
ion
FNIR
Enrollment Time
Identification Tim
e
●
●
●
●
●
RA
M C
onsu
mpt
ion
FNIR
Enrollment Time
Identification Tim
e
●
●
●
●
●
RA
M C
onsu
mpt
ion
FNIR
Enrollment Time
Identification Tim
e
●
●
●
●
●
RA
M C
onsu
mpt
ion
FNIR
Enrollment Time
Identification Tim
e
●
●
●
●
●
RA
M C
onsu
mpt
ion
FNIR
Enrollment Time
Identification Tim
e
●
●
●
●
●
RA
M C
onsu
mpt
ion
FNIR
Enrollment TimeIdentification T
ime
●
●
●
●
●
RA
M C
onsu
mpt
ion
FNIR
Enrollment Time
Identification Tim
e
●
●
●
●
●
RA
M C
onsu
mpt
ion
FNIR
Enrollment Time
Identification Tim
e
●
●
●
●
●
RA
M C
onsu
mpt
ion
FNIR
Enrollment Time
Identification Tim
e
●
●
●
●
●
RA
M C
onsu
mpt
ion
FNIR
Enrollment Time
Identification Tim
e
●
●
●
●
●
RA
M C
onsu
mpt
ion
FNIR
Enrollment Time
Identification Tim
e
●
●
●
●
●
RA
M C
onsu
mpt
ion
FNIR
Enrollment Time
Identification Tim
e
●
●
●
●
●
RA
M C
onsu
mpt
ion
FNIR
Enrollment Time
Identification Tim
e
●
●
●
●
●
RA
M C
onsu
mpt
ion
FNIR
Enrollment Time
Identification Tim
e
●
●
●
●
●
RA
M C
onsu
mpt
ion
FNIR
Enrollment Time
Identification Tim
e
●
●
●
●
●
RA
M C
onsu
mpt
ion
FNIR
Enrollment Time
Identification Tim
e
●
●
●
●
●
RA
M C
onsu
mpt
ion
FNIR
Enrollment Time
Identification Tim
e
●
●
●
●
●
RA
M C
onsu
mpt
ion
FNIR
Enrollment Time
Identification Tim
e
●
●
●
●
●
RA
M C
onsu
mpt
ion
FNIR
Enrollment Time
Identification Tim
e
●
●
●
●
●
RA
M C
onsu
mpt
ion
FNIR
Enrollment Time
Identification Tim
e
●
●
●
●
●
RA
M C
onsu
mpt
ion
FNIR
Enrollment Time
Identification Tim
e
●
●
●
●
●
RA
M C
onsu
mpt
ion
FNIR
Enrollment Time
Identification Tim
e
●
●
●
●
●
C1 C2 D1 D2 E1 E2
F1 F2 G1 G2 H1 H2
I1 I2 J1 J2 L1 L2
M1 M2 O1 O2 Q1 Q2
S1 S2 U1 U2 V1 V2
Figure 104: Star plot of combined results for Class B — Left and Right Slap. The values in this plot have been independently scaled from 0 to 1 fromthe values printed in Table 86, with the exception of FNIR, whose log10 values were scaled. Any values printed as NA were set to 1 before scaling. Theintersection point of a radius and the circumference of a circle indicate the scaled values 0, 0.5, and 1, with 1 resting on the outer dashed-gray circle.The title above each plot represents the participant’s letter code found on the footer of this page and an identifier used to differentiate between the twosubmissions each participant could make.
C = afis team D = 3M Cogent E = Neurotechnology F = Papillon G = Dermalog H = Hisign Bio-Info InstituteI = NEC J = Sonda K = Tiger IT L = Innovatrics M = SPEX O = ID SolutionsP = id3 Q = Morpho S = Decatur Industries T = BIO-key U = Aware V = AA Technology

FPVTE – FINGERPRINT MATCHING 195R
AM
Con
sum
ptio
n
FNIR
Enrollment Time
Identification Tim
e
●
●
●
●
●R
AM
Con
sum
ptio
nFNIR
Enrollment Time
Identification Tim
e
●
●
●
●
●
RA
M C
onsu
mpt
ion
FNIR
Enrollment Time
Identification Tim
e
●
●
●
●
●
RA
M C
onsu
mpt
ion
FNIR
Enrollment Time
Identification Tim
e
●
●
●
●
●
RA
M C
onsu
mpt
ion
FNIR
Enrollment Time
Identification Tim
e
●
●
●
●
●
RA
M C
onsu
mpt
ion
FNIR
Enrollment Time
Identification Tim
e
●
●
●
●
●
RA
M C
onsu
mpt
ion
FNIR
Enrollment Time
Identification Tim
e
●
●
●
●
●
RA
M C
onsu
mpt
ion
FNIR
Enrollment Time
Identification Tim
e
●
●
●
●
●
RA
M C
onsu
mpt
ion
FNIR
Enrollment Time
Identification Tim
e
●
●
●
●
●
RA
M C
onsu
mpt
ion
FNIR
Enrollment Time
Identification Tim
e
●
●
●
●
●
RA
M C
onsu
mpt
ion
FNIR
Enrollment Time
Identification Tim
e
●
●
●
●
●
RA
M C
onsu
mpt
ion
FNIR
Enrollment Time
Identification Tim
e
●
●
●
●
●
RA
M C
onsu
mpt
ion
FNIR
Enrollment Time
Identification Tim
e
●
●
●
●
●
RA
M C
onsu
mpt
ion
FNIR
Enrollment TimeIdentification T
ime
●
●
●
●
●
RA
M C
onsu
mpt
ion
FNIR
Enrollment Time
Identification Tim
e
●
●
●
●
●
RA
M C
onsu
mpt
ion
FNIR
Enrollment Time
Identification Tim
e
●
●
●
●
●
RA
M C
onsu
mpt
ion
FNIR
Enrollment Time
Identification Tim
e
●
●
●
●
●
RA
M C
onsu
mpt
ion
FNIR
Enrollment Time
Identification Tim
e
●
●
●
●
●
RA
M C
onsu
mpt
ion
FNIR
Enrollment Time
Identification Tim
e
●
●
●
●
●
RA
M C
onsu
mpt
ion
FNIR
Enrollment Time
Identification Tim
e
●
●
●
●
●
RA
M C
onsu
mpt
ion
FNIR
Enrollment Time
Identification Tim
e
●
●
●
●
●
RA
M C
onsu
mpt
ion
FNIR
Enrollment Time
Identification Tim
e
●
●
●
●
●
RA
M C
onsu
mpt
ion
FNIR
Enrollment Time
Identification Tim
e
●
●
●
●
●
RA
M C
onsu
mpt
ion
FNIR
Enrollment Time
Identification Tim
e
●
●
●
●
●
RA
M C
onsu
mpt
ion
FNIR
Enrollment Time
Identification Tim
e
●
●
●
●
●
RA
M C
onsu
mpt
ion
FNIR
Enrollment Time
Identification Tim
e
●
●
●
●
●
RA
M C
onsu
mpt
ion
FNIR
Enrollment Time
Identification Tim
e
●
●
●
●
●
RA
M C
onsu
mpt
ion
FNIR
Enrollment Time
Identification Tim
e
●
●
●
●
●
RA
M C
onsu
mpt
ion
FNIR
Enrollment Time
Identification Tim
e
●
●
●
●
●
RA
M C
onsu
mpt
ion
FNIR
Enrollment Time
Identification Tim
e
●
●
●
●
●
C1 C2 D1 D2 E1 E2
F1 F2 G1 G2 H1 H2
I1 I2 J1 J2 L1 L2
M1 M2 O1 O2 Q1 Q2
S1 S2 U1 U2 V1 V2
Figure 105: Star plot of combined results for Class B — Identification Flats. The values in this plot have been independently scaled from 0 to 1 from thevalues printed in Table 22, with the exception of FNIR, whose log10 values were scaled. Any values printed as NA were set to 1 before scaling. Theintersection point of a radius and the circumference of a circle indicate the scaled values 0, 0.5, and 1, with 1 resting on the outer dashed-gray circle.The title above each plot represents the participant’s letter code found on the footer of this page and an identifier used to differentiate between the twosubmissions each participant could make.
C = afis team D = 3M Cogent E = Neurotechnology F = Papillon G = Dermalog H = Hisign Bio-Info InstituteI = NEC J = Sonda K = Tiger IT L = Innovatrics M = SPEX O = ID SolutionsP = id3 Q = Morpho S = Decatur Industries T = BIO-key U = Aware V = AA Technology

196 FPVTE – FINGERPRINT MATCHING
RA
M C
onsu
mpt
ion
FNIR
Enrollment Time
Identification Tim
e
●
●
●
●
●R
AM
Con
sum
ptio
nFNIR
Enrollment Time
Identification Tim
e
●
●
●
●
●
RA
M C
onsu
mpt
ion
FNIR
Enrollment Time
Identification Tim
e
●
●
●
●
●
RA
M C
onsu
mpt
ion
FNIR
Enrollment Time
Identification Tim
e
●
●
●
●
●
RA
M C
onsu
mpt
ion
FNIR
Enrollment Time
Identification Tim
e
●
●
●
●
●
RA
M C
onsu
mpt
ion
FNIR
Enrollment Time
Identification Tim
e
●
●
●
●
●
RA
M C
onsu
mpt
ion
FNIR
Enrollment Time
Identification Tim
e
●
●
●
●
●
RA
M C
onsu
mpt
ion
FNIR
Enrollment Time
Identification Tim
e
●
●
●
●
●
RA
M C
onsu
mpt
ion
FNIR
Enrollment Time
Identification Tim
e
●
●
●
●
●
RA
M C
onsu
mpt
ion
FNIR
Enrollment Time
Identification Tim
e
●
●
●
●
●
RA
M C
onsu
mpt
ion
FNIR
Enrollment Time
Identification Tim
e
●
●
●
●
●
RA
M C
onsu
mpt
ion
FNIR
Enrollment Time
Identification Tim
e
●
●
●
●
●
RA
M C
onsu
mpt
ion
FNIR
Enrollment Time
Identification Tim
e
●
●
●
●
●
RA
M C
onsu
mpt
ion
FNIR
Enrollment TimeIdentification T
ime
●
●
●
●
●
RA
M C
onsu
mpt
ion
FNIR
Enrollment Time
Identification Tim
e
●
●
●
●
●
RA
M C
onsu
mpt
ion
FNIR
Enrollment Time
Identification Tim
e
●
●
●
●
●
RA
M C
onsu
mpt
ion
FNIR
Enrollment Time
Identification Tim
e
●
●
●
●
●
RA
M C
onsu
mpt
ion
FNIR
Enrollment Time
Identification Tim
e
●
●
●
●
●
RA
M C
onsu
mpt
ion
FNIR
Enrollment Time
Identification Tim
e
●
●
●
●
●
RA
M C
onsu
mpt
ion
FNIR
Enrollment Time
Identification Tim
e
●
●
●
●
●
RA
M C
onsu
mpt
ion
FNIR
Enrollment Time
Identification Tim
e
●
●
●
●
●
RA
M C
onsu
mpt
ion
FNIR
Enrollment Time
Identification Tim
e
●
●
●
●
●
RA
M C
onsu
mpt
ion
FNIR
Enrollment Time
Identification Tim
e
●
●
●
●
●
RA
M C
onsu
mpt
ion
FNIR
Enrollment Time
Identification Tim
e
●
●
●
●
●
RA
M C
onsu
mpt
ion
FNIR
Enrollment Time
Identification Tim
e
●
●
●
●
●
RA
M C
onsu
mpt
ion
FNIR
Enrollment Time
Identification Tim
e
●
●
●
●
●
RA
M C
onsu
mpt
ion
FNIR
Enrollment Time
Identification Tim
e
●
●
●
●
●
RA
M C
onsu
mpt
ion
FNIR
Enrollment Time
Identification Tim
e
●
●
●
●
●
RA
M C
onsu
mpt
ion
FNIR
Enrollment Time
Identification Tim
e
●
●
●
●
●
RA
M C
onsu
mpt
ion
FNIR
Enrollment Time
Identification Tim
e
●
●
●
●
●
C1 C2 D1 D2 E1 E2
F1 F2 G1 G2 H1 H2
I1 I2 J1 J2 L1 L2
M1 M2 O1 O2 Q1 Q2
S1 S2 U1 U2 V1 V2
Figure 106: Star plot of combined results for Class C — Ten-Finger Plain-to-Plain. The values in this plot have been independently scaled from 0 to 1from the values printed in Table 88, with the exception of FNIR, whose log10 values were scaled. Any values printed as NA were set to 1 before scaling.The intersection point of a radius and the circumference of a circle indicate the scaled values 0, 0.5, and 1, with 1 resting on the outer dashed-gray circle.The title above each plot represents the participant’s letter code found on the footer of this page and an identifier used to differentiate between the twosubmissions each participant could make.
C = afis team D = 3M Cogent E = Neurotechnology F = Papillon G = Dermalog H = Hisign Bio-Info InstituteI = NEC J = Sonda K = Tiger IT L = Innovatrics M = SPEX O = ID SolutionsP = id3 Q = Morpho S = Decatur Industries T = BIO-key U = Aware V = AA Technology
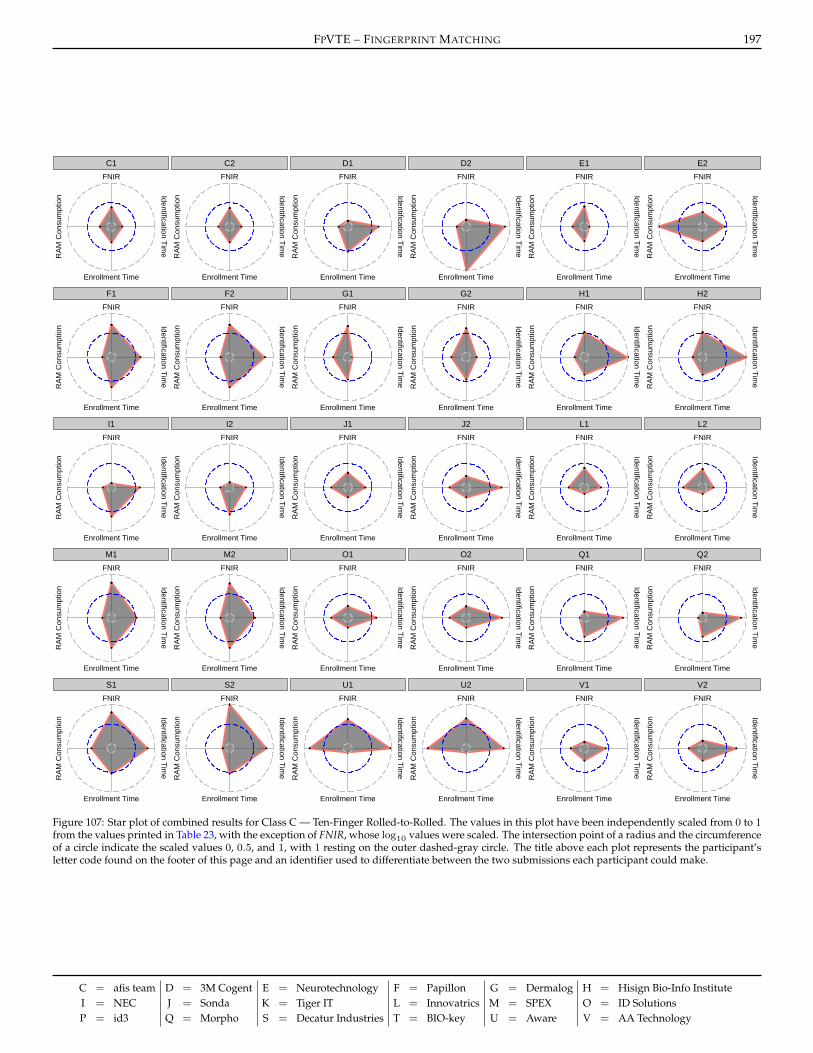
FPVTE – FINGERPRINT MATCHING 197R
AM
Con
sum
ptio
n
FNIR
Enrollment Time
Identification Tim
e
●
●
●
●
●
RA
M C
onsu
mpt
ion
FNIR
Enrollment Time
Identification Tim
e
●
●
●
●
●
RA
M C
onsu
mpt
ion
FNIR
Enrollment Time
Identification Tim
e
●
●
●
●
●
RA
M C
onsu
mpt
ion
FNIR
Enrollment Time
Identification Tim
e
●
●
●
●
●
RA
M C
onsu
mpt
ion
FNIR
Enrollment Time
Identification Tim
e
●
●
●
●
●
RA
M C
onsu
mpt
ion
FNIR
Enrollment Time
Identification Tim
e
●
●
●
●
●
RA
M C
onsu
mpt
ion
FNIR
Enrollment Time
Identification Tim
e
●
●
●
●
●
RA
M C
onsu
mpt
ion
FNIR
Enrollment Time
Identification Tim
e
●
●
●
●
●
RA
M C
onsu
mpt
ion
FNIR
Enrollment TimeIdentification T
ime
●
●
●
●
●
RA
M C
onsu
mpt
ion
FNIR
Enrollment Time
Identification Tim
e
●
●
●
●
●
RA
M C
onsu
mpt
ion
FNIR
Enrollment Time
Identification Tim
e
●
●
●
●
●
RA
M C
onsu
mpt
ion
FNIR
Enrollment Time
Identification Tim
e
●
●
●
●
●
RA
M C
onsu
mpt
ion
FNIR
Enrollment Time
Identification Tim
e
●
●
●
●
●
RA
M C
onsu
mpt
ion
FNIR
Enrollment Time
Identification Tim
e
●
●
●
●
●
RA
M C
onsu
mpt
ion
FNIR
Enrollment Time
Identification Tim
e
●
●
●
●
●
RA
M C
onsu
mpt
ion
FNIR
Enrollment Time
Identification Tim
e
●
●
●
●
●
RA
M C
onsu
mpt
ion
FNIR
Enrollment Time
Identification Tim
e
●
●
●
●
●
RA
M C
onsu
mpt
ion
FNIR
Enrollment Time
Identification Tim
e
●
●
●
●
●
RA
M C
onsu
mpt
ion
FNIR
Enrollment Time
Identification Tim
e
●
●
●
●
●
RA
M C
onsu
mpt
ion
FNIR
Enrollment Time
Identification Tim
e
●
●
●
●
●
RA
M C
onsu
mpt
ion
FNIR
Enrollment Time
Identification Tim
e
●
●
●
●
●
RA
M C
onsu
mpt
ion
FNIR
Enrollment Time
Identification Tim
e
●
●
●
●
●
RA
M C
onsu
mpt
ion
FNIR
Enrollment Time
Identification Tim
e
●
●
●
●
●
RA
M C
onsu
mpt
ion
FNIR
Enrollment Time
Identification Tim
e
●
●
●
●
●
RA
M C
onsu
mpt
ion
FNIR
Enrollment Time
Identification Tim
e
●
●
●
●
●
C1 C2 D1 D2 E1 E2
F1 F2 G1 G2 H1 H2
I1 I2 J1 J2 L1 L2
M1 M2 O1 O2 Q1 Q2
S1 S2 U1 U2 V1 V2
Figure 107: Star plot of combined results for Class C — Ten-Finger Rolled-to-Rolled. The values in this plot have been independently scaled from 0 to 1from the values printed in Table 23, with the exception of FNIR, whose log10 values were scaled. The intersection point of a radius and the circumferenceof a circle indicate the scaled values 0, 0.5, and 1, with 1 resting on the outer dashed-gray circle. The title above each plot represents the participant’sletter code found on the footer of this page and an identifier used to differentiate between the two submissions each participant could make.
C = afis team D = 3M Cogent E = Neurotechnology F = Papillon G = Dermalog H = Hisign Bio-Info InstituteI = NEC J = Sonda K = Tiger IT L = Innovatrics M = SPEX O = ID SolutionsP = id3 Q = Morpho S = Decatur Industries T = BIO-key U = Aware V = AA Technology

198 FPVTE – FINGERPRINT MATCHING
K Relative Accuracy and Number of Fingers
In Section 7, DETs, tables, and other data visualization methods were used to show exact FNIR values at FPIR = 10−3.While this data is important for exact comparisons, it is difficult to quickly compare relative accuracy among submissions,or to see how a submission fares across finger combinations. To facilitate these comparisons, star plots [1] (also calledspider or radar plots) are included in this section. These plots are used to quickly examine relative values among multiplevariables.
In each star plot, values are plotted along multiple radii, where each radius represents a single variable. The plot area isdelineated with three circles. The points on the circumference of these circles indicate different values where they intersectthe radii. The intersection with the smallest circle represents 0, the next-largest circle (dashed-blue) represents 0.5, and thelargest circle (dashed-gray) represents 1. All values plotted have been scaled between 0 and 1 against other values for thesame variable in order to fit within the largest circle. These plotted values were then connected to adjacent plotted values,creating a polygon. Many traits may be quickly inferred by the shape of these polygons:
. Regular polygons indicate submissions that have similar accuracy for all plotted variables.
. A submission that is the most accurate in terms of every variable would inscribe the center circle and the leastaccurate would inscribe the largest circle.
. The smaller the polygon, the more accurate the submission.
C = afis team D = 3M Cogent E = Neurotechnology F = Papillon G = Dermalog H = Hisign Bio-Info InstituteI = NEC J = Sonda K = Tiger IT L = Innovatrics M = SPEX O = ID SolutionsP = id3 Q = Morpho S = Decatur Industries T = BIO-key U = Aware V = AA Technology

FPVTE – FINGERPRINT MATCHING 199
K.1 Class A
Relative FNIR results for left index, right index, and left and right index searches are shown in Figure 108. Note that theenrollment set sizes differed between single index and two-index searches.
Some notable observations include:
. The most accurate submissions (D, I, Q, V) are instantly recognizable by their small shape.
. Most submissions have near-identical accuracy, regardless of being provided one or two index fingers, as indicatedby the equilateral triangle drawn. This may have impacts on data collection and storage. Extreme examples includeD, K, M, and V.
. No participants appear to have wildly-differing accuracy among any of the index finger combinations.
C = afis team D = 3M Cogent E = Neurotechnology F = Papillon G = Dermalog H = Hisign Bio-Info InstituteI = NEC J = Sonda K = Tiger IT L = Innovatrics M = SPEX O = ID SolutionsP = id3 Q = Morpho S = Decatur Industries T = BIO-key U = Aware V = AA Technology

200 FPVTE – FINGERPRINT MATCHING
Left
and
Rig
ht In
dex
Left Index
Right Index
●
●
●
●
Left
and
Rig
ht In
dex
Left Index
Right Index
●
●
●
●
Left
and
Rig
ht In
dex
Left Index
Right Index
●
●●
●
Left
and
Rig
ht In
dex
Left Index
Right Index
●
●●
●
Left
and
Rig
ht In
dex
Left Index
Right Index
●
●●
●
Left
and
Rig
ht In
dex
Left Index
Right Index
●
●●
●
Left
and
Rig
ht In
dex
Left Index
Right Index
●
●●
●
Left
and
Rig
ht In
dex
Left Index
Right Index
●
●●
●
Left
and
Rig
ht In
dex
Left Index
Right Index
●
●●
●
Left
and
Rig
ht In
dex
Left Index
Right Index
●
●
●
●
Left
and
Rig
ht In
dex
Left Index
Right Index
●
●●
●
Left
and
Rig
ht In
dex
Left Index
Right Index
●
●
●
●
Left
and
Rig
ht In
dex
Left Index
Right Index
●
●●
●
Left
and
Rig
ht In
dex
Left Index
Right Index
●
●●
●
Left
and
Rig
ht In
dex
Left Index
Right Index
●
●
●
●
Left
and
Rig
ht In
dex
Left Index
Right Index
●
●
●
●
Left
and
Rig
ht In
dex
Left Index
Right Index
●
●●
●
Left
and
Rig
ht In
dex
Left Index
Right Index
●
●●
●
Left
and
Rig
ht In
dex
Left Index
Right Index
●
●●
●
Left
and
Rig
ht In
dex
Left Index
Right Index
●
●●
●
Left
and
Rig
ht In
dex
Left Index
Right Index
●
●●
●
Left
and
Rig
ht In
dex
Left Index
Right Index
●
●●
●
Left
and
Rig
ht In
dex
Left Index
Right Index
●
●
●
●
Left
and
Rig
ht In
dex
Left Index
Right Index
●
●●
●
Left
and
Rig
ht In
dex
Left Index
Right Index
●
●
●
●
Left
and
Rig
ht In
dex
Left Index
Right Index
●
●
●
●
Left
and
Rig
ht In
dex
Left Index
Right Index
●
●●
●
Left
and
Rig
ht In
dex
Left Index
Right Index
●
●●
●
Left
and
Rig
ht In
dex
Left Index
Right Index
●
●●
●
Left
and
Rig
ht In
dex
Left Index
Right Index
●
●●
●
Left
and
Rig
ht In
dex
Left Index
Right Index
●
●●
●
Left
and
Rig
ht In
dex
Left Index
Right Index
●
●●
●
Left
and
Rig
ht In
dex
Left Index
Right Index
●
●
●
●
Left
and
Rig
ht In
dex
Left Index
Right Index
●
●
●
●
Left
and
Rig
ht In
dex
Left Index
Right Index
●
●●
●
Left
and
Rig
ht In
dex
Left Index
Right Index
●
●●
●
C1 C2 D1 D2 E1 E2
F1 F2 G1 G2 H1 H2
I1 I2 J1 J2 K1 K2
L1 L2 M1 M2 O1 O2
P1 P2 Q1 Q2 S1 S2
T1 T2 U1 U2 V1 V2
Figure 108: Star plots of relative accuracy for Class A. Values plotted along each radius are log10 of values from Tables 7 through 9, scaled independentlyfrom 0 to 1. Values printed as NA in those tables were set to 1 prior to scaling. 30 000 searches were run against an enrollment set of 100 000 subjects forleft index and right index, and 1 600 000 subjects for left and right index. The intersection point of a radius and the circumference of a circle indicate thescaled values 0, 0.5, and 1, with 1 resting on the outer dashed-gray circle. The title above each plot represents the participant’s letter code found on thefooter of this page and an identifier used to differentiate between the two submissions each participant could make.
C = afis team D = 3M Cogent E = Neurotechnology F = Papillon G = Dermalog H = Hisign Bio-Info InstituteI = NEC J = Sonda K = Tiger IT L = Innovatrics M = SPEX O = ID SolutionsP = id3 Q = Morpho S = Decatur Industries T = BIO-key U = Aware V = AA Technology

FPVTE – FINGERPRINT MATCHING 201
K.2 Class B
Relative FNIR results for left slap, right slap, left and right slap, and IDFlat searches are shown in Figure 109. Some notableobservations include:
. The most accurate submissions (I and Q) are instantly recognizable by their small shape.
. The most accurate submissions are also square, meaning they perform equally well for all finger combinations.
. Most submissions appear to skew towards slightly worse accuracy on left slap and right slap searches, as indicatedby the obtuse angles at the vertices for IDFlats and left and right slap.
. Some submissions, like C, F, H, M, and S, vary significantly as the number of fingers at their disposal changes.
C = afis team D = 3M Cogent E = Neurotechnology F = Papillon G = Dermalog H = Hisign Bio-Info InstituteI = NEC J = Sonda K = Tiger IT L = Innovatrics M = SPEX O = ID SolutionsP = id3 Q = Morpho S = Decatur Industries T = BIO-key U = Aware V = AA Technology

202 FPVTE – FINGERPRINT MATCHING
Iden
tific
atio
n F
lats
Left Slap
Left and Right Slap
Right S
lap
●
●
●
●
●
Iden
tific
atio
n F
lats
Left Slap
Left and Right Slap
Right S
lap
●
●
●
●
●
Iden
tific
atio
n F
lats
Left Slap
Left and Right Slap
Right S
lap
●
●
●
●
●
Iden
tific
atio
n F
lats
Left Slap
Left and Right Slap
Right S
lap
●
●
●
●
●
Iden
tific
atio
n F
lats
Left Slap
Left and Right Slap
Right S
lap
●
●
●
●
●
Iden
tific
atio
n F
lats
Left Slap
Left and Right Slap
Right S
lap
●
●
●
●
●
Iden
tific
atio
n F
lats
Left Slap
Left and Right Slap
Right S
lap
●
●
●
●
●
Iden
tific
atio
n F
lats
Left Slap
Left and Right Slap
Right S
lap
●
●
●
●
●
Iden
tific
atio
n F
lats
Left Slap
Left and Right Slap
Right S
lap
●
●
●
●
●
Iden
tific
atio
n F
lats
Left Slap
Left and Right Slap
Right S
lap
●
●
●
●
●
Iden
tific
atio
n F
lats
Left Slap
Left and Right Slap
Right S
lap
●
●
●
●
●
Iden
tific
atio
n F
lats
Left Slap
Left and Right Slap
Right S
lap
●
●
●
●
●
Iden
tific
atio
n F
lats
Left Slap
Left and Right Slap
Right S
lap
●
●
●
●
●
Iden
tific
atio
n F
lats
Left Slap
Left and Right SlapR
ight Slap
●
●
●
●
●
Iden
tific
atio
n F
lats
Left Slap
Left and Right Slap
Right S
lap
●
●
●
●
●
Iden
tific
atio
n F
lats
Left Slap
Left and Right Slap
Right S
lap
●
●
●
●
●
Iden
tific
atio
n F
lats
Left Slap
Left and Right Slap
Right S
lap
●
●
●
●
●
Iden
tific
atio
n F
lats
Left Slap
Left and Right Slap
Right S
lap
●
●
●
●
●
Iden
tific
atio
n F
lats
Left Slap
Left and Right Slap
Right S
lap
●
●
●
●
●
Iden
tific
atio
n F
lats
Left Slap
Left and Right Slap
Right S
lap
●
●
●
●
●
Iden
tific
atio
n F
lats
Left Slap
Left and Right Slap
Right S
lap
●
●
●
●
●
Iden
tific
atio
n F
lats
Left Slap
Left and Right Slap
Right S
lap
●
●
●
●
●
Iden
tific
atio
n F
lats
Left Slap
Left and Right Slap
Right S
lap
●
●
●
●
●
Iden
tific
atio
n F
lats
Left Slap
Left and Right Slap
Right S
lap
●
●
●
●
●
Iden
tific
atio
n F
lats
Left Slap
Left and Right Slap
Right S
lap
●
●
●
●
●
Iden
tific
atio
n F
lats
Left Slap
Left and Right Slap
Right S
lap
●
●
●
●
●
Iden
tific
atio
n F
lats
Left Slap
Left and Right Slap
Right S
lap
●
●
●
●
●
Iden
tific
atio
n F
lats
Left Slap
Left and Right Slap
Right S
lap
●
●
●
●
●
Iden
tific
atio
n F
lats
Left Slap
Left and Right Slap
Right S
lap
●
●
●
●
●
Iden
tific
atio
n F
lats
Left Slap
Left and Right Slap
Right S
lap
●
●
●
●
●
C1 C2 D1 D2 E1 E2
F1 F2 G1 G2 H1 H2
I1 I2 J1 J2 L1 L2
M1 M2 O1 O2 Q1 Q2
S1 S2 U1 U2 V1 V2
Figure 109: Star plots of relative accuracy for Class B. Values plotted along each radius are log10 of values from Tables 10 through 13, scaled independentlyfrom 0 to 1. Values printed as NA in those tables were set to 1 prior to scaling. 30 000 searches were run against an enrollment set of 3 000 000 subjects.The intersection point of a radius and the circumference of a circle indicate the scaled values 0, 0.5, and 1, with 1 resting on the outer dashed-gray circle.The title above each plot represents the participant’s letter code found on the footer of this page and an identifier used to differentiate between the twosubmissions each participant could make.
C = afis team D = 3M Cogent E = Neurotechnology F = Papillon G = Dermalog H = Hisign Bio-Info InstituteI = NEC J = Sonda K = Tiger IT L = Innovatrics M = SPEX O = ID SolutionsP = id3 Q = Morpho S = Decatur Industries T = BIO-key U = Aware V = AA Technology

FPVTE – FINGERPRINT MATCHING 203
K.3 Class C
Relative FNIR results for ten-finger plain-to-plain, ten-finger rolled-to-rolled, and ten-finger plain-to-rolled searches areshown in Figure 110. Some notable observations include:
. The most accurate submissions (D, I, and Q) are instantly recognizable by their small shape and are seeminglyequilateral, indicating that they perform equally well for all finger combinations.
. Many submissions had lower accuracy with plain-to-rolled searching over searching homogeneous impressions,including F, G, and M.
C = afis team D = 3M Cogent E = Neurotechnology F = Papillon G = Dermalog H = Hisign Bio-Info InstituteI = NEC J = Sonda K = Tiger IT L = Innovatrics M = SPEX O = ID SolutionsP = id3 Q = Morpho S = Decatur Industries T = BIO-key U = Aware V = AA Technology

204 FPVTE – FINGERPRINT MATCHING
Pla
in−
to−
Rol
led
Plain−to−Plain
Rolled−
to−R
olled
●
●●
●
Pla
in−
to−
Rol
led
Plain−to−Plain
Rolled−
to−R
olled
●
●●
●
Pla
in−
to−
Rol
led
Plain−to−Plain
Rolled−
to−R
olled
●
●●
●
Pla
in−
to−
Rol
led
Plain−to−Plain
Rolled−
to−R
olled
●
●●
●
Pla
in−
to−
Rol
led
Plain−to−PlainR
olled−to−
Rolled
●
●●
●
Pla
in−
to−
Rol
led
Plain−to−Plain
Rolled−
to−R
olled
●
●●
●
Pla
in−
to−
Rol
led
Plain−to−Plain
Rolled−
to−R
olled
●
●
●
●
Pla
in−
to−
Rol
led
Plain−to−Plain
Rolled−
to−R
olled
●
●
●
●
Pla
in−
to−
Rol
led
Plain−to−Plain
Rolled−
to−R
olled
●
●●
●
Pla
in−
to−
Rol
led
Plain−to−PlainR
olled−to−
Rolled
●
●●
●
Pla
in−
to−
Rol
led
Plain−to−Plain
Rolled−
to−R
olled
●
●●
●
Pla
in−
to−
Rol
led
Plain−to−Plain
Rolled−
to−R
olled
●
●●
●
Pla
in−
to−
Rol
led
Plain−to−Plain
Rolled−
to−R
olled
●
●●
●
Pla
in−
to−
Rol
led
Plain−to−Plain
Rolled−
to−R
olled
●
●●
●
Pla
in−
to−
Rol
led
Plain−to−Plain
Rolled−
to−R
olled
●
●●
●
Pla
in−
to−
Rol
led
Plain−to−Plain
Rolled−
to−R
olled
●
●●
●
Pla
in−
to−
Rol
led
Plain−to−Plain
Rolled−
to−R
olled
●
●●
●
Pla
in−
to−
Rol
led
Plain−to−Plain
Rolled−
to−R
olled
●
●●
●
Pla
in−
to−
Rol
led
Plain−to−Plain
Rolled−
to−R
olled
●
●
●
●
Pla
in−
to−
Rol
led
Plain−to−Plain
Rolled−
to−R
olled
●
●
●
●
Pla
in−
to−
Rol
led
Plain−to−Plain
Rolled−
to−R
olled
●
●●
●
Pla
in−
to−
Rol
led
Plain−to−Plain
Rolled−
to−R
olled
●
●●
●
Pla
in−
to−
Rol
led
Plain−to−Plain
Rolled−
to−R
olled
●
●●
●
Pla
in−
to−
Rol
led
Plain−to−Plain
Rolled−
to−R
olled
●
●●
●
Pla
in−
to−
Rol
led
Plain−to−Plain
Rolled−
to−R
olled
●
●●
●
Pla
in−
to−
Rol
led
Plain−to−Plain
Rolled−
to−R
olled
●
●●
●
Pla
in−
to−
Rol
led
Plain−to−Plain
Rolled−
to−R
olled
●
●●
●
Pla
in−
to−
Rol
led
Plain−to−Plain
Rolled−
to−R
olled
●
●●
●
Pla
in−
to−
Rol
led
Plain−to−Plain
Rolled−
to−R
olled
●
●
●
●
Pla
in−
to−
Rol
led
Plain−to−Plain
Rolled−
to−R
olled
●
●●
●
C1 C2 D1 D2 E1 E2
F1 F2 G1 G2 H1 H2
I1 I2 J1 J2 L1 L2
M1 M2 O1 O2 Q1 Q2
S1 S2 U1 U2 V1 V2
Figure 110: Star plots of relative accuracy for Class C. Values plotted along each radius are log10 of values from Tables 14 through 16, scaled indepen-dently from 0 to 1. Values printed as NA in those tables were set to 1 prior to scaling. 30 000 searches were run against an enrollment set of 5 000 000subjects. The intersection point of a radius and the circumference of a circle indicate the scaled values 0, 0.5, and 1, with 1 resting on the outer dashed-gray circle. The title above each plot represents the participant’s letter code found on the footer of this page and an identifier used to differentiatebetween the two submissions each participant could make.
C = afis team D = 3M Cogent E = Neurotechnology F = Papillon G = Dermalog H = Hisign Bio-Info InstituteI = NEC J = Sonda K = Tiger IT L = Innovatrics M = SPEX O = ID SolutionsP = id3 Q = Morpho S = Decatur Industries T = BIO-key U = Aware V = AA Technology

FPVTE – FINGERPRINT MATCHING 205
K.4 All Classes
Relative FNIR results for left and right index, IDFlat, and ten-finger rolled-to-rolled searches are shown in Figure 111.Note that the enrollment set sizes differed between all three finger searching combinations. Some notable observationsinclude:
. The top-performing submissions from Class A, B, and C (D, I, Q, and V) are instantly recognizable by their smallshape.
. Many of the most accurate submissions from all three classes appear equally as accurate in each individual class.
. If a submission had trouble with a particular class in FpVTE, it appears to be Class C, as seen by the long linesegments extending from the ten-finger rolled-to-rolled vertex in most plots that do not contain a mostly equilateraltriangle.
C = afis team D = 3M Cogent E = Neurotechnology F = Papillon G = Dermalog H = Hisign Bio-Info InstituteI = NEC J = Sonda K = Tiger IT L = Innovatrics M = SPEX O = ID SolutionsP = id3 Q = Morpho S = Decatur Industries T = BIO-key U = Aware V = AA Technology

206 FPVTE – FINGERPRINT MATCHING
Rol
led−
to−
Rol
led
Left and Right Index
Identification Flats
●
●
●
●
Rol
led−
to−
Rol
led
Left and Right Index
Identification Flats
●
●
●
●
Rol
led−
to−
Rol
led
Left and Right Index
Identification Flats
●
●●
●
Rol
led−
to−
Rol
led
Left and Right Index
Identification Flats
●
●●
●
Rol
led−
to−
Rol
led
Left and Right Index
Identification Flats
●
●
●
●
Rol
led−
to−
Rol
led
Left and Right Index
Identification Flats
●
●●
●
Rol
led−
to−
Rol
led
Left and Right Index
Identification Flats
●
●●
●
Rol
led−
to−
Rol
led
Left and Right Index
Identification Flats
●
●●
●
Rol
led−
to−
Rol
led
Left and Right Index
Identification Flats
●
●
●
●
Rol
led−
to−
Rol
led
Left and Right IndexIdentification F
lats
●
●
●
●
Rol
led−
to−
Rol
led
Left and Right Index
Identification Flats
●
●●
●
Rol
led−
to−
Rol
led
Left and Right Index
Identification Flats
●
●●
●
Rol
led−
to−
Rol
led
Left and Right Index
Identification Flats
●
●●
●
Rol
led−
to−
Rol
led
Left and Right Index
Identification Flats
●
●●
●
Rol
led−
to−
Rol
led
Left and Right IndexIdentification F
lats
●
●●
●
Rol
led−
to−
Rol
led
Left and Right Index
Identification Flats
●
●●
●
Rol
led−
to−
Rol
led
Left and Right Index
Identification Flats
●
●
●
●
Rol
led−
to−
Rol
led
Left and Right Index
Identification Flats
●
●
●
●
Rol
led−
to−
Rol
led
Left and Right Index
Identification Flats
●
●
●
●
Rol
led−
to−
Rol
led
Left and Right Index
Identification Flats
●
●
●
●
Rol
led−
to−
Rol
led
Left and Right Index
Identification Flats
●
●●
●
Rol
led−
to−
Rol
led
Left and Right Index
Identification Flats
●
●●
●
Rol
led−
to−
Rol
led
Left and Right Index
Identification Flats
●
●●
●
Rol
led−
to−
Rol
led
Left and Right Index
Identification Flats
●
●●
●
Rol
led−
to−
Rol
led
Left and Right Index
Identification Flats
●
●
●
●
Rol
led−
to−
Rol
led
Left and Right Index
Identification Flats
●
●
●
●
Rol
led−
to−
Rol
led
Left and Right Index
Identification Flats
●
●
●
●
Rol
led−
to−
Rol
led
Left and Right Index
Identification Flats
●
●
●
●
Rol
led−
to−
Rol
led
Left and Right Index
Identification Flats
●
●●
●
Rol
led−
to−
Rol
led
Left and Right Index
Identification Flats
●
●●
●
C1 C2 D1 D2 E1 E2
F1 F2 G1 G2 H1 H2
I1 I2 J1 J2 L1 L2
M1 M2 O1 O2 Q1 Q2
S1 S2 U1 U2 V1 V2
Figure 111: Star plots of relative accuracy for two-index finger, IDFlat, and ten-finger rolled-to-rolled comparisons. Values plotted along each radiusare log10 of values from Tables 9, 13, and 15, scaled independently from 0 to 1. Values printed as NA in those tables were set to 1 prior to scaling.30 000 searches were run against an enrollment set of 1 600 000 subjects for left and right index, 3 000 000 subjects for IDFlats, and 5 000 000 subjects forten-finger rolled-to-rolled. The intersection point of a radius and the circumference of a circle indicate the scaled values 0, 0.5, and 1, with 1 resting onthe outer dashed-gray circle. The title above each plot represents the participant’s letter code found on the footer of this page and an identifier used todifferentiate between the two submissions each participant could make.
C = afis team D = 3M Cogent E = Neurotechnology F = Papillon G = Dermalog H = Hisign Bio-Info InstituteI = NEC J = Sonda K = Tiger IT L = Innovatrics M = SPEX O = ID SolutionsP = id3 Q = Morpho S = Decatur Industries T = BIO-key U = Aware V = AA Technology

FPVTE – FINGERPRINT MATCHING 207
L Combined Sorted Rankings for a Theoretical Use Case
In prior sections, numerous tables and plots were presented showcasing individual statistics of participant submissions.Tables 91 through 98 attempt to coalesce all the presented identification statistics and categorize the overall performanceof the submissions. Note that these rankings are theoretical and do not imply quality or endorsement of any kind. Pleaseread the disclaimer for more information.
For each statistic, the values and overall ranks from Sections 7 through 9 are displayed. The Score column is computedby weighting percentiles of the results per class. The weights and percentiles were chosen based on values that providedreasonable and consistent results across all enrollment sets for all classes.
. Search Template Enrollment Time+2B ⇐⇒ Vf ≤ P10 or
+b ⇐⇒ Vf ≤ P15 or
−b ⇐⇒ Vf ≥ P85
. FNIR+(N −RFNIR)
+5B ⇐⇒ Vf ≤ P5 or
+3B ⇐⇒ Vf ≤ P15 or
+B ⇐⇒ Vf ≤ P5 or
−5B ⇐⇒ Vf ≥ P95 or
−3B ⇐⇒ Vf ≥ P90 or
−B ⇐⇒ Vf ≥ P75
. RAM Consumption+2b ⇐⇒ Vf ≤ P10 or
+b ⇐⇒ Vf ≤ P15 or
−2B ⇐⇒ Vf ≥ P85
. Identification Time+(N −RTime)
+2B ⇐⇒ Vf ≤ P10 or
+B ⇐⇒ Vf ≤ P15 or
−2B ⇐⇒ Vf ≥ P90 or
−B ⇐⇒ Vf ≥ P85
where N = number of participants for finger
B =max (N/2.0, 15)
b =max (N/6.0, 3)
Rf = submission’s rank for factor fVf = submission’s value for factor f
Px = xthpercentile of Vf
As shown, the primary factors used in scoring were accuracy and identification speed. While enrollment speed is im-portant, the FpVTE API limited the time that could be used, and most participants completed enrollment in a relativelysimilar timeframe. Using a very high amount of RAM was penalized heavily, as greater amounts of RAM require addi-tional compute nodes, while less RAM could allow additional identification processes to be run, decreasing search time.High accuracy was rewarded the most of any factor—regardless of how fast or resource-friendly a submission is, it doesn’tmatter if the results are incorrect.
The color bands are indicative of the 80th percentile, 55th percentile, and below. The best performance in each category isshaded in green and the worst in pink. Time values in the Identification and Enroll columns are reported in seconds, butwere originally recorded to microsecond precision. RAM is the sum of the resident set sizes of the stage one identificationprocesses over all compute nodes after returning from the identification stage one initialization method.
Some notable observations from Tables 90 through 98 include:
. Some of the most accurate submissions used such a small amount of RAM that only a single compute node wasnecessary.
. The most accurate submissions did not use the entire 90 seconds to perform identifications. This dramatically re-duced the score given to submissions that used the maximum amount of time but were not with the top accuracyrange.
C = afis team D = 3M Cogent E = Neurotechnology F = Papillon G = Dermalog H = Hisign Bio-Info InstituteI = NEC J = Sonda K = Tiger IT L = Innovatrics M = SPEX O = ID SolutionsP = id3 Q = Morpho S = Decatur Industries T = BIO-key U = Aware V = AA Technology

208 FPVTE – FINGERPRINT MATCHING
. In Class C, there are a number of submissions that achieve an “acceptable” level of accuracy in much less time thanthe most accurate submissions.
C = afis team D = 3M Cogent E = Neurotechnology F = Papillon G = Dermalog H = Hisign Bio-Info InstituteI = NEC J = Sonda K = Tiger IT L = Innovatrics M = SPEX O = ID SolutionsP = id3 Q = Morpho S = Decatur Industries T = BIO-key U = Aware V = AA Technology

FPVTE – FINGERPRINT MATCHING 209
ParticipantScore FNIR Identification Enrollment RAM
Letter Sub. #
<20
seco
nds
D 1 109 1 0.0197 20 7.32 29 1.43 19 0.61
L 1 95 8 0.0625 2 0.29 1 0.05 26 1.14
V 1 82 4 0.0253 19 6.01 10 0.32 17 0.39
Q 2 79 3 0.0226 24 10.43 19 0.54 14 0.34
Q 1 74 2 0.0222 28 15.70 19 0.54 13 0.34
I 1 73 5 0.0257 22 9.94 30 1.46 20 0.70
J 1 73 14 0.0786 4 0.54 11 0.32 9 0.32
O 1 60 15 0.0818 5 0.62 4 0.27 15 0.35
E 1 59 12 0.0745 3 0.35 13 0.35 25 1.12
L 2 57 6 0.0351 12 3.32 3 0.15 28 2.32
C 1 50 24 0.1335 1 0.26 17 0.39 7 0.18
O 2 43 13 0.0766 9 1.56 4 0.27 15 0.35
T 2 43 9 0.0685 18 5.97 8 0.31 1 0.01
J 2 43 10 0.0712 7 1.25 11 0.32 9 0.32
F 2 27 18 0.1082 14 3.56 25 1.07 5 0.18
P 2 25 22 0.1272 13 3.33 15 0.36 22 0.78
F 1 24 20 0.1111 11 2.49 25 1.07 6 0.18
G 1 20 19 0.1089 21 9.74 21 0.55 18 0.57
C 2 14 25 0.1337 6 0.76 17 0.39 8 0.18
P 1 14 23 0.1308 8 1.32 15 0.36 23 0.78
S 1 10 7 0.0571 29 16.86 22 0.88 21 0.72
H 1 5 26 0.1576 15 3.61 6 0.30 11 0.33
H 2 1 27 0.1607 17 4.13 6 0.30 11 0.33
U 1 −2 21 0.1218 27 14.42 2 0.15 27 1.70
K 2 −10 16 0.0875 23 10.32 23 1.05 30 3.87
E 2 −11 11 0.0723 30 16.90 13 0.35 24 1.11
K 1 −12 17 0.0883 25 10.44 23 1.05 29 3.87
M 1 −49 29 0.2995 10 1.84 27 1.07 3 0.14
T 1 −51 30 NA 16 3.99 8 0.31 2 0.01
M 2 −55 28 0.2921 26 10.70 27 1.07 4 0.14
≥20
seco
nds
D 2 84 1 0.0197 3 41.84 5 1.42 3 0.61
S 2 4 4 0.0650 4 44.66 4 0.88 4 0.72
I 2 3 3 0.0278 2 40.99 6 2.15 5 1.04
V 2 −5 2 0.0252 6 65.35 2 0.32 1 0.39
G 2 −13 5 0.1086 5 54.03 3 0.55 2 0.57
U 2 −40 6 0.1178 1 24.16 1 0.15 6 1.42
Table 90: Tabulation of operationally-ranked results for Class A — Left Index. Submissions were split into two groups. The first group includessubmissions that performed searches on average in less than 20 seconds, and the second includes those that took, on average, 20 seconds or longer.Letter refers to the participant’s letter code found on the footer of this page. Sub. # is an identifier used to differentiate between the two submissions eachparticipant could make. Score refers to the sum of the scoring equations shown in Appendix L. The color bands are indicative of the 80th percentile,55th percentile, and below of the Score column. The FNIR column was computed at the score threshold that gave FPIR = 10−3. NA indicates that theoperations required to produce the value could not be performed. The Identification column shows the time used to perform a search over an enrollmentset of 100 000, as seen in Table 17. The Enrollment column shows the time used to create a search template to be used for a query, as seen in Table 72.Identification and Enrollment durations are reported in seconds, but were originally recorded to microsecond precision. RAM refers to the sum of theresident set sizes of the stage one identification processes over all compute nodes after returning from the identification stage one initialization method,as seen in Table 60. RAM is reported in gigabytes, where 1 GB is equal to 1 073 741 824 bytes. The number to the left of a value provides the value’scolumn-wise ranking, with the best performance shaded in green and the worst in pink. The table is sorted on descending Score.
C = afis team D = 3M Cogent E = Neurotechnology F = Papillon G = Dermalog H = Hisign Bio-Info InstituteI = NEC J = Sonda K = Tiger IT L = Innovatrics M = SPEX O = ID SolutionsP = id3 Q = Morpho S = Decatur Industries T = BIO-key U = Aware V = AA Technology

210 FPVTE – FINGERPRINT MATCHING
ParticipantScore FNIR Identification Enrollment RAM
Letter Sub. #
<20
seco
nds
Q 2 111 2 0.0214 23 9.98 19 0.54 11 0.33
D 1 109 1 0.0190 20 7.46 29 1.43 19 0.61
L 1 95 8 0.0505 2 0.26 1 0.05 26 1.14
V 1 81 5 0.0223 18 5.60 10 0.32 17 0.39
E 1 76 11 0.0630 3 0.32 13 0.36 24 1.07
I 1 74 3 0.0215 22 9.83 30 1.46 20 0.69
O 1 58 17 0.0776 5 0.56 4 0.27 15 0.34
L 2 57 6 0.0295 13 3.26 3 0.16 28 2.32
J 1 55 16 0.0708 4 0.51 11 0.33 10 0.31
C 1 50 24 0.1132 1 0.24 17 0.39 7 0.17
Q 1 43 4 0.0218 28 14.24 19 0.54 11 0.33
O 2 43 13 0.0675 9 1.36 4 0.27 16 0.34
T 2 43 9 0.0562 19 5.87 8 0.31 1 0.01
J 2 41 12 0.0643 7 1.13 11 0.33 9 0.31
F 2 27 18 0.0903 15 3.60 25 1.09 5 0.17
P 2 25 22 0.1100 12 3.07 15 0.37 23 0.76
F 1 24 20 0.0933 11 2.38 25 1.09 6 0.17
G 1 20 19 0.0910 24 10.10 21 0.55 18 0.57
C 2 16 23 0.1124 6 0.69 17 0.39 8 0.18
P 1 12 25 0.1133 8 1.24 15 0.37 22 0.76
S 1 9 7 0.0442 30 16.55 22 0.88 21 0.71
H 1 5 26 0.1230 14 3.56 6 0.30 14 0.33
H 2 1 27 0.1249 17 4.05 6 0.30 13 0.33
U 1 −3 21 0.0996 27 10.76 2 0.15 27 1.56
K 2 −9 15 0.0685 25 10.27 23 1.05 29 3.87
K 1 −9 14 0.0682 26 10.42 23 1.05 30 3.87
E 2 −10 10 0.0624 29 16.27 13 0.36 25 1.07
T 1 −19 28 0.1929 16 3.73 8 0.31 1 0.01
M 1 −50 30 0.2615 10 1.78 27 1.09 3 0.14
M 2 −80 29 0.2526 21 9.39 27 1.09 3 0.14
≥20
seco
nds
D 2 84 1 0.0190 2 28.64 5 1.43 3 0.61
I 2 19 2 0.0214 3 40.35 6 2.15 5 1.01
S 2 4 4 0.0503 4 46.05 4 0.88 4 0.71
G 2 −13 5 0.0909 5 59.55 3 0.55 2 0.57
V 2 −21 3 0.0222 6 61.24 2 0.32 1 0.39
U 2 −40 6 0.1007 1 20.10 1 0.15 6 1.30
Table 91: Tabulation of operationally-ranked results for Class A — Right Index. Submissions were split into two groups. The first group includessubmissions that performed searches on average in less than 20 seconds, and the second includes those that took, on average, 20 seconds or longer.Letter refers to the participant’s letter code found on the footer of this page. Sub. # is an identifier used to differentiate between the two submissions eachparticipant could make. Score refers to the sum of the scoring equations shown in Appendix L. The color bands are indicative of the 80th percentile,55th percentile, and below of the Score column. The FNIR column was computed at the score threshold that gave FPIR = 10−3. The Identification columnshows the time used to perform a search over an enrollment set of 100 000, as seen in Table 17. The Enrollment column shows the time used to create asearch template to be used for a query, as seen in Table 73. Identification and Enrollment durations are reported in seconds, but were originally recordedto microsecond precision. RAM refers to the sum of the resident set sizes of the stage one identification processes over all compute nodes after returningfrom the identification stage one initialization method, as seen in Table 61. RAM is reported in gigabytes, where 1 GB is equal to 1 073 741 824 bytes. Thenumber to the left of a value provides the value’s column-wise ranking, with the best performance shaded in green and the worst in pink. The table issorted on descending Score.
C = afis team D = 3M Cogent E = Neurotechnology F = Papillon G = Dermalog H = Hisign Bio-Info InstituteI = NEC J = Sonda K = Tiger IT L = Innovatrics M = SPEX O = ID SolutionsP = id3 Q = Morpho S = Decatur Industries T = BIO-key U = Aware V = AA Technology

FPVTE – FINGERPRINT MATCHING 211
ParticipantScore FNIR Identification Enrollment RAM
Letter Sub. #
<20
seco
nds
V 1 87 1 0.0034 5 9.29 3 0.64 5 11.77
L 1 43 4 0.0146 2 2.19 1 0.11 8 18.76
J 1 24 3 0.0143 6 13.64 4 0.65 3 8.30
I 1 19 2 0.0058 8 17.87 9 2.93 6 15.83
C 1 12 7 0.0368 1 2.08 5 0.78 2 4.87
O 1 9 5 0.0229 7 14.46 2 0.53 4 9.05
C 2 −3 8 0.0374 4 6.35 5 0.78 1 4.87
K 1 −44 6 0.0360 9 18.01 8 2.09 9 61.81
G 1 −69 9 0.0515 3 5.22 7 1.09 7 16.38
≥20
seco
nds
Q 2 109 1 0.0027 19 161.02 15 1.08 9 9.14
Q 1 107 1 0.0027 21 212.69 15 1.08 10 9.14
L 2 89 7 0.0072 3 23.42 3 0.31 26 53.98
V 2 78 3 0.0028 18 127.65 9 0.64 13 11.77
D 1 74 4 0.0030 15 70.99 25 2.84 17 18.58
E 1 71 11 0.0207 1 16.35 11 0.70 22 33.40
S 1 70 13 0.0281 2 23.00 18 1.75 14 14.82
D 2 68 4 0.0030 23 237.43 26 2.84 17 18.58
J 2 39 8 0.0143 7 33.35 10 0.65 7 8.30
O 2 36 12 0.0214 10 43.53 4 0.53 8 9.05
I 2 36 4 0.0030 25 338.88 27 4.30 21 30.83
T 2 35 19 0.0366 9 37.23 7 0.62 1 0.01
U 1 26 17 0.0336 11 45.51 1 0.30 25 44.63
P 2 21 16 0.0333 17 101.16 13 0.72 19 21.41
P 1 20 20 0.0370 14 63.65 13 0.72 20 21.42
G 2 17 15 0.0311 22 221.16 17 1.09 16 16.38
H 1 7 24 0.0686 8 36.71 5 0.60 12 9.36
F 1 5 21 0.0386 13 60.66 21 2.15 5 4.86
K 2 4 14 0.0286 6 32.93 20 2.09 27 61.81
H 2 4 23 0.0684 12 52.25 5 0.60 11 9.36
F 2 2 22 0.0412 16 73.95 21 2.15 5 4.86
U 2 −3 18 0.0358 24 240.40 1 0.30 24 37.35
S 2 −11 9 0.0195 26 495.50 18 1.75 14 14.82
E 2 −13 10 0.0202 27 518.11 11 0.70 23 33.41
T 1 −28 27 NA 4 25.68 7 0.62 1 0.01
M 2 −36 25 NA 20 171.24 23 2.16 4 3.76
M 1 −48 26 NA 5 31.44 23 2.16 3 3.75
Table 92: Tabulation of operationally-ranked results for Class A — Left and Right Index. Submissions were split into two groups. The first groupincludes submissions that performed searches on average in less than 20 seconds, and the second includes those that took, on average, 20 secondsor longer. Letter refers to the participant’s letter code found on the footer of this page. Sub. # is an identifier used to differentiate between the twosubmissions each participant could make. Score refers to the sum of the scoring equations shown in Appendix L. The color bands are indicative of the80th percentile, 55th percentile, and below of the Score column. The FNIR column was computed at the score threshold that gave FPIR = 10−3. NAindicates that the operations required to produce the value could not be performed. The Identification column shows the time used to perform a searchover an enrollment set of 1 600 000, as seen in Table 18. The Enrollment column shows the time used to create a search template to be used for a query,as seen in Table 74. Identification and Enrollment durations are reported in seconds, but were originally recorded to microsecond precision. RAM refersto the sum of the resident set sizes of the stage one identification processes over all compute nodes after returning from the identification stage oneinitialization method, as seen in Table 62. RAM is reported in gigabytes, where 1 GB is equal to 1 073 741 824 bytes. The number to the left of a valueprovides the value’s column-wise ranking, with the best performance shaded in green and the worst in pink. The table is sorted on descending Score.
C = afis team D = 3M Cogent E = Neurotechnology F = Papillon G = Dermalog H = Hisign Bio-Info InstituteI = NEC J = Sonda K = Tiger IT L = Innovatrics M = SPEX O = ID SolutionsP = id3 Q = Morpho S = Decatur Industries T = BIO-key U = Aware V = AA Technology
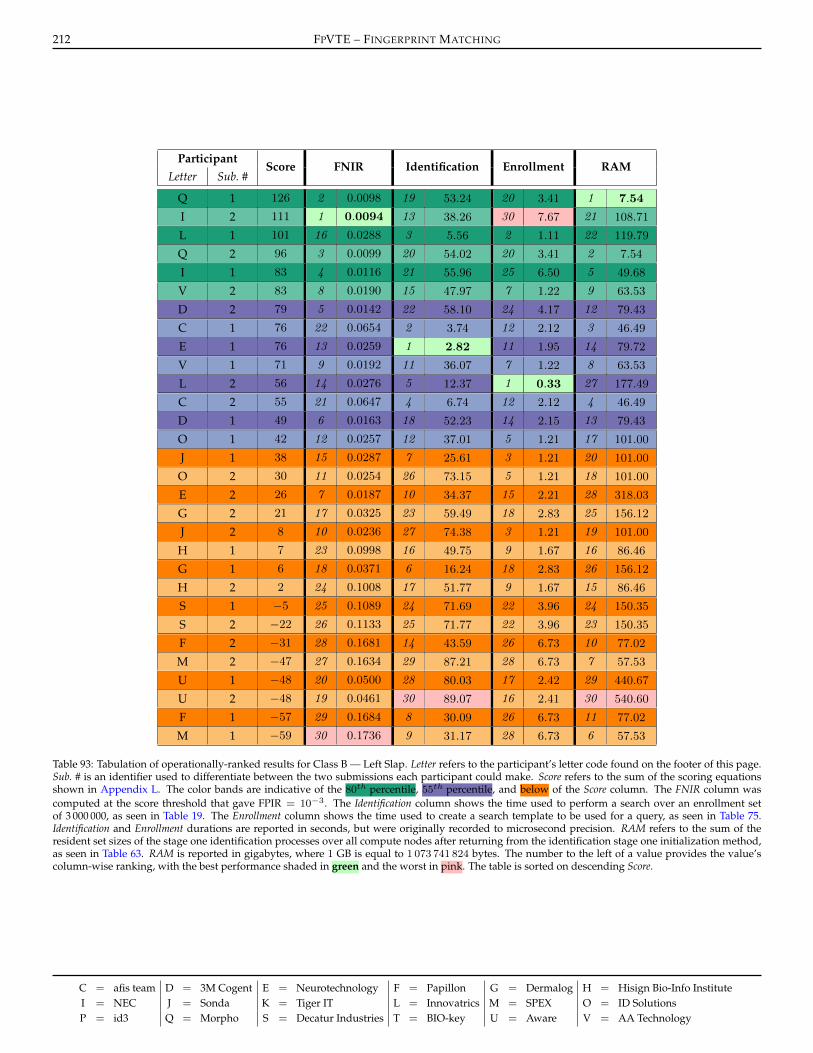
212 FPVTE – FINGERPRINT MATCHING
ParticipantScore FNIR Identification Enrollment RAM
Letter Sub. #
Q 1 126 2 0.0098 19 53.24 20 3.41 1 7.54
I 2 111 1 0.0094 13 38.26 30 7.67 21 108.71
L 1 101 16 0.0288 3 5.56 2 1.11 22 119.79
Q 2 96 3 0.0099 20 54.02 20 3.41 2 7.54
I 1 83 4 0.0116 21 55.96 25 6.50 5 49.68
V 2 83 8 0.0190 15 47.97 7 1.22 9 63.53
D 2 79 5 0.0142 22 58.10 24 4.17 12 79.43
C 1 76 22 0.0654 2 3.74 12 2.12 3 46.49
E 1 76 13 0.0259 1 2.82 11 1.95 14 79.72
V 1 71 9 0.0192 11 36.07 7 1.22 8 63.53
L 2 56 14 0.0276 5 12.37 1 0.33 27 177.49
C 2 55 21 0.0647 4 6.74 12 2.12 4 46.49
D 1 49 6 0.0163 18 52.23 14 2.15 13 79.43
O 1 42 12 0.0257 12 37.01 5 1.21 17 101.00
J 1 38 15 0.0287 7 25.61 3 1.21 20 101.00
O 2 30 11 0.0254 26 73.15 5 1.21 18 101.00
E 2 26 7 0.0187 10 34.37 15 2.21 28 318.03
G 2 21 17 0.0325 23 59.49 18 2.83 25 156.12
J 2 8 10 0.0236 27 74.38 3 1.21 19 101.00
H 1 7 23 0.0998 16 49.75 9 1.67 16 86.46
G 1 6 18 0.0371 6 16.24 18 2.83 26 156.12
H 2 2 24 0.1008 17 51.77 9 1.67 15 86.46
S 1 −5 25 0.1089 24 71.69 22 3.96 24 150.35
S 2 −22 26 0.1133 25 71.77 22 3.96 23 150.35
F 2 −31 28 0.1681 14 43.59 26 6.73 10 77.02
M 2 −47 27 0.1634 29 87.21 28 6.73 7 57.53
U 1 −48 20 0.0500 28 80.03 17 2.42 29 440.67
U 2 −48 19 0.0461 30 89.07 16 2.41 30 540.60
F 1 −57 29 0.1684 8 30.09 26 6.73 11 77.02
M 1 −59 30 0.1736 9 31.17 28 6.73 6 57.53
Table 93: Tabulation of operationally-ranked results for Class B — Left Slap. Letter refers to the participant’s letter code found on the footer of this page.Sub. # is an identifier used to differentiate between the two submissions each participant could make. Score refers to the sum of the scoring equationsshown in Appendix L. The color bands are indicative of the 80th percentile, 55th percentile, and below of the Score column. The FNIR column wascomputed at the score threshold that gave FPIR = 10−3. The Identification column shows the time used to perform a search over an enrollment setof 3 000 000, as seen in Table 19. The Enrollment column shows the time used to create a search template to be used for a query, as seen in Table 75.Identification and Enrollment durations are reported in seconds, but were originally recorded to microsecond precision. RAM refers to the sum of theresident set sizes of the stage one identification processes over all compute nodes after returning from the identification stage one initialization method,as seen in Table 63. RAM is reported in gigabytes, where 1 GB is equal to 1 073 741 824 bytes. The number to the left of a value provides the value’scolumn-wise ranking, with the best performance shaded in green and the worst in pink. The table is sorted on descending Score.
C = afis team D = 3M Cogent E = Neurotechnology F = Papillon G = Dermalog H = Hisign Bio-Info InstituteI = NEC J = Sonda K = Tiger IT L = Innovatrics M = SPEX O = ID SolutionsP = id3 Q = Morpho S = Decatur Industries T = BIO-key U = Aware V = AA Technology

FPVTE – FINGERPRINT MATCHING 213
ParticipantScore FNIR Identification Enrollment RAM
Letter Sub. #
I 2 113 1 0.0045 14 41.13 30 7.65 21 108.71
D 2 113 2 0.0052 21 57.19 24 4.13 12 79.43
L 1 102 15 0.0167 3 5.47 2 1.11 22 119.78
Q 2 91 3 0.0057 22 61.94 20 3.41 2 7.54
Q 1 90 3 0.0057 23 64.04 20 3.41 1 7.54
V 1 87 8 0.0106 11 35.43 3 1.19 8 63.53
I 1 82 5 0.0058 20 55.87 25 6.47 5 49.68
E 1 75 13 0.0151 1 2.97 11 1.91 14 79.72
V 2 66 9 0.0110 16 48.51 3 1.19 9 63.53
C 1 55 24 0.0403 2 3.67 12 2.09 4 46.49
D 1 50 6 0.0072 19 53.32 14 2.14 13 79.43
J 1 44 14 0.0156 7 24.14 5 1.20 18 101.00
C 2 43 23 0.0392 4 6.50 12 2.09 3 46.49
O 1 37 12 0.0142 12 35.61 7 1.20 17 101.00
L 2 37 17 0.0202 6 12.66 1 0.33 27 177.49
G 2 31 16 0.0198 13 37.28 18 2.78 25 156.12
E 2 26 7 0.0083 10 34.47 15 2.18 28 318.00
G 1 22 18 0.0212 5 10.13 18 2.78 26 156.12
S 2 14 22 0.0381 25 70.84 22 3.88 24 150.35
S 1 14 21 0.0369 24 70.54 22 3.88 23 150.35
J 2 13 10 0.0126 27 74.09 5 1.20 19 101.00
O 2 8 11 0.0132 26 73.93 7 1.20 20 101.00
H 1 3 25 0.0641 17 50.16 9 1.63 16 86.46
H 2 1 26 0.0647 18 52.84 9 1.63 15 86.46
F 2 −32 28 0.1220 15 45.92 26 6.68 10 77.02
M 2 −47 27 0.1155 29 87.41 28 6.69 6 57.53
U 1 −48 19 0.0266 30 89.26 16 2.39 29 440.67
U 2 −48 20 0.0273 28 80.11 17 2.39 30 540.59
F 1 −57 29 0.1222 8 31.87 26 6.68 11 77.02
M 1 −59 30 0.1259 9 32.03 28 6.69 7 57.53
Table 94: Tabulation of operationally-ranked results for Class B — Right Slap. Letter refers to the participant’s letter code found on the footer of this page.Sub. # is an identifier used to differentiate between the two submissions each participant could make. Score refers to the sum of the scoring equationsshown in Appendix L. The color bands are indicative of the 80th percentile, 55th percentile, and below of the Score column. The FNIR column wascomputed at the score threshold that gave FPIR = 10−3. The Identification column shows the time used to perform a search over an enrollment setof 3 000 000, as seen in Table 19. The Enrollment column shows the time used to create a search template to be used for a query, as seen in Table 76.Identification and Enrollment durations are reported in seconds, but were originally recorded to microsecond precision. RAM refers to the sum of theresident set sizes of the stage one identification processes over all compute nodes after returning from the identification stage one initialization method,as seen in Table 63. RAM is reported in gigabytes, where 1 GB is equal to 1 073 741 824 bytes. The number to the left of a value provides the value’scolumn-wise ranking, with the best performance shaded in green and the worst in pink. The table is sorted on descending Score.
C = afis team D = 3M Cogent E = Neurotechnology F = Papillon G = Dermalog H = Hisign Bio-Info InstituteI = NEC J = Sonda K = Tiger IT L = Innovatrics M = SPEX O = ID SolutionsP = id3 Q = Morpho S = Decatur Industries T = BIO-key U = Aware V = AA Technology

214 FPVTE – FINGERPRINT MATCHING
ParticipantScore FNIR Identification Enrollment RAM
Letter Sub. #
Q 1 123 2 0.0021 22 65.02 20 6.84 2 7.54
I 2 110 1 0.0015 17 46.13 30 15.33 21 108.71
Q 2 94 3 0.0022 19 53.40 20 6.84 1 7.54
I 1 92 3 0.0022 13 37.19 25 12.96 5 49.68
L 1 89 12 0.0054 4 10.48 2 2.23 22 119.77
V 1 87 7 0.0036 15 38.93 7 2.40 9 63.53
V 2 81 7 0.0036 18 52.80 7 2.40 8 63.53
D 2 76 5 0.0024 21 63.05 24 8.28 13 79.43
E 1 72 15 0.0063 2 6.12 11 3.85 14 79.72
D 1 48 6 0.0031 20 61.24 14 4.28 12 79.43
G 1 41 18 0.0106 1 3.89 18 5.62 26 156.12
L 2 40 14 0.0062 6 20.78 1 0.66 27 177.49
O 1 39 13 0.0057 14 38.34 3 2.40 20 101.00
J 1 37 16 0.0068 7 26.15 5 2.40 18 101.00
O 2 29 11 0.0051 23 68.46 3 2.40 19 101.00
G 2 29 17 0.0084 11 34.55 18 5.62 25 156.12
J 2 10 9 0.0047 24 69.28 5 2.40 17 101.00
E 2 8 10 0.0049 10 33.09 15 4.38 28 317.99
M 1 4 27 0.0904 8 27.15 28 13.53 7 57.53
F 2 4 26 0.0901 12 36.36 26 13.49 11 77.02
H 1 0 23 0.0349 25 70.38 9 3.31 16 86.46
M 2 −1 25 0.0882 16 45.91 28 13.53 6 57.53
H 2 −2 24 0.0361 26 73.06 9 3.31 15 86.46
S 2 −4 22 0.0190 27 82.13 22 7.83 24 150.35
C 1 −7 30 NA 3 6.40 12 4.20 3 46.49
S 1 −19 21 0.0160 29 83.33 22 7.83 23 150.35
F 1 −26 28 0.0910 9 27.27 26 13.49 10 77.02
C 2 −29 29 NA 5 10.70 12 4.20 4 46.49
U 1 −49 20 0.0139 30 83.62 16 4.82 29 440.67
U 2 −49 19 0.0124 28 82.40 17 4.83 30 540.59
Table 95: Tabulation of operationally-ranked results for Class B — Left and Right Slap. Letter refers to the participant’s letter code found on the footerof this page. Sub. # is an identifier used to differentiate between the two submissions each participant could make. Score refers to the sum of the scoringequations shown in Appendix L. The color bands are indicative of the 80th percentile, 55th percentile, and below of the Score column. The FNIR columnwas computed at the score threshold that gave FPIR = 10−3. NA indicates that the operations required to produce the value could not be performed.The Identification column shows the time used to perform a search over an enrollment set of 3 000 000, as seen in Table 19. The Enrollment column showsthe time used to create a search template to be used for a query, as seen in Table 77. Identification and Enrollment durations are reported in seconds,but were originally recorded to microsecond precision. RAM refers to the sum of the resident set sizes of the stage one identification processes over allcompute nodes after returning from the identification stage one initialization method, as seen in Table 63. RAM is reported in gigabytes, where 1 GB isequal to 1 073 741 824 bytes. The number to the left of a value provides the value’s column-wise ranking, with the best performance shaded in greenand the worst in pink. The table is sorted on descending Score.
C = afis team D = 3M Cogent E = Neurotechnology F = Papillon G = Dermalog H = Hisign Bio-Info InstituteI = NEC J = Sonda K = Tiger IT L = Innovatrics M = SPEX O = ID SolutionsP = id3 Q = Morpho S = Decatur Industries T = BIO-key U = Aware V = AA Technology

FPVTE – FINGERPRINT MATCHING 215
ParticipantScore FNIR Identification Enrollment RAM
Letter Sub. #
I 1 132 2 0.0012 7 19.07 25 16.52 5 49.68
Q 1 129 2 0.0012 14 42.92 20 8.92 1 7.54
Q 2 119 2 0.0012 24 66.01 20 8.92 2 7.54
D 2 114 2 0.0012 18 46.70 24 11.86 13 79.43
I 2 109 1 0.0009 16 43.86 30 19.36 21 108.71
L 1 90 10 0.0031 5 14.50 2 3.05 22 119.79
V 2 83 7 0.0024 19 49.30 7 3.36 9 63.53
E 1 72 16 0.0043 2 6.76 13 5.34 14 79.73
G 1 71 18 0.0062 1 4.26 18 7.90 25 156.12
V 1 71 9 0.0027 10 34.96 7 3.36 8 63.53
D 1 52 6 0.0020 17 45.15 17 6.16 12 79.43
L 2 41 11 0.0033 9 28.59 1 0.88 27 177.48
O 1 39 15 0.0041 11 35.64 5 3.36 19 101.00
J 1 36 17 0.0049 8 25.38 3 3.35 18 101.00
O 2 31 13 0.0035 21 60.02 5 3.36 20 101.00
J 2 27 11 0.0033 22 60.13 3 3.35 17 101.00
E 2 20 7 0.0024 15 43.61 16 5.93 28 317.95
G 2 7 14 0.0040 6 16.26 18 7.90 26 156.12
M 1 1 26 0.0543 13 38.87 28 18.11 6 57.53
M 2 −8 25 0.0515 23 65.91 28 18.11 6 57.53
C 1 −8 30 NA 3 7.92 11 5.13 3 46.49
U 2 −17 22 0.0141 25 75.28 14 5.73 30 540.60
S 1 −18 20 0.0108 29 87.60 22 10.31 24 150.35
H 1 −19 23 0.0203 26 82.66 9 4.37 15 86.46
S 2 −20 21 0.0136 30 88.46 22 10.31 23 150.35
H 2 −21 24 0.0204 27 86.56 9 4.37 16 86.46
C 2 −28 29 NA 4 10.21 11 5.13 4 46.49
F 1 −29 27 0.0591 12 37.56 26 18.07 10 77.02
F 2 −33 27 0.0591 20 49.34 26 18.07 10 77.02
U 1 −49 19 0.0099 28 86.60 15 5.82 29 440.68
Table 96: Tabulation of operationally-ranked results for Class B — Identification Flats. Letter refers to the participant’s letter code found on the footer ofthis page. Sub. # is an identifier used to differentiate between the two submissions each participant could make. Score refers to the sum of the scoringequations shown in Appendix L. The color bands are indicative of the 80th percentile, 55th percentile, and below of the Score column. The FNIR columnwas computed at the score threshold that gave FPIR = 10−3. NA indicates that the operations required to produce the value could not be performed.The Identification column shows the time used to perform a search over an enrollment set of 3 000 000, as seen in Table 19. The Enrollment column showsthe time used to create a search template to be used for a query, as seen in Table 78. Identification and Enrollment durations are reported in seconds,but were originally recorded to microsecond precision. RAM refers to the sum of the resident set sizes of the stage one identification processes over allcompute nodes after returning from the identification stage one initialization method, as seen in Table 63. RAM is reported in gigabytes, where 1 GB isequal to 1 073 741 824 bytes. The number to the left of a value provides the value’s column-wise ranking, with the best performance shaded in greenand the worst in pink. The table is sorted on descending Score.
C = afis team D = 3M Cogent E = Neurotechnology F = Papillon G = Dermalog H = Hisign Bio-Info InstituteI = NEC J = Sonda K = Tiger IT L = Innovatrics M = SPEX O = ID SolutionsP = id3 Q = Morpho S = Decatur Industries T = BIO-key U = Aware V = AA Technology
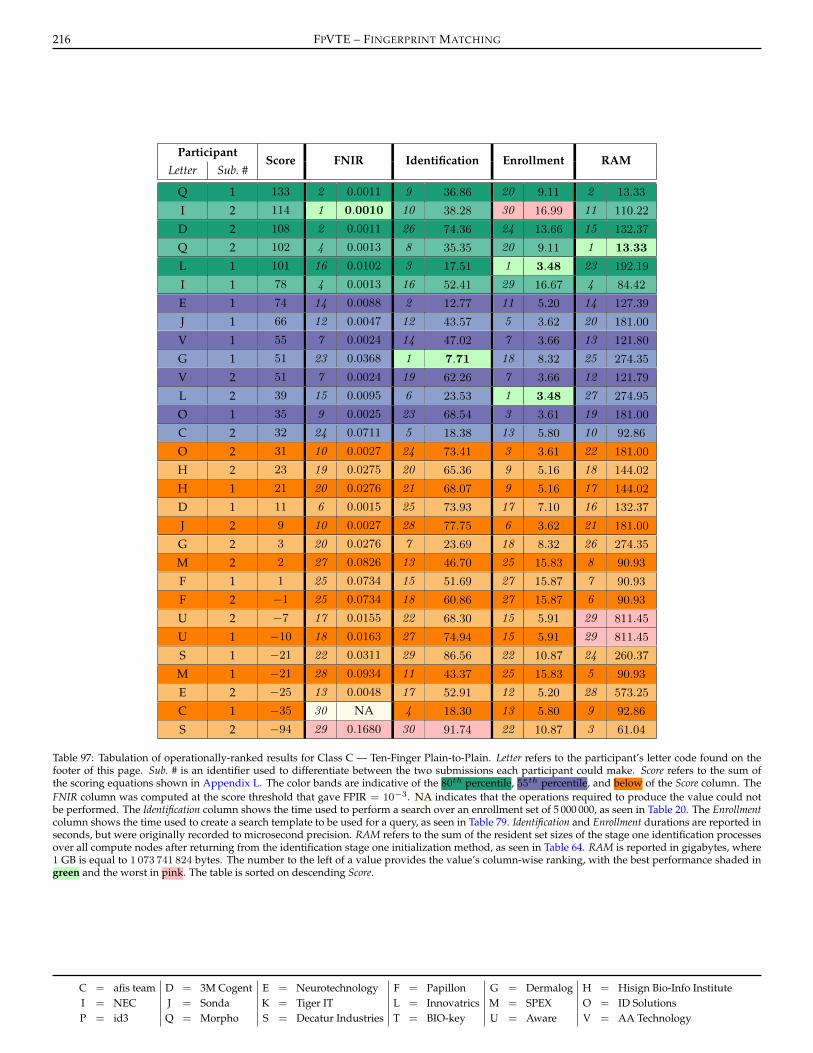
216 FPVTE – FINGERPRINT MATCHING
ParticipantScore FNIR Identification Enrollment RAM
Letter Sub. #
Q 1 133 2 0.0011 9 36.86 20 9.11 2 13.33
I 2 114 1 0.0010 10 38.28 30 16.99 11 110.22
D 2 108 2 0.0011 26 74.36 24 13.66 15 132.37
Q 2 102 4 0.0013 8 35.35 20 9.11 1 13.33
L 1 101 16 0.0102 3 17.51 1 3.48 23 192.19
I 1 78 4 0.0013 16 52.41 29 16.67 4 84.42
E 1 74 14 0.0088 2 12.77 11 5.20 14 127.39
J 1 66 12 0.0047 12 43.57 5 3.62 20 181.00
V 1 55 7 0.0024 14 47.02 7 3.66 13 121.80
G 1 51 23 0.0368 1 7.71 18 8.32 25 274.35
V 2 51 7 0.0024 19 62.26 7 3.66 12 121.79
L 2 39 15 0.0095 6 23.53 1 3.48 27 274.95
O 1 35 9 0.0025 23 68.54 3 3.61 19 181.00
C 2 32 24 0.0711 5 18.38 13 5.80 10 92.86
O 2 31 10 0.0027 24 73.41 3 3.61 22 181.00
H 2 23 19 0.0275 20 65.36 9 5.16 18 144.02
H 1 21 20 0.0276 21 68.07 9 5.16 17 144.02
D 1 11 6 0.0015 25 73.93 17 7.10 16 132.37
J 2 9 10 0.0027 28 77.75 6 3.62 21 181.00
G 2 3 20 0.0276 7 23.69 18 8.32 26 274.35
M 2 2 27 0.0826 13 46.70 25 15.83 8 90.93
F 1 1 25 0.0734 15 51.69 27 15.87 7 90.93
F 2 −1 25 0.0734 18 60.86 27 15.87 6 90.93
U 2 −7 17 0.0155 22 68.30 15 5.91 29 811.45
U 1 −10 18 0.0163 27 74.94 15 5.91 29 811.45
S 1 −21 22 0.0311 29 86.56 22 10.87 24 260.37
M 1 −21 28 0.0934 11 43.37 25 15.83 5 90.93
E 2 −25 13 0.0048 17 52.91 12 5.20 28 573.25
C 1 −35 30 NA 4 18.30 13 5.80 9 92.86
S 2 −94 29 0.1680 30 91.74 22 10.87 3 61.04
Table 97: Tabulation of operationally-ranked results for Class C — Ten-Finger Plain-to-Plain. Letter refers to the participant’s letter code found on thefooter of this page. Sub. # is an identifier used to differentiate between the two submissions each participant could make. Score refers to the sum ofthe scoring equations shown in Appendix L. The color bands are indicative of the 80th percentile, 55th percentile, and below of the Score column. TheFNIR column was computed at the score threshold that gave FPIR = 10−3. NA indicates that the operations required to produce the value could notbe performed. The Identification column shows the time used to perform a search over an enrollment set of 5 000 000, as seen in Table 20. The Enrollmentcolumn shows the time used to create a search template to be used for a query, as seen in Table 79. Identification and Enrollment durations are reported inseconds, but were originally recorded to microsecond precision. RAM refers to the sum of the resident set sizes of the stage one identification processesover all compute nodes after returning from the identification stage one initialization method, as seen in Table 64. RAM is reported in gigabytes, where1 GB is equal to 1 073 741 824 bytes. The number to the left of a value provides the value’s column-wise ranking, with the best performance shaded ingreen and the worst in pink. The table is sorted on descending Score.
C = afis team D = 3M Cogent E = Neurotechnology F = Papillon G = Dermalog H = Hisign Bio-Info InstituteI = NEC J = Sonda K = Tiger IT L = Innovatrics M = SPEX O = ID SolutionsP = id3 Q = Morpho S = Decatur Industries T = BIO-key U = Aware V = AA Technology

FPVTE – FINGERPRINT MATCHING 217
ParticipantScore FNIR Identification Enrollment RAM
Letter Sub. #
I 2 124 2 0.0014 7 30.82 24 18.73 11 137.03
I 1 115 1 0.0013 15 54.56 25 20.23 4 113.80
Q 2 101 2 0.0014 25 74.22 17 13.06 2 20.22
V 1 90 5 0.0017 10 40.74 9 8.50 17 234.03
D 1 84 4 0.0015 17 58.92 21 17.39 10 132.40
L 2 73 14 0.0083 5 20.25 3 4.36 26 367.82
E 1 71 18 0.0106 2 8.63 12 9.92 16 191.66
Q 1 69 5 0.0017 26 74.40 17 13.06 1 20.22
L 1 66 17 0.0097 8 31.68 3 4.36 21 280.49
C 2 55 15 0.0085 6 21.97 13 10.69 15 183.36
C 1 55 16 0.0094 4 20.15 13 10.69 14 183.36
V 2 51 8 0.0019 18 65.07 9 8.50 18 234.03
G 1 49 24 0.0447 1 7.78 19 15.50 20 261.29
J 1 44 13 0.0051 9 33.02 5 6.69 22 303.13
O 1 34 11 0.0034 14 54.42 6 6.71 25 303.13
G 2 33 21 0.0333 3 19.46 19 15.50 19 261.29
O 2 32 9 0.0033 21 69.30 6 6.71 23 303.13
J 2 31 9 0.0033 19 67.98 8 6.74 24 303.13
U 2 15 22 0.0351 24 72.48 1 2.87 28 806.17
M 2 6 27 0.0716 13 48.80 26 20.89 5 130.29
E 2 4 12 0.0050 11 42.73 11 9.91 30 930.48
D 2 3 7 0.0018 27 74.97 30 30.47 9 132.37
F 1 2 25 0.0536 16 55.79 28 20.92 7 130.29
U 1 −3 23 0.0358 28 82.61 1 2.87 28 806.17
F 2 −3 25 0.0536 20 68.20 28 20.92 6 130.29
H 2 −18 19 0.0199 29 84.50 15 12.17 12 144.02
H 1 −18 20 0.0201 30 84.51 15 12.17 13 144.02
M 1 −29 28 0.0783 12 48.08 26 20.89 8 130.29
S 2 −56 30 0.2462 23 70.77 22 17.57 3 78.28
S 1 −96 29 0.0860 22 69.71 22 17.57 27 382.88
Table 98: Tabulation of operationally-ranked results for Class C — Ten-Finger Rolled-to-Rolled. Letter refers to the participant’s letter code found onthe footer of this page. Sub. # is an identifier used to differentiate between the two submissions each participant could make. Score refers to the sum ofthe scoring equations shown in Appendix L. The color bands are indicative of the 80th percentile, 55th percentile, and below of the Score column. TheFNIR column was computed at the score threshold that gave FPIR = 10−3. The Identification column shows the time used to perform a search over anenrollment set of 5 000 000, as seen in Table 20. The Enrollment column shows the time used to create a search template to be used for a query, as seen inTable 80. Identification and Enrollment durations are reported in seconds, but were originally recorded to microsecond precision. RAM refers to the sumof the resident set sizes of the stage one identification processes over all compute nodes after returning from the identification stage one initializationmethod, as seen in Table 65. RAM is reported in gigabytes, where 1 GB is equal to 1 073 741 824 bytes. The number to the left of a value provides thevalue’s column-wise ranking, with the best performance shaded in green and the worst in pink. The table is sorted on descending Score.
C = afis team D = 3M Cogent E = Neurotechnology F = Papillon G = Dermalog H = Hisign Bio-Info InstituteI = NEC J = Sonda K = Tiger IT L = Innovatrics M = SPEX O = ID SolutionsP = id3 Q = Morpho S = Decatur Industries T = BIO-key U = Aware V = AA Technology