Selective Aromatics extraction from hydrocarbon mixtures
19
Selective Aromatics extraction from hydrocarbon mixtures Miguel Ángel Balderas Altamirano* 1 , Arturo Trejo* 2 ,Blanca Estela García- Flores 2 1 Universidad Autónoma Metropolitana, Unidad Iztapalapa, San Rafael Atlixco No. 186, Col. Vicentina, Iztapalapa, 09340, D.F., México. 2 Instituto Mexicano del Petróleo, Dirección de Investigación y Posgrado, Programa de Ingeniería Molecular, Área de Investigación en Termofísica. Eje Central Lázaro Cárdenas Norte 152, San Bartolo Atepehuacan, Gustavo A. Madero, 07730, D.F., Mexico. 1 Electronic mail: [email protected] Abstract This work is aimed at the study of liquid-liquid equilibrium of systems of industrial interest, particularly the purification of oil and gas in the oil refining industry. We present experimental results on the solubility of aromatics in the liquid-liquid equilibrium obtained by gas - liquid chromatography at different temperatures. We used a mixture of solvents to improve the characteristics of selectivity and aromatics extraction. The solvent is a binary mixture of N-methyl 2-pyrrolidone (NMP) and diethylene glycol (DEG). The results presented are for two mixtures consisting of 90% NMP + 10% DEG, and 70% NMP +30% DEG. Heptane was used as hydrocarbon solvent and toluene as aromatic compound. Furthermore, we applied the equation of state NRTL (Non Random Two Liquids) and UNIQUAC (Universal Quasi Chemical) for coexistence curves and the critical point.
Transcript of Selective Aromatics extraction from hydrocarbon mixtures

Selective Aromatics extraction from hydrocarbon mixtures
Miguel Ángel Balderas Altamirano*1, Arturo Trejo*2,Blanca Estela García-Flores2
1Universidad Autónoma Metropolitana, Unidad Iztapalapa, San Rafael Atlixco No. 186, Col. Vicentina, Iztapalapa, 09340, D.F., México.
2Instituto Mexicano del Petróleo, Dirección de Investigación y Posgrado, Programa de Ingeniería Molecular, Área de Investigación en Termofísica. Eje Central Lázaro Cárdenas Norte 152, San Bartolo Atepehuacan, Gustavo A. Madero, 07730, D.F., Mexico.
1Electronic mail: [email protected]
Abstract
This work is aimed at the study of liquid-liquid equilibrium of systems of industrial interest, particularly the purification of oil and gas in the oil refining industry. We present experimental results on the solubility of aromatics in the liquid-liquid equilibrium obtained by gas - liquid chromatography at different temperatures. We used a mixture of solvents to improve the characteristics of selectivity and aromatics extraction. The solvent is a binary mixture of N-methyl 2-pyrrolidone (NMP) and diethylene glycol (DEG). The results presented are for two mixtures consisting of 90% NMP + 10% DEG, and 70% NMP +30% DEG. Heptane was used as hydrocarbon solvent and toluene as aromatic compound. Furthermore, we applied the equation of state NRTL (Non Random Two Liquids) and UNIQUAC (Universal Quasi Chemical) for coexistence curves and the critical point.

2 M. A. Balderas, B. E. García and A. Trejo
1 Introduction
Oil is a source of energy in the modern world and a non-renewable resource. It is a liquid that is below the surface of the earth embedded in rock cavities, also a complex mixture of hydrocarbons (alkanes, cycloalkanes, aromatics) and is composed by oxygen, sulfur and nitrogen
atoms, mainly. [Erij V., 1988] The color of the oil depends on its content of hydrocarbon structures. Known oils are black, clear or colorless and are
lighter and more viscous than water. The origin of petroleum is not well established and is one of the most debated problems of modern science. Once extracted, oil must be refined in order to use its individual components. The process used to separate the constituents of oil is called distillation. Both atmospheric and vacuum distillation are used to refine oil. In the first distillation, the most volatile fractions are obtained: 180ºC gasoline, kerosene from 180ºC to 240ºC and diesel fraction at 350ºC. The residue from atmospheric distillation is distilled under vacuum and the fractions taken are 350ºC to 420ºC for lighter distillate oils, 420ºC to 500ºC for heavy distillate oils. The residue in this process, depending on their viscosity can be called tar or semi tar. Tar feedstock has been used to obtain highly viscous lubricating oils and bitumens. The composition of distillate fractions is a way of distinguishing the types of oil.
The fraction in which gasoline distillates is composed mainly of three classes of hydrocarbons: alkanes, cycloalkanes and aromatics. The fractions of kerosene and diesel contain most of the bi- and tri-cyclic hydrocarbons. The distillate fraction, with molecular weights less than 305 g / mol and which are distilled to temperatures close to 350ºC containing alkanes, alkenes, cycloalkanes, bicycloalkanes, bicyclic aromatic, etc. The chemical composition of the distillate fraction above the 350ºC is poorly studied. This part contains macromolecular structures and in practice, is the fraction of oil, lubricants and tar. The molecular mass of these fractions is between 300 and 1000 g / mol. This hydrocarbon mixture is composed of alkanes, cycloalkanes with mono and polycyclic alkane chains, asphaltenes, resins,
etc. The next steps for the use of oil are intended to improve distillate fractions. Thus, there are dearomatization, dewaxing, etc., which are used to produce components or mixtures with fewer impurities.

Aromatics extraction in hydrocarbon mixtures 3
Dearomatization process [Kirk, E.R., 1961] involves adding one or more polar solvents to a mixture containing alkanes and aromatics compounds. In the first stage the system is agitated and then allowed to stand until equilibrium is reached. In this state the system is separated into two liquid phases, one rich in solvent the other rich in alkanes. The aromatic compounds are distributed in the two phases. The solvent should extract as much of the aromatics as possible. Aromatics are subsequently purified for use in other applications. Gasoline is mainly composed by benzene, toluene and xylenes. In the case of lubricants the aromatic molecular structure is more complex.
Solvents such as NMP, N-formylmorpholine (NFM), glycols and sulfolanes [Saha, M., 1998; Tayseer, A., 1990; Baird, M.H.I., 1991, Nagpal, J.M., 1981]are used in multi component hydrocarbon mixtures due to its extraction capabilities, and must have, besides high selectivity towards aromatics, high distribution coefficient, fast separation of phases (high density and low viscosity), good thermal stability, to be non-corrosive and non-reactive. An alternative to using the pure solvent is the use of mixtures of solvents to improve the extraction of aromatics and decrease energy and solvent consumption. On the other hand, analyzing multi component hydrocarbon oil directly from the plant has several disadvantages: it is expensive, its molecular composition and the structure of each component are not well known, the boiling point is high and solubility is difficult to
analyze. But some studies have been reported using such mixtures. [De Lucas, A., 1993] To make a quantitative analysis of the solubility of a component in a mixture, it is convenient to use a mixture model in order to control the variables that determine the liquid-liquid equilibrium, and then extrapolate the results to problems of industrial interest.
In a model system we can perform a systematic study of the solubility and control the effect of temperature, pressure, solvent concentration, hydrocarbon molecular structure, etc. The results obtained at laboratory level can be used to extrapolate the behavior in industrial hydrocarbon mixtures. Examples of results obtained in this way are reported in references
[Letcher, T.M., 1998; Bernabe, D., 1988; Romero-Martínez, A.(1995)]. Figure 1 describes the extraction process. Phase I initially contains hydrocarbons and aromatics while Phase II contains only polar solvent. The

4 M. A. Balderas, B. E. García and A. Trejo
aromatic is soluble in both the hydrocarbon and the solvent, therefore, when the system reaches equilibrium, the concentration of aromatic in phase I will be less than the initial, i.e., there will be a selective separation of the mixture of aromatics hydrocarbons.
Figure 1. Liquid-liquid equilibrium between two phases. Phase I contains a mixture of hydrocarbons, paraffinic and aromatic compounds. Phase II is a polar solvent. The left side shows the initial mixture and the right when they have reached thermodynamic equilibrium.
The purpose of this work is to determine the thermodynamic conditions to remove as much of aromatics using polar solvents. The rest of the work is divided into three sections: first is the methodology used, second the results section and finally conclusions drawn form the results.
2 Methodology
As an initial step, the purity of the compounds used was examined in the laboratory with the aid of a gas chromatograph, brand Varian model 3400. The chromatogram reported in all cases areas greater than 99.8 % and the purity reported by the manufacturer was greater than 99% in all cases. In all

Aromatics extraction in hydrocarbon mixtures 5
reagents we added 4A diameter molecular sieves to remove traces of moisture in the solvent. Before chromatographic analysis it is necessary to find the best operating conditions to obtain the best chromatograms, they should show high and well defined peaks for each substance without any overlapping between them. The temperature range which was more consistent with these conditions was from 40°C to 160°C for mixing n-heptane-toluene-NMP in a DB-5 column, and n-heptane-toluene-NMP-DEG was 100°C to 280°C in a SE -30 column, both with a flow of helium gas of 12 cm3/min as the carrier gas. To eliminate possible chromatographic signal fluctuations, benzene was used as the internal standard for each analysis.
The next step is obtained from a calibration curve (concentration vs. area under the curve) at 25°C for each system component, so we prepared mixtures of the three components making sure that the mixture is in the homogeneous region of the phase diagram. The mass of each component and its concentration in the mixture is known. To these mixtures the internal standard (benzene) was added and the concentration is obtained using the
chromatograph, with a calibration curve constructed for each component. Once the calibration curve for each component is done it is necessary to study multi component mixtures. The first is a ternary system, the second and third are mixtures of solvents, the first with a percentage of 90% NMP + 10% of DEG and second with 70% DEG + 30% NMP. Two equilibria were analyzed at three different temperatures, 15°C, 25°C and 40°C.
Each mixture was deposited in a cell designed for the IMP (Instituto Mexicano del Petróleo, Mexico) where the separation of the system into two liquid phases can be visually assessed. The cell allows the passage of water, similar to the mechanism of a coolant to control the temperature of the experiment. The system is stirred for at least 4 hours with a Teflon coated magnetic stirrer, the stirring is stopped and allowed to stand until equilibrium; this requires at least 4 hours. When the phases have separated and reached equilibrium, each phase is extracted with hypodermic syringes (one for each phase) and transferred in a separate vial (container) containing 0.2 g of benzene as internal standard. Finally the chromatograms for each phase are obtained and the calibration curve of each component is used to determine its concentration. The same procedure is carried out in mixtures of various concentrations to generate the coexistence curve at a single

6 M. A. Balderas, B. E. García and A. Trejo
temperature. In this paper the coexistence curves were obtained at three
different temperatures. The experimental systems studied in this work can be summarized as follows:
a) Heptane + Toluene + solvent I at 25°C
b) Heptane + Toluene + solvent II at 15°C, 25°C and 40°C
c) Heptane + Toluene + solvent III at 15°C, 25°C and 40°C
Solvent concentration: I = 100% solvent NMP, solvent II 90%, NMP + 10% DEG and solvent III 70% NMP+ 30% DEG.
The experimental data are correlated using NRTL and UNIQUAC models. [Sorensen, J.M., 1986] Several versions of these models are found in the literature with different expressions to describe the temperature dependency of the binary interaction parameters. The ones used here are outlined below. The excess Gibbs free energy (gE) for the NRTL model [Renon, H., 1968] is given by:
∑
∑∑
k
c
=kki
jji
c
j=jic
j=i
E
xG
xGτ
x=RTg
1
1
1
(1)
where xi is the mole fraction of component i, τij is the interaction parameter, Gji is the interaction energy, R the gas constant and T the temperature. For a binary mixture, the NRTL model contains five parameters, two binary interaction parameters for each component and the non randomness parameter for the binary mixture. The excess Gibbs energy for the UNIQUAC model [Abrams,D.S.,1975] is given by

Aromatics extraction in hydrocarbon mixtures 7
( )RT
g+g=
RTg RC
E
(2)
where gE and gR are the combinatorial and the residual contributions.
∑∑i
ii
c
=ii
i
ic
=ii
c
Φ
θxq+
x
Φx=
RT
gln5ln
11 (3)
∑∑ ij
c
=iji
c
=ii
R
τθxq=RT
g
11
ln(4)
where qi are the pure component surface area parameter, τij is the interaction parameter, Φi the segment fraction and the area fraction θi. The parameters in both models were found by minimizing the objective function, where N is the number of experimental points.
( )∑∑∑ −′N
i=k =j =iijkijk xx=F
2
1
3
1
2
(5)
where ijkx′ y xijk are the molar fraction calculated by the program and
experimentally, respectively. The sums take into account the experimental data k, the phases j and the components i. The program used in this work was elaborated at the IMP. [García-Sánchez, F., 1996]

8 M. A. Balderas, B. E. García and A. Trejo
Figure 2 Ternary diagram for the system heptane toluene NMP. The squares represent the values of Ferreira, 1984 filled circles are the values obtained in this work. These data correspond to measurements made at 25 C.
3 Results
The data generated for ternary systems are best depicted in a triangular
diagram as shown in Figure 2 for the system heptane-toluene-NMP. Once equilibrium concentrations are obtained from our system, we can build with these data the triangular diagram or phase diagram. In this case seven experiments were made at constant temperature and varying concentrations of aromatic. Heptane-NMP binary system is in the base of the triangle, the left side is the phase rich in heptane and the right in NMP. Heptane mixtures

Aromatics extraction in hydrocarbon mixtures 9
with concentrations greater than 86% and lower than 16% are in a liquid phase. States below the symbols correspond to the two-phase region in the liquid-liquid equilibrium. States outside this region correspond to a liquid phase where the three components are present. Mixtures with toluene concentration greater than 15% are in a single stage, this is the critical region. Near the critical point it is difficult to measure the concentration due
to large density fluctuations in the phases. In this system, with NMP as a solvent, the size of the curve is small. We want to find the way to increase this curve and improve the extraction of aromatics. There is evidence to show that a mixture of solvents could extend this region, for more details see works reported in [Nagpal, J.M, 1981; Naidoo, R.D., 2001]. These results were compared with those reported by [Ferreira, P.O., 1984] to validate the experimental technique and verify the proper operation of the
equipment. To study the effect of a solvent mixture in the aromatic extraction we decide to vary the amount of DEG. For practical purposes, these systems are treated as ternary systems, where the extractant mixture NMP - DEG is considered a single component; a system like this is known as a pseudo-ternary system. In what follows in all triangular diagrams the legend 90% NMP +10% DEG or 70% NMP+30%DEG means that the solvent NMP was prepared with X mass % DEG, not to be confused with the concentration of the solvent in equilibrium expressed in molar fraction.
i) Effect of concentration of DEG in the solvent.
Figure 3 shows the results at 25°C and various concentrations of DEG. Immiscibility region increases with the addition of DEG. The maximum amount of the aromatic compound can participate in the liquid-liquid equilibrium narrows the top of the region of insolubility (top of the curve). In this study the limit was 0.15, 0.30 and 0.45 (molar fraction of toluene) for solvent mixtures with 0%, 10% and 30% of DEG, respectively. The points on the curve divide the region in which we can find the liquid - liquid equilibrium, above it will have total miscibility and under it partial
miscibility. Application of the NRTL model allows one to obtain the continuous line in Figure 3 for each of the three sets of data. UNIQUAC model results are similar to those of NRTL and we not reported here.

10 M. A. Balderas, B. E. García and A. Trejo
Figure 3 Effect of DEG concentration in the solvent. The line parallel to heptane axis shows the area where we can find homogeneous equilibrium. In the case of the mixture with 30% DEG, the line shows the region where we can find two liquid phases. The experiments were done at 25C. The continuum line was obtained with the NRTL model. The circles are experimental data.
ii) Effect of temperature on the extractant mixture
The effects of temperature on the mixture with 10% of DEG are shown in Figure 4, and at 30% of DEG in Figure 5. The increased temperature promotes the solubility of the components and the bimodal curve is smaller. In the system with 10% DEG, the bimodal curve size is different; it shows a greater displacement to the left side. While the system with 30% DEG, cornering bimodal separation is larger in the middle part, but decays into points very close to the equilibrium binary line.

Aromatics extraction in hydrocarbon mixtures 11
Figure 4 Temperature effect on the mixture 10% of DEG in NMP. The curves were obtained with the NRTL correlation model. The circles are experimental data.
Figure 5 Temperature effect on the mixture 30% of DEG in NMP. The
12 M. A. Balderas, B. E. García and A. Trejo
curves were obtained with the NRTL correlation model. The circles are experimental data.
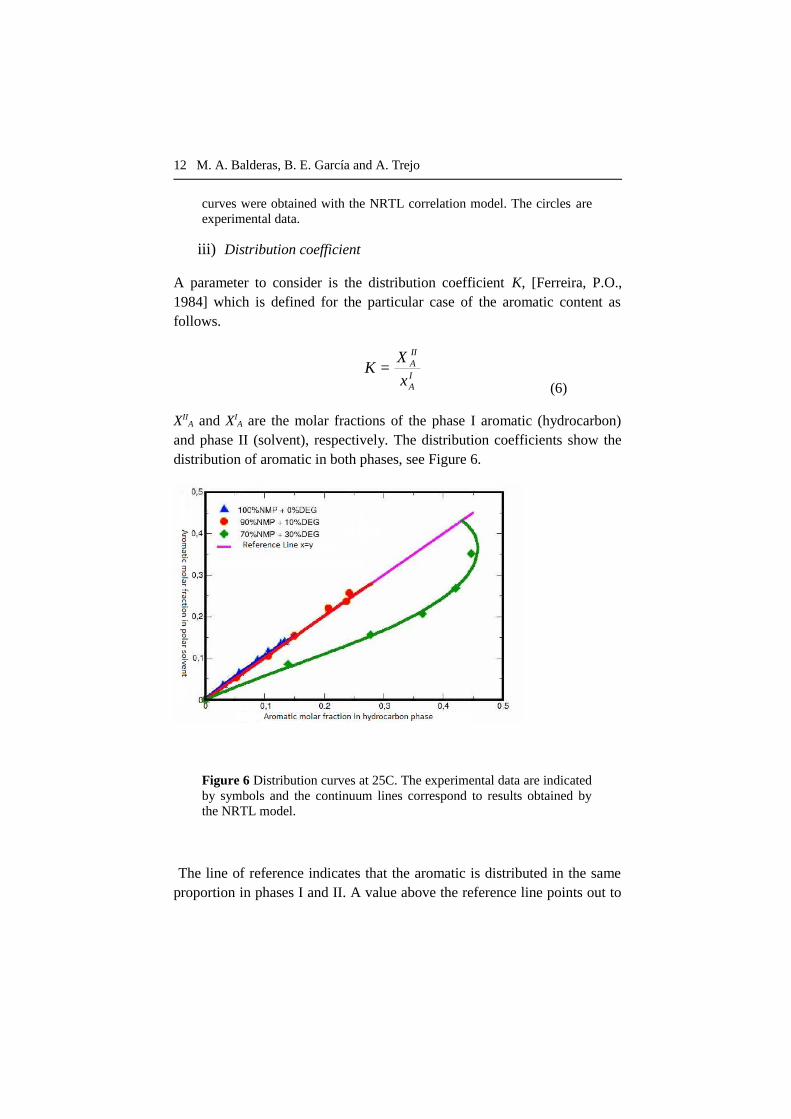
iii) Distribution coefficient
A parameter to consider is the distribution coefficient K, [Ferreira, P.O., 1984] which is defined for the particular case of the aromatic content as follows.
IA
IIA
x
X=K
(6)
XIIA and XI
A are the molar fractions of the phase I aromatic (hydrocarbon) and phase II (solvent), respectively. The distribution coefficients show the distribution of aromatic in both phases, see Figure 6.
Figure 6 Distribution curves at 25C. The experimental data are indicated by symbols and the continuum lines correspond to results obtained by the NRTL model.
The line of reference indicates that the aromatic is distributed in the same proportion in phases I and II. A value above the reference line points out to

Aromatics extraction in hydrocarbon mixtures 13
higher extraction capacity and a value below it indicates that the greatest amount of aromatic remained in phase I. In the systems studied in this work, the mixture with 0% DEG extracted at slightly higher concentration of aromatic, mixture with 10% DEG separates slightly less than that of the
pure solvent, while the mixture with 30% DEG obtained fewer aromatic. The results of the distribution coefficient plotted in Figure 6 show that the increase of the immiscible region reduces the aromatic distribution in the mixture. The Aromatic concentration is greater in Phase II with 10% DEG compared with 30% DEG system. By increasing the bimodal curve a greater amount of aromatic hydrocarbon mixtures may be involved in the extraction process. The K distribution coefficient in 0% and 10% of DEG mixtures, for all practical purposes are equal and their use as extracting solvent is indistinct, but because the mixture with 10% DEG has a higher insoluble region, it can be considered that it is better solvent for extraction systems.
iv) Selectivity (selectivity factor)
Another criterion for evaluating a solvent Selectivity [Prausnitz, J.M., 1986] is defined as:
XI
YI=β
(7)
where XI and YI are defined as:
( )IH
IA
IA
x+xx
=XI , ( )II
HIIA
IIA
x+xX
=YI, (8)
where XA and XH are the mole fractions of aromatic and hydrocarbon, respectively. Superscripts I and II refer to the hydrocarbon rich phase and solvent respectively. Selectivity is defined as the measure of the ability of the solvent to separate the aromatic compound with a mixture of alkane.21

14 M. A. Balderas, B. E. García and A. Trejo
Figure 7 Graphic selectivity distribution of 25C at different concentrations of DEG. Symbols are experimental data and trend lines were obtained with the NRTL model.
For each of the systems obtained in this work, we made a selectivity diagram. Selectivities are shown in figures 7-9; they indicate that our solvents are highly selective.21 The solvent is more selective towards the toluene if we added DEG. Selectivity is shown in an ascendant way, the
combination of solvent mixture: 100% NMP + 0% DEG < 90% NMP +
10%DEG <70% NMP +30% DEG; that is, the mixture with the highest selectivity curve was the 70% DEG + 30% NMP mixture. The selectivity is reduced with increasing temperature for both systems studied, at 10% DEG and 30% DEG. However, its effect is rather small. The solid lines in each figure were obtained using the correlation data obtained by NRTL for each experimental system. The curves obtained by the UNIQUAC model are almost the same, and therefore are not reported in this work.

Aromatics extraction in hydrocarbon mixtures 15
Figure 8 Graphic distribution of selectivities at different temperatures for the system heptane + toluene + 90%NMP + 10% DEG. Symbols are experimental data and trend lines were obtained by the NRTL model.
Figure 9 Graphic distribution of selectivities at different temperatures for the system heptane + toluene + 70% NMP + 30% DEG. Symbols are experimental data and trend lines were obtained by the NRTL model.

16 M. A. Balderas, B. E. García and A. Trejo
4 Conclusions
The effect of adding DEG to the solvent (NMP) is to increase the region of immiscibility, and decrease the solubility of the aromatic compound. Temperature increase has little effect in the solubility of the aromatic compound. The distribution coefficient increases as the selectivity decreases and vice versa. The solvent with 70% NMP + 30% DEG is the most selective and 90% NMP + 10% DEG which had a higher extraction capacity (distribution coefficient with a high value). The distribution coefficient, in mixtures with 10% and 0% DEG, is similar; selectivity and immiscibility regions are greater in the first case, so that the mixture with 10% DEG is most useful for extraction of aromatics. Analysis of the region of immiscibility, selectivity and distribution coefficient is insufficient to decide, from the mixtures at 0% and 30% DEG, which may be used in the extraction of aromatics. To make a better choice we should consider other properties such as viscosity, degree of corrosion, thermal stability, toxicity, vapor pressure, etc. Interaction parameters used in the NRTL and UNIQUAC equations fit well the experimental values and the critical point. This is an ongoing research [Balderas,M.A., 2003], so one would have to continue mixing solvents in order to look for the best mixture that can result in the best selectivity (β) with the best distribution constant (K). This research should be important for those interested in the separation processes or in purification of compounds.
Acknowledgements
MABA is grateful to CONACYT (Consejo Nacional de Ciencia y Tecnología, Mexico) for a grant during this work. Also, thanks are due to the IMP (Instituto Mexicano del Petróleo), to the group of Thermodynamics at IMP for providing the substances, equipment and guidance to develop this research, and finally to Armando Gama and Miguel Gama, for discussions and encouragement. And Promociones Nelly, Tamazunchale for end financial support.

Aromatics extraction in hydrocarbon mixtures 17
References
Erij V.; Rásina, M.; Rudin, M..(1988) “Química y Tecnología del gas”, Mir: U.R.S.S..
Kirk, E.R.; Othmer, F.D.; Scott, D.J.; Standein, A.. (1961) “Enciclopedía de Tecnología Química”, Unión Tipográfica editorial Hispanoaméricana, D.F., México.
De-Lucas, A.; Rodríguez, L.; Sánchez, P.; Carnicer, A.. (1993) Separation Science and Technology, 28, 2465, 1993.
Saha, M.; Rawat, B.S.; Khanna, M.K.; Nautiyal, B.R.. (1998) Liquid-liquid Equilibrium Studies on Toluene + Heptane + Solvetn, J. Chem. Eng. Data, 43,422.
Taysser, A.; Al-Zayled, T.A.; Al-Sahhaf; Fahim, M.A.. (1990) Measurements of phase equilibrium in multicomponent systems of aromatics with n-methylpyrrolidone and predictions with unifac. Fluid Phase Equilibria, 61,131.
Baird, M.H.I.; Henson, C., Handbook of solvent Extraction, Krieguer:Florida, E.U.A., 1991.
Nagpal, J.M.; Rawat, B.S.. (1981) Liquid-liquid equilibria for toluene-heptane-N-methyl-pyrrolidone and benzene-heptane solvents. J. Chem. Tech. Biotechnol., 31, 145.
Eustaquio-Rincón, R.; Ramírez, L.F.; Trejo, A.. (1998) Experimental liquid-liquid phase equilibria for binary systems: ethanenitrile with several hydrocarbon isomer. Fluid Phase Equilibria, 149, 1-2,177.
Letcher, T.M.; Naicker, P.K.. (1998) Ternary liquid-liquid equilibria for mixtures for n-alkane + an Aromatic Hydrocarbon + N-methyl-2-pyrrolidone. J. Chem. Eng. Data, 43,1034.

18 M. A. Balderas, B. E. García and A. Trejo
Bernabe, D.; Romero-Martínez, A.; Trejo, A.. (1988) Liquid-liquid coexistence curves for binary systems. Fluid Phase Equilibria, 40, 279.
Romero-Martínez, A.; Trejo, A.. (1995) Equilibrio Líquido Líquido: Su correlación y medición parte II Sistemas binarios, IMP: D.F., México.
Sorensen, J.M.; Lichtenhaler, R.N.; Gomes-de-Azevedo, E.. (1986) Molecular Thermodynamics of Fluid Phase Equilibria, Prentice Hall: New Jersey, E.U.A..
Renon, H.; Prausnitz, J.M.. (1968) Local compositions in thermodynamic excess functions for liquid mixtures, AIChe J., 14,1,135.
Abrams, D.S., Prausnitz, J.M.. (1975) Statistical thermodynamics of liquid mixtures: A new expression for the excess Gibbs energy of partly or completely miscible systems, AIChe J., 21, 1, 116.
García-Sánchez, F., Schwartzentruber, J.; Ammar, M.N; Renon, H.. (1996) Thermodynamics of multiphase liquid equilibria in multicomponent mixtures. Rev. Mex. Fis., 1996, 43, 59.
Naidoo, R.D.; Letcher, T.M., Ramjugernath, D.. (2001) Ternary liquid liquid equilibria for pseudo ternary mixtures containing an n-alkane + an aromatic hydrocarbon + {N-methyl-2-pyrrolidone+solvent}at 298.2 K and 1 atm. J. Chem. Eng. Data, 46, 1375.
Ferreira, P.O.; Barbosa, D.; Medina, A.G.. (1984) Phase equilibria for the separation of aromatic and non-aromatic compounds using mixed solvents. Part I. The system n-heptane – toluene- N-methyl pyrrolidone/monoethyleneglycol. Fluid Phase Equilibria, 15, 309.
Ferreira, P.O.; Barbosa, D.; Medina, A.G.. (1984) Liquid – liquid equilibria for the system N-methyl pyrrolidone + toluene + n-heptane: UNIFAC interaction parameters for N-methyl pyrrolidone. Fluid Phase Equilibria, 16, 369.
Balderas Altamirano, M.A., Tesis de Maestría, “Extracción de aromáticos en mezclas de hidrocarburos”, Universidad Autónoma Metropolitana, Unidad Iztapalapa, Asesores: Arturo Trejo and José Alejandre, 2003,

Aromatics extraction in hydrocarbon mixtures 19
México, D.F.