AN ASSESSMENT OF WORLD HYDROCARBON RESOURCES
48
AN ASSESSMENT OF WORLD HYDROCARBON RESOURCES H .- H. Ro gner Unicer.c;ify of Victoria, Victoria , BC, Canada and lntcnwtionaf Institut e for Applied Systems Ana lysis Lm:cn. uu rg . Austria RR -98-G 1998 Re print ed from Annual Review of Energy and th e Environment, \'o lurn e 22. pp. 211-262 . Hl97 . l11t e rnational Institute for Appli ed Syste ms Analysis , Lax e nburg. Au s tria Tel: +43 223G 807 Fax: +43 2236 73148 E-mail: publication s@ iiasa.ac.at
-
Upload
khangminh22 -
Category
Documents
-
view
2 -
download
0
Transcript of AN ASSESSMENT OF WORLD HYDROCARBON RESOURCES
AN ASSESSMENT OF WORLD HYDROCARBON RESOURCES
H.- H . Rog ner Unicer.c;ify of Victoria, Victoria , BC, Canada and lntcnwtionaf Institute for Applied Systems Analysis
Lm:cn.uu rg . Austria
RR-98-G ~fay 1998
Reprinted from Annual Review of Energy and the Environment, \'o lurn e 22. pp. 211-262 . Hl97 .
l11te rnational Institute for Applied Systems Analysis , Laxe nburg. Aus tria Tel: +43 223G 807 Fax: +43 2236 73148 E-mail: publications@ iiasa.ac.at
Research Reports, which record research conducted at IIASA , are independently reviewed before publication. Views or opinions expressed herein do not necessarily represent those of the Institute , its National Member Organizations, or other organizations supporting the work .
Reprinted with permission from Annual Review of Energy and th e Environment, Volume 22, pp. 217- 262 , 1997. Copyright © 1997 by Annual Reviews Inc .
All rights reserved. No part of this publication may be reproduced or transmitted in any form or by any means , electronic or mechanical , including photocopy, recording, or any information storage or retrieval system, without permission in writing from the copyright holder.

Annu. Rev. Energy Environ. 1997. 22:217-62 Copyright© 1997 by Annual Reviews lnc. All rights reserved
AN ASSESSMENT OF WORLD HYDROCARBON RESOURCES
H-H. Rogner Institute for Integrated Energy Systems, University of Victoria, P.O. Box 3055, Victoria, British Columbia, V8W 3P6, Canada, and International Institute for Applied Systems Analysis, A-2361 Laxenburg, Austria
KEY WORDS : conventional, unconventional, coal, oil, natural gas occurrences
ABSTRACT
Assessments of global coal, oil, and natural gas occurrences usually focus on conventional hydrocarbon reserves, i.e. those occurrences that can be exploited with current technology and present market conditions. The focus on reserves seriously underestimates long-term global hydrocarbon availability. Greenhouse gas emissions based on these estimates may convey the message that the world is running out of fossil fuels, and as a result, emissions would be reduced automatically. If the vast unconventional hydrocarbon occurrences are included in the resource estimates and historically observed rates of technology change are applied to their mobilization, the potential accessibility of fossil sources increases dramatically with long-term production costs that are not significantly higher than present market prices. Although the geographical hydrocarbon resource distribution varies significantly, a regional breakdown for 11 world regions indicates that neither hydrocarbon resource availability nor costs are likely to become forces that automatically would help wean the global energy system from the use of fossil fuel during the next century.
CONTENTS
ENERGY RESERVES AND RESOURCES ...... ............... .... .............. 218 Motivation and Introduction .. .... ....................... .. ........ . ........ 218 Definitions ....... . .... .. .. ...... ......... .............. . . ... .. . ... ... .. . 219
CLASSIFICATION ... ..... . . ....... . . .... .... ... .......................... . _ 224 Resource 'Categories ................. .. .... .. ...... ... .. . .. ...... . .. . ..... 225 Conventional Oil .. . ....... . ........ ... . . .... . .... . .... . ........ . ......... 231 Natural Gas ........ .. .. . ........ . ... . . . . . ... .... .. ........ . .. . ..... . .. . . 237 Coal ................................................. ........ .. ..... . .. 245 Summary of Reserves, Resources, and Occurrences ................ ....... . .... . . 247
217 1056-3466/97 /1022-0217$08.00
218 ROGNER
MODELING ENERGY SOURCES . . . ...... . . .... .. .. . .... .. . ...... . . . . . . ... . .. . 250
CONCLUDING REMARKS . .... ....... . .. .. . ... .... .... . . . .. . . . . ..... . .... .. . 257
ENERGY RESERVES AND RESOURCES
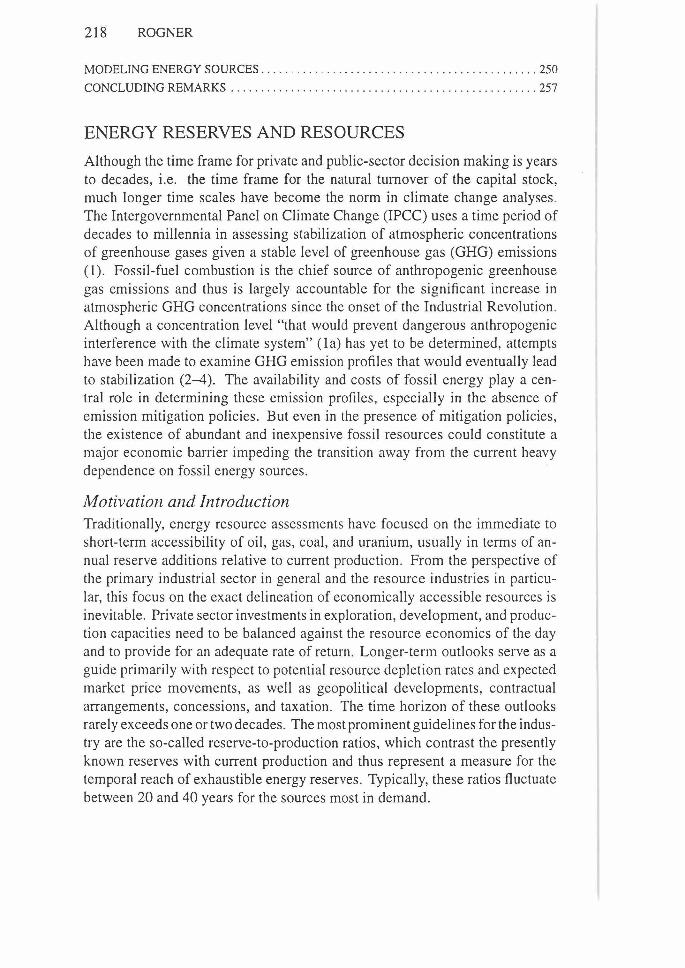
Although the time frame for private and public-sector decision making is years to decades, i.e. the time frame for the natural turnover of the capital stock, much longer time scales have become the norm in climate change analyses. The Intergovernmental Panel on Climate Change (IPCC) uses a time period of decades to millennia in assessing stabilization of atmospheric concentrations of greenhouse gases given a stable level of greenhouse gas (GHG) emissions (1). Fossil-fuel combustion is the chief source of anthropogenic greenhouse gas emissions and thus is largely accountable for the significant increase in atmospheric GHG concentrations since the onset of the Industrial Revolution . Although a concentration level "that would prevent dangerous anthropogenic interference with the climate system" (la) has yet to be determined, attempts have been made to examine GHG emission profiles that would eventually lead to stabilization (2-4). The availability and costs of fossil energy play a central role in determining these emission profiles, especially in the absence of emission mitigation policies. But even in the presence of mitigation policies, the existence of abundant and inexpensive fossil resources could constitute a major economic barrier impeding the transition away from the current heavy dependence on fossil energy sources.
Motivation and Introduction Traditionally, energy resource assessments have focused on the immediate to short-term accessibility of oil, gas, coal, and uranium, usually in terms of annual reserve additions relative to current production. From the perspective of the primary industrial sector in general and the resource industries in particular, this focus on the exact delineation of economically accessible resources is inevitable. Private sector investments in exploration, development, and production capacities need to be balanced against the resource economics of the day and to provide for an adequate rate of return. Longer-term outlooks serve as a guide primarily with respect to potential resource depletion rates and expected market price movements, as well as geopolitical developments, contractual arrangements, concessions, and taxation . The time horizon of these outlooks rarely exceeds one or two decades. The most prominent guidelines for the industry are the so-called reserve-to-production ratios, which contrast the presently known reserves with current production and thus represent a measure for the temporal reach of exhaustible energy reserves. Typically, these ratios fluctuate between 20 and 40 years for the sources most in demand.
HYDROCARBON RESOURCES 219
Studies with temporal scales of 100 years or more necessarily involve resource assessments and recoverability evaluations that extend far beyond conventional reserve analyses and reserve-to-production ratios. The concept of reserve-to-production ratios is seriously flawed and, in the past, has led to aberrant conclusions (5). The most erroneous conclusion is that the world will run out of reserves by the point in time suggested by reserve-to-production ratios. For oil, ratios ranging from 20 to 40 years have existed since the beginning of the twentieth century, so the world should have run out of oil a long time ago. 1
Driven by economics, advances in the geosciences, and technological progress in the upstream production operations, reserves have been continuously replenished from previously unknown (newly discovered) or techno-economically inaccessible occurrences. Although reserve additions have shifted to inherently more difficult and potentially more costly frontier locations, technological progress has outweighed potentially diminishing returns.
Because scientific advances, technological process, extraction and demand projections are continually changing, it is impossible to encapsulate energy reserves and resources or production economics with simple measures or single numbers. The many uncertainties entering the analysis make energy resource assessment "the effort of estimating the economic portion of an unknown total" (7). Government bureaus and industry attempt to meet the challenge of presenting up-to-date estimates of the economically available crude oil, natural gas, and coal resources. Usually, these assessments comprise elements along a continuum of three dimensions: geological knowledge, economics, and technology. Another important dimension, and perhaps from society's perspective the most important, is the level of future resource extraction and use. The fact that these dimensions do not evolve independently adds to the already complex task of energy resource assessment, especially if the temporal scope of the assessment extends beyond traditional energy-sector planning horizons.
Definitions Inevitably, many assumptions enter such an analysis. Two of the most critical are the future rates of technology change and productivity gains. Technology advances in the hydrocarbon upstream sectors have an immediate impact on long-term fossil energy-resource availability. Because resource availability and resource costs play a central role in energy analyses extending over centuries, it is common practice to devise several scenarios of future rates of technology
1 Viewed through the lens of economics, however, there are no depletable resources. Even in the event of "the cessation, once and for all, of technological progress" (6) in the hydrocarbon upstream sector, the cost of replenishing depleted production capacity would eventually make investments in this resource uneconomical compared to alternatives. Investors would simply stop investing in this resource, and the remaining amounts would remain in the Earth's crust untapped.
220 ROGNER
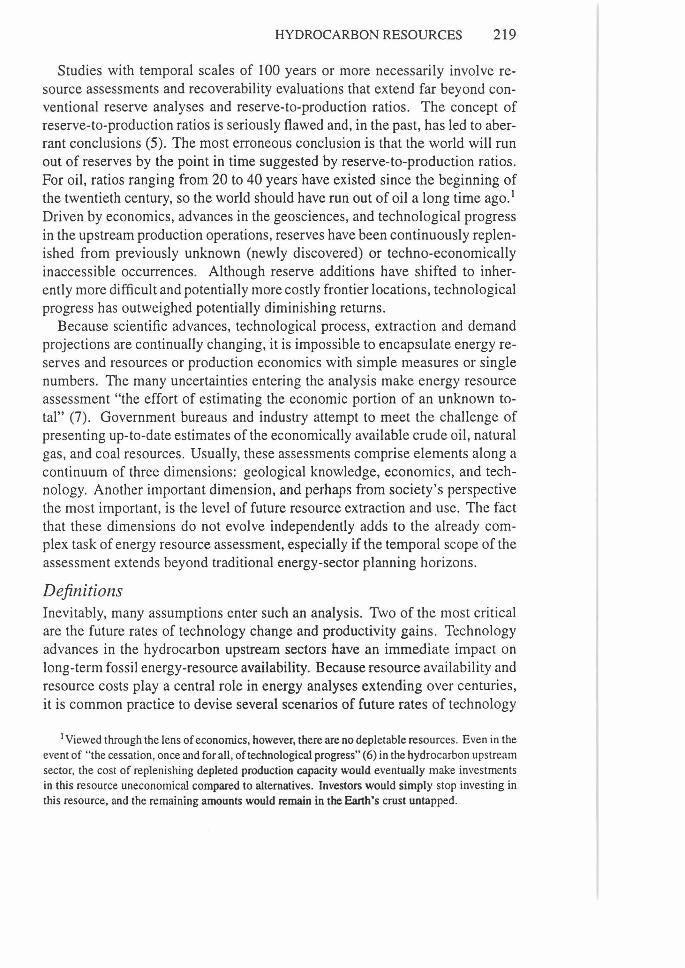
progress and fossil resource availability in which advances range from conservative to accelerated. In this hydrocarbon resource assessment, the broadest possible dimensions were applied without immediate reference to recoverability. In a second step, the assessed occurrences were categorized into estimated ranges of potential future production costs. Uncertainty is an element common to inventory assessment and recoverability evaluation, i.e. uncertainty with respect to geological assurance and techno-economic production feasibility of hydrocarbon occurrences. A modified "McKelvey box" approach was used for the resource categorization and techno-economic feasibility estimates reported here.
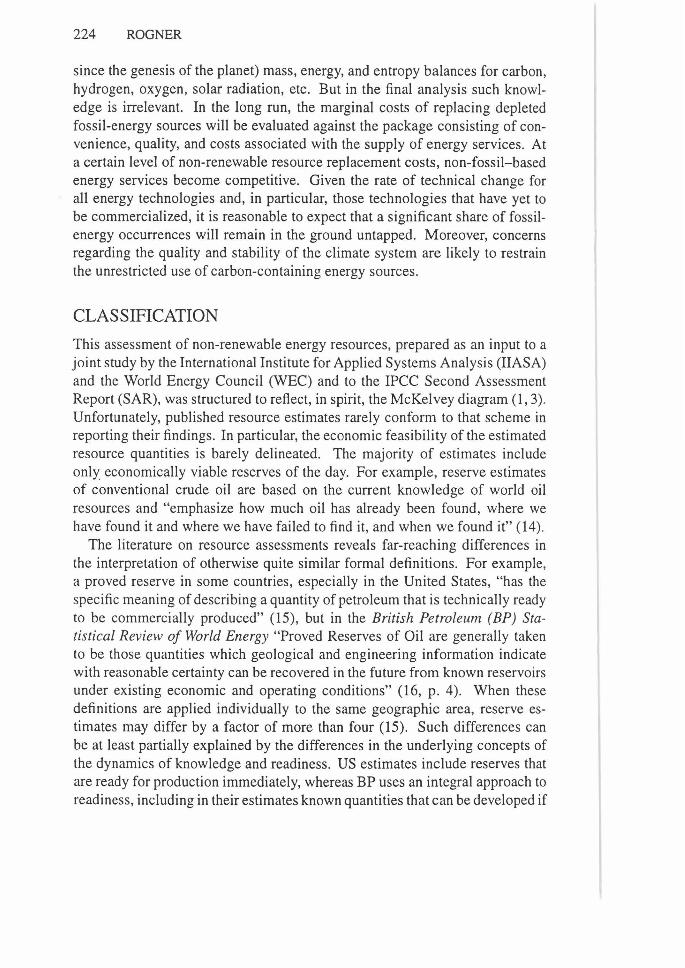
McKelvey (8) proposed a diagram with a matrix structure for the classification of mineral resources along two dimensions: decreasing geological assurance of occurrence and decreasing economic recoverability (see Figure 1). In the case of fossil energy, the concept of occurrence or resources "in place" represents all types and forms of hydrocarbon deposits in the Earth's crust (9). Global occurrences can be assessed using mass-balance calculations on the basis -of geophysical and geochemical information. At the regional level, analogy is used to obtain a first-order assessment of hydrocarbon occurrences. Geological properties and past production data of one particularly well-explored area are
.-------...... . . . .. . . .. ... .... ... . .. .. . . . ... ... . .. . . . ...... . - - ... .. . . . . .
Q)
~ Ol Q) 'O
Ol c ·u;
"'
Not economic
Submarglnal
~ Economic u Q)
Cl
Additional Occurrences
Proved Probable Indicated Inferred Hypo· Speculative thetical
Measured
Demonstrated
Identified Undiscovered
Decreasing degree of geological assurance
Figure I Classification of energy reserves and resources. (Modified from Reference 8.)
HYDROCARBON RESOURCES 221
used to construct a geologic model of the basin history and are then applied to geologically similar areas. The resource characteristics of the reference site in terms of in-place accumulation, distribution, etc, are then assumed to be similar to the characteristics of undiscovered resources within the unexplored area of interest (10).
The McKelvey box adds the dimensions of uncertainty and tech no-economic recoverability to the analogy concept. For example, measured occurrences have the highest geological assurance, followed by indicated, inferred, and undiscovered or speculative occurrences. Indicated occurrences are resources located in known reservoirs that can be extracted through the application of additional or improved recovery techniques. Inferred occurrences are identified resources that can be recovered by additional drilling in the extensions of known fields. Also included in the inferred category are newly discovered pay zones and net upward revisions of previous estimates (11). Taken together, the measured, indicated, and inferred occurrences are often referred to as proved reserves or reserves. In short, reserves are those occurrences that are identified, measured, and at the same time known to be technically and economically recoverable. Thus, reserve estimates inherently depend on the state-of-the-art of present exploration and production technologies as well as on the prevailing and anticipated market prices.
Resources are occurrences with less-certain geological assurance and/or with doubtful economic feasibility. The boundary between occurrences and resources is fuzzy and is usually drawn "by practice" in inventory assessments . Together, reserves and resources form the so-called resource base.2 Additional quantities with unknown degrees of assurance and/or with unknown or without economic significance are referred to as undiscovered or additional occurrences, respectively. For example, additional occurrences include methane hydrates (clathrates), which are presumed to exist in enormous quantities. Little is known, however, about their actual resource potential and the eventual techno-economic feasibility of their extraction.3
As helpful as the McKelvey diagram is for an organized and internally consistent presentation of reserves and resources, the underlying dynamic nature concerning geological assurance and techno-economic recoverability is often
2The resource base estimates include reserves and potentially recoverable resources not only of coal, conventional oil, and natural gas but also of unconventional oil (oil shale, tar sands, and heavy crude) and natural gas resources (gas in Devonian shales, tight sand formations, geopressured aquifers, and coal seams).
3 An abundance of methane hydrates is inferred mainly on the basis of the appearance on marine seismic-reflection profiles of a pronounced bottom-simulating reflection (BSR), which coincides with the base of the gas hydrate stability field (12). However, drilling has yet to confirm the volumes in-place suggested by BSR.
222 ROGNER
ignored. Instead, the diagram is viewed as an ironclad matrix structure with fixed quantities in each rectangle. In this case, energy reserves and resources appear to be ultimately determined by present knowledge and by technological and economic conditions. The result is those widely publicized reserve-toproduction ratios, which convey a definite sense of imminent finiteness. Reality, however, proves the opposite to be true.
In response to the energy service needs of a growing world population, improved geological knowledge, both scientific and experimental (e.g. reservoir theories and exploration techniques), technical progress, and innovation have continuously expanded the fossil-energy resource base. In fact, over the past 150 years, the additions to reserves have regularly outpaced consumption. Market prices and price expectations, the latter often raised by the static concept of energy reserves (which inherently fuels the perception that we are running out of reserves), contribute indirectly to the steadily growing resource base. Fluctuating prices impact resource availability in two ways. First, increasing prices render previously marginal or even uneconomic resources profitable. Higher market prices increase the technical recoverability of known and even depleted deposits (e.g. enhanced oil recovery can double the extraction from some reservoirs). Higher prices also accelerate exploration and induce technology change. Improved exploration and extraction technologies help identify and access quantities that were previously only inferred or beyond technical reach, and these technologies result in the reclassification of resources to reserves. Finally, technology improvements can further reduce the production costs of currently operating fields.
After a period of large additions to the resource base, price expectations tend to decline. Exploration activities are streamlined and concentrate on the most promising projects. Likewise, exotic technology development is abandoned. In the short run, the net effect is an increase in exploration and production productivity. This increase will further suppress price expectations, and eventually exploration activity bottoms out. The resource base stagnates and even begins to shrink. Periodical reserve estimates display declining reserves-to-production ratios, which raise future price expectations, and the cycle begins anew.4
Obviously, energy resource estimates based on, and responding to, shortterm business-cycle-dominated events in the market place are inadequate for any long-term evaluation of energy resources and their techno-economic availability. Over the last century, technology has probably had a more profound and lasting impact on prices than prices have had on technology. Energy prices matter in the short run when infrastructures are essentially locked in. They also
4In addition to these essentially expected return-on-investment-driven cycles upon cycles, return and price expectations are also highly influenced by the geopolitics of the day, especially geopolitical events involving the Middle East.
50
-c (].)
cu 40· .:?: ::J O"' (].)
'(5 30 -0
(].) .... .... C'Cl .0 20 .... (].) a. -co co ~10 CJ)
:J
0 2
No technology advances
4 6 8
HYDROCARBON RESOURCES 223
10 12
With technology advances
14 16 18
Gigatonnes of oil equivalent
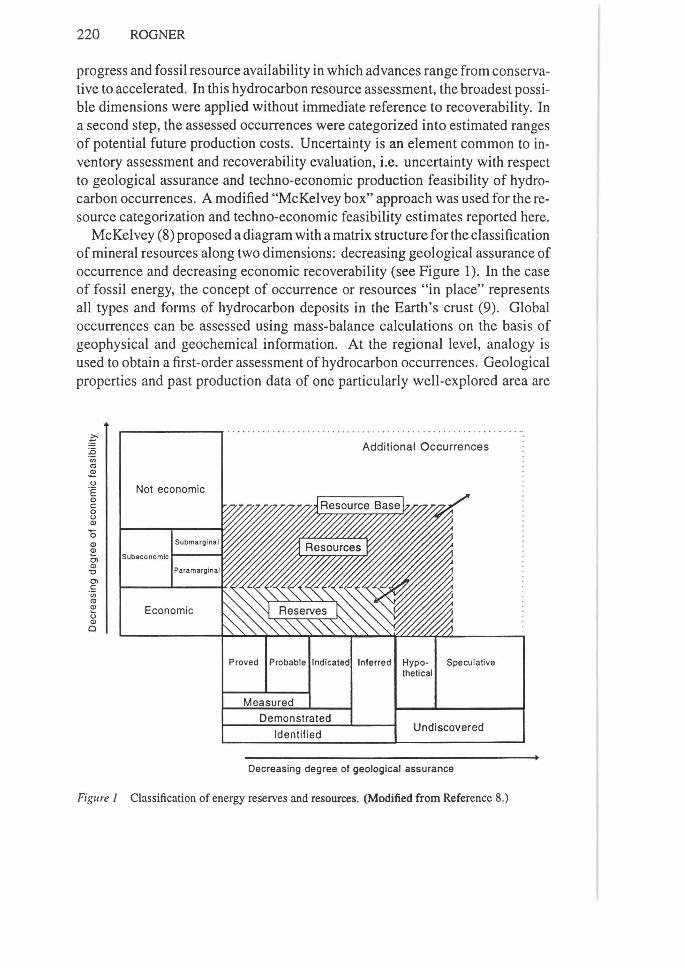
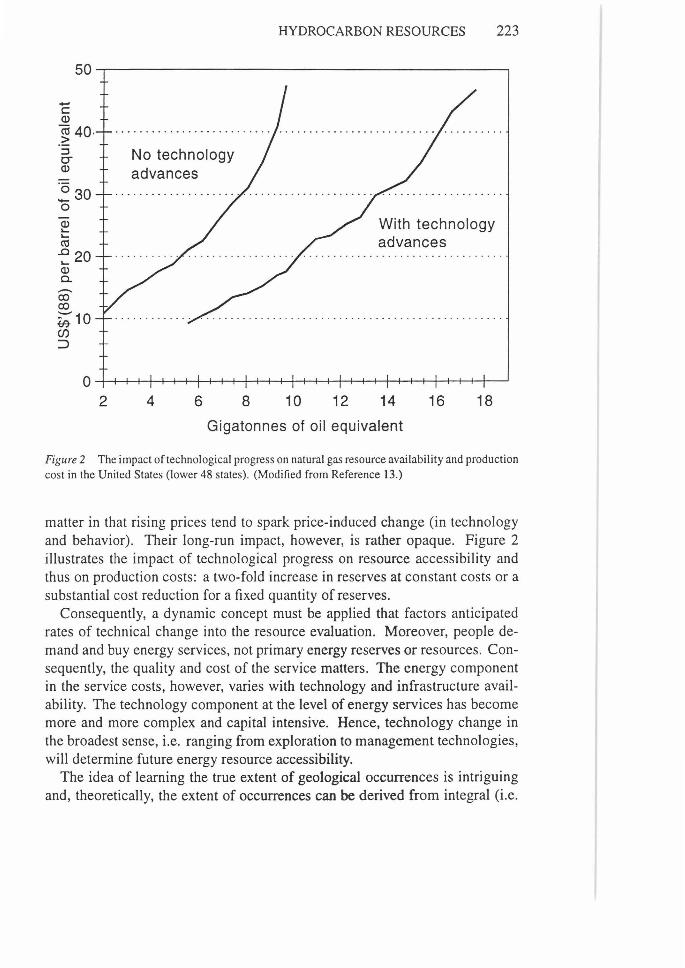
Figure 2 The impact of technological progress on natural gas resource availability and production cost in the United States (lower 48 states). (Modified from Reference 13.)
matter in that rising prices tend to spark price-induced change (in technology and behavior). Their long-run impact, however, is rather opaque. Figure 2
illustrates the impact of technological progress on resource accessibility and thus on production costs: a two-fold increase in reserves at constant costs or a substantial cost reduction for a fixed quantity of reserves.
Consequently, a dynamic concept must be applied that factors anticipated rates of technical change into the resource evaluation. Moreover, people demand and buy energy services, not primary energy reserves or resources. Consequently, the quality and cost of the service matters. The energy component in the service costs, however, varies with technology and infrastructure availability. The technology component at the level of energy services has become more and more complex and capital intensive. Hence, technology change in the broadest sense, i.e. ranging from exploration to management technologies, will determine future energy resource accessibility.
The idea of learning the true extent of geological occurrences is intriguing and, theoretically, the extent of occurrences can be derived from integral (i.e.
224 ROGNER
since the genesis of the planet) mass, energy, and entropy balances for carbon, hydrogen, oxygen, solar radiation, etc. But in the final analysis such knowledge is irrelevant. In the long run, the marginal costs of replacing depleted fossil-energy sources will be evaluated against the package consisting of convenience, quality, and costs associated with the supply of energy services. At a certain level of non-renewable resource replacement costs, non-fossil-based energy services become competitive. Given the rate of technical change for all energy technologies and, in particular, those technologies that have yet to be commercialized, it is reasonable to expect that a significant share of fossilenergy occurrences will remain in the ground untapped. Moreover, concerns regarding the quality and stability of the climate system are likely to restrain the unrestricted use of carbon-containing energy sources.
CLASSIFICATION
This assessment of non-renewable energy resources, prepared as an input to a joint study by the International Institute for Applied Systems Analysis (IIASA) and the World Energy Council (WEC) and to the IPCC Second Assessment Report (SAR), was structured to reflect, in spirit, the McKelvey diagram (1, 3). Unfortunately, published resource estimates rarely conform to that scheme in reporting their findings. In particular, the economic feasibility of the estimated resource quantities is barely delineated. The majority of estimates include only economically viable reserves of the day. For example, reserve estimates of conventional crude oil are based on the current knowledge of world oil resources and "emphasize how much oil has already been found, where we have found it and where we have failed to find it, and when we found it" (14) .
The literature on resource assessments reveals far-reaching differences in the interpretation of otherwise quite similar formal definitions. For example, a proved reserve in some countries, especially in the United States, "has the specific meaning of describing a quantity of petroleum that is technically ready to be commercially produced" (15), but in the British Petroleum (BP) Statistical Review of World Energy "Proved Reserves of Oil are generally taken to be those quantities which geological and engineering information indicate with reasonable certainty can be recovered in the future from known reservoirs under existing economic and operating conditions" (16, p. 4). When these definitions are applied individually to the same geographic area, reserve estimates may differ by a factor of more than four (15). Such differences can be at least partially explained by the differences in the underlying concepts of the dynamics of knowledge and readiness. US estimates include reserves that are ready for production immediately, whereas BP uses an integral approach to readiness, including in their estimates known quantities that can be developed if
HYDROCARBON RESOURCES 225
required. The BP definition of proved reserve corresponds approximately to the Demonstrated-by-Economic rectangle in the McKelvey diagram in Figure I.
The lesson learned from this discussion is the apparent difficulty of incorporating future development efforts, technology change, and uncertainty into reserve assessments. The short-term implications of these differences are not so important but will influence any long-term energy demand-and-supply analysis. If a long-term energy analysis with a study horizon of 50 or 100 years into the future incorporates an oil and gas resource availability based on current reserveto-production ratios of 45 to 60 years, a future in which we are running out of resources is hard-wired into the study findings. Therefore, a resource concept that reflects the overall hydrocarbon occurrences as well as future dynamics of technology change is needed, i.e. a series of McKelvey boxes as a function of time and technology change.
Resource Categories Estimates of global conventional and, to a lesser extent, unconventional oil and natural gas occurrences are routinely published by many organizations (15, 16-18, 19). Unfortunately, it is impossible to put these reserve and resource estimates at face value into the format suggested by the McKelvey box. The respective industries and institutions tend to report their quantities using quite different terminologies, concepts, and boundaries. As shown above, the same terms may have distinctly different meanings in different organizations. Because of these difficulties, an attempt was made to reconcile the individual estimates with the help of the McKelvey box. One drawback to this attempt is the difficulty of comparing the resulting resource quantities with the original industry classifications and reporting structures.
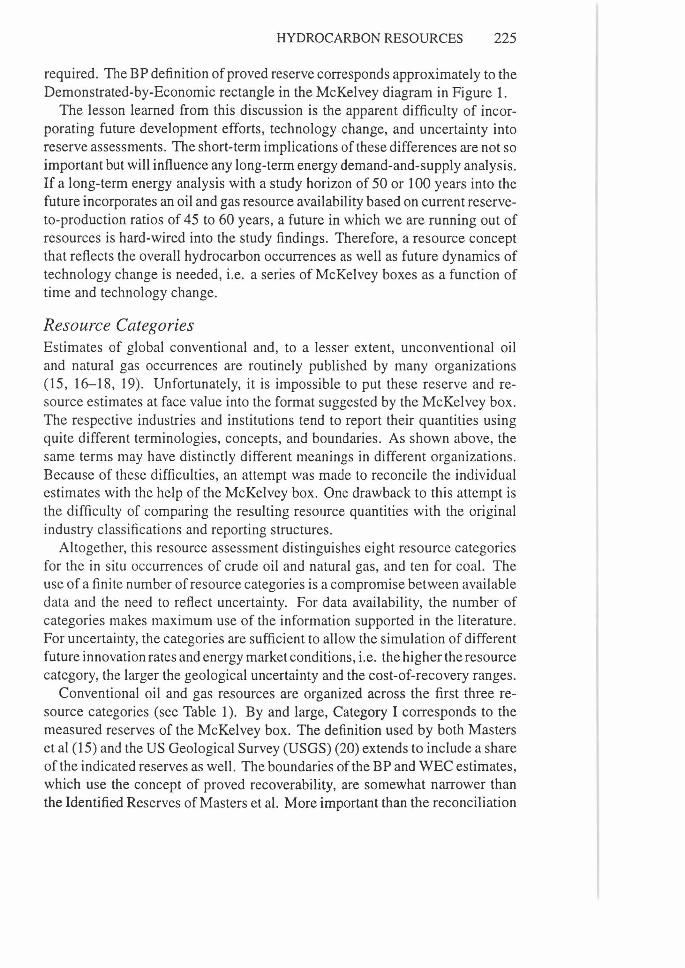
Altogether, this resource assessment distinguishes eight resource categories for the in situ occurrences of crude oil and natural gas, and ten for coal. The use of a finite number of resource categories is a compromise between available data and the need to reflect uncertainty. For data availability, the number of categories makes maximum use of the information supported in the literature. For uncertainty, the categories are sufficient to allow the simulation of different future innovation rates and energy market conditions, i.e. the higher the resource category, the larger the geological uncertainty and the cost-of-recovery ranges.
Conventional oil and gas resources are organized across the first three resource categories (see Table 1 ). By and large, Category I corresponds to the measured reserves of the McKelvey box. The definition used by both Masters et al (15) and the US Geological Survey (USGS) (20) extends to include a share of the indicated reserves as well. The boundaries of the BP and WEC estimates, which use the concept of proved recoverability, are somewhat narrower than the Identified Reserves of Masters et al. More important than the reconciliation
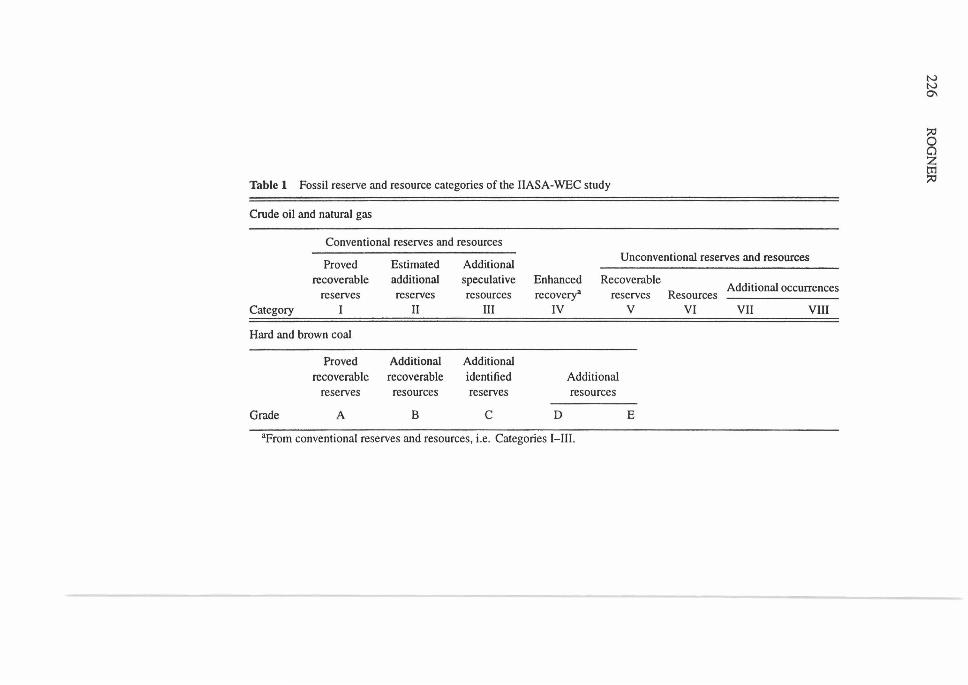
Table 1 Fossil reserve and resource categories of the IIASA-WEC study
Crude oil and natural gas
Conventional reserves and resources
Proved Estimated Additional Unconventional reserves and resources
recoverable additional reserves reserves
Category I II
Hard and brown coal
Proved Additional recoverable recoverable
reserves resources
Grade A B
speculative resources
III
Additional identified reserves
c
Enhanced Recoverable reserves
v recoverya
IV
D
Additional resources
E
aFrom conventional reserves and resources, i.e. Categories I-III.
R Additional occurrences
esources VI VII VIII
N N
°'
f5 0 z trl :;o
HYDROCARBON RESOURCES 227
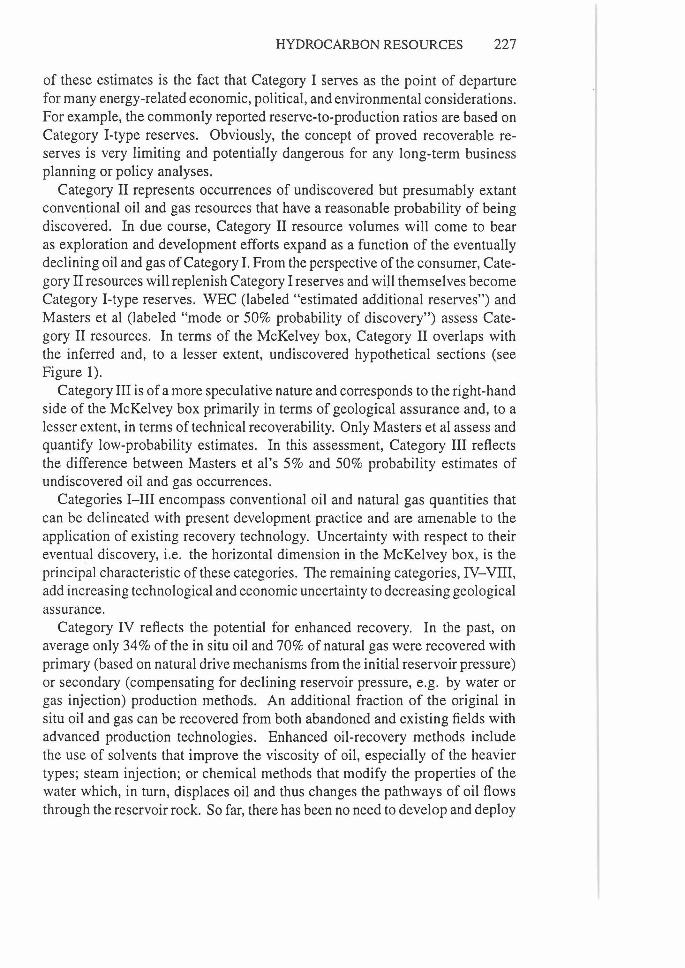
of these estimates is the fact that Category I serves as the point of departure for many energy-related economic, political, and environmental considerations. For example, the commonly reported reserve-to-production ratios are based on Category I-type reserves. Obviously, the concept of proved recoverable reserves is very limiting and potentially dangerous for any long-term business planning or policy analyses.
Category II represents occurrences of undiscovered but presumably extant conventional oil and gas resources that have a reasonable probability of being discovered. In due course, Category II resource volumes will come to bear as exploration and development efforts expand as a function of the eventually declining oil and gas of Category I. From the perspective of the consumer, Category II resources will replenish Category I reserves and will themselves become Category I-type reserves. WEC (labeled "estimated additional reserves") and Masters et al (labeled "mode or 50% probability of discovery") assess Category II resources. In terms of the McKelvey box, Category II overlaps with the inferred and, to a lesser extent, undiscovered hypothetical sections (see Figure 1).
Category III is of a more speculative nature and corresponds to the right-hand side of the McKelvey box primarily in terms of geological assurance and, to a lesser extent, in terms of technical recoverability. Only Masters et al assess and quantify low-probability estimates. In this assessment, Category III reflects the difference between Masters et al's 5% and 50% probability estimates of undiscovered oil and gas occurrences.
Categories I-III encompass conventional oil and natural gas quantities that can be delineated with present development practice and are amenable to the application of existing recovery technology. Uncertainty with respect to their eventual discovery, i.e. the horizontal dimension in the McKelvey box, is the principal characteristic of these categories. The remaining categories, IV-VIII, add increasing technological and economic uncertainty to decreasing geological assurance.
Category IV reflects the potential for enhanced recovery. In the past, on average only 34% of the in situ oil and 70% of natural gas were recovered with primary (based on natural drive mechanisms from the initial reservoir pressure) or secondary (compensating for declining reservoir pressure, e.g. by water or gas injection) production methods. An additional fraction of the original in situ oil and gas can be recovered from both abandoned and existing fields with advanced production technologies. Enhanced oil-recovery methods include the use of solvents that improve the viscosity of oil, especially of the heavier types; steam injection; or chemical methods that modify the properties of the water which, in turn, displaces oil and thus changes the pathways of oil flows through the reservoir rock. So far, there has been no need to develop and deploy
228 ROGNER
enhanced natural gas recovery methods. Extensive fracture stimulation comes closest to enhanced gas recovery.
In this assessment, future conventional oil and gas production from Categories I to III is assumed to utilize 40% and 80% of the in situ occurrences, respectively. Since the reserve quantities are delineated for the domain of primary and secondary recovery methods, the possibility of increasing the initial quantities assessed by enhanced recovery methods may arise.
Categories V-VIII encompass unconventional oil and natural gas. Unconventional oil and natural gas reserves cannot, in general, be tapped with conventional production methods, because of technical or economic reasons or both. The boundary between conventional and unconventional resources is flexible and depends on regional technology access and availability, geography, market prices, and definitions. Consequently, quantifications and statistics on reserves, resources, and production of conventional and unconventional oil and natural gas may well overlap. In fact, technological progress is one of the main causes of such boundary shifts.
Unconventional oils include oil shales, tar sands/bitumen, heavy and extraheavy crude oils, and deep-sea oil occurrences. Unconventional natural gas includes gas in Devonian shales, tight sandstone formations, geopressured aquifers, coal-bed gas, and methane in clathrate structures (gas hydrates) . These resources are known to exist in large quantities, but to date only minor efforts have been made to delineate them. The geological formations containing unconventional gas are distinctly different from those associated with unconventional oils. The latter are usually of low grade and often involve extraction technologies more similar to those for coal than to those for conventional oil. For example, estimates suggest that about 85% of global oil shale resources are contained in shales averaging less than 0.08 tonnes of oil equivalent (toe) per tonne (21 ). In contrast, unconventional natural gas requires elaborate drilling technologies, well stimulation, or liquid-gas and gasgas separation equipment. In general, the term unconventional suggests that this class of occurrences historically could not be produced using traditional development and extraction practices. Consequently, the production processes suitable for unconventional oil and gas production lack maturity. Given the large resource volumes of conventional oil and natural gas, there has been no immediate need to embark on rapid development of unconventional extraction technologies. Moreover, in the case of unconventional oil occurrences, the extraction products are less readily usable than conventional oils and require further treatment/upgrading. The production of unconventional oil poses additional environmental challenges ranging from enormous amounts of overburden removal (shale oils and tar sands) to heavy metals and sulfur (from heavy oils).
HYDROCARBON RESOURCES 229
Category V contains the identified reserves of unconventional oil and gas. Reserves in this context reflect those unconventional occurrences that can be produced today or in the near future at prevailing international market prices. It is important to note the difference between market price and production costs. While unconventional reserves can be produced commercially at current market prices and provide adequate returns to investors, their production costs tend to be significantly higher than those of conventional fuels, especially in the Middle East.5 Therefore, their economic viability is at present quite vulnerable to any downward pressure on international market prices. Because of this risk and the fact that conventional oil is still plentiful, investments in unconventional oil production are practically nonexistent.
Categories VI and VII encompass unconventional oil and gas resource estimates; Category VIII contains all remaining conventional and unconventional in situ occurrences including the quantities remaining in situ after commercial production has been abandoned. The occurrences in Category VIII are reported to show complete data, but they are not expected to be technically recoverable or economically feasible before the end of the twenty-first century. For example, the joint IIASA-WEC study excluded Category VIII resources from the menu of potential energy supply options.
Coal reserves and resources assessments usually distinguish among several ranks of coal (e.g. lignite, sub-bituminous, bituminous, or anthracite), which are a proxy for energetic value, depth of deposits, seam thickness, and type of recovery (i.e. surface or underground mining). As in the case of oil and natural gas, assessments of coal occurrences differ greatly in their reporting structures, terminology, technology assumptions, and levels of aggregation. 6
Another difference concerns the units used in the assessment documentation. For example, WEC reports coal resources in physical units, i.e. tonnage per rank and country, and gives tables of national coal characteristics such as heating values and levels of sulphur, carbon, ash, volatile matter, and moisture. These characteristics are given as ranges or averages or both. In contrast, the Bundesanstalt fiir Geowissenschaften und Rohstoffe (BGR) (22) provides the estimates in terms of both natural units (tonnage) and tons of coal equivalent.
For this study, the two BGR ranks of hard coal and lignite were adopted. Each rank was subdivided into five subcategories or grades: (A) recoverable reserves, (B) additional identified reserves, (C) additional recoverable resources,
5 In 1995, some 160 million toe of unconventional oil were produced worldwide. Most of the investments in unconventional oil production occurred during an era of high-oil price expectations, i.e. the late 1970s and early 1980s. For most projects, current market prices appear sufficient to offset operating costs. Whether or not capital costs can be fully recovered is uncertain in many cases.
6For a detailed review of coal occurrences see (9).
230 ROGNER
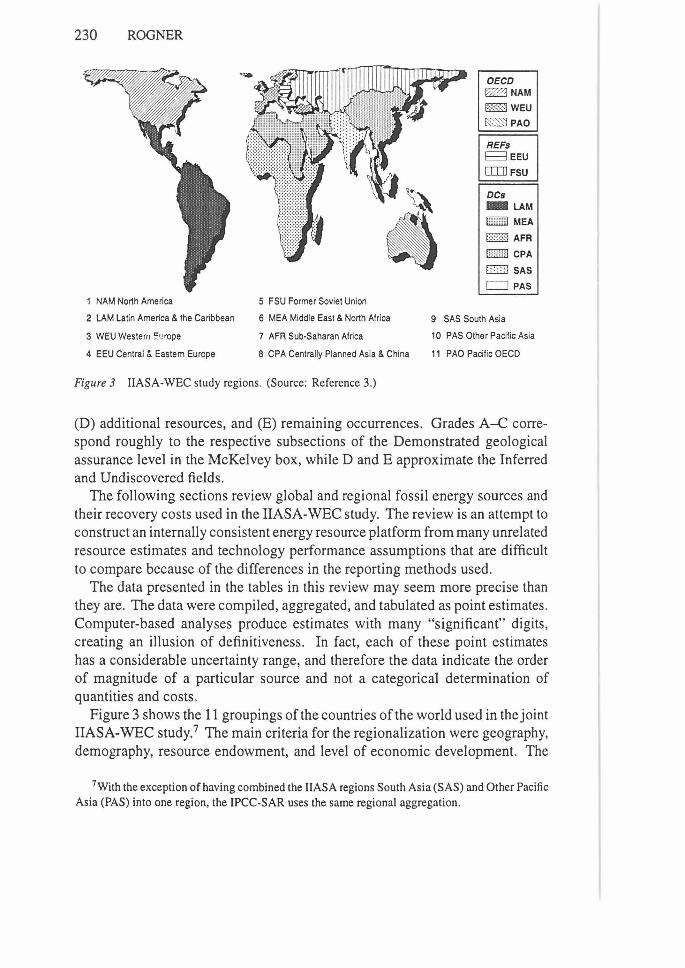
1 NAM North America
2 LAM Latin America & the Caribbean
3 WEU Western !:urope
4 EEU Central & Eastern Europe
5 FSU Former Soviet Union
OECD 10'l?,J NAM
~WEU
~ PAO
REFS ~EEU
0IIJ FSU
DCs lllllLAM F i!rnmj MEA
f::::::::::j AFR
k'i'''Hi CPA
!:::: :I SAS
c::J PAS
6 MEA Middle East & North Africa 9 SAS South Asia
7 AFR Sub-Saharan Africa 10 PAS Other Pacific Asia
8 CPA Centrally Planned Asia & China 11 PAO Pacific OECD
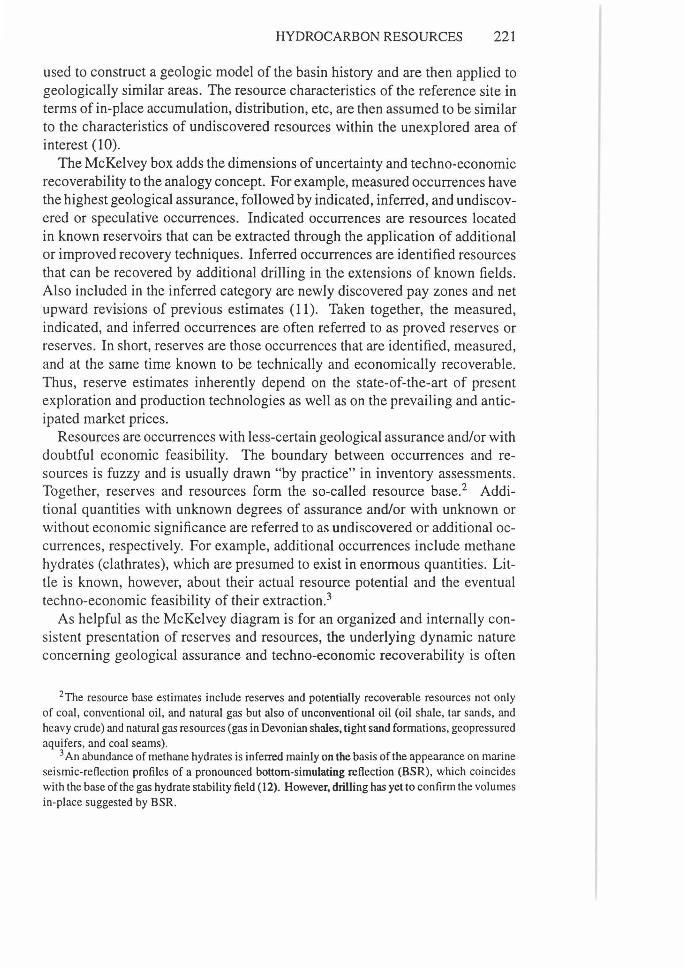
Figure 3 IIASA-WEC study regions. (Source: Reference 3.)
(D) additional resources, and (E) remaining occurrences. Grades A-C, correspond roughly to the respective subsections of the Demonstrated geological assurance level in the McKelvey box, while D and E approximate the Inferred and Undiscovered fields .
The following sections review global and regional fossil energy sources and their recovery costs used in the IIASA-WEC study. The review is an attempt to construct an internally consistent energy resource platform from many unrelated resource estimates and technology performance assumptions that are difficult to compare because of the differences in the reporting methods used.
The data presented in the tables in this review may seem more precise than they are. The data were compiled, aggregated, and tabulated as point estimates. Computer-based analyses produce estimates with many "significant" digits, creating an illusion of definitiveness . In fact, each of these point estimates has a considerable uncertainty range, and therefore the data indicate the order of magnitude of a particular source and not a categorical determination of quantities and costs.
Figure 3 shows the 11 groupings of the countries of the world used in the joint IIASA-WEC study.7 The main criteria for the regionalization were geography, demography, resource endowment, and level of economic development. The
7With the exception of having combined the IIASA regions South Asia (SAS) and Other Pacific Asia (PAS) into one region, the IPCC-SAR uses the same regional aggregation.
HYDROCARBON RESOURCES 231
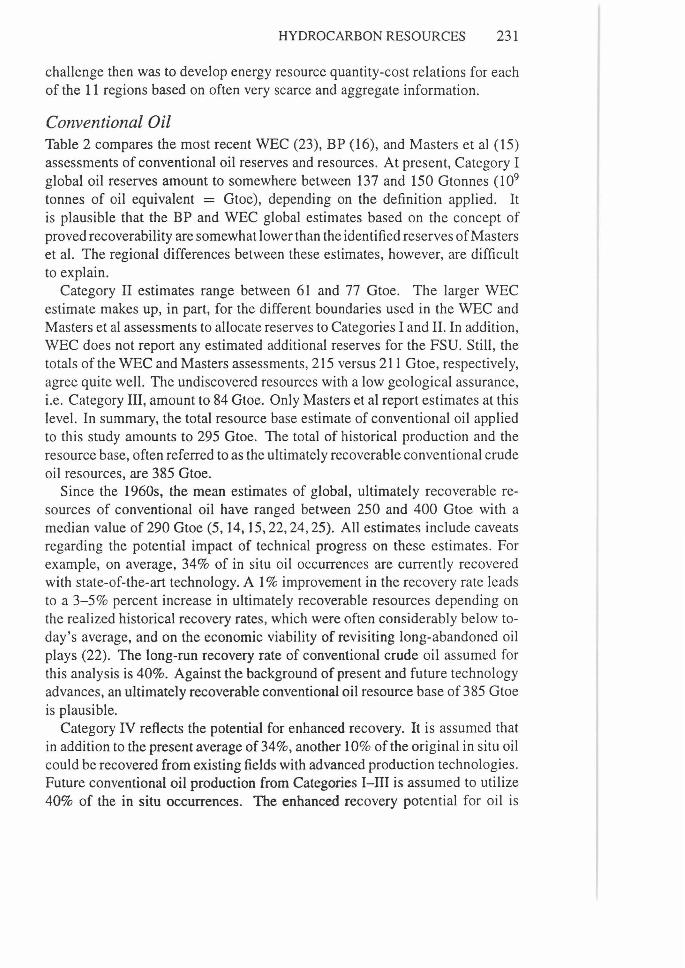
challenge then was to develop energy resource quantity-cost relations for each of the 11 regions based on often very scarce and aggregate information.
Conventional Oil Table 2 compares the most recent WEC (23), BP (16), and Masters et al (15) assessments of conventional oil reserves and resources . At present, Category I global oil reserves amount to somewhere between 137 and 150 Gtonnes (109
tonnes of oil equivalent = Gtoe), depending on the definition applied. It is plausible that the BP and WEC global estimates based on the concept of proved recoverability are somewhat lower than the identified reserves of Masters et al. The regional differences between these estimates, however, are difficult to explain.
Category II estimates range between 61 and 77 Gtoe. The larger WEC estimate makes up, in part, for the different boundaries used in the WEC and Masters et al assessments to allocate reserves to Categories I and II. In addition, WEC does not report any estimated additional reserves for the FSU. Still, the totals of the WEC and Masters assessments, 215 versus 211 Gtoe, respectively, agree quite well. The undiscovered resources with a low geological assurance, i.e. Category III, amount to 84 Gtoe. Only Masters et al report estimates at this level. In summary, the total resource base estimate of conventional oil applied to this study amounts to 295 Gtoe. The total of historical production and the resource base, often referred to as the ultimately recoverable conventional crude oil resources, are 385 Gtoe.
Since the 1960s, the mean estimates of global, ultimately recoverable resources of conventional oil have ranged between 250 and 400 Gtoe with a median value of 290 Gtoe (5, 14, 15, 22, 24, 25). All estimates include caveats regarding the potential impact of technical progress on these estimates. For example, on average, 34% of in situ oil occurrences are currently recovered with state-of-the-art technology. A I% improvement in the recovery rate leads to a 3-5% percent increase in ultimately recoverable resources depending on the realized historical recovery rates, which were often considerably below today's average, and on the economic viability of revisiting long-abandoned oil plays (22). The long-run recovery rate of conventional crude oil assumed for this analysis is 40%. Against the background of present and future technology advances, an ultimately recoverable conventional oil resource base of 385 Gtoe is plausible.
Category IV reflects the potential for enhanced recovery. It is assumed that in addition to the present average of 34%, another 10% of the original in situ oil could be recovered from existing fields with advanced production technologies. Future conventional oil production from Categories I-III is assumed to utilize 40% of the in situ occurrences. The enhanced recovery potential for oil is
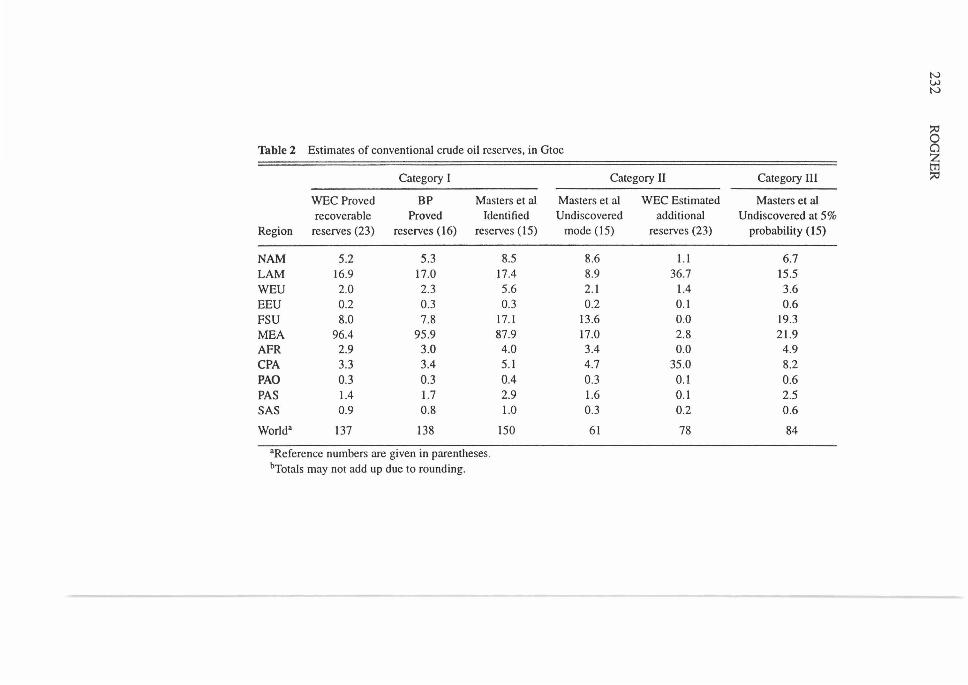
Table 2 Estimates of conventional crude oil reserves, in Gtoe
Category 1 Category II
WEC Proved BP Masters et al Masters et al WEC Estimated recoverable Proved Identified Undiscovered additional
Region reserves (23) reserves (16) reserves ( 15) mode (15) reserves (23)
NAM 5.2 5.3 8.5 8.6 I.I LAM 16.9 17.0 17.4 8.9 36.7 WEU 2.0 2.3 5.6 2.1 1.4 EEU 0.2 0.3 0.3 0.2 0.1 FSU 8.0 7.8 17. l 13.6 0.0 MEA 96.4 95.9 87.9 17.0 2.8 AFR 2.9 3.0 4.0 3.4 0.0 CPA 3.3 3.4 5.1 4.7 35.0 PAO 0.3 0.3 0.4 0.3 0.1 PAS 1.4 1.7 2.9 1.6 0.1 SAS 0.9 0.8 1.0 0.3 0.2
World• 137 138 150 61 78
•Reference numbers are given in parentheses. bTotals may not add up due to rounding.
Category III
Masters et al Undiscovered at 5%
probability ( 15)
6.7 15.5 3.6 0.6
19.3 21.9
4.9 8.2 0.6 2.5 0.6
84
N VJ N
~ Cl z trl :;o

HYDROCARBON RESOURCES 233
estimated at 15% of the original in situ quantities [ultimate recovery rates of 55-60% were suggested by Nehring (14)]. Based on these assumptions, the potential enhanced recovery is 138 Otoe.
UNCONVENTIONAL OIL Categories V-VIII encompass unconventional oil occurrences. Despite their presumably large resource volumes, only minor efforts have been made to delineate them. Most known unconventional oil deposits are economically marginal or unattractive given present market conditions and available technology. The technology for their exploitation is complex and capital intensive. With a few notable exceptions, unconventional oil is not exploited to contribute to liquid fuel supply. Current oil production from unconventional resources amounts to some 160 Mtoe per year (or 5% of global oil production). In the absence of considerably higher oil market prices, further technology advances are called upon to improve the economic attractiveness of unconventional oil resources. Because of this dependence on innovation, both the "oil-in-place" occurrences reported in the literature and prerequisite oil market price levels vary significantly, i.e. between 875 and 4120 Otoe and from $20 to $70 per barrel, respectively (26) . Moreover, potentially very high environmental costs add to the already large production-cost uncertainty.8
Moreover, unconventional oils contain low carbon-to-hydrogen ratios. In order to blend with or substitute for present oil products, unconventional oils need to be upgraded by means of hydrogen addition. Because of the greater density, viscosity, molecular structure, and nonhydrocarbon content, their production, transportation, upgrading, and refining processes differ greatly from those applied to conventional oil (27).
OIL SHALES Oil shales are sedimentary rocks containing a high proportion of kerogen formed from organic matter that is not buried deep enough to be transformed into oil and natural gas. Oil shale may be recovered through mining (surface or underground) similar to the production of coal or through in situ techniques (retorting or chemical treatment). In general, oil shale deposits are low grade with average yields of oil per tonne of deposit material rarely exceeding 0.1 toe. One estimate suggests that about 85% of global oil shale resources are contained in shales averaging less than 0.08 toe per tonne (21 ). The low-grade characteristic of this hydrocarbon resource represents a particular technological challenge. Large-scale production has to meet two objectives simultaneously: economic viability and environmental compatibility. In the past, oil shale was used as an under-boiler fuel or was refined into synthetic oil and gas. In the future, this resource is expected to initially supplement and eventually substitute for conventional oil.
8Most unconventional oils contain undesirable nonhydrocarbons ranging from vanadium and nickel to sulfur, nitrogen, and oxygen (27).
234 ROGNER
Oil shales account for the majority of unconventional oil occurrences. Oilin-place estimates range from 450 to 2510 Gtoe (19). An earlier study by BGR (22) showed a resource range of 667-2512 Gtoe, i.e. the bottom end of the estimate was revised downward significantly. This assessment incorporated an overall oil shale occurrence of 934 Gtoe. This resource volume is the result of a middle-of-the-road approach to the earlier BGR resource data based on a conservative interpretation of the immense resource range reported for China. 9
Most recent studies report only some 12 to 14 Gtoe as "proved reserves" ( 18, 19). Proved reserves have hovered at this level for almost a decade. Therefore, 14 Gtoe appeared as a plausible datum. Estimated additional reserves range from 35 Gtoe (18) to almost 160 Gtoe (19). The latter estimate is somewhat higher than the 1989 assessment of 123 Gtoe. At the time of this assessment, the 1995 estimates were not yet available, and Table 3, therefore, shows the 1989 BGR value.
NATURAL BITUMEN (TAR SANDS) AND HEAVY CRUDE OIL Natural bitumen (tar sands) and heavy crude oil are closely related, i.e. most of their physical and chemical characteristics are the same. In essence, these hydrocarbons are oils that have seeped upwards from the geological "petroleum window" and near the surface were either oxidized or microbiologically altered (30); a method of distinguishing between these alternatives has yet to be devised. In general, viscosity and American Petroleum Institute (API) gravities at reservoir conditions are used as distinguishing characteristics. Heavy oils have 10°-25° gravities but are less viscous than 10,000 centipoise ( cP). Extra heavy oil is less than 10° APL Heavy oils can still flow but only extremely slowly, especially at the lower API range, and their production often involves in situ flow and lift enhancement methods (heat, steam, and polymer stimulation). Natural bitumen has a viscosity greater than 10,000 cP. At this viscosity level, bitumen differs more from conventional oil than it does from heavy oil, and its production requires more complex techniques. Tar sands and extra heavy oil have a 7°-10° API gravity and cannot flow under normal reservoir conditions. Their extraction methods are surface mining or in situ thermal recovery.
Worldwide resource estimates for tar sands and heavy crude oil have been reported (22, 23, 27, 29). For tar sands, the estimates range from 73 to 460 Gtoe. The lower estimate, made by WEC, is the result of a relatively narrow definition of resource that includes only occurrences meeting criteria otherwise applied to potentially recoverable reserves. The estimated resource levels in all the other studies were between 436 and 460 Gtoe. Based on the availability of regional data, a total resource volume of 446 Gtoe was deemed plausible. It appears that tar sand reserves were generally assessed cautiously, i.e. the
9 "Data from China appears to be erratic. It often appears that tons of shale oil, and barrels of shale oil may be transposed" (21).

Table 3 Estimates of unconventional oil occurrences, in Gtoe
Shale oil Tarsands Heavy Oil
BGR (I 9)b WEC (2W BGR (22)b WEC(2W Meyers et al (27)b BGR (22)b Meyers et al (29)b
Region Resources Reserves Resources Reserves Resources Reserves Resources Reserves Resources Reserves Resources Reserves Resources Reserves
NAM LAM WEU EEU FSU MEA AFR CPA PAO PAS SAS
World'
220 120 29
3 35
144 16
202 133
18 -
920
3.0 217 9.0 19 4.0 2 0.3 2.0 42
20.0 79 - 0
80.0 -3.3 102 1.0 19 - -
123 479
'Totals may not add up owing to rounding.
0.4 0.2
2.0 6.3
1.0 3.7 0.1
14
bData adapted and/or modified from these references.
258 125
0 42 0 9 I
436
5.00 0.01 0.04 0.01 0.34 0.01 1.00
-0.09 -
6.5
26.8 24.4 0.3 0.1
19.0 0.0 0.2 1.7 -0.0 -72
0.52 368 - 14 0.83 23 2.57 0.00 I - 166 33.0 215 2.29 0.03 0 - I 0.07 10 1.04 0.01 0 - 0 0.04 0 0.02
65 - 0 0.02 23 0.95 0.01 0 - 2 76 16.0 0.03 5 - 1 0.20 2 0.41 0.25 4 0.90 9 1.26 - 0.01 0 0.01
0.00 0.13 6 0.39 1 0.10
440 191 35 367 25
:r: --<: 0 :;o 0 n >-:;o to 0 z :;o tTl (/)
0 c::: :;o n tTl (/)
N w VI
236 ROGNER
reserves are very low compared to the immense resource volume. The values reported in the literature reflect the capital intensiveness of tar sand recovery and the low oil market-price level of the late 1980s when these assessments were made. The maximum estimate of 6.5 Gtoe was adopted.
The 1995 study of BGR shows a somewhat different resource range, i.e. tar sands are estimated at 200-680 Gtoe of oil-in-place. Reserve values are considerably higher compared to earlier estimates (24 Gtoe versus 6.5 Gtoe).
Heavy crude oil reserve and resource estimates are based on the same studies as the tar sand assessments. According to these studies, resources range from 191 to 367 Gtoe, while reserves vary between 25 and 35 Gtoe. The latest BGR estimate shows a much wider variation, from 135 to 930 Gtoe. Likewise, the 1995 reserves estimates exceed those of 1989 by 30%.
Table 3 summarizes the state-of-the-art assessments of unconventional oil reserves and resources at the time of the finalization of the IIASA-WEC study analyses and the IPCC-SAR study in early 1995. This study examined longterm perspectives for today's energy system, which relies largely on fossil fuels to progress toward a generally more sustainable energy service supply structure. Attractors and barriers were identified that could accelerate or delay a transition toward sustainability. Fossil energy sources may accelerate or delay such a transition or even do both simultaneously. An abundance of a low-carbon fossil source, e.g. natural gas, could well facilitate a transition, initially as a substitute for the higher-carbon fossil sources-coal and oil-and eventually as a staple source for hydrogen production. On the other hand, continued technology change may, in the course of half a century, mobilize a sizable portion of the carbon-intensive unconventional fossil occurrences whose recovery in the short-term remains technically or economically unfeasible. The abundance of inexpensive high-carbon energy sources would probably function as a barrier to sustainability if it were not complemented by stringent pollution-abatement measures. An examination of not only resource-constrained but also hydrocarbon resource-rich energy futures required the use of the largest fossil occurrence figures referenced in the literature. Ultimately, the global resource availability included in a scenario is a matter of choice (the analyst's). Sensitivity analyses around the assumed resource availability then address the issue of uncertainty. But the a priori exclusion of presently subeconomic or geologically uncertain occurrences would certainly underestimate the hydrocarbon occurrence potentially available to humankind.
In the IIASA-WEC study, Category V, the reserves of unconventional oil are defined as the sum of WEC shales reserves, BGR tar sands reserves, and Meyers et al heavy oil reserves. This aggregation leads to a global reserve volume of 45 Gtoe. The study selected an essentially low range of unconventional reserves because of the anticipated strong techno-economic performance of
HYDROCARBON RESOURCES 237
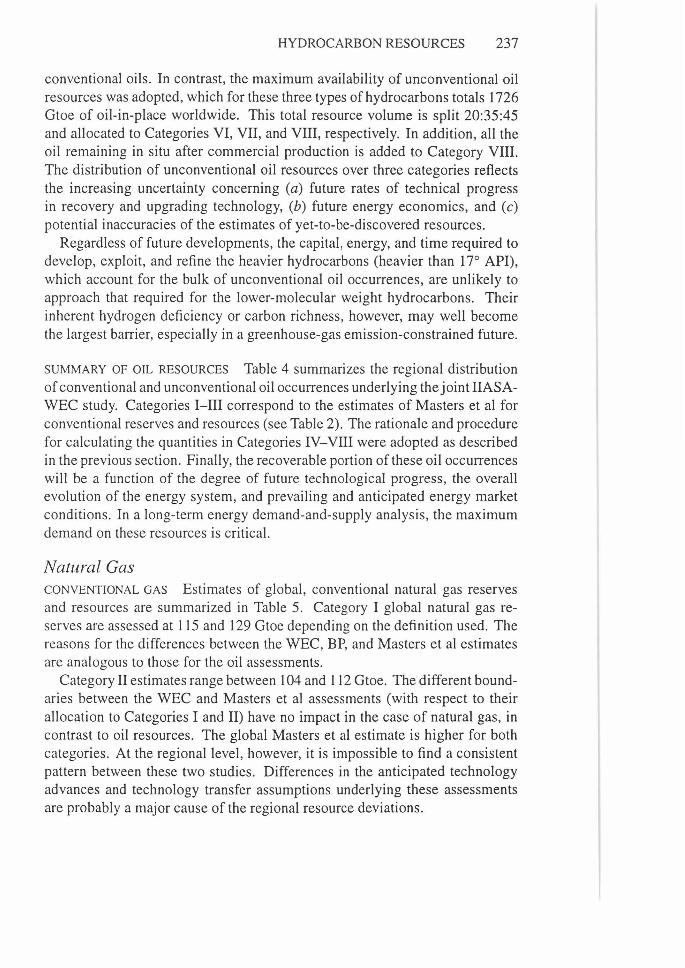
conventional oils. In contrast, the maximum availability of unconventional oil resources was adopted, which for these three types of hydrocarbons totals 1726 Gtoe of oil-in-place worldwide. This total resource volume is split 20:35:45 and allocated to Categories VI, VII, and VIII, respectively. In addition, all the oil remaining in situ after commercial production is added to Category VIII. The distribution of unconventional oil resources over three categories reflects the increasing uncertainty concerning (a) future rates of technical progress in recovery and upgrading technology, (b) future energy economics, and (c) potential inaccuracies of the estimates of yet-to-be-discovered resources.
Regardless of future developments, the capital, energy, and time required to develop, exploit, and refine the heavier hydrocarbons (heavier than 17° API), which account for the bulk of unconventional oil occurrences, are unlikely to approach that required for the lower-molecular weight hydrocarbons. Their inherent hydrogen deficiency or carbon richness, however, may well become the largest barrier, especially in a greenhouse-gas emission-constrained future.
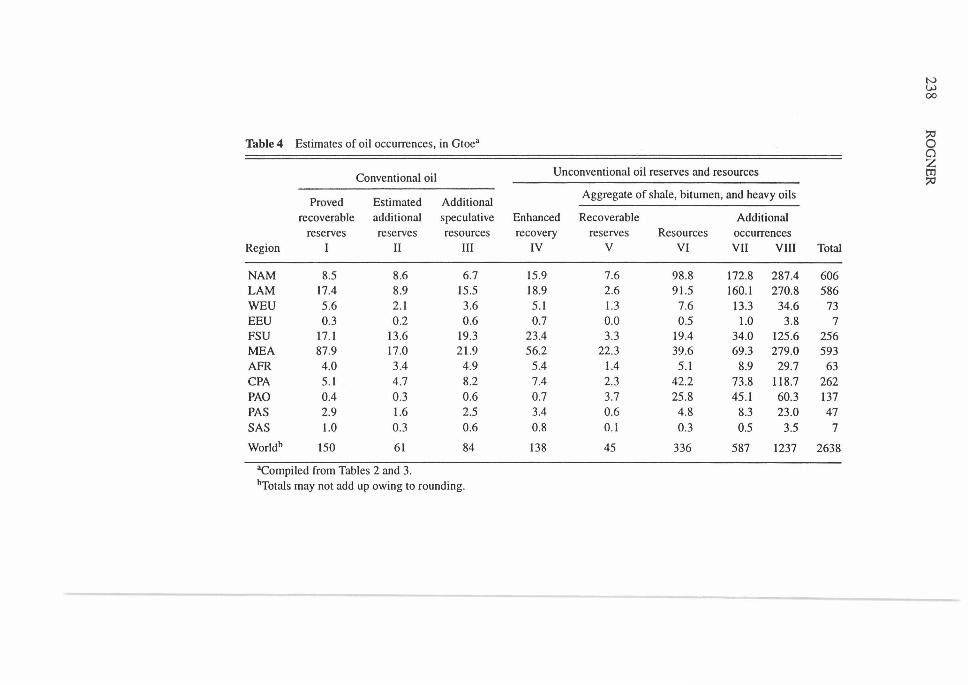
SUMMARY OF OIL RESOURCES Table 4 summarizes the regional distribution of conventional and unconventional oil occurrences underlying the joint IIASAWEC study. Categories I-III correspond to the estimates of Masters et al for conventional reserves and resources (see Table 2). The rationale and procedure for calculating the quantities in Categories IV-VIII were adopted as described in the previous section. Finally, the recoverable portion of these oil occurrences will be a function of the degree of future technological progress, the overall evolution of the energy system, and prevailing and anticipated energy market conditions. In a long-term energy demand-and-supply analysis, the maximum demand on these resources is critical.
Natural Gas CONVENTIONAL GAS Estimates of global, conventional natural gas reserves and resources are summarized in Table 5. Category I global natural gas reserves are assessed at 115 and 129 Gtoe depending on the definition used. The reasons for the differences between the WEC, BP, and Masters et al estimates are analogous to those for the oil assessments.
Category II estimates range between 104 and 112 Gtoe. The different boundaries between the WEC and Masters et al assessments (with respect to their allocation to Categories I and II) have no impact in the case of natural gas, in contrast to oil resources. The global Masters et al estimate is higher for both categories. At the regional level, however, it is impossible to find a consistent pattern between these two studies. Differences in the anticipated technology advances and technology transfer assumptions underlying these assessments are probably a major cause of the regional resource deviations.
N VJ 00
Tablc4 Estimates of oil occurrences, in Gtoe• :;cl 0 0
Unconventional oil reserves and resources z
Conventional oil rri :;cl
Proved Estimated Additional Aggregate of shale, bitumen, and heavy oils
recoverable additional speculative Enhanced Recoverable Additional reserves reserves resources recovery reserves Resources occurrences
Region I II III IV v VI VII VIII Total
NAM 8.5 8.6 6.7 15.9 7.6 98.8 172.8 287.4 606 LAM 17.4 8.9 15.5 18.9 2.6 91.5 160.1 270.8 586 WEU 5.6 2.1 3.6 5.1 1.3 7.6 13.3 34.6 73 EEU 0.3 0.2 0.6 0.7 0.0 0.5 1.0 3.8 7 FSU 17.1 13.6 19.3 23.4 3.3 19.4 34.0 125.6 256 MEA 87.9 17.0 21.9 56.2 22.3 39.6 69.3 279.0 593 AFR 4.0 3.4 4.9 5.4 1.4 5.1 8.9 29.7 63 CPA 5.1 4.7 8.2 7.4 2.3 42.2 73.8 118.7 262 PAO 0.4 0.3 0.6 0.7 3.7 25.8 45.l 60.3 137 PAS 2.9 1.6 2.5 3.4 0.6 4.8 8.3 23.0 47 SAS 1.0 0.3 0.6 0.8 0.1 0.3 0.5 3.5 7
Worldb 150 61 84 138 45 336 587 1237 2638
•compiled from Tables 2 and 3. bTotals may not add up owing to rounding.
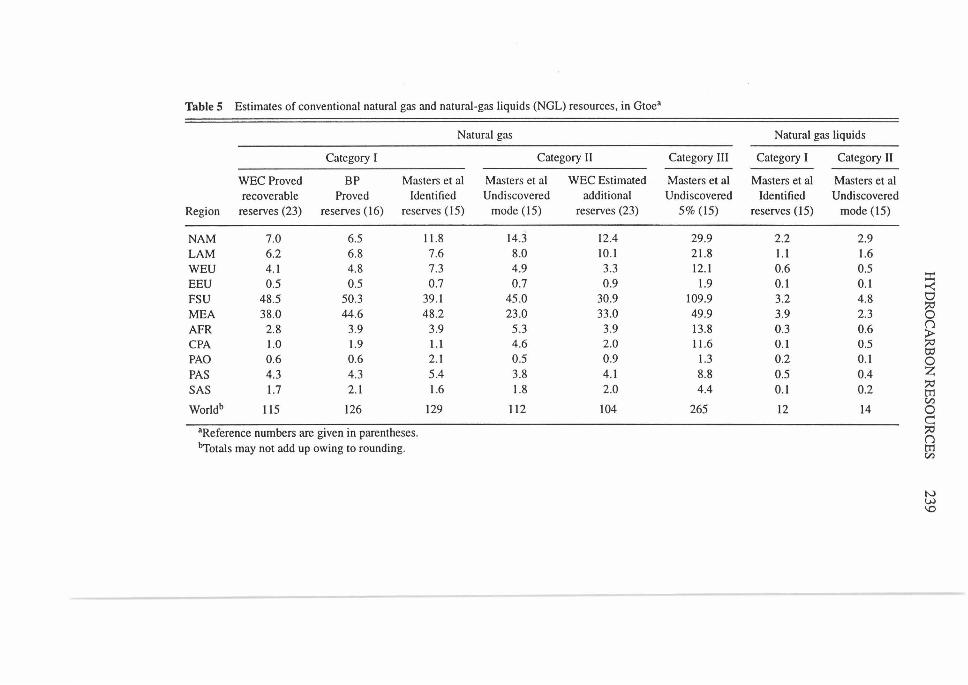
Table 5 Estimates of conventional natural gas and natural-gas liquids (NGL) resources, in Gtoea
Natural gas Natural gas liquids
Category I Category II Category III Category I Category II
WEC Proved BP Masters et al Masters et al WEC Estimated Masters et al Masters et al Masters et al recoverable Proved Identified Undiscovered additional Undiscovered Identified Undiscovered
Region reserves (23) reserves (16) reserves (15) mode (15) reserves (23) 5% (15) reserves (15) mode (15)
NAM 7.0 6.5 11.8 14.3 12.4 29.9 2.2 2.9 LAM 6.2 6.8 7.6 8.0 IO.I 21.8 I.I 1.6 WEU 4.1 4.8 7.3 4.9 3.3 12.1 0.6 0.5
:t EEU 0.5 0.5 0.7 0.7 0.9 1.9 0.1 0.1 ....:: FSU 48.5 50.3 39 .1 45 .0 30.9 109.9 3.2 4.8 0
~ MEA 38.0 44.6 48.2 23.0 33.0 49.9 3.9 2.3 0 AFR 2.8 3.9 3.9 5.3 3.9 13.8 0.3 0.6 n
;l> CPA 1.0 1.9 I.I 4.6 2.0 11.6 0.1 0.5 ~
0.6 0.6 2.1 0.5 0.9 1.3 0.2 0.1 Oj
PAO 0 PAS 4.3 4.3 5.4 3.8 4.1 8.8 0.5 0.4 z SAS 1.7 2.1 1.6 1.8 2.0 4.4 0.1 0.2 ~ m Worldb
Cl)
115 126 129 112 104 265 12 14 0 c: "Reference numbers are given in parentheses. ~ n bTotals may not add up owing to rounding. m
Cl)
N VJ \0
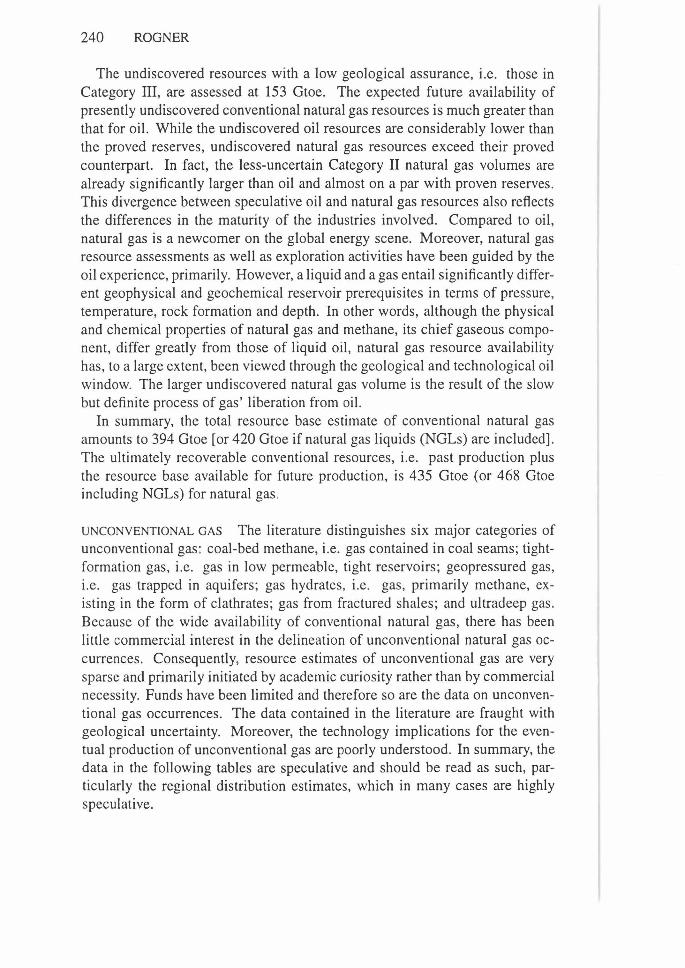
240 ROGNER
The undiscovered resources with a low geological assurance, i.e. those in Category III, are assessed at 153 Gtoe. The expected future availability of presently undiscovered conventional natural gas resources is much greater than that for oil. While the undiscovered oil resources are considerably lower than the proved reserves, undiscovered natural gas resources exceed their proved counterpart. In fact, the less-uncertain Category II natural gas volumes are already significantly larger than oil and almost on a par with proven reserves. This divergence between speculative oil and natural gas resources also reflects the differences in the maturity of the industries involved. Compared to oil, natural gas is a newcomer on the global energy scene. Moreover, natural gas resource assessments as well as exploration activities have been guided by the oil experience, primarily. However, a liquid and a gas entail significantly different geophysical and geochemical reservoir prerequisites in terms of pressure, temperature, rock formation and depth. In other words, although the physical and chemical properties of natural gas and methane, its chief gaseous component, differ greatly from those of liquid oil, natural gas resource availability has, to a large extent, been viewed through the geological and technological oil window. The larger undiscovered natural gas volume is the result of the slow but definite process of gas' liberation from oil.
In summary, the total resource base estimate of conventional natural gas amounts to 394 Gtoe [or 420 Gtoe if natural gas liquids (NGLs) are included]. The ultimately recoverable conventional resources, i.e. past production plus the resource base available for future production, is 435 Gtoe (or 468 Gtoe including NGLs) for natural gas.
UNCONVENTIONAL GAS The literature distinguishes six major categories of unconventional gas: coal-bed methane, i.e. gas contained in coal seams; tightformation gas, i.e. gas in low permeable, tight reservoirs; geopressured gas, i.e. gas trapped in aquifers; gas hydrates, i.e. gas, primarily methane, existing in the form of clathrates; gas from fractured shales; and ultradeep gas . Because of the wide availability of conventional natural gas, there has been little commercial interest in the delineation of unconventional natural gas occurrences. Consequently, resource estimates of unconventional gas are very sparse and primarily initiated by academic curiosity rather than by commercial necessity. Funds have been limited and therefore so are the data on unconventional gas occurrences. The data contained in the literature are fraught with geological uncertainty. Moreover, the technology implications for the eventual production of unconventional gas are poorly understood. In summary, the data in the following tables are speculative and should be read as such, particularly the regional distribution estimates, which in many cases are highly speculative.
HYDROCARBON RESOURCES 241
COAL-BED METHANE Coal-bed gas is the gas mixture contained in predominantly bituminous and anthracite coal occurrences. The major component of coal-bed gas is methane with varying admixed quantities of heavier hydrocarbons and carbon dioxide. Coal-beds are both the source and reservoir rock for large quantities of methane (31 ). They are the source rock in that the gas is a product of the coalification process in which organic matter is initially decomposed by microorganisms to methane in an anoxic and low-temperature, low-pressure environment (biogenic process). As sedimentation increases both temperature and pressure, the coalification process continues and large amounts of methane and carbon dioxide are released, thus enriching the coal carbon contents (thermogenic process). The quantities of methane generated during the coalification process are estimated at 150-200 cm3 of gas per gram of coal (31).
The coal-bed serves also as the gas reservoir, whereas the gas is adsorbed as well as absorbed within the molecular lattice structure of the coal. The actual quantity of gas stored is a function of coal rank, pressure, and temperature. Because permeability is extremely low in coal, gas production requires the depressurization of the coal-bed reservoir, usually via dewatering or fracturing.
The potential volume of coal-bed methane (in place) has been estimated at 85-367 trillion cubic m globally (31, 32). The regional distribution of coal-bed gas is intimately linked to the geographical distribution of anthracite and bituminous coal deposits. The wide range of the coal-bed gas estimates indicates that the delineation of coal-bed gas is in its infancy. There are no imminent technology barriers to production, and the economics appear quite favorable. Still, this resource is essentially undeveloped, except in the United States. 10 In the United States, coal-bed gas has been established as a commercial source of natural gas and accounts for some 4% of the domestic natural gas supply. In other countries with access to conventional natural gas deposits, coal-bed gas has yet to gain appeal. Table 6 shows the estimated coal-bed methane resources and their geographical distribution .
TIGHT-FORMATION GAS Gas in tight reservoirs occurs in a variety of rock types where the common characteristics are low in situ permeability to gas of less than 0.1 millidarcy and reservoir pressures that deviate significantly from hydrostatic pressures (in either direction). Almost every petroleum province has tight gas reservoirs, and their depths range from very shallow to very deep. Unlike conventional natural gas, where the gas is concentrated in structural or
10The ventilation and use of coal-bed methane from active coal mines is common in many coalproducing countries . It is a necessary precautionary measure to reduce the risk of underground explosions during coal production. Commercial use of coal-bed gas for this purpose implies that gas production is the primary, if not the only, objective and that the coal serves simply as the reservoir.
242 ROGNER
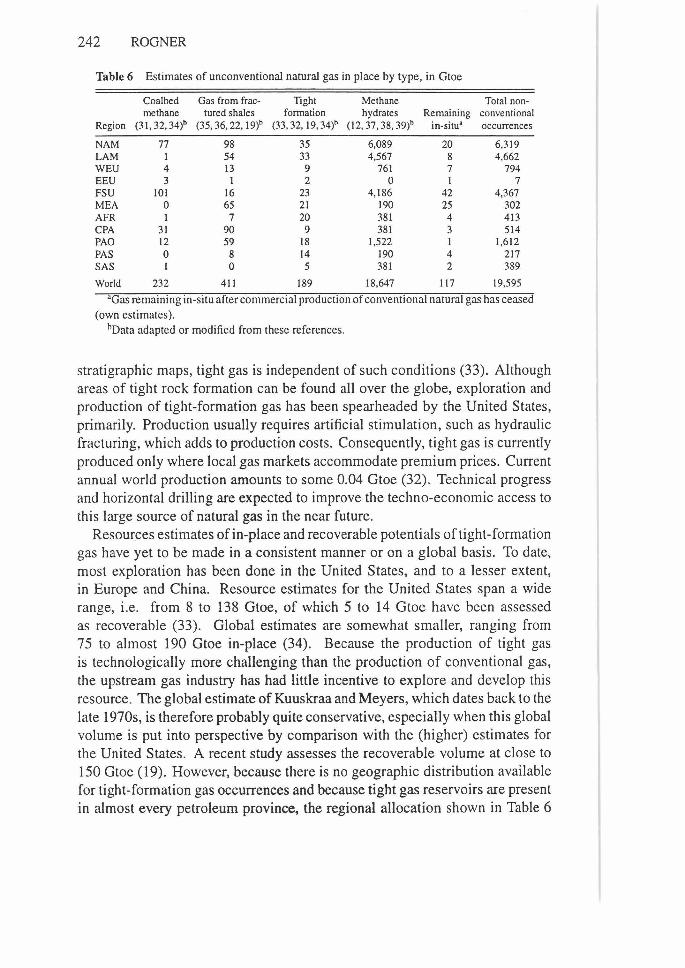
Table 6 Estimates of unconventional natural gas in place by type, in Gtoe
Coalbed Gas from frac- Tight Methane Total non-methane lured shales formation hydrates Remaining conventional
Region (31, 32, 34)h (35, 36, 22, l 9)h (33, 32, 19, 34)h (12, 37' 38, 39)h in-situ• occurrences
NAM 77 98 35 6,089 20 6,319 LAM I 54 33 4,567 8 4,662 WEU 4 13 9 761 7 794 EEU 3 I 2 0 I 7 FSU IOI 16 23 4,186 42 4,367 MEA 0 65 21 190 25 302 AFR I 7 20 381 4 413 CPA 31 90 9 381 3 514 PAO 12 59 18 1,522 I 1,612 PAS 0 8 14 190 4 217 SAS I 0 5 381 2 389
World 232 411 189 18,647 117 19,595
aaas remaining in-situ after commercial production of conventional natural gas has ceased (own estimates).
hoata adapted or modified from these references.
stratigraphic maps, tight gas is independent of such conditions (33). Although areas of tight rock formation can be found all over the globe, exploration and production of tight-formation gas has been spearheaded by the United States, primarily_ Production usually requires artificial stimulation, such as hydraulic fracturing, which adds to production costs. Consequently, tight gas is currently produced only where local gas markets accommodate premium prices. Current annual world production amounts to some 0.04 Gtoe (32) . Technical progress and horizontal drilling are expected to improve the techno-economic access to this large source of natural gas in the near future.
Resources estimates of in-place and recoverable potentials of tight-formation gas have yet to be made in a consistent manner or on a global basis. To date, most exploration has been done in the United States, and to a lesser extent, in Europe and China. Resource estimates for the United States span a wide range, i.e. from 8 to 138 Gtoe, of which 5 to 14 Gtoe have been assessed as recoverable (33). Global estimates are somewhat smaller, ranging from 75 to almost 190 Gtoe in-place (34) . Because the production of tight gas is technologically more challenging than the production of conventional gas, the upstream gas industry has had little incentive to explore and develop this resource. The global estimate of Kuuskraa and Meyers, which dates back to the late 1970s, is therefore probably quite conservative, especially when this global volume is put into perspective by comparison with the (higher) estimates for the United States. A recent study assesses the recoverable volume at close to 150 Gtoe (19) . However, because there is no geographic distribution available for tight-formation gas occurrences and because tight gas reservoirs are present in almost every petroleum province, the regional allocation shown in Table 6
HYDROCARBON RESOURCES 243
was obtained by weighting the estimated global volume of almost 190 Otoe with the regional distribution of conventional gas.
GEOPRESSURED GAS The solubility of a gas in a liquid increases with increasing pressure, whereas increasing temperatures reduce solubility. Methane dissolved in water is quite common when oil and natural gas reservoirs are in contact with water-bearing pore space. Because the solubility of methane in underground water is much more influenced by pressure than by temperature, the concentration of methane in underground water increases greatly with depth (40). Because most hydrocarbon reservoirs tend to be in contact with water, it is plausible to expect methane in geopressured aquifers in almost all sedimentary basins. The in-place resource volume of geopressured gas has not been assessed in detail, but the global resource volume is expected, by analogy to other unconventional types of natural gas, to be gigantic-8900 Otoe (32). Although some aquifer gas is already produced from shallow aquifers, it is currently impossible to delineate the recoverable portion of this potentially enormous volume. The economics of the only case of methane production from a deep aquifer appear to be driven by the extraction of the by-product iodine. In fact, methane-bearing aquifers contain many valuable trace elements, and the eventual extraction of geopressured gas may well become the by-product from the quest for these trace elements. The regional resource data in Table 6 were derived by multiplying the global in-place estimate of 8900 Otoe by the regions' relative shares in the world's sedimentary area.
NATURAL GAS HYDRATES natural gas hydrates are crystallized ice-like mixtures of natural gas, chiefly methane, and water. In hydrates, the gas is contained within cavities formed by lattices of water molecules. Such hydrates are stable at temperatures and pressure conditions that exist (a) onshore and offshore in permafrost regions and (b) near or just beneath the sea floor, where water depths exceed 300-500 m (12, 41). The latter can be found almost everywhere in the world's oceans (41), probably with higher-than-average concentrations at the bases of continental slopes (32) . Because hydrates can penetrate and seal sediment pore space, they not only trap natural gas in their lattice structure but may also function as hydrate-cemented traps for free natural gas beneath.
The recovery of gas hydrates requires one or any combination of three measures to release the gas from the lattice trap: thermal stimulation, depressurization, or inhibitor injection. Appropriate techniques for the gas extraction from hydrates have not been developed, and it will be technically challenging to engineer methods so that the natural gas gains exceed the energy expenditures. In the foreseeable future, there will be little need for the development of gas hydrates. However, their in-place occurrence, estimated at more than 19,000
244 ROGNER
Gtoe (37, 38), is remarkable and should be acknowledged. Although these estimates have yet to be confirmed by drilling tests, if only 1 % of the estimated volume becomes techno-economically recoverable, this resource volume would be larger than current identified global natural gas reserves .
Although a geographical allocation of the gas hydrates is speculative at best, such estimates have been made (see Table 6). The world map of locations of known and inferred gas hydrates in marine sediments of outer continental margins and in continental permafrost (39) was used at face value-i.e. each location was assumed to host equal amounts of gas hydrates-and applied to the global occurrence estimate of MacDonald (37).
NATURAL GAS FROM FRACTURED SHALES Devonian shales have been a source of natural gas for more than 100 years (35). Devonian shales are organic-rich shales with 5% to 65% indigenous organic matter (36). Such geological formations are principal source beds for petroleum and natural gas. Natural gas production from shale depends on several preconditions. The source rock must contain a suitable type, amount, and thermal maturation of organic matter. Furthermore, the source rock must have a trapping mechanism as well as sufficient porosity and permeability. Resource estimates for organic-rich shales have been limited almost exclusively to the United States. Moreover, natural gas extraction from shales requires that all the above preconditions be met simultaneously. Although it is quite speculative, the ratio of the US estimates for natural gas from shale formations to the in-place shale volume was used as a guide to calculate the regional natural gas resource from fractured shale resource potentials. The resource data shown in Table 6 are based on the assumption that the shale oil occurrences outside the United States also contain the US gas value of 17 .7 TCF/Gt (tera-cubic feet per gigatonne) of shale in-place.
ULTRADEEP GAS Deep gas reservoirs, i.e. those at a depth between 4,600 m (15,000 ft) and 7,600 m (25,000 ft), are estimated to host some 25% of the total undiscovered natural gas resources of the United States (42). These resource volumes suggest that there are even larger gas occurrences in the ultradeep region (below 7,600 m or 25,000 ft) . Although the role of organic matter in producing large amounts of gas at such depths has yet to be determined, there is no doubt that in a dry-reservoir environment methane is stable at and can withstand the temperature and pressure conditions prevailing at a depth of 10,000-13,000 m. However, in the presence of fluids and minerals, the stability of methane is quite uncertain (43). In addition, theories of abiogenic methane sources have further sparked interest in deep gas resource estimates. While the deep-gas category is accounted for in the gas occurrence estimates for the tight-formation gas, geopressured aquifers, etc, no attempt has been made to

HYDROCARBON RESOURCES 245
assess ultradeep gas. The reservoir and geologic characteristics prerequisite to ultradeep gas-bearing rock are simply not understood.
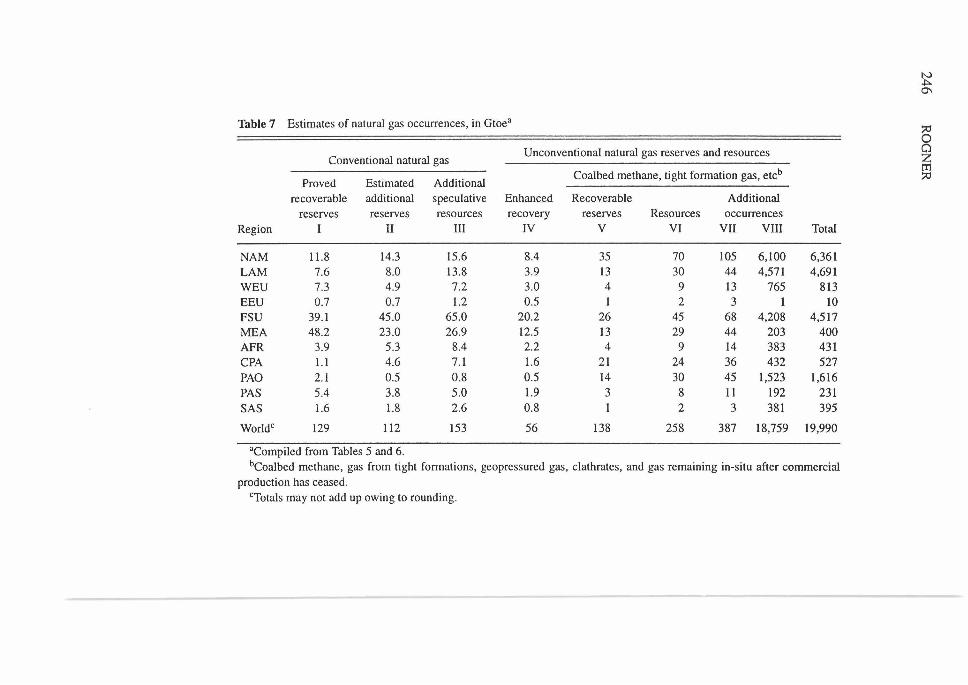
SUMMARY OF NATURAL GAS RESOURCES Table 7 summarizes assessments of the regional distribution of conventional and unconventional natural gas occurrences. As in the case of oil, Categories I-III correspond to the estimates of Masters et al for conventional reserves and resources (see Table 5). The rationale and procedure for the calculations of quantities in Categories IV-VIII are as described in the previous section. Again, the recoverable portion of these natural gas occurrences will be a function of the degree of future technological progress, the overall evolution of the energy system, and prevailing and anticipated energy market conditions.
Coal Estimates of proved recoverable reserves of coal have hovered just above the 1000 Gt mark ever since the first worldwide inventory of world coal resources was presented at the International Geological Congress held in Toronto in 1913. Fluctuations in reserves periodically reported by national bureaus appear to have offset each other without notably affecting the world total. National reserve revisions have colluded with energy market price trends: With lower prices, reserve estimates decline; with higher price expectations, they rise. Coal resources have generally been estimated to exceed reserves by one order of magnitude, i.e. their occurrences surpass 10,000 Gt (9, 44, 45).
Although there is no internationally accepted convention for the demarcation between different ranks of coal, many institutions group coal occurrences into two major classes, hard coal and brown coal. Hard coal usually consists of anthracite and bituminous coal; brown coal usually consists of lignite and subbituminous coal. The dividing line between these two macro-categories is determined by the coal's carbon, moisture, volatile material, and ash contents. Typically, the heating value of coal tends to increase with greater amounts of carbon and lesser amounts of moisture and ash per unit of coal mass. Heating value is often used to differentiate between hard and brown coal deposits. The heating value of hard coal is greater than 25 MJ/kg and can be as high as 36 MJ/kg; the heating value of brown coal is less than 25 MJ/kg and can be as low as 4-5 MJ/kg for lignite.
In order to put the energy relevance of coal reserve and resource quantities into perspective with those of oil and natural gas, the heating values of various carbonaceous deposits must be known. Because the chemical composition of coal varies widely even within a deposit, coal resource surveys often report only the physical quantities in place or the coal characteristics that are specific to one location and cannot be easily generalized. The Bundesanstalt fiir
IV +:>-0\
Table 7 Estimates of natural gas occurrences, in Gtoe• it:! 0
Unconventional natural gas reserves and resources Cl Conventional natural gas z
trl
Proved Estimated Additional Coalbed methane, tight formation gas, etch it:!
recoverable additional speculative Enhanced Recoverable Additional reserves reserves resources recovery reserves Resources occurrences
Region I II III IV v VI VII VIII Total
NAM 11.8 14.3 15.6 8.4 35 70 105 6,100 6,361 LAM 7.6 8.0 13 .8 3.9 13 30 44 4,571 4,691 WEU 7.3 4.9 7.2 3.0 4 9 13 765 813 EEU 0.7 0.7 1.2 0.5 1 2 3 1 10 FSU 39.1 45.0 65.0 20.2 26 45 68 4,208 4,517 MEA 48.2 23.0 26.9 12.5 13 29 44 203 400 AFR 3.9 5.3 8.4 2.2 4 9 14 383 431 CPA 1.1 4.6 7.1 1.6 21 24 36 432 527 PAO 2. l 0.5 0.8 0.5 14 30 45 1,523 1,616 PAS 5.4 3.8 5.0 l.9 3 8 ll 192 231 SAS 1.6 l.8 2.6 0.8 l 2 3 381 395
Worldc 129 112 153 56 138 258 387 18,759 19,990
•compiled from Tables 5 and 6. bCoalbed methane, gas from tight formations, geopressured gas, clathrates, and gas remaining in-situ after commercial
production has ceased. cTotals may not add up owing to rounding.
HYDROCARBON RESOURCES 247
Geowissenschaften und Rohstoffe (BGR) is one of the few institutions that publish their coal reserve and resource estimates in physical and energy units (22). 11 This assessment adopted the BGR coal reserve data, and the countryspecific average heating values were applied to the physical coal resource estimates of WEC (23). BGR reports two reserve categories-proved recoverable reserves and proved additional reserves-as well as one resource category-total coal resources. WEC's coal reserve and resource estimates are grouped as follows: proved amount in place, proved recoverable reserves, estimated additional amount in place, and estimated additional reserves recoverable. Depending on which reserve classification is applied, aggregate world coal reserves, i.e. proven recoverable and proved additional reserves, vary between 606 and 1003 Gtoe. Ultimately recoverable coal occurrences amount to 6200 Gtoe.
Viewed through the lens of conventional energy reserves, coal is clearly the world's most widely available fossil energy source. Given this large reserve base, it is not surprising that the coal industry generally focuses on short-term coal market prospects and very little on resource exploration. Moreover, coal deposits tend to extend continuously and laterally over extended distances, which reduces coal exploration requirements and increases the geological assurance of most coal deposits.
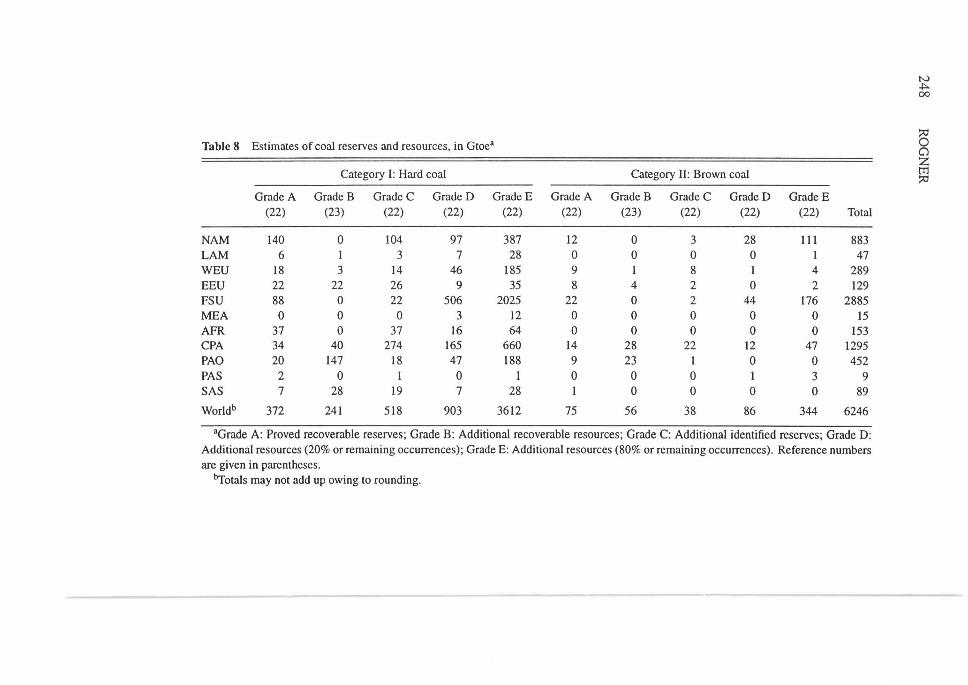
SUMMARY OF COAL RESOURCES Table 8 depicts the allocation of coal occurrences. Hard and brown coal resources are each distributed over five resource grades. Grade A corresponds to proven recoverable reserves, Grade B to additional recoverable reserves, and Grade C to additional identified reserves. The remaining occurrences or additional resources were divided 20:80 and allocated to Grades D and E.
Summary of Reserves, Resources, and Occurrences Table 9 summarizes this assessment of global hydrocarbon reserves, resources, and occurrences. Table 9 also contrasts the estimated quantities with their past cumulative consumption and present rates of utilization, respectively. Conventional hydrocarbon reserves are estimated to be in excess of 1600 Gtoe. This quantity is five times larger than the cumulative fossil-resource consumption since the beginning of the coal era in the mid-nineteenth century. Theoretically, present fossil reserves could fuel the world for another 160 years at the present level of global primary energy use of almost 10 Gtoe per year. 12 Coal accounts
11 The WEC Survey of Energy Resources no longer reports coal resources in units of tonnes of coal equivalent (45).
12The close to IO Gtoe of global primary energy use are made up of 7.4 Gtoe of fossil sources (see Table 9), 0.6 Gtoe of nuclear power, 0.2 Gtoe of hydro power, and l.4 Gtoe of renewables such as non-commercial biomass, etc.
N ~ 00
:::0 Table 8 Estimates of coal reserves and resources, in Gtoea 0 a z
Category I: Hard coal Category II: Brown coal tTl :::0
Grade A Grade B Grade C Grade D GradeE Grade A Grade B Grade C Grade D Grade E (22) (23) (22) (22) (22) (22) (23) (22) (22) (22) Total
NAM 140 0 104 97 387 12 0 3 28 111 883 LAM 6 l 3 7 28 0 0 0 0 l 47 WEU 18 3 14 46 185 9 I 8 l 4 289 EEU 22 22 26 9 35 8 4 2 0 2 129 FSU 88 0 22 506 2025 22 0 2 44 176 2885 MEA 0 0 0 3 12 0 0 0 0 0 15 AFR 37 0 37 16 64 0 0 0 0 0 153 CPA 34 40 274 165 660 14 28 22 12 47 1295 PAO 20 147 18 47 188 9 23 l 0 0 452 PAS 2 0 1 0 1 0 0 0 1 3 9 SAS 7 28 19 7 28 l 0 0 0 0 89
Worldb 372 241 518 903 3612 75 56 38 86 344 6246
aGrade A: Proved recoverable reserves ; Grade B: Additional recoverable resources ; Grade C: Additional identified reserves; Grade D: Additional resources (20% or remaining occurrences) ; Grade E: Additional resources (80% or remaining occurrences). Reference numbers are given in parentheses.
~otals may not add up owing to rounding.
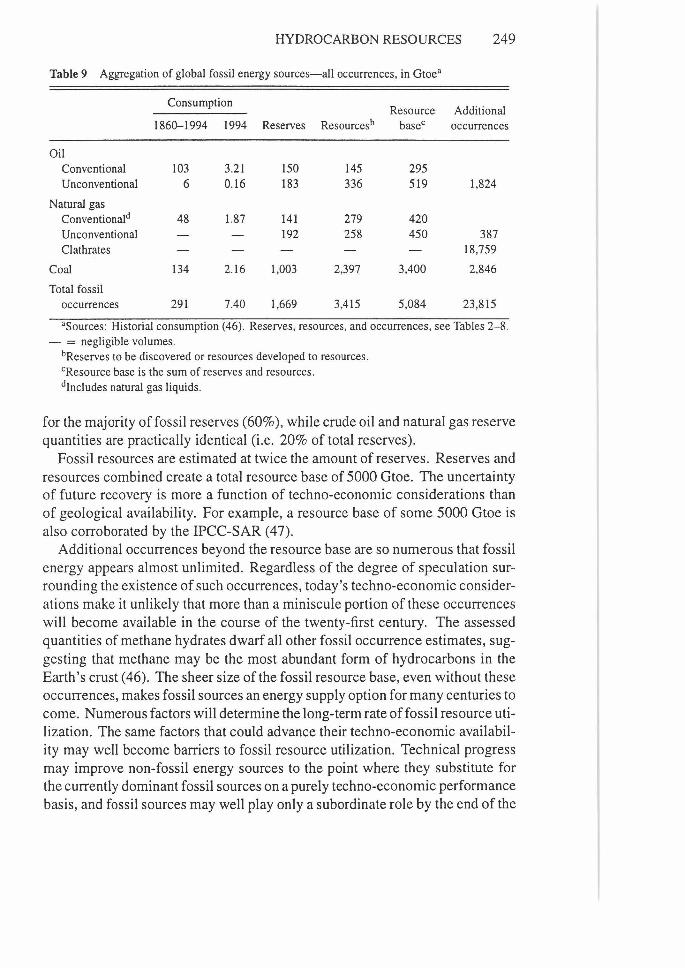
HYDROCARBON RESOURCES 249
Table 9 Aggregation of global fossil energy sources-all occurrences, in Gtoea
Consumption Resource Additional
1860-1994 1994 Reserves Resourcesh basec occurrences
Oil Conventional 103 3.21 150 145 295 Unconventional 6 0.16 183 336 519 1,824
Natural gas Conventionald 48 1.87 141 279 420 Unconventional 192 258 450 387 Clathrates 18,759
Coal 134 2.16 1,003 2,397 3,400 2,846
Total fossil occurrences 291 7.40 1,669 3,415 5,084 23,815
asources : Historial consumption (46) . Reserves, resources, and occurrences, see Tables 2-8. - = negligible volumes .
hReserves to be discovered or resources developed to resources. cResource base is the sum of reserves and resources . dlncludes natural gas liquids .
for the majority of fossil reserves (60% ), while crude oil and natural gas reserve quantities are practically identical (i.e. 20% of total reserves).
Fossil resources are estimated at twice the amount of reserves. Reserves and resources combined create a total resource base of 5000 Gtoe. The uncertainty of future recovery is more a function of techno-economic considerations than of geological availability. For example, a resource base of some 5000 Gtoe is also corroborated by the IPCC-SAR (47).
Additional occurrences beyond the resource base are so numerous that fossil energy appears almost unlimited. Regardless of the degree of speculation surrounding the existence of such occurrences, today's techno-economic considerations make it unlikely that more than a miniscule portion of these occurrences will become available in the course of the twenty-first century. The assessed quantities of methane hydrates dwarf all other fossil occurrence estimates, suggesting that methane may be the most abundant form of hydrocarbons in the Earth's crust (46). The sheer size of the fossil resource base, even without these occurrences, makes fossil sources an energy supply option for many centuries to come. Numerous factors will determine the long-term rate of fossil resource utilization. The same factors that could advance their techno-economic availability may well become barriers to fossil resource utilization. Technical progress may improve non-fossil energy sources to the point where they substitute for the currently dominant fossil sources on a purely techno-economic performance basis, and fossil sources may well play only a subordinate role by the end of the
250 ROGNER
twenty-first century. In addition, the question of whether continued large-scale use of fossil energy is compatible with the environment at large will need to be resolved.
MODELING ENERGY SOURCES
The quantitative assessment of regional energy resource availability is an essential prerequisite for the development of future regional energy demand and supply scenarios. However, in an analysis that covers more than half a century the application of reserve and resource volumes based on the static concept of present technology and cost regimes is insufficient. Given the current oil and gas reserve-to-production ratios of 43 and 65 years, respectively, the prospects of a growing world population, and the aspiration of the developing world to substantially improve their standard of living, it is obvious that these reserves will be depleted long before the end of the study horizon.
The nature of this study calls for a dynamic resource concept, i.e. a concept that accounts for factors that affect existing and future conditions bearing on the reclassification of resources as reserves . In essence, this reclassification is the rate of mobilization ofresources ( 48) based on both anticipated technology advances and undetermined technical breakthroughs. The latter definitely play a major role in the commercialization of unconventional resources (49, 50).
Given the relative long-run constancy of the reserve-to-production ratio, reserves can be viewed as stocks continuously replenished from resources. The question, then, is what fraction of the reserve replenishment is price induced (i .e. the result of higher market prices) and what fraction is technology induced (i.e. the result of technological progress). The latter is of particular interest because of its long-term energy price-capping effect, which is similar to that of a backstop technology.
Explicit assumptions about the rates of technology change and of advancements in knowledge must also be included in the analysis. Including them means that the construction of curves of resource-to-reserve mobilization must be a function of time, the proxy applied here for technology change. The final result is a two-dimensional representation of resource availability versus production costs . In this analysis, a productivity gain in the upstream sector of 1 % per year is assumed. This increase is close to the average of historically observed rates 13 Assuming that history is a guide for the future, a resource
13 In the short run , historically observed productivity gains have been much higher than I% per year (49, 51-54). Periods of two-digit growth rates are often followed by periods of zero or negative increases . Because data are consistently poor and have limited availability, estimating productivity gains over extended periods of time is a risky undertaking. Hence, there could be a wide margin for error around this productivity estimate. The projection of a long-term I% per year growth rate may well prove too conservative (or too optimistic).
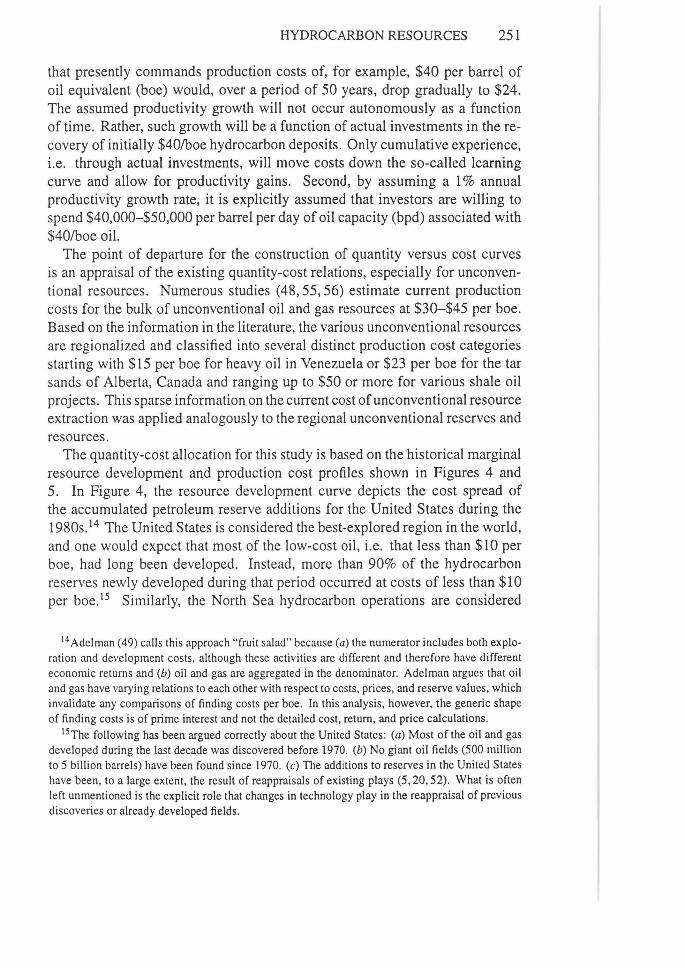
HYDROCARBON RESOURCES 251
that presently commands production costs of, for example, $40 per barrel of oil equivalent (boe) would, over a period of 50 years, drop gradually to $24. The assumed productivity growth will not occur autonomously as a function of time. Rather, such growth will be a function of actual investments in the recovery of initially $40/boe hydrocarbon deposits. Only cumulative experience, i.e. through actual investments, will move costs down the so-called learning curve and allow for productivity gains. Second, by assuming a 1 % annual productivity growth rate, it is explicitly assumed that investors are willing to spend $40,000-$50,000 per barrel per day of oil capacity (bpd) associated with $40/boe oil.
The point of departure for the construction of quantity versus cost curves is an appraisal of the existing quantity-cost relations, especially for unconventional resources. Numerous studies (48, 55, 56) estimate current production costs for the bulk of unconventional oil and gas resources at $30-$45 per boe. Based on the information in the literature, the various unconventional resources are regionalized and classified into several distinct production cost categories starting with $15 per boe for heavy oil in Venezuela or $23 per boe for the tar sands of Alberta, Canada and ranging up to $50 or more for various shale oil projects . This sparse information on the current cost of unconventional resource extraction was applied analogously to the regional unconventional reserves and resources.
The quantity-cost allocation for this study is based on the historical marginal resource development and production cost profiles shown in Figures 4 and 5. In Figure 4, the resource development curve depicts the cost spread of the accumulated petroleum reserve additions for the United States during the 1980s.14 The United States is considered the best-explored region in the world, and one would expect that most of the low-cost oil, i.e. that less than $10 per boe, had long been developed. Instead, more than 90% of the hydrocarbon reserves newly developed during that period occurred at costs of less than $10 per boe. 15 Similarly, the North Sea hydrocarbon operations are considered
14 Adelman (49) calls this approach "fruit salad" because (a) the numerator includes both exploration and development costs, although these activities are different and therefore have different economic returns and (b) oil and gas are aggregated in the denominator. Adelman argues that oil and gas have varying relations to each other with respect to costs, prices, and reserve values, which invalidate any comparisons of finding costs per boe. In this analysis, however, the generic shape of finding costs is of prime interest and not the detailed cost, return, and price calculations.
15The following has been argued correctly about the United States: (a) Most of the oil and gas developed during the last decade was discovered before 1970. (b) No giant oil fields (500 million to 5 billion barrels) have been found since 1970. (c) The additions to reserves in the United States have been, to a large extent, the result of reappraisals of existing plays (5, 20, 52). What is often left unmentioned is the explicit role that changes in technology play in the reappraisal of previous discoveries or already developed fields.
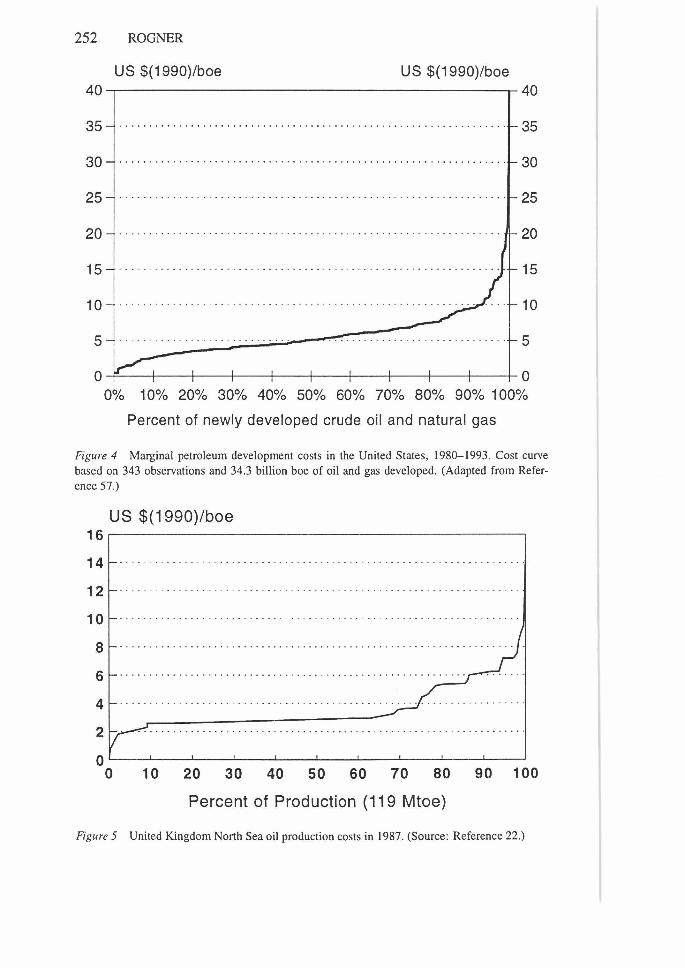
252 ROGNER
US $(1990)/boe US $(1990)/boe
35 . . . . .. . . .. . .. . ..... .. . ... .. . . . .. ... . .. ... . .. .. ... . . . ... . .... .... . 35
30 . . ..... .. .. . . . . · · ·· · · ···· · ·· . . .. . ... . .. . . . . ... .. . . .. . . . . .. ... . .. . 30
25 .. . .. . · · ···· ·· · .. . . . ..... . . . .. .. . . . ... . . . .. . .... . .. . .. . . . .. .. .... 25
20 . ... .. . .. .. . .. . . . . . . .. . ... .. .......... .. . . . . . . . .. .. .. . . . . ······. 20
15 . . . . . . . . . . . . . . . . . . . . . . . . . . . . . . . . . . . . . . . . . . . . . . . . . . . . . . . . . . . . . . . . 15
10 10
5 · · · · ··· -~- - ~· · · :...:..;.· ··~·-·:;..;...·· ;..;..;.· ··~·· ·--·· __ .,-. .. . ".'"'."".' . . . "'."'."". .. . ~ .. . ~ . .... .... .... .. .. . . 5
0 0 0% 10% 20% 30% 40% 50% 60% 70% 80% 90% 100%
Percent of newly developed crude oil and natural gas
Figure 4 Marginal petroleum development costs in the United States, 1980-1993. Cost curve based on 343 observations and 34.3 billion boe of oil and gas developed. (Adapted from Reference 57.)
US $(1990)/boe 1s.--~~~~~~~~~~~~~~~~~~~~~~---,
14 . . . . . . . .......... ... . .. . .. .. . . .. .... .... . .. . ... . . . . . . . .. ....... . . . . . .
12
10
8
6
4
2 ...... .... .. .. . . . ... . . .. . . . ........... . . . . . ... . .. .. ... . .. . . . . . ... . .
O<--~--'-~---'-~~-'-~-'-~~'--~--'-~---L~~-'-~---'-~--'
0 10 20 30 40 50 60 70 80 90 100
Percent of Production (119 Mtoe)
Figure 5 United Kingdom North Sea oil production costs in 1987. (Source: Reference 22.)
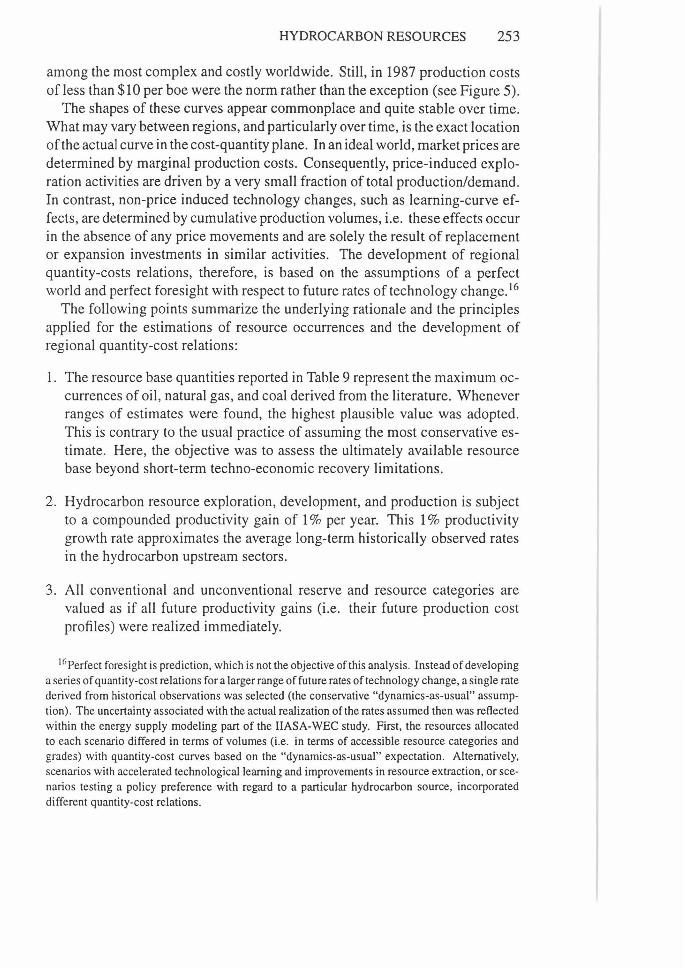
HYDROCARBON RESOURCES 253
among the most complex and costly worldwide. Still, in 1987 production costs of less than $10 per boe were the norm rather than the exception (see Figure 5).
The shapes of these curves appear commonplace and quite stable over time. What may vary between regions, and particularly over time, is the exact location of the actual curve in the cost-quantity plane. In an ideal world, market prices are determined by marginal production costs. Consequently, price-induced exploration activities are driven by a very small fraction of total production/demand. In contrast, non-price induced technology changes, such as learning-curve effects, are determined by cumulative production volumes, i.e. these effects occur in the absence of any price movements and are solely the result of replacement or expansion investments in similar activities. The development of regional quantity-costs relations, therefore, is based on the assumptions of a perfect world and perfect foresight with respect to future rates of technology change. 16
The following points summarize the underlying rationale and the principles applied for the estimations of resource occurrences and the development of regional quantity-cost relations:
1. The resource base quantities reported in Table 9 represent the maximum occurrences of oil, natural gas, and coal derived from the literature. Whenever ranges of estimates were found, the highest plausible value was adopted. This is contrary to the usual practice of assuming the most conservative estimate. Here, the objective was to assess the ultimately available resource base beyond short-term techno-economic recovery limitations.
2. Hydrocarbon resource exploration, development, and production is subject to a compounded productivity gain of 1 % per year. This 1 % productivity growth rate approximates the average long-term historically observed rates in the hydrocarbon upstream sectors.
3. All conventional and unconventional reserve and resource categories are valued as if all future productivity gains (i.e. their future production cost profiles) were realized immediately.
16 Perfect foresight is prediction, which is not the objective of this analysis . Instead of developing a series of quantity-cost relations for a larger range of future rates of technology change, a single rate derived from historical observations was selected (the conservative "dynamics-as-usual" assumption). The uncertainty associated with the actual realization of the rates assumed then was reflected within the energy supply modeling part of the IIASA-WEC study. First, the resources allocated to each scenario differed in terms of volumes (i.e. in terms of accessible resource categories and grades) with quantity-cost curves based on the "dynamics-as-usual" expectation. Alternatively, scenarios with accelerated technological learning and improvements in resource extraction, or scenarios testing a policy preference with regard to a particular hydrocarbon source, incorporated different quantity-cost relations.

254 ROGNER
Table 10 Estimates of fossil resource extraction economics for the IIASA-WEC study•
Resource category II III IV v VI VII VIII
Oil <12 12-19 19-25 25-35 35-38 38-52 52-62 62-160 Gas <10 10-16 16-25 25-29 29-34 34-42 42-50 50-145
Grade A B c D E
Coal0 1-9 9-11 11-16 16-24 24-36
"Production cost ranges in US$ (1990) per barrel of oil equivalent (boe). The resource categories I-VIII for crude oil and natural gas correspond to the categories shown in Tables 4 and 7. Likewise, the coal grades A through E correspond to those of Table 8. Adapted from (5, 22, 44, 48, 52, 56, 58-60).
hHard and brown coal.
4. From the quantity-cost relations calculated in this way, a single aggregate resource cost curve per source and region is developed. This means that the dimension of time is taken out of the resource quantity-cost representations . Table 10 and Figure 6 summarize the various quantity-cost relationships for oil, natural gas, and coal.
5. This approach valuates all of the presently identified conventional oil reserves at production costs of less than $12 per boe. Obviously, not all the identified reserves are presently available at that cost. This quantity-cost relation is an artifact and results from dropping the time dimension from the analysis . The data in Table 10 and Figure 6 must be interpreted as integrals of the impact of technical change on resource economics. In other words, for each resource category a quantity-cost relation is assumed whose shape resembles the curve introduced in Figure 4. Hence, there will be low-cost production from unconventional occurrences of the higher resource categories as well as high-cost production of lower resource categories. The cost ranges per resource category shown in Table 10 are calibrated so that the aggregates over all categories of all similar cost volumes correspond to the resource volumes of specific categories.
6. The dimension of time is reintroduced in the actual modeling of resource extraction. Here a quantity-cost profile similar to the one shown in Figure 4 is imposed on annual production volumes. This guarantees that not all production occurs in the lowest categories and that truly marginal cost signals are provided to the downstream sections of the energy system.
7. The resource quantities for coal as applied in this study are summarized in Table 8. Coal reserves are modeled in less detail than oil and natural
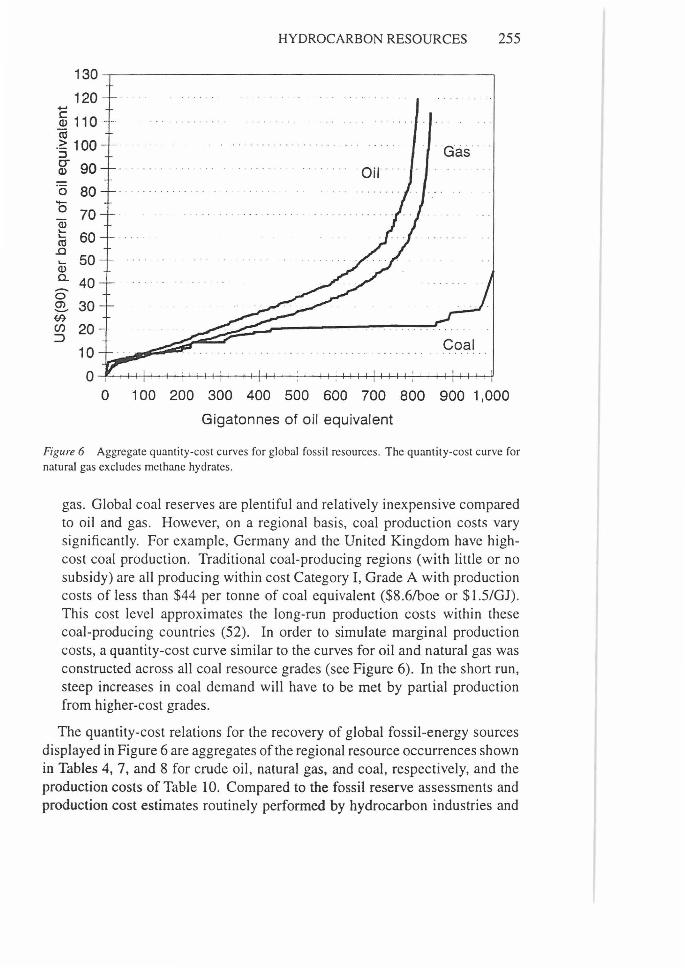
130
120 ..... c Q) 110 - --ca -~ 100 :J O'" 90 Q)
0 80 ,.._ 0 70 «> ....
60 .... «l
..0 .... 50 Q) 0..
0 40
~ 30 (J'r CJ) 20-=>
10
0 0
HYDROCARBON RESOURCES 255
-Gas--0;1 -
100 200 300 400 500 600 700 800 900 1,000
Gigatonnes of oil equivalent
Figure 6 Aggregate quantity-cost curves for global fossil resources. The quantity-cost curve for natural gas excludes methane hydrates.
gas. Global coal reserves are plentiful and relatively inexpensive compared to oil and gas. However, on a regional basis, coal production costs vary significantly. For example, Germany and the United Kingdom have highcost coal production. Traditional coal-producing regions (with little or no subsidy) are all producing within cost Category I, Grade A with production costs of less than $44 per tonne of coal equivalent ($8.6/boe or $1 .5/GJ). This cost level approximates the long-run production costs within these coal-producing countries (52). In order to simulate marginal production costs, a quantity-cost curve similar to the curves for oil and natural gas was constructed across all coal resource grades (see Figure 6). In the short run, steep increases in coal demand will have to be met by partial production from higher-cost grades.
The quantity-cost relations for the recovery of global fossil-energy sources displayed in Figure 6 are aggregates of the regional resource occurrences shown in Tables 4, 7, and 8 for crude oil, natural gas, and coal, respectively, and the production costs of Table 10. Compared to the fossil reserve assessments and production cost estimates routinely performed by hydrocarbon industries and
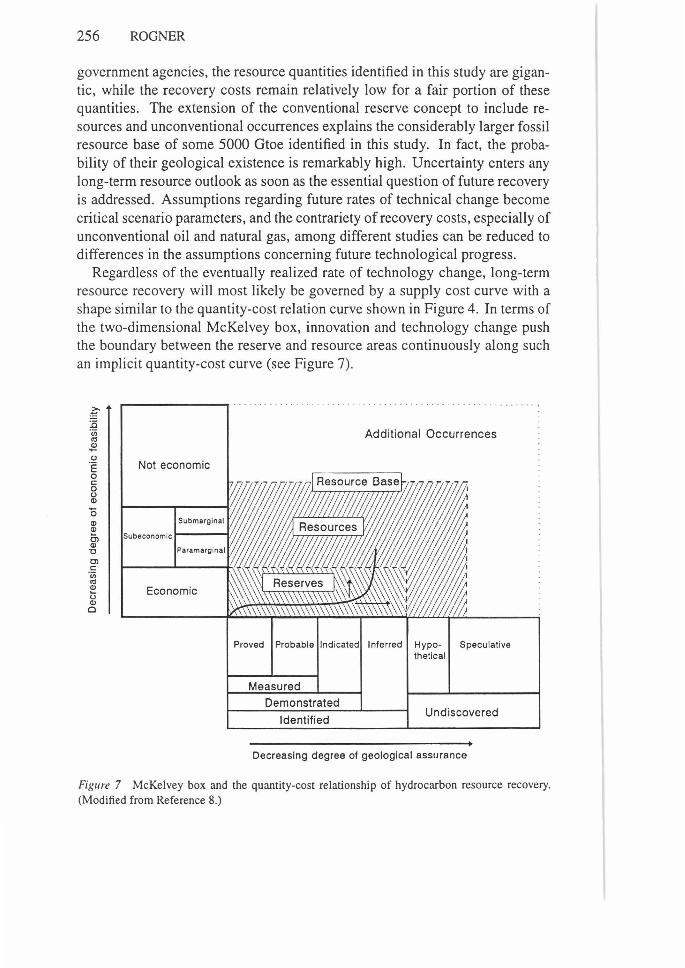
256 ROGNER
government agencies, the resource quantities identified in this study are gigantic, while the recovery costs remain relatively low for a fair portion of these quantities. The extension of the conventional reserve concept to include resources and unconventional occurrences explains the considerably larger fossil resource base of some 5000 Gtoe identified in this study. In fact, the probability of their geological existence is remarkably high. Uncertainty enters any long-term resource outlook as soon as the essential question of future recovery is addressed. Assumptions regarding future rates of technical change become critical scenario parameters, and the contrariety of recovery costs, especially of unconventional oil and natural gas, among different studies can be reduced to differences in the assumptions concerning future technological progress.
Regardless of the eventually realized rate of technology change, long-term resource recovery will most likely be governed by a supply cost curve with a shape similar to the quantity-cost relation curve shown in Figure 4. In terms of the two-dimensional McKelvey box, innovation and technology change push the boundary between the reserve and resource areas continuously along such an implicit quantity-cost curve (see Figure 7).
~ :0 ·~ Additional Occurrences ~ 0 ·E Not economic 0 c: 0 0 Q)
en Submarginal Q)
O, Subeconomic Q)
1J Cl c: ·u;
"' Q)
t; Q)
Cl
Economic
Proved Probable Indicated Inferred Hypo- Speculative !helical
Measured Demonstrated
Identified Undiscovered
Decreasing degree of geological assurance
Figure 7 McKelvey box and the quantity-cost relationship of hydrocarbon resource recovery. (Modified from Reference 8.)
HYDROCARBON RESOURCES 257
The regional quantity-cost relations for crude oil, natural gas, hard coal, and brown coal developed in the previous sections are both descriptive and normative. They are descriptive in that the underlying average productivity growth rates are historically observed estimates. They are normative in that the recovery technologies will require drastic specific technology improvements with implicit improvement rates several times the historically observed average. Because normative elements shape the quantity-cost relations, a range of technology improvement rates rather than quasi-deterministic point estimates should have been applied. As a result, one would obtain a series of cost curves per fossil source and region reflecting alternative images of how the future might unfold. In the joint IIASA-WEC study, a different approach was used in which alternative scenarios encompassed different resource categories. For example, the allocation of additional oil resource categories thus mirrors accelerated rates of innovation in the oil upstream sector and in the chemistry of converting unconventional oil to synliquids. In contrast, limiting oil to Categories I-III (see Table 4) assumes low rates of technical change in the oil sector, which then shifts the focus of technology change to other energy sources, such as coal, nuclear, or renewables.
CONCLUDING REMARKS
The global fossil resource base is abundant and is estimated at approximately 5000 Gtoe. Compared to current global primary energy use of some 10 Gtoe per year, this amount is certainly sufficient to fuel the world economy through the twenty-first century, even in the case of drastic growth in global energy demand. However, the geological existence of hydrocarbon occurrences alone does not guarantee energy supply stability or supply security. First of all, supply uncertainties concern the costs of resource recovery and conversion to usable fuels. The recovery of more-difficult-to-access conventional and, especially, unconventional hydrocarbon occurrences requires additional technology development. Additionally, production cost reductions will not materialize in the absence of investments. Their magnitude and timing may affect the timing of future access to hydrocarbon resources. The scale of upfront investment requirements is expected to increase while the economic risk associated with upstream hydrocarbon projects will likely be higher than for alternative non-energy investment opportunities (61). Therefore, the quest for short-term profits may well be a road block to long-term resource development. Secondly, short-term hydrocarbon development and production decisions often lie with public sector agencies and therefore are not necessarily driven by market considerations alone. The objectives of energy producers may also differ from those of the energy users, especially when large-scale energy trade subject to
258 ROGNER
international political intrusion is involved. Temporary energy supply shortages and volatile market price fluctuations will continue to mark Jong-term energy system development. In short, it is unlikely that future energy system development will be any Jess volatile than in the past.
Possibly the largest source of energy supply uncertainty is the environment. Emissions from the combustion and conversion of fossil fuels are substantially increasing the atmospheric concentrations of greenhouse gases. Higher GHG concentrations will enhance the natural greenhouse effect, raise the Earth's average surface temperature and cause global climate change. Hence, environmental considerations may constrain fossil fuel use to below present-day rates long before global resource scarcity becomes the limiting factor. On the other hand, the perception that resource scarcity will eventually resolve environmental problems may be seriously flawed.
If technological progress continues to better upstream productivity as observed in the past, resource constraints are unlikely to drive down hydrocarbon production during the twenty-first century. While oil production from present recoverable oil reserves is expected to peak during the early decades of the next century, this will eventually spur the development of alternatives . Investments in exploration and development will continue to replenish depleted reserves. The gradual technical progress associated with every replacement investment will also cause a transformation of presently uncertain conventional oil or marginal unconventional oil into the conventional oil of the future. Secondly, in the absence of environmental constraints, the closest long-run alternative to conventional oil is unconventional oil. One comparative advantage over other fossil or non-fossil alternatives is the latter's downstream compatability with existing oil-based fuel distribution and end-use infrastructures . The oil era, therefore, may well last beyond the time frame suggested by ultimately recoverable conventional crude oil reserves.
Current oil market prices are too low to stimulate investment in energy technologies with large upfront capital requirements and long-term payback prospects. With global demand for oil rising and production approaching full capacity upward, pressure on oil prices can be expected in the longer run. World oil prices may well encounter at times volatile fluctuations around an otherwise Jong-term trend of alternating periods of gradually rising production costs and stability. Assuming no geopolitical interference, an upward pressure on oil prices or temporary oil price volatility result from time lags between the market signals (futures prices, spot prices) of production approaching capacity and the point in time when new investments become production effective. Pressure and volatility are not caused by resource scarcity.
In addition to unconventional oil, there are vast amounts of natural gas and coal waiting to be recovered from the Earth's crust. Using the quantity-cost
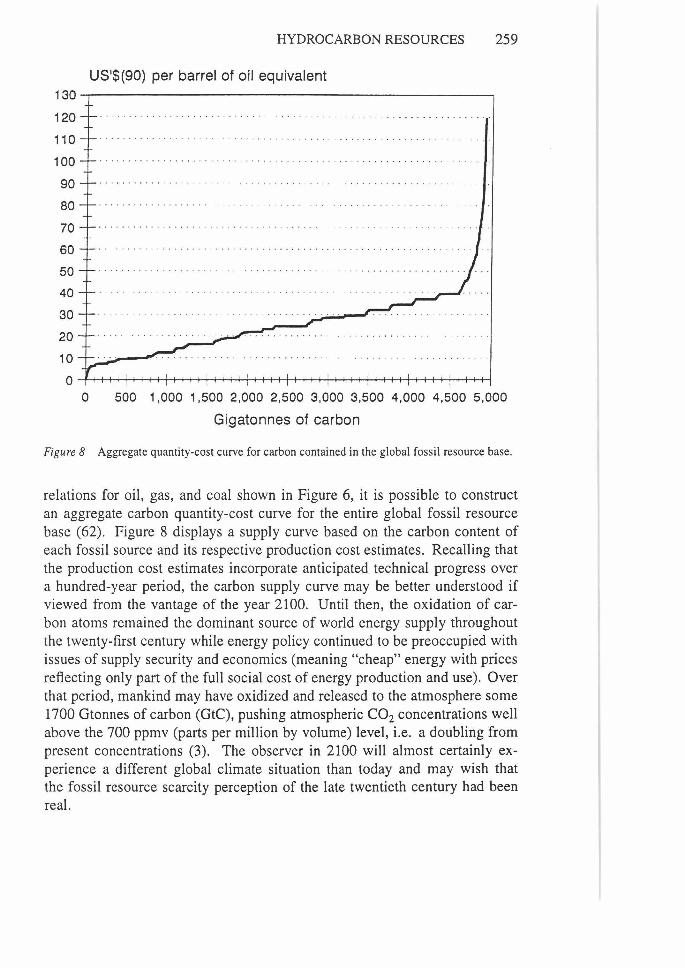
130
120
110
100
90
80
70
60
50
40
30
20
10
0 0
HYDROCARBON RESOURCES 259
US'$(90) per barrel of oil equivalent
500 1,000 1,500 2,000 2,500 3,000 3,500 4,000 4,500 5,000
Gigatonnes of carbon
Figure 8 Aggregate quantity-cost curve for carbon contained in the global fossil resource base.
relations for oil, gas, and coal shown in Figure 6, it is possible to construct an aggregate carbon quantity-cost curve for the entire global fossil resource base (62) . Figure 8 displays a supply curve based on the carbon content of each fossil source and its respective production cost estimates. Recalling that the production cost estimates incorporate anticipated technical progress over a hundred-year period, the carbon supply curve may be better understood if viewed from the vantage of the year 2100. Until then, the oxidation of carbon atoms remained the dominant source of world energy supply throughout the twenty-first century while energy policy continued to be preoccupied with issues of supply security and economics (meaning "cheap" energy with prices reflecting only part of the full social cost of energy production and use). Over that period, mankind may have oxidized and released to the atmosphere some 1700 Gtonnes of carbon (GtC), pushing atmospheric C02 concentrations well above the 700 ppmv (parts per million by volume) level, i.e. a doubling from present concentrations (3). The observer in 2100 will almost certainly experience a different global climate situation than today and may wish that the fossil resource scarcity perception of the late twentieth century had been real.
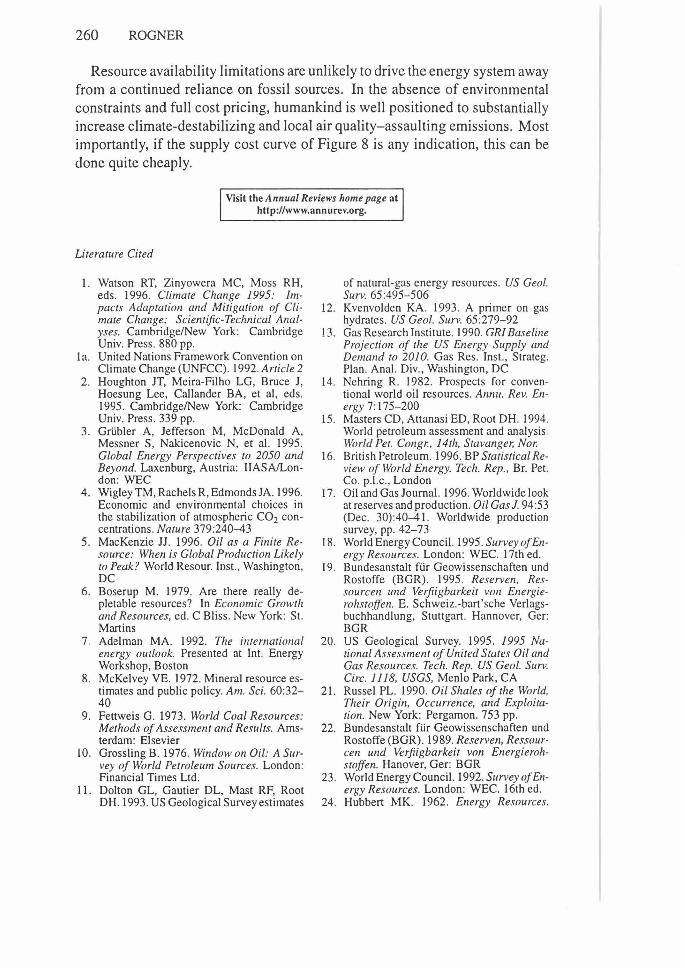
260 ROGNER
Resource availability limitations are unlikely to drive the energy system away from a continued reliance on fossil sources. In the absence of environmental constraints and full cost pricing, humankind is well positioned to substantially increase climate-destabilizing and local air quality-assaulting emissions. Most importantly, if the supply cost curve of Figure 8 is any indication, this can be done quite cheaply.
Visit the Annual Reviews home page at http://www.annurev.org.
Literature Cited
1. Watson RT, Zinyowera MC, Moss RH, eds. 1996. Climate Change 1995: impacts Adaptation and Mitigation r1f Climate Change: Scientific-Technical Analyses. Cambridge/New York: Cambridge Univ. Press. 880 pp.
la. United Nations Framework Convention on Climate Change (UNFCC). 1992. Article 2
2. Houghton JT, Meira-Filho LG, Bruce J, Hoesung Lee, Callander BA, et al, eds . 1995. Cambridge/New York: Cambridge Univ. Press. 339 pp.
3. Griibler A, Jefferson M, McDonald A, Messner S, Nakicenovic N, et al. 1995. Global Energy Perspectives to 2050 and Beyond. Laxenburg, Austria: IIASA/London: WEC
4. Wigley TM, Rachels R, Edmonds JA. 1996. Economic and environmental choices in the stabilization of atmospheric C02 concentrations. Nature 379:240-43
5. MacKenzie JJ. 1996. Oil as a Finite Resource: When is Global Production Likely to Peak? World Resour. Inst., Washington, DC
6. Boserup M. 1979. Are there really depletable resources? In Economic Growth and Resources, ed. C Bliss . New York: St. Martins
7. Adelman MA. 1992. The international energy outlook. Presented at Int. Energy Workshop, Boston
8. McKelvey VE. 1972. Mineral resource estimates and public policy. Am. Sci. 60:32-40
9. Fettweis G. 1973. World Coal Resources: Methods of Assessment and Results. Amsterdam: Elsevier
10. Grossling B. 1976. Window on Oil: A Survey of World Petroleum Sources. London: Financial Times Ltd .
11. Dolton GL, Gautier DL, Mast RF, Root DH. 1993. US Geological Survey estimates
of natural-gas energy resources. US Geo/. Surv. 65 :495-506
12. Kvenvolden KA. 1993. A primer on gas hydrates. US Geo/. Surv. 65 :279-92
13. Gas Research Institute. 1990. GR! Baseline Projection ()f the US Energy Supply and Demand to 2010. Gas Res. Inst., Strateg. Plan. Anal. Div., Washington, DC
14. Nehring R. 1982. Prospects for conventional world oil resources . Annu. Rev. Energy 7: 175-200
15. Masters CD, Attanasi ED, Root DH. 1994. World petroleum assessment and analysis. World Pet. Congr., 14th, Stavanger, Nor.
16. British Petroleum. 1996. BP Statistical Review of World Energy. Tech. Rep., Br. Pet. Co. p.l.c., London
17. Oil and Gas Journal. 1996. Worldwide look at reserves and production. Oil Gas J. 94:53 (Dec. 30):40-41. Worldwide production survey, pp. 42-73
18. World Energy Council. 1995. Survey of Energy Resources. London: WEC. 17th ed.
19. B undesanstalt fi.ir Geowissenschaften und Rostoffe (BGR). 1995. Reserven, Ressourcen und Verjiigbarkeit von Energierohstr1tfen. E. Schweiz.-bart'sche Verlagsbuchhandlung, Stuttgart. Hannover, Ger: BGR
20. US Geological Survey. 1995. 1995 National Assessment of United States Oil and Gas Resources. Tech. Rep. US Geo/. Surv. Circ. 1118, USGS, Menlo Park, CA
21 . Russel PL. 1990. Oil Shales of the World, Their Origin, Occurrence, and Exploitation. New York: Pergamon. 753 pp.
22. Bundesanstalt fi.ir Geowissenschaften und Rostoffe (BGR). 1989. Reserven, Ressourcen und Verjiigbarkeit von Energierohstoffen. Hanover, Ger: BGR
23. World Energy Council. 1992. Survey r~f'Energy Resources. London: WEC. 16th ed.
24. Hubbert MK. 1962. Energy Resources.
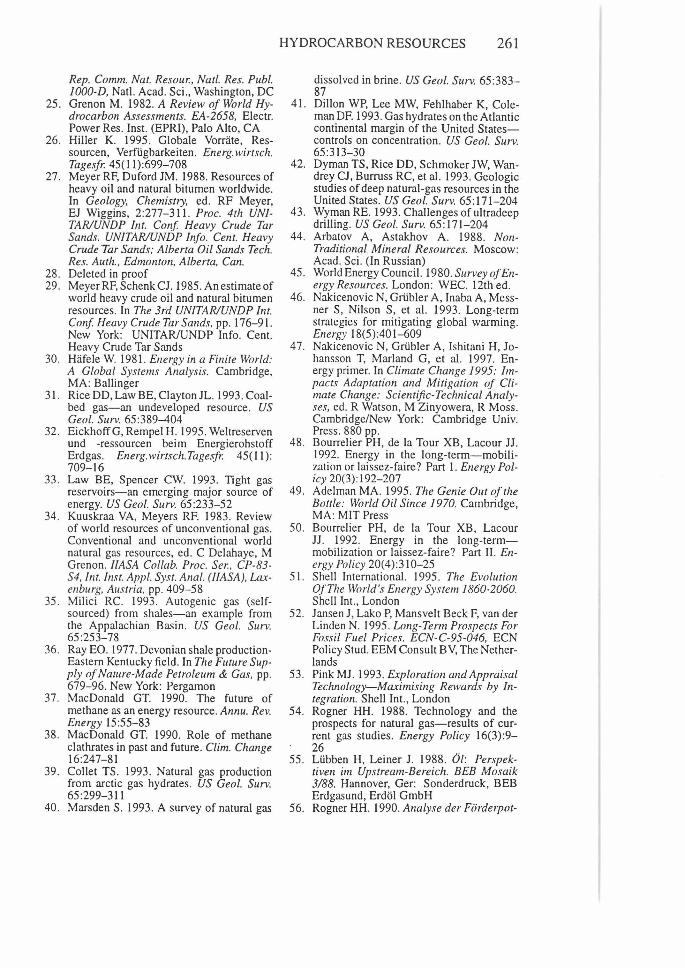
Rep. Comm. Nat. Resour. , Natl. Res. Pub/. 1000-D, Natl. Acad. Sci., Washington, DC
25 . Grenon M. 1982. A Review of World Hydrocarbon Assessments. EA-2658, Electr. Power Res. Inst. (EPRI), Palo Alto, CA
26. Hiller K. 1995. Globale Vorrate, Ressourcen, VerfUgbarkeiten. Energ. wimch. Tage.~fr. 45(11):699-708
27. Meyer RF, Duford JM. 1988. Resources of heavy oil and natural bitumen worldwide. In Geology, Chemistry, ed. RF Meyer, EJ Wiggins, 2:277-311. Proc. 4th UNlTARJUNDP Int. Conf Heavy Crude Tar Sands. UNITARJUNDP Info. Cent. Heavy Crude Tar Sands; Alberta Oil Sands Tech. Res. Auth., Edmonton, Alberta, Can.
28. Deleted in proof 29. Meyer RF, Schenk CJ. 1985. An estimate of
world heavy crude oil and natural bitumen resources . In The 3rd UNITARJUNDP Int. Con.f Heavy Crude Tar Sands, pp. 176-91 . New York: UNITAR/UNDP Info. Cent. Heavy Crude Tar Sands
30. Hafele W. 1981. Energy in a Finite World: A Global Systems Analysis. Cambridge, MA : Ballinger
31 . Rice DD, Law BE, Clayton JL. 1993. Coalbed gas-an undeveloped resource. US Geo/. Surv. 65 :389--404
32. EickhoffG, Rempel H. 1995. Weltreserven und -ressourcen beim Energierohstoff Erdgas. En erg. wirtsch. Tage.ifr. 45( 11 ): 709-16
33 . Law BE, Spencer CW. 1993. Tight gas reservoirs-an emerging major source of energy. US Geo/. Surv. 65:233-52
34. Kuuskraa VA, Meyers RF. 1983. Review of world resources of unconventional gas. Conventional and unconventional world natural gas resources, ed. C Delahaye, M Grenon. llASA Col/ab. Proc. Ser., CP-83-S4, Int. Inst. Appl. Syst. Anal. (llASA), laxenburg, Austria, pp. 409-58
35. Milici RC. 1993. Autogenic gas (selfsourced) from shales-an example from the Appalachian Basin. US Geo/. Surv. 65 :253-78
36. Ray EO. 1977. Devonian shale productionEastem Kentucky field . In The Future Supply of Nature-Made Petroleum & Gas, pp. 679-96. New York: Pergamon
37. MacDonald GT. 1990. The future of methane as an energy resource. Annu. Rev. Energy 15:55-83
38 . MacDonald GT. 1990. Role of methane clathrates in past and future. Clim. Change 16:247-81
39. Collet TS . 1993. Natural gas production from arctic gas hydrates. US Geo!. Surv. 65 :299-311
40. Marsden S. 1993. A survey of natural gas
HYDROCARBON RESOURCES 261
dissolved in brine. US Geol. Surv. 65 :383-87
41 . Dillon WP, Lee MW, Fehlhaber K, Coleman DF. 1993. Gas hydrates on the Atlantic continental margin of the United Statescontrols on concentration. US Geo/. Surv. 65:313-30
42. Dyman TS, Rice DD, Schmoker JW, Wandrey CJ, Burruss RC, et al. 1993. Geologic studies of deep natural-gas resources in the United States. US Geo/. Surv. 65: 171-204
43 . Wyman RE. 1993. Challenges ofultradeep drilling. US Geo/. Surv. 65 :171-204
44. Arbatov A, Astakhov A. 1988. NonTraditional Mineral Resources. Moscow: Acad. Sci. (In Russian)
45 . World Energy Council. 1980. Survey <!{Energy Resources. London: WEC. 12th ed .
46. Nakicenovic N, Gri.ibler A, Inaba A, Messner S, Nilson S, et al. 1993. Long-term strategies for mitigating global warming. Energy 18(5):401-609
47. Nakicenovic N, Gri.ibler A, Ishitani H, Johansson T, Marland G, et al. 1997. Energy primer. In Climate Change 1995: Impacts Adaptation and Mitigation of Climate Change: Scientific-Technical Analyses, ed. R Watson, M Zinyowera, R Moss . Cambridge/New York : Cambridge Univ. Press . 880 pp.
48 . Bourrelier PH, de la Tour XB, Lacour JJ. 1992. Energy in the long-term-mobilization or laissez-faire? Part I. Energy Policy 20(3): 192-207
49. Adelman MA. 1995. The Genie Out of the Bottle: World Oil Since 1970. Cambridge, MA : MIT Press
50. Bourrelier PH, de la Tour XB, Lacour JJ . 1992. Energy in the long-termmobilization or laissez-faire? Part II. Energy Policy 20(4):310-25
51. Shell International . 1995. The Evolution Of The World 's Energy System 1860-2060. Shell Int ., London
52. Jansen J, Lako P, Mansvelt Beck F, van der Linden N. 1995. Long-Term Prospects For Fossil Fuel Prices. ECN-C-95-046, ECN Policy Stud. EEM Consult B V, The Netherlands
53. Pink MJ. 1993. Exploration and Appraisal Technology-Maximising Rewards by Integration. Shell Int., London
54. Rogner HH. 1988. Technology and the prospects for natural gas-results of current gas studies . Energy Policy 16(3) :9-26
55. Li.ibben H, Leiner J. 1988. 0/: Perspektiven im Upstream-Bereich. BEB Mosaik 3188. Hannover, Ger: Sonderdruck, BEB Erdgasund, Erda! GmbH
56. Rogner HH. 1990. Analyse der Fiirderpot-

262 ROGNER
entiale und langfristige Verfiigbarkeit von Kahle, Erdgas und Erdol. In Energie und Klima, pp. 7-86. Band4, Stud. A.3.1, Hrsg. Enq .-Komm. "Vorsorge zum Schutz der Erdatmosphare" des Deutsch. Bundestages. Bonn: Econ. Verlag, Verlag CF Mtiller
57. American Petroleum Institute. 1991-1995. Basic Petroleum DataBook: Petroleum Industry Statistics. Am. Pet. Inst. (API), Washington, DC
58. Adelman MA. 1995. Prospects for OPEC capacity. Energy Policy 23(3):235-42
59. Adelman MA. 1993. Economics of Petroleum Supply. Cambridge, MA: MIT Press
60. Odell PR. 1995. Is Middle East Domination of the International Oil Market Inevitable? Int. Energy Workshop, Int. Inst. Appl. Syst. Anal., Laxenburg, Austria
61. Hyman LS. 1994. Financing electricity expansion. World Energy Counc. J. Jul :l5-20
62. Rogner HH, Nakicenovic N, Grtibler A. 1993. Second- and third-generation energy technologies. Energy 46:461-84