Thematic assessment — Water resources: quantity and flows
36
THE EUROPEAN ENVIRONMENT STATE AND OUTLOOK 2010 WATER RESOURCES: QUANTITY AND FLOWS
-
Upload
khangminh22 -
Category
Documents
-
view
0 -
download
0
Transcript of Thematic assessment — Water resources: quantity and flows
THE EUROPEAN ENVIRONMENT
STATE AND OUTLOOK 2010
WATER RESOURCES: QUANTITY AND FLOWS
What is the SOER 2010?
The European environment — state and outlook 2010 (SOER 2010) is aimed primarily at policymakers, in Europe and beyond, involved with framing and implementing policies that could support environmental improvements in Europe. The information also helps European citizens to better understand, care for and improve Europe's environment.
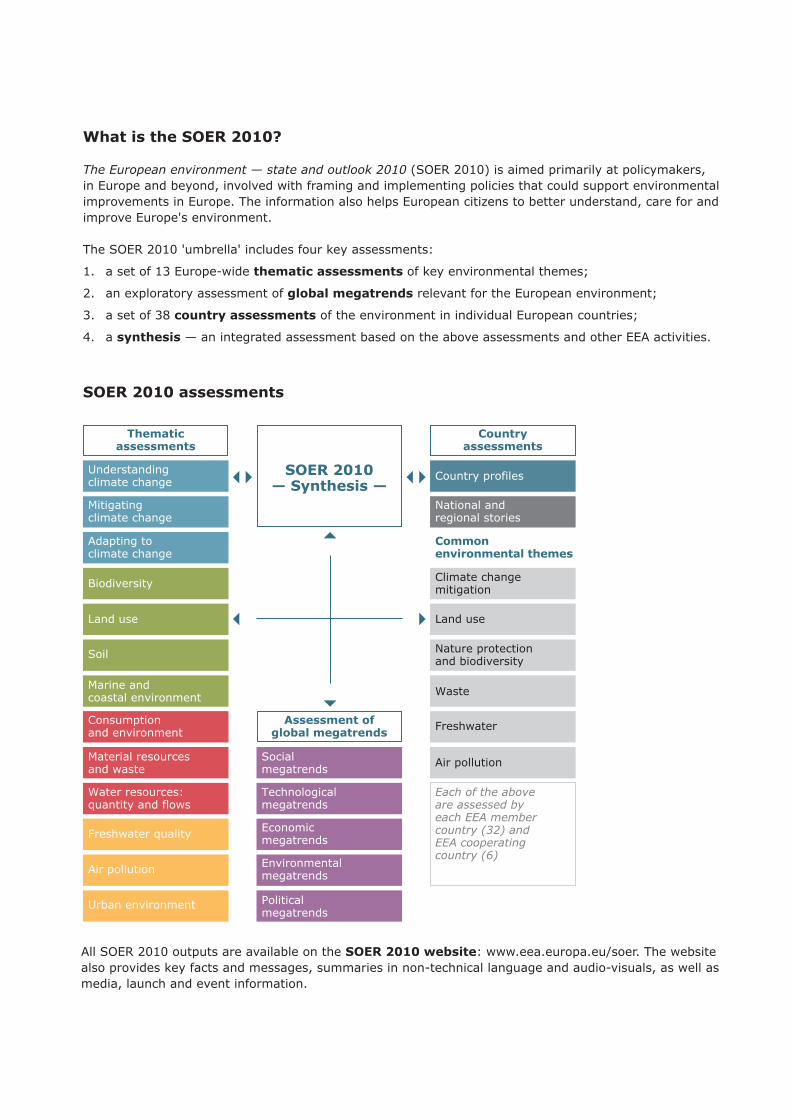
The SOER 2010 'umbrella' includes four key assessments:
1. a set of 13 Europe‑wide thematic assessments of key environmental themes;
2. an exploratory assessment of global megatrends relevant for the European environment;
3. a set of 38 country assessments of the environment in individual European countries;
4. a synthesis — an integrated assessment based on the above assessments and other EEA activities.
SOER 2010 assessments
All SOER 2010 outputs are available on the SOER 2010 website: www.eea.europa.eu/soer. The website also provides key facts and messages, summaries in non‑technical language and audio‑visuals, as well as media, launch and event information.
Thematic assessments
Assessment of global megatrends
SOER 2010— Synthesis —
Country assessments
Understanding climate change Country profiles
National and regional stories
Climate change mitigation
Common environmental themes
Land use
Nature protection and biodiversity
Freshwater
Air pollution
Waste
Mitigating climate change
Adapting to climate change
Biodiversity
Land use
Soil
Marine and coastal environment
Consumption and environment
Material resources and waste
Water resources: quantity and flows
Freshwater quality
Air pollution
Urban environment
Social megatrends
Technological megatrends
Each of the above are assessed by each EEA member country (32) and EEA cooperating country (6)
Economic megatrends
Environmental megatrends
Political megatrends

THE EUROPEAN ENVIRONMENT
STATE AND OUTLOOK 2010
WATER RESOURCES: QUANTITY AND FLOWS

Acknowledgements EEA lead author Peter Kristensen (coordinator).
EEA contributors Beate Werner, Rob Collins, Bo Jacobsen, Ronan Uhel, and André Wehrli.
EEA's European Topic Centre on Water Ifigeneia Koutiva and Maggie Kossida (NTUA).
European Commission DG ENV: Henriette Færgemann, Marieke van Nood, Jacques Delsalle; Andrea Nam, Raimund Mar.
Cover design: EEA/Rosendahl‑Schultz GrafiskLayout: EEA/Pia Schmidt
European Environment AgencyKongens Nytorv 61050 Copenhagen KDenmarkTel.: +45 33 36 71 00Fax: +45 33 36 71 99Web: eea.europa.euEnquiries: eea.europa.eu/enquiries
Copyright notice© EEA, Copenhagen, 2010Reproduction is authorised, provided the source is acknowledged, save where otherwise stated.
Information about the European Union is available on the Internet. It can be accessed through the Europa server (www.europa.eu).
Luxembourg: Publications Office of the European Union, 2010
ISBN 978‑92‑9213‑162‑3doi:10.2800/59600

3
Thematic assessment | Water resources: quantity and flows
The European environment | State and outlook 2010
Water resources: quantity and flows
Summary �������������������������������������������������������������������������������������������������������������������� 4
1 Introduction ������������������������������������������������������������������������������������������������������� 6
2 State and trends ������������������������������������������������������������������������������������������������� 82.1 Too little water ..................................................................................................... 82.2 Too much water .................................................................................................. 102.3 Modified river systems — hydro‑morphological changes ........................................... 11
3 Impacts ������������������������������������������������������������������������������������������������������������ 123.1 Too little water ................................................................................................... 123.2 Impacts of hydro‑morphological pressures ............................................................. 14
4 Outlooks ����������������������������������������������������������������������������������������������������������� 184.1 Water availability, demand and scarcity ................................................................. 184.2 Flood risks and pressures for more dams and hydropower ........................................ 22
5 Response ���������������������������������������������������������������������������������������������������������� 235.1 Future water resource management in Europe ....................................................... 235.2 Mitigation of flood risks and hydro‑morphological pressures ...................................... 265.3 Europe's waters require full implementation of the Water Framework Directive ............ 27
5�4 Blueprint for safeguarding European Waters ���������������������������������������������������� 27
References ��������������������������������������������������������������������������������������������������������������� 28

4
Thematic assessment | Water resources: quantity and flows
The European environment | State and outlook 2010
Summary
Too little water
While water is generally abundant in much of Europe, large areas are affected by water scarcity and droughts — particularly in the south with its severe lack of, and high demand for, water. A comparison of the impacts of droughts in the EU between 1976–1990 and 1991–2006 shows a doubling in both area and population affected. Climate change is projected to exacerbate these impacts, with more frequent and severe droughts projected for many parts of Europe.
Water scarcity has severe consequences for most sectors, particularly agriculture, tourism, energy and the provision of drinking water. Activities that depend on high water abstraction and use, such as irrigated agriculture, tourism and the use of cooling water, are affected by changed flow regimes and reduced water availability. In many locations, water demand often exceeds availability, and the need for adequate water supplies to service vulnerable ecosystems is often neglected. Over-abstraction is causing low river flows, lowered groundwater levels and the drying-up of wetlands, with detrimental impacts on freshwater ecosystems. For many European countries, much of the 'water footprint' (an indicator of direct and indirect water use) is imported from wherever production takes place (virtual water), causing potential water stress abroad.
Too much water
Over the past ten years, Europe has suffered more than 175 major floods, causing deaths, the displacement of people and large economic losses. Climate change is projected to increase the intensity and frequency of floods. Most of the observed upward trend in flood damage can
be attributed to socio-economic factors, such as increases in population, wealth and urbanisation in flood-prone areas, and to land use changes, such as deforestation and loss of wetlands and natural floodplain storage.
Physical modifications
Over the past 150 years Europe's freshwaters have been affected by: major modifications by dams, weirs and sluices, which reduce connectivity; straightening and canalisation; and the disconnection of floodplains. Such structures and activities have altered many European water bodies, sometimes leaving little space for natural habitats, obstructing species migration, disconnecting rivers from floodplains and wetlands, and changing the water flow.
Outlook
Because of water scarcity and physical modifications (and poor water quality), many European water bodies are at risk of failing to meet the aim of the EU Water Framework Directive (WFD) to achieve good status by 2015. Overall water demand in most of Europe is expected to be stable or to decrease (due to increased efficiency), although many river basins will continue to face high water stress due to high demand for water compared with availability. Climate change is projected to increase water shortages, with more frequent and severe droughts projected for many parts of Europe (e.g. Mediterranean region). Flood hazards are also projected to increase across much of Europe. There are also many plans for new dams, reservoirs and small hydropower projects that may further modify Europe's water.
Europe's freshwaters are affected by water scarcity, droughts, floods and physical modifications. Many water bodies are at risk of failing to meet the aim of the EU Water Framework Directive (WFD) to achieve good status by 2015. Future policies should encourage demand management through actions such as increasing water efficiency. In addition, water management will benefit from applying an ecosystems perspective, using floodplains and groundwater aquifers for storing water, and making room (space) for rivers.
5SOER 2010
Thematic assessment | Water resources: quantity and flows
The European environment | State and outlook 2010
At the same time, win-win solutions for managing water use and improving ecological status are beginning to emerge. Examples include making room (space) for rivers, protecting and developing wetlands, and fostering rainwater infiltration in urban areas.
Response
To meet the needs of a resource efficient future, sustain human and economic development and maintain the essential functions of our water ecosystems, an integrated approach to water resource management is needed. Full implementation of the WFD and other water policies will be required to reach good status by 2015. The EU 2020 Strategy and the European Commission's 'Blueprint for safeguarding European waters', planned for 2012, will also further promote sound water management.
Unfortunately, some policies (e.g. hydropower, bio-energy crops) threaten the achievement of water management
objectives. There is thus a need to strike a balance between the benefits of such policies (e.g. renewable energy) and the impacts on the ecological status of water bodies, adjacent land ecosystems and wetlands.
Europe cannot endlessly increase its water supply. Rather, it must reduce demand and policies are needed to encourage demand management. Demand measures could include: the use of economic instruments; water loss controls; water-reuse and recycling; increased efficiency in domestic, agricultural and industrial water use; and water-saving campaigns supported by public education programmes.
Flood management should shift from its current focus on hard-engineered defence systems to natural measures based more on slowing and storing water (e.g. by floodplains and groundwater aquifers) and providing adequate space for rivers. The environmental impacts of water engineering projects (e.g. dams and navigation) should also be minimised.
6
Thematic assessment | Water resources: quantity and flows
The European environment | State and outlook 2010
1 Introduction
Europe's freshwaters are affected by water scarcity, droughts and floods; by major modifications by dams, weirs and sluices, which reduce connectivity; by straightening and canalisation; and disconnection of floodplains. Different uses of water related to sectoral policies, including irrigation, bioenergy and hydropower, and inland water navigation, are affecting the quantitative status of water bodies and degraded water is affecting their ecological quality (see the SOER 2010 freshwater quality assessment (EEA, 2010b)).
Land-use practices and development planning have had major impacts on water scarcity, floods and modification of water bodies. Important wetlands and forests, which help regulate water, have been drained or felled throughout Europe. Rivers have been straightened and floodplains drained to allow for farming, urban development and transport. Our rivers, floodplains and lakes have been heavily modified for a range of different uses.
As large areas of Europe are affected by water scarcity and droughts (Box 1.1), the pressures on European water resources have increased, and there may increasingly be conflicts between human requirements and ecological needs. In many locations, water demand often exceeds availability, and the need for adequate water supplies to service vulnerable ecosystems is often neglected. Climate change is projected to exacerbate these impacts, with more frequent and severe droughts projected for many parts of Europe.
Over the past ten years Europe has suffered more than 175 major floods, causing deaths, the displacement of people and significant economic losses (Box 1.2).
To maintain and improve the essential functions of its water ecosystems Europe needs to manage them well. EU water policies aim to ensure that the rates of extraction from water resources are sustainable over the long term (EC, 2002; 6th EAP), and promote sustainable water use based on a long-term protection of water resources (EC, 2000; WFD).
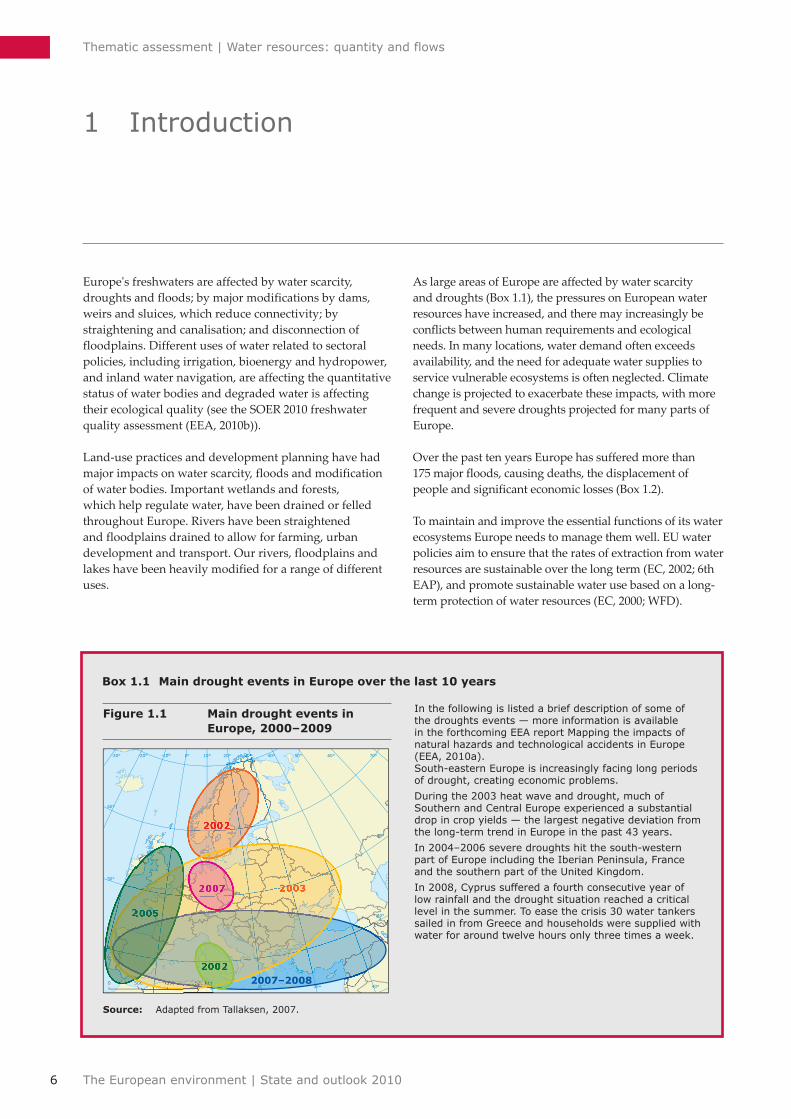
Box 1�1 Main drought events in Europe over the last 10 years
In the following is listed a brief description of some of the droughts events — more information is available in the forthcoming EEA report Mapping the impacts of natural hazards and technological accidents in Europe (EEA, 2010a). South‑eastern Europe is increasingly facing long periods of drought, creating economic problems.
During the 2003 heat wave and drought, much of Southern and Central Europe experienced a substantial drop in crop yields — the largest negative deviation from the long‑term trend in Europe in the past 43 years.
In 2004–2006 severe droughts hit the south‑western part of Europe including the Iberian Peninsula, France and the southern part of the United Kingdom.
In 2008, Cyprus suffered a fourth consecutive year of low rainfall and the drought situation reached a critical level in the summer. To ease the crisis 30 water tankers sailed in from Greece and households were supplied with water for around twelve hours only three times a week.
Source: Adapted from Tallaksen, 2007.
70°60°50°
40°
40°
30
30°
20
20°10°0°-10°-20°-30°
60°
50°
50°
40°
200
2002
2003
2007–20082002
0 500 1000 1500 km
Figure 1�1 Main drought events in Europe, 2000–2009
7SOER 2010
Thematic assessment | Water resources: quantity and flows
The European environment | State and outlook 2010
But because of the problems listed above there is a serious possibility that the achievement of good ecological status/potential in many river basins by 2015, the aim of the Water Framework Directive (WFD), will not be met.
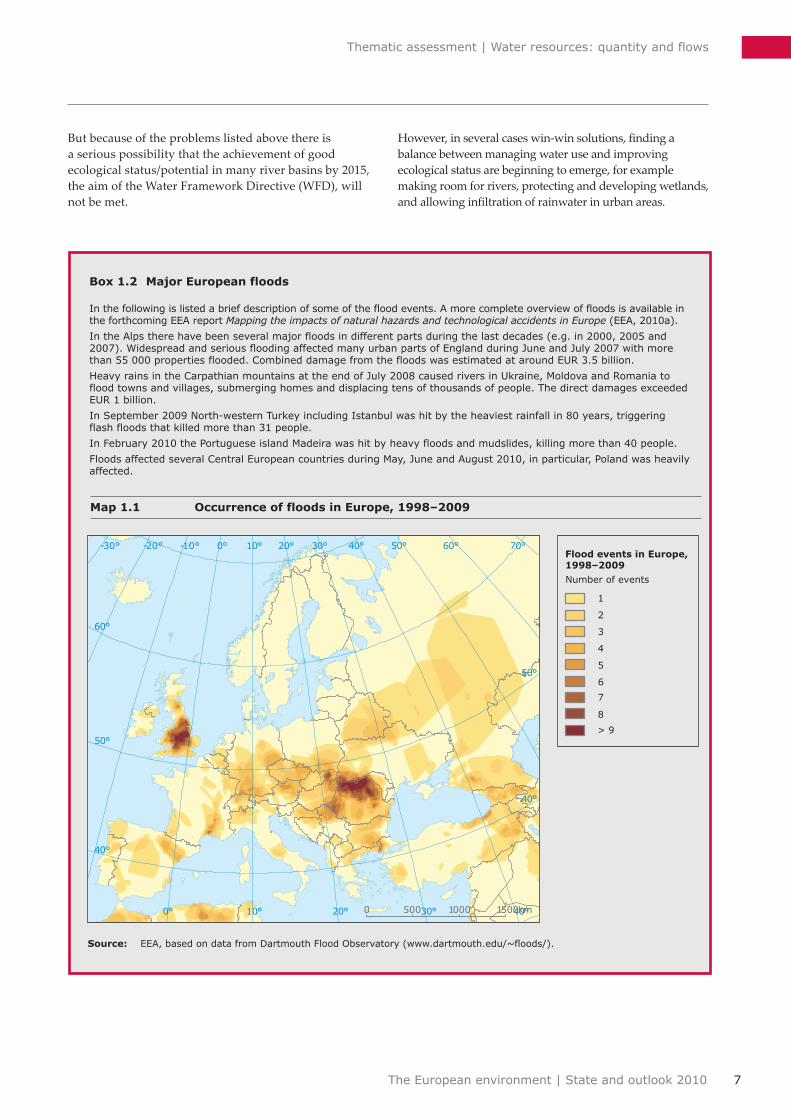
Box 1�2 Major European floods
In the following is listed a brief description of some of the flood events. A more complete overview of floods is available in the forthcoming EEA report Mapping the impacts of natural hazards and technological accidents in Europe (EEA, 2010a).
In the Alps there have been several major floods in different parts during the last decades (e.g. in 2000, 2005 and 2007). Widespread and serious flooding affected many urban parts of England during June and July 2007 with more than 55 000 properties flooded. Combined damage from the floods was estimated at around EUR 3.5 billion.
Heavy rains in the Carpathian mountains at the end of July 2008 caused rivers in Ukraine, Moldova and Romania to flood towns and villages, submerging homes and displacing tens of thousands of people. The direct damages exceeded EUR 1 billion.
In September 2009 North‑western Turkey including Istanbul was hit by the heaviest rainfall in 80 years, triggering flash floods that killed more than 31 people.
In February 2010 the Portuguese island Madeira was hit by heavy floods and mudslides, killing more than 40 people.
Floods affected several Central European countries during May, June and August 2010, in particular, Poland was heavily affected.
Source: EEA, based on data from Dartmouth Flood Observatory (www.dartmouth.edu/~floods/).
Map 1�1 Occurrence of floods in Europe, 1998–2009
70°60°50°
40°
40°
30°
30°
20°
20°
10°
10°
0°
0°-10°-20°-30°
60°
50°
50°
40°
40°
0 500 1000 1500km
Flood events in Europe,1998–2009
Number of events
1
2
3
4
5
6
7
8
> 9
However, in several cases win-win solutions, finding a balance between managing water use and improving ecological status are beginning to emerge, for example making room for rivers, protecting and developing wetlands, and allowing infiltration of rainwater in urban areas.
8
Thematic assessment | Water resources: quantity and flows
The European environment | State and outlook 2010
Many European river basins and waters have been altered by such human activities as land drainage, dredging, flood protection, water abstraction and inter-basin water transfer, hydropower, dams to create reservoirs, and new canals for navigation purposes. Such activity has been intense over the past 150 years but has started to level off in some countries, partly because very few unregulated waters remain but also because of increased awareness of the ecological importance of freshwater habitats.
2�1 Too little water
Compared with many regions of the world that face serious water shortages, water scarcity in Europe is easier to manage. In general, water is relatively abundant, with only 13 % of the available resource abstracted each year (EEA, 2009a). However, water availability and populations are unevenly distributed. Except in some northern and sparsely-populated countries that possess abundant resources, water scarcity occurs in many areas of Europe, particularly in the south, confronted with a crucial combination of a severe lack of and high demand for water.
One relatively straightforward indicator of the pressure or stress on freshwater resources is the water exploitation index (WEI), the percentage of the total freshwater abstracted annually compared to the total available renewable resource. A WEI above 20 % implies that a water resource is under stress, and more than 40 % indicates severe stress and clearly unsustainable use of the resource (Raskin et al., 1997).
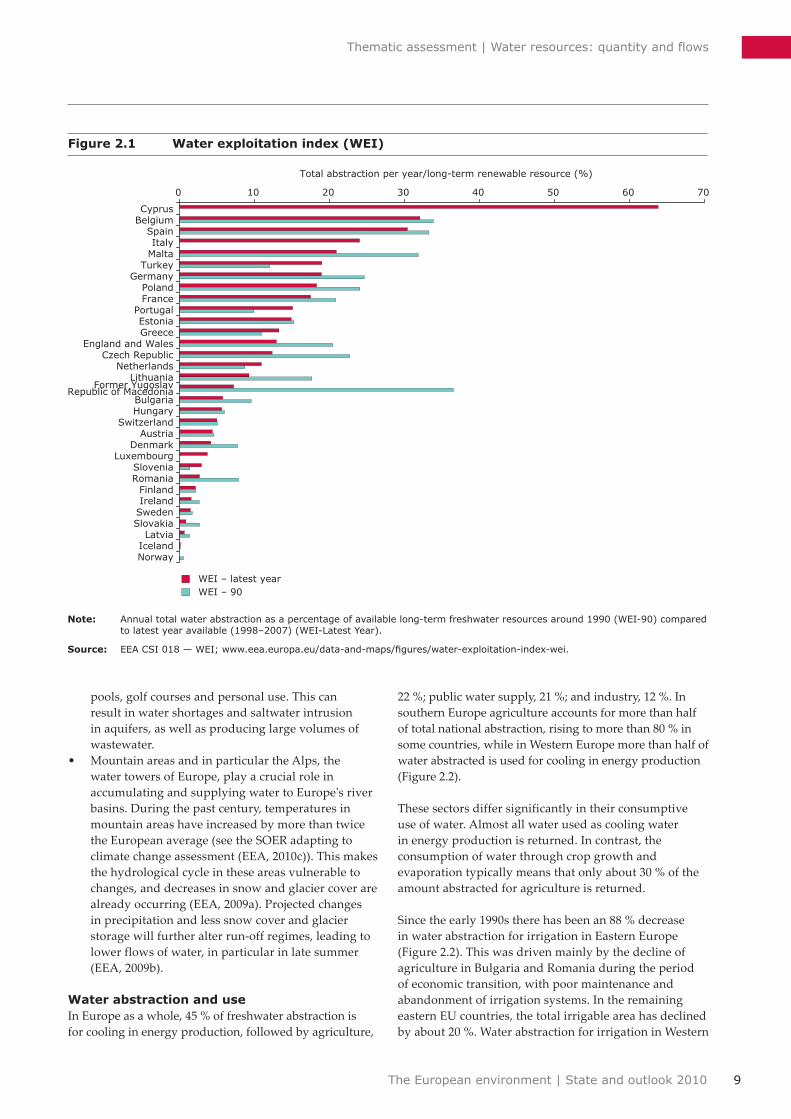
National estimates show that Cyprus (64 %), Belgium (32 %) and Spain (30 %) have the highest WEI in Europe, with high values also for Italy, Malta and Turkey (Figure 2.1). Over the past 10–17 years WEI decreased in 24 countries, representing a 15 % drop in total water abstraction. Most of the decrease occurred in the eastern EU Member States as a result of a decline in abstraction by most economic sectors. However, five countries — Finland, Greece, the Netherlands, Slovenia and Turkey — increased their total water abstraction during the period 1990–2007.
Water can be abundant nationally, but scarce locallyNational estimates of WEI (Figure 2.1) do not, however, reflect the extent and severity of water scarcity in
2 State and trends
sub-national regions. While Spain's WEI is 30 %, it is more than 100 % in the south-eastern river basins of Andalusia and Segura, where demand can only be met by transfers from other river basins, water reuse and desalination.
In particular the following areas and sectors can be considered as water-stressed:
• IrrigatedagriculturalproductioninmanySouthernEuropean regions has grown markedly over the past 60 years. As a consequence, water resources are under severe pressure, with an increasing gap between demand and available resources. Overexploitation has resulted in aquifer water levels falling by several tens of meters, salt-water intrusion, and the drying up of wetlands.
• Inthepast,withgrowingpopulationsandincreasingdemand for water, Europe's larger cities have generally relied on the surrounding regions for water. Athens, Istanbul and Paris, for example, have all developed wide networks for transporting water, often over more than 100–200 km, to their water-hungry densely-populated cities. Growing urban populations, improving lifestyles, reduced water availability due to climate change and the introduction of drinking water quality standards — the water around large cities is often polluted and cannot be used for drinking water — are all factors that should be taken into account when seeking to reduce the vulnerability of large cities to water stress.
• TheMediterraneanislandsincludingCyprus,Malta, Crete, the Balearic Islands and Sicily are generally heavily water-stressed due to quite low net-precipitation with large annual and inter-annual variations, their geographical isolation and their inability to draw on more distant water sources. In addition, near-shore aquifers are threatened by seawater intrusion. The situation is worse in summer when average precipitation is very low and water demand for agriculture and tourism high. This makes water resource management on these islands particularly challenging.
• The Mediterranean is the world's top tourist destination. Tourism peaks in summer, when natural water availability is at its lowest. Tourism generally overuses water resources for hotels, swimming
9SOER 2010
Thematic assessment | Water resources: quantity and flows
The European environment | State and outlook 2010
Figure 2�1 Water exploitation index (WEI)
Note: Annual total water abstraction as a percentage of available long‑term freshwater resources around 1990 (WEI‑90) compared to latest year available (1998–2007) (WEI‑Latest Year).
Source: EEA CSI 018 — WEI; www.eea.europa.eu/data-and-maps/figures/water-exploitation-index-wei.
pools, golf courses and personal use. This can result in water shortages and saltwater intrusion in aquifers, as well as producing large volumes of wastewater.
• MountainareasandinparticulartheAlps,thewater towers of Europe, play a crucial role in accumulating and supplying water to Europe's river basins. During the past century, temperatures in mountain areas have increased by more than twice the European average (see the SOER adapting to climate change assessment (EEA, 2010c)). This makes the hydrological cycle in these areas vulnerable to changes, and decreases in snow and glacier cover are already occurring (EEA, 2009a). Projected changes in precipitation and less snow cover and glacier storage will further alter run-off regimes, leading to lower flows of water, in particular in late summer (EEA, 2009b).
Water abstraction and useIn Europe as a whole, 45 % of freshwater abstraction is for cooling in energy production, followed by agriculture,
22 %; public water supply, 21 %; and industry, 12 %. In southern Europe agriculture accounts for more than half of total national abstraction, rising to more than 80 % in some countries, while in Western Europe more than half of water abstracted is used for cooling in energy production (Figure 2.2).
These sectors differ significantly in their consumptive use of water. Almost all water used as cooling water in energy production is returned. In contrast, the consumption of water through crop growth and evaporation typically means that only about 30 % of the amount abstracted for agriculture is returned.
Since the early 1990s there has been an 88 % decrease in water abstraction for irrigation in Eastern Europe (Figure 2.2). This was driven mainly by the decline of agriculture in Bulgaria and Romania during the period of economic transition, with poor maintenance and abandonment of irrigation systems. In the remaining eastern EU countries, the total irrigable area has declined by about 20 %. Water abstraction for irrigation in Western
0 10 20 30 40 50 60 70
CyprusBelgium
SpainItaly
MaltaTurkey
GermanyPolandFrance
PortugalEstoniaGreece
England and WalesCzech Republic
NetherlandsLithuania
Former YugoslavRepublic of Macedonia
BulgariaHungary
SwitzerlandAustria
DenmarkLuxembourg
SloveniaRomania
FinlandIreland
SwedenSlovakia
LatviaIcelandNorway
Total abstraction per year/long-term renewable resource (%)
WEI – latest yearWEI – 90

10
Thematic assessment | Water resources: quantity and flows
The European environment | State and outlook 2010
Europe is very low compared with southern countries but rises in years with dry summers.
Water abstraction for irrigation decreased by about 2 % in Southern Europe other than Turkey, where it increased by up to 36 % from the 1990 level. In Southern Europe there is a tendency to use irrigation water more efficiently with a higher proportion of the area using drip irrigation. Also, the use of recycled water in these areas has increased (EEA, 2009a). Although the main source of irrigation water is surface water, unregulated/illegal water abstraction, mainly from groundwater, need to be added to the high figures for water abstraction for irrigation in many Southern European countries (EEA, 2009a).
A range of factors influence public water demand, including population and household size, tourism, income, technology, and lifestyle. Public water demand in Eastern Europe has declined by 40 % since the early 1990s as a result of higher water prices and the economic downturn. A similar but less marked reduction in
Figure 2�2 Water abstraction for irrigation, manufacturing industry, energy cooling and public water supply (million m3/year) in the early 1990s and 1998–2007
Source: EEA CSI 018 — Figure 2 Sectoral water use www.eea.europa.eu/data-and-maps/figures/water-abstractions-for-irrigation-manufacturing‑industry‑energy‑cooling‑and‑public‑water‑supply‑million‑m3‑year‑in‑early‑1990s‑and‑the‑period‑1997‑2005.
0
10 000
20 000
30 000
40 000
50 000
60 000
70 000
80 000
90 000
Early 1990sEarly 1990sEarly 1990s 1998–2007 1998–2007 1998–2007 1990 2007
Eastern Western Southern Turkey
Energy Industry Irrigation Public water supply
Abstractions (million m3/year)
demand is apparent in Western Europe over recent years, driven by changes in awareness and behaviour and increases in water prices.
The abstraction of water for industrial use has decreased over the past 20 years, partly because of the general decline in water-intensive heavy industry but also because of increases in the efficiency of water use (see Section 5.1). Abstraction for cooling water has also decreased, due mainly to the implementation of advanced cooling technologies that require less water.
2�2 Too much water
Over the past ten years Europe suffered more than 175 major floods, causing deaths, the displacement of people and large economic losses (see EEA, 2010a, 2010c). Major floods include those along the Danube and Elbe in summer 2002, in the Alps in summer 2005, along the Danube in spring 2006, in England in 2007 and 2009, and the recent flash-floods in Istanbul and on Madeira.
11SOER 2010
Thematic assessment | Water resources: quantity and flows
The European environment | State and outlook 2010
Some areas are more affected than others — in 1998–2009 north-western Romania, south-eastern France, central and southern Germany, northern Italy and the east of England experienced the highest concentrations of repeated flooding.
The costs of floods have increased rapidly (Barredo, 2009; EEA, 2010a). Despite the considerable rise in the number of reported major flood events and economic losses caused by floods in Europe over recent decades, no significant general climate-related trend in extreme high river flows that induce floods has yet been detected (Becker and Grunewald, 2003; Glaser and Stangl, 2003; Mudelsee et al., 2003; Kundzewicz et al., 2005; Pinter et al., 2006; Hisdal et al., 2010; Macklin and Rumsby, 2007). Most of the observed upward trend in flood damage can be attributed to socio-economic factors, such as increases in population, wealth and urbanisation in flood-prone areas, and to land-use changes, such as deforestation and loss of wetlands and natural floodplain storage.
2�3 Modified river systems — hydro-morphological changes
Structures such as dams for hydropower or supplying water for irrigation have resulted in significant hydro-morphological modifications — physical changes — to many of Europe's waters. Navigation activities and navigation infrastructure such as cross profile construction — dams, weirs, locks, and impoundments; canalisation; straightening; bank reinforcement and deepening are typically associated with a range of hydro-morphological changes with potential adverse ecological consequences.
Based on the first characterisation of river basins in relation to the WFD (Article 5), the majority of EU Member States indicated that pressures related to urban development, flood defence, power generation including hydropower, inland water navigation and straightening and land drainage for agriculture are important pressures affecting the hydro-morphological status of water bodies (EC, 2007c).
For this first characterisation of water bodies, four Member States provisionally identified more than 50 % of their water bodies as being heavily modified or artificial — the Netherlands, Belgium, Slovakia and the Czech Republic (EC, 2007c). With the exception of the first four, EU Member States have on average provisionally identified around 16 % of their water bodies as heavily modified and artificial. A more complete overview of Europe's modified waters
should be generated in the coming years through WFD reporting of River Basin Management Plans.
There are many national examples illustrating that a large proportion of waters have been significantly modified. In Switzerland, for example, below elevations of 600 m 46 % of watercourses are heavily impacted in terms of structural diversity and there are about 101 000 artificial barriers with a height difference of more than 0.5 m (FOEN, 2010). Only 21 % of German rivers, mainly in less populated areas, are still in their natural state or only slightly to moderately altered (Umweltbundesamt, 2009) and in Denmark the majority of streams have been directed into culverts or channels over the years. In Austria only about one third of the total length of the main rivers remains free flowing. The remainder has been impounded or otherwise modified for hydroelectricity generation or flood protection and erosion control (Lebensministerium, 2010).
The key driving forces and structural changes that cause hydro-morphological pressures are reservoirs, hydropower generation, inland navigation and flood protection:
• Reservoirs are standing waters created by the damming of rivers or pumped filling to serve one or more purposes, such as hydropower production, water supply for drinking, irrigation and flood protection. During the last two centuries there was a marked increase in both size and number of large storage reservoirs, especially with the development of hydropower and large basin management. Nowadays there are more than 7 000 large dams in Europe and thousands of smaller ones (EEA, 2009a).
• In2008hydropower provided 16 % of electricity in Europe and hydropower currently provides more than 70 % of all renewable electricity (Eurelectric, 2009), more than 85 % of which is produced by large hydropower plants. The share of hydropower in electricity production is generally high in the northern and Alpine countries.
• Inlandwaterwaytransportplaysanimportantrolein the movement of goods in Europe. More than 4 000 kilometres of waterways connect hundreds of cities and industrial regions. Some 20 out of 27 EU Member States have inland waterways, 12 of which have interconnected transboundary waterway networks.
The widespread use of water engineering measures, for example for water transfer, desalination or flood defences, often has adverse hydro-morphological effects.
12
Thematic assessment | Water resources: quantity and flows
The European environment | State and outlook 2010
3�1 Too little water
Water scarcity and droughts have direct impacts on citizens and economic sectors. Information provided by Member States (EC, 2007b) has made it possible to identify severe drought events that affected more than 800 000 km2
of the EU territory in 1989, 1990, 1991 and more recently in 2003. A comparison of the impacts of droughts in the EU between 1976–1990 and 1991–2006 shows a doubling in both area and population affected.
Water scarcity has severe consequences for most sectors, particularly agriculture, tourism, energy, and the provision of drinking water. Activities that depend on high water abstraction and use, such as irrigated agriculture, tourism and the use of cooling water, are affected by changed flow regimes and reduced water availability.
There are many economic impacts on agriculture, in particular reduced crop yields. Low rainfall during the growing season can have serious consequences for rain-fed crops, and for irrigated agriculture water scarcity may have effects over subsequent years as a result of low levels of water in reservoirs and groundwater aquifers. Examples of impacts on agriculture include:
• The2004/2005hydrologicalyearwascharacterisedbyan intense drought throughout the Iberian Peninsula and cereals production fell on average by 40 % (García-Herrera, 2007).
• Duringsummer2006,rainfallinLithuaniawasonly half of the long-term average and agricultural production fell by 30 % with an estimated loss of around EUR 200 million (EC, 2007d).
• In2003,theSlovenianMinistryofAgriculture,Forestry and Food estimated direct annual losses attributable to drought of around EUR 100 million.
3 Impacts
State aid was provided to the agricultural community (Sušnik and Kurnik, 2005).
The incidence of forest fires increases substantially during extended droughts. During summer 2009 a series of Mediterranean wildfires broke out across France, Greece, Italy, Portugal, Spain, and Turkey. The most severe were associated with strong winds that spread the fire during a hot, dry period of weather (see also EEA, 2010a).
The water demand of the energy sector is high, with hydropower and thermal power the most water-intensive energy activities. The production of hydropower can be seriously affected by dry periods:
• Adrought/dryperiodhitFinland,NorwayandSweden in 2002–2003 with a considerable reduction in hydropower production and a considerable increase in the price of electricity (Kuusisto, 2004; Silander et al., 2006; NVE, 2003).
• The2004/2005hydrologicalyearwascharacterisedbyone of the worst droughts ever recorded in the Iberian Peninsula, with only half the average precipitation. River flows dropped considerably throughout Iberia and hydroelectric power production was reduced by 40 % and had to be replaced by electricity from thermoelectric power plants (García-Herrera, 2007).
During droughts, public water supplies often have priority over other uses. However, during severe droughts, different restrictions are implemented on different water uses:
• Duringthe2008drought,Barcelona'sauthoritiesturned off civic fountains and beachside showers, brought in hosepipe bans, and banned the filling of swimming pools.
Box 3�1 EU Solidarity Fund aids Cyprus following severe drought
Cyprus had suffered four consecutive years of low rainfall and the drought reached a critical level in summer 2008. The government applied for financial assistance from the EU Solidarity Fund to help respond to the crisis, which had associated costs equivalent to an estimated 1.25 % of the country's Gross National Income. The European Commission agreed to grant EUR 7.6 million in aid from the EU Solidarity Fund. This will mainly help reimburse the costs of emergency measures, such as the transport of water from Greece. This has been the first time that the Solidarity Fund was used to provide financial aid for emergency measures in response to drought.
13SOER 2010
Thematic assessment | Water resources: quantity and flows
The European environment | State and outlook 2010
• In2008theCypriotgovernmentwasforcedtoapplyemergency measures that included cutting water supply by 30 %. Households were supplied with water for around 12 hours a day, three times a week.
• Indryyearstherehavebeenproblemssupplyingsufficient water to the 12 million people living in Istanbul and the 4 million in Ankara, and water supplies have been rationed (EEA, 2009a).
• Duringtheperiod2004–2006adroughtbuiltupinsouthern Britain and by summer 2006, 13 million consumers were subject to minor restrictions on the use of hosepipe for some non-essential uses (DEFRA, 2007).
The effects of droughts may be more severe in rural areas. During the 2002 drought it was necessary to transport water to thousands of Finnish households and farms in rural areas. In addition, the low groundwater level caused problems with the foundations of many buildings and sewage pipe leakages, due to ground movement (Silander, et al., 2006).
Water use in many sectors is not evenly distributed over the year. Therefore, in some cases competition for water arises in specific periods. Imbalance between demand and availability becomes most acute when abstraction occurs at times of prolonged dry periods. For example, peak abstraction for both agriculture and tourism typically occurs in the summer when water availability is generally at a minimum.
Impacts on water and water-related ecosystemsWhere the water resource has diminished there may be detrimental impacts on freshwater and related ecosystems. Over-abstraction and dry periods frequently result in reduced river flows, lower lake and groundwater levels, and the drying of wetlands. Excessive abstraction from any one of these types of water body can impact one or more of the others. For example, rivers, lakes and wetlands may all be strongly dependent on groundwater, especially in the summer when it typically provides critical base-flow. Environmental flow is the amount of water needed in a watercourse to maintain healthy ecosystems (Box 3.2).
Over-abstraction can worsen water quality because there is less water to dilute pollutant discharges, while over-abstraction of aquifers in coastal areas often results in salt-water intrusion, diminishing the quality and use of groundwater. A heavy aquifer draw-down can also lead to ground subsidence.
In parts of southern Europe, groundwater levels have fallen significantly as a result of abstraction for irrigation and around large cities due to droughts. In areas of intensive agricultural in Southern Europe there are several examples of groundwater levels being lowered by several tens of metres (EEA, 2009a; Custodio, 2002; Dogdu and Sagnak, 2008). The result of falling water tables is empty wells, higher pumping costs, dried-up rivers, endangered wetlands and the intrusion of saltwater which degrades the quality of groundwater.
Water footprint and virtual waterEach European uses, on average, 100–200 litres of tap water a day, but if the amount of water embedded in products such as food, paper, and clothes is included, water use is often ten to twenty times higher. The water footprint is an indicator of water use that looks at both the direct and the indirect water use of a consumer or producer.
The major part of an individual's footprint is related to the production of food and fibre products and most of the water used is for growing agricultural raw products. About 1 m3 of water is needed to produce 1 kg of wheat, but about 15 m3 for 1 kg of beef. However, depending on the region, most of this water use can be by rain-fed agriculture and only when the products are grown in water-scarce regions does water footprint become a fair indicator of our impact on water stress in the region of production.
For many European countries, much of the water footprint is imported from wherever production takes place (virtual water), causing potential water stress there. For example, more than 10 m3 of water are embedded in the production of a pair of jeans and 2.5 m3 in a cotton T-shirt (Chapagain et al., 2006) with most of the water being used for cotton which is mostly grown in water-scarce
Box 3�2 Environmental flows
The quantity, quality and timing of water flows needed to sustain ecosystems and the services they provide are called environmental flows. The different components of an environmental flow regime contribute to different ecological processes. For example, base flows help maintain water table levels in floodplains and soil moisture for plants, high pulse flows shape the character of river channels, and large floods recharge floodplain aquifers (SIWI, 2009).
To use environmental flows as sustainable criteria can help to evaluate the environmental impacts of hydropower and water abstraction licenses in a river system (World Bank, 2009).
14
Thematic assessment | Water resources: quantity and flows
The European environment | State and outlook 2010
countries and needs intensive irrigation — 84 % of the EU's cotton-related water footprint lies outside the EU (Chapagain et al., 2006).
3�2 Impacts of hydro-morphological pressures
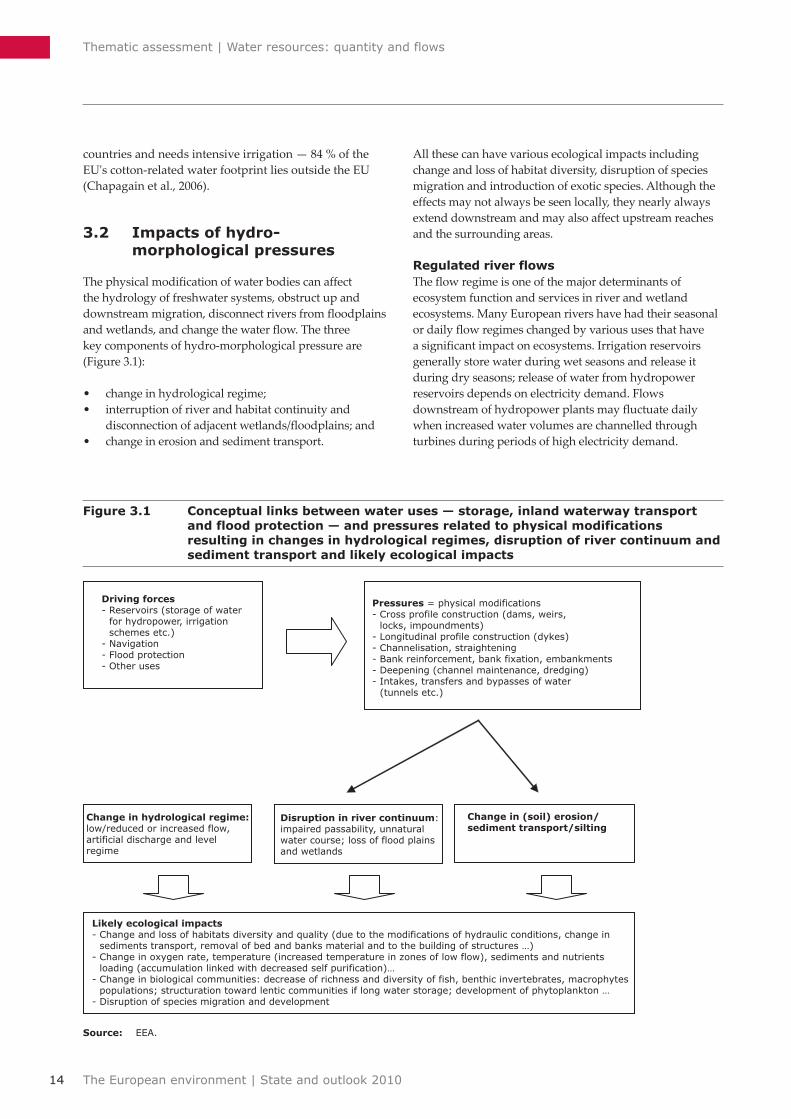
The physical modification of water bodies can affect the hydrology of freshwater systems, obstruct up and downstream migration, disconnect rivers from floodplains and wetlands, and change the water flow. The three key components of hydro-morphological pressure are (Figure 3.1):
• changeinhydrologicalregime;• interruptionofriverandhabitatcontinuityand
disconnection of adjacent wetlands/floodplains; and• changeinerosionandsedimenttransport.
Figure 3�1 Conceptual links between water uses — storage, inland waterway transport and flood protection — and pressures related to physical modifications resulting in changes in hydrological regimes, disruption of river continuum and sediment transport and likely ecological impacts
Source: EEA.
Driving forces- Reservoirs (storage of water - for hydropower, irrigation - schemes etc.)- Navigation- Flood protection- Other uses
Pressures = physical modifications- Cross profile construction (dams, weirs, - locks, impoundments)- Longitudinal profile construction (dykes)- Channelisation, straightening- Bank reinforcement, bank fixation, embankments- Deepening (channel maintenance, dredging)- Intakes, transfers and bypasses of water- (tunnels etc.)
Change in hydrological regime: low/reduced or increased flow, artificial discharge and level regime
Disruption in river continuum: impaired passability, unnatural water course; loss of flood plains and wetlands
Change in (soil) erosion/sediment transport/silting
Likely ecological impacts - Change and loss of habitats diversity and quality (due to the modifications of hydraulic conditions, change in - sediments transport, removal of bed and banks material and to the building of structures …)- Change in oxygen rate, temperature (increased temperature in zones of low flow), sediments and nutrients - loading (accumulation linked with decreased self purification)…- Change in biological communities: decrease of richness and diversity of fish, benthic invertebrates, macrophytes - populations; structuration toward lentic communities if long water storage; development of phytoplankton …- Disruption of species migration and development
All these can have various ecological impacts including change and loss of habitat diversity, disruption of species migration and introduction of exotic species. Although the effects may not always be seen locally, they nearly always extend downstream and may also affect upstream reaches and the surrounding areas.
Regulated river flowsThe flow regime is one of the major determinants of ecosystem function and services in river and wetland ecosystems. Many European rivers have had their seasonal or daily flow regimes changed by various uses that have a significant impact on ecosystems. Irrigation reservoirs generally store water during wet seasons and release it during dry seasons; release of water from hydropower reservoirs depends on electricity demand. Flows downstream of hydropower plants may fluctuate daily when increased water volumes are channelled through turbines during periods of high electricity demand.

15SOER 2010
Thematic assessment | Water resources: quantity and flows
The European environment | State and outlook 2010
Space for many European rivers has become limitedLand-use practices and development planning have a major impact on the way water drains from land into rivers. Throughout Europe, rivers have been straightened and important wetlands and floodplains drained to allow for farming, urban development and transport. The result of these activities is that rivers flow faster and over smaller, deeper beds than they would under natural conditions.
Not only do rivers flow faster, but floods also develop more rapidly since catchment areas have been severely altered, for example by deforestation. Trees and vegetation have been removed and soils that used to retain water before it drained into rivers have been sealed. This leaves less time for flood warnings, preparation and preventive measures.
The problems of flooding have in some places been made worse by the way we construct and defend ourselves against floods. Floods defence works such as canalisation, bank reinforcement and dykes are often associated with a range of hydro-morphological changes with adverse ecological consequences. The building of dykes parallel to the river flow results in the loss of floodplains as retention spaces for flood water with rivers becoming narrower and deeper.
In many European countries several small lakes and streams have disappeared as a result of draining, particularly during the past century in order to gain agricultural land. From an ecological point of view these small water bodies are extremely valuable by providing
habitats for a wide range of plants and animals and by retaining and transforming pollutants thereby reducing the pollution load of downstream river stretches
Floods and water qualityFloods can have particularly severe environmental consequences, for example when installations holding large quantities of toxic chemicals are inundated. In 2002, when the Elbe flooded, industrial facilities and contaminated soils were inundated, resulting in the spreading of persistent organic pollutants and nutrients. Increased levels were recorded in water samples and sediments, and the load of pollutants to coastal areas was very high (IKSE, 2004). The 2007 flood at Tewkesbury's Mythe water treatment works, Gloucestershire, England left 140 000 homes without clean water for up to 17 days (EA, 2009b).
Impacts of reservoirs and weirsReservoir construction may have a number of environmental effects, both during building and following completion. Since dams interrupt the natural continuity of rivers and reservoirs and change the river flow, their ecological consequences can be manifold. For example, access to spawning sites for migratory fish may be prevented. This is a particular problem for fish such as salmon, trout, eel and sturgeon (Box 3.4). However, even small dams cause problems, as they are impassable to most species of fish.
Dams and weirs have an effect on the natural transport of sediment, resulting in its retention upstream of dams and loss downstream, so that material may have to be imported to stabilise the river bed and prevent incision.
Box 3�3 Danube and Rhine heavily impacted by hydro-morphological pressures
Like many other European rivers, the Danube and Rhine are heavily influenced by human activities including intensive navigation and habitat modification by hydraulic engineering. The natural structure on many stretches of the rivers has been changed, including their depth and width, flow regimes, natural sediment transport and fish migration routes.
Dams and reservoirs have been built in nearly all mountainous areas and some lowland regions of the Danube Basin and navigation channels, dykes and irrigation networks are widespread in the lowlands along the middle and lower reaches of the river.
• more than 80 % of the Danube is regulated for flood protection, and about 30 % of its length is impounded for hydropower generation;
• about half of the Danube tributaries are used to generate hydropower. The generation capacity of all the hydropower plants in the Danube Basin is almost 30 000 MW;
• more than 700 dams and weirs have been built along the main tributaries of the Danube;
• along the Rhine, water meadows between Basle and Karlsruhe have shrunk by 87 % following construction of dykes and channels to cut off meanders.
Source: ICPDR, 2010 and Umweltbundesamt, 2006.
16
Thematic assessment | Water resources: quantity and flows
The European environment | State and outlook 2010
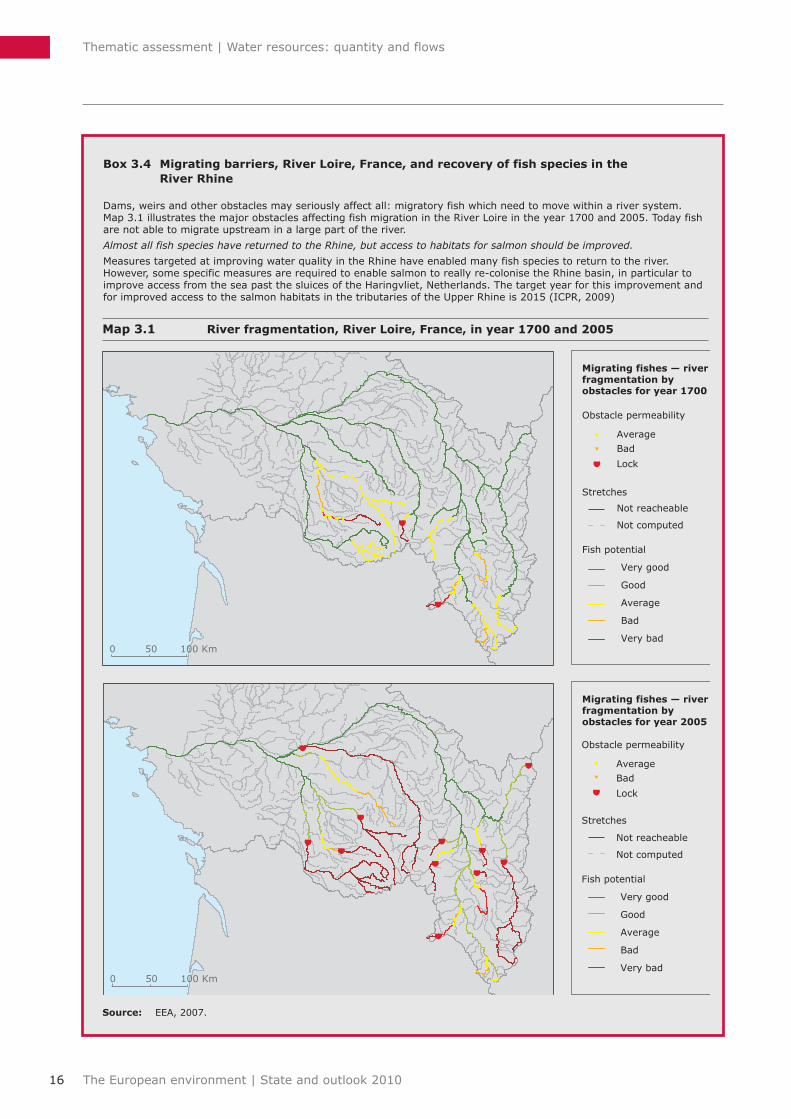
Box 3�4 Migrating barriers, River Loire, France, and recovery of fish species in the River Rhine
Dams, weirs and other obstacles may seriously affect all: migratory fish which need to move within a river system. Map 3.1 illustrates the major obstacles affecting fish migration in the River Loire in the year 1700 and 2005. Today fish are not able to migrate upstream in a large part of the river.
Almost all fish species have returned to the Rhine, but access to habitats for salmon should be improved.
Measures targeted at improving water quality in the Rhine have enabled many fish species to return to the river. However, some specific measures are required to enable salmon to really re‑colonise the Rhine basin, in particular to improve access from the sea past the sluices of the Haringvliet, Netherlands. The target year for this improvement and for improved access to the salmon habitats in the tributaries of the Upper Rhine is 2015 (ICPR, 2009)
Migrating fishes — riverfragmentation by obstacles for year 1700
Migrating fishes — riverfragmentation by obstacles for year 2005
Average
Bad
Lock
Obstacle permeability
Stretches
Not reacheable
Not computed
Fish potential
Very good
Good
Average
Bad
Very bad
Average
Bad
Lock
Obstacle permeability
Stretches
Not reacheable
Not computed
Fish potential
Very good
Good
Average
Bad
Very bad0 50 100 Km
0 50 100 Km
Map 3�1 River fragmentation, River Loire, France, in year 1700 and 2005
Source: EEA, 2007.
17SOER 2010
Thematic assessment | Water resources: quantity and flows
The European environment | State and outlook 2010
River fragmentation Structures such as dams, weirs and barrages may seriously interfere with or completely obstruct fish migration in a water body, in particular affecting species that need to migrate between the headwaters of freshwater bodies and the sea to reproduce (Box 3.4). Bypass rivers, fish ladders or fish passes at such structures may maintain or improve ecological continuity.
Box 3�5 Invasion of large European rivers
Invasive species have become a major concern in the Danube. The Joint Danube Survey in 2007 found killer shrimps, Dikerogammarus villosus, at 93 % of the sites sampled along the river, Asian clams at 90 % and carpets of weeds at 69 %. Killer shrimps can adapt to a wide range of habitats and cause significant ecological disruption such as species reduction. The water hyacinth (Eichhornia crassipes) is considered one of the worst aquatic weeds in the world.
Over the past two centuries, the connection of the Rhine with other river catchments through an extensive network of inland waterways has allowed macro‑invertebrate species from different bio‑geographical regions to invade the river. A total of 45 such species have been recorded. Transport by shipping and dispersal by man‑made waterways are the most important dispersal vectors.
Invasive species spread through inland waterwaysThe extensive networks of inland waterways in parts of Europe have allowed species from different bio-geographical regions to mix, altering communities, affecting the food webs and introducing new constraints to the recovery of the native biodiversity (Box 3.5).
Source: Danube Watch, 2008; Bernaur and Jansen, 2006; Leuven et al., 2009.

18
Thematic assessment | Water resources: quantity and flows
The European environment | State and outlook 2010
This section provides outlooks for water availability, demand and future water scarcity and flood risks, and pressures from more dams and hydropower. More detailed information on flood risks due to climate change is available in the SOER 2010 adapting to climate change assessment (EEA, 2010c).
4�1 Water availability, demand and scarcity
Global outlookOver the past 50 years the world's population has doubled, gross domestic product (GDP) has grown tenfold, and agricultural and industrial production has boomed. This growth and these competing uses have put water resources under ever-increasing strain. Many countries and big cities face water scarcity as a fundamental challenge to economic and social development. The main problems are increased population, economic growth and the mis-management of water resources.
By 2030 more than a third of the world's population will be living in river basins that will have to cope with significant water shortages, including many in countries and regions that drive global economic growth. A new report by the 2030 Water Resource Group (1) estimates that in just 20 years global demand for water will be 40 % higher than it is today, and more than 50 % higher in the most rapidly developing countries (2030 Water Resource Group, 2009; see also Box 4.1). The report estimates that, assuming historic rates of supply expansion and efficiency improvement, it will only be possible to close a fraction of this gap. Unless local, national and global communities come together and dramatically improve the way they consider and manage water, there will be many more hungry people and degraded environments — and economic development itself will be at risk in many countries.
In addition, future climate change is projected to reduce water availability in many places and further increase the population affected by water scarcity (Bates et al., 2008).
4 Outlooks
(1) 2030 Water Resource Group: Members include McKinsey & Company, the World Bank Group, and a consortium of business partners: The Barilla Group, The Coca Cola Company, Nestlé SA, New Holland Agriculture, SAB Miller PLC, Standard Chartered and Syngenta AG.
European and national outlooksCompared with the global situation, with many regions facing serious water shortages in the coming decades, water stress in Europe may be easier to manage. Based on projections of population, economic development and agricultural production, demand for water in most of Europe is expected to be stable or to decrease. The decrease is expected to be driven by more the efficient use of water by all sectors together with a generally stable population and the projected limited change in the area of irrigated land. However, many river basins will continue to face high water stress due to high demand for water compared with availability (EEA, 2005; Plan Bleu, 2005; OECD, 2008).
National or regional outlooks for demand are available for some European countries. In the Netherlands (Vewin, 2008) and England and Wales (EA, 2009) outlooks for the coming 10–20 years predict stable or a small increase in water demand. A more marked increase of 10 % is seen for Spain (MMA, 2007), and demand in Turkey is predicted to more than double over the next 15 years (DSI, 2009 and Box 4.2).
However when evaluating the future water situation in Europe, the following factors have to be taken into consideration:
1) agriculture and demand for food and bioenergy; 2) the impact of climate change on water availability; 3) sectoral water demands: agriculture, household and
tourism. Agriculture and demand for food and bioenergyIncreasing global demand for food and bioenergy may lead to increasing agricultural demand for water (EEA, 2010d). The European Commission's Biomass Action Plan expects an increase in energy crops from 2 Mtoe in 2003 to 102–142 Mtoe in 2030 (EC, 2005). More bioenergy production may result in more water stress in some river basins and regions, in particular in southern Europe and during dry summers (Dworak et al.
19SOER 2010
Thematic assessment | Water resources: quantity and flows
The European environment | State and outlook 2010
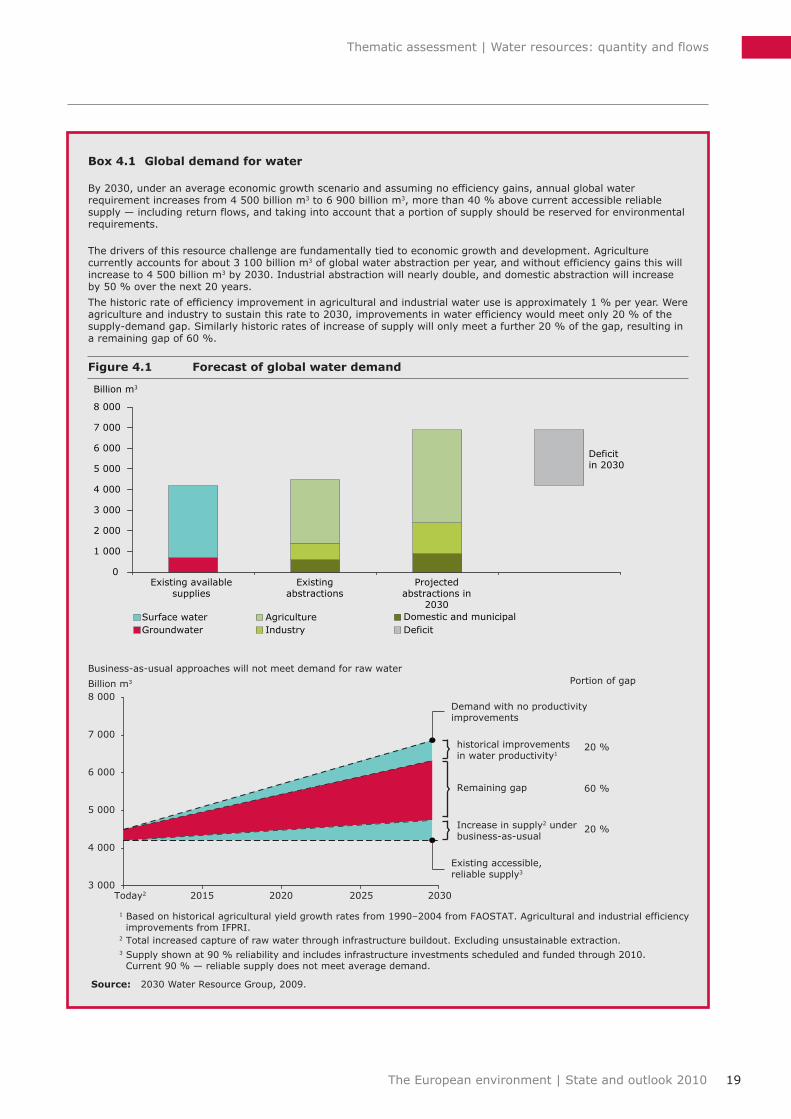
Box 4�1 Global demand for water
By 2030, under an average economic growth scenario and assuming no efficiency gains, annual global water requirement increases from 4 500 billion m3 to 6 900 billion m3, more than 40 % above current accessible reliable supply — including return flows, and taking into account that a portion of supply should be reserved for environmental requirements.
The drivers of this resource challenge are fundamentally tied to economic growth and development. Agriculture currently accounts for about 3 100 billion m3 of global water abstraction per year, and without efficiency gains this will increase to 4 500 billion m3 by 2030. Industrial abstraction will nearly double, and domestic abstraction will increase by 50 % over the next 20 years.
The historic rate of efficiency improvement in agricultural and industrial water use is approximately 1 % per year. Were agriculture and industry to sustain this rate to 2030, improvements in water efficiency would meet only 20 % of the supply‑demand gap. Similarly historic rates of increase of supply will only meet a further 20 % of the gap, resulting in a remaining gap of 60 %.
Figure 4�1 Forecast of global water demand
0
1 000
2 000
3 000
4 000
5 000
6 000
7 000
8 000
Existing availablesupplies
Existingabstractions
Projectedabstractions in
2030
Deficitin 2030
Billion m3
DeficitSurface waterGroundwater
AgricultureIndustry
Domestic and municipal
3 000
4 000
1 Based on historical agricultural yield growth rates from 1990–2004 from FAOSTAT. Agricultural and industrial efficiency improvements from IFPRI.2 Total increased capture of raw water through infrastructure buildout. Excluding unsustainable extraction.3 Supply shown at 90 % reliability and includes infrastructure investments scheduled and funded through 2010. Current 90 % — reliable supply does not meet average demand.
5 000
6 000
7 000
8 000
Business-as-usual approaches will not meet demand for raw water
Billion m3
Today2 2030202520202015
Remaining gap
20 %
60 %
20 %
Portion of gap
Increase in supply2 underbusiness-as-usual
Existing accessible,reliable supply3
historical improvementsin water productivity1
Demand with no productivityimprovements
Source: 2030 Water Resource Group, 2009.
20
Thematic assessment | Water resources: quantity and flows
The European environment | State and outlook 2010
2009). For example, in Turkey, agriculture is undergoing marked modernisation and is becoming more intensive, and demand is expected to increase. However, Dworak et al. (2009) conclude that a significant increase in biomass production in the EU will not require an increase in the total water abstraction for irrigation if the land used for bioenergy will be in northern and central Europe. Furthermore, economic reconstructuring in some eastern European countries has also led to a decrease in the intensity of agriculture. For example, water abstraction for irrigation in Romania and Bulgaria is only one-tenth of what it was 20 years ago, and new economic growth will provide further opportunities for better water efficiency. This decline suggests the potential for a future increase in irrigated agriculture in this region. In Romania, for example, rehabilitation and modernisation of the irrigation system has been initiated (World Bank, 2007).
Climate change impact on water availability Climate change is projected to lead to significant changes in yearly and seasonal water availability across Europe. Water availability will generally increase in northern regions, although summer flows may decrease. Southern and south-eastern regions, which already suffer most from water stress, will be particularly exposed to reductions in
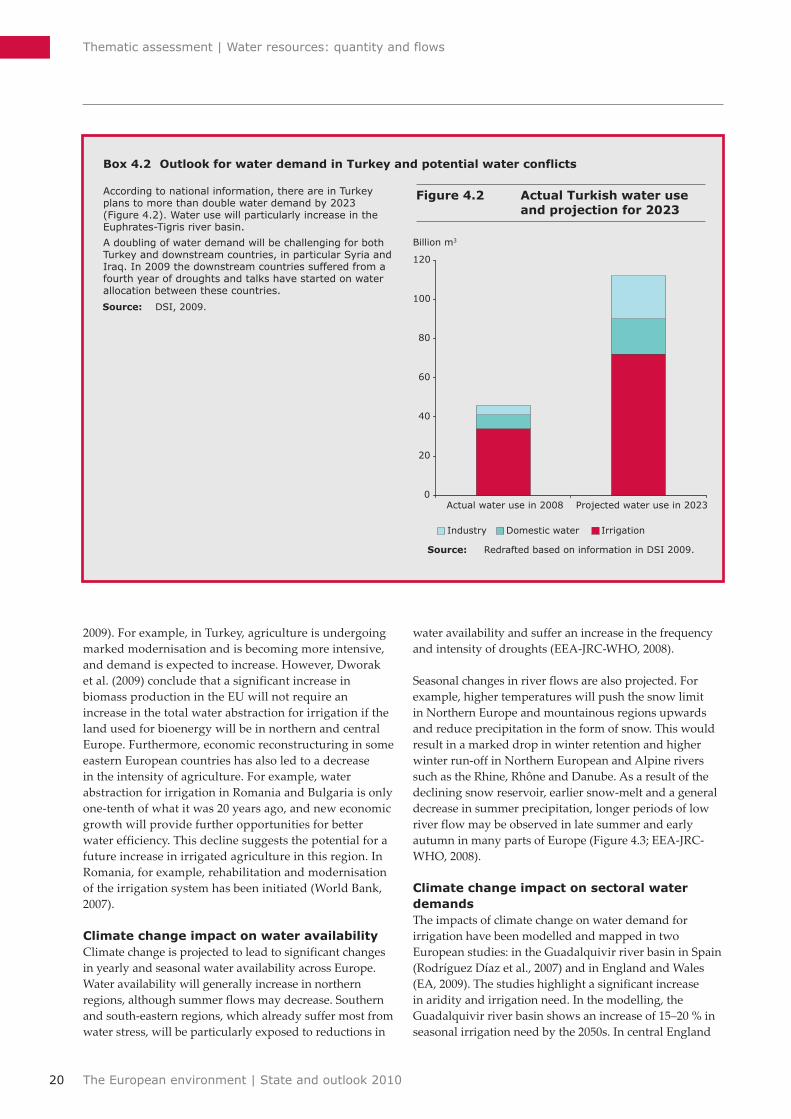
Box 4�2 Outlook for water demand in Turkey and potential water conflicts
According to national information, there are in Turkey plans to more than double water demand by 2023 (Figure 4.2). Water use will particularly increase in the Euphrates‑Tigris river basin.
A doubling of water demand will be challenging for both Turkey and downstream countries, in particular Syria and Iraq. In 2009 the downstream countries suffered from a fourth year of droughts and talks have started on water allocation between these countries.
Figure 4�2 Actual Turkish water use and projection for 2023
0
20
40
60
80
100
120
Actual water use in 2008 Projected water use in 2023
Billion m3
Industry Domestic water Irrigation
Source: Redrafted based on information in DSI 2009.
water availability and suffer an increase in the frequency and intensity of droughts (EEA-JRC-WHO, 2008).
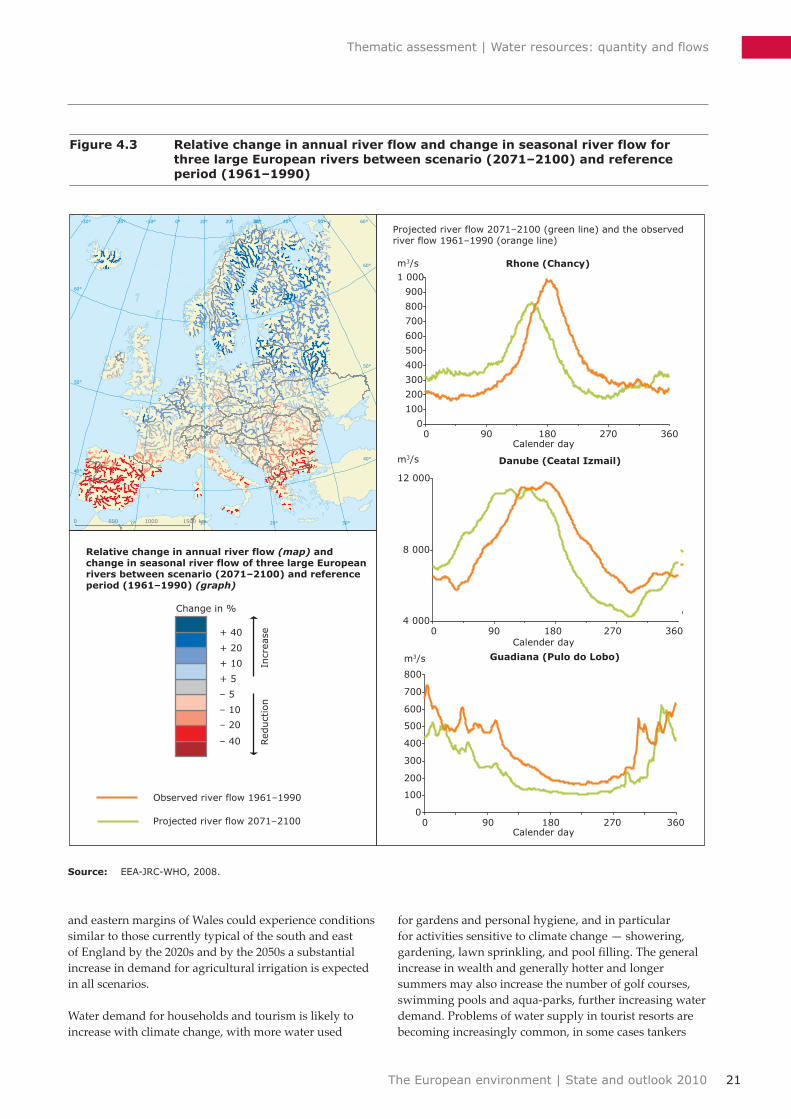
Seasonal changes in river flows are also projected. For example, higher temperatures will push the snow limit in Northern Europe and mountainous regions upwards and reduce precipitation in the form of snow. This would result in a marked drop in winter retention and higher winter run-off in Northern European and Alpine rivers such as the Rhine, Rhône and Danube. As a result of the declining snow reservoir, earlier snow-melt and a general decrease in summer precipitation, longer periods of low river flow may be observed in late summer and early autumn in many parts of Europe (Figure 4.3; EEA-JRC-WHO, 2008).
Climate change impact on sectoral water demandsThe impacts of climate change on water demand for irrigation have been modelled and mapped in two European studies: in the Guadalquivir river basin in Spain (Rodríguez Díaz et al., 2007) and in England and Wales (EA, 2009). The studies highlight a significant increase in aridity and irrigation need. In the modelling, the Guadalquivir river basin shows an increase of 15–20 % in seasonal irrigation need by the 2050s. In central England
Source: DSI, 2009.
21SOER 2010
Thematic assessment | Water resources: quantity and flows
The European environment | State and outlook 2010
and eastern margins of Wales could experience conditions similar to those currently typical of the south and east of England by the 2020s and by the 2050s a substantial increase in demand for agricultural irrigation is expected in all scenarios.
Water demand for households and tourism is likely to increase with climate change, with more water used
Figure 4�3 Relative change in annual river flow and change in seasonal river flow for three large European rivers between scenario (2071–2100) and reference period (1961–1990)
Rhone (Chancy)
0
100
200
300
400
500
600
700
800
900
1 000
90 180 270 360Calender day
Danube (Ceatal Izmail)
4 000
8 000
12 000
90 180 270 360Calender day
Guadiana (Pulo do Lobo)
0
100
200
300
400
500
600
700
800
90 180 270 360
m3/s
m3/s
m3/s
0
0
0
Relative change in annual river flow (map) and change in seasonal river flow of three large European rivers between scenario (2071–2100) and reference period (1961–1990) (graph)
+ 40
+ 20
+ 10
+ 5
– 5
– 10
– 20
– 40
30°
0 500 1000 1500 km
Change in %
60°50°40°
30°
30°
20°
20°
10°
10°
0°
0°-10°-20°-30°
60°
60°
50°
50°
40°
40°
Red
uct
ion
Incr
ease
Calender day
Projected river flow 2071–2100
Observed river flow 1961–1990
Projected river flow 2071–2100 (green line) and the observed river flow 1961–1990 (orange line)
for gardens and personal hygiene, and in particular for activities sensitive to climate change — showering, gardening, lawn sprinkling, and pool filling. The general increase in wealth and generally hotter and longer summers may also increase the number of golf courses, swimming pools and aqua-parks, further increasing water demand. Problems of water supply in tourist resorts are becoming increasingly common, in some cases tankers
Source: EEA‑JRC‑WHO, 2008.

22
Thematic assessment | Water resources: quantity and flows
The European environment | State and outlook 2010
now have to transport water to tourist islands, and winter tourism may require increases in snow-making due to ascending snowlines.
4�2 Flood risks and pressures for more dams and hydropower
Changes in the intensity and frequency of extreme precipitation events are projected to cause an increase in flood hazard across much of Europe, although in the more northern and mountainous areas the risk of snowmelt floods and ice jams in spring may actually be reduced owing to rising temperatures (EEA-JRC-WHO, 2008; Dankers and Feyen, 2008; see also EEA, 2010c).
Most European rivers are already heavily affected by dams and reservoirs and most of the suitable stretches have already been used. However, there are still many plans and studies for new dams, reservoirs and small hydropower projects:
• intheDanubebasinthereareplanstobuiltdamson the Bavarian Danube, the Sava, and the Drava (ICPDR, 2010);
• inDecember2007thePortuguesegovernmentapproved the National Programme for Dams with High Hydroelectric Potential (PNBEPH) leading to the construction of ten new dams (PNBEPH, 2008);
• inTurkey,86largedams—above15m—and124 small dams are currently under construction or planned. The aim is to increase the area under irrigation by 58 %, hydropower generation by 36 %, and domestic and industrial water supply by 27 % (DSI, 2009);
• inFebruary2010,theCouncilofState,Greece'shighest administrative court, ordered the suspension of a controversial project to divert the country's second-longest river, the Acheloos, from western Greece to the heavily-farmed Plain of Thessaly, approving an appeal by environmentalists against the plans (Katemerini 2010; WWF 2010)
• arecently-publishedScottishgovernmentstudyestimates a potential for more than 7 000 new small hydropower projects (Scottish Government, 2010) and a study by the Environment Agency (EA, 2010) identified between 4 000 and 12 000 potential new small hydropower projects in England and Wales;
• inJune2008,theFrenchenvironmentministerannounced a plan to boost hydropower by 2020. The government wants to increase production capacity by 30 % by installing more efficient turbines. It does not propose to build more dams (ENDS, 2008 and Gouvernement, 2008).
This list is just a snapshot; it is neither an exhaustive nor a complete overview of planned water infrastructure projects in Europe. Many of the projects are being discussed between governments, local administrations, different user groups, and industrial and environmental organisations. The new projects may conflict with the WFD objectives of achieving good ecological status/potential. Article 4.7 of the WFD requires that all practicable steps are taken to mitigate the adverse impacts of new infrastructures on the status of water bodies and that the projects should have overriding public/societal interest and/or benefits to the environment and society (EC, 2006).
23
Thematic assessment | Water resources: quantity and flows
The European environment | State and outlook 2010
Sustaining human and economic development and maintaining ecosystems requires more effective management of water resources. Integrated water resource management introduced in the WFD and national water policies should be implemented in order to manage water resources more efficiently and ensure that sufficient water is reserved for environmental needs.
The EU's 6th Environment Action Programme (6th EAP) and EU water policies, including the WFD, aim to ensure that rates of extraction from water resources are sustainable over the long term (6th EAP) and to promote sustainable water use on the basis of the long-term protection of available water resources (WFD). Many European water bodies may fail to meet the aim of the WFD to achieve good status by 2015 because of problems in the management of water quantity, modifications to the structures of riverbanks and beds and the connectivity of rivers, or unsustainable flood protection measures.
Towards a balance of environmental protection and other objectives There are different sectoral and environmental policies and measures at the EU and national levels that threaten the achievement of water management objectives and the objective of achieving good status. Examples include:• policiesanddemandforfoodproductionand
bioenergy crops, including irrigated agriculture, and the development of tourism have the potential to increase the demand for water and, together with reduced water availability due to climate change, further worsen the extent and severity of water scarcity in some parts of Europe;
• inthecontextoftheEUDirectiveonthepromotionofthe use of energy from renewable sources 2009/28/EC (EC, 2009), hydropower is an important measure for increasing the share of renewable electricity but, depending on its management, hydropower can impact water bodies and adjacent wetlands;
• inlandwaterwaytransportplaysanimportantrolein the transport of goods in central Europe and is generally seen as more environmentally friendly than road transport. However, navigation activities and/or infrastructure works are typically associated with a range of hydro-morphological changes with potentially adverse ecological consequences.
5 Response
Thus, despite the advantage of these policies for society and for reducing GHG emissions, there is a need to strike a balance between the benefits and the impacts on the ecological status of water bodies, adjacent land ecosystems and wetlands.
5�1 Future water resource management in Europe
In 2007 the European Commission adopted a Communication Towards Sustainable Water Management in the European Union on water scarcity and droughts (EC, 2007a). This sets out the measures needed if Europe is to move towards a water-efficient and water-saving economy, including full implementation of the WFD with water pricing, moving towards sustainable land-use planning, giving priority to water savings and water efficiency measures over any others, and further integrating water issues into all sectoral policies. The need for adaptation to climate change will add a further challenge.
In the past, European water management has largely focused on increasing supply by drilling new wells, constructing dams and reservoirs, desalination, large-scale water-transfer infrastructures, etc. However, as Europe cannot endlessly increase water supply to its citizen, we must reduce demand. Policies are needed to encourage demand management that increases the efficiency of water use rather than supply-side approaches. Demand measures could include the use of economic instruments; water loss controls; water-reuse and recycling; increased efficiency of domestic, agricultural and industrial water use; and water-saving campaigns supported by public education programmes. Water savings will bring additional benefits, for example by reducing pollution discharges and energy consumption.
Water efficiency — wasting less water and increasing the productivity per volume — is essential for building resilience into our systems and adapting to climate change. Water efficiency is an economic and environmental opportunity that serves sectors and functions that use water, helps economic growth and at the same time safeguards the environment. To realise a boost in water efficiency, both technological development and improved governance for water is needed, together

24
Thematic assessment | Water resources: quantity and flows
The European environment | State and outlook 2010
with monitoring methodologies such as 'environmental accounting'.
Water pricing Water pricing is a key mechanism for achieving the more sustainable use of water in all sectors. It is also fundamental to the WFD requirement that the pricing of water services reflect their full costs. The WFD obliges Member States to implement water-pricing policies that provide adequate incentives to use water resources efficiently.
Water pricing and metering have been highly effective in changing consumer behaviour in many countries. When wasteful water use is reflected in the next water bill, people act by repairing a leaking lavatory or reducing watering the garden. Increased water prices have been a major factor in reducing public water demand in Eastern Europe and have contributed to a focus on increasing water saving in Western Europe. (EEA, 2009a, 2010e). To optimise the incentives for efficient use of water, pricing must be tied to the volume of water consumed. In this respect, metering plays a key role and should be implemented across all sectors. Currently only some countries meter the majority of water uses (EC, 2010a).
When water use decreases as a consequence of water savings, the revenues from water services may decrease — this can force water companies to increase prices to keep up with necessary investments. Water prices therefore have to be seen in the context of needed measures for implementing better water services and protecting the environment.
In many places farmers have moved to water-intensive crops that require irrigation because of the higher yields and prices for these crops can command. In Spain, for example, the 14 % of agricultural land that is irrigated yields more than 60 % of the total value of agricultural products. Yet agriculture generally pays much less for water than other users. In Greece and Spain, for example, agricultural water costs EUR 0.05/m3 compared with EUR 0.85–1.25/m3 for household and industrial water (SOER 2010 country assessment on Greece (EEA, 2010f); MARM 2008). If water were paid for by volume, with the price reflecting the full resource and environmental cost, farmers would reduce irrigation and adopt measures to improve water efficiency (EEA, 2009a).
Illegal abstraction, particularly from groundwater and often for agricultural purposes, is widespread in certain areas of Europe (EEA, 2009a). Addressing illegal water use is crucial but represents a major political challenge. Surveillance and fines are required to detect and stop illegal wells. From 2010 the Good Agricultural and Environmental Condition (GAEC) framework under cross-compliance (i.e. the attachment of environmental
conditions to agricultural support policies) includes the requirement that, where use of water for irrigation is subject to authorisation, procedures for authorising irrigation have to be complied with. This should give Member States a tool for controlling illegal wells.
Water saving, technology, behaviour and practicesThe potential for saving water is large. An EU 2007 study estimates that water efficiency could be improved by nearly 40 % through technological improvements alone and that changes in human behaviour or production patterns could further increase such savings (Dworak et al., 2007).
There are many ways to save water. Shifting to water-efficient products or adapting existing ones can have a huge impact. Lavatory flushing alone accounts for 25–30 % of domestic water use and dual-flush appliances can significantly lower water use. Improvements in the efficiency of water use by washing machines and dishwashers can also bring reductions. The most efficient dishwashers, for example, now use less water than washing by hand. At the same time, changes in lifestyles and habits, such as the desire for a green lawn during summer, or more baths, jacuzzis and swimming pools, can have the opposite effect and boost household water use. Raising awareness through education, information campaigns and eco-labelling schemes can play a crucial role in changing habits and lifestyles.
Various practices can be implemented to ensure that agriculture uses water more efficiently. These include changing the timing of irrigation so that it closely follows crop water requirements, adopting more efficient techniques such as sprinkler and drip irrigation systems, and implementing the practice of deficit irrigation; an optimization strategy in which irrigation is applied during drought-sensitive growth stages of a crop. In addition, changing crop types can reduce water demand or shift peak demands away from the height of summer when water availability is at a minimum. As with other water-saving approaches in agriculture, providing advice, information and education to farmers should enhance should significantly improve water efficiency.
During the past ten years there has been a marked improvement in the irrigation methods used in some countries. In Spain, the total irrigated area was stable at 3.4 million hectares from 2002 to 2008 but the area irrigated by gravity (flooding) decreased from around 1.4 million to just above 1 million hectares, while the area watered by drip irrigation increased from 1.1 million to 1.6 million hectares (MARM/BPIA, 2009). In 2006 average water use for drip irrigation was 3 800 m3/ha and for gravity irrigation 6 200 m3/ha (INE, 2008). However in some cases adoption of more efficient irrigation

25SOER 2010
Thematic assessment | Water resources: quantity and flows
The European environment | State and outlook 2010
techniques will not necessarily mean that more water will be left in the environment: it may be used to irrigate a larger area.
Manufacturing industry can reduce its water use by recycling and re-use, changing production processes and using more efficient technologies, including measures to reduce leakage (Dworak et al., 2007). Water-use efficiency in many sectors has been improving significantly for some years. The European Chemicals Industry (CEFIC, 2009), for example, has estimated that water abstraction by chemical industries across Europe, used mainly for cooling, fell by 7 % between 2003 and 2007.
Since 1995 Unilever has reduced the amount of water used per tonne of production by 63 %, by minimising water use and maximising water recycling (Unilever, 2010) and since 2005 Kraft Foods has reduced global water used in manufacturing processes by 32 % (Kraft Foods, 2010).
Infrastructure maintenance and leakageLeakage of water from supply systems in parts of Europe is substantial, and countries face major challenges in the construction and maintenance of water-related infrastructure. Investing in detection and repairing leaks is important. According to recent projections, France and the United Kingdom will have to increase their annual spending by about 20 % just to maintain water services at their current levels (OECD, 2009).
In some parts of Europe, for example, Germany and Denmark, leakage rates are less than 10 % and close to what is technically and economically feasible (BDEW, 2010 and Statistics Denmark, 2006). In other parts, however, water loss remains considerable. In the Czech Republic, Malta, Spain and England and Wales, losses from public water supply are around 20 % (MoA and MoA, 2007; NSO, 2006; INE, 2010; EA, 2008) while in Croatia and the city of Rome loss rates are greater than 25 % (Crostat, 2009; ACEA, 2006).
In some countries there has been a focus on reducing such losses, and recent declines in leakage are apparent. Over the past 10–15 years, a 30–50 % reductions have been seen in the Czech Republic, Denmark, England and Wales, Germany, Malta, the Netherlands and Spain. In Denmark,
for example, loss from leakage has fallen from more than 10 % in 1996 to 6–7 % today.
In some eastern countries poor maintenance of irrigation infrastructures such as irrigation canals has led to high losses through leakages (World Bank, 2003). EU Structural funds can be used for investments connected with water supply and water management (EC, 2010b).
Water conservation can deliver financial and economic benefits, including delayed or avoided additional water supply infrastructures, reduction in sewage and wastewater treatment capacity, less energy use for transporting water and reduced water bills. Saving water should leave more water for the aquatic environment.
Improving drought risk managementDrought management is an essential element of water resource policy and strategies. Drought Management Plans (DMP), based on the characterisation of possible droughts in a basin, their effect, and possible mitigation measures, should be prepared on a river basin scale and before emergency schemes have to be applied. DMPs, by promoting sustainable water use, are closely linked with the WFD objectives. Measures to prevent and alleviate the consequences of droughts and water scarcity should aim to establish a drought-resilient society with a focus on reducing the demand for water so that negative impacts of droughts on the status of water bodies are avoided. Criteria for minimum ecological flow and assuring good quantitative status for groundwater should be established.
Considering additional water supply infrastructuresAdditional water supply infrastructures — such as water storage, water transfers or use of alternative sources — should only be considered when other demand options have been exhausted.
Water reuse Water reuse can have two important benefits. It effectively increases the available water resources and it minimises wastewater outflow. Treated wastewater is currently reused in some southern European countries, primarily for irrigation — crop cultivation, public gardens, parks and golf courses — but also by industry. Some countries aim to
Box 5�1 Financial crisis and investing in water services and infrastructures
The current financial crisis presents risks but also opportunities to reinforce commitments to the water sector and invest in water infrastructure as part of fiscal stimulus packages (OECD, 2009). The EU and individual countries can play crucial roles in these policy areas, using public spending and grants to create and maintain necessary infrastructure, promote technological innovation and incentivise behavioural change.

26
Thematic assessment | Water resources: quantity and flows
The European environment | State and outlook 2010
increase the harvesting of rainwater and the reuse of grey water from baths, showers, washbasins and kitchens, which can be used for non-potable purposes such as watering gardens and flushing lavatories. Wastewater reuse could supply 2 % of irrigation needs in the EU-25 by 2025 and 3.5 % in Mediterranean countries (Angelakis and Durham, 2008) and should be one of the water conservation measures used. More rainwater harvesting may also be an option.
Desalination Desalination has become a fast-growing alternative to reservoirs and inter-basin transfers, particularly in Mediterranean coastal areas. Many desalination plants are either being built or planned, including one that will supply freshwater to London (EEA, 2009a). High energy consumption and the generation of brine are major environmental drawbacks. Decisions on the suitability of desalination plants need to be made on a case-by-case basis, taking into account all environmental aspects and long-term economic and technological investments, including possible links with development of renewable energy sources.
Better land management and planningLand management and land-use planning are essential to the management of water resources in water-scarce areas. Important wetlands, which help to store water, have been drained throughout Europe. One priority should be to retain rainwater where it falls, enabling water infiltration, through the re-establishment of wetlands and increased recharge of aquifers. Spending on maintaining and increasing soil organic matter would enable soils to absorb more water, as would planning and regulating the crops grown within a river basin, including changing to crops more adapted to dry conditions or growing different crops that require water at different times of the year.
Introducing energy crops should not be allowed to result in increased water use, particularly in areas of water scarcity; energy crops that have a low water demand or are drought-tolerant are clearly preferable to water-intensive crops competing with other uses for the scarce resource. (EEA, 2009a)
5�2 Mitigation of flood risks and hydro-morphological pressures
Towards sustainable flood risk management A well-informed public that knows how to prepare for a flood can reduce damage significantly. The EU Floods Directive (2007/60/EC) aims to reduce and manage the risks of floods to human health, the environment, cultural heritage and economic activity. The Directive requires Member States to assess what water courses
and coast lines are at risk from flooding, to map the possible extent of flooding and the assets and humans at risk in such areas, and to take adequate and coordinated measures to reduce the risks. All EU Member States have to develop such flood hazard and risk maps by 2013. Using hazard maps, this planning aims to limit increases in potential damage, to avoid aggravating it in risk areas, and even to reduce it in the longer term. European countries outside the EU generally have similar legislation.
Working with nature, not against itFor centuries, hard infrastructure, including bank enforcements and dykes, navigation including canals, locks, dredging and bank reinforcement, water storage reservoirs and dams, and drainage through straightening rivers and pumping canals, has been used for flood defences. All these activities are typically associated with a range of hydro-morphological alterations and adverse ecological effects. In many countries, activities in relation to the WFD and flood risk planning have been an impetus for changing the way we manage flooding to enhance the environment and protect people from the damage.
In general, measures for managing flood risk and mitigating hydro-morphological pressures that work with nature rather than against it should be promoted, such as making more room for rivers.
Sustainable flood risk management is a shift away from our predominantly hard-engineering flood defences to a river basin approach, which uses natural processes and natural systems to slow and store water in addition to measures such as flood warning, spatial planning and emergency response. Natural floodplains are allowed to flood and wetlands to act as giant sponges to soak up excess water then release it slowly back into the river. This is generally a cost-effective way of achieving many objectives, including the good status objective of the WFD and national water policies.
For many European rivers, restoring former floodplains and wetlands would both reduce flood risk and improve the ecological and quantitative status of freshwater. Opportunities to enhance the natural environment and improve its capacity to perform ecosystem services should be identified.
There are many national activities in Europe aimed at more sustainable flood management and restoring rivers. Examples include the Dutch Room for the River (Ruimtevoorderivier, 2010), the UK programme for making space for the river (DEFRA, 2008), the Swiss guiding principles for sustainable water management (BAFU, 2010; the SOER 2010 country assessment on Switzerland (EEA, 2010g)), the Austrian Stream Care

27SOER 2010
Thematic assessment | Water resources: quantity and flows
The European environment | State and outlook 2010
Scheme (Lebensministerium, 2010) and the Spanish National Strategy for Restoring Rivers (MARM, 2010). As a spin-off from national activities and EU Life funding, there have been a number of initiatives to restore European rivers and riverine habitats during the past decade. One example is the river Skjern Å in Denmark, the largest nature restoration project in Northern Europe. Over a period of 3½ years about 40 km of new watercourse have been excavated and regulated. The result is more or less a return to the river bends of the Skjern Å in 1900. Restoration work has included the removal of unnecessary dikes, pumping stations, bridges and roads costing a total of EUR 40 million.
5�3 Europe's waters require full implementation of the Water Framework Directive
To maintain and improve the essential functions of our water ecosystems, we need to manage them well. This can only succeed if we adopt the integrated approach introduced in the WFD and other water policies. Many European water bodies are at risk of failing to meet the aim of the WFD of achieving good status by 2015, due to problems in the management of water quantity, modifications of the structure of river banks and beds and the connectivity of rivers, or unsustainable flood protection measures. Full implementation of the WFD throughout all sectors is needed to resolve these potential conflicts and to commit all users in a river basin to focus on the achievement of healthy water bodies with good ecological status.
In several cases, there are co-benefits between management in relation to water use and improving ecological status. Management measures that work with nature, not against it, often result in a win-win situation. Furthermore, water saving and conservation bring additional benefits, by ensuring sufficient water for environmental needs (environmental flows) and reducing pollution discharges and energy use.
5�4 Blueprint for safeguarding European Waters
The European Commission has launched a new initiative to provide a 'Blueprint for safeguarding European
Waters' by 2012 (Barroso, 2010). The blueprint will contain the:
• assessmentoftheRiverBasinManagementPlansprovided under the Water Framework Directive;
• reviewoftheStrategyonWaterScarcityandDroughts; and
• reviewofthevulnerabilityofwaterandenvironmental resources to climate change and other man-made pressures.
In addition, the 'Europe 2020' strategy places a high focus on resource efficiency, including increasing water resource efficiency with additional benefits of less energy use for treating and transporting water and reduced water bills.
Europe has via the WFD and other water policies strong water legislation in place, and the challenge now is to see how it works in practice. In March 2010, Member States had to deliver their river basin plans for Europe's 110 river basin districts. These plans will be our key tool for achieving the objective of 'good status' for European waters by 2015. During the coming years the Commission and EEA will now assess all plans for river basin districts and this analysis will feed into the 2012 'Blueprint to safeguard EU waters'.
Rising demand from competing uses and the impacts of climate change are increasing the pressure on water resources. Increasing water efficiency and water savings will be important measures to maintain and improve the essential functions of our water ecosystems. Increased water efficiency is possible, as described in the previous sections.
EEA together with Eurostat supports the establishment and improvement of a system of water accounts where both the water uses for different environmental and economic functions and the interaction with the water ecosystems are reflected.
To maintain and improve the functions of our water ecosystems, we have to ensure sufficient water allocation (environmental flows). One of the most promising ways of placing ecosystems on the water agenda is through the economic valuation of such services.. In this way, ecosystems can be compared to other water-using sectors and internalised in decision-making processes.

28
Thematic assessment | Water resources: quantity and flows
The European environment | State and outlook 2010
References
2030 Water Resource Group, 2009. Charting our water future. Report from the 2030 Water Resource Group. www.mckinsey.com/clientservice/Water/Charting_our_water_future.aspx (accessed 13 September 2010).
ACEA, 2006. Sustainability Report 2006. ACEA, Rome, Italy. http://web.aceaspa.it/ViewDocument.aspx?catid=52790a54427a44feabddf8aa2f2a1889&lang=en&docid=86a8296b6eaf44f1a49877c33e2cc786 (accessed 13 September 2010).
Angelakis, A.N. and Durham, B., 2008. Water recycling and reuse in EUREAU countries: Trends and challenges. Desalination. 218 (1–3), 3–12.
BAFU, 2010. Flood protection and ecology of watercourses. www.bafu.admin.ch/wasser/01444/01993/index.html?lang=en (accessed 13 September 2010).
Barroso, 2010. World Water Day 2010: A red letter day for Europe's waters. Press release to speech given by President of the European Commission, José Manuel Barroso 22 March 2010. http://europa.eu/rapid/pressReleasesAction.do?reference=IP/10/336&format=HTML (accessed 13 September 2010).
Barredo, J.I., 2009. Normalised flood losses in Europe: 1970–2006. Natural Hazards and Earth System Sciences 9: 97–104.
Bates, B.C.; Kundzewicz, Z.W.; Wu, S. and Palutikof, J.P. (eds.), 2008. Climate Change and Water. Technical Paper of the Intergovernmental Panel on Climate Change, IPCC Secretariat, Geneva, 210 pp. www.ipcc.ch/pdf/technical-papers/climate-change-water-en.pdf. (accessed 13 September 2010).
BDEW, 2010. Wasserverluste_seit_1991.Diagram from Bundesverband der Energie- und Wasserwirtschaft (BDEW). www.bdew.de/bdew.nsf/id/DE_Wasserverluste_seit_1991/$file/10 %2003 %2025 %20Wasserverluste %20seit %201991-Anteile.pdf (accessed 13 September 2010).
Becker, A. and Grunewald, U. 2003. Disaster magement — flood risk in Central Europe. Science. 300 (5622): 1099–1099.
Bernauer, D. and Jansen W., 2006. Recent invasions of alien macroinvertebrates and loss of native species in the
upper Rhine River, Germany. Aquatic Invasions. Volume 1, Issue 2: 55–71.
CEFIC, 2009. Responsible Care Performance Reporting. www.cefic.be/en/responsible-care-performance-reporting.html (accessed 13 September 2010).
Chapagain, A.K.; Hoekstra, A.Y.; Savenije, H.H.G.; Gautam, R., 2006: The water footprint of cotton consumption: An assessment of the impact of worldwide consumption of cotton products on the water resources in the cotton producing countries. Ecological Economics. 60(1): 186–203.
Crostat, 2009. Statistical yearbook of the Republic of Croatia 2009, Section: Environment. p. 439. www.dzs.hr/Hrv_Eng/ljetopis/2009/00-sadrzaj.htm (accessed 13 September 2010).
Custodio, E., 2002. Aquifer overexploitation: what does it mean? Hydrogeology Journal. 10: 254–277.
Dankers, R. and Feyen, L., 2008. Climate change impact on flood hazard in Europe: An assessment based on high-resolution climate simulations. J. Geophys. Res. 113. D19105, doi:10.1029/2007JD009719.
Danube Watch, 2008. Invasion of the Danube. www.icpdr.org/icpdr-pages/dw0803_p_07.htm. (accessed 13 September 2010).
DEFRA, 2007. e-Digest Statistics about: Inland Water Quality and Use: Section Rainfall. www.defra.gov.uk/evidence/statistics/environment/inlwater/iwrainfall.htm, (accessed 13 September 2010).
DEFRA, 2008. Making space for water. www.defra.gov.uk/environment/flooding/policy/strategy/ (accessed 13 September 2010).
Dogdu, M. S. and Sagnak, C. 2008. Climate change, drought and over pumping impacts on groundwaters: Two examples from Turkey. Paper submitted to the Third International BALWOIS Conference on the Balkan Water Observation and Information System, Ohrid, the Former Yugoslav Republic of Macedonia, May 2008. http://balwois.com/balwois/administration/full_paper/ffp-1140.pdf (accessed 13 September 2010).
29SOER 2010
Thematic assessment | Water resources: quantity and flows
The European environment | State and outlook 2010
DSI, 2009. Turkey water report 2009. Report from the General Directorate Of State Hydraulic Works. www.dsi.gov.tr/english/pdf_files/TurkeyWaterReport.pdf. (accessed 13 September 2010).
Dworak, T.; Berglund, M.; Laaser, C.; Strosser, P.; Roussard, J.; Grandmougin, B.; Kossida, M.; Kyriazopoulou, I.; Berbel, J.; Kolberg, S.; Rodríguez-Díaz, J.A.; Montesinos, P., 2007. EU Water Saving Potential. European Commission report ENV.D.2/ ETU/2007/0001r. European Commission. Brussels, Belgium. http://ec.europa.eu/environment/water/quantity/pdf/water_saving_1.pdf (accessed 13 September 2010).
Dworak, T.; Elbersen, B.; van Diepen, K.; Staritsky, I.; van Kraalingen, D.; Suppit, I.; Berglund, M.; Kaphengst, T.; Laaser, C.; Ribeiro, M., 2009. Assessment of inter-linkages between bioenergy development and water availability. Ecologic. Vienna, Austria. http://ec.europa.eu/environment/water/quantity/pdf/2009Bioenergy.pdf (accessed 13 September 2010).
EA, 2008. Water Resources in England and Wales — current state and future pressures. Environment Agency, London, the United Kingdom. www.environment-agency.gov.uk/research/library/publications/100582.aspx (accessed 13 September 2010).
EA, 2009a. Water resources strategy for England and Wales. Environment Agency, London, the United Kingdom. www.environment-agency.gov.uk/research/library/publications/40731.aspx
EA, 2009b. Flooding in England: A National Assessment of Flood Risk. Environment Agency. London, the United Kingdom. http://publications.environment-agency.gov.uk/pdf/GEHO0609BQDS-E-E.pdf
EA, 2010. Opportunity and environmental sensitivity mapping for hydropower in England and Wales. Environment Agency, London, the United Kingdom. www.environment-agency.gov.uk/shell/hydropowerswf.html (accessed 13 September 2010).
EC, 2000. Water Framework Directive (WFD). Directive 2000/60/EC of the European Parliament and of the Council of 23 October 2000 establishing a framework for Community action in the field of water policy. OJ L 327, 22.12.2000, Brussels.
EC, 2002. 6th Environment Action Programme (6thEAP): Decision No 1600/2002/EC of the European Parliament and of the Council of 22 July 2002 laying down the Sixth Community Environment Action Programme. OJ, 09.09.2000. Brussels. http://eur-lex.europa.eu/LexUriServ/LexUriServ.do?uri=OJ:L:2002:242:0001:0001:EN:PDF (accessed 13 September 2010).
EC, 2005. Biomass action plan, COM (2005) 628 final{SEC(2005) 1573} Brussels, 7.12.2005. http://ec.europa.eu/energy/renewables/bioenergy/national_biomass_action_plans_en.htm (accessed 13 September 2010).
EC, 2006. Exemptions to the environmental objectives under the Water Framework Directive allowed for new modifications or new sustainable human development activities (WFD Article 4.7). Policy paper endorsed by the Water Directors. Brussels: European Commission (DG Environment).
EC, 2007a. Addressing the challenge of water scarcity and droughts in the European Union. Communication from the Commission to the European Parliament and the Council. COM(2007) 414 final, 18 July 2007. Brussels: European Commission (DG Environment). http://eur-lex.europa.eu/LexUriServ/LexUriServ.do?uri=COM:2007:0414:FIN:EN:PDF (accessed 13 September 2010).
EC, 2007b. Water Scarcity and Droughts — In-Depth Assessment — Second Interim Report. June 2007. Brussels: European Commission (DG Environment). http://ec.europa.eu/environment/water/quantity/pdf/comm_droughts/2nd_int_report.pdf (accessed 13 September 2010).
EC, 2007c. First report on the implementation of the Water Framework Directive 2000/60/EC. Commission Staff Working Document (SEC(2007) 362 final). Brussels: European Commission (DG Environment). http://ec.europa.eu/environment/water/water-framework/implrep2007/pdf/sec_2007_0362_en.pdf.
EC, 2007d. State aid/Lithuania Aid no N 842/2006. Note Brussels: European Commission (DG Agriculture). http://ec.europa.eu/agriculture/stateaid/decisions/n84206_en.pdf (accessed 13 September 2010).
EC, 2009. Directive 2009/28/EC on the promotion of the use of energy from renewable sources. http://europa.eu/legislation_summaries/energy/renewable_energy/en0009_en.htm (accessed 13 September 2010).
EC, 2010a. Second Follow-up Report to the Communication on water scarcity and droughts in the European Union. Report from the Commission to the Council and the European Parliament COM (2007) 414 final. 18.5.2010 http://eur-lex.europa.eu/LexUriServ/LexUriServ.do?uri=COM:2010:0228:FIN:EN:PDF (accessed 13 September 2010).
EC, 2010b. Cohesion Policy and Environment and climate change. http://ec.europa.eu/regional_policy/themes/environment/index_en.htm (accessed 13 September 2010).
30
Thematic assessment | Water resources: quantity and flows
The European environment | State and outlook 2010
EEA, 2005. European Environment Outlook. EEA Report No 4/2005. EEA. Copenhagen, Denmark. www.eea.europa.eu/publications/eea_report_2005_4 (accessed 13 September 2010).
EEA, 2007. Halting the loss of biodiversity by 2010: proposal for a first set of indicators to monitor progress in Europe. Technical report No 11/2007. European Environment Agency, Copenhagen, Denmark. www.eea.europa.eu/publications/technical_report_2007_11 (accessed 13 September 2010).
EEA-JRC-WHO, 2008. Impacts of Europe's changing climate — 2008 indicator-based assessment. EEA Report No 4/2008. European Environment Agency, Copenhagen, Denmark.
EEA, 2009a. Water resources across Europe confronting water scarcity and drought. EEA Report No 2/2009. European Environment Agency, Copenhagen, Denmark. www.eea.europa.eu/publications/water-resources-across-europe (accessed 13 September 2010).
EEA, 2009b. Regional climate change and adaptation — The Alps facing the challenge of changing water resources. Technical report No 8/2009. European Environment Agency, Copenhagen, Denmark. www.eea.europa.eu/publications/alps-climate-change-and-adaptation-2009 (accessed 13 September 2010).
EEA, 2010a. Mapping the impacts of natural hazards and technological accidents in Europe. EEA Technical Report in preparation.
EEA, 2010b. The European environment — state and outlook 2010: freshwater quality. European Environment Agency, Copenhagen.
EEA, 2010c. The European environment — state and outlook 2010: adapting to climate change. European Environment Agency, Copenhagen.
EEA, 2010d. The European environment — state and outlook 2010: land use. European Environment Agency, Copenhagen.
EEA, 2010e. The European environment — state and outlook 2010: consumption and the environment. European Environment Agency, Copenhagen.
EEA, 2010f. The European environment — state and outlook 2010: country assessment — Greece. European Environment Agency, Copenhagen.
EEA, 2010g. The European environment — state and outlook 2010: country assessment — Switzerland. European Environment Agency, Copenhagen.
ENDS, 2008. France unveils plan to boost hydropower. News article from ENDS Europe 24 July 2008. www.endseurope.com/15357?referrer=search (accessed 13 September 2010).
Eurelectric, 2009. Key Statistics 2008. Report from Eurelectric. www2.eurelectric.org/content/Default.asp?PageID=618 (accessed 13 September 2010).
FOEN, 2010. Core indicator: Structure of watercourses. Federal Office for the Environment. Bern, Switzerland. www.bafu.admin.ch/umwelt/indikatoren/08525/08586/index.html?lang=en (accessed 13 September 2010).
García-Herrera, R., 2007. The Outstanding 2004/05 Drought in the Iberian Peninsula: Associated Atmospheric Circulation. Journal of Hydrometeorology. 8(3). Boston, USA.
Glaser, R. and Stangl, H., 2003. Historical floods in the Dutch Rhine Delta. Natural Hazards and Earth System Sciences. 3: 605–613. Cpernicus Publications. Göttingen, Germany.
Gouvernement, 2008. Un plan de relance de la production hydraulique française. News article 23 July 2008. www.gouvernement.fr/gouvernement/un-plan-de-relance-de-la-production-hydraulique-francaise (accessed 13 September 2010).
Hisdal, H.; Holmqvist, E.; Jónsdóttir, J.F.; Jónsson, P.; Kuusisto, E.; Lindström, G.; Roald, L., 2010. Has streamflow changed in the Nordic countries? Report No. 1 2010, NVE. www.nve.no/Global/Publikasjoner/Publikasjoner%202010/Report%202010/report1-10.pdf (accessed 29 September 2010).
ICPDR, 2010. Dams and Structures. International Commission for the Protection of the Danube River. Vienna www.icpdr.org/icpdr-pages/dams_structures.htm (accessed 13 September 2010).
ICPR, 2009. Biological monitoring programme for the Rhine river 2006 / 2007, part I: Summary report on the quality components phytoplankton, macrophytes / phytobenthos, macrozoobenthos, fish. Report from the International Commission for the Protection of the Rhine. Koblenz. www.iksr.org/fileadmin/user_upload/Dokumente_en/Reports/Bericht_168_e.pdf (accessed 13 September 2010).
IKSE, 2004. Dokumentation des Hochwassers vom August 2002 im Einzugsgebiet der Elbe. Internationale Kommission zum Schutz der Elbe. Magdeburg, Germany. www.ikse-mkol.org/index.php?id=81&L=0 (accessed 13 September 2010).
INE, 2008. Estadísticas e indicadores del agua (Water statistics and indicators). Briefing from Instituto Nacional

31SOER 2010
Thematic assessment | Water resources: quantity and flows
The European environment | State and outlook 2010
de Estadística. www.ine.es/revistas/cifraine/0108.pdf (accessed 13 September 2010).
INE, 2010. Water Statistics. Indicators on water por main indicators. Table from Instituto Nacional de Estadística. www.ine.es/jaxi/tabla.do?path=/t26/p069/p03/l1/&file=01001.px&type=pcaxis&L=1 (accessed 13 September 2010).
Katemerini, 2010. Court suspends Acheloos works. News article 11 February 2010. http://ekathimerini.com/4Dcgi/4Dcgi/_w_articles_politics_1100011_11/02/2010_114822 (accessed 13 September 2010).
Kraft Foods, 2010. Working to build a better world. Responsibility report. Kraft Foods. USA www.kraftfoodscompany.com/SiteCollectionDocuments/pdf/kraftfoods_responsibility_report.pdf (accessed 13 September 2010).
Kundzewicz, Z.W.; Graczyk, D.; Maurer; T.; Pi skwar; I.; Radziejewski; M.; Svensson; C.; Szwed, M., 2005. Annual maximum flow. Trend detection in river flow series: 1. Hydrological Sciences Journal. 50 (5): 797–810. Wallingford, the United Kingdom.
Kuusisto, 2004. Droughts in Finland — past, present and future. Paper presented at Hydrology Days 2004. http://hydrologydays.colostate.edu/Papers_2004/Kuusisto_Paper.pdf (accessed 13 September 2010).
Lebensministerium, 2010. Wassernet: Running waters — Rivers and brooks. Vienna, Austria. www.wassernet.at/article/articleview/67691/1/1460 (accessed 13 September 2010).
Leuven, R.S.E.W.; van der Velde, G.; Baijens, I. Snijders, J.; van der Zwart, C.; Lenders, H.J.R. and bij de Vaate, A., 2009: The river Rhine: a global highway for dispersal of aquatic invasive species. Biological Invasions. Vol. 9. No.11, 1 989–2 008, doi:10.1007/s10530-009-9491-7. Springer-Verlag GmbH, Heidelberg. Germany.
Macklin, M. G. and Rumsby, B. T., 2007. Changing climate and extreme floods in the British Uplands. Transactions of the Institute of British Geographers. 32 (2): 168–186. Wiley-Blackwell. Oxford, the United Kingdom.
MARM, 2008. Libro Digital del Agua (Digital Water Atlas) Section Análisis económicos. http://servicios3.mma.es/siagua/visualizacion/lda/economico/recuperacion_precios_agricultura.jsp (accessed 13 September 2010).
MARM/BPIA, 2009. Public Bank Environmental Indicators (BPIA) — Irrigation indicator. Factsheet www.mma.es/secciones/calidad_contaminacion/
indicadores_ambientales/banco_publico_ia/pdf/AGRSuperficieRegadio.pdf (accessed 13 September 2010).
MARM, 2010. Estrategia Nacional de Restauración de Ríos. www.mma.es/portal/secciones/acm/aguas_continent_zonas_asoc/dominio_hidraulico/conserv_restaur/index.htm (accessed 13 September 2010).
MMA, 2007. El agua en la Economía Española: situación y perspectivas. Report from Ministerio de Medio Ambiente. Madrid, Spain. www.fundacion-biodiversidad.info/ciclodelagua/production/usoagua_economia_espanola.pdf (accessed 13 September 2010).
MoA and MoE, 2007. Report on the state of water management in the Czech Republic in 2007. Report from the Czech Ministry of Agriculture and Ministry of Environment. www.mzp.cz/en/report_state_water (accessed 13 September 2010).
Mudelsee, M.; Börngen, M., Tetzlaff, G.; Grünewald, U., 2003. No upward trends in the occurrence of extreme floods in Central Europe. Nature. 425: 166–169. London, the United Kingdom.
NSO, 2006. Environment statistics 2006: National Statistical Office, Malta. www.nso.gov.mt/statdoc/document_view.aspx?id=1649&backurl=/themes/theme_page.aspx (accessed 15 September 2010).
NVE, 2003. Tørrårsberegninger. Report no 10 from Norges vassdrags- og energidirektorat (in Norwegian). Oslo, Norway. www.nve.no/Global/Publikasjoner/Publikasjoner %202003/Oppdragsrapport %20A %202003/Trykkefil %20oppdr. %20A %2010-03.pdf (accessed 15 September 2010).
OECD, 2008. Environmental Outlook to 2030: OECD, Paris, France. www.oecd.org/document/20/0,3343,en_2649_34305_39676628_1_1_1_1,00.html (accessed 15 September 2010).
OECD, 2009. Managing Water for All — an OECD perspective on pricing and financing — key messages for policy makers. OECD. Paris, France. www.oecd.org/dataoecd/53/34/42350563.pdf. (accessed 15 September 2010).
Plan Bleu, 2005. Water. Benoît, G.and Comeau, A. (eds.) in A Sustainable Future for the Mediterranean. The Blue Plan's Environment and Development Outlook. Earthscan. London, the United Kingdom. www.planbleu.org/red/pdf/Partie2-Eau_uk.pdf (accessed 15 September 2010).
PNBEPH, 2008. Programa Nacional de Barragens com Elevado Potencial Hidroeléctrico. http://pnbeph.inag.pt/np4/home.html (accessed 15 September 2010).
32
Thematic assessment | Water resources: quantity and flows
The European environment | State and outlook 2010
Pinter, N.; Ickes, B.S.; Wlosinski, J.H.; van der Ploeg, R.R., 2006. Trends in flood stages: Contrasting results from the Mississippi and Rhine River systems. Journal of Hydrology. 331: 554–566. Elsivier B.V., Netherlands.
Raskin, P.; Gleick, P. H.; Kirshen, P.; Pontius, R. G. Jr; and Strzepek, K., 1997. Comprehensive assessment of the freshwater resources of the world. Stockholm Environmental Institute, Sweden. Document prepared for the fifth session of the United Nations Commission on Sustainable Development, 1997.
Ruimtevoorderivier, 2010. Homepage for the Dutch project 'Room for the River'. www.ruimtevoorderivier.nl/meta-navigatie/english.aspx (accessed 15 September 2010).
Scottish Government, 2010. The Employment Potential of Scotland's Hydro Resource. Study report from the Scottish Government. www.scotland.gov.uk/Publications/2010/01/19141527/0 (accessed 15 September 2010).
Silander, J.; Vehviläinen, B.; Niemi, J.; Arosilta, A.; Dubrovin, T.; Jormola, J.; Keskisarja, V.; Keto, A.; Lepistö, A.; Mäkinen, R.; Ollila, M.; Pajula, H.; Pitkänen, H.; Sammalkorpi, I.; Suomalainen, M. and Veijalainen, N., 2006. Climate change adaptation for hydrology and water resources. FINADAPT Working Paper 6, Finnish Environment Institute Mimeographs. 336. 52 pp. Helsinki, Finland. www.miljo.fi/download.asp?contentid=53794&lan=EN (accessed 15 September 2010).
SIWI, 2009. Securing Water for Ecosystems and Human Well-being: The Importance of Environmental Flows. Swedish Water House (SWH). Stockholm, Sweden. www.siwi.org/documents/Resources/Reports/Report24_E-Flows-low-res.pdf (accessed 15 September 2010).
Statistics Denmark, 2006. StatBank Denmark. Table VAND1: Consumption of drinking water by region and use. www.statistikbanken.dk/statbank5a/default.asp?w=1280 (accessed 15 September 2010).
Sušnik A. and Kurnik B., 2005: Agricultural Drought Management: Status and Trends in Slovenia. ICID 21st European Regional Conference 2005. www.zalf.de/icid/ICID_ERC2005/HTML/ERC2005PDF/Topic_4/Susnik.pdf (accessed 15 September 2010).
Tallaksen, 2007. Tørke–også i ikke-tørrestrøk? Presentation at Faglig-Pedagogisk Dag 2007. www.geo.uio.no/for_skolen/ (accessed 15 September 2010).
Umweltbundesamt, 2006. Water Resource Management in Germany, Part 1 — Fundamentals. Report from Umweltbundesamt and, Dessau. www.umweltbundesamt.de/uba-info-medien/mysql_medien.php?anfrage=Kennummer&Suchwort= 3770 (accessed 15 September 2010).
Umweltbundesamt, 2009. Daten zur Umwelt: Gewässerstruktur. www.umweltbundesamt-daten-zur-umwelt.de/umweltdaten/public/theme.do?nodeIdent=2393 (accessed 15 September 2010).
Unilever. 2010. Water use in manufacturing. Web-site on sustainability. www.unilever.com/sustainability/environment/water/performance/?WT.LHNAV=Our_manufacturing_performance (accessed 15 September 2010).
Vewin. 2008. Prognose landelijke drinkwatervraag t/m 2025. Rijswijk, Netherlands. www.vewin.nl/SiteCollectionDocuments/Publicaties/Overige %20Vewin-uitgaven/2008/Prognose %20landelijke %20drinkwatervraag %202025.pdf (accessed 15 September 2010).
World Bank, 2003. Water resources in Europe and Central Asia. Volume II. Country Water Notes and Water Fact Sheets. Washington DC, USA. http://siteresources.worldbank.org/INTALBANIA/Resources/Water_Resources_Management_in_South_Eastern_Europe-Volume_Two.pdf (accessed 15 September 2010).
World Bank, 2007. World Bank Supports Irrigation Rehabilitation and Reform in Romania. Press Release No. 2004/38/ECA.
World Bank, 2009. Environmental Flows in Water Resources Policies, Plans, and Projects. Report from World Bank, Washington DC, USA. http://siteresources.worldbank.org/INTWAT/Resources/Env_Flows_Water_v1.pdf (accessed 15 September 2010).
WWF, 2010. Justice for Acheloos. News item at the WWF Greeece web-site www.wwf.gr/en/index.php?option=com_content&view=article&id=659:justice-for-acheloos&catid=70:2008-09-16-12-10-46&Itemid=90 (accessed 15 September 2010).


European Environment AgencyKongens Nytorv 61050 Copenhagen KDenmark
Tel.: +45 33 36 71 00Fax: +45 33 36 71 99
Web: www.eea.europa.euEnquiries: www.eea.europa.eu/enquiries
TH
‑30‑1
0‑5
58‑E
N‑N
doi:1
0.2
800/5
9600