THEMATIC REPORT ON THE OLDER POPULATION
176
The 2014 Myanmar Population and Housing Census THEMATIC REPORT ON THE OLDER POPULATION Census Report Volume 4-L Department of Population Ministry of Labour, Immigration and Population With technical assistance from UNFPA SEPTEMBER 2017 The Republic of the Union of Myanmar
-
Upload
khangminh22 -
Category
Documents
-
view
3 -
download
0
Transcript of THEMATIC REPORT ON THE OLDER POPULATION

The 2014 Myanmar Population and Housing Census
THEMATIC REPORT ON THE OLDER POPULATION
Census Report Volume 4-L
Department of PopulationMinistry of Labour, Immigration and Population
With technical assistance from UNFPA
SEPTEMBER 2017
The Republic of the Union of Myanmar


The 2014 Myanmar Populationand Housing Census
THEMATIC REPORT ON THE OLDER POPULATION
Census Report Volume 4-L
For more information contact:
Department of PopulationMinistry of Labour, Immigration and Population
Office No. 48, Nay Pyi Taw, MYANMAR
Tel: +95 67 431 062www.dop.gov.mm
SEPTEMBER 2017


Census Report Volume 4-L – The Older Population I
Figure 1 Map of Myanmar by State/Region and District
Kachin
Sagaing
Chin
Magway
Kayin
ShanMandalay
Ayeyawady
Kayah
Rakhine
Tanintharyi
Mon
Yangon
Bago
Nay Pyi Taw
Putao
Hkamti
Myitkyina
LoilinMindat
Kyaukme
Katha
Myeik
Taunggyi
Bago
Minesat
Dawei
LashioShwebo
Mohnyin
Thayet
Kalay
Bhamo
Pyay
Linkhe`
Minbu
FalamMuse
Pathein
Haka
Magway
Kengtung
Makman
Mawlaik
Pakokku
Loikaw
Hopan
Toungoo
Thandwe
Hpa-an
Myauk U
Kawkareik
Pharpon
Kyaukpyu
Hinthada
Yinmarpin
Gangaw
Myingyan
Pyin Oo Lwin
Kawthoung
Thaton
Meiktila
Thayawady
Phyapon
Maubin
BawlakheHpa-an
Minephyat
Kyaukse
Mawlamyine
Tachileik
Monywa
Tamu
Maungtaw
North Yangon
Sagaing
Myawady
Yame`thin
Myaungmya
Ottara (North)
Dekkhina (South)
Laukine
South Yangon
Kunlon
Nyaung U
Mandalay
Sittway
Labutta
102°0'0"E
102°0'0"E
99°0'0"E
99°0'0"E
96°0'0"E
96°0'0"E
93°0'0"E
93°0'0"E
90°0'0"E
90°0'0"E
27°0
'0"N
27°0
'0"N
24°0
'0"N
24°0
'0"N
21°0
'0"N
21°0
'0"N
18°0
'0"N
18°0
'0"N
15°0
'0"N
15°0
'0"N
12°0
'0"N
12°0
'0"N
±1 cm = 53 km
0 300 600150 KilometersProduced by: Department of Population
Legend
State and Region boundaries
District boundaries

Census Report Volume 4-L – The Older PopulationII
Foreword
The 2014 Myanmar Population and Housing Census (2014 Census) was conducted with midnight of 29 March 2014 as the reference point. This is the first Census in 30 years; the last Census was conducted in 1983. Planning and execution of this Census was spearheaded by the former Ministry of Immigration and Population, now the Ministry of Labour, Immigration and Population, on behalf of the Government, in accordance with the Population and Housing Census Law, 2013. The main objectives of the 2014 Census are to provide the Government and other stakeholders with essential information on the population, regarding demographic, social and economic characteristics, and housing conditions and household amenities. By generating information at all administrative levels, it is also intended to provide a sound basis for evidence-based decision-making and to evaluate the impact of social and economic policies and programmes in the country.
The results of the 2014 Census have been published to date in a number of volumes. The first was the Provisional Results (Census Report Volume 1), which was released in August 2014. The Census Main Results were launched in May 2015. These included The Union Report (Census Report Volume 2), Highlights of the Main Results (Census Report Volume 2-A), and the reports for each of the 15 States and Regions (Census Report Volume 3[A -O]). The reports on Occupation and Industry (Census Report Volume 2-B) and Religion (Census Report Volume 2-C) were launched in March 2016 and July 2016, respectively.
The current set of 2014 Census publications comprises thirteen thematic reports and a Census Atlas. They address issues on Fertility and Nuptiality; Mortality; Maternal Mortality; Migration and Urbanization; Population Projections; Population Dynamics; the Older Population; Children and Youth; Education; Labour Force; Disability; Gender Dimensions; and Housing Conditions and Household Amenities. Their preparation involved collaborative efforts with both local and international experts as well as various Government Ministries, Departments and research institutions. The thematic reports published to date include: Fertility and Nuptiality; Mortality; Maternal Mortality; Migration and Urbanization; Population Dynamics; Population Projections; the Labour Force; Education; Housing Conditions and Household Amenities; Gender Dimensions; and Disability.
Data capture of the Census was undertaken using scanning technology. The processes were highly integrated, with tight controls to guarantee accuracy of results. To achieve internal consistency and minimize errors, rigorous data editing and validation were carried out to facilitate further analysis of the results. The information presented in these reports is therefore based on more cleaned data sets, and the reader should be aware that there may be some small differences from the results published in the first set of volumes. In such instances, the data in the thematic reports should be preferred.
The 2030 Sustainable Development Agenda calls for all governments to ‘leave no one behind’. Most of the Sustainable Development Goals (SDGs) specifically mention the importance of eliminating discrimination and increasing opportunities ‘for all’ or for ‘all ages’. These include ending poverty for all; the right to health ‘for all at all ages’; promoting lifelong learning; encouraging the development of sustainable, inclusive, and accessible urban environments, including for ‘older persons’; and the production and use of age-disaggregated data to monitor the SDGs.

Census Report Volume 4-L – The Older Population III
Myanmar is committed to providing for the economic, health and social needs of older people. This has been stipulated in the 2008 Constitution, which states ‘the Union shall care for mothers and children, orphans, fallen Defence Services personnel’s children, the aged and the disabled.’ This has been reiterated in the National Social Protection Strategic Plan and the National Action Plan on Ageing which were both approved in 2014.
With the older population growing at 2.4 per cent, a rate faster than the rate of growth of the total population (1.4 per cent), and where this growth of the older population will result in more older people than children by 2050 (12.9 million children aged 0 to 14 against 13.1 million people aged 60 years old and over), the Government of Myanmar must prepare and provide the means for a supportive environment for older persons such as social protection; affordable access to basic primary health care services; sufficient universal social pension schemes; work opportunities for those who wish to continue working; and other infrastructure that will ensure their well-being and facilitate their physical and social activities.
The 2014 Census also shows that the urban population was slightly older than the rural population. The proportion of the older population in urban areas is 9.2 per cent while it is 8.8 per cent in rural areas. This is the result of a more rapid decline in urban fertility, offset by net migration to urban areas by youth and young adults. Furthermore, the Census has indicated that there are more older females than older males - 2.6 million against 1.9 million, or a sex ratio of 75 older males for every 100 females aged 60 years and over. On the other hand, the younger age group (0-59 years old) recorded only 95 males per 100 females. Among States/Regions, differentials exist on the extent of ageing. Mayway Region recorded the highest proportion of the older population at 10.8 per cent of its population while Kayah State recorded the lowest at 6 per cent.
The information from the Census, which includes differentials across groups of population, as well as their geographical distribution allows for the development of policies and programmes that will directly target older people, especially those who are poor and vulnerable, to improve the quality of health and social services for this segment of the population.
On behalf of the Government of Myanmar, I wish to thank the teams at the Department of Population, the United Nations Population Fund (UNFPA) and the authors for their contribution towards the preparation of this thematic report. I would also like to thank our development partners, namely; Australia, Finland, Germany, Italy, Norway, Sweden, Switzerland, and the United Kingdom for their support to undertake the Census, as well as the technical support provided by the United States of America.
H.E U Thein SweMinister of Labour, Immigration and PopulationThe Republic of the Union of Myanmar
Foreword

Census Report Volume 4-L – The Older PopulationIV
Table of Contents
Foreword / II
List of Tables / VII
List of Figures / X
List of Tables in Appendices / XII
List of Acronyms / XIV
Executive summary / XV
1. Introduction / 1
1.1 Background to the report / 2
1.2 Definition of the older population / 2
1.3 Previous research on older people in Myanmar / 3
1.4 Aim and objectives / 3
1.5 Report structure / 4
2. Methodology and data quality assessment / 5
2.1 Sources of data and their limitations / 5
2.2 Assessment of data quality for the older population / 6
3. Demographic change and the older population in Myanmar / 9
3.1 Population ageing in Myanmar / 9
3.1.1 The size and growth of the older population / 9
3.1.2 Measures of age dependency of the total population / 9
3.1.3 Population ageing in urban and rural areas / 11
3.1.4 Age and sex composition within the older population / 12
3.2 The determinants of population ageing / 13
3.3 Projecting the future older population / 15
3.3.1 Limitations of projections / 18
3.4 Myanmar’s population ageing compared to other ASEAN countries / 19
3.5 Summary / 21
4. Social characteristics of older persons / 22
4.1 Place of residence and residential mobility / 23
4.1.1 Urban - rural distribution of the older population / 23
4.1.2 Older people’s migration within Myanmar / 25
4.2 Marital status and numbers of living children / 28
4.2.1 Childlessness among older women / 30
4.3 Literacy and educational attainment / 32
4.4 Summary / 36

Census Report Volume 4-L – The Older Population V
Table of Contents
5. Living arrangements of the older population / 38
5.1 Older people living in institutions / 38
5.2 Household composition / 39
5.3 Children who co-reside with their parents / 44
5.4 Summary / 46
6. Economic conditions of the older population. / 47
6.1 Main activities of the older population / 47
6.1.1 Unpaid work by the older population / 48
6.1.2 Labour force participation of the older population / 49
6.1.3 Occupations of the employed older population / 51
6.1.4 Industry / 53
6.2 Quality of housing and access to facilities / 54
6.3 Household size and wealth / 56
6.4 Summary / 58
7. Health and life expectancy in old age. / 60
7.1 Mortality / 60
7.2 Disability / 62
7.2.1 Prevalence of disability from the 2014 Census / 63
7.2.2 Other estimates of disability and health among the older population / 66
7.2.3 Living arrangements and economic conditions of older people with disabilities / 67
7.2.4 Calculations based on disability prevalence / 69
7.3 Summary / 71
8. Regional variations in ageing / 73
8.1 Population ageing / 73
8.1.1 Indicators of population ageing / 74
8.1.2 Population ageing from 1983 to 2050 / 77
8.2 Regional variations in the social and economic characteristics of the older population / 78
8.2.1 Marital status / 78
8.2.2 Number of living children / 80
8.2.3 Household composition / 81
8.2.4 Housing quality and amenities / 84
8.2.5 Formal education and literacy / 88
8.2.6 Main/usual activity of the older population / 90
8.3 Summary / 92

Census Report Volume 4-L – The Older PopulationVI
9. Policy challenges and implications / 94
9.1 Challenges in supporting the current and future older population / 94
9.2 Evidence-based policies to support the older population / 97
9.2.1 International declarations / 97
9.2.2 Policies and programmes / 98
9.2.3 Income security / 98
9.2.4 Health and health care / 99
9.3 Government of Myanmar approaches / 100
9.3.1 Income security / 100
9.3.2 Older people care services and residential facilities / 101
9.3.3 Health care services / 101
9.3.4 Participation of older people / 102
9.4 Summary / 102
10. Recommendations and conclusions / 104
10.1 Recommendations / 104
10.1.1 Recommendations for policy / 104
10.1.2 Recommendations for further research / 104
10.1.3 Recommendations for future censuses / 105
10.2 Conclusion / 105
References / 107
Glossary of terms and definitions / 111
Appendices / 115
Appendix 1. Appendix tables / 116
List of contributors 151
Table of Contents

Census Report Volume 4-L – The Older Population VII
List of Tables
2.1 Whipple’s Index for ages 23-62 and 63-92 by sex, urban and rural areas, 1983 and 2014 censuses / 8
3.1 Indicators of population ageing, size and growth of broad age groups, 1973, 1983 and 2014 censuses / 9
3.2 Indicators of population ageing, 1973, 1983, and 2014 censuses / 10
3.3 Indicators of population ageing, urban and rural areas, 1983 and 2014 censuses / 12
3.4 Relative size and growth rate of the older population by five-year age group, 1973, 1983 and 2014 censuses / 12
3.5 Projected growth of the total and older population, 2015-2050, medium variant / 16
3.6 Projected indicators of population ageing by urban and rural areas, 2015-2050, medium variant / 17
3.7 Indicators of population ageing for ASEAN countries compared to Myanmar, circa 2015 / 19
3.8 Projected indicators of population ageing in 2050 for Myanmar and other ASEAN countries / 20
4.1 Birth cohorts of the older population in 2014 and 1983, by timing of significant ages and historical events / 23
4.2 Percentage of the population living in urban areas by functional age group by sex by age groups within the older population, 1983 and 2014 censuses / 24
4.3 Older persons living in conventional households by area of usual residence and birthplace, 2014 Census / 26
4.4 Percentage of population 15 years old and over by marital status by broad age groups by sex, 2014 Census / 28
4.5 Percentage of women never married aged 40 and over by five-year age group, urban and rural areas, 2014 Census / 30
4.6 Percentage of older women’s children living and living in the same household by broad age group, urban and rural areas, 2014 Census / 32
4.7 Population aged 15-59 and 60 and over by age by sex by literacy status by level of education, 2014 Census / 34
4.8 Population aged 15-59 and 60 and over by literacy status by level of education, urban and rural areas, 2014 Census / 35
4.9 Number and percentage of literate population aged 60 and over living in conventional households by sex, 1983 and 2014 censuses / 36
5.1 Number and percentage of people enumerated in an institution by sex by functional age group, 2014 Census / 39
5.2 Percentage of household heads aged 60 and over living in conventional households by household composition by sex, 2014 Census / 40
5.3 Percentage of household heads aged 60 and over by household composition, urban and rural areas, 2014 Census / 42
5.4 Percentage of household heads aged 60 and over by household composition by marital status, 2014 Census / 42
5.5 Percentage of ever-married women aged 60 and over who are household heads by household composition by number of living children, urban and rural areas, 2014 Census / 43

Census Report Volume 4-L – The Older PopulationVIII
List of Tables
5.6 Percentage of adults aged 40-59 in conventional households who are residing with their parents or parent-in-laws, by sex by marital status by level of education, urban and rural areas, 2014 Census / 44
5.7 Percentage of adults aged 40-59 classified as the child or daughter/son-in-law of the household head by marital status by level of education by sex, urban and rural areas, 2014 Census / 45
6.1 Percentage of population 60 years and over who reported being retired, by sex by age group, urban and rural areas, 2014 Census / 48
6.2 Proportion of older population and prime working aged adults whose main activity is ‘contributing family worker’ or ‘household worker’ by sex by age group, urban and rural areas, 2014 Census / 49
6.3 Labour force participation of the population aged 15-59 and 60 and over by sex, 2014 Census / 50
6.4 Percentage of employed persons aged 15-59 and 60 and over, by occupation by sex, urban and rural areas, 2014 Census / 52
6.5 Percentage of employed population aged 15-59 and 60 and over by occupation by sex, 1983 census / 53
6.6 Percentage of employed people in prime working ages and older people by industry group, 1983 and 2014 censuses / 54
6.7 Summary of housing conditions and amenities, by households with and without an older member, urban and rural areas, 2014 Census / 56
6.8 Percentage of households with and without an older member by wealth quintile and number of persons in the household, 2014 Census / 57
6.9 Percentage of households with and without an older member by wealth quintile and number of prime aged workers (15-59) in the household, 2014 Census / 58
7.1 Number and percentage of population aged 60 and over by domain of disability by sex, urban and rural areas, 2014 Census / 64
7.2 Comparison of disability measures for the population aged 60 and over from the 2014 Census and the 2012 Survey of Older Persons / 67
7.3 Percentage of household heads aged 60 and over by household composition, degree of disability, urban and rural areas, 2014 Census / 68
7.4 Percentage of population aged 60 and over in conventional households by degree of disability, wealth quintiles, urban and rural areas, 2014 Census / 69
7.5 Estimates of disability-free life expectancy for the older population, 2014 Census / 71
8.1 Percentage of the total and older population by State/Region, 2014 Census / 73
8.2 Indicators of population by State/Region, 2014 Census / 75
8.3 Annual growth rates for the total and older population between 1983 and 2014 by State/Region, 2014 Census / 77
8.4 Projected population and annual growth rate of persons aged 60 years old and over from 2015 to 2030 by State/Region / 78
8.5 Proportion of household heads 60 years old and over by living arrangement, urban and rural areas, State/Region, 2014 Census / 83
8.6 Percentage of older population by type of housing units they are staying in, urban and rural areas, State/Region, 2014 Census / 85
8.7 Percentage of population aged 60 and over living in conventional households whose main source of lighting is electricity, urban and rural areas, State/Region, 2014 Census / 86

Census Report Volume 4-L – The Older Population IX
List of Tables
8.8 Percentage of population living in a conventional household with electricity in their house as main source of lighting by functional age group by State/Region, 2014 Census / 86
8.9 Percentage of older people living in a household with access to improved sanitation, urban and rural areas, State/Region, 2014 Census / 87
8.10 Percentage of population aged 60 and over who have never attended school by sex, urban and rural areas, State/Region, 2014 Census / 89
8.11 Literacy rates for youth and the older population by State/Region, 2014 Census / 90
8.12 Percentage of older population by main/usual activity, State/Region, 2014 Census / 91

Census Report Volume 4-L – The Older PopulationX
List of Figures
1 Map of Myanmar by State/Region and District / I
2.1 Sex ratios by five-year age group from 50 to 90 years and over, 1973, 1983 and 2014 censuses / 7
2.2 Age-sex pyramid by single year of age, 2014 Census / 7
3.1 Numbers of persons aged 60 and over by sex, 1973, 1983 and 2014 censuses / 13
3.2 Percentage of the older population by broad age groups, urban and rural areas, 1983 and 2014 censuses / 13
3.3 Population pyramid showing 1973, 1983 and 2014 populations / 15
3.4 Projected numbers of people in functional age groups, 2015-2050, medium variant / 16
3.5 Projected population by functional age groups for Myanmar and other ASEAN countries, 2015, 2035 and 2050 / 20
4.1 Percentage of population by functional age groups, urban and rural areas, 1983 and 2014 censuses / 25
4.2 Percentage of population by functional age groups, by sex, urban area, 1983 and 2014 censuses / 25
4.3 Percentage of population 40 years old and over living in conventional households by age and movement within and between State/Region, 2014 Census / 27
4.4 Recent migration rates for population 40 years and over living in conventional households, by age by sex, 2014 Census / 27
4.5 Percentage of older population by five-year age group by sex, 2014 Census / 29
4.6 Percentage of older population by marital status by sex, 1983 and 2014 censuses / 29
4.7 Questions 25 to 31 of the Questionnaire, 2014 Census / 30
4.8 Percentage of women aged 60 and over by number of living children, urban and rural areas, 2014 Census / 31
4.9 Percentage of population 60 years old and over by educational attainment by sex, 1983 and 2014 censuses / 36
5.1 Percentage of household heads aged 60 and over by household composition by sex by age, 2014 Census a) Male b) Female / 41
6.1 Percentage of prime working age (15-59) persons and the older population by main activity in the past 12 months by age group, 2014 Census / 48
6.2 Labour force participation rates by age by sex, 2014 Census / 51
7.1 Survival ratios for five more years, population aged 55 to 79 by sex, urban and rural areas, 2014 / 61
7.2 Life expectancy at age 60 for ASEAN countries a) Male b) Female / 62
7.3 Percentage of older population reporting four domains of disability by age group by sex, 2014 Census / 65
7.4 Percentage of population aged 60 and over with moderate and severe disabilities by age by sex, urban and rural areas, 2014 Census / 66
7.5 Estimates of the effect of population ageing on the absolute number of persons with a disability for aged 60 and over, 2015, 2035 and 2050 / 70
8.1 Population aged 60 and over, urban and rural areas, State/Region, 2014 Census / 74
8.2 Percentage of population 60 years and over, urban and rural areas, State/Region, 2014 Census / 75
8.3 Map of the older age dependency ratio by District, 2014 Census / 76
8.4 Percentage of older population, by marital status by sex, State/Region, 2014 Census a) Male b) Female / 79

Census Report Volume 4-L – The Older Population XI
List of Figures
8.5 Percentage of older women in conventional households by number of living children, State/Region, 2014 Census / 80
8.6 Population of household heads aged 60 years and over by household composition, State/Region, 2014 Census a) Male b) Female / 81
8.7 Proportion of population aged 60 and over by type of housing, State/Region, 2014 Census / 84
8.8 Ranking of State/Region by indicators of material comfort for older people, 2014 Census / 88
8.9 Percentage of older persons living in conventional households who are literate, urban and rural areas, State/Region, 2014 Census / 89
8.10 Labour force participation rates of older population by sex, urban and rural areas, State/Region, 2014 Census a) Male b) Female / 92

Census Report Volume 4-L – The Older PopulationXII
List of Tables in Appendices
1 Population by sex by five-year age group by functional age groups, 1973, 1983 and 2014 censuses / 116
2 Population by functional age groups and age groups within the older population by sex, urban and rural areas, 1983 and 2014 censuses / 117
3 Population projections for ASEAN countries from medium variant of World Population Prospects, 2015, 2035 and 2050 / 118
4 Distribution of older population living in conventional households by area of usual residence and area of birthplace, by age by sex, 2014 Census / 119
5 Recent migration of population 40 years old and over by sex by age group, 2014 Census / 120
6 Population 15 years old and over by marital status by age group by sex, 2014 Census / 121
7 Number of older women by total number of living children and number of children living in the same household, by broad age group, urban and rural areas, 2014 Census / 122
8 Population 60 years old and over by literacy status by level of education by sex, 1983 and 2014 censuses / 123
9 Household heads aged 60 and over by household composition by age by sex, 2014 Census / 124
10 Population aged 40-59 in conventional households classified as living with a parent or parent-in-law by household headship by sex by marital status by level of education, urban and rural areas, 2014 Census / 125
11 Population aged 15 years and over by main/usual activity by sex by age group, urban and rural areas, 2014 Census / 126
12 Percentage of population aged 15 years and over by main activity in the past 12 months, by sex by age group, urban and rural areas, 2014 Census / 129
13 Distribution of prime working age and older population by industry group by sex, 2014 and 1983 censuses / 132
14 Number of households by presence of older members, selected housing/household conditions, urban and rural areas, 2014 Census / 133
15 Wealth quintiles of households with and without an older member, by household size by number of employed members aged 15-59, 2014 Census / 135
16 Number and percentage of persons 15 years old and over by degree of disability by age group by sex, urban and rural areas, 2014 Census / 136
17 Calculation of disability-free life expectancy for older population / 139
18 Population by functional age groups, urban and rural areas, State/Region, 2014 Census / 140
19 Percentage of population by functional age groups and older age dependency ratio, State/Region, District, 2014 Census / 141
20 Percentage of population aged 60 and over by sex by marital status, urban and rural areas, State/Region, 2014 Census / 143
21 Number and percentage of women aged 60 and over living in conventional households by number of living children, State/Region and District, 2014 Census / 144
22 Number and percentage of population aged 60 and over by type of housing, urban and rural areas, State/Region, 2014 Census / 146

Census Report Volume 4-L – The Older Population XIII
List of Tables in Appendices
23 Number and percentage of older persons who never attended school by sex, urban and rural areas, State/Region, 2014 Census / 147
24 Number and percentage of older persons living in conventional households who are literate, by sex, urban and rural areas, State/Region, 2014 Census / 148
25 Percentage of population aged 60 and over by main activity, by sex, urban and rural areas, State/Region, 2014 Census / 149

Census Report Volume 4-L – The Older PopulationXIV
ASEAN Association of Southeast Asian Nations GDP Gross domestic productLao PDR Lao People’s Democratic RepublicLPG Liquefied petroleum gasMSWRR Ministry of Social Welfare, Relief and Resettlement NCDs Non-communicable diseasesNGOs Non-governmental organizationsSDGs Sustainable Development GoalsTFR Total fertility rateUN United NationsUN DESA United Nations Department of Economic and Social AffairsUNFPA United Nations Population FundWHO World Health Organization
List of Acronyms

Census Report Volume 4-L – The Older Population XV
Executive summary
The world’s population is rapidly ageing as a consequence of declining fertility and mortality. The number of older people, defined as those aged 60 and over, has increased much more rapidly than the total population. In 1990 there were 482 million older people; in 2015 there were an estimated 901 million; and by 2050 there will be nearly 2.1 billion.
Myanmar’s 2014 Census enumerated 4.5 million people aged 60 and over and by 2050 Myanmar is projected to have 13 million people in this age group. In 2050, the country’s age structure will be similar to Singapore’s today with about 20 per cent of the population aged 60 and over and approximately the same number of older people and children under 15 years of age.
Understanding population ageing is important because of the potential effects on the economic development of the country. The 2014 Census, the first in the country for 30 years, is a unique source for describing national and regional population dynamics underlying population ageing. Furthermore, the Census is invaluable in describing the situation of the older population to facilitate the design of programmes targeting the most vulnerable and to monitor the outcomes of these programmes.
Myanmar’s population has aged between 1973 and 2014; while the total population increased at an annual rate of 1.4 per cent, the population aged 60 and over increased annually by 2.4 per cent. Within the older population, the oldest age group, those over 80 years old, has been growing much faster than those aged 60-79. In 2014, the urban population was slightly older than the rural population. This is the result of a more rapid decline in urban fertility, offset by net migration to urban areas by youth and young adults.
Myanmar’s population is much younger than richer ASEAN countries such as Singapore, Malaysia and Thailand, which had an earlier and more rapid fertility decline. Its population is slightly older than the other low and middle-income ASEAN countries which still have high fertility.
The conditions of the older population are an accumulation of their life experiences and are also directly affected by current social and economic realities. Most of the people aged 60 and over enumerated in the Census were born between 1925 and 1950. Their access to education and choices about marriage and childbearing were influenced by the times through which they lived.
Three quarters of people aged 60 and over are still living in the Township where they were born. However, nearly half of them in urban areas were born elsewhere, mostly in other urban areas.
Most men aged 60 and over are currently married (73.9 per cent) whereas only 44.1 per cent of women in the same age group are married. The proportion of women aged 60 and over who are widowed rises rapidly with age, from 30.7 per cent at ages 60-64; to 60.5 per cent at ages 75-79; to 74.0 per cent among those aged 85-89. This is due to women marrying men some years older than themselves, poorer life expectancy of males and much higher life expectancy for females. Among urban women aged 60-64, 12.1 per cent were reported
Census Report Volume 4-L – The Older PopulationXVI
to have never married. In the future, this proportion will rise among urban women 20 years younger, aged 40-44; 18.7 per cent will have never married. Nearly one-fifth of women aged 60 years and over (18.4 per cent) reported that they have no surviving children of their own.
People who are reported as not being able to read or write comprise 20.9 per cent of the population aged 60 years and over: 11.2 per cent of men and 28.0 per cent of women. The older population and especially women, have lower levels of education and literacy than prime working-age adults, aged 15-59. Similarly, 24.6 per cent of older men and 37.7 per cent of older women have never attended school. Among today’s youth, literacy and completing at least one grade of primary school is nearly universal.
The practice of older people living with their adult children is firmly entrenched in Myanmar. About three-quarters of older people living in conventional households co-reside with one or more son or daughter or son- or daughter-in-law. Fifteen per cent of older men and women live alone or with only a spouse. Approximately 6 per cent of older people live with a grandchild but no adult child and another 2 per cent live with a sibling and no adult child.
The preference for living with younger family members is so strong that marital status has very little effect on household composition. Older people who are married and those who are widowed are equally likely to live with their children. Even those reported in the Census as without a living child describe themselves as a parent to other household members.
Myanmar society places a high value on the reciprocal duties between parents and children and there is a very strong belief in the importance of looking after older members of the family. Among adults aged 40-59, at least 15.7 per cent live with a parent. Single adults and those adults with higher levels of education are the most likely to live with a parent.
Older people gradually transition away from being economically active. Only 30 per cent of people aged 60 and over are in the labour force; 47 per cent of men and 18 per cent of women. Older people working in agriculture remain in the workforce for longer than workers in other occupations and sectors. However, even this form of employment is becoming less common, as can be seen by comparing the main activities of the older population in the 1983 and 2014 censuses.
A lack of rural infrastructure and low agricultural productivity means that many rural households with an older member live in bamboo, huts, or other types of dwelling units not suitable for habitation (37 per cent); lack access to electricity for lighting (84 per cent) and cooking (95 per cent); do not have access to improved sanitation (28 per cent); and lack access to communication devices such as phones, radios or televisions, or means of transport that are common in urban households.
The strong social conventions in Myanmar which enable older people to live with their adult children or other family members, bring economic benefits to everyone. Older people benefit from living with others. The most disadvantaged households are those where an older person lives on his or her own or without an employed person in the prime working ages, aged 15-59. Other members of the household also benefit from having a member aged
Executive Summary

Census Report Volume 4-L – The Older Population XVII
60 or over. Larger households are more likely to be in a higher wealth quintile if at least one member is aged 60 or over.
Based on estimates from the 2014 Census, the average 60 year-old in Myanmar can expect to live an additional 16.3 years. Urban men have the shortest life expectancy; from age 60 they can expect to live on average only 12.7 years. A rural man at age 60 can expect to live another 14.8 years, whereas a 60 year-old woman can expect to live another 18.5 years in rural areas and another 17.7 years in urban areas.
The 2014 Census was the first census in Myanmar to attempt to measure the prevalence of disability in the population by asking if people experienced any difficulty in seeing, hearing, walking, or remembering or concentrating and, if so, the level of difficulty they experienced. Nearly one-quarter of older people have at least one form of disability and nearly 6 per cent have a moderate or severe disability. All types and severity of disabilities increase rapidly with advancing age. Among those aged 80 and over, 43 per cent have some form of disability and 16 per cent report having a moderate or severe disability. At each age women are slightly more likely to report a disability than men. The prevalence of disability is higher in rural areas and amongst older people in the lowest wealth quintiles.
Like the rest of the population, half of older people in Myanmar live in several of the largest States/Regions. Yangon is home to 14.4 per cent of all people in this age group and another 13 per cent live in Mandalay and Ayeyawady respectively. Sagaing and Bago each have about 11 per cent of the older population. Also like the total population, 49 per cent of urban people aged 60 and over live in urban areas of Yangon and Mandalay.
The extent of population ageing is greatest in Magway, Mon, Bago, Mandalay, Sagaing, Ayeyawady and Yangon. In all States/Regions, the urban population has a higher proportion of older people than the rural population. If present rates continue, the central States/Regions will experience the highest growth rate of the population aged 60 and over by 2030, accompanied by a declining total population. This is the result of a steady outflow of younger people in search of employment. However, all States/Regions are projected to have older populations growing at a rate of at least 3 per cent every year, at a faster rate than the total population between 2015 and 2030.
In every State/Region most older people – from 70 to 80 per cent – co-reside with an adult child. In a few States/Regions over 10 per cent of older persons live alone or with a spouse only, especially in rural areas. In the rural areas of Kayin, Tanintharyi and Mon, which have high rates of outmigration, over 10 per cent of older people are living with their grandchildren but no adult child.
Using three indicators of poor material well-being (housing made from bamboo, a hut, or other types of dwelling units; a lack of access to improved sanitation; and no electricity as a source of lighting), Yangon, Mon, Kayah, Nay Pyi Taw and Bago were ranked as the States/Regions which had the highest level of material well-being for older people. Sagaing, Magway and Rakhine had the lowest levels.
Executive Summary

Census Report Volume 4-L – The Older PopulationXVIII
The proportion of older people who never attended school also varied widely between States/Regions, from a low of 11 per cent in Yangon to a high of 66 per cent in Shan. The current gender gaps in education and literacy between States/Regions seen among older people, will narrow in the future given the much higher rates reported among youth in the 2014 Census.
The labour force participation of older people varies between States/Regions from 21.2 per cent in Yangon to 38.9 per cent in Chin. In all cases, older men are more likely to be in the labour force than older women, and older people living in rural areas are more likely to be working than those in urban areas.
The Government of Myanmar has approved several laws and policies to address the challenges of an ageing population. Among the priorities are to expand the pension scheme for government workers to private sector employees; introduce a social pension for people aged 65 and over; and to foster local support groups comprised of older people to conduct activities to benefit those in their communities. A social pension for people aged 90 and over started in 2017.
Myanmar has a number of significant advantages. Its population is ageing more slowly than many other countries in the region. This will provide a greater opportunity for older people of the future to benefit from the economic growth occurring in the country. On an individual level, the strong cultural values of respecting older people mean that most people are able to grow old surrounded by an extended family. This form of practical, social and economic support by families is likely to continue for many decades to come.
Executive Summary

Census Report Volume 4-L – The Older Population 1
Chapter 1. Introduction Chapter 1.
Population ageing is the most significant demographic change in modern times. It is defined as the increasing share of older persons in the population and is caused by the transition from high to low levels of fertility and mortality. The pace and magnitude of these declines determines the numbers and relative size of the older population now and in the future. Every country and region in the world has or will experience population ageing.
Globally, the estimated number of people aged 60 and over has grown from 482 million in 1990 to 901 million in 2015. By 2050, the world’s older population is projected to more than double, reaching nearly 2.1 billion (UN DESA, 2015a). From 1990 to 2015 the percentage of older people of the total population has increased from 9 per cent to 12 per cent and is expected to reach 21 per cent by 2050. Although the more developed regions were the first to experience population ageing, it is in the less developed regions where the numbers of the older population and their proportion of the total population are growing most rapidly. Two out of three older people lived in less developed regions in 2015, and this will increase to four out of five by 2050.
Myanmar is no exception to widespread population ageing. Of the 50.3 million people enumerated in the 2014 Census, 4.5 million, or 8.9 per cent, were aged 60 and over. The older population has been growing at an average annual rate of 2.4 per cent since 1973, compared to a total population growth rate of 1.4 per cent (see Table 3.1). Furthermore, the country’s share of older persons is projected to rise to 15.5 per cent by 2035 and to 20.2 per cent by 2050 (Department of Population, 2017a).
The increasing number of older people is a triumph of the advances in health care and the economic development of past decades. Population ageing is a sign that many older people can expect to live longer, healthier lives than their parents and to continue to contribute to their family and community. The challenge for governments and broader society is to enable older people to have adequate income security through savings, continued participation in the workforce if they wish and are able, and through social programmes such as pensions.
However, population ageing is also viewed as having potentially negative consequences for societies, economies, families and individuals. The availability of labour, demand for goods and services and levels of savings are affected by the changes in the proportion of older people in the population. The demographic changes that lead to population ageing will mean that older people have fewer children to support them and that they will live into advanced ages, potentially experiencing increasing health problems for a longer time. Health systems will face larger numbers of older people requiring care. The concern for many low and middle-income countries is that their populations will grow old before they grow rich enough to support the increased numbers of older people.
Nationally and internationally, these benefits and challenges of population change are well understood. The 2030 Sustainable Development Agenda calls for all governments to ‘leave no one behind’. Although the well-being of older people is not a specific focus of the Sustainable Development Goals (SDGs), they are mentioned as among those who are the most vulnerable and must be empowered. Most of the 17 SDGs specifically mention the importance of eliminating discrimination and increasing opportunities ‘for all’ or for ‘all ages’. These include ending poverty for all (SDG 1); the right to health ‘for all at all ages’

Census Report Volume 4-L – The Older Population2
Chapter 1. Introduction
(SDG 3); promoting lifelong learning (SDG 4); encouraging the development of sustainable, inclusive, and accessible urban environments, including for ‘older persons’ (SDG 11); and the production and use of age-disaggregated data to monitor the SDGs (United Nations 2015, UNDP 2016).
In Myanmar, a commitment to older people is laid down in the 2008 Constitution, which states ‘the Union shall care for mothers and children, orphans, fallen Defence Services personnel’s children the aged and the disabled.’ A law related to older persons was passed in late 2016 and the National Social Protection Strategic Plan and the National Action Plan on Ageing, were both approved in 2014, outlining a comprehensive approach to provide for the economic, health and social needs of older people (Government of Myanmar 2014a and b).
1.1 Background to the report
A population census is “the total process of collecting, compiling, evaluating, analyzing and publishing or otherwise disseminating demographic, economic, and social data pertaining to a specified time, to all persons in a country or in a well delimited part of a country” (United Nations, 2008). A census provides benchmark data on population characteristics such as age and sex, marital, educational, occupational and disability status and household composition which are profoundly important for effective national development planning and policymaking.
The history of census taking in Myanmar dates back to 500 BC during the regime of King Thadodipa Mahadamayaza of the Tagaung Dynasty. The first modern census, as defined by the United Nations (2008), was carried out in the southern part of Myanmar as part of a census implemented by India under the British administration in 1872 (Department of Population, 2015, p ii). Decennial censuses were carried out throughout the country up until 1941. After independence in 1948 the country held its first census in 1973 followed by another in 1983.
The 2014 Myanmar Population and Housing Census is the first census in over 30 years. It was conducted from 29th March to 10th April, 2014 and enumerated all persons based on where they were on Census Night, 29 March, including those living in conventional households, institutions, the homeless, and persons living in other collective quarters. The Census provides the most comprehensive and reliable source of data on the size and the demographic and socioeconomic characteristics of older persons. It offers a unique opportunity to look in-depth at the situation of older people not only at the Union level but at the State/Region and District level. Such information is beneficial for socioeconomic development and health service planning and advocacy.
1.2 Definition of the older population
The definition of the threshold for the older population is somewhat arbitrary when considering the very different circumstances of older people across the world (Siddhisena, 2005). However, the United Nations has consistently used aged 60 and over as the definition of older people (United Nations 1983, 2002; UN DESA 2015b). Age 60 is also considered to

Census Report Volume 4-L – The Older Population 3
Chapter 1. Introduction
be the threshold in identifying older persons in Myanmar since the mandatory retirement age in the public sector is 60 years with an extension of up to two to three years in some circumstances.
As the socio-demographic characteristics of older persons and the consequences of their ageing process vary by age, the entire older population (60 and over) is commonly divided into three broad age groups which are defined here as: the young old (those aged 60-69); the old (those aged 70-79); and the oldest (80 and over). Some information presented in this report uses these three age groups to explore patterns by age within the older population. Where a finer-grained analysis is required, five-year age groups from 60 to 85 and over or 90 and over are used. Almost all analysis is conducted for the total older population by sex and urban or rural residence, with reference as needed to younger age groups, and particularly people in the prime working ages of 15-59.
1.3 Previous research on older people in Myanmar
This report contributes to a small but growing body of evidence on the conditions of older people in Myanmar. Four studies on the older population have been conducted in Myanmar in the past 15 years. The first two were derived from the 2001 and 2007 Fertility and Reproductive Health Surveys and the 1973 and 1983 censuses (Department of Population and UNFPA 2005, 2012). The third study was a survey of the older population conducted by the Department of Social Welfare, Relief and Resettlement and HelpAge International in 2012 (Knodel 2014). The 2012 survey is the first survey conducted in Myanmar that exclusively focuses on the older population. A number of papers have been published from the survey data, with more detailed analysis on the health and socioeconomic conditions of older people (Teerawichitchainan and Knodel 2015; Teerawichitchainan, Knodel and Pothisiri 2015; Knodel and Teerawichitchainan 2017). The fourth study, restricted to the older population in five Townships from different geographic States/Regions in the country, focused on health status and access to health care services (Rajan and Sreerupa 2016). Findings from these studies will be used to extend or verify findings based on the 2014 Census.
1.4 Aim and objectives
The primary aim of this thematic report is to draw on the 2014 Census data to describe the current and future size, growth and characteristics of the older population in order to assist policymakers in the development of evidence-based policies and programmes to protect and enhance their well-being.
The objectives of the report are to:• Describe the trends of population ageing in Myanmar up to and beyond the 2014
Census.• Determine the demographic, social and economic characteristics of the older
population.• Analyse the living arrangements of older people and the implications for their well-
being.• Highlight policies and programmes needed to support the well-being of the older
population now and in the future.

Census Report Volume 4-L – The Older Population4
Chapter 1. Introduction
1.5 Report structure
The structure of the thematic report is arranged as follows. Chapter 2 is devoted to the discussion of the data and methodology used in the analysis of the older population in Myanmar. An assessment is made of the quality of age reporting and the completeness of the coverage of the older population in the 2014 and 1983 censuses. Chapter 3 presents an overview of population ageing trends in Myanmar and other South-East Asian countries (defined as members of the Association of Southeast Asian Nations (ASEAN)). It explores the current size, age and composition of the older population, how it has changed since 1973 and how it is expected to change up to 2050.
Chapters 4, 5, 6 and 7 are concerned with individual ageing and the conditions in which older people live. Chapter 4 explores the social and demographic characteristics of older people including place of residence and residential mobility, marital status and number of living children, and education. Chapter 5 describes older people’s living arrangements in institutions and conventional households, with particular attention to household composition and how this differs by sex, marital status, number of children and age.
Around the world, economic security and health are older people’s primary concerns (UNFPA and HelpAge International 2012). Chapter 6 considers the economic conditions of older people. Three in ten of the older population are economically active, but they eventually transition out of the labour force. This chapter also looks at other indicators of economic well-being, including housing conditions, amenities, assets and a wealth index, by age, sex and household composition. Chapter 7 presents information on older people’s life expectancy and the prevalence of disabilities.
Chapter 8 explores regional variations in the rate of population ageing and the social and economic conditions of older people. Information is presented by urban and rural areas of States/Regions. In Chapter 9, existing policies and programmes for the older population in Myanmar are discussed within the context of the probable size, composition and social and economic characteristics of the older population in the future. Chapter 10 offers recommendations concerning policy, future research and the next census.

Census Report Volume 4-L – The Older Population 5
Chapter 2. Methodology and data quality assessment Chapter 2.
The quality of a census is determined by the completeness of its coverage and the accuracy of the responses given by householders, especially in the reporting of age. The better the quality of the data, the more reliable the findings. Hence, this chapter discusses the source of data used in the analyses in this report and, in particular, evaluates the quality of age reporting.
2.1 Sources of data and their limitations
One of the objectives of this report is to describe trends in population ageing and the characteristics of the older population. Where possible this is done by referring to data from the 1973 and 1983 censuses. The 2014 Census was a much more ambitious undertaking than the previous censuses, covering more topics and with a more extensive programme of analysis. There is no comparable data in the 1973 and 1983 censuses on a number of important topics including household composition, mortality and fertility rates, and disability.
The 2014 Census adopted a de facto methodology where, with some exceptions, the majority of people (95 per cent) were enumerated in the houses/dwelling units where they were staying on March 29, 2014 (Census Night). They were interviewed using the main Census questionnaire. The remaining 5 per cent were enumerated in institutions; in other collective quarters; or were enumerated as the homeless population. An institution questionnaire was completed for these people, which did not contain all of the questions asked in the main questionnaire. In particular, no information was collected for people in institutions on literacy, number of children (of ever-married women only), residential moves between Townships (used to derive migration rates), occupation and industry of employment.
The field operation was completed in almost all areas within 12 days after the start of the fieldwork. The total enumerated population stood at 50,279,900. Some populations in three areas of the country were not enumerated. These included an estimated 1,090,000 persons in Rakhine State, 69,753 persons in Kayin State and 46,600 persons in Kachin State (see Department of Population, 2015 for the reasons that these populations were not enumerated). In total, therefore, it is estimated that 1,206,400 persons were not enumerated in the 2014 Census. The total estimated population of Myanmar on Census Night, both enumerated and non-enumerated, was 51,486,253.
The analysis in this report covers only the enumerated population. It is worth noting that in Rakhine State an estimated 34 per cent of the population were not enumerated as members of some communities were not counted because they were not allowed to self-identify using a name that was not recognized by the Government. The Government made the decision in the interest of security and to avoid the possibility of violence occurring due to inter-communal tension. Consequently, data for Rakhine State, as well as for several Districts and Townships within it, are incomplete, and only represent about two-thirds of the estimated population.

Census Report Volume 4-L – The Older Population6
Chapter 2. Methodology and data quality assessment
2.2 Assessment of data quality for the older population
Two types of errors can occur during the enumeration phase of a census. The first is coverage errors, occurring due to omission or duplication of individuals and/or households. The second type of errors is content or response errors, due to inaccurate, or lack of, information provided by the respondents or errors made in reporting or recording of the information by enumerators. Both types of errors could be of concern for the older population, potentially limiting the data accuracy and usefulness. The most robust way to determine the quality of data is to check the accuracy of the information by collecting information more than once, using different methods. For censuses, this is done through a post-enumeration survey where an independent team interviews a randomly selected sample of respondents. A post-enumeration survey was not undertaken for the 2014 Census.
The quality of data of the older population has been a neglected topic, especially in developing countries where the focus of data collection efforts has been on children and women in their reproductive years. However, with the growing interest in the welfare of the older population and in the increasing importance of non-communicable diseases as a cause of death, researchers have been taking a closer and more critical look at the quality of data for older ages (Randall and Coast 2016).
The systematic omission of older people in population censuses would be a major concern, resulting in data which underestimated the size of the older population. This is especially troubling because it is the poorest older people who would most likely be omitted (Zimmer and Das 2014). Research on older people in Africa have hypothesized that older females are most likely to be omitted in censuses and surveys because, due to higher male mortality and the practice of marrying males older than themselves, older women are more likely to be living alone or semi-independently from their adult children. An examination of the sex ratios (number of men per 100 women) in the older population from 29 African censuses and surveys found that in most data sets, sex ratios were unreasonably high, indicating that older females had been omitted (Randall and Coast 2016).
There is no evidence that females are omitted from the three most recent Myanmar censuses. Figure 2.1 shows that the sex ratio declines with age, starting from the age group 55-59, in all three censuses. Furthermore, as will be shown in Chapter 5, very few older people in Myanmar live alone and therefore are less likely to be missed by enumerators. The reason for the much lower sex ratios in the 2014 Census is not clear. While it could be the result of a more complete enumeration of older women in 2014 compared to the earlier censuses, it is more likely to reflect the high male mortality rates found in 2014. Mortality levels were not derived from the 1983 and 1973 censuses; it is conceivable that the gap between male and female mortality (which will be discussed in Chapter 7) emerged between 1983 and 2014.

Census Report Volume 4-L – The Older Population 7
Chapter 2. Methodology and data quality assessment
Figure 2.1 Sex ratios by five-year age group from 50 to 90 years and over, 1973, 1983 and 2014 censuses
Figure 2.2 Age-sex pyramid by single year of age, 2014 Census
0
10
20
30
40
50
60
70
80
90
100
50-54 55-59 60-64 65-69 70-74 75-79 80-84 85-89 90+
Mal
es p
er 1
00 fe
mal
es
Age group
1973 1983 2014
600,000 400,000 200,000 0 200,000 400,000 600,0000
5
10
15
20
25
30
35
40
45
50
55
60
65
70
75
80
85
90
95 +
Numbers of persons
Age
MaleFemale

Census Report Volume 4-L – The Older Population8
Chapter 2. Methodology and data quality assessment
The resulting distribution of the population by single year of age shows signs of reporting ages in ‘round digits’ ending at 0 or 5 and in certain ages ending with an even number. The resulting ‘heaping’, ‘inflation’ and ‘deflation’ of particular ages are apparent in the age pyramid at Figure 2.2.
Whipple’s Index is a common indicator of the quality of age reporting (Shryock and Siegel 1976). It measures the proportion of people reporting an age ending in 0 or 5 out of the total population. The values can range from 100, where there is no preference for reporting ages ending in 0 or 5, to 500, where all people are reporting ages ending in 0 or 5. The convention is to view scores less than 105 as indicating highly accurate data; 105 up to 110 as fairly accurate; 110 up to 125 as approximate data; 125 up to 175 as rough data; and 175 and over as very rough data.
Whipple’s Index uses the population aged 23-62; a range which has the same number of ages ending in 0 and 5. Obviously, the conventional Whipple’s Index fails to capture the quality of age reporting among the older population (Randall and Coast 2016). In Table 2.1 the conventional Whipple’s Index reported for the 1983 and 2014 censuses are shown with a Whipple Index for ages 63-92.
Table 2.1 Whipple’s Index for ages 23-62 and 63-92 by sex, urban and rural areas, 1983 and 2014 censuses
Census year/Age group
Union Urban Rural
Both sexes Male Female Both sexes Male Female Both sexes Male Female
1983
23-62 142.8 141.9 143.7 114.8 114.4 115.1 152.6 151.5 153.7
63-92 162.0 158.9 164.8 125.8 122.9 128.0 173.9 169.7 177.7
2014
23-62 123.3 124.0 122.6 115.8 116.0 115.6 126.7 127.6 125.8
63-92 142.1 139.0 144.4 129.9 126.7 132.1 147.5 144.2 150.1
At the Union level, the quality of age reporting for 23-62 year olds and 63-92 year olds improved between 1983 and 2014 overall for both males and females. Using the standard Whipple classifications, the quality of age reporting among those aged 23-62 would be considered approximately accurate and the age data for those aged 63-92 would be considered rough.
Table 2.1 also shows that although there is relatively little difference in the quality of age reporting for males and females, there are large differences between urban and rural populations. The quality of urban age reporting for the 23-62 age group was considered ‘approximate’ in 1983 and has remained so in 2014. In rural areas, there was a substantial improvement in the quality of age reporting for those aged 23-62. The quality of age reporting for the 63-92 age group in 2014 (142.1) is very similar to the quality of age reporting for the 23-62 age group in 1983 (142.8).

Census Report Volume 4-L – The Older Population 9
Chapter 3. Demographic change and the older population in Myanmar Chapter 3. This chapter presents the trends in the size, growth and composition of the older population aged 60 and over. It describes the demographic forces that drive population ageing in Myanmar and projects the older population up to 2050. Population ageing in Myanmar is contrasted with the experiences of other South-East Asian countries.
3.1 Population ageing in Myanmar
3.1.1 The size and growth of the older populationThe growth in the absolute number and relative proportion of the older population can be traced through Myanmar’s censuses of 1973, 1983 and 2014 (Table 3.1). The 1973 census enumerated 1.7 million people aged 60 and over, comprising 6.0 per cent of the total population. By 2014, the enumerated older population was 4.5 million; 8.9 per cent of the total population. In the past 40 years the older population has been growing much faster than the total population and the populations of children aged 0-14 and persons who are in their prime working ages, aged 15-59. Myanmar’s population is becoming older, with the median age rising from 19.1 years in 1973 to 27.1 years in 2014. Interested readers can calculate these and other measures of Myanmar’s population size, growth and composition from Appendix 1, Table 1, which contains the enumerated population by five-year age group, by sex, and functional age groups from the three censuses.
Table 3.1 Indicators of population ageing, size and growth of broad age groups, 1973, 1983 and 2014 censuses
1973 1983 2014 1973-2014
Total enumerated population
Total 28,084,513 34,124,908 50,279,900
0-14 11,643,840 13,159,645 14,399,569
15-59 14,749,083 18,794,731 31,405,923
60 and over 1,691,590 2,170,532 4,474,408
Percentage of total population
Total 100 100 100
0-14 41.5 38.6 28.6
15-59 52.5 55.1 62.5
60 and over 6.0 6.4 8.9
Average annual growth rate
Total - 2.0 1.3 1.4
0-14 1.2 0.3 0.5
15-59 2.4 1.7 1.8
60 and over - 2.5 2.3 2.4
Median age 19.1 20.2 27.1 --
3.1.2 Measures of age dependency of the total populationDemographers use several indicators of population ageing based on three functional age groups: children (0-14 years), persons in their prime working age years (15-59 years) and older people (60 and over). As discussed in the introduction, this report uses 60 and over

Census Report Volume 4-L – The Older Population10
Chapter 3. Demographic change and the older population in Myanmar
to define the older population, as it is the preferred age grouping for studying population ageing and the conditions of older people in less developed countries. To distinguish the definition of the middle age group from the definition of working-age adults aged 15-64 used in other thematic census reports, 15-59 year olds will be called the ‘prime’ working-age group throughout this report.
The demographic indicators of ageing presented in this section are the index of ageing, the older age dependency ratio, the potential support ratio and the parent support ratio. Each of these indicators can be calculated using the population numbers provided in Appendix 1, Table 1. Each indicator captures some aspect of the population-wide implications of ageing by comparing the numbers of children and older people who may be dependent on the support of prime working-aged adults. The indicators for Myanmar will be compared to other ASEAN countries in the final section of this chapter. The values of these indicators for States/Regions are given in Chapter 8.
The index of ageing is the number of people aged 60 and over per 100 children aged 0-14. The higher the index value, the greater the relative size of the older population compared to the population of children. The United Nations Population Division has estimated that globally there are 47 older people to 100 children, with a stark difference between more developed regions where there are almost 50 per cent more older people than children (index of ageing equals 145.7) compared to less developed regions where there is only one older person for every three children (index of ageing equals 35.2) (UN DESA 2015b).
In Myanmar, children still outnumber the older population by a wide margin, but the index of ageing is increasing (Table 3.2). In 1973, there were only 14.5 older people per 100 children while in 2014 there were 31.1.
Table 3.2 Indicators of population ageing, 1973, 1983, and 2014 censuses
Indicators of population ageing 1973 1983 2014
Index of ageing 14.5 16.5 31.1
Total dependency ratio 90.4 81.6 60.1
Child dependency ratio 78.9 70.0 45.8
Older age dependency ratio 11.5 11.5 14.2
Potential support ratio 8.7 8.7 7.0
Parent support ratio 1.4 1.7 3.7
The dependency ratios also show that while Myanmar’s population is ageing, it is still young. The older age dependency ratio (the number of persons aged 60 and over per 100 persons aged 15-59) has only increased from 11.5 in 1973 to 14.2 in 2014. Over the same period the total dependency ratio (the population aged under 15 plus the population aged 60 and over per 100 people aged 15-59) has decreased from 90.4 to 60.1 due to the substantial decline in the proportion of children. The child dependency ratio (the population under 15 per 100 persons aged 15-59) has declined from 78.9 to 45.8.
The potential support ratio measures population ageing from the perspective of the older
Census Report Volume 4-L – The Older Population 11
Chapter 3. Demographic change and the older population in Myanmar
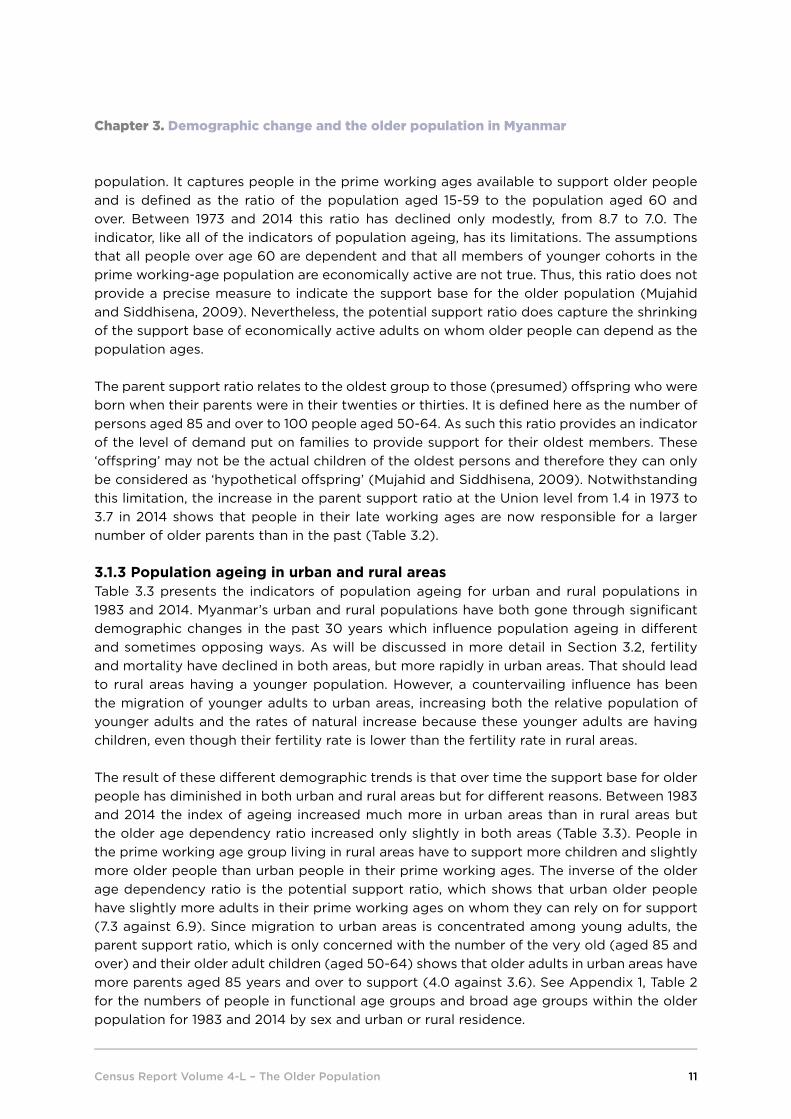
population. It captures people in the prime working ages available to support older people and is defined as the ratio of the population aged 15-59 to the population aged 60 and over. Between 1973 and 2014 this ratio has declined only modestly, from 8.7 to 7.0. The indicator, like all of the indicators of population ageing, has its limitations. The assumptions that all people over age 60 are dependent and that all members of younger cohorts in the prime working-age population are economically active are not true. Thus, this ratio does not provide a precise measure to indicate the support base for the older population (Mujahid and Siddhisena, 2009). Nevertheless, the potential support ratio does capture the shrinking of the support base of economically active adults on whom older people can depend as the population ages.
The parent support ratio relates to the oldest group to those (presumed) offspring who were born when their parents were in their twenties or thirties. It is defined here as the number of persons aged 85 and over to 100 people aged 50-64. As such this ratio provides an indicator of the level of demand put on families to provide support for their oldest members. These ‘offspring’ may not be the actual children of the oldest persons and therefore they can only be considered as ‘hypothetical offspring’ (Mujahid and Siddhisena, 2009). Notwithstanding this limitation, the increase in the parent support ratio at the Union level from 1.4 in 1973 to 3.7 in 2014 shows that people in their late working ages are now responsible for a larger number of older parents than in the past (Table 3.2).
3.1.3 Population ageing in urban and rural areasTable 3.3 presents the indicators of population ageing for urban and rural populations in 1983 and 2014. Myanmar’s urban and rural populations have both gone through significant demographic changes in the past 30 years which influence population ageing in different and sometimes opposing ways. As will be discussed in more detail in Section 3.2, fertility and mortality have declined in both areas, but more rapidly in urban areas. That should lead to rural areas having a younger population. However, a countervailing influence has been the migration of younger adults to urban areas, increasing both the relative population of younger adults and the rates of natural increase because these younger adults are having children, even though their fertility rate is lower than the fertility rate in rural areas.
The result of these different demographic trends is that over time the support base for older people has diminished in both urban and rural areas but for different reasons. Between 1983 and 2014 the index of ageing increased much more in urban areas than in rural areas but the older age dependency ratio increased only slightly in both areas (Table 3.3). People in the prime working age group living in rural areas have to support more children and slightly more older people than urban people in their prime working ages. The inverse of the older age dependency ratio is the potential support ratio, which shows that urban older people have slightly more adults in their prime working ages on whom they can rely on for support (7.3 against 6.9). Since migration to urban areas is concentrated among young adults, the parent support ratio, which is only concerned with the number of the very old (aged 85 and over) and their older adult children (aged 50-64) shows that older adults in urban areas have more parents aged 85 years and over to support (4.0 against 3.6). See Appendix 1, Table 2 for the numbers of people in functional age groups and broad age groups within the older population for 1983 and 2014 by sex and urban or rural residence.

Census Report Volume 4-L – The Older Population12
Chapter 3. Demographic change and the older population in Myanmar
Table 3.3 Indicators of population ageing, urban and rural areas, 1983 and 2014 censuses
Indicators of population ageing 1983 2014
Union Urban Rural Union Urban Rural
Index of ageing 16.5 17.3 16.3 31.1 38.1 28.8
Total dependency ratio 81.6 71.9 85.0 60.1 49.8 64.8
Child dependency ratio 70.0 61.3 73.1 45.8 36.1 50.4
Older age dependency ratio 11.5 10.6 11.9 14.2 13.7 14.5
Potential support ratio 8.7 9.4 8.4 7.0 7.3 6.9
Parent support ratio 1.7 1.9 1.6 3.7 4.0 3.6
3.1.4 Age and sex composition within the older population The age and sex composition of the older population in Myanmar is changing rapidly and this has important policy implications because as people age their capacities and needs change. The ageing population is characterized not only by an increasing proportion of older persons and an absolute growth in their numbers but also by ageing within the total population aged 60 and over. Furthermore, because females have lower mortality rates at all ages; by the advanced years there are more females than males.
Table 3.4, derived from the population numbers in Appendix 1, Table 1, shows the relative size and growth of the older population in five-year age groups. In 1973 only 6.5 per cent of the older population was over 80 years old; in 2014, the figure had nearly doubled to 12.6 per cent. The oldest age groups are growing the fastest.
Table 3.4 Relative size and growth rate of the older population by five-year age group, 1973, 1983 and 2014 censuses
Age group Percentage Average annual growth rate
1973 1983 2014 1973-2014 1983-2014
60-64 39.1 38.3 35.2 2.1 2.1
65-69 26.4 24.7 23.8 2.1 2.2
70-74 19.3 19.2 15.9 1.9 1.7
75-79 8.7 9.9 12.4 3.2 3.1
80-84 4.4 5.6 7.5 3.7 3.3
85-89 1.3 1.7 3.5 4.8 4.8
90+ 0.8 0.8 1.6 4.3 4.6
Per cent 100 100 100
Total Number 1,691,590 2,170,532 4,474,408 2.4 2.3
Figure 3.1 shows that females outnumber males in the older population and that at older age groups the number of men to women is lower and that the relative proportion of females has also been increasing. In 2014, there were 1.9 million older men and 2.6 million older women. Women comprised 57.1 per cent of the older population in 2014, compared to 52.2 per cent in 1973.

Census Report Volume 4-L – The Older Population 13
Chapter 3. Demographic change and the older population in Myanmar
Figure 3.1 Numbers of persons aged 60 and over by sex, 1973, 1983 and 2014 censuses
The increase in the proportion of the oldest old within the 60 years and over population is taking place equally in urban and rural areas (Figure 3.2 and Appendix 1, Table 2).
Figure 3.2 Percentage of the older population by broad age groups, urban and rural areas, 1983 and 2014 censuses
3.2 The determinants of population ageing
A population changes its size and composition through a combination of three demographic actions: births, deaths and net migration. Population ageing is the consequence of these three components over the course of time. Children born in one year become part of the older population 60 years later. The relative proportion of the older population depends on the size of the younger population, and that is determined primarily by how many children are born in the intervening years and, to a lesser extent, the rates of mortality and net migration.
0
500,000
1,000,000
1,500,000
2,000,000
2,500,000
3,000,000
3,500,000
4,000,000
4,500,000
5,000,000
1973 1983 2014
Num
bers
of p
erso
ns a
ged
60 a
nd o
ver Female
Male
63.1 59.4 62.9 58.9
28.627.7
29.228.6
8.3 12.8 7.9 12.6
0
10
20
30
40
50
60
70
80
90
100
1983 2014 1983 2014
Urban Rural
Percen
tage
80+
70-79
60-69

Census Report Volume 4-L – The Older Population14
Chapter 3. Demographic change and the older population in Myanmar
Myanmar does not have an accurate and comprehensive vital registration system. The level and trends in fertility, mortality and net migration in Myanmar can only be estimated. Other 2014 Census thematic reports have used evidence from the 2014 and past censuses and surveys to piece together the most plausible trends. This report uses these findings to describe the broad demographic forces that have shaped the current older population and which will determine the future of population ageing.
There is strong evidence that the level of fertility has been declining for the past 40 to 50 years (Department of Population 2016b). In the mid-1960s the average woman in Myanmar had five and a half children throughout her life. This declined to about three and a half children around 1990. Based on the 2014 Census, in 2013 the average woman had two and a half children. Most of the decline occurred in the 1980s and 1990s. Fertility has been at approximately the same level since the late 1990s. Fertility in urban and rural areas is strikingly different: based on the 2014 Census urban women can now expect to have an average of 1.9 children and rural women 2.8 children. All else being equal, the rural population will grow faster than the urban population and will have a younger population than urban areas.
But all things are not equal. Urban and rural differences in mortality and net migration also affect population ageing.
The 2014 Census thematic report on Mortality found much higher mortality rates of males than females at all ages (Department of Population 2016c). The estimated life expectancy at birth for urban males was 59.7 years and 71.0 years for females. Rural males’ life expectancy was slightly higher at 60.7 years and females slightly lower at 68.8 years. In low income countries such as Myanmar, infant and child mortality are the most important determinants of total life expectancy. Infants and children in Myanmar still experience high rates of mortality due to infectious diseases, acerbated by poor environmental conditions and a weak health system (MNPED and UNICEF 2012). Using data from the 2014 Census and past surveys and censuses, it was concluded that there was a rapid decline in infant and child mortality during the 1970s to mid-1980s, followed by stagnation and then a further decline starting in the mid-2000s (2014 Census thematic report on Mortality, Department of Population).
Higher infant and child mortality in rural areas is not likely to affect the proportion of the older population. However, the higher urban adult mortality, especially for urban males, could slow urban population ageing and increase the proportions of older urban widowed females. At the local and State/Region level, net migration can have a profound effect on the composition of the population and therefore the proportion of older persons. The 2014 Census thematic report on Migration and Urbanization reported that some States/Regions gained many migrants while others lost population to other States/Regions (Department of Population 2016d). For example, as reported in the 2014 Census, Yangon had an additional 246 migrants per 1,000 people while Chin lost 168 migrants per 1,000 people. In addition, in the 2014 Census households reported a total of 2 million former household members living abroad; an estimate which, for several reasons, is considered an undercount. A large proportion of international emigrants come from Districts and Townships along international borders and most moved for the first time when they were young adults.

Census Report Volume 4-L – The Older Population 15
Chapter 3. Demographic change and the older population in Myanmar
3.3 Projecting the future older population
Myanmar’s population has been gradually ageing over the past forty years, driven by declines in fertility and mortality. However, in the next forty years, population ageing will be much more rapid. Figure 3.3 illustrates this, which superimposes the populations enumerated in 1973, 1983 and 2014. Both the 1973 and 1983 population pyramids have a deficit in the middle age groups, which may have been the result of high mortality in the late twentieth century or low fertility during WWII and its aftermath. This is one of the reasons the older population in 2014 is relatively small compared to the rest of the population, although much larger than the older populations enumerated in previous censuses. What is very noticeable in Figure 3.3 is the expanded width of the working-age population in 2014. It is this swelling of the population pyramid, combined with the fertility decline which is reducing the number of children born each year, that will result in rapid population ageing in the future.
Figure 3.3 Population pyramid showing 1973, 1983 and 2014 populations
Projections of the future population of Myanmar have been made based on the 2014 Census thematic report on Population Projections (Department of Population 2017a). They show the total population growing at an increasingly slower rate, but the older population accelerating quickly (Table 3.5). By 2050, Myanmar is projected to have a population of 65.0 million. Although the total population will be growing at less than 1 per cent a year between 2015 and 2050, the population aged 60 and over will be growing at an annual rate of 3 per cent or more until 2030-35 and then decelerate. Between 2045 and 2050, the older population will still be growing at 1.76 per cent. The population in the oldest ages, above 80 years, will increase even faster, at about 5 per cent or more between 2025-30 and 2035-2040. Note
3,000,000 2,000,000 1,000,000 0 1,000,000 2,000,000 3,000,000
0 - 45 - 9
10 - 1415 - 1920 - 2425 - 2930 - 3435 - 3940 - 4445 - 4950 - 5455 - 5960 - 6465 - 6970 - 7475 - 7980 - 8485 - 89
90 +
1973 Census 1983 Census 2014 Census
Male Female

Census Report Volume 4-L – The Older Population16
Chapter 3. Demographic change and the older population in Myanmar
that the population projections are based on the total population, including an estimate of the size of the population not enumerated in the 2014 Census. Therefore, there will be differences between the 2015 population totals in Table 3.5 and the 2014 Census figures used elsewhere in the report.
Table 3.5 Projected growth of the total and older population, 2015-2050, medium variant
Year Number of persons (‘000s) Percentage Average annual growth rate
Total population
60+ 80+ Total population
60+ 80+ Total population
60+ 80+
2015 52,451 4,750 557 100 9.1 1.1
2020 54,818 5,649 576 100 10.3 1.1 0.88 3.47 0.67
2025 57,178 6,848 639 100 12.0 1.1 0.84 3.85 2.08
2030 59,399 8,160 832 100 13.7 1.4 0.76 3.51 5.28
2035 61,343 9,490 1,143 100 15.5 1.9 0.64 3.02 6.35
2040 62,932 10,771 1,527 100 17.1 2.4 0.51 2.53 5.79
2045 64,147 12,010 1,956 100 18.7 3.0 0.38 2.18 4.95
2050 64,984 13,113 2,373 100 20.2 3.7 0.26 1.76 3.87
2015-2035 0.78 3.46 3.59
2015-2050 0.61 2.90 4.14
Figure 3.4 shows the absolute number of children, prime working-age adults and older people between 2015 and 2050. The number of children stays fairly constant until it starts to decline visibly from 2035. The number of people in the prime working ages continues to increase but at a slower rate. The growth in the prime working ages will result in more older people than children by 2050.
Figure 3.4 Projected numbers of people in functional age groups, 2015-2050, medium variant
0
5,000
10,000
15,000
20,000
25,000
30,000
35,000
40,000
45,000
2015 2020 2025 2030 2035 2040 2045 2050
Popu
latio
n in
'000
s
0-14 15-59 60+

Census Report Volume 4-L – The Older Population 17
Chapter 3. Demographic change and the older population in Myanmar
Table 3.6 shows how the indicators of population ageing will change over time, and how the urban and rural populations will differ. It is based on assumptions about the fertility, mortality and net migration rates for urban and rural populations. While the urban population was somewhat older than the rural population in 2014, continued fertility declines in rural areas are projected to reverse this in the future.
In 2050, the proportion of the older population in urban areas is projected to be 18.7 per cent and 21.0 per cent in rural areas. The index of ageing (number of older people per 100 children) will increase substantially, resulting in slightly more older people than children in urban and rural areas by 2050. The number of children supported per 100 adults in the prime working ages will decline but the number of older people per prime working-age adults will increase, resulting in an overall increase in the total dependency ratio. In 2050, 100 prime working-age adults will be supporting 57.7 dependents in urban areas and 71.7 dependents in rural areas. The number of prime working-age adults per older person (the potential support ratio) will decline from 7.2 to 3.4 in urban areas and from 6.8 to 2.8 in rural areas. The parent support ratio (the population aged 85 and over to 100 adults aged 50-64) also increases but remains at a fairly low level of 8.9 in urban areas and 10.4 in rural areas.
Table 3.6 Projected indicators of population ageing by urban and rural areas, 2015-2050, medium variant
Union Urban Rural
2015 2035 2050 2015 2035 2050 2015 2035 2050
Numbers in ‘000s
Total* 52,451 61,343 64,984 15,364 19,736 22,541 37,087 41,606 42,444
0-14 15,008 14,433 12,861 3,669 4,139 4,038 11,340 10,293 8,823
15-59 32,693 37,421 39,012 10,263 12,668 14,291 22,428 24,749 24,721
60+ 4,750 9,490 13,113 1,432 2,928 4,212 3,319 6,563 8,899
Percentage
0-14 28.6 23.5 19.8 23.9 21.0 17.9 30.6 24.7 20.8
15-59 62.3 61.0 60.0 66.8 64.2 63.4 60.5 59.5 58.2
60+ 9.1 15.5 20.2 9.3 14.8 18.7 8.9 15.8 21.0
Indicators of population ageing
Index of ageing 31.6 65.8 102.0 39.0 70.7 104.3 29.3 63.8 100.9
Dependency ratios
Total 60.4 63.9 66.6 49.7 55.8 57.7 65.4 68.1 71.7
Child 45.9 38.6 33.0 35.7 32.7 28.3 50.6 41.6 35.7
Older age 14.5 25.4 33.6 14.0 23.1 29.5 14.8 26.5 36.0
Support ratios
Potential 6.9 3.9 3.0 7.2 4.3 3.4 6.8 3.8 2.8
Parent 3.1 4.5 9.8 3.3 5.0 8.9 3.0 4.3 10.4
Median age** 26.8 31.8 35.8 28.2 33.1 36.1 26.1 31.1 35.6
*Totals from projections may not match the summations due to rounding errors.
** Calculated from five-year age groups.

Census Report Volume 4-L – The Older Population18
Chapter 3. Demographic change and the older population in Myanmar
3.3.1 Limitations of projectionsPopulation projections are only estimates based on a set of assumptions that may or may not eventuate. The assumptions used in the projections cited in this chapter were taken from the medium variant. These are assumptions that fall between the two extremes of very rapid and very slow changes in fertility and mortality. Specifically, the assumptions underlying the projections are that:
• Fertility will decline steadily from a total fertility rate of 2.5 in 2015, to 1.8 in 2050 at a rate of 0.1 child every five years.
• Urban fertility, which is already very low, will fall more slowly than rural fertility.• Life expectancy at birth will increase from 69.33 during 2014-2015 to 78.23 in 2049-
2050, more rapidly over the first ten years and then by one year every five years.• Life expectancy at birth for men will increase faster than life expectancy for women,
narrowing the gender gap.• Urban and rural life expectancies will converge until they are almost identical in
2050.• The annual number of net international migrants will decline by half between 2015
and 2050.• Age-specific net migration to urban and rural areas within the country is assumed to
remain at current levels.
For a detailed account of the assumptions see the 2014 Census thematic report on Population Projections (Department of Population 2017a).
All, some or none of these scenarios may come true and the future is unlikely to be exactly as projected. Lacking access to jobs in the formal sector, rural areas may remain predominantly agricultural and fertility may not decline any further. Greater gender equality may lead to a more supportive environment for women to combine work and family, raising or at least halting the decline in urban fertility. Economic development and stronger health systems could lower mortality at all ages, but it is equally possible that there will be little improvement; life expectancy will improve more slowly and the high rates of male mortality will continue. Net international migration is sensitive to official relations between countries and changes in the relative differences in income. The increase of the urban population is influenced by fertility rates, the prosperity of rural areas and the supply of housing and jobs in urban areas. More dire scenarios could include a pandemic with high mortality, affecting, as pandemics often do, healthy middle-aged adults and frail older people.
Different assumptions will affect the rate of population ageing but will not change the fact that the country will continue to experience an increase in the size and relative proportion of the older population nor the importance for the Myanmar Government and civil society to plan to support the older population of today and of the future.

Census Report Volume 4-L – The Older Population 19
Chapter 3. Demographic change and the older population in Myanmar
3.4 Myanmar’s population ageing compared to other ASEAN countries
Compared to other ASEAN countries, Myanmar remains a relatively young population, with a moderately slow rate of population ageing. Table 3.7 compares the 2014 population ageing indicators presented earlier in this chapter with the estimated values based on the United Nations Population Division’s World Population Prospects of 2015 (UN DESA 2015a). Although the methods by which these estimates were derived are not strictly comparable, the broad trends are accurate. Myanmar is younger than Singapore, Thailand, Viet Nam and Malaysia, all of which have higher GDP per capita and lower fertility. Myanmar sits as the oldest population of the group of lower income countries.
Table 3.7 Indicators of population ageing for ASEAN countries compared to Myanmar, circa 2015
Country % of total population aged 60 and over
Index of ageing
Older age dependency ratio
Potential support ratio
Median age
Singapore 17.8 114.8 26.8 3.7 40.0
Thailand 15.8 89.2 23.7 4.2 38.0
Viet Nam 10.3 44.6 15.4 6.5 30.4
Malaysia 9.2 37.5 13.8 7.2 28.5
Myanmar 8.9 31.1 14.2 7.0 27.1
Indonesia 8.2 29.7 12.8 7.8 28.4
Brunei Darussalam 7.8 33.7 11.3 8.8 30.6
Philippines 7.3 22.8 12.0 8.4 24.2
Timor-Leste 7.2 16.9 14.3 7.0 18.5
Cambodia 6.8 21.4 11.0 9.1 23.9
Lao PDR 6.0 17.2 10.1 9.9 21.9
Source: 2014 Myanmar Census; data of other ASEAN countries are from the medium variant population projections
(UN DESA 2015a).
Figure 3.5 displays what may happen to the populations of these countries in 2035 and 2050. The countries have been grouped according to whether they were older or younger than Myanmar based on the proportion of the population aged 60 and over in Table 3.7. These estimates in Figure 3.5 are very sensitive to the projection assumptions which anticipate a convergence of fertility and mortality rates between countries over time. In Myanmar and the other countries, the number of children stays the same or declines over time. The number of prime working-age people increases in the ‘youngest’ countries and declines in the ‘oldest’ while increasing slightly in Myanmar. The older population, including those over the age of 80, continues to increase in Myanmar and the other countries. The population aged 60-79 grows faster in the youngest country group and the population over 80 years grows most rapidly in the oldest country group. These changes reflect the later onset of fertility decline in the youngest countries. Table 3.8 compares the projected indicators of population ageing for ASEAN countries in 2050 to the projected population for Myanmar from the 2014 Census analysis. In three countries, older people are expected to comprise more than 30 per cent of the total population, and the older age dependency ratio to exceed 50, meaning that every two persons in the prime working-age population will have at least one older person to support. Myanmar will maintain its position in the middle of the ASEAN countries, ageing less rapidly than the oldest countries and more rapidly than the other countries.

Census Report Volume 4-L – The Older Population20
Chapter 3. Demographic change and the older population in Myanmar
See Appendix 1, Table 3 for the projected populations by functional age group for the ASEAN countries from the World Population Prospects, 2015.
Figure 3.5 Projected population by functional age groups for Myanmar and other ASEAN countries, 2015, 2035 and 2050
Note: ‘Oldest countries’ are Singapore, Thailand, Viet Nam and Malaysia. ‘Youngest countries’ are Indonesia, Brunei
Darussalam, the Philippines, Timor-Leste, Cambodia and Lao PDR. These countries are grouped according to
whether they are older or younger than Myanmar.
Table 3.8 Projected indicators of population ageing in 2050 for Myanmar and other ASEAN countries
Country Total population in
‘000s
% 60+ % 80+ Index of ageing
Dependency ratios Potential support
ratioTotal Child Older age population
Singapore 6,682 40.4 13.8 366.7 105.8 22.7 83.1 1.2
Thailand 62,452 37.1 9.9 292.0 99.1 25.3 73.8 1.4
Brunei Darussalam 546 31.0 6.2 208.6 84.5 27.4 57.1 1.8
Viet Nam 112,784 27.9 6.2 161.7 82.2 31.4 50.8 2.0
Malaysia 40,725 23.6 3.6 139.6 67.9 28.3 39.5 2.5
Myanmar 64,984 20.2 3.7 102.0 66.6 33.0 33.6 3.0
Indonesia 322,236 19.2 2.3 96.0 64.5 32.9 31.6 3.2
Cambodia 22,547 17.6 2.6 81.1 64.7 35.7 29.0 3.4
Lao PDR 10,172 14.6 1.6 67.9 56.8 33.9 23.0 4.4
Philippines 148,260 14.0 1.6 59.1 60.6 38.1 22.5 4.4
Timor-Leste 2,162 8.0 0.9 24.6 68.6 55.1 13.6 7.4
500,000 400,000 300,000 200,000 100,000 0 100,000 200,000
2015
2035
2050
2015
2035
2050
2015
2035
2050
Myanm
arYo
unge
stcoun
tries
Oldest
coun
tries
Population in '000s
0-14
15-59
60-79
80+

Census Report Volume 4-L – The Older Population 21
Chapter 3. Demographic change and the older population in Myanmar
3.5 Summary
Myanmar’s population has aged between 1973 and 2014. While the total population increased at an annual rate of 1.4 per cent, the population aged 60 and over increased annually by 2.4 per cent. The median age of the 2014 enumerated population was 27.1 years. Indicators of population ageing show that people in the prime working ages have a higher burden of looking after older people, but this has been compensated for by a decreased ratio of children aged 0-14 to 100 working-age adults.
Within the older population, the oldest age group, those over 80 years old, has been growing much faster than those aged 60-79 years. With the increase in the oldest age group, there has also been an increase in the proportion of older women. This is the result of the longer life expectancy of women compared to men.
If the ASEAN countries are ranked by the degree of population ageing, Myanmar is in the middle. It is much younger than richer countries such as Singapore, Malaysia, Viet Nam, and Thailand, that had an earlier and more rapid fertility decline. It is slightly older than the other ASEAN countries which still have high fertility.
Population projections prepared based on the 2014 Census suggest that in 2050 Myanmar may have a population structure that looks like Singapore today, with equal numbers of older people and children and approximately 20 per cent of the population aged 60 and over. Myanmar’s gradual fertility decline means that population ageing will occur more slowly than it has in other countries in the region.
In 2014, the urban population was slightly older than the rural population. This is the result of a more rapid decline in urban fertility, offset by net migration to urban areas by young people of working age. The urban population is projected to become younger than the rural population in the future, based on assumptions of a decline in rural fertility.

Census Report Volume 4-L – The Older Population22
Chapter 4. Social characteristics of older persons Chapter
4.
This chapter describes the social and demographic characteristics of the older population and, where relevant, compares them to younger age groups. The purpose is to understand the current composition of the older population, what it looked like in the past and what it might look like in the future. Section 4.1 looks at the proportion of older people living in urban and rural areas. In Myanmar, living in an urban area affects many aspects of life, including access to different forms of employment, more education opportunities, and better public infrastructure such as electricity and roads. Section 4.1 also documents the extent to which older people have moved residence over their lifetime and particularly in their older years.
A spouse and adult children are important sources of support and comfort in old age. Section 4.2 explores older people’s marital status and, for females, the number of living children.
The ability to read and write and the experience of going to school provide lifelong benefits. Older adults who have attended secondary school should be better able to manage their economic affairs and acquire and act on information about services and healthy behaviours than their less educated peers. Section 4.3 examines the proportion of older people who are literate and their level of educational attainment.
The social characteristics of older people cannot be fully understood without an appreciation of the social and economic changes that have occurred in their lifetime. Table 4.1 shows when the currently older population was born and the years in which they had their twelfth and twentieth birthdays, corresponding roughly to schooling and starting life as an adult. The table also shows how old they were during key events in Myanmar’s history: the Japanese occupation during WWII followed by independence from the United Kingdom in 1948. The youngest of the older population in 2014 would have finished their schooling in the mid-1960s; the oldest people would have gone to school (or been the age when they could have gone to school), in the colonial era of the 1930s. Virtually everyone aged 60 and over in 2014 spent most or all of their adult life after independence. The older population enumerated thirty years earlier in the 1983 census were born at the turn of the century up to the beginning of the 1920s. They spent most of their working adult life under British rule; the younger cohorts in 1983 would have been in their young middle ages during WWII.

Census Report Volume 4-L – The Older Population 23
Chapter 4. Social characteristics of older persons
Table 4.1 Birth cohorts of the older population in 2014 and 1983, by timing of significant ages and historical events
Age group Birth years Aged 12 Aged 20 Age in 1948
Age in 2014
60-64 1950-54 1962-66 1970-74
65-69 1945-49 1957-61 1965-69 Up to 3
70-74 1940-44 1952-56 1960-64 4-8
75-79 1935-39 1947-51 1955-59 9-13
80-84 1930-34 1942-46 1950-54 14-18
85-89 1925-29 1937-41 1945-49 19-23
90+ 1924 and earlier 1936 and earlier 1944 and earlier 24 and older
Age in 1983
60-64 1919-23 1931-35 1939-43 25-29
65-69 1914-18 1926-30 1934-38 30-34
70-74 1909-13 1921-25 1929-33 35-39
75-79 1904-08 1916-20 1924-28 40-44
80-84 1899-1903 1911-15 1919-23 45-49
85-89 1894-98 1906-10 1914-18 50-54
90+ 1893 and earlier 1905 and earlier 1913 and earlier 55 and older
4.1 Place of residence and residential mobility
4.1.1 Urban - rural distribution of the older population Myanmar remains a predominantly rural society, but it is gradually becoming more urban. In 1983, 24.8 per cent of the total population was enumerated in urban areas; in 2014, 29.6 per cent of the population was urban (Table 4.2). The percentage of older people living in urban areas increased slightly more than the total population, from 24.1 per cent in 1983 to 30.5 per cent in 2014. Men aged 70-79 had the largest shift towards urban living, increasing from only 21.7 per cent in 1983 to 29.0 per cent in 2014 (or 7.3 percentage points).

Census Report Volume 4-L – The Older Population24
Chapter 4. Social characteristics of older persons
Table 4.2 Percentage of the population living in urban areas by functional age group by sex by age groups within the older population, 1983 and 2014 censuses
Functional age group/Sex 1983 2014
Total population % urban Total population % urban
Both sexes 34,124,908 24.8 50,279,900 29.6
0-14 13,159,645 22.9 14,399,569 24.9
15-59 18,794,731 26.2 31,405,923 31.6
60+ 2,170,532 24.1 4,474,408 30.5
Male 16,939,593 24.9 24,228,714 29.4
0-14 6,663,105 23.1 7,296,904 25.2
15-59 9,257,232 26.4 15,010,470 31.4
60+ 1,019,256 22.7 1,921,340 29.3
Female 17,185,315 24.7 26,051,186 29.8
0-14 6,496,540 22.8 7,102,665 24.6
15-59 9,537,499 26.0 16,395,453 31.8
60+ 1,151,276 25.3 2,553,068 31.4
Within the older population
Both sexes
60-69 1,365,815 24.1 2,641,338 30.7
70-79 631,031 23.7 1,266,468 29.9
80+ 173,686 25.0 566,602 30.9
Male
60-69 652,904 23.2 1,178,658 29.4
70-79 291,693 21.7 529,994 29.0
80+ 74,659 22.1 212,688 29.1
Female
60-69 712,911 25.0 1,462,680 31.7
70-79 339,338 25.3 736,474 30.5
80+ 99,027 27.2 353,914 32.0
Another feature of the urbanization of Myanmar’s older population is that older females aged 60 and over were slightly more likely to be living in urban areas than older males in both 1983 and 2014. In 2014, the percentage in urban areas was higher for older females than older males in each broad older age group.
The increasing number of older people living in urban areas means that urban areas have aged faster than rural areas. This can be seen in Figures 4.1 and 4.2, based on the numbers in Appendix 1, Table 2. Figure 4.1 shows that children make up a smaller proportion while the prime working age and older adult populations make up a larger proportion of the 2014 population compared to the 1983 population and that the change is more pronounced in urban areas. Figure 4.2 shows that the population of urban females is older than the population of urban males and that the differences in age distribution between the sexes are greater in 2014 than in 1983.

Census Report Volume 4-L – The Older Population 25
Chapter 4. Social characteristics of older persons
Figure 4.1 Percentage of population by functional age groups, urban and rural areas, 1983 and 2014 censuses
Figure 4.2 Percentage of population by functional age groups, by sex, urban area, 1983 and 2014 censuses
The balance in favour of older women living in urban areas could be caused by differences in life expectancy between urban males and females, which will be discussed in Chapter 7, and differences in movement to urban areas.
4.1.2 Older people’s migration within MyanmarThree quarters of older people are living in the same Township in which they were born. However, Table 4.3 shows the large difference between people in urban and rural areas. While almost all rural older people (88.8 per cent) are living in the same Township in which they were born, this is true for less than half of urban older people. Most urban residents who had moved from their birthplace came from another urban area in a different Township. This means that most of the urban older people (82.7 per cent) were born in an urban area. Appendix 1, Table 4, provides more detailed information on birthplace and usual residence by age group and sex. The rates of moving are slightly higher among older men than among
38.6 35.7 39.528.6 24.1 30.6
55.1 58.2 54.162.5 66.7 60.7
6.4 6.2 6.4 8.9 9.2 8.8
0
10
20
30
40
50
60
70
80
90
100
Union Urban Rural Union Urban Rural
1983 2014
Percen
tage
60+
15-59
0-14
36.5 34.925.8 22.5
58.0 58.366.3 67.2
5.5 6.8 7.9 10.3
0
10
20
30
40
50
60
70
80
90
100
Male Female Male Female
1983 Urban 2014 Urban
Percen
tage
60+15-590-14

Census Report Volume 4-L – The Older Population26
Chapter 4. Social characteristics of older persons
older women. Also, the proportions living in a different Township from that of their birthplace are stable from the youngest to the oldest age groups, indicating that these moves took place earlier in life.
Table 4.3 Older persons living in conventional households by area of usual residence and birthplace, 2014 Census
Area of usual residence
Population Living in Township of birth
Area of birthplace Total
Urban area Rural area
Union 4,322,081 75.8 12.8 11.4 100
Urban 1,308,073 45.8 36.9 17.3 100
Rural 3,014,008 88.8 2.3 8.9 100
Note: Totals exclude persons whose area or Township of birth or usual place of residence could not be classified.
Nevertheless, some older people do move to other Townships. Worldwide, young adults are the most mobile group. In Myanmar, the rate of recent migration (persons moving to another Township in the five years prior to the Census as a percentage of all persons) is highest among those aged 15-29. However, in some countries there is a small increase in migration rates in the older age groups (Bernard et al 2014). Given the preference of older people to live with other family members and the extent of migration by young adults between urban areas and from rural to urban areas, it is possible that older people are moving to be with their adult children. Furthermore, it is likely that these moves are triggered by life events such as retirement, widowhood and increasing disability (Litwak and Longino 1987).
Figure 4.3 illustrates the recent migration rates for people from age 40, to show the effects of increasing age. In Myanmar, it appears that migration becomes less common as people age, reaching the lowest point between ages 75 and 84. However, the rates do plateau between ages 55 and 64, suggesting that there may be some residential moves as people reach those ages. From age 85, the migration rate increases slightly. At all ages, migration within States/Regions is more common than migration across State/Region borders. These rates underestimate the true extent of people moving because the 2014 Census only recorded moves between Townships.

Census Report Volume 4-L – The Older Population 27
Chapter 4. Social characteristics of older persons
Figure 4.3 Percentage of population 40 years old and over living in conventional households by age and movement within and between State/Region, 2014 Census
Figure 4.4 illustrates the difference in recent migration between males and females. Males in the older working ages from 40 to 54 years have higher recent migration rates. These rates crossover female rates between the ages of 55-64. From ages 65-69 females have higher migration rates, possibly because of residential moves following widowhood. The numbers from which Figures 4.3 and 4.4 are derived can be found in Appendix 1, Table 5.
Figure 4.4 Recent migration rates for population 40 years and over living in conventional households, by age by sex, 2014 Census
7.4
6.56.1
5.8 5.7
4.94.4 4.2 4.2 4.4
4.8
0.0
1.0
2.0
3.0
4.0
5.0
6.0
7.0
8.0
40 - 44 45 - 49 50 - 54 55 - 59 60 - 64 65 - 69 70 - 74 75 - 79 80 - 84 85 - 89 90 +
Perc
enta
ge
Age groupMoved within State/Region Moved between State/Region
0.0
1.0
2.0
3.0
4.0
5.0
6.0
7.0
8.0
9.0
40 - 44 45 - 49 50 - 54 55 - 59 60 - 64 65 - 69 70 - 74 75 - 79 80 - 84 85 - 89 90 +
Mig
ratio
n ra
te
Age group
MaleFemale

Census Report Volume 4-L – The Older Population28
Chapter 4. Social characteristics of older persons
4.2 Marital status and numbers of living children
The marital status of older males and females differs enormously. Although overall 56.9 per cent of older persons were married at the time of the 2014 Census, 73.9 per cent of older males and only 44.1 per cent of older females were married. As Table 4.4 shows, older females are more likely to be without a spouse, because of widowhood, divorce or separation or because they have never married (47.3 per cent). The percentages in Table 4.4 can be derived from Appendix 1, Table 6.
A small proportion of older men and women are listed as ‘renounced’. This is equivalent to becoming a monk or a nun. Separate analysis revealed that over 95 per cent of older males and females reporting as renounced lived in an institution. This is discussed in more detail in Chapter 5 which explores living arrangements.
Table 4.4 Percentage of population 15 years old and over by marital status by broad age groups by sex, 2014 Census
Sex/Age group Total population Percentage
Never married
Married Widowed/ Divorced/ Separated
Renounced Total
Both sexes
15-29 13,103,192 62.8 34.8 1.3 1.1 100
30-59 18,302,731 13.9 77.8 7.6 0.8 100
60 and over 4,474,408 6.4 56.9 35.0 1.7 100
Male
15-29 6,377,988 67.4 29.7 0.8 2.1 100
30-59 8,632,482 12.6 82.0 4.0 1.4 100
60 and over 1,921,340 4.1 73.9 18.7 3.3 100
Female
15-29 6,725,204 58.5 39.6 1.7 0.2 100
30-59 9,670,249 15.0 74.0 10.8 0.2 100
60 and over 2,553,068 8.2 44.1 47.3 0.5 100
As men and women age, they are more likely to be widowed. However, as shown in Figure 4.5, at each age group, older women are more likely to be widowed and less likely to be married than older men. This difference is due to the higher life expectancy of females; the practice of women marrying men several years older; and the greater likelihood of widowed men remarrying (which cannot be derived from the Census data). Also notable in Figure 4.5 is the constant proportion of ‘renounced’ men from the age of 75 and the modest higher proportions of women who have never married.

Census Report Volume 4-L – The Older Population 29
Chapter 4. Social characteristics of older persons
Figure 4.5 Percentage of older population by five-year age group by sex, 2014 Census
Over time, the proportion of older people who are married has increased, as can be seen in Figure 4.6. The percentage of older men and women who were married in 1983 was lower than the percentage in 2014. This is probably the result of increasing life expectancy and may have been the effects of years of conflict in the mid-twentieth century which would have had a large impact on the lives of people who were aged 60 and over in 1983.
Figure 4.6 Percentage of older population by marital status by sex, 1983 and 2014 censuses
82.378.7
71.763.4
54.045.0 39.0
57.049.2
39.231.3
23.718.5 16.1
9.012.8
19.727.8
37.145.9
50.9
30.740.2
51.660.5
68.574.0 76.2
0
10
20
30
40
50
60
70
80
90
100
60 - 64 65 - 69 70 - 74 75 - 79 80 - 84 85 - 89 90 + 60 - 64 65 - 69 70 - 74 75 - 79 80 - 84 85 - 89 90 +
Male Female
Percen
tage
Never married Married Widowed Divorced/Separated Renounced
72.9 76.4
38.8 44.3
23.1 18.0
53.5 45.9
0102030405060708090
100
1983 2014 1983 2014
Male Female
Percen
tage
Divorced/Separated
Widowed
Married
Never married

Census Report Volume 4-L – The Older Population30
Chapter 4. Social characteristics of older persons
Another striking demographic change in Myanmar is that many urban females are postponing marriage and many may never marry. As Table 4.5 shows, over 6 per cent of older women aged 75 and over have never married. The percentage is a little lower in rural areas than in urban areas.
Table 4.5 Percentage of women never married aged 40 and over by five-year age group, urban and rural areas, 2014 Census
Age group Union Urban Rural
Total % never married
Total % never married
Total % never married
40-44 1,734,131 14.1 551,383 18.7 1,182,748 11.9
45-49 1,571,107 12.9 504,233 17.1 1,066,874 10.9
50-54 1,376,891 11.9 436,853 15.9 940,038 10.1
55-59 1,115,958 10.8 356,567 14.1 759,391 9.2
60-64 864,805 9.7 270,869 12.1 593,936 8.6
65-69 597,875 8.4 193,431 9.7 404,444 7.7
70-74 411,491 7.4 125,050 8.4 286,441 6.9
75-79 324,983 6.6 99,772 7.9 225,211 6.0
80-84 204,701 6.5 62,628 8.3 142,073 5.7
85+ 149,213 6.3 50,758 8.0 98,455 5.4
60 and over 2,553,068 8.2 802,508 9.9 1,750,560 7.4
4.2.1 Childlessness among older womenThe 2014 Census asked all ever-married women living in conventional households how many children they had ever had. To ensure a complete count, women were asked separately for the number of children currently living in the same household, living elsewhere, and no longer alive (see Figure 4.7 for the questions used in the 2014 Census). Women who had never married and those who were ‘renounced’ were not asked these questions. In this analysis both groups of women are assumed to have had no children. These questions were included in the Census to assist in estimating recent fertility and child mortality. Here they are used to determine the level of support available to older women. The Census did not ask men about their children.
Figure 4.7 Questions 25 to 31 of the Questionnaire, 2014 Census
1
2
3
4
5
6
7
8
1 2
1 2
1 2
1 2
1 2
1 2
1 2
1 2
1 2
1 2
1 2
1 2
1 2
1 2
1 2
1 2
1234567
89
10
12
3456
12
34
56789
1234567
89
10
123456789
123456
78
1234567
1234567
1234567
22222
2
2
11111
1
1
22222
2
11111
1
1
23456
Seria
l Num
ber
Male
23. What work was (Name) mainly doing during the last 12 months? Write detailed work descriptions (for example, Primary teacher, Rice farmer, Taxi driver)
24. What is the major product or service provided in the organisation/enterprise where (Name) mainly worked during the last 12 months? Write detailed descriptions (e.g. Hotel service, Building construction, Garment manufacture)
AGE 10 AND ABOVE AND EMPLOYED
25. Number of children ever born alive(If no children, write “00”)
26. How many of those children are living in this household?
27. How many of those children are living elsewhere (not in this household)?
28. How many of those children are no longer alive (dead)?
Female Female Female
EVER MARRIED WOMEN (AGED 15 AND ABOVE)
htnoMelaMelaM YearMale Female Yes
sI .13htrib evil tsal fo etaD .92thechildstillalive?
NoMale
30. Sex of last livebirth
Fema
le
Number of children ever born aliveLABOUR FORCEyrtsudnInoitapuccO
Particulars of last live birth
HOUSING CHARACTERISTICS
ElectricityLiquefied Petroleum Gas (LPG)
KeroseneBioGasFirewoodCharcoalCoalStraw/GrassOther
Flush
Water Seal (Improved PL)Pit (Traditional pit latrine)
Bucket (Surface latrine)
OtherNo toilet
Dhani/Theke/In leafBambooEarthWoodCorrugated SheetTile/Brick/ConcreteOther
RadioTelevisionLand line phoneMobile phoneComputer
Internet at home
Car/Pick-up/ Truck/Van
Motorcycle/ Moped/ Tuk TukBicycle4 wheel tractorCanoe/BoatMotor Boat
Cart (Bullock)
CondominiumApartment/Flat
Bungalow/ Brick houseSemi-pacca house
Wooden HouseBambooHut 2-3 yearsHut 1 yearOther
Tap water/PipedTube well, boreholeProtected well/SpringUnprotected well/SpringPool/Pond/LakeRiver/Stream/CanalWaterfall/Rain water
Bottled water/water from vending machineTanker/TruckOther
ElectricityKeroseneCandleBatteryGenerator (Private)Water mill (Private)
Solar System/ energyOther
OwnerRenter
Provided free (individual)Government QuarterPrivate Company QuarterOther
34. Main source of lighting in the household
32. Type of housing unit occupied by this household
33. Type of ownership of housing unit
35. Main source of water for drinking and non-drinking in this household
36. Main type of cooking fuel used in this household
39. Which of the following items does your household have? (mark all that apply)
37. Type of toilet used in this household
38. Main construction material of the housing unit
DrinkingNon-
Drinking
FloorWallRoofoNseYoNseY
© DRS Data Services Limited [2013]/O03140813/RLCJ

Census Report Volume 4-L – The Older Population 31
Chapter 4. Social characteristics of older persons
Figure 4.8 shows that the majority of older women (64.0 per cent of all women aged 60 and over) have three or more living children, and 18 per cent of older women have no living children at all. (The numbers from which Figure 4.8 were derived are available in Appendix 1, Table 7).
Figure 4.8 Percentage of women aged 60 and over by number of living children, urban and rural areas, 2014 Census
More details about the availability of children to support older people are shown at Table 4.6 which displays the number of living children by women’s age and urban or rural residence. The table shows that nearly one third of older women are not living with a biological child. Urban women are slightly more likely than rural women to have no living children (20.3 per cent against 17.5 per cent), but rural women are more likely to have no biological children living with them in the same household than urban women (33.4 per cent against 31.5 per cent). The percentage of older women with no living children increases with age because they are more likely to survive their children as they grow older. That is, the older the children are, the more likely they are to have died.
0
5
10
15
20
25
0 1 2 3 4 5 6 7 8 9 10+
Perc
enta
ge
Number of living children
Union
Urban
Rural

Census Report Volume 4-L – The Older Population32
Chapter 4. Social characteristics of older persons
Table 4.6 Percentage of older women’s children living and living in the same household by broad age group, urban and rural areas, 2014 Census
Age group/
Area
Total population
Number of living children (%) Number of children living in the same household
None 1 2 3 or more Total None 1 2 3 or more Total
Aged 60 and over
Union 2,515,552 18.4 7.3 10.4 63.9 100 32.8 37.5 16.9 12.8 100
Urban 783,343 20.3 8.0 12.0 59.7 100 31.5 33.7 18.8 16.0 100
Rural 1,732,209 17.5 7.0 9.6 65.8 100 33.4 39.1 16.0 11.4 100
Aged 60-69
Union 1,441,723 16.7 7.2 11.1 64.9 100 31.5 34.8 18.6 15.1 100
Urban 454,155 19.2 8.1 13.5 59.2 100 31.0 31.8 19.9 17.3 100
Rural 987,568 15.6 6.8 10.0 67.6 100 31.7 36.2 17.9 14.1 100
Aged 70-79
Union 725,595 18.8 7.0 9.2 65.0 100 33.6 40.3 15.5 10.6 100
Urban 219,077 19.8 7.4 9.9 62.9 100 31.0 35.6 18.2 15.2 100
Rural 506,518 18.3 6.9 8.9 65.9 100 34.8 42.3 14.4 8.5 100
Aged 80 and over
Union 348,234 24.4 8.3 9.9 57.4 100 36.7 42.5 12.8 8.0 100
Urban 110,111 25.8 8.9 9.8 55.5 100 34.7 37.7 15.5 12.1 100
Rural 238,123 23.7 8.0 9.9 58.4 100 37.6 44.7 11.6 6.1 100
As will be illustrated in Chapter 5 on living arrangements, being childless does not necessarily mean that older women live alone. In addition to their husband, women may have step- children or adopted children, or co-reside with other family members such as siblings, aunts and uncles, and nieces and nephews. However, the rate of childlessness does show that not all older people have children available to support them in their old age and the rising proportions of women never married, especially in urban areas, means that in the future there will be many more older women with no living children to support them.
4.3 Literacy and educational attainment
Literacy gives people the ability to function in the modern world. Literate people can read newspapers, write letters, and navigate government and financial services. Formal education, especially completion of primary school and higher levels, gives people opportunities to gain employment in government and private businesses. Parents, and especially mothers, who have been educated provide better care to their children and encourage them to complete school. Children who are healthy and educated are more likely to be able to give a higher level of support to their parents. Furthermore, studies from many countries have found that education is the one of the strongest predictors of longevity (Jasilionis and Shkolnikov 2016). However, the older population, and particularly older women, did not have the same educational opportunities as children and youth of today.
It should be noted that information on education attainment was collected for all older persons in the 2014 Census (including those in institutions) but the question on literacy was

Census Report Volume 4-L – The Older Population 33
Chapter 4. Social characteristics of older persons
only asked of people in conventional households. The results presented in this chapter on these two topics refer to different population bases. For more information on education and literacy, and the numbers from which the tables and figures in this chapter are derived, see the 2014 Census thematic report on Education (Department of Population 2017b).
For everyone over the age of five, the 2014 Census recorded if they could read and write in any language. Table 4.7 shows that about one in five (20.9 per cent) of the older population enumerated in conventional households were reported as illiterate in the 2014 Census, compared with less than one in ten of the population in the prime working ages. Older women have an illiteracy rate which is two and a half times higher than older men. The difference is much smaller between males and females in the prime working ages.
Educational attainment was recorded by asking everyone the level of education they had completed. In Table 4.7, a person who had completed at least one year of a level, such as the first year of primary school, is included in that level. Nearly one-third (32.0 per cent) of older people reported having no formal education compared to a little more than 10 per cent (11.3 per cent) of adults in the prime working ages. As seen with literacy, older women have much lower levels of education, with 37.7 per cent reporting never having attended school compared to 24.6 per cent of older men. A lack of education is less common among the youngest of the older population and it rises with age to 45.1 per cent of people aged 80 and over. There is a large difference between male and female educational attainment at all ages within the older population.
As might be expected, completing at least one year of primary and lower secondary level is much lower among older people than younger age groups. Older women who did go to school were more likely not to progress beyond primary school than older men. From lower secondary school to university, older females lag far behind their male counterparts. There is a considerably smaller gender gap in educational attainment among the prime working-age population.

Census Report Volume 4-L – The Older Population34
Chapter 4. Social characteristics of older persons
Table 4.7 Population aged 15-59 and 60 and over by age by sex by literacy status by level of education, 2014 Census
Literacy status and level of education
Population aged 15-59 Population aged 60 and over
Number % Number % Percentage aged
60-69 70-79 80 and over
Literacy
Both sexes
Literate 26,945,166 91.1 3,433,653 79.1 82.9 75.6 68.9
Illiterate 2,648,006 8.9 907,806 20.9 17.1 24.4 31.1
Total 29,593,172 100 4,341,459 100 100 100 100
Male
Literate 12,787,378 93.1 1,621,534 88.8 90.3 87.6 83.5
Illiterate 940,557 6.9 204,373 11.2 9.7 12.4 16.5
Total 13,727,935 100 1,825,907 100 100 100 100
Female
Literate 14,157,788 89.2 1,812,119 72.0 77.2 67.3 60.5
Illiterate 1,707,449 10.8 703,433 28.0 22.8 32.7 39.5
Total 15,865,237 100 2,515,552 100 100 100 100
Level of education
Both sexes
No education 3,547,072 11.3 1,433,709 32.0 26.5 37.7 45.1
Primary 12,942,670 41.2 1,919,423 42.9 45.6 39.2 38.2
Lower secondary 7,024,548 22.4 484,709 10.8 12.1 9.9 6.8
Upper secondary 4,287,322 13.7 283,472 6.3 7.7 5.2 2.5
University 3,314,123 10.6 162,430 3.6 4.5 2.7 1.7
Other 290,188 0.9 190,665 4.3 3.5 5.2 5.6
Total 31,405,923 100 4,474,408 100 100 100 100
Male
No education 1,492,325 9.9 472,385 24.6 21.0 28.6 34.5
Primary 5,786,483 38.5 793,519 41.3 42.5 38.9 40.4
Lower secondary 3,867,858 25.8 286,474 14.9 16.1 14.1 10.3
Upper secondary 2,265,642 15.1 175,507 9.1 10.5 8.0 4.4
University 1,422,511 9.5 98,198 5.1 5.8 4.3 3.1
Other 175,651 1.2 95,257 5.0 4.1 6.1 7.2
Total 15,010,470 100 1,921,340 100 100 100 100
Female
No education 2,054,747 12.5 961,324 37.7 31.0 44.3 51.4
Primary 7,156,187 43.6 1,125,904 44.1 48.2 39.5 36.9
Lower secondary 3,156,690 19.3 198,235 7.8 8.9 6.9 4.8
Upper secondary 2,021,680 12.3 107,965 4.2 5.4 3.3 1.3
University 1,891,612 11.5 64,232 2.5 3.4 1.5 0.9
Other 114,537 0.7 95,408 3.7 3.1 4.5 4.7
Total 16,395,453 100 2,553,068 100 100 100 100
Note: The population base for literacy is persons in conventional households; the population base for educational
attainment is for all persons, both in conventional households and institutions.

Census Report Volume 4-L – The Older Population 35
Chapter 4. Social characteristics of older persons
Not surprisingly, there are considerable differences in the levels of literacy and educational attainment between people living in urban and rural areas. Table 4.8 shows that the percentage of illiterate older persons in rural areas was noticeably higher (at 24.9 per cent) than among the urban older population (11.8 per cent).
Table 4.8 Population aged 15-59 and 60 and over by literacy status by level of education, urban and rural areas, 2014 Census
Literacy status and
level of education
Population aged 15-59 Population aged 60 and over
Total Urban Rural Total Urban Rural
Number % Number % Number % Number % Number % Number %
Literacy
Literate 26,945,166 91.1 8,744,146 96.2 18,201,020 88.8 3,433,653 79.1 1,157,955 88.2 2,275,698 75.1
Illiterate 2,648,006 8.9 342,833 3.8 2,305,173 11.2 907,806 20.9 154,400 11.8 753,406 24.9
Total 29,593,172 100 9,086,979 100 20,506,193 100 4,341,459 100 1,312,355 100 3,029,104 100
Level of education
No education 3,547,072 11.3 460,591 4.6 3,086,481 14.4 1,433,709 32.0 235,644 17.3 1,198,065 38.5
Primary 12,942,670 41.2 2,512,009 25.3 10,430,661 48.6 1,919,423 42.9 498,724 36.5 1,420,699 45.7
Lower secondary
7,024,548 22.4 2,539,985 25.6 4,484,563 20.9 484,709 10.8 266,723 19.5 217,986 7.0
Upper secondary
4,287,322 13.7 2,207,025 22.2 2,080,297 9.7 283,472 6.3 202,702 14.9 80,770 2.6
University 3,314,123 10.6 2,175,496 21.9 1,138,627 5.3 162,430 3.6 138,069 10.1 24,361 0.8
Other 290,188 0.9 34,452 0.3 255,736 1.2 190,665 4.3 22,727 1.7 167,938 5.4
Total 31,405,923 100 9,929,558 100 21,476,365 100 4,474,408 100 1,364,589 100 3,109,819 100
This urban-rural differential also exists for educational attainment. There is more than twice the proportion of persons aged 60 and over in rural areas with no education compared with their urban counterparts (38.5 per cent and 17.3 per cent respectively). As expected, due to better access to education and the prospects of better job opportunities when younger, noticeably higher proportions of urban older people had attained lower secondary (19.5 per cent), upper secondary (14.9 per cent) and university (10.1 per cent) education, than their rural counterparts (for whom the respective proportions were 7.0 per cent, 2.6 per cent and 0.8 per cent, respectively). The educational advantage of living in urban areas is still present. In fact, the literacy rates and educational attainment of the older population in urban areas in 2014 are similar to the levels present among rural adults in the prime working ages.
The increase in literacy among older persons from 1983 to 2014 is noteworthy (Table 4.9). Older men’s literacy rates improved by 11 percentage points from 78.0 per cent to 88.8 per cent, whilst the rates for older women increased by 20 percentage points, from 51.6 to 72.0 per cent.

Census Report Volume 4-L – The Older Population36
Chapter 4. Social characteristics of older persons
Table 4.9 Number and percentage of literate population aged 60 and over living in conventional households by sex, 1983 and 2014 censuses
Sex 1983 2014
Total Number literate
% literate Total Number literate
% literate
Both sexes 2,170,532 1,388,281 64.0 4,341,459 3,433,653 79.1
Male 1,019,256 794,702 78.0 1,825,907 1,621,534 88.8
Female 1,151,276 593,579 51.6 2,515,552 1,812,119 72.0
Improvements in the level of educational attainment since 1983 were also reported in the 2014 Census. Figure 4.9 shows that the percentage of both older males and females with no schooling decreased substantially between 1983 and 2014 and the percentage of older people who had attained primary, lower secondary, upper secondary and university levels increased. However, the gender gap widened, with older men having a much greater educational advantage over older women in 2014 compared to 1983. See Appendix 1, Table 8 for the numbers of persons reporting having completed at least one grade at each educational level.
Figure 4.9 Percentage of population 60 years old and over by educational attainment by sex, 1983 and 2014 censuses
4.4 Summary
Most of the population aged 60 and over enumerated in the Census were born between 1925 and 1950. The oldest were in their youth during WWII and the Japanese occupation. Their access to education and choices about marriage and childbearing were influenced by the times through which they lived.
Myanmar is a predominantly rural country and only 29.6 per cent of the population live in urban areas. Older men are slightly less likely to be living in urban areas (29.3 per cent) than older women (31.4 per cent). Overall, urban populations are a little older than rural populations, largely because the higher fertility rate in rural areas results in a higher proportion of children.
Three quarters of older people are living in the Township where they were born. However, more than half of older people in urban areas were born elsewhere, although most of these people were born in another urban area. Older persons have the lowest recent migration
72.1
78.9
24.6
37.7
18.6
17.6
41.3
44.1
0 10 20 30 40 50 60 70 80 90 100
Male 1983
Female 1983
Male 2014
Female 2014
No education Primary Lower secondary Upper secondary University Other

Census Report Volume 4-L – The Older Population 37
Chapter 4. Social characteristics of older persons
rates of any age, however, there is a small increase in recent migration at the oldest ages suggesting that some older people are moving to other Townships to join family as they become frail.
Most older males are married (73.9 per cent) whereas only 44.1 per cent of older women are married. The proportion of older women who are widowed rises rapidly with age, from 30.7 per cent at ages 60-64 to 60.5 per cent at ages 75-79 to 74.0 per cent among those aged 85-89. This pattern is the result of a number of factors including women marrying men some years older than themselves; and poor life expectancy of males and much higher life expectancy of females. In the past 20 to 30 years there has been a trend of increasing proportions of urban women never marrying. Among urban women aged 60-64, 12.1 per cent were reported to have never married. Among urban women 20 years younger, i.e., aged 40-44, 18.7 per cent have never married.
Never marrying, early widowhood and the mortality of children have contributed to 18.4 per cent of older women having no living biological children. Among women aged 80 and over, 24.4 per cent have no living children. The rates of childlessness are higher in urban areas.
The older population and especially older women, have lower levels of education and literacy than prime working-age adults. This is a result of the lack of opportunities they had when they were young. People who are reported as not being able to read or write comprise 20.9 per cent of the older population: 11.2 per cent of males and 28.0 per cent of females. At every broad age group within the older population, females are more than twice as likely as males to be illiterate. Similarly, 24.6 per cent of older males and 37.7 per cent of older women never attended school. Among today’s youth, literacy and at least some school attendance is nearly universal and this will give them lifelong advantages they will be able to take into old age.
The place of residence, marital status and numbers of children, and the ability to function in the modern world through literacy are important factors which influence the living arrangements and household composition of the older population, which is the subject of the next chapter.

Census Report Volume 4-L – The Older Population38
Chapter 5. Living arrangements of the older population Chapter 5. This chapter explores the living arrangements of older persons. It first considers whether older people are living in institutions. The rest of the chapter focuses on the vast majority of older people living in conventional households. The chapter also includes a brief examination of the characteristics of adults who live with their parents.
Myanmar society places a high value on the reciprocal duties of parents and children. There is a very strong belief in the importance of looking after older members of the family (Department of Population 2012; Teerawichitchainan, Knodel and Pothisiri 2015). This chapter and Chapter 6 will show that these values are widely practiced; most older people live with other relatives and particularly their children, and older members and other family members benefit from this arrangement.
The literature on population ageing in Asia expresses concern that fertility decline, urbanization and economic growth will erode the cultural values of children’s duty to their parents and lead to more older people living alone without support from their children (Teerawichitchainan, Knodel and Pothisiri 2015). These large-scale changes will be discussed in Chapter 9. This chapter focuses on the current pattern of living arrangements for older people and their adult children. Particular attention is directed towards older people who have never married, are widowed, childless or living alone. They are currently likely to be the most vulnerable people and their proportion within the older population can be expected to increase in the future.
5.1 Older people living in institutions
One of the striking features of Myanmar’s older population is that nearly all live in conventional households. It is very rare for an older person to live in an institution.
The most common types of institutions and other collective quarters enumerated in the 2014 Census were related to work, such as work camps and barracks. As Table 5.1 shows, young males aged 15-29 have the highest rates of living in institutions. Only 3.0 per cent of people aged 60 and over were enumerated in places other than conventional households. Older males were more likely to be living in an institution on Census Night than older females (5.0 per cent compared to 1.5 per cent).

Census Report Volume 4-L – The Older Population 39
Chapter 5. Living arrangements of the older population
Table 5.1 Number and percentage of people enumerated in an institution by sex by functional age group, 2014 Census
Age group
Both sexes Male Female
Total population
In institutions Total population
In institutions Total population
In institutions
Number % Number % Number %
Total 50,279,900 2,349,901 4.7 24,228,714 1,674,136 6.9 26,051,186 675,765 2.6
0-14 14,399,569 404,201 2.8 7,296,904 296,168 4.1 7,102,665 108,033 1.5
15-29 13,103,192 1,085,333 8.3 6,377,988 753,691 11.8 6,725,204 331,642 4.9
30-59 18,302,731 727,418 4.0 8,632,482 528,844 6.1 9,670,249 198,574 2.1
60+ 4,474,408 132,949 3.0 1,921,340 95,433 5.0 2,553,068 37,516 1.5
60-64 1,576,845 43,513 2.8 712,040 31,290 4.4 864,805 12,223 1.4
65-69 1,064,493 31,665 3.0 466,618 22,931 4.9 597,875 8,734 1.5
70-74 713,170 21,495 3.0 301,679 15,492 5.1 411,491 6,003 1.5
75-79 553,298 17,967 3.2 228,315 13,091 5.7 324,983 4,876 1.5
80-84 335,576 10,809 3.2 130,875 7,630 5.8 204,701 3,179 1.6
85-89 158,069 5,072 3.2 56,979 3,422 6.0 101,090 1,650 1.6
90+ 72,957 2,428 3.3 24,834 1,577 6.4 48,123 851 1.8
Table 5.1 should not be interpreted as older people being institutionalized and living in long-term care facilities. For many Buddhists, old age is the time to devote themselves to religious practices. As noted in Table 4.4, a small proportion of older people renounce their former life. Over 95 per cent of these older people were recorded as living in an institution, presumably a religious order. If the number of older men and women who were reported as ‘renounced’ are subtracted from the total number of the older population in institutions, the older population in institutions is reduced to 32,221 men (1.7 per cent of the male population over age 60) and 25,733 women (1.0 per cent of the female population over age 60).
These figures from the Census are broadly consistent with the official statistics from the Department of Social Welfare that state that there are not many registered homes for the older population; only 78 in 2015, which housed 3,402 older residents (HelpAge International 2015).
5.2 Household composition
The living arrangements of the vast majority of older people who live in conventional households are derived from the list of all household residents collected by the Census. Like most censuses, the 2014 Census asked people about their relationship to the head of the household. The head of household was defined as ‘the member who makes most of the household decisions and is acknowledged by all members’ (Department of Population 2014). Enumerators were instructed that every household should have a household head who was present on Census Night. In the main questionnaire each individual was recorded as either the head of household or related to the head. Examples of a relationship to a head are spouse, son or daughter, son- or daughter in-law, and non-relative. The coding of the relationship to the head of household made it possible to infer some information about the

Census Report Volume 4-L – The Older Population40
Chapter 5. Living arrangements of the older population
composition of the household but some complex household forms may not be clear. For example, if an older man was a head of household and he lived with people classified as his son and his granddaughter, the granddaughter is probably the son’s daughter, but could be the daughter of another son or daughter not living in the household.
Based on information on the relationship to the head of household, a classification of household composition has been developed to capture the issues most relevant for older people. The purpose is to distinguish between those older people who live alone from those who live with a child and those who have other living arrangements with relatives or non-relatives but without a child. The classification has eight categories: living alone; living only with a spouse; living with a child with or without grandchildren and other residents; living with grandchildren without the adult children, although other family members may live in the house; living with a sibling but not a child; living with other relatives but not a child, grandchild or sibling; living with non-relatives only; and a final category of household arrangements that could not be classified. For example, an older woman living with a grandchild and a sibling would be classified as living with a grandchild without someone from the parental generation.
The proportions of older people living in each of these household types are shown at Table 5.2. The majority of older people, about three-quarters, live with a child with or without other residents. Men are more likely to live with their children than women (76.6 per cent compared to 70.9 per cent). Living alone is rare, although more frequent for women than men. Twelve per cent of older men live alone with a spouse compared to only less than 1 per cent of older women. Other household forms are less common.
Table 5.2 Percentage of household heads aged 60 and over living in conventional households by household composition by sex, 2014 Census
Household composition Both sexes
Male Female
Total persons Number 2,530,908 1,549,758 981,150
Per cent 100 100 100
Living alone 7.9 3.9 14.2
Living only with spouse 7.3 11.5 0.7
Living with a child and anyone else 74.4 76.6 70.9
Living with a grandchild and no children but may live with others 5.7 4.6 7.4
Living with a sibling, no children, no grandchildren but may live with others 2.3 1.3 3.8
Living with other relatives, no children, no grandchildren, and no sibling 1.7 1.3 2.3
Living with non-relatives only 0.5 0.5 0.6
Unclassifiable 0.2 0.2 0.1
The relative proportion of different household forms is remarkably stable as people age. As seen at Figure 5.1, the percentage of older people living with their children remains almost constant from ages 60-64 to 90 and over. The numbers from which Table 5.2 and Figure 5.1 were derived can be found in Appendix 1, Table 9.

Census Report Volume 4-L – The Older Population 41
Chapter 5. Living arrangements of the older population
Figure 5.1 Percentage of household heads aged 60 and over by household composition by sex by age, 2014 Census a) Male
b) Female
Older people in urban and rural areas have similar household compositions (Table 5.3). Living with a child is the most common arrangement in both areas. Living with a grandchild without the child is slightly more common in rural areas, and living with a sibling is more common in urban areas. The local social and economic environment is a major factor influencing household composition. These patterns and their possible causes are discussed in more detail in Chapter 8 on State/Region variations.
8.4
9.6
11.4
12.4
12.4
11.9
10.8
76.3
75.4
74.3
74.1
74.9
76.4
78.5
5.9
6.1
5.8
5.9
5.4
4.7
3.7
0 10 20 30 40 50 60 70 80 90 100
90 +
85 - 89
80 - 84
75 - 79
70 - 74
65 - 69
60 - 64
PercentageLiving aloneLiving only with spouseLiving with a child and anyone elseLiving with a grandchild and no children but may live with othersLiving with a sibling, no children, no grandchildren but may live with othersLiving with other relatives, no children, no grandchildren, and no siblingLiving with non-relatives onlyUnclassifiable
0.5
0.5
0.5
0.5
0.6
0.7
0.9
71.1
71.9
71.5
71.9
71.1
70.8
70.1
9.4
8.6
8.2
8.1
8.1
7.4
6.3
0 10 20 30 40 50 60 70 80 90 100
90 +
85 - 89
80 - 84
75 - 79
70 - 74
65 - 69
60 - 64
PercentageLiving aloneLiving only with spouseLiving with a child and anyone elseLiving with a grandchild and no children but may live with othersLiving with a sibling, no children, no grandchildren but may live with othersLiving with other relatives, no children, no grandchildren, and no siblingLiving with non-relatives onlyUnclassifiable

Census Report Volume 4-L – The Older Population42
Chapter 5. Living arrangements of the older population
Table 5.3 Percentage of household heads aged 60 and over by household composition, urban and rural areas, 2014 Census
Household composition Union Urban Rural
Total persons Number 2,530,908 767,067 1,763,841
Per cent 100 100 100
Living alone 7.9 5.8 8.8
Living only with spouse 7.3 5.6 8.0
Living with a child and anyone else 74.4 76.9 73.3
Living with a grandchild and no children but may live with others 5.7 5.0 6.0
Living with a sibling, no children, no grandchildren but may live with others
2.3 3.1 1.9
Living with other relatives, no children, no grandchildren, and no sibling 1.7 2.3 1.5
Living with non-relatives only 0.5 1.0 0.3
Unclassifiable 0.2 0.2 0.2
Marital status influences household composition but, as Table 5.4 shows, not as strongly as might be expected. Only 12.9 per cent of older people who are married live alone with their spouse. Even those older people reported to be single (meaning never married as defined by the Census) live with household members described as their child/adopted child.
Table 5.4 Percentage of household heads aged 60 and over by household composition by marital status, 2014 Census
Household composition Total Single Married Widowed Divorced/ Separated
Renounced
Total (=100%) 2,530,908 112,933 1,410,975 968,653 37,929 418
Living alone 7.9 29.9 1.8 13.3 29.7 35.2
Living only with spouse 7.3 0.3 12.9 0.3 0.3 3.1
Living with a child and anyone else 74.4 7.2 78.1 77.6 55.8 45.5
Living with a grandchild and no children but may live with others
5.7 8.5 4.9 6.6 6.1 4.5
Living with a sibling, no children, no grandchildren but may live with others
2.3 37.8 0.4 0.7 4.1 3.6
Living with other relatives, no children, no grandchildren, and no sibling
1.7 14.0 1.2 1.0 2.4 4.5
Living with non-relatives only 0.5 1.8 0.5 0.4 1.2 3.3
Unclassifiable 0.2 0.6 0.2 0.1 0.4 0.2
As discussed in Chapter 4, the current cohort of older women had most of their children prior to the fertility decline in the 1970s and 1980s. This means that most older women have a living child. However, 18.4 per cent of older women reported that they had no living biological children. Table 5.5 shows that, unsurprisingly, women with more living children are more likely to live with at least one child; 66.3 per cent of women with only one living child lives with a child (or a son-/daughter-in-law or adopted child) whereas 81.5 per cent of women with three or more living children live with a child. Among ever-married women, 42.5 per cent who reported they had no living biological children were living with a person described as their child. This could include women living with the widowed spouse of a deceased child, an adopted child or a step-child.

Census Report Volume 4-L – The Older Population 43
Chapter 5. Living arrangements of the older population
Table 5.5 also shows the difference in urban and rural women’s living arrangements. Rural women are nearly twice as likely to be living alone or only with their husband than urban women, regardless of how many living children they have. This may be the result of more housing availability in rural areas, permitting older persons to live near but not with their adult children. Unfortunately, information on the proximity to adult children is not available from the Census.
Table 5.5 Percentage of ever-married women aged 60 and over who are household heads by household composition by number of living children, urban and rural areas, 2014 Census*
Area/Household Composition Number of living children
Total None One Two Three or more
Union
Total Number 899,352 57,392 67,920 99,637 674,403
Per cent 100 100 100 100 100
Living alone 12.7 32.3 17.7 15.3 10.1
Living only with spouse 0.7 1.4 0.9 0.8 0.7
Living with a child and anyone else 76.8 42.5 66.3 71.9 81.5
Living with a grandchild and no children but may live with others 7.3 11.5 10.0 8.9 6.5
Living with a sibling, no children, no grandchildren but may live with others 0.8 4.6 2.1 1.1 0.3
Living with other relatives, no children, no grandchildren and no sibling 1.1 5.9 1.9 1.2 0.6
Living with non-relatives only 0.4 1.5 0.8 0.6 0.3
Unclassifiable 0.1 0.3 0.2 0.2 0.1
Urban
Total Number 295,038 19,041 24,484 37,661 213852
Per cent 100 100 100 100 100
Living alone 7.7 22.4 12.3 9.2 5.6
Living only with spouse 0.7 1.3 1.0 0.8 0.6
Living with a child and anyone else 81.9 46.9 70.9 78.6 86.9
Living with a grandchild and no children but may live with others 6.3 12.5 9.0 7.3 5.3
Living with a sibling, no children, no grandchildren but may live with others 1.1 6.4 2.5 1.3 0.4
Living with other relatives, no children, no grandchildren and no sibling 1.4 7.5 2.6 1.6 0.7
Living with non-relatives only 0.8 2.7 1.5 1.1 0.5
Unclassifiable 0.1 0.2 0.2 0.1 *
Rural
Total Number 604,314 38,351 43,436 61,976 460,551
Per cent 100 100 100 100 100
Living alone 15.1 37.2 20.8 19.0 12.2
Living only with spouse 0.8 1.4 0.9 0.8 0.7
Living with a child and anyone else 74.3 40.4 63.8 67.9 79.0
Living with a grandchild and no children but may live with others 7.8 11.1 10.5 9.9 7.0
Living with a sibling, no children, no grandchildren but may live with others 0.7 3.7 1.8 0.9 0.3
Living with other relatives, no children, no grandchildren and no sibling 0.9 5.1 1.5 1.0 0.5
Living with non-relatives only 0.3 0.8 0.4 0.3 0.2
Unclassifiable 0.1 0.3 0.2 0.2 0.1
* Less than 0.1 per cent.

Census Report Volume 4-L – The Older Population44
Chapter 5. Living arrangements of the older population
5.3 Children who co-reside with their parents
Even though most older people live with an adult child, not all adults live with their parents. Table 5.6 is constructed using the relationship to the head of household. Adults are considered to be living with a parent if they are reported to be: 1) the child, son- or daughter-in-law or adopted child of the head of household; or 2) the head of a household or spouse of the head of a household that contains a household member classified as the parent or parent-in-law of the head of household. This method could miss some adults living with their parents under other household arrangements, such as if the head of household was a sibling or other relative. The table shows that 15.7 per cent of adults aged 40-59 are living in the same household as their parent or parent-in-law. Considering that older women who have a living child have an average of 4.4 children, it is to be expected that not all adult children would live with their parents (see Appendix 1, Table 7).
Men and women are equally likely to be living with a parent or parent-in-law. Adults who are single or divorced/separated are much more likely to be living with the parental generation than those who are married, widowed, or renounced. Co-residence with a parent or parent-in-law is more common in urban than in rural areas but the difference is not large.
There are very large differences in the percentage of adults co-residing with parents by their education level. Adults with no education have the lowest percentage of co-residence. Adults with post-secondary school education are almost three times as likely as those with no education to be co-residing. This is probably because the parents of educated adult children and the children themselves are likely to have more resources than the parents of children with no education. These educated households may be in a better position to afford co-residence.
Table 5.6 Percentage of adults aged 40-59 in conventional households who are residing with their parents or parent-in-laws, by sex by marital status by level of education, urban and rural areas, 2014 Census
Marital status/Level of education Union Urban Rural
Both sexes Male Female
Total population 40-59 10,478,171 4,779,077 5,699,094 3,212,469 7,265,702
% living with parents 15.7 15.3 16.0 19.3 14.1
Marital status
Single 45.0 44.1 45.4 42.9 46.5
Married 11.8 12.4 11.2 14.9 10.5
Widowed 12.7 14.3 12.3 15.1 11.5
Divorced/Separated 28.3 31.7 26.4 28.9 28.0
Renounced 13.1 9.4 19.6 17.1 11.3
Level of education
None 10.6 11.7 9.9 11.3 10.5
Primary 13.7 13.0 14.2 13.6 13.7
Lower secondary 18.1 17.2 19.3 18.9 17.4
Upper secondary 22.1 21.2 23.2 23.0 20.5
University 29.7 25.1 33.4 30.0 29.0
Other 10.1 10.0 10.3 11.4 10.0

Census Report Volume 4-L – The Older Population 45
Chapter 5. Living arrangements of the older population
Table 5.7 reveals more about the dynamics of co-residence. The table contains only adults living with a parent or parent-in-law and shows the percentage living in a house where the parent is the head of household. This is a more common living arrangement than the adult child being the head of household. Among males living with a parent or parent-in-law, 62.8 per cent are classified as a member of the household. Females are even more likely to be classified as a member of a parental household (70.5 per cent). This arrangement is more common in urban than in rural areas. Married adults are the least likely to live with a parent as a household member rather than as a head of household; single, divorced/separated or renounced persons are the most likely. The more education an adult has, the more likely he or she will be classified as a member of the parental household rather than as the head of household or the spouse of the head. This reinforces the finding that co-residence in the parental household is more common among urban families. In rural areas and among households with less education, it is more common for older parents to join their children’s home – or to transfer the role of head of household to the next generation.
The numbers from which Tables 5.6 and 5.7 have been derived are in Appendix 1, Table 10.
Table 5.7 Percentage of adults aged 40-59 classified as the child or daughter/son-in-law of the household head by marital status by level of education by sex, urban and rural areas, 2014 Census
Marital status/Level of education Male Female
Union Urban Rural Union Urban Rural
Population living with a parent 731,469 270,802 460,667 913,318 347,908 565,410
% living in a household with parent as head 62.8 71.7 57.6 70.5 76.4 66.9
Marital status
Single 92.4 95.3 90.4 95.2 95.4 95.0
Married 51.6 61.6 46.0 51.7 61.4 46.0
Widowed 70.2 79.1 66.5 71.7 76.8 68.2
Divorced/Separated 89.9 93.5 87.8 86.0 87.2 85.3
Renounced 92.3 92.5 92.1 93.0 89.1 95.3
Level of education
None 53.4 65.2 51.7 58.6 64.5 57.7
Primary school 58.1 66.2 56.3 67.4 70.1 66.7
Lower secondary 65.9 72.6 60.5 73.4 75.9 70.7
Upper secondary 71.5 75.0 64.8 77.2 78.7 73.6
University 71.7 72.8 68.4 82.0 82.3 81.1
Other 51.4 58.0 50.6 63.6 62.8 63.7

Census Report Volume 4-L – The Older Population46
Chapter 5. Living arrangements of the older population
5.4 Summary
The custom of older people living with their adult children is firmly entrenched in Myanmar. It is rare for an older person to live in an institution other than a religious order. About three-quarters of older people living in conventional households co-reside with one or more son or daughter or son- or daughter-in-law. Older men and women living in urban and rural areas are equally likely to live with their children. Some 15 per cent of older men and women live alone or with only a spouse and this proportion decreases with age. Approximately 6 per cent of older people live with a grandchild but no child, and another 2 per cent live with a sibling.
The preference for living with younger family members is so strong that marital status has very little effect on household composition. Older people who are married and those who are widowed are equally likely to live with their children.
The parents of adults aged 40-59 can be assumed to be aged 60 and over. Among adults aged 40-59, at least 15.7 per cent live with a parent. Single adults are most likely to live with a parent as well as adults with more education than those with little or no education. The most common arrangement is for adults to live in households in which their parent is the household head. However, this arrangement is less common for rural adults and adults with lower levels of education. Housing shortages in urban areas may be another factor leading to higher rates of co-residence than in rural areas.
The influence of household composition by the wealth of households with older members will be discussed in Chapter 6.

Census Report Volume 4-L – The Older Population 47
Chapter 6. Economic conditions of the older population Chapter 6.
This chapter reviews the economic conditions of older people in Myanmar. The first section examines their main activities as economically productive persons. It describes the proportion in the labour force, their type of economic activity and the occupations and industries in which they work. To the extent possible, the situation of the older population in 2014 is compared to their situation in 1983.
The second section considers the diversity of economic circumstances experienced by older adults: their quality of housing, access to services such as water, sanitation and electricity, and access to communication devices and transport facilities that affect their material well-being.
In the absence of government support, care by family members within and outside of the household is essential for most older people. Although it is not possible to directly measure support from family members, this chapter describes how they benefit from living with economically active adult children, building on the analysis of household composition in Chapter 5. Using a Wealth Index comprised of those measures, households with older members are compared to those without older members, controlling for the size of the household and number of employed people in the prime working ages. Despite the prevalence of older people living with their children, as shown in Chapter 5, many older people live in very disadvantaged circumstances, in poor quality housing and with relatively few amenities or assets. Those living alone are the most disadvantaged.
6.1 Main activities of the older population
The 2014 Census recorded the ‘usual activity’ of all people over the age of 10. Figure 6.1 illustrates the transition in usual activities from prime working age to older age. In part because of mandatory retirement, employment in government and private organizations is much less common for people aged 60 and over, compared to prime working-aged adults in other occupations. Working as an own account worker declines with age, although it is more common among older persons in their sixties than it is for prime working-aged adults. Contributing to a family business also becomes less common with age, possibly because the family business has been passed on to the next generation. Even the relative proportion of people reporting that they are involved in household work diminishes with age. In each successive age group, a larger proportion of people describe themselves as ‘pensioners, retired or an older person’. More details on the main activities of the older population by sex, urban or rural location and age group can be found in Appendix 1, Tables 11 and 12.

Census Report Volume 4-L – The Older Population48
Chapter 6. Economic conditions of the older population
Figure 6.1 Percentage of prime working age (15-59) persons and the older population by main activity in the past 12 months by age group, 2014 Census
Transitioning to retirement occurs in both urban and rural areas and for males and females. Table 6.1, taken from Appendix 1, Tables 11 and 12, shows that women transition out of the labour force slightly earlier than men. Those living in rural areas transition out of the labour force at older ages than those living in urban areas. Those in rural areas continue to work longer than their urban counterparts in other Asian countries as well, primarily because they lack the resources to retire earlier (World Bank 2016).
Table 6.1 Percentage of population 60 years and over who reported being retired, by sex by age group, urban and rural areas, 2014 Census
Sex/Area 60-64 65-69 70-74 75-79 80-84 85-89 90+
Male 24.3 38.2 56.2 66.3 73.3 74.7 71.7
Female 24.3 39.5 59.7 70.0 77.4 78.2 76.8
Urban 33.2 48.1 63.7 71.4 75.9 75.6 73.2
Rural 20.5 34.8 55.9 67.3 75.8 77.6 76.0
6.1.1 Unpaid work by the older populationOlder people actively participate in their family and community. The 2012 Survey of Older Persons found that 79 per cent of people aged 60 and over attended community or religious ceremonies at least occasionally and 48 per cent attended community meetings at least occasionally (Knodel 2014). The same report found that 45 per cent of older men and 64 per cent of older women who lived with one or more children were doing some housework, although in the majority of cases they were not the main person responsible for the housework in the household.
3.8
3.6
4.5
7.5
12.0
19.6
25.7
25.0
3.8
4.4
5.3
9.1
13.2
20.4
24.4
20.7
75.1
77.0
75.8
68.5
58.2
39.0
24.3
1.0
0 10 20 30 40 50 60 70 80 90 100
90+
85-89
80-84
75-79
70-74
65-69
60-64
15-59
PercentageEmployee (government) Employee (private org.) EmployerOwn account worker Contributing family worker Sought workDid not seek work Full-time student Household workPensioner, retired, older person Ill, disabled Other

Census Report Volume 4-L – The Older Population 49
Chapter 6. Economic conditions of the older population
These important contributions of older people are not captured directly by the Census. The main or usual activities only capture contributing to a family business as an unpaid worker and household work. If a person was doing this work but did not consider it as his or her ‘usual’ activity’, it would not be reported. Table 6.2 shows that the proportion of older persons contributing as a family worker is very low and declines with age. Rural older people are more likely to report that they are contributing family workers than urban older people. Only 1 per cent of males reported that their main activity was household work. Nearly 30 per cent of older females reported household work as their main activity; this proportion declines from over 40 per cent among women aged 60-64 to about 15 per cent of those aged 75-79 and less than 10 per cent among women aged 80-84.
Table 6.2 Proportion of older population and prime working aged adults whose main activity is ‘contributing family worker’ or ‘household worker’ by sex by age group, urban and rural areas, 2014 Census
Age group/ Main activity
Male Female
Union Urban Rural Union Urban Rural
Contributing family worker
15-59 9.4 3.7 12.0 13.0 4.0 17.1
60+ 2.2 1.1 2.7 4.4 1.6 5.7
60-64 2.9 1.4 3.5 6.9 2.5 8.9
65-69 2.5 1.1 3.1 5.0 1.8 6.6
70-74 1.8 0.8 2.2 3.0 1.1 3.8
75-79 1.2 0.5 1.5 1.9 0.8 2.4
80-84 1.0 0.5 1.2 1.3 0.5 1.6
85+ 1.0 0.5 1.3 1.1 0.5 1.4
Household worker
15-59 1.2 1.5 1.1 38.5 39.0 38.3
60+ 1.2 1.4 1.1 29.4 31.1 28.6
60-64 1.3 1.6 1.1 43.4 44.9 42.8
65-69 1.3 1.6 1.2 35.2 36.2 34.7
70-74 1.2 1.2 1.2 22.0 24.3 20.9
75-79 1.1 1.2 1.1 14.6 17.0 13.6
80-84 0.9 1.0 0.9 8.2 10.6 7.1
85+ 0.9 1.0 0.8 6.0 7.9 5.1
6.1.2 Labour force participation of the older populationPeople who described their main activity in the past 12 months as employers; employed by a private organization or by government; working as an own account worker (self-employed); working as a contributing family worker (unpaid); or seeking work are classified as being in the labour force.
Labour force participation declines with age. However, because of the limited coverage of pensions and other social security schemes in Myanmar, many older people continue to work. As shown in Table 6.3, 30.3 per cent of people aged 60 and over were recorded as being in the labour force in 2014. This is more than half the level of participation among those aged 15-59, recorded at 68.1 per cent. There was an even larger difference between the sexes

Census Report Volume 4-L – The Older Population50
Chapter 6. Economic conditions of the older population
in the percentage of older people reported as being active in the labour force: less than one in five older females (17.8 per cent) compared to almost a half (46.8 per cent) of older males. Table 6.3 Labour force participation of the population aged 15-59 and 60 and over by sex, 2014 Census
Labour force participation
Population aged 15-59 Population aged 60 and over
Both sexes Male Female Both sexes Male Female
Number % Number % Number % Number % Number % Number %
Total population 31,405,923 100 15,010,470 100 16,395,453 100 4,474,408 100 1,921,340 100 2,553,068 100
In the labour force 21,395,550 68.1 12,927,584 86.1 8,467,966 51.6 1,354,213 30.3 899,536 46.8 454,677 17.8
Employed 20,526,532 65.4 12,413,267 82.7 8,113,265 49.5 1,346,007 30.1 893,783 46.5 452,224 17.7
Unemployed 869,018 2.8 514,317 3.4 354,701 2.2 8,206 0.2 5,753 0.3 2,453 0.1
Not in the labour force 10,010,373 31.9 2,082,886 13.9 7,927,487 48.4 3,120,195 69.7 1,021,804 53.2 2,098,391 82.2
Unemployment rate - 4.1 - 4.0 - 4.2 - 0.6 - 0.6 - 0.5
Note: The population includes both the conventional and institutional populations.
Figure 6.2 shows that men’s labour force participation declines very quickly from the age of 55. Women’s labour force participation begins to gradually decline from ages 20-24 and then there is a more rapid decline from ages 50-54. Among those people aged 80 and over, about 15 per cent of men and 5 per cent of women remain in the labour force. (See Table E-1a in Department of Population 2015 to derive the rates in Figure 6.2).
The labour force participation of the older population has declined since 1983. In the 1983 Census, 60.8 per cent of men aged 60 and over were economically active, compared to 46.8 per cent in 2014 (Census Division 1986). The labour force participation of older women was 29.1 per cent in 1983 and 17.8 per cent in 2014. Unfortunately, the 1983 census report did not break down the older population into smaller age groups, so it is not possible to examine if the decline in the labour force participation occurred at younger ages or only at the oldest ages.
The Census question about ‘usual’ activity in the 12 months prior to the Census may underestimate the labour force participation by older age groups; people may not have reported part-time and episodic or seasonal work. This is relevant because studies in other Asian countries have found that income from labour comprises the largest proportion of older people’s income in countries where there is not a widespread pension scheme (World Bank 2016). The same continuing importance of labour is likely to be true in Myanmar as well. Nevertheless, the contribution from older people’s own labour may be less important than the direct support from adult children. The 2012 Survey of Older Persons found that children were the main source of economic support (or other family members for older people with no children) and that this increased with age as support from older people’s own labour declined (Knodel 2014).
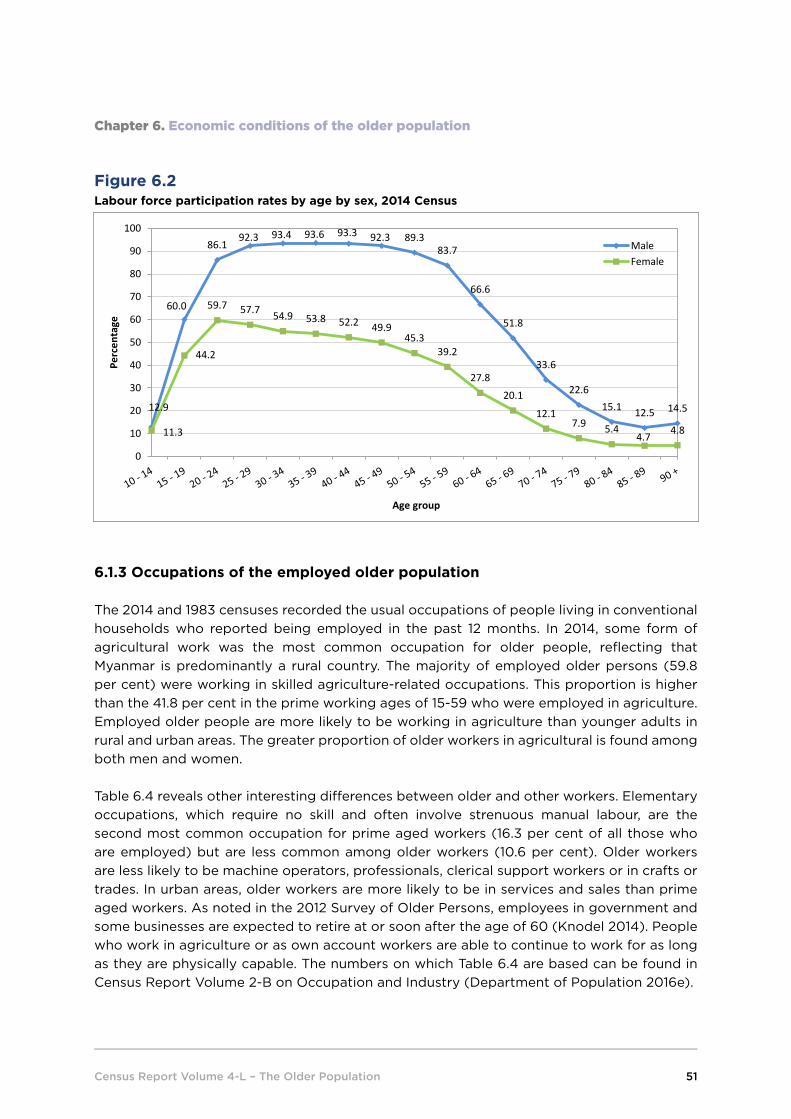
Census Report Volume 4-L – The Older Population 51
Chapter 6. Economic conditions of the older population
Figure 6.2 Labour force participation rates by age by sex, 2014 Census
6.1.3 Occupations of the employed older population
The 2014 and 1983 censuses recorded the usual occupations of people living in conventional households who reported being employed in the past 12 months. In 2014, some form of agricultural work was the most common occupation for older people, reflecting that Myanmar is predominantly a rural country. The majority of employed older persons (59.8 per cent) were working in skilled agriculture-related occupations. This proportion is higher than the 41.8 per cent in the prime working ages of 15-59 who were employed in agriculture. Employed older people are more likely to be working in agriculture than younger adults in rural and urban areas. The greater proportion of older workers in agricultural is found among both men and women.
Table 6.4 reveals other interesting differences between older and other workers. Elementary occupations, which require no skill and often involve strenuous manual labour, are the second most common occupation for prime aged workers (16.3 per cent of all those who are employed) but are less common among older workers (10.6 per cent). Older workers are less likely to be machine operators, professionals, clerical support workers or in crafts or trades. In urban areas, older workers are more likely to be in services and sales than prime aged workers. As noted in the 2012 Survey of Older Persons, employees in government and some businesses are expected to retire at or soon after the age of 60 (Knodel 2014). People who work in agriculture or as own account workers are able to continue to work for as long as they are physically capable. The numbers on which Table 6.4 are based can be found in Census Report Volume 2-B on Occupation and Industry (Department of Population 2016e).
12.9
60.0
86.192.3 93.4 93.6 93.3 92.3 89.3
83.7
66.6
51.8
33.6
22.615.1 12.5 14.5
11.3
44.2
59.7 57.7 54.9 53.8 52.2 49.945.3
39.2
27.820.1
12.17.9 5.4
4.7 4.8
0
10
20
30
40
50
60
70
80
90
100
Perc
enta
ge
Age group
MaleFemale

Cen
sus
Rep
ort
Vo
lum
e 4
-L –
The
Old
er P
op
ulat
ion
52
Cha
pter
6. E
cono
mic
con
diti
ons
of t
he o
lder
pop
ulat
ion
Tab
le 6
.4
Per
cent
age
of
emp
loye
d p
erso
ns a
ged
15-
59 a
nd 6
0 a
nd o
ver,
by o
ccup
atio
n by
sex
, urb
an a
nd r
ural
are
as, 2
014
Cen
sus
Occ
upat
ion
Tota
lU
rban
Rur
alM
ale
Fem
ale
15-5
960
+15
-59
60+
15-5
960
+15
-59
60+
15-5
960
+
Tota
lN
umb
er19
,228
,355
1,31
7,25
25,
464,
885
277,
266
13,7
63,4
701,
039,
986
11,4
82,3
2187
2,40
17,
746,
034
444,
851
Per
cen
t10
010
010
010
010
010
0.0
100
100
100
100
Man
ager
s0.
60.
61.
52.
10.
30.
20.
60.
70.
60.
3
Pro
fess
iona
ls2.
51.
15.
24.
01.
40.
31.
11.
24.
50.
7
Tech
nici
ans
and
Ass
oci
ate
Pro
fess
iona
ls1.
91.
54.
54.
90.
80.
52.
01.
71.
61.
0
Cle
rica
l Sup
po
rt W
ork
ers
2.4
0.7
6.0
2.6
0.9
0.2
2.0
0.9
2.9
0.4
Ser
vice
s an
d S
ales
Wo
rker
s12
.812
.628
.036
.36.
86.
39.
18.
818
.320
.2
Ski
lled
Ag
ricu
ltur
al F
ore
stry
and
Fis
hery
W
ork
ers
41.8
59.8
7.3
16.8
55.5
71.3
44.7
64.5
37.5
50.5
Cra
ft a
nd R
elat
ed T
rad
e W
ork
ers
12.1
6.3
22.1
14.0
8.1
4.3
13.0
7.0
10.8
5.1
Pla
nt a
nd M
achi
ne O
per
ato
rs a
nd A
ssem
ble
rs3.
91.
68.
35.
32.
20.
66.
02.
20.
90.
4
Ele
men
tary
Occ
upat
ions
16.3
10.6
11.0
8.0
18.4
11.3
17.2
11.0
15.0
9.9
Oth
er0.
80.
11.
20.
20.
60.
11.
30.
10.
00.
0
No
t S
tate
d5.
05.
14.
95.
85.
04.
93.
01.
97.
811
.5
Not
e: In
clud
es p
op
ulat
ion
in c
onv
enti
ona
l ho
useh
old
s o
nly.

Census Report Volume 4-L – The Older Population 53
Chapter 6. Economic conditions of the older population
Although the 2014 Census used different occupational categories than the 1983 census, some comparisons can be made. Table 6.5 shows that the main occupation profile of the older population in 2014 was broadly similar to that in the earlier census. The large majority of employed older males and females were engaged in agriculture and related occupations in 1983 (farmers, foresters, fishermen and hunters) (77.7 per cent of males and 67.4 per cent of females). As in 2014, in 1983 older people who were employed were more likely to be working in agriculture and less likely to be in professional, administrative, or clerical occupations or working as labourers. This pattern is also reflected among prime working-aged adults. Employment in agriculture declined from 62.6 per cent to 41.8 per cent between 1983 and 2014. This indicates a diversification of the economy and suggests that if it continues older people of the future will be even less likely to work in agriculture. It also suggests that in the future, when people are employed in non-agricultural occupations or formal employment, older people may find it difficult to continue to be in the labour force unless actions are taken to accommodate older workers.
Table 6.5 Percentage of employed population aged 15-59 and 60 and over by occupation by sex, 1983 census
Occupation 15-59 year olds 60 years and over
Both sexes Male Female Both sexes Male Female
Total persons Number 10,600,307 6,823,878 3,776,429 954,016 619,258 334,758
Per cent 100 100 100 100 100 100
Professional, technical and related workers
2.6 2.3 3.2 1.3 1.7 0.7
Administrative and managerial workers
0.4 0.6 0.1 0.2 0.3 0.1
Clerical and related workers 2.5 3.0 1.8 0.1 0.2 0.0
Sales workers 9.4 6.0 15.4 12.5 7.9 21.1
Service workers 1.8 2.3 0.9 0.9 1.0 0.7
Farmers, foresters, fishermen and hunters
62.6 63.7 60.6 74.1 77.7 67.4
Production and transport operators and labourers
18.7 19.2 17.8 10.7 11.1 9.9
Not classifiable 1.9 2.9 0.2 0.1 0.1 0.1
6.1.4 IndustryA comparison of employment by industry for 1983 and 2014 in Table 6.6 shows that agriculture remains the main area of economic activity in Myanmar, especially for older people even if the proportions of the population of prime working-aged adults and older people working in agricultural industries have declined from 1983 to 2014. This decline has resulted in a shift to other industries specifically the service industries in 2014, especially for older persons and women in their prime working ages. See Appendix 1, Table 13 for a more detailed breakdown of industries reported in the 2014 and 1983 censuses.

Census Report Volume 4-L – The Older Population54
Chapter 6. Economic conditions of the older population
Table 6.6 Percentage of employed people in prime working ages and older people by industry group, 1983 and 2014 censuses
Industry group/Census year 15-59 year olds 60 and over
Both sexes Male Female Both sexes Male Female
1983
Total 10,600,307 6,823,878 3,776,429 954,016 619,258 334,758
Agriculture, forestry, fishing and hunting 63.1 64.4 60.7 74.0 77.6 67.3
Mining and quarrying 0.6 0.8 0.4 0.2 0.2 0.1
Manufacturing 9.5 7.6 13.0 5.7 5.3 6.4
Construction 1.4 2.0 0.3 0.9 1.3 *
Electricity, gas, water and sanitary services 0.2 0.3 * * 0.1 *
Wholesale and retail trade, restaurants and hotels 11.5 7.9 17.9 13.5 9.0 21.9
Transport, storage and communication 3.2 4.8 0.2 1.0 1.5 0.2
Services 7.4 8.9 4.7 1.9 2.4 0.9
Not classified 3.2 3.4 2.8 2.8 2.6 3.2
2014
Total 19,228,355 11,482,321 7,746,034 1,317,252 872,401 444,851
Agriculture, forestry and fishing 51.2 54.2 46.8 66.3 71.1 56.8
Mining and quarrying 0.8 1.2 0.4 0.2 0.3 0.1
Manufacturing 7.0 4.9 10.0 4.2 4.0 4.7
Construction 4.7 7.1 1.2 2.2 3.3 0.2
Electricity, gas, steam and air conditioning supply & water supply; sewerage, waste management and remediation activities
0.4 0.5 0.1 0.2 0.3 *
Wholesale and retail trade; repair of motor vehicles and motorcycles. Accommodation and food service activities
14.1 10.5 19.5 12.7 8.6 20.9
Transportation and storageInformation and communication
4.3 6.9 0.5 1.9 2.8 0.3
Other services 11.3 10.3 12.8 6.2 7.0 4.7
Not stated 6.1 4.4 8.6 5.9 2.7 12.2
*Less than 0.1 per cent.
6.2 Quality of housing and access to facilities The 2014 Census collected information on housing conditions and household amenities, including type of ownership; building materials; sources of drinking water; sources of energy for cooking and lighting; access to sanitation facilities; and access to common devices for communication and means of transport. A selection of these characteristics, distinguishing between urban and rural areas, is presented at Table 6.7. It should be noted that in this section analyses refer to the characteristics of households in which older persons live rather than the characteristics of older persons. Data relating to the full set of household conditions and housing amenities from the 2014 Census are presented in Appendix 1, Table 14.
For most characteristics, households with an older member are more advantaged than households with only younger members. Most households containing at least one person aged 60 and over owned their own dwelling (92.3 per cent). In rural areas, household ownership among households with an older member was almost universal (97.0 per cent)

Census Report Volume 4-L – The Older Population 55
Chapter 6. Economic conditions of the older population
and fairly high (81.4 per cent) among urban households with an older member.
The relative advantage of households with an older member using electricity as a source of energy for lighting and cooking and access to improved water and sanitation is mixed, depending on the area of residence. Table 6.7 shows that most urban households have access to improved water and sanitation; households with an older member have only slightly higher rates of access to these amenities.
For example, 66.2 per cent of rural households with an older member have access to an improved source of drinking water compared to 61.3 per cent of households without an older member. Urban households with an older member are slightly more likely to use electricity as a source of energy for lighting and cooking, but there is almost no difference in electricity use between households with and without an older person in rural areas. Similarly, most urban households have a roof made from a permanent material (tile/concrete/brick/corrugated iron sheet), because semi-permanent materials (wood/bamboo) and temporary materials (dhani/theke/in leaf) are rarely used for roofing in urban residential structures. In rural areas, where permanent roofing material is a capital investment, households with an older member are more advantaged than households consisting of younger members.
Urban and rural households with an older member are much less likely to be living in housing constructed from bamboo, a hut, or other types of dwelling units than households without an older member. However, there is still a large proportion of households with older people living in these types of housing units: 19.6 per cent in urban areas and 37.2 per cent in rural areas.
Similarly, households with an older member are more likely to have access to communication devices such as a radio or television and a telephone (landline or mobile) than households without an older member. There is not much difference, however, in both groups, when it comes to the proportion of households without access to a car, motorbike, or bicycle. It was observed though, that many households with an older member live without these important items of modern life, which facilitate links with family members, local markets and services and the wider world.

Census Report Volume 4-L – The Older Population56
Chapter 6. Economic conditions of the older population
Table 6.7 Summary of housing conditions and amenities, by households with and without an older member, urban and rural areas, 2014 Census
Housing conditions and amenities Households with at least one older member
Households with no older member
Union Urban Rural Union Urban Rural
Total households (=100%) 3,288,183 985,909 2,302,274 7,589,649 2,063,524 5,526,125
Housing tenure
Owner 92.3 81.4 97.0 82.6 58.6 91.5
Renter 4.0 11.0 1.0 8.9 24.7 3.0
Access to electricity
For lighting 35.8 82.0 16.1 31.0 75.4 14.4
For cooking 17.2 44.9 5.4 16.0 43.5 5.7
Improved sources of drinking water 72.7 87.7 66.2 68.1 86.3 61.3
Improved sanitation 79.0 94.1 72.5 72.3 91.4 65.2
Permanent materials for roof* 70.7 89.1 62.8 60.6 84.1 51.8
Type of dwelling: Bamboo, hut, other types 31.9 19.6 37.2 44.9 28.9 50.9
No radio or television 27.9 13.3 34.1 36.3 21.9 41.6
No landline or mobile 62.6 30.8 76.2 67.2 37.9 78.2
No car, motorbike or bicycle 41.9 30.0 47.1 41.8 30.9 45.8
* Includes tile/brick/concrete/corrugated sheets
The differences between households with an older member and those without probably have multiple causes. Firstly, households with older members have, on average, older household heads. That is, the household head is either the older person or their adult child. Over time people acquire the resources to improve their housing quality. Secondly, households with more economic resources are more likely to be able to afford to live with two or three generations under the same roof. These reasons are not mutually exclusive. The next section of this chapter will examine the relationship between the size of households and their economic conditions to explore these two explanations.
6.3 Household size and wealth
The material well-being of older people is of critical importance. The Department of Population constructed a Wealth Index based on questions concerning household conditions and household assets such as construction materials; access to an electricity supply; access to improved drinking water and sanitation; and access to communication and transport assets described in the previous section. Characteristics of individuals, such as occupation or educational attainment are not included in the index. The household variables were combined using a statistical method and the resulting scores were applied to each household. Based on the household scores, each household was assigned to one of five groups, each totalling 20 per cent of all households. Households in Quintile 1 have the lowest Wealth Index, indicating that they have the most disadvantaged material conditions. Households in Quintile 5 have the most advantaged material conditions. The Wealth Index is designed as a measure of the amount of assets that households can access. It shows the relative position of a household compared to other households in the country.

Census Report Volume 4-L – The Older Population 57
Chapter 6. Economic conditions of the older population
The Wealth Index is most often used to compare the assets of different groups. In this section the Wealth Index is used to explore the degree to which households with older persons are better or worse off than households without older persons. As shown in Chapter 5, in Myanmar very few older people live alone or only with their spouse. The vast majority of older people live with an adult child or other relatives. The number of people in a household can affect wealth in a number of ways. Individuals may bring in income or assets to the household or individuals may place a burden on households. In other words, large households have both more hands and more mouths to feed.
Households with an older member are more likely to be in the higher wealth quintiles than households without an older member, as long as there are three or more people in the household (Table 6.8). For small households, comprised of one or two people, households with older members are disproportionately in the lowest wealth quintile. At the most extreme, one third (32.8 per cent) of all older single person households (that is, the older person is living alone) are in the lowest wealth quintile and only 11 per cent are in the highest quintile. Table 6.9 investigates if households with more employed people in the prime working ages of 15-59 are in higher wealth quintiles. Households with at least one older person but no one in the prime working ages who is economically active (24.3 per cent) are less likely to be in the lowest quintile than households without an older person and no employed person in the prime working ages (32.7 per cent). Regardless of the number of employed prime working- aged persons living in the house, households with an older person are more likely to be in a higher wealth quintile than households without an older member. This suggests that older people contribute economically to their households. The contribution could be in the form of assets acquired over a lifetime, through income that they are earning or have earned, or both. See Appendix 1, Table 15 for the numbers from which Tables 6.8 and 6.9 were derived.
Table 6.8 Percentage of households with and without an older member by wealth quintile and number of persons in the household, 2014 Census
Wealth quintile All households Single person households
Two person households
3-6 person households
7 or more person households
With older
member
Without older
member
With older
member
Without older
member
With older
member
Without older
member
With older
member
Without older
member
With older
member
Without older
member
1 (Lowest) 16.2 23.6 32.8 24.6 23.1 25.0 14.6 23.7 11.1 21.5
2 19.5 21.4 27.0 20.8 24.3 20.7 19.2 21.8 14.7 19.9
3 21.6 18.7 17.3 15.0 20.5 16.2 22.6 19.1 20.7 20.3
4 21.6 17.7 12.3 15.0 16.5 16.2 22.3 17.6 26.0 20.3
5 (Highest) 21.1 18.6 10.5 24.5 15.5 21.8 21.4 17.8 27.5 18.0
Total (Per cent) 100 100 100 100 100 100 100 100 100 100
Number of households
3,288,183 7,589,649 198,990 302,098 454,624 897,605 1,961,313 5,501,013 673,256 888,933

Census Report Volume 4-L – The Older Population58
Chapter 6. Economic conditions of the older population
Table 6.9 Percentage of households with and without an older member by wealth quintile and number of prime aged workers (15-59) in the household, 2014 Census
Wealth quintile All households No prime age worker
Only one prime age worker
Two prime age workers
Three or more prime age workers
With older
member
Without older
member
With older
member
Without older
member
With older
member
Without older
member
With older
member
Without older
member
With older
member
Without older
member
1 (Lowest) 16.2 23.6 24.3 32.7 16.9 26.1 13.0 23.5 9.5 16.5
2 19.5 21.4 22.7 21.4 20.2 21.0 18.5 22.4 15.8 20.6
3 21.6 18.7 19.7 15.5 21.2 16.8 22.8 19.1 22.8 22.5
4 21.6 17.7 17.1 14.4 20.8 16.3 23.4 17.6 26.1 21.4
5 (Highest) 21.1 18.6 16.2 16.0 20.9 19.7 22.3 17.4 25.9 19.0
Total (Per cent) 100 100 100 100 100 100 100 100 100 100
Number of households
3,288,183 7,589,649 781,247 441,059 1,028,528 3,052,651 795,470 2,492,439 682,938 1,603,500
Another way to look at Tables 6.8 and 6.9 is from the perspective of older people in the households. Older people benefit from living with younger people who are employed. However, nearly one quarter (24.3 per cent) of households with an older person have no employed person in the prime working ages. Of all households with older members, these are the households which are most likely to be in the lowest wealth quintiles. The more prime working-aged adults living in the household, the higher the wealth quintile of the household. While this is true for all households, the advantage for households with an older member is greater.
6.4 Summary
An understanding of the economic situation of older people is extremely important for the development of policies to safeguard older people’s well-being. This chapter started by considering the economic activity of older people over their life course and the changes since 1983.
Older people working in agriculture remain in the workforce for longer than workers in other occupations and sectors. However, compared to 1983, this form of employment by older people is becoming less common. The retreat from agricultural employment reflects a wider shift away from an agricultural labour force to a more diversified economy. To the extent that non-agricultural employment brings in higher wages and profits, the diversification has brought benefits to the total population, including the older population. On the other hand, barriers such as mandatory retirement may make it more difficult for older people to continue to be economically active, making it even more important to enable people to save for their retirement during their working life.
Lack of rural infrastructure and low agricultural productivity means that many older people in rural areas, like the rest of the rural population, live in housing made of poor quality materials; lack access to electricity as a source of energy for lighting and cooking; do not have access to improved sanitation; and cannot access communication devices and transportation means that are commonplace in urban households.

Census Report Volume 4-L – The Older Population 59
Chapter 6. Economic conditions of the older population
The strong social conventions in Myanmar that enable older people to live with their adult children or other family members bring economic benefits to everyone. Older people benefit from living with others. The most disadvantaged households are those where an older person lives on his or her own or without an employed person in the prime working ages. Other members of the household also benefit from having an older member. Even households with a large number of members and a large number of employed prime working-age people are more likely to be in a higher wealth quintile if at least one member is aged 60 or over.

Census Report Volume 4-L – The Older Population60
Chapter 7. Health and life expectancy in old age Chapter 7.
Increasing life expectancy is a triumph, resulting from lower fertility and better living conditions, supported by health services to prevent and treat diseases. As a result of declining mortality, people in Myanmar can study, work, marry and start a family with confidence that they and their children will probably survive into old age. However, those who reach old age by avoiding an early death through infectious diseases, non-communicable diseases, poor nutrition or injury, are likely to experience a decline in health in their later years.
This chapter reviews what is known about mortality within the older population and looks closely at the level of self-reported disability, which was the only health indicator included in the 2014 Census.
Underlying the older population’s life expectancy and health are the significant changes in the pattern of diseases occurring in Myanmar and globally. The four main non-communicable diseases of cardiovascular disease, diabetes, cancer and chronic respiratory diseases are responsible for 59 per cent of total deaths and comprise an increasing proportion of deaths of males and females aged 30-69 (WHO 2014). These diseases, if uncontrolled, can result in a number of chronic conditions such as a shortness of breath, difficulty in walking and poor eyesight.
Risk factors for non-communicable diseases (NCDs) include obesity, smoking, harmful alcohol use, lack of physical activity and exposure to air pollution. All of these may become more prevalent as Myanmar becomes more urban and transitions from a low to a middle-income country, but with appropriate policies and programmes, these risk factors can be reduced. Chapter 9 will discuss the policy responses that could better provide social and economic protection and health services for older people in order to care for those who are sick and prevent premature mortality and preventable health problems from NCDs.
7.1 Mortality
This section will present what is known about mortality rates in regard to older people’s life expectancy. Myanmar does not have a vital registration system that records all births and deaths. Without such a system, it is difficult to accurately measure gains in adult life expectancy over time. Myanmar only has the Census for estimating adult mortality, using statistical methods based on reported deaths in the household in the 12 months prior to the Census and the age and sex distribution of the population. Both reported deaths and age distribution have limitations. Reporting on recent deaths is subject to error about when the death occurred and dependent on the household remaining intact and a consensus about whether the deceased was a member of the household. Age reporting, as discussed in Chapter 2, is subject to error, especially in the older age groups. Therefore, estimates of the level of mortality in people of older ages should be treated with caution.
Since there is no robust data on the current level of mortality, it is not surprising that even less is known about whether death rates in older ages have been declining. There was no analysis from the 1983 census on adult mortality.
Despite the data shortcomings, the broad outlines of mortality change are known. As

Census Report Volume 4-L – The Older Population 61
Chapter 7. Health and life expectancy in old age
discussed in Chapter 3, due to the decline in infant and child mortality, people in Myanmar can expect to live longer. Another fact which is clear from the Census data is that males are at a higher risk of dying in every age group than females. Male mortality is very high in Myanmar.
Figure 7.1 is presented with the preceding limitations in mind. It shows the probability of a person surviving another five years and has been derived from the adjusted life tables in the 2014 Census thematic report on Mortality (Department of Population 2016c). Urban men aged 55-59 have the lowest probability of surviving another five years; that disadvantage continues up to the age of 75-79. Rural men have the second lowest survival rates. Rural females have the highest survival rate at the oldest ages. The oldest age group in the life tables was 80 and over. Since every person who reaches age 80 will die sometime after 80, a survival rate for the 80 and over category is meaningless.
To use the life tables to describe mortality in another way, on his sixtieth birthday, a man living in urban Myanmar can expect to live, on average, an additional 12.7 years, whereas a woman of the same age can expect to live for another 17.7 years. A man turning 60 in rural Myanmar can expect to live for another 14.8 years and a rural woman can expect to live for an additional 18.5 years (see Appendix E, Table E in Department of Population 2016c).
Figure 7.1 Survival ratios for five more years, population aged 55 to 79 by sex, urban and rural areas, 2014
The extent of male disadvantage is highlighted by comparing male and female life expectancy estimates at age 60 with other ASEAN countries (Figure 7.2). The reader should note that the data sources for Myanmar and other countries are different. Nonetheless, a life expectancy for Myanmar males at 60 of 14.1 years would be the lowest among the ASEAN countries. Myanmar female life expectancy is at the top of the group of lower income countries, exceeded only by Singapore, Viet Nam, Brunei Darussalam, Thailand and Malaysia.
0.000000.100000.200000.300000.400000.500000.600000.700000.800000.900001.00000
55-59 60-64 65-69 70-74 75-79
Surv
ival
ratio
Age group
Urban male Urban female Rural male Rural female

Census Report Volume 4-L – The Older Population62
Chapter 7. Health and life expectancy in old age
7.2 Disability
One of the great concerns about increasing life expectancy is that it will increase the number of years lived in poor health. Fortunately, that does not appear to be happening. As life expectancy has increased over the past few decades, so has the number of years lived in good health, although not quite as quickly. In Asia and the Pacific, for every year gained in life expectancy between 1970 and 2010, there have been 11 months gained in the number of years spent in good health. Low income countries such as Myanmar have had a faster increase in the number of healthy years than middle-income countries (World Bank 2016 based on the work of the Global Burden of Disease (IHME and World Bank 2013)).
Disability is increasingly common at older ages, particularly as a result of the cumulative effect of behaviours, the environment, illnesses and injuries over a lifetime. Chronic health problems and fragility in old age frequently manifests itself as a disability. The Myanmar National Plan of Action for Persons with Disabilities 2010-2012 defines disability as: ‘Disability is an evolving concept and that disability results from the interaction between persons with impairments and attitudinal and environmental barriers that hinders their full and effective participation in society on an equal basis with others.’ The Department of Social Welfare currently classifies disability into four types: a) persons with visual impairments; b) persons with hearing impairments; c) persons with physical (mobility) impairments; and d) persons with intellectual impairments (Department of Population 2017d).
In the past, collecting information on health was beyond the scope of a census. However, many recent international censuses, including the 2014 Myanmar Census, have included questions on disability. Such information is invaluable for understanding the well-being of older people, as age-related infirmities often result in older people becoming unable to perform basic tasks for themselves, placing additional burdens on family and on other formal and informal social support systems.
Figure 7.2 Life expectancy at age 60 for ASEAN countries a) Male
14.115.115.3
15.816.116.3
18.419.3
20.020.1
22.5
0 5 10 15 20 25 30
MyanmarPhilippines
IndonesiaLao PDR
Timor-LesteCambodia
MalaysiaViet NamThailand
Brunei DarussalamSingapore
Number of years

Census Report Volume 4-L – The Older Population 63
Chapter 7. Health and life expectancy in old age
b) Female
Source: For Myanmar, Department of Population (2016c) adjusted life tables; for other ASEAN countries UN DESA
(2015a) medium variant for 2010-2015.
The disability questions in the Census measured the ability to perform functions of everyday life by recording if a person had difficulty in seeing, hearing, walking and remembering or concentrating, aligning with the Department of Social Work’s classification. For each function, the severity of disability was captured on a four-item scale: no difficulty, some difficulty, a lot of difficulty, and cannot do at all.
In interpreting the results on disability, it is important to recognize that the 2014 Census was the first time the prevalence of disability had been systematically measured in Myanmar for the whole population. Disability-focused surveys conducted earlier had only included people with a disability. The 2012 Survey of Older Persons asked questions about disability which were different from those in the 2014 Census (Knodel 2014). The findings from that survey are discussed in Section 7.2.2.
As in other countries where there are weaknesses in measuring disability from censuses, the disability rates from the 2014 Census are believed to underestimate the true rate of disability due to a number of reasons including unfamiliarity with the concept; reluctance to discuss disabilities with people outside of the family; and the range and wording of the Census questions (Department of Population 2017d). Dedicated surveys, with trained staff and more time allocated per interview, are more appropriate to assess the prevalence of disabilities than censuses.
7.2.1 Prevalence of disability from the 2014 CensusNearly one quarter (23.3 per cent) of persons aged 60 and over were reported to have one or more of the four disabilities (those who responded with ‘some difficulty’, ‘a lot of difficulty’, and ‘cannot do at all’ in any one of the domains of disability – seeing, hearing, walking, remembering/concentrating) in the 2014 Census (Table 7.1). As is to be expected, this is a much higher prevalence than is found among younger people. Just 1.2 per cent of youth aged 15-24 years and 3.4 per cent of the prime working-age group of 15-59 years were reported to have at least one form of disability (Department of Population, 2017d).
17.417.717.717.8
18.318.4
20.122.622.7
24.827.5
0 5 10 15 20 25 30
Lao PDRCambodia
Timor-LesteIndonesia
PhilippinesMyanmarMalaysiaThailand
Brunei DarussalamViet Nam
Singapore
Number of years
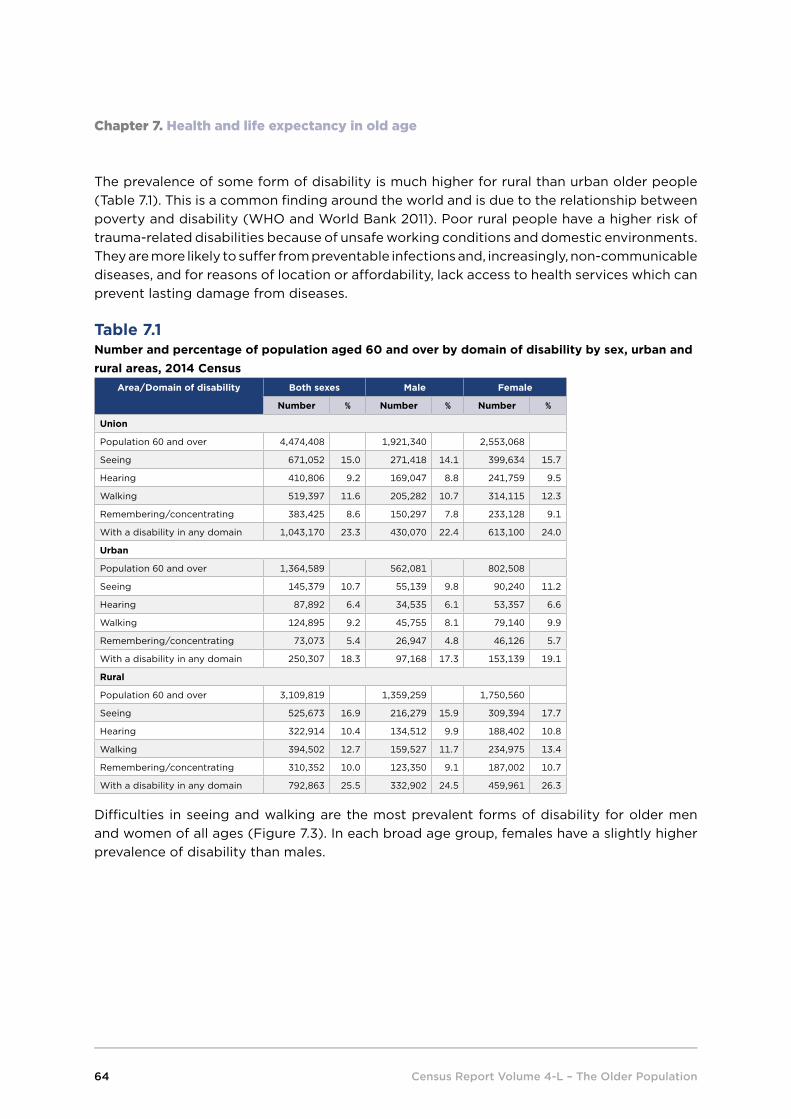
Census Report Volume 4-L – The Older Population64
Chapter 7. Health and life expectancy in old age
The prevalence of some form of disability is much higher for rural than urban older people (Table 7.1). This is a common finding around the world and is due to the relationship between poverty and disability (WHO and World Bank 2011). Poor rural people have a higher risk of trauma-related disabilities because of unsafe working conditions and domestic environments. They are more likely to suffer from preventable infections and, increasingly, non-communicable diseases, and for reasons of location or affordability, lack access to health services which can prevent lasting damage from diseases.
Table 7.1 Number and percentage of population aged 60 and over by domain of disability by sex, urban and rural areas, 2014 Census
Area/Domain of disability Both sexes Male Female
Number % Number % Number %
Union
Population 60 and over 4,474,408 1,921,340 2,553,068
Seeing 671,052 15.0 271,418 14.1 399,634 15.7
Hearing 410,806 9.2 169,047 8.8 241,759 9.5
Walking 519,397 11.6 205,282 10.7 314,115 12.3
Remembering/concentrating 383,425 8.6 150,297 7.8 233,128 9.1
With a disability in any domain 1,043,170 23.3 430,070 22.4 613,100 24.0
Urban
Population 60 and over 1,364,589 562,081 802,508
Seeing 145,379 10.7 55,139 9.8 90,240 11.2
Hearing 87,892 6.4 34,535 6.1 53,357 6.6
Walking 124,895 9.2 45,755 8.1 79,140 9.9
Remembering/concentrating 73,073 5.4 26,947 4.8 46,126 5.7
With a disability in any domain 250,307 18.3 97,168 17.3 153,139 19.1
Rural
Population 60 and over 3,109,819 1,359,259 1,750,560
Seeing 525,673 16.9 216,279 15.9 309,394 17.7
Hearing 322,914 10.4 134,512 9.9 188,402 10.8
Walking 394,502 12.7 159,527 11.7 234,975 13.4
Remembering/concentrating 310,352 10.0 123,350 9.1 187,002 10.7
With a disability in any domain 792,863 25.5 332,902 24.5 459,961 26.3
Difficulties in seeing and walking are the most prevalent forms of disability for older men and women of all ages (Figure 7.3). In each broad age group, females have a slightly higher prevalence of disability than males.

Census Report Volume 4-L – The Older Population 65
Chapter 7. Health and life expectancy in old age
Figure 7.3 Percentage of older population reporting four domains of disability by age group by sex, 2014 Census
Most people who have a disability report a relatively mild form, agreeing with the description that they can see, hear, walk or remember/concentrate with ‘some difficulty’. When a person is described as having ‘a lot of difficulty’ or that they ‘cannot do at all’, they can be considered as having a moderate or severe level of disability. A disability of this severity may make it difficult for older people to participate in the regular activities of daily living.
Figure 7.4 shows the prevalence of moderate and severe disabilities for older men and women by age and whether they live in urban or rural areas. Older people in rural areas are more likely to have a moderate or severe disability. Likewise, women have higher rates of moderate and severe disabilities than men. Figure 7.4 was derived from numbers available in Appendix 1, Table 16, which also includes the numbers for the older population who reported only ‘some difficulty’ in performing routine daily activities.
0
5
10
15
20
25
30
35
Total Male Female Total Male Female Total Male Female
60-69 70-79 80+
Perc
enta
ge
Age groupSeeing Hearing Walking Remembering/concentrating

Census Report Volume 4-L – The Older Population66
Chapter 7. Health and life expectancy in old age
Figure 7.4 Percentage of population aged 60 and over with moderate and severe disabilities by age by sex, urban and rural areas, 2014 Census
7.2.2 Other estimates of disability and health among the older populationThe 2012 Survey of Older Persons asked respondents about many aspects of their health. One third (33.2 per cent) of respondents aged 60 and over described their overall health as ‘good’ or ‘very good’; 44.5 per cent said it was ‘fair’; and 22.2 per cent said it was ‘poor’ or ‘very poor’. Respondents aged 70 and over and females reported the poorest health.
The same survey asked similar questions of older people about their ability to undertake everyday tasks (Knodel 2014). As the survey was dedicated to older people with a particular interest in health conditions, it can be assumed that the data collected comes closer to measuring the actual extent of disability in this population. Table 7.2 compares the results. In all similar measures regarding walking, hearing, seeing and remembering or concentrating, the Survey of Older Persons recorded levels that were at least twice as high as those reported in the 2014 Census. Some of the differences may be due to the slightly different wording of the questions and response categories.
0
5
10
15
20
25
30
60-64 65-69 70-74 75-79 80-84 85-89 90+
Perc
enta
ge
Age groupUrban male Rural male Urban female Rural female

Census Report Volume 4-L – The Older Population 67
Chapter 7. Health and life expectancy in old age
Table 7.2 Comparison of disability measures for the population aged 60 and over from the 2014 Census and the 2012 Survey of Older Persons
2012 Survey (Knodel 2014) % 2014 Census %
Walking 200-300 metres 33 At least some difficulty walking 12
Difficulty with hearing 15 At least some difficulty hearing 9
Difficulty with vision 29 At least some difficulty seeing 15
Memory poor or very poor 18 At least some difficulty remembering/concentrating 9
A higher rate of self-reported disability was also found in a survey of older people’s use of health care services in five Myanmar Townships (Rajan and Seerupa 2016). Respondents aged 60 and over were asked if they experienced any difficulty in moving around. The survey used the same categories of severity as the Census: some difficulty, a lot of difficulty and cannot do at all. Overall, 42 per cent of older people said they experienced at least some difficulty and 13 per cent said they had a lot of difficulty or could not do at all. Among older people aged 80 and over, 32 per cent said they had a lot of difficulty or could not move at all. Similarly, 26 per cent of respondents reported at least some difficulty hearing and 60 per cent reported at least some difficulty seeing.
7.2.3 Living arrangements and economic conditions of older people with disabilities Older people with disabilities have very similar living arrangements as older people without disabilities. Table 7.3 shows that older people with a disability are slightly more likely to live on their own (10.1 per cent for older people with a mild disability and 11.2 per cent for older people with a moderate/severe disability) and to be looking after a grandchild (6.8 per cent for a mild disability and 6.7 per cent for a moderate/severe disability) than older people without a disability.

Census Report Volume 4-L – The Older Population68
Chapter 7. Health and life expectancy in old age
Table 7.3 Percentage of household heads aged 60 and over by household composition, degree of disability, urban and rural areas, 2014 Census
Area and household composition Total No disability
Mild disability
Moderate or severe disability
Union
Total (=100%) 2,530,908 1,948,259 453,651 128,998
Living alone 7.9 7.1 10.1 11.2
Living only with spouse 7.3 7.2 7.8 7.8
Living with a child and anyone else 74.4 75.4 71.2 70.2
Living with a grandchild and no children but may live with others
5.7 5.4 6.8 6.7
Living with a sibling, no children, no grandchildren but may live with others
2.3 2.4 1.9 1.8
Living with other relatives, no children, no grandchildren and no sibling
1.7 1.8 1.6 1.6
Living with non-relatives only 0.5 0.6 0.5 0.5
Unclassifiable 0.2 0.2 0.1 0.1
Urban
Total (=100%) 767,067 622,451 113,450 31,166
Living alone 5.8 5.5 7.1 6.5
Living only with spouse 5.6 5.7 5.4 4.9
Living with a child and anyone else 76.9 77.2 75.6 76.9
Living with a grandchild and no children but may live with others
5.0 4.8 6.1 6.1
Living with a sibling, no children, no grandchildren but may live with others
3.1 3.2 2.6 2.3
Living with other relatives, no children, no grandchildren and no sibling
2.3 2.4 2.2 2.2
Living with non-relatives only 1.0 1.0 1.0 1.0
Unclassifiable 0.2 0.2 0.1 0.1
Rural
Total (=100%) 1,763,841 1,325,808 340,201 97,832
Living alone 8.8 7.9 11.1 12.7
Living only with spouse 8.0 7.8 8.6 8.7
Living with a child and anyone else 73.3 74.6 69.7 68.1
Living with a grandchild and no children but may live with others
6.0 5.7 7.1 6.9
Living with a sibling, no children, no grandchildren but may live with others
1.9 2.0 1.6 1.7
Living with other relatives, no children, no grandchildren and no sibling
1.5 1.5 1.4 1.5
Living with non-relatives only 0.3 0.3 0.4 0.3
Unclassifiable 0.2 0.2 0.1 0.1
The lower the wealth quintile of an older person’s household, the more prevalent and the more severe the disabilities are. This gradation is particularly pronounced in rural areas (Table 7.4).

Census Report Volume 4-L – The Older Population 69
Chapter 7. Health and life expectancy in old age
Table 7.4 Percentage of population aged 60 and over in conventional households by degree of disability, wealth quintiles, urban and rural areas, 2014 Census
Area/Wealth Quintile
Total (=100%) No disability Mild disability Moderate disability
Severe disability
Union (=100%) 4,341,459 76.6 17.5 3.8 2.1
1 660,305 68.0 22.8 6.0 3.1
2 826,963 73.2 19.8 4.5 2.5
3 943,006 76.0 18.1 3.8 2.1
4 957,277 79.0 16.1 3.1 1.8
5 953,908 83.7 12.6 2.3 1.4
Urban (=100%) 1,312,355 81.6 14.0 2.7 1.7
1 20,758 72.2 20.5 4.5 2.7
2 52,428 73.8 19.1 4.4 2.7
3 99,300 76.4 17.5 3.8 2.3
4 339,264 79.2 15.8 3.1 1.9
5 800,605 84.1 12.2 2.2 1.4
Rural (=100%) 3,029,104 74.4 19.0 4.2 2.3
1 639,547 67.9 22.9 6.0 3.1
2 774,535 73.1 19.8 4.5 2.5
3 843,706 76.0 18.2 3.8 2.1
4 618,013 78.9 16.3 3.1 1.7
5 153,303 81.8 14.4 2.4 1.4
These findings are consistent with those reported in the 2012 Survey of Older Persons (Teerawichitchainan and Knodel 2015). The researchers found that most measures of health, including self-reported health, such as difficulties in seeing and hearing and a number of tasks that required walking or lifting, were directly related to economic status measured by the possession of various consumer items and housing infrastructure. Importantly, researchers showed that even older people in the economic quintile second from the bottom, who were nevertheless very poor, had better health than those in the bottom quintile. This same gradation can be seen from the Census data in Table 7.4.
Greater severity of disability is associated with being in the lowest wealth quintiles (Table 7.4), but only has a very weak relationship with household composition (Table 7.3). This suggests that regardless of a family’s wealth, there is a strong preference for older persons to co-reside with their children. Older people with disabilities are more likely to be poor because of the relationship between poverty and disability and not because they are more likely to live alone.
7.2.4 Calculations based on disability prevalenceDespite the limitations of the measures of disability prevalence from the 2014 Census, they can be illustrative to understand the implications for population ageing and the burden of disability for older persons. This section makes two types of calculations to demonstrate these implications. The first calculation is to project the number of older people living with a disability in 2035 and 2050. The second calculation is to estimate the number of years that older people can expect to live free of a disability. Both calculations used several estimates

Census Report Volume 4-L – The Older Population70
Chapter 7. Health and life expectancy in old age
of the prevalence of disabilities among older people in Myanmar, drawing on data presented in Section 7.2.1.
The 2014 Census thematic report on Disability attempted to project the impact of ageing on disability in the future by applying the age-specific disability rates to the projected population (Department of Population 2017d). That analysis is replicated here. In Figure 7.5 three age-specific disability rates are used: the rate of moderate and severe disability from the 2014 Census; the rate of any form of disability from the 2014 Census; and double the rate of any form of disability to reflect the higher rates found in the 2012 Survey of Older Persons and the 2016 Survey on the use of Health Care Services (see Table 7.2). These rates are applied to the projected population in 2035 and 2050 as presented in Chapter 3. Using the highest estimate of disability, in 2050 there could be 10 million people in Myanmar (out of nearly 65 million) who will have some form of disability. Among the 13 million projected older people, almost 7 million will have some form of disability. Details on the methodology can be found in the 2014 Census thematic report on Disability.
Figure 7.5 Estimates of the effect of population ageing on the absolute number of persons with a disability for aged 60 and over, 2015, 2035 and 2050
Another way to use the disability rates is to estimate the number of years older people can expect to live without a disability. Disability-free life expectancy is frequently calculated to capture the quality of life of a population. A particular interest in the study of ageing is whether, over time, older people are gaining more years of life only at the expense of more years of disability. Disability-free life expectancy is calculated from life tables, which create a hypothetical population based on the age-specific death rates experienced at a particular period (Jagger et al 2014).
The 2014 Census thematic report on Mortality created life tables for the Myanmar population one year prior to the Census (Department of Population 2016c). The life expectancy and survival ratios reported earlier in this chapter were taken from these life tables. By multiplying
0
2,000
4,000
6,000
8,000
10,000
12,000
Total population 60+ Total population 60+ Total population 60+
Moderate and severe disability Mild disability or higher Mild disability or higher (doubled)
Popu
latio
n in
'000
s
2015 2035 2050
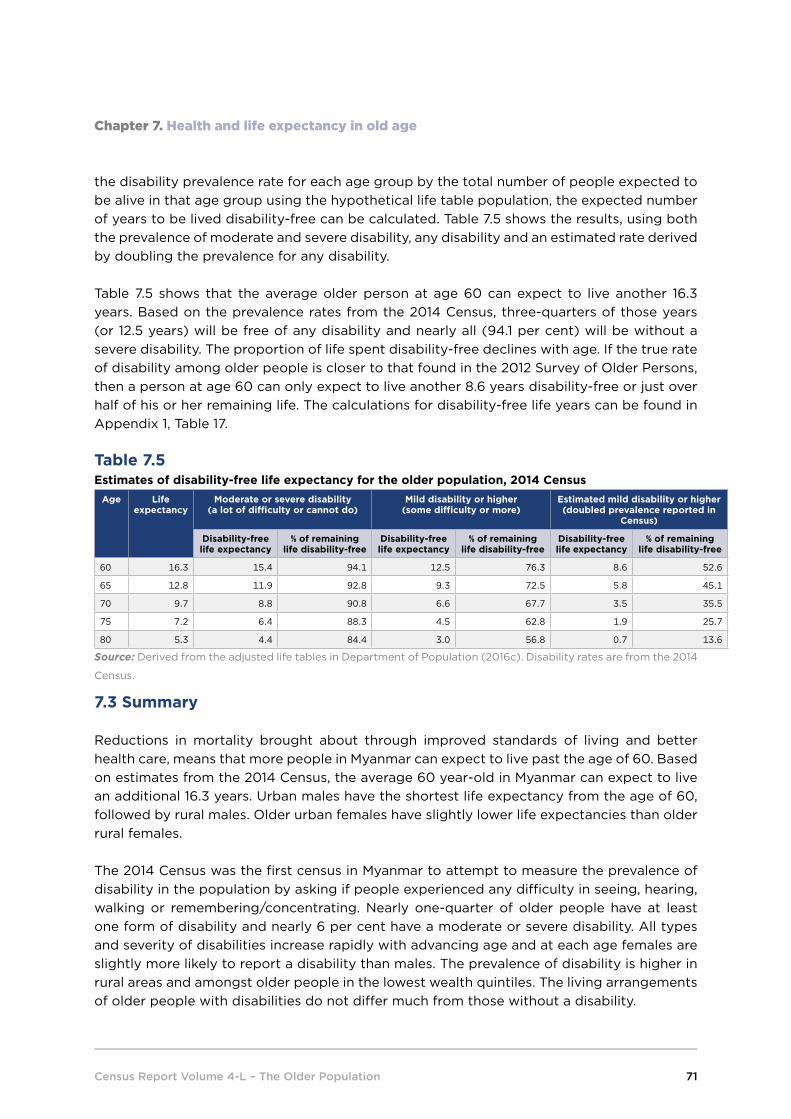
Census Report Volume 4-L – The Older Population 71
Chapter 7. Health and life expectancy in old age
the disability prevalence rate for each age group by the total number of people expected to be alive in that age group using the hypothetical life table population, the expected number of years to be lived disability-free can be calculated. Table 7.5 shows the results, using both the prevalence of moderate and severe disability, any disability and an estimated rate derived by doubling the prevalence for any disability.
Table 7.5 shows that the average older person at age 60 can expect to live another 16.3 years. Based on the prevalence rates from the 2014 Census, three-quarters of those years (or 12.5 years) will be free of any disability and nearly all (94.1 per cent) will be without a severe disability. The proportion of life spent disability-free declines with age. If the true rate of disability among older people is closer to that found in the 2012 Survey of Older Persons, then a person at age 60 can only expect to live another 8.6 years disability-free or just over half of his or her remaining life. The calculations for disability-free life years can be found in Appendix 1, Table 17.
Table 7.5 Estimates of disability-free life expectancy for the older population, 2014 Census
Age Life expectancy
Moderate or severe disability (a lot of difficulty or cannot do)
Mild disability or higher (some difficulty or more)
Estimated mild disability or higher (doubled prevalence reported in
Census)
Disability-free life expectancy
% of remaining life disability-free
Disability-free life expectancy
% of remaining life disability-free
Disability-free life expectancy
% of remaining life disability-free
60 16.3 15.4 94.1 12.5 76.3 8.6 52.6
65 12.8 11.9 92.8 9.3 72.5 5.8 45.1
70 9.7 8.8 90.8 6.6 67.7 3.5 35.5
75 7.2 6.4 88.3 4.5 62.8 1.9 25.7
80 5.3 4.4 84.4 3.0 56.8 0.7 13.6
Source: Derived from the adjusted life tables in Department of Population (2016c). Disability rates are from the 2014
Census.
7.3 Summary
Reductions in mortality brought about through improved standards of living and better health care, means that more people in Myanmar can expect to live past the age of 60. Based on estimates from the 2014 Census, the average 60 year-old in Myanmar can expect to live an additional 16.3 years. Urban males have the shortest life expectancy from the age of 60, followed by rural males. Older urban females have slightly lower life expectancies than older rural females.
The 2014 Census was the first census in Myanmar to attempt to measure the prevalence of disability in the population by asking if people experienced any difficulty in seeing, hearing, walking or remembering/concentrating. Nearly one-quarter of older people have at least one form of disability and nearly 6 per cent have a moderate or severe disability. All types and severity of disabilities increase rapidly with advancing age and at each age females are slightly more likely to report a disability than males. The prevalence of disability is higher in rural areas and amongst older people in the lowest wealth quintiles. The living arrangements of older people with disabilities do not differ much from those without a disability.

Census Report Volume 4-L – The Older Population72
Chapter 7. Health and life expectancy in old age
Using information from a dedicated survey of older people in Myanmar it is possible to adjust the disability prevalence rates upward to estimate the rapid increase in the number of people with a disability in the coming decades. It is also possible to calculate the number of years older people can expect to live disability-free. People turning age 60 may expect to live another 8.6 years free of a mild disability (based on an adjusted estimate of prevalence) to 15.4 years free of a moderate or severe disability.

Census Report Volume 4-L – The Older Population 73
Chapter 8. Regional variations in ageing Chapter 8.
Population ageing is occurring in all parts of the country, but at different paces. As a result of history and the diverse levels of economic development, the social and material conditions of older people and their living arrangements also vary. This chapter highlights those variations in ageing at the subnational level. At the time of the 2014 Census, Myanmar had 15 States/Regions. Within these were 74 Districts and beneath the Districts were 412 Townships and sub-townships. This chapter focuses on variations by State/Region. Some detailed information is available in the Appendix tables by District. The chapter covers trends in population ageing and characteristics of the older population, including marital status; proportions of women with no living children; literacy and attendance in formal education; household composition; and some aspects of housing conditions and assets.
8.1 Population ageing
Half of Myanmar’s older population live in the populous States/Regions of Yangon, Mandalay, Ayeyawady, Sagaing, and Bago. This is similar to the distribution of the total population, with one notable difference. Shan State comprises 11.6 per cent of the total population of Myanmar but the proportion of the older population is only 9.1 per cent.
Table 8.1 Percentage of the total and older population by State/Region, 2014 Census
State/Region Total population State/Region Population aged 60 and over
Number % Cumulative % Number % Cumulative %
Union 50,279,900 100 100 Union 4,474,408 100 100
Yangon 7,360,703 14.6 Yangon 645,329 14.4
Ayeyawady 6,184,829 12.3 14.6 Mandalay 580,359 13.0 14.4
Mandalay 6,165,723 12.3 26.9 Ayeyawady 569,906 12.7 27.4
Shan 5,824,432 11.6 39.2 Sagaing 495,140 11.1 40.1
Sagaing 5,325,347 10.6 50.8 Bago 472,847 10.6 51.2
Bago 4,867,373 9.7 61.4 Magway 424,498 9.5 61.8
Magway 3,917,055 7.8 71.1 Shan 405,631 9.1 71.3
Rakhine 2,098,807 4.2 78.8 Rakhine 206,515 4.6 80.3
Mon 2,054,393 4.1 83.0 Mon 203,481 4.5 84.9
Kachin 1,642,841 3.3 87.1 Kayin 122,317 2.7 89.5
Kayin 1,504,326 3.0 90.4 Tanintharyi 109,051 2.4 92.2
Tanintharyi 1,408,401 2.8 93.4 Kachin 102,612 2.3 94.7
Nay Pyi Taw 1,160,242 2.3 96.2 Nay Pyi Taw 83,747 1.9 96.9
Chin 478,801 1.0 98.5 Chin 35,796 0.8 98.8
Kayah 286,627 0.6 99.4 Kayah 17,179 0.4 99.6
The major metropolitan areas of Myanmar, Yangon and Mandalay, contain 49 per cent of the urban older population. This is the same proportion as for the total urban population. Again, the greatest deviation in ranking from the distribution of the total population is Shan State, which is home to 9.4 per cent of urban people enumerated in the 2014 Census but is only home to 7.9 per cent of the urban older population. Half of rural older people live in Ayeyawady (15.2 per cent), Sagaing (13.2 per cent), Mandalay (12.8 per cent) and Magway (11.6 per cent). Appendix 1, Table 18 has the numbers from which Table 8.1 and Figure 8.1 were derived.
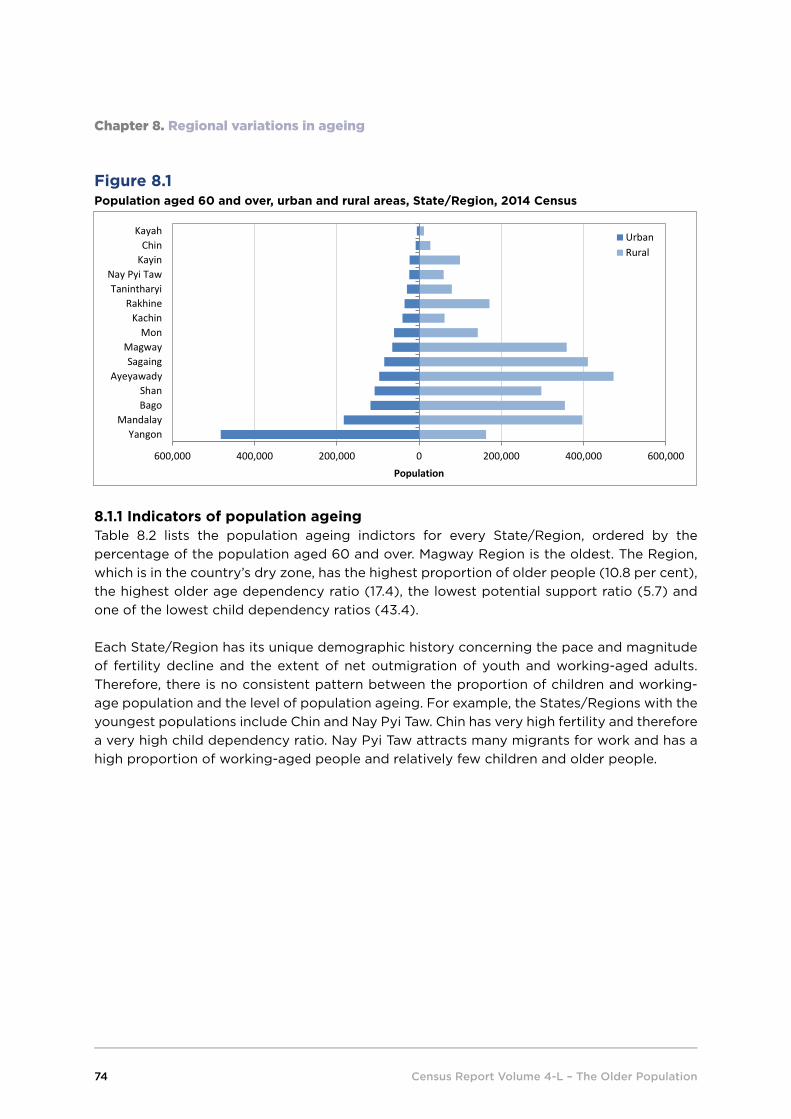
Census Report Volume 4-L – The Older Population74
Chapter 8. Regional variations in ageing
Figure 8.1 Population aged 60 and over, urban and rural areas, State/Region, 2014 Census
8.1.1 Indicators of population ageing Table 8.2 lists the population ageing indictors for every State/Region, ordered by the percentage of the population aged 60 and over. Magway Region is the oldest. The Region, which is in the country’s dry zone, has the highest proportion of older people (10.8 per cent), the highest older age dependency ratio (17.4), the lowest potential support ratio (5.7) and one of the lowest child dependency ratios (43.4).
Each State/Region has its unique demographic history concerning the pace and magnitude of fertility decline and the extent of net outmigration of youth and working-aged adults. Therefore, there is no consistent pattern between the proportion of children and working-age population and the level of population ageing. For example, the States/Regions with the youngest populations include Chin and Nay Pyi Taw. Chin has very high fertility and therefore a very high child dependency ratio. Nay Pyi Taw attracts many migrants for work and has a high proportion of working-aged people and relatively few children and older people.
600,000 400,000 200,000 0 200,000 400,000 600,000
YangonMandalay
BagoShan
AyeyawadySagaing
MagwayMon
KachinRakhine
TanintharyiNay Pyi Taw
KayinChin
Kayah
Population
UrbanRural

Census Report Volume 4-L – The Older Population 75
Chapter 8. Regional variations in ageing
Table 8.2 Indicators of population by State/Region, 2014 Census
State/Region Total population
% in functional age groups Index of ageing
Dependency ratios Potential support
ratio0-14 15-59 60+ Total Child Older population
Union 50,279,900 28.6 62.5 8.9 31.1 60.1 45.8 14.2 7.0
Magway 3,917,055 27.0 62.2 10.8 40.2 60.8 43.4 17.4 5.7
Mon 2,054,393 31.2 58.8 9.9 31.7 69.9 53.1 16.8 5.9
Rakhine 2,098,807 31.1 59.0 9.8 31.6 69.4 52.7 16.7 6.0
Bago 4,867,373 28.4 61.9 9.7 34.2 61.7 46.0 15.7 6.4
Mandalay 6,165,723 25.9 64.7 9.4 36.3 54.7 40.1 14.6 6.9
Sagaing 5,325,347 28.7 62.0 9.3 32.4 61.2 46.2 15.0 6.7
Ayeyawady 6,184,829 29.4 61.3 9.2 31.3 63.0 48.0 15.0 6.7
Yangon 7,360,703 23.4 67.8 8.8 37.4 47.5 34.6 12.9 7.7
Kayin 1,504,326 35.8 56.1 8.1 22.7 78.4 63.9 14.5 6.9
Tanintharyi 1,408,401 33.9 58.3 7.7 22.8 71.5 58.2 13.3 7.5
Chin 478,801 40.0 52.6 7.5 18.7 90.2 76.0 14.2 7.0
Nay Pyi Taw 1,160,242 28.2 64.6 7.2 25.6 54.8 43.6 11.2 9.0
Shan 5,824,432 32.0 61.0 7.0 21.7 63.9 52.5 11.4 8.8
Kachin 1,642,841 30.0 63.8 6.2 20.8 56.9 47.1 9.8 10.2
Kayah 286,627 34.5 59.5 6.0 17.4 68.2 58.1 10.1 9.9
Despite the variations in age structure, in every State/Region the urban population has a higher percentage of older people than the rural population (Figure 8.2).
Figure 8.2 Percentage of population 60 years and over, urban and rural areas, State/Region, 2014 Census
At smaller geographic areas, there is greater diversity in age structure. At one extreme, 12.2 per cent of the population is aged 60 and over in Kyaukpyu, Rakhine State, and, at the other extreme, Bawlakhe in Kayah State has only 4.4 per cent. The map at Figure 8.3 shows that the Districts with the highest older age dependency ratios are in the central, western and southern parts of the country and the largest cities. The Districts with the lowest
05
101520253035404550
Percen
tage
UrbanRural

Census Report Volume 4-L – The Older Population76
Chapter 8. Regional variations in ageing
older age dependency ratios are, for the most part, in the northern and eastern parts of the country. Appendix 1, Table 19 gives the population by functional age groups and indicators of population ageing by District.
Figure 8.3 Map of the older age dependency ratio by District, 2014 Census
LegendState/Region boundariesDistrict boundaries
Older age dependency ratio7.0 - 9.79.8 - 12.512.6 - 14.114.2 - 18.118.2 - 20.90 150 30075 Miles

Census Report Volume 4-L – The Older Population 77
Chapter 8. Regional variations in ageing
8.1.2 Population ageing from 1983 to 2050 Trends in population ageing since the last census show how the current patterns of variation between States/Regions emerged. In every State/Region, the older population grew faster than the total population between the censuses (Table 8.3).
Table 8.3 Annual growth rates for the total and older population between 1983 and 2014 by State/Region, 2014 Census
State/Region 1983 2014 Growth rates 1983 - 2014
Total 60+ Total 60+ Total 60+ Difference
Union 34,117,198 2,170,351 50,279,900 4,474,408 1.3 2.3 1.1
Kachin 819,774 45,769 1,642,841 102,612 2.2 2.6 0.4
Kayah 159,661 6,410 286,627 17,179 1.9 3.2 1.3
Kayin 632,962 34,848 1,504,326 122,317 2.8 4.1 1.3
Chin 368,949 17,717 478,801 35,796 0.8 2.3 1.4
Sagaing 3,825,158 237,057 5,325,347 495,140 1.1 2.4 1.3
Tanintharyi 913,943 52,285 1,408,401 109,051 1.4 2.4 1.0
Bago 3,799,791 270,124 4,867,373 472,847 0.8 1.8 1.0
Magway 3,243,166 222,985 3,917,055 424,498 0.6 2.1 1.5
Mandalay 4,577,762 278,465 6,165,723 580,359 1.0 2.4 1.4
Mon 1,680,157 96,817 2,054,393 203,481 0.7 2.4 1.8
Rakhine 2,045,559 125,810 2,098,807 206,515 0.1 1.6 1.5
Yangon 3,965,916 231,967 7,360,703 645,329 2.0 3.3 1.3
Shan 3,090,339 176,973 5,824,432 405,631 2.0 2.7 0.6
Ayeyawady 4,994,061 373,124 6,184,829 569,906 0.7 1.4 0.7
Nay Pyi Taw 1,160,242 83,747
The projected populations for States/Regions in 2030 illustrate what may happen if present trends continue (Table 8.4). In 15 years, the oldest States/Regions are projected to be the same ones that were the oldest in the 2014 Census. The four oldest States/Regions are also projected to have declining or only modestly growing total populations, indicating that the outmigration of working-age adults is driving population ageing. Most States/Regions have growth rates of the older population which are three to six times the growth rate of the total population, except in Yangon where the older population is growing at a comparatively slow rate; twice as fast as the total population.

Census Report Volume 4-L – The Older Population78
Chapter 8. Regional variations in ageing
Table 8.4 Projected population and annual growth rate of persons aged 60 years old and over from 2015 to 2030 by State/Region
State/Region 2015 2030 Annual growth rate 2015-2030
Total 60+ % 60+ Total 60+ % 60+ Total 60+
Magway 3,944,972 433,035 11.0 3,845,976 647,583 16.8 -0.2 2.7
Mon 2,034,439 208,145 10.2 1,893,405 316,297 16.7 -0.5 2.8
Bago 4,896,520 489,996 10.0 4,999,430 809,358 16.2 0.1 3.3
Ayeyawady 6,262,164 593,810 9.5 6,135,794 972,382 15.8 -0.1 3.3
Sagaing 5,411,440 509,237 9.4 5,942,547 850,704 14.3 0.6 3.4
Mandalay 6,274,139 598,360 9.5 7,122,580 1,007,720 14.1 0.8 3.5
Rakhine 3,266,405 319,183 9.8 3,495,118 485,352 13.9 0.5 2.8
Kayin 1,575,826 132,521 8.4 1,712,637 228,069 13.3 0.6 3.6
Nay Pyi Taw 1,196,717 89,565 7.5 1,499,213 192,974 12.9 1.5 5.1
Yangon 7,595,018 675,899 8.9 10,397,969 1,320,109 12.7 2.1 4.5
Tanintharyi 1,434,723 112,896 7.9 1,631,909 202,244 12.4 0.9 3.9
Shan 6,001,082 423,637 7.1 7,450,683 812,210 10.9 1.4 4.3
Kachin 1,762,901 109,620 6.2 2,292,682 222,958 9.7 1.8 4.7
Chin 497,009 36,482 7.3 578,431 55,916 9.7 1.0 2.8
Kayah 297,162 18,013 6.1 400,663 37,337 9.3 2.0 4.9
The high proportion of the older population in Magway and several other States/Regions are not so much greater as to warrant special policy attention, because they have originated through smaller families and greater outmigration. These trends are likely to influence the social and economic conditions of the older population.
8.2 Regional variations in the social and economic characteristics of the older population
8.2.1 Marital statusMost older people in Myanmar would have married at some time during their lifetime. As discussed in Chapter 4, a small proportion of females never married, amounting to 8.2 per cent of older women throughout the country. Older males were much more likely to be ever- married than females, but there is a small proportion of males who, at the time of the Census, had ‘renounced’ marriage and other aspects of routine life to join religious orders. These men may have been married at some point in their life or they may have joined an order as a single person. However, at the time of the Census, older men who were reported as renounced would have been living without a spouse. If the proportion of older men who were reported to be renounced (3.3 per cent) is added to the proportion of older men who never married (4.1 per cent) the total (7.4 per cent) is similar to the proportion of older women who never married.
Figure 8.4 shows the marital status of older men and women by State/Region. In every State/Region, there is a higher proportion of women who never married than men. At least 10 per cent of older women are never married or renounced in Mandalay and Bago. In those same areas and adding Yangon and Mon, at least 8 per cent of older men have never married

Census Report Volume 4-L – The Older Population 79
Chapter 8. Regional variations in ageing
or are renounced. Older women are much more likely to have been widowed than older men because of higher female life expectancy and the gap in the ages of husbands and wives. The proportion of older women living as widows is lowest in Mandalay at 41.6 per cent and highest in Kachin at 53.6 per cent. The ranking is almost the reverse for men in Kachin, which together with Chin, has the lowest proportion of older men who are widowers, while Ayeyawady has the highest at 20.5 per cent. The numbers and percentages used to derive Figure 8.4 and to investigate urban and rural differences within States/Regions can be found in Appendix 1, Table 20.
Figure 8.4 Percentage of older population, by marital status by sex, State/Region, 2014 Census a) Male
b) Female
75.570.577.0
74.477.1
71.773.7
73.872.372.8
74.781.173.1
74.979.273.9
16.320.5
16.515.7
16.718.4
16.318.118.217.8
16.714.3
18.917.9
14.617.4
0 10 20 30 40 50 60 70 80 90 100
Nay Pyi TawAyeyawady
ShanYangon
RakhineMon
MandalayMagway
BagoTanintharyi
SagaingChin
KayinKayah
KachinUnion
PercentageNever married Renounced Married Widowed Divorced/Separated
42.943.4
43.643.2
43.145.7
45.945.1
42.044.0
45.745.4
44.843.6
40.744.1
47.545.2
50.544.9
50.645.5
41.644.2
46.347.7
43.748.0
48.350.4
53.645.7
0 10 20 30 40 50 60 70 80 90 100
Nay Pyi TawAyeyawady
ShanYangon
RakhineMon
MandalayMagway
BagoTanintharyi
SagaingChin
KayinKayah
KachinUnion
Percentage
Never married Renounced Married Widowed Divorced/Separated

Census Report Volume 4-L – The Older Population80
Chapter 8. Regional variations in ageing
8.2.2 Number of living childrenChapters 5 and 6 describe the importance of adult children for older people. The majority of older people in Myanmar live with at least one of their children or the spouse of a child. However, there are also older people who do not have any living children and must find other living arrangements. At the Union level, 18.4 per cent of women aged 60 and over have no living children, either because they were childless or because they survived their children. Nearly two-thirds or 63.9 per cent of older women have three or more living children, giving them several opportunities to co-reside with an adult child.
Figure 8.5 shows that the proportion of older women with no living children ranges from under 14 per cent in Mon to over 20 per cent in Ayeyawady. The proportion of older women with three or more living children varies from 59.9 per cent in Ayeyawady to 71.7 per cent in Kayah. The differences are the result of earlier fertility decline in States/Regions such as Yangon and Ayeyawady and higher fertility in States/Regions such as Kayah and Chin. The pattern by Districts (given in Appendix 1, Table 21) is even more diverse. Two Districts in eastern Shan State have very high proportions of older women with no living children, 41 per cent in Makman and 39 per cent in Hopan. There are another 18 Districts where at least 20 per cent of older women have no living children. These include West Yangon, two districts in Mandalay, all six districts in Ayeyawady, three in Sagaing, two in Bago, two other Districts in Shan and one in Rakhine, and Chin. Shan also has Districts where a low percentage of older women are childless, such as in Laukine (10.2 per cent), Kunlon (12.5 per cent) and Muse (12.6 per cent).
Figure 8.5 Percentage of older women in conventional households by number of living children, State/Region, 2014 Census
21.117.4
19.617.719.0
16.018.219.219.4
17.617.4
14.815.1
13.915.1
7.610.8
7.88.07.2
8.56.86.47.0
6.96.2
6.15.6
5.85.6
11.411.812.2
12.010.7
11.19.79.07.9
9.48.7
9.68.0
8.97.6
59.960.160.4
62.263.0
64.565.365.465.766.1
67.769.6
71.271.471.7
0 10 20 30 40 50 60 70 80 90 100
AyeyawadyShan
YangonRakhine
BagoKachin
MagwayMandalay
ChinNay Pyi Taw
SagaingKayin
TanintharyiMon
Kayah
PercentageNone One Two Three or more

Census Report Volume 4-L – The Older Population 81
Chapter 8. Regional variations in ageing
8.2.3 Household compositionThe prevalence of different forms of household composition in States/Regions follows the same pattern as at the Union level (Figure 8.6). The majority of older men and women live with their adult children. Older men are more likely to be living with their children than older women. The proportion of older people living with their children is highest in Shan, Sagaing, Kayah and Kachin (over 80 per cent for men and 75 per cent for women) and lowest in Ayeyawady (69 per cent for men) and Chin (59 per cent for women).
Figure 8.6 also highlights small but meaningful State/Region variations in the proportion of older people living alone or with only their spouse and with their grandchildren without the presence of a parental generation. For men, Ayeyawady and Rakhine have higher proportions of older people living alone or with a spouse only than other States/Regions. For women, this is the case in Chin and Rakhine. Mon, Tanintharyi and Kayin have larger percentages of older people living with grandchildren but no parents. Table 8.5 gives these percentages by urban and rural area.
Figure 8.6 Population of household heads aged 60 years and over by household composition, State/Region, 2014 Census a) Male
12.616.2
8.410.4
16.79.0
9.811.9
14.49.9
8.713.8
9.97.9
7.011.5
75.468.9
82.477.4
72.274.1
80.277.772.1
74.082.7
75.772.4
82.283.2
76.6
0 10 20 30 40 50 60 70 80 90 100
Nay Pyi TawAyeyawady
ShanYangon
RakhineMon
MandalayMagway
BagoTanintharyi
SagaingChin
KayinKayah
Kachin Union
PercentageLiving aloneLiving only with spouseLiving with a child and anyone elseLiving with a grandchild and no children but may live with othersLiving with a sibling, no children, no grandchildren but may live with othersLiving with other relatives, no children, no grandchildren and no siblingLiving with non-relatives only

Census Report Volume 4-L – The Older Population82
Chapter 8. Regional variations in ageing
b) Female
The proportion of older people living with a grandchild and no adult children is higher in rural than urban areas (Table 8.5). It is most prevalent in Kayin, Tanintharyi and Mon and is almost certainly related to outmigration.
More than 13 per cent of urban older people live either alone or with their spouse only in Chin, Bago, Magway, Ayeyawady and Nay Pyi Taw. More than 19 per cent of rural older people live alone or with their spouse only in Chin, Bago, Rakhine, Ayeyawady, and Yangon. In Bago, Magway, Ayeyawady, Rakhine and rural Yangon, these high rates are likely to be the result of adult children having moved away for work. Migration or the greater availability of housing enabling rural older people to maintain separate housing near to their adult children could be a factor in Chin.
14.720.1
10.89.7
22.212.812.8
16.617.2
12.211.5
28.315.9
14.79.8
14.2
71.663.2
77.175.1
64.067.5
73.970.9
66.266.2
76.259.1
61.875.2
75.270.9
0 10 20 30 40 50 60 70 80 90 100
Nay Pyi TawAyeyawady
ShanYangon
RakhineMon
MandalayMagway
BagoTanintharyi
SagaingChin
KayinKayah
Kachin Union
PercentageLiving aloneLiving only with spouseLiving with a child and anyone elseLiving with a grandchild and no children but may live with othersLiving with a sibling, no children, no grandchildren but may live with othersLiving with other relatives, no children, no grandchildren and no siblingLiving with non-relatives onlyUnclassifiable

Census Report Volume 4-L – The Older Population 83
Chapter 8. Regional variations in ageing
Table 8.5 Proportion of household heads 60 years old and over by living arrangement, urban and rural areas, State/Region, 2014 Census
State/Region/ Area
Total Living alone
Living with spouse
only
Living alone + with spouse
Living with grandchildren and
no children
Urban
Union 767,067 5.8 5.6 11.4 5.0
Kachin 21,163 4.7 3.5 8.3 6.5
Kayah 3,158 6.1 4.3 10.4 5.1
Kayin 12,826 5.9 5.0 10.9 9.4
Chin 4,769 7.7 7.2 14.9 5.5
Sagaing 47,797 5.8 5.5 11.3 4.6
Tanintharyi 16,294 6.2 4.5 10.7 8.4
Bago 66,607 7.2 7.3 14.5 5.7
Magway 39,179 7.5 6.1 13.6 4.6
Mandalay 103,418 5.1 4.7 9.8 3.8
Mon 35,339 6.1 4.5 10.6 8.7
Rakhine 18,059 6.0 6.3 12.3 4.6
Yangon 269,056 4.8 5.3 10.1 4.0
Shan 61,839 6.1 5.7 11.8 6.4
Ayeyawady 55,562 8.1 7.9 16.0 6.0
Nay Pyi Taw 12,001 7.0 7.0 14.1 5.2
Rural
Union 1,763,841 8.8 8.0 16.8 6.0
Kachin 31,381 6.5 4.9 11.4 6.8
Kayah 6,162 9.1 5.9 15.0 4.0
Kayin 56,998 9.7 6.7 16.4 14.5
Chin 14,898 12.3 10.9 23.2 4.5
Sagaing 233,754 6.2 5.4 11.6 3.9
Tanintharyi 42,518 8.1 7.3 15.4 12.5
Bago 200,198 10.0 9.7 19.8 6.7
Magway 212,038 9.3 7.5 16.8 4.1
Mandalay 232,312 8.2 6.5 14.7 3.9
Mon 84,349 8.4 6.1 14.5 13.0
Rakhine 85,605 10.2 12.9 23.1 5.8
Yangon 96,756 9.7 9.7 19.3 5.6
Shan 159,120 5.6 5.7 11.3 4.7
Ayeyawady 272,255 11.1 11.3 22.5 6.7
Nay Pyi Taw 35,497 9.1 7.8 16.9 5.8

Census Report Volume 4-L – The Older Population84
Chapter 8. Regional variations in ageing
8.2.4 Housing quality and amenitiesMyanmar is one of the lowest income countries in Asia and this has an implication for the living conditions of older people. This section describes the State/Region variations for three indicators of material well-being for older people: housing type, access to improved sanitation, and electricity as the main source of lighting. To conclude the section, States/Regions are ranked based on their combined score across the three variables in order to establish if older people in some locations are particularly disadvantaged.
Type of HousingThe type of housing people live in is influenced by their economic resources; building conventions in the local area; and the wider stock of housing available. As Chapter 6 described, housing types recorded in the Census questionnaire are classified into condominiums/apartments and bungalows/brick houses; those categorized as wooden and semi-pacca; and those which need constant maintenance to provide protection such as housing units made from bamboo, huts and ‘other’. The type of housing is an indicator of the households’ economic resources and of the level of material well-being. While a semi-pacca or wooden house may be as comfortable, safe and healthy as a condominium/apartment or bungalow/brick house, other types of dwelling units such as housing units made from bamboo or huts, or other types of units are constructed using poorer standard building materials.
Figure 8.7 Proportion of population aged 60 and over by type of housing, State/Region, 2014 Census
Figure 8.7 shows the wide variation in older people’s housing type between States/Regions. Living in a condominium/apartment is rare in most areas, accounting for the housing of less than 11 per cent of the older population in nine States/Regions. Only in Yangon and Shan do more than 20 per cent of older people live in condominiums/apartments/brick houses. Nearly half of the older population in Mandalay and over 30 per cent in Shan, Kachin, Sagaing, Magway, Ayeyawady, and Rakhine live in a housing unit made from bamboo, a hut, or other types of dwelling units.
1.62.03.5
6.06.37.08.110.010.111.613.0
15.316.6
23.530.9
12.7
74.863.561.4
51.073.3
79.656.8
78.953.3
69.364.0
35.960.9
41.656.3
56.9
23.634.535.1
43.020.4
13.335.1
11.136.6
19.123.0
48.822.5
34.912.7
30.4
0 10 20 30 40 50 60 70 80 90 100
ChinRakhine
AyeyawadyMagway
BagoKayin
SagaingMon
KachinTanintharyi
Nay Pyi TawMandalay
KayahShan
Yangon
Union
PercentageCondominium/apartment/brick house Semi-pacca/wooden house Bamboo/hut/other

Census Report Volume 4-L – The Older Population 85
Chapter 8. Regional variations in ageing
Table 8.6 gives the percentages of housing type for the older population in urban and rural areas. As would be expected, a higher proportion of urban older people compared to rural older people live in condominiums/apartments/bungalows/brick houses, but more than a quarter of urban older people live in a house constructed from bamboo, a hut or other types of dwelling units in Kachin, Sagaing, Magway, Mandalay and Rakhine. The numbers from which Figure 8.7 and Table 8.6 were derived can be found in Appendix 1, Table 22.
Table 8.6 Percentage of older population by type of housing units they are staying in, urban and rural areas, State/Region, 2014 Census
State/Region
Urban Rural
Condominiums/ apartments
Semi-pacca/ wooden houses
Bamboo/ hut/other
Total Condominiums/ Apartments
Semi-pacca/ wooden houses
Bamboo/hut/ other
Total
Union 28.6 53.1 18.3 100 5.8 58.5 35.7 100
Kachin 17.9 53.4 28.8 100 5.0 53.3 41.7 100
Kayah 29.2 58.6 12.3 100 11.0 61.9 27.0 100
Kayin 17.8 74.6 7.6 100 4.6 80.8 14.6 100
Chin 6.1 85.3 8.6 100 0.2 71.6 28.2 100
Sagaing 17.7 51.0 31.3 100 6.1 58.0 35.9 100
Tanintharyi 20.5 66.4 13.1 100 8.3 70.3 21.3 100
Bago 16.6 70.4 13.0 100 3.0 74.2 22.8 100
Magway 17.4 37.4 45.2 100 4.0 53.4 42.6 100
Mandalay 27.7 33.8 38.5 100 9.7 36.9 53.4 100
Mon 18.8 74.0 7.2 100 6.2 81.0 12.7 100
Rakhine 8.7 64.2 27.1 100 0.6 63.3 36.1 100
Yangon 39.0 54.1 6.9 100 6.7 63.1 30.1 100
Shan 46.5 33.0 20.4 100 15.3 44.6 40.1 100
Ayeyawady 13.0 69.5 17.5 100 1.6 59.8 38.6 100
Nay Pyi Taw 34.5 50.0 15.5 100 4.7 69.4 25.9 100
Electricity as a source of energy for lighting
An indicator of the poor quality of public infrastructure in Myanmar is the very low proportion of older people who use electricity as their main source of lighting, especially in rural areas. Throughout the Union, a little more than a third of older people (36.6 per cent) have electric lighting. In rural areas only 16.4 per cent have electric lighting compared to 83.2 per cent in urban areas. Variations between States/Regions are considerably – from only 7.5 per cent of older people with electrical lighting in their houses in Tanintharyi to 78.9 per cent in Yangon. In all States/Regions, older people in urban areas are more likely to live in a household with electric lighting than older people in rural areas. However, even in urban areas there is a wide range from only 10.3 per cent in Tanintharyi to over 90 per cent in Yangon, Mandalay, Kayah and Magway. In only three States/Regions is the percentage of older rural people with electric lighting 30 per cent or higher. In another four States/Regions, less than 10 per cent of older people have electric lighting in rural areas.
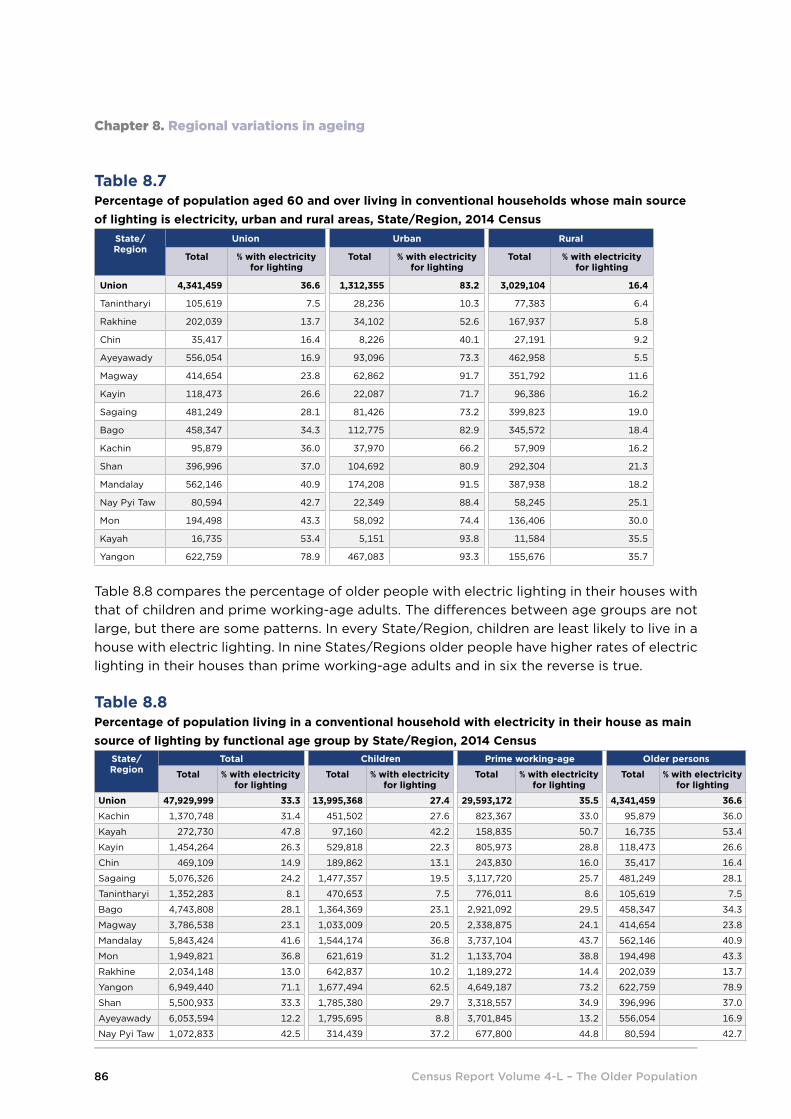
Census Report Volume 4-L – The Older Population86
Chapter 8. Regional variations in ageing
Table 8.7 Percentage of population aged 60 and over living in conventional households whose main source of lighting is electricity, urban and rural areas, State/Region, 2014 Census
State/Region
Union Urban Rural
Total % with electricity for lighting
Total % with electricity for lighting
Total % with electricity for lighting
Union 4,341,459 36.6 1,312,355 83.2 3,029,104 16.4
Tanintharyi 105,619 7.5 28,236 10.3 77,383 6.4
Rakhine 202,039 13.7 34,102 52.6 167,937 5.8
Chin 35,417 16.4 8,226 40.1 27,191 9.2
Ayeyawady 556,054 16.9 93,096 73.3 462,958 5.5
Magway 414,654 23.8 62,862 91.7 351,792 11.6
Kayin 118,473 26.6 22,087 71.7 96,386 16.2
Sagaing 481,249 28.1 81,426 73.2 399,823 19.0
Bago 458,347 34.3 112,775 82.9 345,572 18.4
Kachin 95,879 36.0 37,970 66.2 57,909 16.2
Shan 396,996 37.0 104,692 80.9 292,304 21.3
Mandalay 562,146 40.9 174,208 91.5 387,938 18.2
Nay Pyi Taw 80,594 42.7 22,349 88.4 58,245 25.1
Mon 194,498 43.3 58,092 74.4 136,406 30.0
Kayah 16,735 53.4 5,151 93.8 11,584 35.5
Yangon 622,759 78.9 467,083 93.3 155,676 35.7
Table 8.8 compares the percentage of older people with electric lighting in their houses with that of children and prime working-age adults. The differences between age groups are not large, but there are some patterns. In every State/Region, children are least likely to live in a house with electric lighting. In nine States/Regions older people have higher rates of electric lighting in their houses than prime working-age adults and in six the reverse is true.
Table 8.8 Percentage of population living in a conventional household with electricity in their house as main source of lighting by functional age group by State/Region, 2014 Census
State/Region
Total Children Prime working-age Older persons
Total % with electricity for lighting
Total % with electricity for lighting
Total % with electricity for lighting
Total % with electricity for lighting
Union 47,929,999 33.3 13,995,368 27.4 29,593,172 35.5 4,341,459 36.6
Kachin 1,370,748 31.4 451,502 27.6 823,367 33.0 95,879 36.0
Kayah 272,730 47.8 97,160 42.2 158,835 50.7 16,735 53.4
Kayin 1,454,264 26.3 529,818 22.3 805,973 28.8 118,473 26.6
Chin 469,109 14.9 189,862 13.1 243,830 16.0 35,417 16.4
Sagaing 5,076,326 24.2 1,477,357 19.5 3,117,720 25.7 481,249 28.1
Tanintharyi 1,352,283 8.1 470,653 7.5 776,011 8.6 105,619 7.5
Bago 4,743,808 28.1 1,364,369 23.1 2,921,092 29.5 458,347 34.3
Magway 3,786,538 23.1 1,033,009 20.5 2,338,875 24.1 414,654 23.8
Mandalay 5,843,424 41.6 1,544,174 36.8 3,737,104 43.7 562,146 40.9
Mon 1,949,821 36.8 621,619 31.2 1,133,704 38.8 194,498 43.3
Rakhine 2,034,148 13.0 642,837 10.2 1,189,272 14.4 202,039 13.7
Yangon 6,949,440 71.1 1,677,494 62.5 4,649,187 73.2 622,759 78.9
Shan 5,500,933 33.3 1,785,380 29.7 3,318,557 34.9 396,996 37.0
Ayeyawady 6,053,594 12.2 1,795,695 8.8 3,701,845 13.2 556,054 16.9
Nay Pyi Taw 1,072,833 42.5 314,439 37.2 677,800 44.8 80,594 42.7

Census Report Volume 4-L – The Older Population 87
Chapter 8. Regional variations in ageing
Access to improved sanitationThe 2014 Census defined improved sanitation as a ‘flush toilet’ or a water sealed pit latrine. At the Union level, nearly 80 per cent of older people live in a household with access to improved sanitation. In urban areas, nearly 95 per cent have such access and in rural areas about three-quarters have access (Table 8.9). Older people in Rakhine stand out as those with the least access to improved sanitation.
Table 8.9 Percentage of older people living in a household with access to improved sanitation, urban and rural areas, State/Region, 2014 Census
State/Region
Union Urban Rural
Total % with improved sanitation
Total % with improved sanitation
Total % with improved sanitation
Union 4,341,459 79.8 1,312,355 94.6 3,029,104 73.4
Rakhine 202,039 37.2 34,102 81.5 167,937 28.2
Shan 396,996 65.7 104,692 93.2 292,304 55.8
Kayin 118,473 73.3 22,087 96.0 96,386 68.1
Magway 414,654 75.4 62,862 87.2 351,792 73.3
Tanintharyi 105,619 75.4 28,236 93.3 77,383 68.9
Sagaing 481,249 78.4 81,426 93.2 399,823 75.4
Chin 35,417 79.0 8,226 94.5 27,191 74.3
Bago 458,347 81.7 112,775 93.0 345,572 78.0
Ayeyawady 556,054 82.4 93,096 93.9 462,958 80.1
Mandalay 562,146 85.6 174,208 95.3 387,938 81.2
Mon 194,498 86.6 58,092 95.7 136,406 82.7
Kachin 95,879 87.4 37,970 92.2 57,909 84.3
Kayah 16,735 90.5 5,151 95.7 11,584 88.2
Nay Pyi Taw 80,594 90.6 22,349 95.0 58,245 88.9
Yangon 622,759 94.7 467,083 97.3 155,676 87.1
Summary of the material conditions of older peopleDesigning policies and programmes to support older people means, in part, targeting areas where the older population experiences the most difficult living conditions. To contribute to policy development, Figure 8.8 draws together the information on the material conditions of the older population. A ranking of States/Regions from the most to the least disadvantaged was created by summing the three measures presented above: access to improved sanitation, living in a bamboo/hut/other type of dwelling unit and the use of electricity for lighting. Yangon was ranked first since it has the lowest proportion of older persons living without access to improved sanitation (score of 1); the second lowest proportion of older persons living in a bamboo/hut/other type of dwelling unit (score of 2); and the lowest proportion of older persons living without electric lighting (score of 1). When summed, Yangon had a score of 4, meaning it ranked in first place (having the lowest score) out of all States/Regions.
As Figure 8.8 shows, there is no perfect relationship between these three variables. Some States/Regions rank relatively high on one or more indicators and low on others; however, there is a general pattern. The final ranking, shown in the first column, shows that Yangon is the Region where older people have the highest material wealth. Sagaing, Magway and

Census Report Volume 4-L – The Older Population88
Chapter 8. Regional variations in ageing
Rakhine rank the lowest; that is, older persons are most likely to lack access to improved sanitation, live in a condominium/apartment/bungalow or semi-pacca or wooden house or use electric lighting, although they are not necessarily the States/Regions with the greatest deprivation for each indicator.
Figure 8.8 Ranking of State/Region by indicators of material comfort for older people, 2014 Census
Summary ranking % without improved sanitation
% living in a bamboo/hut/other type
% without electric lighting
8.2.5 Formal education and literacyAttending formal schooling gives children a lifelong advantage. In addition to basic literacy and numeracy, education provides a better understanding of how society and government functions. A person who has attended school is better able to acquire and act on new knowledge and have greater confidence dealing with government and the private sector. Table 8.10 gives the percentage of older people who have never attended school, ranked from the lowest to the highest. Yangon has the lowest percentage of older people who have never attended school (11.1 per cent) and Shan has the highest (65.7 per cent). Between 18 and 25 per cent of older people in the central States/Regions, with the exception of Mon and Magway, have never attended school. Between 30 and 50 per cent of older people in the more remote States/Regions of Rakhine, Kachin, Kayah, Kayin and Chin have never attended school. In all States/Regions, older females are less likely to have attended school than older males. In most States/Regions, the proportion of those who have never attended school in rural areas is at least twice as high as the urban proportion. The numbers from which Table 8.10 were derived can be found in Appendix 1, Table 23.
1514
139999
77
65
43
21
0 5 10 15
RakhineMagwaySagaing
ChinTanintharyi
ShanAyeyawady
KayinMandalay
KachinBago
Nay Pyi TawKayah
MonYangon
62.824.621.621.024.6
34.317.6
26.714.412.618.3
9.49.513.4
5.3
0 50 100
34.543.0
35.123.6
19.134.935.1
13.348.8
36.620.423.022.5
11.112.7
0 50 100
86.376.2
71.983.6
92.563.0
83.173.4
59.164.065.7
57.346.6
56.721.1
0 50 100

Census Report Volume 4-L – The Older Population 89
Chapter 8. Regional variations in ageing
Table 8.10 Percentage of population aged 60 and over who have never attended school by sex, urban and rural areas, State/Region, 2014 Census
State/Region
Both sexes Male Female
Union Urban Rural Union Urban Rural Union Urban Rural
Union 28.7 15.0 34.6 20.9 8.4 26.0 34.3 19.5 41.0
Yangon 11.1 8.5 18.9 6.4 3.8 13.5 14.5 11.8 23.0
Tanintharyi 17.9 10.0 20.8 13.7 5.6 16.4 21.1 13.0 24.3
Nay Pyi Taw 18.9 10.6 22.1 7.0 3.3 8.5 26.9 15.4 31.3
Bago 20.8 12.8 23.4 14.8 7.0 17.1 25.0 16.5 28.0
Ayeyawady 21.8 12.7 23.7 16.2 7.1 17.9 26.3 16.5 28.4
Sagaing 24.1 13.7 26.2 14.0 5.7 15.7 30.9 19.0 33.4
Mandalay 25.2 13.7 30.3 14.4 6.1 18.0 32.4 18.6 38.8
Mon 30.1 18.0 35.2 22.5 11.0 26.9 35.8 22.8 41.8
Rakhine 32.8 20.1 35.3 19.9 10.4 21.6 42.5 26.6 46.0
Kachin 35.2 26.3 41.1 25.5 16.4 31.3 41.7 32.6 47.7
Magway 40.1 16.5 44.3 32.1 9.6 35.9 45.6 20.8 50.3
Kayah 45.0 22.4 55.1 32.2 11.6 40.6 55.3 30.2 67.3
Kayin 48.4 20.0 54.9 38.8 11.7 44.6 55.8 25.9 63.1
Chin 49.1 34.9 53.4 27.7 14.6 31.6 67.5 51.8 72.4
Shan 65.7 42.3 74.0 57.3 31.4 65.6 72.5 50.1 81.3
In the 2014 Census, people living in conventional households were asked if they could read and write in any language. The results for the older population reflect the same pattern as found in the percentage of those who had never attended school as shown at Table 8.10. Literacy rates are highest in Yangon, followed by Ayeyawady and Bago and lowest in Chin and Shan States. See Appendix 1, Table 24 for the numbers used to derive Figure 8.9.
Figure 8.9 Percentage of older persons living in conventional households who are literate, urban and rural areas, State/Region, 2014 Census
0
10
20
30
40
50
60
70
80
90
100
Percen
tage
Total
Urban
Rural

Census Report Volume 4-L – The Older Population90
Chapter 8. Regional variations in ageing
Many States/Regions have made impressive gains in literacy in recent decades. Table 8.11 shows these gains by comparing the literacy rates of youth and older people. With the exception of Kayin and Shan States, the youth literacy rates in all States/Regions are over 90 per cent. The progress in literacy rates has been particularly pronounced for females. For example, older women in Kachin have a literacy rate of 63.2 per cent but 97.8 per cent of female youth are literate. Even in Shan, Chin, Kayah and Kayin States there has been remarkable progress, considering the low level of literacy among people aged 60 and over. The literacy rates for the older population can be found in Appendix 1, Table 24 and the youth literacy rates can be found in the 2014 Census thematic report on Children and Youth (Department of Population 2017c).
Table 8.11 Literacy rates for youth and the older population by State/Region, 2014 Census
State/Region Youth aged 15-24 Population aged 60 and over Difference
Both sexes Male Female Both sexes Male Female Both sexes Male Female
Union 94.0 94.5 93.5 79.1 88.8 72.0 14.9 5.7 21.5
Kachin 97.8 97.8 97.8 71.1 83.0 63.2 26.7 14.8 34.6
Kayah 94.5 95.2 93.7 56.2 69.2 45.8 38.3 26.0 47.9
Kayin 86.8 86.0 87.5 54.0 65.2 45.3 32.8 20.8 42.2
Chin 93.3 95.7 91.2 51.4 72.6 33.3 41.9 23.1 57.9
Sagaing 97.4 97.7 97.2 82.7 94.0 75.1 14.7 3.7 22.1
Tanintharyi 96.1 95.9 96.1 85.1 91.7 80.1 11.0 4.2 16.0
Bago 96.7 97.1 96.3 88.0 95.4 82.8 8.7 1.7 13.5
Magway 97.1 97.6 96.7 79.4 93.5 69.7 17.7 4.1 27.0
Mandalay 97.6 98.0 97.2 82.8 95.0 74.6 14.8 3.0 22.6
Mon 93.8 93.5 94.1 73.0 82.8 65.7 20.8 10.7 28.4
Rakhine 91.3 94.1 89.1 72.2 87.9 60.4 19.1 6.2 28.7
Yangon 97.9 98.1 97.7 92.6 97.6 89.0 5.3 0.5 8.7
Shan 76.8 78.4 75.3 41.6 54.1 31.4 35.2 24.3 43.9
Ayeyawady 95.9 96.3 95.5 88.1 94.8 82.8 7.8 1.5 12.7
Nay Pyi Taw 97.3 98.2 96.6 84.5 96.9 76.2 12.8 1.3 20.4
8.2.6 Main/usual activity of the older populationChapter 4 discussed older people’s transition out of the labour force in their older years. At the Union level, older men have higher labour force participation rates than older women and older people in rural areas are more likely to be economically active than urban older people. These patterns also occur in each State/Region.
Table 8.12 shows that the older population in Yangon has a much lower labour force participation rate than any other State/Region. Shan and Chin have the highest rates. The percentage of older people who were recorded as pensioner, retired, or classified themselves as an older person ranged from 39.2 per cent in Ayeyawady to 50.3 per cent in Yangon.
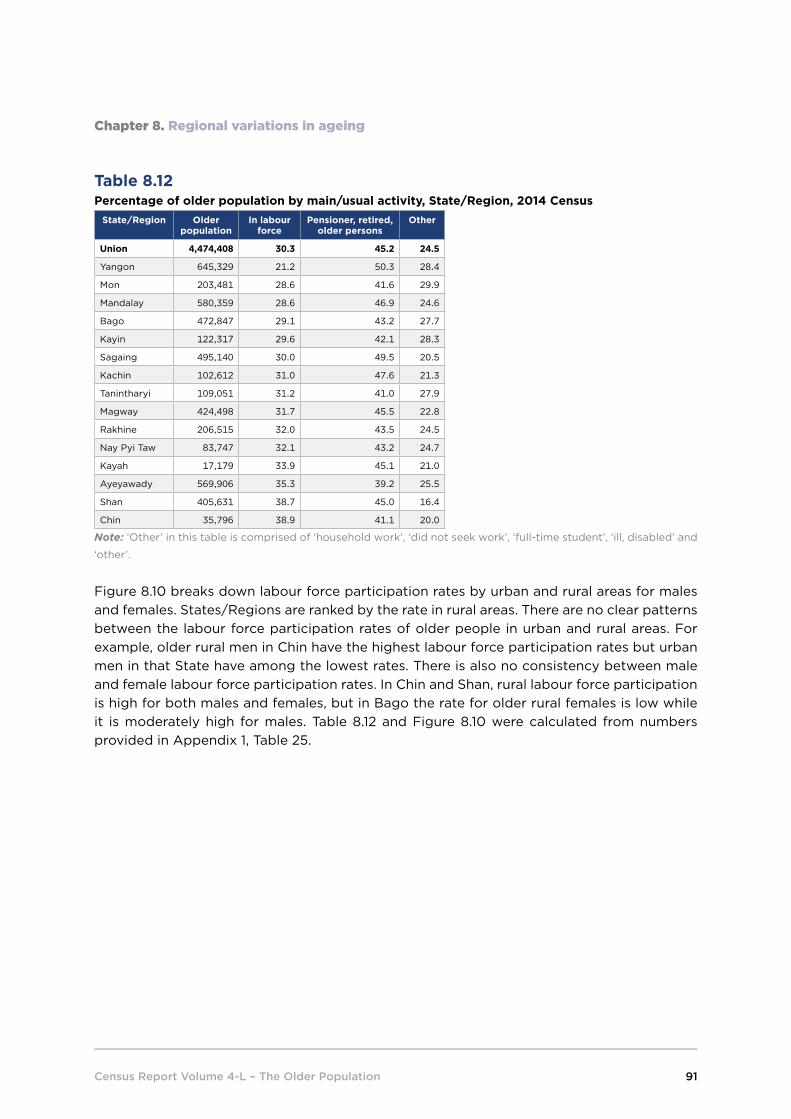
Census Report Volume 4-L – The Older Population 91
Chapter 8. Regional variations in ageing
Table 8.12 Percentage of older population by main/usual activity, State/Region, 2014 Census
State/Region Older population
In labour force
Pensioner, retired, older persons
Other
Union 4,474,408 30.3 45.2 24.5
Yangon 645,329 21.2 50.3 28.4
Mon 203,481 28.6 41.6 29.9
Mandalay 580,359 28.6 46.9 24.6
Bago 472,847 29.1 43.2 27.7
Kayin 122,317 29.6 42.1 28.3
Sagaing 495,140 30.0 49.5 20.5
Kachin 102,612 31.0 47.6 21.3
Tanintharyi 109,051 31.2 41.0 27.9
Magway 424,498 31.7 45.5 22.8
Rakhine 206,515 32.0 43.5 24.5
Nay Pyi Taw 83,747 32.1 43.2 24.7
Kayah 17,179 33.9 45.1 21.0
Ayeyawady 569,906 35.3 39.2 25.5
Shan 405,631 38.7 45.0 16.4
Chin 35,796 38.9 41.1 20.0
Note: ‘Other’ in this table is comprised of ‘household work’, ‘did not seek work’, ‘full-time student’, ‘ill, disabled’ and
‘other’.
Figure 8.10 breaks down labour force participation rates by urban and rural areas for males and females. States/Regions are ranked by the rate in rural areas. There are no clear patterns between the labour force participation rates of older people in urban and rural areas. For example, older rural men in Chin have the highest labour force participation rates but urban men in that State have among the lowest rates. There is also no consistency between male and female labour force participation rates. In Chin and Shan, rural labour force participation is high for both males and females, but in Bago the rate for older rural females is low while it is moderately high for males. Table 8.12 and Figure 8.10 were calculated from numbers provided in Appendix 1, Table 25.

Census Report Volume 4-L – The Older Population92
Chapter 8. Regional variations in ageing
Figure 8.10 Labour force participation rates of older population by sex, urban and rural areas, State/Region, 2014 Census a) Male
b) Female
010203040506070
Percen
tage
Urban
Rural
8.3 Summary
Like the rest of the population, half of the older population in Myanmar live in several of the largest States/Regions. There are 14.4 per cent of all older people in Yangon; 13 per cent in Mandalay; and 12.7 per cent in Ayeyawady. Sagaing and Bago are home to about 11 per cent of the older population. Also like the total population, 49 per cent of urban older people live in the urban areas of Yangon and Mandalay.
The extent of population ageing is greatest in several of the central States/Regions. Magway has the oldest population, followed by Mon, Bago, Mandalay, Sagaing, Ayeyawady and Yangon. The enumerated population of Rakhine is also relatively old, but this may not be true for the non-enumerated population. In all States/Regions, the urban population has the same or a higher proportion of the older population as the rural population. A map of the older age dependency ratio shows that Districts with the highest ratios are in the centre of the country while Districts with the lowest older age dependency ratios are along the eastern and northern borders. If present rates continue, the central States/Regions will experience the highest growth rate of the older population by 2030, accompanied by a declining
0
10
20
30
40
50
60
70
Percen
tage Urban
Rural

Census Report Volume 4-L – The Older Population 93
Chapter 8. Regional variations in ageing
total population. This is the result of a steady outflow of the population for employment opportunities. All States/Regions are projected to have older populations growing at a rate of at least 3 per cent every year, faster than the total population.
The combination of outmigration and fertility decline also affects household composition. Most older people - from 70 to 80 per cent - co-reside with an adult child. However, a few States/Regions have over 10 per cent of older persons living alone or with a spouse only. This is more common in rural areas. In the rural areas of three States/Regions (Kayin, Tanintharyi and Mon) with high rates of outmigration of adults, over 10 per cent of older people are living with their grandchildren but no adult child.
Highlighting three indicators of poor material well-being (poorer quality of housing, lack of access to improved sanitation and no electrical lighting), a large proportion of older people live in difficult conditions. Some patterns in State/Region variations were observed. Yangon, Mon, Kayah, Nay Pyi Taw and Bago were ranked as the States/Regions which had the highest level of material well-being for older people. Sagaing, Magway and Rakhine were ranked the lowest for the material well-being of older people.
The proportion of older people who have never attended school and who were illiterate also varied widely among States/Regions. An encouraging finding is that by comparing the literacy rates of youth and older people, it can be seen that all States/Regions have made substantial gains (or maintained a high level) of literacy, especially for females. The gender gaps in education and literacy among States/Regions seen among older people, will narrow in the future.
The labour force participation of older people varies among States/Regions from 21.2 per cent in Yangon to 38.9 per cent in Chin. In all cases, older men are more likely to be in the labour force than older women. Older people living in rural areas are more likely to be working than those in urban areas. However, patterns are not consistent. Some States/Regions may have a high labour force participation rate for older males compared to other States/Regions, but a lower labour force participation rate among older females. Cultural factors as well as the local economy influences the main activities of older people.

Census Report Volume 4-L – The Older Population94
Chapter 9. Policy challenges and implications Chapter 9.
As discussed in Chapter 3 and throughout this report, the ageing of a population is a natural outcome of the demographic transition from high to low fertility and mortality and, to some extent, of greater mobility. These have been fundamental changes that have brought profound improvements to individuals and society. However, these forces also bring concerns about the implications for economic growth and the well-being of the older population.
The Government of Myanmar is developing policies that take into account the needs of the current and future older population, informed by the experiences of countries that have already experienced population ageing. This chapter starts with a review of what the 2014 Census reveals about the older population 20 to 30 years in the future. It also reviews the range of policies and programmes promoted through international declarations and backed by evidence. Finally, it describes the Government of Myanmar’s plans for addressing the growing number of older people.
9.1 Challenges in supporting the current and future older population
A major concern about population ageing in Asia and elsewhere has been its potential impact on economic growth through a proportionate decrease in the relative size of the economically active population (Park et al 2012). With proportionately fewer workers there is less capacity to increase production and fewer people receiving wages which they spend and invest.
Unlike countries that have had a rapid fertility decline, Myanmar’s population profile will contribute to economic growth in the short to medium term. Up to 2050, Myanmar will experience continuous growth in the working-age population and a decline in the proportion of children. Although the proportion of the older population will grow from 9 per cent in 2015 to 20 per cent in 2050, the total dependency ratio will only increase from 60 to 67 children and older people per 100 persons in the prime working ages. Furthermore, as Chapter 6 showed, 47 per cent of men and 18 per cent of women aged 60 and over are still in the labour force.
Therefore, population ageing in Myanmar should not be seen as a threat to economic growth. The policy challenges for continuing to grow the Myanmar economy are to create productive employment opportunities for youth entering the labour force and to encourage women to remain in the workforce for longer.
Although population ageing is not a threat, it does present challenges. The Government of Myanmar is committed to providing social protection to the most vulnerable in society, including older people. The characteristics of the older population in the future and the implications for policy can be forecast with a great deal of accuracy, based on the detailed information available from the Census and recent studies of older people.
From population projections, it can be seen that in the future the older population in Myanmar will be larger, both in absolute numbers and proportionately. As a result of a steady net migration from rural to urban areas and from small towns and cities to larger ones, an increasing proportion of the total population and older people will be living in urban areas

Census Report Volume 4-L – The Older Population 95
Chapter 9. Policy challenges and implications
and, probably, in the largest cities of Yangon and Mandalay. However, the majority of older people will continue to live in rural areas. In rural areas with large volumes of outmigration of youth and young adults, a higher proportion of the remaining population will be older people. Targeted programmes may be required to assist those older people who do not have adult children living nearby and, in some cases, take on responsibilities for caring for grandchildren.
Marriage and childbearing is going through a profound change in Myanmar which will affect the older people of today and the future. An increasing proportion of women, especially in urban areas, are choosing not to marry. In the 2014 Census, 18.7 per cent of women aged 40-44 in urban areas and 11.9 per cent in rural areas were single. This compares to 12.1 and 8.6 per cent of urban and rural women aged 60-64. Using the population projections described in Chapter 3 and the proportions never married (single) from Chapter 4, it is possible to project the population of single older women in 2035 and 2050. This is based on the assumption that single women aged 40-44 do not marry and that the proportion single stays at that level for younger cohorts. The result of this projection is that compared to an estimated 224,000 single older women in 2015, there will be 691,000 in 2035 and 1,076,000 in 2050. The proportion of older women who are single will increase from 8 per cent in 2015 to 14 per cent in 2050.
In the short-term, older people will benefit from a higher proportion of daughters remaining single. Single adults are more likely to live with their parents than married or widowed adults. Chapter 5 also showed that the majority of older people who are single live with family members. The average woman in her childbearing years at the time of the Census can expect to have an average of only 2.5 children (Department of Population 2016b).
Over time the older population will become much better educated. Chapter 4 showed that more than one quarter (26.5 per cent) of people aged 60-69 in 2014 had never attended school. Among 40-49 year olds, only 5.8 per cent had no education (Department of Population 2015). A more educated older population will be more informed about how to safeguard their future. They will be better able to make financial decisions and follow advice about preventive and primary health to lower their risk of illness.
Continued rural economic development will also affect the well-being of older people. Myanmar is primarily a rural country. Seventy per cent of the population live in rural areas; that is projected to continue for many decades. Therefore, the well-being of older people will largely be determined by the prosperity of the agricultural sector, supplemented by public and private investment in infrastructure such as electricity, water and sanitation and roads.
Agriculture is the main source of employment for the total population and for the older population. The agricultural sector has very low productivity; most people working in the sector earn very little. Increasing agricultural productivity is a priority for the Government of Myanmar, both to increase economic growth and to reduce poverty (World Bank Group 2014). Productivity gains will directly lead to improved well-being for older people. Chapter 6 showed that households in the lowest wealth quintiles were least likely to have an older member.
Census Report Volume 4-L – The Older Population96
Chapter 9. Policy challenges and implications
Economic development for Myanmar will also involve continuing a trend that can be seen since 1983 of increasing non-agricultural employment. Without other changes, as more adults take jobs in non-agricultural sectors, they will be more likely to withdraw from the workforce at around the age of 60. Income security in old age will become a more pressing policy issue. Four policy approaches will need to be considered. Individuals will need opportunities to save for their old age while they are working through a range of financial products including contributory pensions. Only an estimated 12 per cent of the older population in Myanmar have access to a pension (HelpAge International 2015); expanding pension schemes for workers in the formal and informal sector will need to be considered. Older people’s low labour force participation rates in Yangon and in most urban areas in other States/Regions suggests that there is a need for more flexible opportunities for older people to continue to be economically active if they wish. Lastly, older people and their families who cannot meet their basic needs require the security of social protection schemes.
The strong emphasis on supporting older people and the preference for co-residence can be expected to continue in Myanmar for many decades. The high proportion of educated adult children who live with their parents suggests that co-residence is compatible with economic growth. International studies have shown that in the short and medium term, economic growth increases the proportion of multi-generational households (Ruggle and Heggeness 2008). Chapter 6 showed that households with an older person had greater wealth per number of persons in the household than households without an older person, and the higher the level of education of children, the more likely an adult was to live with a parent.
However, the demographic changes discussed above will result in a higher proportion of older people not living with family members. Other Asian countries with similar cultural values have seen an increase in the proportion of older people living alone as a result of economic development (Teerawichitchainan, Knodel and Pothisiri 2015; World Bank 2016). Along with a shift away from co-residence, economic development has seen older people providing an increasing amount of economic support to younger generations rather than an increase in financial support from children to their parents (World Bank 2016).
Improvements in life expectancy and in disability-free life years will be dependent on policies implemented by the Ministry of Health and Sports as well as through improved standards of living as a result of economic development.
The rising prevalence of non-communicable diseases (NCDs) could result in little improvements or even a worsening of adult mortality rates. Furthermore, uncontrolled diabetes and hypertension can increase disabilities due to a lack of mobility and failing vision. Many of the risk factors for non-communicable diseases are prevalent in Myanmar. A 2014 national survey of adults aged 25-64 found that males were particularly at risk: 34 per cent smoke daily, and 20 per cent engage in heavy episodic or binge drinking. Although 84 per cent of Myanmar adults are physically active, 87 per cent ate less than the recommended servings of fruit or vegetables per day. Women are more likely to be overweight (31 per cent) and to have raised cholesterol (43 per cent). About one-quarter of males and females have high blood pressure. As a result WHO estimates that 18 per cent of males and 21 per cent of females have three out of the five risk factors for NCDs (MOH and WHO 2014).
Census Report Volume 4-L – The Older Population 97
Chapter 9. Policy challenges and implications
Lastly, an analysis of the older population in Myanmar requires a gender lens. More females than males will survive to older ages and they will live longer. However, older females are also more likely to suffer from disabilities, to live alone and to live in poverty. Older females have been found to access health care less often than older males (Rajan and Sreerupa 2016). They are less likely to be economically active and they are more likely to have never attended school or to be able to read and write. Any programmes to support the well-being of older people need to take into account the greater needs of older women and to be designed and implemented in a manner that increases gender equity.
9.2 Evidence-based policies to support the older population
Myanmar is not unique in its population ageing. In fact, its current level and projected situation in 2050 is almost the same as the global pattern. This means that Myanmar can learn from, and share with other countries successful strategies to address the challenges and opportunities of the increasingly older population.
The World Bank’s (2016) overview of the experiences and lessons learned from Asia’s population ageing makes the following broad points:
• The scale of population ageing in the medium term is known and the need for planning is great because the growth of the older population is occurring faster than economic growth in many countries.
• Addressing issues arising from population ageing needs a multi-sectoral approach. • Meeting the challenges of an ageing population is not just about supporting older
people. Improving the education, health and economic opportunities of younger generations will enable them to support their older family members and to transition into a healthy and prosperous old age.
9.2.1 International declarations For decades, international conferences have been urging countries to address the challenges of population ageing and the well-being of the older population. The first was the United Nations International Plan of Action for the Ageing that was presented to the World Assembly on Ageing, in Vienna in 1982. The Plan pointed out “the vast and multifaceted impact which the ageing of population will have on the structure, functioning and further development of all societies of the world” (United Nations, 1983). At this World Assembly some 62 recommendations for action were suggested under the main headings of Health and Nutrition; Protection of Elderly Consumers; Housing and Environment; Family; Social Welfare; Income Security and Employment; Education; Care; and Self-fulfilment and Dignity - all of which are important for the formulation of policy in Myanmar.
At the World Population Conference in Mexico City in 1984, a general global consensus emerged that emphasized that: “The ageing section of the population should be viewed not merely as a dependent group, but also the group which has actively contributed to the economic, social and cultural life of their families and community” (Siddhisena and Ratnayaka, 1998).
The Second World Assembly on Ageing, in Madrid in 2002, was a landmark in forming

Census Report Volume 4-L – The Older Population98
Chapter 9. Policy challenges and implications
an international consensus on interventions. The Political Declaration and Plan of Action identified three priority directions: full participation of older people in development including its benefits; advancing health and well-being into old age; and ensuring enabling and supportive environments. Myanmar has indicated its support for the Madrid Plan of Action, and the five elements of the National Action Plan on Ageing, discussed below, are derived from these three priorities.
One of the most pervasive messages from several decades of advocacy for greater attention to population ageing is that it is affected by all dimensions of people’s lives and public policy. An integrated approach to ageing is required: one that addresses livelihoods, savings, fiscal programmes, health, education and social welfare. Most recently this multi-sectoral approach has been reflected in the Sustainable Development Goals which are committed to ‘leaving no one behind’ in the effort to create a safer, healthier, more equitable and prosperous world for current and future populations. Many of the 17 goals explicitly target improvements for older people or emphasize the importance of all age groups sharing in the benefits. At a national level, most countries have adopted national plans on ageing that bring a common purpose to the work of many sectors.
9.2.2 Policies and programmesThe views of older people from around the world have highlighted two universal concerns and one wish (UNFPA and HelpAge International 2012). The concerns are income security in old age and being able to meet their health needs. The wish is to continue to contribute to society.
These individual concerns are also the primary concerns of governments: the consequences that population ageing will have on economic growth and their capacity to support the needs of a growing older population. This section discusses the primary approaches governments have taken to provide income security and affordable and accessible health care.
During the 21st century Asian countries have been introducing diverse pension schemes to cover workers in the formal and informal sector (Park et al 2012). They have also been striving to ensure universal access to health care, including meeting the essential health needs of older people. The concern is that governments may not be able to afford these programmes, leading them into unsustainable debt.
9.2.3 Income securityAsian countries are at the early stages of developing and institutionalizing mechanisms to financially support older people. There are four broad approaches that can be taken. The first is the transfer of public money to older people, either to everyone or targeted to those with the greatest need. The second are strategies which facilitate private savings during older people’s working years to self-fund their last decades of life. The third policy is to reduce barriers to older people being economically active. The fourth policy is to invest in future economic growth through the education of younger generations and to facilitate their entry into the labour force, as well as economic investment friendly policies. These approaches are not mutually exclusive. Successfully meeting the challenges of population ageing will involve striking a balance between all four.

Census Report Volume 4-L – The Older Population 99
Chapter 9. Policy challenges and implications
Social securitySeveral Asian countries have adopted non-contributory pension schemes to support older people. Nepal, Viet Nam and Thailand have universal social pensions. China has new rural pension schemes and the Philippines has means-tested social pensions. A continuing issue with all of these schemes is the relatively low benefit levels to individuals resulting from proportionately smaller amounts of money spent on these programmes. The Asian programmes spend about 1 to 2 per cent of the GDP on pensions compared to 5 per cent or more in other countries with a similar GDP in other regions such as Latin America and parts of Africa. In fact, in the Philippines, Thailand and Indonesia older people pay more in taxes than they receive in benefits (Park et al 2012 p 14).
As pressure increases to provide greater income security, the most appropriate course will be to adopt two policy approaches (World Bank 2016). The first is to encourage voluntary contribution pension schemes for an increasing proportion of workers in the government and private sector. By enabling individuals to save for their retirement there will be less pressure on government transfers. However, this approach needs to be complemented by social protection measures which ensure basic rights are enshrined in law to provide social pensions for the most vulnerable.
Flexible arrangements for working older peopleIncreasing the age of retirement, typically aged 60 in government and many businesses, has proved to be politically unpopular in many countries. Opposition comes from cultural views of the importance of old age as a time for other activities; the demands of younger workers to assume leadership roles held by older workers; and the fiscal implications of keeping on cohorts of less productive workers as they age.
For the majority of people, the retirement age is not relevant as they are employed in agriculture, the informal economy or in family businesses and household production. Programmes to train or re-train older people who wish to be in the workforce or support for older people to start small businesses are likely to be more appropriate and effective as well as politically acceptable.
9.2.4 Health and health careAn ageing population can increase pressure on tertiary health care systems unless primary health care systems are strengthened. In fact, it is a vicious cycle with poor primary health care exacerbating the episodic use of more expensive hospital care, for those who can afford to access it (World Bank 2016).
The best investment for good health in older people is in primary and preventive health care earlier in life. Healthy women, giving birth to healthy infants who receive good nutrition; immunizations; prompt treatment for infectious diseases; and who are kept safe from trauma is the best predictor of a healthy older population in the future (World Bank 2016). Programmes to encourage and enable people to practice healthy behaviours such as not smoking, remaining active and eating nutritious food will contribute to people having a healthier old age. Action is needed to address the causes of the extremely high levels of male mortality.

Census Report Volume 4-L – The Older Population100
Chapter 9. Policy challenges and implications
However, age-related illnesses and disabilities cannot be completely prevented. Providing home- and community-based care to older people and their family carers through health care workers and volunteers is more affordable and more culturally acceptable than long-term care facilities.
Enabling better health throughout the lifecycle requires that governments work towards ensuring universal access to a range of quality primary and hospital facilities without causing financial hardship. This is the primary goal of national public health programmes.
9.3 Government of Myanmar approaches
Since 2010, the Government of Myanmar has been introducing policies and programmes to improve the quality of health and social services. These include strategies that directly target older people as well as those that indirectly affect older people by benefiting those who are poor or vulnerable. The Ministry of Social Welfare, Relief and Resettlement (MSWRR) is responsible for the majority of the government’s social protection programmes to support older people. An unpublished report by the non-governmental organization HelpAge International mapped out existing and planned government strategies as of late 2015 and forms the basis of this section. Given that population ageing and social protection are government priorities, more services and programmes can be expected to be introduced in the next few years in line with the five-year National Plan on Ageing and the National Social Protection Strategic Plan, both passed in 2014, and the law related to older people passed in late 2016. In early 2017, a 20-year National Policy on Ageing was being drafted and is expected to be approved later in the year.
9.3.1 Income securityAccess to some form of retirement pension or social security has been considered by the Myanmar Government since independence, initially with very limited coverage but gradually expanding over time (Department of Population, 2012). However, the pension scheme is limited and applies mainly to public service employees; it continues to be a non-contributory programme for those who have worked, up to the age of 60, for the government including civil servants, military and political personnel. The latest figures suggest that for the period 2014-2015, 365,573 persons received a civil service pension; 49,089 persons received a political pension and 253,873 received a military pension which, together, covered about 12 per cent of the population aged 55 and over (HelpAge International, 2015).
Permanent employees in the private sector in Myanmar do not receive a pension on their retirement. Under the current social security system, the Government has recently adopted some social protection programmes to cover small-scale agriculture and fishing communities, but this has not yet been implemented. Older people in NGOs or the informal sector do not receive any of the protection provided by the Government. The 2014 National Social Protection Strategic Plan has committed the government to a non-contributory social pension programme to support the income security of those aged 65 and over through a cash benefit of MMK 25,000 per month. Towards fulfilling this commitment, the government has approved a social pension for all older persons aged 90 and over of MMK 10,000 per month, starting in the fiscal year beginning April 2017.

Census Report Volume 4-L – The Older Population 101
Chapter 9. Policy challenges and implications
9.3.2 Older people care services and residential facilitiesThe long-term care system is largely fragmented with a heavy reliance on informal care provided by family and neighbours as well as the over-utilization of hospitalization. However, several models of services for older people are being implemented in Myanmar, including home care, community-based support, day care centres and residential facilities. Services that do exist are disproportionally in urban areas and in Yangon in particular. Most programmes are managed by non-government and community organizations in partnership with the Government. They are reliant on volunteers and project funding. Monitoring and evaluation and analysis of cost effectiveness are uncommon and therefore these programmes may not be useful models to scale-up across the country.
Private and charitable organizations offer home care programmes to some 41,219 older people through Older People Self-Help Groups and Village Development Committees in selected Townships (HelpAge International, 2015). The five-year National Action Plan on Ageing proposes to expand the formation and roles of Older People Self-Help Groups.
As noted in Chapter 4, there were only 78 registered old people’s homes in Myanmar providing care for 3,402 older residents in 2015. These existing homes are reported to have long waiting lists (HelpAge International 2015). There are also government and private charitable Day Care Centres that offer meals and basic health care to older people and others who are destitute. These services often require that beneficiaries have no family members.
9.3.3 Health care servicesHealth care services in Myanmar have suffered from a long period of neglect. WHO has estimated that between 2000 and 2011 the total expenditure on health averaged only 2 per cent of the GDP, the lowest in South-East Asia and the Pacific (WHO 2014b). Rural health care facilities are particularly under-resourced (Rajan and Sreerupa 2016). Despite the recent expansion of health services, there is still much to be done before the government can achieve its goal of universal health coverage (Ministry of Health and Sports 2016).
There are government and private health services in Myanmar. According to the policies of the Ministry of Health, older people can obtain annual check-ups or other consultations from government hospitals free of charge, but patients are required to pay for the medication and treatment. Many organizations and voluntary contributors assist in funding such medical expenses as there is no Medicare insurance coverage in Myanmar, but there is no evidence about how many people are assisted in this way. Private drug stores, clinics and hospitals are an important source of health care for older people. The 2012 Survey of Older Persons reported that 35 per cent of older people were ill or injured in the past 12 months which prevented them from carrying out normal activities. Of those, nearly all (95 per cent) said they received some treatment. Forty-four per cent received that treatment from a private source.
Access and affordability are major barriers to older people using health services. A study of older people’s use of health services in five Townships found that older people from rural areas and the poorest households were the least likely to have used outpatient or inpatient services (Rajan and Sreerupa 2016). Cost is likely to be a factor discouraging use. Older

Census Report Volume 4-L – The Older Population102
Chapter 9. Policy challenges and implications
people from poor households faced a cost burden for outpatient care that was double the cost burden (defined as expenditure in relation to their average total monthly expenditure) faced by wealthier households.
In order to promote active and healthy ageing, the Ministry of Health and Sports has, since 1992-1993, implemented its Health Care of the Elderly project; first initiated in six Townships and subsequently expanded to four to six Townships yearly. This programme was developed as an integral part of a primary health care programme focusing on health care for older people under the umbrella of the Community Health Care programme as part of the National Health Plan of 1993-1996 (Han, 2012). By 2013, this programme had been implemented in 161 Townships where hospitals and rural health centres opened clinics for the specific care of older people every Wednesday. These clinics provide comprehensive health care, including promotive, preventive, curative and rehabilitative care. The health care programme also encourages home-based care of older persons by families, health volunteers and NGOs through advocacy and training of health staff, voluntary health workers, family members and community volunteers (Han, 2012). The programme has not been evaluated.
In the future the prevalence of non-communicable diseases will be a major factor in determining how long older people can expect to live disability-free. Myanmar is developing a national non-communicable disease strategic plan which will establish mechanisms to advocate for more resources to be allocated towards preventing and managing the adverse impacts of cardiovascular disease, diabetes and cancer.
9.3.4 Participation of older peopleBuilding on previous experience, the National Social Protection Strategic Plan and the National Action Plan on Ageing calls for village level Older People Self-Help Groups to be expanded nationwide. These groups would empower older people to meet their own needs by designing and implementing programmes such as home-based care; health awareness and self-care; age-friendly livelihoods; disaster risk reduction; microcredit; and rights and entitlements.
One of the five areas of action in the National Action Plan on Ageing is increasing the engagement of older people in disaster management planning, risk reduction and in emergency response, recognizing that older people are frequently the most vulnerable in times of disaster.
9.4 Summary
Myanmar’s population is ageing gradually. Although the proportion of the population aged 60 and over will continue to rise, the proportion of younger adults who have higher labour force participation rates will also increase over much of the period.
Future older people in Myanmar will benefit from a higher level of education. If mortality, and the underlying causes of death, continues to decline, a greater proportion of older people should be able to enjoy good health for a longer period.

Census Report Volume 4-L – The Older Population 103
Chapter 9. Policy challenges and implications
The challenges for older persons in the future include an apparent trend towards lower labour force participation. The higher proportion of older women who will not have a spouse or a surviving child, primarily because of an increasing proportion of women who never marry, means that the number of vulnerable older women living on their own may increase. In areas of the country where high proportions of youth and young adults move away for employment, older people may be left responsible for all of the agricultural work. Poor health in older age is an accumulation of a lifetime of living in an unhealthy environment without access to health care. Without improvements in water and sanitation, food security and health care, the health of older people in the future may not be better than it is now.
Policies and programmes are being designed which are aligned with international declarations. These include policies to increase income security; provide opportunities for labour force participation for older people who wish to be employed; strengthened primary health care which addresses the specific needs of older adults; and the establishment of mechanisms to increase the participation of older people in the community and in decision-making processes that affect them.
The recent policies and programmes of the Government of Myanmar have confirmed the importance of addressing the challenges and opportunities of population ageing and safeguarding the well-being of the older population. However, programmes are still in an early stage of development and do not reach all 4.5 million people currently aged 60 and over. However, they have been designed in the spirit of international conferences that have highlighted the rights of older people, with a view to integrating lessons learned from other countries.

Census Report Volume 4-L – The Older Population104
Chapter 10. Recommendations and conclusions Chapter 10.
10.1 Recommendations
10.1.1 Recommendations for policyMyanmar’s strong cultural and religious traditions of respecting and caring for older people means that most older people receive social and material support from family members. However, government, along with civil society and the private sector, has an important role to play in establishing a supportive environment for older people and their families.
As a low income country, Myanmar faces challenges in providing social protection to an increasing number of older people. The government’s focus on economic development, poverty elimination and increased agricultural productivity will ultimately enhance the well-being of older people and their families.
Increasing affordable access to basic primary health care, including support to prevent non-communicable diseases, will help more people enjoy a healthy old age. Investing in developing a long-term care system integrated with strengthened primary health care will be essential to meet the needs of the growing older population. Practically, the use of home- and community-based care offered by trained volunteers will help ill, frail, and older people with a disability to live with dignity and provide support to family members who may find it difficult to give the care that is needed.
As the economy modernizes and diversifies, wage earners and employees in the formal sector should be given incentives to save for their retirement. Older people who wish to work should have the opportunities to do so. Development of social protection including a sufficient universal social pension, as outlined in the National Law on Ageing passed in 2016, will provide essential protection to older people.
10.1.2 Recommendations for further researchThis thematic report covered the information available on the older population from the 2014 Census. Recommendations for further research include methodological approaches in substantive areas of interest, such as the labour force participation of the older population and the increasing proportion of never married women.
Modelling and multivariate analysis is called for to better understand the predictors of important indicators such as recent residential moves by older people, those who live alone and adult children who co-reside with their parents. For example, a simple cross-tabulation between the severity of disability and household composition, controlling for urban and rural residence was presented in Chapter 7. No meaningful differences in household composition were detected. This finding may be accurate. Given the preference for living with family and particularly with living children, age-related disability may not have an impact in the decision to co-reside. However, a much more complete understanding requires controlling for more factors such as age, sex, type of disability, number of living children and assets.
When the unit level data is made available for a sample of the population it is hoped that researchers will take up this challenge to perform detailed, policy-relevant analysis. In preparing the unit record file, consideration should be given to ensure that it contains an

Census Report Volume 4-L – The Older Population 105
Chapter 10. Recommendations and conclusions
adequate number of older persons to make detailed analysis meaningful.
Dedicated surveys on the older population should be conducted on a regular basis, building on the comprehensive work of the 2012 Survey of Older Persons. Such surveys could provide more information on inter-generational flows of financial and non-financial assistance and about older people’s health conditions and use of health services.
Some findings in this thematic report call out for further analysis of the Census data and new studies. For example, findings in Chapters 6 and 8 raise concerns about the effects of population ageing on agricultural production. Two trends were observed. Firstly, there has been a decline over time in the proportion of older people reporting to be employed in farming. Secondly, there are reasons for concern about the effects on agricultural productivity in the rapidly ageing dry zone, which is experiencing a loss of young people due to migration for employement.
10.1.3 Recommendations for future censusesIn order to monitor progress of the National Action Plan on Ageing, the National Social Protection Strategic Plan and the pending National Policy on Ageing, all standard tables should include sex and age-disaggregated data for the older population at least up until the age of 80 and over. The education tables in the Union report, for example, only go up to age 50 and over (Department of Population 2015). Age-disaggregated data are also important for targeting geographic areas where the needs of older people are particularly acute.
Censuses are massive exercises, relying on the skill and integrity of a large number of enumerators to correctly identify and record information on every resident. This report found that the completeness of the coverage of the older population appears to be very good and that, over time, the quality of age reporting can expect to improve as a result of increasing levels of education.
Training for enumerators in the next census should address problems encountered when enumerating older people. Disability, marital status and the number of living children are areas in which the quality of reporting would probably improve if enumerators were sensitive to the potential for misreporting.
10.2 Conclusion
The vast majority of older people in Myanmar are supported by family members. In return, older people contribute to these extended households through their income and assets and by providing advice and practical assistance.
Compared to many other countries in the region, Myanmar’s older population has grown at a relatively slow rate and will continue to do so. This gives the government and civil society the opportunity to make gradual adjustments to meet the challenges and opportunities of a projected older population of 64 million, or 20 per cent of the total population, by 2050.
Many of the 4.5 million older people enumerated in the 2014 Census live in poor quality

Census Report Volume 4-L – The Older Population106
Chapter 10. Recommendations and conclusions
housing, without access to improved sanitation and drinking water, and do not use electricity as a source of energy for lighting and cooking. They also lack access to basic amenities, communication devices and transport facilities. Policies and programmes that lead to economic development, poverty reduction and increased agricultural productivity will benefit the whole of society. For those who advocate for the well-being of older people, the priority is to ensure that these benefits are shared with the most vulnerable.

Census Report Volume 4-L – The Older Population 107
References
Bernard A, Bell M and Charles-Edwards E. 2014. Life-course transitions and the age profile of internal migration. Population and Development Review 40(2) pp 213-239.
Census Division. 1986. Burma 1983 Population Census. Department of Immigration and Manpower, Rangoon.
Department of Population. 1995. Population Changes and Fertility Survey, 1991. Chapter 4. Fertility and Nuptiality. Ministry of Immigration and Population, Yangon.
Department of Population. 2014. Field Instructions Manual for Enumerators and Supervisors. 2014 Population and Housing Census of Myanmar. Ministry of Immigration and Population, Nay Pyi Taw.
Department of Population. 2014. The 2014 Population and Housing Census: Census Observation Mission Report. Republic of the Union of Myanmar. Nay Pyi Taw.
Department of Population. 2015. The 2014 Myanmar Population and Housing Census: The Union Report. Ministry of Immigration and Population. Nay Pyi Taw.
Department of Population. 2016a. The 2014 Myanmar Population and Housing Census: Thematic Report on Population Dynamics. Ministry of Labour, Immigration and Population. Nay Pyi Taw.
Department of Population. 2016b. The 2014 Myanmar Population and Housing Census: Thematic Report on Fertility and Nuptiality. Ministry of Labour, Immigration and Population. Nay Pyi Taw.
Department of Population. 2016c. The 2014 Myanmar Population and Housing Census: Thematic Report on Mortality. Ministry of Labour, Immigration and Population. Nay Pyi Taw.
Department of Population. 2016d. The 2014 Myanmar Population and Housing Census: Thematic Report on Migration and Urbanization. Ministry of Labour, Immigration and Population. Nay Pyi Taw.
Department of Population. 2016e. The 2014 Myanmar Population and Housing Census. The Union Report: Occupation and Industry. Census Report Volume 2-B. Ministry of Immigration and Population. Nay Pyi Taw.
Department of Population. 2017a. The 2014 Myanmar Population and Housing Census: Thematic Report on Population Projections for the Union of Myanmar, States/Regions, Rural and Urban Areas, 2014-2050. Ministry of Labour, Immigration and Population. Nay Pyi Taw.
Department of Population. 2017b. The 2014 Myanmar Population and Housing Census: Thematic Report on Education. Ministry of Labour, Immigration and Population. Nay Pyi Taw.

Census Report Volume 4-L – The Older Population108
Department of Population. 2017c. The 2014 Myanmar Population and Housing Census: Thematic Report on Children and Youth. Ministry of Labour, Immigration and Population. Nay Pyi Taw.
Department of Population. 2017d. The 2014 Myanmar Population and Housing Census: Thematic Report on Disability. Ministry of Labour, Immigration and Population. Nay Pyi Taw.
Department of Population and UNFPA. 2005. The Elderly Population in Myanmar: Trends, Living Conditions, Characteristics and Prospects. Ministry of Immigration and Population. Yangon.
Department of Population and UNFPA. 2012. Ageing Transition in Myanmar. Ministry of Immigration and Population. Nay Pyi Taw.
Government of Myanmar. 2014a. Myanmar National Social Protection Strategic Plan. Nay Pyi Taw.
Government of Myanmar. 2014b. Plan of Action on Ageing. Approved by Cabinet, July 2014. Nay Pyi Taw.
Han Myint, 2012. Health care of the elderly in Myanmar. Regional Health Forum. Volume 16. Number 1:23-28.
HelpAge International. 2015. Mapping of Myanmar Services for Older People. HelpAge International, Yangon.
Institute for Health Metrics and Evaluation (IHME), Human Development Network and The World Bank. 2013. The Global Burden of Disease: Generating Evidence, Guiding Policy – East Asia and Pacific Regional Edition. Seattle, WA: IHME.
Jasilionis D and Shkolnikov VM. 2016. Longevity and education: a demographic perspective. Gerontology 62(3) pp 253-362.
Jagger C, Van Oyen H and Robine J-M. 2014. Health Expectancy Calculation by the Sullivan Method: A Practical Guide. 4th edition. Institute for Ageing, Newcastle University, Newcastle upon Tyne, United Kingdom.
Knodel J. 2014. The Situation of Older Persons in Myanmar. Results from the 2012 Survey of Older Persons (Revised 2014). HelpAge International and UNFPA.
Knodel J and Teerawichitchitchanan B. 2017. Aging in Myanmar. The Gerontologist. Advance Access, posted January 11, 2017, DOI: 10.1093/geront/gnw211.
Ministry of Health (MOH) and World Health Organization (WHO). 2014. Report on National Survey of Diabetes Mellitus and Risk Factors for Non-Communicable Diseases in Myanmar. Ministry of Health, Myanmar.
References

Census Report Volume 4-L – The Older Population 109
Ministry of Health and Sports. 2016. National Health Plan 2017-22. Nay Pyi Taw.
Ministry of National Planning and Economic Development (MNPED) and UNICEF. 2012. Situation Analysis of Children in Myanmar. 2nd Ed. Nay Pyi Taw, MNPED and UNICEF.
Mujahid G and Siddhisena K.A. P. 2009. Demographic Prognosis for South Asia: A Future of Rapid Ageing. Papers in Population Ageing 6. Bangkok. UNESCAP.
Park D, Lee S-H and Mason A (eds.). 2012. Ageing, Economic Growth, and Old-Age Security. Asian Development Bank and Edward Elgar Publishing, Cheltenham, United Kingdom.
Rajan, S.I and Sreerupa. 2016. Study on Accessing Healthcare by the Older Population in Myanmar. HelpAge International, Yangon.
Ruggle S and Heggeness M. 2008. Intergenerational Coresidence in Developing Countries. Population and Development Review 34(2): 253-281.
Randall S and Coast E. 2016. The quality of demographic data on older Africans. Demographic Research. 34(5):143-174.
Siddhisena K. A. P. 2005. Socio-economic Implications of Ageing in Sri Lanka. Oxford Institute of Ageing Working Paper No. 105. University of Oxford, Oxford.
Siddhisena K. A. P. and Ratnayaka K. 1998. Ageing Population and Elderly Care in Sri Lanka. Sri Lanka Journal of Population Studies. 1(1) pp 35-55.
Shyrock H S and Siegel J S. 1976. Methods and Materials of Demography. New York, Academic Press.
Teerawichitchainan B and Knodel J. 2015. Economic status and old-age health in poverty-striken Myanmar. Journal of Aging and Health 27(8) pp 1462-1484.
Teerawichitchainan B, Knodel J and Pothisiri W. 2015. What does living alone really mean for older persons? A comparative study of Myanmar, Vietnam, and Thailand. Demographic Research 32: 1329-1360.
UNDP. 2016. Leave No One Behind: Ageing, Gender and the SDGs. Issue Brief. New York, UNDP.
UNICEF/WHO/World Bank/UN-DESA Population Division, 2014. Levels and Trends in Child Mortality. Report 2014.
United Nations. 1983. Vienna International Plan of Action on Aging. United Nations, New York.
United Nations. 2001. World Population Prospects. The 2000 Revision. United Nations, New York.
References

Census Report Volume 4-L – The Older Population110
United Nations 2002. Report of the Second World Assembly on Ageing. Madrid. 8-12 April 2002. Population A/CONF. 197/9. United Nations, New York.
United Nations. 2011. Social Development: Follow-up to the International Year of Older Persons: Second World Assembly on Ageing. Publication A/66/173. United Nations, New York.
United Nations. 2015. Transforming Our World: the 2030 Agenda for Sustainable Development. Resolution adopted by the General Assembly on 25 September 2015. A/RES/70/1. United Nations, New York.
United Nations Department of Economic and Social Affairs (UN DESA). 2015a. World Population Prospects. The 2015 Revision. [Online data set] United Nations, New York.
United Nations Department of Economic and Social Affairs (UN DESA). 2015b. World Population Ageing 2015. ST/ESA/SER.A/390. United Nations, New York.
United Nations Population Fund (UNFPA) and HelpAge International. 2012. Ageing in the Twenty-first Century: A Celebration and a Challenge. New York and London.
World Bank. 2016. Live Long and Prosper: Aging in East Asia and Pacific. World Bank East Asia and Pacific Regional Report. World Bank, Washington DC.
World Bank Group. 2014. Ending Poverty and Boosting Shared Prosperity in a Time of Transition: A Systematic County Diagnostic. Yangon.
World Health Organization (WHO). 2014a. Noncommunicable Disease (NCD) Country Profiles Myanmar. Geneva.
World Health Organization (WHO). 2014b. The Republic of the Union of Myanmar: Health system review. In Health Systems in Transition (HiT), Vol.4 No. 3, WHO Press (on behalf of the Asia Pacific Observatory on Health Systems and Policies).
WHO and World Bank. 2011. World Report on Disability. World Health Organization, Geneva.
Zimmer Z and Das S. 2014. The poorest of the poor: composition and wealth of older person households in sub-Saharan Africa. Research on Aging. 36(3), pp 271-296.
References

Census Report Volume 4-L – The Older Population 111
Glossary of terms and definitions
Ageing index: is the ratio of the population aged 60 and over to the population aged under 15. It takes into account the size and changes at both ends of the age distribution, or the shift in the balance between the populations of children and older persons.
Annual growth rate: a growth rate (r) can be calculated either arithmetically or exponentially. This report uses the exponential method.
Exponential method: r = [loge (Pn / Po)] / n Where, Pn is the older population in the current census P0 is the older population in the previous census n = the number of years between the censuses r is conventionally multiplied by 100.
Census Night: the night between the 29th and 30th March 2014. Every person in Myanmar was enumerated where they spent Census Night.
Child dependency ratio: in this report the child dependency ratio is the number of persons aged 0-14 per 100 persons aged 15-59.
Conventional household: includes one or more persons who are either related or unrelated and share living quarters (single quarter or compound) and meals. The household members would usually eat food from the same cooking pot. In most cases, there would be one person acknowledged by the household members as the head of the household.
Economically active: refers to the status of those persons who are ‘employed’ or ‘unemployed’ at the Census date. The report sometimes refers to these people as ‘active’, but they are also commonly referred to as the ‘labour force’.
Educational attainment: is the highest grade/standard/diploma/degree completed within the most advanced level attended in the education system of the country where the education was received. It covers both public and private institutions accredited by government.
Functional age groups: three broad age groups are used to compare children aged 0-14, people in the prime working-age group, aged 15-59, and persons aged 60 and over.
Improved drinking water: is drinking water from a source that is defined as one that, by nature of its construction or through active intervention, is likely to be protected from outside contamination, in particular from contamination with faecal matter. The Census identified the following sources as ‘Improved’: Tap/piped water; Tube well/borehole; Protected well/spring; and Bottled/purified water. All other sources of drinking water identified in the Census were classified as ‘Unimproved’.
Improved sanitation: is a toilet facility that hygienically separates human excreta from human contact. The Census identified the following toilet facilities as ‘Improved’: Flush; Water seal (improved latrine); and Pit latrine. All other types of toilet identified in the Census were classified as ‘Unimproved’.

Census Report Volume 4-L – The Older Population112
Institutional population: is a unit where a group of people are living together other than in a conventional household. Examples include: old people’s homes; orphanages; hospitals; boarding schools; hotels, hostels and guest houses; institutions for persons with disabilities; prisons; monasteries; convents; military and police barracks; and camps for workers.
Labour force: is a general term to mean those persons who were, collectively, ‘Employed’ or ‘Unemployed’ at the time of the Census. The report sometimes refers to such persons as ‘Economically active’.
Labour force participation rate: is the ratio between the number of people in the labour force in a particular age group and the overall size of the total population in the same age group. This is an important indicator as it represents the proportion of the population that is economically active.
Level of education: this refers to primary, secondary and post-secondary education. Primary education includes grades 1 to 5, while secondary education includes grades 6 to 11. Post-secondary education starts at the age of 16 progressing to diplomas, university attendance, and postgraduate degrees.
Life expectancy: is the average number of additional years that a person could expect to live if current mortality levels were to continue for the rest of that person’s life.
Literacy: is the ability to both read and write in any one language with reasonable understanding. A literate person is one who can read and write a short simple statement on everyday life in any one language. An illiterate person cannot.
Marital status: is the status of the enumerated person in relation to the institution of marriage. The marital status was classified as: single/never married, married, widowed, divorced/separated and renounced.
Median age: is the age at which exactly half the population is younger and half is older than that age.
Natural increase: is the difference between the number of births and the number of deaths in a year divided by the midyear population and conventionally expressed per 1,000 people.
Older age dependency ratio: in this report the older age dependency ratio is the number of persons aged 60 and over to the population aged 15-59.
Parent support ratio: is the number of persons aged 85 and over per 100 persons aged 50-64.
Population ageing: is the increasing share of older persons in the population.
Potential support ratio: is the number of persons aged 15-59 per number of persons aged 60 and over.
Glossary of terms and definitions

Census Report Volume 4-L – The Older Population 113
Recent migrant: in the context of the 2014 Census recent migrants are persons who changed their place of usual residence to another Township during the five year period prior to the 2014 Census.
Rural area: is an area classified by the General Administration Department (GAD) as a village tract. Generally, such areas have a low population density and a land use which is predominantly agricultural.
Sex ratio: is the number of males per 100 females in the total population. Age-specific sex ratios are the number of males per 100 females in a specific age group.
Survival ratio: is the life table function S(x,n). It is the proportion of people expected to survive five years in a specific age group where x is the starting age in the age group and n is the number of years in the age group. For example, the survival ratio for persons aged 60 to 64 surviving 5 years to ages 65 to 69.
Total dependency ratio: in this report the total dependency ratio is the number of persons aged 0-14 and 60 and over per 100 persons aged 15-59. The total dependency ratio equals the sum of the child and the older age dependency ratios.
Unemployed: refers to those persons who had no work but were able to work and were actually seeking a job during the reference period, or at the time of the 2014 Census enumeration.
Unemployment rate: is the percentage of the total labour force that was unemployed but actively seeking employment and willing to work. These are people who were without work, looking for jobs and were available for work.
Urban area: is an area classified by the General Administration Department (GAD) as a ward. Generally such areas have an increased density of building structures, population and better infrastructural development.
Glossary of terms and definitions

Census Report Volume 4-L – The Older Population114

Census Report Volume 4-L – The Older Population 115
Appendices

Census Report Volume 4-L – The Older Population116
Appendix 1. Appendix tables Appendix 1.
Table 1 Population by sex by five-year age group by functional age groups, 1973, 1983 and 2014 censuses
Age group
1973 Both sexes 1983 Both sexes 2014
Both sexes Male Female Male Female Male Female
Union 28,084,513 13,962,774 14,121,739 34,124,908 16,939,593 17,185,315 50,279,900 24,228,714 26,051,186
0-4 4,234,177 2,127,734 2,106,443 4,501,934 2,267,826 2,234,108 4,472,130 2,262,783 2,209,347
5-9 3,928,501 1,975,913 1,952,588 4,389,041 2,216,323 2,172,718 4,819,077 2,438,372 2,380,705
10-14 3,481,162 1,761,969 1,719,193 4,268,670 2,178,956 2,089,714 5,108,362 2,595,749 2,512,613
15-19 2,930,986 1,442,923 1,488,063 3,735,435 1,844,414 1,891,021 4,625,989 2,290,998 2,334,991
20-24 2,308,487 1,135,581 1,172,906 3,286,324 1,610,144 1,676,180 4,331,069 2,091,525 2,239,544
25-29 1,795,550 884,403 911,147 2,763,545 1,363,835 1,399,710 4,146,134 1,995,465 2,150,669
30-34 1,664,751 815,471 849,280 2,152,965 1,067,173 1,085,792 3,898,861 1,884,549 2,014,312
35-39 1,594,730 794,586 800,144 1,668,631 835,177 833,454 3,563,480 1,705,630 1,857,850
40-44 1,470,252 730,791 739,461 1,479,520 716,619 762,901 3,283,073 1,548,942 1,734,131
45-49 1,159,092 579,833 579,259 1,413,759 695,833 717,926 2,946,148 1,375,041 1,571,107
50-54 1,043,704 517,465 526,239 1,299,152 634,222 664,930 2,559,232 1,182,341 1,376,891
55-59 781,531 387,127 394,404 995,400 489,815 505,585 2,051,937 935,979 1,115,958
60-64 661,958 323,737 338,221 830,334 398,942 431,392 1,576,845 712,040 864,805
65-69 446,147 214,634 231,513 535,481 253,962 281,519 1,064,493 466,618 597,875
70-74 327,217 153,791 173,426 416,223 192,715 223,508 713,170 301,679 411,491
75-79 146,774 68,884 77,890 214,808 98,978 115,830 553,298 228,315 324,983
80-84 74,818 33,019 41,799 120,466 52,281 68,185 335,576 130,875 204,701
85-89 21,972 9,580 12,392 35,851 15,334 20,517 158,069 56,979 101,090
90+ 12,704 5,333 7,371 17,369 7,044 10,325 72,957 24,834 48,123
0-14 11,643,840 5,865,616 5,778,224 13,159,645 6,663,105 6,496,540 14,399,569 7,296,904 7,102,665
15-59 14,749,083 7,288,180 7,460,903 18,794,731 9,257,232 9,537,499 31,405,923 15,010,470 16,395,453
60 and over
1,691,590 808,978 882,612 2,170,532 1,019,256 1,151,276 4,474,408 1,921,340 2,553,068

Census Report Volume 4-L – The Older Population 117
Appendix 1. Appendix tables
Table 2 Population by functional age groups and age groups within the older population by sex, urban and rural areas, 1983 and 2014 censuses
Age group/Sex
1983
2014
Union Urban Rural % urban Union Urban Rural % urban
Functional age groups
Both sexes 34,124,908 8,466,292 25,658,616 24.8 50,279,900 14,877,943 35,401,957 29.6
0-14 13,159,645 3,019,589 10,140,056 22.9 14,399,569 3,583,796 10,815,773 24.9
15-59 18,794,731 4,924,393 13,870,338 26.2 31,405,923 9,929,558 21,476,365 31.6
60+ 2,170,532 522,310 1,648,222 24.1 4,474,408 1,364,589 3,109,819 30.5
Male 16,939,593 4,214,463 12,725,130 24.9 24,228,714 7,114,224 17,114,490 29.4
0-14 6,663,105 1,537,161 5,125,944 23.1 7,296,904 1,836,199 5,460,705 25.2
15-59 9,257,232 2,446,237 6,810,995 26.4 15,010,470 4,715,944 10,294,526 31.4
60+ 1,019,256 231,065 788,188 22.7 1,921,340 562,081 1,359,259 29.3
Female 17,185,315 4,251,829 12,933,486 24.7 26,051,186 7,763,719 18,287,467 29.8
0-14 6,496,540 1,482,428 5,014,112 22.8 7,102,665 1,747,597 5,355,068 24.6
15-59 9,537,499 2,478,156 7,059,343 26.0 16,395,453 5,213,614 11,181,839 31.8
60+ 1,151,276 291,245 860,031 25.3 2,553,068 802,508 1,750,560 31.4
Older population
Both sexes
60-69 1,365,815 329,621 1,036,194 24.1 2,641,338 810,788 1,830,550 30.7
70-79 631,031 149,265 481,766 23.7 1,266,468 378,479 887,989 29.9
80+ 173,686 43,424 130,262 25.0 566,602 175,322 391,280 30.9
Male
60-69 652,904 151,202 501,702 23.2 1,178,658 346,488 832,170 29.4
70-79 291,693 63,363 228,330 21.7 529,994 153,657 376,337 29.0
80+ 74,659 16,500 58,156 22.1 212,688 61,936 150,752 29.1
Female
60-69 712,911 178,419 534,492 25.0 1,462,680 464,300 998,380 31.7
70-79 339,338 85,902 253,436 25.3 736,474 224,822 511,652 30.5
80+ 99,027 26,924 72,103 27.2 353,914 113,386 240,528 32.0

Census Report Volume 4-L – The Older Population118
Appendix 1. Appendix tables
Table 3 Population projections for ASEAN countries from medium variant of World Population Prospects, 2015, 2035 and 2050
Year and Country Population in ‘000s Percentage
0-14 15-59 60+ 80+ Total 0-14 15-59 60+ 80+ Total
2015
All ASEAN less Myanmar 153,306 372,064 54,221 6,122 579,591 26.5 64.2 9.4 1.1 100
Brunei Darussalam 98 292 33 3 423 23.2 69.0 7.8 0.7 100
Cambodia 4,924 9,602 1,052 78 15,578 31.6 61.6 6.8 0.5 100
Indonesia 71,326 165,042 21,195 1,729 257,563 27.7 64.1 8.2 0.7 100
Lao PDR 2,366 4,030 406 35 6,802 34.8 59.2 6.0 0.5 100
Malaysia 7,433 20,114 2,784 236 30,331 24.5 66.3 9.2 0.8 100
Philippines 32,172 61,207 7,321 596 100,700 31.9 60.8 7.3 0.6 100
Singapore 871 3,732 1,000 133 5,603 15.5 66.6 17.8 2.4 100
Thailand 12,036 45,192 10,731 1,430 67,959 17.7 66.5 15.8 2.1 100
Timor-Leste 503 596 85 5 1,184 42.5 50.3 7.2 0.4 100
Viet Nam 21,577 62,257 9,614 1,877 93,448 23.1 66.6 10.3 2.0 100
2035
All ASEAN less Myanmar 148,880 422,777 114,325 12,957 685,982 21.7 61.6 16.7 1.9 100
Brunei Darussalam 88 320 108 12 516 17.1 62.0 20.9 2.3 100
Cambodia 5,052 12,608 2,328 240 19,988 25.3 63.1 11.6 1.2 100
Indonesia 67,881 191,028 45,938 3,474 304,847 22.3 62.7 15.1 1.1 100
Lao PDR 2,393 5,762 819 72 8,974 26.7 64.2 9.1 0.8 100
Malaysia 7,668 23,914 6,034 726 37,616 20.4 63.6 16.0 1.9 100
Philippines 35,299 80,657 14,600 1,291 130,556 27.0 61.8 11.2 1.0 100
Singapore 800 3,512 2,247 481 6,559 12.2 53.5 34.3 7.3 100
Thailand 8,992 37,964 20,486 3,430 67,442 13.3 56.3 30.4 5.1 100
Timor-Leste 637 951 123 13 1,711 37.2 55.6 7.2 0.8 100
Viet Nam 20,070 66,061 21,642 3,218 107,773 18.6 61.3 20.1 3.0 100
2050
All ASEAN less Myanmar 142,471 430,743 155,352 26,164 728,566 19.6 59.1 21.3 3.6 100
Brunei Darussalam 81 296 169 34 546 14.8 54.2 31.0 6.2 100
Cambodia 4,892 13,686 3,969 577 22,547 21.7 60.7 17.6 2.6 100
Indonesia 64,470 195,870 61,896 7,417 322,236 20.0 60.8 19.2 2.3 100
Lao PDR 2,196 6,486 1,490 158 10,172 21.6 63.8 14.6 1.6 100
Malaysia 6,871 24,262 9,592 1,455 40,725 16.9 59.6 23.6 3.6 100
Philippines 35,154 92,328 20,778 2,437 148,260 23.7 62.3 14.0 1.6 100
Singapore 736 3,247 2,699 921 6,682 11.0 48.6 40.4 13.8 100
Thailand 7,928 31,371 23,153 6,171 62,452 12.7 50.2 37.1 9.9 100
Timor-Leste 706 1,282 174 20 2,162 32.7 59.3 8.0 0.9 100
Viet Nam 19,437 61,915 31,432 6,974 112,784 17.2 54.9 27.9 6.2 100

Census Report Volume 4-L – The Older Population 119
Appendix 1. Appendix tables
Table 4 Distribution of older population living in conventional households by area of usual residence and area of birthplace, by age by sex, 2014 Census
Sex/Age
group
Total population
Non- migrant
Urban usual residents Rural usual residents Not classifiable
Total Born in: Living in Township of birth
Total Born in: Living in Township of birthAnother
urban areaA rural
areaAn urban
areaAnother
rural area
Both sexes
60 - 64 1,527,346 75.5 459,594 37.2 15.9 46.9 1,067,752 2.7 9.5 87.8 5,978
65 - 69 1,028,499 74.6 320,487 37.6 17.9 44.5 708,012 2.4 9.3 88.2 4,327
70 - 74 688,520 76.0 203,696 36.8 18.9 44.3 484,824 2.0 8.7 89.3 3,154
75 - 79 532,709 76.8 157,853 36.7 18.2 45.1 374,856 1.9 8.0 90.1 2,619
80 - 84 322,931 78.4 94,499 35.6 17.1 47.3 228,432 1.6 7.2 91.2 1,835
60+ 4,322,081 75.8 1,308,073 36.9 17.3 45.8 3,014,008 2.3 8.9 88.8 19,363
Male
60 - 64 678,198 74.6 195,078 38.2 17.0 44.8 483,120 3.0 10.4 86.6 2,546
65 - 69 441,925 73.5 132,276 39.1 19.2 41.7 309,649 2.7 10.2 87.1 1,760
70 - 74 284,993 74.6 82,365 38.3 20.7 41.0 202,628 2.3 9.5 88.2 1,194
75 - 79 214,233 75.5 61,292 38.2 20.2 41.6 152,941 2.1 8.8 89.1 990
80 - 84 122,633 77.5 34,164 37.9 18.4 43.8 88,469 1.7 7.8 90.5 612
60+ 1,818,351 74.7 528,296 38.3 18.6 43.1 1,290,055 2.6 9.8 87.7 7,547
Female
60 - 64 849,148 76.2 264,516 36.4 15.1 48.5 584,632 2.4 8.8 88.8 3,432
65 - 69 586,574 75.4 188,211 36.6 17.0 46.4 398,363 2.2 8.6 89.1 2,567
70 - 74 403,527 77.0 121,331 35.7 17.7 46.6 282,196 1.9 8.1 90.1 1,960
75 - 79 318,476 77.6 96,561 35.7 17.0 47.4 221,915 1.7 7.5 90.8 1,629
80 - 84 200,298 78.9 60,335 34.3 16.4 49.4 139,963 1.5 6.8 91.6 1,223
60+ 2,503,730 76.6 779,777 36.0 16.4 47.7 1,723,953 2.1 8.2 89.7 11,816
Note: Totals exclude persons with unclassifiable area of Township of birth or usual place of residence.
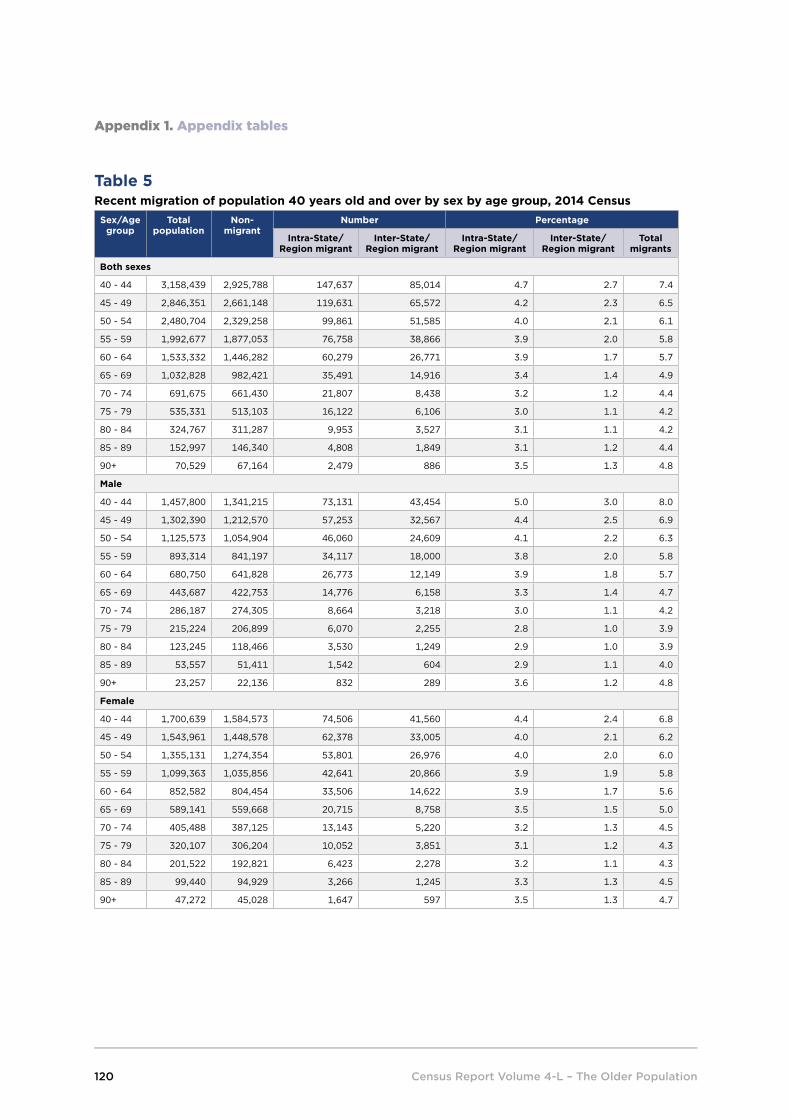
Census Report Volume 4-L – The Older Population120
Appendix 1. Appendix tables
Table 5 Recent migration of population 40 years old and over by sex by age group, 2014 Census
Sex/Age group
Total population
Non-migrant
Number Percentage
Intra-State/Region migrant
Inter-State/Region migrant
Intra-State/Region migrant
Inter-State/Region migrant
Total migrants
Both sexes
40 - 44 3,158,439 2,925,788 147,637 85,014 4.7 2.7 7.4
45 - 49 2,846,351 2,661,148 119,631 65,572 4.2 2.3 6.5
50 - 54 2,480,704 2,329,258 99,861 51,585 4.0 2.1 6.1
55 - 59 1,992,677 1,877,053 76,758 38,866 3.9 2.0 5.8
60 - 64 1,533,332 1,446,282 60,279 26,771 3.9 1.7 5.7
65 - 69 1,032,828 982,421 35,491 14,916 3.4 1.4 4.9
70 - 74 691,675 661,430 21,807 8,438 3.2 1.2 4.4
75 - 79 535,331 513,103 16,122 6,106 3.0 1.1 4.2
80 - 84 324,767 311,287 9,953 3,527 3.1 1.1 4.2
85 - 89 152,997 146,340 4,808 1,849 3.1 1.2 4.4
90+ 70,529 67,164 2,479 886 3.5 1.3 4.8
Male
40 - 44 1,457,800 1,341,215 73,131 43,454 5.0 3.0 8.0
45 - 49 1,302,390 1,212,570 57,253 32,567 4.4 2.5 6.9
50 - 54 1,125,573 1,054,904 46,060 24,609 4.1 2.2 6.3
55 - 59 893,314 841,197 34,117 18,000 3.8 2.0 5.8
60 - 64 680,750 641,828 26,773 12,149 3.9 1.8 5.7
65 - 69 443,687 422,753 14,776 6,158 3.3 1.4 4.7
70 - 74 286,187 274,305 8,664 3,218 3.0 1.1 4.2
75 - 79 215,224 206,899 6,070 2,255 2.8 1.0 3.9
80 - 84 123,245 118,466 3,530 1,249 2.9 1.0 3.9
85 - 89 53,557 51,411 1,542 604 2.9 1.1 4.0
90+ 23,257 22,136 832 289 3.6 1.2 4.8
Female
40 - 44 1,700,639 1,584,573 74,506 41,560 4.4 2.4 6.8
45 - 49 1,543,961 1,448,578 62,378 33,005 4.0 2.1 6.2
50 - 54 1,355,131 1,274,354 53,801 26,976 4.0 2.0 6.0
55 - 59 1,099,363 1,035,856 42,641 20,866 3.9 1.9 5.8
60 - 64 852,582 804,454 33,506 14,622 3.9 1.7 5.6
65 - 69 589,141 559,668 20,715 8,758 3.5 1.5 5.0
70 - 74 405,488 387,125 13,143 5,220 3.2 1.3 4.5
75 - 79 320,107 306,204 10,052 3,851 3.1 1.2 4.3
80 - 84 201,522 192,821 6,423 2,278 3.2 1.1 4.3
85 - 89 99,440 94,929 3,266 1,245 3.3 1.3 4.5
90+ 47,272 45,028 1,647 597 3.5 1.3 4.7

Census Report Volume 4-L – The Older Population 121
Appendix 1. Appendix tables
Table 6 Population 15 years old and over by marital status by age group by sex, 2014 Census
Sex/Age group Total Single Married Widowed Divorced/ Separated
Renounced
Both sexes
15 - 29 13,103,192 8,231,417 4,561,848 40,553 125,830 143,544
30 - 59 18,302,731 2,539,777 14,239,391 958,789 423,545 141,229
60 and over 4,474,408 287,475 2,545,077 1,499,541 67,320 74,995
60 - 64 1,576,845 118,227 1,078,818 328,827 30,193 20,780
65 - 69 1,064,493 68,579 661,025 299,792 17,317 17,780
70 - 74 713,170 41,281 377,590 271,673 9,391 13,235
75 - 79 553,298 28,896 246,639 260,266 5,786 11,711
80 - 84 335,576 17,832 119,237 188,758 2,852 6,897
85 - 89 158,069 8,388 44,343 100,939 1,281 3,118
90+ 72,957 4,272 17,425 49,286 500 1,474
Male
15 - 29 6,377,988 4,295,757 1,895,411 11,086 42,732 133,002
30 - 59 8,632,482 1,087,448 7,080,368 179,416 162,339 122,911
60 and over 1,921,340 78,772 1,419,946 333,773 25,637 63,212
60 - 64 712,040 34,099 585,699 63,752 10,923 17,567
65 - 69 466,618 18,396 367,081 59,630 6,443 15,068
70 - 74 301,679 10,941 216,277 59,489 3,769 11,203
75 - 79 228,315 7,431 144,857 63,539 2,537 9,951
80 - 84 130,875 4,605 70,694 48,550 1,260 5,766
85 - 89 56,979 2,105 25,659 26,173 523 2,519
90+ 24,834 1,195 9,679 12,640 182 1,138
Female
15 - 29 6,725,204 3,935,660 2,666,437 29,467 83,098 10,542
30 - 59 9,670,249 1,452,329 7,159,023 779,373 261,206 18,318
60 and over 2,553,068 208,703 1,125,131 1,165,768 41,683 11,783
60 - 64 864,805 84,128 493,119 265,075 19,270 3,213
65 - 69 597,875 50,183 293,944 240,162 10,874 2,712
70 - 74 411,491 30,340 161,313 212,184 5,622 2,032
75 - 79 324,983 21,465 101,782 196,727 3,249 1,760
80 - 84 204,701 13,227 48,543 140,208 1,592 1,131
85 - 89 101,090 6,283 18,684 74,766 758 599
90+ 48,123 3,077 7,746 36,646 318 336

Cen
sus
Rep
ort
Vo
lum
e 4
-L –
The
Old
er P
op
ulat
ion
122
App
endi
x 1.
App
endi
x ta
bles
Tab
le 7
N
umb
er o
f o
lder
wo
men
by
tota
l num
ber
of
livin
g c
hild
ren
and
num
ber
of
child
ren
livin
g in
the
sam
e ho
useh
old
, by
bro
ad a
ge
gro
up, u
rban
and
rur
al a
reas
, 20
14 C
ensu
sA
ge
gro
up/
Are
a
Tota
l nu
mb
er o
f w
om
en
Num
ber
of
child
ren
No
neO
neTw
oTh
ree
Four
Five
Six
Seve
nE
ight
Nin
e10
or
mo
reM
ean
no.
of
child
ren
Mea
n no
. of
child
ren
for
wo
men
wit
h a
livin
g c
hild
Num
ber
of
old
er w
om
en w
ith
child
ren
livin
g in
the
sam
e ho
useh
old
Ag
ed 6
0 an
d o
ver
Uni
on
2,51
5,55
282
6,09
894
2,21
942
4,80
718
6,79
078
,878
32,2
8713
,656
5,68
42,
645
1,32
51,
163
1.2
1.8
Urb
an78
3,34
324
6,78
126
4,11
714
7,50
170
,902
30,8
7512
,948
5,56
92,
422
1,13
558
151
21.
31.
9
Rur
al1,
732,
209
579,
317
678,
102
277,
306
115,
888
48,0
0319
,339
8,08
73,
262
1,51
074
465
11.
11.
7
Ag
ed 6
0-69
Uni
on
1,44
1,72
345
4,30
350
1,93
126
7,50
612
5,12
854
,351
22,3
369,
320
3,73
81,
652
812
646
1.3
1.9
Urb
an45
4,15
514
0,77
214
4,49
290
,523
44,8
5219
,503
8,03
33,
366
1,41
263
032
324
91.
42.
0
Rur
al98
7,56
831
3,53
135
7,43
917
6,98
380
,276
34,8
4814
,303
5,95
42,
326
1,02
248
939
71.
21.
8
Ag
ed 7
0-79
Uni
on
725,
595
244,
071
292,
255
112,
699
45,0
8518
,120
7,37
63,
162
1,39
972
535
335
01.
11.
7
Urb
an21
9,07
767
,851
78,0
5939
,884
18,5
848,
163
3,56
91,
555
710
355
167
180
1.3
1.9
Rur
al50
6,51
817
6,22
021
4,19
672
,815
26,5
019,
957
3,80
71,
607
689
370
186
170
1.0
1.6
Ag
ed 8
0 an
d o
ver
Uni
on
348,
234
127,
724
148,
033
44,6
0216
,577
6,40
72,
575
1,17
454
726
816
016
71.
01.
5
Urb
an11
0,11
138
,158
41,5
6617
,094
7,46
63,
209
1,34
664
830
015
091
831.
11.
8
Rur
al23
8,12
389
,566
106,
467
27,5
089,
111
3,19
81,
229
526
247
118
6984
0.9
1.4
Num
ber
of
old
er w
om
en w
ith
livin
g c
hild
ren
Ag
ed 6
0 an
d o
ver
Uni
on
2,51
5,55
246
2,49
818
4,16
126
0,97
532
8,70
834
8,09
131
1,95
324
9,02
117
1,52
810
4,19
252
,977
41,4
483.
64.
4
Urb
an78
3,34
315
9,08
262
,746
94,0
0311
5,12
911
0,84
588
,824
64,7
5840
,935
24,0
9012
,288
10,6
433.
34.
1
Rur
al1,
732,
209
303,
416
121,
415
166,
972
213,
579
237,
246
223,
129
184,
263
130,
593
80,1
0240
,689
30,8
053.
74.
5
Ag
ed 6
0-69
Uni
on
1,44
1,72
324
1,47
510
4,10
415
9,81
420
3,18
520
8,99
218
1,17
014
0,90
695
,284
56,9
4028
,517
21,3
363.
64.
3
Urb
an45
4,15
587
,336
36,7
2961
,381
74,9
6367
,820
50,1
8934
,002
20,1
5911
,423
5,61
14,
542
3.2
3.9
Rur
al98
7,56
815
4,13
967
,375
98,4
3312
8,22
214
1,17
213
0,98
110
6,90
475
,125
45,5
1722
,906
16,7
943.
84.
5
Ag
ed 7
0-79
Uni
on
725,
595
136,
117
51,1
0566
,816
85,2
4296
,400
91,9
9776
,963
54,7
0934
,148
17,8
2414
,274
3.7
4.6
Urb
an21
9,07
743
,367
16,1
9921
,782
27,8
8430
,177
27,1
1721
,266
14,1
538,
640
4,53
03,
962
3.5
4.4
Rur
al50
6,51
892
,750
34,9
0645
,034
57,3
5866
,223
64,8
8055
,697
40,5
5625
,508
13,2
9410
,312
3.8
4.7
Ag
ed 8
0 an
d o
ver
Uni
on
348,
234
84,9
0628
,952
34,3
4540
,281
42,6
9938
,786
31,1
5221
,535
13,1
046,
636
5,83
83.
34.
3
Urb
an11
0,11
128
,379
9,81
810
,840
12,2
8212
,848
11,5
189,
490
6,62
34,
027
2,14
72,
139
3.2
4.3
Rur
al23
8,12
356
,527
19,1
3423
,505
27,9
9929
,851
27,2
6821
,662
14,9
129,
077
4,48
93,
699
3.3
4.4

Census Report Volume 4-L – The Older Population 123
Appendix 1. Appendix tables
Table 8 Population 60 years old and over by literacy status by level of education by sex, 1983 and 2014 censuses
Literacy status/Level of education
1983 2014
Male Female Male Female
Literacy
Literate 794,702 593,579 1,621,534 1,812,119
Illiterate 224,554 557,697 204,373 703,433
Total 1,019,256 1,151,276 1,825,907 2,515,552
Level of education
No education 732,131 907,734 472,385 961,324
Grade 1-4 188,255 202,778 - -
Primary - - 793,519 1,125,904
Lower secondary 68,130 33,866 282,931 196,679
Upper secondary 22,182 5,878 175,507 107,965
University 3,905 792 98,198 64,232
Vocational training - - 3,543 1,556
Certificate 53 49 - -
Other 88 11 95,257 95,408
Total 1,014,744 1,151,108 1,921,340 2,553,068
Note: Literacy was only recorded for persons in conventional households.

Census Report Volume 4-L – The Older Population124
Appendix 1. Appendix tables
Table 9 Household heads aged 60 and over by household composition by age by sex, 2014 Census
Sex/Age
group
Total Living alone
Living only with spouse
Living with a
child and anyone
else
Living with a grandchild and no children but may live with
others
Living with a sibling, no children, no
grandchildren but may live with others
Living with other
relatives, no children, no
grandchildren and no sibling
Living with non-
relatives only
Unclassifiable
Both sexes
Total 2,530,908 198,990 184,971 1,882,913 144,707 57,554 43,437 13,914 4,422
60 - 64 895,808 57,617 67,833 678,957 40,334 26,807 16,285 4,973 3,002
65 - 69 625,888 46,004 48,351 465,147 35,573 15,584 10,728 3,420 1,081
70 - 74 415,567 35,964 31,126 304,680 27,200 7,365 6,711 2,261 260
75 - 79 315,866 29,941 22,291 230,885 21,642 4,376 4,947 1,717 67
80 - 84 175,050 18,386 10,642 127,724 12,258 2,231 2,873 929 7
85 - 89 74,364 7,945 3,559 54,678 5,501 885 1,355 438 3
90+ 28,365 3,133 1,169 20,842 2,199 306 538 176 2
Male
Total 1,549,758 59,863 178,265 1,186,943 71,803 20,494 20,906 8,435 3,049
60 - 64 604,707 18,640 65,316 474,861 22,098 9,999 8,463 3,269 2,061
65 - 69 392,078 13,880 46,701 299,495 18,302 5,474 5,353 2,128 745
70 - 74 241,762 10,303 30,078 181,085 13,115 2,537 3,137 1,315 192
75 - 79 173,412 8,689 21,508 128,448 10,158 1,472 2,127 965 45
80 - 84 89,685 5,240 10,199 66,675 5,234 700 1,166 467 4
85 - 89 35,063 2,224 3,369 26,420 2,131 238 471 209 1
90+ 13,051 887 1,094 9,959 765 74 189 82 1
Female
Total 981,150 139,127 6,706 695,970 72,904 37,060 22,531 5,479 1,373
60 - 64 291,101 38,977 2,517 204,096 18,236 16,808 7,822 1,704 941
65 - 69 233,810 32,124 1,650 165,652 17,271 10,110 5,375 1,292 336
70 - 74 173,805 25,661 1,048 123,595 14,085 4,828 3,574 946 68
75 - 79 142,454 21,252 783 102,437 11,484 2,904 2,820 752 22
80 - 84 85,365 13,146 443 61,049 7,024 1,531 1,707 462 3
85 - 89 39,301 5,721 190 28,258 3,370 647 884 229 2
90+ 15,314 2,246 75 10,883 1,434 232 349 94 1

Census Report Volume 4-L – The Older Population 125
Appendix 1. Appendix tables
Table 10 Population aged 40-59 in conventional households classified as living with a parent or parent-in-law by household headship by sex by marital status by level of education, urban and rural areas, 2014 Census
Sex/marital status/level of education
Population aged 40-59 in conventional households
Adults aged 40-59 living as the son/daughter or son/daughter-in-law or adopted child of the
household head
Adults aged 40-59 who are the head or the spouse of the head of household living with parent
or parent-in-law
Union Urban Rural Union Urban Rural Union Urban Rural
Both sexes
Total 10,478,171 3,212,469 7,265,702 1,103,403 459,973 643,430 541,384 158,737 382,647
Single 1,083,524 452,881 630,643 459,253 185,209 274,044 28,028 8,978 19,050
Married 8,317,101 2,403,059 5,914,042 507,159 220,436 286,723 474,586 137,940 336,646
Widowed 825,199 266,089 559,110 74,696 30,943 43,753 29,951 9,168 20,783
Divorced/Separated 249,958 89,673 160,285 62,004 23,266 38,738 8,796 2,639 6,157
Renounced 2,389 767 1,622 291 119 172 23 12 11
Male
Total 4,779,077 1,409,846 3,369,231 459,559 194,177 265,382 271,910 76,625 195,285
Single 372,439 156,058 216,381 151,604 64,322 87,282 12,508 3,192 9,316
Married 4,165,037 1,186,425 2,978,612 266,771 114,778 151,993 250,115 71,425 178,690
Widowed 148,563 35,460 113,103 14,946 4,900 10,046 6,346 1,295 5,051
Divorced/Separated 91,521 31,500 60,021 26,106 10,115 15,991 2,930 708 2,222
Renounced 1,517 403 1,114 132 62 70 11 5 6
Female
Total 5,699,094 1,802,623 3,896,471 643,844 265,796 378,048 269,474 82,112 187,362
Single 711,085 296,823 414,262 307,649 120,887 186,762 15,520 5,786 9,734
Married 4,152,064 1,216,634 2,935,430 240,388 105,658 134,730 224,471 66,515 157,956
Widowed 676,636 230,629 446,007 59,750 26,043 33,707 23,605 7,873 15,732
Divorced/Separated 158,437 58,173 100,264 35,898 13,151 22,747 5,866 1,931 3,935
Renounced 872 364 508 159 57 102 12 7 5
Both sexes
Total 10,478,171 3,212,469 7,265,702 1,103,403 459,973 643,430 541,384 158,737 382,647
No education 1,706,742 211,169 1,495,573 101,875 15,421 86,454 78,689 8,386 70,303
Primary school 5,079,872 1,002,360 4,077,512 442,032 93,384 348,648 252,212 42,667 209,545
Lower secondary 1,945,954 883,767 1,062,187 244,241 124,221 120,020 107,946 43,059 64,887
Upper secondary 871,916 567,435 304,481 143,093 100,311 42,782 49,643 30,158 19,485
Higher than high school 697,290 531,836 165,454 162,023 125,545 36,478 45,223 33,742 11,481
Other 176,397 15,902 160,495 10,139 1,091 9,048 7,671 725 6,946
Male
Total 4,779,077 1,409,846 3,369,231 459,559 194,177 265,382 271,910 76,625 195,285
None 654,591 66,959 587,632 40,756 6,146 34,610 35,586 3,285 32,301
Primary school 2,141,490 365,945 1,775,545 161,743 34,286 127,457 116,470 17,495 98,975
Lower secondary 1,103,593 449,653 653,940 124,805 61,345 63,460 64,617 23,125 41,492
Upper secondary 473,003 289,942 183,061 71,618 49,131 22,487 28,562 16,341 12,221
Higher than high school 308,484 228,761 79,723 55,632 42,670 12,962 21,937 15,945 5,992
Other 97,916 8,586 89,330 5,005 599 4,406 4,738 434 4,304
Female
Total 5,699,094 1,802,623 3,896,471 643,844 265,796 378,048 269,474 82,112 187,362
None 1,052,151 144,210 907,941 61,119 9,275 51,844 43,103 5,101 38,002
Primary school 2,938,382 636,415 2,301,967 280,289 59,098 221,191 135,742 25,172 110,570
Lower secondary 842,361 434,114 408,247 119,436 62,876 56,560 43,329 19,934 23,395
Upper secondary 398,913 277,493 121,420 71,475 51,180 20,295 21,081 13,817 7,264
Higher than high school 388,806 303,075 85,731 106,391 82,875 23,516 23,286 17,797 5,489
Other 78,481 7,316 71,165 5,134 492 4,642 2,933 291 2,642

Cen
sus
Rep
ort
Vo
lum
e 4
-L –
The
Old
er P
op
ulat
ion
126
App
endi
x 1.
App
endi
x ta
bles
Tab
le 1
1
Po
pul
atio
n ag
ed 1
5 ye
ars
and
ove
r by
mai
n/us
ual a
ctiv
ity
by s
ex b
y ag
e g
roup
, urb
an a
nd r
ural
are
as, 2
014
Cen
sus
Sex/
Ag
e g
roup
/Are
aM
ain/
usua
l act
ivit
y d
urin
g 1
2 m
ont
hs
Tota
lE
mp
loye
e (g
over
nmen
t)E
mp
loye
e (p
riva
te o
rg.)
Em
plo
yer
Ow
n ac
coun
t w
ork
erC
ont
rib
utin
g
fam
ily w
ork
erSo
ught
w
ork
Did
no
t se
ek w
ork
Full-
tim
e st
uden
tH
ous
eho
ld
wo
rkP
ensi
one
r, re
tire
d,
old
er p
erso
nIll
, d
isab
led
Oth
er
Uni
on
Bo
th s
exes
15-5
931
,405
,923
1,32
6,18
06,
935,
944
866,
597
7,86
4,89
13,
532,
920
869,
018
128,
828
1,73
6,56
86,
498,
506
311,
059
166,
811
1,16
8,60
1
60+
4,47
4,40
820
,784
229,
291
175,
638
764,
972
155,
322
8,20
65,
455
4,99
177
3,03
02,
023,
339
129,
851
183,
529
60-6
41,
576,
845
14,5
7713
3,36
677
,116
405,
091
80,7
724,
410
2,42
71,
283
384,
658
383,
394
28,8
5960
,892
65-6
91,
064,
493
3,21
259
,873
46,5
1420
8,78
441
,570
2,02
51,
418
1,11
521
6,64
841
4,82
924
,825
43,6
80
70-7
471
3,17
01,
198
20,4
2525
,220
85,8
5317
,659
767
642
1,04
093
,922
415,
224
21,7
8129
,439
75-7
955
3,29
867
59,
049
16,6
0941
,611
8,87
546
350
071
650
,140
379,
066
21,4
2124
,173
80-8
433
5,57
651
33,
602
7,18
115
,220
3,92
329
126
640
017
,925
254,
414
17,0
1814
,823
85-8
915
8,06
933
01,
752
2,33
45,
644
1,64
913
613
124
66,
976
121,
647
10,0
357,
189
90+
72,9
5727
91,
224
664
2,76
987
411
471
191
2,76
154
,765
5,91
23,
333
Mal
e
15-5
915
,010
,470
754,
491
4,53
0,14
764
5,71
95,
074,
821
1,40
8,08
951
4,31
779
,246
815,
863
181,
752
140,
332
100,
447
765,
246
60+
1,92
1,34
016
,746
167,
722
129,
478
536,
957
42,8
805,
753
3,40
91,
723
23,2
9982
8,76
552
,659
111,
949
60-6
471
2,04
012
,028
97,9
0457
,875
282,
473
20,9
373,
300
1,60
538
08,
933
172,
977
14,6
5538
,973
65-6
946
6,61
82,
591
44,0
1834
,333
147,
799
11,5
631,
426
942
358
6,24
417
8,45
811
,338
27,5
48
70-7
430
1,67
995
114
,785
18,3
9761
,277
5,39
648
736
140
23,
595
169,
626
8,69
017
,712
75-7
922
8,31
552
86,
521
11,8
3829
,557
2,80
526
328
527
22,
595
151,
440
7,89
114
,320
80-8
413
0,87
532
22,
445
5,06
810
,460
1,33
314
413
213
41,
220
95,8
935,
538
8,18
6
85-8
956
,979
184
1,17
91,
511
3,63
753
868
5393
503
42,5
693,
007
3,63
7
90+
24,8
3414
287
045
61,
754
308
6531
8420
917
,802
1,54
01,
573
Fem
ale
15-5
916
,395
,453
571,
689
2,40
5,79
722
0,87
82,
790,
070
2,12
4,83
135
4,70
149
,582
920,
705
6,31
6,75
417
0,72
766
,364
403,
355
60+
2,55
3,06
84,
038
61,5
6946
,160
228,
015
112,
442
2,45
32,
046
3,26
874
9,73
11,
194,
574
77,1
9271
,580
60-6
486
4,80
52,
549
35,4
6219
,241
122,
618
59,8
351,
110
822
903
375,
725
210,
417
14,2
0421
,919
65-6
959
7,87
562
115
,855
12,1
8160
,985
30,0
0759
947
675
721
0,40
423
6,37
113
,487
16,1
32
70-7
441
1,49
124
75,
640
6,82
324
,576
12,2
6328
028
163
890
,327
245,
598
13,0
9111
,727
75-7
932
4,98
314
72,
528
4,77
112
,054
6,07
020
021
544
447
,545
227,
626
13,5
309,
853
80-8
420
4,70
119
11,
157
2,11
34,
760
2,59
014
713
426
616
,705
158,
521
11,4
806,
637
85-8
910
1,09
014
657
382
32,
007
1,11
168
7815
36,
473
79,0
787,
028
3,55
2
90+
48,1
2313
735
420
81,
015
566
4940
107
2,55
236
,963
4,37
21,
760

Cen
sus
Rep
ort
Vo
lum
e 4
-L –
The
Old
er P
op
ulat
ion
127
App
endi
x 1.
App
endi
x ta
bles
Sex/
Ag
e g
roup
/Are
aM
ain/
usua
l act
ivit
y d
urin
g 1
2 m
ont
hs
Tota
lE
mp
loye
e (g
over
nmen
t)E
mp
loye
e (p
riva
te o
rg.)
Em
plo
yer
Ow
n ac
coun
t w
ork
erC
ont
rib
utin
g
fam
ily w
ork
erSo
ught
w
ork
Did
no
t se
ek w
ork
Full-
tim
e st
uden
tH
ous
eho
ld
wo
rkP
ensi
one
r, re
tire
d,
old
er p
erso
nIll
, d
isab
led
Oth
er
Urb
an
Bo
th s
exes
15-5
99,
929,
558
739,
228
2,69
5,75
122
2,11
22,
005,
243
380,
739
312,
802
51,5
6278
4,66
42,
104,
115
149,
082
52,3
1843
1,94
2
60+
1,36
4,58
912
,599
67,4
3328
,674
161,
593
18,8
171,
973
2,14
22,
084
257,
605
705,
033
38,6
5367
,983
60-6
447
7,04
18,
400
39,4
5714
,329
88,8
019,
668
1,05
896
455
412
4,93
615
8,33
08,
515
22,0
29
65-6
933
3,74
72,
221
17,5
927,
514
43,6
445,
024
443
546
463
72,1
7516
0,68
77,
257
16,1
81
70-7
421
2,74
784
25,
651
3,49
516
,239
2,12
816
222
939
531
,388
135,
539
6,10
010
,579
75-7
916
5,73
246
32,
428
1,94
37,
819
1,10
712
318
631
717
,823
118,
277
6,19
89,
048
80-8
499
,573
317
1,16
890
13,
066
524
100
107
164
7,00
775
,551
4,98
95,
679
85-8
951
,127
201
682
340
1,30
724
644
7210
03,
090
38,6
363,
431
2,97
8
90+
24,6
2215
545
515
271
712
043
3891
1,18
618
,013
2,16
31,
489
Mal
e
15-5
94,
715,
944
401,
370
1,74
5,51
615
3,36
41,
180,
296
173,
061
192,
180
33,5
1937
1,63
071
,789
73,4
4034
,497
285,
282
60+
562,
081
9,60
553
,483
20,4
2310
0,59
25,
929
1,40
31,
255
675
8,00
430
8,90
314
,489
37,3
20
60-6
420
6,17
26,
443
31,4
0010
,347
54,9
762,
983
820
608
151
3,32
277
,660
4,30
113
,161
65-6
914
0,31
61,
762
14,0
925,
344
27,2
121,
578
316
351
131
2,18
874
,832
3,18
09,
330
70-7
487
,697
659
4,47
22,
493
10,3
6771
791
119
155
1,05
359
,639
2,24
85,
684
75-7
965
,960
360
1,89
41,
301
4,91
435
068
8510
781
649
,394
2,01
94,
652
80-8
436
,945
205
823
618
1,93
618
552
5055
370
28,6
101,
379
2,66
2
85-8
917
,118
110
469
221
753
8225
2736
175
13,1
1286
61,
242
90+
7,87
366
333
9943
434
3115
4080
5,65
649
658
9
Fem
ale
15-5
95,
213,
614
337,
858
950,
235
68,7
4882
4,94
720
7,67
812
0,62
218
,043
413,
034
2,03
2,32
675
,642
17,8
2114
6,66
0
60+
802,
508
2,99
413
,950
8,25
161
,001
12,8
8857
088
71,
409
249,
601
396,
130
24,1
6430
,663
60-6
427
0,86
91,
957
8,05
73,
982
33,8
256,
685
238
356
403
121,
614
80,6
704,
214
8,86
8
65-6
919
3,43
145
93,
500
2,17
016
,432
3,44
612
719
533
269
,987
85,8
554,
077
6,85
1
70-7
412
5,05
018
31,
179
1,00
25,
872
1,41
171
110
240
30,3
3575
,900
3,85
24,
895
75-7
999
,772
103
534
642
2,90
575
755
101
210
17,0
0768
,883
4,17
94,
396
80-8
462
,628
112
345
283
1,13
033
948
5710
96,
637
46,9
413,
610
3,01
7
85-8
934
,009
9121
311
955
416
419
4564
2,91
525
,524
2,56
51,
736
90+
16,7
4989
122
5328
386
1223
511,
106
12,3
571,
667
900
Tabl
e 11
(co
ntin
ued)
Pop
ulat
ion
aged
15
year
s an
d ov
er b
y m
ain/
usua
l act
ivit
y by
sex
by
age
grou
p, u
rban
and
rur
al a
reas
, 20
14 C
ensu
s

Cen
sus
Rep
ort
Vo
lum
e 4
-L –
The
Old
er P
op
ulat
ion
128
App
endi
x 1.
App
endi
x ta
bles
Sex/
Ag
e g
roup
/Are
aM
ain/
usua
l act
ivit
y d
urin
g 1
2 m
ont
hs
Tota
lE
mp
loye
e (g
over
nmen
t)E
mp
loye
e (p
riva
te o
rg.)
Em
plo
yer
Ow
n ac
coun
t w
ork
erC
ont
rib
utin
g
fam
ily w
ork
erSo
ught
w
ork
Did
no
t se
ek w
ork
Full-
tim
e st
uden
tH
ous
eho
ld
wo
rkP
ensi
one
r, re
tire
d,
old
er p
erso
nIll
, d
isab
led
Oth
er
Rur
al
Bo
th s
exes
15-5
921
,476
,365
586,
952
4,24
0,19
364
4,48
55,
859,
648
3,15
2,18
155
6,21
677
,266
951,
904
4,39
4,39
116
1,97
711
4,49
373
6,65
9
60+
3,10
9,81
98,
185
161,
858
146,
964
603,
379
136,
505
6,23
33,
313
2,90
751
5,42
51,
318,
306
91,1
9811
5,54
6
60-6
41,
099,
804
6,17
793
,909
62,7
8731
6,29
071
,104
3,35
21,
463
729
259,
722
225,
064
20,3
4438
,863
65-6
973
0,74
699
142
,281
39,0
0016
5,14
036
,546
1,58
287
265
214
4,47
325
4,14
217
,568
27,4
99
70-7
450
0,42
335
614
,774
21,7
2569
,614
15,5
3160
541
364
562
,534
279,
685
15,6
8118
,860
75-7
938
7,56
621
26,
621
14,6
6633
,792
7,76
834
031
439
932
,317
260,
789
15,2
2315
,125
80-8
423
6,00
319
62,
434
6,28
012
,154
3,39
919
115
923
610
,918
178,
863
12,0
299,
144
85-8
910
6,94
212
91,
070
1,99
44,
337
1,40
392
5914
63,
886
83,0
116,
604
4,21
1
90+
48,3
3512
476
951
22,
052
754
7133
100
1,57
536
,752
3,74
91,
844
Mal
e
15-5
910
,294
,526
353,
121
2,78
4,63
149
2,35
53,
894,
525
1,23
5,02
832
2,13
745
,727
444,
233
109,
963
66,8
9265
,950
479,
964
60+
1,35
9,25
97,
141
114,
239
109,
055
436,
365
36,9
514,
350
2,15
41,
048
15,2
9551
9,86
238
,170
74,6
29
60-6
450
5,86
85,
585
66,5
0447
,528
227,
497
17,9
542,
480
997
229
5,61
195
,317
10,3
5425
,812
65-6
932
6,30
282
929
,926
28,9
8912
0,58
79,
985
1,11
059
122
74,
056
103,
626
8,15
818
,218
70-7
421
3,98
229
210
,313
15,9
0450
,910
4,67
939
624
224
72,
542
109,
987
6,44
212
,028
75-7
916
2,35
516
84,
627
10,5
3724
,643
2,45
519
520
016
51,
779
102,
046
5,87
29,
668
80-8
493
,930
117
1,62
24,
450
8,52
41,
148
9282
7985
067
,283
4,15
95,
524
85-8
939
,861
7471
01,
290
2,88
445
643
2657
328
29,4
572,
141
2,39
5
90+
16,9
6176
537
357
1,32
027
434
1644
129
12,1
461,
044
984
Fem
ale
15-5
911
,181
,839
233,
831
1,45
5,56
215
2,13
01,
965,
123
1,91
7,15
323
4,07
931
,539
507,
671
4,28
4,42
895
,085
48,5
4325
6,69
5
60+
1,75
0,56
01,
044
47,6
1937
,909
167,
014
99,5
541,
883
1,15
91,
859
500,
130
798,
444
53,0
2840
,917
60-6
459
3,93
659
227
,405
15,2
5988
,793
53,1
5087
246
650
025
4,11
112
9,74
79,
990
13,0
51
65-6
940
4,44
416
212
,355
10,0
1144
,553
26,5
6147
228
142
514
0,41
715
0,51
69,
410
9,28
1
70-7
428
6,44
164
4,46
15,
821
18,7
0410
,852
209
171
398
59,9
9216
9,69
89,
239
6,83
2
75-7
922
5,21
144
1,99
44,
129
9,14
95,
313
145
114
234
30,5
3815
8,74
39,
351
5,45
7
80-8
414
2,07
379
812
1,83
03,
630
2,25
199
7715
710
,068
111,
580
7,87
03,
620
85-8
967
,081
5536
070
41,
453
947
4933
893,
558
53,5
544,
463
1,81
6
90+
31,3
7448
232
155
732
480
3717
561,
446
24,6
062,
705
860
Tabl
e 11
(co
ntin
ued)
Pop
ulat
ion
aged
15
year
s an
d ov
er b
y m
ain/
usua
l act
ivit
y by
sex
by
age
grou
p, u
rban
and
rur
al a
reas
, 20
14 C
ensu
s

Cen
sus
Rep
ort
Vo
lum
e 4
-L –
The
Old
er P
op
ulat
ion
129
App
endi
x 1.
App
endi
x ta
bles
Tab
le 1
2
Per
cent
age
of
po
pul
atio
n ag
ed 1
5 ye
ars
and
ove
r by
mai
n ac
tivi
ty in
the
pas
t 12
mo
nths
, by
sex
by a
ge
gro
up, u
rban
and
rur
al a
reas
, 20
14 C
ensu
sSe
x/A
ge
gro
up/
Are
a
Mai
n ac
tivi
ty in
the
pas
t 12
mo
nths
Em
plo
yee
(gov
ernm
ent)
Em
plo
yee
(pri
vate
org
.)E
mp
loye
rO
wn
acco
unt
wo
rker
Co
ntri
but
ing
fa
mily
wo
rker
Soug
ht
wo
rkD
id n
ot
seek
wo
rkFu
ll- t
ime
stud
ent
Ho
useh
old
w
ork
Pen
sio
ner,
reti
red
, o
lder
per
son
Ill, d
isab
led
Oth
erTo
tal
Uni
on
Bo
th s
exes
15-5
94.
222
.12.
825
.011
.22.
80.
45.
520
.71.
00.
53.
710
0
60+
0.5
5.1
3.9
17.1
3.5
0.2
0.1
0.1
17.3
45.2
2.9
4.1
100
60-6
40.
98.
54.
925
.75.
10.
30.
20.
124
.424
.31.
83.
910
0
65-6
90.
35.
64.
419
.63.
90.
20.
10.
120
.439
.02.
34.
110
0
70-7
40.
22.
93.
512
.02.
50.
10.
10.
113
.258
.23.
14.
110
0
75-7
90.
11.
63.
07.
51.
60.
10.
10.
19.
168
.53.
94.
410
0
80-8
40.
21.
12.
14.
51.
20.
10.
10.
15.
375
.85.
14.
410
0
85-8
90.
21.
11.
53.
61.
00.
10.
10.
24.
477
.06.
34.
510
0
90+
0.4
1.7
0.9
3.8
1.2
0.2
0.1
0.3
3.8
75.1
8.1
4.6
100
Mal
e
15-5
95.
030
.24.
333
.89.
43.
40.
55.
41.
20.
90.
75.
110
0
60+
0.9
8.7
6.7
27.9
2.2
0.3
0.2
0.1
1.2
43.1
2.7
5.8
100
60-6
41.
713
.78.
139
.72.
90.
50.
20.
11.
324
.32.
15.
510
0
65-6
90.
69.
47.
431
.72.
50.
30.
20.
11.
338
.22.
45.
910
0
70-7
40.
34.
96.
120
.31.
80.
20.
10.
11.
256
.22.
95.
910
0
75-7
90.
22.
95.
212
.91.
20.
10.
10.
11.
166
.33.
56.
310
0
80-8
40.
21.
93.
98.
01.
00.
10.
10.
10.
973
.34.
26.
310
0
85-8
90.
32.
12.
76.
40.
90.
10.
10.
20.
974
.75.
36.
410
0
90+
0.6
3.5
1.8
7.1
1.2
0.3
0.1
0.3
0.8
71.7
6.2
6.3
100
Fem
ale
15-5
93.
514
.71.
317
.013
.02.
20.
35.
638
.51.
00.
42.
510
0
60+
0.2
2.4
1.8
8.9
4.4
0.1
0.1
0.1
29.4
46.8
3.0
2.8
100
60-6
40.
34.
12.
214
.26.
90.
10.
10.
143
.424
.31.
62.
510
0
65-6
90.
12.
72.
010
.25.
00.
10.
10.
135
.239
.52.
32.
710
0
70-7
40.
11.
41.
76.
03.
00.
10.
10.
222
.059
.73.
22.
810
0
75-7
90.
00.
81.
53.
71.
90.
10.
10.
114
.670
.04.
23.
010
0
80-8
40.
10.
61.
02.
31.
30.
10.
10.
18.
277
.45.
63.
210
0
85-8
90.
10.
60.
82.
01.
10.
10.
10.
26.
478
.27.
03.
510
0
90+
0.3
0.7
0.4
2.1
1.2
0.1
0.1
0.2
5.3
76.8
9.1
3.7
100

Cen
sus
Rep
ort
Vo
lum
e 4
-L –
The
Old
er P
op
ulat
ion
130
App
endi
x 1.
App
endi
x ta
bles
Sex/
Ag
e g
roup
/A
rea
Mai
n ac
tivi
ty in
the
pas
t 12
mo
nths
Em
plo
yee
(gov
ernm
ent)
Em
plo
yee
(pri
vate
org
.)E
mp
loye
rO
wn
acco
unt
wo
rker
Co
ntri
but
ing
fa
mily
wo
rker
Soug
ht
wo
rkD
id n
ot
seek
wo
rkFu
ll- t
ime
stud
ent
Ho
useh
old
w
ork
Pen
sio
ner,
reti
red
, o
lder
per
son
Ill, d
isab
led
Oth
erTo
tal
Urb
an
Bo
th s
exes
15-5
97.
427
.12.
220
.23.
83.
20.
57.
921
.21.
50.
54.
410
0
60+
0.9
4.9
2.1
11.8
1.4
0.1
0.2
0.2
18.9
51.7
2.8
5.0
100
60-6
41.
88.
33.
018
.62.
00.
20.
20.
126
.233
.21.
84.
610
0
65-6
90.
75.
32.
313
.11.
50.
10.
20.
121
.648
.12.
24.
810
0
70-7
40.
42.
71.
67.
61.
00.
10.
10.
214
.863
.72.
95.
010
0
75-7
90.
31.
51.
24.
70.
70.
10.
10.
210
.871
.43.
75.
510
0
80-8
40.
31.
20.
93.
10.
50.
10.
10.
27.
075
.95.
05.
710
0
85-8
90.
41.
30.
72.
60.
50.
10.
10.
26.
075
.66.
75.
810
0
90+
0.6
1.8
0.6
2.9
0.5
0.2
0.2
0.4
4.8
73.2
8.8
6.0
100
Mal
e
15-5
98.
537
.03.
325
.03.
74.
10.
77.
91.
51.
60.
76.
010
0
60+
1.7
9.5
3.6
17.9
1.1
0.2
0.2
0.1
1.4
55.0
2.6
6.6
100
60-6
43.
115
.25.
026
.71.
40.
40.
30.
11.
637
.72.
16.
410
0
65-6
91.
310
.03.
819
.41.
10.
20.
30.
11.
653
.32.
36.
610
0
70-7
40.
85.
12.
811
.80.
80.
10.
10.
21.
268
.02.
66.
510
0
75-7
90.
52.
92.
07.
40.
50.
10.
10.
21.
274
.93.
17.
110
0
80-8
40.
62.
21.
75.
20.
50.
10.
10.
11.
077
.43.
77.
210
0
85-8
90.
62.
71.
34.
40.
50.
10.
20.
21.
076
.65.
17.
310
0
90+
0.8
4.2
1.3
5.5
0.4
0.4
0.2
0.5
1.0
71.8
6.3
7.5
100
Fem
ale
15-5
96.
518
.21.
315
.84.
02.
30.
37.
939
.01.
50.
32.
810
0
60+
0.4
1.7
1.0
7.6
1.6
0.1
0.1
0.2
31.1
49.4
3.0
3.8
100
60-6
40.
73.
01.
512
.52.
50.
10.
10.
144
.929
.81.
63.
310
0
65-6
90.
21.
81.
18.
51.
80.
10.
10.
236
.244
.42.
13.
510
0
70-7
40.
10.
90.
84.
71.
10.
10.
10.
224
.360
.73.
13.
910
0
75-7
90.
10.
50.
62.
90.
80.
10.
10.
217
.069
.04.
24.
410
0
80-8
40.
20.
60.
51.
80.
50.
10.
10.
210
.675
.05.
84.
810
0
85-8
90.
30.
60.
31.
60.
50.
10.
10.
28.
675
.17.
55.
110
0
90+
0.5
0.7
0.3
1.7
0.5
0.1
0.1
0.3
6.6
73.8
10.0
5.4
100
Tabl
e 12
(co
ntin
ued)
Per
cent
age
of p
opul
atio
n ag
ed 1
5 ye
ars
and
over
by
mai
n ac
tivi
ty in
the
pas
t 12
mon
ths,
by
sex
by a
ge g
roup
, urb
an a
nd r
ural
are
as, 2
014
Cen
sus

Cen
sus
Rep
ort
Vo
lum
e 4
-L –
The
Old
er P
op
ulat
ion
131
App
endi
x 1.
App
endi
x ta
bles
Sex/
Ag
e g
roup
/A
rea
Mai
n ac
tivi
ty in
the
pas
t 12
mo
nths
Em
plo
yee
(gov
ernm
ent)
Em
plo
yee
(pri
vate
org
.)E
mp
loye
rO
wn
acco
unt
wo
rker
Co
ntri
but
ing
fa
mily
wo
rker
Soug
ht
wo
rkD
id n
ot
seek
wo
rkFu
ll- t
ime
stud
ent
Ho
useh
old
w
ork
Pen
sio
ner,
reti
red
, o
lder
per
son
Ill, d
isab
led
Oth
erTo
tal
Rur
al
Bo
th s
exes
15-5
92.
719
.73.
027
.314
.72.
60.
44.
420
.50.
80.
53.
410
0
60+
0.3
5.2
4.7
19.4
4.4
0.2
0.1
0.1
16.6
42.4
2.9
3.7
100
60-6
40.
68.
55.
728
.86.
50.
30.
10.
123
.620
.51.
83.
510
0
65-6
90.
15.
85.
322
.65.
00.
20.
10.
119
.834
.82.
43.
810
0
70-7
40.
13.
04.
313
.93.
10.
10.
10.
112
.555
.93.
13.
810
0
75-7
90.
11.
73.
88.
72.
00.
10.
10.
18.
367
.33.
93.
910
0
80-8
40.
11.
02.
75.
11.
40.
10.
10.
14.
675
.85.
13.
910
0
85-8
90.
11.
01.
94.
11.
30.
10.
10.
13.
677
.66.
23.
910
0
90+
0.3
1.6
1.1
4.2
1.6
0.1
0.1
0.2
3.3
76.0
7.8
3.8
100
Mal
e
15-5
93.
427
.04.
837
.812
.03.
10.
44.
31.
10.
60.
64.
710
0
60+
0.5
8.4
8.0
32.1
2.7
0.3
0.2
0.1
1.1
38.2
2.8
5.5
100
60-6
41.
113
.19.
445
.03.
50.
50.
20.
01.
118
.82.
05.
110
0
65-6
90.
39.
28.
937
.03.
10.
30.
20.
11.
231
.82.
55.
610
0
70-7
40.
14.
87.
423
.82.
20.
20.
10.
11.
251
.43.
05.
610
0
75-7
90.
12.
86.
515
.21.
50.
10.
10.
11.
162
.93.
66.
010
0
80-8
40.
11.
74.
79.
11.
20.
10.
10.
10.
971
.64.
45.
910
0
85-8
90.
21.
83.
27.
21.
10.
10.
10.
10.
873
.95.
46.
010
0
90+
0.4
3.2
2.1
7.8
1.6
0.2
0.1
0.3
0.8
71.6
6.2
5.8
100
Fem
ale
15-5
92.
113
.01.
417
.617
.12.
10.
34.
538
.30.
90.
42.
310
0
60+
0.1
2.7
2.2
9.5
5.7
0.1
0.1
0.1
28.6
45.6
3.0
2.3
100
60-6
40.
14.
62.
614
.98.
90.
10.
10.
142
.821
.81.
72.
210
0
65-6
90.
03.
12.
511
.06.
60.
10.
10.
134
.737
.22.
32.
310
0
70-7
40.
01.
62.
06.
53.
80.
10.
10.
120
.959
.23.
22.
410
0
75-7
90.
00.
91.
84.
12.
40.
10.
10.
113
.670
.54.
22.
410
0
80-8
40.
10.
61.
32.
61.
60.
10.
10.
17.
178
.55.
52.
510
0
85-8
90.
10.
51.
02.
21.
40.
10.
00.
15.
379
.86.
72.
710
0
90+
0.2
0.7
0.5
2.3
1.5
0.1
0.1
0.2
4.6
78.4
8.6
2.7
100
Tabl
e 12
(co
ntin
ued)
Per
cent
age
of p
opul
atio
n ag
ed 1
5 ye
ars
and
over
by
mai
n ac
tivi
ty in
the
pas
t 12
mon
ths,
by
sex
by a
ge g
roup
, urb
an a
nd r
ural
are
as, 2
014
Cen
sus

Census Report Volume 4-L – The Older Population132
Appendix 1. Appendix tables
Table 13 Distribution of prime working age and older population by industry group by sex, 2014 and 1983 censuses
Industry group/Census year 15-59 year olds 60 and over
Both sexes Male Female Both sexes Male Female
2014
Total 19,228,355 11,482,321 7,746,034 1,317,252 872,401 444,851
Agriculture, forestry and fishing 9,853,382 6,224,773 3,628,609 873,427 620,648 252,779
Mining and quarrying 162,170 133,660 28,510 2,711 2,271 440
Manufacturing 1,339,591 566,619 772,972 55,723 34,763 20,960
Electricity, gas, steam and air conditioning supply 42,874 38,613 4,261 1,562 1,510 52
Water supply; sewerage, waste management and remediation activities
24,875 20,437 4,438 995 871 124
Construction 910,687 817,757 92,930 29,544 28,522 1,022
Wholesale and retail trade; repair of motor vehicles and motorcycles
1,811,043 840,353 970,690 112,357 52,811 59,546
Transportation and storage 787,073 762,109 24,964 23,552 22,749 803
Accommodation and food service activities 907,187 369,263 537,924 55,533 22,137 33,396
Information and communication 45,958 28,346 17,612 1,755 1,428 327
Financial and insurance activities 41,724 16,726 24,998 1,135 797 338
Real estate activities 10,028 6,469 3,559 772 546 226
Professional, scientific and technical activities 27,191 17,961 9,230 2,281 1,990 291
Administrative and support service activities 235,831 139,244 96,587 12,307 10,756 1,551
Public administration and defence; compulsory social security
604,683 429,323 175,360 11,874 10,018 1,856
Education 385,981 72,194 313,787 4,111 2,001 2,110
Human health and social work activities 104,767 38,461 66,306 8,199 6,231 1,968
Arts, entertainment and recreation 53,694 38,743 14,951 4,077 3,657 420
Other service activities 439,791 271,503 168,288 24,160 17,201 6,959
Activities of households as employers; undifferentiated goods and services
265,335 146,454 118,881 13,019 7,747 5,272
Activities of extraterritorial organizations and bodies 2,766 1,404 1,362 93 68 25
Not stated 1,171,724 501,909 669,815 78,065 23,679 54,386
1983
Total 10,600,307 6,823,878 3,776,429 954,016 619,258 334,758
Agriculture, forestry, fishing and hunting 6,688,422 4,396,085 2,292,337 705,962 480,763 225,199
Mining and quarrying 66,717 51,326 15,391 1,600 1,147 453
Manufacturing 1,007,691 518,182 489,509 54,558 33,130 21,428
Construction 147,118 134,454 12,664 8,298 8,214 84
Electricity, gas, water and sanitary services 20,430 18,783 1,647 384 363 21
Wholesale and retail trade, restaurants and hotels 1,216,043 540,599 675,444 128,967 55,726 73,241
Transport, storage and communication 334,409 325,391 9,018 9,748 9,228 520
Services 784,749 608,697 176,052 17,792 14,635 3,157
Not classified 334,728 230,361 104,367 26,707 16,052 10,655

Census Report Volume 4-L – The Older Population 133
Appendix 1. Appendix tables
Table 14 Number of households by presence of older members, selected housing/household conditions, urban and rural areas, 2014 Census
Household/housing conditions Households with someone aged 60 and over
Households with no one aged 60 and over
Union Urban Rural Union Urban Rural
Type of ownership
Total 3,288,183 985,909 2,302,274 7,589,649 2,063,524 5,526,125
Owner 3,035,780 802,984 2,232,796 6,267,060 1,210,068 5,056,992
Renter 131,904 108,880 23,024 673,587 510,184 163,403
Provided free (individually) 45,968 24,520 21,448 226,589 108,505 118,084
Government quarters 53,659 37,394 16,265 300,496 176,481 124,015
Private company quarters 10,106 4,965 5,141 67,128 25,925 41,203
Other 10,766 7,166 3,600 54,789 32,361 22,428
Lighting
Total 3,288,183 985,909 2,302,274 7,589,649 2,063,524 5,526,125
Electricity 1,178,368 808,488 369,880 2,349,349 1,554,915 794,434
Kerosene 237,488 4,536 232,952 639,090 11,250 627,840
Candle 607,029 54,619 552,410 1,644,907 163,478 1,481,429
Battery 513,146 43,643 469,503 1,330,610 147,886 1,182,724
Generator (private) 331,858 50,849 281,009 681,291 126,460 554,831
Water mill (private) 54,980 7,970 47,010 122,527 17,816 104,711
Solar system/Energy 293,990 12,291 281,699 651,252 30,520 620,732
Other 71,324 3,513 67,811 170,623 11,199 159,424
Cooking fuel
Total 3,288,183 985,909 2,302,274 7,589,649 2,063,524 5,526,125
Electricity 566,449 443,093 123,356 1,213,886 898,243 315,643
LPG 19,080 17,718 1,362 29,812 25,605 4,207
Kerosene 5,844 244 5,600 15,354 677 14,677
Biogas 9,662 7,331 2,331 23,301 15,315 7,986
Firewood 2,284,167 253,394 2,030,773 5,248,494 528,653 4,719,841
Charcoal 357,933 250,186 107,747 924,185 557,555 366,630
Coal 9,168 6,227 2,941 22,499 12,929 9,570
Straw/Grass 1,344 314 1,030 3,703 787 2,916
Other 34,536 7,402 27,134 108,415 23,760 84,655
Drinking water
Total 3,288,183 985,909 2,302,274 7,589,649 2,063,524 5,526,125
Tap water/Piped 305,704 169,075 136,629 668,894 319,084 349,810
Tube well/Borehole 1,081,938 277,844 804,094 2,337,552 573,575 1,763,977
Protected well/Spring 676,976 123,314 553,662 1,377,552 227,683 1,149,869
Unprotected well/Spring 153,598 16,418 137,180 426,954 39,224 387,730
Pool/Pond/Lake 369,204 53,669 315,535 966,156 128,553 837,603
River/Stream/Canal 218,477 17,335 201,142 596,434 38,438 557,996
Waterfall/Rain water 93,455 9,890 83,565 246,523 15,419 231,104
Bottled water/Water from vending machine
324,664 294,292 30,372 784,342 660,511 123,831
Tanker/Truck 13,984 10,643 3,341 36,779 25,617 11,162
Other 50,183 13,429 36,754 148,463 35,420 113,043

Census Report Volume 4-L – The Older Population134
Appendix 1. Appendix tables
Household/housing conditions Households with someone aged 60 and over
Households with no one aged 60 and over
Union Urban Rural Union Urban Rural
Toilet
Total 3,288,183 985,909 2,302,274 7,589,649 2,063,524 5,526,125
Flush 84,912 63,614 21,298 144,063 95,159 48,904
Water seal (Improved pit latrine) 2,511,734 864,573 1,647,161 5,343,403 1,791,689 3,551,714
Pit (Traditional pit latrine) 244,115 33,504 210,611 611,330 83,468 527,862
Bucket (Surface latrine) 68,136 7,229 60,907 223,046 23,688 199,358
Other 19,534 1,807 17,727 64,346 6,591 57,755
None 359,752 15,182 344,570 1,203,461 62,929 1,140,532
Roof
Total 3,288,183 985,909 2,302,274 7,589,649 2,063,524 5,526,125
Dhani/Theke/In leaf 862,900 86,646 776,254 2,711,080 267,268 2,443,812
Bamboo 67,563 16,574 50,989 174,430 46,931 127,499
Wood 4,801 1,810 2,991 10,125 3,597 6,528
Corrugated sheet 2,246,474 828,613 1,417,861 4,438,134 1,645,610 2,792,524
Tile/Brick/Concrete 78,376 49,994 28,382 158,869 90,524 68,345
Other 28,069 2,272 25,797 97,011 9,594 87,417
Housing type
Total 3,288,183 985,909 2,302,274 7,589,649 2,063,524 5,526,125
Condominium/Apartment/Flat 117,192 105,363 11,829 371,293 271,511 99,782
Bungalow/Brick house 282,007 164,544 117,463 456,216 241,085 215,131
Semi-pacca house 286,496 136,781 149,715 424,579 198,552 226,027
Wooden house 1,553,304 385,717 1,167,587 2,929,080 755,748 2,173,332
Bamboo 976,607 179,825 796,782 3,088,249 540,341 2,547,908
Hut 2 - 3 years 39,404 5,017 34,387 167,369 20,661 146,708
Hut 1 year 14,704 2,326 12,378 81,635 12,750 68,885
Other 18,469 6,336 12,133 71,228 22,876 48,352
Radio and television
Total 3,288,183 985,909 2,302,274 7,589,649 2,063,524 5,526,125
Has no radio and no TV 916,513 131,054 785,459 2,752,232 452,649 2,299,583
Has radio but no TV 623,092 52,044 571,048 1,203,005 102,571 1,100,434
Has no radio but has TV 957,447 514,971 442,476 2,385,459 1,120,617 1,264,842
Has both radio and TV 791,131 287,840 503,291 1,248,953 387,687 861,266
Telephone
Total 3,288,183 985,909 2,302,274 7,589,649 2,063,524 5,526,125
Has no landline or mobile 2,057,306 303,787 1,753,519 5,102,739 782,793 4,319,946
Has landline but no mobile 55,354 13,634 41,720 80,682 11,828 68,854
Has no landline but has mobile 1,002,771 541,594 461,177 2,190,503 1,135,592 1,054,911
Has both landline and mobile 172,752 126,894 45,858 215,725 133,311 82,414
Table 14 (continued) Number of households by presence of older members, selected housing/household conditions, urban and rural areas, 2014 Census
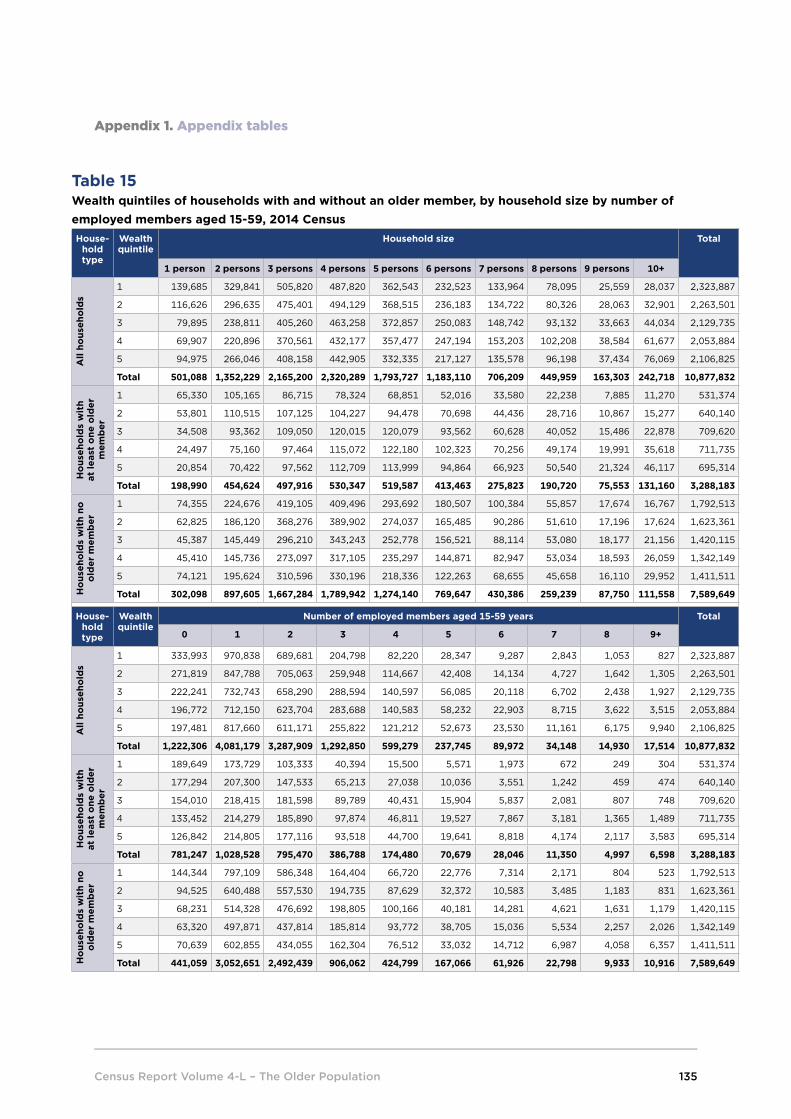
Census Report Volume 4-L – The Older Population 135
Appendix 1. Appendix tables
Table 15 Wealth quintiles of households with and without an older member, by household size by number of employed members aged 15-59, 2014 CensusHouse-
hold type
Wealth quintile
Household size Total
1 person 2 persons 3 persons 4 persons 5 persons 6 persons 7 persons 8 persons 9 persons 10+
All
hous
eho
lds
1 139,685 329,841 505,820 487,820 362,543 232,523 133,964 78,095 25,559 28,037 2,323,887
2 116,626 296,635 475,401 494,129 368,515 236,183 134,722 80,326 28,063 32,901 2,263,501
3 79,895 238,811 405,260 463,258 372,857 250,083 148,742 93,132 33,663 44,034 2,129,735
4 69,907 220,896 370,561 432,177 357,477 247,194 153,203 102,208 38,584 61,677 2,053,884
5 94,975 266,046 408,158 442,905 332,335 217,127 135,578 96,198 37,434 76,069 2,106,825
Total 501,088 1,352,229 2,165,200 2,320,289 1,793,727 1,183,110 706,209 449,959 163,303 242,718 10,877,832
Ho
useh
old
s w
ith
at le
ast
one
old
er
mem
ber
1 65,330 105,165 86,715 78,324 68,851 52,016 33,580 22,238 7,885 11,270 531,374
2 53,801 110,515 107,125 104,227 94,478 70,698 44,436 28,716 10,867 15,277 640,140
3 34,508 93,362 109,050 120,015 120,079 93,562 60,628 40,052 15,486 22,878 709,620
4 24,497 75,160 97,464 115,072 122,180 102,323 70,256 49,174 19,991 35,618 711,735
5 20,854 70,422 97,562 112,709 113,999 94,864 66,923 50,540 21,324 46,117 695,314
Total 198,990 454,624 497,916 530,347 519,587 413,463 275,823 190,720 75,553 131,160 3,288,183
Ho
useh
old
s w
ith
no
old
er m
emb
er
1 74,355 224,676 419,105 409,496 293,692 180,507 100,384 55,857 17,674 16,767 1,792,513
2 62,825 186,120 368,276 389,902 274,037 165,485 90,286 51,610 17,196 17,624 1,623,361
3 45,387 145,449 296,210 343,243 252,778 156,521 88,114 53,080 18,177 21,156 1,420,115
4 45,410 145,736 273,097 317,105 235,297 144,871 82,947 53,034 18,593 26,059 1,342,149
5 74,121 195,624 310,596 330,196 218,336 122,263 68,655 45,658 16,110 29,952 1,411,511
Total 302,098 897,605 1,667,284 1,789,942 1,274,140 769,647 430,386 259,239 87,750 111,558 7,589,649
House-hold type
Wealth quintile
Number of employed members aged 15-59 years Total
0 1 2 3 4 5 6 7 8 9+
All
hous
eho
lds
1 333,993 970,838 689,681 204,798 82,220 28,347 9,287 2,843 1,053 827 2,323,887
2 271,819 847,788 705,063 259,948 114,667 42,408 14,134 4,727 1,642 1,305 2,263,501
3 222,241 732,743 658,290 288,594 140,597 56,085 20,118 6,702 2,438 1,927 2,129,735
4 196,772 712,150 623,704 283,688 140,583 58,232 22,903 8,715 3,622 3,515 2,053,884
5 197,481 817,660 611,171 255,822 121,212 52,673 23,530 11,161 6,175 9,940 2,106,825
Total 1,222,306 4,081,179 3,287,909 1,292,850 599,279 237,745 89,972 34,148 14,930 17,514 10,877,832
Ho
useh
old
s w
ith
at le
ast
one
old
er
mem
ber
1 189,649 173,729 103,333 40,394 15,500 5,571 1,973 672 249 304 531,374
2 177,294 207,300 147,533 65,213 27,038 10,036 3,551 1,242 459 474 640,140
3 154,010 218,415 181,598 89,789 40,431 15,904 5,837 2,081 807 748 709,620
4 133,452 214,279 185,890 97,874 46,811 19,527 7,867 3,181 1,365 1,489 711,735
5 126,842 214,805 177,116 93,518 44,700 19,641 8,818 4,174 2,117 3,583 695,314
Total 781,247 1,028,528 795,470 386,788 174,480 70,679 28,046 11,350 4,997 6,598 3,288,183
Ho
useh
old
s w
ith
no
old
er m
emb
er
1 144,344 797,109 586,348 164,404 66,720 22,776 7,314 2,171 804 523 1,792,513
2 94,525 640,488 557,530 194,735 87,629 32,372 10,583 3,485 1,183 831 1,623,361
3 68,231 514,328 476,692 198,805 100,166 40,181 14,281 4,621 1,631 1,179 1,420,115
4 63,320 497,871 437,814 185,814 93,772 38,705 15,036 5,534 2,257 2,026 1,342,149
5 70,639 602,855 434,055 162,304 76,512 33,032 14,712 6,987 4,058 6,357 1,411,511
Total 441,059 3,052,651 2,492,439 906,062 424,799 167,066 61,926 22,798 9,933 10,916 7,589,649

Census Report Volume 4-L – The Older Population136
Appendix 1. Appendix tables
Table 16 Number and percentage of persons 15 years old and over by degree of disability by age group by sex, urban and rural areas, 2014 Census
Sex/Age Group/
Area
Number Percentage
Total No disability Mild disability
Moderate disability
Severe disability
No disability
Mild disability
Moderate or severe
Total
Union
Both sexes
15-59 31,405,923 30,335,006 851,366 132,900 86,651 96.6 2.7 0.7 100
60+ 4,474,408 3,431,238 781,587 167,741 93,842 76.7 17.5 5.8 100
60-64 1,576,845 1,346,967 188,831 27,784 13,263 85.4 12.0 2.6 100
65-69 1,064,493 862,541 161,378 27,220 13,354 81.0 15.2 3.8 100
70-74 713,170 525,808 143,462 29,085 14,815 73.7 20.1 6.2 100
75-79 553,298 374,202 131,506 30,938 16,652 67.6 23.8 8.6 100
80-84 335,576 199,921 92,012 27,300 16,343 59.6 27.4 13.0 100
85-89 158,069 86,830 44,410 15,712 11,117 54.9 28.1 17.0 100
90+ 72,957 34,969 19,988 9,702 8,298 47.9 27.4 24.7 100
Male
15-59 15,010,470 14,489,324 402,857 71,106 47,183 96.5 2.7 0.8 100
60+ 1,921,340 1,491,270 326,062 68,382 35,626 77.6 17.0 5.4 100
60-64 712,040 608,025 84,498 13,089 6,428 85.4 11.9 2.7 100
65-69 466,618 379,758 68,871 12,081 5,908 81.4 14.8 3.9 100
70-74 301,679 224,025 59,719 12,031 5,904 74.3 19.8 5.9 100
75-79 228,315 155,885 53,710 12,487 6,233 68.3 23.5 8.2 100
80-84 130,875 79,062 36,067 10,186 5,560 60.4 27.6 12.0 100
85-89 56,979 31,962 16,207 5,430 3,380 56.1 28.4 15.5 100
90+ 24,834 12,553 6,990 3,078 2,213 50.5 28.1 21.3 100
Female
15-59 16,395,453 15,845,682 448,509 61,794 39,468 96.6 2.7 0.6 100
60+ 2,553,068 1,939,968 455,525 99,359 58,216 76.0 17.8 6.2 100
60-64 864,805 738,942 104,333 14,695 6,835 85.4 12.1 2.5 100
65-69 597,875 482,783 92,507 15,139 7,446 80.7 15.5 3.8 100
70-74 411,491 301,783 83,743 17,054 8,911 73.3 20.4 6.3 100
75-79 324,983 218,317 77,796 18,451 10,419 67.2 23.9 8.9 100
80-84 204,701 120,859 55,945 17,114 10,783 59.0 27.3 13.6 100
85-89 101,090 54,868 28,203 10,282 7,737 54.3 27.9 17.8 100
90+ 48,123 22,416 12,998 6,624 6,085 46.6 27.0 26.4 100

Census Report Volume 4-L – The Older Population 137
Appendix 1. Appendix tables
Sex/Age Group/
Area
Number Percentage
Total No disability Mild disability
Moderate disability
Severe disability
No disability
Mild disability
Moderate or severe
Total
Urban
Both sexes
15-59 9,929,558 9,682,396 195,109 29,679 22,374 97.5 2.0 0.5 100
60+ 1,364,589 1,114,282 190,332 36,984 22,991 81.7 13.9 4.4 100
60-64 477,041 425,140 42,827 5,849 3,225 89.1 9.0 1.9 100
65-69 333,747 285,724 38,643 6,017 3,363 85.6 11.6 2.8 100
70-74 212,747 170,385 33,159 5,874 3,329 80.1 15.6 4.3 100
75-79 165,732 123,113 32,030 6,624 3,965 74.3 19.3 6.4 100
80-84 99,573 66,184 23,813 5,861 3,715 66.5 23.9 9.6 100
85-89 51,127 31,039 13,165 3,948 2,975 60.7 25.7 13.5 100
90+ 24,622 12,697 6,695 2,811 2,419 51.6 27.2 21.2 100
Male
15-59 4,715,944 4,594,645 91,939 16,735 12,625 97.4 1.9 0.6 100
60+ 562,081 464,913 74,471 14,267 8,430 82.7 13.2 4.0 100
60-64 206,172 183,519 18,294 2,772 1,587 89.0 8.9 2.1 100
65-69 140,316 120,653 15,557 2,597 1,509 86.0 11.1 2.9 100
70-74 87,697 70,920 13,081 2,348 1,348 80.9 14.9 4.2 100
75-79 65,960 49,664 12,307 2,571 1,418 75.3 18.7 6.0 100
80-84 36,945 25,150 8,687 1,958 1,150 68.1 23.5 8.4 100
85-89 17,118 10,718 4,352 1,211 837 62.6 25.4 12.0 100
90+ 7,873 4,289 2,193 810 581 54.5 27.9 17.7 100
Female
15-59 5,213,614 5,087,751 103,170 12,944 9,749 97.6 2.0 0.4 100
60+ 802,508 649,369 115,861 22,717 14,561 80.9 14.4 4.6 100
60-64 270,869 241,621 24,533 3,077 1,638 89.2 9.1 1.7 100
65-69 193,431 165,071 23,086 3,420 1,854 85.3 11.9 2.7 100
70-74 125,050 99,465 20,078 3,526 1,981 79.5 16.1 4.4 100
75-79 99,772 73,449 19,723 4,053 2,547 73.6 19.8 6.6 100
80-84 62,628 41,034 15,126 3,903 2,565 65.5 24.2 10.3 100
85-89 34,009 20,321 8,813 2,737 2,138 59.8 25.9 14.3 100
90+ 16,749 8,408 4,502 2,001 1,838 50.2 26.9 22.9 100
Table 16 (continued) Number and percentage of persons 15 years old and over by degree of disability by age group by sex, urban and rural areas, 2014 Census

Census Report Volume 4-L – The Older Population138
Appendix 1. Appendix tables
Sex/Age Group/
Area
Number Percentage
Total No disability Mild disability
Moderate disability
Severe disability
No disability
Mild disability
Moderate or severe
Total
Rural
Both sexes
15-59 21,476,365 20,652,610 656,257 103,221 64,277 96.2 3.1 0.8 100
60+ 3,109,819 2,316,956 591,255 130,757 70,851 74.5 19.0 6.5 100
60-64 1,099,804 921,827 146,004 21,935 10,038 83.8 13.3 2.9 100
65-69 730,746 576,817 122,735 21,203 9,991 78.9 16.8 4.3 100
70-74 500,423 355,423 110,303 23,211 11,486 71.0 22.0 6.9 100
75-79 387,566 251,089 99,476 24,314 12,687 64.8 25.7 9.5 100
80-84 236,003 133,737 68,199 21,439 12,628 56.7 28.9 14.4 100
85-89 106,942 55,791 31,245 11,764 8,142 52.2 29.2 18.6 100
90+ 48,335 22,272 13,293 6,891 5,879 46.1 27.5 26.4 100
Male
15-59 10,294,526 9,894,679 310,918 54,371 34,558 96.1 3.0 0.9 100
60+ 1,359,259 1,026,357 251,591 54,115 27,196 75.5 18.5 6.0 100
60-64 505,868 424,506 66,204 10,317 4,841 83.9 13.1 3.0 100
65-69 326,302 259,105 53,314 9,484 4,399 79.4 16.3 4.3 100
70-74 213,982 153,105 46,638 9,683 4,556 71.6 21.8 6.7 100
75-79 162,355 106,221 41,403 9,916 4,815 65.4 25.5 9.1 100
80-84 93,930 53,912 27,380 8,228 4,410 57.4 29.1 13.5 100
85-89 39,861 21,244 11,855 4,219 2,543 53.3 29.7 17.0 100
90+ 16,961 8,264 4,797 2,268 1,632 48.7 28.3 23.0 100
Female
15-59 11,181,839 10,757,931 345,339 48,850 29,719 96.2 3.1 0.7 100
60+ 1,750,560 1,290,599 339,664 76,642 43,655 73.7 19.4 6.9 100
60-64 593,936 497,321 79,800 11,618 5,197 83.7 13.4 2.8 100
65-69 404,444 317,712 69,421 11,719 5,592 78.6 17.2 4.3 100
70-74 286,441 202,318 63,665 13,528 6,930 70.6 22.2 7.1 100
75-79 225,211 144,868 58,073 14,398 7,872 64.3 25.8 9.9 100
80-84 142,073 79,825 40,819 13,211 8,218 56.2 28.7 15.1 100
85-89 67,081 34,547 19,390 7,545 5,599 51.5 28.9 19.6 100
90+ 31,374 14,008 8,496 4,623 4,247 44.6 27.1 28.3 100
Table 16 (continued) Number and percentage of persons 15 years old and over by degree of disability by age group by sex, urban and rural areas, 2014 Census

Census Report Volume 4-L – The Older Population 139
Appendix 1. Appendix tables
Table 17 Calculation of disability-free life expectancy for older population
Age/Degree of disability
Age group
nlx nLx Life expectancy
ndisx Person years lived without a disability
Total years lived without a disability
from age x
Disability- free life
expectancy
% of remaining life disability-
free
Moderate or severe disability (a lot of difficulty or cannot do)
60 60-64 73,198 349,056 16.31 0.026031 339969.7 1123603 15.35 94.1
65 65-69 65,949 304,970 12.81 0.038116 293345.8 783633.5 11.88 92.8
70 70-74 55,435 243,061 9.74 0.061556 228099.1 490287.7 8.84 90.8
75 75-79 41,243 165,795 7.2 0.086012 151534.7 262188.6 6.36 88.3
80 80+ 24,987 131,129 5.25 0.156145 110653.9 110653.9 4.43 84.4
Mild disability or higher (some difficulty)
60 60-64 73,198 349,056 16.31 0.145784 298169.4 911071.2 12.45 76.3
65 65-69 65,949 304,970 12.81 0.189717 247112.1 612901.8 9.29 72.5
70 70-74 55,435 243,061 9.74 0.262717 179204.7 365789.7 6.60 67.7
75 75-79 41,243 165,795 7.2 0.323688 112129.1 186585 4.52 62.8
80 80+ 24,987 131,129 5.25 0.432194 74455.83 74455.83 2.98 56.8
Mild disability or higher (doubled)
60 60-64 73,198 349,056 16.31 0.291567 247282.8 628131.4 8.58 52.6
65 65-69 65,949 304,970 12.81 0.379433 189254.3 380848.6 5.77 45.1
70 70-74 55,435 243,061 9.74 0.525434 115348.4 191594.3 3.46 35.5
75 75-79 41,243 165,795 7.2 0.647376 58463.25 76245.91 1.85 25.7
80 80+ 24,987 131,129 5.25 0.864388 17782.66 17782.66 0.71 13.6
Source: nlx, nLx and life expectancy are from the adjusted abridged life table for the Union and both sexes in
Department of Population 2016c.
ndisx are disability rates derived from the 2014 Census (Appendix Table 16 of this report)
Persons years lived without a disability = (1 - ndisx ) x nLx
Total years lived without a disability from age x = Sum of persons years lived without a disability
Disability-free life expectancy = Total years lived without a disability from age x / nlx% of remaining life disability-free = Disability-free life expectancy / life expectancy x 100

Census Report Volume 4-L – The Older Population140
Appendix 1. Appendix tables
Table 18 Population by functional age groups, urban and rural areas, State/Region, 2014 Census
State/Region/Area Total 0-14 15-59 60+ 80+
Union 50,279,900 14,399,569 31,405,923 4,474,408 566,602
Kachin 1,642,841 492,879 1,047,350 102,612 12,852
Kayah 286,627 99,003 170,445 17,179 2,057
Kayin 1,504,326 538,596 843,413 122,317 13,859
Chin 478,801 191,290 251,715 35,796 4,262
Sagaing 5,325,347 1,525,943 3,304,264 495,140 64,084
Tanintharyi 1,408,401 478,027 821,323 109,051 15,893
Bago 4,867,373 1,383,846 3,010,680 472,847 62,424
Magway 3,917,055 1,056,659 2,435,898 424,498 52,085
Mandalay 6,165,723 1,599,216 3,986,148 580,359 71,809
Mon 2,054,393 641,960 1,208,952 203,481 27,215
Rakhine 2,098,807 653,333 1,238,959 206,515 28,602
Yangon 7,360,703 1,725,413 4,989,961 645,329 78,290
Shan 5,824,432 1,865,293 3,553,508 405,631 48,000
Ayeyawady 6,184,829 1,821,154 3,793,769 569,906 74,319
Nay Pyi Taw 1,160,242 326,957 749,538 83,747 10,851
Urban 14,877,943 3,583,796 9,929,558 1,364,589 175,322
Kachin 592,368 167,648 384,313 40,407 5,231
Kayah 72,418 20,365 46,697 5,356 696
Kayin 329,166 98,720 207,583 22,863 2,509
Chin 99,809 32,853 58,570 8,386 1,014
Sagaing 911,335 234,435 592,322 84,578 11,103
Tanintharyi 338,419 96,297 212,716 29,406 4,339
Bago 1,072,336 268,131 686,164 118,041 15,778
Magway 588,031 139,917 382,851 65,263 8,466
Mandalay 2,143,436 494,906 1,465,471 183,059 22,403
Mon 572,189 152,917 358,464 60,808 8,522
Rakhine 354,288 93,279 225,732 35,277 5,360
Yangon 5,160,512 1,107,103 3,571,193 482,216 60,056
Shan 1,395,847 378,172 909,471 108,204 13,198
Ayeyawady 872,600 209,317 566,438 96,845 13,753
Nay Pyi Taw 375,189 89,736 261,573 23,880 2,894
Rural 35,401,957 10,815,773 21,476,365 3,109,819 391,280
Kachin 1,050,473 325,231 663,037 62,205 7,621
Kayah 214,209 78,638 123,748 11,823 1,361
Kayin 1,175,160 439,876 635,830 99,454 11,350
Chin 378,992 158,437 193,145 27,410 3,248
Sagaing 4,414,012 1,291,508 2,711,942 410,562 52,981
Tanintharyi 1,069,982 381,730 608,607 79,645 11,554
Bago 3,795,037 1,115,715 2,324,516 354,806 46,646
Magway 3,329,024 916,742 2,053,047 359,235 43,619
Mandalay 4,022,287 1,104,310 2,520,677 397,300 49,406
Mon 1,482,204 489,043 850,488 142,673 18,693
Rakhine 1,744,519 560,054 1,013,227 171,238 23,242
Yangon 2,200,191 618,310 1,418,768 163,113 18,234
Shan 4,428,585 1,487,121 2,644,037 297,427 34,802
Ayeyawady 5,312,229 1,611,837 3,227,331 473,061 60,566
Nay Pyi Taw 785,053 237,221 487,965 59,867 7,957

Census Report Volume 4-L – The Older Population 141
Appendix 1. Appendix tables
Table 19 Percentage of population by functional age groups and older age dependency ratio, State/Region, District, 2014 Census
State/Region/District
Total population
0-14 15-59 60 and over 80 and over
% 60+ Older age dependency ratio
Union 50,279,900 14,399,569 31,405,923 4,474,408 566,602 8.9 14.2
Kachin 1,642,841 492,879 1,047,350 102,612 12,852 6.2 9.8
Myitkyina 531,456 169,378 326,813 35,265 4,637 6.6 10.8
Mohnyin 673,608 179,545 457,984 36,079 4,296 5.4 7.9
Bhamo 346,520 109,417 212,328 24,775 2,904 7.1 11.7
Putao 91,257 34,539 50,225 6,493 1,015 7.1 12.9
Kayah 286,627 99,003 170,445 17,179 2,057 6.0 10.1
Loikaw 243,718 85,291 143,148 15,279 1,846 6.3 10.7
Bawlakhe 42,909 13,712 27,297 1,900 211 4.4 7.0
Kayin 1,504,326 538,596 843,413 122,317 13,859 8.1 14.5
Hpa-An 783,510 285,304 427,105 71,101 8,122 9.1 16.6
Pharpon 35,085 12,768 20,212 2,105 236 6.0 10.4
Myawady 210,540 69,753 130,366 10,421 922 4.9 8.0
Kawkareik 475,191 170,771 265,730 38,690 4,579 8.1 14.6
Chin 478,801 191,290 251,715 35,796 4,262 7.5 14.2
Hakha 98,726 36,902 53,217 8,607 1,129 8.7 16.2
Falam 167,578 67,294 88,879 11,405 1,266 6.8 12.8
Mindat 212,497 87,094 109,619 15,784 1,867 7.4 14.4
Sagaing 5,325,347 1,525,943 3,304,264 495,140 64,084 9.3 15.0
Sagaing 520,591 123,917 334,712 61,962 8,771 11.9 18.5
Shwebo 1,433,343 392,309 893,451 147,583 21,334 10.3 16.5
Monywa 757,358 186,990 486,871 83,497 10,901 11.0 17.1
Katha 861,283 268,582 528,610 64,091 7,580 7.4 12.1
Kalay 509,368 155,613 314,451 39,304 4,064 7.7 12.5
Tamu 114,869 40,558 67,200 7,111 708 6.2 10.6
Mawlaik 164,008 57,298 93,924 12,786 1,344 7.8 13.6
Hkamti 422,692 151,113 249,839 21,740 2,635 5.1 8.7
Yinmarpin 541,835 149,563 335,206 57,066 6,747 10.5 17.0
Tanintharyi 1,408,401 478,027 821,323 109,051 15,893 7.7 13.3
Dawei 493,576 160,192 282,125 51,259 8,207 10.4 18.2
Myeik 693,087 242,238 404,559 46,290 6,561 6.7 11.4
Kawthoung 221,738 75,597 134,639 11,502 1,125 5.2 8.5
Bago 4,867,373 1,383,846 3,010,680 472,847 62,424 9.7 15.7
Bago 1,770,785 563,413 1,061,109 146,263 16,659 8.3 13.8
Toungoo 1,123,355 348,788 678,895 95,672 12,583 8.5 14.1
Pyay 910,902 198,139 604,918 107,845 15,694 11.8 17.8
Thayawady 1,062,331 273,506 665,758 123,067 17,488 11.6 18.5
Magway 3,917,055 1,056,659 2,435,898 424,498 52,085 10.8 17.4
Magway 1,235,030 342,238 756,779 136,013 16,635 11.0 18.0
Minbu 687,575 185,337 433,304 68,934 8,448 10.0 15.9
Thayet 738,047 179,316 481,091 77,640 10,682 10.5 16.1
Pakokku 1,005,545 287,403 604,805 113,337 13,059 11.3 18.7
Gangaw 250,858 62,365 159,919 28,574 3,261 11.4 17.9

Census Report Volume 4-L – The Older Population142
Appendix 1. Appendix tables
State/Region/District
Total population
0-14 15-59 60 and over 80 and over
% 60+ Older age dependency ratio
Mandalay 6,165,723 1,599,216 3,986,148 580,359 71,809 9.4 14.6
Mandalay 1,726,889 405,898 1,188,682 132,309 16,247 7.7 11.1
Pyin Oo Lwin 1,001,945 284,619 642,998 74,328 8,613 7.4 11.6
Kyaukse 741,071 195,317 478,227 67,527 8,142 9.1 14.1
Myingyan 1,055,957 278,744 649,938 127,275 16,510 12.1 19.6
Nyaung U 239,947 60,266 152,005 27,676 3,001 11.5 18.2
Yame`Thin 518,384 139,538 326,573 52,273 6,742 10.1 16.0
Meiktila 881,530 234,834 547,725 98,971 12,554 11.2 18.1
Mon 2,054,393 641,960 1,208,952 203,481 27,215 9.9 16.8
Mawlamyine 1,232,221 369,719 733,039 129,463 18,002 10.5 17.7
Thaton 822,172 272,241 475,913 74,018 9,213 9.0 15.6
Rakhine 2,098,807 653,333 1,238,959 206,515 28,602 9.8 16.7
Sittway 535,583 173,575 316,417 45,591 5,946 8.5 14.4
Myauk U 669,131 224,171 386,634 58,326 7,203 8.7 15.1
Maungtaw 96,330 32,386 57,903 6,041 793 6.3 10.4
Kyaukpyu 439,923 130,349 256,056 53,518 7,894 12.2 20.9
Thandwe 357,840 92,852 221,949 43,039 6,766 12.0 19.4
Yangon 7,360,703 1,725,413 4,989,961 645,329 78,290 8.8 12.9
North Yangon 2,606,670 659,290 1,754,574 192,806 21,633 7.4 11.0
East Yangon 2,366,659 505,319 1,631,166 230,174 28,559 9.7 14.1
South Yangon 1,417,724 396,251 903,902 117,571 13,453 8.3 13.0
West Yangon 969,650 164,553 700,319 104,778 14,645 10.8 15.0
Shan 5,824,432 1,865,293 3,553,508 405,631 48,000 7.0 11.4
Taunggyi 1,701,338 524,251 1,064,648 112,439 12,537 6.6 10.6
Loilin 565,162 184,378 341,578 39,206 4,681 6.9 11.5
Linkhe` 139,483 40,430 87,081 11,972 1,562 8.6 13.7
Lashio 612,248 195,984 370,937 45,327 5,253 7.4 12.2
Muse 453,495 145,629 275,305 32,561 4,324 7.2 11.8
Kyaukme 770,065 235,846 477,043 57,176 6,398 7.4 12.0
Kunlon 58,774 22,363 32,287 4,124 601 7.0 12.8
Laukine 154,912 53,290 92,139 9,483 1,274 6.1 10.3
Hopan 228,880 87,228 124,914 16,738 2,280 7.3 13.4
Makman 241,884 89,611 137,651 14,622 1,977 6.0 10.6
Kengtung 366,861 113,318 225,753 27,790 3,495 7.6 12.3
Minesat 243,571 90,932 139,864 12,775 1,353 5.2 9.1
Tachileik 177,313 49,528 115,365 12,420 1,318 7.0 10.8
Minephyat 110,446 32,505 68,943 8,998 947 8.1 13.1
Ayeyawady 6,184,829 1,821,154 3,793,769 569,906 74,319 9.2 15.0
Pathein 1,630,716 466,235 1,016,802 147,679 19,818 9.1 14.5
Phyapon 1,033,053 332,255 622,965 77,833 8,641 7.5 12.5
Maubin 973,948 287,173 594,731 92,044 11,781 9.5 15.5
Myaungmya 781,844 238,315 475,744 67,785 8,284 8.7 14.2
Labutta 626,558 198,874 381,236 46,448 5,209 7.4 12.2
Hinthada 1,138,710 298,302 702,291 138,117 20,586 12.1 19.7
Nay Pyi Taw 1,160,242 326,957 749,538 83,747 10,851 7.2 11.2
Ottara 526,497 151,007 337,656 37,834 4,908 7.2 11.2
Dekkhina 633,745 175,950 411,882 45,913 5,943 7.2 11.1
Table 19 (continued) Percentage of population by functional age groups and older age dependency ratio, State/Region, District, 2014 Census

Census Report Volume 4-L – The Older Population 143
Appendix 1. Appendix tablesTable 20 Percentage of population aged 60 and over by sex by marital status, urban and rural areas, State/Region, 2014 Census
State/Region/Area Male Female
Tota
l p
op
ulat
ion
Nev
er m
arri
ed
Ren
oun
ced
Mar
ried
Wid
owed
Div
orc
ed o
r se
par
ated
Tota
l
Tota
l p
op
ulat
ion
Nev
er m
arri
ed
Ren
oun
ced
Mar
ried
Wid
owed
Div
orc
ed o
r se
par
ated
Tota
l
Union 1,921,340 4.1 3.3 73.9 17.4 1.3 100 2,553,068 8.2 0.5 44.1 45.7 1.6 100
Kachin 41,737 3.0 2.0 79.2 14.6 1.2 100 60,875 4.1 0.4 40.7 53.6 1.2 100
Kayah 7,720 3.4 2.0 74.9 17.9 1.8 100 9,459 3.6 0.8 43.6 50.4 1.6 100
Kayin 55,035 2.6 4.3 73.1 18.9 1.1 100 67,282 4.9 0.6 44.8 48.3 1.4 100
Chin 16,616 3.0 0.4 81.1 14.3 1.2 100 19,180 3.8 0.0 45.4 48.0 2.8 100
Sagaing 203,362 4.4 3.1 74.7 16.7 0.9 100 291,778 9.0 0.5 45.7 43.7 1.2 100
Tanintharyi 48,454 3.3 4.1 72.8 17.8 2.0 100 60,597 6.0 0.4 44.0 47.7 1.9 100
Bago 202,221 4.0 4.2 72.3 18.2 1.3 100 270,626 9.6 0.6 42.0 46.3 1.5 100
Magway 176,437 4.2 2.9 73.8 18.1 1.0 100 248,061 9.2 0.3 45.1 44.2 1.3 100
Mandalay 239,746 5.3 3.8 73.7 16.3 0.9 100 340,613 10.9 0.4 45.9 41.6 1.3 100
Mon 90,199 2.9 5.6 71.7 18.4 1.4 100 113,282 6.3 0.8 45.7 45.5 1.7 100
Rakhine 90,493 1.9 2.7 77.1 16.7 1.6 100 116,022 4.0 0.4 43.1 50.6 1.9 100
Yangon 274,143 5.2 3.3 74.4 15.7 1.5 100 371,186 9.3 0.6 43.2 44.9 2.0 100
Shan 184,019 3.2 1.7 77.0 16.5 1.5 100 221,612 3.6 0.3 43.6 50.5 2.0 100
Ayeyawady 256,417 4.2 3.1 70.5 20.5 1.8 100 313,489 9.0 0.4 43.4 45.2 2.0 100
Nay Pyi Taw 34,741 3.5 3.4 75.5 16.3 1.3 100 49,006 7.7 0.3 42.9 47.5 1.6 100
Urban 562,081 5.1 3.3 74.8 15.4 1.4 100 802,508 9.9 0.7 42.6 44.9 1.9 100
Kachin 16,119 3.3 1.6 79.8 14.1 1.2 100 24,288 5.5 0.5 41.2 51.7 1.2 100
Kayah 2,274 4.3 2.4 74.7 16.4 2.2 100 3,082 4.5 1.0 41.7 50.8 1.9 100
Kayin 9,761 3.3 4.0 74.5 16.5 1.7 100 13,102 5.4 0.6 42.6 49.2 2.2 100
Chin 3,825 2.6 0.4 84.8 11.3 0.9 100 4,561 4.1 0.0 46.9 47.2 1.8 100
Sagaing 34,197 5.1 3.5 75.6 14.8 1.1 100 50,381 10.5 0.8 43.9 43.3 1.5 100
Tanintharyi 12,161 5.3 4.6 71.7 16.7 1.8 100 17,245 10.1 0.8 41.1 46.0 1.9 100
Bago 47,489 4.9 4.6 72.9 16.3 1.3 100 70,552 12.0 1.5 39.6 45.3 1.7 100
Magway 25,638 5.2 4.1 74.2 15.4 1.1 100 39,625 11.8 0.7 42.1 43.8 1.6 100
Mandalay 74,156 6.1 4.4 73.7 14.7 1.1 100 108,903 11.4 0.8 43.9 42.5 1.5 100
Mon 25,203 4.4 5.0 72.4 16.7 1.6 100 35,605 9.1 0.9 42.8 45.3 1.9 100
Rakhine 14,319 3.4 3.7 76.1 15.1 1.7 100 20,958 7.4 1.0 38.5 51.0 2.1 100
Yangon 201,574 5.6 2.6 75.2 15.0 1.6 100 280,642 10.0 0.5 43.4 43.9 2.1 100
Shan 45,353 3.6 1.9 78.6 14.4 1.5 100 62,851 5.0 0.5 44.4 48.3 1.8 100
Ayeyawady 40,133 4.9 3.6 71.2 18.4 1.8 100 56,712 12.4 1.0 39.3 45.0 2.3 100
Nay Pyi Taw 9,879 4.5 2.8 77.1 14.6 1.0 100 14,001 9.6 0.5 43.1 45.2 1.5 100
Rural 1,359,259 3.7 3.3 73.5 18.2 1.3 100 1,750,560 7.4 0.3 44.7 46.0 1.5 100
Kachin 25,618 2.9 2.3 78.8 14.8 1.2 100 36,587 3.2 0.4 40.4 54.9 1.2 100
Kayah 5,446 3.1 1.8 74.9 18.6 1.6 100 6,377 3.2 0.6 44.5 50.2 1.5 100
Kayin 45,274 2.5 4.4 72.8 19.4 0.9 100 54,180 4.7 0.6 45.3 48.1 1.3 100
Chin 12,791 3.1 0.4 80.0 15.2 1.3 100 14,619 3.7 0.0 44.9 48.2 3.1 100
Sagaing 169,165 4.3 3.1 74.6 17.1 0.9 100 241,397 8.6 0.4 46.0 43.8 1.1 100
Tanintharyi 36,293 2.7 4.0 73.1 18.2 2.1 100 43,352 4.3 0.3 45.1 48.3 1.9 100
Bago 154,732 3.7 4.0 72.2 18.7 1.3 100 200,074 8.8 0.3 42.8 46.7 1.4 100
Magway 150,799 4.0 2.6 73.7 18.6 1.0 100 208,436 8.7 0.2 45.6 44.3 1.2 100
Mandalay 165,590 5.0 3.5 73.7 16.9 0.8 100 231,710 10.7 0.2 46.8 41.2 1.1 100
Mon 64,996 2.4 5.9 71.4 19.1 1.3 100 77,677 5.0 0.7 47.0 45.6 1.6 100
Rakhine 76,174 1.7 2.5 77.2 16.9 1.6 100 95,064 3.2 0.2 44.1 50.6 1.9 100
Yangon 72,569 4.0 5.0 72.1 17.4 1.5 100 90,544 7.0 1.0 42.5 47.8 1.6 100
Shan 138,666 3.1 1.7 76.6 17.2 1.5 100 158,761 3.0 0.3 43.4 51.3 2.0 100
Ayeyawady 216,284 4.1 3.0 70.4 20.9 1.7 100 256,777 8.2 0.2 44.3 45.2 2.0 100
Nay Pyi Taw 24,862 3.2 3.6 74.8 17.0 1.5 100 35,005 6.9 0.2 42.8 48.4 1.7 100
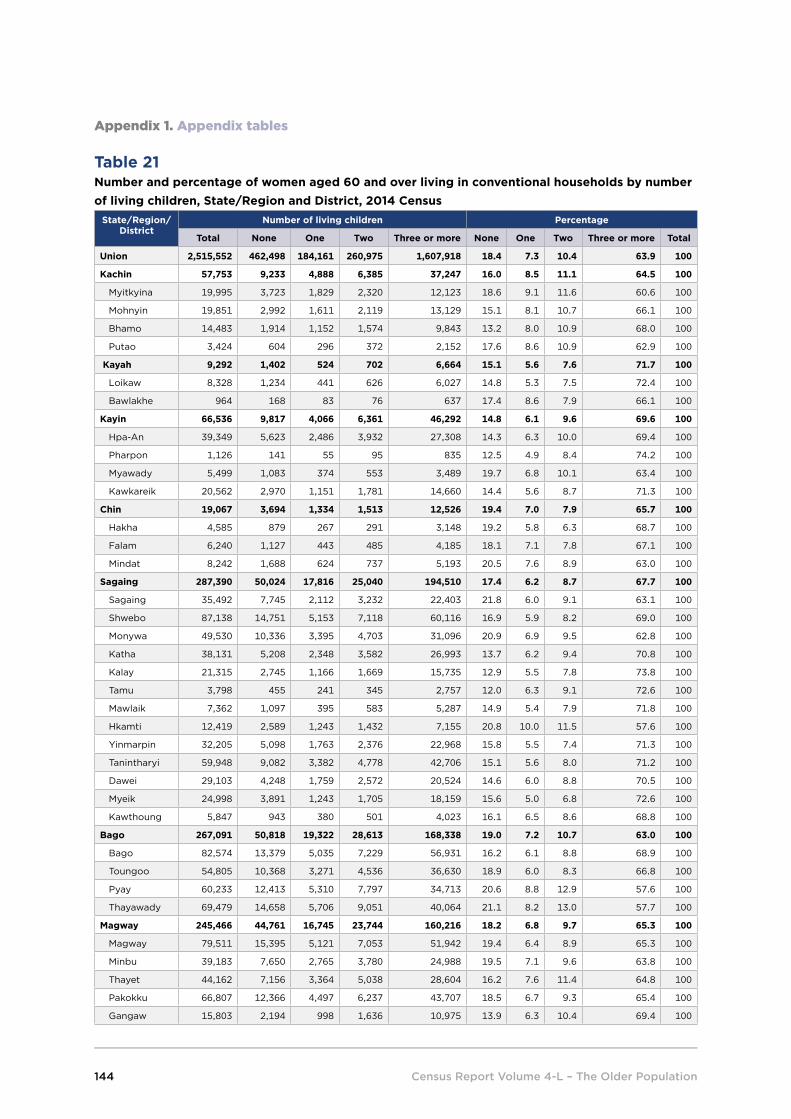
Census Report Volume 4-L – The Older Population144
Appendix 1. Appendix tables
Table 21 Number and percentage of women aged 60 and over living in conventional households by number of living children, State/Region and District, 2014 Census
State/Region/ District
Number of living children Percentage
Total None One Two Three or more None One Two Three or more Total
Union 2,515,552 462,498 184,161 260,975 1,607,918 18.4 7.3 10.4 63.9 100
Kachin 57,753 9,233 4,888 6,385 37,247 16.0 8.5 11.1 64.5 100
Myitkyina 19,995 3,723 1,829 2,320 12,123 18.6 9.1 11.6 60.6 100
Mohnyin 19,851 2,992 1,611 2,119 13,129 15.1 8.1 10.7 66.1 100
Bhamo 14,483 1,914 1,152 1,574 9,843 13.2 8.0 10.9 68.0 100
Putao 3,424 604 296 372 2,152 17.6 8.6 10.9 62.9 100
Kayah 9,292 1,402 524 702 6,664 15.1 5.6 7.6 71.7 100
Loikaw 8,328 1,234 441 626 6,027 14.8 5.3 7.5 72.4 100
Bawlakhe 964 168 83 76 637 17.4 8.6 7.9 66.1 100
Kayin 66,536 9,817 4,066 6,361 46,292 14.8 6.1 9.6 69.6 100
Hpa-An 39,349 5,623 2,486 3,932 27,308 14.3 6.3 10.0 69.4 100
Pharpon 1,126 141 55 95 835 12.5 4.9 8.4 74.2 100
Myawady 5,499 1,083 374 553 3,489 19.7 6.8 10.1 63.4 100
Kawkareik 20,562 2,970 1,151 1,781 14,660 14.4 5.6 8.7 71.3 100
Chin 19,067 3,694 1,334 1,513 12,526 19.4 7.0 7.9 65.7 100
Hakha 4,585 879 267 291 3,148 19.2 5.8 6.3 68.7 100
Falam 6,240 1,127 443 485 4,185 18.1 7.1 7.8 67.1 100
Mindat 8,242 1,688 624 737 5,193 20.5 7.6 8.9 63.0 100
Sagaing 287,390 50,024 17,816 25,040 194,510 17.4 6.2 8.7 67.7 100
Sagaing 35,492 7,745 2,112 3,232 22,403 21.8 6.0 9.1 63.1 100
Shwebo 87,138 14,751 5,153 7,118 60,116 16.9 5.9 8.2 69.0 100
Monywa 49,530 10,336 3,395 4,703 31,096 20.9 6.9 9.5 62.8 100
Katha 38,131 5,208 2,348 3,582 26,993 13.7 6.2 9.4 70.8 100
Kalay 21,315 2,745 1,166 1,669 15,735 12.9 5.5 7.8 73.8 100
Tamu 3,798 455 241 345 2,757 12.0 6.3 9.1 72.6 100
Mawlaik 7,362 1,097 395 583 5,287 14.9 5.4 7.9 71.8 100
Hkamti 12,419 2,589 1,243 1,432 7,155 20.8 10.0 11.5 57.6 100
Yinmarpin 32,205 5,098 1,763 2,376 22,968 15.8 5.5 7.4 71.3 100
Tanintharyi 59,948 9,082 3,382 4,778 42,706 15.1 5.6 8.0 71.2 100
Dawei 29,103 4,248 1,759 2,572 20,524 14.6 6.0 8.8 70.5 100
Myeik 24,998 3,891 1,243 1,705 18,159 15.6 5.0 6.8 72.6 100
Kawthoung 5,847 943 380 501 4,023 16.1 6.5 8.6 68.8 100
Bago 267,091 50,818 19,322 28,613 168,338 19.0 7.2 10.7 63.0 100
Bago 82,574 13,379 5,035 7,229 56,931 16.2 6.1 8.8 68.9 100
Toungoo 54,805 10,368 3,271 4,536 36,630 18.9 6.0 8.3 66.8 100
Pyay 60,233 12,413 5,310 7,797 34,713 20.6 8.8 12.9 57.6 100
Thayawady 69,479 14,658 5,706 9,051 40,064 21.1 8.2 13.0 57.7 100
Magway 245,466 44,761 16,745 23,744 160,216 18.2 6.8 9.7 65.3 100
Magway 79,511 15,395 5,121 7,053 51,942 19.4 6.4 8.9 65.3 100
Minbu 39,183 7,650 2,765 3,780 24,988 19.5 7.1 9.6 63.8 100
Thayet 44,162 7,156 3,364 5,038 28,604 16.2 7.6 11.4 64.8 100
Pakokku 66,807 12,366 4,497 6,237 43,707 18.5 6.7 9.3 65.4 100
Gangaw 15,803 2,194 998 1,636 10,975 13.9 6.3 10.4 69.4 100

Census Report Volume 4-L – The Older Population 145
Appendix 1. Appendix tables
State/Region/ District
Number of living children Percentage
Total None One Two Three or more None One Two Three or more Total
Mandalay 335,977 64,570 21,471 30,077 219,859 19.2 6.4 9.0 65.4 100
Mandalay 76,072 16,010 5,424 8,007 46,631 21.0 7.1 10.5 61.3 100
Pyin Oo Lwin 41,762 7,007 2,513 3,628 28,614 16.8 6.0 8.7 68.5 100
Kyaukse 38,972 7,060 2,119 3,223 26,570 18.1 5.4 8.3 68.2 100
Myingyan 75,104 15,176 4,715 6,298 48,915 20.2 6.3 8.4 65.1 100
Nyaung U 15,896 2,864 1,050 1,416 10,566 18.0 6.6 8.9 66.5 100
Yame`Thin 30,301 5,631 1,916 2,441 20,313 18.6 6.3 8.1 67.0 100
Meiktila 57,870 10,822 3,734 5,064 38,250 18.7 6.5 8.8 66.1 100
Mon 111,002 15,420 6,479 9,863 79,240 13.9 5.8 8.9 71.4 100
Mawlamyine 71,322 10,128 4,176 6,385 50,633 14.2 5.9 9.0 71.0 100
Thaton 39,680 5,292 2,303 3,478 28,607 13.3 5.8 8.8 72.1 100
Rakhine 115,023 20,357 9,258 13,823 71,585 17.7 8.0 12.0 62.2 100
Sittway 26,096 4,414 1,623 2,177 17,882 16.9 6.2 8.3 68.5 100
Myauk U 31,860 5,440 1,988 2,954 21,478 17.1 6.2 9.3 67.4 100
Maungtaw 3,183 734 231 266 1,952 23.1 7.3 8.4 61.3 100
Kyaukpyu 30,173 5,637 2,740 3,958 17,838 18.7 9.1 13.1 59.1 100
Thandwe 23,711 4,132 2,676 4,468 12,435 17.4 11.3 18.8 52.4 100
Yangon 363,466 71,414 28,334 44,332 219,386 19.6 7.8 12.2 60.4 100
North Yangon 107,960 19,026 7,980 12,118 68,836 17.6 7.4 11.2 63.8 100
East Yangon 131,925 25,499 11,317 17,906 77,203 19.3 8.6 13.6 58.5 100
South Yangon 64,560 11,369 3,860 5,689 43,642 17.6 6.0 8.8 67.6 100
West Yangon 59,021 15,520 5,177 8,619 29,705 26.3 8.8 14.6 50.3 100
Shan 218,996 38,045 23,598 25,781 131,572 17.4 10.8 11.8 60.1 100
Taunggyi 61,542 9,594 4,251 5,762 41,935 15.6 6.9 9.4 68.1 100
Loilin 21,335 3,073 2,988 2,987 12,287 14.4 14.0 14.0 57.6 100
Linkhe` 6,114 1,062 661 864 3,527 17.4 10.8 14.1 57.7 100
Lashio 24,838 3,243 2,869 3,167 15,559 13.1 11.6 12.8 62.6 100
Muse 18,472 2,319 1,631 1,990 12,532 12.6 8.8 10.8 67.8 100
Kyaukme 31,821 5,037 3,151 3,908 19,725 15.8 9.9 12.3 62.0 100
Kunlon 2,280 284 174 210 1,612 12.5 7.6 9.2 70.7 100
Laukine 5,214 533 373 480 3,828 10.2 7.2 9.2 73.4 100
Hopan 7,724 2,985 1,255 783 2,701 38.6 16.2 10.1 35.0 100
Makman 6,691 2,751 1,025 798 2,117 41.1 15.3 11.9 31.6 100
Kengtung 14,843 3,343 2,268 2,009 7,223 22.5 15.3 13.5 48.7 100
Minesat 6,175 1,613 934 872 2,756 26.1 15.1 14.1 44.6 100
Tachileik 6,891 1,215 1,091 1,123 3,462 17.6 15.8 16.3 50.2 100
Minephyat 5,056 993 927 828 2,308 19.6 18.3 16.4 45.6 100
Ayeyawady 310,510 65,397 23,624 35,463 186,026 21.1 7.6 11.4 59.9 100
Pathein 79,734 16,269 6,196 9,983 47,286 20.4 7.8 12.5 59.3 100
Phyapon 42,101 8,546 2,693 3,564 27,298 20.3 6.4 8.5 64.8 100
Maubin 50,522 11,435 3,422 5,073 30,592 22.6 6.8 10.0 60.6 100
Myaungmya 36,752 7,355 2,342 3,332 23,723 20.0 6.4 9.1 64.5 100
Labutta 24,318 4,883 1,647 2,276 15,512 20.1 6.8 9.4 63.8 100
Hinthada 77,083 16,909 7,324 11,235 41,615 21.9 9.5 14.6 54.0 100
Nay Pyi Taw 48,035 8,464 3,320 4,500 31,751 17.6 6.9 9.4 66.1 100
Ottara 21,829 3,464 1,400 1,922 15,043 15.9 6.4 8.8 68.9 100
Dekkhina 26,206 5,000 1,920 2,578 16,708 19.1 7.3 9.8 63.8 100
Table 21 (continued) Number and percentage of women aged 60 and over living in conventional households by number of living children, State/Region and District, 2014 Census

Census Report Volume 4-L – The Older Population146
Appendix 1. Appendix tables
Table 22 Number and percentage of population aged 60 and over by type of housing, urban and rural areas, State/Region, 2014 Census
State/Region/Area
Number Percentage
Total Condominium/ apartment/brick house
Semi-pacca/ wooden house
Bamboo/ hut/other
types
Condominium/ apartment/brick house
Semi-pacca/ wooden house
Bamboo/ hut/other
types
Total
Union 4,341,459 551,727 2,468,881 1,320,851 12.7 56.9 30.4 100
Kachin 95,879 9,648 51,146 35,085 10.1 53.3 36.6 100
Kayah 16,735 2,782 10,192 3,761 16.6 60.9 22.5 100
Kayin 118,473 8,313 94,362 15,798 7.0 79.6 13.3 100
Chin 35,417 565 26,488 8,364 1.6 74.8 23.6 100
Sagaing 481,249 38,752 273,545 168,952 8.1 56.8 35.1 100
Tanintharyi 105,619 12,244 73,153 20,222 11.6 69.3 19.1 100
Bago 458,347 28,987 335,746 93,614 6.3 73.3 20.4 100
Magway 414,654 25,046 211,407 178,201 6.0 51.0 43.0 100
Mandalay 562,146 85,942 202,013 274,191 15.3 35.9 48.8 100
Mon 194,498 19,441 153,516 21,541 10.0 78.9 11.1 100
Rakhine 202,039 4,020 128,219 69,800 2.0 63.5 34.5 100
Yangon 622,759 192,543 350,918 79,298 30.9 56.3 12.7 100
Shan 396,996 93,485 165,000 138,511 23.5 41.6 34.9 100
Ayeyawady 556,054 19,481 341,600 194,973 3.5 61.4 35.1 100
Nay Pyi Taw 80,594 10,478 51,576 18,540 13.0 64.0 23.0 100
Urban 1,312,355 375,186 696,869 240,300 28.6 53.1 18.3 100
Kachin 37,970 6,778 20,267 10,925 17.9 53.4 28.8 100
Kayah 5,151 1,503 3,016 632 29.2 58.6 12.3 100
Kayin 22,087 3,925 16,473 1,689 17.8 74.6 7.6 100
Chin 8,226 502 7,016 708 6.1 85.3 8.6 100
Sagaing 81,426 14,416 41,548 25,462 17.7 51.0 31.3 100
Tanintharyi 28,236 5,796 18,736 3,704 20.5 66.4 13.1 100
Bago 112,775 18,702 79,359 14,714 16.6 70.4 13.0 100
Magway 62,862 10,920 23,533 28,409 17.4 37.4 45.2 100
Mandalay 174,208 48,179 58,931 67,098 27.7 33.8 38.5 100
Mon 58,092 10,946 42,960 4,186 18.8 74.0 7.2 100
Rakhine 34,102 2,960 21,903 9,239 8.7 64.2 27.1 100
Yangon 467,083 182,053 252,658 32,372 39.0 54.1 6.9 100
Shan 104,692 48,731 34,587 21,374 46.5 33.0 20.4 100
Ayeyawady 93,096 12,062 64,700 16,334 13.0 69.5 17.5 100
Nay Pyi Taw 22,349 7,713 11,182 3,454 34.5 50.0 15.5 100
Rural 3,029,104 176,541 1,772,012 1,080,551 5.8 58.5 35.7 100
Kachin 57,909 2,870 30,879 24,160 5.0 53.3 41.7 100
Kayah 11,584 1,279 7,176 3,129 11.0 61.9 27.0 100
Kayin 96,386 4,388 77,889 14,109 4.6 80.8 14.6 100
Chin 27,191 63 19,472 7,656 0.2 71.6 28.2 100
Sagaing 399,823 24,336 231,997 143,490 6.1 58.0 35.9 100
Tanintharyi 77,383 6,448 54,417 16,518 8.3 70.3 21.3 100
Bago 345,572 10,285 256,387 78,900 3.0 74.2 22.8 100
Magway 351,792 14,126 187,874 149,792 4.0 53.4 42.6 100
Mandalay 387,938 37,763 143,082 207,093 9.7 36.9 53.4 100
Mon 136,406 8,495 110,556 17,355 6.2 81.0 12.7 100
Rakhine 167,937 1,060 106,316 60,561 0.6 63.3 36.1 100
Yangon 155,676 10,490 98,260 46,926 6.7 63.1 30.1 100
Shan 292,304 44,754 130,413 117,137 15.3 44.6 40.1 100
Ayeyawady 462,958 7,419 276,900 178,639 1.6 59.8 38.6 100
Nay Pyi Taw 58,245 2,765 40,394 15,086 4.7 69.4 25.9 100

Census Report Volume 4-L – The Older Population 147
Appendix 1. Appendix tables
Table 23 Number and percentage of older persons who never attended school by sex, urban and rural areas, State/Region, 2014 Census
State/Region/Sex
Union Urban Rural
Total population
Never attended Total population
Never attended Total population
Never attended
Number % Number % Number %
Both sexes
Total 4,341,459 1,245,362 28.7 1,312,355 196,801 15.0 3,029,104 1,048,561 34.6
Kachin 95,879 33,771 35.2 37,970 9,973 26.3 57,909 23,798 41.1
Kayah 16,735 7,535 45.0 5,151 1,154 22.4 11,584 6,381 55.1
Kayin 118,473 57,306 48.4 22,087 4,413 20.0 96,386 52,893 54.9
Chin 35,417 17,404 49.1 8,226 2,871 34.9 27,191 14,533 53.4
Sagaing 481,249 116,067 24.1 81,426 11,167 13.7 399,823 104,900 26.2
Tanintharyi 105,619 18,939 17.9 28,236 2,830 10.0 77,383 16,109 20.8
Bago 458,347 95,111 20.8 112,775 14,415 12.8 345,572 80,696 23.4
Magway 414,654 166,345 40.1 62,862 10,373 16.5 351,792 155,972 44.3
Mandalay 562,146 141,454 25.2 174,208 23,886 13.7 387,938 117,568 30.3
Mon 194,498 58,538 30.1 58,092 10,483 18.0 136,406 48,055 35.2
Rakhine 202,039 66,214 32.8 34,102 6,871 20.1 167,937 59,343 35.3
Yangon 622,759 69,281 11.1 467,083 39,890 8.5 155,676 29,391 18.9
Shan 396,996 260,760 65.7 104,692 44,327 42.3 292,304 216,433 74.0
Ayeyawady 556,054 121,420 21.8 93,096 11,787 12.7 462,958 109,633 23.7
Nay Pyi Taw 80,594 15,217 18.9 22,349 2,361 10.6 58,245 12,856 22.1
Male
Total 1,825,907 382,106 20.9 529,012 44,276 8.4 1,296,895 337,830 26.0
Kachin 38,126 9,715 25.5 14,864 2,443 16.4 23,262 7,272 31.3
Kayah 7,443 2,397 32.2 2,154 250 11.6 5,289 2,147 40.6
Kayin 51,937 20,149 38.8 9,172 1,074 11.7 42,765 19,075 44.6
Chin 16,350 4,528 27.7 3,734 545 14.6 12,616 3,983 31.6
Sagaing 193,859 27,219 14.0 32,229 1,840 5.7 161,630 25,379 15.7
Tanintharyi 45,671 6,279 13.7 11,332 636 5.6 34,339 5,643 16.4
Bago 191,256 28,248 14.8 44,341 3,103 7.0 146,915 25,145 17.1
Magway 169,188 54,384 32.1 24,075 2,313 9.6 145,113 52,071 35.9
Mandalay 226,169 32,520 14.4 68,506 4,211 6.1 157,663 28,309 18.0
Mon 83,496 18,781 22.5 23,356 2,578 11.0 60,140 16,203 26.9
Rakhine 87,016 17,292 19.9 13,543 1,406 10.4 73,473 15,886 21.6
Yangon 259,293 16,474 6.4 191,806 7,367 3.8 67,487 9,107 13.5
Shan 178,000 101,970 57.3 43,236 13,556 31.4 134,764 88,414 65.6
Ayeyawady 245,544 39,860 16.2 37,699 2,659 7.1 207,845 37,201 17.9
Nay Pyi Taw 32,559 2,290 7.0 8,965 295 3.3 23,594 1,995 8.5
Female
Total 2,515,552 863,256 34.3 783,343 152,525 19.5 1,732,209 710,731 41.0
Kachin 57,753 24,056 41.7 23,106 7,530 32.6 34,647 16,526 47.7
Kayah 9,292 5,138 55.3 2,997 904 30.2 6,295 4,234 67.3
Kayin 66,536 37,157 55.8 12,915 3,339 25.9 53,621 33,818 63.1
Chin 19,067 12,876 67.5 4,492 2,326 51.8 14,575 10,550 72.4
Sagaing 287,390 88,848 30.9 49,197 9,327 19.0 238,193 79,521 33.4
Tanintharyi 59,948 12,660 21.1 16,904 2,194 13.0 43,044 10,466 24.3
Bago 267,091 66,863 25.0 68,434 11,312 16.5 198,657 55,551 28.0
Magway 245,466 111,961 45.6 38,787 8,060 20.8 206,679 103,901 50.3
Mandalay 335,977 108,934 32.4 105,702 19,675 18.6 230,275 89,259 38.8
Mon 111,002 39,757 35.8 34,736 7,905 22.8 76,266 31,852 41.8
Rakhine 115,023 48,922 42.5 20,559 5,465 26.6 94,464 43,457 46.0
Yangon 363,466 52,807 14.5 275,277 32,523 11.8 88,189 20,284 23.0
Shan 218,996 158,790 72.5 61,456 30,771 50.1 157,540 128,019 81.3
Ayeyawady 310,510 81,560 26.3 55,397 9,128 16.5 255,113 72,432 28.4
Nay Pyi Taw 48,035 12,927 26.9 13,384 2,066 15.4 34,651 10,861 31.3

Census Report Volume 4-L – The Older Population148
Appendix 1. Appendix tablesTable 24 Number and percentage of older persons living in conventional households who are literate, by sex, urban and rural areas, State/Region, 2014 Census
State/ Region/Sex
Union Urban Rural
Total population
Literate Total population
Literate Total population
Literate
Number % Number % Number %
Both sexes
Total 4,341,459 3,433,653 79.1 1,312,355 1,157,955 88.2 3,029,104 2,275,698 75.1
Kachin 95,879 68,143 71.1 37,970 29,569 77.9 57,909 38,574 66.6
Kayah 16,735 9,405 56.2 5,151 4,081 79.2 11,584 5,324 46.0
Kayin 118,473 64,015 54.0 22,087 18,060 81.8 96,386 45,955 47.7
Chin 35,417 18,221 51.4 8,226 5,519 67.1 27,191 12,702 46.7
Sagaing 481,249 398,007 82.7 81,426 72,737 89.3 399,823 325,270 81.4
Tanintharyi 105,619 89,894 85.1 28,236 25,768 91.3 77,383 64,126 82.9
Bago 458,347 403,480 88.0 112,775 102,931 91.3 345,572 300,549 87.0
Magway 414,654 329,285 79.4 62,862 56,574 90.0 351,792 272,711 77.5
Mandalay 562,146 465,504 82.8 174,208 156,002 89.5 387,938 309,502 79.8
Mon 194,498 142,049 73.0 58,092 48,870 84.1 136,406 93,179 68.3
Rakhine 202,039 145,970 72.2 34,102 28,260 82.9 167,937 117,710 70.1
Yangon 622,759 576,421 92.6 467,083 437,414 93.6 155,676 139,007 89.3
Shan 396,996 165,158 41.6 104,692 65,980 63.0 292,304 99,178 33.9
Ayeyawady 556,054 489,965 88.1 93,096 85,760 92.1 462,958 404,205 87.3
Nay Pyi Taw 80,594 68,136 84.5 22,349 20,430 91.4 58,245 47,706 81.9
Male
Total 1,825,907 1,621,534 88.8 529,012 502,837 95.1 1,296,895 1,118,697 86.3
Kachin 38,126 31,633 83.0 14,864 13,098 88.1 23,262 18,535 79.7
Kayah 7,443 5,151 69.2 2,154 1,940 90.1 5,289 3,211 60.7
Kayin 51,937 33,881 65.2 9,172 8,281 90.3 42,765 25,600 59.9
Chin 16,350 11,871 72.6 3,734 3,236 86.7 12,616 8,635 68.4
Sagaing 193,859 182,281 94.0 32,229 31,216 96.9 161,630 151,065 93.5
Tanintharyi 45,671 41,876 91.7 11,332 10,951 96.6 34,339 30,925 90.1
Bago 191,256 182,456 95.4 44,341 43,104 97.2 146,915 139,352 94.9
Magway 169,188 158,156 93.5 24,075 23,461 97.4 145,113 134,695 92.8
Mandalay 226,169 214,883 95.0 68,506 66,495 97.1 157,663 148,388 94.1
Mon 83,496 69,121 82.8 23,356 21,467 91.9 60,140 47,654 79.2
Rakhine 87,016 76,477 87.9 13,543 12,608 93.1 73,473 63,869 86.9
Yangon 259,293 253,039 97.6 191,806 188,299 98.2 67,487 64,740 95.9
Shan 178,000 96,308 54.1 43,236 33,056 76.5 134,764 63,252 46.9
Ayeyawady 245,544 232,858 94.8 37,699 36,795 97.6 207,845 196,063 94.3
Nay Pyi Taw 32,559 31,543 96.9 8,965 8,830 98.5 23,594 22,713 96.3
Female
Total 2,515,552 1,812,119 72.0 783,343 655,118 83.6 1,732,209 1,157,001 66.8
Kachin 57,753 36,510 63.2 23,106 16,471 71.3 34,647 20,039 57.8
Kayah 9,292 4,254 45.8 2,997 2,141 71.4 6,295 2,113 33.6
Kayin 66,536 30,134 45.3 12,915 9,779 75.7 53,621 20,355 38.0
Chin 19,067 6,350 33.3 4,492 2,283 50.8 14,575 4,067 27.9
Sagaing 287,390 215,726 75.1 49,197 41,521 84.4 238,193 174,205 73.1
Tanintharyi 59,948 48,018 80.1 16,904 14,817 87.7 43,044 33,201 77.1
Bago 267,091 221,024 82.8 68,434 59,827 87.4 198,657 161,197 81.1
Magway 245,466 171,129 69.7 38,787 33,113 85.4 206,679 138,016 66.8
Mandalay 335,977 250,621 74.6 105,702 89,507 84.7 230,275 161,114 70.0
Mon 111,002 72,928 65.7 34,736 27,403 78.9 76,266 45,525 59.7
Rakhine 115,023 69,493 60.4 20,559 15,652 76.1 94,464 53,841 57.0
Yangon 363,466 323,382 89.0 275,277 249,115 90.5 88,189 74,267 84.2
Shan 218,996 68,850 31.4 61,456 32,924 53.6 157,540 35,926 22.8
Ayeyawady 310,510 257,107 82.8 55,397 48,965 88.4 255,113 208,142 81.6
Nay Pyi Taw 48,035 36,593 76.2 13,384 11,600 86.7 34,651 24,993 72.1

Cen
sus
Rep
ort
Vo
lum
e 4
-L –
The
Old
er P
op
ulat
ion
149
App
endi
x 1.
App
endi
x ta
bles
Tab
le 2
5
Per
cent
age
of
po
pul
atio
n ag
ed 6
0 a
nd o
ver
by m
ain
acti
vity
, by
sex,
urb
an a
nd r
ural
are
as, S
tate
/Reg
ion,
20
14 C
ensu
sSt
ate/
Reg
ion/
Are
aB
oth
sex
esM
ale
Fem
ale
Tota
l (N
umb
er)
In t
he la
bo
ur
forc
e (%
)P
ensi
one
r, re
tire
d,
old
er p
erso
n (%
)O
ther
(%)
Tota
l (N
umb
er)
In t
he la
bo
ur
forc
e (%
)P
ensi
one
r, re
tire
d,
old
er p
erso
n (%
)O
ther
(%)
Tota
l (N
umb
er)
In t
he la
bo
ur
forc
e (%
)P
ensi
one
r, re
tire
d,
old
er p
erso
n (%
)O
ther
(%)
Uni
on
4,47
4,40
830
.345
.224
.51,
921,
340
46.8
43.1
10.0
2,55
3,06
817
.846
.835
.4
Kac
hin
102,
612
31.0
47.6
21.3
41,7
3749
.441
.39.
360
,875
18.4
52.0
29.6
Kay
ah17
,179
33.9
45.1
21.0
7,72
048
.043
.78.
39,
459
22.4
46.3
31.3
Kay
in12
2,31
729
.642
.128
.355
,035
45.8
39.3
14.9
67,2
8216
.444
.339
.3
Chi
n35
,796
38.9
41.1
20.0
16,6
1652
.239
.48.
419
,180
27.3
42.6
30.1
Sag
aing
495,
140
30.0
49.5
20.5
203,
362
45.9
46.6
7.4
291,
778
19.0
51.5
29.5
Tani
ntha
ryi
109,
051
31.2
41.0
27.9
48,4
5449
.537
.712
.860
,597
16.6
43.5
39.9
Bag
o47
2,84
729
.143
.227
.720
2,22
148
.240
.811
.027
0,62
614
.845
.040
.2
Mag
way
424,
498
31.7
45.5
22.8
176,
437
47.6
43.9
8.5
248,
061
20.4
46.7
33.0
Man
dal
ay58
0,35
928
.646
.924
.623
9,74
645
.246
.08.
834
0,61
316
.947
.435
.7
Mo
n20
3,48
128
.641
.629
.990
,199
44.7
40.1
15.2
113,
282
15.7
42.7
41.6
Rak
hine
206,
515
32.0
43.5
24.5
90,4
9352
.537
.410
.111
6,02
216
.048
.335
.7
Yang
on
645,
329
21.2
50.3
28.4
274,
143
35.1
53.9
11.0
371,
186
11.0
47.7
41.3
Sha
n40
5,63
138
.745
.016
.418
4,01
951
.840
.47.
722
1,61
227
.748
.723
.6
Aye
yaw
ady
569,
906
35.3
39.2
25.5
256,
417
53.8
35.0
11.2
313,
489
20.1
42.7
37.2
Nay
Pyi
Taw
83,7
4732
.143
.224
.734
,741
48.3
42.1
9.6
49,0
0620
.644
.035
.4

Cen
sus
Rep
ort
Vo
lum
e 4
-L –
The
Old
er P
op
ulat
ion
150
App
endi
x 1.
App
endi
x ta
bles
Stat
e/R
egio
n/A
rea
Bo
th s
exes
Mal
eFe
mal
e
Tota
l (N
umb
er)
In t
he la
bo
ur
forc
e (%
)P
ensi
one
r, re
tire
d,
old
er p
erso
n (%
)O
ther
(%)
Tota
l (N
umb
er)
In t
he la
bo
ur
forc
e (%
)P
ensi
one
r, re
tire
d,
old
er p
erso
n (%
)O
ther
(%)
Tota
l (N
umb
er)
In t
he la
bo
ur
forc
e (%
)P
ensi
one
r, re
tire
d,
old
er p
erso
n (%
)O
ther
(%)
Urb
an1,
364,
589
21.3
51.7
27.0
562,
081
34.1
55.0
11.0
802,
508
12.4
49.4
38.2
Kac
hin
40,4
0726
.051
.222
.816
,119
41.9
47.7
10.4
24,2
8815
.453
.531
.1
Kay
ah5,
356
22.9
52.1
25.0
2,27
435
.555
.59.
13,
082
13.5
49.7
36.8
Kay
in22
,863
23.7
47.2
29.1
9,76
137
.448
.813
.813
,102
13.5
46.1
40.4
Chi
n8,
386
21.6
47.6
30.7
3,82
532
.555
.512
.04,
561
12.5
41.0
46.4
Sag
aing
84,5
7822
.654
.523
.034
,197
35.2
56.1
8.6
50,3
8114
.053
.332
.7
Tani
ntha
ryi
29,4
0624
.346
.029
.612
,161
39.9
45.6
14.5
17,2
4513
.346
.440
.3
Bag
o11
8,04
123
.247
.829
.147
,489
36.6
50.5
13.0
70,5
5214
.146
.039
.9
Mag
way
65,2
6319
.153
.427
.525
,638
29.9
59.0
11.0
39,6
2512
.149
.738
.1
Man
dal
ay18
3,05
921
.053
.026
.074
,156
33.4
56.0
10.6
108,
903
12.5
51.0
36.5
Mo
n60
,808
24.7
45.9
29.4
25,2
0337
.747
.914
.435
,605
15.5
44.5
40.0
Rak
hine
35,2
7723
.448
.228
.314
,319
37.7
48.9
13.4
20,9
5813
.747
.838
.6
Yang
on
482,
216
17.9
53.4
28.7
201,
574
30.2
59.3
10.5
280,
642
9.1
49.2
41.8
Sha
n10
8,20
426
.653
.020
.545
,353
39.2
52.5
8.3
62,8
5117
.553
.329
.3
Aye
yaw
ady
96,8
4524
.948
.726
.440
,133
37.9
49.7
12.4
56,7
1215
.747
.936
.4
Nay
Pyi
Taw
23,8
8022
.249
.828
.09,
879
36.1
53.3
10.6
14,0
0112
.447
.340
.3
Rur
al3,
109,
819
34.2
42.4
23.4
1,35
9,25
952
.138
.29.
71,
750,
560
20.3
45.6
34.1
Kac
hin
62,2
0534
.345
.320
.425
,618
54.2
37.2
8.6
36,5
8720
.451
.028
.6
Kay
ah11
,823
38.9
42.0
19.1
5,44
653
.338
.87.
96,
377
26.7
44.6
28.7
Kay
in99
,454
31.0
40.9
28.1
45,2
7447
.637
.315
.154
,180
17.1
43.9
39.0
Chi
n27
,410
44.2
39.1
16.7
12,7
9158
.134
.67.
314
,619
31.9
43.1
25.0
Sag
aing
410,
562
31.6
48.5
19.9
169,
165
48.1
44.7
7.2
241,
397
20.0
51.1
28.9
Tani
ntha
ryi
79,6
4533
.739
.127
.236
,293
52.7
35.1
12.2
43,3
5217
.842
.439
.8
Bag
o35
4,80
631
.041
.727
.315
4,73
251
.737
.810
.520
0,07
415
.144
.740
.3
Mag
way
359,
235
33.9
44.1
22.0
150,
799
50.6
41.3
8.1
208,
436
21.9
46.1
32.0
Man
dal
ay39
7,30
032
.144
.023
.916
5,59
050
.541
.68.
023
1,71
018
.945
.835
.3
Mo
n14
2,67
330
.239
.730
.164
,996
47.4
37.1
15.5
77,6
7715
.841
.942
.3
Rak
hine
171,
238
33.7
42.5
23.7
76,1
7455
.335
.29.
595
,064
16.5
48.4
35.1
Yang
on
163,
113
31.2
41.2
27.6
72,5
6948
.838
.912
.290
,544
17.0
43.1
39.9
Sha
n29
7,42
743
.142
.014
.913
8,66
656
.036
.57.
615
8,76
131
.846
.921
.3
Aye
yaw
ady
473,
061
37.4
37.3
25.3
216,
284
56.8
32.2
11.0
256,
777
21.1
41.5
37.4
Nay
Pyi
Taw
59,8
6736
.040
.623
.424
,862
53.2
37.6
9.2
35,0
0523
.842
.733
.5
Tabl
e 25
(co
ntin
ued)
Per
cent
age
of p
opul
atio
n ag
ed 6
0 a
nd o
ver
by m
ain
acti
vity
, by
sex,
urb
an a
nd r
ural
are
as, S
tate
/Reg
ion,
20
14 C
ensu
s

Census Report Volume 4-L – The Older Population 151
List of contributorsContributors to The Older Population thematic report
Name Institution Role
Government Coordination
U Myint Kyaing Permanent Secretary, Ministry of Labour, Immigration and Population
Overall administration and coordination
U Nyi Nyi Deputy Director General, Department of Population (DoP)
Administration, coordination and quality control
Daw Khaing Khaing Soe Director, DoP Administration, coordination and quality control
UNFPA Coordination
Janet E Jackson Country Representative Overall administration and coordination
Fredrick Okwayo Chief Technical Advisor (former) Administration, coordination and quality assurance
Mercedita Tia Chief Technical Advisor Administration, coordination and quality assurance
Daniel Msonda Programme Specialist, Census Administration and coordination
Thet Thet U Programme Assistant Administration and logistics
Thida Aye Maung Programme Assistant Administration and logistics
Tun Tun Win Project Assistant Administration and logistics
Authors
Kone Aratchige Siddhisena UNFPA Consultant Lead Author
Ann Larson UNFPA Consultant Lead Author
Daw Khaing Khaing Soe Director, DoP Assisting Author
Daw Myo Thandar Staff Officer, DoP Trainee and Assisting Author
Daw Tin Tin Lay Assistant Immigration Officer, DoP Trainee and Assisting Author
Daw Wai Wai Hlaing Zin Assistant Immigration Officer, DoP Trainee and Assisting Author
Daw Hnin Hnin Wai Immigration Assistant, DoP Trainee and Assisting Author
Reviewers and Editors
Rabbi Royan UNFPA Consultant Peer review
HelpAge International Peer review
Paul Koural Peer review
Ghazy Mujahid UNFPA Consultant Peer review
Esther Bayliss UNFPA Consultant Review, editing and proofreading
Ian Stuart White UNFPA Consultant Review and editing
Daniel Msonda Programme Specialist, Census Review, editing and proofreading
U Nyi Nyi Deputy Director General, DoP Review, editing and proofreading
Daw Khaing Khaing Soe Director, DoP Review, editing and proofreading
Data Processing and IT Team
Arij Dekker UNFPA Data Processing Consultant Data editing and programming
Daw Khaing Khaing Soe Director, DoP Programming and generation of tables
Daw Sandar Myint Deputy Director, DoP Programming and generation of tables
Daw May Myint Bo Staff Officer, DoP Generation of tables
Daw Lin Lin Mar Staff Officer, DoP Generation of maps
Daw Su Myat Oo Immigration Assistant, DoP Generation of tables
U Thant Zin Oo Assistant Computer Operator, DoP Generation of maps
U Wai Phyo Win UNFPA Census IT Manager Information technology services
Designer
Karlien Truyens UNFPA Consultant Graphic designer


Thematic Report on The Older Population can be downloaded at:
www.dop.gov.mm
or
http://myanmar.unfpa.org/census