Trends in Assistance with Daily Activities: Racial/Ethnic and Socioeconomic Disparities Persist in...
33
-
Upload
johnshopkins -
Category
Documents
-
view
0 -
download
0
Transcript of Trends in Assistance with Daily Activities: Racial/Ethnic and Socioeconomic Disparities Persist in...


Trends in Assistance with Daily Activities:
Racial/Ethnic and Socioeconomic Disparities Persist in the
U.S. Older Population
Vicki A. Freedman, Ph.D., University of Medicine and Dentistry of New Jersey
Linda G. Martin, Ph.D., Institute of Medicine
Jennifer Cornman, Ph.D., Polisher Research Institute
Emily M. Agree, Ph.D., Johns Hopkins University
Robert F. Schoeni, Ph.D., University of Michigan
TRENDS Working Paper 05-2
Presented at the annual meeting of the Population Association of America, Philadelphia PA, March 31-April 2, 2005. An earlier version of this paper was presented at the Disability Group Meeting, National Bureau of Economic Research, Jackson Hole, WY, {PRIVATE }October 8-11, 2004, and at the annual meeting of the Gerontological Society of America, Washington, DC, November 20-22, 2004. We gratefully acknowledge support for this paper provided by the National Institute on Aging (R01 AG021516), the Albert and Mary Lasker Foundation, and the National Bureau of Economic Research. This study was conducted while Dr. Freedman was at Polisher Research Institute. Corresponding author: Vicki A. Freedman, Ph.D., Department of Health Systems and Policy, UMDNJ-School of Public Health, 335 George Street, Suite 2200, New Brunswick, NJ 08903; [email protected].

TRENDS Working Paper 05-02 2
ABSTRACT
Assistive technology has become increasingly important in facilitating independence among older Americans. It remains unclear, however, whether this trend has been experienced broadly. Using the 1992 to 2001 Medicare Current Beneficiary Survey, we provide evidence that among older people who have difficulty with daily activities, there were substantial increases in the independent use of assistive technology (without help from another person). Controlling for shifts in the composition of the older population reporting difficulty with daily activities, the independent use of assistive technology increased on average 4% to 5% per year, amounting to a 6 percentage point increase over the entire period. These increases were accompanied by declines in the use of any help and in unassisted difficulty, with larger declines in the latter. Substantial differentials in assistance—which favor the more highly educated in the case of technology and favor minorities in the case of help—persisted over this period. All else equal, 5-percentage point gaps were evident between more and less advantaged education groups with respect to the independent use of assistive technology for walking. Gaps in the independent use of assistive technology to bathe were even larger, amounting to 7 to 8 percentage points in 2001 by education and race. We discuss the implications of findings for the study of late-life disability trends and disparities therein.

TRENDS Working Paper 05-02 3
INTRODUCTION
Promoting independence through increased use of assistive technology has been a goal of federal programs and policies, beginning with the passage of the Americans with Disabilities Act over a decade ago, and continuing with the 1998 Assistive Technology Act, and President Bush’s “New Freedom Initiative.” These policies specifically target the removal of environmental barriers and increased access to assistive and universally designed technologies of people of all ages and abilities. Indeed, assistive technology (AT) is playing an increasingly important role in facilitating independence among older Americans (Pew et al., 2004), particularly those at risk for long-term care, and a growing number of studies suggest devices have a unique role in improving functioning and quality of life even at later ages (Agree and Freedman, 2003; Taylor and Hoenig, 2004; Verbrugge et al., 1997). Current estimates suggest that approximately 14 to 18 percent of the U.S. population age 65 or older uses assistive devices—most often devices for mobility (canes, walkers) and bathing (grab bars, bath seats, railings) (Cornman, Freedman, and Agree, in press). Among older people reporting difficulty with daily personal care activities, nearly two-thirds report using a device to meet their needs (Agree and Freedman, 2000)—and about one third do so but do not receive any help from another person (Agree et al. 2004).
As first reported by Manton and colleagues a decade ago (Manton et al., 1993), shifts have been occurring in the forms of assistance to cope with disability in late life. In that study, between 1982 and 1989, equipment use increased for older persons with mild chronic impairment and for older people with severe chronic disability as a supplement to personal assistance. During the same time period, reliance on personal care without any supplemental equipment declined. The trend toward using equipment as a sole form of assistance with daily activities has continued through the 1990s (Freedman, Martin, Agree, et al. 2004; Spillman, 2004). In particular, the literature has drawn attention to large increases in assistive technology for two common tasks—mobility and bathing. Russell and colleagues (1997) report increases of over 19 percentage points in the use of mobility equipment among adults from 1980 to 1994 and a recent consensus report demonstrated agreement in two out of three national surveys that notable increases have occurred in the use of equipment without help for bathing (Freedman, Crimmins, Schoeni et al., 2004). Reliance on such devices is likely to rise further as the number and types of devices available increase. In the last twenty years alone, the number of assistive devices has expanded from 6,000 products to over 29,000 (NIDDR, 2004; U.S. Congress Office of Technology Assessment, 1985).
Despite these trends, the continuing debate on disparities in health care utilization (e.g., AHRQ, 2003) has not yet explicitly recognized assistive technology as a type of care with which to be concerned, and the literature on racial and socioeconomic disparities in forms of assistance remains small, with mixed results. Hence, it remains unclear whether types of assistance among those with difficulty in their daily tasks vary by race/ethnicity and socioeconomic status and whether the aforementioned trends have been experienced broadly, or only by some segments of the older population. Likewise, it remains equally unclear whether the shifts in assistance are similar for less and more advantaged groups and if not, whether differences can be explained by the changing demographic and socioeconomic composition of the older population.
TRENDS Working Paper 05-02 4
The purpose of this paper is to explore for the older U.S. population trends in forms of assistance with daily activities, disparities in forms of assistance by race/ethnicity and socioeconomic status, and whether those gaps have changed in recent years. We also explore whether differential patterns between more and less advantaged groups can be explained by recent shifts in the composition of the older population. To the extent that we can identify reasons for and disparities in these phenomena, such analyses may provide insights into explanations for recent declines in late-life disability.
BACKGROUND AND FRAMEWORK
Disability and Forms of Assistance
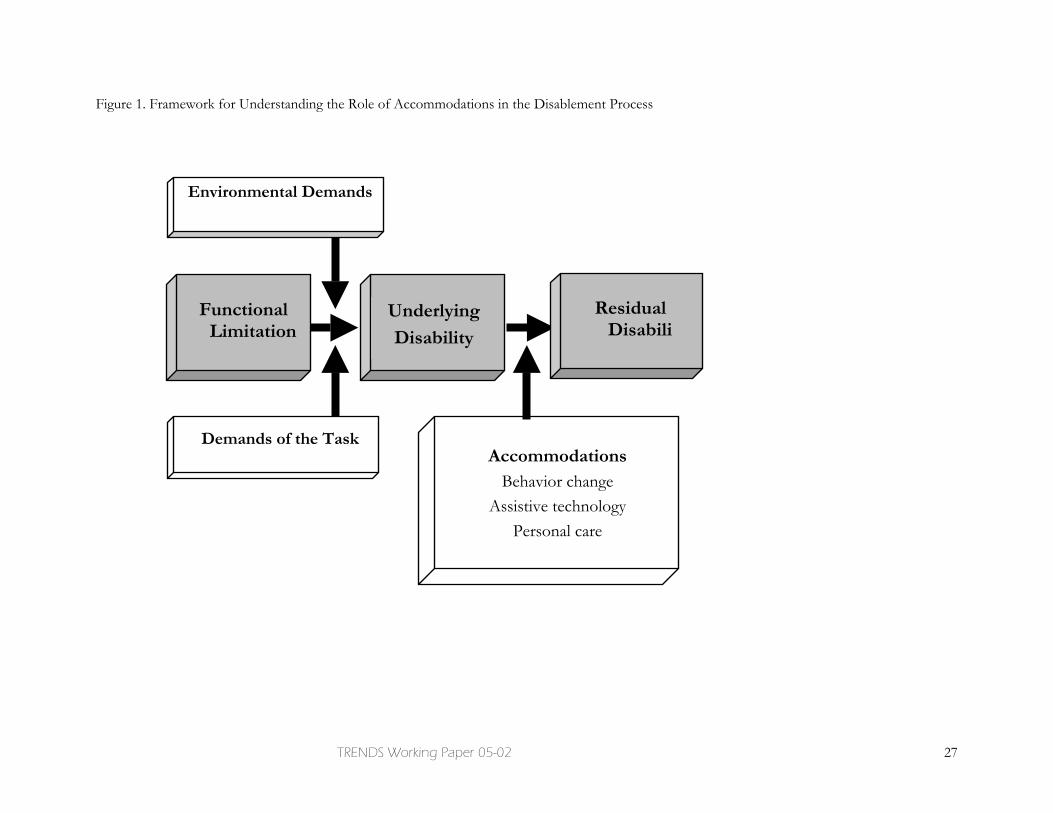
As shown in Figure 1, disability is defined at the intersection of an individual’s underlying functional capacity, his or her physical and social environment, and the demands of a given task. Although disability measurement among younger age groups typically focuses on the relevance of work and other aspects of societal participation, most often late-life disability is discussed in terms of the ability to carry out routine tasks necessary to live independently such as shopping, cooking, and cleaning (instrumental activities of daily living [IADLs]) and personal care tasks such as bathing and walking (activities of daily living [ADLs]). Personal care disability is associated with formidable costs, particularly when an individual requires daily assistance for an ongoing, chronic condition. Figure 1 also emphasizes the important distinction between disability in the absence of accommodations (that is, underlying disability, generally measured as difficulty without help or equipment) and residual disability (that is, the level of difficulty with help or equipment if used) (Verbrugge, 1990).
Accommodations to age-related changes in functional capacity take various forms. For example, older individuals may change their behaviors by doing a task less frequently or in a different way (e.g., walking across the room by holding onto furniture, see Fried et al., 2000, 2001). Accommodations may also consist of two distinct types of assistance: the use of help from another person, whether paid or unpaid, and technological assistance designed to facilitate a specific task or set of tasks (Agree, 1999).1 Although not explicitly shown in the figure, changes in behavior may change the nature of the task at hand, whereas assistive technologies either extend an individual’s functional capacity or, if in the form of environmental modifications, reduce environmental demands.
Although we recognize that the use of personal care and technological assistance in combination may confer benefits beyond those conveyed by either in isolation, three conceptually distinct groups are germane for our purposes—those who carry out tasks with
1 Technology can contribute to the quality of older persons’ lives in many ways—for example, through new diagnostic and therapeutic devices or through new information technologies that facilitate telemedicine and tele-rehabilitation services. Other common household and convenience technologies may not be specifically intended to address disabilities (e.g., microwaves, portable phones, direct deposit) but may be used to compensate for a functional need. To the extent that these technologies may have contributed to recent declines in late-life disability (see Spillman, 2004 for discussion of this point) they are of interest; however, measuring their contribution is difficult with currently available data. In this article we therefore concern ourselves with a narrower class of technologies sometimes referred to as assistive technologies that are used to increase, maintain, or improve the functional capabilities of individuals for specific tasks.
TRENDS Working Paper 05-02 5
help from another person, those who use only technology in the performance of a task (i.e., use only assistive technology to carry out a task independently), and those who report difficulty but use neither assistive technology nor human assistance in the performance of the task. The latter group is likely heterogeneous in that it consists of individuals with mild difficulty who do not need assistance as well as those who need assistance but do not use any (i.e., those with “unmet” needs).
The experience of disability and forms of assistance used to cope with functional declines differ by task (Agree and Freedman, 2000). Mobility is unique in the sense that it is a central component of many other activities. Consequently, mobility demands are idiosyncratic in timing and length, involving short distances (across a room) or longer ones (walking to the bathroom, or going down stairs, or outside). The ability to walk even short distances involves multiple body systems (including lower body strength, balance, visual acuity, and respiratory, cardiovascular, and cognitive functioning). Because mobility takes place in public as well as private spaces, social stigma may be important in influencing the choice of accommodation for different locations. In addition, environmental barriers such as stairs, inclines, slippery floors, or inadequate lighting may impede the use of certain types of assistance. Assistive devices most often used to bridge difficulty with walking are common and include relatively inexpensive canes and walkers, and more expensive wheelchairs, scooters, and home modifications such as ramps, railings, and widened halls and doorways to accommodate wheelchairs.
In contrast, a discrete activity such as bathing can be scheduled at regular intervals, and generally involves one location. The level of physical and cognitive skill required to bathe independently may depend in part on the environment. For example, bathing in a traditional tub (with no environmental modifications) may require climbing over the side, and lowering oneself into the bath whereas using a typical shower (with no equipment or modifications) requires standing and balancing. Most of the technologies designed to facilitate bathing involve a change to the physical environment and include relatively inexpensive tub and shower chairs (for sitting while bathing), grab bars that provide security in the tub or shower, transfer benches (placed in a tub to ease entering and exiting the tub) and relatively more expensive installation of walk-in showers with accessible features or automatic bathtub lifts that facilitate transferring. In contrast to walking, concerns about privacy may be more salient than social stigma in choosing forms of assistance for bathing.
Disparities by Racial/ethnic and Socioeconomic Status
Each of the components of disability–underlying function, the physical environment, and the nature of the task—will vary across individuals and can be influenced by race/ethnicity and socioeconomic status. With respect to functioning, previous research has shown that functional limitations tend to be more prevalent among older Hispanics and blacks than older whites, those with fewer years of education, and those with lower incomes (Freedman and Martin, 1998; Mendes de Leon et al., 1995; Schoeni et al., 2002; Stump et al., 1997) and that many chronic conditions are more prevalent for minorities and those of lower socioeconomic status (Kington and Smith, 1997). Less advantaged groups often live in poorer quality older housing and face more environmental barriers (Gitlin et al., 2001; Tomita et al., 1997; Newman, 2003). At the same time, socio-economically advantaged groups are more likely to live in homes with features that facilitate aging in place (e.g., retirement communities built with wide hallways, railings, and accessible bathrooms).

TRENDS Working Paper 05-02 6
Finally, the nature of daily tasks also may vary by socioeconomic status. For example, it may be that more advantaged groups have access to resources that enable them to accomplish tasks more efficiently, such as using private transportation to get to and from places outside the home.
In addition, the relative out-of-pocket costs of assistance are likely to vary in part by socioeconomic status. The out-of-pocket costs faced by an older individual will vary depending on the nature and forms of assistance for a given task. In addition, costs will vary depending on the availability and opportunity costs of informal caregivers and on insurance coverage for personal care and equipment, both of which in turn are linked to socioeconomic status.
Public insurance does not systematically cover assistive technology. Medicare, the primary health insurance program for people ages 65 and older, covers personal care assistance only for individuals who cannot leave the home and who also require skilled nursing care. Coverage for durable medical equipment is limited to medically necessary, reusable medical items that are ordered by a physician for use in the home. For example, Medicare generally covers medically necessary walkers and wheelchairs used in the home, but the program does not generally cover stair glides, tub rails, or wheelchair ramps. Medicaid, the insurance program for poor elderly, blind, and disabled individuals, has a home health benefit similar to Medicare’s, which covers nursing, home health aides, and medical equipment suitable for use in the home. In addition, over half the states have a personal care benefit and almost all states now have a home and community-based waiver program (LeBlanc et al. 2001), the latter of which may be designed to cover assistive technologies and home modifications. Cash and counseling demonstration programs, which currently provide a cash benefit to Medicaid recipients in 3 states, may also be used to purchase personal care related goods and services, including assistive technology and home modifications.
Given these complexities, it is not surprising that findings about cross-sectional relationships between socioeconomic status and forms of assistance have been mixed. For example, with respect to race, two studies (Agree et al., 2004; Verbrugge and Sevak, 2002) have found that non-whites are more likely than whites to use assistive technology without help compared to using neither form of assistance. And Agree and colleagues (2004) also find minorities and persons of Hispanic origin are more likely than others to combine equipment and informal care. Other studies, however, have found that minorities are less likely to use equipment (Hartke et al., 1998; Tomita et al., 1997) or that there are no significant racial differences (Norburn et al., 1995). With respect to education, higher levels of education are associated with increased odds of using equipment and/or personal care (Agree et al., 2004; Burton et al., 1995; Hartke et al., 1998) and with substituting assistive technology for hours of informal care (Agree et al., in press). Other studies, however, either find a negative relationship between education and informal care (Kemper, 1992) or fail to find any relationship between education and the use of assistive technology (Agree, 1999; Norburn et al., 1995; Verbrugge and Sevak, 2002; Zimmer and Chappell, 1994). Several studies have examined aspects of economic status, including percent of poverty in categories, above/below median income, family income and assets, household income, sources of income in addition to Social Security, and subjective measures of economic resources (Agree et al., 2004; Hartke et al., 1998; Mathieson et al., 2002; Norburn et al., 1995; and Verbrugge and Sevak, 2002). Results from these studies have been mixed, with most studies showing no income effects, one showing non-linear effects of percent of

TRENDS Working Paper 05-02 7
poverty on the use of mobility devices (Norburn et al., 1995) and another showing income in addition to Social Security increases the chances of using 1, 2, or 3 mobility devices but the amount of household income inversely related to the chances of using three or more devices (Mathieson et al., 2002).
There is reason to hypothesize that the relationship between race/ethnicity and socioeconomic status and forms of assistance may be shifting over time, with more advantaged groups benefiting disproportionately from newer technologies. First, although disparities in disability are not well-studied (Freedman et al., 2002), recent evidence (Schoeni et al., 2004) suggests that the risk of needing help with daily activities may be shifting differentially for more and less advantaged groups. To the extent that more advantaged groups are experiencing milder difficulties, they may be more readily able to use assistive devices. In addition, newer technologies may be more expensive relative to older ones, may require learning new ways of performing routine tasks, and may involve adherence to complex instructions. At the same time, newer technologies are not routinely covered by existing and widely held insurance, and those that are may require navigation of the increasingly complex health care system. In addition, the expansion of retirement communities, which often come equipped with environmental features, may disproportionately favor seniors of higher socioeconomic status. Yet studies to date are based on data that are often at least a decade old and none have attempted to trace changes over time in types of assistance for various racial and socioeconomic groups.
In this paper we explore trends in forms of assistance with daily tasks, disparities by racial and socioeconomic status, and whether those gaps have changed over time. Building on Agree and colleagues (2004), we integrate our analysis of predictors of assistance into a cohesive framework with three distinct, non-overlapping outcomes: use of only assistive technology, any help (with or without assistive technology), and neither form of assistance. In doing so, we focus on individuals reporting difficulty with any ADL, and also investigate these trends for two activities for which assistive technology is commonly used, mobility and bathing. Unlike previous studies, we explicitly test for differences by race/ethnicity, education, and income groups as distinct categories of disadvantage and explore changes in these gaps over time.
DATA AND METHODS
Data and Analytic Samples
The analysis is based on data from the 1992 to 2001 Medicare Current Beneficiary Survey (MCBS). Conducted annually, the MCBS is a continuous survey of a representative national sample drawn from Center for Medicare and Medicaid Service's Medicare enrollment file. The MCBS sample is selected by systematic random sampling with different sampling rates by age (0-44, 45-64, 65-69,70-74, 75-79, 80-84, and 85 or over) to over-represent persons with disability who are under 65 years of age and people who are 85 or older. Newly eligible beneficiaries are added to the sample once a year. Interviews are conducted wherever respondents reside, including long-term care facilities. We focus on the U.S. population ages 65 or older living in the community from 1992 to 2001.2
2We excluded 1,970 respondents living in Puerto Rico (80 percent of whom identify themselves as Hispanic), 56 cases missing both race and Hispanic origin, and 61 cases missing marital status.

TRENDS Working Paper 05-02 8
In each year, respondents were asked whether because of a health or physical problem they “have difficulty by themselves and without special equipment” with each of the following activities of daily living: bathing, dressing, eating, transferring, walking, and toileting. Community-dwelling respondents reporting difficulty with or not doing an activity for health reasons were asked whether they received help (hands on or standby) doing that activity and whether they used special equipment or aids to do that activity. To focus our analysis on the older population at risk for using assistance, we restricted our analytic samples to those reporting difficulty with any ADL (N= 38,603), walking (N=32,737), and bathing (N=16,648).
Variables
We examined disparities in the use of assistance by three dimensions of socioeconomic status (SES): race/ethnicity, education, and income quartiles. For race/ethnicity, we contrasted non-Hispanic whites and all other races or ethnicities. Education was classified into three categories: 0-8 years, 9-12 years (including high school graduates), and more than 12 years. Changes across survey years in the response categories for education did not permit more detailed specification. For 909 cases (0.7% of the sample 65 and older) that were missing education, we assigned the modal education category by six age-sex groups (females and males age 65-74, 75-84 and 85 and over).
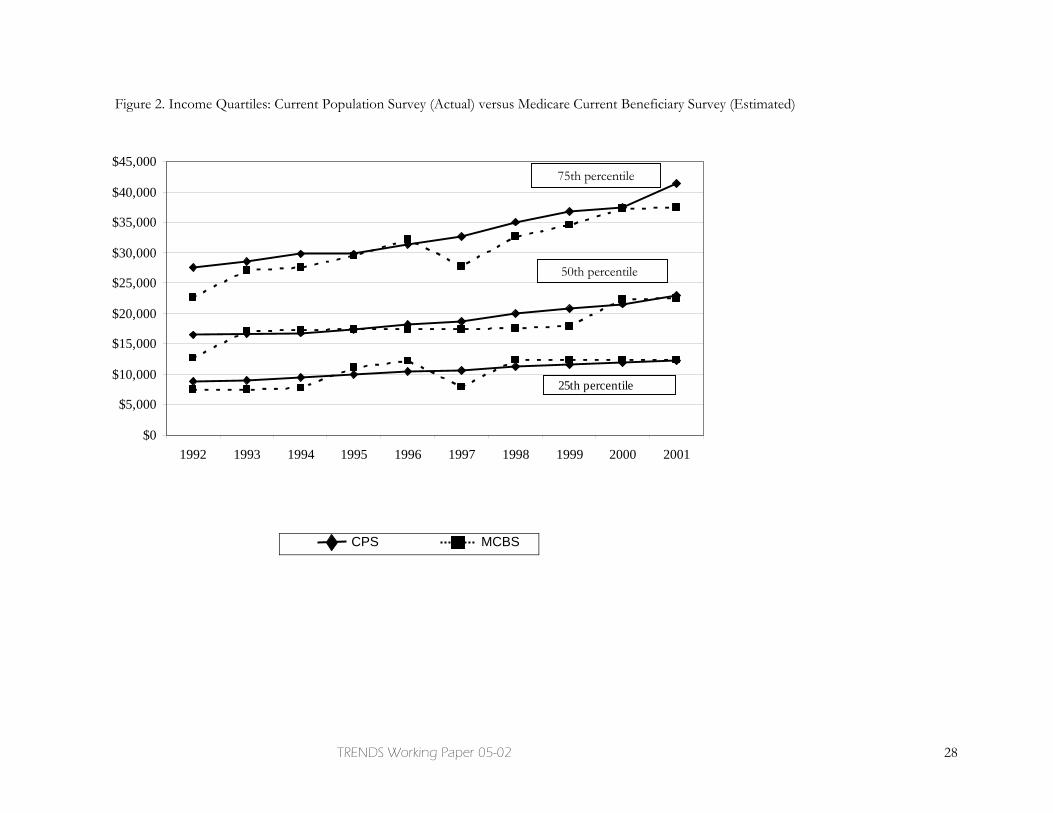
For our analysis of income differentials and trends, we created a relative rather than absolute measure of income reflecting quartiles. In the MCBS for 1992 to 2001, couple income (and for unmarried respondents, respondent income) was collected in 14 categories, including a group for missing (n = 4,240 or 3.4% of the sample ages 65 and older). To create quartiles, we implemented a three-step procedure. First, for each year 1992 to 2001, we used data from the 65 and older population from the March Current Population Survey (CPS), which is the U.S. Census Bureau’s source for official estimates of income and poverty, to estimate couple income as a continuous function of socio-demographic variables (age, sex, marital status, education, race/ethnicity, region) and the MCBS couple income categories. Second, we used the CPS-based coefficients from this model to estimate an exact couple income within category for each MCBS respondent. 3 Finally, we grouped individuals in the MCBS into income quartiles based on the weighted distribution of the estimated income measure, with quartiles created separately for each year. We evaluated the procedure by comparing the March CPS and estimated MCBS income distributions and trends for the 65 and older population and found they were substantially similar (see Figure 2).
In multivariate models we controlled for several additional demographic variables previously demonstrated to be related to forms of assistance in this population, including age, sex, marital status, and region. To control for changes over time in underlying functioning, we created a scale reflecting severity of functional limitations. We summed the level of difficulty ranging from 0 (no difficulty) to 4 (unable to do) for three tasks: lifting, reaching and stooping. The scale ranged from 0-12, with a mean of 5.9 among those
3 For a small number of cases the imputation procedure estimated an income that was out of range. Imputed income for 31 cases missing on income was less than 0. These values were recoded to 0. For 14 cases that provided an original response of “$25,000 or more,” imputed income was less than $25,000 and these values were recoded to $25,000.

TRENDS Working Paper 05-02 9
reporting difficulty with one or more ADL, and Cronbach’s alpha equal to 0.75.4 Finally, to control for potentially greater access to formal personal care, we included an indicator of Medicaid participation for at least part of the year.
Methods
We first plotted unadjusted trends in the use of any help, only assistive technology, and neither for each outcome (any ADL, walking, and bathing) stratified by socioeconomic status. We tested for trends over time and differences in trends by socioeconomic status using logistic regression models with linear terms for year, with standard errors adjusted for the complex design of the MCBS.5 Departures in the trend from linearity were explored but found not to be consistently significant so they were not incorporated into multivariate models.
We then fit multinomial logistic regression models predicting the use of any help, only the use of assistive technology, and neither, again adjusting standard errors for sample design.6 We included in these models a linear trend variable that took the value of 1 in 1992 and increased by 1 in each subsequent year, with maximum value of 10 in 2001. Initially, we fit models including year, race/ethnicity, education, income quartiles, and the control variables as previously discussed. To this main effects model we added an interaction between each of the race/ethnicity and socioeconomic indicators and year (one set at a time). We coded these interactions so that we could directly test relative trends separately for each racial/ethnic and socioeconomic group. We then reparameterized the model to test for changes over time in racial/ethnic and socioeconomic differentials (using an adjusted Wald statistic for nested multinomial logit models, adjusted for sample design).
To facilitate the interpretation of the various contrasts from the multinomial logit models, we calculated for each year the predicted probabilities of using each type of assistance by race/ethnicity and socioeconomic status. We calculated the probabilities of each outcome, varying characteristics of interest across the whole data set and averaging the predictions. In doing so, we held all other characteristics constant at the levels observed in the data set.7 The resulting trends and disparities may be interpreted as changes or gaps for a particular socioeconomic group and activity, net of all other characteristics shown in Table 1.
4 The MCBS also asked about difficulty with two other tasks: walking 2-3 blocks and writing. These items were explored but eventually omitted from the scale. We omitted the writing item because it did not correlate with the other items in the scale. We omitted the item about walking 2-3 blocks because the question did not explicitly refer to the level of difficulty without special equipment and we were concerned the item might be endogenous to the use of assistance, particularly for walking. 5 OLS regression models were also estimated and in general showed similar patterns but produced statistically significant results in more cases for the more advantaged groups. 6 Standard error adjustments do not take into account the additional gain in precision from overlapping samples and are thus conservative. For one model, standard error adjustments necessitated that 7 cases be deleted because they were in primary sampling units (PSU) that were single PSUs within a stratum. 7 For more details on this methodology, known as “the method of recycled predictions,” see StataCorp (1997 p. 548).
TRENDS Working Paper 05-02 10
RESULTS
Racial/ethnic and Socioeconomic Composition of the Older Population Reporting Difficulty with Daily Tasks
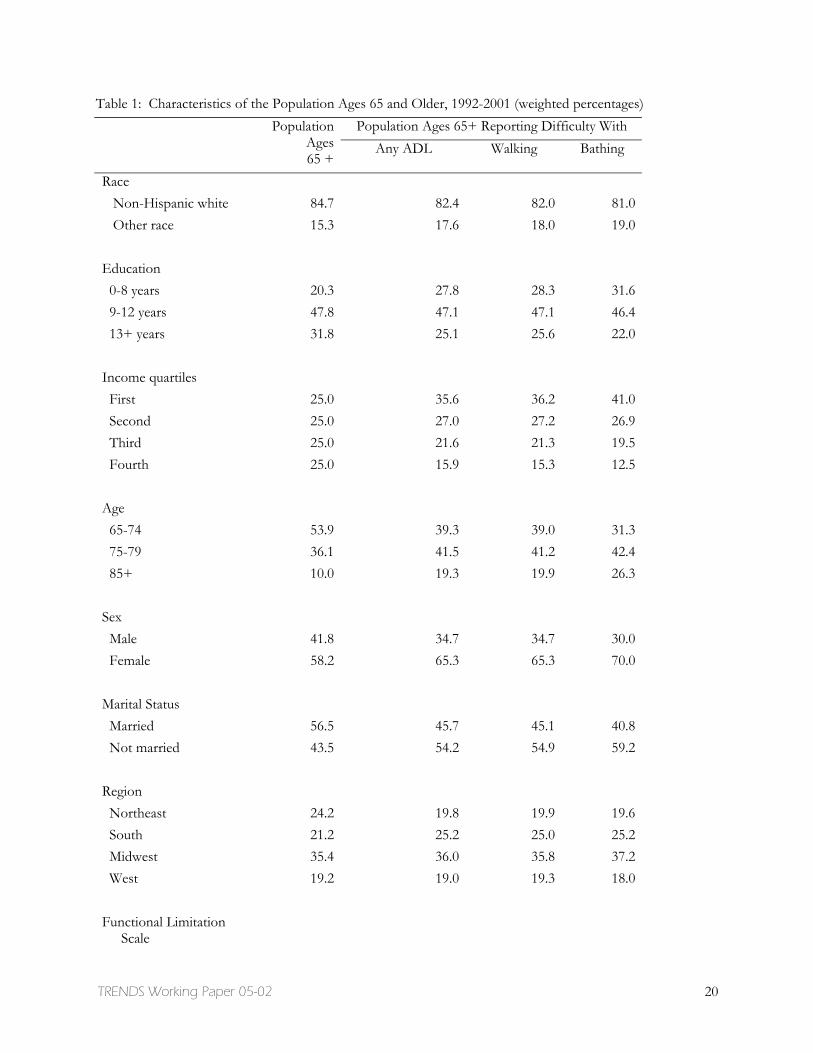
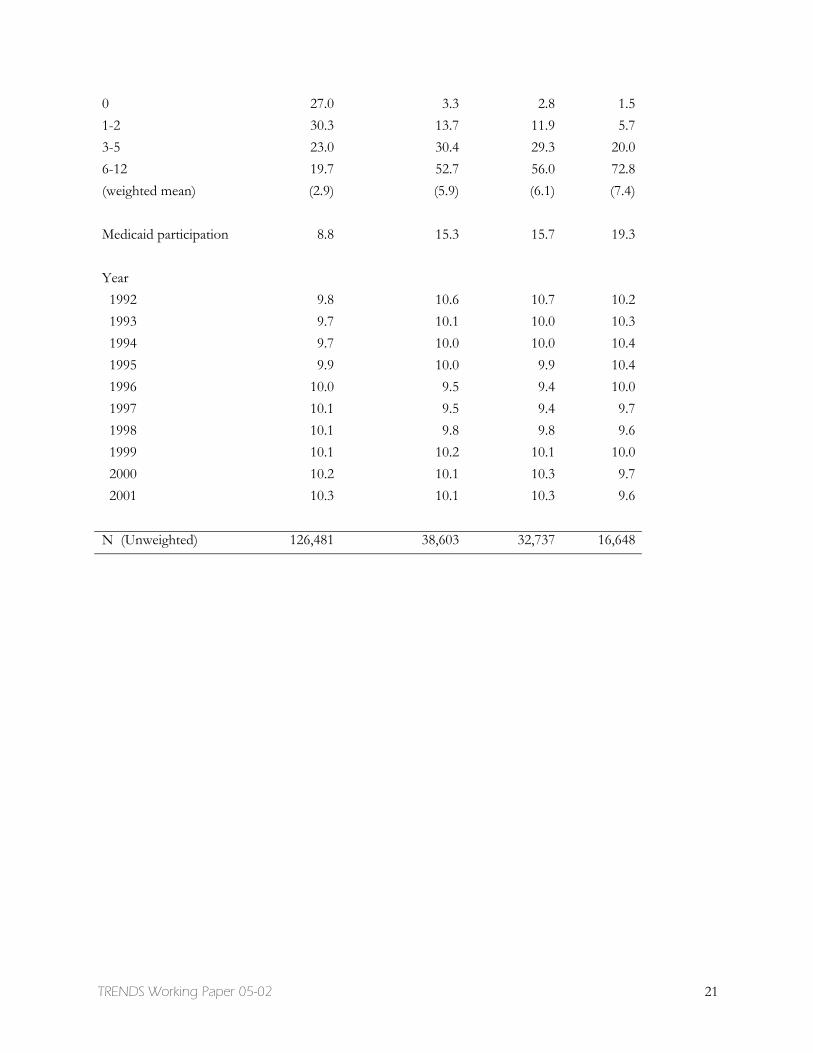
Distributions for each of the racial/ethnic and socioeconomic indictors and other control variables used in the analysis are shown in Table 1 for each of the three analytic samples, averaged over the 10 years of observation. Compared to the entire population age 65 or older, the populations reporting difficulty with any ADL, walking, and bathing over-represent socioeconomically disadvantaged individuals (with roughly 30 percent reporting 0-8 years of education and 35 to 40 percent falling into the lowest income quartile). The populations reporting difficulty are also substantially older, report more functional limitations, and over-represent women, unmarried individuals, those living in the South, and Medicaid beneficiaries.
Mirroring increases in educational attainment among the 65 and older population, over time the populations reporting difficulty have experienced substantial declines in the percentage with 8 or fewer completed years of education and increases in the percentage who have completed 13 or more years (see Table 2). Yet, even in 2001, those reporting difficulty with daily activities reported lower levels of educational attainment compared to the entire population ages 65 and older. For instance, 28 percent of those with any ADL difficulty had completed 8 or fewer years of education compared to only 15 percent of the entire population ages 65 and older. Income distributions also shifted during this time period, notably toward lower quartiles for those with difficulty bathing, although distributions at the beginning and end of the period were substantially similar among those reporting difficulty with any ADL and with walking.8
Unadjusted Trends in Assistance and Disparities by Socioeconomic Status
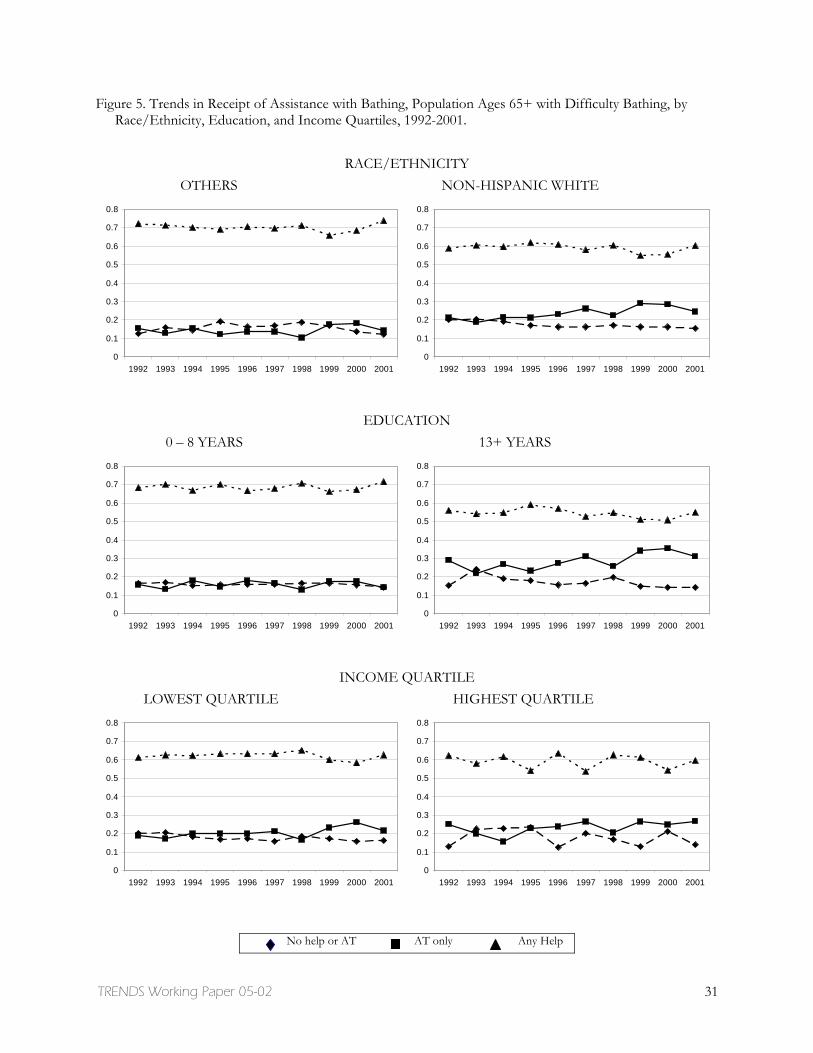
Figures 3-5 show the unadjusted trends in assistance among those who reported difficulty with any of the six ADLs, walking, and bathing. Three observations are noteworthy with respect to trends. First, the independent use of assistive technology (indicated “AT only”) has increased significantly over the period for select groups—non-Hispanic whites, those with 13 or more years of education, and those in the lowest income quartile.9 Second, where significant increases in the use of only assistive technology have occurred, they have in some cases been accompanied by declines in unassisted difficulty (indicated “no help or
8 We also explored whether the chances of reporting difficulty with daily activities, which has been previously reported to have declined between 1992 and 2001 for the older population (Freedman, Crimmins, Schoeni et al. 2004), declined differentially by race/ethnicity and socioeconomic status. We found no differentials by race and education, however, there appeared to be important differences by income. The two lowest quartiles demonstrated statistically significant declines in difficulty with any ADL over the ten-year period, whereas the upper quartiles did not. In logistic regression models in which we controlled for demographic and socioeconomic characteristics, we found evidence for smaller declines in the highest quartile compared to the lowest quartile (0.15 percent per year versus 2.3 percent per year). Hence, some narrowing of the differential in difficulty by income over the ten-year period occurred. 9Tests based on an OLS specification suggest that the use of AT only for any ADL and for walking also increased significantly among the highest income quartile.

TRENDS Working Paper 05-02 11
AT”) and in other cases been accompanied by declines in help from another person (designated by “any help”). For non-Hispanic whites and the lowest income quartile, assistive technology appears to have offset declines in unassisted difficulty (“no help or AT”). In contrast, those who have completed more than a high school education have become significantly more likely to use only assistive technology and significantly less likely to use any help.
A third observation relates to disparities in assistance by racial/ethnic and socioeconomic status. Less advantaged groups consistently report higher rates of help than more advantaged groups and more advantaged groups consistently report higher rates of unassisted difficulty. This general pattern holds true for all three activity outcomes, although help differentials by income are less pronounced among those reporting difficulty walking and bathing. Gaps in the use of assistive technology for any ADL and walking are in the 4 to 7 percentage point range for the two racial groups and highest versus lowest education groups. In contrast, gaps for bathing equipment are much larger; non-white Hispanic whites and those with higher education levels have a 10 and 17 percentage point advantage, respectively, in 2001.
These descriptive figures do not control for differences across racial/ethnic and socioeconomic groups in other factors related to the type of assistance used (such as age, sex, or functional status), nor do they adjust for compositional shifts that have occurred over time. It may be, for example, that assistive technology is increasing in part because of changes in the severity of underlying functional limitations, or that help is declining because of shifts in marital status. Gaps by race/ethnicity and socioeconomic status might not be linked to these characteristics directly, but may be influenced by other demographic differences across groups. To explore whether gaps have changed over time, net of shifts in other demographic factors, we turn to a series of multinomial logit models.
Trends and Disparities Adjusted for Compositional Shifts
Table 3 presents the relative risk ratios predicting assistance among those with difficulty with any of six ADLs, walking, or bathing. The predictors of assistance with any ADL and walking tend to be similar, whereas those for bathing differ in some important aspects, particularly with respect to income effects.
Trends in assistance. For all three activity outcomes, among those reporting difficulty there is no trend in the chances of getting any help (relative to using neither help nor AT). In contrast, the chances of using assistive technology (relative to using neither) has steadily increased among those reporting difficulty with any ADL (nearly 4% per year), walking (nearly 4% per year), and bathing (over 5% per year). Significant declines in the chances of using neither type of assistance (relative to using only AT) also occurred (not shown).
Disparities in assistance by socioeconomic status. Significant disparities in assistance are evident by racial/ethnic and socioeconomic status. For all three activity outcomes, non-Hispanic whites have consistently lower risk of using any (vs. neither) and for bathing this group has a significantly higher risk (35% higher than minorities) of using only assistive technology. Having completed more than a high school education is associated with an increased risk of using only assistive technology among those reporting difficulty with any ADL (19% higher than those with 8 or fewer years), walking (15% higher) and bathing (46% higher). Differentials with respect to income quartiles are more complex and somewhat counterintuitive, with the highest quartile having lower chances than those in the lowest
TRENDS Working Paper 05-02 12
quartile of using only AT for walking (vs nothing). And among those with difficulty bathing, income has an inverse u-shaped relationship with both forms of assistance, so that individuals in the middle quartiles are more likely to both use any help (vs neither) and AT only (vs neither).
Differential Trends by Race/ethnicity and Socioeconomic Status
Tables 4 and 5 present results from a series of multinomial logit models that allow us to explore differential trends by race/ethnicity (model 1), by education (model 2), and by income quartile (model 3). The models in Tables 4 and 5 contain identical variables but they are parameterized in different ways. For example, model 1 of Tables 4 and 5, which highlights racial/ethnic trends, includes main effects for education and income quartiles and the control variables in Table 3. However, the interaction between the trend and each race/ethnicity group is parameterized differently depending on the table. Table 4 includes parameters representing a separate trend line for each of the racial/ethnic groups. This specification allows an explicit test for each group of whether forms of assistance have changed. All three contrasts (any help vs none, AT only vs none, and any help vs AT only) are provided to facilitate interpretation. Table 5 includes parameters representing the trend for the omitted group (in Model 1, non-white or hispanic), the main effect of race/ethnicity (in Model 1, non-Hispanic white), and interaction terms between the trend variable and race/ethnicity. This additional parameterization allows an explicit test of the difference in trend by the various groups, compared to an omitted group, which may be interpreted as a test for changes in disparities over time. Similar contrasts for education and income groups are provided in the other panels of the two tables.
Trends stratified by race/ethnicity and socioeconomic status. Controlling for shifts in the composition of the older population experiencing difficulty with daily activities, the unadjusted patterns previously described generally persist. The chances of using assistive technology independently (relative to no assistance) have increased significantly over the period for most groups. For walking, for example, equipment use has increased significantly for all groups except the highest income quartile (column 5, Table 4). At the same time, the chances of using any help versus nothing (for any of the activities) have not changed appreciably for almost all groups. The coefficient is generally close to 1.0 and not statistically significant except for those completing 9-12 years of education (for walking and bathing, the chances of any help have increased relative to neither). Taken together, these patterns suggest that the chances of using any help and the chances of using nothing have both declined in relation to the use AT alone. Indeed, as shown in the third column of each panel of Table 4, the chances of using any help relative to AT have generally declined for most groups, but these declines typically do not reach statistical significance for groups where AT has increased less than 4% per year.
Changes in disparities over time. In testing interactions between each set of racial/ethnic and socioeconomic indicators and year (see Table 5), only one statistically significant interaction emerged. We found a very small difference between the lowest and highest income quartiles in the trend for receiving help with any ADL. However, because this interaction effect is so small (note that it rounds to 1.00) and because the remaining interactions in the model were not significant, the set of interactions does not rise to significance for the adjusted F-test (F(26,2532)=2.04). Hence we conclude that none of the disparities in forms of assistance by race/ethnicity or socioeconomic status that we
TRENDS Working Paper 05-02 13
observed have changed significantly over the past decade and none of the trends differ significantly by racial/ethnic and socioeconomic status.
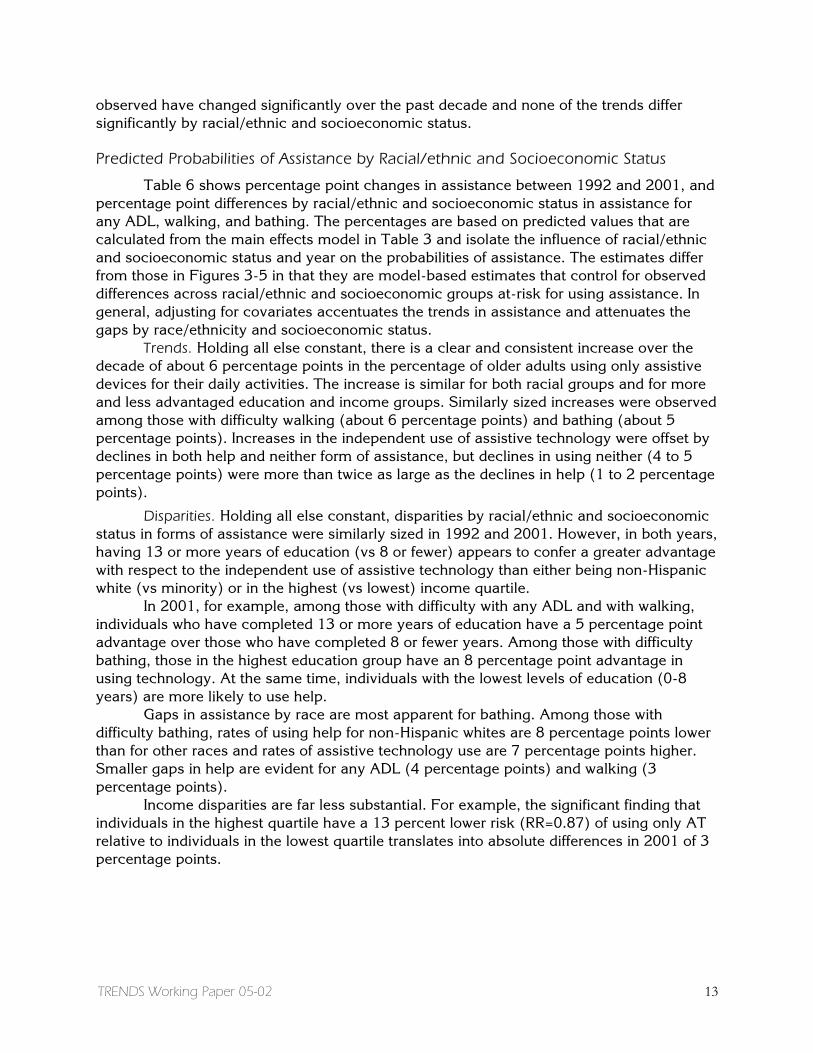
Predicted Probabilities of Assistance by Racial/ethnic and Socioeconomic Status
Table 6 shows percentage point changes in assistance between 1992 and 2001, and percentage point differences by racial/ethnic and socioeconomic status in assistance for any ADL, walking, and bathing. The percentages are based on predicted values that are calculated from the main effects model in Table 3 and isolate the influence of racial/ethnic and socioeconomic status and year on the probabilities of assistance. The estimates differ from those in Figures 3-5 in that they are model-based estimates that control for observed differences across racial/ethnic and socioeconomic groups at-risk for using assistance. In general, adjusting for covariates accentuates the trends in assistance and attenuates the gaps by race/ethnicity and socioeconomic status.
Trends. Holding all else constant, there is a clear and consistent increase over the decade of about 6 percentage points in the percentage of older adults using only assistive devices for their daily activities. The increase is similar for both racial groups and for more and less advantaged education and income groups. Similarly sized increases were observed among those with difficulty walking (about 6 percentage points) and bathing (about 5 percentage points). Increases in the independent use of assistive technology were offset by declines in both help and neither form of assistance, but declines in using neither (4 to 5 percentage points) were more than twice as large as the declines in help (1 to 2 percentage points).
Disparities. Holding all else constant, disparities by racial/ethnic and socioeconomic status in forms of assistance were similarly sized in 1992 and 2001. However, in both years, having 13 or more years of education (vs 8 or fewer) appears to confer a greater advantage with respect to the independent use of assistive technology than either being non-Hispanic white (vs minority) or in the highest (vs lowest) income quartile.
In 2001, for example, among those with difficulty with any ADL and with walking, individuals who have completed 13 or more years of education have a 5 percentage point advantage over those who have completed 8 or fewer years. Among those with difficulty bathing, those in the highest education group have an 8 percentage point advantage in using technology. At the same time, individuals with the lowest levels of education (0-8 years) are more likely to use help.
Gaps in assistance by race are most apparent for bathing. Among those with difficulty bathing, rates of using help for non-Hispanic whites are 8 percentage points lower than for other races and rates of assistive technology use are 7 percentage points higher. Smaller gaps in help are evident for any ADL (4 percentage points) and walking (3 percentage points).
Income disparities are far less substantial. For example, the significant finding that individuals in the highest quartile have a 13 percent lower risk (RR=0.87) of using only AT relative to individuals in the lowest quartile translates into absolute differences in 2001 of 3 percentage points.

TRENDS Working Paper 05-02 14
DISCUSSION
This paper has provided strong evidence that there has been a substantial increase in recent years in the use of assistive technology by members of the older U.S. population who have difficulty with daily tasks. In general, the increases in assistive technology appear to be widely experienced. Still, some socioeconomic groups are more likely to use assistive technology without help than others. Notably, higher levels of education are associated with higher probabilities of using technology independently to carry out daily activities. Among those with difficulty with one or more daily activities, all else equal, there has been a persistent 5 percentage point gap in the independent use of assistive technology between those with more than a high school education and those with 8 or fewer years of completed education. Even larger gaps by education are evident among those reporting difficulty bathing—reaching 8 percentage points in 2001.
We also found descriptive evidence suggestive of different patterns over time among more and less advantaged groups. Among those with more than a high school education, we found that increases in assistive technology have offset declines in the chances of receiving help from another person. In contrast, among low-income groups we found increases in assistive technology have offset declines in unassisted difficulty. However, tests for differences across groups in these patterns (that also took into account differences across groups and over time in the demographic and socioeconomic composition of the population) did not rise to the level of statistical significance. In fact, we found that for most groups increases in assistive technology appear to be offset by decreases both in the use of help and in unassisted difficulty, with declines in the latter twice as large as declines in help.
Our analysis is limited in several respects. First, questions about forms of assistance were limited to those individuals reporting that they experienced difficulty with a particular task. As Cornman and colleagues (in press) and others (Pine et al., 2002) have shown, there is a sizeable group that uses assistive technology, most often canes or environmental features, but does not report difficulty, and this group appears to be increasing in size (Freedman, Agree, Martin et al., 2004). Hence, our findings may underestimate the increases in assistive technology that have taken place over the last decade. On a similar note, we have limited our attention to technologies that are specifically designed to assist with functioning in day-to-day tasks, and hence excluded important medical, information, and household technologies that undoubtedly have improved older Americans’ quality of life in recent decades. Finally, due to data limitations, we considered only personal care activities in our analysis. In particular, declines in the prevalence of IADL limitations have been much larger than those observed for ADLs; hence understanding the role of technology in these other activities would be an important next step.
Despite these limitations, our findings have implications for the study of late-life disability trends and disparities therein. A recent consensus report (Freedman, Crimmins, Schoeni et al., 2004) found agreement across several national data sets (including the MCBS upon which we drew here) that there have been declines during the 1990s in help with ADL activities. Here we have investigated whether declines in help are linked to increases in the use of assistive technology. We found that controlling for compositional shifts, declines in reports of help from 1991 to 2001 among those reporting difficulty amounted to at most 2 percentage points. This figure equals about one-third of the observed decline in help over this period in the entire older population. The rest of the decline in help is the result of fewer people reporting underlying difficulty with daily activities. Whether the declines among those reporting difficulty have been driven mainly by

TRENDS Working Paper 05-02 15
increases in assistive technology or by other forces not measured in our analysis – such as changes in Medicare home health care or shifts in the causes and extent of underlying difficulty – warrants further attention. Although we were not able to distinguish between paid and unpaid source of care, future analyses should explore these distinctions, particularly whether the declines in help among more highly educated older adults represent declines in paid or unpaid sources of care. Moreover, previous studies have demonstrated that the severity of underlying difficulty is the overriding determinant of the types of assistance used (Agree et al., 2004; Verbrugge and Sevak, 2002). Although we controlled for severity of functional limitations in our analyses, a useful next step would be to focus on the effects of shifts in underlying functional ability on trends in assistance.
Our results also have implications for the growing literature on substitution between assistive technology and personal care and on unmet need. We found limited evidence of tradeoffs in the aggregate between assistive technology and help in the older U.S. population and our descriptive findings were consistent with recent evidence that more highly educated seniors may be trading off assistive technology for personal care (Agree et al., in press). However, this pattern was not dominant, and clearly a greater share of the increase in assistive technology has been offset by declines in unassisted difficulty. At the same time, we found that participation in the Medicaid program is associated with a greater likelihood of receipt of help, but not assistive technology. Hence for economically disadvantaged seniors participating in this means-tested program, substitution does not appear to be encouraged by the current benefit structure.
With respect to disparities in trends, increasing gaps in the need for help with personal activities have recently been reported (Schoeni et al., 2004), with lower income seniors and those with fewer years of education not gaining as much as other groups. We did not find increasing gaps by income in the forms of assistance. However, we found that disparities evident as early as 1991 persisted a decade later, with better educated individuals more likely than less educated to use assistive technology without help and minorities more likely than others to use help. Racial and education gaps with respect to the use of bathing technology were especially large, all else equal, amounting to 7 to 8 percentage points in 2001—nearly twice the gaps found by education for walking.
These task-specific findings highlight the complex nature of late-life disability and the heterogeneity of the various daily tasks. Although the use of walking and bathing technologies have both increased over the decade by similar amounts, gaps by race/ethnicity and socioeconomic status in the use of technologies to assist in bathing remained notably large. The reason for this pattern is not clear. It may be that technologies to accommodate bathing difficulties involve changes to the physical environment that less advantaged groups may not be in a position to adapt. Currently national surveys do not provide details on the home environment of older adults with difficulty in daily activities, so further exploration of these kinds of hypotheses will await new data collection efforts.
From a societal perspective, the fact the there have been declines in the proportion of the older population reporting difficulty with ADL activities, is undoubtedly good news. However, at the same time, those with difficulty have become increasingly disadvantaged socially and economically over time, even as educational attainment has risen. The especially large and persistent educational disparities in use of assistive technology suggests greater effort in this area, perhaps through public education around access to and benefits of assistive technology, may be warranted. Ultimately, whether the shift toward technological assistance by those experiencing difficulty with daily tasks is judged as
TRENDS Working Paper 05-02 16
beneficial remains to be seen. A recent study suggests that technology may enhance independence, but that those who use equipment equally or more often report that tasks are tiring, time consuming, or painful even when they use assistance (Agree and Freedman, 2003). Better understanding of the costs and benefits of various forms of assistance for older persons who experience difficulty in their day-to-day tasks is needed for policymaking to keep pace with technological advancements.

TRENDS Working Paper 05-02 17
REFERENCES
Agency for HealthCare Research and Quality. 2003. National Health Care Disparities Report. Accessed May 21, 2004: http://www.qualitytools.ahrq.gov/disparitiesreport/download_report.aspx
Agree, E.M. 1999. The influence of personal care and assistive devices on the measurement of disability. Social Science and Medicine, 48, 427-443.
Agree, E.M. and V. A. Freedman. 2000. Incorporating assistive devices into long-term care arrangements: Analysis of the Second Supplement on Aging. Journal of Aging and Health 12(3):426-450.
Agree, E.M. and V. A. Freedman. 2003. A comparison of assistive technology and personal care in alleviating disability and unmet need. The Gerontologist 43:335-344.
Agree, E.M., V. A. Freedman, J. C. Cornman, D. A. Wolf, and J. E. Marcotte. Forthcoming "Reconsidering substitution in long-term care: when does assistive technology take the place of personal care?" Journals of Gerontology.
Agree E.M., V.A. Freedman, and M. Sengupta. 2004. Factors influencing the use of mobility technology in community-based long-term care. Journal of Aging Health, 16(2), 267-307.
Burton, L., Kasper, J., Shore, A., Cagney, K., LaVeist, T., Cubbin, C., and German, P. 1995. The structure of informal care: Are there differences by race? The Gerontologist 35(6), 744-752.
Cornman, J., V.A. Freedman, and E.M. Agree. In Press. The effect of assistive technology measurement on late life disability rates. The Gerontologist.
Freedman, V.A., and LG Martin. 1998. Understanding trends in functional limitations among older Americans. American Journal of Public Health, 88:1457-1462.
Freedman, V. A., E. Agree, L.G. Martin, and Jennifer. Cornman. 2004. Trends in the use of disability and assistance: are they related? Presented at the NBER workshop on Understanding Disability Change and Its Implications, February 14, Charleston, SC.
Freedman, V,A., E, Crimmins, R,F, Schoeni, B, Spillman, H, Aykan, K, Land, J, Lubitz, K, Manton, L,G, Martin, D, Shinberg, and T, Waidmann. 2004. Resolving discrepancies in old-age disability trends across national surveys: report from a technical working group. Demography 41(3):417-441.
Fried L,P,, K. Bandeen-Roche, P.H. Chaves, and B.A. Johnson. 2000. Preclinical mobility disability predicts incident mobility disability in older women. Journal of Gerontology: Medical Sciences 55(1):M43-52.
Fried L,P., Y. Young, G. Rubin, and K. Bandeen-Roche; WHAS II Collaborative Research Group. 2001. Self-reported preclinical disability identifies older women with early declines in performance and early disease. Journal of Clinical Epidemiology 54(9):889-901.
Gitlin, L.N., W.C. Mann, W.C., Tomita, M., and Marcus, S.M. 2001. Factors associated with home environmental problems among community-living older people. Disability and Rehabilitation 23(17):777-787.
Hartke, R.J., T.R. Prohaska, and S.E. Furner. 1998. Older adults and assistive devices: Use, multiple-device use and need. Journal of Aging and Health 10(1): 99-116.
Kemper, P. 1992. The use of formal and informal care by the disabled elder. Health Services Research 27(4):421-451.
Kington R.S. and J.P. Smith. 1997. Socioeconomic status and racial and ethnic differences in functional status associated with chronic diseases. American Journal of Public Health. 87(5):805-10.

TRENDS Working Paper 05-02 18
LeBlanc A.J., M.C. Tonner, and C. Harrington. 2001. State Medicaid programs offering personal care services. Health Care Financing Review. 22(4):155-73.
Mann, W. C., K.J. Ottenbacher, L. Fraas, M. Tomita, and C.V. Granger. 1999. Effectiveness of assistive technology and environmental interventions in maintaining independence and reducing home care costs for the frail elderly. A randomized controlled trial. Archives of Family Medicine, 8(3), 210-217.
Manton, K.G., L. Corder, and E. Stallard. 1993. Changes in the use of personal assistance and special equipment from 1982 to 1989: Results from the 1982 and 1989 NLTCS. The Gerontologist, 33, 168-176.
Mathieson, K.M., J. Kronenfeld, and V.M. Kieth. 2002. Maintaining functional independence in elderly adults: The roles of health status and financial resources in predicting home modifications and use of mobility equipment. The Gerontologist, 42(1), 24-31.
Mendes de Leon, C.F., Fillenbaum, G.G., Williams, C.S., Brock, D.B., Beckett, L.A,, Berkman L.F. 1995. Functional disability among elderly blacks and whites in two diverse areas: the New Haven and North Carolina EPESE. Established Populations for the Epidemiologic Studies of the Elderly. American Journal of Public Health, 85(7), 994-8.
Newman, S. J. 2003. The living conditions of elderly Americans. Gerontologist, 43(1), 99-109.
NIDRR (National Institute for Disability and Rehabilitation Research). 2004. National Database of Assistive Technology Information (ABLEDATA), Silver Spring, MD: Macro International, Inc.
Norburn, J.E.K., S. Bernard, T. Konrad, A. Woomert, G. DeFriese, W. Kalsbeek, G.G. Koch, and M. Ory. 1995. Self-care and assistance from others in coping with functional status limitations among a national sample of older adults. Journal of Gerontology: Social Sciences, 50B(2), S101-S109.
Pew, R.W. and S.B. Van Hemel. (Editors). 2004. Technology for Adaptive Aging Steering Committee for the Workshop on Technology for Adaptive Aging, National Research Council.
Pine, M. Z., B. Gurland, and M.M. Chren. 2002. Use of a cane for ambulation: marker and mitigator of impairment in older people who report no difficulty walking. Journal of the American Geriatric Society 50(2):263-8.
Russell, J.N., G.E. Hendershot, F. LeClere, L.J. Howie and M. Adler. 1997. Trends and differential use of assistive technology devices. Advance Data from Vital and Health Statistics, 292. Hyattsville, MD: National Center for Health Statistics.
Schoeni, R.F., V.A. Freedman, and R. Wallace. 2002. Late-life disability trajectories and socioeconomic status. Annual Review of Gerontology and Geriatrics 22: 184-206.
Schoeni, R.F., L.G. Martin, P. Andreski, V.A. Freedman. 2004. Persistent and growing disparities in disability among the elderly: 1982-2002. Presented at the NBER workshop on Understanding Disability Change and Its Implications, February 14, Charleston, SC.
Spillman, B.C. 2004. Changes in elderly disability rates and the implications for health care utilization and cost. Milbank Quarterly 82, 157-194.
Stump T.E., D.O. Clark, R.J. Johnson, F.D. Wolinsky. 1997. The structure of health status among Hispanic, African American, and white older adults. Journals of Gerontology 52:S49-S60.
Stuck, A. E., J.M. Walthert, T. Nikolaus, C.J. Bula, C. Hohmann and J.C. Beck, J. C. 1999. Risk factors for functional status decline in community-living elderly people: a systematic literature review. Social Science and Medicine 48(4):445-469.
StataCorp. 1997. Stata Statistical Software: Release 5.0. College Station, TX: Stata Corporation.
TRENDS Working Paper 05-02 19
Taylor, D.H. and H. Hoenig. 2004. The effect of equipment usage and residual task difficulty on use of personal assistance, days in bed and nursing home placement. Journal of the American Geriatrics Society 52(1):72-9.
M.R. Tomita, W.C. Mann, L.F. Fraas, and L.L. Burns. 1997. Racial Differences of Frail Elders in Assistive Technology. Assistive Technology, 9:140-151.
U.S. Congress Office of Technology Assessment. 1985. Technological change and the U.S. older population. Chapter 1 in Technology and Aging in America, Washington D.C.: U.S. Congress Office of Technology Assessment, OTA-BA-264, June 1985.
Verbrugge, L.M. 1990. The Iceberg of Disability. In Stahl S (Ed.) The Legacy of Longevity: Health and Health Care in Late Life. Newbury Park: Sage Publications.
Verbrugge, LM, C. Rennert, and J.H. Madans. 1997. The great efficacy of personal and equipment assistance in reducing disability. American Journal of Public Health. 87(3):384-92.
Verbrugge L.M. and P. Sevak.2002. Use, type, and efficacy of assistance for disability. Journal of Gerontology.57 :S366-79.
Zimmer, Z. and N. Chappell. 1994. Mobility restrictions and the use of devices among seniors. Journal of Aging and Health, 6(2), 185-208.
TRENDS Working Paper 05-02 20
Table 1: Characteristics of the Population Ages 65 and Older, 1992-2001 (weighted percentages) Population Ages 65+ Reporting Difficulty With
Population Ages 65 +
Any ADL Walking Bathing
Race Non-Hispanic white 84.7 82.4 82.0 81.0 Other race 15.3 17.6 18.0 19.0 Education 0-8 years 20.3 27.8 28.3 31.6 9-12 years 47.8 47.1 47.1 46.4 13+ years 31.8 25.1 25.6 22.0 Income quartiles First 25.0 35.6 36.2 41.0 Second 25.0 27.0 27.2 26.9 Third 25.0 21.6 21.3 19.5 Fourth 25.0 15.9 15.3 12.5 Age 65-74 53.9 39.3 39.0 31.3 75-79 36.1 41.5 41.2 42.4 85+ 10.0 19.3 19.9 26.3 Sex Male 41.8 34.7 34.7 30.0 Female 58.2 65.3 65.3 70.0 Marital Status Married 56.5 45.7 45.1 40.8 Not married 43.5 54.2 54.9 59.2 Region Northeast 24.2 19.8 19.9 19.6 South 21.2 25.2 25.0 25.2 Midwest 35.4 36.0 35.8 37.2 West 19.2 19.0 19.3 18.0 Functional Limitation
Scale
TRENDS Working Paper 05-02 21
0 27.0 3.3 2.8 1.5 1-2 30.3 13.7 11.9 5.7 3-5 23.0 30.4 29.3 20.0 6-12 19.7 52.7 56.0 72.8 (weighted mean) (2.9) (5.9) (6.1) (7.4) Medicaid participation 8.8 15.3 15.7 19.3 Year 1992 9.8 10.6 10.7 10.2 1993 9.7 10.1 10.0 10.3 1994 9.7 10.0 10.0 10.4 1995 9.9 10.0 9.9 10.4 1996 10.0 9.5 9.4 10.0 1997 10.1 9.5 9.4 9.7 1998 10.1 9.8 9.8 9.6 1999 10.1 10.2 10.1 10.0 2000 10.2 10.1 10.3 9.7 2001 10.3 10.1 10.3 9.6 N (Unweighted) 126,481 38,603 32,737 16,648

TRENDS Working Paper 05-02 22
Table 2: Racial/ethnic and Socioeconomic Characteristics of the Population Ages 65 and Older, 1992 and 2001 (weighted percentages)
Population Ages 65+ Reporting Difficulty With
Population Ages 65 + Any ADL Walking Bathing
1992 2001 p 1992 2001 p 1992 2001 p 1992 2001 pRace ** Non-Hispanic white 86.6 82.4 84.0 80.5 83.3 80.4 83.7 78.5 Other race 13.4 17.6 16.0 19.5 16.7 19.6 16.3 21.5 Education ** ** ** ** 0-8 years 26.2 14.7 34.4 27.8 35.4 20.5 39.2 24.6 9-12 years 47.8 45.6 46.0 47.2 44.9 48.3 43.5 50.5 13+ years 26.0 39.7 19.6 25.1 19.7 31.2 17.3 24.9 Income quartiles * ** * First 25.0 25.0 35.1 36.2 36.3 36.8 39.3 44.3 Second 25.0 25.0 27.8 26.3 27.7 26.3 28.4 25.0 Third 25.0 25.0 21.9 21.3 21.7 21.0 19.6 18.7 Fourth 25.0 25.0 15.3 16.2 14.3 15.9 12.7 12.0
* p<.05 ** p<.001 for X2 test for relationship between year (1992-2001) and variable of interest.

TRENDS Working Paper 05-02 23
Table 3. Relative Risk Ratios from Multinomial Regressions for Using Assistive Technology Only and Receiving Any Help (vs Neither) among Those with Difficulty with Any ADL, Walking, or Bathing: Main Effects Models
Any ADL Walking Bathing
Any help
vs. neither
AT only vs.
neither
Any help
vs. neither
AT only vs.
neither
Any help
vs. neither
AT only vs.
neither
Year 1.008 1.037 ** 1.013 1.038 ** 1.022 1.056 ** Non-Hispanic white 0.794 ** 0.932 0.793 ** 0.911 0.795 ** 1.347 * Education 9-12 years 0.897 * 0.988 0.911 0.996 0.928 1.111 Education 13+ years 0.895 1.187 ** 0.883 1.148 * 0.891 1.462 ** 2nd income quartile 0.993 1.028 0.950 1.012 1.208 * 1.196 * 3rd income quartile 1.019 0.964 0.977 0.934 1.306 ** 1.334 ** 4th income quartile 0.961 0.886 1.002 0.872 * 1.204 1.188 (high) Control variables: Age 75-84 1.777 ** 1.647 ** 1.743 ** 1.667 ** 1.600 ** 1.340 ** Age 85+ 5.429 ** 3.094 ** 4.999 ** 3.356 ** 3.182 ** 1.233 * Female 1.009 0.971 1.080 0.909 * 0.863 * 1.288 ** Married 1.832 ** 0.684 ** 1.852 ** 0.717 ** 1.896 ** 0.700 ** Midwest 0.826 ** 1.006 0.721 ** 1.008 0.731 ** 0.790 Northeast 1.113 0.950 0.959 0.945 1.322 * 0.795 South 0.913 0.966 0.777 ** 0.905 0.947 0.840 Functional Limitations 1.444 ** 1.186 ** 1.363 ** 1.157 ** 1.234 ** 1.014 Medicaid participation 1.477 ** 0.935 1.284 ** 1.029 1.626 ** 0.881 Observations 38,603 32,737 16,648 * p < 0.05 **p < 0.01

TRENDS Working Paper 05-02 24
Table 4: Relative Risk Ratios from Multinomial Regressions for Using Assistive Technology Only, Receiving Any Help, or Neither Among Those with Difficulty with Any ADL, Walking, Bathing: Trends Stratified by Race/ethnicity and Socioeconomic Status Any ADL Walking Bathing
Any hel
p AT only
Any help
Any help
AT only
Any hel
p Any help
AT only
Any help
vs. None
vs. None
vs. AT only
vs. None
vs. None
vs. AT
only
vs. Non
e
vs. None
vs. AT only
: Model 1: Trend stratified by race/ethnicity Trend for Other race/ethnicity 1.00 1.02 0.98 1.02 1.03 * 0.99 1.00 1.01 0.99 Trend for Non-Hispanic white 1.01 1.04 ** 0.97 ** 1.01 1.04 ** 0.97 * 1.03 1.06 ** 0.96 * Adjusted Wald statistic, df 6.68** (4, 2534) 7.24** (4, 2443) 3.03* (4, 1860) Model 2: Trend stratified by education groups Trend for 0-8 years 1.00 1.02 0.98 1.02 1.03 ** 0.99 0.99 1.02 0.98 Trend for 9-12 years 1.02 1.05 ** 0.97 ** 1.02 * 1.04 ** 0.98 1.04 * 1.07 ** 0.97 Trend for 13+ years 0.99 1.03 ** 0.96 ** 0.98 1.04 ** 0.95 ** 1.03 1.08 ** 0.96 * Adjusted Wald statistic, df 5.27** (6, 2532) 5.51** (6, 2441) 2.73* (6, 1858)
Model 3: Trend stratified by income quartiles Trend for 1st quartile 1.01 1.03 ** 0.98 1.02 1.03 ** 0.99 1.01 1.05 * 0.96 * Trend for 2nd quartile 1.01 1.04 ** 0.97 ** 1.01 1.05 ** 0.97 ** 1.04 1.05 * 0.99 Trend for 3rd quartile 1.01 1.06 ** 0.95 ** 1.02 1.05 ** 0.97 ** 1.04 1.08 ** 0.96 Trend for 4th quartile 1.00 1.00 1.00 ** 1.00 1.00 1.00 ** 1.00 1.00 1.00 Adjusted Wald statistic, df 4.60** (8, 2530) 4.79** (8, 2439) 1.82, (8, 1856)
Note: Models also control for all main effects shown in Table 3.

TRENDS Working Paper 05-02 25
Table 5 Relative Risk Ratios from Multinomial Regressions for Using Assistive Technology Only, Receiving Any Help, or Neither Among Those with Difficulty with Any ADL, Walking, or Bathing: Interaction Models
Any ADL Walking Bathing
Main effects model with the following interactions:
Any help
vs. none
AT only vs. none
Any help
vs. none
AT only vs. none
Any help
vs. none
AT only vs. none
Model 1: Trend interacted with race/ethnicity
Year 1.00 1.02 1.02 1.03 * 1.00 1.01 Non-Hispanic white 0.78 * 0.85 0.85 0.85 0.69 * 0.99 Non-Hispanic white * year 1.00 1.02 0.99 1.01 1.03 1.06 Adjusted Wald statistic, df for race * year 0.50, (2, 2536) 0.83, (2, 2445) 1.47, (2, 1862) Model 2: Trend interacted with
education groups Year 1.00 1.02 1.02 1.03 ** 0.99 1.02 9-12 years of education 0.82 * 0.87 0.89 0.96 0.76 0.88 13+ years of education 0.98 1.13 1.08 1.13 0.73 1.08 9-12 years * year 1.02 1.02 1.00 1.01 1.04 1.05 13+ years * year 0.99 1.01 0.97 1.00 1.04 1.06
Adjusted Wald statistic, df for education * year 1.51, (4, 2534) 1.69, (4, 2443) 1.16, (4, 1860) Model 3: Trend interacted with
income quintiles Year 1.01 1.03 ** 1.02 1.03 ** 1.01 1.05 * 2nd quartile 1.02 0.95 0.96 0.91 1.05 1.17 3rd quartile 1.07 0.82 0.95 0.80 * 1.13 1.14 4th quartile 1.02 0.89 1.06 0.88 * 1.27 1.21 2nd quartile*year 1.00 1.01 1.00 1.02 1.03 1.00 3rd quartile* year 0.99 1.03 1.01 1.03 1.03 1.03 4th quartile*year 1.00 * 1.00 1.00 1.00 1.00 1.00
Adjusted Wald statistic, df for income * year 2.04, (6, 2532) 1.59, (6 , 2441) 0.84, (6, 1858) Observations 38,603 32,737 16,648 * p < 0.05 **p < 0.01
Note: Models also control for all main effects shown in Table 3.

TRENDS Working Paper 05-02 26
Table 6. Percentage Point Changes from 1992 to 2001 and Disparities by Race, Education, and Income in Assistance with Any ADL, Walking and Bathing Any ADL Walking Bathing
AT only Help Neither
AT only Help Neither
AT only Help Neither
Percentage point change over time (2001 vs 1992)
Race Other 6 -2 -3 6 -2 -5 4 -1 -3 Non-Hispanic white 6 -2 -4 6 -1 -5 5 -2 -4 Education 0-8 years 6 -2 -4 6 -1 -5 5 -1 -4 13+ years 6 -2 -4 7 -1 -5 6 -2 -4 Income 1st income quartile 6 -2 -4 6 -1 -5 5 -1 -4 4th income quartile 6 -2 -4 6 -1 -5 5 -2 -4 Disparities by year 1992 Non-Hispanic white vs Other 1 -4 3 0 -3 3 6 -7 1 13+ years vs 0-8 years 4 -4 -1 4 -4 -1 7 -6 0 4th quartile vs 1st quartile -2 0 1 -3 1 2 1 2 -3 2001 Non-Hispanic white vs Other 1 -4 2 0 -3 3 7 -8 1 13+ years vs 0-8 years 5 -4 -1 5 -4 -1 8 -7 -1 4th quartile vs 1st quartile -2 1 1 -3 1 2 1 2 -2
Note: Calculated based on predicted values from model shown in Table 3. See text for methodology.
TRENDS Working Paper 05-02 27
Figure 1. Framework for Understanding the Role of Accommodations in the Disablement Process
Underlying
Disability
Residual Disabili
Functional Limitation
Environmental Demands
Demands of the Task Accommodations
Behavior change Assistive technology
Personal care
TRENDS Working Paper 05-02 28
Figure 2. Income Quartiles: Current Population Survey (Actual) versus Medicare Current Beneficiary Survey (Estimated)
CPS MCBS
$0
$5,000
$10,000
$15,000
$20,000
$25,000
$30,000
$35,000
$40,000
$45,000
1992 1993 1994 1995 1996 1997 1998 1999 2000 2001
25th percentile
75th percentile
50th percentile

TRENDS Working Paper 05-02 29
Figure 3. Trends in Receipt of Assistance with Any of Six ADLs, Population Ages 65+ with Difficulty in Any ADL, by Race/Ethnicity, Education, and Income Quartiles, 1992-2001.
RACE/ETHNICITY
OTHERS NON-HISPANIC WHITE
EDUCATION 0 – 8 YEARS 13+ YEARS
INCOME QUARTILE LOWEST QUARTILE HIGHEST QUARTILE
No help or AT AT only Any Help
0
0.1
0.2
0.3
0.4
0.5
0.6
0.7
0.8
1992 1993 1994 1995 1996 1997 1998 1999 2000 20010
0.1
0.2
0.3
0.4
0.5
0.6
0.7
0.8
1992 1993 1994 1995 1996 1997 1998 1999 2000 2001
0
0.1
0.2
0.3
0.4
0.5
0.6
0.7
0.8
1992 1993 1994 1995 1996 1997 1998 1999 2000 20010
0.1
0.2
0.3
0.4
0.5
0.6
0.7
0.8
1992 1993 1994 1995 1996 1997 1998 1999 2000 2001
0
0.1
0.2
0.3
0.4
0.5
0.6
0.7
0.8
1992 1993 1994 1995 1996 1997 1998 1999 2000 20010
0.1
0.2
0.3
0.4
0.5
0.6
0.7
0.8
1992 1993 1994 1995 1996 1997 1998 1999 2000 2001

TRENDS Working Paper 05-02 30
Figure 4. Trends in Receipt of Assistance with Walking, Population Ages 65+ with Difficulty Walking, by Race/Ethnicity, Education, and Income Quartiles, 1992-2001.
RACE/ETHNICITY
OTHERS NON-HISPANIC WHITE
EDUCATION 0 – 8 YEARS 13+ YEARS
INCOME QUARTILE LOWEST QUARTILE HIGHEST QUARTILE
No help or AT AT only Any Help
0
0.1
0.2
0.3
0.4
0.5
0.6
0.7
0.8
1992 1993 1994 1995 1996 1997 1998 1999 2000 20010
0.1
0.2
0.3
0.4
0.5
0.6
0.7
0.8
1992 1993 1994 1995 1996 1997 1998 1999 2000 2001
0
0.1
0.2
0.3
0.4
0.5
0.6
0.7
0.8
1992 1993 1994 1995 1996 1997 1998 1999 2000 20010
0.1
0.2
0.3
0.4
0.5
0.6
0.7
0.8
1992 1993 1994 1995 1996 1997 1998 1999 2000 2001
0
0.1
0.2
0.3
0.4
0.5
0.6
0.7
0.8
1992 1993 1994 1995 1996 1997 1998 1999 2000 20010
0.1
0.2
0.3
0.4
0.5
0.6
0.7
0.8
1992 1993 1994 1995 1996 1997 1998 1999 2000 2001
TRENDS Working Paper 05-02 31
Figure 5. Trends in Receipt of Assistance with Bathing, Population Ages 65+ with Difficulty Bathing, by Race/Ethnicity, Education, and Income Quartiles, 1992-2001.
RACE/ETHNICITY
OTHERS NON-HISPANIC WHITE
EDUCATION 0 – 8 YEARS 13+ YEARS
INCOME QUARTILE LOWEST QUARTILE HIGHEST QUARTILE
No help or AT AT only Any Help
0
0.1
0.2
0.3
0.4
0.5
0.6
0.7
0.8
1992 1993 1994 1995 1996 1997 1998 1999 2000 20010
0.1
0.2
0.3
0.4
0.5
0.6
0.7
0.8
1992 1993 1994 1995 1996 1997 1998 1999 2000 2001
0
0.1
0.2
0.3
0.4
0.5
0.6
0.7
0.8
1992 1993 1994 1995 1996 1997 1998 1999 2000 20010
0.1
0.2
0.3
0.4
0.5
0.6
0.7
0.8
1992 1993 1994 1995 1996 1997 1998 1999 2000 2001
0
0.1
0.2
0.3
0.4
0.5
0.6
0.7
0.8
1992 1993 1994 1995 1996 1997 1998 1999 2000 20010
0.1
0.2
0.3
0.4
0.5
0.6
0.7
0.8
1992 1993 1994 1995 1996 1997 1998 1999 2000 2001