Daytime baroreflex sensitivity in patients with primary insomnia
Upload
khangminh22Category
view
1download
0
Citation: Bendaoud, I.; Etindele
Sosso, F.A. Socioeconomic Position
and Excessive Daytime Sleepiness: A
Systematic Review of Social
Epidemiological Studies.
Clocks&Sleep 2022, 4, 240–259.
https://doi.org/10.3390/
clockssleep4020022
Received: 22 November 2021
Accepted: 5 May 2022
Published: 16 May 2022
Publisher’s Note: MDPI stays neutral
with regard to jurisdictional claims in
published maps and institutional affil-
iations.
Copyright: © 2022 by the authors.
Licensee MDPI, Basel, Switzerland.
This article is an open access article
distributed under the terms and
conditions of the Creative Commons
Attribution (CC BY) license (https://
creativecommons.org/licenses/by/
4.0/).
Review
Socioeconomic Position and Excessive Daytime Sleepiness:A Systematic Review of Social Epidemiological StudiesImene Bendaoud 1,2,* and Faustin Armel Etindele Sosso 2
1 Clinical Pharmacology, Faculty of Medicine, University of Montreal, Montreal, QC H3T 1J4, Canada2 Global Health and Ecoepidemiology, Redavis Institute, Montreal, QC H3S 1X5, Canada;
[email protected]* Correspondence: [email protected]
Abstract: The objectives of this empirical study are to describe and discuss the current literatureavailable on the relationship between excessive daytime sleepiness (EDS) and the socioeconomicposition (SEP) as well as to provide recommendations for consideration of SEP in sleep medicineand biomedical research. Databases Medline/PubMed, Web of Science, Google scholar and Scopuswere screened from January 1990 to December 2020 using PRISMA guidelines and 20 articles wereincluded in the final synthesis. Nineteen studies were cross-sectional and one study was longitudinal.Among these studies, 25.00% (n = 5) are focused on children and adolescent and the remaining 75.00%(n = 15) focused on adults and seniors. Ages ranged from 8 to 18 years old for children/adolescentand ranged from 18 to 102 years old for adults. Main SEP measures presented in these studies wereeducation, income, perceived socioeconomic status and employment. The sample size in these studiesvaried from N = 90 participants to N = 33,865 participants. Overall, a lower educational level, a lowerincome and full-time employment were associated with EDS. Symptoms of EDS are prevalent inwomen, especially those with a low income or no job; and children and adolescents with difficultliving conditions or working part time reported more sleep disturbances. SEP is already consideredas an important determinant for many health outcomes, but if SEP is embedded in the experimentaldesign in psychosomatic research, biomedical research and clinical practice as a constant variableregardless of outcome; it will move forward future investigations.
Keywords: sleepiness; systematic review; social class; health status disparities; economics; global health
1. Introduction
Sleep is an essential state to restore and revitalize physiological and mental processes,occupying up to a third of a person’s lifetime. The prevalence of sleep disturbances has beenincreasing steadily over the past decades [1–5], alongside modern societal and technologicalchanges that influence quality and quantity of sleep.
Alterations in sleep have been linked to a wide range of health issues includingcardiovascular or metabolic disorders [6–12], as well as an increase in workplace andoccupational health issues due to sleep disturbances such as excessive daytime sleepiness(EDS) [13–15]. According to the National Sleep Foundation 2000 Omnibus Sleep in AmericaPoll: 43% of adults report that they are so sleepy during the day to the point that it interfereswith their daily activities a few days per month or more [16].
Sleepiness is an imperative biological function defined by the likelihood of fallingasleep, however, when this tendency is increased and the propensity to sleep becomes com-pulsive, it is referred to as excessive daytime sleepiness (EDS) [17,18]. The latter is definedvariously as daytime somnolence or when wakefulness is difficult to maintain [17,18]. Thisburdensome disorder has been widely studied in order to understand its physiological andneurological substrates; however, few studies have looked into the association between EDSand socioeconomic indicators of social class or socioeconomic position (SEP) [7,13,19–23].
Clocks&Sleep 2022, 4, 240–259. https://doi.org/10.3390/clockssleep4020022 https://www.mdpi.com/journal/clockssleep

Clocks&Sleep 2022, 4 241
It has been previously shown that a lower socioeconomic status, including employ-ment, educational level or income, is an important stressor and impacts sleep negatively [24].Despite the known adverse consequences of excessive sleepiness during the day, literatureis scarce on the topic.
Substantial evidence has shed some light on the graded association of SEP and healthproblems [8,19,25–30]. However, despite the numerous findings linking SEP with health,there is an enormous lack of research conducted on the relationship between SEP and sleepdisturbances. Due to the high implication of SEP in health status and the public health issuethat sleep disturbances represent [31], a better understanding of this relationship is necessary.
A systematic review seemed more appropriate to investigate this question, becausethe indicators needed to assess SEP, such as income, education or employment, are useddifferently depending on the context. Therefore, the heterogeneity of the results prevents astatistical combination of the findings necessary for a meta-analysis. The present systematicreview was performed for various purposes. It has as an objective to: (1) describe the currentliterature on the relationship between EDS and SEP, and (2) provide recommendations forconsideration of SEP in sleep medicine and biomedical research.
2. Materials and Methods2.1. Literature Review
Using Prisma [32], articles included in this review were identified by screening inPubMed, Web of Science, Google scholar and Scopus. Keywords/Mesh terms used for SEPwere a mix of the following: “socioeconomic”, “socioeconomic position”, “socioeconomicstatus”, “social position”, “social rank”, ‘’social class” AND the following keywords/Meshterms used for EDS: were “sleep”, “sleep disorders”, “sleep disturbances”, “sleep com-plaints”, “sleep duration”, “sleepiness”, “daytime sleepiness”, “somnolence” “sleep qual-ity”, “sleepiness”, “somnolence”, “sleep” (Figure 1). Screening ranged from January 1990 toDecember 2020. Only peer review articles in English with an available pdf were considered.Studies conducted before 1990 were not considered for this review, since they were mostlyempirical studies conducted on animals. Clinical studies examining sleep health beganafter 1990. This systematic review was not pre-registered.
Clocks&Sleep 2022, 4, FOR PEER REVIEW 3
Figure 1. Prisma flowchart of study selection process: the relationship between EDS and SEP.
2.2. Inclusion and Exclusion Criteria Cross-sectional, retrospective and longitudinal studies which include individual SEP
indicators such as education, income, occupation, employment status as well as perceived SES were considered, as shown in Figure 1. Full text articles were evaluated for inclusion by two independent reviewers and disagreements were resolved by discussion to reach a consensus. Proxy measures of SEP, such as composite measures and aggregate measures of SES were also included. Family SEP measures, such as parental education and household income were used when study participants were children or adolescents. Studies were excluded when they: (1) were not original research, (2) were case report/series, reviews or meta-analysis, (3) were not written in English, (4) did not have a fully accessible text or (5) included participants that already presented specific conditions at baseline (for example chronic disease, high mental health medication, pregnant women, etc.).
2.3. Data Extraction and Quality Rating of Studies Eligible studies were screened to extract interrater variability measurements using
Cohen’s Kappa scores to assess diagnostic agreement. Interrater variability demonstrated good agreement (κ = 0.79; 95 % CI = 0.68-0.92) as shown in Table 1. Data extracted from included studies were: Country (where research took place), year, type of population, sample size, age (mean or range depending on studies), percentage of each gender in the sample, study design, settings, SEP measures, sleep measures, findings and statistical strength of the association SEP-EDS (Odds Ratio, p value and r) (Table 2). SEP was considered the exposure variable and EDS the outcome variable. The National Institute of
Figure 1. Prisma flowchart of study selection process: the relationship between EDS and SEP.

Clocks&Sleep 2022, 4 242
2.2. Inclusion and Exclusion Criteria
Cross-sectional, retrospective and longitudinal studies which include individual SEPindicators such as education, income, occupation, employment status as well as perceivedSES were considered, as shown in Figure 1. Full text articles were evaluated for inclusionby two independent reviewers and disagreements were resolved by discussion to reach aconsensus. Proxy measures of SEP, such as composite measures and aggregate measures ofSES were also included. Family SEP measures, such as parental education and householdincome were used when study participants were children or adolescents. Studies wereexcluded when they: (1) were not original research, (2) were case report/series, reviewsor meta-analysis, (3) were not written in English, (4) did not have a fully accessible text or(5) included participants that already presented specific conditions at baseline (for examplechronic disease, high mental health medication, pregnant women, etc.).
2.3. Data Extraction and Quality Rating of Studies
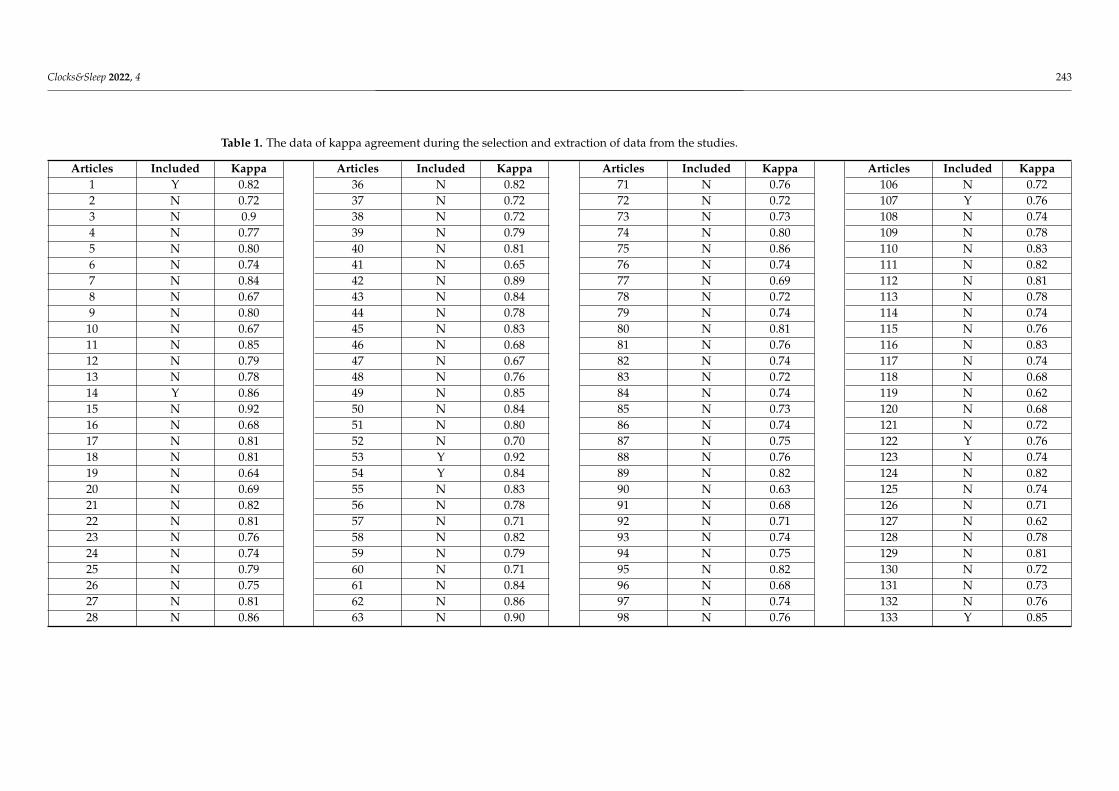
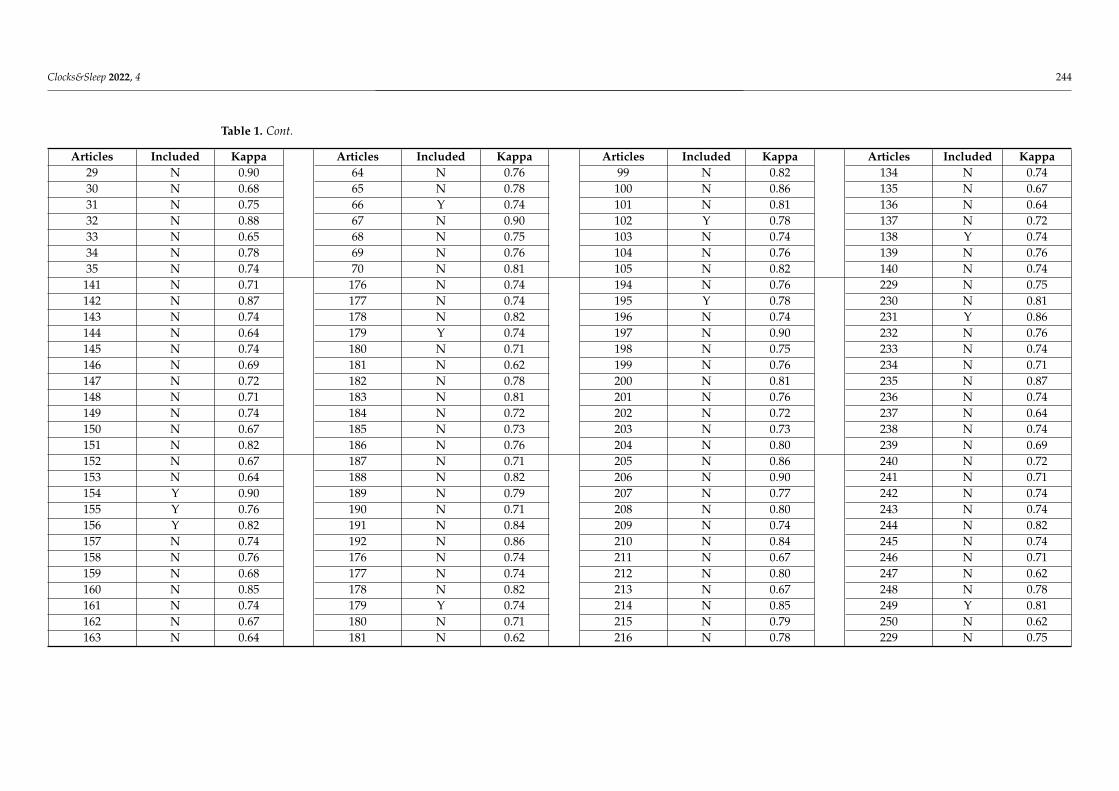
Eligible studies were screened to extract interrater variability measurements usingCohen’s Kappa scores to assess diagnostic agreement. Interrater variability demonstratedgood agreement (κ = 0.79; 95 % CI = 0.68-0.92) as shown in Table 1. Data extracted fromincluded studies were: Country (where research took place), year, type of population,sample size, age (mean or range depending on studies), percentage of each gender inthe sample, study design, settings, SEP measures, sleep measures, findings and statisticalstrength of the association SEP-EDS (Odds Ratio, p value and r) (Table 2). SEP was con-sidered the exposure variable and EDS the outcome variable. The National Institute ofHealth’s Quality Assessment Tool for Observational Cohort and Cross-Sectional Studieswas used to rate the quality of included studies (Table 3). This is a tool that focuses onkey factors for a critical evaluation of the internal validity of a study. SEP was consid-ered the independent variable and sleep disturbances the dependent variable. Rating ofthe independent and the dependent variables of each study was performed by the twoco-authors. Studies employing subjective and community SEP indicators, self-reportedor non-diagnostic symptoms of EDS were downgraded. Blinding of outcome assessorswas non-applicable in self-reported outcomes. Age, gender and race were consideredessential confounders in statistical analyses, while body mass index or obesity were alsorequired in studies assessing sleep-disordered breathing. Regarding overall quality rating,we calculated the proportion of positive rating on the sum of applicable criteria. Studieswith <50% positive rating were judged as poor quality, ≥65% as good quality and the restas fair quality, respectively.
Clocks&Sleep 2022, 4 243
Table 1. The data of kappa agreement during the selection and extraction of data from the studies.
Articles Included Kappa Articles Included Kappa Articles Included Kappa Articles Included Kappa1 Y 0.82 36 N 0.82 71 N 0.76 106 N 0.722 N 0.72 37 N 0.72 72 N 0.72 107 Y 0.763 N 0.9 38 N 0.72 73 N 0.73 108 N 0.744 N 0.77 39 N 0.79 74 N 0.80 109 N 0.785 N 0.80 40 N 0.81 75 N 0.86 110 N 0.836 N 0.74 41 N 0.65 76 N 0.74 111 N 0.827 N 0.84 42 N 0.89 77 N 0.69 112 N 0.818 N 0.67 43 N 0.84 78 N 0.72 113 N 0.789 N 0.80 44 N 0.78 79 N 0.74 114 N 0.74
10 N 0.67 45 N 0.83 80 N 0.81 115 N 0.7611 N 0.85 46 N 0.68 81 N 0.76 116 N 0.8312 N 0.79 47 N 0.67 82 N 0.74 117 N 0.7413 N 0.78 48 N 0.76 83 N 0.72 118 N 0.6814 Y 0.86 49 N 0.85 84 N 0.74 119 N 0.6215 N 0.92 50 N 0.84 85 N 0.73 120 N 0.6816 N 0.68 51 N 0.80 86 N 0.74 121 N 0.7217 N 0.81 52 N 0.70 87 N 0.75 122 Y 0.7618 N 0.81 53 Y 0.92 88 N 0.76 123 N 0.7419 N 0.64 54 Y 0.84 89 N 0.82 124 N 0.8220 N 0.69 55 N 0.83 90 N 0.63 125 N 0.7421 N 0.82 56 N 0.78 91 N 0.68 126 N 0.7122 N 0.81 57 N 0.71 92 N 0.71 127 N 0.6223 N 0.76 58 N 0.82 93 N 0.74 128 N 0.7824 N 0.74 59 N 0.79 94 N 0.75 129 N 0.8125 N 0.79 60 N 0.71 95 N 0.82 130 N 0.7226 N 0.75 61 N 0.84 96 N 0.68 131 N 0.7327 N 0.81 62 N 0.86 97 N 0.74 132 N 0.7628 N 0.86 63 N 0.90 98 N 0.76 133 Y 0.85
Clocks&Sleep 2022, 4 244
Table 1. Cont.
Articles Included Kappa Articles Included Kappa Articles Included Kappa Articles Included Kappa29 N 0.90 64 N 0.76 99 N 0.82 134 N 0.7430 N 0.68 65 N 0.78 100 N 0.86 135 N 0.6731 N 0.75 66 Y 0.74 101 N 0.81 136 N 0.6432 N 0.88 67 N 0.90 102 Y 0.78 137 N 0.7233 N 0.65 68 N 0.75 103 N 0.74 138 Y 0.7434 N 0.78 69 N 0.76 104 N 0.76 139 N 0.7635 N 0.74 70 N 0.81 105 N 0.82 140 N 0.74141 N 0.71 176 N 0.74 194 N 0.76 229 N 0.75142 N 0.87 177 N 0.74 195 Y 0.78 230 N 0.81143 N 0.74 178 N 0.82 196 N 0.74 231 Y 0.86144 N 0.64 179 Y 0.74 197 N 0.90 232 N 0.76145 N 0.74 180 N 0.71 198 N 0.75 233 N 0.74146 N 0.69 181 N 0.62 199 N 0.76 234 N 0.71147 N 0.72 182 N 0.78 200 N 0.81 235 N 0.87148 N 0.71 183 N 0.81 201 N 0.76 236 N 0.74149 N 0.74 184 N 0.72 202 N 0.72 237 N 0.64150 N 0.67 185 N 0.73 203 N 0.73 238 N 0.74151 N 0.82 186 N 0.76 204 N 0.80 239 N 0.69152 N 0.67 187 N 0.71 205 N 0.86 240 N 0.72153 N 0.64 188 N 0.82 206 N 0.90 241 N 0.71154 Y 0.90 189 N 0.79 207 N 0.77 242 N 0.74155 Y 0.76 190 N 0.71 208 N 0.80 243 N 0.74156 Y 0.82 191 N 0.84 209 N 0.74 244 N 0.82157 N 0.74 192 N 0.86 210 N 0.84 245 N 0.74158 N 0.76 176 N 0.74 211 N 0.67 246 N 0.71159 N 0.68 177 N 0.74 212 N 0.80 247 N 0.62160 N 0.85 178 N 0.82 213 N 0.67 248 N 0.78161 N 0.74 179 Y 0.74 214 N 0.85 249 Y 0.81162 N 0.67 180 N 0.71 215 N 0.79 250 N 0.62163 N 0.64 181 N 0.62 216 N 0.78 229 N 0.75

Clocks&Sleep 2022, 4 245
Table 1. Cont.
Articles Included Kappa Articles Included Kappa Articles Included Kappa Articles Included Kappa164 N 0.72 182 N 0.78 217 N 0.86 230 N 0.81165 N 0.74 183 N 0.81 218 N 0.92 231 Y 0.86166 N 0.76 184 N 0.72 219 Y 0.68 232 N 0.76167 N 0.74 185 N 0.73 220 N 0.81 233 N 0.74168 N 0.71 186 N 0.76 221 N 0.81 234 N 0.71169 N 0.87 187 N 0.71 222 N 0.64 235 N 0.87170 N 0.74 188 N 0.82 223 N 0.69 236 N 0.74171 N 0.64 189 N 0.79 224 N 0.82 237 N 0.64172 Y 0.74 190 N 0.71 225 N 0.81 238 N 0.74173 N 0.69 191 N 0.84 226 N 0.76 239 N 0.69174 N 0.72 192 N 0.86 227 N 0.74 240 N 0.72175 Y 0.71 193 N 0.90 228 N 0.79 241 N 0.71242 N 0.74 246 N 0.71 250 N 0.62 254 N 0.68243 N 0.74 247 N 0.62 251 N 0.75 255 N 0.74244 N 0.82 248 N 0.78 252 N 0.68 256 N 0.76245 N 0.74 249 Y 0.81 253 N 0.75 257 N 0.78
Y = Yes; N = No.

Clocks&Sleep 2022, 4 246
3. Results3.1. Characteristics of Studies
Twenty studies [7,13,18–24,27,28,33–40] were included (Table 2), among which, nine-teen were cross-sectional studies [7,13,17–23,27,28,32–39] and one longitudinal study [41].Among these studies, 25.00% (n = 5) focused on children and adolescent [18,19,27,33] andthe remaining 75.00% (n = 15) focused on adults and old people [7,13,18,21–24,28,34–40].Among all these studies, 60.0% (n = 12) were performed in North America (ten in theUSA [7,17,20,21,27,28,33,34,37] and two in Canada [19,39]), 10.00% (n = 2) in Europe(Switzerland and Norway), 10.00% (n = 2) in South America (Brazil and Peru), 10.00%(n = 2) in Oceania (Australia and New Zealand) and 10.00% (n = 2) in Asia (Japan andIran). Ages ranged between 8 and 18 years old for children/adolescent and ranged from18 to 102 years old for adults. Eleven studies [18,20–24,33,34,38,39] among these twentyarticles have a majority of girls/women in their sample. Sample size in these studiesvaried from N = 90 ([13] until N = 33865 [37]. SEP measures presented in these stud-ies were education [13,18–23,28,34,35,37,38,40], income [7,18,20,22,27,28,33,38], employ-ment [7,13,17,20,22,35,38], perceived/subjective socioeconomic status (SES) [19,39], andcomposite index/tool using more than one SEP measure [24,36].
3.2. Synthesis of the Main Results
• Education: Lower education was related to increased perceived sleepiness [22]. Hav-ing lower education was associated with more daytime sleepiness [21]. Higher educa-tional attainment was associated with less excessive daytime sleepiness [37]. Men witha low educational level were more likely to suffer from poor sleep quality and shortsleep duration [35]. One study reported that higher level of maternal education wasnegatively related to EDS [20] and another one reported that EDS was not associatedwith educational status [40].
• Income: Lower income-to-needs ratio INR was related to increased sleepiness [27].Lower INR was associated with greater daytime sleepiness [33,41]. Lower familyincome was associated with EDS [23]. Lower income was associated with difficultyfalling asleep and having no private insurance was associated with sleep latency>30 min and non-restorative sleep [28]. The prevalence of EDS was lower in adultswith a higher family income [7].
• Employment: Individuals employed full-time had more sleepiness than those em-ployed part time or not employed [18]. Men with a low occupational position weremore likely to suffer from poor sleep quality and short sleep duration [35]. Men witha low occupational position were also more likely to have long sleep latency [35].Women with a low occupational position were more likely to have long sleep latency,excessive daytime sleepiness and short sleep duration [35]. One study reported thatoffice workers had lower EDS scores than line workers [13], and another one reportedthat there is no association between EDS and employment status [7].
• Perceived/subjective SES: In children, higher subjective SES predicted less daytimesleepiness in adolescents [41], higher subjective SES was associated with fewer sleepdisturbances [19]. Being in the highest deprivation quintile was a significant indepen-dent predictor of EDS [41], compared to being in the lowest deprivation quintile [24].Lower household food security was associated with poor sleep quality, short sleep du-ration and excessive daytime sleepiness [36]. Subjective SES better predicted daytimesleepiness than objective SES [39]. Lower SES was also associated with more excessivedaytime sleepiness [36]. One study reported that higher SES was associated withless daytime sleepiness [39] and another one reported that there was no associationbetween SES and EDS [38].

Clocks&Sleep 2022, 4 247
Table 2. Characteristics of included studies investigating the relation between SEP and sleepiness/excessive daytime sleepiness.
Children and Adolescents < 18 Years Old
Author Country Population Sample Size Mean or RangeAge (Years) % Women Study Design SES Measures Sleep Measures Findings Odds Ratio, p
Value, r
Pallesen 2011 [20] Norway
11th–13th gradeadolescents fromhigh schools in
Hordaland county
1279 N/A 62.4 Cross-sectional
Parentaleducation
(primary school,vocational/high
school, col-lege/university)
Behaviorally inducedinsufficient sleep
syndrome (excessivedaytime sleepiness,short habitual sleep
duration and sleepingconsiderably longerthan usual during
weekend/vacations)
Higher level ofmaternal
education wasnegatively
related to EDS
* Maternaleducation—EDS:
OR = 0.51* Urban
living—EDS:OR= 1.52* Grade
average—EDS:p < 0.01
Jarrin 2014 [19] Canada
Children andadolescents
recruited fromschools and
neighbourhoodsin Montreal
239 8–17(12.6 ± 1.9) 45.6 Cross-sectional
Objective SES:household income
(17 categories)and highest
parentaleducation (9categories)
Subjective SES:Subjective Social
Status Scale-YouthVersion (two
10-rung ladders:school and society,
youth reported)
Sleep quality(youth-rated, 10-point
scale)Daytime sleepiness
(youth-rated, PediatricDaytime Sleepiness
Scale)Sleep disturbances
(parent-rated,Children’s Sleep Habits
Questionnaire)Sleep duration (youth-and parent-reported)
In children,higher subjective
SES predictedless daytimesleepiness inadolescents,
higher subjectiveSES was
associated withfewer sleep
disturbances.
Subjective SESwas associatedwith daytime
sleepiness(p < 0.01)
Bagley 2015 [27] USA
Children recruitedfrom semirural
public schools inthe southeastern
US
271 11.33 ± 7.74 47 Cross-sectional
Income-to-needsratio (computed
by dividing familyincome by the
federal povertythreshold for thesame family size)
One-week actigraphy(sleep duration, night
waking duration,variability in sleep
schedule)School Sleep HabitsSurvey (Sleep/Wake
Problems Scale,Sleepiness Scale)
Lowerincome-to-needsratio was related
to increasedsleepiness.
A lowerincome-to-needs
ratio wasmoderatelyrelated toincreasedsleepiness(p = 0.01)

Clocks&Sleep 2022, 4 248
Table 2. Cont.
Children and Adolescents < 18 Years Old
Author Country Population Sample Size Mean or RangeAge (Years) % Women Study Design SES Measures Sleep Measures Findings Odds Ratio, p
Value, r
Tomaso 2020 [33] USA
Adolescentsmembers of a
cohort recruitedfrom
advertisements ina small city in the
Midwest US
184 11–14(12) 50.5 Cross-sectional
Familyincome-to-needsratio (dividing
family income byyear’s federal
poverty level for aspecific family
size)
Sleep wake problems(Sleep–Wake ProblemsBehavior Scale of theSleep Habits Survey)Daytime sleepiness
(Epworth SleepinessScale–Revised for
Children)
Lowerincome-to-needs
ratio wasassociated withgreater daytime
sleepiness
SES significantlypredicteddaytime
sleepiness(p = 0.009)
Philbrook2020[41] USA
Adolescentsrecruited throughflyers distributed
at local elementaryschools in
semirural areasand small townsin Alabama US
252
16 (Mage = 15.79years, SD ± 0.81),17 (Mage = 16.79years, SD ± 0.81),18 (Mage = 17.73years, SD ± 1.00)years across the
three waves
53 3-wavelongitudinal
Income-to-needs-ratio (INR)
derived fromfamilial income
range andreported house-
hold sizePerceivedeconomic
well-being
Sleep–wakeprocesses—sleep
quality and daytimesleepiness
(Two scales of thewell-established School
Sleep Habits Survey)
Family chaos isan intervening ormediator variable
in longitudinalassociations
betweenindicators of
lower SES andpoor quality ofsleep or greater
daytimesleepiness
* Lower INRand poor quality
of sleep(p < 0.01) and
higher levels ofchaos (p < 0.05)in which it actsas a mediator
* Lower INR anddaytime
sleepiness(p = 0.350) where
chaos is anintervening
variable(p < 0.05)
* Chaos is anintervening
variablebetweeneconomic
well-being andboth poor
quality of sleepand daytime
sleepiness(p < 0.01;p < 0.05)

Clocks&Sleep 2022, 4 249
Table 2. Cont.
Adults and Old People ≥ 18 Years Old
Author Country SampleCharacteristics Sample Size Mean or Range
Age (Years) % Women Type of Study SES Measures Sleep Measures Findings Odds Ratio, pValue, r
Breslau 1997 [18] USA
Adults insured ina health
maintenanceorganization in
southeastMichigan
973 26–36 62.4 Cross-sectional
Education (<highschool, highschool, some
college, college)Employment
status (employedfull-time vs.
employed parttime or
unemployed)
Daytime sleepiness(five items from theSleep–Wake Activity
Inventory)
Those employedfull-time had
more sleepinessthan those
employed parttime or notemployed
N/A
Doi 2003 [40] Japan
Workers of atelecommunica-
tions company inTokyo
4722 20–59 17.8 Cross-sectional Education (< or>high school)
Excessive daytimesleepiness (ESS score
>10)
EDS was notassociated with
educationalstatus
*Education-EDS:
OR=1.47,p = 0.001* Marital
status-EDS:OR = 1.61,p = 0.001
Hara 2004 [23] Brazil
1066 adults fromthe general
population inBambui
1066 NR 55.7 Cross-sectional
Years of education(0, 1–3, 4–7, 8+).
Monthly personalincome (none, <1,
1.0–1.9, ≥2.0Brazilian mini-mum wages);
Monthly familyincome
(<2.0, ≥2.0 Brazil-ian minimum
wages); Currentemployment
situation (student,working,
unemployed,retired)
Excessive daytimesleepiness three or
more times per weekwith consequent
impairmentof daily activities
Lower familyincome was
associated withEDS
* Maritalstatus-EDS:
p = 0.559* Education-EDS:
p = 0.138* Employment
status-EDS:p = 0.001
* Income-EDS:p = 0.001
Gander 2005 [24] New ZealandAdults from the
generalpopulation
5441 30–60 54 Cross-sectionalArea deprivationindex (divided in
quintiles)
EDS (EpworthSleepiness Scale score >
10)
Being in thehighest
deprivationquintile was a
significantindependent
predictor of EDS,compared tobeing in the
lowestdeprivation
quintile
Ethnicity-EDS:OR = 1.55,p < 0.0001

Clocks&Sleep 2022, 4 250
Table 2. Cont.
Adults and Old People ≥ 18 Years Old
Author Country SampleCharacteristics Sample Size Mean or Range
Age (Years) % Women Type of Study SES Measures Sleep Measures Findings Odds Ratio, pValue, r
Kim 2005 [22] USA
Adults part of acohort of
employees in fivestate agencies in
Wisconsin
2913 35–65(46.6 ± 7.9) 53.6 Cross-sectional
Education (somecollege or less,
college graduateor higher)
Excessive daytimesleepiness (13-item
questionnaire subjectedto factor analysis)
Lower educationwas related to
worse perceivedsleepiness
Education-EDS:p = 0.002
Baker 2009 [21] USAWomen from the
general USpopulation
959 18–64(45 ± 11.7) 100 Cross-sectional
Employmentstatus (working
full-time, workingmore than one job,working part time,
student,homemaker,unemployed,
retired ordisabled)
Education (highschool or less,
graduated fromhigh school, some
vocational orcollege courses,graduated from
college)Household
income (<$35,000,$35,000–$75,000,
>$75,000)
Sleep quality (singlequestion, dichotomous)
Daytime sleepiness(single question,
dichotomous)
Having lowereducation wasassociated withmore daytime
sleepiness
Education-EDS:p = 0.001
Grandner 2013[28] USA
Adults from thegeneral USpopulation
4081 46.54 ± 16.55 48.05 Cross-sectional
Householdincome (above vs.
below $20,000)Education level
(<9th grade, 9th to11th grade, highschool graduate,
some college,college graduate)Access to privatehealth insurance
(yes vs. no)Household food
security(combination of 18
items andcategorised as full,
marginal, low,very low)
Sleep latency >30 min(yes vs. no)
Insomnia symptoms(never, rarely,
sometimes, often,almost always)
Daytime sleepiness(never, rarely,
sometimes, often,almost always)
Sleep apnea symptoms(never, rarely,
sometimes, frequently)
Lower incomewas associatedwith difficultyfalling asleep,
lower educationwith sleep latency
> 30 min,non-restorative
sleep,snorting/gaspingand snoring, no
private insurancewith sleep latency
>30 min andnon-restorativesleep and lowerhousehold foodsecurity with all
symptoms
* Education-EDS: OR = 1.04* Income-EDS:
OR = 1.11*Marital
status-EDS:OR = 1.24,
p < 0.05* Ethnicity/Race-
EDS: OR = 0.8,p < 0.05
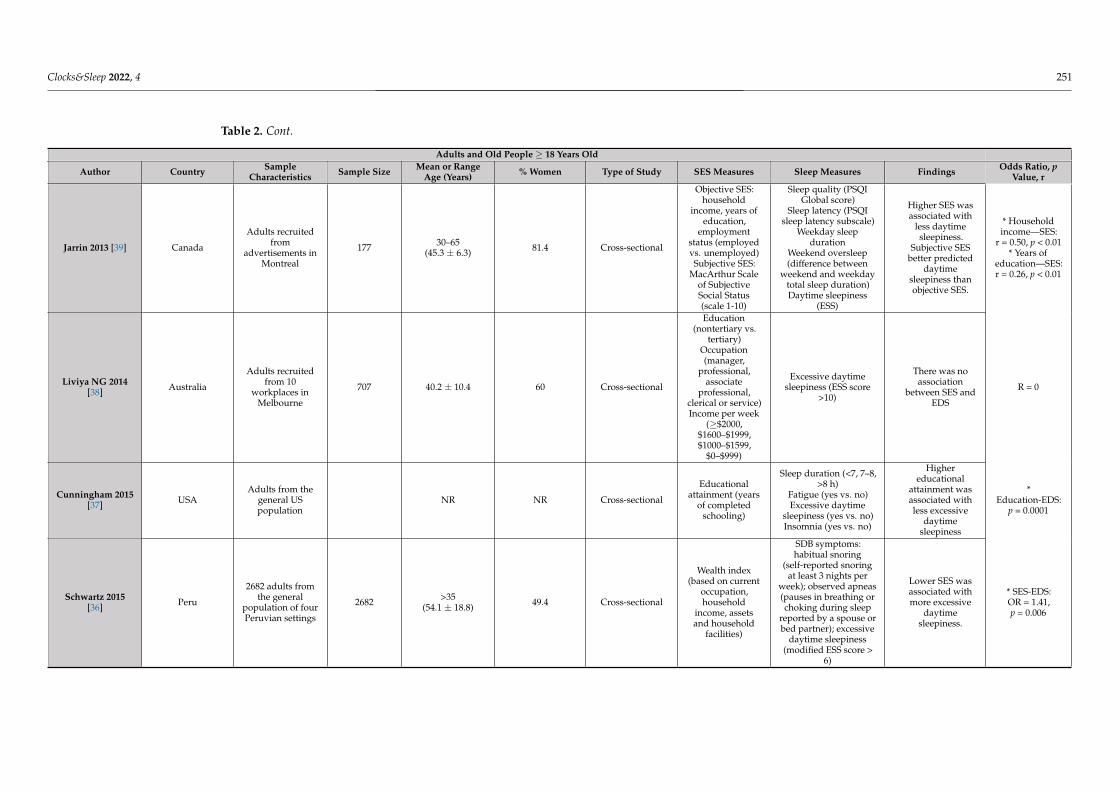
Clocks&Sleep 2022, 4 251
Table 2. Cont.
Adults and Old People ≥ 18 Years Old
Author Country SampleCharacteristics Sample Size Mean or Range
Age (Years) % Women Type of Study SES Measures Sleep Measures Findings Odds Ratio, pValue, r
Jarrin 2013 [39] Canada
Adults recruitedfrom
advertisements inMontreal
177 30–65(45.3 ± 6.3) 81.4 Cross-sectional
Objective SES:household
income, years ofeducation,
employmentstatus (employedvs. unemployed)Subjective SES:
MacArthur Scaleof SubjectiveSocial Status(scale 1-10)
Sleep quality (PSQIGlobal score)
Sleep latency (PSQIsleep latency subscale)
Weekday sleepduration
Weekend oversleep(difference between
weekend and weekdaytotal sleep duration)Daytime sleepiness
(ESS)
Higher SES wasassociated with
less daytimesleepiness.
Subjective SESbetter predicted
daytimesleepiness thanobjective SES.
* Householdincome—SES:
r = 0.50, p < 0.01* Years of
education—SES:r = 0.26, p < 0.01
Liviya NG 2014[38] Australia
Adults recruitedfrom 10
workplaces inMelbourne
707 40.2 ± 10.4 60 Cross-sectional
Education(nontertiary vs.
tertiary)Occupation(manager,
professional,associate
professional,clerical or service)Income per week
(≥$2000,$1600–$1999,$1000–$1599,
$0–$999)
Excessive daytimesleepiness (ESS score
>10)
There was noassociation
between SES andEDS
R = 0
Cunningham 2015[37] USA
Adults from thegeneral USpopulation
NR NR Cross-sectional
Educationalattainment (years
of completedschooling)
Sleep duration (<7, 7–8,>8 h)
Fatigue (yes vs. no)Excessive daytime
sleepiness (yes vs. no)Insomnia (yes vs. no)
Highereducational
attainment wasassociated withless excessive
daytimesleepiness
*Education-EDS:
p = 0.0001
Schwartz 2015[36] Peru
2682 adults fromthe general
population of fourPeruvian settings
2682 >35(54.1 ± 18.8) 49.4 Cross-sectional
Wealth index(based on current
occupation,household
income, assetsand household
facilities)
SDB symptoms:habitual snoring
(self-reported snoringat least 3 nights per
week); observed apneas(pauses in breathing orchoking during sleep
reported by a spouse orbed partner); excessive
daytime sleepiness(modified ESS score >
6)
Lower SES wasassociated withmore excessive
daytimesleepiness.
* SES-EDS:OR = 1.41,p = 0.006

Clocks&Sleep 2022, 4 252
Table 2. Cont.
Adults and Old People ≥ 18 Years Old
Author Country SampleCharacteristics Sample Size Mean or Range
Age (Years) % Women Type of Study SES Measures Sleep Measures Findings Odds Ratio, pValue, r
Stringhini 2015[35] Switzerland
Adults from thegeneral
population inLausanne
3391 40–81 47.4 Cross-sectional
Educational level(high, middle,
low)Occupationalposition (high,middle, low)
Subjective sleepassessment: sleep
quality (PSQI globalscore > 5), sleep latency
(>30 min), daytimesleepiness (ESS score >10), sleep duration (<5h), insomnia (from 2
items in PSQI)Objective sleep
assessment: total sleeptime, sleep latency,
slow wave sleep, sleepefficiency, stage shifts
(in-home 1-night * PSGin a subsample of 1569
participants)
Men with a loweducational levelor occupationalposition weremore likely to
suffer from poorsleep quality,short sleep
duration andinsomnia. Men
with a lowoccupationalposition were
also more likelyto have longsleep latency.
Women with alow educationallevel were more
likely to havelong sleep latency
and short sleepduration. Women
with a lowoccupationalposition weremore likely to
have long sleeplatency, excessive
daytimesleepiness and
short sleepduration.
Participants withlow SES hadlower sleep
efficiency andhigher stageshifts in PSG.
* Men with loweducational and
occupationalposition—ESS:
p < 0.001* Men with low
occupationalposition have
long sleeplatency:
OR = 4.90* Women withlow education
have long sleeplatency andshort sleepduration:OR = 2.09;OR = 2.26
* Sleepefficiency—low
SES: p < 0.05* Low
SES—higherstage shifts:
p < 0.05
Miner 2018 [34] USACommunity-
dwelling elderlypersons
357 78–102(84.2 ± 4.4) 67.8 Cross-sectional Education (high
school vs. higher)Epworth Sleepiness
Scale (≥10)
No associationbetween
education andEDS
R = 0

Clocks&Sleep 2022, 4 253
Table 2. Cont.
Adults and Old People ≥ 18 Years Old
Author Country SampleCharacteristics Sample Size Mean or Range
Age (Years) % Women Type of Study SES Measures Sleep Measures Findings Odds Ratio, pValue, r
Kolla 2020 [7] USACommunity-
dwellingadults
5692 18–60 27.4 Cross-sectional
Family income(low, low-average,
high-average,high)
Employmentstatus (working,
student,homemaker,
retired)
Interview
The prevalence ofEDS was lower in
adults with ahigher family
incomeNo association
between EDS andemployment
status
* EDS—lowincome: OR: 1.21
* Low averageincome:
OR = 1.36* High average
income: OR: 1.24* EDS—workers,
students,homemakers or
retired:OR = 0.88–0.89
Mokarami 2020[13] Iran Workers in a brick
factory 90 22–68(35.6 ± 4.3) 0 Cross-sectional
Education(elementary,
diploma,university)
Occupational title(office vs. line
workers)
Epworth SleepinessScale
No associationbetween
education andEDS
Office workershad lower ESSscores than line
workers
Occupation-EDS:p = 0.0001
* SES = socioeconomic status; PSQI = Pittsburgh Sleep Quality Index; DSM = Diagnostic and Statistical Manual of Mental Disorders; SDB = sleep-disordered breathing; ESS = EpworthSleepiness Scale; EDS = excessive daytime sleepiness; OSA = obstructive sleep apnea; ICD = International Statistical Classification of Diseases and Related Health Problems;BIISS = behaviorally induced insufficient sleep syndrome, NR = Non Reported, PSG = polysomnography.

Clocks&Sleep 2022, 4 254
Table 3. Quality rating of included studies using the National Institute of Health’s Quality Assessment Tool for Observational Cohort and Cross-Sectional Studies.
Study Q1 Q2 Q3 Q4 Q5 Q6 Q7 Q8 Q9 Q10 Q11 Q12 Q13 Q14 Quality RatingBreslau 1997 [18] Y Y Y Y N N N Y Y N N NA NA Y Fair
Doi 2003 [40] Y Y Y Y N N N N Y N N NA NA Y FairHara 2004 [23] Y Y Y Y N N N Y Y N N NA NA N Fair
Gander 2005 [24] Y Y Y Y N N N Y N N N NA NA Y FairKim 2005 [22] Y Y NR Y N N N N Y N N NA NA Y Poor
Baker 2009 [21] Y Y N Y N N N Y Y N N NA NA Y FairPallesen 2011 [20] Y N Y Y N N N Y Y N Y NA NA Y FairAnsarin 2013 [42] Y Y Y Y N N N Y Y N N NA NA Y Fair
Grandner 2013 [28] Y Y Y Y N N N Y Y N N NA NA Y FairJarrin 2013 [39] Y N NA Y N N N Y Y N N NA NA Y PoorJarrin 2014 [19] Y N NA Y N N N Y Y N N NA NA Y Poor
Liviya NG 2014 [38] Y Y NR Y N N N Y Y N N NA NA Y FairBagley 2015 [27] Y Y Y Y N N N Y Y N Y Y NA Y Good
Cunningham 2015 [37] Y Y Y Y N N N Y Y N N NA NA Y FairSchwartz 2015 [36] Y Y N Y N N N Y Y N N NA NA Y Fair
Stringhini 2015 [35] Y Y Y Y N N N Y Y N Y NR NA Y FairMiner 2018 [34] Y Y Y Y N N N N Y N N NA NA Y Fair
Tomaso 2018 [33] Y N Y Y N N N N Y N N NA NA Y PoorKolla 2020 [7] Y Y Y Y N N N Y Y N Y Y NA Y Good
Mokarami 2020 [13] Y Y Y Y N N N Y Y N Y Y NA Y GoodPhilbrook 2020 [41] Y Y Y Y N N N Y Y N Y Y NA Y Good
Y = Yes; N = No; CD = cannot determine; NA = not applicable; NR = not reported.

Clocks&Sleep 2022, 4 255
4. Discussion
The aim of the present systematic review of observational cohort longitudinal andcross-sectional studies is to provide the current status of knowledge on the link betweensocioeconomic position (SEP) and excessive daytime sleepiness (EDS). Overall, a lowereducational level, a lower income and full-time employment were associated with moreexcessive daytime sleepiness (Table 2). EDS symptoms are prevalent in women, especiallythose with a low income or no job [21]; and finally, children and adolescents with difficultliving conditions or working part time reported more sleep disturbances [19,23,27].
• Association between EDS and SEP in children and minors
EDS was evaluated among young children and minors, a population in which de-velopment and growth rely on many physiological processes, including sleep. However,their sleep needs are often unmet. The actual average number of hours slept for minorswas 6.7 h on weekdays and 7.4 on weekends [17,22,38,42]. EDS was inversely related tothe number of hours of sleep and was associated with lower grade average and elevatedscores of anxiety and depression [13,17,43]. These results, along with other studies, showthat sleep disturbances are linked to poor academic performance, cognitive impairmentand mental issues [37,43]. Disruptive sleep environment, conditions non-conducive tosleep or great worries could explain why children living in disadvantageous conditionshave more sleep disturbances [21]. Moreover, the omnipresence of technological devices,the commotion of urban environment as well remunerated work influences their sleepduration and quality [13,43].
• Association between EDS and SEP in adults
Low SEP was strongly associated with poor sleep quality in adults. Important factorssuch as workload, varying shifts, family commitments or financial stress could account forthe observed disparity in the burden of sleep disturbances on people with low SEP [35]. Thisassociation persists even after the adjustment for other sociodemographic, psychological orbehavioral factors [35].
Moreover, EDS symptoms seem to be more frequent in women, especially in those witha lower family income or no job [21]. Women consider psychological factors to be the mostimportant causes of sleep disturbances [20,44,45], therefore a low SEP could be perceivedas a bigger burden by females rather than males. Furthermore, anxiety is significantly morecommon in females. However, psychological stress could be a consequence rather than acause [44,46]. Women included in sleep health studies are often of the childbearing age,therefore, the higher number of sleep disturbance complaints could be due to the presenceof young children [27,44,45].
• Association between EDS and SEP in people with mental, physical and functionaldisability
Excessive daytime sleepiness was also significantly associated with mental disorders,chronic physical conditions and greater functional disability among vulnerable popula-tions [7]. Sleep disturbance is commonly observed in a wide range of psychiatric disordersreported by disadvantaged communities [17,45] and sleep disturbances increase negativeemotions and decrease positive emotional responses among these communities more thantheir pairs [47].
EDS also seems to be more prevalent in low SEP individuals with chronic conditionsthan high SEP people with the same chronic conditions [48]. These chronic conditions suchas diabetes, arthritis and obesity have been linked to poor quality of sleep [7,36,49], whichin turn partly explains the high prevalence of sleep disturbances that have been observedin the elderly population [22,38,46].
• Association between EDS and SEP in the elderly
The lack of a significant association between sleep disturbances and SEP in geriatricresearch may be due to the presence of comorbidities. Multiple chronic diseases can cause

Clocks&Sleep 2022, 4 256
bodily pain and can cause sleep disturbance independently of SEP. Reports of daily bodilypain account for 35% of complaints of sleep disturbance, including EDS [48].
Other factors that contribute to sleep problems in old age independently of SEP arechanges in social engagement and lifestyle [49]. As their daily demands diminish andlifestyle becomes more sedentary, alteration in their sleep might not be as noticeable [50].Furthermore, there are normal physiological alterations in sleep that arise with olderage [51]. These changes include shortened nocturnal sleep duration as well as a higherfrequency of daytime napping [51]. Although more studies are required to understandthe association between sleep disturbances and SEP, the findings of this review point outa potential relationship that deserves more investigations. As previously mentioned, theolder population often suffers from multiple diseases, therefore, those with no healthinsurance might be more worried about their medical expenses, which in turn might impairtheir sleep quality [51].
• Recommendation for future sleep research
Given the wide range of negative impacts associated with EDS, further researchneeds to be conducted to raise awareness among healthcare workers and improve clinicalguidelines. Social class is a strong predictor of health outcomes and yet, it is a variable thatremains particularly underexamined in sleep science. It is vital to gather more informationabout the contribution of other SEP parameters on EDS, such as access to insurance,ethnicity or immigration status. The temporality of the relationship between EDS and SEPneeds to be further assessed in longitudinal studies, rather than cross-sectional, which candiscern the direction of the interaction and allow clear causality interpretations on howSEP influences EDS. In order to implement and design clinical and public health initiativesto improve the overall population health and reduce the gap in health disparities, inclusionof objective measures of sleep, obtained by actigraphy or polysomnography should beincluded in future research [52,53]. Considering that sleep is an intricate and individualprocess that is heavily influenced by complex and dynamic interrelations across a lifetime,the development of a multivariable model that allows to consider and describe the variousmodifiable factors that take play in EDS would lead to better novel clinical interventions.Figure 2 presents a biopsychosocial model of EDS that considers the various interactionsbetween societal, social and individual factors.
Clocks&Sleep 2022, 4, FOR PEER REVIEW 19
Figure 2. The biopsychosocial model of excessive daytime sleepiness.
5. Conclusions Modern medical care revolves mainly on a biomedical model where quantitative
measurements are very often considered the gold standard for clinical practice as well as public health administrators. However, this approach has limitations in assessing long-term health outcomes and their relationship with socioeconomic disparities. SEP isalready considered as an important determinant for many health outcomes, but if SEP is embedded in experimental design in psychosomatic research, biomedical research and clinical practice as a constant variable regardless of outcome, it will move forward futureinvestigations. It is a challenge to capture the multidimensional nature of SEP, whichhighlights the need for better measures that would be comparable among various populations and across different types of studies. Future research is still required to understand how socioeconomic status, social class and socioeconomic position influence sleep health while analyzing possible mediators and moderators. Achieving a sustainable and wide impact on sleep disparities is a challenging feat that requires a coordination ofefforts of various systems to instill a perceivable change.
Author Contributions: Conceptualization, I.B. and F.A.E.S.; methodology, F.A.E.S.; formal analysis, I.B.; investigation, F.A.E.S.; writing—original draft preparation, I.B. and F.A.E.S.; writing—review and editing, I.B. and F.A.E.S. All authors have read and agreed to the published version of themanuscript.
Funding: This research received no external funding.
Conflicts of Interest: The authors declare no conflict of interest.
Figure 2. The biopsychosocial model of excessive daytime sleepiness.
Clocks&Sleep 2022, 4 257
The recent shift in the societal paradigm accompanied by technological advancesrender our lifestyles incompatible with good sleep. The incessant need for productivityand the increasing hours of work have impacted the quality and quantity of sleep thataffects mostly developed countries. Furthermore, the abundant availability of technologicaldevices has also diminished the duration of sleep that affects people of all ages. Theproliferation of screens and electronics increases our exposure to blue wavelengths, whichin turn suppresses the secretion of melatonin. This phenomenon has been linked to diabetes,obesity, as well as depression.
On a smaller scale, SEP reflects the conditions of an individual’s environment, suchas their community, workspace and family. Sleep is an intricate process that is heavilyaffected by environmental cues; thus, a lower SEP is linked to more sleep disturbances,more worries and anxiety that all lead to poor sleep hygiene. Socioeconomic disparitycreates a greater gap between different individuals, based on their age, sex or ethnicity.
Although sleep is impacted by the larger spheres of society and community, it is apersonal physiological function. Therefore, the lifestyle, behavior and psychology of theindividual is of the utmost importance. Behavioral risk factors such as smoking, drinking,drug use or eating disorders are linked with a lower SEP as well as with poor healthoutcomes (including sleep health). Disadvantageous living conditions impact sleep healthdirectly and indirectly via mental health. The bidirectional association between sleep andmental health is significant and could account for a large part of sleep disorders.
5. Conclusions
Modern medical care revolves mainly on a biomedical model where quantitativemeasurements are very often considered the gold standard for clinical practice as well aspublic health administrators. However, this approach has limitations in assessing long-term health outcomes and their relationship with socioeconomic disparities. SEP is alreadyconsidered as an important determinant for many health outcomes, but if SEP is embeddedin experimental design in psychosomatic research, biomedical research and clinical practiceas a constant variable regardless of outcome, it will move forward future investigations. Itis a challenge to capture the multidimensional nature of SEP, which highlights the need forbetter measures that would be comparable among various populations and across differenttypes of studies. Future research is still required to understand how socioeconomic status,social class and socioeconomic position influence sleep health while analyzing possiblemediators and moderators. Achieving a sustainable and wide impact on sleep disparitiesis a challenging feat that requires a coordination of efforts of various systems to instill aperceivable change.
Author Contributions: Conceptualization, I.B. and F.A.E.S.; methodology, F.A.E.S.; formal analysis,I.B.; investigation, F.A.E.S.; writing—original draft preparation, I.B. and F.A.E.S.; writing—review andediting, I.B. and F.A.E.S. All authors have read and agreed to the published version of the manuscript.
Funding: This research received no external funding.
Conflicts of Interest: The authors declare no conflict of interest.
References1. Ma, Y.; Hu, Z.; Qin, X.; Chen, R.; Zhou, Y. Prevalence and socio-economic correlates of insomnia among older people in Anhui,
China. Australas. J. Ageing 2018, 37, E91–E96. [CrossRef] [PubMed]2. Berhanu, H.; Mossie, A.; Tadesse, S.; Geleta, D. Prevalence and Associated Factors of Sleep Quality among Adults in Jimma Town,
Southwest Ethiopia: A Community-Based Cross-Sectional Study. Sleep Disord. 2018, 2018, 1–10. [CrossRef] [PubMed]3. Foroughi, M.; Malekmohammad, M.; Sharafkhaneh, A.; Emami, H.; Adimi, P.; Khoundabi, B. Prevalence of Obstructive Sleep
Apnea in a High-Risk Population Using the Stop-Bang Questionnaire in Tehran, Iran. Tanaffos 2017, 16, 217–224.4. Seyedmehdi, S.M.; Rahnama, N.; Yazdanparast, T.; Jamaati, H.; Attarchi, M.; Naghan, P.A.; Hassani, S. Prevalence of snoring and
the risk of sleep apnea in hospital staff. Work 2016, 55, 765–772. [CrossRef] [PubMed]5. Safak, E.D.; Gocer, S.; Mucuk, S.; Ozturk, A.; Akin, S.; Arguvanli, S.; Mazicioglu, M.M. The prevalence and related factors of
restless leg syndrome in the community dwelling elderly; in Kayseri, Turkey: A cross-sectional study. Arch. Gerontol. Geriatr.2016, 65, 29–35. [CrossRef] [PubMed]

Clocks&Sleep 2022, 4 258
6. Papadopoulos, D.; Sosso, F.E.; Khoury, T.; Surani, S.R. Sleep Disturbances Are Mediators Between Socioeconomic Status andHealth: A Scoping Review. Int. J. Ment. Health Addict. 2020, 20, 480–504. [CrossRef]
7. Kolla, B.P.; He, J.-P.; Mansukhani, M.; Frye, M.A.; Merikangas, K. Excessive sleepiness and associated symptoms in the U.S. adultpopulation: Prevalence, correlates, and comorbidity. Sleep Health 2019, 6, 79–87. [CrossRef]
8. Rodriguez, J.M.; Karlamangla, A.S.; Gruenewald, T.L.; Miller-Martinez, D.; Merkin, S.S.; Seeman, T.E. Social stratification andallostatic load: Shapes of health differences in the MIDUS study in the United States. J. Biosoc. Sci. 2019, 51, 627–644. [CrossRef]
9. Lei, W.-Y.; Chang, W.-C.; Wong, M.-W.; Hung, J.-S.; Wen, S.-H.; Yi, C.-H.; Liu, T.-T.; Chen, J.-H.; Hsu, C.-S.; Hsieh, T.-C.; et al. SleepDisturbance and Its Association with Gastrointestinal Symptoms/Diseases and Psychological Comorbidity. Digestion 2019, 99,205–212. [CrossRef]
10. Peltzer, K.; Pengpid, S. Self-Reported Sleep Duration and Its Correlates with Sociodemographics, Health Behaviours, Poor MentalHealth, and Chronic Conditions in Rural Persons 40 Years and Older in South Africa. Int. J. Environ. Res. Public Health 2018, 15,1357. [CrossRef]
11. Wang, S.; Li, B.; Wu, Y.; Ungvari, G.S.; Ng, C.H.; Fu, Y.; Kou, C.; Yu, Y.; Sun, H.Q.; Xiang, Y.T. Relationship of Sleep Duration withSociodemographic Characteristics, Lifestyle, Mental Health, and Chronic Diseases in a Large Chinese Adult Population. J. Clin.Sleep Med. Off. Publ. Am. Acad. Sleep Med. 2017, 13, 377–384. [CrossRef] [PubMed]
12. Canuto, R.; Garcez, A.S.; Olinto, M.T. Metabolic syndrome and shift work: A systematic review. Sleep Med. Rev. 2013, 17, 425–431.[CrossRef] [PubMed]
13. Mokarami, H.; Gharibi, V.; Kalteh, H.O.; Kujerdi, M.F.; Kazemi, R. Multiple environmental and psychosocial work risk factorsand sleep disturbances. Int. Arch. Occup. Environ. Health 2020, 93, 623–633. [CrossRef] [PubMed]
14. Etindele-Sosso, F.A. Insomnia, excessive daytime sleepiness, anxiety, depression and socioeconomic status among customerservice employees in Canada. Sleep Sci. 2020, 13, 54–64.
15. Wong, K.; Chan, A.H.S.; Ngan, S.C. The Effect of Long Working Hours and Overtime on Occupational Health: A Meta-Analysisof Evidence from 1998 to 2018. Int. J. Environ. Res. Public Health 2019, 16, 2102. [CrossRef]
16. McWhirter, D.; Bae, C.; Budur, K. The assessment, diagnosis, and treatment of excessive sleepiness: Practical considerations forthe psychiatrist. Psychiatry 2007, 4, 26–35.
17. American Psychiatric Association. Diagnostic and Statistical Manual of Mental Disorders, 5th ed.; American Psychiatric Association:Washington, DC, USA, 2013.
18. Breslau, N.; Roth, T.; Rosenthal, L.; Andreski, P. Daytime sleepiness: An epidemiological study of young adults. Am. J. PublicHealth 1997, 87, 1649–1653. [CrossRef]
19. Jarrin, D.C.; McGrath, J.J.; Quon, E.C. Objective and subjective socioeconomic gradients exist for sleep in children and adolescents.Health. Psychol. Off. J. Div. Health Psychol. Am. Psychol. Assoc. 2014, 33, 301–305. [CrossRef]
20. Pallesen, S.; Saxvig, I.W.; Molde, H.; Sørensen, E.; Wilhelmsen-Langeland, A.; Bjorvatn, B. Brief report: Behaviorally inducedinsufficient sleep syndrome in older adolescents: Prevalence and correlates. J. Adolesc. 2011, 34, 391–395. [CrossRef]
21. Baker, F.C.; Wolfson, A.R.; Lee, K.A. Association of sociodemographic, lifestyle, and health factors with sleep quality and daytimesleepiness in women: Findings from the 2007 National Sleep Foundation “Sleep in America Poll”. J. Women’s Health 2009, 18,841–849. [CrossRef]
22. Kim, H.; Young, T. Subjective Daytime Sleepiness: Dimensions and Correlates in the General Population. Sleep 2005, 28, 625–634.[CrossRef] [PubMed]
23. Hara, C.; Rocha, F.L.; Lima-Costa, M.F. Prevalence of excessive daytime sleepiness and associated factors in a Brazilian community:The Bambui study. Sleep Med. 2004, 5, 31–36. [CrossRef] [PubMed]
24. Gander, P.H.; Marshall, N.S.; Harris, R.; Reid, P. The Epworth Sleepiness Scale: Influence of Age, Ethnicity, and SocioeconomicDeprivation. Epworth Sleepiness Scores of Adults in New Zealand. Sleep 2005, 28, 249–254. [CrossRef] [PubMed]
25. Sosso, F.E.; Matos, E. Socioeconomic disparities in obstructive sleep apnea: A systematic review of empirical research. Sleep Breath.2021, 25, 1729–1739. [CrossRef] [PubMed]
26. Petrovic, D.; Haba-Rubio, J.; Carmeli, C.; Vollenweider, P.; Heinzer, R.; Stringhini, S. Social inequalities in sleep-disorderedbreathing: Evidence from the CoLaus|HypnoLaus study. J. Sleep Res. 2019, 28, e12799. [CrossRef]
27. Bagley, E.J.; Kelly, R.J.; Buckhalt, J.A.; El-Sheikh, M. What keeps low-SES children from sleeping well: The role of presleep worriesand sleep environment. Sleep Med. 2014, 16, 496–502. [CrossRef]
28. Grandner, M.A.; Petrov, M.E.; Rattanaumpawan, P.; Jackson, N.; Platt, A.; Patel, N.P. Sleep symptoms, race/ethnicity, andsocioeconomic position. J. Clin. Sleep Med. Off. Publ. Am. Acad. Sleep Med. 2013, 9, 897–905. [CrossRef]
29. Adams, J. Socioeconomic position and sleep quantity in UK adults. J. Epidemiol. Community Health 2006, 60, 267–269. [CrossRef]30. Silva-Perez, L.J.; Gonzalez-Cardenas, N.; Surani, S.; Sosso, F.E.; Surani, S.R. Socioeconomic Status in Pregnant Women and Sleep
Quality During Pregnancy. Cureus 2019, 11, e6183. [CrossRef]31. Hale, L.; Troxel, W.; Buysse, D.J. Sleep Health: An Opportunity for Public Health to Address Health Equity. Annu. Rev. Public
Health 2020, 41, 81–99. [CrossRef]32. Page, M.J.; McKenzie, J.E.; Bossuyt, P.M.; Boutron, I.; Hoffmann, T.C.; Mulrow, C.D.; Shamseer, L.; Tetzlaff, J.M.; Akl, E.A.;
Brennan, S.E.; et al. The PRISMA 2020 statement: An updated guideline for reporting systematic reviews. BMJ 2021, 372, 105906.[CrossRef]

Clocks&Sleep 2022, 4 259
33. Tomaso, C.C.; Nelson, J.M.; Espy, K.A.; Nelson, T.D. Associations between different components of executive control in childhoodand sleep problems in early adolescence: A longitudinal study. J. Health Psychol. 2018, 25, 2440–2452. [CrossRef] [PubMed]
34. Miner, B.; Gill, T.M.; Yaggi, H.K.; Redeker, N.S.; Van Ness, P.H.; Han, L.; Fragoso, C.A.V. Insomnia in Community-Living Personswith Advanced Age. J. Am. Geriatr. Soc. 2018, 66, 1592–1597. [CrossRef] [PubMed]
35. Stringhini, S.; Haba-Rubio, J.; Marques-Vidal, P.; Waeber, G.; Preisig, M.; Guessous, I.; Bovet, P.; Vollenweider, P.; Tafti, M.; Heinzer,R. Association of socioeconomic status with sleep disturbances in the Swiss population-based CoLaus study. Sleep Med. 2015, 16,469–476. [CrossRef] [PubMed]
36. Schwartz, N.G.; Rattner, A.; Schwartz, A.R.; Mokhlesi, B.; Gilman, R.H.; Bernabe-Ortiz, A.; Miranda, J.J.; Checkley, W. SleepDisordered Breathing in Four Resource-Limited Settings in Peru: Prevalence, Risk Factors, and Association with Chronic Diseases.Sleep 2015, 38, 1451–1459. [CrossRef]
37. Cunningham, T.J.; Ford, E.S.; Chapman, D.P.; Liu, Y.; Croft, J.B. Independent and joint associations of race/ethnicity andeducational attainment with sleep-related symptoms in a population-based US sample. Prev. Med. 2015, 77, 99–105. [CrossRef]
38. Ng, W.L.; Freak-Poli, R.; Peeters, A. The Prevalence and Characteristics Associated With Excessive Daytime Sleepiness AmongAustralian Workers. J. Occup. Environ. Med. 2014, 56, 935–945. [CrossRef]
39. Jarrin, D.C.; McGrath, J.J.; Silverstein, J.E.; Drake, C. Objective and Subjective Socioeconomic Gradients Exist for Sleep Quality,Sleep Latency, Sleep Duration, Weekend Oversleep, and Daytime Sleepiness in Adults. Behav. Sleep Med. 2013, 11, 144–158.[CrossRef]
40. Doi, Y.; Minowa, M.; Tango, T. Impact and Correlates of Poor Sleep Quality in Japanese White-Collar Employees. Sleep 2003, 26,467–471. [CrossRef]
41. Philbrook, L.E.; Saini, E.K.; Fuller-Rowell, T.E.; Buckhalt, J.A.; El-Sheikh, M. Socioeconomic status and sleep in adolescence: Therole of family chaos. J. Fam. Psychol. 2020, 34, 577–586. [CrossRef]
42. Ansarin, K.; Sahebi, L.; Sabur, S. Obstructive sleep apnea syndrome: Complaints and housing characteristics in a population inthe United States. Sao Paulo Med. J. 2013, 131, 220–227. [CrossRef] [PubMed]
43. Stamatakis, K.A.; Kaplan, G.A.; Roberts, R.E. Short Sleep Duration Across Income, Education, and Race/Ethnic Groups:Population Prevalence and Growing Disparities During 34 Years of Follow-Up. Ann. Epidemiol. 2007, 17, 948–955. [CrossRef][PubMed]
44. Lindberg, E.; Janson, C.; Gislason, T.; Björnsson, E.; Hetta, J.; Boman, G. Sleep Disturbances in a Young Adult Population: CanGender Differences Be Explained by Differences in Psychological Status? Sleep 1997, 20, 381–387. [CrossRef] [PubMed]
45. Benca, R.M.; Obermeyer, W.H.; Thisted, R.A.; Gillin, J.C. Sleep and psychiatric disorders. A meta-analysis. Arch. Gen. Psychiatry1992, 49, 651–670. [CrossRef]
46. Arber, S.; Bote, M.; Meadows, R. Gender and socio-economic patterning of self-reported sleep problems in Britain. Soc. Sci. Med.2009, 68, 281–289. [CrossRef]
47. El-Sheikh, M.; Buckhalt, J.A.; Cummings, E.M.; Keller, P. Sleep disruptions and emotional insecurity are pathways of risk forchildren. J. Child Psychol. Psychiatry 2006, 48, 88–96. [CrossRef]
48. Foley, D.; Ancoli-Israel, S.; Britz, P.; Walsh, J. Sleep disturbances and chronic disease in older adults: Results of the 2003 NationalSleep Foundation Sleep in America Survey. J. Psychosom. Res. 2004, 56, 497–502. [CrossRef]
49. Andrew, M.K. CHAPTER 33—Social Vulnerability in Old Age. In Brocklehurst’s Textbook of Geriatric Medicine and Gerontology, 7thed.; Fillit, H.M., Rockwood, K., Woodhouse, K., Eds.; W.B. Saunders: Philadelphia, PA, USA, 2010; pp. 198–204.
50. Hoyos, C.M.; Gordon, C.; Terpening, Z.; Norrie, L.; Lewis, S.J.G.; Hickie, I.B.; Naismith, S.L. Circadian rhythm and sleepalterations in older people with lifetime depression: A case-control study. BMC Psychiatry 2020, 20, 1–9. [CrossRef]
51. Li, J.; Vitiello, M.V.; Gooneratne, N.S. Sleep in Normal Aging. Sleep Med. Clin. 2018, 13, 1–11. [CrossRef]52. Etindele Sosso, F.A.; Holmes, S.D.; Weinstein, A.A. Influence of socioeconomic status on objective sleep measurement: A
systematic review and meta-analysis of actigraphy studies. Sleep Health 2021, 74, 417–428. [CrossRef]53. Etindele Sosso, F.A. Measuring Sleep Health Disparities with Polysomnography: A Systematic Review of Preliminary Findings.
Clocks&Sleep 2022, 4, 80–87.
Copyright © 2022 FDOKUMEN