Psychopathy increases perceived moral permissibility of accidents
This article was published in an Elsevier journal. The attached copyis furnished to the author for non-commercial research and
education use, including for instruction at the author’s institution,sharing with colleagues and providing to institution administration.
Other uses, including reproduction and distribution, or selling orlicensing copies, or posting to personal, institutional or third party
websites are prohibited.
In most cases authors are permitted to post their version of thearticle (e.g. in Word or Tex form) to their personal website orinstitutional repository. Authors requiring further information
regarding Elsevier’s archiving and manuscript policies areencouraged to visit:
http://www.elsevier.com/copyright
Author's personal copy
Monitoring sleepiness with on-board electrophysiological recordingsfor preventing sleep-deprived traffic accidents
Christos Papadelis a,*, Zhe Chen a,b, Chrysoula Kourtidou-Papadeli c,Panagiotis D. Bamidis a, Ioanna Chouvarda a, Evangelos Bekiaris d, Nikos Maglaveras a
a Aristotle University of Thessaloniki, School of Medicine, Laboratory of Medical Informatics, P.O. Box 323, 54124 Thessaloniki, Greeceb RIKEN Brain Science Institute, Laboratory for Advanced Brain Signal Processing, Wako, Saitama, Japan
c Greek Aerospace Medical Association and Space Research, Thessaloniki, Greeced Center for Research and Technology, Hellenic Institute of Transport, Thessaloniki, Greece
See Editorial, pages 1899–1900
Abstract
Objective: The objective of this study is the development and evaluation of efficient neurophysiological signal statistics, which may assessthe driver’s alertness level and serve as potential indicators of sleepiness in the design of an on-board countermeasure system.Methods: Multichannel EEG, EOG, EMG, and ECG were recorded from sleep-deprived subjects exposed to real field driving condi-tions. A number of severe driving errors occurred during the experiments. The analysis was performed in two main dimensions: the mac-roscopic analysis that estimates the on-going temporal evolution of physiological measurements during the driving task, and themicroscopic event analysis that focuses on the physiological measurements’ alterations just before, during, and after the driving errors.Two independent neurophysiologists visually interpreted the measurements. The EEG data were analyzed by using both linear and non-linear analysis tools.Results: We observed the occurrence of brief paroxysmal bursts of alpha activity and an increased synchrony among EEG channelsbefore the driving errors. The alpha relative band ratio (RBR) significantly increased, and the Cross Approximate Entropy that quan-tifies the synchrony among channels also significantly decreased before the driving errors. Quantitative EEG analysis revealed significantvariations of RBR by driving time in the frequency bands of delta, alpha, beta, and gamma. Most of the estimated EEG statistics, such asthe Shannon Entropy, Kullback–Leibler Entropy, Coherence, and Cross-Approximate Entropy, were significantly affected by drivingtime. We also observed an alteration of eyes blinking duration by increased driving time and a significant increase of eye blinks’ numberand duration before driving errors.Conclusions: EEG and EOG are promising neurophysiological indicators of driver sleepiness and have the potential of monitoring sleepi-ness in occupational settings incorporated in a sleepiness countermeasure device.Significance: The occurrence of brief paroxysmal bursts of alpha activity before severe driving errors is described in detail for the firsttime. Clear evidence is presented that eye-blinking statistics are sensitive to the driver’s sleepiness and should be considered in the designof an efficient and driver-friendly sleepiness detection countermeasure device.� 2007 International Federation of Clinical Neurophysiology. Published by Elsevier Ireland Ltd. All rights reserved.
Keywords: Sleepiness; Fatigue; Driving; EEG; EOG; Eye blinks
1. Introduction
Sleepiness at the wheel has been identified as the reasonbehind fatal crashes and highway accidents caused by caror truck drivers (Philip, 2005; Connor et al., 2001; Hakka-nen and Summala, 2000). Boredom, fatigue, monotony,
1388-2457/$32.00 � 2007 International Federation of Clinical Neurophysiology. Published by Elsevier Ireland Ltd. All rights reserved.
doi:10.1016/j.clinph.2007.04.031
* Corresponding author. Tel.: +30 2310 999332; fax: +30 2310 435331.E-mail addresses: [email protected], [email protected]
(C. Papadelis).
www.elsevier.com/locate/clinph
Clinical Neurophysiology 118 (2007) 1906–1922
Author's personal copy
disturbed or deprived sleep may induce sleepiness anddrowsiness. Deprived sleep is one of the most importantfactors of sleepiness that affects various aspects of perfor-mance (Bocca and Denise, 2006). Sleep deprivation canreduce attention and vigilance by 50%, decision-makingability, communication skills, and memory (Killgoreet al., 2006; Raidy and Scharff, 2005; Harrison and Horne,2000). The most sensitive tasks are those that are long,monotonous, and boring such as driving (especially duringnight) that becomes very vulnerable to the effects of sleepdeprivation (see Dinges and Kribbs, 1991, for a review).During sleepy conditions, decreased attention, impairedinformation processing, and the reduced decision-makingcapability can all diminish driver’s ability to respond effec-tively to unusual or emergent situations (Mascord andHeath, 1992). Specifically, Williamson and Feyer (2000)affirmed that sleep-deprived drivers are just as dangerousas drunk drivers. Recent studies presented evidence thatdriver sleepiness accounts for 6% of crashes, 15% of fatalcrashes, and 30% of fatal crashes on rural roads (The Par-liament of the Commonwealth of Australia, 2000). Sincesleepiness impairs cognitive skills and therefore canadversely affect drivers’ ability to monitor and assess theirown fitness to continue driving safely, serious care shouldbe taken for the implementation of sleepiness technologicalcountermeasures, which might be used to provide driverswith useful feedback about the onset of sleepiness and toimprove road safety.
The importance of developing driver sleepiness counter-measure devices has been identified in recent studies,mainly for the purpose of preventing driving accidentsand errors (Lal and Craig, 2001b). The basic idea behindvehicle-based detection is to monitor the driver unobtru-sively by means of an on-board system that can detectwhen the driver is impaired by sleepiness and drowsiness.Such a device might possibly be based on physiologicalmeasurements which are sensitive to the driver’s alertness.Numerous physiological indicators are possible to assessthe sleepiness and alertness level. The electroencephalo-graphic (EEG) signal may be one of the most predictiveand reliable measurements since it reflects directly humanbrain activity (Artaud et al., 1973; Volow and Erwin,1973).
Driver sleepiness research has received increased interestin the last few decades. A number of studies have been per-formed in drivers concerning the EEG alterations due tosleepiness. A review of this literature can be found in Laland Craig (2001b). In most studies, the EEG data weresubjected to Fourier spectral analysis and alterations inalpha and theta bands were generally reported (Torsvalland Akerstedt, 1983; Akerstedt et al., 1982; Lal and Craig,2000). In a pioneer study of night driving, sleep intrudedwhile the drivers still had their eyes open, and it wasaccompanied by theta waves, sleep bursts and K-complexes(O’Hanlon and Kelley, 1977). Interestingly, the drivers hadnot been aware that they had been driving the car whileasleep. Later, Torsvall and Akerstedt (1987) recorded
ambulatory EEG and electrooculogram (EOG) from traindrivers during a night and day trip and they observed thatalpha power increased during night driving relative to thedaytime levels for the sleepy group. Higher alpha powerduring night trips was also observed in this sleepy groupin comparison with the alert group (Torsvall and Aker-stedt, 1987). Later, in another study of night driving, Laland Craig (2000) found, in a laboratory-based simulatorsetup, consistent increases in delta, theta, and alpha activ-ities during transition to sleepiness from an awake and alertstate. These authors focused their attention on the appear-ance of delta waves during sleepiness and confirmed thatdelta rhythm may become a reliable and simple indicatorof sleepiness.
A few authors have attempted further to establish a linkbetween the alertness and performance by correlating EEGalterations and the driving task’s performance. Specifically,Khardi and Vallet (1994) presented a significant positivecorrelation between the number of steering wheel reversalsand the EEG’s activities in the theta and alpha bands.More recently, Horne and Baulk (2004) established corre-lations between the (alpha + theta) EEG power and theincidents (a car wheel crossing the lateral lane marking)in a simulated driving task. In agreement with these results,Campagne et al. (2004) also established correlationsbetween the lower-frequency EEG changes and the drivingerrors. In the independent driving simulator studies, it wasreported that the driving duration but not sleep deprivationwas found to have an effect on (alpha + theta) EEG power(Otmani et al., 2005), or that the driving performance waspositively correlated with log sub-band (<20 Hz) powerspectrum (Lin et al., 2005). However, all these results havebeen obtained using driving simulators. Consequently, sub-jects knew that the consequences of their driving errorswould not affect their safety. Thus, from a psychologicalpoint of view, it is necessary to perform further studies withexperimental paradigms in more realistic or fieldenvironments.
The main goal of our study is the development of a reli-able and driver-friendly neurophysiological fatigue coun-termeasure device that may detect sleepiness, and thatcan provide drivers with useful feedback and alert themabout the onset of sleepiness and consequently may assistin the prevention of sleep-deprived car accidents. In ourstudy, EEG and peripheral physiological measurementswere collected from healthy sleep-deprived subjects duringrealistic night driving conditions in an experimental car onthe road. The data analysis was performed in two maindimensions: (a) macroscopic analysis, which monitors orestimates the on-going temporal evolution of physiologicalmeasurements during the driving task, assuming that sleepdeprivation together with the duration of driving wouldattenuate gradually the driving performance as well asthe subjective sleepiness; and (b) microscopic event analy-sis, which focuses on physiological measurements’ altera-tions before and during driving incidents or seriousdriving errors. The EEG data were analyzed by using both
C. Papadelis et al. / Clinical Neurophysiology 118 (2007) 1906–1922 1907
Author's personal copy
standard linear techniques and the more advanced non-lin-ear analysis tools.
2. Materials and methods
2.1. Subjects
Twenty-one subjects (20 males and 1 female) partici-pated in the present study with a mean age of33.04 ± 10.7 (mean ± SD) years. The subjects had averagedriving experience (i.e., with possession of their drivinglicense) for 12.28 ± 8.66 (mean ± SD) years. All the driversreported that they drove more than 10,000 km/year. Theywere medically evaluated prior to the study and were foundto be in good physical condition. All subjects had normalvision or corrected to normal (20/20). One subject wasexcluded from the subject pool before the experiment dueto severe hypertension. Alcohol, caffeine, tea, and choco-late consumption were prohibited for one day prior tothe measurements. All subjects were free of any kind ofmedication, and did not possess any personal or family his-tory of neuropsychiatric disorder. Each subject signed aninformed consent agreement prior to his/her participationand completed a short questionnaire. All subjects were paidfor their participation. Written instructions explaining tothe subjects the complete experiment procedure were pro-vided. This investigation has obtained an approval fromthe Local Ethics Committee.
2.2. Experimental protocol
The experiments were performed at CERTH-HIT (Cen-ter for Research and Technology, Hellenic Institute ofTransport) in Thessaloniki, Greece, from 6 June up to 27July 2005. The participants were supervised to ensure thatthey remained awake for at least 24 h prior to the experi-ment, and then to arrive at the CERTH-HIT around8.00 pm. Upon arrival and after passing the standard med-ical examination, the subjects’ level of sleepiness was esti-mated in a 20-min recording at rest position by using theMaintenance of Wakefulness Test (MWT) (Doghramjiet al., 1997). The EEG, EOG, electromyogram (EMG),and electrocardiogram (ECG) measurements were col-lected during this stage. The subjects were asked to relaxin a lean-back armchair in a quite, dark room and trynot to sleep while keeping their eyes open during the mea-surements. An experienced sleep medical doctor conductedthe on-line monitoring of the EEG traces, and estimatedsubject’s sleepiness level according to the MWT scale (1–20, with 1 being most sleepy and 20 being most awake).Their sleep behavior was also scaled by using the EpworthSleepiness test such that the pathological sleep disorderswere excluded. All subjects were found free of any patho-logical sleep disorder.
The on-board measurements were conducted in theCERTH-HIT experimental car (LANCIA� Thesis, 2.4Emblema, 5 cylinders, 2446 cm3, 170 HP). The vehicle is
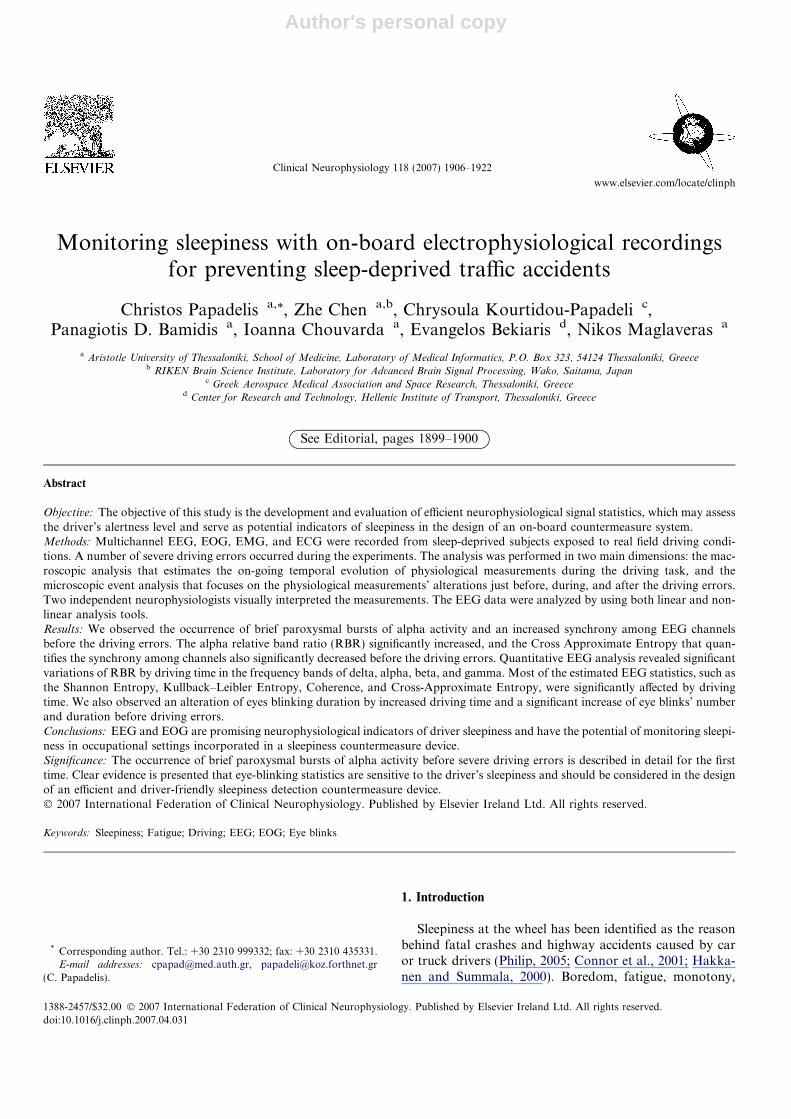
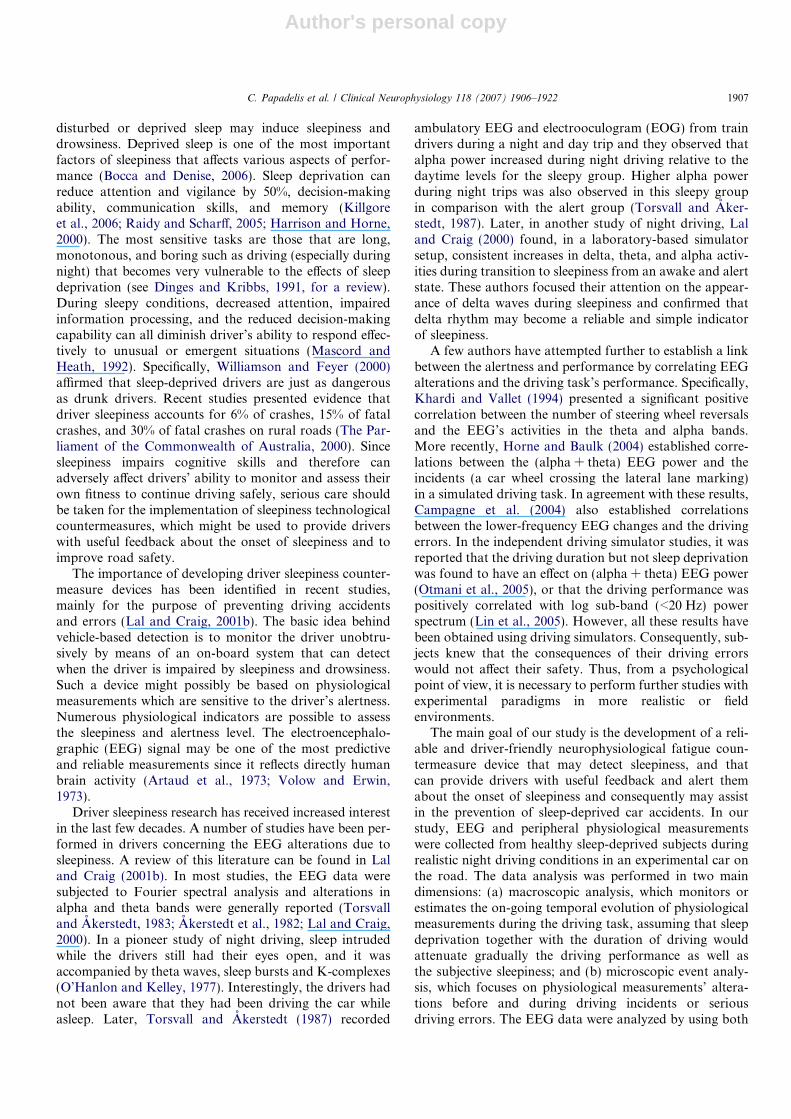
equipped with double support pedals that are accessibleto the driver’s instructor and are equipped with advanceddriver assistance systems and sensors, such as the LaneDetection System (LDS), and the Eye Leads Sensors(ELS). The LDS (CRF, FIAT Center of Investigations)consists of a CCD camera and a processing unit that recog-nizes lane borders and estimates the position and orienta-tion of the experimental vehicle with respect to them(with a temporal resolution of 1 s). The ELS system (Sie-mens, Germany) detects the eye blinks and consists of aCCIR camera with two near infrared lighting units thatenable night measurements (see the inset of Fig. 1), and apersonal computer supporting the ELS software. TheELS system outputs the following data: timestamp in sec-onds, eye blink duration of both eyes in millisecond, andthe per minute averaged blink duration (PERCLOS).
The subject was seated at the driver seat and theattached electrodes were connected to an ambulatory mon-itoring system (Brain Products GmbH, Germany) (Fig. 1).Eight-channel EEG, four-channel EOG, EMG, and ECGrecordings were collected simultaneously during the exper-iment. An experienced driving instructor was seated at theco-driver’s seat. At the back a technician monitored thefunctioning of the recording equipment, and a medical doc-tor monitored the on-going EEG and the other physiolog-ical measurements. A CCIR camera was placed behind thewheel that also monitored the subjects. The camera displaywas shown on a LCD screen in the back seat. The drivingdata collected by the LDS system were used for markingthe driving error events. Only the driving errors identifiedby the driver instructor and verified by the LDS systemwere used for the final quantitative analysis.
The same route was followed during each measurementfrom CERTH-Thessaloniki to Veria (approximate dis-tance: 100 km) and then back to Thessaloniki. It is amonotonous motorway with light traffic during the exper-
Fig. 1. One of the experimental subjects in front of the wheel wearing theEEG cap before the on-road experiment. The inset of the figure shows theEye Leads Sensors (ELS) system, which consists of a CCIR camera andtwo near infrared lighting units that enable the night measurements.
1908 C. Papadelis et al. / Clinical Neurophysiology 118 (2007) 1906–1922
Author's personal copy
iment’s time. Subjects were asked to drive at their own pacewhile observing the usual driving rules that are to drive inthe right lane except for overtake and not to exceed themotorway speed limit (in Greece: 120 km/h). They werealso required to drive as much as possible in the center ofthe right lane and to avoid overtakes. The task was monot-onous enough to promote hypovigilance. In four cases,subjects’ sleepiness levels were very high during the drivingtask, and the driver instructor stopped the measurementsafter two consecutive severe sleepiness incidents (e.g., unin-tentionally crossing the lane border). During the experi-mental procedure, a total of nine severe driving errorsoccurred. All severe errors occurred during the last15-min of the experiment. Seven out of nine events wereobserved during the last 10-min. There were also minordriving error events during the task. These events wereobserved only by the driver instructor and not confirmedby the LDS system. We excluded these minor driving errorevents from our analysis in order to ensure that theseobservations were not just driver instructor’s subjectiveobservations avoiding a possible bias in our analysis.
2.3. Physiological recordings
Physiological recordings were measured during the pre-experimental stage (20-min recordings in a dark room) andduring the actual experiment (measurements in the researchcar on the motorway) by means of a digital ambulatorydata acquisition system (Brain Products, Inc.). An Elec-tro-Cap connected to the recording device was used to col-lect EEG data from positions Fp1, Fp2, C3, C4, P3, P4,O1, and O2. The active sites on the scalp were referencedto linked mastoids, and all impedances were maintainedless than 10 kX. The EOG signal was also monitored viafour Ag/AgCl electrodes positioned one above, and onebelow the right eye, one at the outer canthus of the righteye and one at the nasion. EOG channels were connected,one for horizontal (HEOG) and one for vertical (VEOG)eye-movements. Electrodes for heart activity were posi-tioned on the sternum and the fifth intercostal space onthe left side of the body. The EMG signal was also col-lected from two Ag/AgCl electrodes positioned on the chin.A 50-Hz hardware notch filter was also applied to all mea-surements to remove power interference. Sampling fre-quency was 200 Hz for all channels. Two testmeasurements were performed before the whole experi-mental procedure in order to assure that there was no noisecontamination from the vehicle electrical or mechanicalparts.
2.4. Artifact rejection
The EEG recordings were first band-pass filtered (2ndorder Butterworth filter, low-pass filter cut-off frequency:40 Hz, high-pass filter cut-off frequency: 0.5 Hz), and thenthe Infomax Independent Component Analysis (ICA) algo-rithm was used, in order to remove the artifacts from the
data (e.g., Jung et al., 2000). The analysis and extractionof artifacts were performed off-line on a PC by means ofthe EEGLAB software (Delorme and Makeig, 2004). TheICA decomposition was performed on the entire multi-channel waveforms (eight EEG channels plus two EOGchannels). After the separation of the independent compo-nents, all the abnormal components such as eye blinks,eye-movements, and muscle activity were eliminated.Components contaminated by artifacts were rejected, andthe remaining components were mixed and projected backonto the scalp-channels.
The peripheral physiological data were also band-passed filtered (EOG: 2nd order Butterworth filter,low-pass filter cut-off frequency: 13 Hz, high-pass filtercut-off frequency: 1 Hz; ECG: 2nd order Butterworthfilter, low-pass filter cut-off frequency: 40 Hz, high-passfilter cut-off frequency: 1 Hz; EMG: 2nd order Butter-worth filter, low-pass filter cut-off frequency: 100 Hz,high-pass filter cut-off frequency: 20 Hz). For two subjectsno EMG data could be taken because of the removal ofelectrodes during the experiment.
2.5. Statistical data analysis
The quantitative analysis was performed on the artifact-free EEG and peripheral physiological data in two maindimensions: macroscopic and microscopic. At the macro-scopic analysis, we estimate the on-going temporal evolu-tion of physiological measurements during the drivingtask, assuming that sleep deprivation together with theincreased duration of driving would attenuate the drivingperformance and subjective sleepiness would increase. Atthe microscopic event analysis, we focus on the physiologi-cal measurements’ alterations before, during, and after thedriving errors. The analysis was performed on the recordeddata that satisfied the following two criteria: (a) the sub-ject’s MWT score before the experiment was less than 10,and (b) the subject managed to accomplish one hour driv-ing task such that all subjects have comparably equal dura-tion of recordings. The EEG traces were visuallyinterpreted by two independent sleep-specialized neurophy-siologists who kept notes on the traces. The specialists werenot aware of the possible driving errors, or the subject’sMWT score. The visual interpretation of the data revealedthe occurrence of high-amplitude ‘alpha bursts’ synchroni-zation events before the driving errors, which will be ana-lyzed in detail in the next section of the paper.
In the macroscopic event analysis, EEG recordings weredivided into one-second segments. For each channel, therelative band ratio (RBR) of the classic EEG frequencybands (delta: 0.5–4 Hz, theta: 4–8 Hz, alpha: 8–12 Hz, beta:12–30 Hz, and gamma: 30–40 Hz) was calculated. TheRBR is estimated by the relative ratio of the power of spe-cific frequency bands against the total frequency power,and it is a unit-less value in the range between 0 and 1.The Shannon Entropy (SE) (Appendix A), the Kullback–Leibler (K–L) Relative Entropy (Appendix B), and the
C. Papadelis et al. / Clinical Neurophysiology 118 (2007) 1906–1922 1909
Author's personal copy
Approximate Entropy (ApEn) (Appendix C) were also cal-culated for each EEG segment and each channel. As refer-ence segment for the K–L entropy, an EEG segment fromthe first minute of each recording was used. These quanti-tative EEG statistics were then averaged in 5-min periods.
Based on the observations of the two neurophysiologistswho visually analyzed the signals, we applied both linearand non-linear statistical tools to our measurements inorder to detect and quantify the multichannel synchroniza-tion of ‘alpha spindles’ events that were identified as crucialindicators of sleepiness. To quantify the synchrony amongpairwise channels, we use the common linear coherencemeasure and the non-linear Cross-ApEn (Appendix D).Coherence was calculated for the classic EEG frequencybands per one-second segment between all possible combi-nations of the EEG channels. As an information-theoreticmeasure, Cross-ApEn describes the pattern similaritybetween two time series. It can be viewed as a generaliza-tion of the non-linear dynamic measure of ApEn, whichis a statistic that quantifies the complexity (or irregularity)of a single signal (Fusheng et al., 2001). We applied thecross-ApEn with typical setup of m = 1 and r = 0.2 tothe EEG segments of one second for all pairwise combina-tions of channels. These quantitative EEG statistics werealso averaged in 5-min periods.
The eye blinks were detected as peaks in the differenti-ated EOG signals, and the number of eye blinks was alsocalculated per minute (Hyoki et al., 1998). The per minuteaveraged eye blink duration (PERCLOSE) was also calcu-lated from the EOG signal.
We examine the MWT score variation as a function ofthe driver’s age and driver’s experience by using one-wayanalysis of variance (ANOVA). Possible correlationsbetween the MWT score and the EEG and eye blink statis-tics were also examined (Pearson’s bivariate correlationtest).
For the macroscopic analysis, we have complete data,available to perform statistical analysis from 10 subjects(EEG data were either missing or were interrupted in foursubjects due to technical problems during recordings, andsix subjects did not satisfy the inclusion criteria of the pres-ent study). One-way ANOVA was applied to the averagedEEG statistics. The independent variables were differenttime factors (5, 10, and 15-min). The Bonferroni test wasused for correction of multiple comparisons. Post hoc anal-ysis was performed using the Tukey HSD test and themeans were considered significantly different when theprobability of error was less than or equal to 0.05. Corre-lation between the averaged EEG quantitative statisticsand the MWT scores was calculated using the Pearsoncoefficient correlation. A cut-off correlation coefficient of0.632 was regarded as a sign of significance.
We also validated the ELS system’s ability to reliablyestimate the number of eye blinks per minute and the perminute averaged eye blink duration (PERCLOSE) compar-ing the system’s outputs with the estimated eye blink statis-tics derived from the EOG signal.
In the microscopic event analysis, we averaged the cor-responding EEG statistics every 5 s; 40 s before, and 10 safter the nine severe driving incidents that occurred duringthe experiments. Additionally, nine 5-s segments from thefirst minute of each measurement (from those during whichsevere driving errors occurred) served as control condi-tions. We also averaged the eye blink statistics in everyminute right before the driving errors. As a baseline, weselected one-minute segments from the first five minutesof each measurement. One-way ANOVA was applied onthe averaged EEG and eye blink statistics. The independentvariable was the time factor. The Bonferroni test was alsoused for correction of multiple comparisons. Post hoc anal-ysis was performed using the Tukey HSD test.
For the definition of the exact onset time of a severe dri-ver error, both LDS system and EMG activity were used asmarkers. When a driver error event was noticed by the dri-ver instructor and confirmed by the LDS system, then theevent was defined as severe driver’s error. In all cases, theinstructor corrected the driver’s error for safety reasons.During this time, the driver was alerted by his/her mistakeand/or instructor’s intervention, leading to a noticeableand measurable EMG activity (Fig. 2). The onset of thedriver’s error was defined according to the EMG activity(increase in EMG RMS (in lV) by at least 25% in compar-ison with the previous 200 ms time window). The EMGpatterns were estimated by computing muscles activationlevel (RMS, root mean square) (Gentili et al., 2006; Papad-elis et al., 2007).
In order to analyze the microscopic events of drivingaccidents, we are also interested in monitoring the short-range (1–2 s) phase synchrony between different EEGchannels. In the neuroscience literature, phase synchronyis an important phenomenon that might have some rela-tionships with attention, cognition, and memory (Lachauxet al., 1999). In neuroelectric or biomagnetic recordings, agood measure for quantifying the instantaneous phaserelationship between two signals is the so-called phaselocking value (PLV; Appendix E). Specifically, PLV hassome advantages over the common coherence measure(i.e., spectral covariance) since coherence can be appliedonly to stationary signals and it does not specificallyquantify phase relationship (Lachaux et al., 1999). Inaddition, the PLV statistic calculated from Hilbert trans-form is a non-linear measure compared with the linearcoherence measure; moreover, the PLV is based on theinstantaneous phase difference between two signals, whilethe coherence does not explicitly use the phase informa-tion. In this paper, no statistical test was applied to thePLV measure, since we only want to use the PLV forquantifying the specific duration (generally <1 s) of tem-porally local, synchronized events. Application of such ameasure for predicting the synchronized event is the topicof a separate research that will be reported elsewhere. Inthis paper, we will show by visual illustration the distinc-tion of the PLV statistic during, before, and after the syn-chronized events.
1910 C. Papadelis et al. / Clinical Neurophysiology 118 (2007) 1906–1922
Author's personal copy
3. Results
3.1. Visual interpretation of EEG
Two independent sleep-specialized neurophysiologistsvisually interpreted the measurements. The visual interpre-tation of the continuous measurements of EEG, EMG, and
EOG revealed the occurrence of ‘alpha synchronizationbursts’ especially just before the driving errors. The occur-rence of these bursts was consistent with the nine severedriving error events (before the events). Alpha synchroni-zation bursts were also observed before minor drivingerrors (in two cases), and additionally two more times inde-pendently from any driving error. The bursts were more
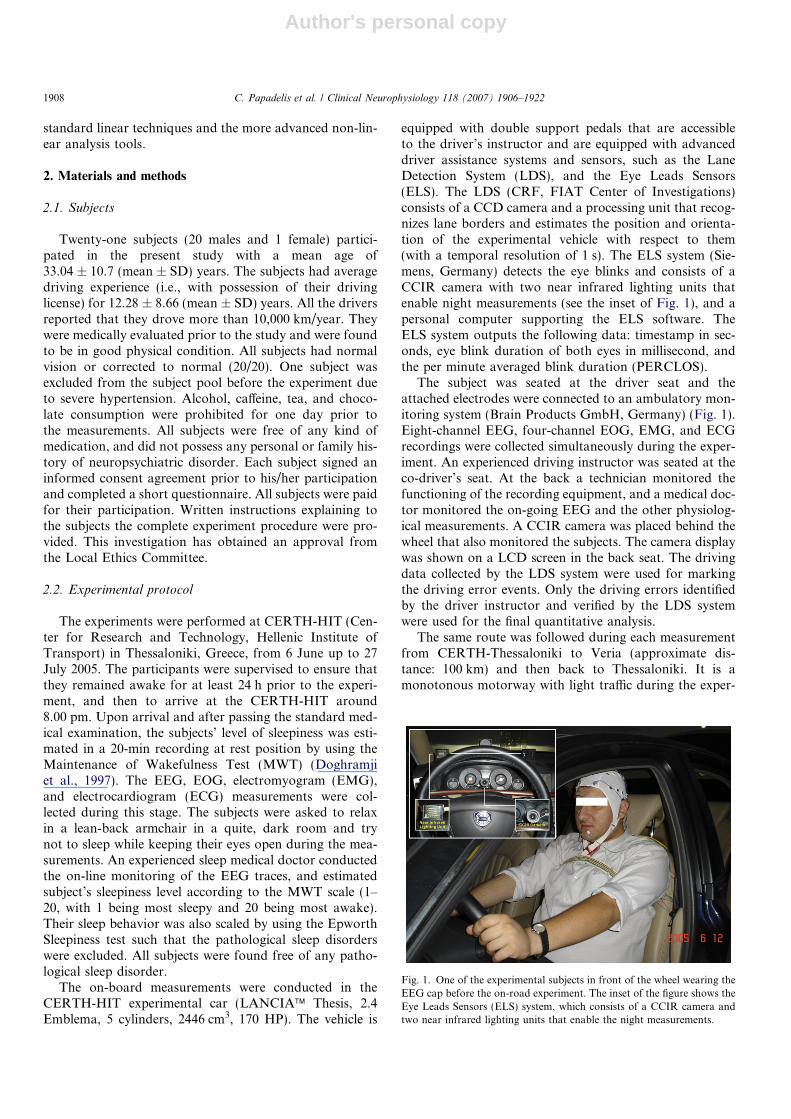
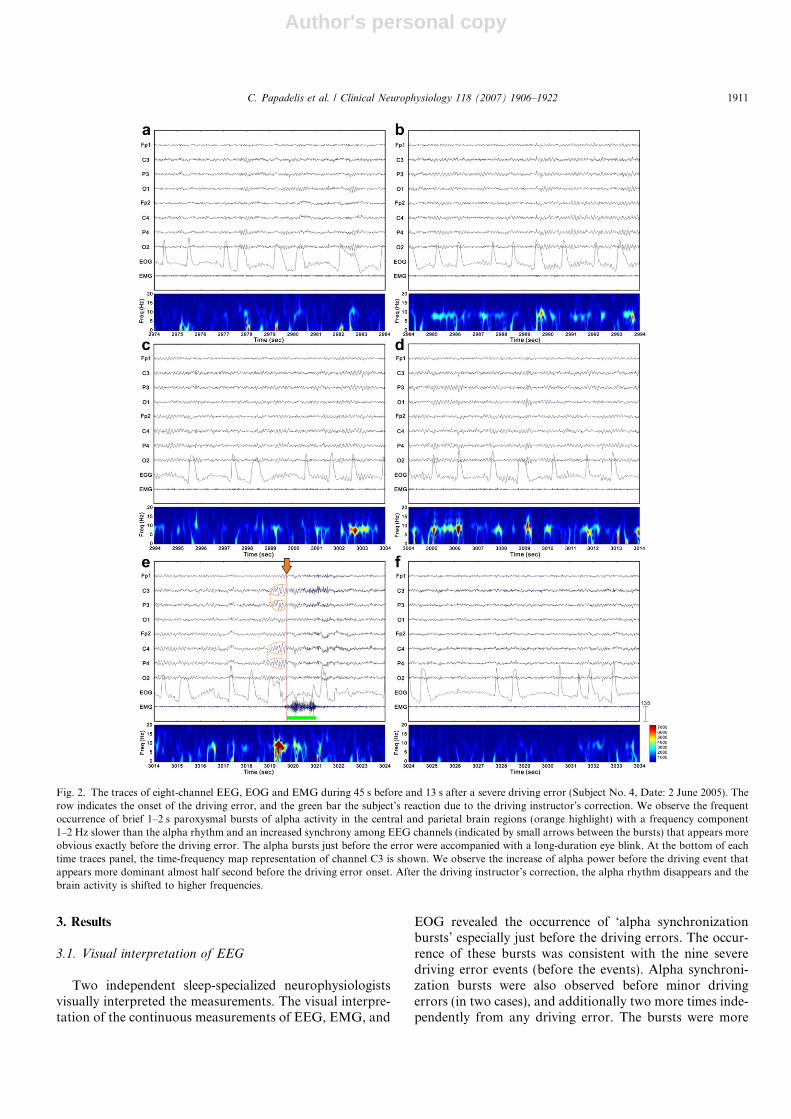
Fig. 2. The traces of eight-channel EEG, EOG and EMG during 45 s before and 13 s after a severe driving error (Subject No. 4, Date: 2 June 2005). Therow indicates the onset of the driving error, and the green bar the subject’s reaction due to the driving instructor’s correction. We observe the frequentoccurrence of brief 1–2 s paroxysmal bursts of alpha activity in the central and parietal brain regions (orange highlight) with a frequency component1–2 Hz slower than the alpha rhythm and an increased synchrony among EEG channels (indicated by small arrows between the bursts) that appears moreobvious exactly before the driving error. The alpha bursts just before the error were accompanied with a long-duration eye blink. At the bottom of eachtime traces panel, the time-frequency map representation of channel C3 is shown. We observe the increase of alpha power before the driving event thatappears more dominant almost half second before the driving error onset. After the driving instructor’s correction, the alpha rhythm disappears and thebrain activity is shifted to higher frequencies.
C. Papadelis et al. / Clinical Neurophysiology 118 (2007) 1906–1922 1911
Author's personal copy
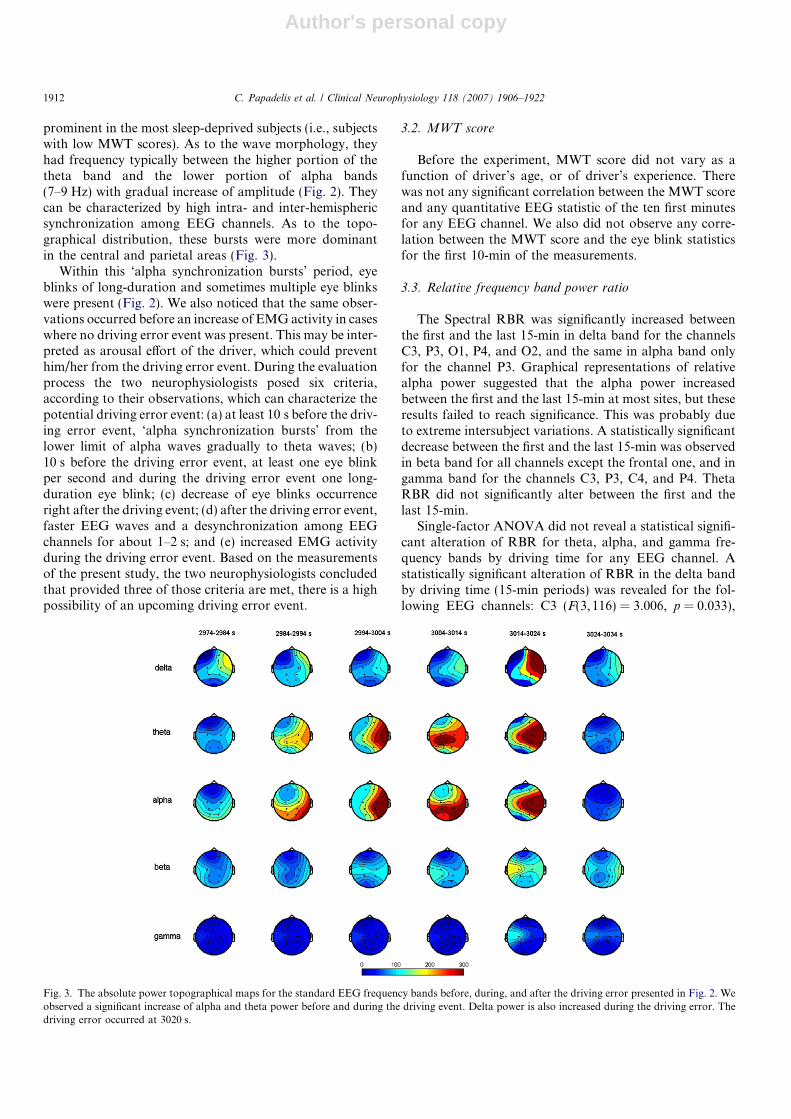
prominent in the most sleep-deprived subjects (i.e., subjectswith low MWT scores). As to the wave morphology, theyhad frequency typically between the higher portion of thetheta band and the lower portion of alpha bands(7–9 Hz) with gradual increase of amplitude (Fig. 2). Theycan be characterized by high intra- and inter-hemisphericsynchronization among EEG channels. As to the topo-graphical distribution, these bursts were more dominantin the central and parietal areas (Fig. 3).
Within this ‘alpha synchronization bursts’ period, eyeblinks of long-duration and sometimes multiple eye blinkswere present (Fig. 2). We also noticed that the same obser-vations occurred before an increase of EMG activity in caseswhere no driving error event was present. This may be inter-preted as arousal effort of the driver, which could preventhim/her from the driving error event. During the evaluationprocess the two neurophysiologists posed six criteria,according to their observations, which can characterize thepotential driving error event: (a) at least 10 s before the driv-ing error event, ‘alpha synchronization bursts’ from thelower limit of alpha waves gradually to theta waves; (b)10 s before the driving error event, at least one eye blinkper second and during the driving error event one long-duration eye blink; (c) decrease of eye blinks occurrenceright after the driving event; (d) after the driving error event,faster EEG waves and a desynchronization among EEGchannels for about 1–2 s; and (e) increased EMG activityduring the driving error event. Based on the measurementsof the present study, the two neurophysiologists concludedthat provided three of those criteria are met, there is a highpossibility of an upcoming driving error event.
3.2. MWT score
Before the experiment, MWT score did not vary as afunction of driver’s age, or of driver’s experience. Therewas not any significant correlation between the MWT scoreand any quantitative EEG statistic of the ten first minutesfor any EEG channel. We also did not observe any corre-lation between the MWT score and the eye blink statisticsfor the first 10-min of the measurements.
3.3. Relative frequency band power ratio
The Spectral RBR was significantly increased betweenthe first and the last 15-min in delta band for the channelsC3, P3, O1, P4, and O2, and the same in alpha band onlyfor the channel P3. Graphical representations of relativealpha power suggested that the alpha power increasedbetween the first and the last 15-min at most sites, but theseresults failed to reach significance. This was probably dueto extreme intersubject variations. A statistically significantdecrease between the first and the last 15-min was observedin beta band for all channels except the frontal one, and ingamma band for the channels C3, P3, C4, and P4. ThetaRBR did not significantly alter between the first and thelast 15-min.
Single-factor ANOVA did not reveal a statistical signifi-cant alteration of RBR for theta, alpha, and gamma fre-quency bands by driving time for any EEG channel. Astatistically significant alteration of RBR in the delta bandby driving time (15-min periods) was revealed for the fol-lowing EEG channels: C3 (F(3,116) = 3.006, p = 0.033),
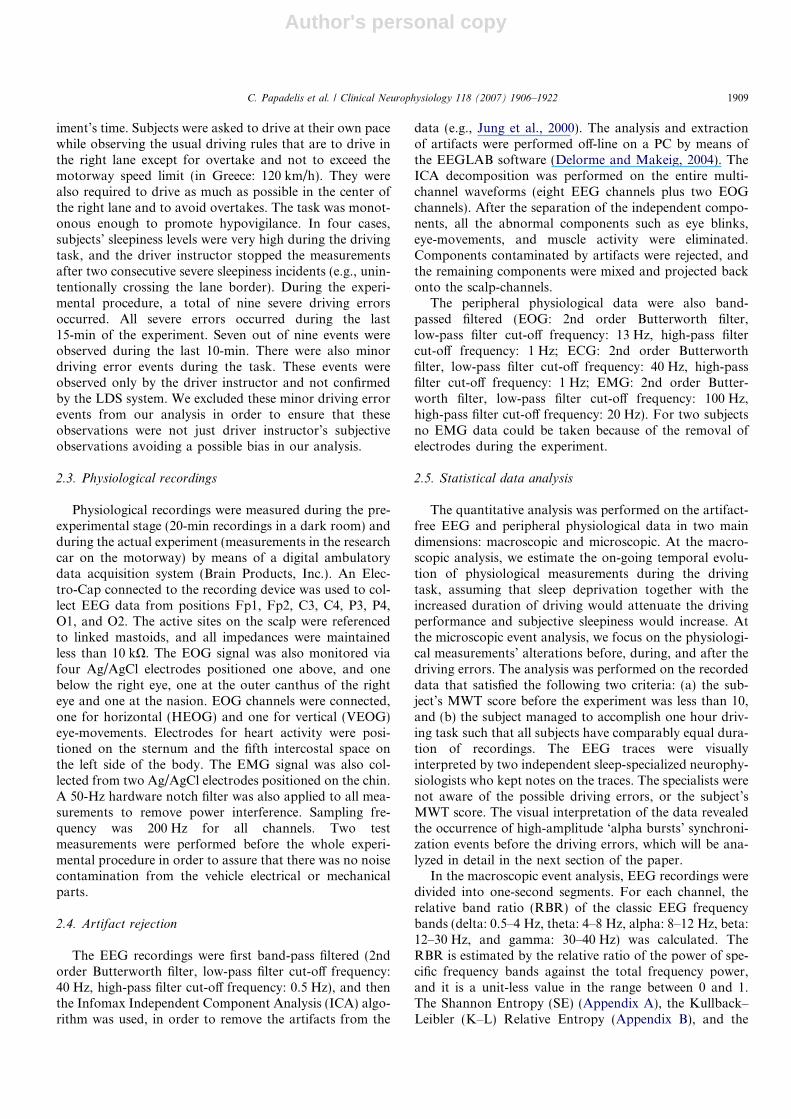
Fig. 3. The absolute power topographical maps for the standard EEG frequency bands before, during, and after the driving error presented in Fig. 2. Weobserved a significant increase of alpha and theta power before and during the driving event. Delta power is also increased during the driving error. Thedriving error occurred at 3020 s.
1912 C. Papadelis et al. / Clinical Neurophysiology 118 (2007) 1906–1922
Author's personal copy
P3 (F(3,116) = 5.066, p = 0.002), and O2 (F(3, 116) = 3.147,p = 0.028). For the beta frequency band, we observed astatistically significant alteration of RBR by driving timefor the channels: C3 (F(3, 116) = 3.051, p = 0.031), P3(F(3, 116) = 4.005, p = 0.009), C4 (F(3, 116) = 3.309, p =0.023), and P4 (F(3, 116) = 3.373, p = 0.021). The post hocanalysis by Tukey HSD revealed two homogenous groupsfor the delta band (channels: C3, P3, and O2), and also twohomogenous groups for the beta band (channels: C3, P3,C4, and P4), and two for the gamma band (channels: C4and P4).
3.4. Shannon Entropy, K–L Entropy, and ApEn Measures
A statistically significant decrease between the first andthe last 15-min was observed in Shannon Entropy for allchannels except the frontal one. The statistical analysis forShannon Entropy (one-way ANOVA) revealed a statisti-cally significant alteration by driving time (15-min periods)for all EEG channels except the frontal ones: C3(F(3, 116) = 3.77, p = 0.013), P3 (F(3, 116) = 5.846, p =0.001), O1, (F(3,116) = 3.758, p = 0.013), C4 (F(3, 116) =4.451, p = 0.005), P4 (F(3,116) = 5.521, p = 0.001), and O2(F(3, 116) = 3.99, p = 0.01).
A statistically significant decrease between the first andthe last 15-min was observed in K–L Entropy for the chan-nels: P3, O1, P4, and O2. The K–L Entropy was signifi-cantly affected by driving time only for the P4 channel(F(3, 116) = 3.51, p = 0.018). The post hoc analysis byTukey HSD revealed two homogenous groups for theShannon Entropy (all channels except the frontal), and alsotwo homogenous groups for the K–L Entropy only for theP4 channel. We did not observe a statistically significantalteration of ApEn by driving time for any EEG channel.
3.5. Coherence and Cross-ApEn Measures
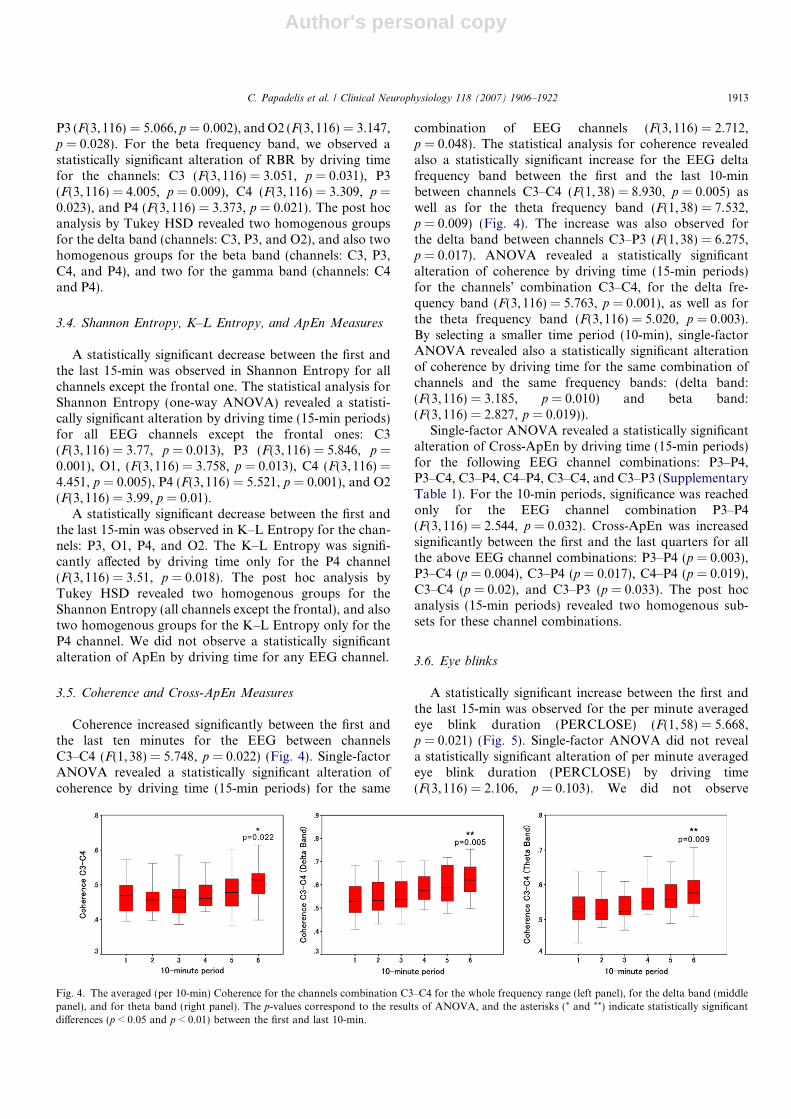
Coherence increased significantly between the first andthe last ten minutes for the EEG between channelsC3–C4 (F(1, 38) = 5.748, p = 0.022) (Fig. 4). Single-factorANOVA revealed a statistically significant alteration ofcoherence by driving time (15-min periods) for the same
combination of EEG channels (F(3,116) = 2.712,p = 0.048). The statistical analysis for coherence revealedalso a statistically significant increase for the EEG deltafrequency band between the first and the last 10-minbetween channels C3–C4 (F(1, 38) = 8.930, p = 0.005) aswell as for the theta frequency band (F(1,38) = 7.532,p = 0.009) (Fig. 4). The increase was also observed forthe delta band between channels C3–P3 (F(1,38) = 6.275,p = 0.017). ANOVA revealed a statistically significantalteration of coherence by driving time (15-min periods)for the channels’ combination C3–C4, for the delta fre-quency band (F(3,116) = 5.763, p = 0.001), as well as forthe theta frequency band (F(3,116) = 5.020, p = 0.003).By selecting a smaller time period (10-min), single-factorANOVA revealed also a statistically significant alterationof coherence by driving time for the same combination ofchannels and the same frequency bands: (delta band:(F(3,116) = 3.185, p = 0.010) and beta band:(F(3,116) = 2.827, p = 0.019)).
Single-factor ANOVA revealed a statistically significantalteration of Cross-ApEn by driving time (15-min periods)for the following EEG channel combinations: P3–P4,P3–C4, C3–P4, C4–P4, C3–C4, and C3–P3 (SupplementaryTable 1). For the 10-min periods, significance was reachedonly for the EEG channel combination P3–P4(F(3,116) = 2.544, p = 0.032). Cross-ApEn was increasedsignificantly between the first and the last quarters for allthe above EEG channel combinations: P3–P4 (p = 0.003),P3–C4 (p = 0.004), C3–P4 (p = 0.017), C4–P4 (p = 0.019),C3–C4 (p = 0.02), and C3–P3 (p = 0.033). The post hocanalysis (15-min periods) revealed two homogenous sub-sets for these channel combinations.
3.6. Eye blinks
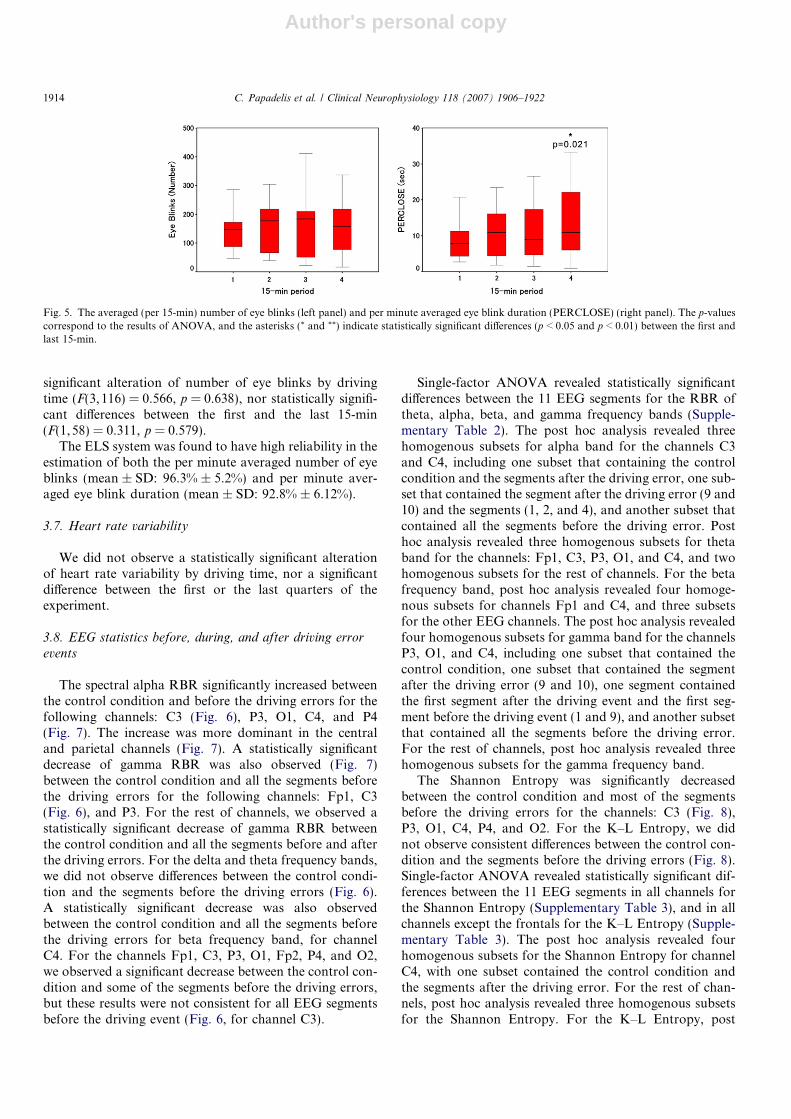
A statistically significant increase between the first andthe last 15-min was observed for the per minute averagedeye blink duration (PERCLOSE) (F(1,58) = 5.668,p = 0.021) (Fig. 5). Single-factor ANOVA did not reveala statistically significant alteration of per minute averagedeye blink duration (PERCLOSE) by driving time(F(3,116) = 2.106, p = 0.103). We did not observe
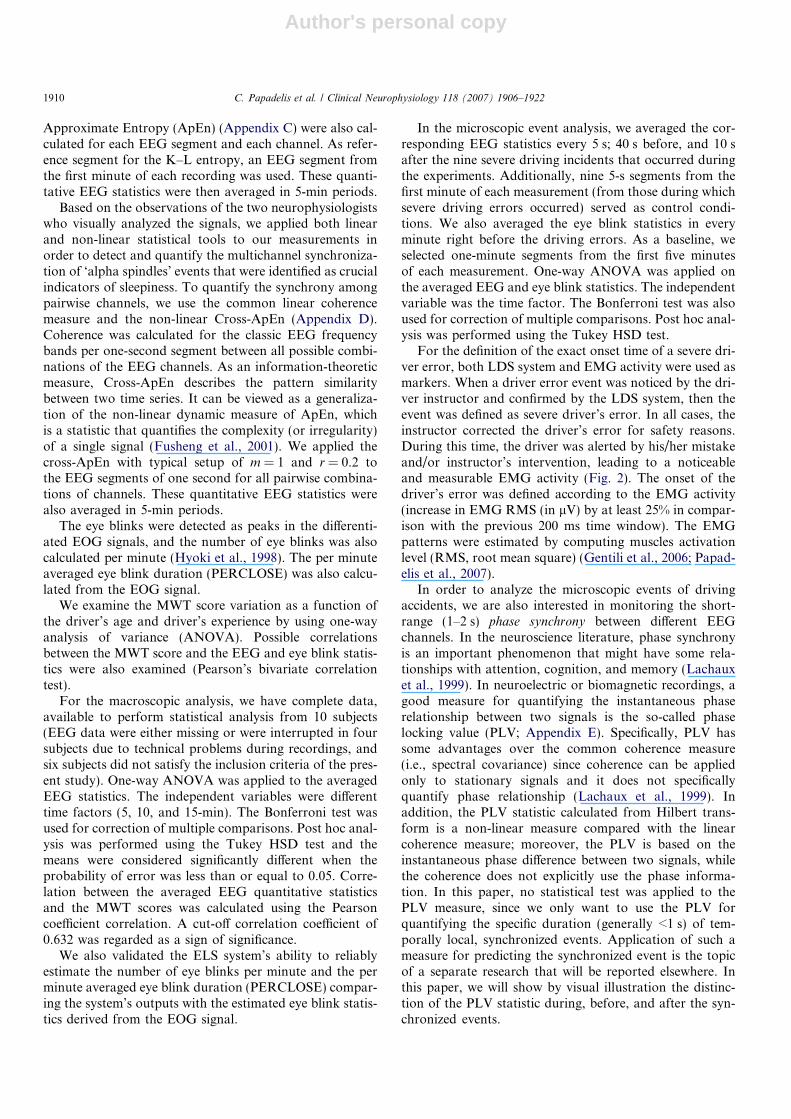
Fig. 4. The averaged (per 10-min) Coherence for the channels combination C3–C4 for the whole frequency range (left panel), for the delta band (middlepanel), and for theta band (right panel). The p-values correspond to the results of ANOVA, and the asterisks (* and **) indicate statistically significantdifferences (p < 0.05 and p < 0.01) between the first and last 10-min.
C. Papadelis et al. / Clinical Neurophysiology 118 (2007) 1906–1922 1913
Author's personal copy
significant alteration of number of eye blinks by drivingtime (F(3,116) = 0.566, p = 0.638), nor statistically signifi-cant differences between the first and the last 15-min(F(1,58) = 0.311, p = 0.579).
The ELS system was found to have high reliability in theestimation of both the per minute averaged number of eyeblinks (mean ± SD: 96.3% ± 5.2%) and per minute aver-aged eye blink duration (mean ± SD: 92.8% ± 6.12%).
3.7. Heart rate variability
We did not observe a statistically significant alterationof heart rate variability by driving time, nor a significantdifference between the first or the last quarters of theexperiment.
3.8. EEG statistics before, during, and after driving error
events
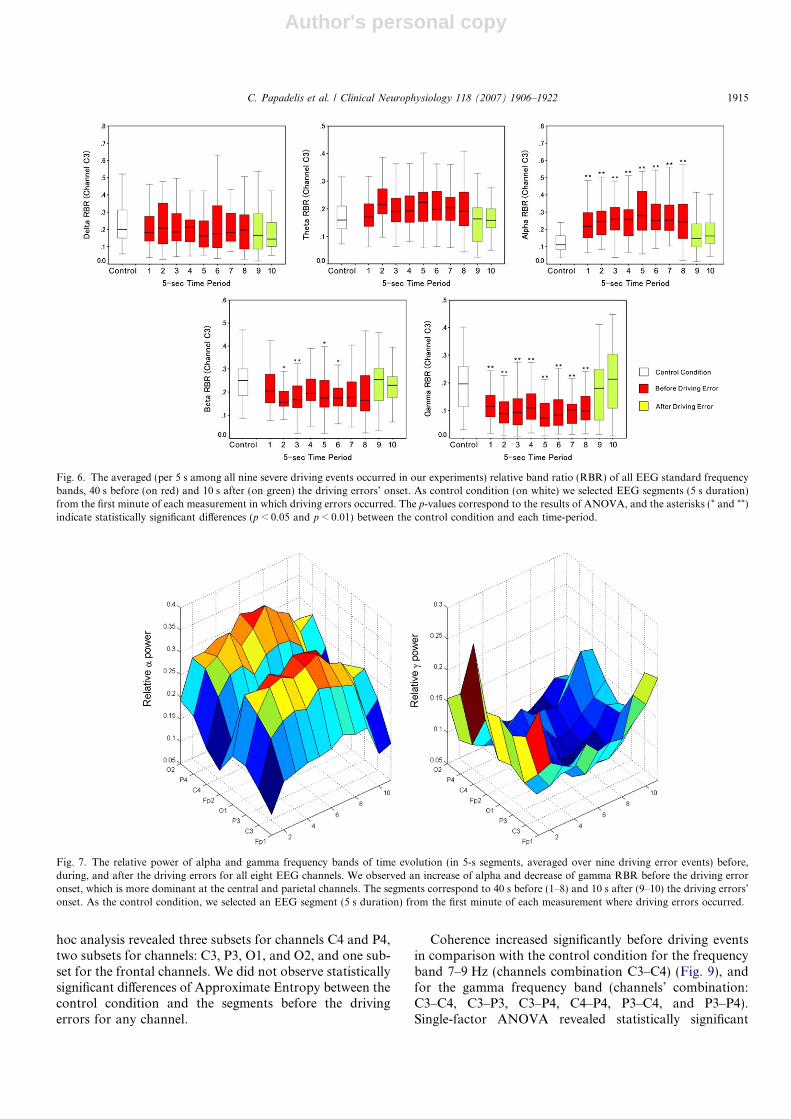
The spectral alpha RBR significantly increased betweenthe control condition and before the driving errors for thefollowing channels: C3 (Fig. 6), P3, O1, C4, and P4(Fig. 7). The increase was more dominant in the centraland parietal channels (Fig. 7). A statistically significantdecrease of gamma RBR was also observed (Fig. 7)between the control condition and all the segments beforethe driving errors for the following channels: Fp1, C3(Fig. 6), and P3. For the rest of channels, we observed astatistically significant decrease of gamma RBR betweenthe control condition and all the segments before and afterthe driving errors. For the delta and theta frequency bands,we did not observe differences between the control condi-tion and the segments before the driving errors (Fig. 6).A statistically significant decrease was also observedbetween the control condition and all the segments beforethe driving errors for beta frequency band, for channelC4. For the channels Fp1, C3, P3, O1, Fp2, P4, and O2,we observed a significant decrease between the control con-dition and some of the segments before the driving errors,but these results were not consistent for all EEG segmentsbefore the driving event (Fig. 6, for channel C3).
Single-factor ANOVA revealed statistically significantdifferences between the 11 EEG segments for the RBR oftheta, alpha, beta, and gamma frequency bands (Supple-mentary Table 2). The post hoc analysis revealed threehomogenous subsets for alpha band for the channels C3and C4, including one subset that containing the controlcondition and the segments after the driving error, one sub-set that contained the segment after the driving error (9 and10) and the segments (1, 2, and 4), and another subset thatcontained all the segments before the driving error. Posthoc analysis revealed three homogenous subsets for thetaband for the channels: Fp1, C3, P3, O1, and C4, and twohomogenous subsets for the rest of channels. For the betafrequency band, post hoc analysis revealed four homoge-nous subsets for channels Fp1 and C4, and three subsetsfor the other EEG channels. The post hoc analysis revealedfour homogenous subsets for gamma band for the channelsP3, O1, and C4, including one subset that contained thecontrol condition, one subset that contained the segmentafter the driving error (9 and 10), one segment containedthe first segment after the driving event and the first seg-ment before the driving event (1 and 9), and another subsetthat contained all the segments before the driving error.For the rest of channels, post hoc analysis revealed threehomogenous subsets for the gamma frequency band.
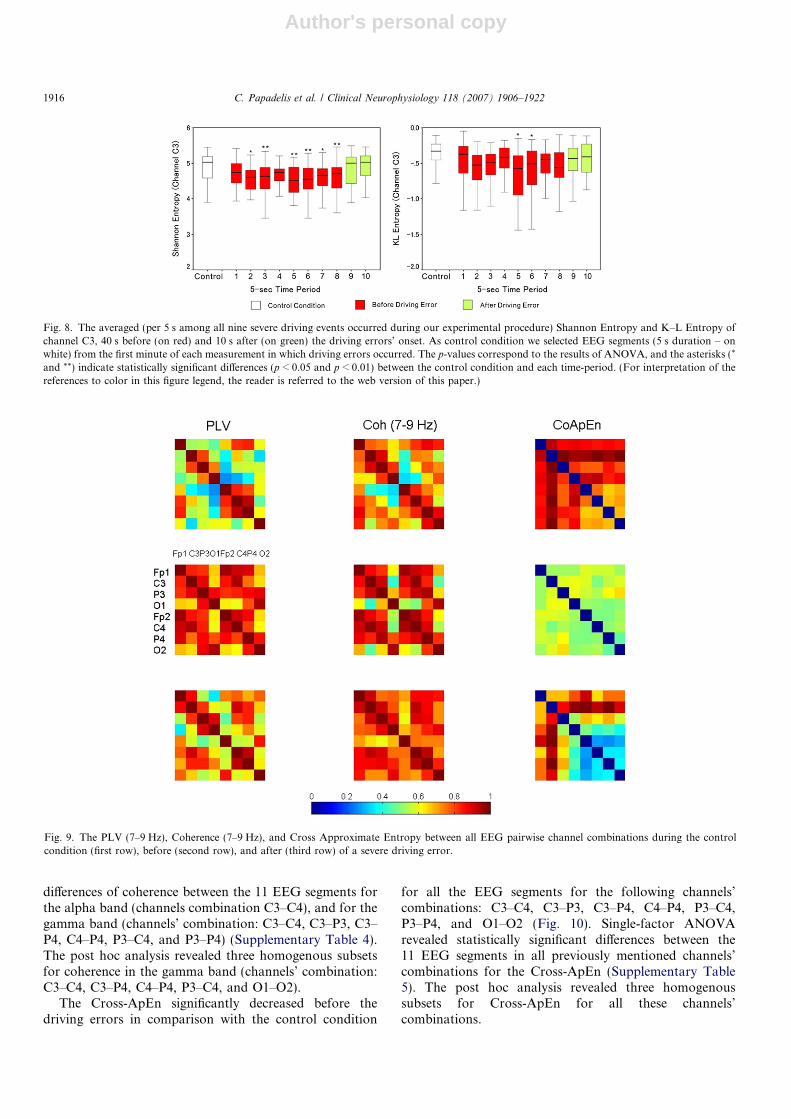
The Shannon Entropy was significantly decreasedbetween the control condition and most of the segmentsbefore the driving errors for the channels: C3 (Fig. 8),P3, O1, C4, P4, and O2. For the K–L Entropy, we didnot observe consistent differences between the control con-dition and the segments before the driving errors (Fig. 8).Single-factor ANOVA revealed statistically significant dif-ferences between the 11 EEG segments in all channels forthe Shannon Entropy (Supplementary Table 3), and in allchannels except the frontals for the K–L Entropy (Supple-mentary Table 3). The post hoc analysis revealed fourhomogenous subsets for the Shannon Entropy for channelC4, with one subset contained the control condition andthe segments after the driving error. For the rest of chan-nels, post hoc analysis revealed three homogenous subsetsfor the Shannon Entropy. For the K–L Entropy, post
Fig. 5. The averaged (per 15-min) number of eye blinks (left panel) and per minute averaged eye blink duration (PERCLOSE) (right panel). The p-valuescorrespond to the results of ANOVA, and the asterisks (* and **) indicate statistically significant differences (p < 0.05 and p < 0.01) between the first andlast 15-min.
1914 C. Papadelis et al. / Clinical Neurophysiology 118 (2007) 1906–1922
Author's personal copy
hoc analysis revealed three subsets for channels C4 and P4,two subsets for channels: C3, P3, O1, and O2, and one sub-set for the frontal channels. We did not observe statisticallysignificant differences of Approximate Entropy between thecontrol condition and the segments before the drivingerrors for any channel.
Coherence increased significantly before driving eventsin comparison with the control condition for the frequencyband 7–9 Hz (channels combination C3–C4) (Fig. 9), andfor the gamma frequency band (channels’ combination:C3–C4, C3–P3, C3–P4, C4–P4, P3–C4, and P3–P4).Single-factor ANOVA revealed statistically significant
Fig. 7. The relative power of alpha and gamma frequency bands of time evolution (in 5-s segments, averaged over nine driving error events) before,during, and after the driving errors for all eight EEG channels. We observed an increase of alpha and decrease of gamma RBR before the driving erroronset, which is more dominant at the central and parietal channels. The segments correspond to 40 s before (1–8) and 10 s after (9–10) the driving errors’onset. As the control condition, we selected an EEG segment (5 s duration) from the first minute of each measurement where driving errors occurred.
Fig. 6. The averaged (per 5 s among all nine severe driving events occurred in our experiments) relative band ratio (RBR) of all EEG standard frequencybands, 40 s before (on red) and 10 s after (on green) the driving errors’ onset. As control condition (on white) we selected EEG segments (5 s duration)from the first minute of each measurement in which driving errors occurred. The p-values correspond to the results of ANOVA, and the asterisks (* and **)indicate statistically significant differences (p < 0.05 and p < 0.01) between the control condition and each time-period.
C. Papadelis et al. / Clinical Neurophysiology 118 (2007) 1906–1922 1915
Author's personal copy
differences of coherence between the 11 EEG segments forthe alpha band (channels combination C3–C4), and for thegamma band (channels’ combination: C3–C4, C3–P3, C3–P4, C4–P4, P3–C4, and P3–P4) (Supplementary Table 4).The post hoc analysis revealed three homogenous subsetsfor coherence in the gamma band (channels’ combination:C3–C4, C3–P4, C4–P4, P3–C4, and O1–O2).
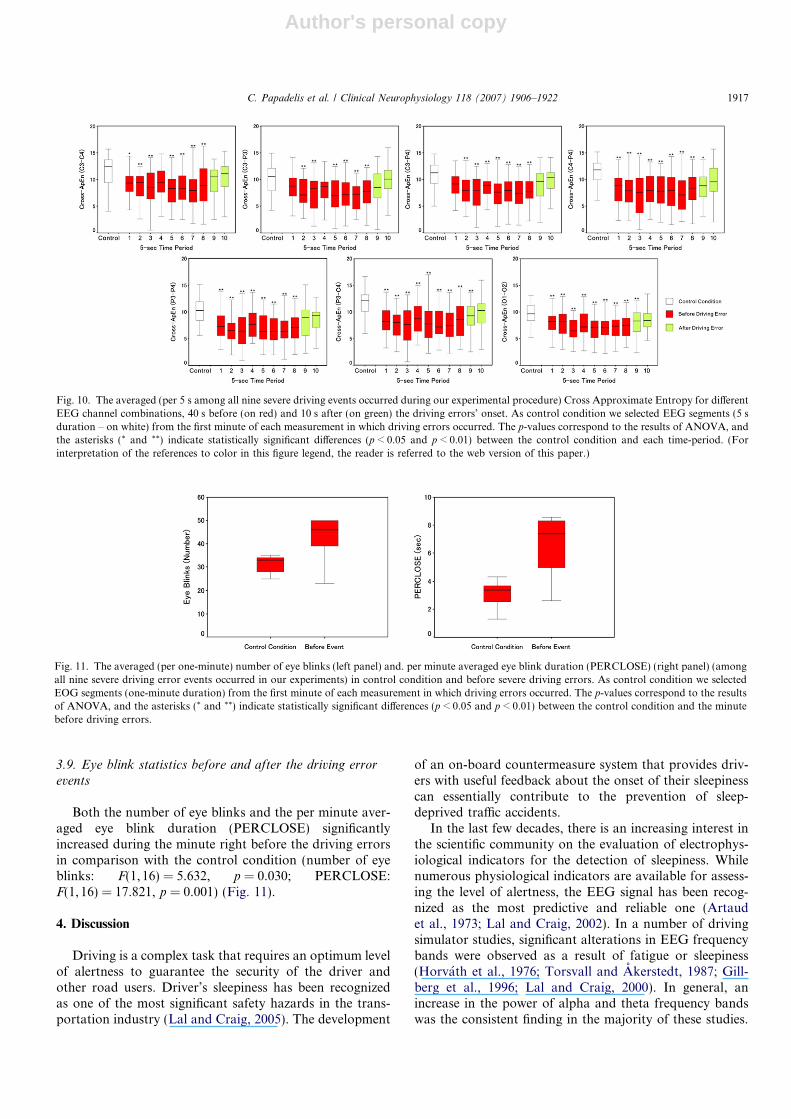
The Cross-ApEn significantly decreased before thedriving errors in comparison with the control condition
for all the EEG segments for the following channels’combinations: C3–C4, C3–P3, C3–P4, C4–P4, P3–C4,P3–P4, and O1–O2 (Fig. 10). Single-factor ANOVArevealed statistically significant differences between the11 EEG segments in all previously mentioned channels’combinations for the Cross-ApEn (Supplementary Table5). The post hoc analysis revealed three homogenoussubsets for Cross-ApEn for all these channels’combinations.
Fig. 8. The averaged (per 5 s among all nine severe driving events occurred during our experimental procedure) Shannon Entropy and K–L Entropy ofchannel C3, 40 s before (on red) and 10 s after (on green) the driving errors’ onset. As control condition we selected EEG segments (5 s duration – onwhite) from the first minute of each measurement in which driving errors occurred. The p-values correspond to the results of ANOVA, and the asterisks (*
and **) indicate statistically significant differences (p < 0.05 and p < 0.01) between the control condition and each time-period. (For interpretation of thereferences to color in this figure legend, the reader is referred to the web version of this paper.)
Fig. 9. The PLV (7–9 Hz), Coherence (7–9 Hz), and Cross Approximate Entropy between all EEG pairwise channel combinations during the controlcondition (first row), before (second row), and after (third row) of a severe driving error.
1916 C. Papadelis et al. / Clinical Neurophysiology 118 (2007) 1906–1922
Author's personal copy
3.9. Eye blink statistics before and after the driving error
events
Both the number of eye blinks and the per minute aver-aged eye blink duration (PERCLOSE) significantlyincreased during the minute right before the driving errorsin comparison with the control condition (number of eyeblinks: F(1, 16) = 5.632, p = 0.030; PERCLOSE:F(1, 16) = 17.821, p = 0.001) (Fig. 11).
4. Discussion
Driving is a complex task that requires an optimum levelof alertness to guarantee the security of the driver andother road users. Driver’s sleepiness has been recognizedas one of the most significant safety hazards in the trans-portation industry (Lal and Craig, 2005). The development
of an on-board countermeasure system that provides driv-ers with useful feedback about the onset of their sleepinesscan essentially contribute to the prevention of sleep-deprived traffic accidents.
In the last few decades, there is an increasing interest inthe scientific community on the evaluation of electrophys-iological indicators for the detection of sleepiness. Whilenumerous physiological indicators are available for assess-ing the level of alertness, the EEG signal has been recog-nized as the most predictive and reliable one (Artaudet al., 1973; Lal and Craig, 2002). In a number of drivingsimulator studies, significant alterations in EEG frequencybands were observed as a result of fatigue or sleepiness(Horvath et al., 1976; Torsvall and Akerstedt, 1987; Gill-berg et al., 1996; Lal and Craig, 2000). In general, anincrease in the power of alpha and theta frequency bandswas the consistent finding in the majority of these studies.
Fig. 10. The averaged (per 5 s among all nine severe driving events occurred during our experimental procedure) Cross Approximate Entropy for differentEEG channel combinations, 40 s before (on red) and 10 s after (on green) the driving errors’ onset. As control condition we selected EEG segments (5 sduration – on white) from the first minute of each measurement in which driving errors occurred. The p-values correspond to the results of ANOVA, andthe asterisks (* and **) indicate statistically significant differences (p < 0.05 and p < 0.01) between the control condition and each time-period. (Forinterpretation of the references to color in this figure legend, the reader is referred to the web version of this paper.)
Fig. 11. The averaged (per one-minute) number of eye blinks (left panel) and. per minute averaged eye blink duration (PERCLOSE) (right panel) (amongall nine severe driving error events occurred in our experiments) in control condition and before severe driving errors. As control condition we selectedEOG segments (one-minute duration) from the first minute of each measurement in which driving errors occurred. The p-values correspond to the resultsof ANOVA, and the asterisks (* and **) indicate statistically significant differences (p < 0.05 and p < 0.01) between the control condition and the minutebefore driving errors.
C. Papadelis et al. / Clinical Neurophysiology 118 (2007) 1906–1922 1917
Author's personal copy
Notably, we shall not forget that these results have beenobtained in driver simulators, and therefore the subjectsknew that the consequences of their driving errors wouldnot affect their safety. Moreover, driving simulator pro-duces results that may not be generalized to real-life driv-ing, and calibrations have been suggested against realdriving for the driving simulators in various conditions(Philip et al., 2005).
In the present study, we used an experimental paradigmthat involves neurophysiological measurements in realdriving conditions to assess the driving task in a more real-istic way. We obtained peripheral physiological measure-ments and we examined the effectiveness of eye blinkstatistics as potential indicators of sleepiness.
It is well known that increased driving time wouldimpair the alertness and the driving performance (Otmaniet al., 2005). Total sleep restriction during the night priorto the experiment combined with the effect of time on thedriving task would amplify the decrease in the level of alert-ness and induce severe sleepiness. Based on this assump-tion, we estimated the on-going temporal evolution ofphysiological measurements during the experiment. Weextended this analysis by also focusing on somewell-defined severe driving errors. Although the idea ofintroducing a link between the alertness and driving perfor-mance is not new (Broukhuis and de Waard, 1993; Cam-pagne et al., 2004), the recorded neurophysiologicalmeasurements are rarely linked with specific driving errors.In order to use EEG for the development of a sleepinesscountermeasure device, the EEG signal should be free ofboth environmental and biological artifacts that occur fre-quently in the real field measurements. Artifact rejectionpre-processing techniques were rarely applied to EEG datarecorded from sleep-deprived drivers prior to the quantita-tive analysis. Gevins et al. (1995), in an operational envi-ronment experiment, reported advances in on-linereduction of muscle and eye-movement artifacts based onlow-pass filtering with variable cut-off frequencies. In ourstudy, we used a widely accepted signal processing tech-nique, known as independent components analysis (ICA),in order to remove eye-blinking and muscle activity arti-facts (Jung et al., 2000). In the current data analysis, weused the ICA algorithm for off-line EEG analysis; however,the ICA method can be adapted for real-time processing inan on-line setup for the development of practical devices.
Our quantitative EEG analysis revealed significant vari-ations of RBR by driving time in the frequency bands ofdelta, alpha, beta, and gamma. These alterations weremore prominent in the central and parietal areas, and lessprominent in the occipital areas. We did not observeRBR alteration by driving time in frontal electrodes forany frequency band. More specifically, an increase ofRBR was observed in the delta and alpha bands, and a sig-nificant decrease in the beta and gamma frequency bandsby driving time. Most of our observations concerning theEEG frequency bands (increase in delta and alpha bands)are in agreement with previous findings reported in the lit-
erature. Lal and Craig (2000) found consistent increases inthe delta, theta, and alpha activities during transition tofatigue from an awake state. Torsvall and Akerstedt(1987) reported that the alpha activity was clearly the mostsensitive to sleepiness, while the delta and theta bands werealso affected by driving time but to a lesser extent. In a fieldstudy, Kecklund and Akerstedt (1993) recorded EEG con-tinuously during evening/night driving in a group of truckdrivers, and found increased alpha and theta burst activi-ties during the last few hours of driving. Although thetapower increase due to sleepiness is a frequent observationin most of the studies, we did not find a significant alter-ation of theta RBR as a function of driving time. Theobserved beta band RBR decrease is in accordance withresults reported by Lal and Craig (2005), while it is the firsttime that the gamma frequency band is investigated, whichhas a statistically significant alteration by driving time. Thedifferences in frequency bands between our results and thefindings of previous studies could be due to the fact that weestimated RBR instead of the absolute spectral power. Inlight of Parseval’s theorem (e.g., Arfken and Weber,2001), the sum of the square of signal is equal to the sumof the square of its Fourier transform. Hence, the spectralpower of frequency bands strongly depends on the EEGsignal’s amplitude, and therefore also depends on the elec-trode’s impedance; while relative power disregards the totalpower of the signal, focusing on the ratio of frequencycomponents of the EEG signal.
Although considerable progress has been made for thedetection of sleepiness onset, we know of no publishedstudies that analyze the EEG data obtained from sleep-deprived drivers by using more advanced signal processingtechniques than the standard Fourier analysis. In anattempt to develop and validate more sensitive and reliablestatistics for sleepiness detection, we also applied severalentropy measures to our EEG data. The concept ofentropy is defined as the rate of information loss over time(Stam, 2005). The non-linear entropy measures quantifysuccessfully the cortical function at different sleep stages(Fell et al., 1996; Acharya et al., 2005). Entropy showeda very high statistically alteration by driving time in almostall EEG channels. However, the ApEn was not affected bydriving time, although it seemed to be sensitive to the clas-sification of sleep stages (Burioka et al., 2005).
Compared to other qualitative descriptive studies, thefinding of Santamaria and Chiappa (1987) unquestionablyprovided the most detailed description available for theEEG events during the sleepiness onset. These authors con-firmed many earlier observations and stressed that theEEG changes during drowsiness are often rapid, with somestates lasting from less than a second to a few seconds.Therefore, the macroscopic temporal event analysis of theon-going brain activity may not be able to capture thesetransient EEG alterations, and important informationmight be lost concerning the sleepiness’ onset. For the samereason, a microscopic event analysis focusing on drivingerrors is more desirable.
1918 C. Papadelis et al. / Clinical Neurophysiology 118 (2007) 1906–1922
Author's personal copy
The visual interpretation of our EEG measurementsrevealed the occurrence of ‘alpha bursts’ especially rightbefore the driving errors (Fig. 2). The occurrence of thesebursts was a consistent finding during all measurementsbut was more frequent at the end of the measurements,and more prominent before the errors. Although, thesealpha bursts did not occur exclusively just before the severedriving errors, the fact that before all nine severe errorsalpha synchronization bursts occurred shows that theoccurrence of brief paroxysmal bursts of alpha activityand the increased synchrony among EEG channels arestrongly linked with an upcoming driving error. The alphabursts all had the same frequency content (in the lower por-tion of alpha band). These EEG alterations were observedin previous laboratory sleepiness-onset studies as firstdescribed by Santamaria and Chiappa (1987) and latterconfirmed by Broughton and Hasan (1995) about EEGalterations during sleepiness onset. Mano et al. (1995), intheir real field driving experiment, observed a diffuse sloweralpha activity when the drivers closed their eyelids as thedriving time went on. Although it seems difficult to identifyif the observed alpha bursts correspond to one of the twotypes of alpha activity related with sleepiness as they havebeen described by Broughton and Hasan (1995), theirduration (1–2 s) and their spatial distribution lead us tobelieve that this phenomenon may correspond to the par-oxysmal bursts of alpha activity (Broughton and Hasan,1995). Furthermore, the fact that they occurred more fre-quently in the EEG recordings of the most-deprived sub-jects confirms our notion that they are strongly relatedwith high levels of sleepiness. The spectral RBR of alphaactivity was also significantly increased almost one minutebefore the driving errors, and such an increase was moredominant in the central and parietal channels. However,the alpha RBR presented statistically significant alterationby driving time only in one channel in the macroscopicanalysis of our EEG data. This can be explained by the factthat these paroxysmal bursts of alpha waves occurred inbrief groups of 1–2 s duration, and thus their overall fre-quency power was not strong enough at all channels toincrease significantly the alpha RBR in the macroscopicevent analysis.
The visual interpretation of our recorded data revealedan increase of EEG signal synchronization among differ-ent channels before the driving errors, which led us toexamine if we can quantify this phenomenon by usingboth linear and non-linear signal processing techniques.In the last decade, the notion of EEG synchronizationhas attracted the attention of many researchers and ithas led to a whole new range of quantitative EEG mea-sures as well as a number of emerging applications formonitoring of sleep (Stam, 2005). In macroscopic analysis,we calculated the frequency-domain based linear coher-ence measure and the time-domain based non-linearCross-ApEn (Fusheng et al., 2001) in order to quantifythe synchrony among the EEG channels. It was foundthat coherence increased significantly between the first
and the last 10-min for the channels’ combinationC3–C4, which corresponds to the central areas of thebrain. In the microscopic analysis of our data, coherenceincreased significantly before driving events in comparisonwith the control condition for both alpha and gamma fre-quency bands. The Cross-ApEn was more sensitive indetecting the sleepiness onset since it significantlydecreased before the severe driving errors for the majorityof EEG channel combinations, and moreover it was sig-nificantly affected by the driving time for these channelcombinations. In addition, we also used PLV to measurethe short-range (1–2 s) phase synchronization while exam-ining the pairwise channel synchronization before thesevere driving errors.
Our study provides further evidence that a variety ofquantitative EEG statistics are reliable for the detectionof sleepiness and therefore they can be used as sleepinessindicators in an on-board countermeasure device. How-ever, this approach encounters several practical problems.Even if we assume that a reliable EEG-based sleepinessindicator is available, there are other technical problemsthat need be solved. We should not be remiss of the factthat the system would work reliably in a real environmen-tal condition where the EEG signal is highly contaminatedwith noise. Even if this problem can be solved by theusage of some on-line artifact rejection techniques, suchas the ICA, the usability of such a device should be recon-sidered for more practical than technical reasons. Ourgroup believes that it will be difficult for the drivers toplace jelly electrodes on their scalp before every drivingsession, and especially on hairy areas (such as the centralor parietal regions) that appear to be the most sensitive onthe EEG alterations due to sleepiness. More recently,advanced electrodes have been developed that allow toamplify the EEG signal in the scalp-electrode, and somegroups (Lal and Craig, 2001a) also conducted researchon the development of miniaturized dry electrodes. How-ever, other approaches using peripheral neurophysiologi-cal measurements, which can be obtained with somedriver-friendly techniques, should also be considered andstudied more intensively.
Eye blinks are sensitive to high visual attentiondemands. Fewer and shorter duration blinks are oftenassociated with situations that require intake of importantinformation such as reading (Ponder and Kennedy, 1928),city driving (Lecret and Pottier, 1971), and formation flying(Wilson et al., 1987). Blink closure duration has also beenshown to be sensitive to high overall task demand. Blinkpatterns have also been used to provide information aboutthe operator’s responses to the environmental stimuli andthus the situational awareness (Fogarty and Stern, 1989;Wilson, 1992).
Since Aserinsky and Kleitman (1955) reported changesin spontaneous eye movement patterns not only in sleepbut also in the hypnagogic state, EOG has been used forassessing alertness, often together with EEG (Isse et al.,1978; Hori, 1982; Santamaria and Chiappa, 1987; Ota
C. Papadelis et al. / Clinical Neurophysiology 118 (2007) 1906–1922 1919
Author's personal copy
et al., 1990; Hyoki et al., 1998). Furthermore, EOG hasbeen widely applied to clinical evaluations, such as drugeffects on alertness (Shigeta et al., 1993), and arousal levelsin psychiatric disorders (Toyoshima, 1991). However, therelationship between the EOG and EEG measures hadnot been clarified at various stages of alertness until Hyokiet al. (1993). In their study, a significant correlationbetween the number of eye movements and EEG powersat alpha and beta frequency bands was found (Hyokiet al., 1993).
Mano et al. (1995) first reported in their real field high-way driving experiment that blinking of eyelids increasedas the driving time went on; and recently, EOG measure-ments have been obtained (Lal and Craig, 2005) in a simu-lator study of driver’s sleepiness. However, there is still alack of research on the systematic evaluation ofEOG-based statistics as potential indicators for the driver’ssleepiness. Indeed, Mano et al. (1995) restricted theirobservations on a macroscopic evaluation of the on-goingeye-blinking activity, and Lal and Craig (2005) used theEOG signal for eye blink artifact identification withoutpresenting any results concerning the eye-blinking activity.We analyzed the eye-blinking statistics in both a macro-scopic and microscopic way. We found a statistically signif-icant alteration of eye-blinking duration by driving time.More specifically, the eye-blinking duration and the num-ber of eye blinks both increased as the driving time wenton, but only eye-blinking duration reached significance.Moreover, the number of eye blinks and the per minuteaveraged eye blink duration (PERCLOSE) statistics weresignificantly increased during the minute right before thedriving errors in comparison with the control condition.Our study presented clear evidence that the eye-blinkingstatistics are sensitive to the driver’s sleepiness and theyshould be considered in the design of a future sleepinessdetection countermeasure device. Since advancedtechnological systems, such as the ELS system used inour experiment, are available and reliable in measuringthe eye-blinking activity, the EOG-based approach seemsto be more driver-friendly and efficient than an EEG-basedsystem, and therefore this technology should attract moreattention from the researchers in industry.
In this paper, we evaluated the effectiveness of a pleth-ora of neurophysiological statistics in detecting driver’ssleepiness in a real environment experimental paradigm.We can conclude that the occurrence of brief paroxysmalbursts of alpha activity (with frequency 1–2 Hz slower thanthe conventional alpha rhythm) in the central and parietalbrain regions, as well as an increased synchrony among theEEG channels, indicates a high level of sleepiness and ahigh possibility of an upcoming severe driving error. TheEEG statistics that quantify the signal’s complexity andsynchronization between channels can serve as potentialindicators of driver’s sleepiness. However, we would liketo emphasize that the most important finding of the presentstudy is the sensitivity of the peripheral physiological mea-surements, such as the eye blink statistics, to the driver’s
sleepiness. Further research is anticipated for developingand testing the applicability of a neurophysiological sleep-iness countermeasure device in real field driving situations,which should be based on peripheral physiological mea-surements. It is noteworthy that we have conducted severalmultiple tests (each with omnibus hypothesis) on the levelof a single ANOVA and made appropriate corrections ofsignificance level, a potential remaining pitfall of this pro-cedure is the existence of falsely claimed significance; inthe literature, it is known the level of false discoveriescan be controlled by false discovery rate (Benjamini andHochberg, 1995).
5. Conclusion
The quantitative EEG and EOG statistics are bothpromising neurophysiological indicators of sleepiness andhave the potential for monitoring sleepiness in an occupa-tional setting as well as being used in a sleepiness counter-measure device. In the present study, we describe in detailfor the first time, the occurrence of brief 1–2 s paroxysmalbursts of alpha activity (with a frequency concept 1–2 Hzslower than the conventional alpha rhythm) in the centraland parietal brain regions and an increased synchronyamong the EEG channels before severe driving errors.We also interpret our findings based on some early pub-lished neurophysiological studies regarding the sleepinessonset. The occurrence of these alpha wave bursts indicatesa high level of sleepiness and a high possibility of anupcoming severe driving error. Finally, we present clearevidence that eye blink statistics are sensitive to the driver’ssleepiness and should be considered in the design of afuture sleepiness detection countermeasure device, consid-ering the fact that advanced technological systems arenow available that can reliably measure eye-blinking activ-ity. The EOG-based sleepiness detection approach seems tobe more driver-friendly and efficient than an EEG-basedsystem, and we expect it will attract more attention fromthe researchers in the near future.
Acknowledgements
The research was supported by the SENSATIONProject of the Information Society Technologies (IST)Program (507231) of European Union (EU). We would liketo acknowledge Dr. G. Strikis (IASI Medical Centre, Thes-saloniki, Greece) for his work on the visual interpretationof the EEG data. Dr. C. Papadelis would like to thankhis students from the Technological Institute of Thessalo-niki, Department of Automation, who participated assubjects in the present study.
Appendix A. Supplementary data
Supplementary data associated with this article can befound, in the online version, at doi:10.1016/j.clinph.2007.04.031.
1920 C. Papadelis et al. / Clinical Neurophysiology 118 (2007) 1906–1922
Author's personal copy
References
Acharya UR, Faust O, Kannathal N, Chua T, Laxminarayan S. Non-linear analysis of EEG signals at various sleep stages. ComputMethods Programs Biomed 2005;80(1):37–45.
Akerstedt T, Torsvall L, Gillberg M. Sleepiness and shiftwork: fieldstudies. Sleep 1982;5(Suppl. 2):95–106.
Arfken GB, Weber HJ. Mathematical methods for physicists. Har-court: San Diego; 2001.
Artaud P, Planque S, Lavergne C, Cara H, de Lepine P, Tarriere C, et al.An on-board system for detecting lapses of alertness in car driving. In:14th ESV conference, session 2, intelligent vehicle highway system andhuman factors, Munich, Germany; 1973.
Aserinsky E, Kleitman N. Two types of ocular motility occurring in sleep.J Appl Physiol 1955;8:1–10.
Benjamini Y, Hochberg Y. controlling the false discovery rate: a practicaland powerful approach to multiple testing. J R Stat Soc1995;57(1):289–300.
Bocca ML, Denise P. Total sleep deprivation effect on disengagement ofspatial attention as assessed by saccadic eye movements. ClinNeurophysiol 2006;117:894–9.
Broughton R, Hasan J. Quantitative topographic electroencephalographicmapping during drowsiness and sleep onset. J Clin Neurophysiol1995;12(4):372–86.
Broukhuis KA, de Waard D. The use of psychophysiology to assess driverstatus. Ergonomics 1993;36:1099–110.
Burioka N, Miyata M, Cornelissen G, Halberg F, Takeshima T, KaplanDT, et al. Approximate entropy in the electroencephalogram duringwake and sleep. Clin EEG Neurosci 2005;36(1):21–4.
Campagne A, Pebayle T, Muzet A. Correlation between driving errors andvigilance level: influence of the driver’s age. Physiol Behav 2004;80:515–24.
Connor J, Whitlock G, Norton R, Jackson R. The role of driver sleepinessin car crashes: a systematic review of epidemiological studies. AccidAnal Prev 2001;33:31–41.
Delorme A, Makeig S. EEGLAB: an open source toolbox for analysis ofsingle-trial EEG dynamics including independent component analysis.J Neurosci Methods 2004;134:9–21. (EEGLAB software availablefrom: http://sccn.ucsd.edu/eeglab).
Dinges DF, Kribbs NB. Performing while sleepy: effects of experimentallyinduced sleepiness. In: Monk TH, editor. Sleep, sleepiness andperformance. Chichester: Wiley; 1991. p. 97–128.
Doghramji K, Mitler MM, Sangal RB, et al. A normative study of themaintenance of wakefulness test (MWT). Electroencephalogr ClinNeurophysiol 1997;103(5):554–62.
Fell J, Roschke J, Mann K, Schaffner C. Discrimination of sleep stages: acomparison between spectral and nonlinear EEG measures. Electro-encephalogr Clin Neurophysiol 1996;98(5):401–10.
Fogarty C, Stern JA. Eye movement and blinks: their relationship tohigher cognitive processes. Int J Psychophysiol 1989;8:35–42.
Fusheng Y, Bo H, Qingyu T. Approximate entropy and its application inbiosignal analysis. In: Akay M, editor. Nonlinear biomedical signalprocessing. Dynamic analysis and modeling 2001;vol. II. New Jersey,USA: IEEE Press Series on Biomedical Engineering; 2001.
Gentili R, Papaxanthis C, Pozzo T. Improvement and generalization ofarm motor performance through motor imagery practice. Neurosci-ence 2006;137:761–72.
Gevins A, Leong H, Du R, Smith ME, Le J, DuRousseau D, et al.Toward measurement of brain function in operational environments.Biol Psychiatry 1995;43:145–52.
Gillberg M, Kecklund G, Akerstedt T. Sleepiness and performance ofprofessional drivers in a truck simulator – comparisons between dayand night driving. J Sleep Res 1996;5:12–5.
Gray R. Entropy and information theory. New York: Springer; 1990.Hakkanen H, Summala H. Sleepiness at work among commercial truck
drivers. Sleep 2000;23:49–57.Harrison Y, Horne JA. The impact of sleep deprivation on decision
making: a review. J Exp Psychol Appl 2000;6(3):236–49.
Hori T. Electrodermal and electro-oculographic activity in a hypnagogicstate. Psychophysiology 1982;19:668–72.
Horne JA, Baulk SD. Awareness of sleepiness when driving. Psychophys-iology 2004;4:97–110.
Horvath M, Frantik E, Kopriva K, Meissner J. EEG theta activityincrease coinciding with performance decrement in a monotonoustask. Activitas Nervosa Superior (Prague) 1976;18:207–10.
Hyoki K, Shigeta M, Nishikawa Y, Kawamuro Y, Soda K. The correlationbetween changes of EEG and eye movements (EOG) accompanied bylowered arousal level. Jpn J Clin Pathol 1993;41:813–8.
Hyoki K, Shigeta M, Tsuno N, Kawamuro Y, Kinoshita T. Quantitativeelectro-oculography and electroencephalography as indices of alert-ness. Electroencephalogr Clin Neurophysiol 1998;106:213–9.
Isse K, Kojima T, Ando H, Shimazono Y, Ando K. A study of therelationship between eye movements (EOG) and arousal levels (EEG).Seishin Igaku 1978;20:537–44.
Jung TP, Makeig S, Humphries C, Lee TW, Mckeown MJ, Iraqui V, et al.Removing electroencephalographic artifacts by blind source separa-tion. Psychophysiology 2000;37:163–78.
Kecklund G, Akerstedt T. Sleepiness in long distance truck driving: anambulatory EEG study of night driving. Ergonomics 1993;36:1007–17.
Khardi S, Vallet M. Drivers vigilance. Analysis of differences in vigilancestates assessments by physiological and mechanical indicators. In:Proceedings of the 1st World Congress on applications of transporttelematics and intelligent vehicle-highway systems. 30 November–3December, Paris, France; 1994.
Killgore WD, Balkin TJ, Wesensten NJ. Impaired decision makingfollowing 49 h of sleep deprivation. J Sleep Res 2006;15(1):7–13.
Lachaux J-P, Rodriguez E, Martinerie J, Varela FJ. Measuring phasesynchrony in brain signals. Human Brain Mapp 1999;8:194–208.
Lal SKL, Craig A. Psychophysiological effects associated with drowsiness:driver fatigue and electroencephalography. Int J Psychophys 2000;35:39.
Lal SKL, Craig A. Electroencephalography activity associated with driverfatigue: implications for a fatigue countermeasure device. J Psycho-physiol 2001a;15:183–9.
Lal SKL, Craig A. A critical review of the psychophysiology of driverfatigue. Biol Psychol 2001b;55:173–94.
Lal SKL, Craig A. Driver fatigue: electrophysiology and psychologicalassessment. Psychophysiology 2002;39:1–9.
Lal S, Craig A. Reproducibility of the spectral components of the electroen-cephalogram during driver fatigue. Int J Psychophysiol 2005;55:137–43.
Lecret F, Pottier M. La vigilance, facteur de securite dans la conduiteautomobile. Le Travail Humain 1971;34:51–68.
Le Van Quyen M et al.. Comparison of Hilbert transform and waveletmethods for the analysis of neuronal synchrony. J Neurosci Methods2001;111:83–98.
Lin C-T, Wu R-C, Jung T-P, Liang S-F, Huang T-Y. Estimating drivingperformance based on EEG spectrum analysis. EURASIP J ApplSignal Process 2005;19:3165–74.
Mano T, Shiozawa Z, Amino A, Nagasaka T, Shindo K, Nagasaki H,Kobayashi T, Mihara K. EEG findings for drivers during driving in ahighway. Electroencephalogr Clin Neurophysiol 1995;97(4):149 (1).
Mascord DJ, Heath RA. Behavioral and physiological indices of fatigue ina visual tracking task. J Safety Res 1992;23:19–25.
O’Hanlon SF, Kelley GR. Comparison of performance and physiologicalchanges between drivers who perform well and poorly duringprolonged vehicular operation. In: Mackie RR, editor. Vigilance. NewYork: Plenum; 1977. p. 189–202.
Ota T, Ohshima H, Toyoshima R, Yamauchi T. Arousal level measure-ments by biphasic changes of the mean alpha amplitude. Jpn J EEGEMG 1990;18:258–67.
Otmani S, Pebayle T, Roge J, Muzet A. Effect of driving duration andpartial sleep deprivation on subsequent alertness and performance ofcar drivers. Physiol Behav 2005;84:715–24.
Papadelis C, Kourtidou-Papadeli C, Bamidis P, Albani M. Effects of imagerytraining on cognitive performance and use of physiological measuresas an assessment tool of mental effort. Brain Cogn 2007;64(1):74–85.
C. Papadelis et al. / Clinical Neurophysiology 118 (2007) 1906–1922 1921
Author's personal copy
Philip P. Sleepiness of occupational drivers. Ind Health 2005;43:30–3.Philip P, Sagaspe P, Taillard J, Valtat C, Moore N, Akerstedt T, et al.
Fatigue, sleepiness, and performance in simulated versus real drivingconditions. Sleep 2005;28(12):1511–6.
Pincus SM. Approximate entropy (ApEn) as a complexity measure. ProcNatl Acad Sci USA 1991;88:110–7.
Ponder E, Kennedy WP. On the act of blinking. Q J Physiol1928;18:89–110.
Raidy DJ, Scharff LF. Effects of sleep deprivation on auditory and visualmemory tasks. Percept Mot Skills 2005;101(1):451–67.
Santamaria J, Chiappa KH. The EEG of drowsiness in normal subjects. JClin Neurophysiol 1987;4:327–82.
Shannon CE. A mathematical theory of communication. Bell Syst Tech J1948;27:379–423.
Shigeta M, Nishikawa Y, Shimuzu M, Usui M, Hyoki K, Kawamuro Y.Horizontal component of electro-oculogram as a parameter of arousalin dementia: relationship between intellectual improvement andincreasing arousal under pharmacotherapy. J Clin Pharmacol1993;33:741–6.
Stam CJ. Nonlinear dynamical analysis of EEG and MEG: review of anemerging field. Clin Neurophysiol 2005;116(10):2266–301.
Takens F. Detecting strange attractors in turbulence. In: Rand DA,Young LS, editors. Dynamical systems and turbulence. Lecture notesin mathematics 1981;vol. 898. Berlin: Springer; 1981. p. 366–81.
The Parliament of the Commonwealth of Australia. Beyond the midnight oil.Managing fatigue in transport. House of Representatives StandingCommittee on Communications, Transport and the Arts, Australia; 2000.
Torsvall L, Akerstedt T. Sleepiness and irregular work hours. Sleep Res1983;12:376.
Torsvall L, Akerstedt T. Sleepiness on the job: continuously measuredEEG changes in train drivers. Electroencephalogr Clin Neurophysiol1987;66:502–11.
Toyoshima R. Arousal level in schizophrenia: measurements by biphasicchanges of the mean alpha amplitude and frequencies of eyemovements. Jpn J EEG EMG 1991;19:364–73.
Williamson AM, Feyer AM. Moderate sleep deprivation produces impair-ments in cognitive and motor performance equivalent to legallyprescribed levels of alcohol intoxication. Occup Environ Med2000;57:649–55.
Wilson GF. Applied use of cardiac and respiratory measures: practicalconsiderations and precautions. Biological Psychol 1992;34:163–78.
Wilson GF, Purvis B, Skelly J, Fullenkamp P, Davis I. Physiological dataused to measure pilot workload in actual flight and simulatorconditions. In: Proceedings of the human factors society, 31st annualmeeting; 1987, p. 779–83.
Volow MR, Erwin CW. The heart rate variability correlates of sponta-neous drowsiness onset. International Automotive Engineering Con-gress; Detroit MI, USA, 1973.
1922 C. Papadelis et al. / Clinical Neurophysiology 118 (2007) 1906–1922
Copyright © 2022 FDOKUMEN