Evaluating alternative "countermeasures" against food contamination resulting from nuclear accidents
18
Journal of Ap‘cullural Economics - Volume 52, Number 2 - May 2001 - Pages 92-109 Evaluating alternative “countermeasures” against food contamination resulting from nuclear accidents Nick Hanley, Carol A. Salt, Mike Wilson and Meara Culligan-Dunsmore (Manuscript received November 1999; Revision received October 2000; accepted February 2001) N uclear accidents such as Chernobyl have f a r reaching impacts on ecological systems. Likewise they have major implications for agricultural systems, since crops and livestock can become contaminated and rendered unfit for human consumption. A range of “countermeasures” exists, however, which can mitigate these impacts and allow food products to be saved. The CESER project has been concerned with the development of a system to assess the environmental side- effects of such countermeasures. Estimates of the economic costs of these environ- mental side-effects have been made for a number of case study sites in the VK, using environmental models and an original contingent valuation study. Estimates of farm level (private) costs are also included. 1. Introduction Nuclear accidents can lead to widespread environmental contamination and have long- term consequences for the agricultural use of land. The accident at the nuclear power plant of Chernobyl in 1986 contaminated not only Ukrainian, Belorussian and Russian territories, but also large areas of Europe (Anspaugh et al., 1988) and thus affected a wide W Nick Hanley is a Professor in the Department of Economics, University of Glasgow, Glasgow G12 8RT. E-mail: [email protected] for correspondence. Carol Salt is Senior Lecturer in the Department of Environmental Science, University of Stirling, Stirlin FK9 4LA, Mike Wilson is a Research Assistant in the Department of Applied Social Science, flniversity of Stirling; Meara Culligan-Dunsmore is a former Research Associate in the Department of Environmental Science, University of Stirling. An earlier version of this pa er was resented to the Agricultural Economics Society conference, in Belfast, in March 1999. TEe CESfR project was funded by the European Union’s Fourth Framework, Nuclear Fission Safety Programme (DGXII) . Several academic institutions from across Europe articipated in this project, including the University of Stirling, University of Bremen, Finnish fnvironment Institute, North-Trondelag College (Norway) and University of Salzburg. David Aitch’ison and Bill Jamieson of the cartography unit in the Department of Environmental Science, University of Stirling created the images used in the contingent valuation survey. Thanks go to cwo anonymous referees for comments on an earlier draft.
-
Upload
independent -
Category
Documents
-
view
3 -
download
0
Transcript of Evaluating alternative "countermeasures" against food contamination resulting from nuclear accidents

Journal of Ap‘cullural Economics - Volume 52, Number 2 - May 2001 - Pages 92-109
Evaluating alternative “countermeasures” against food contamination resulting from nuclear accidents
Nick Hanley, Carol A. Salt, Mike Wilson and Meara Culligan-Dunsmore
(Manuscript received November 1999; Revision received October 2000; accepted February 2001)
N uclear accidents such as Chernobyl have f a r reaching impacts on ecological systems. Likewise they have major implications for agricultural systems, since crops and livestock can become contaminated and rendered unfit for
human consumption. A range of “countermeasures” exists, however, which can mitigate these impacts and allow food products to be saved. The CESER project has been concerned with the development of a system to assess the environmental side- effects of such countermeasures. Estimates of the economic costs of these environ- mental side-effects have been made for a number of case study sites in the VK, using environmental models and a n original contingent valuation study. Estimates of f a r m level (private) costs are also included.
1. Introduction
Nuclear accidents can lead to widespread environmental contamination and have long- term consequences for the agricultural use of land. The accident at the nuclear power plant of Chernobyl in 1986 contaminated not only Ukrainian, Belorussian and Russian territories, but also large areas of Europe (Anspaugh et al., 1988) and thus affected a wide
W Nick Hanley is a Professor in the Department of Economics, University of Glasgow, Glasgow G12 8RT. E-mail: [email protected] for correspondence. Carol Salt is Senior Lecturer in the Department of Environmental Science, University of Stirling, Stirlin FK9 4LA, Mike Wilson is a Research Assistant in the Department of Applied Social Science, flniversity of Stirling; Meara Culligan-Dunsmore is a former Research Associate in the Department of Environmental Science, University of Stirling. An earlier version of this pa er was resented to the Agricultural Economics Society conference, in Belfast, in March 1999. TEe CESfR project was funded by the European Union’s Fourth Framework, Nuclear Fission Safety Programme (DGXII) . Several academic institutions from across Europe articipated in this project, including the University of Stirling, University of Bremen, Finnish fnvironment Institute, North-Trondelag College (Norway) and University of Salzburg. David Aitch’ison and Bill Jamieson of the cartography unit in the Department of Environmental Science, University of Stirling created the images used in the contingent valuation survey. Thanks go to cwo anonymous referees for comments on an earlier draft.

Evaluating alternative “counlermeasum against Jood contamination resulting from nuclear accidmk 93
range of extensive and intensive agricultural systems. Transfer of deposited radionuclides from soils to plants and animals resulted in contamination of farmed as well as wild foods. Measures therefore had to be taken to limit their entry into the human food chain (Alexakhin, 1993). The radionuclide of most concern in Europe was caesium-137 with a half-life of 30 years, while closer to the accident strontium-90, plutonium-239,240 and others were also present in significant quantities (Eisenbud and Gesell, 1997). More than ten years after the event 23 holdings in Scotland (Scottish Office 1998) and ten holdings in England and Wales (MAFF, 1999) still had restrictions in place preventing agricultural products which exceed Government limits from entering the food chain.
“Countermeasures” can have considerable benefits by not only reducing the radiation dose to humans but also in terms of saving food from disposal and preserving farm incomes (Tveten et al., 1998). Long-term countermeasures encompass a wide range of options that intervene at the soil, plant or animal level. There are also measures which alter farm management practices or change the existing land use (IAEA, 1994). They may target specific radionuclides (i.e. the application of potassium to the soil, which competes for plant root uptake with radiocaesium) or be effective against all radionuclides deposited (i.e. supplying livestock with uncontaminated fodder). Practical applications, as well as field and laboratory experiments in the aftermath of the Chernobyl accident, have greatly increased our knowledge of the radiological effectiveness of a wide range of countermeasures (Roed et al., 1995). At the same time there is an increasing awareness of the potential negative effects of long-term application of countermeasures on environmental resources and agricultural productivity (Salt and Rafferty, 2001).
From 1997 to 1999, the European Commission funded a project to investigate the environmental and socio-economic impacts of countermeasures (CESER - Countermeasures - Environmental and Socic-Economic Responses). One of the key outcomes was the development and application of methods to quantify these impacts and incorporate them into a decision support system designed to aid decision makers in selecting “optimal” countermeasures (Salt and Culligan-Dunsmore, 2000; Salt and Rafferty, 2001). The main aims of this paper are to set out the environmental implications of a range of effective countermeasures applicable to the UK context; and to show how private and environmental cost estimates can be combined to produce a ranking of these alternatives. For a full account of the outcomes of the CESER project, see Salt et aL,(1999).
2. Countermeasures and their environmental impacts
This paper outlines an analysis of long-term countermeasures most suited to the selected study country, Scotland. The time frame for the application of countermeasures and the assessment of their impacts was set at 10 years to allow modelling of long-term impacts, taking into account the potential effects of climatic variation. The broad groups of countermeasures chosen include ploughing techniques designed to bury and dilute radionuclides; soil application of potassium and of lime to chemically compete with Cs and Sr, respectively; changes in the feeding regime of livestock; pasture improvement; and changing from agriculture to forestry or leaving the land fallow (more details are given in Salt et a1.,1999).
The widespread use of countermeasures would alter the way in which agriculture affects

94 Nick Hnnlq: Carol A. Salt, Mike Wilson and lzleara Culligan-Dunrmore
the environment, For example, changes in the frequency or type of tillage (e.g. deep ploughing) or the amount of animal manure applied to land are likely to change rates of erosion and nutrient inputs to water and air. Negative or positive effects on water quality and on emissions of ammonia to air may result. Similarly, the organic matter status of soil may be reduced through tillage or application of lime or may be increased by afforestation or fallow. Afforestation through conifer monoculture is likely to have a negative effect on biodiversity, while reduced grazing and cutting for hay or silage may show benefits for biodiversity. The creation of more improved pasture or the planting of forests will lead to changes at the landscape scale, which may make the landscape more or less appealing to the public. Environmental impacts will vary across countermeasures and across sites.
3. The CESER methodology
Figure 1 outlines the approach adopted. An initial screening of a wide range of countermeasures was carried out to narrow the scope of the project using the criteria of radiological effectiveness (relative reduction in human dose or soil-plant-animal transfer), direct monetary costs, practicability, and acceptability (e.g. in terms of animal welfare). Study sites representative of the important agricultural production systems in Scotland were then selected. The countermeasure selection process requires knowledge of the level of radioactive deposition to predict which food products are most likely to exceed Government intervention. Four deposition scenarios were selected to represent a range of post accident contamination levels at varying distances from the site of the accident (see Table 1). Table 2 illustrates how countermeasures are assigned to deposition scenarios using the example of arable farming systems. Under Deposition Scenarios 1 and 2, radionuclide-specific measures are recommended whereas at higher contamination levels, the recommended measures will act against all radionuclides.
[ Radiolqial E l k l i v m u s 1 Figure 1: CESER Methodology
U I I
ldcnlifiatim

Euahaling allanlive “countermeasures” against food contamination sesultingjrom nuclear accidents 4
Scenario 1
Table 1: Deposition scenarios in kilo-becquerels per square metre for the radionuclides caesium-137, strontium-90 and alpha-plutonium.
Sr alpha-Pu Situation 90 IJ7CS
kBqrn-* kBqm-’ Wqm-’
100 2 0.02 Far-field Chemobyl-like fallout
Scenario2
Scenario 3
I I
100 100 0.02 Far-field with higher Sr fraction
1000 200 0.2 Chemobvl-like fallout. close to site of accident
Scenario 4 5000 500 1 Chernobyl-like fallout very close to site of accident
Source: Salt and Culligan-Dunsmore (2000)
Skim & bury
Change tooilseedrape
Leave fallow
Afforestation
Table 2: Selected countermeasures against radioactive caesium (Cs) and strontium (Sr) recommended for arable farming in Scotland under 4 deposition scenarios.
TE NR TE TE R R NSE NSE TE NR TE TE R R NSE NSE
TE NR TE TE TE TE R R TE NR TE TE TE TE R R

96 Nick H a n b , Cam1 A. Salt, Mib Wilson and Meara Culligan-Dunsmwe
Private costs of countermeasures were evaluated using standard data readily available in the literature (SAC, 1998; SOAEFD, 1999), and through contacts with farm advisors. Such costs include, for example, the cost of feed supplements for dairy cows or the cost of additional fertilisers. For environmental impacts, a review of the literature and expert judgement were used to draw up the following list of criteria, which are assumed to cover the most important environmental impacts of the selected countermeasures:
0 Erosion and sedimentation 0 Soil organic matter 0
0
0 Ammonia emissions 0 Biodiversity 0 Landscape quality
Soil nutrient transport to water Soil pollutant transport to water
In addition, impacts on the quality and quantity of agricultural products as well as animal welfare were identified as important. All criteria are further explained in Salt and Rafferty (2001). The ultimate goal would be to physically quantify and then value all changes in these criteria for each combination of farm type and countermeasure. Estimating monetary values for these impacts was, on the whole, rather difficult. For some, such as changes in biodiversity, important conceptual problems exist (such as what measure of diversity to use), although estimates of the value of specific changes in biodiversity do exist in the economic literature. For other impacts, such as mobilisation of soil pollutants, no values in the literature could be found. A further challenge was to obtain cost figures applicable at the farm scale. Some side-effects, such as ammonia emissions, will have impacts beyond the boundaries of a farm. There are also problems associated with transferring costs to a set of circumstances for which they were not originally intended. Differences in environment, culture, economic development and technology can make a cost estimate derived in one country irrelevant to another. Where major doubts existed over the transferability of costs, a precautionary approach was applied and the value estimate was not used (for example, with regard to biodiversity impacts). A further restriction in costing environmental impacts was that quantitative predictions of the physical impact were not available in all cases (Salt et al., 1999). We now briefly describe the main types of environmental impacts and the derivation of cost estimates for these.
Soil f?rosion
Many countermeasures involve modifications in farming practices that influence rates of soil erosion, especially if they entail changes in the frequency of ploughing. Much of the literature divides erosion effects into on- and off-site impacts. Short term on-site impacts can include changes in crop productivity, fertiliser loss and operational problems. Study of the long-term on-site damage from erosion in the UKis very limited. It has been estimated for one area in the south-east of Scotland that rates of soil loss up to 25 tonnes per hectare per year could be tolerated for more than 200 years before the land would suffer significant yield losses (Frost and Speirs, 1984).

Evaluating alternalive “countermeasures ” against food contamination resdtingfiom nucltar accidents 97
The largest impact of soil erosion in the UK occurs, however, out-with the farm (Armstrong el al., 1990). Some countermeasures will result in increased exposure of bare soil to winter rain, which could have costly consequences. Evans (1996) lists an average cost of 596.4 per km2 for off-site erosion in East Anglia. However, the environmental models used in the CESER study quantify erosion as weight of soil lost per hectare. To convert these estimates into costs, a monetary value per weight of soil is thus required. Ribaudo (1986) reports such an off-site damage cost of E4.72 per tonne of eroded soil. We utilise this figure, converted to 1998 pounds sterling. It should be noted that Ribaudo’s estimate of damage costs relates to off-farm impacts in the US rather than the UKl the absolute value of soil erosion costs should thus be treated with considerable caution. Both negative and positive cost effects are possible. For instance, afforesting arable land or leaving it fallow will lead to a long-term decrease in erosion, whereas converting dairy grassland to barley production will greatly increase erosion.
Soil organic mutter
The effects of agricultural practices such as tillage or liming on soil organic matter are well documented in the literature (Simard et. al., 1991). Countermeasures that accelerate mineralisation of organic matter, such as converting grassland to cereal production, improving rough grassland and liming, may diminish the soil humus reserves. Conversely, afforestation or leaving the land fallow will increase the humus level, although this is a slow process. However, monetary values associated with these changes in soil quality could not be identified.
Soil nutrient traqbort to water
Changes in the amount of nutrients, in particular nitrogen and phosphorus conipounds, reaching a water course can have considerable effects on water quality. Countermeasures such as afforestation or cessation of agricultural production may result in drastic long- term reductions in the nutrient inputs to water‘bodies. On the other hand, significant increases in nutrient run-off may occur as a result of changes in stocking density, livestock feeding regimes and soil applications of both manure and fertilisers. Countermeasures associated with increased erosion are also likely to increase phosphorus inputs to water bodies (Bsrlund et al., 1998). Increased loadings of N and P will increase the risk of eutrophication (Harper, 1992) with impacts such as bad taste and odour of drinking water, growth of toxin-producing cyanobacteria, poor visual . appearance, and interference with fishing, bathing and other amenity uses.
Economic estimates of eutrophication costs have been provided by several authors. Since no relevant estimates exist for the UK, we make use of the study by Gren et al. (1995), who used contingent valuation to assess the costs and benefits of reduced eutrophication of the Baltic Sea. Assuming a 50 per cent reduction in loadings, the benefits of nitrogen and phosphorus reductions are approximately 32000 million SEK and 3500 million SEK per year, respectively. Based on a 50 per cent reduction, the implied values are 24.7 per kg of N and 515.2 per kg of P, respectively in 1998 2s. However, we note that there are problems in using an estimate of environmental damage costs from Sweden to measure environmental damages in Scotland: both the environmental and social contexts of the damage will differ.

98 Nirk Hanlq, Carol A. Salt, Mikt Wilson and Meara Culligan-Dunrmore
Soil pollutant transport to water
Countermeasures may have an effect on the quantity of pollutants reaching water bodies. Conversion of grassland to cereal cultivation on dairy farms will necessitate greater use of pesticides and herbicides, which may reach watercourses through runoff and percolation. Afforestation may lead to substantial local changes in the iron, manganese and aluminium levels in water (Stretton, 1984). No useable cost estimates were found for these impacts in the literature.
Ammonia emi.ssions
In European countries, intensive farming is the main source of ammonia emissions (Asman, 1992). The detrimental effects of ammonia relate to the input of excess nitrogen to ecosystems. Countermeasures involving changes in intensive livestock systems have the greatest potential impact on ammonia emissions. Some data on the costs associated with atmospheric nitrogen exist in the literature, with costs generally expressed in terms of emissions of nitrogen oxides (e.g. Tellus Institute, 1991). Unfortunately, these figures include not only costs associated with ecosystem damage through excess nitrogen inputs but also the cost in human health effects due to inhalation of NOx. Thus the figures cannot be transferred to ammonia, which has no known direct impact on human health. Given these problems, changes in ammonia emissions resulting from countermeasui.es could not be costed despite good impact predictions being available.
Biodiversity
Several contingent valuation exercises have been carried out to estimate willingness to pay for the preservation of rare, threatened and endangered species (e.g. Loomis and White, 1996). However, obtaining values' for single species is not sufficient when attempting to value full biological diversity. Countermeasures entailing changes in grazing pressure or in land use will affect the biodiversity on a farm. In order to assess the resulting complex shifts in species distribution and abundance, an index or set of indices of biodiversity change would be required. However, as Reid (1992) points out, there is n o clear consensus on how biodiversity should be measured. It was also apparent that no estimates of the economic costs of biodiversity loss appropriate for our case study sites existed in the literature.
Landscape qualily
Major impacts on the landscape will result from afforestation, pasture improvement and the cessation of agricultural production. Several contingent valuation exercises have been undertaken to place a value on particular landscape changes (e.g. Willis and Garrod, 1993; Hanley, Wright and Adamowicz, 1998; Bullock and Kay, 1996). However, very few have been identified that achieve a valuation for the types of landscapes which will change due to countermeasures, whilst landscape values can be viewed as extremely site- specific. Given this lack of applicable data in the literature, an original contingent valuation exercise was undertaken to place values on two types of Scottish landscape likely to be affected by afforestation and pasture improvement - rough grassland and heather moorland. This is discussed in more detail in Section 4.
Evaltia!ing alternative “countemmures ’‘ against Jood conhmination resultingfmm nuclear accirienls 99
Soil Organic Matter
Soil Nutrient Transport to Water
Soil Pollutant Transport to Water
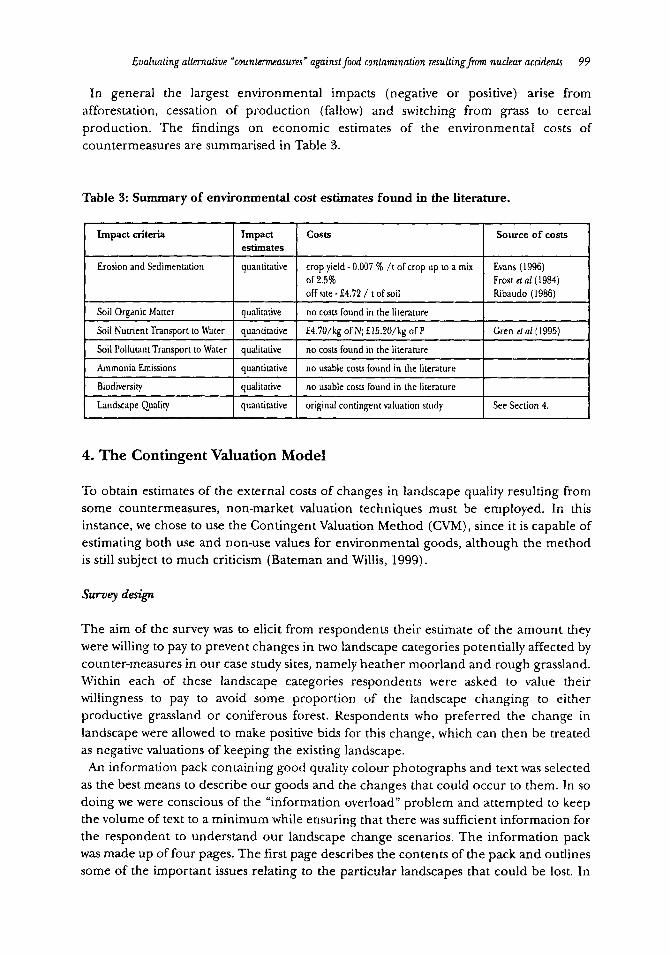
In general the largest environmental impacts (negative or positive) arise from afforestation, cessation of production (fallow) and switching from grass to cereal production. The findings on economic estimates of the environmental costs of countermeasures are summarised in Table 3.
qualitative
quantitative
qualihdve
no costs found in the literature
f4.7O/kg of N; f 15.?O/kg of P
no costs found in the literature
Cren el nl(l995)
Table 3: Summary of environmental cost estimates found in the literature.
Ammonia Emissions
Biodiversity
Impact criteria I
quantitative
qualitative
no usable cosu found in the literature
no usable costs found in the literature
1
Landscape Quality
Erosion and Sedimentation
quantitative original contingent valuation study See Section 4.
Impact estimates
quantitative
Source of costs
of 2.5% Frost el nl(1984) off site - €4.72 / t of soil Ribaudo (1986)
I 1
I 1 - I I I
t 1
4. The Contingent Valuation Model
To obtain estimates of the external costs of changes in landscape quality resulting from some countermeasures, non-market valuation techniques must be employed. In this instance, we chose to use the Contingent Valuation Method (CVM), since it is capable of estimating both use and non-use values for environmental goods, although the method is still subject to much criticism (Bateman and Willis, 1999).
Survqr design
The aim of the survey was to elicit from respondents their estimate of the amount they were willing to pay to prevent changes in two landscape categories potentially affected by counter-measures in our case study sites, namely heather moorland and rough grassland. Within each of these landscape categories respondents were asked to value their willingness to pay to avoid some proportion of the landscape changing to either productive grassland or coniferous forest. Respondents who preferred the change in landscape were allowed to make positive bids for this change, which can then be treated as negative valuations of keeping the existing landscape.
An information pack containing good quality colour photographs and text was selected as the best means to describe our goods and the changes that could occur to them. In so doing we were conscious of the “information overload” problem and attempted to keep the volume of text to a minimum while ensuring that there was sufficient information for the respondent to understand our landscape change scenarios. The information pack was made up of four pages. The first page describes the contents of the pack and outlines some of the important issues relating to the particular landscapes that could be lost. In

100 Nick Hanky, Carol A. Salt, Mike Wilson and Meara Culligan-Dunrmore
the heather moorland information pack, for example, we have stressed the importance of heather moorland as a virtually unique UK habitat. According to Tucker and Evans (1997), 70 per cent of the world’s heather moorland is found in the UK and just over a half of this is in Scotland. The second page contains a map showing the area that would be affected by the hypothetical landscape changes. On this map are concentric circles showing the distance from case study areas at 10-mile intervals. The principal aim of this map was to allow the respondent to relate the area that could be affected by the hypothetical landscape change to where they live. One of the questions in the survey asks respondents to give the distance they live from these areas. The final two pages of the information pack each show pictures of the baseline and changed landscapes, one page for a change to productive grassland and the second for a change to coniferous forest. Both of these pages contain two photographic images each with a short caption describing the management practices that maintain that particular landscape and some of the animal species typical to the landscape. Baseline photographs were manipulated with the software package Adobe Photoshop
Version 4.0 to create pictures of the hypothetical modified landscapes. Other recent CVM exercises using this approach include Hanley et al. (1998) and Hanley, Wright and Adamovicz (1998), although there are many instances of its use in other landscape related exercises, for example, in creating a scenic beauty index to help predict the scenic value of rural landscapes (Tahvanainen el aZ., 1996; Tahvanainen and Tyrvainen, 1998). An advantage of this approach is that all features of the view are held constant apart from those which researchers desire to change. Two focus groups were run, in which questionnaire wording, picture selection, and payment vehicle were tested. The payment mechanism was modified as a result of focus groups, to a specially-created trust fund and a one-off payment per household. A one-off payment was preferred once the focus group realised the landscape change was to be long-term.
A face-to-face interviewing format was chosen for survey implementation in accordance with NOAA guidelines (National Oceanic and Atmospheric Administration, 1993). Another recommendation of the NOAA report is to undertake a scope test, whereby the sensitivity of WTP to changes in the quantity of environmental good being valued is tested for. Two versions of each questionnaire were thus run for each landscape category. Half of the respondents were asked to value their WTP to prevent the landscape change occurring to 50 per cent of the area, while the other half of the respondents were asked their WTP to prevent the landscape change occurring to 25 per cent of the area. In each case the respondent was told the initial size of the study site, both in square miles and, perhaps more meaningfully, in terms of the size of a well known town or city. Note, however, that any one respondent valued one size change only - this was an “across subjects”, rather than a “within subjects” test. WTP responses were collected using the open-ended format, which frequently results in lower mean bid values than dichotomous choice alternatives.
A pilot survey with the heather moorland questionnaire was conducted near Montrose with around twenty respondents, and an immediate follow-up feedback session was held with the field workers. The pilot survey plus feedback session proved useful for simplifying the wording of the questionnaire and in the creation of interviewer briefing packs. The main survey was conducted over a three week period in May 1998 in two areas of Scotland, by a market research firm. The sampling areas comprised one centred on a

Evaluating alternufive "countmuuses " againd food confamination resullingfiom nuclear accidenfs I01
site near Oban on the West Coast, the other on an area approximately 30 miles to the South-West of Aberdeen. Each area was selected for being typical of the two landscape types for which economic valuations of particular landscape changes resulting from countermeasures were required. The completed surveys were gathered from representative samples of respondents selected from within a 50 mile radius of each area. Given that we wish to estimate the total value of our environmental good, i.e. the use and non-use value, then it is appropriate to select the samples from the general population of a geographic area. The questionnaire in the Oban area asked respondents to value their WTP to prevent the loss of rough grassland to 1) afforestation and 2) productive grassland. A similar questionnaire in the Aberdeen area sought respondents' WTP to protect heather moorland from a change to the same two new landscapes. As mentioned above, positive bids to have the change (rather than prevent it) were also allowed. The final versions of the information pack and the questionnaire for the heather
moorland CVh4 can be seen in Wilson et al. (1999). Socio-demographic questions were included in the questionnaires and responses to these were used to estimate bid curves for the WTP amounts.
Suruqr results
A total of 639 questionnaires were collected. This was made up of 318 questionnaires completed in the heather moorland area and 321 completed in the rough grassland area. The scope test meant that approximately 160 questionnaires were completed for each size of area change. The sample proved to be representative of the Scottish population in terms of age and gender when compared to the latest published figures in the Annual Report of the Registrar General for Scotland (GROS, 1998. Table 2.1). An examination of the WTP bids for each of the preferred landscapes suggested that the scope test failed. Given that these bids proved to ,be from non-normal distributions, it is statistically inappropriate to compare means. The alternatives are to either compare medians or to transform the data. Comparisons of medians, using the Mann-Whitney U test, showed that in most cases the quarter area WTPs are not significantly different to the half area WTP estimates. The only exception is the rough grassland-productive grassland landscape change where the null hypothesis that the medians of the quarter and half area changes are the same was rejected at the 95 per cent level. Overall the CVh4 data thus fails to pass the betweensubjects scope test and it was therefore appropriate to pool the two heather moorland data sets, and the two rough grazing data sets. A Kolmogorov-Smirnov test was applied to the data to confirm the appropriateness of chis action. It was not possible to reject the null hypothesis that the two size-varying samples came from identical distributions. All results from this point on were thus based on a pooled moorland sample, and a pooled rough grassland sample
In estimating the value of a change in a given landscape it is important to recognise that some respondents might prefer either alternative (that is, post- or pre- change). This implies including as negative bids for the habitat of interest, positive bids for the alternative (MacMillan and Duff, 1998). WTP amounts for those who wanted to protect the existing landscape (say, heather moorland) were taken as positive figures for heather moorland, whilst WTP amounts for those who preferred the new alternative (in this case, either forestry or improved grazing) were taken as negative values. The resulting net figure suggests a preference for the existing landscape if positive and the new landscape if negative. Table 4 shows the results of combining the WTP data in this manner.

102 Nick Hanky, Carol A . Salt, Mike Wilson and Meara Culligan-Dunsmwe
Change from:
Heather Momland
Rough Grassland
The results suggest that the respondents have a clear preference for heather moorland over both productive grassland and coniferous forestry. The negative WTP for the change from rough grassland to productive grassland suggests the respondents prefer the latter landscape but prefer the former to forestry. This implies a dislike of forestry regardless of the existing landscape and a preference for heather moorland over productive grassland with the latter preferred to rough grassland. As a check on construct validity, bid curves were estimated using the WTP amounts as the dependent variable and the socio-demographic data as the independent variables. Full results may be found in Wilson et al. (1999).
Table 4: Net WTP in 1998 &’s (mean, 95% confidence interval and standard deviation) to preserve existing landscape.
Change to:
Productive Grassland Forestry
Mean WTP 46.5 Mean WTP 9.0 5% trimmed mean 8.1 5% trimmed mean 1.1 95% confidence int -.9 - 93.9 95% confidence int -14.4 - 32.3 standard deviation 365.1 standard deviation 170.2
Mean WTP -36.8 Mean WTP 28.9 5% trimmed mean -5.9 5% trimmed mean 8.4 95% confidence int -90.5 - 17.0 95% confidence int 0.6 - 57.2 standard deviation 400.6 standard deviation 217.9
I
Aggregating the a’utu
Data aggregation, to derive per hectare valuations for each landscape preference, was achieved by multiplying the mean net WTP estimates by the predicted number of affected households. To estimate the number of affected households in each area, a variable representing the distance the respondent lived from the study site was included in the bid curves referred to above. This “distance-decay“ approach to estimate the relevant population for aggregation purposes has been followed by a number of authors, including Pate and Loomis (1997), Bateman and Langford (1997) and Moran (1999). For each study site, the distance from the site at which WTP is predicted to go to zero was derived from the bid curve, and the populations within that distance found from census data. For the heather moorland area, this procedure suggests that the population within a circle of radius 25 miles be used. Using data from the 1991 census (GROS, 1993) the number of households in this circle is approximately 48,000. A similar analysis for the rough grassland area suggests the relevant population lie within a radius of 30 miles. Within this area the number of households is approximately 17,000 (GROS, 1993).
In order to derive a “per hectare value” for each landscape, the size of the area affected by changes has to be considered. Respondents were asked to consider changes to a quarter and to half the area of either 3222 ha. of heather moorland or 2400 ha. of rough grassland. Applying the sample trimmed mean WTP to the estimated number of relevant households and to the size of area affected by the countermeasure produces a range of

Evaluating alternative “coun tmasum againstfood contamination resullingfmm nuclear accidents 103
Change from:
Heather Moorland
Population Trimmed Mean (f/h.hold)
Area (ha) WTP/ha
Rough Grassland Trimmed Mean (f/h.hold) Population Area (ha) WTP/ha
values for each landscape as shown in Table 5. As the scope test suggested that the average WTP valuations are the same regardless of the size of change, the per-hectare figures are shown as a range of values.
Productive Grassland Forestry
8.1 1.1 48,000 48,000 800 - 1600 243 - 486
800 - 1600 33 - 66
-5.9 8.4 17,000 17,000 600 - 1200 -(84 - 168)
600 - 1200 119 - 238
Table 5: Aggregated WTP per hectare to protect heather moorland and rough grassland from changes in landscape to either productive grassland or forestry.
I Change to: I I
Conclusionsfrom the cc?M study
This CVM study showed that the value of preserving particular habi tats/landscapes depends on the alternative proposed. Respondents were allowed to express negative WTP for the existing landscape by bidding to change to this alternative. There is great variation in the WTP data, attributable to greatly differing within-sample variations in preferences for the landscape features: there is no “standard” value of a given landscape. We also know that the way in which the landscape is portrayed within the survey instrument can have a big influence on stated preferences (Blomquist and Whitehead, 1998). The failure of the scope test is unlikely to be due to a poorly-defined good, but is more likely due to the between-sample approach taken and the relatively small sample sizes in each ceIl (160): Schulze et al. (1998) describe a scope test that failed when comparing two samples of approximately 170 responses. They suggest their study could pass a scope test by simply increasing sample size. The use of the distance-decay function, identified from the bid curve, however, allowed us to be fairly precise in aggregating benefits, and so identify per hectare estimates of landscape externalities.
5. Comparing alternative countermeasures
Sample farm data were used to generate a list of feasible and effective countermeasures and an economic analysis of these countermeasures, which estimates the social (private plus environmental) costs of each alternative. For illustrative purposes, we use Deposition Scenarios 2 and 3 from Table 1: results are shown in Tables 6a, 6b and 6c. A farm-level Decision Support System (CeserDSS) was developed and used to identify a set of feasible countermeasures which are radiologically effective given a specific deposition scenario, soil type, farm type and location (Salt and Rafferty, 2001). Since all countermeasures so

104 Nick Hanlq, Carol A. Salt, Mike Wilson and Meara Culligan-Dunsmore
Countermeasure
considered were similarly effective radiologically, the benefits of undertaking coiintermeasures could be taken to be invariant with choice. This means economic comparisons may be made in terms of private plus external costs alone. Three farm types have been used: a dairy farm, an arable farm, and an upland sheep farm with rough grassland for extensive grazing. These farm types correspond to those found in the case study areas, noted below, since physical predictions of environmental impacts need to be based on actual case study area data.
Multi- Net Farm Environmental Total cost criteria Cost Cost Cost ranking Ranking
Table 6: Ranking of alternative countermeasures for three farm types.
Deposition scenario 2 Administer AFCF Feed calcium Feed clean concentrate Feed concentrate grown on farm
6a. Dairy Farm
=2 1314 0 1314 2 =2 684 0 684 1 =I 49844 -354 49490 4 =3 4738 33637 38375 3
Administer AFCF Feed calcium Fml clean concentrate Feed Ca. & clean concentrate.
=2 1314 0 1314 2 =2 684 0 684 1 = I 49844 -354 49490 3 =I 50527 -354 50173 4
Countermeasure Multi- Net Environmental Total Cost criteria Farm Cost Cost ranking Ranking* Cost
1
6b. Arable Farm
Deposition scenario 2 Shallow plough and apply K 1 745 0 745 I

Evnlualing altenintive "countermeasures" ngninrtfood contamination resulting Jrom nuclear accidents 105
Countermeasure
6c. Upland Sheep Farm
Multi- Net Farm Environmental Total Cost criteria Cost Cost Cast ranking Ranking*
Deposition scenario 2 Administer AFCF I =2 I 490 I n I A90
Deposition Scenario 3 Administer AFCF 1 =2 I 490 10 [ 490 1 3 hprove land 1 = I I 3196 I -(1680-3360) 1-164 - I I
1 - I '
AFCF & improve land I = I I 3398 [ -(1680-3360) 1 38- 1718 I 2 Baseline assumptions: Annual rainfall 1978 mm; slope 7%; pew podzol; depth of soil %Om; <35% stones to 30 m depth; depth of rocks % O m ; soil wetness class 111; imperfectly draining pH 3 . 0 CEC 82 rneqI100 g; pea^ surface layer not deeper than 20 cm; no feniliser or lime applied; 145 breeding ewes; animals m be fed outdoors; 109 lambs sold m u a l l y for fattening elsewhere; roughage mntarninated; clean roughage available: rough grazing = rough grassland; no plough available; 50 ha to be treated with l i m e 20 ha to be improved.
In each case, private costs of the'countermeasure were evaluated using data from the SAC Farm Management Handbook (1998). Environmental costs were computed in three ways: (i) for soil erosion, by running a modified CREAMS/GLEAhIS model (Knisel, 1980; Knisel, 1993), ICECREAM (Rekolainen and Posch, 1993), to predict changes in soil loss at the field scale, and multiplying the resultant mean estimate by the f4.72/tonne figure referred to in Table 3; (ii) for dissolved and particulate phosphate in run-off, by again running the ICECREAM model to predict incremental losses, and multiplying this by the figure of f15.2/kg P referred to in Table 3; (iii) for countermeasures involving landscape change, by using the CVM results from section 4. Quantitative estimates of changes in nitrogen losses are not included due to large uncertainties in the model predictions. In all environmental cost calculations i t has been assumed that the predicted change in soil and P loss at the field level is proportionate to the environmental damage. No allowance has been made for potential re-deposition and biological uptake within a catchment since this cannot be easily calculated but i t will cause erosion and P loss to be over-predicted (Richards, 1993; Sharpley and Rekolainen, 1997). It was not possible to rigorously validate the ICECREAM model due to lack of measured data, thus all erosion and nutrient run-off estimates should be treated with caution. Since the decision support system produces a ranking of selected options based on a physical assessment of ten equally weighted environmental and agricultural criteria, we include this information in Table 6 for comparison with the ranking on economic cost grounds.

106 Nick Hanky, Carol A. Salt, Mike Wilson and Meara Culligan-Dunsmore
Dairy farm
The results for a dairy farm in south-west Scotland (Glenstang Burn catchment) are shown for deposition scenarios 2 and 3 in Table 6a. It is assumed that the farm has 44 per cent mowing grass and 56 per cent grazing grass. Net farm costs take into account savings and /or costs arising from changes in the balance between on-farm production and purchase of feed (grass, silage, barley, concentrate). The feeding of bought-in clean concentrate leads to an environmental benefit since on-farm erosion and phosphorus losses are reduced due to the laying fallow of a proportion of the grassland (Salt et aL, 1999). For the dominant soil in the catchment at 5 per cent slope a change in erosion of -0.042 t/ha and a change in P loss of -0.18 kg/ha are predicted. In contrast the feeding of farm-grown winter barley is predicted to markedly increase erosion by 20 t/ha and P loss by 12 kg/ha. The decision support system ranking differs from the economic cost ranking, as might be expected. As the feeding. of Ca is only effective against radiostrontium and the administration of AFCF only reduces radiocaesium transfer, in practice it may be necessary to combine the two measures.
Arable farm
The results for an arable farm growing spring barley in the Eden Water catchment (south- east Scotland) are illustrated in Table 6b. For the ploughing countermeasures the net farm cost is the countermeasure operation cost. The net farm cost for growing winter oilseed rape instead of spring barley is the difference between the two gross margins. Skim and bury ploughing leads to no long-term changes in rates of erosion and P loss since only the top 5 cm of the soil are buried at 50 cm depth, preserving most of the existing topsoil. Deep ploughing in comparison buries the entire topsoil, leading to reduced erosion (-0.014 t/ha at 5 per cent slope) and P loss (-6.0 kg/ha) for one of the common soils in the area. For the switching from spring barley to winter oilseed rape small decreases in erosion and P loss are predicted.
Upland sheep
The results of an assessment for a typical upland sheep farm in the north-west of Scotland near Oban (Lusragan Burn catchment) are shown in Table 6c. Net cost estimates include purchase of roughage and a better market price for fattened compared to store lambs. Increased costs of feeding clean roughage in deposition scenario 3 relative to scenario 2 are due to the longer feeding period required to reduce meat contamination levels below the Government threshold. Improving rough grassland requires additional expenditure in terms of labour, seed, lime, fertiliser and contractors charges. None of the recommended countermeasures have significant effects on erosion and P losses. Environmental costs associated with landscape changes following pasture improvement have been costed using the CVM results. It is assumed that the improved land was originally rough grassland. This has an implied environmental cost in the range &-(84 168)/ha. (Table 5).

Evaluating alternative ’cminkrmeasures” against food contamination resulting fiom nuclear accidents 107
6. Conclusions
Nuclear power stations are associated with a risk of accidental release of radioactivity, which implies a risk of land contamination. Where agricultural land is contaminated, many countermeasures are available to reduce radionuclide transfer to food products. However, these countermeasures may produce a range of environmental impacts, such as soil erosion and landscape change. By combining impact predictions from physical process models with economic value estimates it is possible to rank alternative countermeasures under a range of radionuclide deposition scenarios and agricultural production systems.
It is important to be aware that the cost-based rankings presented in section 5 cannot be generalised in the following sense. The “best” choice of countermeasure for a given deposition scenario depends on the precise location where the action is undertaken, since environmental costs, for instance, will vary greatly according to soil type, slope, rainfall and current farm management practices. Landscape externalities depend crucially on the “before” and “after” states: we make use of estimates for two types of relevant landscape change only as estimated at two survey locations, and we have little idea as to how transferable these landscape estimates are to other locations. We have also pointed out already that lack of useable UK cost estimates for off-site soil erosion and N and P loss forced us to transfer environmental cost estimates from other countries. Original valuation studies for the UK for these two classes of impact might well reveal very different absolute values. Finally, we note that the farm-level costs are based on a simple budgetting calculation, rather than representing the outcomes of mathematical programming models.
Unanswered questions arising from this research include the extent to which consumers are willing to consume products from contaminated areas, even if treatment reduces radiation levels to within official guideline limits; and the extent to which economic estimates of the value of landscape changes are transferable across sites for given landscape types. We hope to address both of these issues in future work (Grande, Hanley and Wilson, 2001).
References
Alexakhin. R. M. (1993). Countermeasures in Agricultural Production as an Effective Means of Mitigating the Radiological Consequences of the Chernobyl Accident. Science of the Total Environment, 137, 9-20.
Anspaugh, L.R., Catlin, R.J., and Goldman, M. (1988). The global impact of the Chernobyl reactor accident. Science, 242, 15131519.
Armstrong, A. C., Davies, D.B. and Castle, D.A. (1990). Soil Water Management and the Control of Erosion on Agricultural Land. In: J. Boardman, I . D. L. Foster and J. A. Dearing. Soil Erosion on Ap’culluml Land. Chichester, Wiley, 569-574.
&man, W. A. H. (1992). Ammonia Emissions in Europe: Updated Emissions and Emission Variations. National Institute of Public Health and Environmental Protection, Bilthoven, Netherlands.
Birlund, I., Tattari, S. and Rekolainen S. (1998). Assessment of Agricultural Management Practices on Phosphorus Loads using the ICECREAM Model. In Foy, R.H. and Dils, R. (eds.), Practical and Innouatiue Measures fbr the Control of Ap’cultural Phosphorus Losses to Water, OECD Workshop, Greenmount College of Agriculture and Horticulture, Northern Ireland, June 1998, pp. 3637.
Baternan. I. and Langford, I. (1997). Non-users WTP for a National Park: an Application of the Contingent Valuation Method, Regional Studies, 31 (6), 571-582.
Baternan, I. and Willis, K (1999). Contingent Valuation of Enuironmentaf Prtferences: Assessing Theory and Practice in

108 Nick Hanlqr, Carol A. Salt, Mike Wilson and Meara Culligan-Dunsmme
tlte USA, Europe, and Developing Countries. Oxford University Press.
in Contingent Valuation." Resource and E n q y Economics 20: 179-196
Benefits of Grazing Extensification. Mimeo, Macaulay Land Use Research Institute, Aberdeen.
Diego; Academic. 656p
Blomquist, G.C. and Whitehead, J.C. (1998) "Resource Quality Information and Validity of Willingness to pay
Bullock, C. and Kay, J. (1996) Preservation and Change in the Upland Agricultural Landscape : Valuing the
Eisenbud, M. and Gesell, T. (1997). Environmental Radioacti7ity:pom Natural, Industrial, and Military Sources. San
Evans, R. (1996). SoilErosion and its Impacts in England and Wales. Friends of the Earth Trust. Frosr, C. A. and Speirs, R.B. (1984). Water Erosion of Soils in Southeast Scotland: a Case Study. Resecmh and
Dmelopmnt in Ag?im~tzcre, 1, 145-52. Grande, J., Hanley, N., and Wilson, M.D. (2001). Risk perceptions, risk averting behaviour and willingness to
pay for risk reduction: an application to countermeasures against radioactive contamination of agricultural areas. Mimeo, Economics Dept., University of Glasgow.
Gren, I., Elofsson, K and Jannke, P. (1995). Costs of Nutrient Reductions to the Baltic Sea. Beijer Discussion Paper Series No 70.
Gren, I-M., T. Soderqvist, el al. (1997). Nutrient Reductions in the Baltic Sea: Ecology, Costs and Benefits. Journnl of Environmental Management, 51 (2): 123143.
GROS (1993). The 1991 Census. -various regions. General Register Office for Scotland. Edinburgh. GROS (1998). Annual Report of the Register General for Scotland. General Register Office for Scotland. Edinburgh. Hanley, N.D., MacMillan. D.. el al. (1998). Contingent Valuation versus Choice Experiments: Estimating the
Benefits of Environmentally Sensitive Areas in Scotland.journa1 of Ap'mltural Economics, 1-15, January. Hanley, N., Wright, R. and Adamowicz, W. (1998). Using Choice Experiments to Value the Environment: Design
Issues, Current Experience and Future Prospects. Environmenfnl und Resource Econmnics, 1 I ( 34 ) , 413-428. Harper, D.M. (1992). Eutrophication of Freshwaters: Principles, Problems and Restoration. London: Chapman and
Hall. IAFA (1994) Guidelines /or Agrkdfural Countermeasures Folloruing an Accidental Release of Radionuclides. Technical
Report Series No.363, Vienna: IAEA. Knisel, W.G. (ed.) (1980). CREAMS, a Field Scale Model for Chemicals, Runoff and Erosion from Agriculttiral
Management Systems, USDA, Conservation Research Report No. 26, 643 pp. Knisel, W.G. (1993). GLEAMS, Groundwater Loading Effects of Agricultural Management Systems, Version 2.1.
UGA-CPESBAED Publ. No. 5. University of Georgia, Tifton, CA. Loomis, J. B. and White, D.S. (1996). Economic Benefitsol Rare and Endangered Species- Summary and Metd-
analysis. Ecological Economics, 18, 197-206. MacMillan, D. and Duff, E. (1998). Estimating the Non-market Benefits and Costs of Nafive Woodland Restoration using
the CVM Method. Mimeo, Department of Agriculture, University of Aberdeen. MAFF (1999). Food Safety Infwmution Bulletin No 106, p.6. Moan, D. (1999). Benefit Transfer and Low Flow Alleviation: What Lessons for Environmental Valuation in the
National Oceanic and Atmospheric Administration (1993). Report of the NOAA Panel on Contingent
Pate J. and Loomis J. (1997). The Effect of Distance on WTP Values: a Case Study of Wetlands and Salmon in
Reid, W. V. (1992). How many species will there be? In: T. Whitrnore and J. Sayer. TropicalDe/orestation and Species
Rekolainen, S. and Posch, M. (1993). Adapting the CREAMS Model for Finnish Conditions. Nordic Hydrology,
Ribaudo, M. 0. (1986). Reducing SoilErosion: Of/site Benefits. AER-561. E M , USDA. Washington, DC. Richards, K (1993). Sediment Delivery and the Drainage Network. In : Channel Network Hydrology (Eds. K
Bevan and M. J. Kirby) pp. 221-254, Wiley, Chichester. Roed, J.. Anderson, KG. and Prip, H. (1995). Practical Means for Decontamination 9years affer a Nuclear Accident.
RisaR-828 (EN) Rise National Laboratory, Denmark. Salt, C., Grande, J., Hanley, N., Solheim Hansen, H., Letmer, H., Kirchner, G., Rekolainen, S., Biirlund, I..
Baumgartner, R., Berreck, M., Culligan Dunsmore, M., Ehlers, H., Ehlken, S., Gastberger, M., Haselwandter, K, Hormann, V., Hosner, F., Peer, T., Pintaric, M., Tattari, S. and Wilson. M. (1999). Final
UK'Journal of EnUiTOnmt?nlal Planning and Managmenf, 42 (3), 425436.
Valuation. Federal Regislet; 58( 10).
California, Ecological Economics, 20, 199-207.
Extinction. London, Chapman Hall.
24, 309-322.

Eualualing allematwe “countt!rm.msures” against food conlamiiiation resultingfiom nuclear accidents 109
RpI)ort o/the C E S R Project - Countermeasures: Environmental and Socio-Economic Responses (FI4P-CT95 0021). EU Nuclear Fission Safety Programme. University of Stirling, Stirling, UIL Available at ww.stir.ac.uk/envsci/ceser/ceser.htm.
Salt, C. and Culligan-Dunsmore, M. (2000). Development o f a Spatial Decision Support System for Post- emergency Management of Radioactively Contaminated Land. Journal o/ Enuzronmtal Managmenf, 58,
Salt, C. and Rafferty, B. (2001). Assessing Potential Secondary Effects of Countermeasures in Agricultural Systems. Journal o/Env~ronmlal Rndioactivity, forthcoming.
Schulze, W. D., McClelland, G.H. et al. (1998). Embedding and Calibration in Measuring Non-use Values. Resuurre and Energy Economics 20, 163-178.
Scottish Agricultural College (1998). The Farm Management Handbook I995/9. Edinburgh: Scottish Agricultural College.
Scottish Office (1998). fost-Cherno[?r[ In fmat ion Sheet. Edinburgh: Scottish Office Agriculture, Environment and Fisheries Department.
Sharpley, A. N. and Rekolainen, S. (1997). Phosphorus in Agriculture and its Environmental Implications. In : Phosphorous Loss from Soil to Water (Eds. H. Tunney, 0. T. Carton, P. C. Brookes and A. E. Johnston). CAB International, Wallingford, pp. 1-53.
Simard, R., Angers, D. and Lapierre, C. (1994). Soil Organic-matter Quality as Influenced by Tillage, Lime, and Phosphorus. Biology and FertiSly o/Soils, 18, 13-18.
SOAEFD (1999). Economic Repurl on Scottzsh A p h l f u r e , 199% Edinburgh: Scottish Office Agriculture, Environment and Forestry Department.
Stretton, C. (1984). Water Supply and Forestry: a Conflict of Interest. Journal ofthe Insfitufion of Wafer Engncers
and Scientists, 38, 323-330. Tahvanainen, L., L. Tyrvainen, et al. (1996). Effects of Afforestation o n the Scenic Value of Rural Landscape.
~candinaviunJourrca1 of Forfilry Research 11: 397405. Tahvanainen. L. and L. Tyrvainen (1998). Model for Predicting the Scenic Value of Rural Landscapes: a
Preliminary Study of Landscape Preferences in North Carelia. Scnndinauinn Journal OjF07cr~try Research. 13,
Tellus Institute (1991). Enuironmental Benejils of DSM in Nnu Ymk: Long Island Case Study. Tellus Institute Proceedings of the Demand Side Management and the Global Environment Conference, Arlington, Virginia, April, 1991.
Tucker, G . M. and Evans, M.I. (1997). Habitatsjor Birds in Europe - a Consmalion .Sfrntt~/ur the Wider Environment. Cambridge: Birdlife International.
Tveten, U., Brynildsen, L.I., Amundsen, I. and Bergan, T.D.S. (1998). Economic Consequences of the Chernobyl Accident in Norway in the decade 1986-1995. Journal o/Environmental Radioactivity, 41,233-255.
Willis, ICG. and Garrod, G.D. (1993). Landscape Values: a Contingent Valuation Approach. Journal o/ Environmental Management, 37, 1-22
Wilson, M.D., Hanley, N.D. and Salt. C.A. (1999). Economic Assessment ofCountmennures. Contract Deliverable o f the CESER Project (FI4P-CT95-0021). EU Nuclear Fission Safety Programme. Environmental Science Department, University of Stirling. Stirling, UK. Available at www.stir.ac.uk/envsci/ceser/ceser. htm.
169-1 78.
379-385.