Road Traffic Accidents and Macroeconomic Conditions in Ghana
Upload
khangminh22Category
view
0download
0
Serious injury due to transport accidents involving
a railway train, Australia, 1999–00 to 2003–04
Louise Flood, Jesia G Berry, James E Harrison
AIHW INJURY RESEARCH AND STATISTICS SERIES № 37

Serious injury due to transport accidents involving a railway
train, Australia, 1999–00 to 2003–04
The Australian Institute of Health and Welfare is Australia’s national health and welfare statistics and information agency. The Institute’s mission is better information and statistics for better health and wellbeing.
Please note that as with all statistical reports there is the potential for minor revisions of data in Serious injury due to transport accidents involving a railway train, Australia, 1999–00 to 2003–04 over its life. Please refer to the online version at <www.nisu.flinders.edu.au>.

Injury Research and Statistics Series Number 37
Serious injury due to transport accidents
involving a railway train, Australia,
1999–00 to 2003–04
Louise Flood Jesia G Berry
and James E Harrison
October 2007
Australian Institute of Health and Welfare
Canberra AIHW cat. no. INJCAT 104

©Australian Institute of Health and Welfare & Australian Transport Safety Bureau 2007 This work is copyright. Apart from any use as permitted under the Copyright Act 1968, no part may be reproduced without prior written permission from the Commonwealth. Requests and enquiries concerning reproduction and rights should be directed to the Head, Business Promotion and Media Unit, Australian Institute of Health and Welfare, GPO Box 570, Canberra ACT 2601. Electronic copies of publications in this series can be downloaded from the Research Centre for Injury Studies website <www.nisu.flinders.edu.au> ISSN 1444-3791 ISBN 978 1 74024 722 1 Suggested citation Australian Institute of Health and Welfare: Louise Flood, Jesia G Berry & James E Harrison, 2007. Serious injury due to transport accidents involving a railway train, Australia, 1999–00 to 2003–04. AIHW cat. no. INJCAT 104. Canberra: AIHW & ATSB. Australian Institute of Health and Welfare & Australian Transport Safety Bureau Penny Allbon Director Australian Institute of Health and Welfare Joe Motha General Manager, Road Safety Australian Transport Safety Bureau Any enquiries about or comments on this publication should be directed to: James Harrison Research Centre for Injury Studies Flinders University GPO Box 2100 Adelaide SA 5001 Phone: 08 8201 7602 Gary Shapcott Australian Transport Safety Bureau PO Box 967, Civic Square ACT 2608 Phone: 1800 621 372 DOTARS Report Number: 50348 Published by the Australian Institute of Health and Welfare and the Australian Transport Safety Bureau Proofreading and layout editing by Stacey Avefua

Contents
Abbreviations........................................................................................................................... vi
1 Introduction .......................................................................................................................1
Major railway disasters.....................................................................................................1
Train-pedestrian collisions...............................................................................................1
Level crossing accidents ...................................................................................................2
Other injury ........................................................................................................................2
2 Main findings....................................................................................................................3
Serious injury involving a train.......................................................................................3
Serious injury due to level crossing accidents...............................................................4
3 Serious injury involving a train.....................................................................................5
Number and rate of hospitalisation................................................................................5
Circumstances of hospitalisation ....................................................................................7
Length of stay...................................................................................................................11
4 Serious injury due to level crossing accidents ..........................................................12
Introduction......................................................................................................................12
Number and rate of hospitalisation..............................................................................14
Circumstances of hospitalisation ..................................................................................16
Length of stay...................................................................................................................19
Data issues ................................................................................................................................20
References.................................................................................................................................23
List of figures ...........................................................................................................................25
List of tables .............................................................................................................................25
Serious injury due to transport accidents involving a railway train, Australia, v 1999–00 to 2003–04

Abbreviations
ABS Australian Bureau of Statistics
AIHW Australian Institute of Health and Welfare
ATC Australian Transport Council
ATSB Australian Transport Safety Bureau
BTRE Bureau of Transport and Regional Economics
CI Confidence Interval
ICD International Classification of Diseases
ICD-10-AM International Classification of Diseases, 10th Revision, Australian Modification
NHMD National Hospital Morbidity Database
vi Serious injury due to transport accidents involving a railway train, Australia, 1999–00 to 2003–04

1 Introduction
The risk of fatal injury, based on passenger kilometres travelled, is five times greater for passengers travelling by car compared with passengers travelling by rail (ATSB 2006). In 1999, Australia had an accident rate of approximately 2.3 per million train kilometres travelled and fatality rate of 0.28 per million train kilometres (BTRE 2002). The Bureau of Transport and Regional Economics (BTRE) suggests that the main issues for rail safety in Australia are suicides, level crossing accidents and pedestrians struck by trains (BTRE 2002). The purpose of this publication is to provide a national overview of serious non-fatal injury in Australia due to transport accidents involving a railway train in the period 1999–00 to 2003–04, including level crossing accidents. The definition of transport injury used in this report excludes injuries given an external cause of intentional self-harm, assault or undetermined intent (see Data Issues ‘Serious injury’, p. 22 for further information on how many of such cases may be rail-related). This report includes all injuries that were serious enough to require hospitalisation but did not result in death. Readers should consult the appendix for notes on the methodology employed and for the meaning of technical terms occasionally used in this report, terms such as ‘separations’ for example.
Major railway disasters Major railway disasters are uncommon, however when they do occur, they: • Often involve a number of fatalities and persons seriously injured. Usually there
are a small number of fatalities but occasionally many deaths result from a single event, e.g. the Granville train disaster in 1977 with 83 fatalities (Sydney Morning Herald 2004);
• Are widely reported in the media; and • Are expensive. The estimated cost of rail accidents that occurred in Australia in
1999 was $133 million (this figure includes level crossing accidents which cost $32 million but does not include suicides or attempted suicides). Approximately $14 million of the cost was accounted for by the accident at Glenbrook with 7 fatalities and 57 minor injuries (BTRE 2006).
In one year (2005), there were 149 derailments, 21 train-train collisions, 12 train-rolling stock collisions, 50 train-person collisions, 107 train-infrastructure collisions, 16 train-road vehicle collisions, 71 level crossing train-road vehicle collisions and 7 level crossing train-person collisions (ATSB 2007).
Train-pedestrian collisions
Suicide and attempted suicide Suicide is the fourth leading cause of death worldwide in the 15–44 year age group (Rådbo et al. 2005). The majority of railway suicides are in males (Rådbo et al. 2005; Gaylord & Lester 1994; Sonneck et al. 1994; O’Donnell & Farmer 1994). Suicide attempts in a railway station have lower lethality than suicide attempts away from a
Serious injury due to transport accidents involving a railway train, Australia, 1 1999–00 to 2003–04

railway station (Schmidtke 1994). A study examining suicides and suicide attempts on the London underground from 1940 to 1990, found that almost 90% of incidents occurred at railway stations (O’Donnell & Farmer 1994). Stations with higher risk of suicides tended to be near psychiatric hospitals and many victims at these stations were current psychiatric inpatients in these hospitals (O'Donnell & Farmer 1994). A Canadian study found that where mental health history was known (122 out of 129 Coroner cases), 86% of suicide victims had a history of mental illness (105 cases) including depression in 50%, schizophrenia in 25.5%, non-specific psychosis in 16.5%, manic depression in 5% and alcoholism in 3% (Mishara 1999). Mishara also found that most suicides (70%) occurred at the station nearest to a person’s place of residence (Mishara 1999). A Swedish study found that the majority of victims (about 75%) were loitering or waiting near the tracks prior to the suicide (Rådbo at el. 2005). In Australia, railway suicides and suicide attempts in 1999 cost approximately $53 million (BTRE 2006).
Railway trespassers Injuries and deaths of pedestrians occur principally at level crossings and to persons trespassing on railway property. In 1997, deaths of railway trespassers became the most common type of railway deaths in the United States of America (USA) (CDC 1999). In Georgia, USA, 288 trespassers were fatally or non-fatally injured during 1990–1996 in 276 separate incidents. The majority of persons were aged 20–49 years (71%), although 11% were children (<18 years old). The majority were males (88%). Most cases (59%) occurred between 6pm and 6am. In 132 cases (46%), their injuries were fatal. For 78 fatalities, a blood alcohol level was available, and of these 55% were positive for alcohol (43 fatalities) with 51% having an alcohol level greater than 100mg/dL (40 fatalities) (CDC 1999). Pelletier studied 128 fatalities among railway trespassers who were killed in 125 separate incidents in North Carolina, USA from 1990–1994 (Pelletier 1997). The majority (81%) were 20–49 years old. The majority of fatalities were males (94%). Again, the majority of fatalities occurred between 6pm and 6am (60%). The majority (82%) had a positive blood alcohol level (105 fatalities), with 78% having a blood alcohol level greater than 100mg/dL (100 fatalities). Many victims were using tracks as a place to socialise, walk or rest (Pelletier 1997).
Level crossing accidents Injury cases due to level crossing accidents are an important issue for rail safety in Australia and these are reviewed separately in Section 4.
Other injury
Boarding and alighting injuries Morlok et al. studied boarding and alighting injuries in the USA from 1995–2000 and found 2,485 boarding and alighting injuries with 0.9175 injuries per million passenger trips and 0.2616 injuries per million employee trips, with a total of 1.1824 boarding and alighting injuries per million person trips (Morlok et al. 2004).
2 Serious injury due to transport accidents involving a railway train, Australia, 1999–00 to 2003–04

2 Main findings
Serious injury involving a train • During the five-year period 1999–00 to 2003–04, there were 1,032 persons seriously
injured and 9,090 patient days due to a transport accident involving a train, with an average of 206 persons seriously injured and 1,818 patient days per year.
• Serious injury due to a transport accident involving a train accounted for 0.1% of all injury-related patient days in hospital and 0.8% of all transport-related patient days.
• On a population basis, the age-standardised rate of serious injury due to a transport accident involving a train was 1.03 per 100,000 population. Males had 1.6 times the rate of serious injury of females, with 1.25 per 100,000 population compared with 0.80 per 100,000 population.
• Over a quarter (26.3%) of train-related hospitalisations were due to injury whilst boarding or alighting; 17.1% of hospitalisations were due to an occupant of a motor vehicle being injured in a collision with a train; and 15.9% of hospitalisations were due to a pedestrian being injured in a collision with a train. Train occupants injured as a result of a train crash were 9.0% of train-related hospitalisations.
• Over three-quarters (76.9%) of hospitalisations due to a transport accident involving a train were in New South Wales and Victoria.
• In New South Wales, a rail user was injured in the majority of cases (84%); most commonly while boarding or alighting, or by falling while in the train or falling from the train. In Victoria, rail users made up only about half of the cases and 41.4% were pedestrians or motor vehicle occupants injured in a collision with a train.
• The majority of persons seriously injured in transport accidents involving a railway train were males (59.7%). There were equal numbers of males and females seriously injured whilst boarding or alighting from a train, but 74.4% of pedestrians, 71.0% of motor vehicle occupants and more than 75% of pedal cyclists and motorcyclists injured in a collision with a train were male. On the other hand, 63.0% of persons injured by a fall in a train were female.
• Serious injury rates, on an age-specific population basis, were highest among youth and young adults (15–24 years) and older people (75 plus years).
• For people aged 65 years and older, about half (49.1%) of the cases were rail users seriously injured while boarding or alighting from a train and 22.2% were rail users injured by falling while in a train. These types of injury were much less common at younger ages.
• Rail-related hospitalised injury at ages 15–44 years was most likely to involve a pedestrian injured in a collision with a train (23.1%), closely followed by a motor vehicle occupant injured in a collision with a train (21.0%).
• The mean length of stay in hospital for persons seriously injured in a transport accident involving a train was 8.8 days, which was longer than the mean length of stay for all external causes of injury and poisoning (4.1 days).
Serious injury due to transport accidents involving a railway train, Australia, 3 1999–00 to 2003–04

Serious injury due to level crossing accidents In this report, a level crossing accident was defined as a collision between a railway train/vehicle and a road vehicle or pedestrian on a public road. This combination of circumstances is most likely to occur at a level crossing, the intersection between a railway track and a public road. This report found that:
• During the five-year period 1999–00 to 2003–04, there were 274 persons seriously injured and 3,117 patient days due to a level crossing accident, with an average of 55 persons seriously injured and 623 patient days per year.
• On a population basis, the age-standardised rate of serious injury from a level crossing accident was 0.27 per 100,000 population. Males had 2.2 times the rate of serious injury of females, with 0.38 per 100,000 population compared with 0.17 per 100,000 population for females.
• 44.2% of persons seriously injured were car occupants injured in a collision with a train and 32.5% were pedestrians injured in a collision with a train.
• Nearly half (49.3%) of all serious injury cases due to level crossing accidents were hospitalised in Victoria.
• More than two-thirds of people seriously injured due to a level crossing accident were male (68.6%).
• Serious injury rates, on an age-specific population basis, were highest among youth and young adults (15–24 years).
• Close to a quarter (24.5%) of persons seriously injured due to a level crossing accident were aged 15–24 years and 39.8% were aged 25–44 years.
• Two-thirds (66.9%) of car occupants and 71.9% of pedestrians seriously injured in a collision with a train were aged 15–44 years.
• The mean length of stay in hospital for persons seriously injured due to a level crossing accident was 11.4 days.
4 Serious injury due to transport accidents involving a railway train, Australia, 1999–00 to 2003–04

3 Serious injury involving a train
Number and rate of hospitalisation From 1999–00 to 2003–04, 1,032 persons were seriously injured(a) in Australia due to transport accidents involving a railway train(b), an average of 206 per year. There was a high in the six months from July to December 1999 with 143 serious injury cases and a low from July to December 2002 and from January to June 2004 with 83 serious injury cases each. The three most populous jurisdictions in Australia are New South Wales (the population number in 2001 was 6,700,312), Victoria (n= 4,936,785) and Queensland (n= 3,846,435). Over three-quarters (76.9%) of the cases due to a transport accident involving a train were hospitalised in New South Wales and Victoria (Table 3.1).
Table 3.1: Persons seriously injured due to transport accidents involving a railway train or railway vehicle, Australia, 1999–00 to 2003–04: by state or territory of hospitalisation
Year Period NSW Vic Qld WA SA Tas ACT NT Australia
1999 Jul-Dec 73 35 23 6 5 0 * * 143
2000 Jan-Jun 43 32 9 * 6 * * * 97
Jul-Dec 53 33 23 * * * 0 0 119
2001 Jan-Jun 25 44 14 * * 0 0 0 89
Jul-Dec 52 38 19 6 6 0 0 0 121
2002 Jan-Jun 37 41 6 8 6 * 0 * 100
Jul-Dec 33 30 7 0 13 0 0 0 83
2003 Jan-Jun 52 39 12 * * 0 0 0 110
Jul-Dec 24 41 18 * 0 * * 0 87
2004 Jan-Jun 35 34 7 * * 0 0 * 83
Total 427 367 138 37 49 8 * * 1,032
Note: * Small counts are omitted (n<5).
(a) The terms seriously injured and hospitalisation are used interchangeably and represent a person being admitted to hospital for injury and subsequently discharged alive either on the same day or after one or more nights stay in a hospital bed (i.e. deaths are excluded). Discharge from hospital can include transfer to home, to another acute care hospital and to another form of care (e.g. rehabilitation). In this report, a method has been used to reduce over-counting of injury cases by omitting separations in which the mode of admission is recorded as being by transfer from another acute-care hospital, on the grounds that such cases are likely to result in two or more separation records for the same injury. (b) In total, there were 1,152 admissions to hospital for rail-related injuries for an estimated 1,057 persons, of whom 25 died whilst in hospital. These deaths are probably included in estimates of fatal rail-related injuries and are omitted from the seriously injured counts in Table 3.1 and throughout the report. The estimate of total patient days includes separations in which the person died in hospital.
Serious injury due to transport accidents involving a railway train, Australia, 5 1999–00 to 2003–04

The total number of hospitalisations over the five-year period by age group at admission and sex is shown in Figure 3.1. For males, the peak was in the 15–19 year age group with 84 hospitalisations. For females, the peak was in the 75–79 year age group with 48 hospitalisations. For males and females combined, the peak was in the 15–19 year age group with 118 hospitalisations (Figure 3.1).
0
20
40
60
80
100
120
0–4
5–9
10–1
4
15–1
9
20–2
4
25–2
9
30–3
4
35–3
9
40–4
4
45–4
9
50–5
4
55–5
9
60–6
4
65–6
9
70–7
4
75–7
9
80–8
4
85+
Age group at admission (years)
Num
ber o
f hos
pita
lisat
ions
Males Females Persons
Figure 3.1: Persons seriously injured due to transport accidents involving a railway train or vehicle, by age group at admission and sex, Australia, 1999–00 to 2003–04
The age-standardised rate of serious injury due to transport accidents involving a railway train was 1.25 hospitalisations per 100,000 population for males (95% CI 1.15–1.35), 0.80 hospitalisations per 100,000 population for females (95% CI 0.72–0.88) and 1.03 hospitalisations per 100,000 population for persons (95% CI 0.97–1.09). The male:female age-standardised rate ratio was 1.6. Serious injury rates, on an age-specific population basis, were highest in the elderly with 2.0, 2.4, 2.2 and 1.9 hospitalisations per 100,000 population for the 70–74, 75–79, 80–84 and 85 plus age groups, respectively, and in the 15–19 and 20–24 year age groups with 1.7 and 1.6 hospitalisations per 100,000 population, respectively. For males, there was a peak in the 85 years and older age group with 2.8 hospitalisations per 100,000 population and in the 15–19 year age group with 2.4 hospitalisations per 100,000 population. For females, the peak was in the 75–79 year age group with 3.2 hospitalisations per 100,000 population (Figure 3.2).
6 Serious injury due to transport accidents involving a railway train, Australia, 1999–00 to 2003–04

0.0
0.5
1.0
1.5
2.0
2.5
3.0
3.5
4.0
0–4
5–9
10–1
4
15–1
9
20–2
4
25–2
9
30–3
4
35–3
9
40–4
4
45–4
9
50–5
4
55–5
9
60–6
4
65–6
9
70–7
4
75–7
9
80–8
4
85+
Age group at admission (years)
Hos
pita
lisat
ions
per
100
,000
pop
ulat
ion
Males Females Persons
Figure 3.2: Age-specific rate of serious injury due to transport accidents involving a railway train or vehicle, by age group at admission and sex, Australia, 1999–00 to 2003–04
Circumstances of hospitalisation Over forty per cent (41.4%) of cases due to a transport accident involving a railway train were hospitalised in New South Wales (Table 3.2). An occupant of a train was injured in the majority (84.1%) of these cases (359 hospitalisations); most commonly while boarding or alighting, or by falling while in the train or falling from the train. Victoria accounted for 35.6% of hospitalisations, but rail users made up only about half of the cases and 41.4% were pedestrians or motor vehicle occupants injured in a collision with a train. Queensland accounted for 13.4% of hospitalisations; about 60% of the cases in Queensland were non-rail users who were injured in a collision with the train, most commonly motor vehicle occupants or pedestrians. Nationally, from 1999–00 to 2003–04, the most common circumstances of hospitalisation due to transport accidents involving a train were: • A person injured while boarding or alighting from train (26.3%) • An occupant of motor vehicle injured in collision with train (17.1%) • A pedestrian injured in collision with train (15.9%) • An occupant of train injured by fall in a train (11.5%) • An occupant of train injured by fall from a train (10.8%). Train occupants who were injured in a train crash (collision or derailment) constituted 9.0% of train-related hospitalisations.
Serious injury due to transport accidents involving a railway train, Australia, 7 1999–00 to 2003–04

Table 3.2: Persons seriously injured due to transport accidents involving a railway train or vehicle, Australia, 1999–00 to 2003–04: circumstances by state or territory of hospitalisation
NSW Vic Qld WA SA Tas ACT NT Australia
Pedestrian injured in collision with train 36 84 25 * 14 * 0 0 164
Pedal cyclist injured in collision with train * 7 5 * * 0 0 0 17
Motorcyclist injured in collision with train * 10 * 0 0 * 0 0 14
Occupant of motor vehicle injured in collision with train 27 68 52 12 13 * * * 176
Animal-rider or occupant of an animal-drawn vehicle injured in collision with train * * 0 0 0 0 0 0 *
Occupant of train injured in collision with motor vehicle** 6 10 * * * 0 0 0 22
Occupant of train injured in collision with or hit by rolling stock** 7 * 0 5 0 0 0 * 15
Occupant of train injured in collision with other object** 25 6 * 0 * 0 0 0 33
Person injured while boarding or alighting from train 148 84 20 7 10 0 * * 271
Occupant of train injured by fall in train** 71 34 10 * * 0 0 * 119
Occupant of train injured by fall from train** 48 44 8 * 5 * 0 * 111
Occupant of train injured in derailment without antecedent collision** 21 0 0 0 * * 0 0 23
Occupant of train injured in unknown transport accident** 33 17 11 * * 0 0 0 66
Person (mode of transport unknown) injured in collision between train and car 0 0 0 0 0 0 * * *
Total 427 367 138 37 49 8 * * 1,032
Note: Shaded areas indicate the 3 highest figures for the total column. * Small counts are omitted (n<5). ** ‘Occupant of train’ includes any occupant of a train, including a passenger, a railway employee, a person on the outside of a train or a person boarding or alighting from a train. Persons waiting at a station for a train (‘intending passengers’) are excluded.
Sixty per cent (59.7%) of persons seriously injured due to transport accidents involving a railway train were male (616 hospitalisations). The ratio of male:female serious injury cases varied with the circumstances. More males than females were seriously injured in collisions involving injury to motor vehicle occupants (2.5:1.0) and pedestrians (2.9:1.0). More males than females were seriously injured in falls from trains (2.1:1.0). However, there were approximately equal numbers of males and females seriously injured whilst boarding or alighting from a train. More females than males were seriously injured by a fall within a train (1.7:1.0) (Table 3.3).
8 Serious injury due to transport accidents involving a railway train, Australia, 1999–00 to 2003–04

Table 3.3: Persons seriously injured due to transport accidents involving a railway train or vehicle, Australia, 1999–00 to 2003–04: circumstances by sex
Males Females Persons
Pedestrian injured in collision with train 122 42 164
Pedal cyclist injured in collision with train * * 17
Motorcyclist injured in collision with train * * 14
Occupant of motor vehicle injured in collision with train 125 51 176
Animal-rider or occupant of animal-drawn vehicle injured in collision with train 0 * *
Occupant of train injured in collision with motor vehicle** 9 13 22
Occupant of train injured in collision with or hit by rolling stock** 10 5 15
Occupant of train injured in collision with other object** 16 17 33
Person injured whilst boarding or alighting from train 136 135 271
Occupant of train injured by fall in train** 44 75 119
Occupant of train injured by fall from train** 75 36 111
Occupant of train injured in derailment without antecedent collision** 11 12 23
Occupant of train injured in unknown transport accident** 43 23 66
Person mode of transport unknown injured in collision between train & car 0 * *
Total 616 416 1,032
Note: Shaded areas indicate the 3 highest figures for the total column. * Small counts are omitted. Only the total of ‘Pedal cyclist injured in collision with train’ and ‘Motorcyclist injured in collision with train’ are shown due to small cell counts. ** ‘Occupant of train’ includes any occupant of a train, including a passenger, a railway employee, a person on the outside of a train or a person boarding or alighting from a train. Persons waiting at a station for a train (‘intending passengers’) are excluded.
The most prominent circumstances of serious injury due to a transport accident involving a train vary with age (Table 3.4). Boarding or alighting from a train accounted for nearly half of cases at ages 65 years and older (49.1%) and nearly a quarter of cases at ages 0–14 years (24.3%) and 45–64 years (24.4%). Injury due to falling while in a train accounted for over one-fifth of cases at ages 65 years and older (22.2%). This type of event was much less common among younger age groups. Falls from trains rather than falls in trains accounted for over one-fifth of cases in the 0–14 age group (21.6%) whereas they accounted for only a small proportion of cases in the 65 years and older group (6.8%). Rail-related hospitalised injury at ages 15–44 years was most likely to involve a pedestrian injured in a collision with a train (23.1%), closely followed by a motor vehicle occupant injured in a collision with a train (21.0%). Pedestrian cases were also prominent among cases in the 0–14 group (14.9%) but much less so among cases in the 65 years and older group (3.4%).
Serious injury due to transport accidents involving a railway train, Australia, 9 1999–00 to 2003–04

Table 3.4: Persons seriously injured due to transport accidents involving a railway train or vehicle, Australia, 1999–00 to 2003–04: circumstances by age group at admission
0–14 15–24 25–44 45–64 65+ Total
Pedestrian injured in collision with train 11 49 72 24 8 164
Pedal cyclist injured in collision with train 6 * 6 * 0 17
Motorcyclist injured in collision with train * * 9 * 0 14
Occupant of motor vehicle injured in collision with train 7 48 62 35 24 176
Animal-rider or occupant of an animal-drawn vehicle injured in collision with train * * 0 0 0 *
Occupant of train injured in collision with motor vehicle** * * 5 7 9 22
Occupant of train injured in collision with or hit by rolling stock** 0 * 7 * * 15
Occupant of train injured in collision with other object** * 5 11 13 * 33
Person injured whilst boarding or alighting from train 18 38 51 49 115 271
Occupant of train injured by fall in train** 5 13 20 29 52 119
Occupant of train injured by fall from train** 16 29 35 15 16 111
Occupant of train injured in derailment without antecedent collision** * 8 7 7 * 23
Occupant of train injured in unknown transport accident** * 25 12 16 * 66
Person mode of transport unknown injured in collision between train & car 0 0 0 * * *
Total 74 226 297 201 234 1,032
Note: Shaded areas indicate the 3 highest figures for the total column. * Small counts are omitted (n<5). ** ‘Occupant of train’ includes any occupant of a train, including a passenger, a railway employee, a person on the outside of a train or a person boarding or alighting from a train. Persons waiting at a station for a train (‘intending passengers’) are excluded.
Table 3.5 shows the five most frequent circumstances of injury by age group at admission and sex. ‘Person injured whilst boarding or alighting from train’ was equally split between males and females. When age group is considered, there were more male than female boarding and alighting injuries in the 15–64 year age range, but more female than male boarding and alighting injuries in the 65 years and older age group (Table 3.5). Males outnumbered females for ‘Occupant of motor vehicle injured in collision with train’ in all age groups except the youngest (0–14 years) and oldest (65 years and older) age groups where there was an even split between males and females. Across all age groups, ‘Pedestrian injured in collision with train’ was approximately three times more common in males than females. In 63.0% of cases, the ‘Occupant of train injured by fall in train’ was female. Case numbers were similar for males and females aged 0–44 years, but more females were seriously injured in the older age groups (45 years and older). In 67.6% of cases, the ‘Occupant of train injured by fall from train’ was male. When age group is considered, there were more males than females seriously injured due to this circumstance in each of the age groups in the 0–64 year age range but more females than males in the 65 years and older group.
10 Serious injury due to transport accidents involving a railway train, Australia, 1999–00 to 2003–04

Table 3.5: Persons seriously injured due to transport accidents involving a railway train or vehicle, Australia, 1999–00 to 2003–04: top five circumstances by age group at admission and sex
0–14 15–24 25–44 45–64 65+ Total
Person injured whilst boarding or alighting from train
Males 9 24 32 29 42 136
Females 9 14 19 20 73 135
Occupant of motor vehicle injured in collision with train
Males * 39 45 25 * 125
Females * 9 17 10 * 51
Pedestrian injured in collision with train
Males * 36 53 18 * 122
Females * 13 19 6 * 42
Occupant of train injured by fall in train**
Males * * 9 11 16 44
Females * * 11 18 36 75
Occupant of train injured by fall from train**
Males * 22 27 11 * 75
Females * 7 8 * 12 36
Total 57 177 240 152 215 841
Note: *Small counts are omitted (<5). This table shows the major circumstances accounting for 81.5% of transport accidents involving a railway train or vehicle. ** ‘Occupant of train’ includes any occupant of a train, including a passenger, a railway employee, a person on the outside of a train or a person boarding or alighting from a train. Persons waiting at a station for a train (‘intending passengers’) are excluded.
Length of stay From 1999–00 to 2003–04, there were 9,090 patient days in hospital due to a transport accident involving a train with an average of 1,818 patient days per year. Serious injury due to a transport accident involving a train accounted for 0.1% of all injury-related patient days in hospital for the same period (8,975,364) and 0.8% of all transport-related patient days (1,118,446). Mean length of stay can be used as a crude indicator of severity of injury. The mean length of stay for persons seriously injured due to transport accidents involving a railway train was 10.1 days for males, 7.0 days for females and 8.8 days for persons. These are considerably longer than the mean length of stay of 3.3 days for males, 5.1 days for females and 4.1 days for persons reported for all external causes of injury and poisoning, 2003–04 (Berry & Harrison 2007). The mean length of stay values are influenced by a small number of cases resulting in very long stays in hospital. There were two cases with a length of stay greater than 250 days and when omitted, the mean length of stay for persons shortened from 8.8 days to 8.0 days.
Serious injury due to transport accidents involving a railway train, Australia, 11 1999–00 to 2003–04

4 Serious injury due to level crossing accidents
Introduction The intersection between a public or private roadway or footpath and a railway track at grade in Australia is commonly called a level crossing. There are several types of level crossing: • Passive level crossings that usually have a crossbuck (Railway crossing sign) and a
‘Give Way’ sign, inverted red triangle or stop sign; • Active level crossings with automatic warning systems such as flashing lights, bells
and/or boom gates; as well as static signage; • Occupational or accommodation crossings between private property and public
roads; • Maintenance crossings; and • Illegal crossings (Standing committee on transport and regional services 2004). In Australia there are approximately 12,500 level crossings (RACS 2003). Approximately 28% (2,650) of the 9,400 public level crossings in Australia are active (Ford & Matthews 2002). Approximately 12% of level crossings are protected by boom gates (RACS 2003). The National Railway Level Crossing Safety Strategy, introduced in 2003, aims to ‘reduce the number, cost and trauma of crashes between trains and any road users by the most cost-effective means’ (ATC 2003, p 3). Accidents at level crossings are a major safety issue for the rail system because: • Level crossing crashes cause more than 40% of rail-related fatalities in Australia
(Cairney 2003); • Crashes are often dramatic and severe and widely reported in the media (Cercarelli
& Guilfoyle 2005); • The majority (67%) of fatal level crossing accidents involving a train and a road
vehicle occur at a rural or urban centre away from a capital city (ATSB 2002b) with most drivers having local knowledge of the crossing (ATC 2003). Hence, accidents can have a significant impact on rural communities; and
• Level crossing accidents are costly. In 1999, the estimated cost of level crossing accidents was $32 million (BTRE 2002).
In Australia, the frequency of road vehicle-train collisions at a level crossing during a six month period (January to June 2006) was 0.41 per million train kilometres and the frequency of train collisions with a person at a level crossing was 0.06 per million train kilometres (ATSB 2007). In Australia, from 1997–2002, there was a yearly average of 36.8 level crossing accident fatalities (range 19 to 44; total of 221) excluding collisions on private roadways and deaths reported as suicide by the coroner (ATSB 2002a). The yearly average for deaths due to a collision between a motor vehicle and train at a level crossing was 12.3 (range 5 to 23; total of 74) (ATSB 2002a).
12 Serious injury due to transport accidents involving a railway train, Australia, 1999–00 to 2003–04
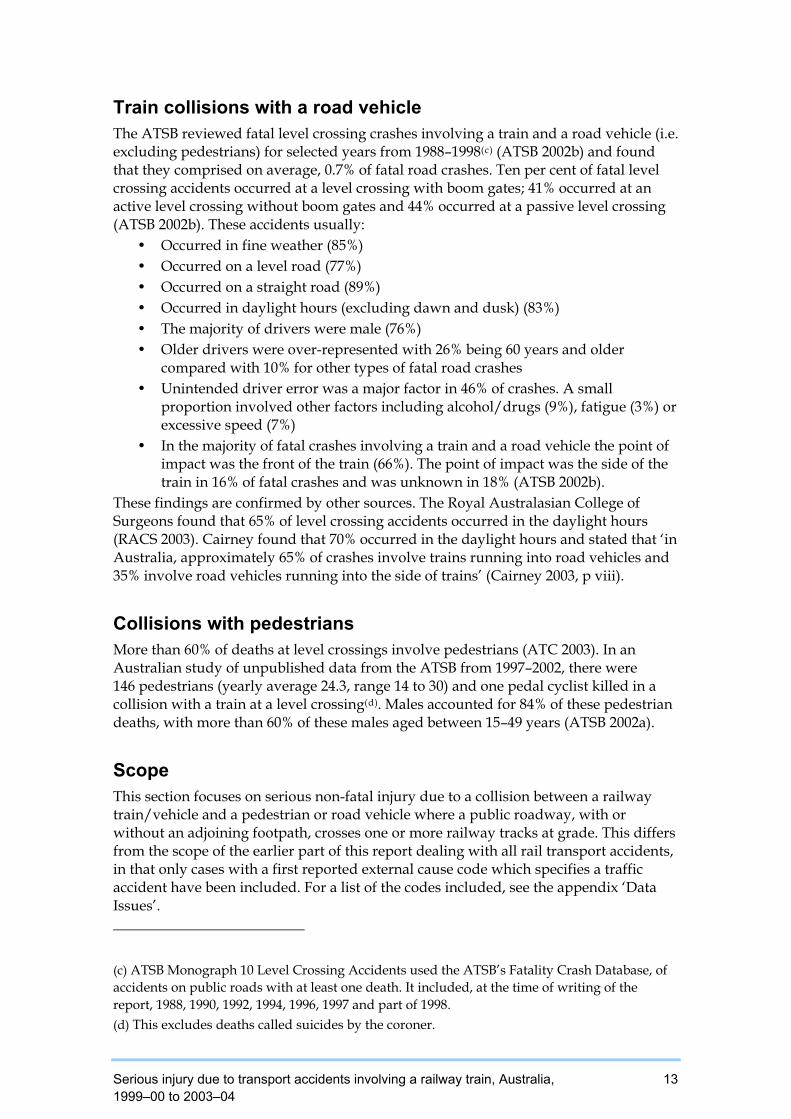
Train collisions with a road vehicle The ATSB reviewed fatal level crossing crashes involving a train and a road vehicle (i.e. excluding pedestrians) for selected years from 1988–1998(c) (ATSB 2002b) and found that they comprised on average, 0.7% of fatal road crashes. Ten per cent of fatal level crossing accidents occurred at a level crossing with boom gates; 41% occurred at an active level crossing without boom gates and 44% occurred at a passive level crossing (ATSB 2002b). These accidents usually:
• Occurred in fine weather (85%) • Occurred on a level road (77%) • Occurred on a straight road (89%) • Occurred in daylight hours (excluding dawn and dusk) (83%) • The majority of drivers were male (76%) • Older drivers were over-represented with 26% being 60 years and older
compared with 10% for other types of fatal road crashes • Unintended driver error was a major factor in 46% of crashes. A small
proportion involved other factors including alcohol/drugs (9%), fatigue (3%) or excessive speed (7%)
• In the majority of fatal crashes involving a train and a road vehicle the point of impact was the front of the train (66%). The point of impact was the side of the train in 16% of fatal crashes and was unknown in 18% (ATSB 2002b).
These findings are confirmed by other sources. The Royal Australasian College of Surgeons found that 65% of level crossing accidents occurred in the daylight hours (RACS 2003). Cairney found that 70% occurred in the daylight hours and stated that ‘in Australia, approximately 65% of crashes involve trains running into road vehicles and 35% involve road vehicles running into the side of trains’ (Cairney 2003, p viii).
Collisions with pedestrians More than 60% of deaths at level crossings involve pedestrians (ATC 2003). In an Australian study of unpublished data from the ATSB from 1997–2002, there were 146 pedestrians (yearly average 24.3, range 14 to 30) and one pedal cyclist killed in a collision with a train at a level crossing(d). Males accounted for 84% of these pedestrian deaths, with more than 60% of these males aged between 15–49 years (ATSB 2002a).
Scope This section focuses on serious non-fatal injury due to a collision between a railway train/vehicle and a pedestrian or road vehicle where a public roadway, with or without an adjoining footpath, crosses one or more railway tracks at grade. This differs from the scope of the earlier part of this report dealing with all rail transport accidents, in that only cases with a first reported external cause code which specifies a traffic accident have been included. For a list of the codes included, see the appendix ‘Data Issues’. (c) ATSB Monograph 10 Level Crossing Accidents used the ATSB’s Fatality Crash Database, of accidents on public roads with at least one death. It included, at the time of writing of the report, 1988, 1990, 1992, 1994, 1996, 1997 and part of 1998. (d) This excludes deaths called suicides by the coroner.
Serious injury due to transport accidents involving a railway train, Australia, 13 1999–00 to 2003–04

Number and rate of hospitalisation From 1999–00 to 2003–04, there were on average 55 persons seriously injured in Australia each year due to a transport accident involving a collision with a train at a level crossing, with 274 persons seriously injured over the five year period. There was a relatively even spread of hospitalisations over the six month periods, with a peak of 34 hospitalisations in the July to December 2001 period and a trough of 20 hospitalisations in the January to June 2002 period. Victoria had the highest number of level crossing-related hospitalisations with 135, followed by Queensland with 59 and NSW with 43. There were small numbers of hospitalisations in Tasmania, the Australian Capital Territory (ACT) and the Northern Territory (NT) (Table 4.1).
Table 4.1: Persons seriously injured due to level crossing accidents, Australia, 1999–00 to 2003–04: by state or territory of hospitalisation
Year Period NSW Vic Qld WA SA Tas ACT NT Australia
1999 Jul-Dec * 14 10 0 * 0 0 0 31
2000 Jan-Jun 6 11 5 0 * 0 * 0 26
2000 Jul-Dec 9 10 9 0 * * 0 0 30
2001 Jan-Jun * 22 7 * * 0 0 0 33
2001 Jul-Dec 5 14 9 * * 0 0 0 34
2002 Jan-Jun * 11 * * * * 0 0 20
2002 Jul-Dec * 12 5 0 8 0 * * 27
2003 Jan-Jun * 13 5 0 * 0 0 0 23
2003 Jul-Dec * 13 5 0 0 * 0 0 22
2004 Jan-Jun 7 15 * * 0 0 0 * 28
Total 43 135 59 9 23 * * * 274
Proportion of rail transport cases 10.1% 36.8% 42.8% 24.3% 46.9% 37.5% 50.0% 25.0% 26.6%
Note: *Small counts are omitted (n<5).
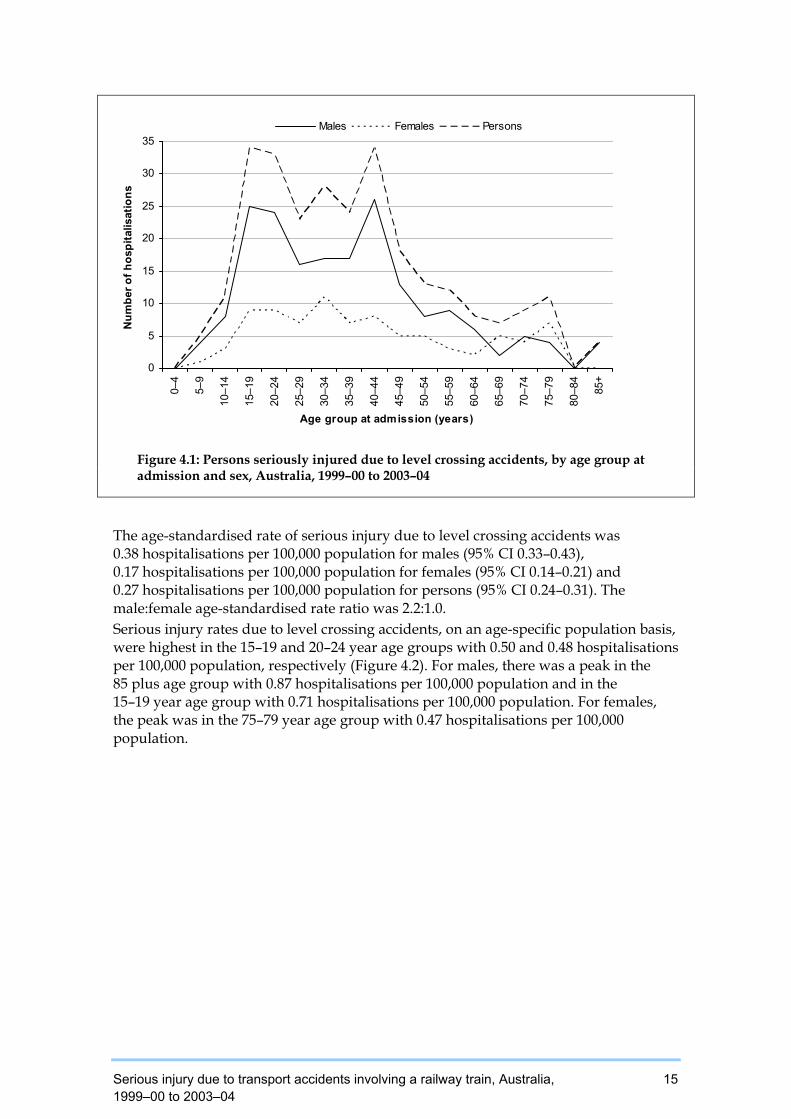
The body of Table 4.1 is restricted to cases that were coded as occurring in traffic. The proportion of included cases that were specified as occurring in traffic differed by jurisdiction and, notably, was lowest for New South Wales. The cases that were coded as unspecified as to whether traffic or non-traffic might include some cases in which a person was seriously injured in a level crossing accident. However, the available data do not allow such a distinction to be made. The number of persons seriously injured in a level crossing accident by age group at admission is shown in Figure 4.1. Case numbers were low for children aged 0–14 years. There was a broad double peak in the teenage to middle age range (15–44 years) with a decline in older age groups. The peak was 34 hospitalisations in both the 15–19 and 40–44 year age groups. This same pattern was observed for males; the peak was 26 hospitalisations in the 40–44 year age group and 25 hospitalisations in the 15–19 year age group. In females there was less variation in the teenage to middle age range (15–44 years) with a peak in the 30–34 year age group with 11 hospitalisations (Figure 4.1).
14 Serious injury due to transport accidents involving a railway train, Australia, 1999–00 to 2003–04
0
5
10
15
20
25
30
35
0–4
5–9
10–1
4
15–1
9
20–2
4
25–2
9
30–3
4
35–3
9
40–4
4
45–4
9
50–5
4
55–5
9
60–6
4
65–6
9
70–7
4
75–7
9
80–8
4
85+
Age group at admission (years)
Num
ber o
f hos
pita
lisat
ions
Males Females Persons
Figure 4.1: Persons seriously injured due to level crossing accidents, by age group at admission and sex, Australia, 1999–00 to 2003–04
The age-standardised rate of serious injury due to level crossing accidents was 0.38 hospitalisations per 100,000 population for males (95% CI 0.33–0.43), 0.17 hospitalisations per 100,000 population for females (95% CI 0.14–0.21) and 0.27 hospitalisations per 100,000 population for persons (95% CI 0.24–0.31). The male:female age-standardised rate ratio was 2.2:1.0. Serious injury rates due to level crossing accidents, on an age-specific population basis, were highest in the 15–19 and 20–24 year age groups with 0.50 and 0.48 hospitalisations per 100,000 population, respectively (Figure 4.2). For males, there was a peak in the 85 plus age group with 0.87 hospitalisations per 100,000 population and in the 15–19 year age group with 0.71 hospitalisations per 100,000 population. For females, the peak was in the 75–79 year age group with 0.47 hospitalisations per 100,000 population.
Serious injury due to transport accidents involving a railway train, Australia, 15 1999–00 to 2003–04

0.0
0.2
0.4
0.6
0.8
1.0
0–4
5–9
10–1
4
15–1
9
20–2
4
25–2
9
30–3
4
35–3
9
40–4
4
45–4
9
50–5
4
55–5
9
60–6
4
65–6
9
70–7
4
75–7
9
80–8
4
85+
Age group at admission (years)
Hos
pita
lisat
ions
per
100
,000
pop
ulat
ion
Males Females Persons
Figure 4.2: Age-specific rate of serious injury due to level crossing accidents, by age group at admission and sex, Australia, 1999–00 to 2003–04
Circumstances of hospitalisation From 1999–00 to 2003–04, 44.2% of persons seriously injured due to level crossing accidents were a ‘Car occupant injured in collision with train’ (121 hospitalisations) and 32.5% were a ‘Pedestrian injured in collision with train’ (89 hospitalisations). Nearly half (49.3%) of all level crossing cases were hospitalised in Victoria (135 hospitalisations) (Table 4.2). Car occupants injured in a collision with a train accounted for a larger proportion of serious injury hospitalisations due to level crossing accidents in Queensland (55.9%) compared with New South Wales (44.2%) and Victoria (40.0%).
16 Serious injury due to transport accidents involving a railway train, Australia, 1999–00 to 2003–04

Table 4.2: Persons seriously injured due to level crossing accidents, Australia, 1999–00 to 2003–04: circumstances by state or territory of hospitalisation
NSW Vic Qld WA SA Tas ACT NT Australia
Pedestrian injured in collision with train 13 58 8 0 9 * 0 * 89
Pedal cyclist injured in collision with train 0 5 * 0 * 0 0 0 9
Motorcycle rider injured in collision with train 0 7 * 0 0 0 * 0 8
Occupant of three-wheeled motor vehicle injured in collision with train 0 0 0 0 0 0 0 0 0
Car occupant injured in collision with train 19 54 33 * 9 * * * 121
Occupant of pick-up truck or van injured in collision with train * * * 0 0 0 0 0 5
Occupant of heavy transport vehicle injured in collision with train * * 6 5 0 * 0 0 17
Bus occupant injured in collision with train 0 * * 0 * 0 0 0 9
Occupant of train injured in collision with motor vehicle** 5 6 * * * 0 0 0 16
Person (mode of transport unknown) injured in collision between train and car 0 0 0 0 0 0 0 0 0
Total 43 135 59 9 23 * * * 274
Note: Shaded areas indicate the 2 highest figures for a column. * Small counts are omitted (n<5). ** ‘Occupant of train’ includes any occupant of a train, including a passenger, a railway employee or a person on the outside of a train. Persons waiting at a station for a train (‘intending passengers’) and persons boarding or alighting from a train are excluded.
Serious injury due to transport accidents involving a railway train, Australia, 17 1999–00 to 2003–04

Over the five-year period, over two-thirds (68.6%) of persons seriously injured due to level crossing accidents were male (188 hospitalisations). The majority of pedestrians (71.9%) and car occupants (62.8%) injured in a collision with a train were male. The majority of pedal cyclists and motorcyclists injured in a collision with a train were male (at least 75%). All persons in the ‘Occupant of pick-up truck or van injured in collision with train’ and ‘Occupant of heavy transport vehicle injured in collision with train’ categories were male (Table 4.3).
Table 4.3: Persons seriously injured due to level crossing accidents, Australia, 1999–00 to 2003–04: circumstances by sex
Males Females Persons
Pedestrian injured in collision with train 64 25 89
Pedal cyclist injured in collision with train * * 9
Motorcyclist injured in collision with train * * 8
Occupant of 3 wheeled vehicle injured in collision with train 0 0 0
Car occupant injured in collision with train 76 45 121
Occupant of pick-up truck or van injured in collision with train 5 0 5
Occupant of heavy transport vehicle injured in collision with train 17 0 17
Bus occupant injured in collision with train * * 9
Occupant of train injured in collision with motor vehicle** 7 9 16
Person (mode of transport unknown) injured in collision between train & car 0 0 0
Total 188 86 274
Note: Shaded areas indicate the 2 highest figures for the person column. * Small counts are omitted (n<5). Only the total of ‘Pedal cyclist injured in collision with train’ and ‘Bus occupant injured in collision with train’ are shown due to small cell counts. ** ‘Occupant of train’ includes any occupant of a train, including a passenger, a railway employee or a person on the outside of a train. Persons waiting at a station for a train (‘intending passengers’) and persons boarding or alighting from a train are excluded.
Close to a quarter (24.5%) of persons seriously injured due to a level crossing accident were aged 15–24 years and 39.8% were aged 25–44 years. Two-thirds (66.9%) of car occupants and 71.9% of pedestrians seriously injured in a collision with a train at a level crossing were aged 15–44 years (Table 4.4). The youngest (0–14 years) and the oldest age groups (65 years and older) comprised only 5.8% and 11.3% of all persons seriously injured due to a level crossing accident, respectively.
18 Serious injury due to transport accidents involving a railway train, Australia, 1999–00 to 2003–04
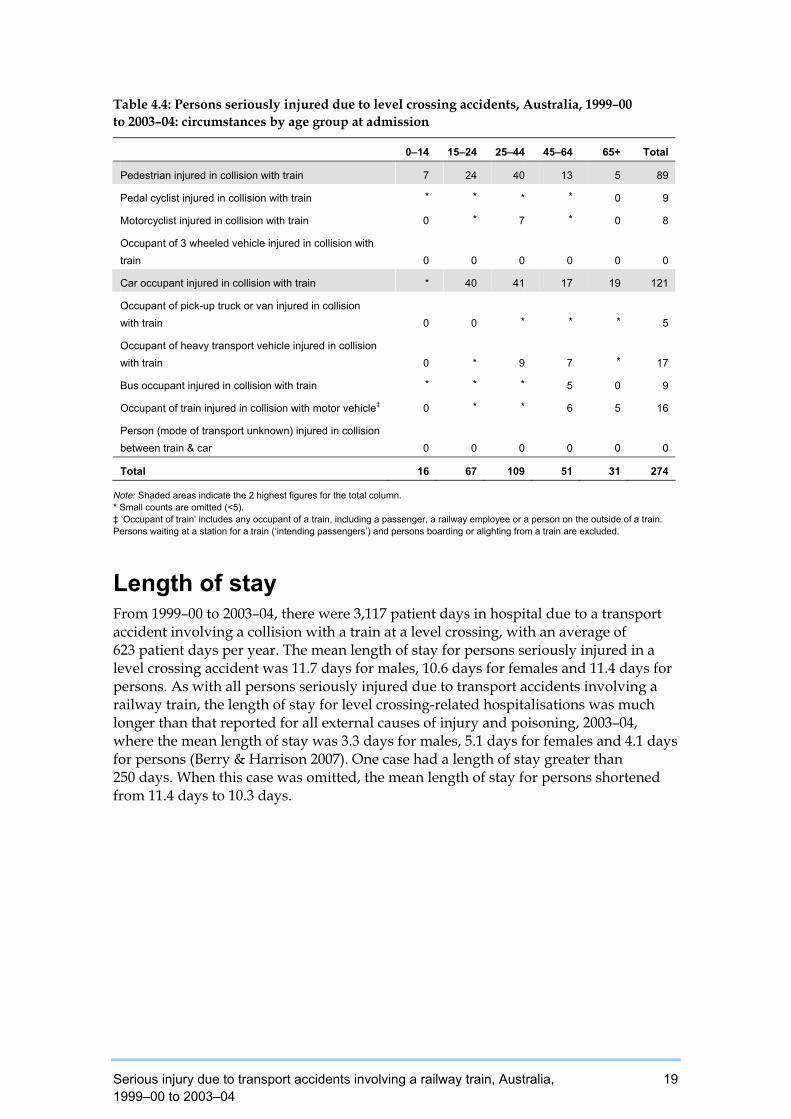
Table 4.4: Persons seriously injured due to level crossing accidents, Australia, 1999–00 to 2003–04: circumstances by age group at admission
0–14 15–24 25–44 45–64 65+ Total
Pedestrian injured in collision with train 7 24 40 13 5 89
Pedal cyclist injured in collision with train * * * * 0 9
Motorcyclist injured in collision with train 0 * 7 * 0 8
Occupant of 3 wheeled vehicle injured in collision with train 0 0 0 0 0 0
Car occupant injured in collision with train * 40 41 17 19 121
Occupant of pick-up truck or van injured in collision with train 0 0 * * * 5
Occupant of heavy transport vehicle injured in collision with train 0 * 9 7 * 17
Bus occupant injured in collision with train * * * 5 0 9
Occupant of train injured in collision with motor vehicle‡ 0 * * 6 5 16
Person (mode of transport unknown) injured in collision between train & car 0 0 0 0 0 0
Total 16 67 109 51 31 274
Note: Shaded areas indicate the 2 highest figures for the total column. * Small counts are omitted (<5). ‡ ‘Occupant of train’ includes any occupant of a train, including a passenger, a railway employee or a person on the outside of a train. Persons waiting at a station for a train (‘intending passengers’) and persons boarding or alighting from a train are excluded.
Length of stay From 1999–00 to 2003–04, there were 3,117 patient days in hospital due to a transport accident involving a collision with a train at a level crossing, with an average of 623 patient days per year. The mean length of stay for persons seriously injured in a level crossing accident was 11.7 days for males, 10.6 days for females and 11.4 days for persons. As with all persons seriously injured due to transport accidents involving a railway train, the length of stay for level crossing-related hospitalisations was much longer than that reported for all external causes of injury and poisoning, 2003–04, where the mean length of stay was 3.3 days for males, 5.1 days for females and 4.1 days for persons (Berry & Harrison 2007). One case had a length of stay greater than 250 days. When this case was omitted, the mean length of stay for persons shortened from 11.4 days to 10.3 days.
Serious injury due to transport accidents involving a railway train, Australia, 19 1999–00 to 2003–04

Data issues
Serious injury National hospital separations data were provided by the Australian Institute of Health and Welfare (AIHW) National Hospital Morbidity Database (NHMD). A ‘separation’ is a term used in Australian hospitals to refer to a formal, or statistical process, by which an episode of care for an admitted patient ceases (AIHW 2001). An ‘episode of care’ is a period of health care characterised by only one care type. For the lay person, this is perhaps best understood as a stay in a particular ward in a hospital. For example, a person who is in an intensive care ward and is then transferred to a rehabilitation ward will have undergone two episodes of care and hence two separations within the hospital. Seriously injured is defined for this report as an injury which results in the person being admitted to hospital, and subsequently discharged alive either on the same day or after one or more nights stay in a hospital bed (i.e. deaths are excluded). The terms seriously injured and hospitalisations are used interchangeably in the report. As discharge from hospital can include transfer to home, to another acute care hospital and to another form of care (e.g. rehabilitation), a method has been used in this report to reduce over-counting of injury cases by omitting separations in which the mode of admission is recorded as being by transfer from another acute-care hospital, on the grounds that such cases are likely to result in two or more separation records for the same injury. Records that met the following criteria are included in this report:
• Australian hospital separations occurring 1 July 1999 to 30 June 2004, coded according to the first, second and third edition of ICD-10-AM (National Centre for Classification in Health 1998, 2000, 2002);
• Principal Diagnosis in the ICD-10-AM range S00–T98 using Chapter XIX Injury, poisoning and certain other consequences of external causes codes;
• First (left-most) external cause of morbidity in ICD-10-AM range V01–V99 (i.e. the ‘Transport Accidents’ section of Chapter XX External causes of morbidity and mortality);
• Mode of admission has any value except the one indicating that transfer from another acute-care hospital has occurred; and
• Mode of separation has any value except the one indicating that the persons died while in hospital.
The calculation of rail transport accidents as a percentage of all injury-related or transport-related hospital separations and the calculation of total patient days (including same day, which are assigned a stay of one day) requires the inclusion of all separations (i.e. not omitting separations in which the mode of admission is recorded as being by transfer from another acute-care hospital or separations in which the person died in hospital). Hospital cases were defined as being due to rail transport if they contained a ICD-10-AM first reported Chapter 20 external cause code of V05, V15, V25, V35, V45, V55, V65, V75, V80.6, V81, V87.6 or V88.6. Cases with a Principal Diagnosis other than injury and cases in which an external cause code for rail transport only appears as an Additional Diagnosis were excluded on the grounds that injury due to a rail transport accident was not recorded as being the main reason for admission to hospital, resulting in a starting file of 1,152 records (Table A1).
Serious injury due to transport accidents involving a railway train, Australia, 20 1999–00 to 2003–04
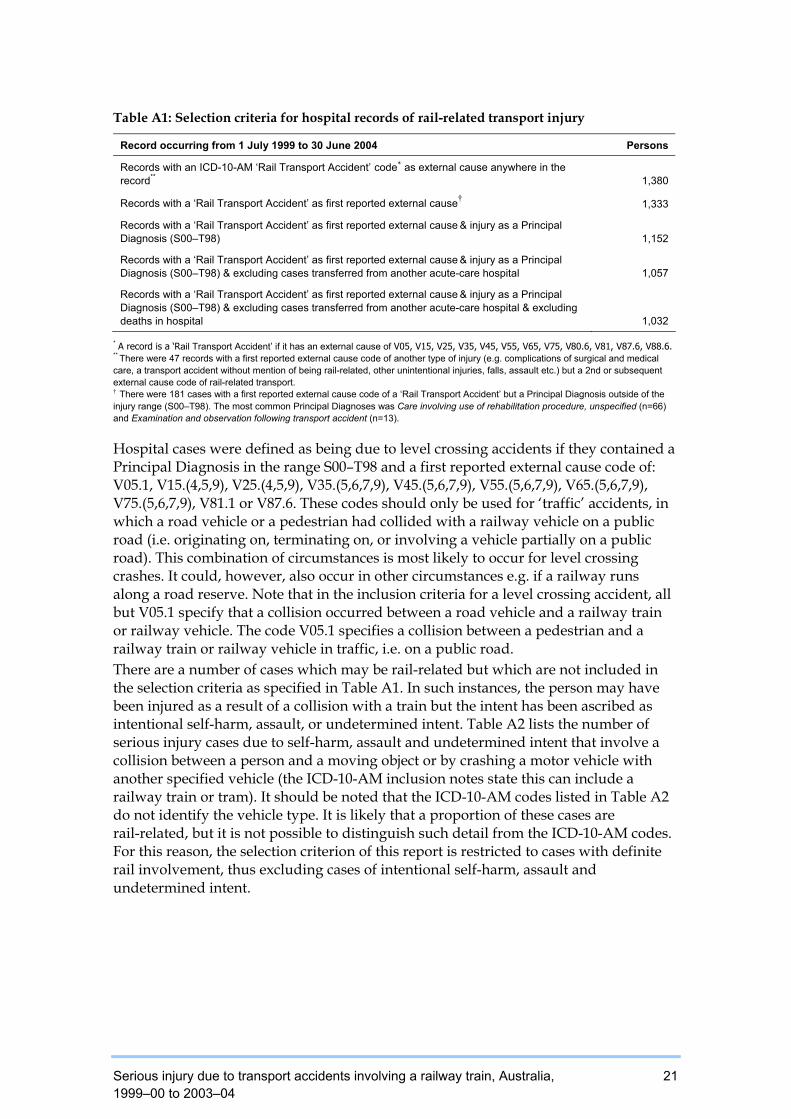
Table A1: Selection criteria for hospital records of rail-related transport injury
Record occurring from 1 July 1999 to 30 June 2004 Persons
Records with an ICD-10-AM ‘Rail Transport Accident’ code* as external cause anywhere in the record** 1,380
Records with a ‘Rail Transport Accident’ as first reported external cause† 1,333
Records with a ‘Rail Transport Accident’ as first reported external cause & injury as a Principal Diagnosis (S00–T98) 1,152
Records with a ‘Rail Transport Accident’ as first reported external cause & injury as a Principal Diagnosis (S00–T98) & excluding cases transferred from another acute-care hospital 1,057
Records with a ‘Rail Transport Accident’ as first reported external cause & injury as a Principal Diagnosis (S00–T98) & excluding cases transferred from another acute-care hospital & excluding deaths in hospital 1,032
* A record is a ‘Rail Transport Accident’ if it has an external cause of V05, V15, V25, V35, V45, V55, V65, V75, V80.6, V81, V87.6, V88.6. ** There were 47 records with a first reported external cause code of another type of injury (e.g. complications of surgical and medical care, a transport accident without mention of being rail-related, other unintentional injuries, falls, assault etc.) but a 2nd or subsequent external cause code of rail-related transport. † There were 181 cases with a first reported external cause code of a ‘Rail Transport Accident’ but a Principal Diagnosis outside of the injury range (S00–T98). The most common Principal Diagnoses was Care involving use of rehabilitation procedure, unspecified (n=66) and Examination and observation following transport accident (n=13).
Hospital cases were defined as being due to level crossing accidents if they contained a Principal Diagnosis in the range S00–T98 and a first reported external cause code of: V05.1, V15.(4,5,9), V25.(4,5,9), V35.(5,6,7,9), V45.(5,6,7,9), V55.(5,6,7,9), V65.(5,6,7,9), V75.(5,6,7,9), V81.1 or V87.6. These codes should only be used for ‘traffic’ accidents, in which a road vehicle or a pedestrian had collided with a railway vehicle on a public road (i.e. originating on, terminating on, or involving a vehicle partially on a public road). This combination of circumstances is most likely to occur for level crossing crashes. It could, however, also occur in other circumstances e.g. if a railway runs along a road reserve. Note that in the inclusion criteria for a level crossing accident, all but V05.1 specify that a collision occurred between a road vehicle and a railway train or railway vehicle. The code V05.1 specifies a collision between a pedestrian and a railway train or railway vehicle in traffic, i.e. on a public road. There are a number of cases which may be rail-related but which are not included in the selection criteria as specified in Table A1. In such instances, the person may have been injured as a result of a collision with a train but the intent has been ascribed as intentional self-harm, assault, or undetermined intent. Table A2 lists the number of serious injury cases due to self-harm, assault and undetermined intent that involve a collision between a person and a moving object or by crashing a motor vehicle with another specified vehicle (the ICD-10-AM inclusion notes state this can include a railway train or tram). It should be noted that the ICD-10-AM codes listed in Table A2 do not identify the vehicle type. It is likely that a proportion of these cases are rail-related, but it is not possible to distinguish such detail from the ICD-10-AM codes. For this reason, the selection criterion of this report is restricted to cases with definite rail involvement, thus excluding cases of intentional self-harm, assault and undetermined intent.
Serious injury due to transport accidents involving a railway train, Australia, 21 1999–00 to 2003–04

Table A2: Serious injury cases due to intentional self-harm, assault or undetermined intent that resulted from a collision with a moving object or vehicle
Record occurring from 1 July 1999 to 30 June 2004 Persons
Records with a first reported external cause as listed below & injury as a Principal Diagnosis (S00–T98) & excluding cases transferred from another acute-care hospital & excluding deaths in hospital
X81 Intentional self-harm by jumping or lying before moving object 180
X82.2 Intentional self-harm by other specified crashing of motor vehicle, non-traffic *
X82.8 Intentional self-harm by other specified crashing of motor vehicle, traffic 12
Y02 Assault by pushing or placing victim before moving object 53
Y03.2 Assault by other specified crashing of motor vehicle, non-traffic 14
Y03.8 Assault by other specified crashing of motor vehicle, traffic 14
Y31 Falling, lying or running before or into moving object, undetermined intent 34
Y32.2 Other specified crashing of motor vehicle, undetermined intent, non-traffic *
Y32.8 Other specified crashing of motor vehicle, undetermined intent. traffic *
Total 312
Note: *Small counts are omitted (n<5).
Population and other denominators All rates in this report were calculated using, as the denominator, the final estimate of the estimated resident population as at 31 December 2003, obtained from the AIHW. Direct standardisation was used to age-standardise rates, using the Australian population in 2001 as the standard (ABS 2003). Confidence intervals (95%; based on a Poisson distribution) were calculated using a method elsewhere described (Anderson & Rosenburg 1998).
Suppression of small cell counts in tables Cell counts in tables that are four cases or fewer have been suppressed as have rates derived from them, to protect confidentiality and because values based on very small numbers are sometimes difficult to interpret. In the instances where only one cell in a row or column has a count of four or less, counts of one or more other cells in the same row or column have generally also been suppressed.
Comparability with other ATSB reports Australian hospitals use an international standard classification called the International Statistical Classification of Diseases (ICD) when compiling data on persons injured and subsequently admitted to hospital (morbidity data). ICD provides a nationally consistent basis for looking at morbidity due to transport accidents of all kinds (road, rail, water and air). However, it is not necessarily consistent with the approach taken by the Australian Transport Safety Bureau (ATSB) or others in looking at safety in each transport mode individually. For example, road safety statistics compiled by the ATSB are focused on crashes on public roads, whereas ICD covers road crashes both on and off public roads. Aviation statistics compiled by the ATSB do not cover hang-gliders, gliders and other forms of non-powered aircraft, whereas ICD does. For information of national road deaths involving railway transport, readers should refer to the ‘rail safety/statistics’ part of the ATSB website at <www.atsb.gov.au>.
22 Serious injury due to transport accidents involving a railway train, Australia, 1999–00 to 2003–04

References
ABS (Australian Bureau of Statistics) 2003. Population by age and sex, Australian states and territories, 2001 Census Edition. ABS cat. no. 3201.0. Canberra: ABS.
AIHW (Australian Institute of Health and Welfare) 2001. National health data dictionary, version 10. AIHW cat. no. HWI 30. Canberra: AIHW.
Anderson R & Rosenburg H 1998. Age standardisation of death rates: implementation of the year 2000 standard. National Vital Statistics Reports 47 3:1–17.
ATC (Australian Transport Council) 2003. National railway level crossing safety strategy. ATC, DOTARS (Department of Transport and Regional Services). <www.atcouncil.gov.au/documents/rail/national_level_crossing_strategy_for_website_publication_27Aug03.doc> Date accessed: 05/03/2007. Last updated: 09/06/2005.
ATSB (Australian Transport Safety Bureau) 2002a. Level crossing accident fatalities. <www.atsb.gov.au/publications/2004/pdf/Lev_Cross_Fat.pdf> Date accessed: 05/03/2007. Last updated: 01/01/2004.
ATSB 2002b. Monograph 10, Level crossing accidents. ATSB, DOTARS. <www.atsb.gov.au/publications/2002/pdf/Lev_Cross_2.pdf> Date accessed: 5/03/2007. Last updated: 01/02/2002.
ATSB 2006. 2006 Annual review. ATSB, DOTARS <www.atsb.gov.au/publications/2006/pdf/annual_review_06.pdf> Date accessed: 23/03/2007. Last updated: 29/09/2006.
ATSB 2007. Australian rail safety occurrence data. <www.atsb.gov.au/publications/2007/pdf/NROD.pdf> Date accessed: 23/03/2007. Last updated: 05/03/2007.
Berry J, & Harrison J 2007. Hospital separations due to injury and poisoning, Australia, 2003–04. AIHW cat. no. INJCAT 88. Adelaide: AIHW.
BTRE (Bureau of Transport and Regional Economics) 2002. Rail accident costs in Australia. BTRE, DOTARS <www.btre.gov.au/docs/reports/r108/r108.pdf> Date accessed: 27/02/2007. Last updated: 23/06/2005.
BTRE 2006. Australian transport statistics. BTRE. <www.btre.gov.au/docs/events/ATS2006.pdf> Date accessed: 27/02/2007. Last updated: 08/2006.
Cairney P 2003. Prospects for improving the conspicuity of trains at passive railway crossings. <ATSB. www.atsb.gov/publications/2003/pdf/lev_cross_3.pdf> Date accessed: 06/03/2007. Last updated: 01/01/2003.
CDC (Center for Disease Control and Prevention) 1999. Injuries among railroad trespassers–Georgia, 1990–1996. MMWR Morbidity and Mortality Weekly Report 48 (25):537.
Cercarelli L & Guilfoyle A 2005. Evaluating the Western Australian Railway Level Crossing Education Project: Injury Research Centre, School of Population Health, University of Western Australia.
Serious injury due to transport accidents involving a railway train, Australia, 23 1999–00 to 2003–04
Ford G & Matthews A 2002. Analysis of Australian grade crossing accident statistics. <www.rtsa.com.au/conferences/crossings/Papers/Ford/Ford.doc> Date accessed: 27/02/2007.
Gaylord MS & Lester D 1994. Suicide in the Hong Kong subway. Social Science and Medicine 38 (3):427–30.
Mishara BL 1999. Suicide in the Montreal Subway System: characterisitcs of the victims, antecedents, and implications for prevention. Canadian Journal of Psychiatry 44 (7):690–6.
Morlok EK, Nitzberg BF & Lai L 2004. Boarding and alighting injury experience with different station platform and car entranceway designs on US commuter railroads. Accident Analysis and Prevention 36 (2):261–71.
NCCH (National Centre for Classification in Health) 1998. The international statistical classification of diseases and related health problems, 10th revision, Australian modification (ICD–10–AM). 1st edition. Sydney: University of Sydney.
NCCH 2000. The international statistical classification of diseases and related health problems, 10th revision, Australian modification (ICD–10–AM). 2nd edition. Sydney: University of Sydney.
NCCH 2002. The international statistical classification of diseases and related health problems, 10th revision, Australian modification (ICD–10–AM). 3rd edition. Sydney: University of Sydney.
O’Donnell I & Farmer RDT 1994. The epidemiology of suicide on the London underground. Social Science and Medicine 38 (3):409–18.
Pelletier A 1997. Deaths among railroad trespassers: the role of alcohol in fatal injuries. JAMA 277 (13):1064–7.
RACS (Royal Australasian College of Surgeons) 2003. Position paper—Railway crossing injuries. <www.surgeons.org/AM/Template.cfm?Section=Policies3&TEMPLATE=/cm/contentDisplay.cfm&CONTENTID=11169> Date accessed: 05/03/2007. Last updated: February 2006.
Rådbo H, Svedung I & Andersson R 2005. Suicides and other fatalities from train-person collisions on Swedish railroads: A descriptive epidemiologic analysis as a basis for systems-oriented prevention. Journal of Safety Research 36 (5):423–8.
Schmidtke A 1994. Suicidal behaviour on railways in the FRG. Social Science and Medicine 38 (3):419–26.
Sonneck G, Etzersdorfer E & Nagel-Kuess S 1994. Imitative suicide on the Viennese subway. Social Science and Medicine 38 (3):453–7.
Standing committee on transport and regional services 2004. Train illumination. Inquiry into some measures proposed to improve train visibility and reduce level crossing accidents. Canberra: House of Representatives, The Parliament of the Commonwealth of Australia.
Sydney Morning Herald 2004, Major rail accidents in Australia. <www.smh.com.au/articles/2004/11/16/1100384539953.html> Date accessed: 03/04/2007. Last updated: 17/11/2004.
24 Serious injury due to transport accidents involving a railway train, Australia, 1999–00 to 2003–04

List of figures
Figure 3.1: Persons seriously injured due to transport accidents involving a railway train or vehicle, by age group at admission and sex, Australia, 1999–00 to 2003–04 ............................................................................6
Figure 3.2: Age-specific rate of serious injury due to transport accidents involving a railway train or vehicle, by age group at admission and sex, Australia, 1999–00 to 2003–04 ....................................................................7
Figure 4.1: Persons seriously injured due to level crossing accidents, by age group at admission and sex, Australia, 1999–00 to 2003–04........................15
Figure 4.2: Age-specific rate of serious injury due to level crossing accidents, by age group at admission and sex, Australia, 1999–00 to 2003–04 ................16
List of tables
Table 3.1: Persons seriously injured due to transport accidents involving a railway train or railway vehicle, Australia, 1999–00 to 2003–04: by state or territory of hospitalisation....................................................................5
Table 3.2: Persons seriously injured due to transport accidents involving a railway train or vehicle, Australia, 1999–00 to 2003–04: circumstances by state or territory of hospitalisation ....................................8
Table 3.3: Persons seriously injured due to transport accidents involving a railway train or vehicle, Australia, 1999–00 to 2003–04: circumstances by sex...........................................................................................9
Table 3.4: Persons seriously injured due to transport accidents involving a railway train or vehicle, Australia, 1999–00 to 2003–04: circumstances by age group at admission .....................................................10
Table 3.5: Persons seriously injured due to transport accidents involving a railway train or vehicle, Australia, 1999–00 to 2003–04: top five circumstances by age group at admission and sex.......................................11
Table 4.1: Persons seriously injured due to level crossing accidents, Australia, 1999–00 to 2003–04: by state or territory of hospitalisation.........................14
Table 4.2: Persons seriously injured due to level crossing accidents, Australia, 1999–00 to 2003–04: circumstances by state or territory of hospitalisation....................................................................................................17
Table 4.3: Persons seriously injured due to level crossing accidents, Australia, 1999–00 to 2003–04: circumstances by sex......................................................18
Table 4.4: Persons seriously injured due to level crossing accidents, Australia, 1999–00 to 2003–04: circumstances by age group at admission..................19
Table A1: Selection criteria for hospital records of rail-related transport injury .......21 Table A2: Serious injury cases due to intentional self-harm, assault or
undetermined intent that resulted from a collision with a moving object or vehicle .................................................................................................22
Serious injury due to transport accidents involving a railway train, Australia, 25 1999–00 to 2003–04

This report presents national statistics on serious injury due to transport accidents involving a railway train that resulted in admission to hospital in Australia during the �ve-year period 1999–00 to 2003–04. It examines variables such as mode of transport, gender and age group. It also focuses on level crossing accidents.
ISBN 978 1 74024 722 1
Copyright © 2022 FDOKUMEN