Traffic Accidents and Roadside Features
11
38 Traffic Accidents and Roadside Features J. CARL McMONAGLE, Director, Planmng and Traffic Division, Michigan State Highway Department • MICHIGAN and the nation at large are experiencing a tremendous e}q>ansion of motor-vehicle traffic. In 1950, traffic in Michigan exceeded by 8 percent the state highway department's long-range estimate for that year. In 1951, actual travel was 16 percent above estimated. Currently we are producing more than 24 billion vehicle miles per annum, or at about the rate our statisticians had forecast for 1964. No one is able to predict with any certainty how long this e:q)ansion will continue at its present rate, but every- one knows that it is putting all highway agencies under heavy pressure. Con- struction forces, already faced by ac- cumulated deficiencies, are straining to meet the most urgent of the mounting demands. Many states have expanded their maintenance operations to take up the slack left by their inability to re- place old or Inadequate facilities. No group is more conscious of the critical conditions which are developing than the traffic engineers. Having the responsibility to operate traffic in what- ever volumes it occurs over existing pavements and structures regardless of their adequacy, they are keenly aware that hazards are increasing. In general, they are missing no opportunities to learn more about the basic facts of accident causation on which safety measures must be based. Certain aspects of the highway safety picture are not too discouraging. The fatality rate has declined steadily during the past 10 years and the trend has been downward for 14 years. In Michigan the 1937 rate was over 15 per 100 million vehicle miles and was less than seven per 100 million vehicle miles in 1951. I believe that this is more or less repre- sentative of the experience in most of the country. We should hesitate to assign too much credit for this condition to any particular measures or factors. Undoubtedly safety education and traffic engineering opera- tions have contributed, but probably of greater importance are the lessons of care and conservation which home-front restrictions taught motorists during the war years. And in this connection, one should not forget the progress of medical science, especially in the use of blood transfusion, which saved so many war wounded from death and which undoubtedly has benefitted many traffic casualties similarly. However, in Michigan at least, any such influence is not reflected in a higher rate for traffic injuries; indeed, this rate has declined slightly but con- sistently during the last decade. All the comfort these rates give is the assurance that, so far, highway casualties are not going up at the same rate as highway traffic (See Fig. 1). Both fatal- ities and personal injuries have increased numercially, and although the data are far from complete, there is Utile doubt that the dollar damage resulting from all accidents has risen faster than traffic. The outstanding message of these figures and conditions is a warning to highway authorities that they cannot for a moment relax their efforts to find and control the hazard factors which are constant com- ponents of moving traffic. Should the present traffic be permitted to develop the frictions and conflicts of 15 years ago, current accident tolls would be doubled. In Michigan we have been on the alert for opportunities to study and analyze accident data. We started early with material that was frequently meager and unreliable and, in consequence, landed in our share of the blind alleys and came up with several wrong answers. As elsewhere, however, methods of collecting and analyzing accident data have been im-
-
Upload
khangminh22 -
Category
Documents
-
view
0 -
download
0
Transcript of Traffic Accidents and Roadside Features

38
Traffic Accidents and Roadside Features
J. CARL McMONAGLE, Director, Planmng and Traffic Division, Michigan State Highway Department
• MICHIGAN and the nation at large are experiencing a tremendous e}q>ansion of motor-vehicle traffic. In 1950, traffic in Michigan exceeded by 8 percent the state highway department's long-range estimate for that year. In 1951, actual travel was 16 percent above estimated. Currently we are producing more than 24 billion vehicle miles per annum, or at about the rate our statisticians had forecast for 1964.
No one is able to predict with any certainty how long this e:q)ansion wil l continue at its present rate, but everyone knows that i t is putting all highway agencies under heavy pressure. Construction forces, already faced by accumulated deficiencies, are straining to meet the most urgent of the mounting demands. Many states have expanded their maintenance operations to take up the slack left by their inability to replace old or Inadequate facilities.
No group is more conscious of the critical conditions which are developing than the traffic engineers. Having the responsibility to operate traffic in whatever volumes it occurs over existing pavements and structures regardless of their adequacy, they are keenly aware that hazards are increasing. In general, they are missing no opportunities to learn more about the basic facts of accident causation on which safety measures must be based.
Certain aspects of the highway safety picture are not too discouraging. The fatality rate has declined steadily during the past 10 years and the trend has been downward for 14 years. In Michigan the 1937 rate was over 15 per 100 million vehicle miles and was less than seven per 100 million vehicle miles in 1951. I believe that this is more or less representative of the experience in most of the country.
We should hesitate to assign too much credit for this condition to any particular measures or factors. Undoubtedly safety education and traffic engineering operations have contributed, but probably of greater importance are the lessons of care and conservation which home-front restrictions taught motorists during the war years. And in this connection, one should not forget the progress of medical science, especially in the use of blood transfusion, which saved so many war wounded from death and which undoubtedly has benefitted many traffic casualties similarly. However, in Michigan at least, any such influence is not reflected in a higher rate for traffic injuries; indeed, this rate has declined slightly but consistently during the last decade.
All the comfort these rates give is the assurance that, so far, highway casualties are not going up at the same rate as highway traffic (See Fig. 1). Both fatalities and personal injuries have increased numercially, and although the data are far from complete, there is Utile doubt that the dollar damage resulting from all accidents has risen faster than traffic. The outstanding message of these figures and conditions is a warning to highway authorities that they cannot for a moment relax their efforts to find and control the hazard factors which are constant components of moving traffic. Should the present traffic be permitted to develop the frictions and conflicts of 15 years ago, current accident tolls would be doubled.
In Michigan we have been on the alert for opportunities to study and analyze accident data. We started early with material that was frequently meager and unreliable and, in consequence, landed in our share of the blind alleys and came up with several wrong answers. As elsewhere, however, methods of collecting and analyzing accident data have been im-

39
HUNDREDS OF TDAFFK FATALITIES
FATALITY RATE P E R 100 M I L L I O N V E H i a E WILES
TOTAL T R A F F I C B I L L I O N S OF V E H I C L E U I L E S
YEAR
Figure I. Traffic and fraffic deafhs in Uichigan, 1930 fo 1951: The long-ferm frend of travel rising faster than traffic fatalities results in a declining fatality rate.
proved, and in recent years we were able to undertake several projects which produced some usable results. One of the more valuable of these results was the knowledge that the findings of such projects are strictly limited as to scope and application by the method of investigation.
There are two ways of approaching the problems of highway accidents. The f i r s t of these is to make an intensive study of the characteristics of an individual accident or of a series of accidents in an individual location in relation to attendant circumstances or features. This is the approach of the enforcement officer investigating a crash for the purpose of setting up an official record and ^sess-ing responsibility. It is also the approach of the traffic engineer studying a high-accident location to find causes and devising remedial measures.
It is an accepted fact that even such intensive investigations fa l l far short of getting all the elements of the accident situation under study; deep psychological fac
tors are seldom touched and factors closer to the observable surface are frequently missed. Nevertheless, such studies produce answers that are usually sufficient for their immediate purposes. The results of a series of such studies may provide the material for analyses which wi l l give solutions of wider scope. However, the greater the number of such individual studies, the more general are the conclusions which can be drawn from their accumulated findings.
The second way of approaching the accident problems is much more objective. It consists of taking as large a collection of accident data as possible, and of then analyzing them in their entirety in relation to selected conditions or features whose relationship to accident occurrence is to be investigated. The validity of the method rests on the belief that the distribution of a large number of instances wi l l create an informative pattern.
The findings of studies of this kind are

40
usually of a very general character. This I S bound to be the case, because although a large number of accidents are used in the analysis, by the nature of the study only those characteristics become significant which are more than ordinarily prevalent.
THE MICHIGAN STUDY
The Michigan Study has resulted in some general findings about certain basic elements of the accident situations which have developed on highways which traverse suburban areas. In most cases these findings are really substantiations of conclusions which previously had been reached tentatively on the basis of rather casual observations of conditions.
Background and Purpose of Study
The Michigan study of roadside features as elements in the accident picture, grew out of a program which the National Safety Council, with the support of the Bureau of Public Roads, Initiated In 1945. The council asked the cooperation of the state highway agencies In making a comparative analysis of the accidents which occurred in 1941 on interstate highways. The accidents were to be analyzed in relation to highway types and certain design features.
Michigan cooperated In this program although the State highway officials were pretty firmly convinced that the accident data then available lacked the detail and accuracy to make such a study success-
W A - S H T E N
1̂
2 <8>
S C A L E O F MILES
Figure 2. Accident analysis study road. US 24 and U 56. The TO-mi. road is a heavily traveled route traversing the edge of the Detroit metropolitan area.

41
MANNER
— HEAD ON ANCLE
mXlT SIDESWIPE » — • REAR END
- » • > » - BACKING
OF ACCIDENT
PEDESTRIAN 1 OVERTURNING PARKED FATALITY
•O PERSONAL INJURY
Z-20-10
7 - J I - u
8-ll-8(> 7 -4 -124
LUNCH a BAR m
/ / /
INSURANCE J OFFICE r—^
D S D CONTROLLER I
TELECRAPM I I nOAQ
3 CONC WALK
DAIRY BAR
10 i'-iPA) ^ « W A Y - S COLOR SiONAL LIOHTS SUSf
g - 2 - g P , ^
9 ;a l O A ^ Q j J
Figure 3. Sample section of study road record map. Data regarding features and accidents were recorded on a strip map with reference to the I,000-ft. section markers.
fu l . A program for studying accidents in relation to roadside as well as roadway features was instituted, and methods were devised for obtaining data which would be sufficiently accurate to permit detailed analysis.
The purpose of this study was to record and study a limited number of the conditions under which accidents took place and to determine, if possible, the relative importance of individual types of features in creating hazards for traffic. Aside from the findings, the most interesting phases of the project are the means that were adopted to secure sound, detailed data, and the statistical methods that were employed to analyze these data.
Of primary Importance were the plans devised to make certain that all t;|ie data should be accurate and particularly that the location of both accidents and features should be precisely established. These plans provided for the selection of a study road and for th6 provision of improved accident reporting measures.
Study Road and Reporting Methods
A 70-mi. stretch of highway on US 24 from the Ohio state line to M 58 just south of Pontiac, and on M 58 to its intersection with US 10, was selected as the study road (See Fig. 2). This route includes a considerable mileage of purely rural highway, but since i t skirts the west edge of the Detroit metropolitan area, it is principally a suburban highway with much roadside development, some of i t extremely dense. For the purposes of this study, the portions of the route in urban territory, were deleted.
To facilitate the exact location of features and accidents, the route was divided into 1000-ft. sections each designated by a numbered marker. All road and roadside features were then inventoried and their location described with reference to these markers (See Fig. 3). Agreements were reached with police agencies under which state troopers, local policemen, and sheriffs'

42
Accidents 70%
Vehicle Miles 70%
Vehicle Miles 30%
Accidents 30%
ISITIUMD
Intersection Sections 29% Non-Intersection Sections 71%
Figure 4. Travel and accidents on intersect ion and nonintersect ion sections Although sections having intersections accounted for less than a third of the road mileage and
travel, they produced 70 percent of the accidents.
officers would Include in the report of every accident the precise place of its occurrence as indicated by the distance from the nearest of these markers.
These arrangements were completed during 1946, and the reporting of accidents by the prescribed methods began on the f i rs t day of 1947 and is s t i l l in progress. By the end of 1949, 3,025 accidents had been reported. These are the accidents used in most of the analyses in this study, although in earUer phases of the study only the 1,968 accidents which occurred in 1947 and 1948 were used.
Methods of Analysis
All data (design and roadside features and accidents) were f i rs t inscribed on a strip map of the study road for recording purposes. For analysis, accident data were punched onto two different tabulating card forms. Of the f i rs t form, one card was punched for each accident and carried items regarding its distance
in hundreds of feet from various features, 1948 average daily traffic, etc. Of the second card form, one was punched for each section and included the section number, the number of accidents, the number of features of each kind, the daily traffic, and the section length.
Two statistical methods were used in analyzing the data. The f i rs t method consisted of tabulating frequency distributions of accidents according to their distance from each specified type of feature. Accuniulative percentages of the accidents within various distances were computed for each feature, and rate curves were drawn.
The second method consisted of calculating correlation coefficients between the number of accidents and the number of various design and roadside features as they occurred in the several sections into which the study road was divided for analysis.
I t should be noted that the 1000-ft road sections were used only for locating features and accidents; initial
43
INTERSECTIONS
TAVERNS
GAS STATIONS
LARGE SIGNS
100 200 300 DISTANCE FROM FEATURE IN FEET
400 500
Figure 5. Number of accidents at various distances from features. Accidents occur with greatest frequency at or close to intersections and nearby roadside features.
phases of the study demonstrated that these sections were unsuitable bases for analyzing the data. For the latter purpose, the road was divided into two kinds of sections: intersection sections, which. include one or more major intersections, and nonintersection sections, which include no intersections. This was done to permit a clearer discrimination between the influence on accident occurrence of intersections and of nearby roadside
features.
RESULTS OF THE STUDY
Analysis of the data by the method of frequency distribution turned up some interesting relationships. One of the most striking of these is revealed by a comparison of the results of separate computations of the data for intersection and nonintersection sections. It shows
r h l i
Taverns 1 1 Gas Stations ^
- ^ — J '—T- T - J
1 LoraA Sians 1 Sto r«8 ^T~~~ •—• 1 kWI WV W f f I ' " - J . 7 ' - :
8 0 100 200 300 DISTANCE FROM FEATURE IN FEET
400 900
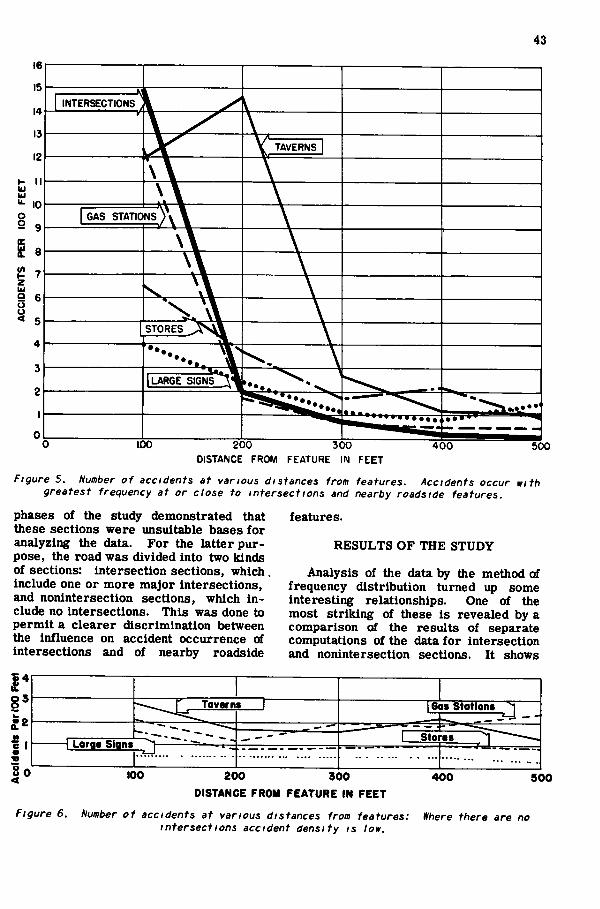
Figure 6. Number of accidents at various distances from features: Where ttiere are no intersections accident density is low.

44
that while the Intersection sections account for less than one third of the study road and its traffic, they produce 70 percent of total accidents (See Fig. 4). Their accident rate is 8. 88 per million vehicle miles while the rate on the non-intersection sections is only 1. 6 accidents per million vehicle miles, or just about the rate on Michigan's rural trunk-line system.
This wide difference in the accident eiqperlence in these two kinds of sections undoubtedly reflects the distribution of features between them. The noninter-section sections have only two intersections. By contrast the intersection sections have all the major intersections while the density of roadside features is 3. 6 times that in the nonintersection sections. These distributions are due to the marked preference of roadside business for locations at or near principal intersections.
Another type of frequency distribution groups the accidents by density at successive distances from several tjrpes of features. Association of a feature with accident occurrence is indicated by the degree of accident density found in its immediate vicinity. In all cases where a feature appears to have real significance, accident density t^ers off rapidly at a distance of 100 or 200 f t . (See Fig. 5).
In the intersection sections, this and subsequent analyses pointed to the importance of one road feature and two roadside features. These are the intersections themselves, gas and service stations, and taverns. On the accompanying graph, one group of signs is also shown, not because it appears to be important but because it was the group of signs showing the highest association with accidents.
In the nonintersection sections, this distribution reveals no important peaks of
Accidents per year per million vehicle miles
3.74
No Roadside Features • • • • • • • < • « > « • • • • 1̂ V»V»ViV»V»V*V»' .*.V.*.V.V.V.V«*.V«V..̂ " • ' • ( • ( ( • • • • • • • • I
13.48
9.06
^xpSSiOl to i.99W^^M^ S^Roadside Features ^^XvvvHPer lOOOfeet j jJsg • •••••• . ^ Y •X'Xw/XvXv.vAV 4 9»8 % .".v.v.v.v.v.v.'.v.v
|jM400andover:l Roadside Features ^per 1000 feet ^ V.VAV.V.V. O Pt .v/.v.v.v. YiYiViYiYiY-YwiYtYtrYiViY-""""
Figure 7. Intersections, features, and accident occurrence: Intersections are dangerous, but the concentration of roadside features near them increase the hazard.

45
TOTAL CORRELATION PARTIAL CORRELATION
TAVERNS
GAS STATIONS
COMMERCIAL GARAGES
STORES
OTHER ESTABLISHMENTS
OESIOM FEATURES
AOVBffTWmO
DEGREE OF CORRELATION
Figure 8. Coefficients of total and partial correlation for various features with accidents (intersection sections): Total correlation shows the cumulative effects of fea
tures, partial correlation reveals their individual relationship to accidents.
accident density; accidents are distributed through these sections rather evenly and without much reference to roadside features or signs (See Fig. 6).
These distributions underscore the importance of intersections among the various features associated with accident occurrence. They also raise the question as to the extent to which the apparent association of some other features is dependent on the location of these features relative to the Intersections.
This difficulty of discriminating between the effects of intersecting traffic and of such features as gas stations which are usually located at intersections, was a serious problem in early phases of the study. The study road was divided Into intersection and nonlntersection sections as a means of partially solving i t .
The next distribution was made to determine something of the relative im
portance of intersections and other features. The pertinent datafor Intersection sections were tabulated with the sections grouped according to the density of roadside features. The results go a long way to providing an answer.
On 28 percent at the mileage in these sections there were 46 Intersections but no roadside featt^es. On this mileage the accident rate was 3. 74 per million vehicle miles.
Fifty percent of the road length had up to 4 roadside features per 1000 f t ; i t had an accident rate of 9.06.
On 22 percent of the mileage, roadside features averaged more than 4 features per 1000 f t . and the accident rate was 13.48 accidents per million vehicle miles (See Fig. 7).
These figures show that Intersections are hazardous in themselves, since the rate of 3. 74 in the groiq> with no road-

MCIDCNTS PER MILLION V E H I C L E - M I L t S ] ,
l » 4 > ANNUAL *VER*6E„~» DAILY TRAFFIC VOLUME
NUMBER OF LANES SURFACE WIDTH 11-33
ROADSIDE FEATURES PER- lOO F E E T
<,1MUf UCTIONS OMITTtD m O H ITUOT i n iTO MO no MO 110 a> 1
1000 FOOT STATIONS I ae MO no
Figures. Accident rates, traffic volumes, number of lanes, surface width, and roadside features (Telegraph Road, 1947 to 1948) Closely spaced intersections and greater densities of roadside features coincide with higher accident rates.

47
side features is more than double the rate for nonintersection sections. But the rising accident rates in the other two groups indicate that intersections become much more hazardous ad roadside features are built around them.
The second method of analyzmg the data in this study was by determining the degree of correlation between accidents and various design and roadside features and was accomplished by computmg correlation coefficients. These are measures of the amount of association between one variable and one or more other variable. The degree of association is registered on a scale running from -1 to -t-1. If two variables are perfectly associated, that is, if one varies directly and proportionately as the other, their correlation wi l l be exactly +1, or if one varies inversely as the other, their correlation wi l l be exactly - 1 . If there is association between two variables, i t is measured by how close their coefficient approaches +1.
This method was used to determine the association of accidents with features in both intersection and nonintersection sections, but since significant degrees of correlation were found only in the intersection sections, these are shown on the accompnaying chart (See Fig. 9). It wi l l be noted that other establishments, advertising signs, taverns, and gas stations all produce coefficients above 0.600.
It was recognized that in many of these cases, the indicated degree of association of a feature with accidents might be, in reality, a reflection of the degrees of association among the features themselves. In other words, certain of these correlation coefficients may well include not only the association of an individual feature with accidents but the association with accidents of other nearby features. For this reason it was desirable and necessary to segregate the association of each individual feature from the influence of other features.
This was accomplished by what the statisticians call partial correlation. That is a process by which the correlation of two variables is computed with the effect of other associated variables e-liminated or held constant. To put it another way, partial correlation meas
ures the effect of one variable in its own right upon a second variable independently of the effect of third or fourth variables which may be present in the field of study.
As the chart indicates (see Fig. 8), when partial correlation was applied to the features in the intersection sections, radical changes were made in the association indicated by the total correlation coefficients. The coefficient of other establishments was reduced to a trifling figure; advertising signs went down to practically zero; and the gas-station coefficient was cut in half. Only the coefficient for taverns remains a significant index of association with accident occurrence.
This finding is borne out by results when partial correlation was applied to the nonintersection sections. There, i t was found that the coefficient for taverns was actually increased. The findings indicate that in all sections of the study route, taverns are more closely associated with accidents than are any other of the features studied.
An overall view of the various factors in the accident experience analyzed, is afforded by the strip map of Oie study road (see Fig. 9). It shows the principal intersections, the density of roadside features, the pavement widths, the average traffic, and the accident rate per million vehicle miles on each 1000-ft. section.
Particularly interesting is the coincidence of peak quantities of roadside features and the higher accident rates at several points along the route. The striking coincidence of low traffic volumes and high accident rate on the northern part of the road is probably due to the fact that this is a two-lane section badly overloaded.
CONCLUSION
As was emphasized earlier, the results of a study must be of a very general nature. They indicate that intersections are themselves centers of traffic hazard and that the hazards increase when the complexities of traffic movement at these points are further complicated by roadside commercial developments.

48
These are findings which have importance in basic problems of highway planning and traffic operation. They point to the fact that every effort should be made to provide highways in suburban areas which wil l protect the main streams of traffic from interference from the roadside. They indicate that intersections in particular require protection.
The studies point with some precision
to the relative importance of various features as factors m creating conditions in which accidents occur with greater than what we believe is normal frequency.
As has been pointed out, most of these findings substantiate conclusions which had been reached but which hitherto lacked clear statistical support. The validity of these conclusions is now soundly established by these studies.