Crowdsourced traffic information in traffic management - DIVA
63
Crowdsourced traffic information in traffic management Evaluation of traffic information from Waze ZSOLT LENKEI Master Thesis No. #, 2018 KTH Royal Institute of Technology School of Architecture and Built Environment Department of Transport Science SE -100 44 Stockholm, Sweden
-
Upload
khangminh22 -
Category
Documents
-
view
2 -
download
0
Transcript of Crowdsourced traffic information in traffic management - DIVA
Crowdsourced traffic information in traffic management
Evaluation of traffic information from Waze
ZSOLT LENKEI
Master Thesis No. #, 2018 KTH Royal Institute of Technology School of Architecture and Built Environment Department of Transport Science SE -100 44 Stockholm, Sweden

2
3
Abstract
The early observation and elimination of non-recurring incidents is a crucial task in traffic management. The performance of the conventional incident detection methods (traffic cameras and other sensory technologies) is limited and there are still challenges in obtaining an accurate picture of the traffic conditions in real time. During the last decade, the technical development of mobile platforms and the growing online connectivity made it possible to obtain traffic information from social media and applications based on spatial crowdsourcing. Utilizing the benefits of crowdsourcing, traffic authorities can receive information about a more comprehensive number of incidents and can monitor areas which are not covered by the conventional incident detection systems. The crowdsourced traffic data can provide supplementary information for incidents already reported through other sources and it can contribute to earlier detection of incidents, which can lead to faster response and clearance time. Furthermore, spatial crowdsourcing can help to detect incident types, which are not collected systematically yet (e.g. potholes, traffic light faults, missing road signs). However, before exploiting crowdsourced traffic data in traffic management, numerous challenges need to be resolved, such as verification of the incident reports, predicting the severity of the crowdsourced incidents and integration with traffic data obtained from other sources.
During this thesis, the possibilities and challenges of utilizing spatial crowdsourcing technologies to detect non-recurring incidents were examined in form of a case study. Traffic incident alerts obtained from Waze, a navigation application using the concept of crowdsourcing, were analyzed and compared with officially verified incident reports in Stockholm. The thesis provides insight into the spatial and temporal characteristics of the Waze data. Moreover, a method to identify related Waze alerts and to determine matching incident reports from different sources is presented. The results showed that the number of reported incidents in Waze is 4,5 times higher than the number of registered incidents by the Swedish authorities. Furthermore, 27,5 % of the incidents could have been detected faster by using the traffic alerts from Waze. In addition, the severity of Waze alerts is examined depending on the attributes of the alerts.
Keywords
Traffic incident management, Traffic monitoring, Traffic incident detection, Spatial
crowdsourcing, Waze

4
5
Sammanfattning
Att identifiera incidenter i trafiken i tidigt skede är avgörande för att kunna bibehålla trafiken säker och rullande. De traditionella metoderna för att upptäcka trafikhändelser (trafikkameror och andra sensorer) är begränsade och det finns fortfarande utmaningar att få en korrekt bild av trafiken i realtid. Tack vare den tekniska utvecklingen och den ökade populariteten av online sociala nätverk under det senaste decenniet blev det möjligt att få fram trafikinformation från sociala medier och applikationer baserade på spatial crowdsourcing. Fördelarna med crowdsourcing möjliggör att trafikledningen kan få mycket finmaskig information om händelser och kan övervaka områden som inte omfattas av traditionella händelsedetekteringssystem. Trafikdata, från källor som bygger på crowdsourcing, kan tillhandahålla kompletterande information för händelser som redan har rapporterats via andra källor. Samtidigt kan det bidra till snabbare identifiering av händelser, vilket kan leda till snabbare responstid. Dessutom kan spatial crowdsourcing tillämpas för att upptäcka incidenter som inte samlas systematiskt ännu (till exempel hål på vägen, ej fungerande trafikljus, saknade vägskyltar). Dock innan crowdsourcad trafikinformation kan nyttjas i hanteringen av trafikhändelser flera utmaningar måste klargöras. Dessa är verifiering av händelserapporter, uppskattning av händelsens påverkan på trafiken och integration med trafikdata från andra källor.
I detta examensarbete undersöktes möjligheterna och utmaningarna för användning av crowdsourcad trafikdata i hantering av trafikhändelser. Trafikdata från Waze, en navigationsapplikation som baseras på crowdsourcing, analyserades och jämfördes med den befintliga trafikinformationen. Uppsatsen ger insikt i de spatiala och temporära egenskaperna av Waze-data. Dessutom presenteras en metod för att identifiera relaterade händelserapporter i Waze och för att matcha händelserapporter från olika källor. Resultatet visade att antalet rapporterade händelser i Waze är 4,5 gånger högre än antalet registrerade incidenter hos den svenska trafikledningen. Vidare kunde 27,5% av händelserna ha detekterats snabbare genom att använda rapporter från Waze.

6

7
Acknowledgements
I would like to thank my academic advisors at KTH, Athina Tympakianaki and Yusak Susilo, and my supervisor at RISE Viktoria, Daniel Rudmark, for their assistance and encouragement.
I also want to thank Per-Olof Svensk, Trafikverket, and Beatrice Gustafsson, Alexander Nilsson and Otto Åstrand from Trafik Stockholm for all the valuable discussions which helped me to understand how traffic management is organized in Sweden.
Zsolt Lenkei
Göteborg, October 2018
8
Table of Contents
Abstract ...............................................................................................................................................3
Sammanfattning .................................................................................................................................5
Acknowledgements............................................................................................................................7
Table of Contents ...............................................................................................................................8
Glossary of Terms ........................................................................................................................... 10
1. Introduction ............................................................................................................................. 11
1.1. Objective............................................................................................................................ 11
1.2. Scope and limitation .......................................................................................................... 12
1.3. Outline of the thesis ........................................................................................................... 12
2. Literature review ...................................................................................................................... 13
2.1. Traffic incident management ............................................................................................. 13
2.2. Conventional traffic incident detection .............................................................................. 13
2.3. Crowdsourcing .................................................................................................................. 13
2.4. Crowdsourcing in traffic incident detection........................................................................ 14
2.5. Characterization of crowdsourced traffic data ................................................................... 15
2.6. Relating and matching incident reports ............................................................................. 15
2.7. Reliability assessment ....................................................................................................... 15
2.8. Severity assessment ......................................................................................................... 16
3. Case study description ........................................................................................................... 17
3.1. Introduction ........................................................................................................................ 17
3.2. The Waze application ........................................................................................................ 17
3.3. The Waze Connected Citizens Program ........................................................................... 18
3.4. Traffic management in Sweden ........................................................................................ 19
3.4.1. Challenges in collecting traffic information ................................................................ 21
3.4.2. Challenges in communicating traffic information....................................................... 22
3.5. Purpose of the study ......................................................................................................... 23
3.6. Research questions ........................................................................................................... 23
3.7. Assumptions ...................................................................................................................... 24
3.8. Delimitations ...................................................................................................................... 24
4. Methodology ............................................................................................................................ 25
4.1. Data collection and preparation ........................................................................................ 25
4.2. Descriptive and quantitative analysis ................................................................................ 25
4.3. Analysis of the reliability value provided by Waze ............................................................ 26
4.4. Identifying related alerts .................................................................................................... 26
4.5. Assessment of the severity ............................................................................................... 26
4.6. Comparison of the Waze traffic data and the existing traffic information .......................... 27
4.7. Regression analysis of the matching reports .................................................................... 27
4.8. Review of projects and use cases ..................................................................................... 28
4.9. Software ............................................................................................................................ 28
9
5. Data collection and preparation ............................................................................................ 29
5.1. Description of the Waze traffic-data .................................................................................. 29
5.1.1. Traffic alerts ............................................................................................................... 29
5.1.2. Traffic jams ................................................................................................................ 31
5.2. Description of the existing traffic data ............................................................................... 33
5.3. Data collection ................................................................................................................... 34
5.4. Data preparation ................................................................................................................ 35
6. Results and analysis ............................................................................................................... 37
6.1. Descriptive and quantitative analysis ................................................................................ 37
6.1.1. Popularity of Waze in Sweden .................................................................................. 38
6.1.2. Spatial distribution of the Waze alerts ....................................................................... 39
6.1.3. Temporal distribution ................................................................................................. 41
6.2. Analysis of the reliability value provided by Waze ............................................................ 42
6.3. Identifying related alerts .................................................................................................... 43
6.3.1. Proximity in time ........................................................................................................ 43
6.3.2. Proximity in space ..................................................................................................... 44
6.3.3. Related alerts ............................................................................................................ 45
6.4. Traffic jams and inference to the severity of incidents ...................................................... 47
6.5. Comparing Waze alerts with official incident reports from Trafikverket ............................ 50
6.5.1. Commonly reported incidents.................................................................................... 50
6.5.2. Comparing incident reporting times .......................................................................... 52
6.6. Regression analysis of the matching alerts....................................................................... 52
7. Related projects and use cases ............................................................................................. 55
7.1. Reducing emergency response times ............................................................................... 55
7.2. Routing drivers around major construction projects .......................................................... 55
7.3. Communicating major traffic events .................................................................................. 55
7.4. Integration of open traffic data from multiple sources ....................................................... 55
7.5. Navigation support for restricted driving zones ................................................................. 56
7.6. Collaborative project for processing Waze traffic data ...................................................... 56
7.7. Promoting Waze, increasing the number of users ............................................................ 56
8. Discussion ............................................................................................................................... 57
8.1. Insights .............................................................................................................................. 57
8.2. Recommendations ............................................................................................................ 58
8.2.1. Processing traffic data from Waze ............................................................................ 58
8.2.2. Controlled data sharing with Waze ........................................................................... 59
References ....................................................................................................................................... 61
Appendix – Variables in the logistic regression model .............................................................. 63
10
Glossary of Terms
Incident An unforeseen event that impacts on the safety and/or the capacity of the road network, e.g. traffic accident, stopped vehicle on the road. Only non-recurring events were discussed in the thesis.
Wazer A user of the Waze application, who reports incidents.
Waze alert A report about a traffic incident in the Waze application.
Official incident report A report about a traffic incident registered and verified at Trafikverket.
Introduction | 11
1. Introduction
Sudden events, such as accidents and vehicle breakdowns, can lead to traffic congestion with all its negative effects: delays, air pollution, frustrated drivers, etc. Therefore, the early observation and elimination of incidents is a crucial task in traffic management. Every national transportation agency faces the challenge of getting an accurate picture of traffic conditions in real-time. They use the conventional methods – traffic cameras, counters and loops, receiving reports by phone calls – for monitoring traffic and getting information about incidents. However, these methods are far from optimal. Reporting through phone calls has inherent delay not to mention the often-inaccurate description (Trafik Stockholm, 2018). Cameras and road sensors are not sufficient either, because of their limited coverage and expensive implementation and maintenance (Leduc, 2008). Floating car data (FCD) technology is an efficient alternative and complement to the static sensors in estimating traffic congestion. However, it’s accuracy is limited to estimate the instantaneous travel time and detect sudden changes in local traffic speed in real time (Liu, et al., 2012). Despite the technological advances of automated traffic monitoring, there are still challenges in obtaining an accurate picture of the traffic conditions in real time. Nevertheless, an alternative way of traffic monitoring has been evolved where the information is not machine based but detected by humans.
During the last decade, the growing online connectivity and popularity of the social media opened up the opportunity to obtain traffic information from social reactions on the web. This huge amount of publicly available data can be used to mine the correlation between events in traffic and postings on Twitter or Facebook. Models for traffic-severity regression based on social data have been developed which can be used to estimate traffic congestion in areas that lack proper traffic monitoring resources (Georgiou, et al., 2015); (Qian, 2016); (Xu, et al., 2018). Beyond the ad-hoc reporting of traffic information in social media, there are specialized applications, like Waze1, using spatial crowdsourcing.
Utilizing crowdsourcing in traffic management is an innovative concept which requires thorough evaluation before it can be applied in practice. Numerous technical and non-technical challenges must be resolved, such as verification of the crowdsourced data and effective integration with other sources (Ali, et al., 2012), along with the privacy and security concerns (Jeske, 2013).
1.1. Objective
Crowdsourcing is an additional way to obtain supplementary traffic information to the data collected from the existing data sources. Traffic management can benefit from this information in several ways. The crowdsourced data can cover areas which are not or purely monitored, or it can complement the existing information about an incident. Furthermore, crowdsourced technology can help to detect incident types, which are not collected systematically yet (e.g. potholes, traffic light faults, missing road signs).
This thesis discusses the possibilities and challenges of utilizing spatial crowdsourcing technologies in traffic incident management. It aims to answer the following research questions:
• What are the possible benefits of crowdsourced traffic information in traffic management?
1 https://www.waze.com
Introduction | 12
• Can crowdsourced traffic data complement the existing traffic information obtained by the conventional methods?
• Which part of the road network is covered by crowdsourcing compared to the existing traffic monitoring technologies?
• How can the reliability of crowdsourced traffic information be assessed?
• How can the severity of a crowdsourced incident report be predicted?
1.2. Scope and limitation
There are several traffic monitoring methods available that are based on crowdsourcing. This thesis focuses on one of them, the information collected through the application Waze. An overview of other crowdsourcing technologies is presented in the literature review. The research questions were investigated through a case study conducted in collaboration with the Swedish Transport Administration. The study area was limited to Stockholm, Sweden.
1.3. Outline of the thesis
The following chapter discusses the relevant research related to traffic incident management, crowdsourcing and its possibilities and challenges in collecting traffic information. In Chapter 3 the case study of utilizing Waze traffic data in Sweden is presented. Chapter 4 describes the methodology applied in data collection, preparation and the analysis. A technical description as well as the collection and preparation of the analyzed data is presented in Chapter 5. The results of the performed analysis are described in Chapter 6 followed by an overview of related projects in Chapter 7. Last, a summary of the thesis is presented in Chapter 8 which includes recommendations for further analysis and development of tools which can be used to integrate crowdsourced traffic information in traffic management.
Literature review | 13
2. Literature review
2.1. Traffic incident management
A traffic incident can be defined as an unforeseen event that impacts on the safety and/or the capacity of the road network. Traffic incident management (TIM) is “coordinated detection, response to and removal of traffic incidents and the restoration of traffic capacity as quickly and safely as possible” (Leonard, 2017). In a well-organized TIM, incidents are handled by the use of systematic and coordinated measures and resources with the following goals (Steenbruggen, et al., 2012):
• Ensuring traffic safety and the safety of crash victims and incident responders.
• Reducing the impact of the incident on the traffic flow and restoring the flow to normality.
• Controlling the damage caused by the incident on the vehicles and road infrastructure.
TIM is built on coordination among multiple public agencies (typically the road authority, road operator, the police, the fire and ambulance services) and private sector partners (media, road navigation providers). Collaboration and coordination between these organizations is crucial for an efficient traffic management. (Leonard, 2017)
2.2. Conventional traffic incident detection
There is a wide range of sensors used in traffic monitoring. The sensing technologies can be divided into two groups, intrusive and non-intrusive regarding their influence on traffic flow and safety during installation and maintenance (Yu & Prevedouros, 2013). Traditional intrusive sensors are the inductive loop or magnetometer, while non-intrusive sensors use infrared, radar, ultrasonic or video image processing technologies. These sensors are strategically placed on carefully selected spots, typically highways and major intersections to measure traffic volume, speed, density, travel time, vehicle class or lane occupancy. (Weil, et al., 1998)
During the last decade, the methods used in traffic incident detection have evolved a lot. Only ten years ago called Leduc (2008) sensors along the roadside as conventional technologies used in traffic data collection. He describes floating car data (FCD) technology as an alternative method, which is very promising and cost-effective solution compared to the fixed detector systems. The main argument is the limited coverage of sensors. Furthermore, to emphasize this statement, he lists the most common roadside sensor technologies and their related installation and maintenance costs. Roadside sensors have their limitations and challenges, as it is revealed in (Yu & Prevedouros, 2013). The authors studied the performance of several non-intrusive traffic sensors in different traffic and weather conditions. According to Leduc (2008) the FCD technology is an efficient way to collect real-time traffic information. It covers a large road network for much less cost than traditional sensor technologies. However, there are still uncertainties about FCD regarding the quality, penetration rate, extent of cover in areas with smaller roads, etc.
2.3. Crowdsourcing
Crowdsourcing is the collective engagement of people to contribute to a common goal. It has many forms – crowdfunding, co-creation, collaboration, etc. – and can be applied in various industries. It is utilized especially for tasks that are inherently easier for humans than for computers. Technically, crowdsourcing is a distributed problem-solving model,
Literature review | 14
where the problem is delegated to a large group of unknown people, the crowd. In some cases, the solutions are awarded monetarily or by some form of recognition, but it is common that individuals want to contribute for their personal interest in solving the problem (Ali, et al., 2012). There are web-based crowdsourcing platforms, such as Amazon Mechanical Turk2, where problem tasks can be defined and distributed to the crowd. Mobile or spatial crowdsourcing solutions are getting more and more popular in solving problems where location and mobility information play a central role. Each crowd worker is considered as a mobile computing unit to complete tasks using their mobile devices and spatial information. When applying spatial crowdsourcing to solving a problem, the spatio-temporal dynamics of user behavior must be considered. (Tong, et al., 2017)
2.4. Crowdsourcing in traffic incident detection
With the growing online connectivity and popularity of the social media, a new method for detecting traffic incidents has turned up. Mining social media to extract incident information has inspired several studies ((Georgiou, et al., 2015); (Qian, 2016); (Xu, et al., 2018)). They all refer to the utilization of big data in incident detection as an efficient and cost-effective alternative because a vast amount of data is accessible for free. Data mining models have been developed that perform accurate classification of Twitter data to detect incidents. One of the issues with mining social media is localizing the tweets, since only a tiny portion of them carry latitude/longitude coordinates. Qian (2016) invented a series of geo-parser and geocoder to extract locational information inside of Twitter texts. Georgiou, et al. (2015) propose a model for traffic-severity regression based solely on the generated social volume. They have reached significant enhancement in the performance of the model by exploiting the fact, that people complain in different levels throughout the day.
The advantages of crowdsourcing in ITS applications is that there is no need for deployment of sophisticated sensors on the roads or complex communication devices within vehicles (Ali, et al., 2012). It could be a solution especially in developing countries, where the conventional traffic monitoring solutions cannot be applied (Roopa, et al., 2013). Examples of spatial crowdsourcing services in the transport sector are FixMyStreet3, to report the need to repair transportation infrastructure, Moovit4 for mapping public transit or Waze5, a navigation application offering route calculation considering the current traffic conditions reported by the users themselves.
Beside its reduced cost, another advantage of crowdsourcing in traffic data collection is the ability to capture events which are not so easy to detect with sensors but can easily be logged by drivers using their mobile phones. Ali, et al. (2012) present CrowdITS, the concept of how crowdsourcing can be utilized in ITS applications and designs the architecture of the system. A major part of the concept is to collect human inputs and integrate it with other available sources. However, the authors point out that numerous challenges still need to be resolved in order to adopt crowdsourcing within ITS applications. Two of these are the efficient data aggregation and verification of the crowdsourced data.
2 https://www.mturk.com/ 3 https://www.fixmystreet.com/ 4 https://moovit.com/ 5 https://www.waze.com
Literature review | 15
2.5. Characterization of crowdsourced traffic data
Waze is one of the most popular crowdsourcing application in traffic incident detection. City dynamics and the urban behavioral patterns are important aspects when designing an application that uses humans in the sensing process. Silva, et al. (2013) characterize the spatial and temporal coverage of Waze data to understand city dynamics and the urban behavioral patterns. This could help to discover the opportunities for application design using data collected from Waze as well as its limitations. In particular, they showed the highly unequal frequency of alert reporting, both spatially and temporally, which is highly correlated with the typical routine of people. The spatial distribution of the alerts, analyzed on a fine grid, shows that most of the quadrants have just a small number of alerts and the alerts concentrate on relatively few quadrants. These areas are typically locations with heavier traffic flow. The temporal distribution of the alerts reveals that alerts are more likely to be common in urban areas during rush hours.
2.6. Relating and matching incident reports
As Ali, et al. (2012) mention, one of the challenges in utilizing crowdsourced traffic data is to match the related alerts and to integrate it with data from other sources. They proposed a simple solution, geohashing, to map and link multiple events together, from different sources. It is based only on the distance between two locations, the characteristics of the road network are not considered. Only the spatial proximity was regarded, since the focus was on addressing non-real-time ITS applications. Santos, et al. (2017) proposed a more sophisticated approach, in that the name of the roads and reporting time are also considered when matching Waze accident alerts with official traffic data in Belo Horizonte, Brazil. They define both spatial and temporal matching criteria: “two records refer to the same incident if they were reported within one hour of each other and occurred (1) within 50 meters of each other, or (2) within 150 meters on the same road”. They haven’t performed any calibration nor verified the criteria. The limits are based on assumptions, such as the possible delay in accident reporting, and the inaccuracy of the available location information.
2.7. Reliability assessment
One of the risks, with collecting data using the method of crowdsourcing, is the estimation of the reliability of the incoming information. Salamanis, et al. (2016) proposed a probabilistic framework to estimate the reliability of crowdsourced traffic alerts. In addition to the individual user reputation, they included the location information and the speed of the reporter in the model.
According to the Waze data specification, there is a hidden centralized mechanism to validate traffic information reported in Waze. It is based on the rank of the reporter and the confirmations the alert has received from other users. Despite this mechanism, Waze cannot guarantee that all the published alerts are certainly true. One of the applications basis is the trust in the society, that the information registered by the users is true. Although, there have been cases when angry citizens tried to fool Waze by reporting false traffic incidents (Hendrix, 2016), these lone protests do not have any substantial impact in a crowd-verified system. A rebellious user can be easily detected and removed from the system as it happened in (Hendrix, 2016).
But it is not the case with programmatic attacks. Jeske (2013) investigated the privacy and authenticity issues both with Google’s and Waze’s communication protocol. He
Literature review | 16
showed that attackers can anonymously manipulate the Waze traffic data and actively influence the navigation software. Moreover, the attack does not require any special equipment and is relatively cheap. As it was demonstrated by Israeli students, who successfully hacked Waze by faking a traffic jam (Yahav, et al., 2014). Although, the deceiving acts are rare, these examples show the vulnerability of Waze. If merging Waze data into traffic management systems, there will always be the question, how trustworthy an alert is before reacting to it.
2.8. Severity assessment
The ability to predict the severity of an incident efficiently, is very important in traffic incident management. Accurate predictions of severity can help emergency responders to estimate the potential impacts, and to apply appropriate incident response measures (Zong, et al., 2013). The definition, and severity classification of an incident is, however, not unified between the different parts involved in incident management. For example, police departments are concerned with public safety, while traffic management focuses on traffic flow, and emergency medical services on the presence and extent of injuries. Regarding the effect on the traffic flow of the incident, the variables influencing the severity are the incident location, date, time, number of affected lanes and the type of the incident (Leonard, 2017). Several severity prediction models have been proposed (Chung, 2010); (Anastasopoulos, et al., 2012). Zong, et al. (2013) showed that there is a strong correlation between incident severity and duration. However, to apply a severity prediction model efficiently, the incident needs to be verified first. No previous work has been found, which addresses the severity prediction of Waze alerts without concerning other sources.
Case study description | 17
3. Case study description
3.1. Introduction
Waze is one of the most popular traffic and navigation application worldwide, using the concept of crowdsourcing. The users share real-time traffic and road information, which Waze considers in the route calculation. Traffic speed and travel times are automatically reported by the app. Furthermore, the users can contribute actively by reporting an incident, such as a car accident or vehicle breakdown. The collection of this real-time traffic information is valuable for transportation agencies. With the help of this crowdsourced information, transportation can become safer, faster, more efficient and more environmentally friendly.
In 2014, Waze started a collaboration, called the Connected Citizens Program (CCP), with traffic agencies and road operators to exchange real-time traffic information. The goal of the program is to make Waze-reported incident data available for traffic authorities that can address the reported incidents, and to provide Waze drivers the improved real-time, location-based information on the road traffic conditions (Waze Connected Citizens Program, 2018).
Through the initial years of the CCP program, it has gained global interest. There are many transport agencies worldwide having an active collaboration with Waze. In 2017, the Swedish Transport Administration (Trafikverket) joined the program in form of a pilot project to examine the advantages and consequences of establishing an active partnership with Waze (Rudmark & Arnestrand, 2018). The project focused on describing Waze itself, the different possibilities in the CCP program, and particularly, investigating the benefits of using crowdsourced traffic information in traffic management. Several use-cases have been identified where data from Waze could be valuable.
This thesis work is the continuation of the project at the Swedish Transport Administration. It investigates two of the identified use-cases. The first is, how traffic-data from Waze could benefit operational traffic management. The second regards the advantages of using Waze as a supplementary, controlled information channel for reaching the travelers. A detailed analysis and comparison of the Waze traffic-data and the data collected by Trafikverket has been performed to find out the relevance and quality of the Waze data. Furthermore, additional uses-cases have been identified and discussed by studying the problems Trafikverket currently dealing with and by looking at different solutions applied by other government agencies working together with Waze.
3.2. The Waze application
Waze is a navigation application with the initiative to create local driving communities who can share traffic information with each other. This real-time traffic and road data reported by the connected commuters is used to improve the quality of everyone’s daily driving. As for all crowdsourced application, the value of Waze depends highly on the number of users. One can enjoy the benefits of Waze only if there is sufficient number of users who generate traffic information. The more users the more data are collected, which leads to more accurate route calculation.
Apart from the average Waze users, very important members of the Waze community are the map editors who keep the map up to date by editing road segments and marking road closures voluntarily. They collect the information about road closures from the websites and services of road operators and edit the map manually. There is no centralized
Case study description | 18
control over their work, nevertheless, the Waze map is very reliable. As part of the previous project, the presentation of a specific road closure was compared between the Waze map and several other maps (trafiken.nu, Google maps, HERE maps). The report indicated that Waze had the most detailed and understandable visualization of the incidents among all the maps. This shows how valuable the voluntary work of the map editors is (Rudmark & Arnestrand, 2018).
The advantages of Waze are tangible in cities where severe congestions can occur during the rush hours and the smallest incident on the roads can lead to miles long traffic queues. In these situations, Waze can suggest alternative routes and help the drivers to avoid the congested roads. Since Waze was established in 2006 in Israel, it has gained global popularity, mostly in North- and South American cities, where it is also recognized as a standard tool for navigation and basic source of traffic information.
3.3. The Waze Connected Citizens Program
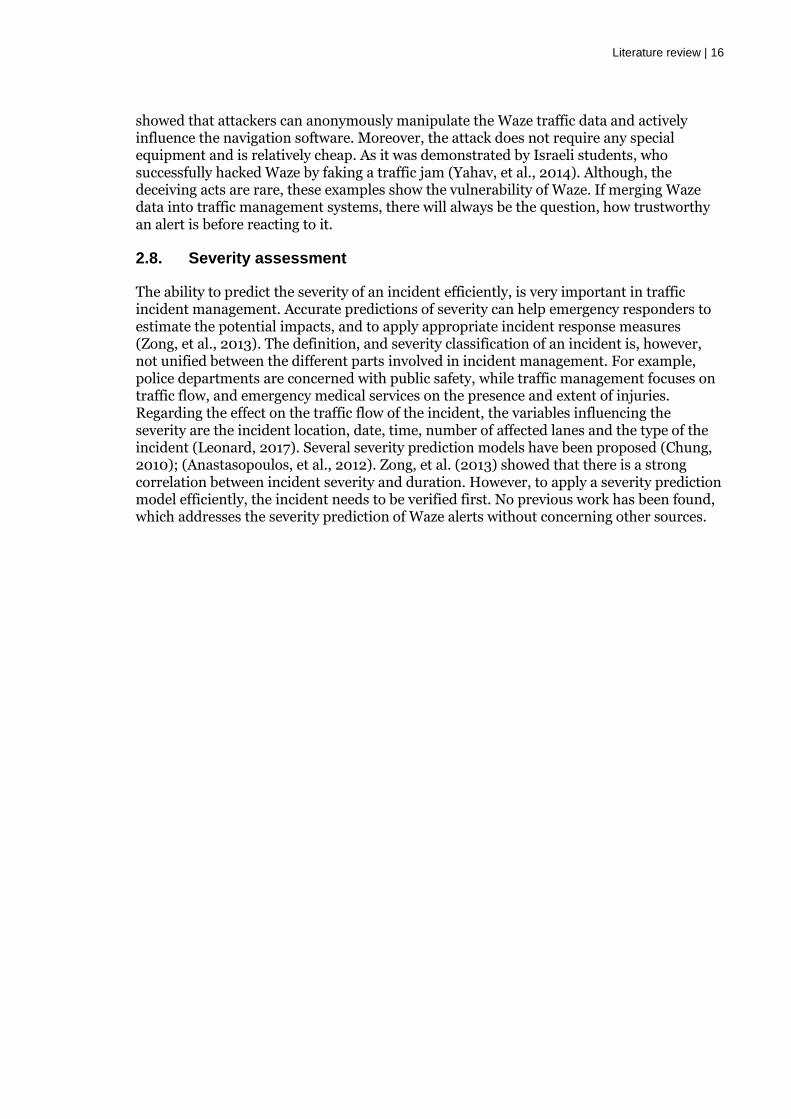
If an organization joins the CCP, it will gain access to the traffic information Waze collects. It includes:
• anonymous, real-time traffic alerts reported by wazers (Waze users),
• system-generated traffic slowdown information, and
• irregularities, unusual traffic jams identified by the system
In exchange the traffic agency shares with Waze its own traffic information including road closures, incidents and major traffic events. There are several reporting tools provided:
• A live feed API for uploading data in Waze’s own data format,
• Waze Map Editor, a web-based map editing tool, or
• Email reporting.
Figure 3-1. Traffic flow along custom-specified routes and the map view with incidents and congested roads.
Modified screenshot from Waze Traffic View Tool.
Case study description | 19
Today, Trafikverket does not use any of these tools, but its data is available for Waze via the open Datex II API. Hence, there is no controlled data sharing between Trafikverket and Waze.
Waze makes its data available for download through the Waze API (data feed). Furthermore, for visualizing the incidents, Waze has developed a map-based web application for traffic management operators. It is called Traffic View Tool and it can be used to monitor incidents and the traffic flow in real time on a map. It gives a general overview of the traffic conditions in the monitored area, but it is also possible to watch the traffic flow along custom-specified routes.
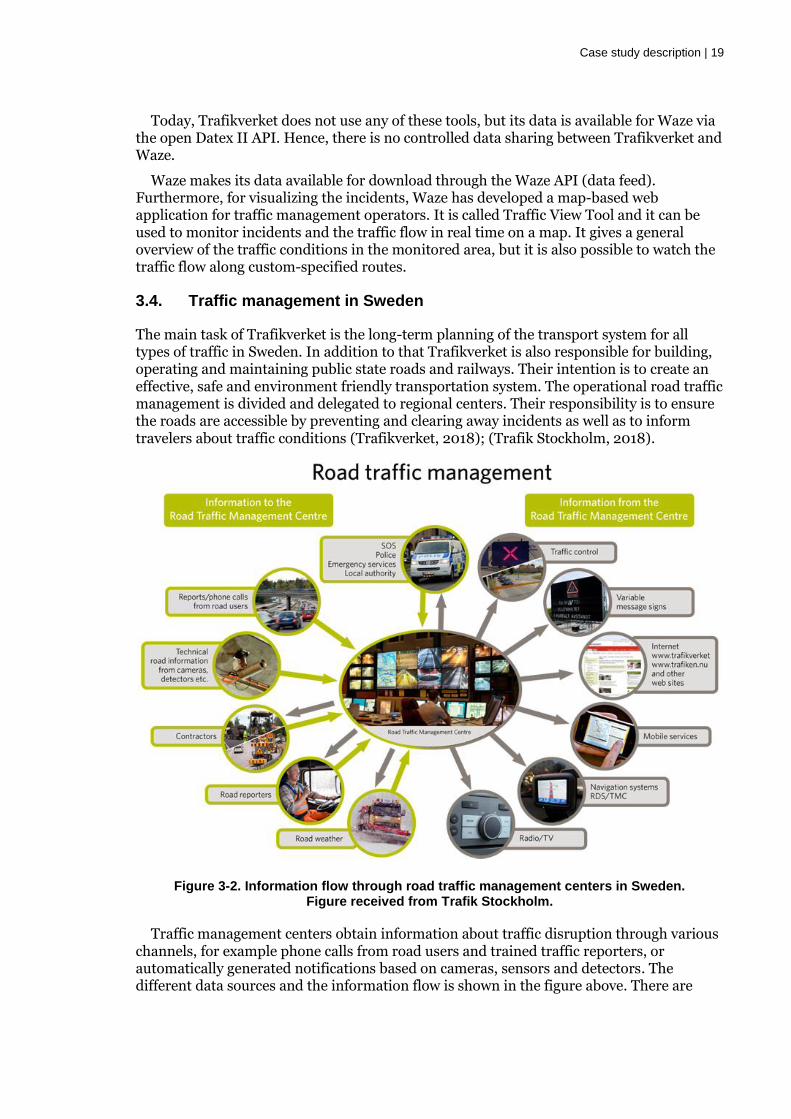
3.4. Traffic management in Sweden
The main task of Trafikverket is the long-term planning of the transport system for all types of traffic in Sweden. In addition to that Trafikverket is also responsible for building, operating and maintaining public state roads and railways. Their intention is to create an effective, safe and environment friendly transportation system. The operational road traffic management is divided and delegated to regional centers. Their responsibility is to ensure the roads are accessible by preventing and clearing away incidents as well as to inform travelers about traffic conditions (Trafikverket, 2018); (Trafik Stockholm, 2018).
Figure 3-2. Information flow through road traffic management centers in Sweden. Figure received from Trafik Stockholm.
Traffic management centers obtain information about traffic disruption through various channels, for example phone calls from road users and trained traffic reporters, or automatically generated notifications based on cameras, sensors and detectors. The different data sources and the information flow is shown in the figure above. There are
Case study description | 20
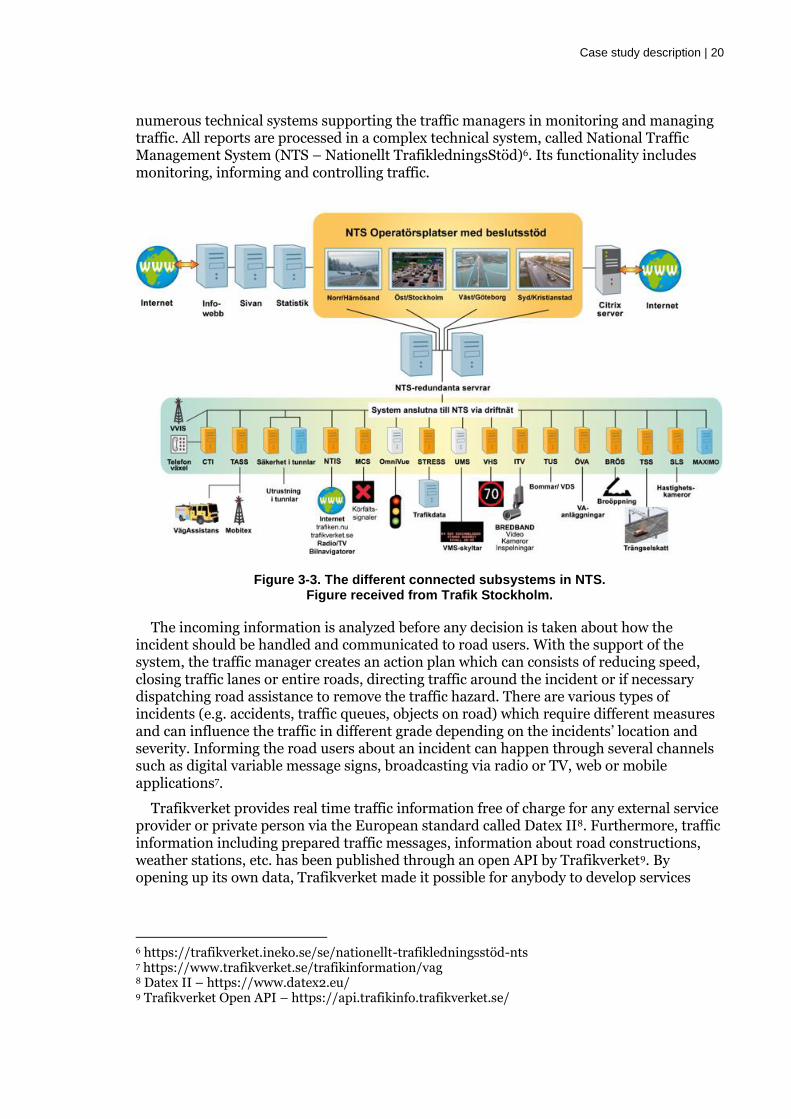
numerous technical systems supporting the traffic managers in monitoring and managing traffic. All reports are processed in a complex technical system, called National Traffic Management System (NTS – Nationellt TrafikledningsStöd)6. Its functionality includes monitoring, informing and controlling traffic.
Figure 3-3. The different connected subsystems in NTS. Figure received from Trafik Stockholm.
The incoming information is analyzed before any decision is taken about how the incident should be handled and communicated to road users. With the support of the system, the traffic manager creates an action plan which can consists of reducing speed, closing traffic lanes or entire roads, directing traffic around the incident or if necessary dispatching road assistance to remove the traffic hazard. There are various types of incidents (e.g. accidents, traffic queues, objects on road) which require different measures and can influence the traffic in different grade depending on the incidents’ location and severity. Informing the road users about an incident can happen through several channels such as digital variable message signs, broadcasting via radio or TV, web or mobile applications7.
Trafikverket provides real time traffic information free of charge for any external service provider or private person via the European standard called Datex II8. Furthermore, traffic information including prepared traffic messages, information about road constructions, weather stations, etc. has been published through an open API by Trafikverket9. By opening up its own data, Trafikverket made it possible for anybody to develop services
6 https://trafikverket.ineko.se/se/nationellt-trafikledningsstöd-nts 7 https://www.trafikverket.se/trafikinformation/vag 8 Datex II – https://www.datex2.eu/ 9 Trafikverket Open API – https://api.trafikinfo.trafikverket.se/
Case study description | 21
using real time traffic information. One of these services is trafiken.nu, a website providing traffic information for daily commuters in Stockholm and Gothenburg.
3.4.1. Challenges in collecting traffic information
Despite the advanced and automatized data collecting methods, Trafikverket still faces challenges for getting a reliable real time picture about the traffic conditions. The camera and sensor systems cover only a part of the major pathways around the big cities. Incidents, especially from the roads where no automatic incident detection system is installed, can be reported with substantial latency. The early detection and communication of an incident is crucial, particularly in the cases of accidents, when the consequences can be fatal.
Regarding the presence and the location of the incident, the quality of the traffic information can be uncertain depending on the source. Reports through phone calls can have inaccurate description. Contractors working on a road construction are not committed enough to reporting accurate information of the construction site: where the road is blocked and when the work is started and finished. Detecting if the incident still exists and removing it from the communication channels is very important. 10
Finding the exact location of an incident is also challenging. In many cases, the only information about the position of the incident is the name of the road and the nearest intersection or approximate km sign. The position of the incident will be set to a whole road segment, which makes it much harder for the emergency services to navigate to the site of the incident. Despite the uncertain location description, all the incidents are assigned a point location for visualization purposes. The coordinates can point either to the start or to the middle of a road segment depending on which technical system the incident has been reported in. 11
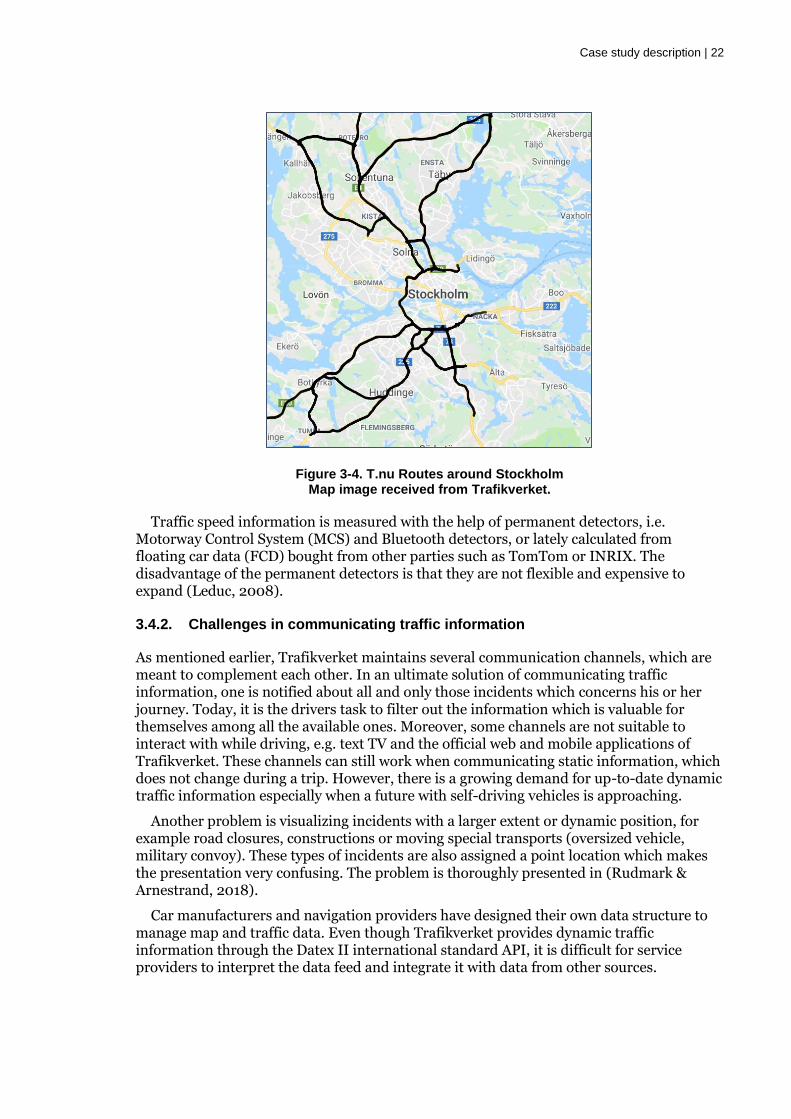
Trafikverket also collects traffic speed data along predefined fixed routes, called T.nu Routes. These road segments have been chosen along the main commuting roads in the three biggest cities, Stockholm, Göteborg and Malmö. The data is used to inform drivers about current travel times and to analyze the impact of changes in the traffic rules.
10, 11 Based on interview with Trafikverket’s personnel
Case study description | 22
Figure 3-4. T.nu Routes around Stockholm Map image received from Trafikverket.
Traffic speed information is measured with the help of permanent detectors, i.e. Motorway Control System (MCS) and Bluetooth detectors, or lately calculated from floating car data (FCD) bought from other parties such as TomTom or INRIX. The disadvantage of the permanent detectors is that they are not flexible and expensive to expand (Leduc, 2008).
3.4.2. Challenges in communicating traffic information
As mentioned earlier, Trafikverket maintains several communication channels, which are meant to complement each other. In an ultimate solution of communicating traffic information, one is notified about all and only those incidents which concerns his or her journey. Today, it is the drivers task to filter out the information which is valuable for themselves among all the available ones. Moreover, some channels are not suitable to interact with while driving, e.g. text TV and the official web and mobile applications of Trafikverket. These channels can still work when communicating static information, which does not change during a trip. However, there is a growing demand for up-to-date dynamic traffic information especially when a future with self-driving vehicles is approaching.
Another problem is visualizing incidents with a larger extent or dynamic position, for example road closures, constructions or moving special transports (oversized vehicle, military convoy). These types of incidents are also assigned a point location which makes the presentation very confusing. The problem is thoroughly presented in (Rudmark & Arnestrand, 2018).
Car manufacturers and navigation providers have designed their own data structure to manage map and traffic data. Even though Trafikverket provides dynamic traffic information through the Datex II international standard API, it is difficult for service providers to interpret the data feed and integrate it with data from other sources.
Case study description | 23
3.5. Purpose of the study
We can see the importance of collecting traffic information as accurate and fast as possible. Furthermore, one of the main tasks in traffic management is informing the drivers in the right time about the incidents which concern them. Waze is a potential tool which could be useful in both collecting and communicating traffic information. The Waze Connected Citizens Program gives the possibility for transport agencies to obtain supplementary traffic information to the data collected from the already approved data sources, and to use Waze as an additional channel to communicate traffic information.
An active collaboration with Waze can give a solution for the above-discussed problems, namely:
• The traditional traffic monitoring techniques cover only a part of the road network.
• Delay in traffic incident reporting where automated incident detection is not installed.
• Inefficient ways of informing the travelers about traffic conditions.
By utilizing the traffic information from Waze, the road traffic management can get a better understanding of the traffic conditions and enhance the efficiency of incident management. The expected benefits are:
• Receiving traffic information from a wider area which is not covered by automated incident detection systems.
• Receiving supplementary information for incidents already reported through other sources.
• Earlier detection of incidents, which can lead to faster response, and clearance time.
• Receiving information about a more comprehensive number of incidents, which are valuable in evaluation and analysis of existing traffic solutions.
• Obtaining additional types of incidents (e.g. potholes, traffic light faults, missing road signs), which are not collected systematically yet, but can be of interest. For example, in infrastructure maintenance.
By utilizing Waze as an additional information channel, a significant number of drivers can be reached directly with dynamic traffic information in real time. Moreover, travelers using Waze can get a more understandable presentation of incidents, especially in case of road closures.
However, before believing that all the problems could be solved with Waze and any hasty actions would be taken to integrate it with the existing traffic management system the benefits of an active collaboration with Waze must be validated. Obviously, introducing Waze into traffic management has its inherent costs (system integration, education of personnel). The technical integration of the Waze incident alerts with the data collected from other sources is also a challenging task which requires careful planning. Furthermore, there is a general doubt about the quality and utility of crowdsourced traffic information, which must be analyzed before any deliberate decision can be taken. Moreover, the risks and possible negative outcomes are also very important aspects. The purpose of this study is to verify the benefits of joining the Waze Connected Citizens Program.
3.6. Research questions
The research questions that were investigated in the study were as follows:
Case study description | 24
• In which areas and to what extent can Trafikverket get traffic information from Waze?
• How can related alerts be identified?
• How can the reliability of Waze alerts be assessed?
• How can the severity of the Waze alerts be assessed?
• How can incidents from Waze be matched with incidents from other sources?
• Can incidents be detected earlier using Waze than other sources?
• What are the potential use cases of the Waze CCP interesting for Trafikverket?
3.7. Assumptions
The assumptions on which the study was based are outlined below:
• All the data was accurately extracted from Waze and Trafikverket’s dataset.
• All the incidents stored in Trafikverket’s dataset are true.
• Trafikverket detects all the incidents which must be handled to maintain the normal traffic flow and ensure traffic safety.
• The detection time of the incidents logged in the different datasets are accurate and are synchronized.
3.8. Delimitations
The study analyses and compares the traffic data collected from Waze and Trafikverket during over a month period in spring 2018. It includes typical weekdays, weekends and holidays. However, the length of the data collection period does not allow to investigate the seasonal characteristics of the data.
Although, in the CCP platform both incident alerts and traffic slow down information are available, the study focuses on the incident alerts.
The type of incidents and their classification are different in the two datasets, which makes it difficult to match the registered incidents by type. Thus, the study considered only specific incident types from both datasets which refer to accidents (including accidents involving wild animals) and a set of hazards: vehicle breakdown, object on road, obstacle on road. These are the types which can require immediate measure to maintain a flowing traffic and are prioritized by incident management. Though, this delimitation doesn’t want to omit the value in the rest of the incident types included in the Waze data. They can be also valuable for other departments at Trafikverket.
There is no border or spatial limitation for using Waze, however its value is sensible only in areas where the number of users has reached a sufficient limit. The usage of Waze is not uniform throughout Sweden, it is much more popular in the bigger cities than in the countryside. Moreover, there is a significant difference in popularity between Stockholm and other cities. This difference can affect the number of detected incidents and the assigned reliability values. Thus, to not influence the internal validity of the analysis, the study area was limited to Stockholm and the neighboring municipalities. Despite the delimitation of the study area, there is a strong belief that Waze data can be valuable in traffic management in other parts of Sweden too, but to evaluate the benefits, further analysis is required.
Methodology | 25
4. Methodology
The purpose of this study was to investigate the benefits of joining the Waze Connected Citizens Program. To justify the quality and utility of the Waze traffic data, a nonexperimental, quantitative study was performed on historical data collected from Waze and Trafikverket. The methodology includes the:
• descriptive and quantitative analysis of the data obtained from Waze,
• analysis of the reliability value provided by Waze,
• assessment of the severity of the Waze incident alerts,
• comparison with the existing traffic information at Trafikverket, and
• regression analysis of the matching incident reports.
In addition to the data analysis, the study contains a review of projects and use cases at other CCP partners worldwide.
4.1. Data collection and preparation
As a part of the Connected Citizens Program Waze maintains a GeoRSS data feed where partners can access and download traffic data. From the previous Trafikverket project, an application for downloading the files was already available and running since March 2018. Official traffic incident data was obtained from Trafikverket. To be able to query and analyze the data, it was loaded to a spatial PostgreSQL database.
Since the Waze data includes incident reports copied from Trafikverket’s Datex II channel, these items had to be removed first. Unfortunately, there is no indication which items are originated from the Datex II channel. This resulted in a manual iterative process of identifying the copied incident reports. The process stopped when no more obviously matching incident reports were find between the two datasets. The process is described in detail later in the thesis.
4.2. Descriptive and quantitative analysis
After the Waze data was cleaned from the official incident reports, the descriptive analysis of Waze data was conducted. It focused on examining the type of the Waze alerts and revealing the temporal and spatial characteristics. As mentioned earlier, the study was delimited to investigate only specific alert types.
The temporal distribution of the alerts was analyzed in a weakly and daily basis, similarly to (Silva, et al., 2013). The spatial distribution of the alerts was analyzed from a national and from a finer perspective. The first examined the spread of the alerts on county level to identify regions where the use of Waze is prominent. From the number of reported alerts in a region, we could infer to the extent of the usage of Waze in that area. After this step, the study area was limited to the region where the popularity of Waze is approximately uniform and local deviation would not influence the result of the analysis. The latter, finer analysis, looked at the number of the alerts per road type to get an understanding of the distribution of the alerts in a more detailed scale.
In (Silva, et al., 2013), the distribution of the alerts was studied in a fine grid, which can fit well for analyzing city dynamics and the urban behavioral patterns. However, traffic incidents are concentrated along the road network. Examining distribution on a grid would conceal valuable details. Instead of using a grid, an analysis of the distribution of the
Methodology | 26
incidents along the road network was performed. A similar approach was used in a project to detect automobile collision hotspots based on historical Waze data in Louisville, KY, USA (Duer, et al., 2018). Their analysis included distribution of accidents along two segment types: intersections and roads.
4.3. Analysis of the reliability value provided by Waze
There are studies discussing the reliability assessment of incident reports in systems based on crowdsourcing. Salamanis, et al. (2016) examined how users can be ranked to show their reliability. In fact, Waze does assess its users’ reliability by ranking them, however, the algorithm and the influencing factors are confidential. Since the data obtained from the CCP data feed do not contain any information about the reporter, the mode to assess the reliability of the reports is limited. The only available information is a value indicating the reliability of the alert, calculated by Waze. From the data specification we know, that it is based on the rank of the reporter and the confirmations the alert has received from other users. And we know, that the number of confirmations depends on the number of users passing by the alert. In the previous step, we inferred to the number of users in an area from the number of alerts reported there. Following, it was examined, how the Waze-provided reliability value relate to the spatial distribution of the alerts.
4.4. Identifying related alerts
The Waze data feed contains alerts and not distinct incident reports. In many cases it was observed that the same incident is reported several times. To approximate the number of distinct incidents reported through Waze, the related alerts need to be aggregated. To identify the related alerts, the users’ incident reporting behavior was explored first. Silva, et al. (2013) studied the reporting activity from the perspective of a user, but in this study the aim was to examine the reporting activity from the perspective of an incident. In that sense, the duration of the incident alert in the data feed plays a major role. That is, alerts do not persist forever, they disappear from Waze after a certain time, regardless the incident has been resolved or not.
If two alerts are related or not is the question of proximity both in time and space. Ali, et al. (2012) proposed the use of geohash to determine if two incidents are close to each other. It is a fast and easy approach, but it omits to count with the characteristics of the road network. Namely, if two alerts are close to each other they are not necessarily related. For example, two alerts on parallel but still separate roads. Santos, et al. (2017) considered the road names too when finding related alerts, which is a more favorable approach and is applied in this study too. The calibration of the proximity limits in time and space were not part of this study, the constraints used in (Santos, et al., 2017) were applied with minor modifications.
4.5. Assessment of the severity
The severity of traffic incidents can be seen from different point of views (Leonard, 2017). This study focused on the impact of the incidents made on the traffic flow. Waze does not provide any indication about the severity of the alerts in the data feed. Unfortunately, there was no severity information about alerts in the historical data either, which did not allow the construction of a model for severity prediction. The question is, if there is still a way to predict the severity of Waze alerts when no information from any other data sources is available. A model for severity regression based on the volume of tweets was proposed by (Georgiou, et al., 2015). Using their idea, this study suggests assessing the severity of a
Methodology | 27
Waze alert by investigating the related alerts and traffic jams. Related traffic jams can be identified similarly to how related alerts were detected in the previous step. The method is demonstrated through a case of an incident.
4.6. Comparison of the Waze traffic data and the existing traffic information
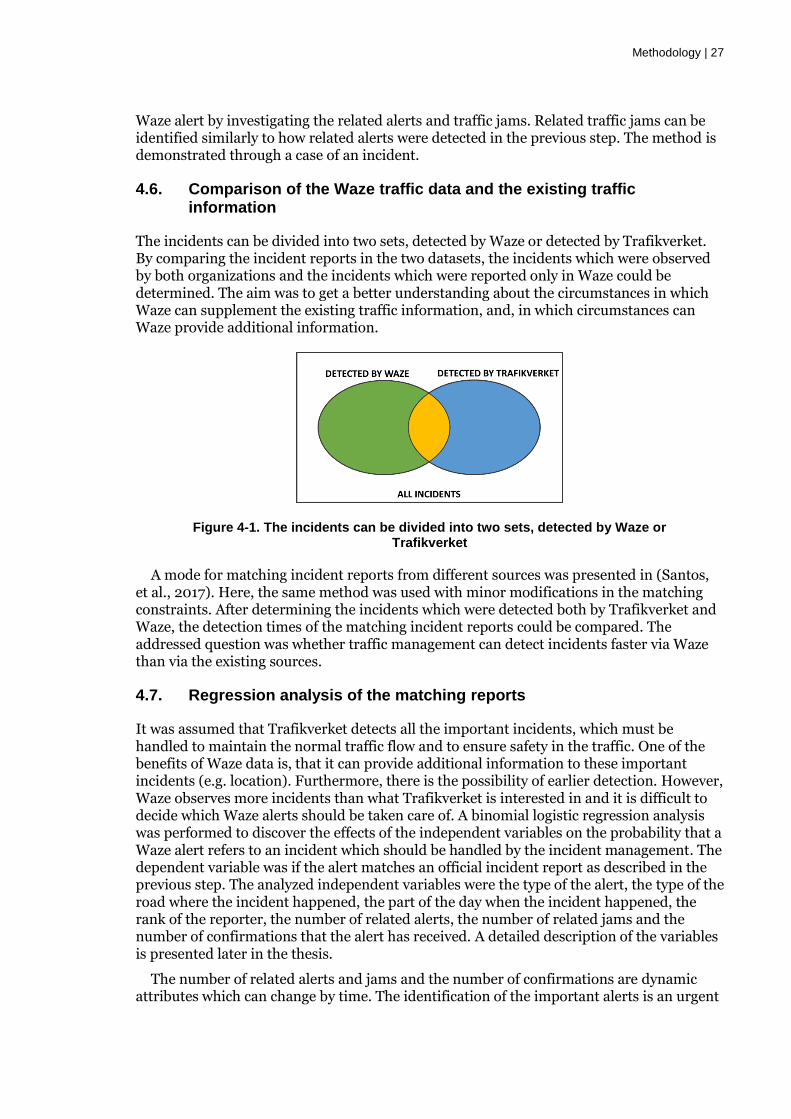
The incidents can be divided into two sets, detected by Waze or detected by Trafikverket. By comparing the incident reports in the two datasets, the incidents which were observed by both organizations and the incidents which were reported only in Waze could be determined. The aim was to get a better understanding about the circumstances in which Waze can supplement the existing traffic information, and, in which circumstances can Waze provide additional information.
Figure 4-1. The incidents can be divided into two sets, detected by Waze or Trafikverket
A mode for matching incident reports from different sources was presented in (Santos, et al., 2017). Here, the same method was used with minor modifications in the matching constraints. After determining the incidents which were detected both by Trafikverket and Waze, the detection times of the matching incident reports could be compared. The addressed question was whether traffic management can detect incidents faster via Waze than via the existing sources.
4.7. Regression analysis of the matching reports
It was assumed that Trafikverket detects all the important incidents, which must be handled to maintain the normal traffic flow and to ensure safety in the traffic. One of the benefits of Waze data is, that it can provide additional information to these important incidents (e.g. location). Furthermore, there is the possibility of earlier detection. However, Waze observes more incidents than what Trafikverket is interested in and it is difficult to decide which Waze alerts should be taken care of. A binomial logistic regression analysis was performed to discover the effects of the independent variables on the probability that a Waze alert refers to an incident which should be handled by the incident management. The dependent variable was if the alert matches an official incident report as described in the previous step. The analyzed independent variables were the type of the alert, the type of the road where the incident happened, the part of the day when the incident happened, the rank of the reporter, the number of related alerts, the number of related jams and the number of confirmations that the alert has received. A detailed description of the variables is presented later in the thesis.
The number of related alerts and jams and the number of confirmations are dynamic attributes which can change by time. The identification of the important alerts is an urgent
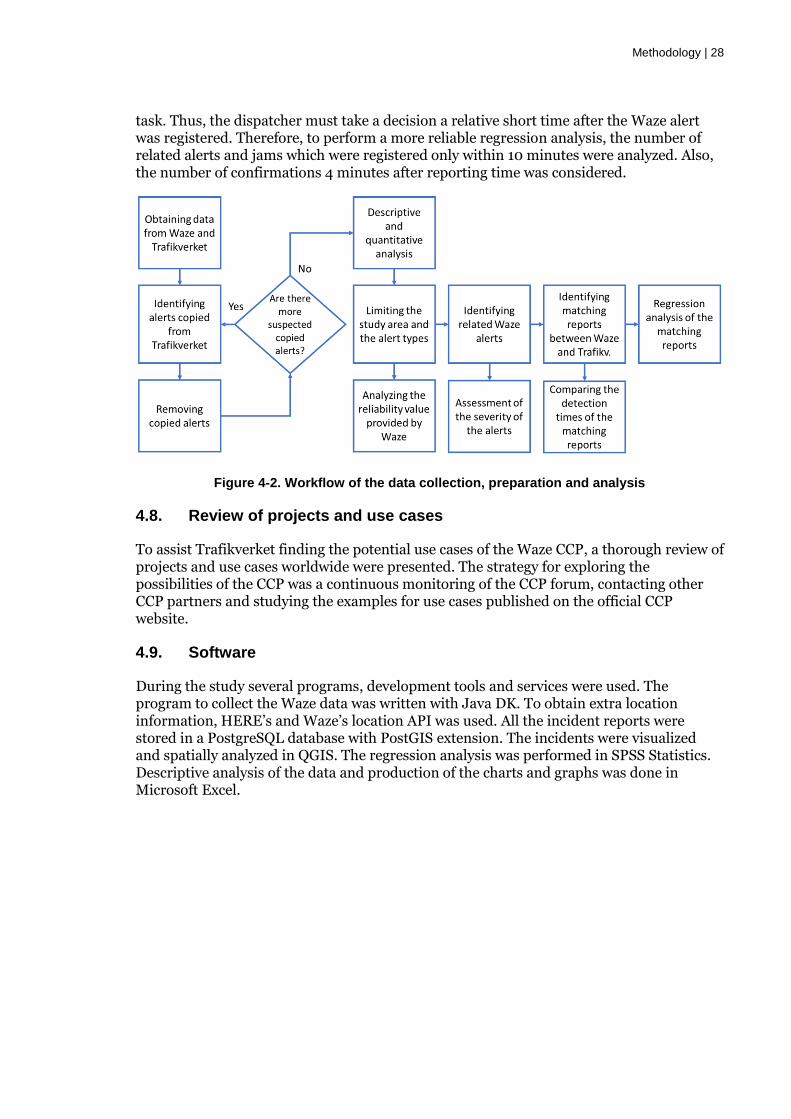
Methodology | 28
task. Thus, the dispatcher must take a decision a relative short time after the Waze alert was registered. Therefore, to perform a more reliable regression analysis, the number of related alerts and jams which were registered only within 10 minutes were analyzed. Also, the number of confirmations 4 minutes after reporting time was considered.
Figure 4-2. Workflow of the data collection, preparation and analysis
4.8. Review of projects and use cases
To assist Trafikverket finding the potential use cases of the Waze CCP, a thorough review of projects and use cases worldwide were presented. The strategy for exploring the possibilities of the CCP was a continuous monitoring of the CCP forum, contacting other CCP partners and studying the examples for use cases published on the official CCP website.
4.9. Software
During the study several programs, development tools and services were used. The program to collect the Waze data was written with Java DK. To obtain extra location information, HERE’s and Waze’s location API was used. All the incident reports were stored in a PostgreSQL database with PostGIS extension. The incidents were visualized and spatially analyzed in QGIS. The regression analysis was performed in SPSS Statistics. Descriptive analysis of the data and production of the charts and graphs was done in Microsoft Excel.
Data collection and preparation | 29
5. Data collection and preparation
5.1. Description of the Waze traffic-data
As a central part of the services included in the CCP program, Waze opened up a GeoRSS data feed for partners to download traffic data. It contains information about traffic alerts – incidents reported by users – and traffic jams, traffic slowdown information generated by Waze, based on user’s location and speed. The data is provided in form of an XML or JSON file and is dynamically updated with two-minute time interval.
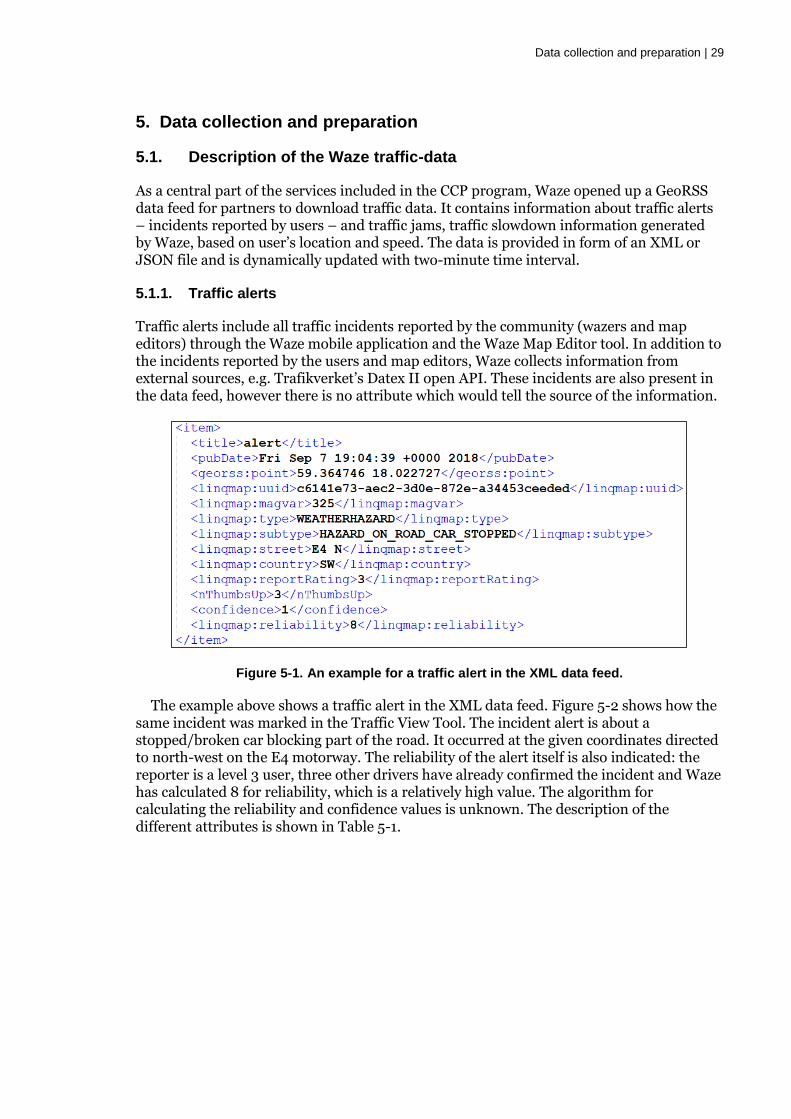
5.1.1. Traffic alerts
Traffic alerts include all traffic incidents reported by the community (wazers and map editors) through the Waze mobile application and the Waze Map Editor tool. In addition to the incidents reported by the users and map editors, Waze collects information from external sources, e.g. Trafikverket’s Datex II open API. These incidents are also present in the data feed, however there is no attribute which would tell the source of the information.
Figure 5-1. An example for a traffic alert in the XML data feed.
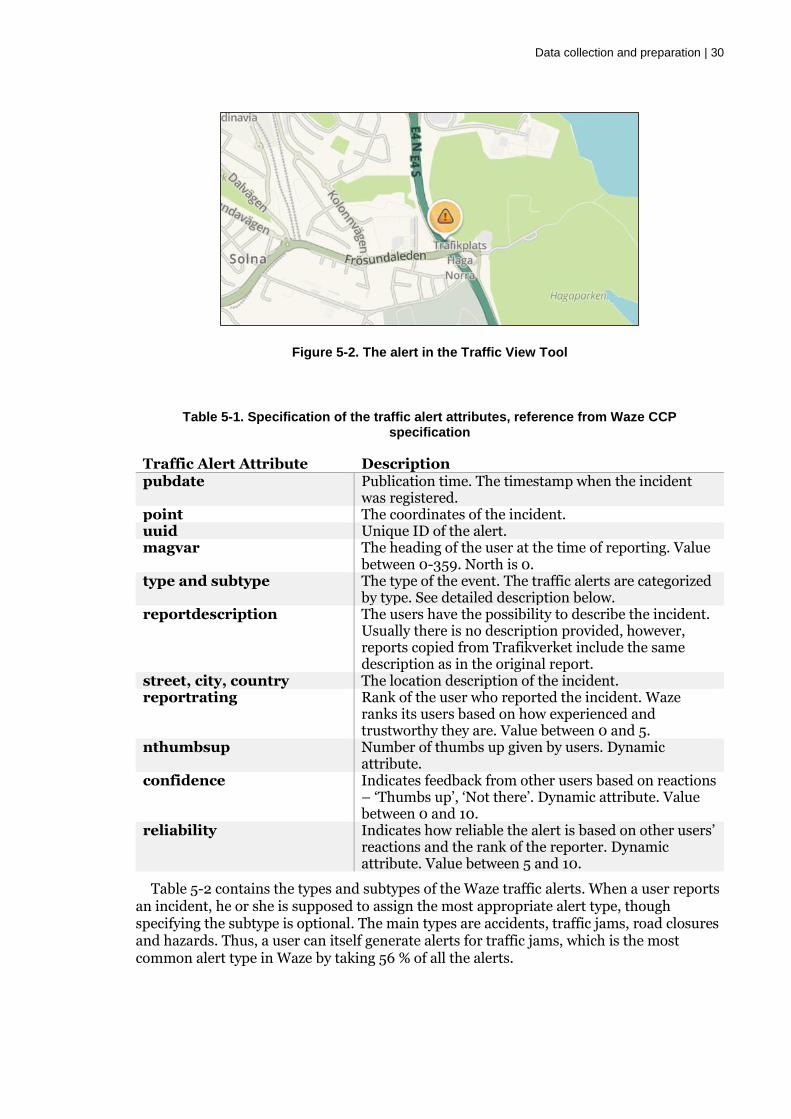
The example above shows a traffic alert in the XML data feed. Figure 5-2 shows how the same incident was marked in the Traffic View Tool. The incident alert is about a stopped/broken car blocking part of the road. It occurred at the given coordinates directed to north-west on the E4 motorway. The reliability of the alert itself is also indicated: the reporter is a level 3 user, three other drivers have already confirmed the incident and Waze has calculated 8 for reliability, which is a relatively high value. The algorithm for calculating the reliability and confidence values is unknown. The description of the different attributes is shown in Table 5-1.
Data collection and preparation | 30
Figure 5-2. The alert in the Traffic View Tool
Table 5-1. Specification of the traffic alert attributes, reference from Waze CCP specification
Traffic Alert Attribute Description pubdate Publication time. The timestamp when the incident
was registered. point The coordinates of the incident. uuid Unique ID of the alert. magvar The heading of the user at the time of reporting. Value
between 0-359. North is 0. type and subtype The type of the event. The traffic alerts are categorized
by type. See detailed description below. reportdescription The users have the possibility to describe the incident.
Usually there is no description provided, however, reports copied from Trafikverket include the same description as in the original report.
street, city, country The location description of the incident. reportrating Rank of the user who reported the incident. Waze
ranks its users based on how experienced and trustworthy they are. Value between 0 and 5.
nthumbsup Number of thumbs up given by users. Dynamic attribute.
confidence Indicates feedback from other users based on reactions – ‘Thumbs up’, ‘Not there’. Dynamic attribute. Value between 0 and 10.
reliability Indicates how reliable the alert is based on other users’ reactions and the rank of the reporter. Dynamic attribute. Value between 5 and 10.
Table 5-2 contains the types and subtypes of the Waze traffic alerts. When a user reports an incident, he or she is supposed to assign the most appropriate alert type, though specifying the subtype is optional. The main types are accidents, traffic jams, road closures and hazards. Thus, a user can itself generate alerts for traffic jams, which is the most common alert type in Waze by taking 56 % of all the alerts.
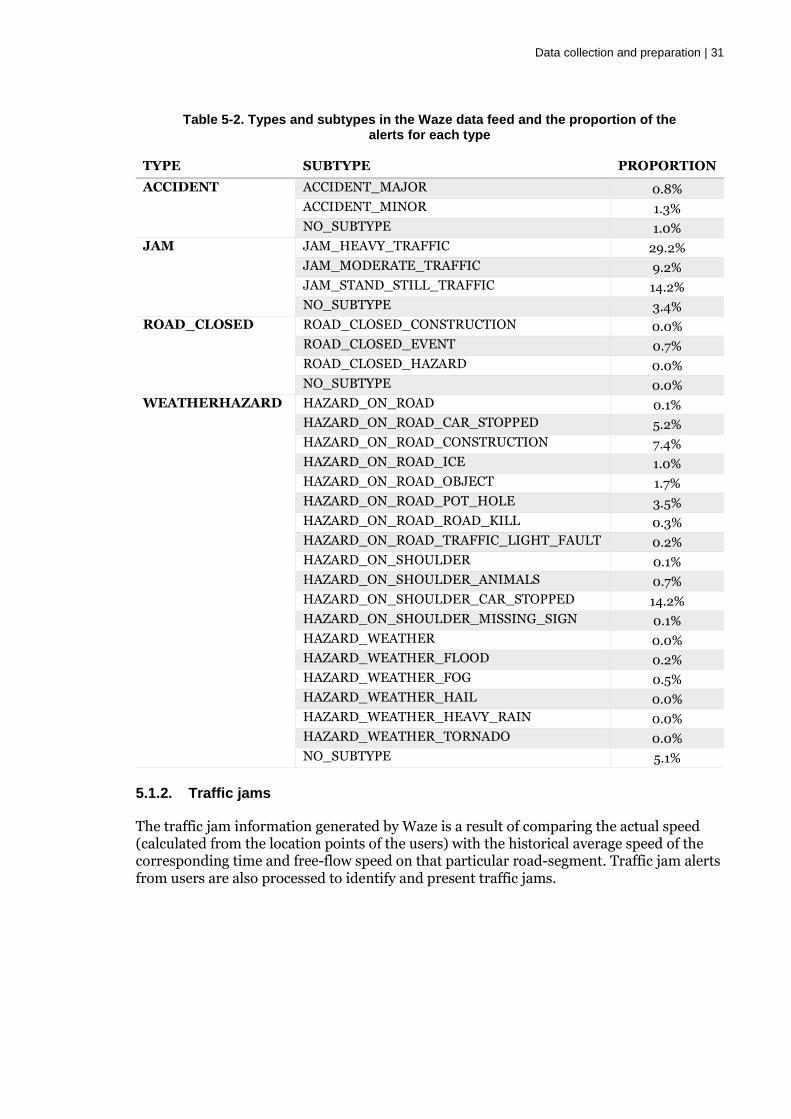
Data collection and preparation | 31
Table 5-2. Types and subtypes in the Waze data feed and the proportion of the alerts for each type
TYPE SUBTYPE PROPORTION
ACCIDENT ACCIDENT_MAJOR 0.8%
ACCIDENT_MINOR 1.3%
NO_SUBTYPE 1.0%
JAM JAM_HEAVY_TRAFFIC 29.2%
JAM_MODERATE_TRAFFIC 9.2%
JAM_STAND_STILL_TRAFFIC 14.2%
NO_SUBTYPE 3.4%
ROAD_CLOSED ROAD_CLOSED_CONSTRUCTION 0.0%
ROAD_CLOSED_EVENT 0.7%
ROAD_CLOSED_HAZARD 0.0%
NO_SUBTYPE 0.0%
WEATHERHAZARD HAZARD_ON_ROAD 0.1%
HAZARD_ON_ROAD_CAR_STOPPED 5.2%
HAZARD_ON_ROAD_CONSTRUCTION 7.4%
HAZARD_ON_ROAD_ICE 1.0%
HAZARD_ON_ROAD_OBJECT 1.7%
HAZARD_ON_ROAD_POT_HOLE 3.5%
HAZARD_ON_ROAD_ROAD_KILL 0.3%
HAZARD_ON_ROAD_TRAFFIC_LIGHT_FAULT 0.2%
HAZARD_ON_SHOULDER 0.1%
HAZARD_ON_SHOULDER_ANIMALS 0.7%
HAZARD_ON_SHOULDER_CAR_STOPPED 14.2%
HAZARD_ON_SHOULDER_MISSING_SIGN 0.1%
HAZARD_WEATHER 0.0%
HAZARD_WEATHER_FLOOD 0.2%
HAZARD_WEATHER_FOG 0.5%
HAZARD_WEATHER_HAIL 0.0%
HAZARD_WEATHER_HEAVY_RAIN 0.0%
HAZARD_WEATHER_TORNADO 0.0%
NO_SUBTYPE 5.1%
5.1.2. Traffic jams
The traffic jam information generated by Waze is a result of comparing the actual speed (calculated from the location points of the users) with the historical average speed of the corresponding time and free-flow speed on that particular road-segment. Traffic jam alerts from users are also processed to identify and present traffic jams.
Data collection and preparation | 32
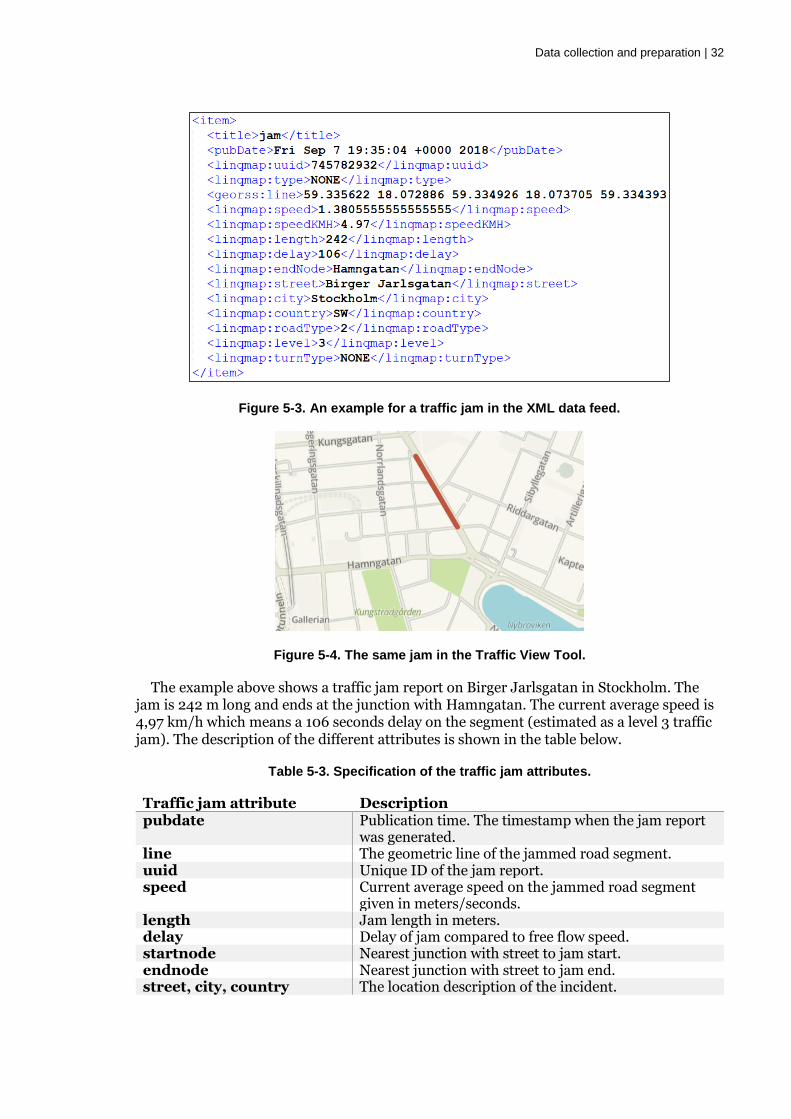
Figure 5-3. An example for a traffic jam in the XML data feed.
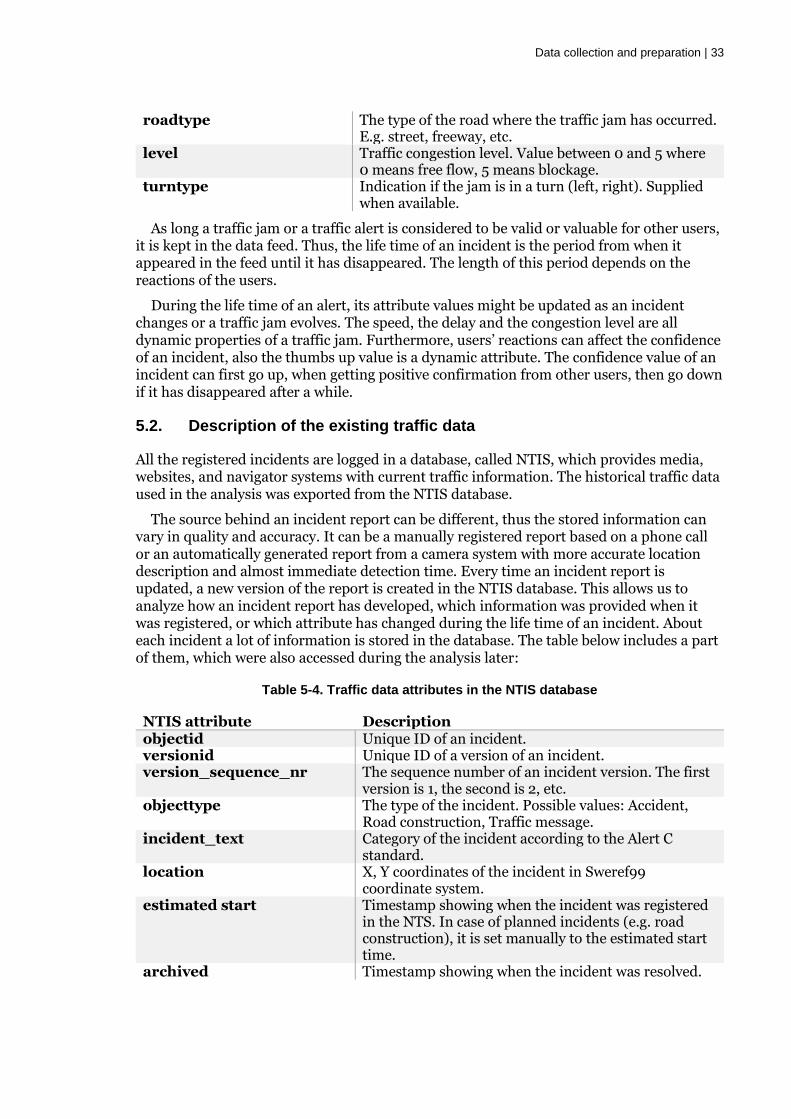
Figure 5-4. The same jam in the Traffic View Tool.
The example above shows a traffic jam report on Birger Jarlsgatan in Stockholm. The jam is 242 m long and ends at the junction with Hamngatan. The current average speed is 4,97 km/h which means a 106 seconds delay on the segment (estimated as a level 3 traffic jam). The description of the different attributes is shown in the table below.
Table 5-3. Specification of the traffic jam attributes.
Traffic jam attribute Description pubdate Publication time. The timestamp when the jam report
was generated. line The geometric line of the jammed road segment. uuid Unique ID of the jam report. speed Current average speed on the jammed road segment
given in meters/seconds. length Jam length in meters. delay Delay of jam compared to free flow speed. startnode Nearest junction with street to jam start. endnode Nearest junction with street to jam end. street, city, country The location description of the incident.
Data collection and preparation | 33
roadtype The type of the road where the traffic jam has occurred. E.g. street, freeway, etc.
level Traffic congestion level. Value between 0 and 5 where 0 means free flow, 5 means blockage.
turntype Indication if the jam is in a turn (left, right). Supplied when available.
As long a traffic jam or a traffic alert is considered to be valid or valuable for other users, it is kept in the data feed. Thus, the life time of an incident is the period from when it appeared in the feed until it has disappeared. The length of this period depends on the reactions of the users.
During the life time of an alert, its attribute values might be updated as an incident changes or a traffic jam evolves. The speed, the delay and the congestion level are all dynamic properties of a traffic jam. Furthermore, users’ reactions can affect the confidence of an incident, also the thumbs up value is a dynamic attribute. The confidence value of an incident can first go up, when getting positive confirmation from other users, then go down if it has disappeared after a while.
5.2. Description of the existing traffic data
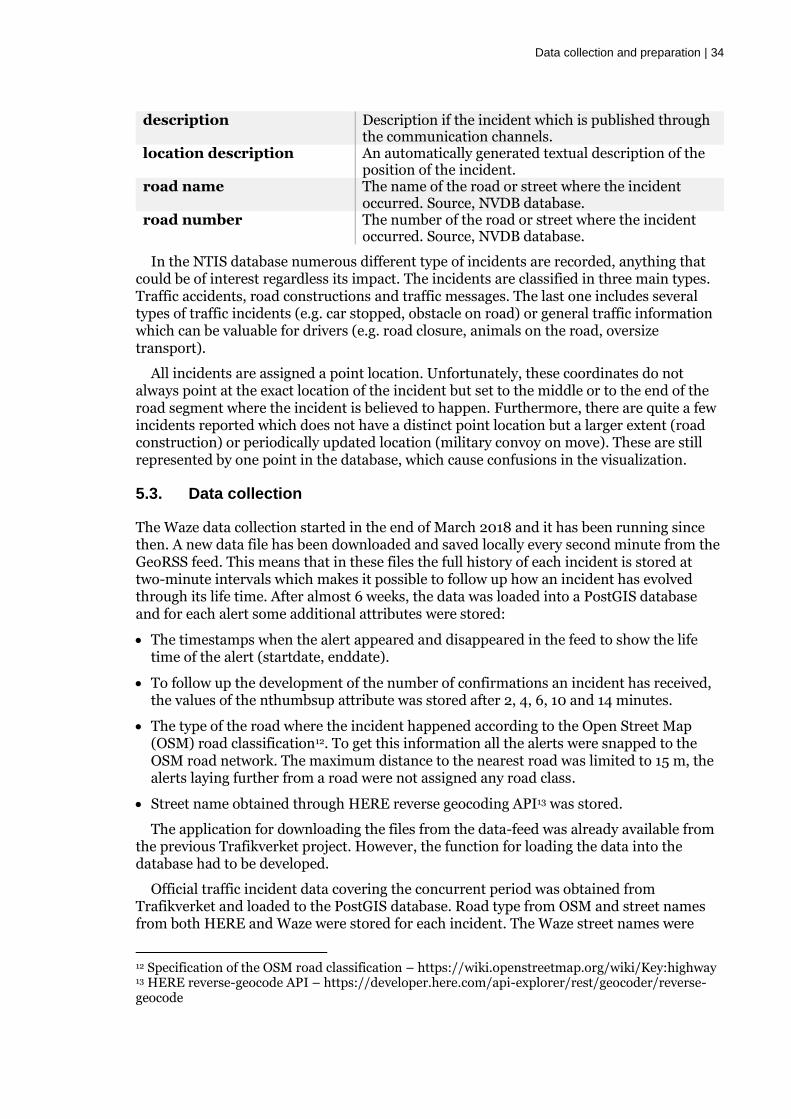
All the registered incidents are logged in a database, called NTIS, which provides media, websites, and navigator systems with current traffic information. The historical traffic data used in the analysis was exported from the NTIS database.
The source behind an incident report can be different, thus the stored information can vary in quality and accuracy. It can be a manually registered report based on a phone call or an automatically generated report from a camera system with more accurate location description and almost immediate detection time. Every time an incident report is updated, a new version of the report is created in the NTIS database. This allows us to analyze how an incident report has developed, which information was provided when it was registered, or which attribute has changed during the life time of an incident. About each incident a lot of information is stored in the database. The table below includes a part of them, which were also accessed during the analysis later:
Table 5-4. Traffic data attributes in the NTIS database
NTIS attribute Description objectid Unique ID of an incident. versionid Unique ID of a version of an incident. version_sequence_nr The sequence number of an incident version. The first
version is 1, the second is 2, etc. objecttype The type of the incident. Possible values: Accident,
Road construction, Traffic message. incident_text Category of the incident according to the Alert C
standard. location X, Y coordinates of the incident in Sweref99
coordinate system. estimated start Timestamp showing when the incident was registered
in the NTS. In case of planned incidents (e.g. road construction), it is set manually to the estimated start time.
archived Timestamp showing when the incident was resolved.
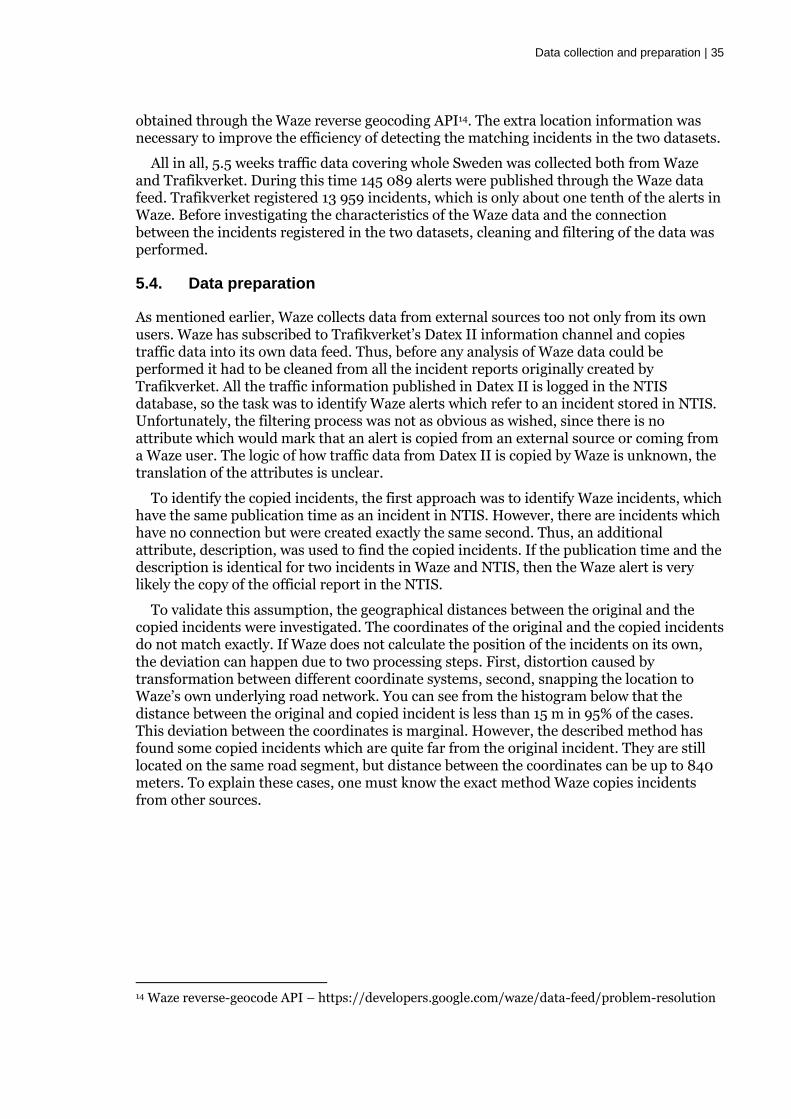
Data collection and preparation | 34
description Description if the incident which is published through the communication channels.
location description An automatically generated textual description of the position of the incident.
road name The name of the road or street where the incident occurred. Source, NVDB database.
road number The number of the road or street where the incident occurred. Source, NVDB database.
In the NTIS database numerous different type of incidents are recorded, anything that could be of interest regardless its impact. The incidents are classified in three main types. Traffic accidents, road constructions and traffic messages. The last one includes several types of traffic incidents (e.g. car stopped, obstacle on road) or general traffic information which can be valuable for drivers (e.g. road closure, animals on the road, oversize transport).
All incidents are assigned a point location. Unfortunately, these coordinates do not always point at the exact location of the incident but set to the middle or to the end of the road segment where the incident is believed to happen. Furthermore, there are quite a few incidents reported which does not have a distinct point location but a larger extent (road construction) or periodically updated location (military convoy on move). These are still represented by one point in the database, which cause confusions in the visualization.
5.3. Data collection
The Waze data collection started in the end of March 2018 and it has been running since then. A new data file has been downloaded and saved locally every second minute from the GeoRSS feed. This means that in these files the full history of each incident is stored at two-minute intervals which makes it possible to follow up how an incident has evolved through its life time. After almost 6 weeks, the data was loaded into a PostGIS database and for each alert some additional attributes were stored:
• The timestamps when the alert appeared and disappeared in the feed to show the life time of the alert (startdate, enddate).
• To follow up the development of the number of confirmations an incident has received, the values of the nthumbsup attribute was stored after 2, 4, 6, 10 and 14 minutes.
• The type of the road where the incident happened according to the Open Street Map (OSM) road classification12. To get this information all the alerts were snapped to the OSM road network. The maximum distance to the nearest road was limited to 15 m, the alerts laying further from a road were not assigned any road class.
• Street name obtained through HERE reverse geocoding API13 was stored.
The application for downloading the files from the data-feed was already available from the previous Trafikverket project. However, the function for loading the data into the database had to be developed.
Official traffic incident data covering the concurrent period was obtained from Trafikverket and loaded to the PostGIS database. Road type from OSM and street names from both HERE and Waze were stored for each incident. The Waze street names were
12 Specification of the OSM road classification – https://wiki.openstreetmap.org/wiki/Key:highway 13 HERE reverse-geocode API – https://developer.here.com/api-explorer/rest/geocoder/reverse-geocode
Data collection and preparation | 35
obtained through the Waze reverse geocoding API14. The extra location information was necessary to improve the efficiency of detecting the matching incidents in the two datasets.
All in all, 5.5 weeks traffic data covering whole Sweden was collected both from Waze and Trafikverket. During this time 145 089 alerts were published through the Waze data feed. Trafikverket registered 13 959 incidents, which is only about one tenth of the alerts in Waze. Before investigating the characteristics of the Waze data and the connection between the incidents registered in the two datasets, cleaning and filtering of the data was performed.
5.4. Data preparation
As mentioned earlier, Waze collects data from external sources too not only from its own users. Waze has subscribed to Trafikverket’s Datex II information channel and copies traffic data into its own data feed. Thus, before any analysis of Waze data could be performed it had to be cleaned from all the incident reports originally created by Trafikverket. All the traffic information published in Datex II is logged in the NTIS database, so the task was to identify Waze alerts which refer to an incident stored in NTIS. Unfortunately, the filtering process was not as obvious as wished, since there is no attribute which would mark that an alert is copied from an external source or coming from a Waze user. The logic of how traffic data from Datex II is copied by Waze is unknown, the translation of the attributes is unclear.
To identify the copied incidents, the first approach was to identify Waze incidents, which have the same publication time as an incident in NTIS. However, there are incidents which have no connection but were created exactly the same second. Thus, an additional attribute, description, was used to find the copied incidents. If the publication time and the description is identical for two incidents in Waze and NTIS, then the Waze alert is very likely the copy of the official report in the NTIS.
To validate this assumption, the geographical distances between the original and the copied incidents were investigated. The coordinates of the original and the copied incidents do not match exactly. If Waze does not calculate the position of the incidents on its own, the deviation can happen due to two processing steps. First, distortion caused by transformation between different coordinate systems, second, snapping the location to Waze’s own underlying road network. You can see from the histogram below that the distance between the original and copied incident is less than 15 m in 95% of the cases. This deviation between the coordinates is marginal. However, the described method has found some copied incidents which are quite far from the original incident. They are still located on the same road segment, but distance between the coordinates can be up to 840 meters. To explain these cases, one must know the exact method Waze copies incidents from other sources.
14 Waze reverse-geocode API – https://developers.google.com/waze/data-feed/problem-resolution
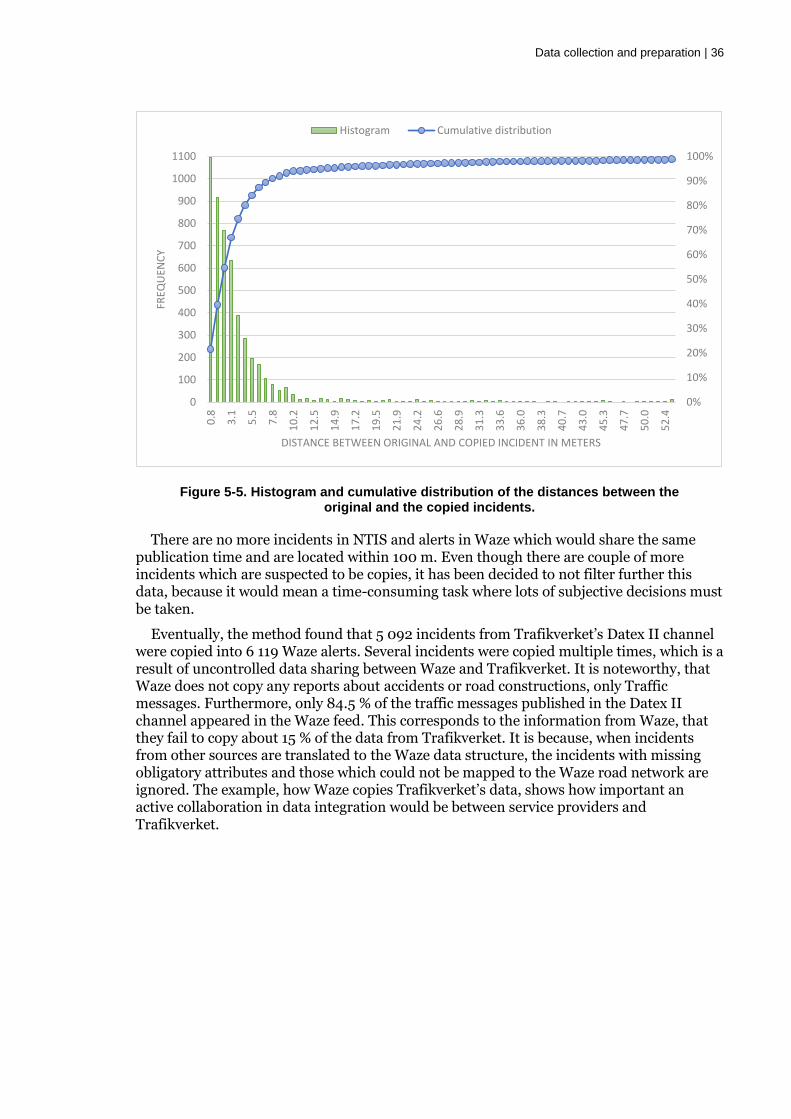
Data collection and preparation | 36
Figure 5-5. Histogram and cumulative distribution of the distances between the original and the copied incidents.
There are no more incidents in NTIS and alerts in Waze which would share the same publication time and are located within 100 m. Even though there are couple of more incidents which are suspected to be copies, it has been decided to not filter further this data, because it would mean a time-consuming task where lots of subjective decisions must be taken.
Eventually, the method found that 5 092 incidents from Trafikverket’s Datex II channel were copied into 6 119 Waze alerts. Several incidents were copied multiple times, which is a result of uncontrolled data sharing between Waze and Trafikverket. It is noteworthy, that Waze does not copy any reports about accidents or road constructions, only Traffic messages. Furthermore, only 84.5 % of the traffic messages published in the Datex II channel appeared in the Waze feed. This corresponds to the information from Waze, that they fail to copy about 15 % of the data from Trafikverket. It is because, when incidents from other sources are translated to the Waze data structure, the incidents with missing obligatory attributes and those which could not be mapped to the Waze road network are ignored. The example, how Waze copies Trafikverket’s data, shows how important an active collaboration in data integration would be between service providers and Trafikverket.
0%
10%
20%
30%
40%
50%
60%
70%
80%
90%
100%
0
100
200
300
400
500
600
700
800
900
1000
1100
0.8
3.1
5.5
7.8
10
.2
12
.5
14
.9
17
.2
19
.5
21
.9
24
.2
26
.6
28
.9
31
.3
33
.6
36
.0
38
.3
40
.7
43
.0
45
.3
47
.7
50
.0
52
.4
FREQ
UEN
CY
DISTANCE BETWEEN ORIGINAL AND COPIED INCIDENT IN METERS
Histogram Cumulative distribution
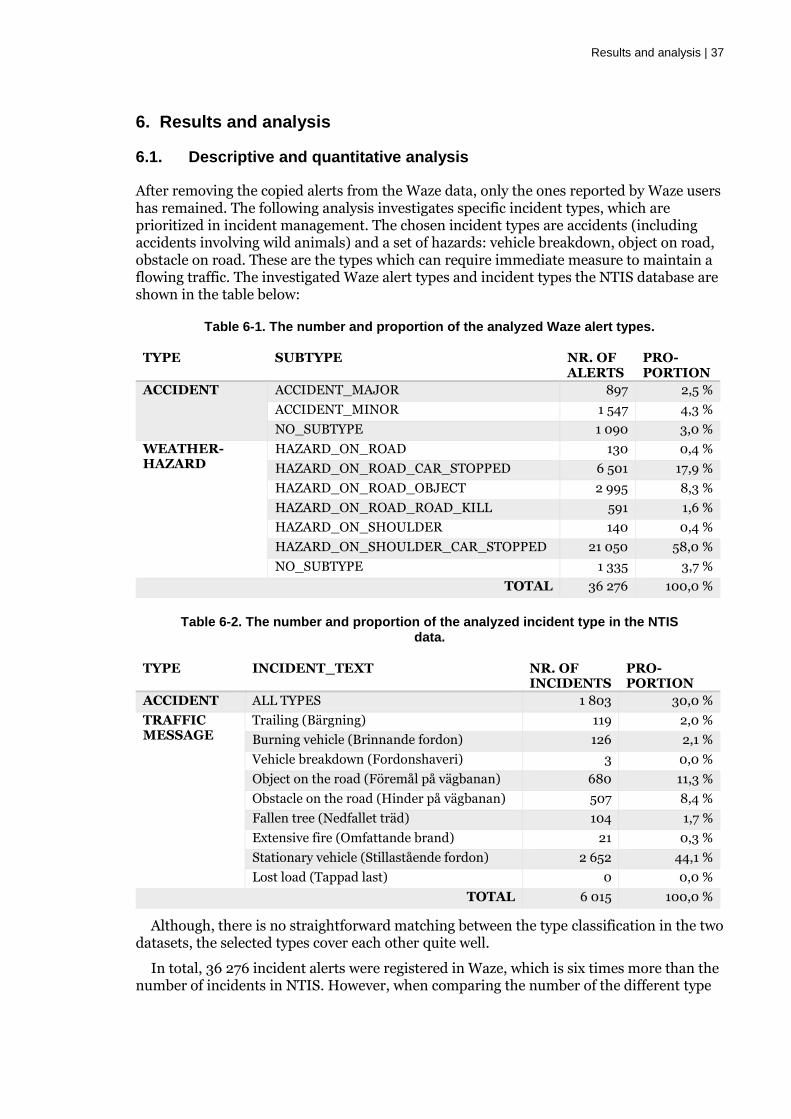
Results and analysis | 37
6. Results and analysis
6.1. Descriptive and quantitative analysis
After removing the copied alerts from the Waze data, only the ones reported by Waze users has remained. The following analysis investigates specific incident types, which are prioritized in incident management. The chosen incident types are accidents (including accidents involving wild animals) and a set of hazards: vehicle breakdown, object on road, obstacle on road. These are the types which can require immediate measure to maintain a flowing traffic. The investigated Waze alert types and incident types the NTIS database are shown in the table below:
Table 6-1. The number and proportion of the analyzed Waze alert types.
TYPE SUBTYPE NR. OF ALERTS
PRO-PORTION
ACCIDENT ACCIDENT_MAJOR 897 2,5 %
ACCIDENT_MINOR 1 547 4,3 %
NO_SUBTYPE 1 090 3,0 %
WEATHER-HAZARD
HAZARD_ON_ROAD 130 0,4 %
HAZARD_ON_ROAD_CAR_STOPPED 6 501 17,9 %
HAZARD_ON_ROAD_OBJECT 2 995 8,3 %
HAZARD_ON_ROAD_ROAD_KILL 591 1,6 %
HAZARD_ON_SHOULDER 140 0,4 %
HAZARD_ON_SHOULDER_CAR_STOPPED 21 050 58,0 %
NO_SUBTYPE 1 335 3,7 %
TOTAL 36 276 100,0 %
Table 6-2. The number and proportion of the analyzed incident type in the NTIS data.
TYPE INCIDENT_TEXT NR. OF INCIDENTS
PRO-PORTION
ACCIDENT ALL TYPES 1 803 30,0 %
TRAFFIC MESSAGE
Trailing (Bärgning) 119 2,0 %
Burning vehicle (Brinnande fordon) 126 2,1 %
Vehicle breakdown (Fordonshaveri) 3 0,0 %
Object on the road (Föremål på vägbanan) 680 11,3 %
Obstacle on the road (Hinder på vägbanan) 507 8,4 %
Fallen tree (Nedfallet träd) 104 1,7 %
Extensive fire (Omfattande brand) 21 0,3 %
Stationary vehicle (Stillastående fordon) 2 652 44,1 %
Lost load (Tappad last) 0 0,0 %
TOTAL 6 015 100,0 %
Although, there is no straightforward matching between the type classification in the two datasets, the selected types cover each other quite well.
In total, 36 276 incident alerts were registered in Waze, which is six times more than the number of incidents in NTIS. However, when comparing the number of the different type
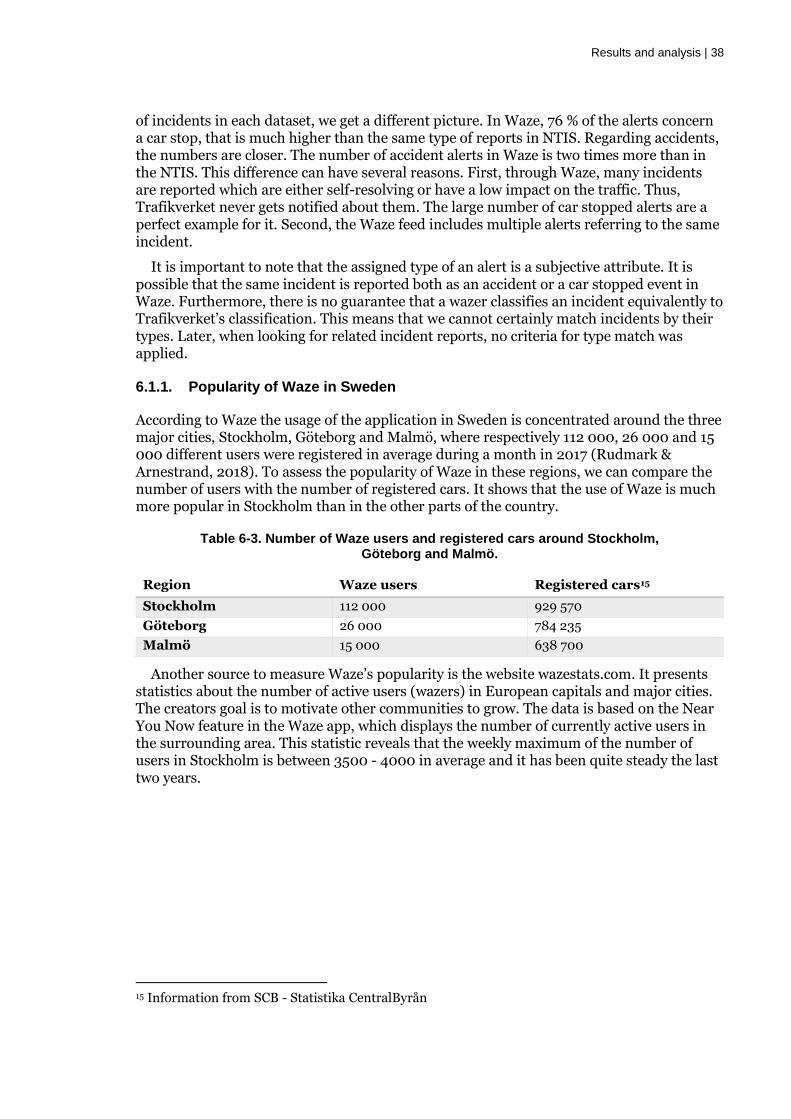
Results and analysis | 38
of incidents in each dataset, we get a different picture. In Waze, 76 % of the alerts concern a car stop, that is much higher than the same type of reports in NTIS. Regarding accidents, the numbers are closer. The number of accident alerts in Waze is two times more than in the NTIS. This difference can have several reasons. First, through Waze, many incidents are reported which are either self-resolving or have a low impact on the traffic. Thus, Trafikverket never gets notified about them. The large number of car stopped alerts are a perfect example for it. Second, the Waze feed includes multiple alerts referring to the same incident.
It is important to note that the assigned type of an alert is a subjective attribute. It is possible that the same incident is reported both as an accident or a car stopped event in Waze. Furthermore, there is no guarantee that a wazer classifies an incident equivalently to Trafikverket’s classification. This means that we cannot certainly match incidents by their types. Later, when looking for related incident reports, no criteria for type match was applied.
6.1.1. Popularity of Waze in Sweden
According to Waze the usage of the application in Sweden is concentrated around the three major cities, Stockholm, Göteborg and Malmö, where respectively 112 000, 26 000 and 15 000 different users were registered in average during a month in 2017 (Rudmark & Arnestrand, 2018). To assess the popularity of Waze in these regions, we can compare the number of users with the number of registered cars. It shows that the use of Waze is much more popular in Stockholm than in the other parts of the country.
Table 6-3. Number of Waze users and registered cars around Stockholm, Göteborg and Malmö.
Region Waze users Registered cars15
Stockholm 112 000 929 570
Göteborg 26 000 784 235
Malmö 15 000 638 700
Another source to measure Waze’s popularity is the website wazestats.com. It presents statistics about the number of active users (wazers) in European capitals and major cities. The creators goal is to motivate other communities to grow. The data is based on the Near You Now feature in the Waze app, which displays the number of currently active users in the surrounding area. This statistic reveals that the weekly maximum of the number of users in Stockholm is between 3500 - 4000 in average and it has been quite steady the last two years.
15 Information from SCB - Statistika CentralByrån
Results and analysis | 39
Figure 6-1. Statistics of active wazers in Stockholm between May 2016 and April 201816 image from wazestats.com.
6.1.2. Spatial distribution of the Waze alerts
The spatial distribution of the alerts correlates with the popularity of Waze in the different regions. The number of alerts is highest in Stockholm county, nearly three times more than in the second most populated county, Västra Götaland.
Table 6-4. Number of Waze alerts per county in Sweden.
County Nr. of alerts
County Nr. of alerts
County Nr. of alerts
Stockholm 13 510 Väst-manland
956 Värmland 242
Västra Götaland
4 772 Jönköping 934 Väster-norrland
204
Skåne 4 196 Örebro 874 Kalmar 190
Uppsala 2 404 Gävleborg 680 Blekinge 111
Södermanland 2 284 Dalarna 392 Västerbotten 85
Östergötland 2 187 Kronoberg 366 Norrbotten 45
Halland 1 533 Jämtland 265 Gotland 11
The spread of the alerts can be visualized on a heatmap, where you can see, that the Waze alerts concentrate around the three major cities (Stockholm stands out) and the main motorways.
The efficiency of a crowdsourced application depends highly on the number of users. One can enjoy the benefits of Waze only if there is sufficient number of users who generate traffic information. The popularity influences the number of detected incidents. Since the usage of the Waze is not uniform throughout Sweden, the added value varies between the
16 In January – February, 2018, the data collection was inactive, therefore there is a gap in the graph
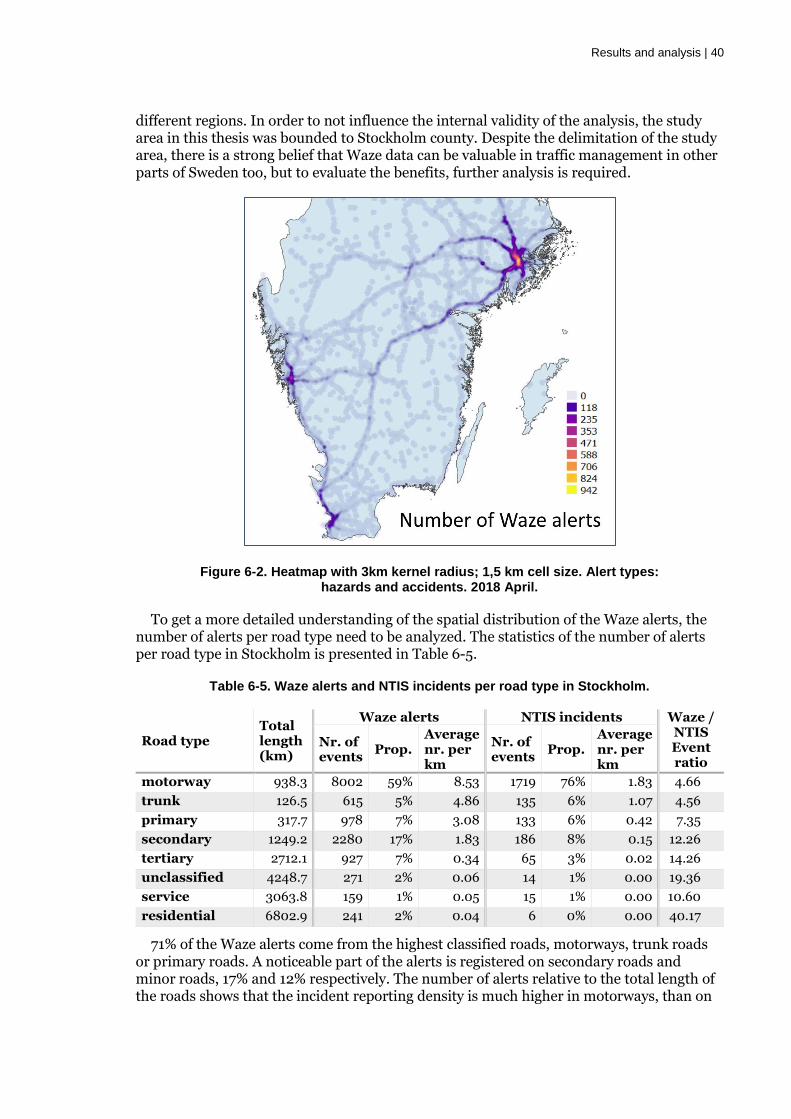
Results and analysis | 40
different regions. In order to not influence the internal validity of the analysis, the study area in this thesis was bounded to Stockholm county. Despite the delimitation of the study area, there is a strong belief that Waze data can be valuable in traffic management in other parts of Sweden too, but to evaluate the benefits, further analysis is required.
Figure 6-2. Heatmap with 3km kernel radius; 1,5 km cell size. Alert types: hazards and accidents. 2018 April.
To get a more detailed understanding of the spatial distribution of the Waze alerts, the number of alerts per road type need to be analyzed. The statistics of the number of alerts per road type in Stockholm is presented in Table 6-5.
Table 6-5. Waze alerts and NTIS incidents per road type in Stockholm.
Road type Total length (km)
Waze alerts NTIS incidents Waze / NTIS Event ratio
Nr. of events
Prop. Average nr. per km
Nr. of events
Prop. Average nr. per km
motorway 938.3 8002 59% 8.53 1719 76% 1.83 4.66
trunk 126.5 615 5% 4.86 135 6% 1.07 4.56
primary 317.7 978 7% 3.08 133 6% 0.42 7.35
secondary 1249.2 2280 17% 1.83 186 8% 0.15 12.26
tertiary 2712.1 927 7% 0.34 65 3% 0.02 14.26
unclassified 4248.7 271 2% 0.06 14 1% 0.00 19.36
service 3063.8 159 1% 0.05 15 1% 0.00 10.60
residential 6802.9 241 2% 0.04 6 0% 0.00 40.17
71% of the Waze alerts come from the highest classified roads, motorways, trunk roads or primary roads. A noticeable part of the alerts is registered on secondary roads and minor roads, 17% and 12% respectively. The number of alerts relative to the total length of the roads shows that the incident reporting density is much higher in motorways, than on
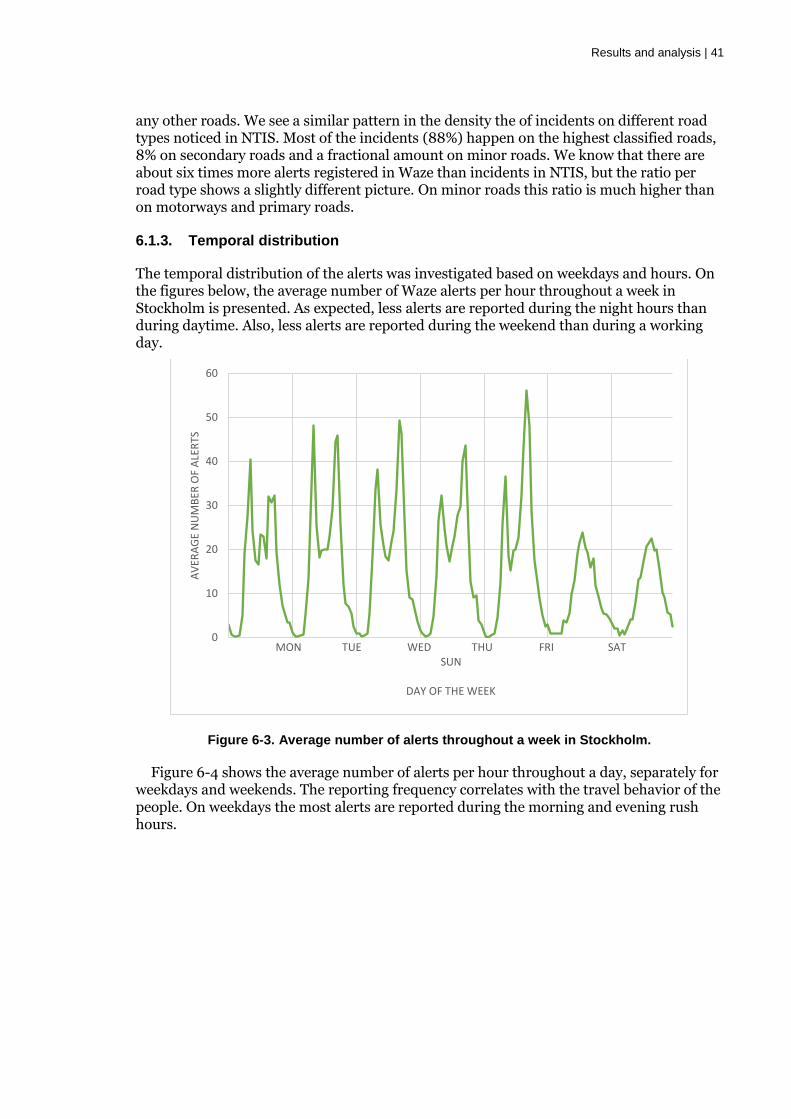
Results and analysis | 41
any other roads. We see a similar pattern in the density the of incidents on different road types noticed in NTIS. Most of the incidents (88%) happen on the highest classified roads, 8% on secondary roads and a fractional amount on minor roads. We know that there are about six times more alerts registered in Waze than incidents in NTIS, but the ratio per road type shows a slightly different picture. On minor roads this ratio is much higher than on motorways and primary roads.
6.1.3. Temporal distribution
The temporal distribution of the alerts was investigated based on weekdays and hours. On the figures below, the average number of Waze alerts per hour throughout a week in Stockholm is presented. As expected, less alerts are reported during the night hours than during daytime. Also, less alerts are reported during the weekend than during a working day.
Figure 6-3. Average number of alerts throughout a week in Stockholm.
Figure 6-4 shows the average number of alerts per hour throughout a day, separately for weekdays and weekends. The reporting frequency correlates with the travel behavior of the people. On weekdays the most alerts are reported during the morning and evening rush hours.
0
10
20
30
40
50
60
AV
ERA
GE
NU
MB
ER O
F A
LER
TS
MON TUE WED THU FRI SAT SUN
DAY OF THE WEEK
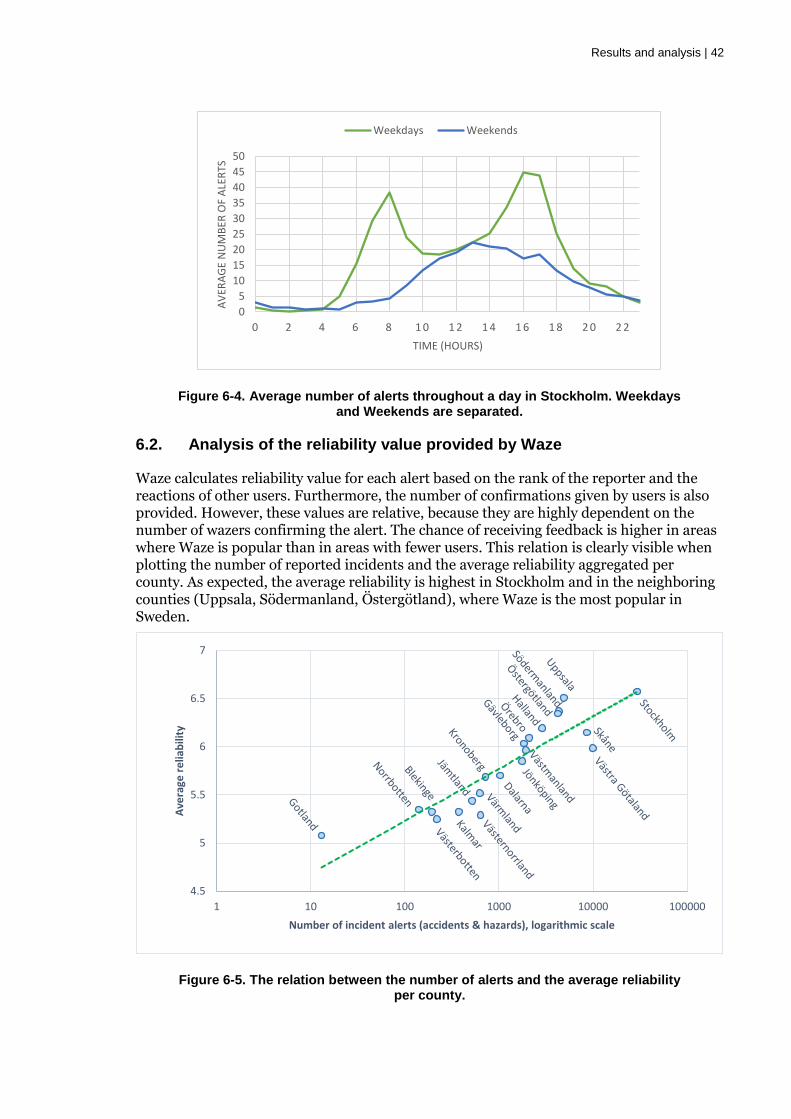
Results and analysis | 42
Figure 6-4. Average number of alerts throughout a day in Stockholm. Weekdays and Weekends are separated.
6.2. Analysis of the reliability value provided by Waze
Waze calculates reliability value for each alert based on the rank of the reporter and the reactions of other users. Furthermore, the number of confirmations given by users is also provided. However, these values are relative, because they are highly dependent on the number of wazers confirming the alert. The chance of receiving feedback is higher in areas where Waze is popular than in areas with fewer users. This relation is clearly visible when plotting the number of reported incidents and the average reliability aggregated per county. As expected, the average reliability is highest in Stockholm and in the neighboring counties (Uppsala, Södermanland, Östergötland), where Waze is the most popular in Sweden.
Figure 6-5. The relation between the number of alerts and the average reliability per county.
0
5
10
15
20
25
30
35
40
45
50
0 2 4 6 8 1 0 1 2 1 4 1 6 1 8 2 0 2 2
AV
ERA
GE
NU
MB
ER O
F A
LER
TS
TIME (HOURS)
Weekdays Weekends
4.5
5
5.5
6
6.5
7
1 10 100 1000 10000 100000
Ave
rage
re
liab
ility
Number of incident alerts (accidents & hazards), logarithmic scale
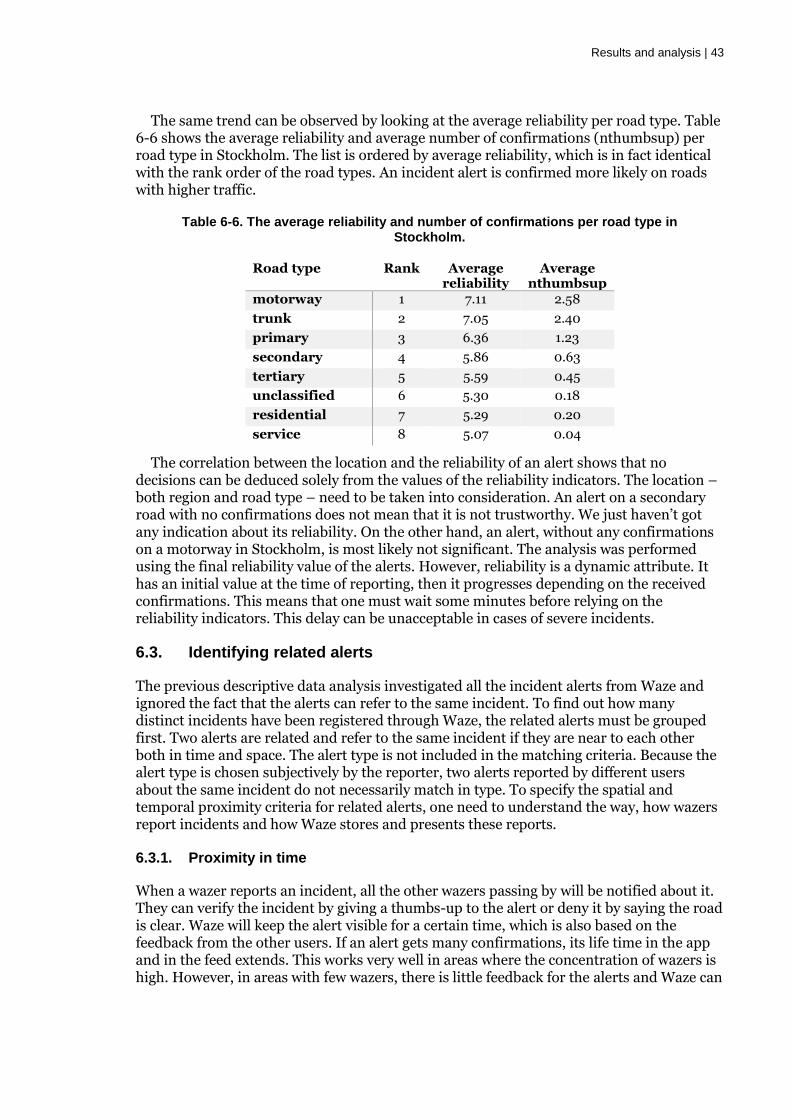
Results and analysis | 43
The same trend can be observed by looking at the average reliability per road type. Table 6-6 shows the average reliability and average number of confirmations (nthumbsup) per road type in Stockholm. The list is ordered by average reliability, which is in fact identical with the rank order of the road types. An incident alert is confirmed more likely on roads with higher traffic.
Table 6-6. The average reliability and number of confirmations per road type in Stockholm.
Road type Rank Average reliability
Average nthumbsup
motorway 1 7.11 2.58
trunk 2 7.05 2.40
primary 3 6.36 1.23
secondary 4 5.86 0.63
tertiary 5 5.59 0.45
unclassified 6 5.30 0.18
residential 7 5.29 0.20
service 8 5.07 0.04
The correlation between the location and the reliability of an alert shows that no decisions can be deduced solely from the values of the reliability indicators. The location – both region and road type – need to be taken into consideration. An alert on a secondary road with no confirmations does not mean that it is not trustworthy. We just haven’t got any indication about its reliability. On the other hand, an alert, without any confirmations on a motorway in Stockholm, is most likely not significant. The analysis was performed using the final reliability value of the alerts. However, reliability is a dynamic attribute. It has an initial value at the time of reporting, then it progresses depending on the received confirmations. This means that one must wait some minutes before relying on the reliability indicators. This delay can be unacceptable in cases of severe incidents.
6.3. Identifying related alerts
The previous descriptive data analysis investigated all the incident alerts from Waze and ignored the fact that the alerts can refer to the same incident. To find out how many distinct incidents have been registered through Waze, the related alerts must be grouped first. Two alerts are related and refer to the same incident if they are near to each other both in time and space. The alert type is not included in the matching criteria. Because the alert type is chosen subjectively by the reporter, two alerts reported by different users about the same incident do not necessarily match in type. To specify the spatial and temporal proximity criteria for related alerts, one need to understand the way, how wazers report incidents and how Waze stores and presents these reports.
6.3.1. Proximity in time
When a wazer reports an incident, all the other wazers passing by will be notified about it. They can verify the incident by giving a thumbs-up to the alert or deny it by saying the road is clear. Waze will keep the alert visible for a certain time, which is also based on the feedback from the other users. If an alert gets many confirmations, its life time in the app and in the feed extends. This works very well in areas where the concentration of wazers is high. However, in areas with few wazers, there is little feedback for the alerts and Waze can
Results and analysis | 44
remove the alert before the incident has been resolved17. Then, it is possible, that the same incident is reported again in Waze. This is called repeated reporting. In this case there is no overlap in the presence of the alerts in the data feed but still reported close to each other in time. The figure below shows a chain of repeated alerts in time, assuming, that the proximity criteria in space is fulfilled. In this case all three alerts refer to the same incident.
Figure 6-6. Repeated reporting in time. All three alerts refer to the same incident.
It can also happen that an incident is reported multiple times concurrently. This case is called overlapped reporting, because the alerts overlap in time in the data feed, i.e. the start time of alert A is earlier than the end time of alert B and the end time of alert A is later than the start time of alert B. These alerts can refer to the same incident or to a consequence of the original incident, which might be an additional accident.
Two alerts are related in time if their existence overlaps in the data feed or the alerts are published within one hour. The scope of this thesis does not include the analysis for finding the optimal time limit between the related incidents. The one-hour limit was based on the previous research done by Santos, et al. (2017).
6.3.2. Proximity in space
The coordinates of an alert are saved in the moment when a wazer starts reporting an incident. Since reporting happens while moving, the accuracy of the alert position cannot be guaranteed. It can happen anytime between the user first recognized the incident and he or she already passed it. The coordinates won’t be exact, and it will result in a deviation in the coordinates of the related alerts. You can find related alerts quite far from each other (~ 500 m), which implies to use a longer proximity limit. A straightforward solution would be to relate all the alerts within a certain distance. However, a condition based only on distance would find false matches. For example, when two alerts are relatively close to each other, but are placed on two different roads, they are not related (alerts B and C on Figure 6-7). Matching alerts based only on the road name would not work either. When two alerts about an incident in a junction are snapped to two different roads (alerts C and D), these should be still matched.
17 The average lifetime of an alert in the data feed is about 25 minutes.
Results and analysis | 45
Figure 6-7. Related alerts in space. A and B are related, but B and C are not.
Finding the optimal proximity values for relating alerts is a complex task. Apart from the incident density and reporting accuracy, it depends on the characteristics of the road network too (length of segments, distance between junctions, density of streets). The analysis of these aspects does not room in this thesis work. Instead, the methodology from (Santos, et al., 2017) was applied to find the related alerts. Two alerts are related in space if:
• the distance between them is less than 70 m, or
• they are on the same road and the distance between them is less than 500 m.
The first rule covers cases when an incident happened in a junction and the alerts are not on the same road. The second one gives an upper limit to the distance between two alerts which were reported on the same road.
The chosen proximity values are a bit less strict than the one used by Santos, et al. (2017), but still short enough to minimize the probability of false positive matches. 70 m is long enough to cover most of the junctions both in cities and on motorways, but not too long to match not related alerts from parallel roads. 500 m is a necessary upper limit for distance between two alerts. Even though the alerts are on the same road, the likelihood they refer to the same incident is less and less by increasing the distance. Since we did not have any control data, the proximity values were evaluated by testing random cases.
6.3.3. Related alerts
Applying the described proximity constraints, groups of alerts can be formed, which refer to the same incident. On the map in Figure 6-8, four Waze alerts can be seen which were published within one hour on Essingeleden. Their attributes are listed in Table 6-7.The distance between A, B and C is less than 500 m and all three are on the same road, E4 / E20 South. Alert A was published first but it vanished from the data feed after 21 minutes. Soon after this were B and C reported as a repetition of the original incident. Furthermore, B and C overlap in time in the data feed. Alert D was also published within one hour the other alerts and is less than 500 m from alert C, however, it is on the north going side of Essingeleden, and considered as a report of a separate incident. This shows the importance of checking the road name too, not only the distance, when searching for related alerts.
Results and analysis | 46
Figure 6-8. A group of related Waze alerts.
Table 6-7. The attributes of the alerts in Figure 6-8.
ID Type Subtype Street Pubdate Enddate A WEATHERHAZARD HAZARD_ON_ROAD
CAR_STOPPED E4 / E20 S 15:33 15:54
B ACCIDENT ACCIDENT_MINOR E4 / E20 S 16:07 16:32
C WEATHERHAZARD HAZARD_ON_ROAD CAR_STOPPED
E4 / E20 S 16:09 16:34
D WEATHERHAZARD HAZARD_ON_SHOULDER CAR_STOPPED
E4 N 15:23 15:36
The algorithm for grouping the related Waze alerts and identifying distinct incidents has not been implemented. Only the pairs of related alerts have been identified. The Waze alerts can be represented as nodes in a graph and there is an edge between two alerts if they are related. The edge is directed towards the alert published later as shown on Figure 6-9. A connected subgraph in the graph is a group of alerts which refers to the same incident. In each subgraph there is at least one node, which does not have any incoming edge (highlighted nodes in the figure). Thus, the number of nodes with no incoming edge (i.e. the initial alert of an incident) gives the upper limit and approximates the number of incidents.
Figure 6-9. Waze alerts represented as a graph. Related alerts are connected and refer to the same incident.
Results and analysis | 47
Among the 13 510 Waze alerts in Stockholm, 4 585 are related to another alert. Among the related alerts, there are 1 811 alerts with no incoming edge (initial alerts). Then we can approximate the number of incidents by adding up the initial alerts and the alerts with no related alerts. 1811 + (13510 − 4585) = 10736, which is the approximated number of the distinct incidents reported through Waze. This method shows, that around 20 % of the alerts refer to an incident which has already been reported. Yet, this number must be taken with reservations. The method for identifying related alerts is not justified. Furthermore, the method assumes that the concentration and frequency of the incidents is relatively low, because it cannot distinguish between two separate incidents happening close in time and space.
Another example of related incidents is presented in Figure 6-10. The alerts are about an accident, happened on the north going side of E4 right south of Stockholm. The alerts were reported very close to each other in time, within two minutes, which is a typical case of overlapped reporting. This can occur when a wazer succeeds to report an incident before a previous report was published in the app. The case of this accident will be followed through the rest of the analysis.
Figure 6-10. A group of related Waze alerts referring to an accident.
Table 6-8. The attributes of the alerts in Figure 6-10.
ID Type Subtype Street Pubdate Enddate A ACCIDENT ACCIDENT_MAJOR E4 / E20 N 17:18:34 17:34
B ACCIDENT ACCIDENT_MINOR E4 / E20 N 17:19:18 17:40
C ACCIDENT ACCIDENT_MINOR E4 / E20 N 17:20:06 17:50
6.4. Traffic jams and inference to the severity of incidents
Prediction of the severity of an incident is a time critical task in traffic management. The advantage, of being notified about an incident through Waze earlier than through the existing sources, is worthless, if the severity of the incident can’t be assessed shortly after its detection. In a fortunate situation, the site of the incident is covered by further traffic monitoring tools which can be used to verify the alert (e.g. traffic cameras). But how can
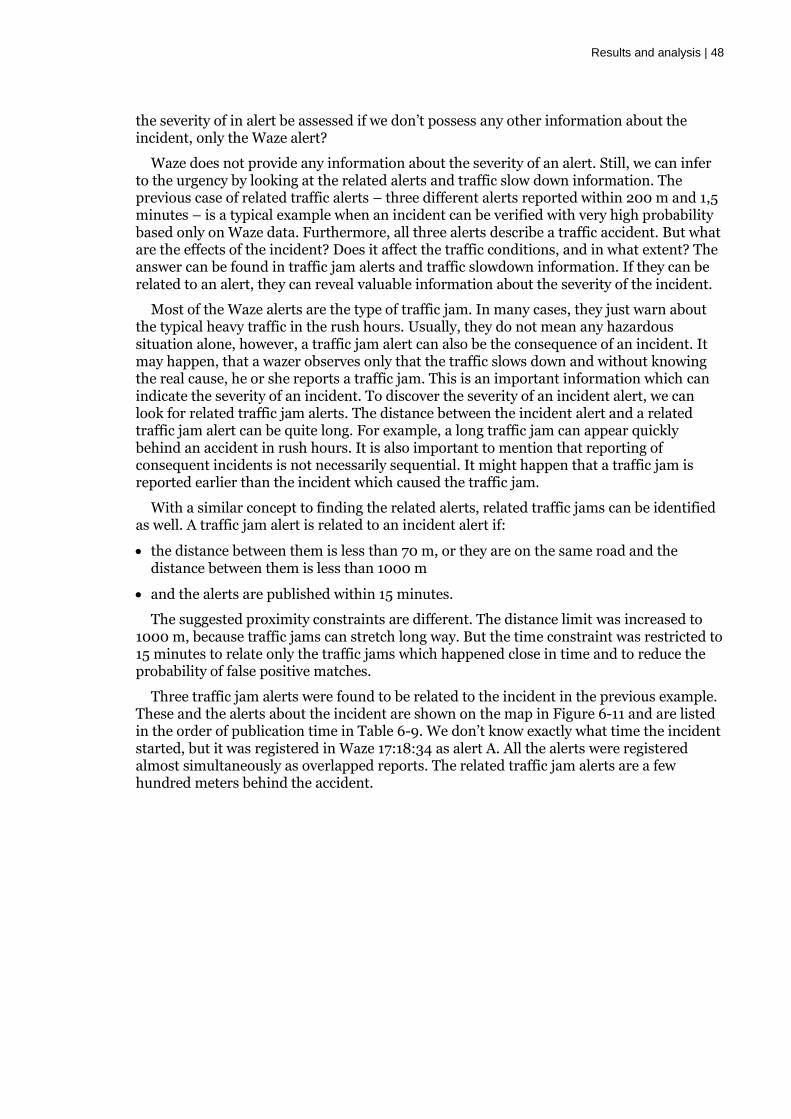
Results and analysis | 48
the severity of in alert be assessed if we don’t possess any other information about the incident, only the Waze alert?
Waze does not provide any information about the severity of an alert. Still, we can infer to the urgency by looking at the related alerts and traffic slow down information. The previous case of related traffic alerts – three different alerts reported within 200 m and 1,5 minutes – is a typical example when an incident can be verified with very high probability based only on Waze data. Furthermore, all three alerts describe a traffic accident. But what are the effects of the incident? Does it affect the traffic conditions, and in what extent? The answer can be found in traffic jam alerts and traffic slowdown information. If they can be related to an alert, they can reveal valuable information about the severity of the incident.
Most of the Waze alerts are the type of traffic jam. In many cases, they just warn about the typical heavy traffic in the rush hours. Usually, they do not mean any hazardous situation alone, however, a traffic jam alert can also be the consequence of an incident. It may happen, that a wazer observes only that the traffic slows down and without knowing the real cause, he or she reports a traffic jam. This is an important information which can indicate the severity of an incident. To discover the severity of an incident alert, we can look for related traffic jam alerts. The distance between the incident alert and a related traffic jam alert can be quite long. For example, a long traffic jam can appear quickly behind an accident in rush hours. It is also important to mention that reporting of consequent incidents is not necessarily sequential. It might happen that a traffic jam is reported earlier than the incident which caused the traffic jam.
With a similar concept to finding the related alerts, related traffic jams can be identified as well. A traffic jam alert is related to an incident alert if:
• the distance between them is less than 70 m, or they are on the same road and the distance between them is less than 1000 m
• and the alerts are published within 15 minutes.
The suggested proximity constraints are different. The distance limit was increased to 1000 m, because traffic jams can stretch long way. But the time constraint was restricted to 15 minutes to relate only the traffic jams which happened close in time and to reduce the probability of false positive matches.
Three traffic jam alerts were found to be related to the incident in the previous example. These and the alerts about the incident are shown on the map in Figure 6-11 and are listed in the order of publication time in Table 6-9. We don’t know exactly what time the incident started, but it was registered in Waze 17:18:34 as alert A. All the alerts were registered almost simultaneously as overlapped reports. The related traffic jam alerts are a few hundred meters behind the accident.
Results and analysis | 49
Figure 6-11. An incident and the related Waze jam alerts and traffic slowdown information.
Table 6-9. Attributes of the incident and jam alerts in Figure 6-11.
ID Type Subtype Street Pubdate Enddate J1 JAM JAM_HEAVY_TRAFFIC E4 / E20 N 17:17:50 17:32 A ACCIDENT ACCIDENT_MAJOR E4 / E20 N 17:18:34 17:34
J2 JAM JAM_HEAVY_TRAFFIC E4 / E20 N 17:18:36 17:36
J3 JAM NULL E4 / E20 N 17:19:10 17:46
B ACCIDENT ACCIDENT_MINOR E4 / E20 N 17:19:18 17:40
C ACCIDENT ACCIDENT_MINOR E4 / E20 N 17:20:06 17:50
In addition to the jam alerts, Waze did also publish an automatically generated traffic jam report (red dashed line on the map) only four minutes after the first alert was reported. It starts at the reported accidents and stretches 883 m backwards along the motorway. Waze also estimates the average speed, delay and the congestion level along the segment. After the accident it is free flow again on the motorway.
Table 6-10. Attributes of the traffic jam report generated by Waze.
Speed Length Delay Level Street Pubdate Enddate
3,67 m/s 883 m 206 4 E4 / E20 N 17:23:00 18:10:00
All these related alerts and traffic jams reflect the impact of the incident and are valuable information for dispatchers when monitoring traffic conditions and ordering measures.
To validate this specific case, we looked for the matching, official incident in the NTIS database. It is presented with the blue rectangle on the map and located little bit less than 500 m behind the Waze alerts. The incident was registered 5 minutes after there was already three alerts and three jams reported in Waze. The source behind the report is unknown, but it reveals some extra information about the circumstances of the accident. Despite the estimated very high severity, the accident was cleaned relatively fast, in 35 minutes.
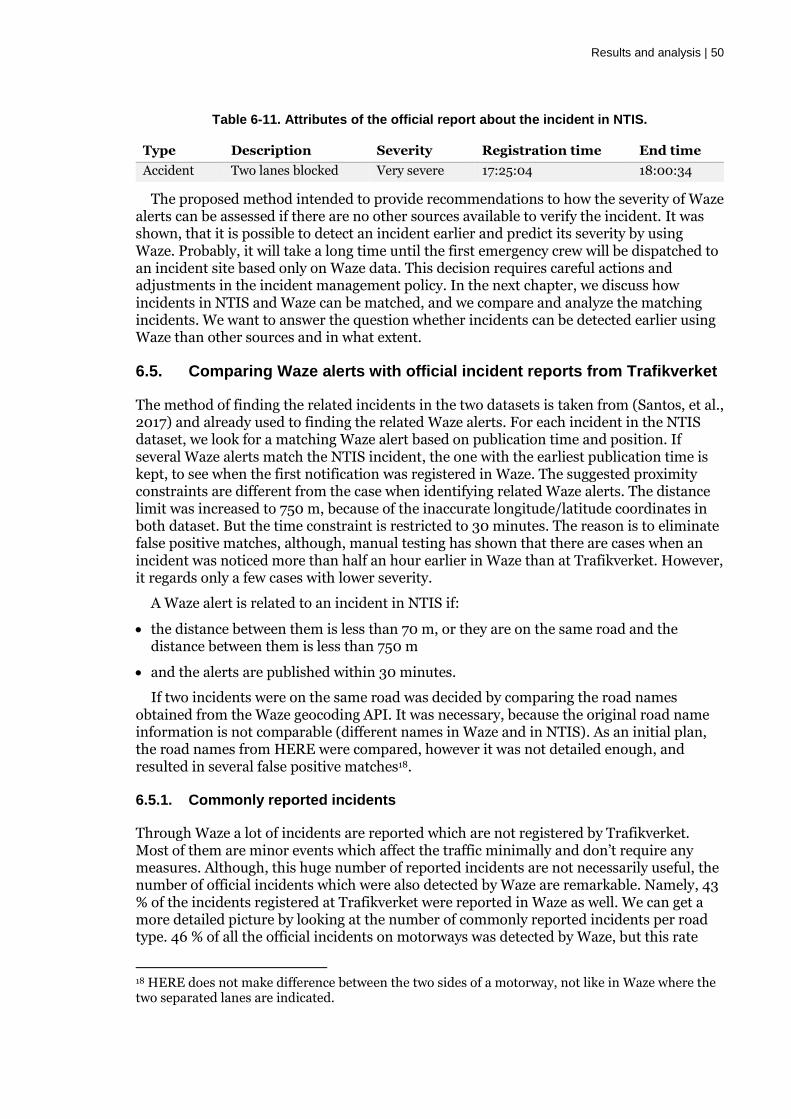
Results and analysis | 50
Table 6-11. Attributes of the official report about the incident in NTIS.
Type Description Severity Registration time End time
Accident Two lanes blocked Very severe 17:25:04 18:00:34
The proposed method intended to provide recommendations to how the severity of Waze alerts can be assessed if there are no other sources available to verify the incident. It was shown, that it is possible to detect an incident earlier and predict its severity by using Waze. Probably, it will take a long time until the first emergency crew will be dispatched to an incident site based only on Waze data. This decision requires careful actions and adjustments in the incident management policy. In the next chapter, we discuss how incidents in NTIS and Waze can be matched, and we compare and analyze the matching incidents. We want to answer the question whether incidents can be detected earlier using Waze than other sources and in what extent.
6.5. Comparing Waze alerts with official incident reports from Trafikverket
The method of finding the related incidents in the two datasets is taken from (Santos, et al., 2017) and already used to finding the related Waze alerts. For each incident in the NTIS dataset, we look for a matching Waze alert based on publication time and position. If several Waze alerts match the NTIS incident, the one with the earliest publication time is kept, to see when the first notification was registered in Waze. The suggested proximity constraints are different from the case when identifying related Waze alerts. The distance limit was increased to 750 m, because of the inaccurate longitude/latitude coordinates in both dataset. But the time constraint is restricted to 30 minutes. The reason is to eliminate false positive matches, although, manual testing has shown that there are cases when an incident was noticed more than half an hour earlier in Waze than at Trafikverket. However, it regards only a few cases with lower severity.
A Waze alert is related to an incident in NTIS if:
• the distance between them is less than 70 m, or they are on the same road and the distance between them is less than 750 m
• and the alerts are published within 30 minutes.
If two incidents were on the same road was decided by comparing the road names obtained from the Waze geocoding API. It was necessary, because the original road name information is not comparable (different names in Waze and in NTIS). As an initial plan, the road names from HERE were compared, however it was not detailed enough, and resulted in several false positive matches18.
6.5.1. Commonly reported incidents
Through Waze a lot of incidents are reported which are not registered by Trafikverket. Most of them are minor events which affect the traffic minimally and don’t require any measures. Although, this huge number of reported incidents are not necessarily useful, the number of official incidents which were also detected by Waze are remarkable. Namely, 43 % of the incidents registered at Trafikverket were reported in Waze as well. We can get a more detailed picture by looking at the number of commonly reported incidents per road type. 46 % of all the official incidents on motorways was detected by Waze, but this rate
18 HERE does not make difference between the two sides of a motorway, not like in Waze where the two separated lanes are indicated.
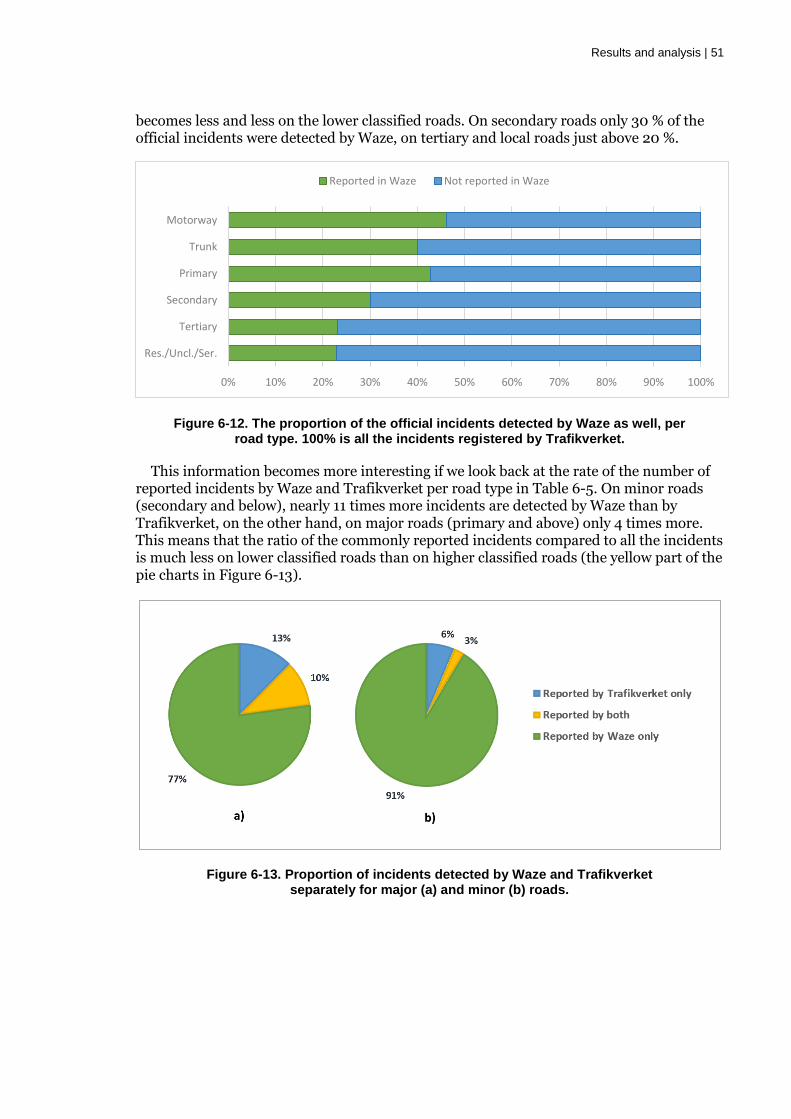
Results and analysis | 51
becomes less and less on the lower classified roads. On secondary roads only 30 % of the official incidents were detected by Waze, on tertiary and local roads just above 20 %.
Figure 6-12. The proportion of the official incidents detected by Waze as well, per road type. 100% is all the incidents registered by Trafikverket.
This information becomes more interesting if we look back at the rate of the number of reported incidents by Waze and Trafikverket per road type in Table 6-5. On minor roads (secondary and below), nearly 11 times more incidents are detected by Waze than by Trafikverket, on the other hand, on major roads (primary and above) only 4 times more. This means that the ratio of the commonly reported incidents compared to all the incidents is much less on lower classified roads than on higher classified roads (the yellow part of the pie charts in Figure 6-13).
Figure 6-13. Proportion of incidents detected by Waze and Trafikverket separately for major (a) and minor (b) roads.
0% 10% 20% 30% 40% 50% 60% 70% 80% 90% 100%
Res./Uncl./Ser.
Tertiary
Secondary
Primary
Trunk
Motorway
Reported in Waze Not reported in Waze
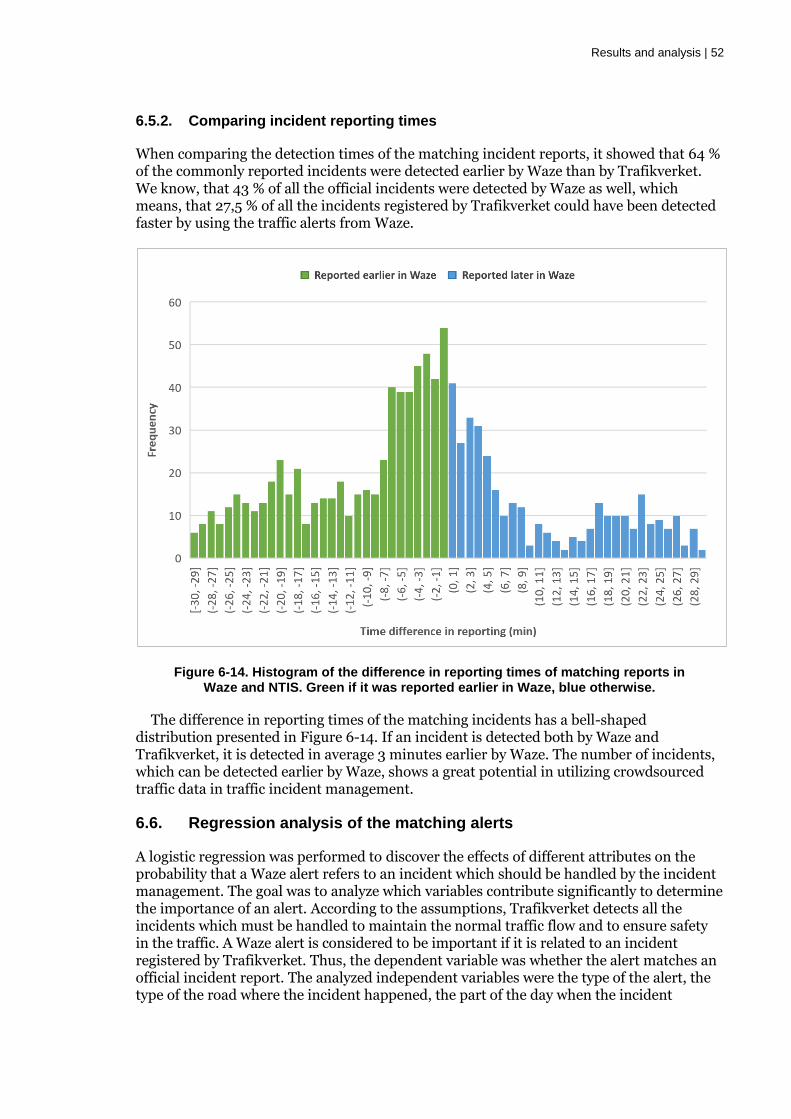
Results and analysis | 52
6.5.2. Comparing incident reporting times
When comparing the detection times of the matching incident reports, it showed that 64 % of the commonly reported incidents were detected earlier by Waze than by Trafikverket. We know, that 43 % of all the official incidents were detected by Waze as well, which means, that 27,5 % of all the incidents registered by Trafikverket could have been detected faster by using the traffic alerts from Waze.
Figure 6-14. Histogram of the difference in reporting times of matching reports in Waze and NTIS. Green if it was reported earlier in Waze, blue otherwise.
The difference in reporting times of the matching incidents has a bell-shaped distribution presented in Figure 6-14. If an incident is detected both by Waze and Trafikverket, it is detected in average 3 minutes earlier by Waze. The number of incidents, which can be detected earlier by Waze, shows a great potential in utilizing crowdsourced traffic data in traffic incident management.
6.6. Regression analysis of the matching alerts
A logistic regression was performed to discover the effects of different attributes on the probability that a Waze alert refers to an incident which should be handled by the incident management. The goal was to analyze which variables contribute significantly to determine the importance of an alert. According to the assumptions, Trafikverket detects all the incidents which must be handled to maintain the normal traffic flow and to ensure safety in the traffic. A Waze alert is considered to be important if it is related to an incident registered by Trafikverket. Thus, the dependent variable was whether the alert matches an official incident report. The analyzed independent variables were the type of the alert, the type of the road where the incident happened, the part of the day when the incident
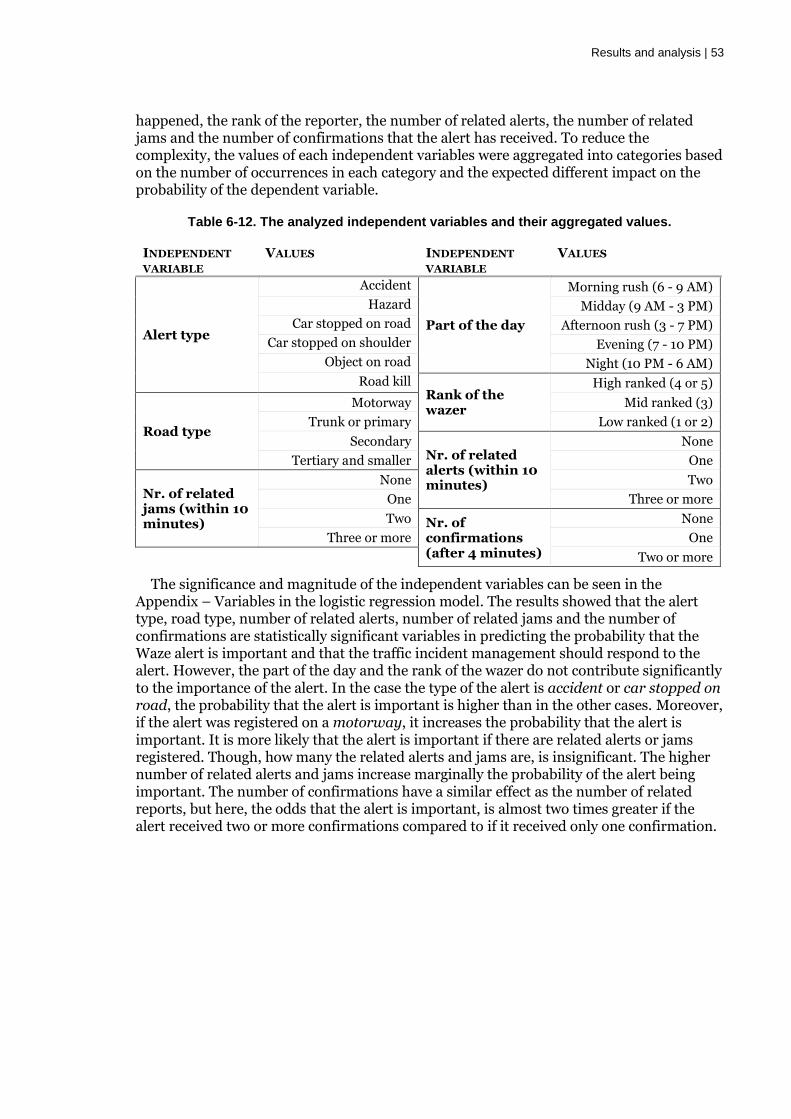
Results and analysis | 53
happened, the rank of the reporter, the number of related alerts, the number of related jams and the number of confirmations that the alert has received. To reduce the complexity, the values of each independent variables were aggregated into categories based on the number of occurrences in each category and the expected different impact on the probability of the dependent variable.
Table 6-12. The analyzed independent variables and their aggregated values.
INDEPENDENT
VARIABLE VALUES INDEPENDENT
VARIABLE VALUES
Alert type
Accident
Part of the day
Morning rush (6 - 9 AM)
Hazard Midday (9 AM - 3 PM)
Car stopped on road Afternoon rush (3 - 7 PM)
Car stopped on shoulder Evening (7 - 10 PM)
Object on road Night (10 PM - 6 AM)
Road kill Rank of the wazer
High ranked (4 or 5)
Road type
Motorway Mid ranked (3)
Trunk or primary Low ranked (1 or 2)
Secondary Nr. of related alerts (within 10 minutes)
None
Tertiary and smaller One
Nr. of related jams (within 10 minutes)
None Two
One Three or more
Two Nr. of confirmations (after 4 minutes)
None
Three or more One
Two or more
The significance and magnitude of the independent variables can be seen in the Appendix – Variables in the logistic regression model. The results showed that the alert type, road type, number of related alerts, number of related jams and the number of confirmations are statistically significant variables in predicting the probability that the Waze alert is important and that the traffic incident management should respond to the alert. However, the part of the day and the rank of the wazer do not contribute significantly to the importance of the alert. In the case the type of the alert is accident or car stopped on road, the probability that the alert is important is higher than in the other cases. Moreover, if the alert was registered on a motorway, it increases the probability that the alert is important. It is more likely that the alert is important if there are related alerts or jams registered. Though, how many the related alerts and jams are, is insignificant. The higher number of related alerts and jams increase marginally the probability of the alert being important. The number of confirmations have a similar effect as the number of related reports, but here, the odds that the alert is important, is almost two times greater if the alert received two or more confirmations compared to if it received only one confirmation.

Results and analysis | 54
Related projects and use cases | 55
7. Related projects and use cases
The Waze Connected Citizens Program is not only a platform for exchanging traffic information. Waze puts focus on sharing the experience and knowledge about the tools and services included in the program. Through the CCP partner forum and summits can community members contact each other and share experience about usage and analysis of Waze data or discuss local projects and case studies. To help Trafikverket to discover further possibilities of the Waze CCP, a couple of potential use cases and international projects were collected from CCP partner forum and from Waze itself19.
7.1. Reducing emergency response times
Genesis Pulse integrated Waze data into its software developed for emergency response centers. The goal was to provide first responders with accident alerts from Waze. Their analysis shows that 40 % of the time, accidents are reported earlier by wazers than received through an emergency call or other channels. In average, the accident alert is received 4,5 minutes earlier. According to the US Federal Communications Commission, an average one-minute faster ambulance response time can save up to 10 thousand lives annually in the US.
7.2. Routing drivers around major construction projects
Miami-Dade Water and Sewer Department (WASD) analyzes Waze data to update their internal construction and maintenance systems and to improve data quality. With the help of Waze notifications, the department has validated and cleaned up the project statuses. Leveraging Waze data, the potential quality issues with internal systems has been highlighted. WASD shares construction information with Waze which helps thousands of drivers to find the best possible routes around the WASD construction projects.
7.3. Communicating major traffic events
Brisa Tollway Authority, Portugal, updates more than 200 virtual messaging signs (VMS) along the highways in Portugal with traffic information. Brisa has worked together with Waze to inform drivers with current travel time data during major traffic events (MTE) such as dignitary visits or major sport events. During the May 2017 papal visit in Lisbon, Brisa worked together with Waze map editors to update closures in real time on the Waze map and provide the most accurate travel time data on its VMSs. The effect of this collaboration was notable. Despite the triple amount of vehicle than usual, there was no congestion or major incident in the highway traffic during the visit of the Pope.
7.4. Integration of open traffic data from multiple sources
2Ways, a Dutch company founded by Jan Spoelstra and Peter van der Veen, has developed a web platform20, to integrate open traffic data in the Netherlands and make it available for the public. Their aim is “to increase the use of open traffic data in the Netherlands, to enrich this data and to develop application possibilities”. They became a partner in the
19 The published Waze CCP case studies: https://www.waze.com/ccp/casestudies 20 https://www.wegstatus.nl/home/

Related projects and use cases | 56
Waze Connected Citizens Program and has been since then the intermediary between Waze and the National Data Warehouse for Traffic Information in the Netherlands21.
7.5. Navigation support for restricted driving zones
Restricted driving zones has been introduced around the world to ease congestion and to reduce air pollution in cities with heavy traffic. In France, a new regulation, called Crit’Air22, restricts vehicle access to city centers based on car emissions, air pollution levels and time/day of the week. Permanent and dynamic (based on pollution level) environmental zones have been set up among others in Paris, Lyon, Grenoble, Strasbourg. To access the restricted zones, the vehicle must have a Crit’Air certificate, otherwise the driver can be fined, or the vehicle can be detained. Waze works together with the French authorities to keep the Waze Map updated with the restrictions and has introduced navigation support to route vehicles around the restricted areas if the vehicle does not have the required certificate. Waze also supports navigation around restricted driving zones, ZTL (Zona a Traffico Limitato), in Italy. (Waze Blog, 2018)
7.6. Collaborative project for processing Waze traffic data
On the initiative of the Office of Civic Innovation Louisville, KY, USA, Waze CCP partners started a project to create an automated solution for Waze data processing. It is an opensource project available on GitHub23 and can be replicated by any CCP Partner. The solution consists of four modules:
• Storing the Waze data feed into a relational database.
• API for integration with other systems.
• A tool for traffic data analysis.
• An interactive map to visualize current and historical traffic data.
7.7. Promoting Waze, increasing the number of users
As for all crowdsourced application, the value of Waze depends highly on the number of users. One can enjoy the benefits of Waze only if there is sufficient number of users who generate traffic information. The more users, the more data are collected which can contribute to having an even more reliable picture about traffic conditions.
The city of Winnipeg, Canada, has encouraged citizens to use Waze through a marketing campaign in social media. As a result, the number of wazers has doubled in Winnipeg. The increased amount of traffic data from Waze in combination with the data from the existing sources has helped the traffic management to reduce incident response times significantly.
The Center of Budapest Transport became a Waze CCP partner already in 2014 and has published traffic information in the app since then. Their collaboration with Waze was announced in the news and on social media which resulted in a huge expansion in the number of Waze users. Stockholm and Budapest have approximately the same number of inhabitants, but according to the website wazestats.com, there are in average 20 000 active daily users of Waze in Budapest compared to 4000 in Stockholm.
21 http://www.ndw.nu/en/ 22 https://www.crit-air.fr/en/ 23 https://github.com/LouisvilleMetro/WazeCCPProcessor
Discussion | 57
8. Discussion
This thesis investigated the possibilities and challenges of utilizing spatial crowdsourcing technologies in traffic incident management. In form of a case study, crowdsourced traffic information obtained from Waze was analyzed and compared with the existing traffic information in Stockholm. In the following chapter, the insights gained during the project are summarized with the aim to present the potential benefits of Waze data in incident traffic management. At last, recommendation for further research and development is presented.
8.1. Insights
The case study of the analysis of Waze data in Stockholm demonstrated the benefits of crowdsourced traffic information in traffic management. The data obtained from Waze is very rich and gives a detailed picture about the traffic conditions. The number of reported incidents in Waze is 4,5 times higher than what Trafikverket detects and registers through the existing data sources. However, a majority of the Waze alerts concern incidents which have such a low effect on the traffic that no response is needed from the traffic incident management. On the other hand, 43 % of all the official incidents were detected by Waze as well. Furthermore, 27,5 % of the incidents registered by Trafikverket could have been detected faster by using the traffic alerts from Waze. This shows, that through Waze not only additional incidents can be detected, but the utilization of Waze in incident management can lead to faster incident response.
Severity assessment of incidents is a crucial task in traffic incident management. Before any measures can be ordered to handle an incident reported in Waze, the alert need to be verified. In an optimal scenario, the site of the incident is covered by other traffic monitoring tools which can be used to verify the alert (e.g. traffic cameras). If there is no other information available, the probability, that the alert need to be handled by the incident management, can be predicted from the combination of different attributes of the alert. According to the conducted logistic regression, the alert type, road type, number of related alerts, number of related jams and the number of confirmations are the significant variables which can be used to decide if the alert should be handled or not. For example, the probability that an incident reported through Waze is severe and need to be taken care of is high, if the Waze alert regards an accident on a motorway, it has received two or more confirmations and there are related jams and alerts registered.
All participants in transportation can benefit from exchanging traffic information with each other. The Waze Connected Citizens Program is a great example of how collaboration between transportation agencies and service providers can improve traffic management. However, the optimal solution would be a platform, through which transportation agencies could exchange traffic information with all the other participants. One of the main technical issues is, how the data from different sources can be integrated. The case study demonstrated the problems of data exchange and integration between Waze and Trafikverket. Even though Trafikverket opened up its data, Waze digests the information only about traffic messages and ignores accidents and road constructions. Furthermore, approximately 15 % of the traffic messages from Trafikverket are failed to be published in Waze because of unsuccessful localization of the incidents or missing obligatory attributes. This shows, how important an active collaboration in data integration would be between service providers and transportation agencies.
Discussion | 58
8.2. Recommendations
This thesis was limited to the evaluation of crowdsourced traffic data obtained from Waze in Stockholm. There are other interesting sources of traffic information (e.g. Twitter) which could be analyzed ((Georgiou, et al., 2015); (Qian, 2016); (Xu, et al., 2018)). Furthermore, the presented results are valid only for the study area, Stockholm. Analyzing the benefits of utilizing incident reports from Waze in other parts of Sweden (especially the country side) would complement this thesis well.
The evaluation of the model of identifying the related incident reports was not part of this thesis. This analysis would require a control dataset, which was not available at the time of the analysis. The chosen model, based on (Santos, et al., 2017), uses two attributes to detect related reports: proximity in space and time. Additional variables can be given to the model to make an even more accurate prediction of related incident reports. A suggestion for additional variables are: type of the road, type of the incident. Recommendation for future research is the calibration of the chosen proximity limits of related alerts (both in space and time). Their dependency on other factors needs to be investigated. These modifying factors can be the accuracy of the location description of an incident and the density of the road network.
Trafikverket has been a Waze CCP partner since 2017. Apart from collecting traffic data from Waze, no other possibilities of the program have been exploited yet. The related projects and use cases, mentioned earlier in chapter 0, have already given ideas for further development. But based on the experiences gained in this thesis, the following actions are recommended for Trafikverket to derive the identified benefits of Waze CCP partnership.
8.2.1. Processing traffic data from Waze
The data received from Waze can be beneficial in several use cases. Regardless of what the data is going to be used for, the first task is to develop and drift a solution for processing the Waze data feed. It includes:
• The process of downloading and storing Waze alerts, and traffic slow down information in an efficient data structure.
• An interface which allows to export the data and integrate it with other systems.
These required tasks are the same for every CCP partner, which was the motivation for starting the global collaborative project, mentioned in chapter 7.6, for processing Waze traffic data.
If a use case requires the access to Waze data in real time, minimizing the latency of the Waze alert being consumable for other systems is crucial. The updating frequency of the georss data feed at Waze is two minutes. If the downloading process is not synchronized with the update of the data feed, it can cause up to two minutes delay.
This thesis focused on providing insight to how Waze data can be utilized in traffic incident management. One important task is to filter out the irrelevant alerts before visualizing it. Otherwise, the important information would get lost in the large amount of available data. Furthermore, the integration with incident reports from other data sources is also very important.
But the available data from Waze contains a lot more information than what was examined during this project. Waze alerts about issues in the transport infrastructure, such as pot holes, missing road signs or traffic light faults, can be valuable input for planning infrastructure maintenance.
Discussion | 59
8.2.2. Controlled data sharing with Waze
Trafikverket keeps track of the incidents detected through the existing sources. The status of the incident is then published and updated in the Datex II channel. However, the example, how Waze consumes the Datex II channel shows, there is no guarantee that the traffic information will reach the drivers. Waze copies incident reports from Datex II, but with what frequency, how the attributes are translated and how updates of incidents are handled, cannot be influenced.
The biggest benefit of sharing traffic information with Waze is the opportunity of directed communication of incidents to drivers so that they can recalculate their route which will lead to reduced traffic congestion. It is Trafikverket’s interest that drivers are provided with correct and real time traffic information. By being an active member of the Waze CCP program there is the opportunity of controlled and automatized data sharing through the Waze API. Trafikverket could control when and how long an incident would be published, what information about an incident would be available, and how updates of an incident would be handled.
If Trafikverket decides to actively share data with Waze, the cooperation with the Waze community is recommended. Their experience in the Waze data structure and incident reporting tools can be very useful. In addition, to reach even more drivers through the Waze application, an announcement of the collaboration with Waze can boost the number of Waze users significantly, as it happened in other cities (see chapter 7.7).

Discussion | 60
References | 61
References
Ali, K., Al-Yaseen, D., Ejaz, A., Javed, T., & Hassanein, H. (2012). CrowdITS: Crowdsourcing in
intelligent transportation systems. 2012 IEEE Wireless Communications and Networking
Conference (WCNC), (pp. 3307-3311). Shanghai.
Anastasopoulos, P. C., Shankar, V. N., & Haddock, J. N. (2012). A multivariate tobit analysis of
highway accident-injury-severity rates. Accident Analysis and Prevention, 110-119.
Chung, Y. (2010). Development of an accident duration prediction model on the Korean Freeway
Systems. Accident Analysis and Prevention, 282-289.
Duer, G., Ni, S., & Provost, D. (2018, May 1). Automobile Collision Prediction in Louisville, KY.
Retrieved from https://gduer.github.io/Collision-Prediction-in-Louisville-KY/
Georgiou, T., Abbadi, A. E., Yan, X., & George, J. (2015). Mining complaints for traffic-jam
estimation: A social sensor application. 2015 IEEE/ACM International Conference on
Advances in Social Networks Analysis and Mining (ASONAM), (p. 330/335). Paris.
Hendrix, S. (2016, June 5). Traffic-weary homeowners and Waze are at war, again. Guess who’s
winning? Retrieved from The Washington Post:
https://www.washingtonpost.com/local/traffic-weary-homeowners-and-waze-are-at-war-
again-guess-whos-winning/2016/06/05/c466df46-299d-11e6-b989-
4e5479715b54_story.html
Jeske, T. (2013). Floating Car Data from Smartphones: What Google and Waze Know About You
and How Hackers Can Control Traffic. Hamburg, Germany: Institute for Security in
Distributed Applications, Hamburg University of Technology.
Leduc, G. (2008). Road traffic data: Collection methods and applications. JRC Technical Notes,
Working Papers on Energy, Transport and Climate Change.
Leonard, D. L. (2017). Incident Traffic Management Respone. Walden University.
Liu, X., Chien, S., & Kim, K. (2012). Evaluation of floating car technologies for travel time
estimation. Journal of Modern Transportation, 49-56.
Qian, Z. (. (2016). Real-time Incident Detection Using Social Media Data. Pennsylvania Department
of Transportation.
Roopa, T., Iyer, A., & Rangaswamy, S. (2013). CroTIS-Crowdsourcing Based Traffic Information
System. IEEE International Congress on Big Data, (p. 271/277). Santa Clara, CA.
Rudmark, D., & Arnestrand, E. (2018). Samarbeten för förbättrad trafikinformation. Trafikverket,
RISE Viktoria.
S. S. Ribeiro, J. C. (2012). Traffic observatory: A system to detect and locate traffic events and
conditions using twitter. Proceedings of the 5th ACM SIGSPATIAL International Workshop
on Location-Based Social Networks.
Salamanis, A., Drosou, A., & Michalopoulos, D. (2016). A probabilistic framework for the reliability
assessment. Transportation Research Procedia, 4552-4561.
References | 62
Santos, S., Davis Jr., C. A., & Smarzaro, R. (2017). Analyzing Traffic Accidents based on the
Integration of Official and Crowdsourced Data. Journal of Information and Data
Management, 67-82.
Silva, T. H., Vaz de Melo, P., & Viana, A. C. (2013). Traffic Condition Is More Than Colored Lines on
a Map: Characterization of Waze Alerts. International Conference on Social Informatics.
Steenbruggen, J., Kusters, M., & Broekhuizen, G. (2012). Best Practice in European Traffic Incident
Management. Procedia - Social and Behavioral Sciences, 297-310.
Tong, Y., Chen, L., & Shahabi, C. (2017). Spatial Crowdsourcing: Challenges, Techniques, and
Applications. Proceedings of the VLDB Endowment.
Trafik Stockholm. (2018). Retrieved from http://www.trafikstockholm.com/
Trafikverket. (2018). Retrieved from https://www.trafikverket.se/
Waze Blog. (2018, April). Retrieved from https://blog.waze.com/2018/04/driving-smarter-and-
greener-with-waze.html
Waze Connected Citizens Program. (2018). Retrieved from https://www.waze.com/ccp
Weil, R., Wotton, J., & Garcia-Ortiz, A. (1998). Traffic incident detection: Sensors and Algorithms.
Mathematical and Computer Modelling vol. 27, 257-291.
Xu, S., Li, S., & Wen, R. (2018). Sensing and detecting traffic events using geosocial media data: A
review. Computers, Environment and Urban Systems.
Yahav, E., Sinai, M. B., Partush, N., & Yadid, S. (2014). Exploiting Social Navigation.
arXiv:1410.0151v1 [cs.CR].
Yu, X., & Prevedouros, P. (2013). Performance and Challenges in Utilizing Non-Intrusive Sensors for
Traffic Data Collection. Advances in Remote Sensing, 45-50.
Zong, F., Zhang, H., Xu, H., Zhu, X., & Wang, L. (2013). Predicting Severity and Duration of Road
Traffic Accident. Mathematical Problems in Engineering.
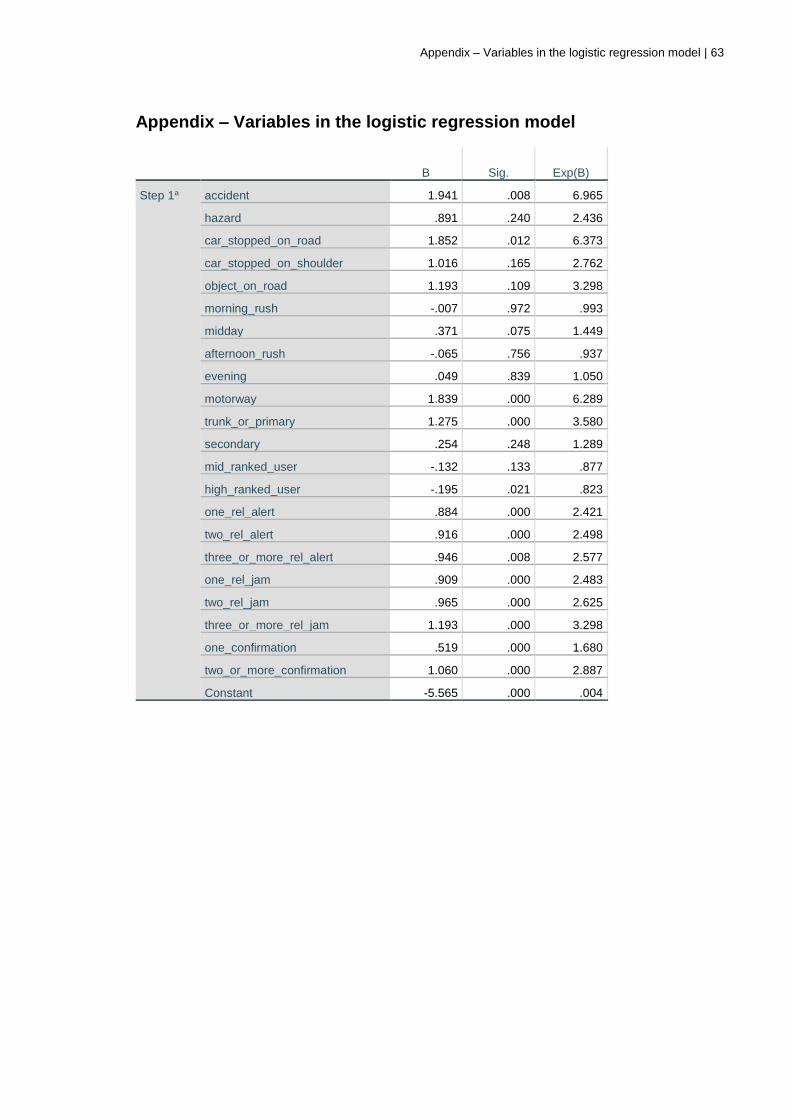
Appendix – Variables in the logistic regression model | 63
Appendix – Variables in the logistic regression model
B Sig. Exp(B)
Step 1a accident 1.941 .008 6.965
hazard .891 .240 2.436
car_stopped_on_road 1.852 .012 6.373
car_stopped_on_shoulder 1.016 .165 2.762
object_on_road 1.193 .109 3.298
morning_rush -.007 .972 .993
midday .371 .075 1.449
afternoon_rush -.065 .756 .937
evening .049 .839 1.050
motorway 1.839 .000 6.289
trunk_or_primary 1.275 .000 3.580
secondary .254 .248 1.289
mid_ranked_user -.132 .133 .877
high_ranked_user -.195 .021 .823
one_rel_alert .884 .000 2.421
two_rel_alert .916 .000 2.498
three_or_more_rel_alert .946 .008 2.577
one_rel_jam .909 .000 2.483
two_rel_jam .965 .000 2.625
three_or_more_rel_jam 1.193 .000 3.298
one_confirmation .519 .000 1.680
two_or_more_confirmation 1.060 .000 2.887
Constant -5.565 .000 .004