Bachelors Thesis - DIVA
55
A real time ECG warning system on Myocardial Infarction, Hyperkalemia and Atrioventricular Block Bachelors Thesis Spring 2015 School of Health and Society Department Design and Computer Science Writer Ibrahim RahamathUllah Asfaqul Islam Supervisor Diana Saplacan Examiner Eric Chen
-
Upload
khangminh22 -
Category
Documents
-
view
6 -
download
0
Transcript of Bachelors Thesis - DIVA

A real time ECG warning system on Myocardial Infarction, Hyperkalemia and Atrioventricular Block
Bachelors Thesis Spring 2015
School of Health and Society Department Design and Computer Science
Writer
Ibrahim RahamathUllah Asfaqul Islam
Supervisor
Diana Saplacan
Examiner Eric Chen

ii
School of Health and Society Department Design and Computer Science Kristianstad University SE-291 88 Kristianstad Sweden
Author, Program and Year:
Ibrahim RahamathUllah and Asfaqul Islam, Software Development 2015
Instructor: Diana Saplacan
Examination:
This graduation work on 15 higher educations credits is a part of the requirements for a Degree of Bachelor of Science (180 credits) in software development and computer science (as specified in the English translation).
Title: A real time ECG warning system on Myocardial Infarction, Hyperkalemia and AtrioventricularBlock.
Abstract:
ECG warning system is established for real time monitoring of a patients electrocardiogram (ECG) and automatic detection of certain cardiac diseases, namely myocardial infarction, hyperkalemia and atrioventricular block. A distinctive research work related on assimilation of modern technologies: software, computer and information technologies. ECG early warning system’s algorithm is developed in accordance to measuring the average of the ECG signatures and interprets the data with simulated healthy curve. The prototype system initially classifies the data and evaluated it with natural healthy simulated curve. Meanwhile the system discards if healthy curve exists otherwise the system stores distinguished abnormalities in the curve then transfers warning to the doctor and patient. Cardiac patients can be assisted by this warning system by detecting the abnormalities at very early stage. Consequently, provide doctors better tools to identify cardiac diseases resulting more accurate medical advice.
Language: English
Approved by:
_____________________________________
Eric Chen Date
Examiner

iii
Table of Contents
Document page...………………………...…….…….……………………..………………………….. i
Abstract…...……………………...………………………………………….…………………………ii
Table of contents ......…..……………….……………………………………………………………. iii
List of Figures..……………..…….…………………………………………………………...…...…..v
List of Tables……...……...……………….………….………………………………………………..vi
1. Introduction..……..….………….………………………….………………………………………01
1.1 Background .….….…………….……………………………………………………………………..…...01
1.1.1 Related work and Research Motivation…..........…..……………………………….………....01
1.2 Aims and Purpose…………….……...…….…………………………………………………...…………02
1.3 Research Questions and Limitations..….…........……………………...…………………………………..03
1.3.1 Limitations. ………….….…………………………………………………………………….03
1.4 Methods and Resources…….....…………..……...………………….……………………………………03
2. Systematic Literature Review (SLR) ...……..…….……….………...……………………...……04
2.1 Formation of the SLR...……..…………...….………….…………….…………………………………. .04
2.2 Steps of Review Protocol……………..………………………………………………………………..…04
2.2.1 Literature Search Strategy………….………………………………………………………….04
2.2.2 Selection Criteria…………….……..………………………………………………………..…06
2.3 Extraction Strategy…………………………………………………….………………………………....06
2.4 Conducting the Systematic Literature Review……….…….…............………………………………….06
2.5 Critical Review. .…………………………………...………………….……………….…………...……07
2.6 Systematic Literature Results…..…………….………….…………….………….………………………08
2.7 Overview of the Primary Studies….…...........……………………………...…………………………….09
3.Theory..………………..…...……...………………………………………………………………..11
3.1 Fundamentals of ECG ………………...…….…………………………………………………………....11
3.2 ECG Signal Monitoring…….…………..………………………………………………………………...11
3.2.1 P Wave………..……………………..…………………………………………………………12
3.2.2 PR Interval .…..……...………………..………………………………………………………..12
3.2.3The Q Wave…….………………………………………………………………………………...12
3.2.4 ST Segment………………………………………………………………………………………12

iv
3.2.5 T Wave……………………….………………………………………………………………...12
3.2.6 QRS Wave Complex. …………………………………………………………………………..12
4. Method ...………………………………………………………………………….………………..13 4.1 Simulated Data collection. ……..........………...…………………………………………………………13
4.2 Experiment………..………………………………………………………………………………………14
5. Analysis..…………………………….……………………………………………..……...………..15
5.1 Simulating the Abnormalities of Hyperkalemia………………….….………………….………………...15
5.1.1 Effects of Hyperkalemia in the ECG…………........….………………………………………15
5.2 Simulating the Abnormalities of Myocardial Infarction…………….…….……….....…………………..16
5.2.1 Effects of Myocardial Infarction…………….……..….…..…………………………………..16
5.3 Simulating the Abnormalities 3rdAVB….……………….………….…………………………………….17
5.3.1 Studies on Different Atrioventricular Block…….………....…….……………………………..17
5.3.2 First-Degree AtrioventricularBlock …….……….……..…........………………………………17
5.3.3 Second-Degree Atrioventricular Block……………..…...……….……………………………..17
5.3.4 Third-Degree Atrioventricular Block…….………...…..……….………………………………17
6. Results..…………………………………..………………………………………………..……….……19
6.1 Detecting Anomaly in Hyperkalemia…………………….…………….….……………….….…………19
6.2 Detecting Anomaly in Myocardial Infarction..……………..………….………………..…….….……....19
6.3 Detecting Anomaly in Third-Degree Heart Block .…………….....……...…………………….….……..20
6.4 Algorithm and Prototype system design..……………………..………………………………………….20
6.4.1 Application Design…………..……..…………………………………………………………….22
6.4.2 Implementing Warning System……………..……………………………………………………..23
6.4.3 Application Testing and Evaluation….……..…………….……….................................................24
6.4.4 Algorithm Evaluation.………………….…….................................................................................26
6.5 Comparing ECG Warning system with other technologies……………...………………………………26
7. Discussions and Conclusion..…...……...........….……….………………..…………………….....28
8. Suggestions for further work………….……….….…………………….…………......…………29
9. References……….…………………….…...……….……..…………….…………………………30
10. Appendices and enclosures….......….……..………………..………. ….……………………….35

v
List of Figures
Figure 1 ECG Warning System architecture..…………….…………………………………..….… ...02
Figure 2Steps of SLR instruction. ……..……………………………….…….….….…..….…………04
Figure 3Primary studies selection process…..…….…………………………..……………...……......07
Figure 4The distribution of. …paper appendixes….…….……………………..………....…..…..…...10
Figure 5A cardiac cycle……….……………...………….………………………..…………………...11
Figure 6Simulated ECG curve in matlab...……………….…………….……………………..…..…...13
Figure 7Standard curve during simulation……..….……………………………………...…..……… 14Figure 8aSerial ECG changes in hyperkalemia. ………………………………………….…..……….15
Figure 8bSimulated curve affected by hyperkalemia.……………..…………………………………..15
Figure 9aEffects on MI…………..…………..………………………...……………………………....16
Figure 9b Simulated curve affected by MI…………..………………….…..…………………….......……16
Figure 10a3rdDegreeAtrioventricular block……...….…………………..……….…………………… 18
Figure 10bSimulated curve affected by 3rd degreeAVB……….…………………………..…………..18
Figure 11 Application design steps in accordance to algorithm………………...…….…….....………21
Figure 12 Case diagram of application design ……….……………………….………………………22
Figure 13 Illustrates doctors view with more detailed graphical representation………………………22
Figure 14 Illustrates patients view with more detailed graphical representation………………….…..23

vi
List of Tables
Table 1- Literature search keywords. ……………………………………….……..…………...……..05
Table 2- Query keywords Table..…….…..……………………………………………..……...……...05
Table 3 - Different Scientific Databases for Searching Keywords…………….…..…………………..06
Table 4-Percentage of potassium level in blood..…………………..………….…..…………………..15
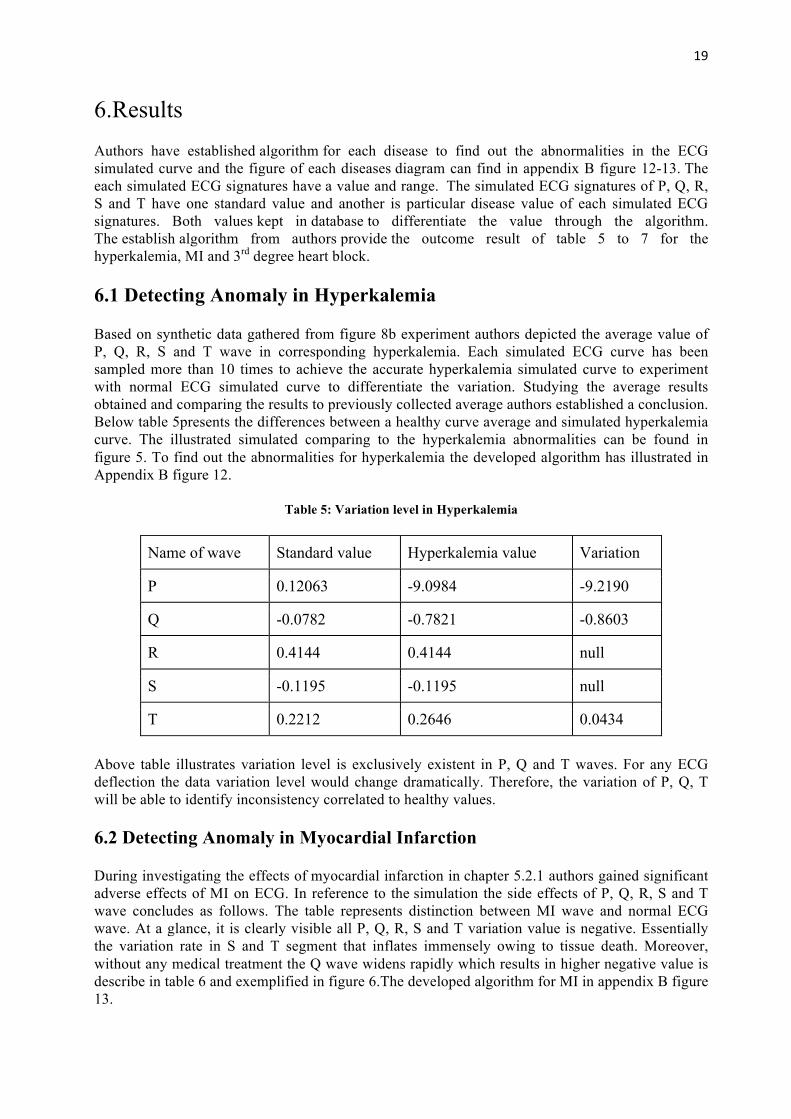
Table 5-Variation level in Hyperkalemia……………………..……………….….……….…………..19
Table 6- Variation level in Myocardial Infarction…….…………….…..………..……..……………..20
Table 7- Variation level in Third Degree Heart Block………………….……….………….…..…......20
Table 8- Black box testing of the server function and outcome ………………………………………24
Table 9: Black box testing of the client/source application function and outcome ………...…………25
Table 10: Black box testing of the node function and outcome ………………………………………25
Table 11: Black box testing of the user function and outcome……………………………..…………25
Table 12: Troubleshooting Log Table……………………………………………………..………….26

1
1. Introduction In the era of 21st century, technology has developed remarkably in human life without it human cannot live a single day and promisingly it is making life more accessible day by day. ECG early warning system comes to light for meet public health, medical informatics referring to health services and information delivered or enhanced through the internet and related technologies. The concept of ECG warning is proposed using wireless access to link patients with doctors with ECG data. Data acquisition methods have been developed for the past decades to accurately sense, collect, record, and analyze the patients’ physical condition [1]. Nenad Stojanovic, Yongchun Xu, Aleksandar Stojadinovic, Ljiljana Stojanovic have defined remote monitoring as “Remote person monitoring is an ever more expanding application area, dealing with the possibility to remotely track “relevant” status of a person in real-time and monitor his/her status in a longer period. It is very common approach in healthcare domain (remote patient monitoring), as some vital parameters of the patient should tracked and thereafter analyzed for finding some types of anomalies. For example, the ECG signal of a patient is possible to analyze on different types of arrhythmia, enabling useful detection of cardio-problems. Consequently, there are many commercially available solutions, consisting of different wearable sensors/devices connected to a smart phone, providing different analyses of the uploaded data on the server (cloud)” [2]. The distinctive output from an ECG signal (i.e., heartbeat rates, morphology, dynamic behaviors) can analyze to determine heart diseases such as hyperkalemia, myocardial infarction and arrhythmia. An ECG telemonitoring system supports patients from avoiding frequent visit at hospitals and allows the continuous and ubiquitous monitoring of ECG patients [3]. The electrocardiographs visualized to detecting automatic abnormalities in various ECG curves through authorization of detected signals to store data and presenting warning through estimated cardiovascular signals [4]. A wide range of wireless health care services is providing various type of remote monitoring diagnosis to the patient. At the present time these services evolved tremendously that it is not only restricted to give services for the cognitive and physical disabilities patients but also it can also maintain high-quality services for the newborn and young children [5]. ECG pattern recognition is useful to architect an early warning system with three major heart diseases myocardial infraction (heart attack), hyperkalemia and atrioventricular block (heart block). Abnormal serum concentrations of potassium and calcium can produce marked effects on the ECG known as hyperkalemia. Therefore, the academic work investigation and analysis consist with related diseases and how to establish a real-time ECG warning system prototype software. In order to accomplish the task authors conducted systematic literature review, analysis and experiment procedure to complete the task. The acquired analyze results is examine and will be useful for further study. 1.1Background 1.1.1 Related Work and Research Motivation A cloud-based ECG analysis system evolved to present the data in more accessible and efficiently to patients. The cloud system can accumulate the ECG data from devices and send it remote servers for analysis. A sample work establishes for validation. However, a substantial amount of restriction yet not resolved to establish cloud system in practical accurate use. One of the main tasks is to collect the ECG data from the device [6]. Sometimes the ECG data is not interpretable because of misplacement of the electrode. It affects many functional and non-functional sources [7]. Another technique for representation of electrocardiograph, how to identify automatically irregularities in several ECG areas among the accumulated data and produces warnings after dignified

2
cardiovascular frequencies rate is out of the range [4]. The techniques of remote heart monitoring system presented as “On-site” and other is “Off-site”. In on-site monitoring, the patient obtained heart signal can process without sending to remote site. On the other hand in off-site, the gained heart signal have to transfer to a remote site through wireless or GSM [8]. An assimilative ECG health care system is quite unique from other ECG medical equipment as a result of the purpose is movable remote monitoring. Throughout the assimilation, it can offer the patients a real-time remote monitoring analysis concerning the obtain accumulated ECG data. The cohesive transferable system can transfer the data wirelessly [9]. A non-disturbing lightweight ECG monitoring system is very useful for the heart patients. A portable leads are set on the body to monitor the ECG data remotely which are very convenient to use for the patients [7]. Remote monitoring has focused on individual person: a monitored person is equipped (wears) with a sensor that transmits data to the person’s smartphone for storage, local (simple) analysis and uploading on the server, where the data can be visualized and analyzed on the request in off-line mode [2]. The writers in the paper included as a “The human electrocardiogram (ECG) exhibits unique patterns that can be used to discriminate individuals. However, perturbation of the ECG signal due to physical activity is a major obstacle in applying the technology in real-world situations” [10]. ECG signals provide us significant evidence about heart and various heart abnormalities such as coronary artery disease, myocardial infarction and hypertension and can be identified by ECG report [12]. Identifying and interpreting of ECG signals precisely will increase the success rate of heart disease diagnosis.
1.2 Aims and Purpose The objective of this research work is to investigate how to depict ECG signals in digital signatures, examine the signatures for inconsistency and deliver corresponding evaluated results as alerts to end authorities. Accordingly, data from 3-Lead ECG device inspect on the server and interpret data could be used to predict medical condition that will aid doctors and hospitals for better patient treatment (simulated event for this research). Figure 1 presents an example of ECG warning system architecture in real life, which receives ECG data through ECG portable device and transfer the ECG data by Bluetooth to a mobile device.
Figure 1: ECG warning system architecture.
Afterwards, mobile device dispatch corresponding data via Wi-Fi or GSM to the server for future storage and analysis. The server scans the results to detect anomalies to the specific person if any critical condition exists. To perform the research authors have experimented with ECGSYN data model by PhysioNet’s. The ECGSYN model provides advanced synthetic data for test and simulation purposes. Additionally, a working prototype will simulate achieved results to spawn alerts in real life context.

3
1.3 Research Questions and Limitations RQ1. How to achieve pattern matching analysis of ECG signal in real time for detection of rapid life threatening heart diseases?
RQ2. How to identify abnormalities on ECG wave curve that are difficult to distinguish on day-to-day diagnostic procedures? RQ3. How to design a warning system to register and analyze rapid, durable disturbances for predictions?
1.3.1 Limitations
Conductive to this research work certain constraints confronted which influenced the research process. Firstly, ECGSYN database chosen for the data collection, experiment process has certain fundamental limits. ECGSYN data model is based on 3-lead ECG data, which is commonly found on wireless portable devices. Wireless portable devices are not as accurate in contrast to 12-lead ECG generally used by physicians in hospitals. 12-lead ECG devices provide more authentic detailed ECG wave curves whereas 3-lead device only contributes to few ECG wave curves. Consequently, the overall study is restricted to 3-lead ECG device abnormality detection. During the simulation and experiment authors opposed to performing certain wave signature deviation to present in myocardial infarction and 3rd-degree heart block. As a substitute authors experimented with existing ECGSYN data resulting in atypical ECG curve, which marginally impairs the authenticity of research. Secondly, diseases namely hyperkalemia, myocardial infarction and 3rd-degree heart block has distinctive ECG signatures depending on human and environmental factors. Correspondingly, determining a standard curve related to the subject is exceptionally challenging. The ECGSYN data models standard value is only satisfactory for simulation intent. In real world applying this standard curve value for all subject will be defective.
Thirdly, each simulated curve evaluates and compares to identify irregularity on respective to the average value which fluctuates on various occasions. Moreover, myocardial infarction and third block’s ECG wave variation is remarkably approximate which increases the complexity of the diagnosis. Finally, during simulation authors exclusively investigated 3rd-degree heart block ECG signatures. 1st and 2nd-degree heart block detection was not implemented despite time constraints.
1.4 Methods and Resources
To achieve the aim of the research questions and finalize the research work the following methods and resources are used: simulated data collection and experiment. There are several classifications on conducting research such as: case study, experiment, literature review, and implementation. Method for a research project does not fit all the purpose because it varies from different research [13][14]. Systematic literature review, theory, data collection, experiment and analysis of the data conducted to achieve expected outcome of the academic work. To implement scientific research is obvious to do systematic literature work, which will assist to provide a specific knowledge regarding the topic. The articles were chosen from different scientific databases. Different simulated data and resources gathered from different articles were used to execute the RQ1, RQ2 and RQ3. The result and analysis data will be used for the prototype warning system of the research work.

4
2. Systematic Literature Review (SLR)
2.1 Formation of the SLR
This academic work consisted with adequate analysis and study through co-related articles where authors examined the related research work according to the topic. Collecting a number of articles from online and books yet the consistent keywords help to search for the potential subjects. A SLR has several steps, which are essential to implement the task. Planning is the foremost task, which will ensure how to accomplish the research work. Instruction of SLR consists of search string, identifying relevant literature, selection of studies, primary studies, data extraction, assessment critical review, results of SLR and overview of the primary studies. The SLR instruction needs to follow for the establishment of work and figure 2 describe the steps that authors have applied to carry out the academic writing.
Figure 2: Steps of SLR instruction
2.2 Steps of Review Protocol
2.2.1 Literature Search Strategy To make an efficient search it is essential to increase different libraries database knowledge on related articles. Gaining knowledge about the shortcuts and actions will improve time efficiency during queries. Some important characteristics which element truncates words, how to search for phrase, and how the boolean operators used. The searching methods differentiate from a database to database and mostly have an advanced search function too. Basic searches, advanced searches, control vocabulary and other features are consisting of distinguishing qualities for usual search. To conduct the literature search, strategy keywords are categories into three group i.e. category A, category B and category C. Each category has classified into individual topic whereas Category A related to mobile and ECG remote monitoring, category B has associated with ECG signal interpretation and last but foremost category C correlated with diseases. The category keywords described in table 1.
1.Descriptionofresearchquestion
2.Setupkeywordsandsearchstringforsearching
3.Inclusiveandexclusivecriteria
4.Searchingindatabasewithkeywords
5.Dataextractionstrategy
6.Exclusionontitleandabstract
7.Exclusiononintroductionandconclusion
8.Exclusiononfullarticles 9.Dataanalysis
10.Criticalreview
11.Systematicliteratureresults
12.Overviewprimarystudies

5
Table1: Literature search keywords
Search string, which has used in various databases, formulated in the following way and represented in table 2.
Table2: Query keywords table
Keywords Search keywords item A a1, a2, a3, a4, a5, a6, a7, a8, a9, a10, a11 and a12 B b1, b2, b3, b4, b5, b6, b7 and b8 C c1, c2, c3, c4 and c5 (A AND B AND C) (a1OR a2 OR a3 OR a4 OR a5 OR a6 OR a7 OR a8 OR a9 OR
a10 OR a11 OR a12) AND (b1 OR b2 OR b3 OR b4 OR b5 OR b6 OR b7OR b8) AND (c1 OR c2 OR c3 OR c4 OR c5)
Joel Coffman and Alfred C. Weaver, supported the idea: “Despite the similarity of keyword search in semi-structured data and relational data, one relational keyword search systems have not been evaluated at this venue. Perhaps researchers see evaluation forums such as INEX as too expensive to validate experimental system designs, but standardized evaluation is essential for real progress” [15]. The resources for search articles, journals, and conference papers identified from the most popular databases that are scientifically and technically peer-reviewed. The search query for
Keyword Category A Keyword Category B Keyword Category C a1. Mobile monitoring system on ECG
b1. Pattern-matching analysis of ECG Signal
c1. Myocardial infarction, hyperkalemia, detection system
a2. ECG warning system b2. ECG signal compression analysis
c2.Cyber physical system on heart controlling
a3. Mobile early warning of ECG anomalies signal
b3. Remote ECG signalmonitoring
c3. ECG based patient authentication
a4. Real time processing and transferring signal by mobile
b4. Real time processing and ECG signal
c4. Accurate and reliable ECG monitoring methodology
a5. Remote health monitoring system
b5. 3 and 12 lead ECG monitoring system
c5. Auto detection of atrial fibrillation myocardial infarction and atrioventricular block
a6. E-health care system on ECG b6. P, Q, R, S, T ECG signal
a7. Cloud-ECG monitoring system b7. A wireless ECG system for generating conventional signal
a8. Mobile electrocardiograph with wireless warning system
b8. wavelet-based electrocardiograph signal compression method
a9 WBAN, wavelet, BLE and SWS
a10Telemonitoring, wireless, GSM, Wi-Fi
a11. Sensing algorithm for ECG telemonitoring in WBAN
a12. Secure monitoring of remote patients

6
different scientific databases presented in table 1 from appendix A, which named as search keywords for database.
Table 3: Different Scientific Databases for Searching Keywords
1. ACM Database 5. Google Scholar 2. Science Direct 6. NCBI Database 3. Academia 7. NEJM Database 4. Springer Link
2.2.2 Selection Criteria
A. Inclusive Criteria
The basic function of inclusion criteria is to detect the potential subjects that include in the research study. The standards or criteria should set out before research work. The studied articles, books, journals and published websites analyzed in English language since year 2000 to 2015 and the data is not copied or duplicated of the same work. The authors motivate this criterion by experience even though the term ECG remote monitoring system is a very common topic nowadays as wireless ECG or telemonitoring ECG report analysis has already started since early 1990 [16]. B. Exclusive Criteria
The rules and standards established before analysis of a study or review. In a research study it determine whether an exclusion criteria would be implemented or a systematic review should excluded. Exclusion criteria may include age, earlier research work, or other terms and conditions [32]. The articles, journal, books or websites information that does not satisfy the authors research requirements that are not authenticated sources of a real-time ECG warning system nor as studied primary studies in this work. Additionally, authors included the research articles that are not peer-reviewed. 2.3 Extraction Strategy So solving the research questions we have to extract some appropriate information from the primary studies. However evaluating the collected articles, the emphasis has made on the data, represent in the data extraction strategy table 2 from appendix A.
2.4 Conducting the Systematic Literature Review The query in databases resulted in consecutive conclusions in figure 3. Firstly, the stated search string used for advanced search in referenced scientific databases. The initial study result delivered 680 articles. After applying primary inclusion criteria and elimination of the same articles, both researchers come up with these articles. On the first level, the researchers reviewed titles and abstracts subject that outcome as 178 articles. On the second step introduction and conclusions were analyzed, which concluded 57 articles. Later, the full text of the articles analyzed. After this step, authors resulted in 27 articles. All three steps conducted in close observation by the researchers. After every step, the concluded results compared. The common articles combined instantly. There were a few articles, which had a contradiction between researchers opinion, they argued as well. The purpose of comprehensive inclusion criteria provided 27 articles that added 4 more books to complete the research work. The authors come to an adequate agreement about the articles and

7
books for the research work. Finally, authors concluded on 27 articles and 4 added books to the final set of primary studies.
Figure 3: Primary studies selection process
2.5 Critical Review The suitability of this research design the authors performed scientific literature review, data collection, experiment, analysis on particular diseases, establishing unique algorithm for specified diseases and presenting in prototype system design which enhanced the academic writing from other research works. The authors designed the model from (ECGSYN: a dynamic model for generating synthetic ECG signal [31]) to detect the abnormalities of the ECG signal. The effectiveness of the data collection process from ECGSYN model specifies a significant ECG signatures from accumulated obtain dataset, which assist authors to interpret the dataset to achieve the results.
The validity of the sample selection process from authentic ECGSYN data model from physioNet’s has examined various numbers to establish different specified ECG signatures. Such as simulated ECG curve of Hyperkalemia, 3rd degree heart block and MI compared with simulated normal curve to identify the abnormalities. The sampling of specified diseases has also satisfied the author algorithm.
ACMDatabase
250
ScienceDirect
162
NCBI
110
Academia
40
GoogleScholar
60
NEJM
58
Number of hits outcome of studies 680
After introduction and conclusion review 57
After basic inclusion criteria and elimination of same works
After title and abstract review 178
Afterfulltextreview27
Comprehensiveinclusioncriteriawithfinalsetof27articlesand4books

8
On the other hand, number of papers interpreted the ECG signal with waveform interpretation, heart voltage deflection, and sample frequencies [9][[18]. The related articles, books and information from various sources have increased knowledge, which are relevant to the topic. It also assisted authors to acquire knowledge on different ECG segment, how ECG performs and the abnormalities of the specified diseases [11]. The ECGSYN model by physioNet’s is highly accurate on 3-lead ECG system, which is calculated on time and amplitude comparison. A number of articles, researchers recommended the ECGSYN data model for future analysis [31].
Authors introduce a unique Hidden Markov Model based classifier for myocardial infarction detection. The system fidelity can be accustomed on the processing power. A short fidelity classifier is used to accomplish local processing and assign priorities to the data based on its criticality. Continuous physiological monitoring during missions can be effective in reducing the number of fatalities. Real-time physiological data such as ECG can be collected using body-worn sensors [26]
Ziad Sankari and Hojjat Adeli has developed an algorithm, “These algorithms are simple enough to be implemented on a low-cost, limited-power microcontroller but powerful enough to detect the relevant cardiac pathologies. When an abnormality is detected, the microcontroller sends a signal to a cell phone. A mobile medical device, dubbed HeartSaver, is developed for real-time monitoring of a patient’s electrocardiogram (ECG) and automatic detection of several cardiac pathologies, including atrial fibrillation, myocardial infarction and atrioventricular block ” [7]. A cohesive system for convenient electrocardiography (ECG) monitoring, integrated with the processor for time-frequency analysis of heart rate variability (HRV), is presented. The functionality of the system comprises three parts, namely, an analog-to-digital converter (ADC) controller, an HRV processor, and a lossless compression engine. ECG data acquired from front-end circuits through the ADC controller is passed through the HRV processor for analysis. Next, the HRV processor performs real-time analysis of time–frequency HRV using the Lomb periodogram and a sliding window configuration [9].
The book contains recent research results as far we collected the theory and general information from books, which have published during the recent past years. The experiment result, data collection and overall carry out whole academic writing books provide authentic data for the authors. Such as Myocardial Infraction and Hear Block causes, effects and aftermath of the diseases are elaborately written in books rather than articles. Consequently, the experiment, simulation, and analysis process conclusion is sufficiently authentic compared to the other articles investigated during literature review with the present evidence.
2.6 Systematic Literature Results
The composed primary studies have been investigated precisely with regard to RQ1, RQ2, and RQ3. The authors analyzed the existing associated resources and their assessment outcome of primary studies, which implemented in the research work. The steps of systematic literature review have followed in conclusion result on research questions in order to authenticate the academic writing.
All of the considered primary studies on articles, journal, books, and website describe the techniques of ECG remote warning system. The researchers have taken different approaches and

9
techniques that interpret the ECG signal. A number of authors occupied distinctive research method like sampled and experimented different data to organize the ECG warning system. Through relative study authors have identified various approaches of algorithm used, such as waveforms, neural network, digital filters, syntactic algorithms and Mobile Cardiac Outpatient Telemetry (MCOT) which monitors patients wirelessly [24][25].
The unique characteristics of ECG signal can be analyzed and identified with the standard signal pattern of the mock up ECG signal data which will assist to achieve pattern matching analysis of ECG signal [11] illustrated in figure 7. Numerous procedures have been established to distinguish various ECG waves. Common wave detection algorithms include signal matched filters, neural networks, time-frequency decomposition methods, genetic algorithms, and hidden Markov models. More recently, wavelet transform has proven to be a reliable method for ECG segmentation. Using wavelet analysis method, the QRS complex can be distinguished from high P or T waves and another signal as well [6]. The authors have introduced completely a unique procedure i.e. finding the average value of the different ECG signal signatures and the normal value with the different P, Q, R, S and T signatures value which will also present the pattern matching of simulated ECG curve data. In order to identify the abnormalities in ECG signatures of P, Q, R, S and T curve of Hyperkalemia, Myocardial Infarction (MI) and 3rd AVB authors will differentiate the average ECG signal value with compared value. If the compared value has any significant difference in the ECG signatures then it will provide the result as abnormalities in the curve. Details analysis of ECG signal abnormalities has presented in 4, 5 and 6 section.
Articles that discussed ECG remote real-time monitoring and ECG warning system that has also evaluated the ECG signal curve impact on heart-related diseases. The authors used the data collection and simulation research method for research work [7][11][17]. Discovering different techniques, which were classified for establishing the ECG remote warning system and support the document on scientific view. Establishing warning system to register and analyze the achieved simulated data from the device authors has designed a prototype system. The basic functionality of warning system, as well as application design, has discussed precisely in section 6.4.
A half of research articles that authors have used correspond to heart voltage deflection, wavelet transform, Wide Body Area Network, sampled frequencies and fiducial and non-fiducial that worked with heartbeat local maxima and minima value. Most of the authors use such research methods are experiment and analysis [10][26]. Authors also searched and examined related articles, books as well as websites that describe how P, Q, R, S, T curve on ECG signal works and the differentiation of normal and abnormal curve where authors have taken theoretical research method from books and existing sources from the primary studies. As the result of SLR, we could identify and describe techniques and their impacts of implementation challenges.
2.7 Overview of the Primary Studies The initial studies through the appendices authors have notified that the primary studies started from the early 1990. Figure 4 illustrate the distribution of publications of articles and books over the years against academic paper appendix C. We can find that starting from 2008 researchers has only one article but in 2009 the steady it grow up to three. So far analysis through the graph we can consider that the percentage of article publications has dramatically increased in the year of 2010, 2012, 2013 and 2014. On the other hand, only one book can found in the year of 1992, 2010, 2012 and 2013 according to the academic paper appendix C.

10
Figure 4: The distribution of publications over the years against academic paper appendixes.
The primary studies signify also empirical or theoretical consequences. Occasionally it can associate both – empirical and theoretical results. The systematic character of publications is shown on figure 1 in appendix B. We can conclude that 68% of publications represent the empirical results. Which can be described by the circumstance that scholars in the ECG warning system technique choose to give the experimental evidence of their theoretical outlines and views, which is the most motivating for experts.
01234567
1990199220082009201020112012201320142015
No.OfPublicationsonarticles
No.Ofbooks

11
3. Theory 3.1 Fundamentals of ECG An electrocardiogram (ECG or EKG) is used to measuring the electrical activity of the heart that is caused when the heart muscle "depolarizes" during each heartbeat. An electrical impulse or wave travels through heart simultaneously with each heartbeat [7] [22][33]. Slight electrical change on the body, when the heart muscle depolarizes at the same time as each heartbeat occurred. The first rising deflection from standard line is characterized as a P wave and it suggest atrial depolarization. It should not exceed more than 2.5mm in height nor .11 second in width [30]. Decreasing the heartbeat towards zero or less is called depolarization. Q wave is the first negative deflection from the baseline after p wave started. Usually, the Q wave suggests ventricular septal depolarization and its longevity is around .03 second [30]. This process in the ECG part is considering as a horizontal line between the edge of the P and the inception of the Q wave [24] [7]. Measuring the current change across 2 electrodes a positive electrode and a negative electrode senses the voltage change. The progression wave of depolarization is triggered by cells sinuous node. The electrical signal moving through the atria is registered as the P wave on the EKG in figure 2 of appendix B.
Escalating throughout the atrium passes through “intrinsic conduction pathways” and then spreads all over the ventricles. The R wave is the initial positive deflection afterward the P wave, imitating depolarization of the ventricular area. The S wave is the negative deflection subsequent the positive R wave representative following ventricular depolarization [30]. An insignificant rises and falls in the voltage between two electrodes placed each of two side of the heart that will be displayed in the screen or paper. This technique is listed as the QRS waves on the EKG [7]. This display indicates the overall rhythm of the heart and weaknesses in different parts of the heart muscle. The basic function of ECG machine is to measuring the heartbeat weather the pulse of the heartbeat is steady or irregular. It also helps to identifying the strength and timing of electrical signs as they occurred in each part of heart. The ventricles then recover their normal electrical state (shown as the T wave on the EKG). ECG machine focus on the electrical activity towards a lead causes an upward deflection as well as electrical activity away from a lead causes a downward deflection [24].
3.2 ECG Signal Monitoring
An ECG waveform cycle and segmentation at PhysioNet’s PTB Database (PTBDB) patterns described on the basis of ECG wave Cycle. The overall description of ECG wave cycle according to the P, Q, R, S, T curve are described in figure 5.
Figure 5: A cardiac cycle [11]
The rhythm of heart is alike a sinus type which can be identify by the existence of P-complex which will appear every QRS complex in a web cycle and at the same time presence of QRS after every P complex. Conventionally, a normal heart sinus node initiates a self-generating impulse that can have an average rate frequency of 60-100 beats per minute (bpm) for adult as well as for athletes to

12
have resting bpm as low as 30 [11]. Inconsistency of the rate above this limit can be considered as abnormal case. However, the range frequencies vary from person to person. In the continuation of time PR, QRS, and QT parts in the cardiac cycle, an acceptable rule is to recognize that the segment QT is less than a half of the distance between two successive QRT complexes. QT segment should be less than half of the RR interval [11].
The change from the original wave shape or it is dissolving means a pathological case. The normal duration of ST segments indicate it is ischemic, although shift above the cycle-axis suggest a heart attack. The normal T complex is about half of the P-complex time [11].
3.2.1 P Wave The P wave is a small deflection wave that represents atrial Depolarization [23]. It can be thought of as being made up of two separate made up of two separate waves due to waves due to right atrial depolarization and left atrial depolarization [7] [28].
A tall P wave (over 2.5mm) can be called P pulmonale. It occurs due to R atrial hypertrophy. It is caused by left atrial hypertrophy and delayed left atrial depolarization [28]. 3.2.2 PR Interval The PR interval is the time between the first deflection of the P wave and the first deflection of the QRS complex [23]. The PR interval parallels to the period between depolarization of the atria and ventricular depolarization [7] [28].
3.2.3 The Q Wave Small Q waves are parallel to depolarization of the interventricular septum. Q waves appear when human breath and curves are generally small and thin [7] [28].
3.2.4 ST Segment
The ST segment, namely as the ST interval, is the time between the end of the QRS complex and the start of the T wave. It echoes the period of zero potential between ventricular depolarization and repolarization [28]. The ST segment expands from the end of the S wave to the start of the T wave. It should be flat or somewhat pitched and level with the baseline [7].
3.2.5 T Wave
T waves represent ventricular repolarization (atrial repolarization is obscured by the large QRS complex) [7]. The T wave represents the repolarization of the ventricles, which is when the heart muscles go back to their negative state at rest after a heartbeat. In most leads, the T wave is positive. Negative T waves can be signs of diseases [23].
3.2.6 QRS Wave Complex
The three waves of the QRS complex represent ventricular depolarization. For the inexperienced, one of the most confusing aspects of ECG reading is the labeling of these waves. The rule is: if the wave immediately after the P wave is an upward deflection, it is an R wave; if it is a downward deflection, it is a Q wave [28]. The R wave reflects depolarization of the main mass of the ventricles hence it is the largest wave. The S wave signifies the final depolarization of the ventricles, at the base of the heart [11].

13
4. Method Data collection and experiment were the two methods conducted throughout this research. Authors SLR and theoretical study provided extensive knowledge on ECG pattern recognition techniques. PhysioNet’s PTB Database (PTBDB) contributed to obtain raw real patient data that later on reformed in mockup results to generate ECG curve for testing and analysis. Data received in .csv format and extracted into SQL database content. Subsequently, an algorithm was programmed in Java computer language to retrieve the SQL data, evaluate the data content and save corresponding results. Analyzed selection translated to assess healthy and abnormal ECG curve in particular sample. A user-friendly interface is also constructed to present the interpreted data. The web interface allows the application user to view subjects’ current heart condition as well as finding the abnormalities also. 4.1 Simulated Data collection
Different hardware provider has their own separate ways of interpreting ECG analog signals. 3-Lead ECG, 8 Led ECG or 12-Lead ECG are some of the examples of available hardware in the market. This research based on mockup data generated by the authors own designed simulated computer program. Program will generate ECG signal according to 3-lead ECG devices, which is similar to real human ECG signal curves. For developing an automated system for ECG interval analysis, author collected a dataset of over 20 ECG waveforms along with the similar waveform. Data were collected from reliable online sources (ECGSYN: a dynamic model for generating synthetic ECG signal [31]), which provide simulated patients ECG data. Synthetic ECG data is available in .dat (MATLAB data format extension) format online. Essentially, .dat files are analyzed by MATLAB graph plot tools to generate an ECG curve [31]. Corresponding QRS is analyzed and stored in MYSQL database for future processing. There are two columns in database one is time in seconds and another is ECG amplitude in millivolts (mV). The accumulated ECGSYN data is collected from database, which is consist of 1000 set of sample mockup data. These 1000 ECG sample data is the output of 4s (four seconds) ECG signatures. In this research the number of sample needed for an accurate ECG curve is 250(two hundred and fifty) which is 1s (one second) illustrated in figure 7. Below figure 6 illustrates a sample ECGSYN curve based on MATLAB data format. This image assembled from 1000 sample dataset that has 4 (four) waveforms for 4 seconds. In appendix section A Table 3 (Patient mockup data), is an example of 20 samples ECGSYN data retrieved out of 1000 ECGSYN sample data.
Figure 6: Simulated ECG curve in MATLAB [31]

14
4.2 Experiment To carry out the experiment of the Hyperkalemia, MI and third degree heart block authors have collected authentic information through literature review form various articles, books, journal and website. In systematic literature results section authors have discussed different approaches to analyze ECG signatures as well as authors own solution to examine ECG curve. The experiment conducted in this research work is in accordance to systematic literature results, which outlines P, Q, R, S, T curve variation. In analysis section authors illustrated with references [20][28][34] for individual diseases, which were found conducting literature studies to precisely compare the authors, experimented result. Writers or researchers for different articles and books have taken different procedure like experiment, 12 leads ECG real time patient analysis or taking blood sample to outcome the result of a specific diseases [20][28][34]. On the other hand, authors worked with mock up patient data, which have interpreted for specific diseases. The interpreted mock up data has manipulated each ECG signatures on the basis of mentioned diseases to find the normal ECG curve as well as finding the abnormalities for warning the patient. To do the experimentation authors have established a distinctive standard average value of P, Q, R, S and T of ECG signatures. These ECG signatures have a specific value (in mV) against time (in seconds), which has compared by any deviation or abnormal value of specific ECG signatures. The authentic representation of different diseases in analysis section is not similar work [20][28][34] moreover these pictures are shown for verification of the work. The existing articles and books have more accurate and authenticate value because it is providing the value on real time patient analysis rather mockup data. ECG signal curve differentiates depending on several key factors such as age, occupation and natural exposure. Correspondingly it is challenging to distinguish between regular heart variations and life threatening changes. In order to establish a standard ECG curve authors followed physioNet’s database. ECGSYN model is capable of generating realistic synthetic electrocardiogram (ECG) signals which the operator can specify the mean and standard deviation of the heart rate, the morphology of the P, Q, R, S, T cycle and the power spectrum of the RR tachogram. In order to simulate an anomaly the authors experimented with the ECG amplitude data that are present in ECGSYN sample dataset. Authors sampled 250 simulated dataset of which creates a normal healthy ECG wave curve that is shown in figure 7.
Figure 7: Standard curve during simulation
In association with 250 samples dataset 30-94 consists of normal P wave with on average value of 0.12063. 95-101 contains Q wave with an average value of -0.0782. 102-123 contains R wave. On average value is 0.41444. 124-132 is S wave with average value of -0.1195. 133-220 is T wave with an average 0.2212. Experimented data has resulted in standard average value, which is the master standard value used to compare deviation. Conversely, simulated data has dataset of 1000 samples from which the standard curve is retrieved.

15
5. Analysis
5.1 Simulating the Abnormalities of Hyperkalemia The medical term hyperkalemia describes the potassium level in human blood is higher than average. Potassium is a nutrient that is critical to the function of nerve and muscle cells. The absolute potassium level is less important than its rate of rise. ECG changes reflecting a rapid rise demand immediate action shown in table 4. The level of danger increases as the ECG changes progress. The sequence generally follows the order [19][20]. The authors has explained in the papers “Potassium is the major intracellular cation; the resting membrane potential is governed primarily by the resting potassium conductance. Hyperkalemia invokes a series of changes to myocardial excitability and conduction, resulting in alterations on the surface ECG and the intra-cardiac electro gram” [19].
Table 4: Percentage of potassium level in blood
Hyperkalemia level Potassium level in blood
1. Primary > 5.5 mEq/L
2. Moderate > 6.0 mEq/L
3. Severe > 7.0 mE/L
In figure 8a It illustrate if the hyperkalemia occurred to patients then its ECG report will be like the below picture. To simulate the ECG effect of hyperkalemia authors first experimented to manipulate the P, QRS and T wave shown in figure 8b.
Figure 8a:Serial ECG changes in hyperkalemia. [20] Figure 8b: Simulated curve affected by hyperkalemia
5.1 .1 Effects of Hyperkalemia in the ECG
• P wave widens and flattens.
• PR segments lengthens
• P wave eventually disappear• Prolonged QRS interval with bizarre QRS morphology• Development of a sine wave appearance.• Sinus bradycardia or slow AF.

16
Tall and symmetrically peaked T waves in hyperkalemia. Broad, bizarre QRS complexes these merge with both the preceding P wave and subsequent T wave [19][20]. After 10 attempts we successfully able to generate ECG curve which has all the properties of hyperkalemia.
5.2 Simulating the Abnormalities of Myocardial Infarction (MI)
Myocardial infarction commonly known as heart attack is usually occurs on basis of a blood clot, which ceases the flow of blood to other part of heart muscle. Myocardial infarction can be characterized from a sum of different perspectives related to clinical, electrocardiographic (ECG), biochemical and pathologic characteristics. It is accepted that the term myocardial infarction reflects death of cardiac myocytes caused by prolonged ischemia [28].
The ECG signs of myocardial ischemia are specifically to ST and T changes. Additionally, it also affects the QRS pattern of ECG curve. Figure 9a illustrate the verified development of ECG waveform with the irrational ST-segment and T-complex afterward the heart attack. It also displays the detailed variations in Q position are illustrated in figure-9a [28]. The simulated affected curve interpreted by authors in figure 9b.
Figure: 9aEffects on MI [28] Figure: 9bSimulated curve affected by MI
Verified progress of ECG waveform showing the irrational disturbances subsequently the heart attack in ST, T and Q parts (basing on the knowledge acquired from [6]). Any pathological difference in any stage can spontaneously be described as an irregular disruption. This picture shows a normal sinus complex. ECG would be balanced but the ST segment would rapidly begin to shift. In this picture, the T wave has widened [7] [28].
5.2.1 Effects of Myocardial Infarction
1. The ST segment in one the ISO-electric line. And beginning of the pain the ECG would be usual but ST segment would soon start to variation and T wave is upward [34].
2. In a period of an hour the ST segment would be considerably inflated, demonstrating the onset on myocardial necrosis (tissue death).
3. ST elevation has reduced by more than before picture and T wave intervention is much deeper. If no medical treatment is administered the Q wave widens rapidly [28][34].

17
4. Twenty four hours later, the ST segment might arrive to the isoelectric line. In this picture it is clearly shown that the ST segment is returned on the iso-electric line but the T wave stays upturned. It may stay unchanged for days, weeks or months [34].
5. On few occasions, after a few months the ECG looks approximately normal. Higher Q wave implies tissue damage, which is a state of Myocardial Infarction. Q wave does not depend on time. It may be present from earlier heart attack and cannot be considered for acute myocardial infarction [7][34].
5.3 Simulating the Abnormalities 3rdAVB
5.3.1 Studies on Different Atrioventricular Block Atrioventricular block (AV BLOCK) is also knows as heart block is an abnormal heart rhythm where the heart beats too slowly. Three types of heart blocks that registered through ECG are first degree, second degree, and third degree. First-degree heart block is less severe compared to third degree heart block.
This research work is designed to identify the abnormalities of hyperkalemia, myocardial infarction and third degree AVB. The system can also be possible to detect other two AVB through modification of the algorithm.
5.3.2 First-Degree Atrioventricular Block
In first-degree Atrioventricular (figure 3 in appendix B), the heart's electrical signals are slowed as they move from the atria to the ventricles (the heart's upper and lower chambers, respectively). This results in a longer, flatter line between the P and the R waves on the EKG(electrocardiogram). If the PR interval is long (>5 small squares or 0.2s). If there is a constant long PR interval 1st degree heart block is present. First-degree heart block is a longer than normal delay in conduction at the AV node [22] [28]. 5.3.3 Second-Degree Atrioventricular Block
In this type of heart block, electrical signals between the atria and ventricles are slowed to a large degree. Some signals don't reach the ventricles. On an EKG, the pattern of QRS waves does not follow each P wave as it normally would. . If the PR interval looks as though it is widening every beat and then a QRS complex is missing, there is 2nd degree heart block, Mobitz type [28].
Figure 4 in appendix B shows ECG report after second-degree heart block. Here QRS wave does not trail regular P wave. If an electrical signal is blocked before it reaches the ventricles, they won't contract and pump blood to the lungs and the rest of the body [28].
5.3.4 Third-Degree Atrioventricular Block
On third heart block, none of the electrical signals reach the ventricles. This type also is called complete heart block or complete AV block. If there are no discernable relationship between the P waves and the QRS complexes, then 3rd degree heart block occurs [28].Figure 10a displays third-degree heart block with significant distinction between P wave and QRS wave complex and the simulated affected curve is shown below in 10b.

18
Figure 10a: Third Degree Atrioventricular block [28] Figure 10b: Simulated curve affected by 3rd degree
When exact heart block occurs, special areas in the ventricles may create electrical signals to cause the ventricles to contract. This natural backup system is slower than the normal heart rate and isn't coordinated with the contraction of the atria. On an EKG, the normal pattern is disrupted. The P waves occur at a faster rate, and it isn't coordinated with the QRS waves. The QRS complex remains cyclic [7]. As experimental in fit ECG, the periods between two consecutive R waves remain constant. However, unlike healthy ECG the P wave period is significantly less than that of the R wave. As such, the P waves appear in unexpected (abnormal) locations on the ECG, a sign of 3rd degree AVB [7] [28].
19
6.Results Authors have established algorithm for each disease to find out the abnormalities in the ECG simulated curve and the figure of each diseases diagram can find in appendix B figure 12-13. The each simulated ECG signatures have a value and range. The simulated ECG signatures of P, Q, R, S and T have one standard value and another is particular disease value of each simulated ECG signatures. Both values kept in database to differentiate the value through the algorithm. The establish algorithm from authors provide the outcome result of table 5 to 7 for the hyperkalemia, MI and 3rd degree heart block.
6.1 Detecting Anomaly in Hyperkalemia
Based on synthetic data gathered from figure 8b experiment authors depicted the average value of P, Q, R, S and T wave in corresponding hyperkalemia. Each simulated ECG curve has been sampled more than 10 times to achieve the accurate hyperkalemia simulated curve to experiment with normal ECG simulated curve to differentiate the variation. Studying the average results obtained and comparing the results to previously collected average authors established a conclusion. Below table 5presents the differences between a healthy curve average and simulated hyperkalemia curve. The illustrated simulated comparing to the hyperkalemia abnormalities can be found in figure 5. To find out the abnormalities for hyperkalemia the developed algorithm has illustrated in Appendix B figure 12.
Table 5: Variation level in Hyperkalemia
Name of wave Standard value Hyperkalemia value Variation
P 0.12063 -9.0984 -9.2190
Q -0.0782 -0.7821 -0.8603
R 0.4144 0.4144 null
S -0.1195 -0.1195 null
T 0.2212 0.2646 0.0434
Above table illustrates variation level is exclusively existent in P, Q and T waves. For any ECG deflection the data variation level would change dramatically. Therefore, the variation of P, Q, T will be able to identify inconsistency correlated to healthy values.
6.2 Detecting Anomaly in Myocardial Infarction
During investigating the effects of myocardial infarction in chapter 5.2.1 authors gained significant adverse effects of MI on ECG. In reference to the simulation the side effects of P, Q, R, S and T wave concludes as follows. The table represents distinction between MI wave and normal ECG wave. At a glance, it is clearly visible all P, Q, R, S and T variation value is negative. Essentially the variation rate in S and T segment that inflates immensely owing to tissue death. Moreover, without any medical treatment the Q wave widens rapidly which results in higher negative value is describe in table 6 and exemplified in figure 6.The developed algorithm for MI in appendix B figure 13.

20
Table 6: Variation level in Myocardial Infarction
6.3Detecting Anomaly in Third degree heart block
In 3rd degree heart block the P, Q, R, S and T wave occurs unusually. Primary indication of AV block in ECG is no correlation between P and QRS complexes. Likewise, P wave appears randomly, on few occasions more than once. Below table presents the results of 3rd degree AV block. In 3rd degree block the R wave changes profoundly. T wave remains unchanged in most of third degree heart block occurrences. The average value is shown in table 7 and the differentiation of the standard and the heart block symbol can be determine in figure 7. 3rd degree AVB algorithm has illustrated in appendix B figure 14
Table 7: Variation level in Third Degree Heart Block
6.4 Algorithm and Prototype System design
ECG warning system architecture is entrenched on an algorithm, which can calculate the curve variation to detect inconsistency between standard ECG curve and corresponding irregular curve. An algorithm is gradual process of solving a problem, resulting desired result. A prototype warning system is developed based on above corresponding algorithm. Simulated individual ECG curve value is analyzed to calculate average value of each wave and compare the variation with already saved deflections of hyperkalemia or other research diseases. Assuming that P wave of corresponding curve has an average value in between 0.1044 to 0.1308. If the average value is not in this range or more likely to have a negative value the curve is presumed to have hyperkalemia. In addition, the T wave deviation is tested for variation level higher then 0.2212 the standard value. However, as T wave peaks on hyperkalemia the inflated value should have approximate value of (0.0420 to 0.0437). Likewise, if the R wave variation results in negative value between (-0.5183 to -
Name of wave Standard value Myocardial Infarction value
Variation
P 0.12063 0.0494 -7.123
Q -0.0782 -0.0055 -0.0837
R 0.4144 -0.1039 -0.5183
S -0.1195 -0.0289 -0.1484
T 0.2212 -0.2377 -0.4589
Name of wave
Standard value
3rd degree heart block value
Variation
P 0.12063 -0.0041 -0.1247
Q -0.0782 -0.0062 -0.0844
R 0.4144 0.0402 -0.3742
S -0.1195 -0.0122 -0.1317
T 0.2212 -0.2212 -0.4424

21
0.5283) it is considered as myocardial infarction. The pseudo code of the algorithm flow chart in appendix B figure 8 for the prototype system is illustrated below.
1. Get INPUT value of P, Q, R, S, and T from source.
2. CALCULATE corresponding average P, Q, R, S, T value.
3. Get standard value of healthy ECG curve and then DETERMINE the variation value.
4. IF the calculated variation value matches predefined variation value OUTPUT respective result.
Figure 11 illustrates the steps involved in this prototype application for detecting corresponding heart diseases in reference to algorithm.
Figure 11: Application design steps in accordance to algorithm.
In appendix B figure 15 describes the process involved detecting normal healthy curve. As the algorithm illustrates when the P, Q, R, S, and T variation value is 0 it is considered to be a normal curve. To emphasize, the variation values only become zero (0) while the corresponding data is exact match of standard value thus resulting no irregularities on the curve. As during analyzing P, Q, R, S and T variation value is depicted from mock up data in which transferred normal curve data contains value identical to standard curve value. To note that, in this prototype design standard P, Q, R, S and T curve is considered constant and is evaluated with other mock up curve data for inconsistencies. As a result, if corresponding data has any abnormalities the variation value will be higher or lower than zero but not exactly zero matching standard curve value. Appendix B figures 12,13 and 14 represents algorithms for detecting abnormality. Abnormality occurs when analyzed P, Q, R, S, T variation values equal or approximate to pre saved corresponding abnormal variation value. These abnormal values are determined during experimentation in regard to related heart disease signatures described earlier in results section. To implement the prototype application software authors followed black box testing model. Each step during the implementation design codes is examined extensively. Tools used for the warning system is Java, PHP, MYSQL and node.js. One of the existing algorithm for real-time ECG patient can be discuss briefly symptoms and detection methods for three major cardiac problems that can currently be handled by the HeartSaver: myocardial infarction (MI), atrial fibrillation (AF), and atrio-ventricular block (AVB). HeartSaver can handle many other cardiac pathologies through algorithmic modifications and extensions and illustration can found figure 16 appendix B [7].

22
6.4.1 Application Design
Prototype system is developed in intent to create an application where a simulated patient and a simulated doctor can access the equivalent data via user-friendly interface. Technologies used are PHP, MYSQL, JAVASCRIPT and NODE.JS in order to achieve this objective. Below case diagram presents how the system design performs. Patient is authorized to view alerts and ECG graphical plots. On the other hand doctor has more privilege like a few more extra feature such as graphical comparison between abnormal wave and standard wave. Moreover detailed P, Q, R, S and T deviation level in percentage (%) for that corresponding ECG curve is also displayed in doctors view figure 12.
Figure 12Case diagram of application design
A. Doctors view
Figure 13 presents enhanced doctors view-detailing comparison between normal curve and defective curve. Top image illustrates the current data curve doctor has clicked to view. The bottom left image represents comparison between healthy curve and the current defective curve. Yellow line is a representation of a standard curve whereas blue line presents current unhealthy curve. The purpose of this chart to provide more detailed graphical information to the doctors for better decision making about the patient’s condition. In addition bottom right image displays curve deviation rate percentage corresponding to that disease which is an extra feature to get further details of the curve.
Figure 13 Illustrates doctors view with more detailed graphical representation

23
B. Patients view
Figure 14 displays patient's alerts in three different categories as warning, normal and danger. This figure 14 is also accessible in doctors view so doctors can view the patients results in real-time. Warning describes ECG curve, which has approximate match with predefined ECG variation. Normal specifies ECG curve with no abnormalities. Lastly, danger defines which abnormal ECG curve is found on that sample. Alert system is real-time developed in node.js. Every alert is pushed from the server to client application in real time.
Figure 14 Illustrates patients view in graphical representation
Above Doctors view and Patients view are correlated to the system architecture described in figure 1.This research is a simulation of the architecture described in figure 1. In figure 1 illustration ECG data is collected from ECG scanning device and transferred from mobile device to the analyzing, storage server via 3G or Wi-Fi connection. In order to create this scenario authors have created simulated data then transfers corresponding data via a Java application program through HTTP connection. Moreover in figure 1 top right corner of the image the architecture illustrates the storage server is providing analyzed information accessible to both doctor and other concerned personal (patient in this case). Figure 13 and figure 14 are both representation of this context where both doctors and patients have access to respective analyzed data. In accordance, in this simulated application doctor’s view contains more detailed graphical view in comparison to patients view for better decision-making.
6.4.2 Implementing Warning System
To implement the warning algorithm system technologies used are JAVA, MYSQL. In java the analytical algorithm first reads simulated ECG data sent via simulated java client application, which imitates real device. The retrieved data is sampled in 250 dataset predefined by the authors. This 250 dataset is obtain from PhysioNet’s PTB database website, which is basically a part of 1000 dataset and the sample of 20 dataset is shown in table 3 appendix A [31]. From corresponding 250 dataset the each P, Q, R, S and T wave value is collected and calculated to sum up average value. Next the resulted average values of all waves are compared with pre-stored value achieved while experiment process. Exact matching value or approximate matching value is evaluated to detect anomaly in P, Q, R, S or T wave. To identify the abnormalities the flow chart from appendix B figure 8 is followed for implementing the warning system.

24
6.4.3 Application Testing and Evaluation
In this section, several tests are made to evaluate this system. Testing and evaluation has conducted to analysis system performance and user requirement. Resulting a system that satisfies real time ECG warning proto-type design. Black box testing which is also known as function testing used to test the systems functions. Wrong incoming data, incorrect data output during analysis functions were evaluated through black box testing method. A troubleshooting log as also created during the validation process in order to keep track of common errors and corresponding solution.
A. Server Testing
Server program performs the most critical functions of the whole system design. It has java classes’ functions to receive data from multiple simulated devices (a client/source java application), analyse the data and save output to the database Figure in Appendix B figure no 9. Core functions of the server are send/receive data via TCP/IP protocol get average value, get variation value, update latest patients alert on database. Black box Testing of the server function and results in shown in below table 8.
Table 8: Black box testing of the server function and outcome
No Function Excepted outcome Final Result
1 TCP/IP server running Server is running on predefined port Passed
2 Received data consists of delimiter (,)
String data has delimiter (,) and then split Passed
3 Get average value Determine the average value of the received data Passed
4 Get variation Find differential between analysed average value and predefined standard value
Passed
5 Insert received value Insert data into database as event occurrence if the analysed result is not normal curve
Passed
6 Update patient alert Update patient alert column in database Passed
B. Simulated device application testing
The java source application program simulates a real world ECG device that send mock up data to the server. The mock up data are saved in different database table from which they are collected by applications button clicks function, therefore sent to the server application for analysis Figure in Appendix B figure 10. Another client application, which sends mock up data every 10 seconds to the server, was also designed on the same function principals as button click simulated application. The table 9 describes the black box testing of the client/source application functions.
25
Table 9: Black box testing of the client/source application function and outcome
No Function Excepted outcome Final Result 1 Send data Send data from source application to
server application via TCP/IP Passed
2 Auto send data every 10 seconds randomly
Retrieve data from database and send data to server
Passed
C. Node JS Server
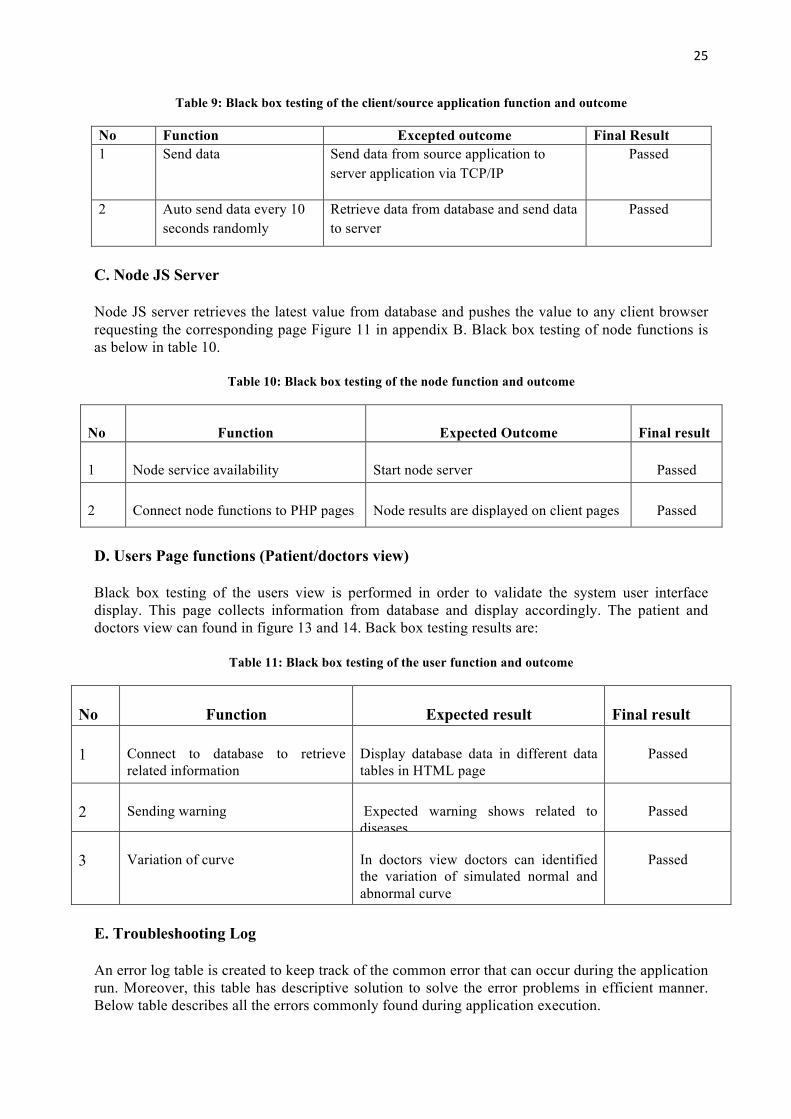
Node JS server retrieves the latest value from database and pushes the value to any client browser requesting the corresponding page Figure 11 in appendix B. Black box testing of node functions is as below in table 10.
Table 10: Black box testing of the node function and outcome
No Function Expected Outcome Final result
1 Node service availability Start node server Passed
2 Connect node functions to PHP pages Node results are displayed on client pages Passed
D. Users Page functions (Patient/doctors view)
Black box testing of the users view is performed in order to validate the system user interface display. This page collects information from database and display accordingly. The patient and doctors view can found in figure 13 and 14. Back box testing results are:
Table 11: Black box testing of the user function and outcome
No Function Expected result Final result
1 Connect to database to retrieve related information
Display database data in different data tables in HTML page
Passed
2 Sending warning Expected warning shows related to diseases
Passed
3 Variation of curve In doctors view doctors can identified the variation of simulated normal and abnormal curve
Passed
E. Troubleshooting Log
An error log table is created to keep track of the common error that can occur during the application run. Moreover, this table has descriptive solution to solve the error problems in efficient manner. Below table describes all the errors commonly found during application execution.

26
Table 12: Troubleshooting Log Table
No Description Solution Threat level
1 TCP/IP address/port not found
Use same port number every source application as server port number
High
2 Array to string convert error Check delimiter of client side application functions
Medium
3 Auto client application not responding
Check server for multi thread function availability
Low
4 Node server runtime error Check for port uses of other software like Skype or Torrent.
Low
5 Node function not working on PHP page
Connect to node ports to receive node results, check port number on both PHP code and node application
High
6 Detailed patient log not working
Server failed to save event occurrences to the database, restart the server
Low
6.4.4 Algorithm Evaluation
Since the perceived of this research paper authors had good co-operation with researchers and experts in field of cardiology, signal processing, medical professionals and business developers for the fulfilment of research topic. In reference to experts’ ideas, comment, criticism from different authorities authors has developed the warning algorithm. Notable research collaborators were Raihan Rafique, PhD currently an Ericsson researcher, LU (Lund University) innovation system,Mikael Johnsson a resident doctor of radiology at Trelleborgs. Lasarett, a division of Diagnostic Lund. Above experts had different assessment on algorithm design depending on respective background. Mikael Johnsson a medical expert clarified how the ECG is affected on P, Q, R, S and T curve in heart related diseases and how ECG value presented in more detailed picture could assist Mikael making decision on patient condition as a doctor. Raihan Rafique an expert in data-signal processing with more than 12 years of experience evaluated this algorithm which concluded that this linear algorithm results are authentic alone as prototype system. Further improvement on algorithm is prerequisite for any medical use since algorithm only considers variation value inconsistency, which is inadequate for any medical conclusion.
6.5 Comparing ECG warning system with other technologies Comparing ECG warning system with other technologies it offers a unique average ECG signatures saving amplitude value against time frame approach to identify the remote monitoring with simulated ECG mockup data, finding the normal pattern matching ECG signatures, recognizing the abnormalities of three major heart diseases myocardial infarction (heart attack), hyperkalemia and atrioventricular block (heart block) with the simulated data. On the other hand, HeartSaver offers improved practicality and mobility by presenting a wider range of pathology monitoring, superior features, transmission of patient data and location, ease of use and extended area coverage. Unlike

27
the MCOT device supplied by CardioNet, HeartSaver can monitor a variety of cardiac pathologies including arrhythmias, STEMI, and AVB. Patient location, often necessary in cases of STEMI, is communicated, a feature that is not present in MCOT or other telemetry devices [7]. As far, authors worked with simulated mock-up patient data to establishment of the prototype software. The basic role of this academic writing is to establish the concept in real world and findings the usability of the research work. The basic functionality of this research work can be effective to heart patient to monitor remotely and getting the precaution to severe damage of the patient.

28
7. Discussions and Conclusion During the development period the authors established the objectives, planning the data collection, experiment, finding the SLR and checked if the obtainable resources are enough for the research. The design stage of the research work at the beginning was bit confusing after lots of research on SLR then authors have made it more clear and concise regarding to research work by setting what is basic criteria for this academic work. Initially, the authors gathered knowledge on specific ECG terms and a remote warning system through SLR and primary studies. After acquiring significant knowledge through SLR authors have analysis different similar articles and how they have established their research work. The impact of SLR has a great improvisation to this research work, which basically helped to search articles by keywords, data extraction shown in table 1, primary studies in figure 4 and so on. Furthermore, theory of different ECG signatures and ECG information provided us immense acquaintance for establishment of the academic work [7][11][28]. After scrutinizing the data and information, investigators collected data from (ECGSYN: a dynamic model for generating synthetic ECG signal [31]) authentic website to interpret the data. The data is stored in database one is time in seconds and another is ECG amplitude in millivolts (mV). Authors collected 1000 sample data from a single patient and estimated time is 4.5 seconds, which illustrated in figure 6. Meanwhile authors interpret the data and find the average value of P, Q, R, S and T value and after that authors differentiate and comprised the average value with related diseases. As far investigating through others research most of the papers interpreted the ECG signal with waveform interpretation, heart voltage deflection, sample frequencies. Evaluating the research work with others the authors has taken a very unique approach, which is taking the average value of ECG signatures instead many researchers has taken different ECG sampling frequencies and heart voltage deflection and soon. A real time ECG warning system on myocardial infarction, hyperkalemia and atrioventricular block is a distinctive system based on integration of modern technologies: software, computer and information technologies. It is singular prototype software, which is established to provide better diagnosis for cardiac patients with the ultimate objective early warning to the patients, reducing cost and saving human life.

29
8. Suggestions for further work In the given work authors investigated research work data with the simulated data, which is achieved from authenticate website. However to get the accurate standard curve from human body nowadays researcher can use different body sensors to acute the ECG signal, which can be implemented for future work and in that case the result will be more accurate for the patients. The researchers may also put emphasis on data collection in different position of the human body where they can take more sampling data to give perfect output. Myocardial infarction and atrioventricular diseases almost have same average value of different ECG signatures where authors sometimes get conflict with the data, to analyze it more precisely further study is required.
The authors are using TCP connection to transmit the simulated data to server and get feedback. But more investigation and study it can be possible to transmit the data through mobile via GSM or Wi-Fi connection. Eventually todays it is also possible to retrieve the data from cloud as well.

30
9.References [1] C. C. Li1, Y. S. Shiao1, Chin E. Lin2, C. C. Li2, C. J. Sun2 A Conceptual Design and Demonstration for an e-Care System. Euro American Conference on Telematics and Information Systems: New Opportunities to increase Digital Citizenship Page 2 & 3. 2009, Article No. [cited 2015-04-10] Available from:
http://dl.acm.org.ezproxy.hkr.se/citation.cfm?id=1551722.1551754&coll=DL&dl=ACM&CFID=557218676&CFTOKEN=20081474
[2] NenadStojanovic, Yongchun Xu, Aleksandar Stojadinovic, Ljiljana Stojanovic. Using Mobile-based Complex Event Processing to realize Collaborative Remote Person Monitoring. DEBS '14 Proceedings of the 8th ACM International Conference on Distributed Event-Based Systems. 2014, page-225. [cited 2015-04-10] Available from:
http://dl.acm.org.ezproxy.hkr.se/citation.cfm?id=2611286.2611306&coll=DL&dl=ACM&CFID=557218676&CFTOKEN=20081474
[3] Aris S. Lalos, Luis Alonso, Christos Verikoukisb, c Model based compressed sensing reconstruction algorithms for ECG telemonitoring in WBANs. 2014, Page-105, Volume 35. [cited 2015-06-18] Available from:
http://www.sciencedirect.com.ezproxy.hkr.se/science/article/pii/S1051200414002553
[4]. Moumtadi Fatimaa, Gómez Méndez Javiera , Delgado Hernández Julio Carlosb , Tovar Medina Robertoa, Development of a mobile electrocardiograph with a wireless warning embedded system. International Meeting of Electrical Engineering Research 2012. page 145,150 volume 35 [cited 2015-04-10] Available from:
http://www.sciencedirect.com.ezproxy.hkr.se/science/article/pii/S1877705812018103
[5] Hande Alemdar ,CemErsoy, Wireless sensor networks for healthcare: A survey Volume 54, Issue 15 2010.05.03 page -689 [cited 2015-02-10] Available from:
http://www.sciencedirect.com.ezproxy.hkr.se/science/article/pii/S1389128610001398
[6] Henian Xiaa, IrfanAsif b, Xiaopeng Zhao, Cloud-ECG for real time ECG monitoring and analysis. Volume 110, Issue 3 2013 page 1 [cited 2015-03-23] Available from:
http://www.sciencedirect.com.ezproxy.hkr.se/science/article/pii/S0169260712003069
[7] Ziad Sankari, Hojjat Adeli, HeartSaver: A mobile cardiac monitoring system for auto-detection of atrial fibrillation, myocardial infarction, and atrio-ventricular block. Volume 41, Issue 4 2011 page 211-214 [cited 2015-09-05] Available from:
http://www.sciencedirect.com.ezproxy.hkr.se/science/article/pii/S0010482511000205
[8] Puneet Kumar Jain, Anil Kumar Tiwari, Heart monitoring systems—A review Volume 54 2014 page 1-4 [cited 2015-09-05] Available from:

31
http://www.sciencedirect.com.ezproxy.hkr.se/science/article/pii/S0010482514002169
[9] Wai-Chi Fang, Hsiang-Cheh Huang, Shao-Yen Tseng, A design of heart rate variability processor for portable 3-lead ECG monitoring system-on-chip. Volume 40, Issue 52012 page 1492 [cited 2015-06-18] Available from:
http://www.sciencedirect.com.ezproxy.hkr.se/science/article/pii/S0957417412010032
[10] Janani Sriram, Minho Shin, Tanzeem Choudhury and David Kotz. Activity-aware ECG-based Patient Authentication for Remote Health Monitoring. international conference on Multimodal interfaces 2009, Page 297. [cited 2015-05-18] Available from:
http://dl.acm.org.ezproxy.hkr.se/citation.cfm?id=1647314.1647378&coll=DL&dl=ACM&CFID=557218676&CFTOKEN=20081474
[11] Adam Szczepański, Khalid Saeed A Mobile Device System for Early Warning of ECG Anomalies. Molecular Diversity Preservation International 2014 [cited 2015-09-28] Available from:
http://www.ncbi.nlm.nih.gov/pmc/articles/PMC4118409/
[12] Esra Guney, Ziya Eksi, Murat Cakiroglu WebECG: A novel ECG simulator based on Matlab web figure. 2011 page-1 [cited 2015-09-28] Available from:
http://www.sciencedirect.com.ezproxy.hkr.se/science/article/pii/S0965997811002444
[13] Per Runeson & Martin Höst. Guidelines for conducting and reporting case study research in software engineering. Empirical Software Engineering, Volume 64, page-135,14:131–164, 2009. [cited 2015-08-25] Available from:
http://www.sciencedirect.com.ezproxy.hkr.se/science/article/pii/S0950584915000646 [14] S. Rajasekar, P. Philominathan, V. Chinnathambi Research Methodology 2013 [cited 2015-09-28] Available from:
https://scholar.google.se/scholar?q=S.+Rajasekar%2C+P.+Philominathan%2C+V.+Chinnathambi+Research+Methodology+&btnG=&hl=sv&as_sdt=0%2C5
[15] Joel Coffman and Alfred C. A Framework for Evaluating Database Keyword Search Strategies. 19th ACM international conference on Information and knowledge management 2010 page1. [cited 2015-08-08] Available from:
http://dl.acm.org.ezproxy.hkr.se/citation.cfm?id=1871437.1871531&coll=DL&dl=ACM&CFID=557218676&CFTOKEN=20081474
[16] P. Friedmann, D. Adam Portable system for acquisition and transmission of ECG parameters.1992.01.01 [cited 2015-09-25] Available from:
http://link.springer.com/article/10.1007%2FBF02446194#page-1

32
[17] S. Maheshwari, A. Acharyya, P. Rajalakshmi, P.E. Puddu, M. Schiariti, Accurate and reliable 3-lead to 12-lead ECG reconstruction methodology for remote health monitoring applications. Volume 35, Issue 6, 2014 page-342 [cited 2015-09-03] Available from:
http://www.sciencedirect.com.ezproxy.hkr.se/science/article/pii/S1959031814000840
[18] Arini Widhiasia, Rosnah Idrusa, Muhammad Fermi Pashaa, Mohammad Syukurb A Feasibility Study Scheme of an Android-based Integrated Wearable ECG Monitoring System. The 4th International Conference on Emerging Ubiquitous Systems and Pervasive Networks (EUSPN-2013) and the 3rd International Conference on Current and Future Trends of Information and Communication Technologies in Healthcare (ICTH), Volume 21 2013 [cited 2015-09-28] Available from:
http://www.sciencedirect.com.ezproxy.hkr.se/science/article/pii/S1877050913008466
[19] Gavin Y Oudit MD PhD FRCPC, Doug Cameron MD FRCPC, Louise Harris MB ChB FRCP A case of appropriate inappropriate device therapy: Hyperkalemia-induced ventricular over sensing. Volume 24, Issue 3 2008 page 16-17 [cited 2015-09-28] Available from:
http://www.sciencedirect.com.ezproxy.hkr.se/science/article/pii/S0828282X08705920
[20] Sung-Bin Chon, Young Ho Kwak, Seung-Sik Hwang, Won Sup Oh, Jun-Ho Bae Severe hyperkalemia can be detected immediately by quantitative electrocardiography and clinical history in patients with symptomatic or extreme bradycardia: A retrospective cross-sectional study. Journal of Critical Care, Volume 28, Issue 6 2013 [cited 2015-10-05] Available from:
http://www.sciencedirect.com.ezproxy.hkr.se/science/article/pii/S0883944113003018
[21] Joel T Levis, MD, PhD, Facep, Faaem ECG Diagnosis: Hyperkalemia. National Center for biotechnology Information. 2013 [cited 2015-10-05] Available from:
http://www.ncbi.nlm.nih.gov/pmc/articles/PMC3627796/ [22] Weronica Linpe Magnetic interference from a tramway in electrocardiogram signals. 2015 [cited 2015-10-05] Available from:
https://scholar.google.com/scholar?q=Magnetic+interference+from+a+tramway+in+electrocardiogram+signals&btnG=&hl=sv&as_sdt=0%2C5 l [23] Onuiri Ernest E, Awodele Oludele, Adeagbo Boluwatife O, Madu Nissi C, Johnson Iniobong E. Design and construction of a microcontroller-based heartbeat monitoring device with display. International Journal of Engineering and technology 2014 [cited 2015-10-05] Available from: http://www.sciencepubco.com/index.php/ijet/article/view/2342/1167 [24] Huasong Cao, Haoming Li, Leo Stocco and Victor C. M. Leung Demonstration of A Novel Wireless Three-pad ECG System for Generating Conventional 12-lead Signals. Proceedings of the Fifth International Conference on Body Area Networks 2010 [cited 2015-10-15] Available from:
http://dl.acm.org.ezproxy.hkr.se/citation.cfm?id=2221924.2221931&coll=DL&dl=ACM&CFID=557218676&CFTOKEN=20081474

33
[25] Costas S. Iliopoulos, Spiros Michalakopoulos, Combinatorial ECG Analysis for Mobile Devices. Proceedings of the international conference on Multimedia information retrieval 2010 page [cited 2015-10-15] Available from:
http://dl.acm.org.ezproxy.hkr.se/citation.cfm?id=1743384.1743454&coll=DL&dl=ACM&CFID=557218676&CFTOKEN=20081474
[26] Jingyuan Li, Tejaswi Tamminedi, Guy Yosiphon, Anurag Ganguli, Lei Zhang, John A., Stankovic, Jacob Yadegar, Remote Physiological Monitoring of First Responders with Intermittent Network Connectivity. WH '10 Wireless Health 2010 [cited 2015-10-28] Available from:
http://dl.acm.org.ezproxy.hkr.se/citation.cfm?id=1921081.1921090&coll=DL&dl=ACM&CFID=557218676&CFTOKEN=20081474
[27] Lilly L.S. Pathophysiology of Heart Disease: A Collaborative Project of Medical Students and Faculty. 5th. Boston and Massachusetts, Lippincott Williams and Wilkins; Baltimore, MD, USA: 2010 Page75 [cited 2015-10-15] Available from:
https://books.google.se/books?id=0lxSGJYeXikC&pg=PR7&lpg=PR7&dq=Pathophysiology+of+Heart+Disease:+A+Collaborative+Project+of+Medical+Students+and+Faculty&source=bl&ots=9TvFJvCEsQ&sig=Rp9M2MEUMDsHSvNLOslBqWGKu4&hl=sv&sa=X&ved=0CIQBEOgBMA1qFQoTCOfU5a_78gCFaTycgodwpEMqg#v=onepage&q=Pathophysiology%20of%20Heart%20Disease%3A%20A%20Collaborative%20Project%20of%20Medical%20Students%20and%20Faculty&f=false [28] Goldberger’s Clinical Electrocardiography A Simplified Approach EIGHTH EDITION Ary L. Goldberger, MD, FACC, Zachary D. Goldberger, MD, MS, FACP and Alexei Shvilkin, MD, PhD, Boston and Massachusetts, Seattle and Washington. 2013 page: 8-10, 160-162 [cited 2015-10-15] Available from:
https://www.academia.edu/7327959/Goldbergers_clinical_electrocardiography_a_simplified_approach
[29] Introduction to ECG Interpretation Version 8.0 July 2012 Frank G. Yanowitz, MD[cited 2015-07-15] Available from: http://data.biitbook.com/Anatomy-of-Hypertensi-.-pdf.pdf [30] Walker HK, Hall WD, Hurst JW, e Clinical Methods: The History, Physical, and Laboratory Examinations. 3rd edition. Boston, Butterworths, 1990 chapter 33 [cited 2015-10-15] Available from:
http://www.ncbi.nlm.nih.gov/books/NBK201/
[31] http://www.physionet.org/physiotools/ecgsyn/paper/node2.htmll ECGSYN physionet patient mockup ECG database last accessed in 10th may 2015
[32] http://effectivehealthcare.ahrq.gov/glossary-of-terms/?pageaction=showterm&termid=34 last accessed in 10th may 2015

34
[33] PietroCinaglia, Giuseppe Tradigo, Pierangelo Veltr. A system for acquiring and management of ECG signals by using mobile devices: a support for first intervention in heart attacks. Proceedings of the ACM Conference on Bioinformatics, Computational Biology and Biomedicine page 677, 2012.
[cited 2015-10-15] Available from:
http://dl.acm.org.ezproxy.hkr.se/citation.cfm?id=2382936.2383058&coll=DL&dl=ACM&CFID=557218676&CFTOKEN=20081474 [34]http://www.nottingham.ac.uk/nursing/practice/resources/cardiology/acs/changes.php School of Health Science last accessed in 10th may 2015

35
10. Appendices and enclosures
Appendix A List of Tables
Table 1: Search keywords for databases
Database Name Search String ACM, Science Direct and Springer Link,
(a1. Mobile monitoring system on ECG ORa2. ECG warning system OR a3. Mobile early warning of ECG anomalies signal OR a4. Real time processing and transferring signal by mobile OR a5. Remote health monitoring system OR a6. E-health care system on ECG OR a7. Cloud-ECG monitoring system OR a8. Mobile electrocardiograph with wireless warning system OR a9. WBAN, Wavelet, BLE and SWS OR a10. Telemonitoring, wireless, GSM, Wi-Fi OR a11. Sensing algorithm for ECG telemonitoring in WBAN OR a12 Secure monitoring of remote patients) AND (b1. Pattern-matching analysis of ECG Signal OR b2. ECG signal Compression Analysis OR b3. Remote ECG signal monitoring OR b4. Real time processing and ECG signal OR b5. 3 and 12 lead ECG monitoring system OR b6. P, Q, R, S, T ECG signal OR b7. A wireless ECG system for generating conventional signal OR b8. Wavelet-based electrocardiograph signal compression method) AND (C1. Myocardial Infarction, Hyperkalemia, detection system OR c2. Cyber physical system on heart controlling OR c3. ECG based patient authentication OR c4. Accurate and reliable ECG monitoring methodology OR c5. Auto detection of atrial fibrillation Myocardial Infarction and atrio-ventricular block)
NCBI, NEJM, Academia and Google Scholar
(a1. Mobile monitoring system on ECG ORa2. ECG warning system OR a3. Mobile early warning of ECG anomalies signal OR a4. Real time processing and transferring signal by mobile OR a5. Remote health monitoring system OR a6. E-health care system on ECG OR a7. Cloud-ECG monitoring system OR a8. Mobile electrocardiograph with wireless warning system OR a9. WBAN, Wavelet, BLE and SWS OR a10. Telemonitoring, wireless, GSM, Wi-Fi OR a11. Sensing algorithm for ECG telemonitoring in WBAN OR a12 Secure monitoring of remote patients) AND (b1. Pattern-matching analysis of ECG Signal OR b2. ECG signal Compression Analysis OR b3. Remote ECG signal monitoring OR b4. Real time processing and ECG signal OR b5. 3 and 12 lead ECG monitoring system OR b6. P, Q, R, S, T ECG signal OR b7. A wireless ECG system for generating conventional signal OR b8. Wavelet-based electrocardiograph signal compression method) AND (C1. Myocardial Infarction, Hyperkalemia, detection system OR c2. Cyber physical system on heart controlling OR c3. ECG based patient authentication OR c4. Accurate and reliable ECG monitoring methodology OR c5. Auto detection of atrial fibrillation Myocardial Infarction and atrio-ventricullar block)

36
Table 2: Data extraction strategy table
Data Targeted Value Purpose General Information Primary purpose analysis Title
Author Publication Year Journal /Conference name
Primary Studies Charecteristics Type of study (yes/no) Theoretical study
Empirical study
Research Methodology Experiment Data collection Analysis SLR Theory
Real time ECG signal interpretation
Investigating ECG signal interpretation techniques to matching pattern
What is P, Q, R, S Answering RQ1
Effects of P, Q, R, S on Healthy ECG Changes of ECG based on environment condition. Current ECG technologies Comparison the ECG curve with simulated achieved data Age, position and drug situation The simulated data will be use as mock up for the research work
Detecting Abnormalities on ECG sample ECG Data
Simulated abnormal data Answering RQ2
Analysis abnormal data effects on ECG curve Understanding ECG requirement Difference of average normal and abnormal ECG curve
Analysis mock up data through database Constructing the sampling data for ECG curve
Design a warning system to register and analyze rapid, durable disturbances for predictions
Store the average value of Ecg wave
Answering RQ3
Analysis simulated data to identify the pattern matching curve Send alerts to corresponding parties at real time Display analyzed result in

37
graph view
Evaluation Group performance
Time
Tasks compilation
Other
What techniques have taken to accomplish the task
Group discussion
Pair coding
Meeting with teachers and researcher
Literature review
Testing

38
Table 3: Patient mockup data. [31] Time (s) Amplitude (mV)
0.000000 1.075095 3
0.003906 1.031029 0
0.007812 0.916540 0
0.011719 0.748307 0
0.015625 0.549199 0
0.019531 0.342897 0
0.023438 0.149521 0
-----------------------
0.027344 -0.016643 0
0.031250 -0.147374 0
0.035156 -0.239553 0
0.039062 -0.293963 0
0.042969 -0.314364 4
0.046875 -0.306833 0
0.050781 -0.279048 0
0.054688 -0.239311 0
0.058594 -0.195373 0
0.062500 -0.153381 0
0.066406 -0.117263 0
0.070312 -0.088692 0

39
Appendix B List of Figures
Figure 1:Different
Primary studies
characteristics
Figure 2: ECG
functionality through
human body [29]
Figure 3: First degree Atrioventricular Block [28]
Figure 4: Second Degree
Atrioventricular Bock [28]
13%
68%
19%
Theoreticalstudy
Empiricalstudy
TheoeiticalandEmpiricalstudy

40
Figure 5: Standard vs Hyperkalemia
Figure 6: Standard vs MI
Figure 7: standard vs heartblock
Figure 8: The algorithm for ECG signatures

41
Figure 9:
Simulated Server
Figure 10:
Simulate device client
Figure 11:
NODE JS testing

42
Figure 12:
Algorithm for
Hyperkalemia
Figure 13:
Algorithm for MI
Figure 14:
Algorithm for 3rd AVB

43
Figure 15:
Algorithm for normal
curve
Figure 16: Heart saver
basic Module

44
Appendix C List of Primary Studies ID
Publication name
Author
Type
Of
Study
Year
01 A Conceptual Design and Demonstration for an e-Care System
C. C. Li1, Y. S. Shiao1, Chin E. Lin2, C. C. Li2, C. J. Sun
Empirical
2009
02 Using Mobile-based Complex Event Processing to realize Collaborative Remote Person Monitoring
Nenad Stojanovic, Yongchun Xu, Aleksandar Stojadinovic, Ljiljana Stojanovic
Empirical
2014
03 Model based compressed sensing reconstruction algorithms for ECG telemonitoring in WBANs
Aris S. Lalos, Luis Alonso a, Christos Verikoukis
Empirical
2014
04 Development of a mobile electrocardiograph with a wireless warning embedded system
Moumtadi Fatimaa, Gómez Méndez Javiera , Delgado Hernández Julio Carlosb , Tovar Medina Robertoa
Empirical
and
theoretical
2012
05 Wireless sensor networks for healthcare: A survey
Hande Alemdar, CemErsoy,
Empirical
2010
06 Cloud-ECG for real time ECG monitoring and analysis
Henian Xiaa, Irfan Asif b, Xiaopeng Zhao
Empirical 2013
07 Activity-aware ECG-based Patient Authentication for Remote Health Monitoring
Janani Sriram, Minho Shin, Tanzeem Choudhury and David Kotz
Empirical
2009

45
08 A Framework for Evaluating Database Keyword Search Strategies
Joel Coffman and Alfred C. A
Empirical
and
theoretical
2010
09 Guidelines for conducting and reporting case study research in software engineering. Empirical Software Engineering
Per Runeson & Martin Höst
Empirical
and
theoretical
2009
10 A novel ECG simulator
based on Matlab web figure
Esra Guney, Ziya Eksi, Murat Cakiroglu
2011
11 A Mobile Device System for Early Warning of ECG Anomalies
Adam Szczepański, KhalidSaeed
Empirical
and
theoretical
2014
12 A mobile cardiac monitoring system for auto-detection of atrial fibrillation, myocardial infarction, and atrio-ventricular block
Ziad Sankari, Hojjat Adeli
Empirical
2011
13 A case of appropriate inappropriate device therapy: Hyperkalemia-induced ventricular oversensing
Gavin Y Oudit MD PhD FRCPC, Doug
Cameron MD FRCPC, Louise Harris MB ChB
FRCPC
Empirical
2008
14 A system for acquiring and management of ECG signals by using mobile devices: a support for first intervention in heart
Pietro Cinaglia, Giuseppe Tradigo, PierangeloVeltr
Empirical
2012

46
attacks 15 Heart monitoring
systems—A review Puneet Kumar Jain, Anil Kumar Tiwari
Empirical 2014
16 A Design of heart rate variability processor for portable 3-lead ECG monitoring system-on-chip
Wai-Chi Fang, Hsiang-Cheh Huang, Shao-Yen Tseng
Empirical
and
theoretical
2012
17 Accurate and reliable 3-lead to 12-lead ECG reconstruction methodology for remote health monitoring applications
S. Maheshwari, A. Acharyya, P. Rajalakshmi, P.E. Puddu, M. Schiariti,
Empirical
2014
18 A Feasibility Study Scheme of an Android-based Integrated Wearable ECG Monitoring System
AriniWidhiasia ,Rosnah Idrusa, Muhammad Fermi Pashaa, Mohammad Syukurb
Empirical
2013
19 Portable system for acquisition and transmission of ECG parameters
P. Friedmann, D. Adam
Empirical
1992
20 Severe hyperkalemia can be detected immediately by quantitative electrocardiography and clinical history in patients with symptomatic or extreme bradycardia: A retrospective cross-sectional study.
Sung-Bin Chon, Young Ho Kwak, Seung-Sik Hwang, Won Sup Oh, Jun-Ho Bae
Empirical
2013
21 ECG Diagnosis: Hyperkalemia
Joel T Levis, MD, PhD, Facep, Faaem
2013
47
28
Goldberger’s Clinical Electrocardiography A Simplified Approach EIGHTH EDITION
Ary L. Goldberger, MD, FACC, Zachary D. Goldberger, MD, MS, FACP and Alexei Shvilkin, MD, PhD
Theoretical
2013
22 Magnetic interference from a tramway in electrocardiogram signals
Weronica Linp´e Empirical
and
theoretical
2015
23 Design and construction of a microcontroller-based heartbeat monitoring device with display.
Onuiri Ernest E,Awodele Oludele, Adeagbo Boluwatife O, MaduNissi C, Johnson Iniobong E.
Empirical
2014
24 Demonstration of A Novel Wireless Three-pad ECG System for Generating Conventional 12-lead Signals
Huasong Cao, Haoming Li, Leo Stocco and Victor C. M. Leung
Empirical
2010
25 Combinatorial ECG Analysis for Mobile Devices. 2010
Costas S. Iliopoulos, Spiros Michalakopoulos,
Empirical
2010
26 Remote Physiological Monitoring of First Responders with Intermittent Network Connectivity.
Jingyuan Li, Tejaswi Tamminedi, Guy Yosiphon, Anurag Ganguli, Lei Zhang, John A., Stankovic, Jacob Yadegar,
Empirical
2010
27 Lilly L.S. Pathophysiology of Heart Disease: A Collaborative Project of Medical Students and Faculty. 5th.
Lippincott Williams and Wilkins; Baltimore, MD,
Theoretical
2010

48
29 Introduction to ECG InterpretationV8.0
Frank G. Yanowitz, MD
Theoretical
2012
30 Clinical Methods: The History, Physical, and Laboratory Examinations. 3rd edition
Walker HK, Hall WD, Hurst JW,
Theoretical
1990
31 RESEARCH METHODOLOGY
S. Rajasekar, P. Philominathan, V. Chinnathambi
Empirical
2013

49
Appendix D List of abbreviations and enclosures
A:
AVB:Atrioventricular block
G:
GSM: Global System for Mobile Communications
P
PTBDB: PhysioNet’s PTB Database
B
BLE: Bluetooth Low
Energy
M:
ML12: Mason–Likar 12-Lead
MCOT: Mobile Cardiac Outpatient Telemetry
MI: Myocardial Infarction
S
SLR: Systematic Literature Review
E:
ECG: Electrocardiogram
N
NCBI: National Center for Biotechnology Information
NEJM: New England Journal for Medicine
W:
WBAN: Wide Body Area Network
Wi-Fi: Wireless Fidelity