MASTER'S THESIS - DiVA Portal
70
RESEARCH ON RESPONSE AND RELATIONS BETWEEN CUSTOMERS AND BRAND EQUITY (A COMPARATIVE STUDY OF MCDONALD AND MAX IN SWEDEN) May, 2011 Authors: Diep Nguyen Thi Bich and Junu Maiya Balami Subject: Master Thesis in Business Administration 15 ECTS Program: Master in International Management Gotland University Spring Semester 2011 Supervisors: Professor Per Lind and Fredrick Sjöstrand MASTER’S THESIS
-
Upload
khangminh22 -
Category
Documents
-
view
0 -
download
0
Transcript of MASTER'S THESIS - DiVA Portal

RESEARCH ON RESPONSE AND RELATIONS BETWEEN CUSTOMERS AND
BRAND EQUITY
(A COMPARATIVE STUDY OF MCDONALD AND MAX IN SWEDEN)
May, 2011
Authors: Diep Nguyen Thi Bich and Junu Maiya Balami
Subject: Master Thesis in Business Administration 15 ECTS
Program: Master in International Management
Gotland University
Spring Semester 2011
Supervisors: Professor Per Lind and Fredrick Sjöstrand
MASTER’S THESIS

ABSTRACT
Despite of economic downturn in recent years, the food service industry has performed well
in Sweden and has grown by 4.1% in 2009. Now, the players are in a battle of differentiating
their products/services and offers, as the degree of competition are moderately high in the
market. Hence, building a strong brand image has apparently become a foremost tactics
particularly in food chain industry.
The study aims to contribute on the concrete importance of brand equity management in the
fast food chain especially by illustrating real empirical cases of McDonald and Max in
Sweden. This comparative study attempts to figure out consumer’s attitudes, preference and
behavior that are affected by equity assets; brand awareness, perceived value, brand loyalty
and brand associations in one way or another. Based on a quantitative survey, consumer’s
brand knowledge is examined to confirm the brand value added by these brand equity assets.
Key words: Fast-food industry, Brand, Brand equity, McDonald, Max, Sweden.

ACKNOWLEDGEMENT
This Master thesis was possible with a fruitful collaboration of all people who have
contributed with a great willingness and devotion for this study.
First of all, we would like to grant our honor to our supervisors Professor Per Lind and Mr.
Fredrik Sjöstrand for their guidance and kind cooperation. Their valuable comment with their
vast knowledge and assistance has developed our research in an appropriate way.
We would like to thank our fellow students in Master of International Management 2010-
2011 program of Gotland University for their help throughout the whole period of the study.
Last but not least, we owe our deepest gratitude to Mrs Nguyen Hong Thuy, Mr Nguyen
Thanh Tam, Mr Nguyen Binh Nguyen, Mr. and Mrs. Ram Lal Balami, Mattias Engström and
Hilton Mombosho who are always by our sides and encourage us incessantly. Their patience,
blessings and greater support is always appreciable.
Thank you all.
Visby, May 2011.
Nguyen Thi Bich Diep and Junu Maiya Balami.

ABBREVIATION
BE-Brand Equity
CBBE- Customer Based Brand Equity Management
EPS- Extended Problem Solving
LPS-Limited Problem Solving
RPS- Routine Problem Solving
WOM- Word of Mouth

CONTENTS CHAPTER 1 INTRODUCTION ............................................................................................1
1.1 Background ..................................................................................................................1
1.2 Problem discussion ......................................................................................................3
1.3 Purpose formulation .....................................................................................................3
1.4 Organization of the study .............................................................................................4
CHAPTER 2. RESEARCH METHODOLOGY .....................................................................5
2.1 Research strategy .......................................................................................................5
2.2 Research design ...........................................................................................................5
2.3 Scientific approach .......................................................................................................6
2.4 Data collection .............................................................................................................7
2.5 Construction of Questionnaire ......................................................................................8
2.6 Data analysis ................................................................................................................9
2.7 Population and Sample ............................................................................................... 11
2.8 Research method assessment ...................................................................................... 12
2.8.1 Replicability ....................................................................................................... 12
2.8.2 Reliability ........................................................................................................... 12
2.8.3 Validity ............................................................................................................... 13
2.8.4 Limitation ........................................................................................................... 13
CHAPTER 3 : THEORITICAL FRAMEWORK ................................................................. 14
3.1 An overview of Consumer Behavior Analysis ............................................................ 14
3.2 Brand Equity .............................................................................................................. 18
3.3 An Overview of Customer Based Brand ..................................................................... 18
3.3.1.Brand Loyalty ..................................................................................................... 20
3.3.2 Brand awareness ................................................................................................. 21
3.3.3 Perceived Quality................................................................................................ 21
3.3.4 Brand Associations ............................................................................................. 22
3.4 Aaker’s Brand Equity Model ...................................................................................... 23
3.5 Brand Equity Relationship and Benefits ..................................................................... 25
3.6 Marketing Strategy for Brand Equity Management ..................................................... 26
3.6.1. Product attributes ............................................................................................... 26
3.6.2. Price Strategy..................................................................................................... 27
3.6.3. Target Audience ................................................................................................ 27
3.6.4. Marketing Strategy ............................................................................................ 28
CHAPTER 4. DATA ANALYSIS ........................................................................................ 29
4.1 Fast food Overview .................................................................................................... 29
4.1.1 McDonald .......................................................................................................... 29
4.1.2 MAX Hamburger ................................................................................................ 31
4.2 Descriptive statistics ................................................................................................... 32
4.3 Customer based brand equity analysis ........................................................................ 34
4.4.1 Brand Awareness ................................................................................................ 35
4.4.2 Brand Loyalty ..................................................................................................... 37
4.4.3 Perceived quality ................................................................................................ 38
4.4.4 Brand Associations ............................................................................................. 43
CHAPTER 5 DISCUSSION ................................................................................................. 46
5.1 Findings and discussion .............................................................................................. 46
5.1.1 Burger War: Became world news ........................................................................ 46
5.1.2 Empirical Findings .............................................................................................. 46
CHAPTER 6 CONCLUSION AND RECOMMENDATION ............................................... 50
6.1 Conclusion ................................................................................................................. 50
6.2 Recommendation ....................................................................................................... 51
REFERENCES ..................................................................................................................... 53
APPENDIX 1: Questionnaire: Survey on fast food consumption .......................................... 57
APPENDIX 2: PERCEIVED QUALITY .............................................................................. 62

LIST OF TABLES
Table 3.1 Types of Consumer Behavior 15
Table 4.1 McDonald’s different menus around the world 30
Table 4.2 Distribution of the respondents via visiting frequency categories 34
Table 4.3 Distribution of the respondents via budget categories 34
Table 4.4 Customer’s recognition of fast food’s logos and slogans 36
Table 4.5 Customer’s loyalty toward a specific brand 37
Table 4.6 MAX: Estimating the performance and importance of Perceived value 39
Table 4.7 McDonald: Estimating the performance and importance of Perceived value 40
Table 4.8 Importance-Performance grid of the four most prominent for Max and McDonald 42
Table 4.9 Ranking of Fast food preference 44
Table 4.10 Communication mix 45
Table 5.1 Measuring Brand Equity of MAX and McDonald 47
LIST OF FIGURES
Figure 3.1 EKB Model 16
Figure 3.2 Aaker’s Brand Equity Model 24
Figure 3.3 Relationship of Brand Equity 25
Figure 4.1 Characteristics of Respondents 33
Figure 4.2 Top of mind brand 36
Figure 4.3 IPA Analysis of Perceived Value for MAX 39
Figure 4.4 IPA Analysis of Perceived Value for Mc Donald 41
Figure 4.5 IPA Analysis of Perceived Value for MAX and McDonald 43
Figure 5.1 Measuring Brand Equity of MAX and McDonald 47

1
CHAPTER 1 INTRODUCTION
Today, the best known brands like Microsoft, Google, and Coca-Cola are spending large
amount of money on advertising. The advertising research (2007) has founded Microsoft
expenses more than 20 percent of their annual revenue, Google-around $188 million and
Coca-Cola – more than $2.5 billion in advertising. It is surprising. They have already a
strong brand name, a reputed image and own identification but still they concentrate on
marketing mix strategy. Why? It is obvious that to attain first choice in consumers mind and
to enjoy competitive advantage in the contemporary market. Hence, the objective of this study
is to dig out the reason behind the performance of this branding and attached equity assets
that influence the whole process.
1.1 Background
In the market, several products are introduced and numbers of brands proliferate, Aaker
(1991). In the midst of numerous product/ brands choice, how consumers behave to a
particular brand is a triggering fact for everyone. Perhaps it could be the brand of a product
that creates a unique identification and differentiation in the consumer’s mind or various
brand elements that excitingly lead consumers for purchase intention or any competitive
offerings that enhance them to retain their loyalty and preferences. Answers could be many
but all of them are somehow related with branding.
Branding existed for centuries as a way of distinguishing the goods of one producer from
those of another, while modern branding finds its origin in the 19th century (A.Room, 1992).
Then, branding started becoming a special meaning to consumers and now prominently
consider as company’s most valuable assets in many countries. According to American
Marketing Association (Keller, 1998:2), a brand is a “name, term, sign, symbol, or design, or
a combination of them intended to identify the goods and services of one seller or a group of
sellers and to differentiate from those of competitors”. Branding is the foremost component
exists with the product when it is introduced in the market. To make it meaningful and
attractive, a brand name is given in different forms. For example, brand name based on People
(McDonald, Estee Lauer cosmetics), places (British airways, Chrysler’s New Yorker),
company name (Volvo, General Electric), animals or birds (Dove, Mustang automobiles),
things or objects (Apple computers, Shell gasoline) or something that sounds scientific (Intel
micro processors, Lexus automobiles). Besides, there are various components either explicitly

2
or implicitly attached with brand, so called as brand elements like logos, image and symbols.
So, marketers have a lot of choices to identify their products in different ways and in different
forms such as name and other brand elements (Keller, 1998). The reason behind these varied
choices is that they add value to a product in terms of perceived quality, inferred attributes,
and eventually, consumer’s awareness and brand loyalty. The perspective of acknowledging
the benefit of “additional value” by brand connotations is labeled as customer-based brand
equity.
The basic notion of Customer Based-Brand Equity is that the power of brand lies in what
customers have learned, felt, seen and heard about the brand followed by their experiences
over time (Keller, 1998). It is a collection of brand assets such as awareness, loyal customers,
perceived quality and associations attached to a brand (its name and symbol) which add or
subtract value to the product or service being offered (Aaker, 1991). In fact it embraces all
tangible and intangible attributes that the business stands for.
Within the marketing literature CBBE can be sort out into two groups for easy understanding;
Consumer perception (brand awareness, brand associations, perceived quality) and
Consumer behavior (brand loyalty, willingness to pay a high price). These dimensions allow
marketing managers to notice that to understand Brand equity is to learn a best way of
structuring marketing tactics to win over consumer’s mind and heart by ensuing maximum
consumer satisfaction level and brand loyalty, which in turn affect on profitability of firm.
Further, it provides a competitive advantage that often presents a real barrier to the
competitors. Thus, brand equity functions as a judgmental asset for the companies who are
seeking for growth opportunities in the market. For this reason, the issue of brand equity has
emerged as one of the most crucial topic in marketing management. And many researchers
like Aaker (1991), Keller (1993 &1998) and Prasad (2000), have been interested in the
concept of brand equity management and emphasized its importance in competitive market.
The concept of Consumer based brand equity was put forward in this research study to give
an overview of brand’s performance based on consumer’s perspective by comparing what
happens if the same product or service did not have brand identification or have poor brand
equity. This approach was necessitated because each consumer’s activities are influenced
somehow by brand and its attached equity relating to what is in consumer’s head about a
particular brand, the firm and its product and how they behave correspondingly. Therefore, it
is understandable that how greater impact does CBBE brings in marketing world.

3
1.2 Problem discussion
The complexity of surviving in a competitive world is not merely increasing a number of
customers and selling more products. When it comes to booming service industry, a company
requires to prioritize on keeping loyal customers and expanding a market share too
particularly in fast-food industry, products and services are likely similar. Hence, product
variation and unique brand connotations are indispensable for these companies to create a
high level of awareness and familiarity in consumer’s memory (Keller, 1998). This allows
consumers to act more favorably to strong brand over poor brand.
The emphasis of the study is to reveal the importance of brand equity and its associate
components namely; brand awareness, brand loyalty, brand image and perceive quality in
interaction to popular fast-food chains in Sweden: McDonald and Max Burger. With their
comparative study , The previous studies on CBBE approach have found focused on the other
era of service sector; such as hotels, bank, healthcare, beauty etc. and now the this study has
consider a fast food industry setting to measure both product and service characteristics in
terms of brand equity.
1.3 Purpose formulation
The purpose of this study was to virtually examine the influential affect of brand equity on
consumer behavior and firm’s performance and it attempts to do so by illustrating the
relationship encircled between brand equity, consumer and the firm with both theoretical
concept and practical exemplification. Therefore, the thesis is expected:
- Firstly, to contribute to extensive Customer Based Brand Equity (CBBE) model by
corresponding concepts and previous literatures;
- Secondly, to deliver an outline of the associations between consumers with McDonald
and Max Burger brand in the peripheral of CBBE framework
- Thirdly, to propose some suggestions for maintainable brand equity of fast food
industry, specifically McDonald and Max Burger
To achieve the above mentioned purpose of the research, the authors made an effort to study
with the following research question:

4
• What are the values added by brand equity that makes it so addressable and valuable
to the marketers?
So, the academic intention of this study is to highlight the crucial importance of brand equity
management in the firm. Research investigation was undertaken with a central theme of this
problem statement in relation to concepts and theories based on which questionnaire was set
up to experiment on empirical cases i.e. MAX and McDonald. Thereafter the findings and
conclusions were extracted to accomplish the purpose of this research.
1.4 Organization of the study
The organization of the study gives you a synopsis of entire thesis. It constitutes of five parts
as outlined below.
Part 1 Introduction This section reveals about a background of brand equity management
in general and purpose of conducting the research regarding brand equity.
Part 2 Research Methodology This division states on research methods that are required
to apply for empirical cases. They guide researchers in making inquiries in an
appropriate way so as to collect needed materials for the study.
Part 3 Theoretical framework This part proposes relevant theories and concepts to
evidently support the thesis writing and also discloses corresponding previous studies
and literatures.
Part 4 Data analysis This chapter introduces empirical cases with a background and
eventually analyze materials discover from data collection regarding empirical cases.
Part 5 Empirical Findings In this section, collected data from Data analysis chapter are
discuss by highlighting important facts on empirical cases and also examine if a
research problem is answered.
Part 6 Conclusion and Recommendation This final part underlines a summary of thesis
research in response to a research problem and offers some recommendations on the
basis of findings.

5
CHAPTER 2. RESEARCH METHODOLOGY
The intention of this chapter is to define and demonstrate appropriate research methods
applied for this study. It presents an accurate means of arranging questionnaire survey to
target group to make data collection valid and reliable.
2.1 Research strategy
In general, a research is conduct to discover solution to a research problem. To attain this
goal, a research plan must be design which is termed as research strategy. It guides necessary
steps and tools to follow for collection of required research materials. Later on, collected data
are analyzed and examined to draw a scientific and valid answer to a research question.
As a foremost research strategy in this thesis, substantial information was gathered on the
basis of background study regarding Brand Equity. Thereafter, a questionnaire was designed
on the foundation of CBBE approach and piloted on McDonald and MAX, to explore an
impact of CBBE at their corporate level. So, the questionnaire survey has planned to circulate
among consumers for data collection and results can extract accordingly. Further, conclusions
and recommendations will be made based on the findings.
2.2 Research design
A research design is a detail work plan that is carried out to structure a flow of steps proceeds
to obtain the required answers for research problem. Nevertheless, it varies as per the nature
of research study. Bryman & Bell (2007) classify research design in five different groups:
• Experimental Design- Analysis of data based on Experiment based on casual effect
research question
• Cross-sectional Design-Analysis of data based on more case studies with two or more
variables at the same time in different countries
• Longitudinal Design-Analysis of data at several different times
• Case Study Design-Data analysis of single case
• Comparative Design- Data analysis of two or more cases

6
Since the research is about the study of consumers’ response on Brand equity of MAX and
McDonald in Sweden so, it needs to weigh up firm’s performance in fulfilling consumer’s
expectation in terms of Brand Equity. This has necessitated a comparative research design to
undertake for a research. As a part of research method, quantitative method has been
approached with an intention to gather enormous consumer’s responses towards both brands.
Normally, there are two types of research method for the collection of data.
• Qualitative Method-Emphasize on generating theories based on interpretation and
observation. The interviews and focus group are used for collection of data which are
flexible and textual.
• Quantitative Method-Emphasize on testing existing theories based on quantification.
The structured models of questionnaires, survey and observation are used for
collection of data which are rather flexible and numeric.
According to Leedy (2001), quantitative method is used to describe prophesy, measurable
phenomena with measurable variables. It means the data is tested in a statistic base by
developing hypothesis and mathematical model on the foundation of existing theories. For
this, the method employs a lot of subjects, the specimen of respondent that makes more
opportunities to create any kind of generalization. Therefore, the use of quantitative method
raises the higher chances of covering larger respondents in comparison to qualitative method.
For the reason, questionnaire survey was passed out to numbers of consumers in Sweden to
cover 200 fast food consumers. The benefit of using questionnaire survey is it allows
collecting data from a geographically scattered sample group, Gratton and Jones (2004). In
addition, it is both time-saving and cost-saving.
2.3 Scientific approach
Bryman & Bell (2007) have offer two distinctive methods for research; inductive and
deductive. They state that these are basic methods to guide whether information is gathered to
test or construct theories. When researchers would like to build the theory on the basis of their
results throughout investigation, they often use inductive approach. Meanwhile, deductive
approach is frequently used to test hypotheses in order to substantiate the general ideas.
The thesis’s aim is not to create a new hypothesis but to illustrate the theory of CBBE with a
comparative study of consumer’s reaction towards strong brands Max and McDonald and
their equity assets. Hence, this thesis research is developed upon the deductive approach.

7
2.4 Data collection
In research methodology, obtaining obligatory data is another important requirement. Lack of
needed data can not accomplish the purpose of conducting any research. Hence, data
collection should be undertaken in a planned and efficient manner to assemble data within a
specified time to resolve stated problem. Two ways of data collection are used in research;
primary data and secondary data. According to Bryman and Bell (2007), primary data is the
information related to research problems and assembled mostly for the purpose of study, from
which the scholars can accumulate by their own way, for example interviews, surveys, tests
etc. They are foremost answers to the subjected questions and it need to gather by the
researcher himself. So, researcher has to take initiative to find suitable data which is very
flexible and innovative. In contrast, secondary data relates to the information which has been
assembled by other investigators in previous literatures, science journals, and articles etc but
can be influential to others depending on research objectives. Hence, the secondary data can
provide a wider chance or set of options for researchers as it saves both time and cost and
meanwhile supply the suitable tools and data to investigate.
The study has used both primary and secondary data to acquire extensive information on
consumer’s reaction towards brands - MAX and McDonald. The questionnaires were
distributed via online and written form among consumers in Sweden which had been
performed on the month April, 2011.
With an intention to meet 200 sample size, 80 questionnaires were distributed by online
survey on spreadsheets.google.com in Sweden and 120 questionnaires via printed version to
consumers by approaching authors themselves. Although we receive 200 sheets as per a target
sample size but only 180 sheets were valid. This means it accounted 90% of research
accomplishment (i.e.180 valid sheets out of target size 200). There were 20 incomplete
questionnaires because some of participants had not pay attention on detailed characteristic
when using services and products of both restaurants. The unfinished questionnaires were not
considered since they might lead to inaccuracy in outcome.
While doing online survey, the questionnaire was forwarded to all people who were fast food
consumers in Sweden and were in connection with authors. Similarly, the printed sheets of
questionnaire were disseminated at Sergels Torg, Stockholm and Visby, Gotland in Sweden.
Sergels Torg is the most central public square in Stockholm and is just a three-minute walk

8
from the central station. Similarly, Visby is the central part of Gotland, whereby both MAX
and McDonald’s restaurant are situated in Östercentrum, a place full of crowds of people both
day and night and apart from that Pingstchurch and Gotland University were also chosen for
this survey to distribute questionnaire. The survey aimed to cover a diverse group of people
that mirror consumers in the fast food restaurants, especially in MAX and McDonald in
Sweden.
The secondary data from credible internet sources for instance; companies’ websites, official
sources were collected and used as reference. Besides, relevant literatures at Gotland
University and Stockholm University were also the most utilized sources in our thesis.
2.5 Construction of Questionnaire
Constructing relevant questionnaire is a complex task. They are not merely a list of questions
but the way to extract needed information to reach out the problem solution. Hence, it is one
way of primary data collection. Based on the nature of research methods and research
purpose, questionnaires can be constructed either open or closed questions. Open questions
are unstructured and respondents are asked to answer in their own way and outdrawn for
qualitative information. But Closed Questions are opposite, structured, and done to obtain
quantitative information. As Bryman & Bell (2007) state, the chances are given for
respondents by open questions and will serve to enlarge their knowledge in desired area.
Nevertheless, closed questions are far easier to process for analysis than open questions and
also increase possibilities for comparative results.
The questionnaire of this thesis included 18 questions and was categorized into two parts. The
first part has covered general questions about participants including their gender, age (less
than 15, between 15 and 35, 35 and above) and mother tongue. The second part consisted of
both open questions and closed questions. The open questions were designed to know overall
status of two restaurants in consumers’ mind such as asking respondents to give the name of
fast food restaurant appear in their mind at first. Similarly, closed questions were designed to
evaluate the significance of service factors concerning products, price, promotions, service
quality, and satisfaction level. This arrangement was done to devise consumer’s own
preference first and then, grade the significance of brand equity’s dimensions. It helps to draw
a cognitive conclusion of Brand equity Management in both brands by assessing consumers’
awareness, loyalty and brand knowledge.

9
In addition, the authors used Likert-scale with 5 points in the questionnaire in which, the
respondents were required to grade the scale of their satisfaction for particular thing. In this
survey “1” represents “The least important” and “Do not satisfy at all”, in contrast, “5”
represents “The most important” and “Satisfy totally”. The Likert-scale (develop by Rensis),
has been used by many researchers for nearly four decades and mostly used in survey
research. According to Neuman (2000), the advantage of using Likert scale is because it is
simple and easy to use. He also proposes the reliability of data conducted with this scale is
highly valued. Therefore, it is easy for the authors to elucidate the analysis for the credibility
it has created for.
2.6 Data analysis
Office Excel is seen as the popular and advanced software used for data analysis. Due to its
user-friendliness, accumulated data for this thesis research were analyzed in Excel which is
often used in business research.
For the statics base, mean average and standard deviation are computed to evaluate the
variability of dataset. According to Business Dictionary (2011), the mean is a very useful
measure to describe a lot of data since it is the mathematical average of all values. Besides,
the Business Dictionary states that standard deviation serves as a measure of unpredictability
of a random variable. Hence, both mean and standard deviation has been used as per
requisition in data analysis including pie-chart and bar-diagrams to make data analysis more
illustrious.
IPA (Important performance) analysis
According to Bacon (2003), Martilla and James were the first people presented the simple
technique called IPA analysis in 1977. The fundamental notion of IPA is using a market
survey to interpret the consumer’s satisfaction in the attributes which is prioritized by them in
order to understand improvement attributes of service quality.
The IPA analysis is 2*2 matrixes comprise of Importance and performance attributes with
their gap analysis in four quadrants, the Importance and Performance will be evaluated from 0
to 4 or 5, where 0 scores for the lowest. Bacon (2003) has well-versed that once the
importance and performance attributes are plotted, IP gap is divided into four quadrants and

10
based on those priorities, improvement attributes are drawn. The points of attributes are
plotted according to Customer’s priority on those particular service qualities whereby, the
cross point for quadrant is set in such way that it acts as a median to divide all four quadrants
equally. The four quadrants are:
• Keep up the good work- Both importance and performance exceeds high score
• Concentrate here- importance scores high but performance falls low score
• Low priority- Neither performance meet the standard nor the importance scores
high
• Possible overkill-Performance scores high although the importance standards is
low
Wade & Eagles (2003) recommend this analysis as best fitting for the survey which uses
Likert scale. Since the questionnaire in the thesis research was set on the base of Likert scale
with 5 points so, IP analysis is best suited to formulate the accumulated data.

11
2.7 Population and Sample
In research methodology, defining a sample is a sort of efficiency which will show the
accuracy of data collection. Therefore, being a precise for sample and population is an
integral part of research design.
Population is defined as audience aim for the collection of information sought by the
researcher for the particular problem, (Malhotra & Birks, 2007). However due to their vague
nature individual data collection is impossible to done with all of them so on the base of target
population, a sample size is extracted to represent the population. Thus, a sample is selected
as to exemplify the whole population in a small and limited number making sure that right
respondents will be choose depending upon age group, demographics, gender or many others
for accuracy of survey.
Bryman & Bell (2007) offer two kinds of approaches in business studies: Probability
approach and non-probability. Firstly, in probability approach, a sample can be chosen
randomly, i.e., each person in the population has the equivalent opportunity of being chosen.
Simple random sample, systematic sample, stratified random sampling and multi-stage cluster
samplings are four types of probability sample. Secondly, non-probability sampling in which,
a sample is not chosen randomly, thus the specimens have not been representative and it is
impossible to carry out a legitimate inference about population. The non-probability includes
convenience sampling, snowball sampling and quota sampling.
In the case of this study, it is not possible to recognize every people in Sweden, thus the thesis
was implemented by applying convenience specimens. According to Business dictionary
online (2011) the convenience sampling is frequently used to prevent the low response rate
and gather the data on time. Since time and resources are the big obstacles, in addition, the
authors do not have the list of fast food customers in Sweden to create a random sample, the
convenience sampling is helpful and suitable for the research purpose to collect empirical
material.
The purpose of conducting this convenience sampling has many good reasons. The most
importantly, Max is a national Brand and Swedish people are strongly familiar with it but the
international people are not. In contrast, McDonald is a recognizable and global brand which
is popular among both Swedish and other people who are now living in Sweden. Another
good reason behind executing the survey on Gotland and Stockholm is that

12
• Gotland is a touristic place having many immigrants and frequent visitors of different
nationalities and
• Simultaneously, Stockholm is the capital city with numerous MAX and McDonald’s
restaurants including many other fast food chains and with enormous number of
people.
Authors have undertaken the survey in these places by themselves via interaction. The survey
began with the question: “Have you ever bought fast food”. From that, the population can be
restricted by only people buy fast food to gather data from people who are in buying fast food
situation. If the participants have never bought fast food before, they may not answer many
questions in the questionnaire. Furthermore, it would be inaccurate if the data is collected
from people who do not buy fast food while the thesis concentrate on customers’ perception
about Max and McDonald based on evaluation about their products and services.
2.8 Research method assessment
2.8.1 Replicability
By suggestion from Malhotra Birks (2007), the survey focuses on characterizing the
procedures of study related to data collection process, choose participants and design
questionnaires in order to raise the replicability of the study.
2.8.2 Reliability
Saunder (2003) argues that there are four factors may affect to reliability of the thesis’s result,
they are “subject or participant error, subject or participant bias, observer’s bias and
observer’s error”. In order to test the result’s reliability, there are two main ways (Muijis,
2004). The first method is repeated measurement in which, the same results are displayed
even though it is measured at different times. The second one is internal consistency
reliability.
In the survey, first a pre-test was taken with a sample of 8 students from Gotland University
was accomplished to heighten the reliability of the questionnaire. They were asked for their
viewpoint about fast food restaurants and feedback regarding the questionnaire so; they
informed that questions were easily understandable and take not more than 5 minutes to
complete. Nevertheless, one item was added in brand loyalty to identify the customer

13
awareness toward fast food restaurants’ slogans and two items about “accuracy of serving the
order” and “additional service (i.e. access to wireless, internet; music, toys for children and
many others)” were also added on to fulfill a better construct. In addition, we also save all
answers for re-examine later.
2.8.3 Validity
The participants took part in the survey were people living in Sweden who could come from
many other countries. For that reason, the researchers attempted to verify the ability to take
care of those who have been using the products of two restaurants. Besides, the researchers
made an effort to build the questionnaires which can achieve the answers for the research
problem. The simple English was used in this thesis as well to prevent misunderstanding
because English is not mother tongue of almost respondents.
2.8.4 Limitation
A short span of time had limited the research though best efforts were made during the last
five months. Besides, the length of the questionnaire was also a problem which the authors
had to consider as well because the participants could have pay less concentration on the
second part of this survey and on online survey participants also lack interest and motivation,
as a result, many respondents have drop out the survey.
The selected sample may not also generalize the population of Sweden due to small
specimens of 200 respondents. In many cases, the participants were assumed that they were
truthful and frank so, the credibility of data collection also depends on consumer’s honesty.
Furthermore, to the quantitative methodology used in this research, it would be useful for
further investigations to conduct more open and unstructured questions from other sides (i.e.
companies’ out-look) to create an extensive and generalized comparative study on response
and relation between customers and brand equity

14
CHAPTER 3 : THEORITICAL FRAMEWORK
This chapter is a principal base for the thesis study as it supports the research purpose by
relevant concepts, theories and models. With available literatures, CBBE framework has
conceptualized in a scientic base and has narrate with consumer behavior process at a
firm’s level.
It understands from introduction chapter that brand equity is an integrated and indispensable
part of marketing management. It is an equity assets come along with a branding of a product
influencing entire process of consumer activities. Hence, the chapter starts with a brief
description of consumer and their activities in the market and steadily it will connect with a
fundamental concept of CBBE approach.
3.1 An overview of Consumer Behavior Analysis:
A consumer behavior is an ongoing buying process of various consumer actions like
searching, selecting, purchasing, consuming, evaluating and disposing the products to attain
their needs and desires (Belch & Belch, 2004 cited in SueLin, 2010). In other words it is a
series of exchange process that initiates from acquiring (searching and selecting the product
with enough information), then moving to consuming (the reason to purchase) and at the end
to disposing (after purchasing activities like consumer satisfaction). Thus, it is understandable
that the most reason for an organization to exit in the long run is to fulfill exchange partners,
needs and desires by performing all three activities of pre-purchase, purchase and post
purchase. In marketing consumers are regarded as “king”. Mowen (1995) also defines them as
human behavior attending an exchange process to satisfy needs and desires. Everyone
practices consumer experience in one way or another like demanding needed things, buying
desired things, and exploring excitement words in the market used by consumers like, “Wow!
My favorite”, “Ugh!! It is weird”, “hmm, it is expensive”, “Common, Lets’ buy Ben and
Jerry’s chocolate ice-cream” are the ordinary reactions and practices shown in the
marketplace. Also, different aspects of consumer buying behavior like; selecting a toy for
babies to luxurious car depends on varied consumer’s taste and preference. Hence, it is
important for producers to acknowledge a changing pattern of consumer behavior in different
situation over time so, as to produce new product, new taste and new technology to make
them acceptable by consumers and satisfy them (Howard, 1989).

15
The pattern of consumer behavior relies on their involvement in accumulating information as
illustrate in the table 3.1. According to this table, consumers in Extended Problem Solving
stage are unfamiliar with product category. They are presumably potential consumers who are
easily enthused by effective communication mix and sales promos. In contrary, Routine
Problem Solving consumers are committed to a particular brand and have high degree of
confidence on solving a problem in cognitive way. Hence, their buying behavior proceeds
with low involvement. Nevertheless, consumers in Limited Problem Solving stage are in
between. They are completely aware about the product category but still interested in trying
and switching new and different brands.
Table 3.1: Types of Consumer behavior
Pattern of Behavior Consumer life
cycle
Confidence and
awareness
Involveme
nt
Hierarchy of Effects
(i)Extended
Problem Solving
(EPS)
- New entrants
Introduction
• Lack of
consumer
ability
Unfamiliar about
products and brand
and low confidence
level
High Awareness
Attitude
Behavior
(ii)Limited Problem
Solving (LPS)
- Switchers and
experimental
Growth Sufficient brand and
product knowledge
but motivate to try
new things
Medium The hierarchy of effects
could be both, same as
in high or low
depending upon
purchase decision.
iii)Routine/Habitual
Problem Solving
(RPS)-
-Loyal consumers
Maturity
• Lack of
consumer
motivation
Confidence about
brand and product
Low Awareness
Behavior
Attitude
Source: Solomon, Bamossy, Askegaard and Hogg (2006) ; Howard (1989)

16
Apart from consumer’s indefinite nature, there are many determinants underlie on their
product choice. Howard (1989) suggests that EKB model (see figure 3.1) simplifies a whole
consumer behavior process by answering “why and how consumers buy” and more of it,
CBBE framework strive to transparent a bundle of equity attributes stick with a
brand/product and has been indirectly emerge by consumer own buying behavior.
Englet Kollatand Blackwell (EKB) Model
Figure 3.1: Englet Kollatand Blackwell ( EKB) Model
Source: Howard (1989:111)
EKB model is a comprehensive model that unified five different classes of concepts and their
inbound relationship in proceeding buying behavior. It has 5 different parts.

17
1. Input- The stimulus that connects us around the world from which consumer receives
the information like: Marketing stimuli (Advertising. Bonus and schemes, store
display), own experiences and conversations with others, external search etc.
2. Information Process- The hierarchy of involvement in acquiring information helps to
develop perception towards a product and a particular brand which leads on
simplifying decision making process. The five methods of information processing are:
(a) Exposure (b) Attention (c) Perception (d) Yielding (e) Retention
3. Decision Process- A simple way of buying behavior that triggers anytime in consumer
mind for purchase intention. It begins with realization of problem, need, want or
desires, then seek for meaningful search based on input, and then right evaluation of
alternatives and ultimately final choice. But the decision process doesn’t end here with
pre-purchase or purchase activities. It also includes post-purchase activity considering
the satisfaction level.
4. Decision Process Variables- The individual qualities that help on making a right
product choice by determining brand personality.
5. External Influences- They are external stimuli, which is also termed as “circle of
social influence” like culture, social class, reference group, family influences etc.
Both these variables (Decision process and external) act like a clue for marketers to
undertake appropriate marketing strategy.
This model has clearly pictures a flow of buying process in a common way. Howard
(1998:117) also adds that this model emphasize on “what we know” about buying behavior
of individual units in ordinary life, like a buyer feel a problem need of a product, through
information search for alternatives, choose a familiar brand that he comfort with and have
confidence about the quality of that particular brand, but various internal and external stimuli
affect on choosing the brand/product, and later on his outcome determines a confidence level,
resulting to repeat purchase. Thus, this model completely reflects the whole notion of buying
behavior and for this reason EKB model is applicable in the study. However, the researcher,
John A. Howard criticizes this model as less qualitative and quantitative comparative to
Howard’s model-CDM (consumer Decision Model) in his book Consumer Behavior
(1989:117).

18
3.2 Brand Equity
Brand equity or strong brand is one of the primary assets for business triumph (Prasad & Dev,
2003) . It starts with branding of a product where branding gives a name, logo, symbol to a
product or service making a product different from its competitiors. Since, brand offers
distinctive collaboration of functional and symbolic aspects of product so, Prasad and Dev
(2000) treat brand as representative of a business. Once the brand is well accepted by
consumers and set up as a strong brand in the market, firm intends to go international by
global expansion.. From this, it is noticable that Global branding is a planned and visionary
strategy of a firm. Global brand offers a standardized and same product formulation to
consumers across the world (Hankinson & Cowking, 1996). Well-build brands like Marlboro,
McDonald, Coca-Cola, Levi, Rolex and many others did by denoting “masculine man smokes
Marlboro”, “fashion of eating American Hamburger”, “refreshness” and “jeans for good
quality”. They all symbolize a sort of universal desires “One fits for all” (Hankinson &
Cowking, 1996). Thus, the concept of brand and global brand is essential to know as the study
is about brand equity management of a national brand-MAX and a global brand-McDonald.
Wood (2000) defines Brand Equity as an attempt of showing a relationship between
consumers and brand. It identifies all the benefits attached with brand which is offered for
purchase or sell influencing consumer behavior so that the firm can enjoy a competitive
advantage by distinguishing the product, allowing price premium and gaining customer
loyalty and winning over poorly brand. .So, it is consider as more than a name to a product,
Moreover, Brand Equity is understand as a pragmatic framework of consumer behavior where
repeat purchase is made by consumer for a reason that highly satisfied from brand, perceiving
all values offered so far (especailly price paid) and the commitment be made for that brand.
(Prasad & Dev, 2003).
3.3 An Overview of Customer Based Brand
The CBBE is a multi-dimensional approach comprising of equity assets such as brand
awareness, brand loyalty, perceived value and brand association comes with brand and has an
attached relation with consumer’s preference, perception and behavior influencing firm’s
performance. From the pre-purchase activities and purchase activities of problem recognition
to product choice, brand equity stands as “reason to buy” for consumers and their post

19
purchase activities of consumption determines satisfaction/dissatisfaction level which leads
to add/subtract to brand loyalty to the firm i.e., provides “Brand value” to the firm.
Many researchers like Aaker (1991), Keller (1993, 1998), Blackston (1992), Sharp (1995),
Berry (2005) have increasingly spotlighted in this holistic approach because of the benefits it
generate are justifiable and worth value in the marketing. However, they have interpreted this
perspective in different manner:
Aaker (1991) states brand equity as value producer to both customer and firm by focusing on
five dimensions; brand awareness, brand loyalty, perceived value, brand associations and
proprietary assets. Aaker’s CBBE model is further discussed in figure 3.2.
Keller (1993, 1998) proposes the CBBE as simultaneous impact of brand knowledge on
consumer responding back to brand (Keller, 1998:45). According to him, brand knowledge is
memory tracer which can be grabbed by favorable, strong and unique brand associations via
whatever means (E.g. past experiences, advertising).
Berry (2000) has also supported Keller’s idea by centralizing brand meaning to brand
awareness.
Prasad & Dev (2003) define this customer centric framework of Brand equity with
satisfaction that is resulted from firm’s performance in response to consumer’s brand
awareness.
Thus, it is explicit that apart from the researcher Aaker, other researchers have concentrate on
only one or two attributes of brand equity but yet all their focus was on the value added to
product by consumer’s association and perceptions of a particular brand. However, the study
has prioritized Aaker’s Brand equity model to conceptualize CBBE framework as it is an
integrated approach of brand with attached components; brand awareness, perceived value,
brand loyalty and brand associations. For understandable perceptive it can be comprehend as
“Added Value” attached to a product which resides in consumer’s thoughts, words and
actions. Whatever the consumer knows, feels, thinks and behaves are all consequences of
brand equity management. For instance, let’s take COKE.
• What consumer know -Logo , Slogan-“The pause that refresh you”,
Jingles-“I’d like to buy the world a coke” or “Jingle Bell”, A Jumbo coke bottle in a
Word of Mouthan’s body shape.
• What consumer feel -It refresh you and strong drink than others.

20
• What consumer think (remember) - Polar Bear Ad or Animated cola factory Ad, Past
experience with Coke and its promos like Coke T-shirt, Coke-Cap, Coke-Pen etc.
• How consumer behave- Buy Coke instead of Pepsi or Red bull or other juice, Buy
coke although is it bit expensive than Pepsi (accept perceive value in terms of price),
Buy New Coke or Diet coke (Brand extension), Buy McDonald with Coke.
With this sufficient brand knowledge consumer gain high confidence level on choosing a
brand “Coke” in the product line of drinking. As a result, a purchase decision of buying a
coke will be speedy as it lessens both consumer’s time and efforts on acquiring information.
Further, Brand Equity components can be discussed below:
3.3.1.Brand Loyalty
Brand loyalty, is an attachment that a customer has towards a brand. It reflects on repeat
purchase and customer’s commitment to a brand measuring consumer behavior as how likely
they will switch to another brand, especially when that brand makes a change, either in price
or in product features (Aaker, 1991). It exists with prior purchase and use experiences. It is a
consumer’s strategy of reducing risk associated with purchase decision. In general, longer the
consumer like to continue to purchase from the same supplier, stronger the brand loyalty
(Eugene W.Anderson, 1994). Some consumers may buy a particular brand repeatedly without
thinking of any reasons, simultaneously other evaluate a brand and repeat buying because
they are truly committed to it. So, Brand loyalty constitute of both behavioral and attitudinal
sense. And it also offers some protection in a marketing downturn or in the brand’s fortunes
fall. For example, New coke, when the world was against it, it was Coke’s loyal customer
which encourage it to back to old coke and their patience maintain the coke’s reputation.
Also, Brand loyalty is a judgmental basis for measuring consumer’s satisfaction. When a new
customer is satisfied with the product, quality and price offered, it remains as a good brand
image in his memory and later he used this experience for a repeat purchase. His experience
likely acts as WOM for prospective customers and as a result more consumers are drag
towards that brand. Thus, the consistency of brand loyalty and customer satisfaction
contribute in firm’s profitability by increasing market share, say Anderson, Fronell & Lehman
(1994).

21
3.3.2 Brand awareness
The ability of consumer to recognize or recall a brand under any circumstances is simply
term as brand awareness. Consumer will choose the brand they know/familiar with and
sometimes based on perceived quality. For instance, “I’ll choose the brand I know; I’ve heard
the brand, so it must be good”, suggests by Macdonald (2000). It acts as a nod to consumers
on saving time. So, if consumers are highly aware about brand and its associations, they
require low involvement in decision making process for a product choice of familiar brands.
On, the other hand, consumer needs to involve much to collect sufficient brand information if
is not aware about the brands. Thus, it is apparent that brand awareness and Involvement has
indirect proportional relationship. Brand awareness can be strengthen by reinforcing a brand
name with complete brand elements – logo, symbols, packaging, character or often more
desirable to develop a slogan or jingle that are easy and influential to memorize. Therefore,
different marketing mix such as advertising, promotion and public relation should undertake
to make brand recognizable and to increase its familiarity among consumers.
In addition, , the image of brand comes as an inseparable consideration of Brand awareness.
Brand image is referred to as consumer perceptions about the brand or how they view it.
According to Keller (1993), brand image is also seen as “a symbolic construct created within
the minds of people and consist of all the information and expectations associated with a
product or service”. Effective brand image management is one of the competent marketing
strategy as it clearly sets the components of image e.g.store location, waiting time for a meal,
food, quality menu variety , interior decoration, professional appearance and cleanliness
producing positive impact on customer (Kisang Ryu, 2008).
3.3.3 Perceived Quality
Aaker (1991) defines perceived quality as the customer’s perception of the overall quality of a
product or service and their behavioural sense of accepting it. It is an intangible and overall
feeling about a brand. However it is usually based on underlying dimensions which include
characteristics of the products to which the brand is attached such as reliability and
performance. In service industry, four attributes: food quality, service quality, atmosphere
and novelty and their influence on repeat Intention to Purchase are discovered (Weiss et al,
2004 cited in Ashton, 2010). It predicts consumer’s intention to buy and also measures the
satisfaction level. According to the journal, (Ashton, 2010) researchers like Paswan et al,

22
(2007) and McDougall find that perceived quality is the core relationship between quality and
value that comes as an implication of improve service element associate with it and the value
paid for. In another words, if a product cost is too high and consumers are not willing to pay
for it, its value is said to be not perceived by consumers instead consumers may prefer to
purchase lower quality product with a reasonable price. So, price is one of the determining
factors for perceived value.
3.3.4 Brand Associations
Brand associations are the other informational indication linked to the brand in memory and
contain the meaning of the brand for consumers. Associations come in all forms and may
reflect characteristics of the product or aspects independent of the product itself. For
Examples:
Possible Starbucks Associations
These brand associations are strongly depend on how marketing program and other factors
affect consumers’ brand experiences. The more deeply person thinks about product
information and relates it to existing brand knowledge, the stronger the resulting brand
associations. The brand associations are created either by direct experience or from
information communicated by other commercial or non-partisan sources (e.g. consumer
reports or the media) and word-of-mouth (Keller, 1998). Research has shown that attitudes
formed from direct behavior or experience is more accessible that attitudes based on
information or other indirect forms of behavior (Keller, 1998).
Great coffee Black gold Expensive and luxurious Starbucks logo Stronger coffee

23
3.4 Aaker’s Brand Equity Model
The researcher, David A.Aker has introduced Aaker’s Brand Equity Model in 1991 as a
conceptual foundation for Customer based brand equity. He defines Brand equity as:
“A set of brand assets and liabilities linked to a brand, its name and symbol that add to or
subtract from the value provided by a product or service to a firm and / or that firm’s
customer.” (Aaker, 1991, s. 15)
His emphasis are on five brand assets: (1) Brand Loyalty (2) Brand Awareness (3) Perceived
Quality (4) Brand Associations (5) Other proprietary. Here, the fifth assets are proprietary
Brand assets which are intellectual property like patents and trademarks providing innovative
competency to brand as a legal protector. A figure 3.2 reflects CBBE framework including
these five assets. According to him, brand assets come as attached and indispensable
attributes with a brand to a product to create a value to both consumer and firm. So, brand
components must work collectively as a system of brands instead of individual performer.
The attributes like brand awareness, perceived value and Brand associations together
influence consumer’s perception by giving “Reason to buy” a product. Simultaneously, brand
loyalty acts as an outcome of consumer behavior which adds value to a product by allowing
premium charges and product extension. Furthermore, the pros are discussed in section 3.5
Brand relationships and benefit. Therefore, the model has given appropriate guidelines to
marketers to build a relationship between brands and consumers to generate valuable benefits.
Understanding this brand capital is apparently seemed as a weighing up investment pattern.

24
BRAND
EQUITY
Anchor to which other association can be attached Familiarity-Liking Signal of Substance/commitment Brand to be considered
Reason-to-buy Differentiate/position Price Channel Member Interest Extensions
Retrieve information Position Reason-to-buy Create positive Attitude/feelings Extensions
Provides value to Customer by Enhancing Customers’:
• Interpretation/Proce
ssing of
Information
• Confidence in the
purchase Decision
• Use Satisfaction
Provides value to firm by enhancing:
• Efficiency and
effectiveness of
Marketing
programs
• Brand Loyalty
• Prices/Margins
• Brand Extensions
• Competitive
Advantage
Brand
Loyalty
Brand
Awarenes
s
Perceived
Quality
Brand
Association
Reduced Marketing Costs Attract New customers
• Creative Awareness
• Reassurance
Time to Respond to
Competitive Threats
Figure 3.2: Aaker’s Brand Equity Model
Othe
Proprietary
Brand
Assets
Competitive Advantage
Source: Aaker (1991); Keller (1998:623)

25
3.5 Brand Equity Relationship and Benefits
After knowing the whole concept of Brand equity framework, it will be unjustifying if the
relationship of brand equity with consumer and firm is ignored. While building and managing
the brand equity, it creates a triangular relationship between consumers and firm around the
peripheral of product as shown in figure 3.3. Brand equity is attached with a brand when it is
offered to sell/purchase influencing consumer attitude and behavior. In another words, each
consumer’s thoughts, feelings, image, beliefs, experience and many others exist on consumer
minds are shaped in respond to products, price, communication, marketing mix, brand
extension and their impact add/subtract value to firm in the process (Keller 2003). He also
emphasized on this relationship by proposing that more a brand has positive customer-based
brand equity, more probability of accepting a new brand extension by consumers is high. In
addition, consumers will be less sensitive to price increases and more willing to seek the
brand in a new distribution channel or withdrawal of advertising support. Thus, the
relationship is directly proportional and provides competitive advantage and value to the firm.
So, building customer-focused brand relationship is crucial.
Source: Designed by authors
Figure 3.3: Relationship of Brand

26
Brand Equity management has become increasingly a prosperous interest for many marketers
because of the value it generate by sustaining the relationship with consumer and firm.
“The assessment of the value of brand equity can be based on the price premium that the
name supports, the impact of the name on customer preference, the replacement cost of the
brand and the stock value minus the value of other assets” (Aaker, 1991, s. 271)
The major advantages observed in Brand equity are mentioned below:
• Past experience or brand knowledge affects consumer’s confidence in product choice
• Familiarity with brand leads to Less effort and time-consuming information process
and speedy purchase decision
• Perceived quality boosts Highly satisfaction resulting repeat purchase and maintain
brand loyalty
• Well known brand for perceived value enhance to Brand extension ;one brand- many
products
• Brand loyalty and perceived value protects a brand from market fall and also allow
Price premium charged to consumers
• A strong brand image with strong brand association can be a real threat to competitors
• Growth of firm via brand extensions, increased in sales, number of customer and
increased shareholder’s value
• Brand equity in total make possible for a firm to expand as a chain to go nationally or
internationally
• Positive Brand image earn trust from stakeholders
• Low marketing cost because of WOM prevails through satisfied customer
3.6 Marketing Strategy for Brand Equity Management
“We have to find ways to measure and justify the megamillions our clients have to spend to
build strong brands” (Peter A.Georgescu cited in Aaker(1991:15)). Hence, marketing
strategy is that way of building and managing brand equity as stated below.
3.6.1. Product attributes - The notion of brand equity management starts with a product. So,
attributes of product is the foremost consideration of strategy in Brand equity management.
Consumers perceive the quality and value of the product depending on its product quality.

27
According to Keller (1998), prior researchers have acknowledged the general dimensions for
product Quality.
• Performance
• Features
• Quality
• Reliability
• Durability
• Serviceability
• Style and Design
Above attributes helps to develop consumer’s attitude towards a brand and influence their
intention to purchase.
3.6.2. Price Strategy - Price is an amount of money that consumers are ready to sacrifice to
acquire something from the product. It is another determinant factor for consumer’s purchase
decision. Setting price for the product and the added value provide by brand is a tactful and
complex. But the pricing strategy is to understand the amount of value consumer is willing to
pay and premium over product costs (Keller, 1998). Hence, lowering cost is seen as a
competitive strategy in introducing new products. Low prices lead to increased sales
minimizing the costs that in turn enlarge the profit. But this low-price approach may not be
same for existing product because there is a relationship between price and quality in the
existing market. Keller (1998) has termed it as “price bands” and in the market there is an
acceptable price range. So, the pricing policy is to adopt value-based strategies -selling the
right product at the right price as per consumer wish.
3.6.3. Target Audience - Understanding consumer is to understand the business and
depending on the nature of this very decisional variable is crucial in market segmentation.
Knowing needs and wants of distinct groups of homogenous consumers is a clear way to set
clear objectives and to take marketing strategy accordingly. The possible consumer
Segmentation Bases according to Keller (1998:112)
• Behavioral- User status, Usage rate, Usage occasion, Brand loyalty, Benefits sought
• Demographic-Income, Age, Sex, Race, Family

28
• Psychographic-Values, opinions and attitudes
• Geographic- International, Regional
3.6.4. Marketing Strategy - Marketing communication is considered as voice of the brand
which informs, persuades, and reminds consumers about the brands they sell Keller (1998).
The purpose of designing the marketing strategy is flowing the brand knowledge to create
positive brand image and brand awareness among consumers in information process chain. It
acts as means of bringing the consumers and firm together to in a cycle of consumer buying
process.
Marketing communication has various alternatives like:
• Advertising-TV, Radio, Newspaper, Magazines
• Personal Selling-Door to Door
• Publicity and Public Relations
• Trade Promotions-Trade shows, Point of purchase (shopping cart ads), In-store radio or TV
• Consumer Promotions-samples, coupons, premiums, Refunds/Rebates, Bonus packs, price-
offs
Thus, what employees and customers say, how they say, how they behave, how employees
offer service to customer, how they keep them informe about product are an impact of
marketing tools (Grönroos, 2007). It effects on shaping the image of the orgnaization in the
minds of customersby determining WOM.

29
CHAPTER 4. DATA ANALYSIS
This chapter highlights the factual state of both MAX and McDonald in the Swedish food
market, their marketing strategy and Brand equity management. The data was collected in
response to these brands among fast food consumers, which was performed via questionnaire
survey on April 2011.
4.1 Fast food Overview
Fast food is a term given to food that can be prepared and served very quickly, typically sold
in a restaurant with precooked ingredients. The modernization of first fast food restaurant
starts with White Castle in the US in 1920s. It is the first most popular burger restaurant in the
US. Slowly, 7-Eleven, KFC and then McDonald came into existence in the fast food world.
For many businesses, entry in this fast food sector has become exceedingly enthusiastic for
the profit and reputation it generates for. The moderate growth of this market even in tough
macroeconomic circumstances will not be any surprise, especially in Sweden, where food
service industry values 2.8% of the European food industry (The data monitor online, 2011:
0181-2333). If market segment is observe, fast food accounts for 17.8% share in 2009.
Currently, powerful brands like McDonald, MAX, Burger King, Subway and many others are
in this fierce competition of hamburger because of their own known brand identity and loyal
customers. Hence, brand equity has operated as a weapon of differentiating a same product in
different name with unique associations.
4.1.1 McDonald
McDonald was started as barbecue meals by brothers, Dick and Mac McDonalds, in San
Bernardino, California and it was officially founded later on 1948; with varieties of foods like
hamburger, cheeseburger, soft drinks, milk, coffee, potato chips and slice of pie. According to
the website of McDonald (2011), later in 1995 it was introduced in Red and White with
Golden Arches in Des Plaines by Ray Kroc. So, the credit of McDonaldizing goes to Ray
Kroc. Currently, McDonald has more than 32,000 global restaurants serving more than 60
million people in 117 countries each day.

30
By the year of 1967 when McDonald started to go internationally, Max hamburger was just
introduced in Sweden and now it has 235 outlets in Sweden which is almost like 75% of
nation’s burgers (MAX online, 2011). Based on The Hubpages online (2011), as a famous
global marketer, it has adapted its successful formula of “food, fun and families” in going
overseas Keller (1998). The successful story behind McDonald being the dominant and the
largest chain of hamburger in the fast food chain is that it offers specific menu varies from
country to country from satisfying the local people by adopting local custom and religious
beliefs of a particular country.
The table 4.1 reveals customer perspective strategy of McDonald from one country to another
according to changing customer’s preference and taste. Consumers from all over the world
has well perceive McDonald’s products and offers despite of its higher price margin, for this
reason it’s global image is rapidly flourishing in the market. McDonald’s world famous foods
are fries, Big Mac, Quarter Pounder, Chick Mc Nuggets, Egg Mc Muffin and pie. When it
comes to the list of Sweden, it has serve Mc Feast, a quarter pound patty, in Swedish flavor.
Table 4.1 McDonald’s different menus around the world
Sn. Country Popular Product Key ingredients Local Custom N
Religious belief
1. India Maharja Mac instead of Big Mac Chicken or Lamb Beef is prohibited
2. Norway McLaks- A sandwich Grilled salmon & Dill sauce Fish-loving
3. German Big Mac with Pilsner Beer Beer German Beer
4. Canada Mclobster- a lobster roll Lobster
5 Japan
• Teriyaki McBurger
• Ebi-chiki
• Ebi Filet-O
• Green Tea flavoured milk shake
• Pork-patties
• Shrimp-nuggets
• Shrimp-burger
Japanese flavor
6. Chile Burger with avocado sauce Sauce made by avocado No ketch up
7. Saudi
Arabia McArabia
A grilled chicken sandwich
served on a flatbread
No pork products and
all meat sold is halal
8. Sweden McFeast A quarter pound patty, lettuce,
mayonnaise, tomato, onion Swedish flavor

31
4.1.2 MAX Hamburger
Max Hamburger Restaurants is a fast food corporation founded by Curt Bergfors in
Gällivare, Sweden in 1968. Bergfors' oldest son Richard Bergfors is the current president
since 2002. Until the 1980's, Max was the largest hamburger restaurant chain in northern
Sweden, with only a single restaurant outside of Norrland (on Drottninggatan, Stockholm).
This changed during the 1990's, when they expanded to become a nationwide fast-food chain.
According to the website of MAX (2011), by 2005, there were around 40 restaurants and now
the relevant home sites reveal that by 2009 MAX has 71 restaurants in Sweden also planning
to excessively spread out all over Sweden targeting 100 restaurants by 2012. Also, MAX has
planned to expand in European countries after a success in Oslo, Norway in May 2011.
The Core features of Max hamburger serving as Max serving the juiciest, tastiest, low-impact
meat possible (The Natural Step, 2011:5).
• Max's brand is much relying on its Swedish heritage as a means of competing with the
two major fast food-chains on the market, McDonalds and Burger King,
• Max has done advertising featuring children as well as adults with different skin
colors, dressed in traditional Swedish costumes (folkdräkt), and in their restaurants
only Swedish music is played, through an own radio channel. . In March 2005, 58% of
the target audience, 18-39 years are seen as primary audience (MAX 2011). So, radio
is a big source of commercializing MAX.
• Max offers free of charge WiFi-access in most of their restaurants.
• At Max, quality and natural fresh ingredients are key driver. Each year MAX
completes a year-end fat statement to see if they have succeeded to make fast food
healthier by reducing the amount of fat. “The first year we removed 83 tons of fat. In
9. Greek Greek Mac Burgers made of patties wrapped
in pita bread
10. Hongkong Rice burgers Burger served in two rice patties Rice loving country
11. Israel McShawarma Pita bread roll Dairy products are
not served.
12. Uruguay McHuevo A regular hamburger but topped
with a poached egg

32
2009 the year-end fat statement showed minus 190 tons of fat!” (MAX home site,
cited on 20 April, 2011). Max not only offers regular hamburgers but also healthier
alternatives like its Delifresh menus, which ranges from 4% to 12.5% fat, served like
regular hamburgers in bread and with the usual accessories (MAX, 2011). It also sells
its own brand of salad sauce, which is quite popular and both the beef and chicken
used are produced locally.
As partnering with an internally recognized non-profit organization specializing in
sustainability called The Natural Step, Max works into sustainability challenges of their
business. So, working under sustainability it opens up its Corporate Social Responsibility
towards society, people and environment. As a result, in 2008 Max became the first restaurant
chain in the world to analyze their food’s climate impact all the way from the farmers land to
the guest’s hand. Max is more profitable than ever. “A Swedish independent survey reported
an increase in customer loyalty by 27 % for Max between 2007 and 2009 mostly due to their
sustainability efforts. This was the highest increase of 20 of the most well-known Swedish
brands” – MAX press release on 19th October 2010 in the Natural Step. A nation-wide survey
by the Swedish Trademarks Association also declares that Max has been serving Sweden’s
most satisfied hamburger customers for 8 years in a row from 2002-2009 beating McDonald’s
and Burger King in ( The Natural Step, 2011)
Hence, it is explicit that both brands have their own brand, strong image, loyal consumers and
marketing strategy. Nevertheless, the study will analyze the genuine state of brand equity of
both brands and their interaction with consumers with a help of data, which was collected
through questionnaire survey from fast food consumers in Sweden on April 2011.
4.2 Descriptive statistics
The survey was conducted to cover 200 respondents but only 180 valid sheets were received
(80 by emails and 120 by printed sheets). The reason for not including remaining 20
respondents was that 13 respondents answered “No” to the first question “Have you ever
bought fast food?” and 7 respondents did not complete questionnaires. Hence, the survey was
carried out among only fast food consumers and the respondent rate of this survey was above
90%.
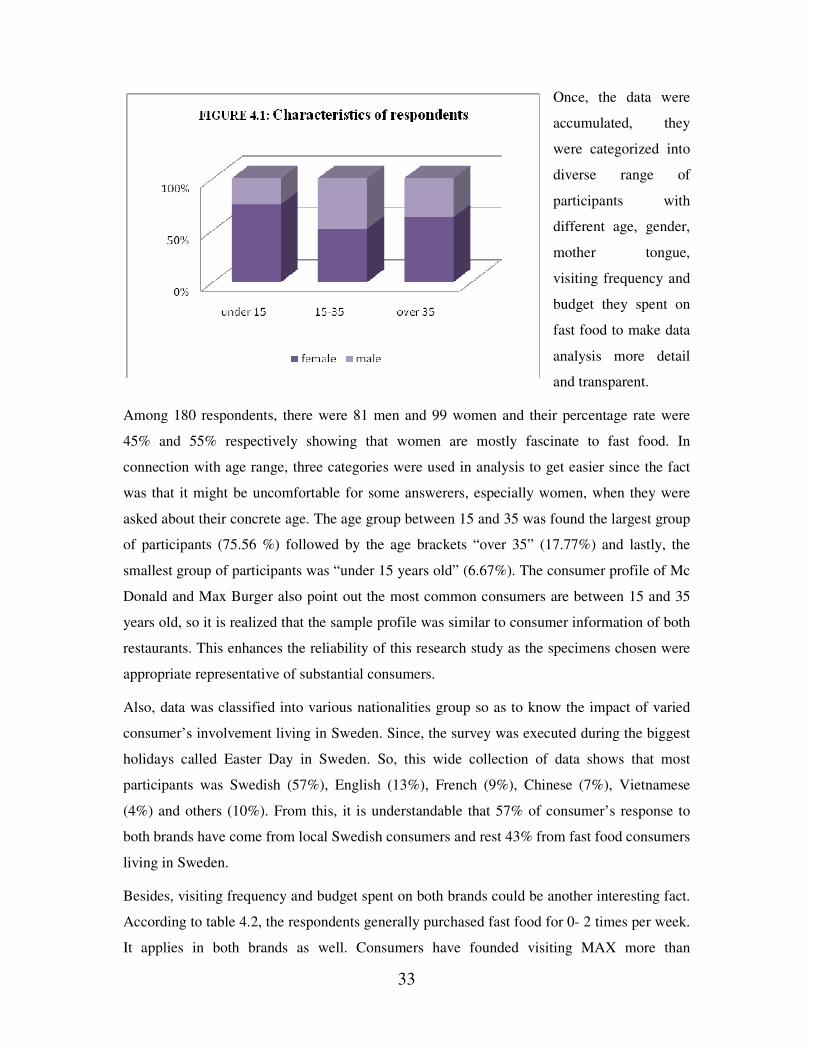
33
Once, the data were
accumulated, they
were categorized into
diverse range of
participants with
different age, gender,
mother tongue,
visiting frequency and
budget they spent on
fast food to make data
analysis more detail
and transparent.
Among 180 respondents, there were 81 men and 99 women and their percentage rate were
45% and 55% respectively showing that women are mostly fascinate to fast food. In
connection with age range, three categories were used in analysis to get easier since the fact
was that it might be uncomfortable for some answerers, especially women, when they were
asked about their concrete age. The age group between 15 and 35 was found the largest group
of participants (75.56 %) followed by the age brackets “over 35” (17.77%) and lastly, the
smallest group of participants was “under 15 years old” (6.67%). The consumer profile of Mc
Donald and Max Burger also point out the most common consumers are between 15 and 35
years old, so it is realized that the sample profile was similar to consumer information of both
restaurants. This enhances the reliability of this research study as the specimens chosen were
appropriate representative of substantial consumers.
Also, data was classified into various nationalities group so as to know the impact of varied
consumer’s involvement living in Sweden. Since, the survey was executed during the biggest
holidays called Easter Day in Sweden. So, this wide collection of data shows that most
participants was Swedish (57%), English (13%), French (9%), Chinese (7%), Vietnamese
(4%) and others (10%). From this, it is understandable that 57% of consumer’s response to
both brands have come from local Swedish consumers and rest 43% from fast food consumers
living in Sweden.
Besides, visiting frequency and budget spent on both brands could be another interesting fact.
According to table 4.2, the respondents generally purchased fast food for 0- 2 times per week.
It applies in both brands as well. Consumers have founded visiting MAX more than

34
McDonald for 0-2 times in a week but there are additional consumers who visited McDonald
for 3-5 times per week, which is relatively high than MAX. Though both brands have none
respondents visiting over 5 times per week, but one respondent said that he often purchased
fast food from others (i.e. Subway, Burger King and Seven Eleven) over 10 times per week.
Table 4.2 - Distribution of the respondents via visiting frequency categories.
Description
Fast food restaurants visiting frequency, times per week
0-2 times 3-5 times 6-9 times 10 or more
McDonald 168 12 0 0
Max Burger 172 8 0 0
Others 170 9 0 1
Depending upon a frequency of visiting to restaurants, the participants spent money on fast
food (See table 4.3). Consumers usually spent less than 100 SEK per week on fast food. The
rate of buying from different brand like MAX, McDonald and others were figure out 92.78%,
90.56% and 90% respectively from the given table. Similar to the previous response, there
was the same person accepted to pay out more than 500SEK per week for fast food which
were not from McDonald and Max.
Table 4.3 - Distribution of the respondents via budget categories
4.3 Customer based brand equity analysis
The Customer based brand equity would be analyzed based on four factors: brand awareness,
brand loyalty, perceived quality and brand association. Each factor would be analyzed and
Fast food
Restaurants
How much money do you spend on fast food products in a week?
Less than 100
SEK
100 SEK-300
SEK
300SEK-
500SEK More than 500SEK
McDonald 163 15 2 0
Max 167 10 3 0
Others 162 13 4 1

35
discussed separately with the help of tables and figures based on Likert scales. As mentioned
above, the researchers used 5-point Likert scale from “the least important” and “do not satisfy
at all” with the score of 1 to “the most important” and “satisfy totally” with the score of 5, in
contrast. The average means were calculated found on the score of each attribute regarding
frequency. For example, to evaluate the importance of Good taste toward customers’ rating,
the researchers denoted “the least important” by “1”, the others by “2”, “3”, “4” and “5”.
Then, the data was used as following: 1*3 (frequency) + 2*0 +3*11+ 4*43 +5*123 = 823.
Dividing to sample size (180), the average mean value got 4.57. To create the simplicity and
understandability for this thesis, the authors decided to show only the final average means and
standard deviation of attributes in figures. Almost all attributes in the survey were calculated
in the same way as Good taste. Thereafter, all attributes of each factor would be taken the sum
and divided by the number of attributes under each factor to get the final average score of
them.
Question number 5 is a special case that used the 4-point Likert scale from “the most
preferred brand” represented by “1” and “the least preferred brand” represented by “4”. To
bring consistency with the results of other attributes and make it easier to compute, the score
of each attribute in question 5 has been converted to the scale in which, 1 was “the least
preferred brand” and 4 was “the most preferred brand”. For instance, the score of Burger King
in old scale in which “1” was “the most preferred brand” was 2.35. This score was transferred
to the new scale as following: 4-2.35= 1.65 which is presented in table 4.9
4.4.1 Brand Awareness
The questionnaire comprised of three questions for measuring consumer’s awareness towards
both brands-Max and McDonald. Based on consumer’s knowledge on memorizing brand on
top of their mind and recognizing brand’s logos and slogans, Brand Awareness attribute will
be evaluate.
4.4.1.1 Please write down the name of the fast food brand appear in your mind first:
The third question in questionnaire was set to know a power of consumer’s mind on
remembering a foremost brand. There were four main restaurants mentioned by consumers;
McDonald, MAX, KFC and Burger King. 83 respondents out of 180 claimed McDonald as
the first restaurant appeared in their mind whereas 51 gave “Max” or “Max hamburger” in
their answers. As shown in below chart (figure 4.2), McDonald has win consumer’s mind by

36
Recognition of Logo Number of respondents
recognize logo
Percentage
Max 155 out of 180 86.11% out of 100% McDonald 176 out of 180 97.78% out of 100% Recognition of Slogan Max McDonald
n percentage n percentage
Right answer 36 20 146 81.11
Wrong answer 22 12.22 5 2.78
“I don’t know” 122 67.78 29 16.11
Total 180 100 180 100
scoring high with 46.11% in Sweden whereby, MAX is relatively less memorize by
consumers.
Figure 4.2 Top of mind brand
4.4.1.2 Recognition of logo and slogan
86.11% of all respondents said that they could easily identify the logo of Max while the logo
of McDonald was identified by 97.78% of respondents. Also, in the survey, (81.11%)
consumers were familiar with right slogan of McDonald; “I’m lovin’ it” but they were not
able to recognize MAX’s slogan. Most of them have either chose wrong slogan for MAX or
“I don’t know”. Only 20% consumers gave the right answer that Max has no slogan.
Hence, table 4.4
illustrates that brand
recognition and brand
recall of McDonald is
maximum than MAX
because of McDonald’s
strong brand elements.
Table 4.4 Recognition of logos and slogans

37
4.4.2 Brand Loyalty
Four questions in this survey were used to evaluate participants’ commitment towards specific
brand. Firstly, the respondents were asked whether they have got any membership card of any
fast food restaurants including MAX and McDonald. It attempted to examine firm’s special
treatment to their loyal consumers. It means, a possibility of consumers staying with a certain
brand can be longer by the firm’s promotional behavior like membership card, discounts and
coupons. The result was found that there were only 16 out of 180 respondents had at least one
membership card of fast food restaurants, 3 got from McDonald, 3 from Subway and 10 from
others. Unfortunately, there were no respondents in this survey had any member card from
Max.
Secondly, three attributes in Question 13 and Question 18 were given to respondents to
measure their loyalty to Max and McDonald. As shown in the table 4.4, Max got higher value
in all of three characteristics. It is noticeable that Max got higher mean not only on “I would
like to choose it again” and “I would like to introduce it to my friends and family” but also on
“If its price is 10% higher than others brand, I will choose another one”. That means although
the respondents were satisfied with the quality of products and services of Max enough to
purchase it for the next time and introduce to others, the connection between Max and
respondents would not be strong enough to keep their loyalty to buy it if its price increased.
For standard deviation regarding brand loyalty, McDonald achieved larger standard deviation
in all characteristics than Max. Therefore, it is seem to be that the data for Max was
assembled surrounding the mean value more closely than McDonald in both three
characteristics.
Description
Max McDonald
Mean
value
Standard
value
Mean
value
Standard
value
I would like to choose it again 3.58 1.11 3.42 1.17
I would like to introduce it to my friends and
family
3.32 1.16 3.15 1.17
If its price is 10% higher than others brand, I will
choose another one. 3.35 1.14 3.34 1.28
Table 4.5 Brand Loyalty

38
In conclusion, while Max had a higher value since it was chosen to purchase again and
introduced to the other people due to the good quality of services, McDonald was better at
attracting the customer loyalty whether its price was higher than others or not.
4.4.3 Perceived quality
To evaluate the perceived quality of both brands, question 4 (described the importance of
twelve factors to customer’s decision to choose a burger), question 12 and 17 (the satisfaction
of customer with two specific brands in twelve categories) were combined together on the
basis of Likert 5-scale point for IPA analysis.
4.4.3.1 Max
Below in the table 4.6, consumers have measure the average mean values for attributes
required to perform by a fast food restaurant (Importance column) eventually, they have rated
mean values performed by MAX in those attributes (Satisfaction column) depending on their
satisfaction level . This list has been calculated with the help of 5-point Likert scale to find
out a degree of MAX performance in the attributes which have been prioritize by consumers.
While selecting a fast food restaurant, consumers firstly prefer Good taste followed by
Reasonable price and Good ingredients and they hardly like to pay attention to Packaging and
Additional services. Comparatively, consumers have found MAX product with a good taste
with an average mean of 3.9 out of 4.57. But in other attributes MAX seems to have poor
performance.
Importance of attribute Satisfaction toward Max
Code Attribute Mean Code Attribute Mean
A Good taste 4.57 A Good taste 3.9
B Reasonability of price 4.19 L Variety of products in menu 3.88
C Good ingredients 4.11 D Accuracy of serving order 3.81
D Accuracy of serving order 3.92 E Opening hours 3.79
E Opening hours 3.91 C Good ingredients 3.72
F Convenient location 3.89 H Attitude of cashiers and staff 3.54
G Speed of serving order 3.77 F Convenient location 3.54
H Attitude of cashiers and staff 3.76 I Customer service 3.49

39
I Customer service 3.65 G Speed of serving order 3.44
L Variety of products in menu 3.47 B Reasonability of price 3.43
M Attractive packing 2.99 M Attractive packing 3.29
N Additional services 2.73 N Additional services 3.13
Table 4.6: MAX: Estimating the performance and importance of Perceived value
For clear illustration, attributes in table 4.6 is analyzed in Importance Performance matrix as
shown in figure 4.3. Two green lines in matrix are used to separate this model to 4 quadrants.
The two lines display the mean value of all attributes for Importance rating and Performance
rating (m=3.7)
From the matrix 4.3, Attributes like (B) Reasonability of price, (F) Convenient location, (G)
Speed of serving order and (H) Attitude of staffs and cashiers are not given much attention by
MAX regardless of their importance. So, MAX managers should reinforce their efforts to
meet the mandatory grade in those attributes because the importance grades were quite high

40
but status of MAX performance is relatively poor than average. However, respondents were
satisfied with (A) Good taste, (D) Accuracy of serving order, (E) Opening hours and (C)
Good ingredients. (I) Customer services, (M) Attractive packing and (N) Additional services
were in low priority area because of their low importance ratings (m= 3.65; 2.99 and 2.73)
and low performance ratings (m= 3.49; 3.29 and 3.13) respectively.
4.4.3.2 McDonald
About McDonald, respondents’ satisfaction to McDonald seem to be connected mainly to
Convenient location with the higher mean value of 3.78, followed by Opening hours and
Speed of serving order with mean value of 3.76 for both. This is little reverse from
consumer’s prioritization. Consumer’s have grade these attributes as not foremost
requirement as good taste and price (see table 4.7) in a restaurant. However, the lowest score
came to Additional services with 3.16, closely the same as Max (m=3.13). For deeper look
table 4.7 has plotted into IPA Matrix as shown in figure 4.4.
Importance of attribute Satisfaction towards McDonald
Cod
e
Attribute Mean
value
Cod
e
Attribute Mean
ue A Good taste 4.57 F Convenient location 3.78
B Reasonability of price 4.19 E Opening hours 3.76
C Good ingredients 4.11 G Speed of serving order 3.76
D Accuracy of serving order 3.92 D Accuracy of serving order 3.71
E Opening hours 3.91 L Variety of products in menu 3.56
F Convenient location 3.89 B Reasonability of price 3.54
G Speed of serving order 3.77 H Attitude of cashiers and staff 3.47
H Attitude of cashiers and staff 3.76 A Good taste 3.44
I Customer service 3.65 I Customer service 3.39
L Variety of products in menu 3.47 M Attractive packing 3.27
M Attractive packing 2.99 C Good ingredients 3.22
N Additional services 2.73 N Additional services 3.16
Table 4.7: McDonald: Estimating the performance and importance of Perceived value

41
The figure 4.4 displays the consequence of survey for perceived value done for McDonald.
The figures apparently demonstrates that McDonald’s performance in most important
attributes; (A) Good taste, (B) Reasonability of price, (C) Good ingredients, (D) Accuracy of
serving order and (H) Attitude of staffs are not up to the meet of consumer’s expectation as
they are positioned on high importance-low performance quadrant. This suggests McDonald
to give attention on improving these attributes. Similarly, consumers are satisfied with
McDonald’s performance on features like (F) Convenient location, (E) Opening hours, (D)
Accuracy of serving order and (G) Speed of serving order are placed on high performance-
high importance quadrant. However, McDonald has performed well in providing Additional
services and packaging despite of their importance in consumer’s mind, they stands on low
priority-high performance area with mean value of 3.16 and 3.27 respectively.
4.4.3.3 Max versus McDonald
After a deep analysis of tables 4.6 and 4.7 and figures 4.3 and 4.4, the authors have extracted
four significant attributes of perceived value together with their mean values which is
revealed in table 4.8 : (A) Good taste, (C) Good ingredients, and (G) Speed of serving order
Figure 4.4: IPA Analysis of Perceived Value for Mc Donald

42
and (L) Variety of products in menu. Due to differential gap in mean values, authors have
select these four attributes and attempted to show comparative performance of MAX and
McDonald though IPA diagram (figure 4.5)
Code Variable Mean
importance
Mean
performance
of Max
Mean
performance of
McDonald
Difference
of
performance
A Good taste 4.57 3.9 3.44 0.46
C Good ingredients 4.11 3.72 3.22 0.5
G Speed of serving order 3.77 3.44 3.76 0.32
L Variety of product in menu 3.47 3.88 3.56 0.32
Table 4.8: Importance-Performance grid of the four most prominent for Max and McDonald
It is understandable from table 4.8 and figure 4.5 that consumers have well perceived MAX
for its good taste and good ingredients as they are positioned in high importance-high
performance quadrant, yet consumer’s requirement is higher on those aspects. Also, MAX
need to speed up their servicing for greater performance. In contrary, McDonald is good in
smooth speed of serving order but they need to focus on producing food with good taste with
good ingredients. For, product menu, both brands have perform better than consumer’s
requirement. However, the present of Variety of products for Max was on quadrant of
possible overkill whereas it was clearly on low priority for Mc Donald’s. Thus, this matrix
can be helpful for marketers to initiate necessary steps to improve the quality and service of
their brand.

43
In conclusion, except the characteristics like Additional service, Speed of serving order and
convenient location, Mc Donald has received lower score than Max in almost perceived
quality attribute.
4.4.4 Brand Associations
With an aim of examining association of both brands, two questions were included in the
questionnaire. First, respondents were asked to rank preferred brand among four popular fast
food brands in Sweden; MAX, McDonald, Burger King and Subway. Second, participants
were enquired about channel mix for the purpose of knowing a source of information for
MAX and McDonald.
Figure 4.5: IPA Analysis of Perceived Value for MAX and McDonald

44
4.4.4.1 Preferred brand
According to the website Sample questionnaire (2011), one question is frequently used to
measure brand association is “Which brands would you like to be most associated with? Rank
in order of your preference”.
As suggested, the participants were asked to rank their favourite fast food restaurant from 1 to
4, where 1 is the most preferred in question number 5 in the survey. But this is contradictory
with other attributes where 1 was graded as the least and 5 was graded as the most. So, to
bring a consistency in result, the grading of preferred brand is converted from 1 to 4 where 1
is the least preferred brand and 4 is the most preferred brand as usual. The below table 4.9
presents Max was the most preferred brand with 1.69, followed by Burger King with 1.65 and
McDonald with 1.59 and at last, Subway represented the least preferred with 1.04.
Fast food restaurant Mean value of old
scale
Converted Mean value
(New) Ranking result
Burger King 2.35 1.65 2nd
Max 2.31 1.69 1st
McDonald 2.41 1.59 3rd
Subway 2.96 1.04 4th
Table 4.9: Ranking of fast food preference
4.4.4.2 Communication mix
As a means of interactive marketing tool, communication mix convey deliberate information
about a product, a brand and a firm and also build a strong brand image in consumer’s mind .
Both internal stimuli (past experience) and external variables (advertisement, word of mouth,
websites) favorably assists consumers to recall and Recognize a brand which in turn
motivates and ease consumers to perform purchase activity.
The analysis explores the fact that word of mouth is a dominant way of interacting with
brand. 38% of MAX consumer liked to talk about the service and done so by favourable word
of mouth i.e., introducing and recommending the brands to others meanwhile they were also

45
motivated by past experience with the brand which is followed by 32%. In a bit contrast,
McDonalds’ consumers enormously performed buying activities in response to their pleasant
past experience. 46 % of consumer behaved according to their internal memory, but also
commercial advertisement of McDonald had strongly stimulated 30.5% consumers. Summing
up communication mix of both fast food chains, it is found that Past Experience on the top
followed by Word of mouth, Advertisement and then lastly, Website. This result apparently
suggests that consumer recalled the brand with their experience and the favorable response
from others, which take place if the brand image is positive and consumers are satisfied with
it.
Means of
communication
No. of
respondents
Percentage
(%)
Means of
communication
No. of
respondents
Percentage
(%)
Advertisement 44 24.45 Advertisement 55 30.56
Friends and family 69 38.33 Friends and family 38 21.11
Past experience 58 32.22 Past experience 83 46.11
Website 9 5 Website 4 2.22
Total 180 100 Total 180 100
MAX McDonald
Table 4.10: Communication mix

46
CHAPTER 5 DISCUSSION
This chapter highlights the major findings discovered about MAX and McDonald in terms of
Brand equity. The result will be discussed on the base of empirical research and media to
draw a real situation of both brands.
5.1 Findings and discussion
The research findings for Brand equity is discussed in two parts as the information dug out
from burger war news is little contradictory with the result extracted from data analysis (for
which the survey was conducted on April 2011).
5.1.1 Burger War: Became world news
According to MAX online (2011) it was 1990 when a world first saw McDonald was forced
to close in Luleå and Umeå. The fries-and-yellow "M" shone all over the world - but was
rejected by the people of northern Sweden. In 2007, the popularity of Max forced the
McDonald's in Skellefteå, Piteå and, again, in Luleå out of business (MAX 2011).
“Market-leader McDonald’s reports an increase by 6.4% to €443 m, in spite of one unit less
than 2006. The hamburger consumers were reported 4.5 m more in 2007 than 2006. In spite
of the high increase in sales McDonald’s continues to lose market shares to its main
challenger, the national chain Max, whose sales increased by 25.6% to nearly €93 m. Max
opened eight new restaurants during 2007 and had an increase in same-store sales by 11%”
(Jan, B. (2008) cited in The Natural Step 2011) . Thus it seems McDonald was slump and
Max marches on recent years. In fact the above statement reveals Max Hamburgers
revolutionize Fast Food Industry in Sweden as Franco, V. (2010) suggests (The Natural Step
online, 2011)
5.1.2 Empirical Findings
The survey study has found both MAX and McDonald as strong competitors having a neck to
neck rivalry in the Swedish fast food market. The data analysis has identified Max as a proven
preferred brand by consumers in Sweden, which is absolutely correct with the fact published

47
by the MAX home site, “Where would you go in first place if you were to buy fast food” and
54% consumers selected MAX as preferred band (MAX online, 2011).
Furthermore, the ultimate conclusion drawn from data analysis is summarized in table 5.1 and
is illustrate clearly in figure 5.1.
Mean Value
Purchase Brand equity attributes MAX McDonald Winner
Pre-
purchase
Top of mind 28% 46% McDonald
Brand
awareness
Recognition of Logo 4.3 4.89 McDonald
Recognition of Slogan 1 4.1 McDonald
Brand
association Preferred brand 1.69 1.59 MAX
Purchase Perceived
quality Accumulated mean 3.58 3.51 MAX
Post-
purchase
Brand
loyalty Accumulated mean 3.42 3.3 MAX
Total 13.99 17.39 McDonald
Table 5.1 Measuring Brand Equity of MAX and McDonald
Figure 5.1 Measuring Brand Equity of MAX and McDonald

48
It reports that consumers have well perceived MAX for its Swedish taste, reasonable price,
varieties of products and additional services like wifi in a friendly environment. Consumers
have highly appreciated its carbon labeling menu and their theme “Eating less meat”.
According to MAX online (2011), a national survey conducted among 1,000 respondents on
2009-03-25 also vote MAX as Sweden’s tastiest and best hamburgers. So, MAX consumers
have been found greatly satisfied and more loyal to the brand and for the reason burger war
issue were emerged as world news, defeating McDonald in some parts of Sweden.
MAX has again scored high in brand loyalty and brand association. But unfortunately, it
could not be on the top of consumer’s mind. On the contrary, consumers are highly aware
about McDonald for its global reputation and have strong brand knowledge on what
McDonald stands for such as “Golden Arches with Red background, I’m lovin’ it, Happy
Meal, Ronald McDonald”. This means by scoring high in brand awareness, McDonald has
win Swedish mind but yet it again fails to win Swedish heart because of less performance in
other attributes. Besides, consumer’s frequent visit to both brands is almost same but
McDonald’s purchasing number is little higher than MAX (see table 4.2 and 4.3) although
consumer has prioritized MAX as first preferred brand.
In short, accumulated mean value states that McDonald has performed better in terms of
Customer Based Brand equity management in the study.
Apart from brand equity performance in both brands, the table also clearly illustrates as how
consumer behavior is affected by equity assets which in turn has add brand value to both
bands as sorted out in below.
The significant benefits achieved by both brands so far:
(1) MAX’s Brand Portfolio:
• The argumentation made in burger war: MAX’s sale has dramatically increase
slowing down McDonald in contemporary years
• MAX Marketing strategy states(from Data analysis): the increment in brand loyalty
by 27% within 2007 to 2009
• Highest rating in Customer satisfaction for consecutive years 2006,2007,2008,2009 in
Sweden
• MAX image as World’s first fast food chain on Carbon labeling of entire menu
(2) McDonald’s Brand Portfolio:
• Introduce McCafe as brand extension which is competing with StarBucks.

49
• MAC index discovered to measure currency valuation and Purchase Power Parity (Big
MAC index online, 2011)
• McDonalds Corporation stock price in New York Stock Exchange ((NYSE:MCD;
Average bid is $ 80 ) (The Stocknod online, 2011)
The observation made so far both brands demonstrates that MAX’s performance is better and
considerably improved in recent years but it has to initiate strong marketing strategy
(suggested in recommendation) on managing brand equity in order to win both Swedish heart
and Swedish mind to compete with McDonald and other brands in Swedish Market.
Thus, with the empirical comparative study of both global chain McDonald and National
chain MAX , the study has generalize on the most imperative marketing strategy called brand
equity.

50
CHAPTER 6 CONCLUSION AND RECOMMENDATION
This chapter attempts to draw final conclusion about brand equity for making it worth value
to marketers. Further, based on data analysis and discussion, the recommendation will be
deliver to both brands, MAX and McDonald for their successful and competitive operation in
Sweden.
6.1 Conclusion
A need of product differentiation emerge with a mounting competition in a market where
players battle for same product to retain top position and to capture consumer’s mind by
means of strong marketing tools. A notion of brand equity is about varying one’s product
from another in every possible way; a recognized brand image, competitive offerings,
reasonable price, quality service, friendly and supportive environment and unique brand
elements (like; logo, slogan, jingles and package) making a similar product special,
meaningful and distinctive from competitors. It means brand equity delivers a message of
product and brand to consumers making them unique, familiar and conscious. Also, guides
them for why and how to choose a product of a particular brand or of a company among
various competitors in the market. It spotlight on building an equity relationship of consumers
to stay with a brand by capturing consumer’s preference and loyalty. This in turn, will
add/subtract value to firm’s performance in the form of different equity assets called; brand
awareness, brand loyalty, perceived value and brand association. That’s why, to gain this
profitable and competitive advantage in a fierce market, brand marketers emphasize to
introduce a new brand though it cost approximately $ 100 million with a probability of 50%
failure (Ourusoff, 1993; Crawford, 1993 recited by Kim, Kim, & An, 2003).
Understanding a significant importance of brand equity and it’s interaction within fast food
market in a Sweden is a main purpose of this study. The research was executed on the
interface of Consumer Based Brand Equity framework which reveals that consumers like to
purchase a familiar brand that can assure guarantee for the quality and services offer. They
recall the brand that comes on top of their mind (i.e., through past experience or external
marketing stimuli) and build an emotional relationship with a brand for the yielded
satisfaction. They also commit a degree of loyalty to same brand by repeat purchase for the
pleasure received without price discrimination. Thus, consumers on one hand, obtain high
degree of confidence in product choice and high satisfaction level. The firm, on other hand,

51
benefits from growing number of loyal and prospective consumers, greater sales turnover and
profitable market growth in terms of price, product, place, promotion and brand extension.
The firm also gains an additional and positive reputation from consumer’s WOM which is a
free advertisement for building strong brand image among other consumers. This is how, the
equity assets termed; brand awareness, brand loyalty, perceived value and brand association
add “Brand Value” to a product by allowing higher price, function as “Reason to Buy” to
consumers for perceived brand association and brand knowledge and simultaneously stands as
a judgmental attribute to investors for a firm’s performance. The importance of forwarding a
concept of CBBE is to focus on reinforcing marketing strategies for organizing a proper brand
management in the firm (Keller, 1998). Hence, the multidimensional approach of Brand
Equity suggests marketers to identify distracting consumer behavior so as to apply efficient
branding programs through unique brand elements and to make introduced brand justifiable.
6.2 Recommendation
In the comparative study of Sweden’s popular fast food chain of hamburger, McDonald has
relatively found high brand equity than MAX for its global brand image. As, it is crystal clear
that a brand with high brand equity attains strong brand image in consumer’s mind and yields
high market position in the competition. Hence, based on research findings and data analysis,
few recommendations are suggested for corresponding brands.
1. Brand Awareness:
MAX: To meet an expansion objective of MAX -100 restaurants over the nation by
2012, firstly it needs to strengthen the brand awareness by various marketing means of
advertising and promotional tools to provide consumers up to date information about
the brand, offers, changes features and many others. Creating brand elements like
slogan, jingles, attractive packaging can be another brand tactic as they are associate
with products tracing consumer’s memory (Keller, 1998). So, they are easily
memorize and recognized by consumers in different circumstances. Hence higher the
brand awareness higher the brand recall and brand recognition easing consumers for
product choice.

52
2. Perceived quality:
MAX: MAX restaurants are difficult to approach because of a place gap and
inflexible timing. Consumers feel serving speed is merely moderate and expect for
more friendly staffs. So, appropriate staff training should be undertaken for better
customer service and to create more open and friendlier environment.
McDonald: It should improve the Swedish taste in menu; fresh ingredients with
Swedish flavor and set up an affordable and competitive price. The marketing
manager should conscious about health and environment friendly food offerings like
MAX’s product- delifresh (low carbohydrate burger), carbon labeling menu and use of
less fat.
.
3. Brand loyalty:
MAX and McDonald: The frequency of re-choosing and recommending the brand is
likely similar in both brands. But both of them haven not pay any attention to loyal
consumers. Both brands can offer special service or member cards or any preferential
treatments to motivate existing consumers for repeat purchase and help in developing
a positive brand image. Also, consumers will like to share about those services and
offerings by WOM which probably add advertising of that brand free of cost.
4. Brand Association:
MAX: In Sweden, it is a preferred brand that consumers like to associate for its brand
personality but it need to put heavy efforts in advertisement, not merely in radio but
also in banner, TV, Newspaper and many other means. Advertising help to aware
consumer by providing sufficient brand knowledge. It might also attract franchisers
for partnership bridging a strong channel mix.
McDonald: The brand lack WOM from consumer in comparison to MAX, which
means consumer like to talk less about the product/brand with others. The marketer
requires investigating this serious problem because WOM is strong communication
channel than other means.
Thus, this paper contributes as an additional brick in the CBBE framework particularly in fast
food market as in understanding what brand equity is actually about, how it works and what
pros does it creates that is making it so noticeable in marketer’s eyes.

53
REFERENCES
Aaker, David A. (1991). Manageing brand equity:capitalizing on the value of a brand name .
New York: The Free Press.
A.Room. (1992). History of Branding In. (J.Murphy, Red.)
Anderson, E. W., Fronell, C., & Lehmann, D. R. (1994). Customer Satisfation, Market share
and profitability. Journal of Marketing , 58, 53-66.
Ashton, A. S. (2010). Hotel Restaurant Dining: The Relationship between Perceived Value
and Intention to Purchase. Toursim and Hospitality Research. 10 (3), 206-218.
Bacon, D. R. (2003). A comparision of approaches to Importance-Performance Analysis.
International Journal of Market Research , 45 (Quater 1).
Bryman, A., & Bell, E. (2007). Business Research Methods (Second uppl.). New York:
Oxford Univrsity Press Inc., .
Essoussi, L. H., Merunka, D., & Martikowski, B. (2010). Brand orgin and county of
manufacture influences on Brand equity and the moderating role of brand typicality. Journal
of Business Research .
Eugene W.Anderson, C. F. (1994). Customer Satisfaction, Market Share, and Proditability:
Findings from Sweden. Journal of Marketing , 58, 53-66.
Gratton, C., & Jones, I. (2004). Research methods for sports studies. London Routledge
Grönroos, C. (2007). Service Management and Marketing (3rd uppl.). England: John Wiley
and Sons Ltd.
Hankinson, G., & Cowking, P. (1996). The Reality of Global Brands. McGRAW-HILL
Publishing Company.
Hong-bumm Kim, W. G. (2003). The effect of consumer-based brand equity on firms'
financial performance. The journal of consumer Marketing , 20 (4/5).
Howard, John A. (1989). Consumer Behavior in Marketing Strategy. Prentice-Hall, Inc.
Keller, K. (2010). Brand equity management in a multichannel, multimeda retail environment.
Journal of marketing , 24 (2), 58-70.

54
Keller, K. (1993). Conceptualizing, Measuring, and Managing Customer based brand equity.
Journal of Marketing , 57, 1-22.
Keller, K (1998). Strategic Management:Building, Measuring and Managing Brand equity.
Kim, H.-b., Kim, W. G., & An, J. A. (2003). The effect of consumer-based brand equity on
firms' financial performance. The journal of Consumer Marketing, 20 (4/5), 223.
Kisang Ryu, H. H.-H. (2008). The relationships among overall quick-casual restaurant image,
perceived value, customer satisfaction and behavioral intentions. International Journal of
Hospitality Management, 57 (3), 459-469.
Kurtz, D., MacKenzie, H.F. and Snow, K. (2009). Contemporary Marketing. Toronto: Nelson
Education Inc
Leedy, P D and Ormrod, J E (2001). Practical Research: Planning and design (7th ed,).
Pearson Educational International and Prentice Hall: New Jersey.
Macdonald , Emma K., B. M. (2000). Brand awareness effects on consumer decision making
for a common, repeat purchase product. Journal of Business Research , 48 (1).
Malhotra, N. & Birks, D. (2007). Marketing Research, an Applied Approach, Third European
Edition. Harlow: Pearson Education
Minor, M., & Mowen, J. C. (1998). Consumer Behavior (4th uppl.). (D. Borkowsky, Red.)
US: Prentice-Hall, Inc.
Muijis, D. (2004). Doing quantitative research in education with SPSS. London: Sage
publications Ltd
Neuman, W. L. (2000). Social research methods: Qualitative and quantitative approaches,
Toronto: Allyn and Bacon.
Pope J. L. (1993). Practical Marketing Research. Amacon, New York, 152 - 155
Prasad, K.,& Dev, C.S. (June 2000). Managing hotel brand equity: a customer-centric
framework for assessing performance.coenell hotel and restaurant administration. The journal
of Cornell Hotel and Restaurant Administration Quarterly, 41 (3), 22-31.
Robson, C. (1993). Real world research: a resource for social scientists and practitioner
researchers.Cambridge, USA: Blakewell

55
Saunders, M., Lewis, P., A., & Thornhill (2003). Research Methods for Business Student (3rd
ed.), England Prentice Hall.
SueLin, C (2010). Understanding consumer purchase behavior in the japanese person
grooming sector. Journal of Yasar University , 17 (5).
Wade, D. J., & Eagles, P. F. (2003). The Use of IPA and Market segmentations in Tourism
Management . Journal of Ecotourism , 2 (3).
Wood, L. (2000). Brands and brand equity:definition and management. The journal of
Managmeent Decision , 38 (9), 662-669.
Internet sources
Business dictionary [online]. Available from:
www.businessdictionary.com/definition/standard-deviation.html (Retrieved on 25 April,
2011)
Business dictionary [online]. Available from:
www.businessdictionary.com/definition/convenience-sampling.html (Retrieved on 20 April,
2011)
Buzzle [online] (2009). History of the fast food industry. Available from:
www.buzzle.com/articles/history-of-the-fast-food-industry.html. (Retrieved on 19 February,
2011)
Food service Europe [online] (2008). Sweden: A burger chain year. Available from:
www.food-service-europe.com/market/rankings/pages/Sweden-A-Burger-Chain-
Year_113.html (Retrieved on 17th March 2011)
Franco, V. (2010). Max hamburgers Sweden Revolutionize fast food industry: New case
study released. The Natural Step [online]. Available from:
www.naturalstep.org/en/canada/max-hamburgers-sweden-revolutionize-fast-food-industry-
new-case-study-released (Retrieved on 17th March 2011)
Hubpages [online]. McDonald’s Strange menu around the world. Available from:
hubpages.com/hub/McDonalds_Strange_Menu_Around_the_World (retrieved on 11 April,
2011)
56
Marketing pilgrim [online] (2007). What top brands spend on advertising. Available from:
www.marketingpilgrim.com/2007/10/what-top-brands-spend-on-advertising.html. (Retrieved
on 1 January, 2011)
Maura, D (2010). Max Hamburger and The Natural Step. The Natural Step [online].
Available from:
www.naturalstep.org/sites/all/files/Max-TNS-CaseStudy-FINAL_0.pdf (Retrieved on 7 April,
2011)
Max [online]. Available from:
max.se/en/max.aspx?page=expansion. (Retrieved on 17 February, 2011)
McDonald [online]. Available from:
www.aboutmcdonalds.com/mcd/our_company/mcd_history.html. (Retrieved on 17 February,
2011)
The Restaurang Varlden [online]. Max expands to more countries after success in Norway.
Available from:
www.restaurangvarlden.se/Nyhetsarkiv/Arkiv/Max-expanderar-i-fler-lander-efter-succe-i-
Norge (Retrieved on 17th April, 2011)
The Sample questionnaire [online]. Available from:
www.samplequestionnaire.com/brand-association-questionnaire.html (Retrieved on 25 April,
2011)
The Stocknod [online]. McDonald’s stock prices. Available from:
www.stocknod.com/MCD-McDonalds-stock-prices.aspx (Retrieved on 17th May 2011)
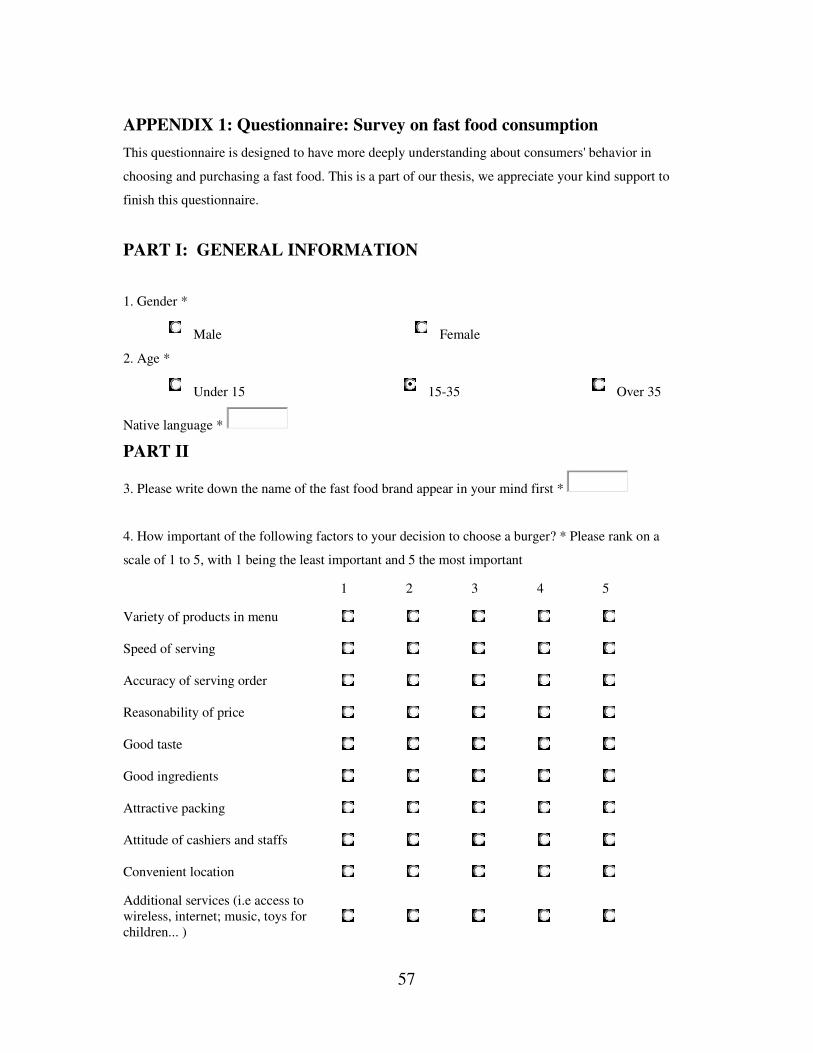
57
APPENDIX 1: Questionnaire: Survey on fast food consumption
This questionnaire is designed to have more deeply understanding about consumers' behavior in
choosing and purchasing a fast food. This is a part of our thesis, we appreciate your kind support to
finish this questionnaire.
PART I: GENERAL INFORMATION
1. Gender *
Male Female
2. Age *
Under 15 15-35 Over 35
Native language *
PART II
3. Please write down the name of the fast food brand appear in your mind first *
4. How important of the following factors to your decision to choose a burger? * Please rank on a
scale of 1 to 5, with 1 being the least important and 5 the most important
1 2 3 4 5
Variety of products in menu
Speed of serving
Accuracy of serving order
Reasonability of price
Good taste
Good ingredients
Attractive packing
Attitude of cashiers and staffs
Convenient location
Additional services (i.e access to wireless, internet; music, toys for children... )

58
1 2 3 4 5
Customer service
Opening hours
5. Which brands would you like to be most associated with? Rank in order of your preference on a
scale of 1 to 4, with 1 being your most preferred and 4 being your least preferred. *
1 2 3 4
Burger King
Max Burger
McDonald
Subway
6. Have you got any membership card of fast food restaurant? *
Yes No
If "Yes", Which one?
McDonald Burger King Subway
Max Burger Others
7. How often do you have fast food products in a week? *
0-2 times 3-5 times 6-9 times 10 or more
McDonald
Max Burger
Others
8. How much money do you spend on fast food products in a week? *
Less than 100kr
100kr -300kr 300kr - 500kr
More than 500kr
McDonald
Max Burger
Others

59
MAX BURGER
9. How do you know about Max Burger? *
Friends and family Website
Past experience Advertisement
10. Can you recognize the logo of Max Burger? *
Yes No
11. Which of the following sentences is Max Burger's slogan? *
Have it your way Hot eats, cool treats
We do it like you'd do it No slogan
I don't know
12. How satisfied are you with Max Burger in the following categories? * Ranking according to your
opinion
Do not satisfy at all
Satisfy partially
Neither Satisfy Satisfy totally
Variety of products in menu
Speed of serving
Accuracy of serving order
Reasonability of price
Good taste
Good ingredients
Attractive packing
Attitude of cashiers and staffs
Convenient location
Additional services (i.e. access to wireless, internet; music, toys for children...)
Customer service
Opening hours

60
13. From scale 1 - 5 (1 is totally disagree and 5 is totally agree), how do you agree with the following
statements? *
1 2 3 4 5
1. Max Burger is a brand that I would like to choose again.
2. Max Burger is a brand that I would like to introduce to my friends and family.
3. If Max Burger's price is 10% higher than other brands, I will choose another one.
McDonald
14. How do you know about McDonald? *
Friends and family Website
Past experience Advertisement
15. Can you recognize the logo of McDonald? *
Yes No
16. Which of the following sentences is McDonald slogan? *
I'm lovin' it Bigger! Better!
Finger Lickin' Good Your way, right way.
I don't know
17. How satisfied are you with McDonald in the following categories? * Ranking according to your
opinion
Do not satisfy at all
Satisfy partially
Neither Satisfy Satisfy totally
Variety of products in menu
Speed of serving
Accuracy of serving order
Reasonability of price
Good taste
Good ingredients

61
Do not satisfy at all
Satisfy partially
Neither Satisfy Satisfy totally
Attractive packing
Attitude of cashiers and staffs
Convenient location
Additional services (i.e. access to wireless, internet; music, toys for children...)
Customer service
Opening hours
18. From scale 1 - 5 (1 is totally disagree and 5 is totally agree), how do you agree with the following
statements? *
1 2 3 4 5
1. McDonald is a brand that I would like to choose again.
2. McDonald is a brand that I would like to introduce to my friends and family.
3. If McDonald price is 10% higher than other brands, I will choose another one.
Thank you for your support!
If you are interested in the survey results analysis, please do not hesitate to contact:

62
APPENDIX 2: PERCEIVED QUALITY
Importance of
attributes
Performance of Max Performance of
McDonald
Sum Mean Std Sum Mean Std Sum Mean Std
Variety of products in
menu
625 3.47 1.17 698 3.88 0.75 641 3.56 1.01
Speed of serving order 678 3.77 0.92 619 3.44 0.99 677 3.76 0.89
Accuracy of serving
order
706 3.92 0.98 685 3.81 0.84 668 3.71 0.97
Reasonability of price 755 4.19 0.98 619 3.43 0.97 638 3.54 1.01
Good taste 823 4.57 0.76 702 3.9 1.02 620 3.44 1.16
Good ingredients 538 2.99 1.11 669 3.72 0.97 579 3.22 1.08
Attractive packing 736 4.11 0.98 592 3.29 0.82 588 3.27 0.92
Attitudes of staffs and
cashiers
676 3.76 0.95 638 3.54 0.82 624 3.47 0.88
Convenient location 700 3.89 0.93 637 3.54 0.94 681 3.78 1.05
Additional services 488 2.73 1.24 564 3.13 0.88 568 3.16 0.97
Customer service 654 3.65 0.99 628 3.49 0.82 610 3.39 0.89
Opening hours 704 3.91 0.94 683 3.79 0.87 678 3.76 1.03

63