MASTER'S THESIS Growing Plants on the Moon - DiVA Portal
73
2008:177 CIV MASTER'S THESIS Growing Plants on the Moon A Design Concept Pre-Study: for the Lunar Equator Annika Eriksson Luleå University of Technology MSc Programmes in Engineering Space Engineering Department of Applied Physics and Mechanical Engineering Division of Physics 2008:177 CIV - ISSN: 1402-1617 - ISRN: LTU-EX--08/177--SE
-
Upload
khangminh22 -
Category
Documents
-
view
0 -
download
0
Transcript of MASTER'S THESIS Growing Plants on the Moon - DiVA Portal

2008:177 CIV
M A S T E R ' S T H E S I S
Growing Plants on the MoonA Design Concept Pre-Study: for the Lunar Equator
Annika Eriksson
Luleå University of Technology
MSc Programmes in Engineering Space Engineering
Department of Applied Physics and Mechanical EngineeringDivision of Physics
2008:177 CIV - ISSN: 1402-1617 - ISRN: LTU-EX--08/177--SE
i
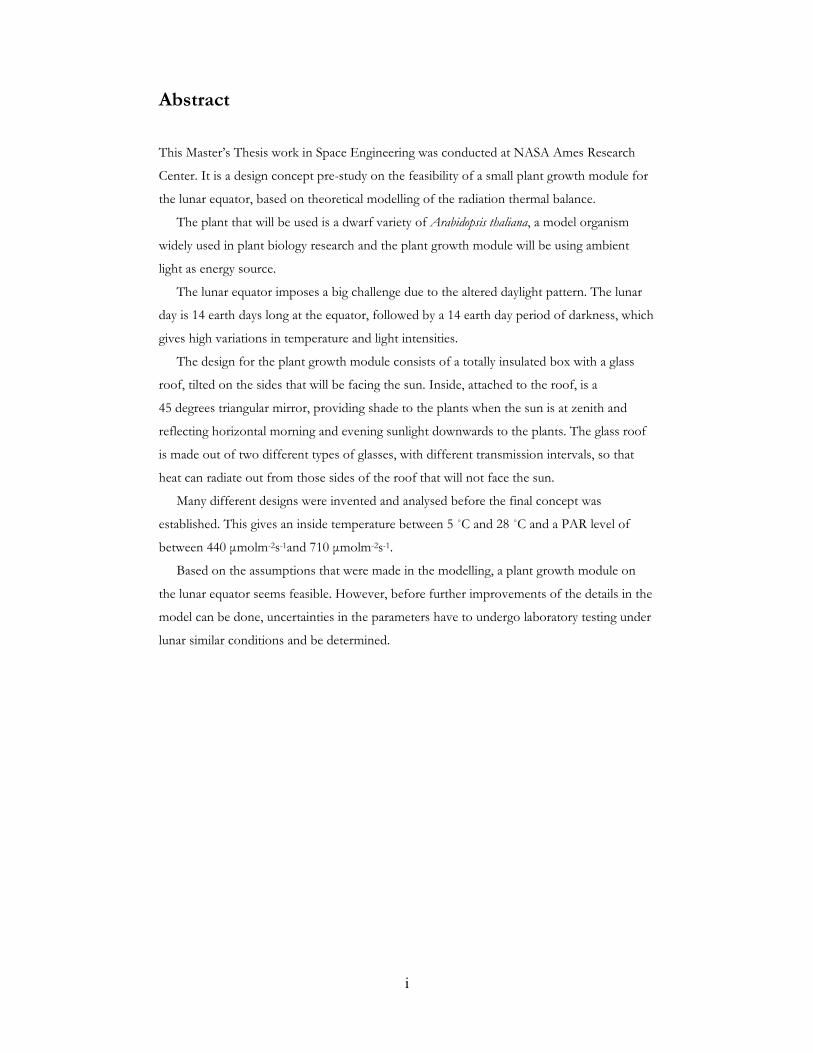
Abstract
This Master’s Thesis work in Space Engineering was conducted at NASA Ames Research
Center. It is a design concept pre-study on the feasibility of a small plant growth module for
the lunar equator, based on theoretical modelling of the radiation thermal balance.
The plant that will be used is a dwarf variety of Arabidopsis thaliana, a model organism
widely used in plant biology research and the plant growth module will be using ambient
light as energy source.
The lunar equator imposes a big challenge due to the altered daylight pattern. The lunar
day is 14 earth days long at the equator, followed by a 14 earth day period of darkness, which
gives high variations in temperature and light intensities.
The design for the plant growth module consists of a totally insulated box with a glass
roof, tilted on the sides that will be facing the sun. Inside, attached to the roof, is a
45 degrees triangular mirror, providing shade to the plants when the sun is at zenith and
reflecting horizontal morning and evening sunlight downwards to the plants. The glass roof
is made out of two different types of glasses, with different transmission intervals, so that
heat can radiate out from those sides of the roof that will not face the sun.
Many different designs were invented and analysed before the final concept was
established. This gives an inside temperature between 5 ˚C and 28 ˚C and a PAR level of
between 440 µmolm-2s-1and 710 µmolm-2s-1.
Based on the assumptions that were made in the modelling, a plant growth module on
the lunar equator seems feasible. However, before further improvements of the details in the
model can be done, uncertainties in the parameters have to undergo laboratory testing under
lunar similar conditions and be determined.

ii

iii
Preface This report is the diploma thesis for the Master of Science in Space Engineering Programme
at Luleå University of Technology. It is the result of a collaboration between Luleå
University of Technology and NASA Ames Research Center in California. It was directed
under Dr. Chris P. McKay, who initially presented the idea of what turned out to be this
project, to me and my fellow student from Luleå University of Technology, Rasmus Larsson,
whom I worked with on a side-by-side project. Both of them are for a plant growth module,
but for two separate cases, one for the lunar equator (for which this report is written) and
one for the lunar south pole (by Rasmus Larsson). Both projects were in collaboration with
Dr. Robert N. Bowman.
I would like to thank Dr. Chris P. McKay for his time, knowledge and invaluable inputs
to this thesis. I also would like to thank Dr. Robert N. Bowman for his time and encouraging
enthusiasm for this project. He provided us with, for this thesis, essential knowledge about
the plants and numerous important inputs on space plant habitats.
I am very grateful for getting the possibility to do my thesis at NASA Ames. I would like
to thank all the people there that made the stay an unforgettable time, including all the
people who were kind enough to take time to escort us every morning.
Further, I would like to thank my examiner, Prof. Sverker Fredriksson, for reading the
manuscript and giving constructive suggestions for it and for giving me the opportunity of
this thesis work to start with.
Thank you also to Rasmus Larsson, for helpful discussions, and for the ability to always
bring gravity and sunshine to any world.
Finally, to my family and to Weston, thank you for all your help and support.
Annika Eriksson August 2008

iv
v
Contents
1 Introduction ................................................................................................................1
1.1 NASA Ames Research Center................................................................................................. 3
1.2 The test organism ...................................................................................................................... 4
1.3 The moon - basic parameters .................................................................................................. 6
1.4 Previous work ............................................................................................................................ 7
1.5 Project objectives and limitations ........................................................................................... 8
2 Blackbody theory ...................................................................................................... 11
3 Day ............................................................................................................................ 15
3.1 The Design ............................................................................................................................... 15
3.1.1 Material properties .......................................................................................................... 17
3.1.2 Photosynthesis ................................................................................................................. 17
3.1.3 Illumination ...................................................................................................................... 20
3.1.4 Temperature maintenance.............................................................................................. 20
3.1.5 Glass .................................................................................................................................. 20
3.1.6 Filter................................................................................................................................... 24
3.1.7 Mirror ................................................................................................................................ 25
3.2 Modelling .................................................................................................................................. 25
3.2.1 Wall heights and transmission - maximum temperature........................................... 36
3.2.2 Opening angle – minimum temperature and daylight time...................................... 38
3.2.3 Temperature curve .......................................................................................................... 39
3.2.4 PAR level estimation....................................................................................................... 41
4 Night .........................................................................................................................45
4.1 Multi-layer insulation............................................................................................................... 45
4.2 Day/Night Transition............................................................................................................. 48
4.3 Battery ....................................................................................................................................... 49
4.4 Solar cells .................................................................................................................................. 50
4.5 Modelling temperature maintenance - battery and MLI ................................................... 53

vi
5 Conclusions and discussion......................................................................................59
6 Future work............................................................................................................... 61
References....................................................................................................................63
Bibliography ................................................................................................................65

1
1 Introduction
It lies in human nature to explore the surrounding world. Today this is extended to exploring
space and the universe. Not only in order to investigate the possibility of other worlds
supporting life and how that may have formed, but also to gain important insight into our
own evolution and how to improve our current living situations, which are every day under
greater demand.
The Apollo missions first put humans on the moon during the 1960s and 1970s. Their
presence on the surface was for a short moment of time, during which they wore extensive
protection equipment, to accomplish rudimentary exploration. Now NASA has a vision to
return to the moon, in order to prepare for future exploration and use the moon as a testing
ground for space technology. The first robotic missions are scheduled to be sent to the
moon during 2008, while the first human missions will follow in 2015. The objectives are to
test new approaches, systems and operations for sustainable explorative human and robotic
missions to Mars and beyond (NASA, The Vision for Space Exploration, 2004).
If humans are to accomplish these exploration objectives to other planetary bodies, it will
require a crew to survive for long periods of independence from earth, if not for the rest of
their lives. This introduces the need to become self-reliant, a challenging prospect within the
limited capacity of a spacecraft or planetary base. Plants can provide food and serve as life
support system. There is a significant reduction in the Equivalent System Mass (ESM) cost,
concerning storing necessary food and life support apparatus when those resources are
supplemented by plant based provisions. These factors highlight the importance of plant
growth module design, especially those that incorporate the use of ambient light in a space
or lunar environment (Figure 1).

2
Figure 1. Reduction of Equivalent System Mass (ESM) cost, through supplementing mission stowage and supply, with plant growth systems using ambient lights (lowest dotted curve). ESM cost is used as a transportation cost measure, in Advanced Life Support (ALS) trade studies, to avoid the complication of using dollar costs for comparisons. Because the cost to transport a payload is proportional to the mass of the payload, a mass-based measure such as ESM is used to quantify the launch cost of the life support system and associated infrastructure. An ESM value (y-axes) represents the sum of the life support system mass and appropriate fractions of supporting system masses, including pressurized volume, power generation, cooling, and crewtime, for maintaining a crew over the duration (x-axes) of a specified mission. (Drysdale, 2001)
Growing plants in a lunar environment will be a first step in demonstrating that plants and
recognizable life can survive and thrive on other worlds, for example on Mars, from a more
convenient space travel distance of three days, instead of several months. A growing plant
on the moon would also be highly symbolic and serve as an inspiration encouraging people
to pursue science and continuing the exploration of the universe.
Plants have been chosen as the first organism to be sent back to the moon based on a
number of important characteristics. Plants are extremely durable organisms that can cope
with numerous environmental perturbations such as extreme temperature fluctuations and
varying light intensities. Their seeds can also survive unaffected for long periods in space
before an experiments needs to be initiated. Also, in case of experimental failure, the death
of a plant individual is acceptable, which would not be the case if the experimental organism
was to be an animal. It is natural that plants become the first lunar inhabitants before human
settlements are established.
This project started as an astrobiology mission concept study for developing a small payload
plant growth module for the moon, or in short; to investigate the possibility of growing
plants on the moon. The focus of this thesis report is on the temperature estimations and

3
design parameters for the plant growth module (PGM). At first, plant growth modules for
both Mars and the moon were considered, but later the work concentrated on investigating
the moon module only. This was due to the fact that the actual possibility of flying a payload
to the moon within a realistic time frame is much higher than one to Mars. There is also a
more established and developed initiative to go to the moon, which is a natural first step
towards going further into space.
The specific location for a PGM on the lunar surface has as of yet not been decided. To
be prepared for whichever scenario offered, designs for both the lunar south pole and the
lunar equator were invented. Each location introduces unique challenges, since they face
different solutions for lightning conditions. This report treats the equatorial part.
1.1 NASA Ames Research Center
NASA Ames Research Center is situated at Moffett Field on the border between Sunnyvale
and Mountain View, California, in the heart of Silicon Valley. This region is characterized by
dynamic research occurring within the numerous universities and high-tech companies.
NASA centre Ames was founded as the second NASA centre out of ten in 1939 as an
aircraft research laboratory by the National Advisory Committee for Aeronautics, NACA. In
1958, it became part of the National Aeronautics and Space Administration, NASA.
This was to address the fact that USA also needed an enhanced space programme to
compete with the Soviet Union, who in 1957 had launched Sputnik into space.
The research at Ames was groundbreaking in developing many flight regimes through the
construction of wind tunnels, one of which is the world’s largest. Other research included
the construction of research aircraft and developing methods for theoretical aerodynamics.
Naturally, the aeronautical research of NACA/NASA was of military interest and Ames
collaborated with the US Navy and later on with the US Airforce.
During World War II, the Moffett Federal Airfield was one of the outposts for defending
the US west coast. A huge hangar for dirigibles that were used to patrol the pacific is still
situated on base, giving it a very distinct visual impression.
Some of the most famous space missions managed by NASA Ames Research Center
were the Pioneer Spacecraft Missions, a series of eight spacecraft missions launched between
the 1960s to the 1990s, in which Pioneer 10 eventually became the first spacecraft to leave
the solar system.
Today, Ames leading research focuses on supercomputing, nanotechnology,
biotechnology, aerospace and thermal protection systems and fundamental space biology,
including for example the effects of gravitation on human physiology.

4
Ames is NASA’s leading centre for astrobiology, conducting research in all aspects of life
in the universe.
Figure 2. View of NASA Ames Research Center with the large wind tunnel in the front and the old airship hangar to the right. (Image from www.pincta-cal.com/images/NASA_Ames.jpg)
1.2 The test organism
The test organism used in this experiment is the plant Arabidopsis thaliana, also known as
thale cress, a model organism widely used in plant biology research. Arabidopsis has no
particular agricultural significance but is related, for example, to cabbage, broccoli and radish.
It has a relatively small genome of 5 chromosomes, with 125 mega base pairs encoding about
25500 genes (The Arabidopsis Genome Initiative, 2000). It was the first higher plant to be
genetically sequenced. More is known about this particular plant’s genetics than any other.
This background of knowledge makes Arabidopsis a well suited specimen for basic research,
since it is easier to manipulate and trace through genetic engineering than other plants.
Arabidopsis has a short life cycle of about 45-50 days from germination to mature seed
under optimal conditions and is easy to grow in limited space, which is a constraining
property common to space based plant growth chambers. It is also the predominant
specimen used in plant experiments on the International Space Station, ISS.
The most commonly used cultivars (cultivated plants that have been selected and given
specific names because of their specific characteristics) of Arabidopsis are Col (Colorado)
and LER (Landsberg erecta). They produce small easily recognizable flowers when they are
sexually mature. At maturity, the stem becomes about 20 cm high. However, for space plant
microhabitat purposes, a dwarf line of Arabidopsis cultivars was created by Bowman at
NASA Ames, through several years of screening mutants. Additional mutations that could
visually verify normal genetic segregation through leaf and seed colour were obtained. For

5
example, red leaves versus green can be used as a genetic marker indicating the occurrence of
meiosis, the reduction division process in cells that is essential for sexual reproduction. This
genetic marker is important for remotely monitoring aspects of plant health and growth
within a growth chamber on the lunar surface.
Previously at NASA Ames, life cycle trials with different lightning conditions have been
run to observe how the altered diurnal pattern of the moon could affect the plants (Bowman,
2008). Continuous illumination throughout the entire life span of the plants were tested, as
were lunar equator daylight pattern, which in these experiments often is referred to as “worst
case scenario” for the moon. The conditions are 14 earth day daylight followed by 14 earth
day darkness. In all the lunar daylight illumination increments, the temperature was kept at
22 ˚C. When lunar night temperature was maintained at 22 ˚C, all the test plants died after
the first day/night cycle. When the lunar night temperature was lowered to 10 ˚C, or 4 ˚C,
healthy normal Arabidopsis plants were grown to full sexual maturity in four lunar day/night
cycles.
Plants grown under 4 ˚C nights produced viable seeds in 62 earth days from seed
germination. This data indicates that a two-generation Arabidopsis experiment could be run
on the moon with visually analyzable second-generation plants in approximately 70 earth
days (Bowman, 2008).
Figure 3. Arabidopsis Col (right) and dwarf lines (left) developed for spaceflight experiments. All plants at same maturity and about 38 days old. (Courtesy R. Bowman)

6
Figure 4. A 45 days old dwarf Arabidopsis. (Courtesy R. Bowman)
Figure 5. Genetic markers, such as red versus green leaves. Visual detection of markers will establish that meiosis has occurred on the moon. (Courtesy R. Bowman)
1.3 The moon - basic parameters
The moon’s orbital period is 655.72 hours or almost 28 days. Therefore, at the equator, the
lunar day consists of 14 earth days of daylight, followed by 14 earth days of darkness. For an
object located on the lunar equator, without any shielding against the sunlight during
daytime, temperature is going to vary strongly between lunar midday and night. The
measured surface temperature at the equator varies between -173 ˚C and 117 ˚C.
7
The moons equatorial surface gravity is approximately one sixth of that of the earth, or
1.622 ms-2, and there is no significant magnetic field.
The atmosphere of the moon is so thin it is considered to be negligible. The total mass of
the lunar atmosphere is 104 kg, in comparison to that of the earth, 5.1480×10¹⁸ kg.
Therefore, convection as a heat transfer mechanism is not valid, which also is considered to
be the case for conduction, since the conductivity of the lunar regolith is very low.
The lunar surface is constantly exposed to hazardous radiation from solar flares, cosmic
rays and secondary back-scattering from incoming heavy ions. This constitutes a big threat to
any living tissue placed in this environment.
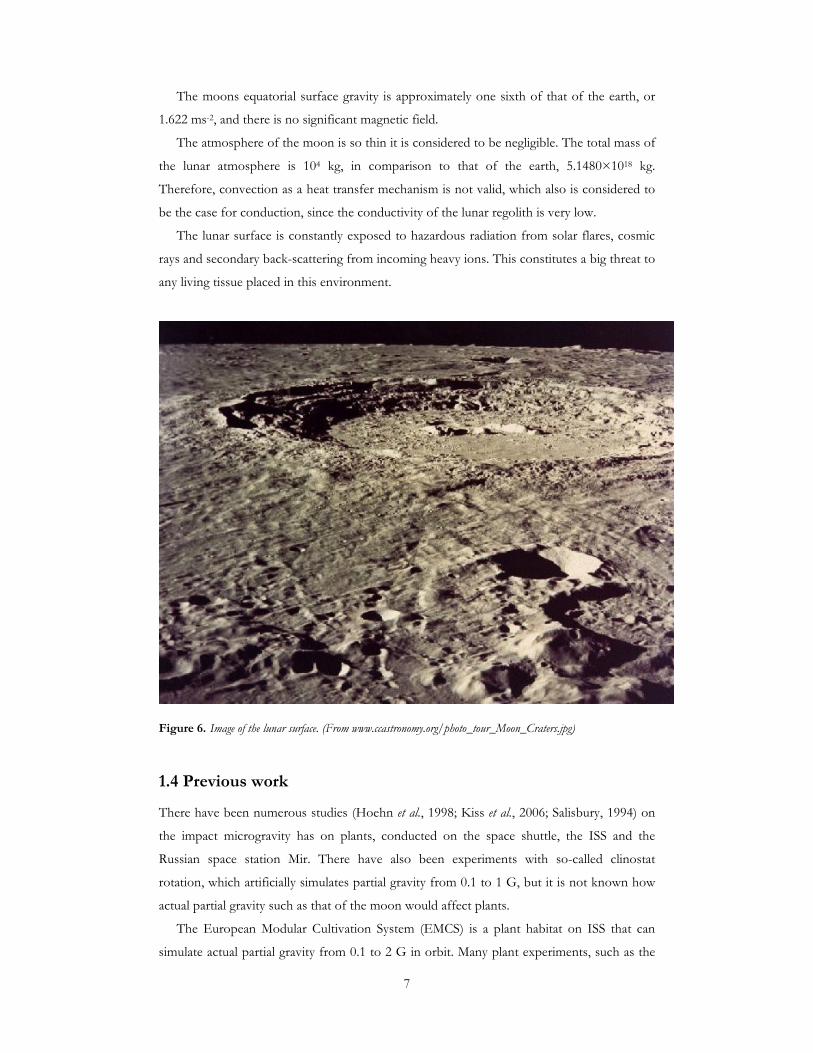
Figure 6. Image of the lunar surface. (From www.ccastronomy.org/photo_tour_Moon_Craters.jpg)
1.4 Previous work
There have been numerous studies (Hoehn et al., 1998; Kiss et al., 2006; Salisbury, 1994) on
the impact microgravity has on plants, conducted on the space shuttle, the ISS and the
Russian space station Mir. There have also been experiments with so-called clinostat
rotation, which artificially simulates partial gravity from 0.1 to 1 G, but it is not known how
actual partial gravity such as that of the moon would affect plants.
The European Modular Cultivation System (EMCS) is a plant habitat on ISS that can
simulate actual partial gravity from 0.1 to 2 G in orbit. Many plant experiments, such as the

8
EMCS’s Multigen, fail because the water supply system is hard to control; the plants either
dry or drown. And results are very seldom published. In general, water management seem to
be the key problem to solve (Bowman, 2008). Being on the moon instead of in orbit offers
certain advantages, since even partial gravity will cause water to move through the soil as it
does on earth rather than remaining suspended in the soil.
Dwarf Arabidopsis plants have been grown successfully on Mars-analogue sites by NASA
Ames researchers under lunar and Mars conditions (Bowman, 2008).
In a preliminary literature search, concepts for space/Mars greenhouses can be found.
However, none of these provide detailed discussions and calculations for temperature
management and construction design. They are also almost exclusively large-scale inflatable
greenhouses. Many experiments also use LED light systems.
Investigations and discussions concerning ideal lunar landing sites for greenhouses mostly
favour the south pole due to the unlimited availability of sunlight there.
1.5 Project objectives and limitations
As stated in Introduction, the immediate objective of this project is to investigate if putting a
small plant growth module on the moon is plausible. If the results from preliminary analyses
were found to be positive, design suggestions were to be developed.
Some restrictions in the design were given. One of the biggest restrictions was the
preference for “no moving parts”. This was established because moving parts impose a high
risk factor of failure, and without human assistance, the possibility of repairing such a failure
is very low. To overcome this restriction, a lot of experimenting with mirrors and different
designs had to be considered. In general, the consistent idea followed when coming up with
the design concept was to keep it simple.
Since a PGM would most likely have to compete for the very limited and highly coveted
spacecraft and/or rover space among many other experiments, it has to be small and energy
efficient, preferably even self-sufficient.
A very important experiment detail is data collection. Basically, the crucial and most
effectual data is visual, and therefore a camera should be placed inside the PGM. Strains of
Arabidopsis can be genetically engineered to display certain visual cues indicating various
stresses within their environment. The biological analyses of the experiment are beyond the
scope of this project.
In order to accomplish a full Arabidopsis life-cycle, the experiment has to run for about 70
earth days. This means that it will be exposed to about 5 lunar day/night cycles and all that
implies for maintaining viable living conditions inside the PGM.

9
To maintain viable living conditions, the temperature must not rise above 30 ˚C or drop
below 4 ˚C. An ideal lunar day temperature would be between 22 ˚C and 25 ˚C. During lunar
night, the temperature should be maintained between 4 ˚C and 10 ˚C.
For lightning conditions, the photosynthetically active radiation (PAR), which is solar
radiation in the wavelength interval between 400 nm and 700 nm, is needed for the plants to
survive, with the ideal irradiation level at 800-900 µmols-1m-2 (Bowman, 2008). Of particular
importance, plants must be shielded against the damaging ultraviolet solar radiation, since
there is no protecting atmosphere on the moon.
Another restriction in this design is that all the light inside the PGM should be natural
sunlight; no artificial lightning systems should be used. This is important to the project’s
original objective, which is to make use of all available resources, keeping it as close as
possible to the conditions of the ambient environment.
For a plant growth module to function and sustain viable plant conditions, many more
requirements remain, for example humidity and atmospheric control and a nutrient supply
system, but this is also beyond the scope of this project. These topics will be addressed later
on in this report.

10

11
2 Blackbody theory
All objects above the absolute temperature of zero emit thermal radiation. Planck’s radiation
law states that in the wavelength interval λd , at wavelengthλ , the energy per volume de is,
1exp
8
05
0
−
=
λ
λλπ
kT
hc
dhcde ,
(2.1)
where h is Planck’s constant, 0c is the speed of light in vacuum, k is Boltzmann’s constant
and T is the blackbody temperature.
Spectral radiant exitance λM describes the radiated power within a spectral interval
around wavelengthλ as
λλd
decM
40= . (2.2)
Equation (2.1) in (2.2) gives
1exp
12
05
20
−
=
λλπ
λ
kT
hc
hcM .
(2.3)
In Figure 7, the radiant spectral exitance is shown in green, for a blackbody object of
6000 K, approximately corresponding to the temperature of the sun. The red curve is the
solar spectrum for extra-terrestrial applications and the blue curve represents the solar
spectrum at sea level on earth.

12
Figure 7. Here, radiant exitance, measured in power per area in every wavelength interval, from the sun, measured at sea level (lower curve) and at the top of the atmosphere (middle curve) is compared to that of an ideal blackbody of 6000 K curve (upper curve). Air Mass 1.5 refers to sea level and Air Mass 0 refers to the top of the atmosphere. (Image from www.udel.edu/igert/pvcdrom/APPEND/AM15AM0.gif)
To obtain the radiant exitance, Equation (2.3) is integrated over all wavelengths from
zero to infinity and becomes Stefan-Boltzman law, where the radiated power per area,
MA
P=
∂∂
, is
4TM σ= , (2.4)
whereσ is the Stefan-Boltzmann constant.
The total power output from the sun, SP , is the surface area of the sun, multiplied with
Equation (2.4),
24 SSS RMP π×= , (2.5)
where SR is the radius of the sun. The power is distributed equally in all directions and thus
has to be divided by the surface area, 24 MSD −π , of the imaginary sphere the sun-moon
distance radius describe, to obtain the power at the surface of the moon. Hence the power
from the sun at the surface of the moon, S , is
2
=
−MS
SS
D
RMS . (2.6)
13
This is the solar constant, since the distances from the moon and the earth to the sun are
about the same. Above the earth’s atmosphere, this so-called Air Mass Zero, AM0, standard
solar constant is measured to be 1366.1 Wm-2.
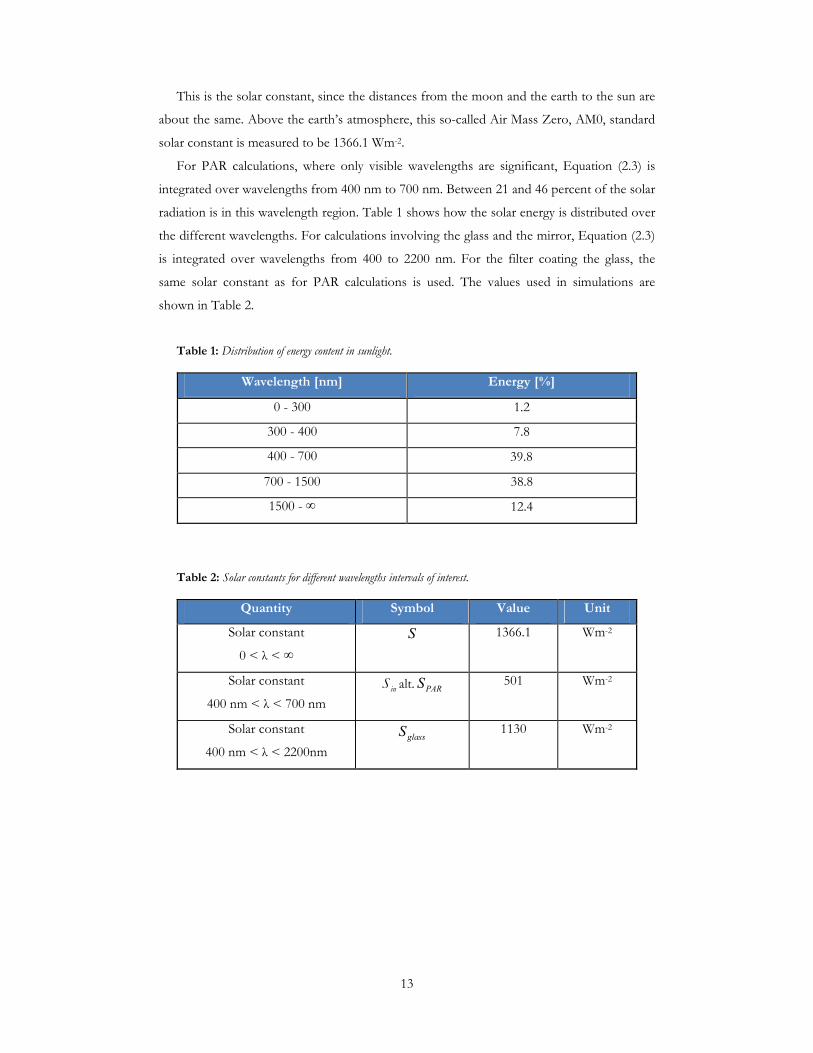
For PAR calculations, where only visible wavelengths are significant, Equation (2.3) is
integrated over wavelengths from 400 nm to 700 nm. Between 21 and 46 percent of the solar
radiation is in this wavelength region. Table 1 shows how the solar energy is distributed over
the different wavelengths. For calculations involving the glass and the mirror, Equation (2.3)
is integrated over wavelengths from 400 to 2200 nm. For the filter coating the glass, the
same solar constant as for PAR calculations is used. The values used in simulations are
shown in Table 2.
Table 1: Distribution of energy content in sunlight.
Wavelength [nm] Energy [%]
0 - 300 1.2
300 - 400 7.8
400 - 700 39.8
700 - 1500 38.8
1500 - ∞ 12.4
Table 2: Solar constants for different wavelengths intervals of interest.
Quantity Symbol Value Unit
Solar constant
0 < λ < ∞
S 1366.1 Wm-2
Solar constant
400 nm < λ < 700 nm inS alt. PARS 501 Wm-2
Solar constant
400 nm < λ < 2200nm glassS 1130 Wm-2

14

15
3 Day
3.1 The Design
Many different designs were tested and rejected before the final concept was chosen. All the
modelling was done in MATLAB. The design sketches were made in Pro ENGINEER and
Delcam PowerSHAPE-e.
The design that was chosen for the PGM is a square box with the side 15 cm in length.
The height of the box is 10 cm but this could be extended if necessary. This yields a box
volume of 2.25 liters. On top of the box is a tilted glass roof. The very top of the roof is cut
off to be horizontal and has a mirror in the shape of an elongated triangle attached to its
interior surface (Figure 8). The purpose of the mirror is twofold. In the morning and evening
days when the sunlight is incident at horizontal angle and does not provide sufficient
radiation, the mirror reflects incoming light downwards to the plants. During the days when
the sun is near zenith it offers shading to the plants, evening out the temperature curve
throughout the day and preventing the PGM from overheating.
Figure 8. The PGM general hardware design: A box with a glass roof, with a triangular mirror attached to its inside.
The box has to fit not only the plants but also the root module, the water/nutrient
delivery system, the atmosphere control system, battery, heater coils and camera equipment
for data collection. Additional room would be preferred for the potential addition of other
required systems. The plants are about 3 cm in diameter.
The module design requires it to be as close to totally insulated as possible, which should
not be a significant problem considering this is not affecting the inside growth area or
16
interfering with some other construction detail. The only restrictions would be the accessible
area surrounding the PGM, for example the rover features. The box material is aluminium,
which will require the addition of extensive insulation. Depending on where and how the
PGM is placed (on the rover or on the lunar surface), insulation is chosen to serve each
situation best, though some form of multi-layer insulation (MLI) and aerogel will certainly be
required.
The roof is tilted about 60 degrees on the two sides that face the sun. One reason for the
tilted roof is to facilitate the transition between day and night modules. This transition will be
more easily obtained with a tilted roof, than if a dome or square shaped one was used. In the
latter case more than one piece on each side need to be constructed. A dome-shaped roof
would have the convenient advantage of reducing the module’s sensitivity to orientation in
addition to construction advantages such as not having any sharp edges. The drawback with
a dome is that a lot of space and volume is consumed by edges. A square roof would have
been attractive in the aspect of eliminating edge effects (waste space) and maximizing interior
volume.
The tilted roof offers no threats to extensive transmission losses due to large incident
angles, since one side always makes up for another to let in visible light. Temperature-wise
transmission must be scaled down regardless, to control and decrease the incoming power.
The mirror mounted in the inside of the roof is angled 45 degrees with respect to the
vertical in order to direct incident horizontal sunlight straight down to the plants. The top
surface in contact with the glass has to be insulated and is assumed to be so in calculations.
Thus this area is not included in the outgoing radiation area. Since the mirror is on the inside
of the PGM and thus is in thermal contact with the PGM, this has to be taken into account.
The two ends of the interior triangular mirror that will not face the sun should not be in
contact with the two glass sides of the module. This will create an air space between the ends
of the triangular mirror and the side glass walls, allowing all the area of the sides to be
available for outgoing radiation.

17
Figure 9. PGM dimensions (millimeter). To the left is the side that will not be facing the sun and to the right the tilted part of the roof that will be facing the sun.
3.1.1 Material properties
The lunar environment is harsh not only for living things but so also for construction
materials that are exposed to aggressive temperature variation and solar radiation. Materials
that can withstand such changes are required. The construction also has to withstand large
pressure gradients, since the inside atmospheric pressure was set to be standard sea level
pressure 101.325 kPa, even though experiments (Richards et al., 2006; Paul et al., 2004; Ferl et
al., 2002) with plant growth under hypobaric conditions have shown that it is possible to
grow plants under lower pressures.
In order to optimize the conditions within the PGM, a material study was performed.
Three applications of solar energy have to be taken into account when designing the PGM;
Photosynthesis, illumination and temperature maintenance.
3.1.2 Photosynthesis
Photosynthesis causes material growth in plants. The part of the solar spectrum usable for
plants is called photosynthetically active radiation (PAR) and is traditionally defined as the
region of wavelengths between 400 and 700 nm. Sometimes a slightly broader interval of
380-750 nm is used, but this will not be used here.
Available PAR is obtained by integrating Equation (2.3) over the previously mentioned
wavelength interval and converting into the commonly used unit micromoles per square
meter and second.

18
Thus PAR level is
PAR
A
PAR Shc
N
SPAR ×≈= 6.4
λ
, (3.1)
where AN is Avogadro’s number and the wavelengthλ is set to 550 nm.
On a sunny day at the surface of the earth, PAR levels are around 2000 µmol m2 s-1. On a
heavily cloudy day, PAR levels are down to 60 µmol m2s-1. It would be ideal with a PAR level
of 800 - 900 µmol m2 s-1 for the plants in the PGM.
The duration of the light, or photoperiod, is also important for plant growth. In this case,
constant sunlight would be ideal (Bowman, 2008).
Photosynthesis increases with the intensity of light. The light compensation point determines
the minimum amount of light that is required for the photosynthetic rate to equal respiration
rate and thus to keep the plants alive. After this point, photosynthesis increases rapidly with
light intensity until a certain level, where it continues to increase but at a slower rate. This
goes on until the light saturation point is reached, where photosynthesis no longer increases,
and providing more light is more likely to cause heat damage. Different species have
different light compensation and saturation points and they also depend on other limiting
factors such as temperature, water and carbon-dioxide supply.
Plants also require selective bands in the UV, visible and near-infrared (λ < 2500 nm)
region which can initiate different responses. This is referred to as photomorphogenesis. It is
not connected to intensity beyond certain threshold values. Red and blue light are the most
important wavelength regions (Figure 10, right). Apart from photosynthesis, red and far-red
light affects, for example, seed germination and photoperiod, which is a response to
lightning changes in the environment. These changes act as signals that may trigger events,
such as flowering. Blue, UV-A and UV-B light affects petiole, (the small stalk attaching the
leaf blade to the stem (Figure 10, left), and internode lengths and phototropic reactions. The
combinations of red and blue light and the ratio of each are also important as a signaling
mechanism controlling various aspects of plant physiology.
Shorter wavelengths than UV-B can be harmful to plants and should be blocked out. As
already mentioned, on earth the atmosphere blocks this radiation from reaching the surface.
This is also the case to a large extent for UV-A radiation. About 98.7 percent of the total UV
radiation (UV-A,-B and -C) reaching the earth’s surface is UV-A.

19
Table 3: Ultraviolet light wavelength intervals.
Radiation Wavelength [nm]
UV-A 400 - 315
UV-B 315 - 280
UV-C 280 - 100
In conclusion, the important wavelengths for photosynthesis are in the somewhat
extended visible region. Therefore, a transparent material must be chosen that has excellent
overall transmission in this visible region.
As it turns out, compromises have to be made due to challenges encountered when
dealing with the temperature maintenance issue. With consistent sunlight for 14 earth days,
heating inside the PGM becomes extensive. To address this issue, incoming light needs to be
restricted in intensity and wavelength. Plants have been grown in experiments with very
restricted light intensities and intervals (Goins et al., 1997), so therefore these compromises
are considered to be acceptable.
Figure 10. Left: Plant nomenclature. The stem of a plant is one of the main structural axes of a plant (the other one is the root). Usually, the stem is divided into internodes and nodes. The nodes hold buds, which grow into, for example, leaves, while the internode is the spacing between nodes. The petioles attach the leaves to the stem.
Right: The so-called plant photosynthetic response curve. The curve shows the relative effectiveness in photosynthesis in plants over the visible spectrum. As seen here, blue (~400 nm) and red (~700 nm) light is the two most important wavelength regions for plant growth. (Images from http://flowerslove.110mb.com/index.php?l=Plant_stem and http://www.cartage.org.lb/en/themes/Sciences/BotanicalSciences/PlantHormones/Nutrition/706.GIF)

20
3.1.3 Illumination
Illumination, simply to let the radiation in the visible range in, is important for data
collection as it will be in visual form with help of cameras. There are no additional
requirements, or need for illumination, other than what are already present for the crucial
purpose of growing plants.
3.1.4 Temperature maintenance
The major challenge in the design of this module is the maintenance of an even and
acceptable temperature throughout the lunar day. Glass in general is opaque to infrared
radiation (hence the term greenhouse effect) and with no other methods for thermal transfer
but radiation cooling, temperature maintenance is an issue, especially for such a small
chamber as this.
Physical shades, filters, tinted glass and reflective coatings are some options for reducing
the incoming solar power.
3.1.5 Glass
The material properties of glass to take into consideration are transmission versus
wavelength, thermal characteristics, mechanical characteristics, chemical characteristics and
cost.
As previously mentioned, the material must be transmissive at the wavelengths of
interest. Therefore, external transmission curves for a number of potential glasses were
studied in the design process, to estimate the attenuation of light. The external transmission
is the single-pass irradiance transmittance of an optical element and can be expressed as
t
ie ettTttT µ−== 2121 , (3.2)
where t1 and t2 are the single-pass transmittance of the first and second surface respectively,
iT is the internal transmittance of the material, µ is the absorption coefficient of the material
and t is the thickness. The two different surface transmittances to take into account are in
case the surfaces have different coatings.
The thermal expansion coefficient is important, since the PGM has to undergo several
severe temperature cycles, exposing it to conditions of thermal shock. The importance of the
mechanical characteristics, such as shock and vibration resistance depends on where and
how the PGM is to be placed, but it must be able to withstand the stresses of launch and

21
landing. The ability to withstand high pressure differentials is also important, as this will be
encountered in its final deployment on the lunar surface. Scratch resistance is not of
significant importance since the duration of the experiment is fairly short and no cleaning
will take place. The only situation where scratches could be incurred would be during the
transition between the day and night modes. Chemical characteristics, such as acid or stain
resistance are not considered to be of significant importance here, even though susceptibility
to humidity may be important. The humidity problem has to be solved as well.
Cost is always a factor when determining material for a design, but it was decided not to
be taken into consideration here, since a specification of the design has to be made in order
to give an accurate price level.
Of the about fifteen basic materials to choose from (Melles Griot, 2008), eleven were
immediately ruled out due to insufficient usable transmittance ranges. The remaining four
were studied in all the above discussed aspects, although transmittance was kept highest in
priority. For the sides facing the sun, materials with restrictive even transmission intervals as
close to the visible ranges as possible were considered interesting.
The four materials were Optical-Quality Synthetic Fused Silica (OQSFS), Optical Crown
Glass, Low-expansion borosilicate glass (LEBG), and ZERODUR®. Figures 11-14 display
the transmission curves for these materials.
All materials provide transmission over 90 percent (for normal incidence) in the visible
range and are possible candidates for roof material. Further eliminations suggest that the
OQSFS might be too deep into the UV region. Optical Crown Glass is not controlled as
carefully as other optical grade glasses and is suitable for applications where tolerance levels
are fairly low. Therefore, the material study was continued with LEBG and Zerodur®. Both
materials possess high thermal stability and have low coefficients of thermal expansion. In
the end, LEBG was judged to be the best candidate for the roof of the PGM as Zerodur®
does not quite reaches a satisfactory transmission until the middle of the visible range.

22
Figure 11. Percentage external transmittance curves, in the wavelength interval 0-4500 nm, for two types of Synthetic Fused Silica Glass; Optical Quality and UV Grade, of which only the first one was of interest in the material study for the PGM roof. The external transmittance is the single-pass irradiance transmittance of the material. (Figure from CVI Melles Griot Online Catalogue)
Figure 12. Percentage external transmittance curve for Optical Crown Glass, in the wavelength interval 0-3000 nm. External transmittance is the single-pass irradiance transmittance of the material. (Figure from CVI Melles Griot Online Catalogue)

23
Figure 13. Percentage external transmittance for ZERODUR®, in the wavelength interval 200-5000 nm. The external transmittance is the single-pass irradiance transmittance of the material. (Figure from http://www.pgo-online.com/intl/katalog/curves/zerodur_tkurve.html)
Figure 14. Percentage external transmittance for Low-expansion borosilicate glass, in wavelength interval 0-3000 nm. The external transmittance is the single-pass irradiance transmittance of the material. (Figure from CVI Melles Griot Online Catalogue)
For the vertical sides of the roof that do not face the sun at any point, a material with a high
or at least modest transmission in the IR region was in demand, to be used as a radiation
cooling window. Glass is preferred, since inside visibility is important, as is maximizing the
image collecting ability from the outside, but any material could have been used.
The material that was chosen for the side glasses were Zinc Selenide, which has the
transmission properties seen in Figure 15.

24
Figure 15. Transmission properties of Zinc Selenide glass, in the wavelength interval 0-100000 nm. It is transparent to radiation between 500 nm and 20000 nm with an overall transmission coefficient of about 70 percent. (Figure from www.sciner.com/Opticsland/ZnSe)
3.1.6 Filter
Letting all the solar energy in from the transmission interval of the borosilicate glass would
still be fatal to the plants inside the PGM as the incoming power still by far exceeds the
outgoing power.
To overcome the excess power input issue, a partially reflective band-pass (400-700 nm)
filter, can be installed. This desired transmission range was defined through the results of the
modelling process.
In principle, any type of filter can be constructed to fit the requirements of the PGM
(Hedqvist, 2008). There is no way to avoid a certain amount of absorption in the glass and
filter that will add to total PGM heat content, though this effect can me mediated by other
potential heat leakages, such as the assumption of total insulation of the box and conduction.
Figure 16. A filter of this type may be used for shielding the PGM from the IR and UV radiation. This particular one, named HeatBuster UV Hot Mirror, was suggested as an alternative for the PGM roof after discussions with several optical companies. It is a band-pass filter that transmits wavelengths between 400 and 700 nm. (Figure from CVI Melles Griot Online Catalogue)

25
3.1.7 Mirror
There are four factors that need to be considered when specifying a mirror; Coating,
substrate material, flatness or surface accuracy and cosmetic surface quality. Here, the
emphasis was set on the first two factors. The mirror requirements are generally similar to
the glass roof requirements. These include reflectance and high mechanical stability. An
excellent reflectance in the visible spectrum is of primary concern. Since the glass/filter
already filters out the UV and IR radiation, characteristics in these regions have no explicit
significance.
The mirror that best fits the necessary design parameters is a protected silver coated
mirror with synthetic fused silica (SFS) as substrate material. SFS has a very low coefficient
of thermal expansion and is ideal for changing environmental conditions. Silver coatings
provide higher reflectance than aluminium in the desired spectral region, with a reflectance
of at least 95 percent (400 nm - 20 µm) (CVI Melles Griot, 2008). Furthermore, silver
coatings provide a dielectric layer effectively sealing it from the atmosphere inside the PGM.
Figure 17. The tilted glass roof of the PGM has a partly reflective filter that blocks out all the wavelengths that are not in the visible range and scales down the overall transmission coefficient to desired value.
3.2 Modelling
When designing the PGM, it is essential that viable temperature conditions are maintained to
maximize the health and survival potential of the plants. To accomplish this, there are three
main parameters that must be simultaneously adjusted. The first one is the maximum
allowable temperature inside the PGM. The second one is the minimum allowable

26
temperature. The final parameter is the photoperiod, or the time duration of ambient
sunlight.
For the first two parameters, it is necessary to consider the overall shape of the
temperature curve throughout the lunar day. These temperature fluctuations must be
controlled to insure that temperature remains within acceptable highs and lows, while at the
same time is mediated at the most constant levels possible.
Extensive experimenting with transmission coefficients and intervals were to be
undertaken. In general, it is preferred and also more efficient to reduce the transmission
coefficient than to restrict the interval of allowable wavelengths in the effort to reduce
incoming solar power. However, it is very difficult to predict how well theoretical models for
filters agree with reality. There are several factors to consider here, including how well
undesirable wavelengths are completely blocked out and exactly how much absorption that
will occur, causing additional heating. Before an actual physical filter is constructed, it is hard
to say if the filter is going to absorb or reflect the wavelengths that should be blocked out
(private communication with several optical companies, 2008). Therefore, as an extra
precautionary measure, the not sun facing sides were made flexible in the modelling. This is
not to be confused with an actual physical flexibility, but rather refers to materials being
interchangeable with their respective properties.
In case of overheating, the glass area of the sides was increased. This means replacing box
wall with glass. Consequently, in case of freezing, the glass area was decreased and more
insulation (higher box wall) was added instead.
The case of freezing is highly unlikely during the day, but a lot of different assumptions
were made in the design process, and to prepare for any scenario, the model was made
flexible in both ways. With this approach, the dimensions of the PGM can be maintained yet
it will remain flexible to deal with size budget changes as well as insufficient or faulty
assumptions in the modelling. The final design of this work was made under the assumption
that the filter and glass properties can be custom-made to perform as desired.

27
0 0.1 0.2 0.3 0.4 0.5 0.6 0.7 0.8 0.9 1
x 10-4
0
0.5
1
1.5
2
2.5
3
3.5x 10
7
Wavelength [m]
Po
wer
den
sity
[W
/m
2 /m
]
T = 298 K
T = 278 K
Figure 18. The black body curves for temperatures 25 ˚C (298 K) and 5 ˚C (278 K). Both curves peak around 10000 nm and for the 25 ˚C curve, over 70 percent of the energy is below 20000 nm, where ZnSe glass becomes opaque to radiation.
0 0.5 1 1.5 2 2.5 3 3.5 4 4.5 5
x 10-6
0
0.5
1
1.5
2
2.5
3
3.5x 10
7
Wavelength [m]
Po
wer
den
sity
[W
/m
2 /m
]
T = 298 K
T = 278 K
700 nm
Figure 19. Here are the curves that were displayed in Figure 18, shown in the wavelength region where the filter starts to get opaque to radiation, 700 nm. It is clear that almost all the radiation from inside the PGM lies outside the transmission interval.
As stated in Table 2, without reflection losses, the solar constant reduces to 1130 Wm-2 with
the transmission interval of the borosilicate glass (400 nm to 2200 nm). With a band pass
filter that blocks out all wavelengths outside the visible range (defined here as between 400

28
nm and 700 nm), the solar constant reduces to 501 Wm-2. This is defined as the incoming
solar power per area, inS , incident on the PGM at any instant.
The equilibrium temperature is reached when the incoming power balances the outgoing
power, thus, with Equation (2.4), the equilibrium temperature eqT inside the PGM is
obtained as
4
1
)()(
=
outout
ininfilterin
eqACt
ASttT
σ
αα, (3.3)
where int is the transmission coefficient function for LEBG, depending on the incident solar
horizontal angle, α , of the radiation, defined as being 0˚ at sunrise and 180˚ at sunset.
filtert is the overall transmission coefficient of the filter, inA is the projected area for
incoming radiation, also depending on α , C is the percentage of the outgoing radiation that
lies in the transmission interval of ZnSe glass (Figures 15 and 18), outt is the transmission
coefficient for ZnSe (Figure 15), i.e., the outgoing radiation and outA is the area for outgoing
radiation. The area for outgoing radiation is considered only to be the sides where the ZnSe
glass is, the not sun-facing sides. This is because when studying Figures 18 and 19, displaying
the blackbody curves for objects of temperatures in the range where the PGM should lay in,
it is clear that nearly all the radiation that will come from inside the PGM is going to be in
the IR region. The LEBG part of the roof that will face the sun is opaque to that radiation.
Some heat will leak out this way as well, but for the day models, this is considered to be
negligible.
The transmission coefficient int varies with incident angle according to Fresnel’s
equations for power reflectivity:
2
21
21
)tan(
)tan(
+−
=θθθθ
Pr , (3.4)
2
21
21
)sin(
)sin(
+−
=⊥ θθθθ
r , (3.5)
where rp is the power reflectivity of the field component parallel to the plane of incidence,
and ⊥r is the power reflectivity of the field component perpendicular to the plane of
incidence.

29
The incident angle is 1θ , and the reflected angle 2θ is obtained from Snell’s law of refraction
as
2211 sinsin θθ nn = , (3.6)
where n1 and n2 are the refractive indices of the materials (n1 = 1 for vacuum and n2 = 1.48
for LEBG).
The incident sunlight is unpolarized, so the total reflection r is
2
⊥+=
rrr
p. (3.7)
Since there are reflections both from the outer and inner glass surface, the combined
reflection coefficient rtot is
)1(2 rrrtot −= . (3.8)
Finally, the transmission coefficient int is
totin rt −= 1 . (3.9)
This yields a transmission curve for incident sunlight on the glass roof shown in Figure 20.
0 10 20 30 40 50 60 70 80 90 1000
0.1
0.2
0.3
0.4
0.5
0.6
0.7
0.8
0.9
1
Incident angle [deg]
Tra
nsm
issi
on
co
effi
cien
t
Figure 20. Transmission coefficient versus incident angle for the low-expansion borosilicate glass (LEBG) roof.

30
For solar horizontal angles 0˚ < α < 60˚, transmission losses due to large incident angles
are negligible, according to Figure 21, since 1θ < 30˚. Thus a constant transmission
coefficient t was used in temperature and PAR calculation programs.
Figure 21. The solar horizontal angles alpha, marked in blue, here 60˚ < alpha < 90˚and corresponding incident solar angles theta, marked in yellow and red respectively, for each side of the PGM glass roof. It shows that on the sun-facing side 30˚< theta < 60˚, while at the same time for the non sun-facing side 60˚ < theta < 90˚.
For solar horizontal angles 60˚< α < 90˚, the incident angle on the sun-facing side of the
roof is 30˚ < 1θ < 60˚ and simultaneously on the side facing away from the sun 90˚ > 1θ >
60˚, as can be seen in Figure 21. Here the transmission function )(αint was implemented in
the programs, weighed with the corresponding side area’s percentage of the total sunlit area
at that point (Figure 22), to achieve a correct transmission coefficient for every incident
angle.

31
Figure 22. The two sunlit areas of the PGM denoted Area 1 and Area 2. In this figure, Area 1 would be referred to as the sun-facing side.
The projected area of incoming radiation also varies throughout the lunar day, as the solar
horizontal angle increases, while the outgoing area is constant. To make all the temperature
and PAR estimations, a MATLAB program was created to simulate the lightning conditions
for the PGM. The incident solar angles were divided into intervals due to the geometry of
the PGM. This is explained below, followed by the formulas used in calculations.
It should be remembered that depending on the geographical/topographical
characteristics of the landing site, the model might very well not be valid for small horizontal
angles, since the PGM might be obscured by other objects in the surrounding environment.
However, according to the results of the following analyses, this has no further influence.
In the first interval, where 0˚ < α < 20˚, the solar rays go through the glass and strike
both the inside free air and the mirror, and is reflected downwards. Thus, the light that
reaches the plants by the latter mean has undergone both transmission and reflection losses.
In the next interval, 20˚ < α < 45˚, part of the incoming light is blocked by the side of
the mirror and part of the light is reflected downwards by it.
For incident solar angles of 45˚ < α < 60˚, incoming light is no longer reflected by the
mirror and is also partly shaded by its top.
Finally, for 60˚ < α < 90˚, the whole mirror top is blocking part of the incident light.
Due to symmetry, after the sun has passed its zenith, the lightning conditions are the
above mentioned, only mirrored.

32
Figure 23. The mirror inside the PGM shown with incident light for solar horizontal angle alpha = 0. The mirror both provides shading when the middle of the day sunlight otherwise would damage the plants, and reflects the tangential morning and evening rays downwards to the plants.
The incoming power, inP , depends on the incident solar angle, α , in the following manner:
For 0˚ < α < 20˚ the incoming power is
{ })45sin()sin( αα −°+= rlLLttSP filterinin , (3.10)
where L is the length of the side of the PGM (and thus mirror and glass roof length as well),
l is the length of sides of the isosceles triangle and r is the reflectance of the mirror.
Figure 24. Incident light at the PGM for solar horizontal angles 0˚ < alpha < 20˚.

33
For 20˚ < α < 45˚, the incoming power is
°−
−−°+=25
)20()45sin()sin(
1
ααα shadowfilterinin ArlLLttSP , (3.11)
where 1shadowA is the total projected area shaded by the side of the mirror in the current angle
interval (Figure 25).
Figure 25. Incident light at the PGM for solar horizontal angles 20˚ < alpha < 45˚.
For 45˚ < α < 60˚, the incoming power is
°−+−=
15
)45()sin(
21
αα shadowshadowfilterinin AALLttSP , (3.12)
where2shadowA is the projected area shaded by the top of the mirror in the current interval
(Figure 26). This is an approximation that was carefully tested in different sketching
programs and found to be accurate enough to apply.

34
Figure 26. Incident light at the PGM for solar horizontal angles 45˚ < alpha < 60˚.
For 60˚ < α < 90˚, the incoming power is
{ }( ) )sin()()()()( 2211 ααααα wLtAtALtSP filterinin −+= , (3.13)
where )(1 αA and )(2 αA are the functions for the percentages of the sunlit area each side
accounts for, )(1 αt and )(2 αt are the transmission functions for each side and w is the
length of the mirror top (Figure 27).

35
Figure 27. Incident light at the PGM for solar horizontal angles 60˚ < alpha < 90˚.
For 90˚ < α < 180˚, as illustrated in Figure 28, the incoming power is
)180()( αα −°= inin PP . (3.14)

36
Figure 28. After the sun has passed its zenith, the incoming power is obtained through the same expressions as for the mirrored incident solar horizontal angles.
3.2.1 Wall heights and transmission - maximum temperature
The maximum allowed inside-temperature of the PGM is 30 ˚C. This is the first constraint
when designing the PGM and the reason for making the model flexible, as mentioned
previously. Therefore, a MATLAB program that shows maximum temperatures as a function
of different wall heights was created. Since keeping the temperature high enough during
morning and evenings will be one of the challenges, an adequate way of approaching the
problem is to aim for a wall height corresponding to the upper critical temperature.
In case of no filter, filtert is equal to 1 and inS is replaced by glassS (Table 2) in
Equation (3.3). The maximum temperature curve versus wall height for this case is shown in
Figure 29.
If a filter can be constructed to only allow wavelengths in the visible range inside the
PGM, the transmission needs to be determined. In Figure 30, it reveals that the transmission
coefficient for the filter should be 70 percent. This is also the model that the following
analyses are based on.

37
0 0.01 0.02 0.03 0.04 0.05 0.06 0.07 0.08 0.09 0.1-40
-20
0
20
40
60
80
100
120
140
Height of replacement ZnSe glass for box wall [m]
Max
imum
tem
per
atur
e [d
eg C
]
Figure 29. The curve for maximal temperature inside the PGM versus wall height, in the case of no filter on the tilted glass roof. Since the box is only 0.1 m high, this is also the maximal possible height of the glass replacement, which yields a maximal temperature right below the limit, 30 ˚C.
0.40.50.60.70.80.910
10
20
30
40
50
60
Filter transmission coefficient
Max
imum
tem
per
atur
e [d
eg C
]
Figure 30. The maximal inside-temperature of the PGM is shown with respect to the filter transmission coefficient. A transmission of 70 percent yields a maximal temperature just below 30 ˚C.

38
3.2.2 Opening angle – minimum temperature and daylight time
The next step is to study the minimum temperature curve versus the daylight time, when the
transmission value is set. The minimum allowed temperature is 4 ˚C. A low temperature is
acceptable but the consequences will be a slower growing plant.
The daylight time corresponds to the opening and closing angles for the PGM. These
have been adjusted since it was discovered that the incoming power is not sufficient to
maintain viable temperature conditions for small incident angles and the now fixed
transmission. Hence, either the PGM has to be kept in night mode a little bit longer into the
lunar day and thus interfere with the photoperiod, or supportive heating has to be
considered, which is discussed further on. Figure 31 shows that in order to not freeze the
plants, it is safe to open the PGM only when the sun is at 9˚ above the lunar horizon. This
gives an opening equilibrium temperature of 5 ˚C.
0 2 4 6 8 10 12 14-25
-20
-15
-10
-5
0
5
10
15
20
Opening solar horizontal angle [deg]
Min
imum
tem
per
atur
e [d
eg C
]
Figure 31. Minimal equilibrium temperature for the PGM versus opening angle.
As the 14 earth days of lunar night already presents a severe challenge for the PGM project,
further losses in daylight time are certainly not desirable. However, if this is chosen over
adding extra heating power, the daylight time as a function of opening angle curve was
calculated and shown in Figure 32. The opening angle is the same as the closing angle. An
opening/closing angle of 9˚ would correspond to 12.6 days of daylight and 15.4 days of
darkness.

39
0 2 4 6 8 10 12 14 16 1811
11.5
12
12.5
13
13.5
14
Opening horizontal solar angle [deg]
Tim
e o
f d
aylig
ht
[ear
th d
ays]
Figure 32. Amount of daylight time for different opening angles.
3.2.3 Temperature curve
Finally, the temperature curve, as a function of time after sunrise was studied. The opening
angle is set to 9˚. The results can be seen in Figure 33.

40
0 2 4 6 8 10 12 140
5
10
15
20
25
30
Time after sunrise [earth days]
Tem
per
atur
e [d
eg C
]
Figure 33. Equilibrium temperature throughout the 14 earth days long lunar day for the PGM at the lunar equator, for 9˚ opening solar horizontal angle. The ruggedness of the curve is caused by the skips between the angle intervals that the model was divided into due to its geometry.
The temperature increases from its opening value of just above 5 ˚C and reaches an ideal
temperature of 22 ˚C after 1.3 days, or about 32 hours. This is about 15 hours after opening
the PGM. After this morning period where the PGM heats up, the temperature fluctuates
between 17 ˚C and 29 ˚C throughout the day, until the sun is starting to set and the
temperature decreases down to 5 ˚C again before closing. Ideal temperature conditions
would be 22 ˚C to 25 ˚C throughout the lunar day time period.
If the power of 1.5 W supportive heating is used in the morning and evening, the PGM
could be opened earlier, at a solar incident angle of 5˚ and thus gain 15 more hours of
insolation. Then the extra power could be switched off when the sun is elevated 9˚ over the
horizon. This is shown in Figure 34.

41
0 2 4 6 8 10 12 140
5
10
15
20
25
30
Time after sunrise [earth days]
Tem
per
atur
e [d
eg C
]
Figure 34. Equilibrium temperature for 5˚ opening solar horizontal angle with 1.5 W added in the morning and evening.
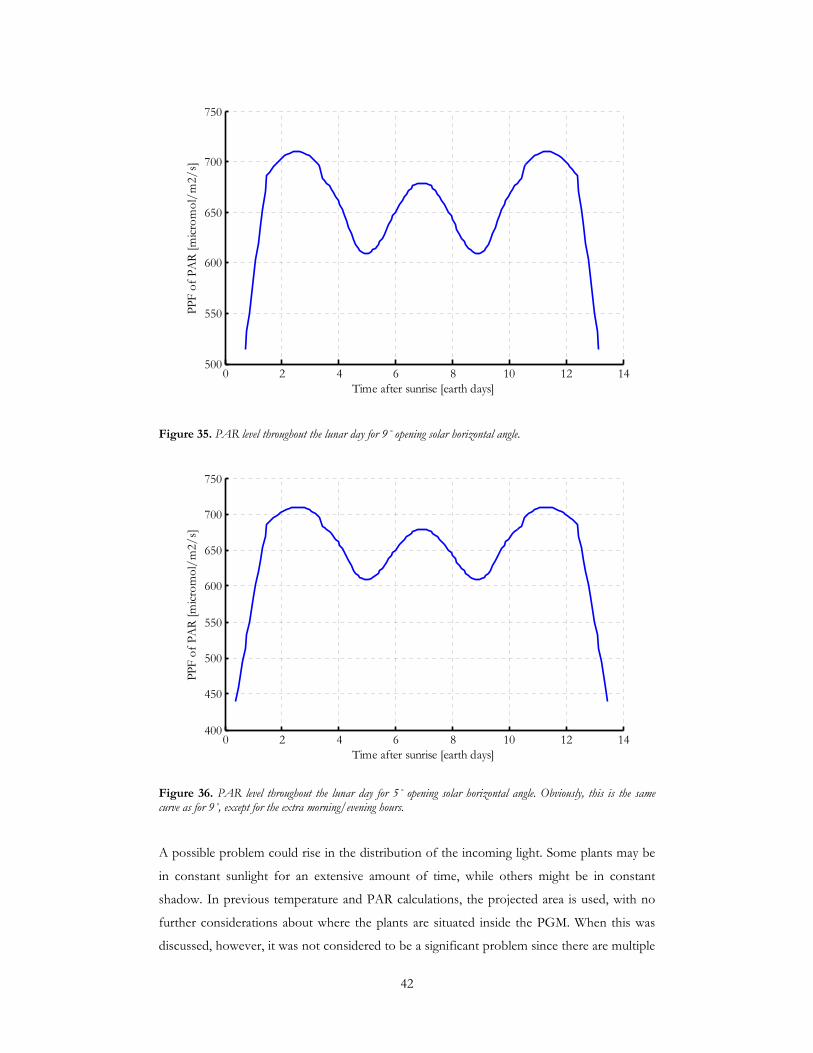
3.2.4 PAR level estimation
The photosynthetic photon flux of PAR from solar radiation is expressed as stated in
Equation (3.1). For available PAR in the PGM, Equations (3.10-3.14) are used in the same
manner as for temperature calculations, where inS is replaced by 4.6SPAR and expressions are
divided by the growth area, which is 2L . In Figures 35 and 36, the PPF of PAR is displayed
for 9˚ and 5˚ opening solar horizontal angles, respectively. The values vary between
440 µmol m2s-1 and 710 µmol m2s-1. The ideal PAR level would be around
800-900 µmolm2s-1 (Bowman, 2008). However, as mentioned before, a lot of experiments
have been performed with far less light available for the plants.
42
0 2 4 6 8 10 12 14500
550
600
650
700
750
Time after sunrise [earth days]
PP
F o
f P
AR
[m
icro
mo
l/m
2/s]
Figure 35. PAR level throughout the lunar day for 9˚ opening solar horizontal angle.
0 2 4 6 8 10 12 14400
450
500
550
600
650
700
750
Time after sunrise [earth days]
PP
F o
f P
AR
[m
icro
mo
l/m
2/s]
Figure 36. PAR level throughout the lunar day for 5˚ opening solar horizontal angle. Obviously, this is the same curve as for 9˚, except for the extra morning/evening hours.
A possible problem could rise in the distribution of the incoming light. Some plants may be
in constant sunlight for an extensive amount of time, while others might be in constant
shadow. In previous temperature and PAR calculations, the projected area is used, with no
further considerations about where the plants are situated inside the PGM. When this was
discussed, however, it was not considered to be a significant problem since there are multiple

43
ways to work around it with diffusers, mirrors and lenses to scatter and redirect the incoming
light.

44

45
4 Night
4.1 Multi-layer insulation
During the 14 day period of time when there will be no incoming heat radiation from the
sun, the PGM has to be protected with multi-layer insulation (MLI) blankets to prevent as
much heat as possible from leaking out to space. MLI blankets are thermal insulation used in
environments where heat loss is dominated by radiation, which is the case for the moon.
They consist of multiple thin sheets and reduce outgoing, “leakage” power by a factor
n+1
1, where ...2,1,0=n is the number of additional layers of insulation, according to
Figure 37.
Figure 37. Radiative power between layers. Every layer radiates from each surface, outer and inner, thus radiates half of its total power in one direction.
Power received by layer n in Figure 37 is
11
2
1
2
1−+ += nnn PPP . (4.1)
Rearranging of indices gives the power for layer n as
212 −− −= nnn PPP . (4.2)
46
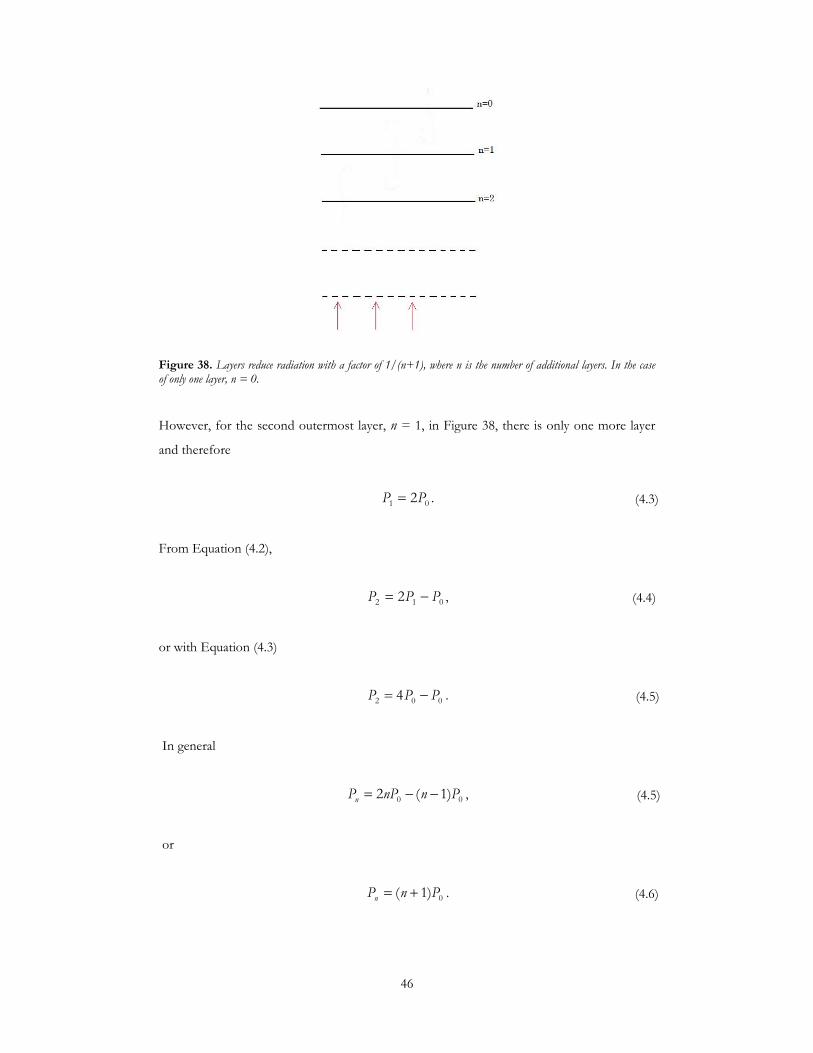
Figure 38. Layers reduce radiation with a factor of 1/(n+1), where n is the number of additional layers. In the case of only one layer, n = 0.
However, for the second outermost layer, n = 1, in Figure 38, there is only one more layer
and therefore
01 2PP = . (4.3)
From Equation (4.2),
012 2 PPP −= , (4.4)
or with Equation (4.3)
002 4 PPP −= . (4.5)
In general
00 )1(2 PnnPPn −−= , (4.5)
or
0)1( PnPn += . (4.6)

47
Thus with n additional layers, the power loss 0P is reduced to
0P
1+=
n
Pn , (4.7)
where nP is the power corresponding to the inside temperature of the PGM.
The MLI material is lightweight aluminized or silver coated plastics, such as Mylar or
Kapton. The layers are separated by a polyester mesh spacer and can be arbitrarily close, as
long as the layers are not in thermal contact. MLI blankets can be made to fit the shape of
the PGM.
Figure 39. Image of MLI – multi-layer insulation, widely used for space applications, since the only heat transfer method in space is radiation. The material is lightweight plastic, coated with aluminium or silver. The layers are separated by a “bridal veil” material, polyester mesh. (From www.rossie.com)

48
4.2 Day/Night Transition
Figure 40. The moon, here almost half of it in darkness. The lunar night is 14 earth days long, which imposes a challenge for the PGM. Another challenge is making the transition between the day and night modes of the module. (Image from http://history.nasa.gov/Vision_For_Space_Exploration.pdf)
A challenge for the PGM at the lunar equator is the transition between the day and night
modes of the module. The MLI blankets have to be able to come on and off the glass roof
smoothly and repeatedly. Also they have to be tight to prevent heat leakage. For the plants to
accomplish a full life cycle of 70 earth days, the PGM has to go through four or five
transitions between lunar day and night, depending on when/where the landing is.
There are four sides that have to be protected. The roof part where the mirror is
mounted is considered to be insulated already.
A first approach is to attach the MLI blanket to hatches on each side with hinges, pre-
programmed to open and close at certain times or controlled by either temperature or light
sensors. However, this requires undesirable moving parts depending on electronics.
Therefore, some other solutions must be considered.

49
A more passive solution, involving materials that are sensitive to outside stimuli were
discussed. There are polymer materials that are able to change shape or size based on
changing temperature or lightning conditions, often called Stimuli Sensitive Materials (SSM)
(Buschle-Diller et al., 2001). In low temperature, as would be the case for lunar night, the
SSM is a highly swollen gel, whereas above the transition temperature the gel collapses and
could thus work as a chemomechanical hinge for the hatches. Problems include finding the
right design for the hinges and finding a material with the right transition temperature. An
appropriate solvent must also be found. This is usually water, which is expelled as the gel
collapses and reabsorbed as the temperature decreases again.
4.3 Battery
Although MLI effectively reduces heat loss, the lunar night is too long for the plants to
survive without supportive heating. This could be done with heater coils, powered by a
battery. The heater coils should be placed both underneath and around the plants, to prevent
both roots and stems from freezing.
At first tiny radioisotope thermoelectric generators (RTG) were considered, as they would
not need much space and are commonly used as power sources in unmaintained facilities
such as satellites. However, they cannot be switched off and would thus cause an excess heat
input during the day. They are also point sources of heat and would not serve their purpose
very well. In addition to this, the price level for RTGs is high.
Instead, a rechargeable lithium-ion battery was considered. They are relatively lightweight
and can be manufactured into desirable design to fit efficiently into the PGM. They will also
last through many more recharging cycles than needed. A common lithium-ion battery has a
specific energy density of between 100 Whkg-1 and 158 Whkg-1 and a volumetric energy
density of between 245 Whl-1 and 430 Whl-1 (Harding Battery Handbook, 2004).
The lunar night is 14 earth days long. However, during the morning and evening days
when there is not sufficient sunlight for warming up the PGM to acceptable temperature,
additional heating might be required. There is also the possibility of not opening the PGM
until the sun is elevated a certain angle above the lunar horizon. So in any case, the lunar
night, or required battery time, is considered to be 16 earth days, or 384 hours long. If the
required power is 1 W, it follows that the battery weight has to be about 3 kg, or the volume
has to be about 1.14 l. This is to be compared with the volume of the box (the glass roof not
included) of 2.25 l. In this case the lithium-ion battery would take up about half of the
volume of the box, although the box size is not restricted and can be expanded in height.
The required weight and volume of the battery for different power needs are given in
Table 4.

50
It should be mentioned that there is research going on, with the objective to develop
batteries with even higher energy densities, so the values used in this report might be on the
pessimistic side of battery performances.
Table 4. Battery sizes and weights according to power demands. The approximate values are due to differences in battery specifications.
Required power [W] Battery weight [kg] Battery volume [l]
1 2.43 - 3.84 0.89 - 1.57
1.5 3.64 - 5.76 1.34 - 2.35
2 4.86 - 7.68 1.78 - 3.13
4.4 Solar cells
During the lunar day, the battery is recharged by solar cells. The typical charging voltage of a
lithium-ion battery is 4.2 V (Harding Battery Handbook, 2004).
Solar cells can be mounted to the sides of the PGM, and to the mirror part of the roof
(Figure 41). This assumes that the solar cells do not interfere with the MLI blanket
construction. There is also a possibility of getting power from solar cells on the rover
vehicle. Since it is desirable to be as self-sufficient as possible though, an estimation was
done of how much power can be extracted from solar cells restricted to the surface of the
PGM. The available power scP is
SAPsc η= , (4.8)
whereη is the energy conversion efficiency of the solar cells, S is the solar constant at the
moon surface and A is the area of the solar cells.
51
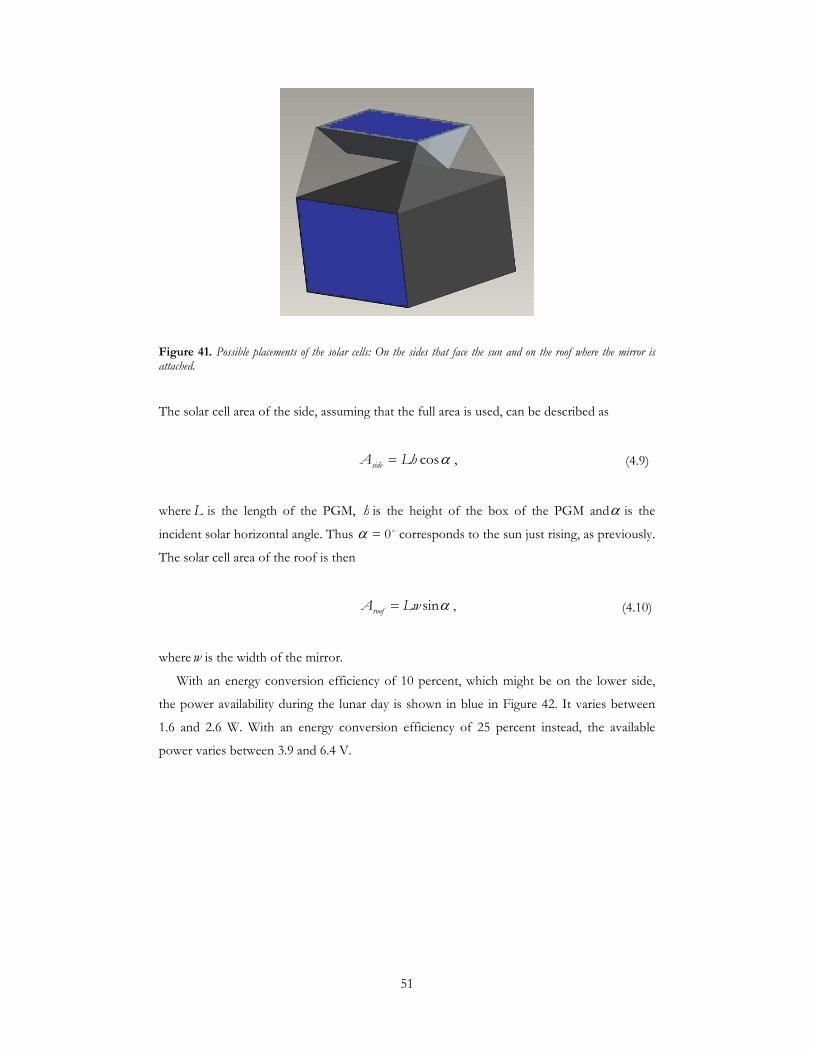
Figure 41. Possible placements of the solar cells: On the sides that face the sun and on the roof where the mirror is attached.
The solar cell area of the side, assuming that the full area is used, can be described as
αcosLhAside = , (4.9)
where L is the length of the PGM, h is the height of the box of the PGM andα is the
incident solar horizontal angle. Thus α = 0˚ corresponds to the sun just rising, as previously.
The solar cell area of the roof is then
αsinLwAroof = , (4.10)
where w is the width of the mirror.
With an energy conversion efficiency of 10 percent, which might be on the lower side,
the power availability during the lunar day is shown in blue in Figure 42. It varies between
1.6 and 2.6 W. With an energy conversion efficiency of 25 percent instead, the available
power varies between 3.9 and 6.4 V.

52
0 2 4 6 8 10 12 141.5
2
2.5
3
3.5
4
4.5
5
5.5
6
6.5
Time after sunrise [earth days]
Po
wer
[W
]
eta=0.10
eta=0.25
Figure 42. Accessible power from solar cells on the PGM, for different energy conversion efficiencies, 10 percent and 25 percent.
There have been recent advances to obtain higher efficiency in solar cells. In multijunction
solar cells, different materials with different band gaps are stacked to capture photons of a
wider range of energies. The material with the highest energy of its band gap is on top with
the other materials of lower band gap energy following. The efficiencies of these types of
solar cells can reach up to 30 percent.
An even more efficient solar cell type is multiband, which has only one layer of material
but split band gaps, so that the solar cell can use almost the whole solar spectrum. These can
reach efficiencies of up to 50 percent (Yu et al., 2003). Figure 43 illustrates the difference
between the two types of solar cells.

53
Figure 43. The difference between multijunction solar cells (left) and multiband solar cells (right) is illustrated. (From http://www.lbl.gov/Science-Articles/Archive/sb-MSD-multibandsolar-panels.html)
4.5 Modelling temperature maintenance - battery and MLI
For nighttime temperature calculations, the PGM is approximated as a system of aluminium
of mass 1 kg. The mass of the inside atmosphere and other materials is considered negligible
in the following heat calculations.
According to the basic formula of calorimetrics, the change in heat dQ is given by
cmdTdQ = , (4.11)
where c is the specific heat, in this case of aluminium, m is the mass of the system and dT is
the change in temperature.
Power is equivalent to
dt
dQP = , (4.12)
where dt is the time duration.

54
Equations (4.11) and (4.12) give temperature change as
cm
PdtdT = . (4.13)
The outgoing power outP from the PGM, without any restrictions in transmission intervals
is
4TAP outout σ= , (4.14)
whereσ is Stefan-Boltzmann’s constant, outA is the PGM area not constantly insulated, i.e.,
the roof, and T the inside temperature.
However, with MLI, the power loss lossP , is reduced to
lossP
1+=
n
Poutε , (4.15)
as already stated in Equation (4.7), though here multiplied with of the emittanceε of the
outermost layer.
Equation (4.13) is now modified for the PGM to
cm
)dtP(PdT
batteryloss −= , (4.16)
where batteryP is the additional heating power that the battery is contributing with.
To simulate the nighttime temperature conditions, a MATLAB program was created.
Two cases were considered, one with the assumption that the glass is transparent to IR
radiation and heat can radiate out freely from all the roof areas. The other one was made
with the assumptions equal to the day model assumptions, that the tilted part (LEBG) of the
glass roof is totally opaque to IR radiation and that the vertical sides with the ZnSe glass
transmit in the very interval that was stated previously. By this, it is possible to compare and
maybe get an estimation of what kind of insulation measures have to be undertaken, since it
is likely that the real scenario lies somewhere in between the two assumptions.

55
For the latter case, Equation (4.14) becomes
4TACtPZnSeoutoutout σ= , Equation (4.17)
where C is the percentage of outgoing radiation in the transmission interval, as in
Equation (3.3). This time though, it is for an object of temperature 5 ˚C, which is the
desirable nighttime temperature. Here, C is just below 70 percent.
The time step is one hour and the start temperature is set to 5 ˚C, when the sun has set,
or the PGM is closed. The battery power is chosen as an input. The results are shown in
Figures 44 and 45. Both cases require some additional heating.
In the first case, without any insulation or supportive heating, the temperature would
decrease rapidly down below -100 ˚C and finally reach an equilibrium temperature of around
-220 ˚C. This is about 50 degrees colder than the lunar equator surface, but agrees with
temperature estimations of space objects not exposed to sunlight (Tribble, 2003).
0 2 4 6 8 10 12 14-10
-5
0
5
10
Time after sunset [earth days]
Tem
per
atur
e [d
eg C
]
n=6
n=7
P = 1.6 W
Figure 44. PGM temperature at night for 1.6 W added power and 6 to 7 layers of insulation. Here, the assumption was that all the roof area transmits heat radiation freely.
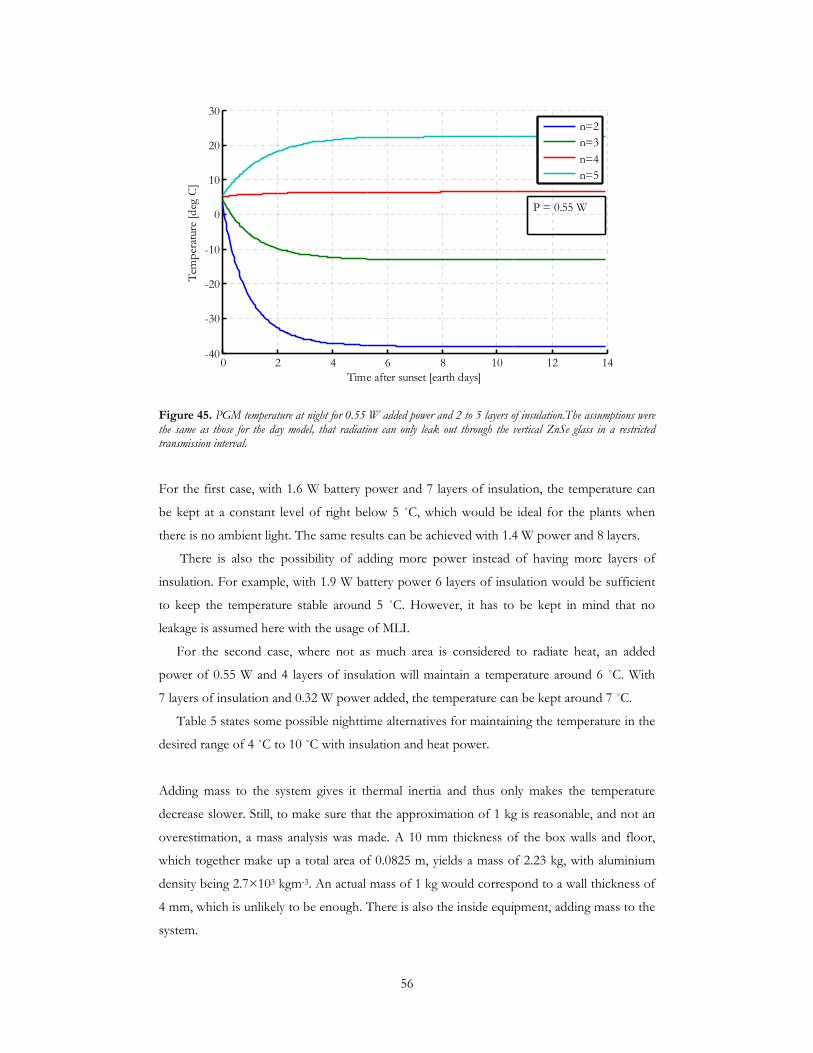
56
0 2 4 6 8 10 12 14-40
-30
-20
-10
0
10
20
30
Time after sunset [earth days]
Tem
per
atur
e [d
eg C
]
n=2
n=3
n=4
n=5
P = 0.55 W
Figure 45. PGM temperature at night for 0.55 W added power and 2 to 5 layers of insulation.The assumptions were the same as those for the day model, that radiation can only leak out through the vertical ZnSe glass in a restricted transmission interval.
For the first case, with 1.6 W battery power and 7 layers of insulation, the temperature can
be kept at a constant level of right below 5 ˚C, which would be ideal for the plants when
there is no ambient light. The same results can be achieved with 1.4 W power and 8 layers.
There is also the possibility of adding more power instead of having more layers of
insulation. For example, with 1.9 W battery power 6 layers of insulation would be sufficient
to keep the temperature stable around 5 ˚C. However, it has to be kept in mind that no
leakage is assumed here with the usage of MLI.
For the second case, where not as much area is considered to radiate heat, an added
power of 0.55 W and 4 layers of insulation will maintain a temperature around 6 ˚C. With
7 layers of insulation and 0.32 W power added, the temperature can be kept around 7 ˚C.
Table 5 states some possible nighttime alternatives for maintaining the temperature in the
desired range of 4 ˚C to 10 ˚C with insulation and heat power.
Adding mass to the system gives it thermal inertia and thus only makes the temperature
decrease slower. Still, to make sure that the approximation of 1 kg is reasonable, and not an
overestimation, a mass analysis was made. A 10 mm thickness of the box walls and floor,
which together make up a total area of 0.0825 m, yields a mass of 2.23 kg, with aluminium
density being 2.7×10³ kgm-3. An actual mass of 1 kg would correspond to a wall thickness of
4 mm, which is unlikely to be enough. There is also the inside equipment, adding mass to the
system.

57
Table 5: Possible solutions for the night module modes. Case 1 is using all the roof area as a radiator, while case 2 uses day model assumptions, and only the ZnSe glass radiates heat out to space.
Case 1 – Four sides radiate heat Case 2 – Two sides radiate heat
Added
power
[W]
Number
of layers
Resulting
temperature
[˚C]
Added
power
[W]
Number
of layers
Resulting
temperature
[˚C]
1.2 10 9 0.28 8 6.4
1.3 9 7.6 0.32 7 7.5
1.4 8 4.5 0.36 6 5.1
1.6 7 4.5 0.44 5 6.4
1.9 6 5.8
0.55 4 6.4

58

59
5 Conclusions and discussion
The purpose of this report was to perform a design concept study, to investigate the
feasibility of putting a small plant growth module on the lunar equator surface. This module
would use ambient light as an energy source. This introduces a number of complications.
From the performed analyses, it seems like an equatorial lunar plant growth module is
possible, in the sense of radiation and heat balance aspects, which are the emphasis of this
report.
It has to be remembered that all simulations were constructed out of assumptions based
on theoretical physical formulas. The model is very sensitive to even small changes in
variables such as area for incoming/outgoing radiation, solar constant fluctuation, and filter
and other material properties in general. It is also unclear how the actual physical objects
inside the PGM (growth medium, plants, atmosphere, electronic equipment etc.) could
change the results of the analyses, which were made under conditions of an empty box, after
preliminary analyses indicated no significant differences. However, for that purpose, the
model was constructed to be flexible and can be changed, as variables become established
after laboratory testing. One weak point in the chosen design concept is that the PGM is
orientation sensitive. All the simulations require that the PGM is oriented with the tilted roof
towards the sun at all times. A possible scenario to solve this issue might be a rotating plate
on the rover, controlled by a solar sensor.
A remaining challenge is to solve the transition between day and night module modes in
detail.

60

61
6 Future work
Future work should include extensive testing of all the design parameters. The glass and filter
properties have to be established and readjusted if so needed, as well as the insulation
solutions. Preferably, the full prototype could be developed and tested in an environment as
similar to lunar conditions as possible, regarding vacuum, light intensities and incident light
angles.
The inside environment, which has not been dealt with in this report needs to be tested.
The parameters that are still to be established include the number of plants that can be
supported, gaseous volume, O2 and CO2 maintenance, root modules and nutrient supply,
water and humidity management, (including condensation on the glass roof and implications
for visibility), and ethylene control (Bowman, 2008).
It is also important to consider data collection, storage and downlink transmission, i.e.,
the camera functions and integration with the rover operations.
These goals have also been outlined in the NASA Ames Research Center proposal,
entitled Astrobiology Mission Concept Study for Development of a Small Payload Plant
Growth Module to Support Human Exploration of the Moon (Bowman, 2008), which was
developed concurrently with this thesis work.
Figure 46. Future work includes PGM prototype testing, preferably in similar conditions to that of the moon. This picture shows a garden experiment, in which humidity, PAR level and temperature are measured inside and outside the PGM. Dimensions are to scale. The box is absent. (Courtesy W. Pike)

62

63
References
Bowman, R. N., 2008, private communication, regarding the biological aspects of the PGM Buschle-Diller, G., Walsh, W. K., Broughton, R., McClain, A., Lin, W., Chen, C., Hawkins, A., Whittington, A., Hudson, S., Zhang, S., 2001, Intelligent Stimuli-Sensitive Material Fibers and Fabrics, National Textile Center Annual Report: 2001 Drysdale, A. E, 2001, Life Support Trade Studies Involving Plants, SAE Technical Papers Series 2001-01-2362 Drysdale, A. E., 2001, Computer Modeling for Advanced Life Support System Analyses, Life Support Biosphere Science 4, 21 Ferl, R. J., Schuerger, A. C., Paul, A.-L., Gurley, W. B., Corey, K., Bucklin, R., 2002, Plant Adaptation to Low Atmospheric Pressures: Potential Molecular Responses, Life support and Biospheric Science 8, 93 Goins, G. D., Yorio, N. C., Sanwo, M. M, Brown, C. S., 1997, Photomorphogenesis, Photosynthesis, and Seed Yield of Wheat Plants Grown Under Red Light-Emitting Diodes (LEDs) with and without Supplemental Blue Lighting, Journal of Experimental Botany 48, 1407 Harding Energy INC., 2004, Harding Battery Handbook for Quest Rechargeable Cells and Battery Packs, Harding Energy Inc technical handbook: 01-15-04 Hedqvist, T., 2008, CVI Melles Griot, private communication, regarding optics; glass, mirrors and filters Hoehn, A., Clawson, J., Heyenga, A. G., Scovazzo, P., Sterrett, K. S., Stodieck, L. S., Todd, P. W., Kliss, M. H., 1998, Mass Transport in a Spaceflight Plant Growth Chamber, SAE transactions 107, 275 Kiss, J. Z., Kumar P., Bowman, R. N., Steele, M. K., Eodice, M. T., Correll, M. J., Edelmann, R. E., 2006, Biocompatibility Studies in Preparation for a Spaceflight Experiment on Plant Tropisms (TROPI), Advances in Space Research 39, 1154 McKAY, C. P., 2008, private communication, regarding the physical aspects of the PGM and overall project definition Melles Griot, The Practical Application of Light, Volume X NASA, 2004, The Vision for Space Exploration, NP-2004-01-334-HQ Nordling, C., Österman, J., 1999, Physics Handbook for Science and Engineering, Studentlitteratur – for all physical formulas used Paul, A.-L., Schuerger, A. C., Popp, M. P., Richards, J. T., Manak, M. S., Ferl, R. J., Wheeler, R. M., 2004, Hypobaric Biology: Arabidopsis Gene Expression at Low Atmospheric Pressure, Plant Physiology 134, 215 Richards, J. T., Corey, K. A., Paul, A.-L., Ferl, R. J., Wheeler, R. M., Schuerger, A. C., 2006, Exposure of Arabidopsis thaliana to Hypobaric Environments: Implications for Low-Pressure Bioregenerative Life Support Systems for Human Exploration Missions and Terraforming on Mars, Astrobiology 6, 851

64
Salisbury, F. B., 1994, Developmental Studies of Wheat in Microgravity, NASA TM-4711, 95 The Arabidopsis Genome Initiative, 2000, Analysis of the Genome Sequence of the Flowering Plant Arabidopsis thaliana, Nature 408, 796 Tribble, A. C., 2003, The Space Environment - Implications for Spacecraft Design, Princeton University Press Yu, K. M., Walukiewicz, W., Wu, J., Shan, W., Beeman, J. W., Scarpulla, M. A., Dubon, O. D., Becla, P., 2003, Diluted II-VI Oxide Semiconductors with Multiple Band Gaps, Physical Review Letters 91, 246403 Zukic, M., 2008, Cascade Optical Corporation, private e-mail communication regarding filters
65
Bibliography
Burke, J. D., 1985, Merits of a Lunar Polar Base Location, In: Mendell, W. W., Lunar Bases and Space Activities of the 21st Century, Lunar and Planetary Institute Houston Fricke, J., Emmerling, A., 2008, Aerogels, Journal of American Ceramic Society 75, 2027 Hastings, L. J., Hedayat, A., Brown, T. M., 2004, Analytical Modeling and Test Correlation of Variable Density Multilayer Insulation for Cryogenic Storage, NASA TM-2004-213175 Hender, M. R., 2007, Suitability of Martian Environmental Conditions for Crop Growth on Mars, Journal of Agronomy and Crop Science 193, 366 Hublitz, I., Henninger, D. L, Drake, B. G, Eckart, P., 2004, Engineering concepts for inflatable Mars surface greenhouses, Advances in Space Research 34, 1546 Kima, S.-H., Reddy, V. R., Baker, J. T., Gitz, D. C., Timlin, D. J., 2004, Quantification of Photosynthetically Active Radiation Inside Sunlit Growth Chambers, Agricultural and Forest Meteorology 126, 117 McKay, C. P., 2004, The Case for Plants on Mars, ISHS Acta Horticulturae 642, 187 Mendell, W. W., 1985, Lunar Bases and Space Activities of the 21st Century, Lunar and Planetary Institute Houston Morrow, R. C., Crabb, T. M., Lee, M. C., 2004, Evolution of Space-Based Plant Growth Systems from Research to Life Support, AIAA-2004-6022 Porterfleld, D. M., Neichitailo G. S, Mashinski A. L., Musgrave, M. E., 2003, Spaceflight Hardware for Conducting Plant Growth Experiments in Space: The Early Years 1960-2000, Advances in Space Research 31, 183 Staehle, R. L., Burke, J. D., Snyder, G. C., Dowling, R., Spudis, P. D., 1992, Lunar Base Sitings, In: Lewis, J., Matthews, M. S., Guerrieri, M. L, Resources of Near-Earth Space, The University of Arizona Press Suryanarayana, N. V., 1995, Engineering Heat Transfer, West Publishing Company TAIR-The Arabidopsis Information Resource web page: http://www.arabidopsis.org/index.jsp

66