Master's Thesis - LUTPub
124
LAPPEENRANTA UNIVERSITY OF TECHNOLOGY SCHOOL OF INDUSTRIAL ENGINEERING AND MANAGEMENT Defining Sales and Operations Planning Process in an Environmental Management Company Master’s Thesis Johannes Sippola 2015 Helsinki, Finland Supervisor: Prof. Timo Kärri Instructor: DI Kalle Saarimaa
-
Upload
khangminh22 -
Category
Documents
-
view
0 -
download
0
Transcript of Master's Thesis - LUTPub

LAPPEENRANTA UNIVERSITY OF TECHNOLOGY
SCHOOL OF INDUSTRIAL
ENGINEERING AND MANAGEMENT
Defining Sales and Operations Planning Process in an Environmental
Management Company
Master’s Thesis
Johannes Sippola
2015
Helsinki, Finland
Supervisor: Prof. Timo Kärri
Instructor: DI Kalle Saarimaa

SUMMARY
Author: Johannes Sippola
Subject: Defining Sales and Operations Planning Process in an Environmental Management
Company
Department: School of Industrial Engineering and Management, Program of Cost Management
Year: 2015 Place: Helsinki
Master’s Thesis. Lappeenranta University of Technology.
96 pages, 21 tables, 25 figures and 12 appendices
Examiner: Professor Timo Kärri
Second examiner: Professor Timo Pirttilä
Instructor: Master of Science Kalle Saarimaa
Keywords: Sales and operations planning, demand planning, supply planning, information
technology, product planning groups, information technology systems, change management, process
governance, performance measurement
Sales and operations research publications have increased significantly in the last decades. The concept
of sales and operations planning (S&OP) has gained increased recognition and has been put forward
as the area within Supply Chain Management (SCM). Development of S&OP is based on the need for
determining future actions, both for sales and operations, since off-shoring, outsourcing, complex
supply chains and extended lead times make challenges for responding to changes in the marketplace
when they occur. Order intake of the Case Company has grown rapidly during the last years. Along
with the growth, new challenges considering data management and information flow have arisen due
to increasing customer orders. To manage these challenges, Case Company has implemented S&OP
process, though initial process is in early stage and due to this, the process is not managing the
increased customer orders adequately. Thesis objective is to explore extensively the S&OP process
content of the Case Company and give further recommendations. Objectives are categorized into six
different groups, to clarify the purpose of this thesis. Qualitative research methods used are active
participant observation, qualitative interviews, enquiry, education, and a workshop.
It is notable that demand planning was felt as cumbersome, so it is typically the biggest challenge in
S&OP process. More proactive the sales forecasting can be, more expanded the time horizon of
operational planning will turn out. S&OP process is 60 percent change management, 30 percent
process development and 10 percent technology. The change management and continuous
improvement can sometimes be arduous and set as secondary. It is important that different people are
required to improve the process and the process is constantly evaluated. As well as, process governance
is substantially in a central role and it has to be managed consciously. Generally, S&OP process was
seen important and all the stakeholders were committed to the process. Particular sections were
experienced more important than others, depending on the stakeholders’ point of views.
Recommendations to objective groups are evaluated by the achievable benefit and resource
requirement. The urgent and easily implemented improvement recommendations should be executed
firstly. Next steps are to develop more coherent process structure and refine cost awareness.
Afterwards demand planning, supply planning, and reporting should be developed more profoundly.
For last, information technology system should be implemented to support the process phases.

TIIVISTELMÄ
Tekijä: Johannes Sippola
Työn nimi: Myynnin ja toiminnan suunnitteluprosessin määrittely ympäristöalan yrityksessä
Laitos: Tuotantotalouden osasto, kustannusjohtamisen koulutusohjelma
Vuosi: 2015 Paikka: Helsinki
Diplomityö. Lappeenrannan teknillinen yliopisto.
96 sivua, 21 taulukkoa, 25 kuvaa, 12 liitettä
Tarkastaja: Professori Timo Kärri
Toinen tarkastaja: Professori Timo Pirttilä
Ohjaaja: Diplomi-insinööri Kalle Saarimaa
Hakusanat: Myynnin ja toiminnan suunnittelu, kysynnän suunnittelu, tarjonnan suunnittelu,
tietotekniikkajärjestelmät, tuotesuunnitteluryhmät, muutosjohtaminen, prosessihallinto,
suorituskyvyn mittaaminen
Tutkimusjulkaisut S&OP-aiheesta ovat lisääntyneet merkittävästi viime vuosikymmeninä. Myynnin
ja toimintojen suunnittelu (S&OP) on saanut kasvavaa huomiota, ja se on osa-alue toimitusketjujen
johtamisessa. S&OP:n kehittäminen perustuu tarpeeseen määrittää myynnin ja toimintojen
tulevaisuutta, sillä ulkoistaminen, monimutkaiset toimitusketjut ja pidentyneet läpimenoajat luovat
haasteita vastata markkinoiden muutoksiin. Tässä työssä tutkittava yhtiö on kasvanut nopeasti viime
vuosina onnistuneiden liiketoimintosuunnitelmien ansiosta. Tilausten kasvusta johtuen uusia haasteita
on noussut tiedonhallinnassa ja tiedonkulussa. Tehokkaamman haasteiden hallinnan takaamiseksi
tutkittava yritys on ottanut käyttöönsä myynnin ja toimintojen suunnitteluprosessin. Prosessi on
alkuvaiheessa ja tästä johtuen se ei hallinnoi kasvaneita tilauksia riittävän tehokkaasti. Diplomityön
tarkoituksena on tutkia laajasti S&OP-prosessin sisältöä kohdeyrityksessä ja antaa tulevaisuuden
kehitysehdotuksia. Tavoitteet ovat luokiteltu kuuteen eri ryhmään. Tutkimus on laadullinen, ja
käytettävät tutkimusmenetelmät ovat aktiivinen osallistuva havainnointi, kvalitatiiviset haastattelut,
kysely, koulutukset ja työpaja.
On huomattava, että kysynnän suunnittelu koettiin haasteelliseksi kohdeyrityksessä ja se on ilmennyt
vaativaksi osa-alueeksi myös muissa S&OP-prosesseissa. Aktiivisemmalla myynnin ennustamisella
voidaan laajentaa toiminnan suunnittelun aikajännettä. S&OP-prosessista 60 prosenttia on
muutosjohtamista, 30 prosenttia prosessin kehittämistä ja 10 prosenttia teknologiaa.
Muutosjohtaminen ja jatkuva kehittäminen esiintyvät teoreettisessa kirjallisuudessa
menestystekijöinä, ja tästä johtuen niitä ei sovi asettaa toissijaisiksi tavoitteiksi. On tärkeää, että eri
sidosryhmät voivat jatkuvasti arvioida ja parantaa prosessia. Prosessijohtaminen on myös olennaisesti
keskeisessä roolissa, ja se on hallittava tehokkaasti. Yleisesti S&OP-prosessi koettiin tärkeäksi
sidosryhmissä ja kaikki sidosryhmät osoittivat sitoutuneisuutta prosessiin. Tietyt osa-alueista koettiin
tärkeämmäksi kuin muut, riippuen sidosryhmien näkemyksistä. Kehitysehdotukset ovat arvioitu
saavutettavien hyötyjen ja resurssivaatimusten perusteella. Kriittiset ja helposti implementoitavat
kehitysehdotukset tulisi ottaa käyttöön ensimmäisenä. Tulevaisuudessa tavoitteena on kehittää
prosessin rakennetta ja kustannustietoutta. Jälkeenpäin on tarkoitus kehittää tarjonnan suunnittelua ja
raportointia. Tietotekniikkajärjestelmien implementointi on myös suositeltavaa, jotta prosessin eri
vaiheita voidaan tukea, automatisoida ja optimoida tehokkaasti.

ACKNOWLEDGEMENT
I would like to thank the Case Company, for providing me this interesting topic for the thesis. Thank you
all employees, who have helped and supported me, and thank you for enabling the seamless team work.
A special thanks to Martti Sinisalo for supporting me with the thesis, especially for opening my mind
from the practical point of view. As well as, I would like to thank my instructor Kalle Saarimaa for the
guidance and interesting new thoughts throughout the thesis project. Thank you LUT for all education
during my academic journey. Thank you Timo Kärri for the support, meetings, and comments, which
have helped me to see things from the different point of view.
Thank you all my friends who have inspired me during the studies, and those who have fostered the
work-life balance with me. Thank you all interesting persons, who I met during the studies in the
university and in the exchange program, it has been a pleasure! For last but not least, I want to say special
thanks to my Family for the priceless support, what I have received during my entire life.

Table of Contents
1 INTRODUCTION ............................................................................................................................. 1
1.1 Background ................................................................................................................................ 1
1.2 Objective .................................................................................................................................... 2
1.3 Limitations.................................................................................................................................. 3
1.4 Research methods ....................................................................................................................... 3
1.5 Structure ..................................................................................................................................... 4
2 THEORETICAL REVIEW ............................................................................................................... 6
2.1 Sales and Operations Planning Overview .................................................................................. 6
2.2 Demand Inputs ......................................................................................................................... 10
2.3 Supply Inputs – Resource Planning.......................................................................................... 14
2.4 Structure of the S&OP process ................................................................................................. 16
2.5 Information technology systems .............................................................................................. 23
2.6 Performance Measurement ....................................................................................................... 29
2.7 Lessons Learned – Success Factors.......................................................................................... 34
3 DEFINING THE S&OP STRUCTURE OF THE CASE COMPANY ........................................... 42
3.1 Case Company .......................................................................................................................... 42
3.2 Product Planning Groups.......................................................................................................... 43
3.3 Demand planning ..................................................................................................................... 46
3.4 Supply planning ........................................................................................................................ 48
3.5 Structure of the S&OP process before refining ........................................................................ 49
3.6 Process structure, planning parameters, and maturity .............................................................. 49
3.7 Data, tools, and performance measuring .................................................................................. 53
4 PROCESS DEVELOPMENT AND RECOMMENDATIONS INTO THE FUTURE .................. 56
4.1 Product planning groups ........................................................................................................... 56
4.2 Demand planning ..................................................................................................................... 58
4.2 Supply planning ........................................................................................................................ 60
4.3 Structure of the process ............................................................................................................ 64
4.4 Data and tools ........................................................................................................................... 66
4.5 Performance Measurement ....................................................................................................... 68
4.6 Evaluation of the process, and as-is and to-be state ................................................................. 71

4.7 State of S&OP in environmental management companies ...................................................... 78
5 CONCLUSION................................................................................................................................ 79
6 SUMMARY ..................................................................................................................................... 89
REFERENCES........................................................................................................................................ 97
APPENDICES ...................................................................................................................................... 103

List of Tables
Table 1. Input and output chart of the structure
Table 2. S&OP process structures
Table 3. S&OP parameters
Table 4. Success factors
Table 5. Business areas of Case Company
Table 6. Forecasting at the case company
Table 7. S&OP process structure
Table 8. Case Company planning parameters before restructuring
Table 9. Maturity level of the Case Company
Table 10. Excel demand table
Table 11. Excel supply table
Table 12. Generation of production grade
Table 13. Recommendations for demand management and forecasting methods roles
Table 14. Supply planning recommendations into the future
Table 15. To-be S&OP process structure
Table 16. Recommendations of key performance indicators for the Case Company
Table 17. Classification of evaluation areas by sections
Table 18. Recommendations for demand planning
Table 19. Supply planning recommendations into the future
Table 20. Answer to research question one
Table 21. Answer to research question two

List of Figures
Figure 1. S&OP connects day-to-day operations and strategic planning
Figure 2. Key links in S&OP
Figure 3. Product structure level
Figure 4. Aggregate forecast’s and individual forecasts’ volatility
Figure 5. Aligned and nonaligned resources
Figure 6. Monthly S&OP process
Figure 7. Lapide S&OP architecture
Figure 8. Payne Reference Architecture for stage 3 S&OP
Figure 9. S&OP system alignment in supply chain planning matrix
Figure 10. KPI Scorecard sample for S&OP Process
Figure 11. Process governance
Figure 12. Loop of continuous improvement
Figure 13. Case Company’s values and mission
Figure 14. Case Company S&OP product families
Figure 15. Dependencies of subfamilies and resources
Figure 16. Mixture of treatment pipeline and product based classification
Figure 17. S&OP product family recommendation
Figure 18. Mixture of product and treatment line based planning scope
Figure 18. Supply and demand actuals and forecasts
Figure 19. Inventory planning with scenarios
Figure 20. Sales department’s section evaluation and importance
Figure 21. Production department’s section evaluation and importance
Figure 22. Business unit environmental construction evaluation and importance
Figure 23. Management’s section evaluation and importance
Figure 24. Stakeholders’ importance and performance analysis of S&OP sections
Figure 25. Prioritization matrix

Abbreviations
APS Advanced planning system
BI Business intelligence
BSC Balanced scorecard
BU Business unit
CPFR Collaborative planning, forecasting and replenishment
CPG Consumer package goods
CRM Customer relationship management
DP Demand planner
ERP Enterprise resource planning
IRR Internal rate of return
ITS Information technology system
KAM Key account manager
KPI Key performance indicator
MAD Mean absolute deviation
MAE Mean absolute error
MAPE Mean absolute percentage error
MASE Mean absolute scaled error
MES Manufacturing execution system
MPC Manufacturing planning and control
MPS Master production schedule
MRP Manufacturing and requirements planning
NPI New product introduction
NPV Net present value
PMI Purchasing management index
PTF Planning time fence
RMSE Root mean squared error
ROA Return on assets
RRP Resource requirement planning
S&OP Sales and operations planning
SCM Supply chain management
SKU Stock keeping unit
SMAPE Symmetric mean absolute percentage error
SP Supply planner
SQL Structured query language
TPM Trade promotions management

1
1 INTRODUCTION
1.1 Background
The concept of sales and operations planning (S&OP) has gained increased recognition and has been put
forward as the area within supply chain management (SCM) (Grimson & Pyke 2007, p. 329). Sheldon
(2006, p. 40) mentions that S&OP is one of the most talked process in business and it is an integrated
business management process developed in the 1980’s. Development of S&OP is based on the need for
determining future actions, both for sales and operations (Ventana Research 2006, p. 4–5). S&OP
research publications have increased significantly in the last decades (Thome et al. 2010, p. 360).
Case Company has grown rapidly during the last years, because of the successful business units and
increased order intake. Along with the growth new challenges considering data management, decision
making and information flow have arisen due to increasing customer orders. Challenges in company’s
sales department, productions, supply chain, finance and customer care have been under investigation –
different departments should be communicating to each other more effectively and instantaneously
without major or separate effort to communication. To manage these challenges Case Company has
implemented S&OP process, though initial process is at an early stage and due to this, the process is not
managing the increased customer orders adequately. In the consequence of abovementioned development
trend, company wants to conduct a comprehensive study.
Case Company is currently redefining S&OP process to gain comprehension for aforementioned
challenges as well company wants to restructure and explore the validity of S&OP’s process content.
Also suitable information technology system (ITS) is monitored and compared, hand in hand with the
process measurement aspect. This is a compelling challenge due to the special environment of the Case
Company, which has process, manufacturing and service industry features.
Challenges should be tackled before they become significant in the imminent present of cross-functional
decision making forum – S&OP process. Case Company wants to study and understand the S&OP
literature and the best practices to modify its S&OP process. Understanding the role of operation
management in S&OP process is a vital step towards a successful process.

2
1.2 Objective
Thesis objective is to explore extensively the S&OP process content of the Case Company. Objectives
are categorized to seven different groups, to clarify the purpose of this thesis. First, process related
planning groups are observed. Second, demand management’s role in the S&OP process is clarified.
Third, supply management role in the process is investigated. Fourth, process structure efficiency is
evaluated. Fifth, objective is to clarify how the entire process should be monitored. Sixth, which ITS
features the process requires. Last, Case Company’s entire S&OP process is compared to theoretical
success factors and other corresponding industries’ S&OP processes. Financial aspect of the S&OP
process is not part of the thesis, though all the controlling decisions are partly based on cost effective
solution.
First the product planning groups are investigated, are they wide enough and at the appropriate level.
The planning point of view is as well investigated. Second, the role of demand management in S&OP
process is investigated – what is the function of sales department in S&OP process. The frequency and
level of demand planning is defined. Essential point is to describe the appliance of forecasting in S&OP
process.
Third objective is to define the role of supply management in S&OP process. Clear frame conditions are
defined for the process, for example, storage capacities, external treatment capacity, balances, treatment
capacities and other affecting factors. Finnish Ministry of the Environment defines the allowances for
waste treatment for each business in the environmental protection act, which are strictly obeyed and so
it also controls S&OP process. Even though, the act is not presented in the thesis, it is a directing
boundary condition for S&OP process.
Fourth objective is to define the process structure and planning scope. The effectiveness of optimizing
the decisions across business areas and functions is investigated. What is the process maturity and what
are the next steps? The vital steps to go through entire S&OP process are presented. The tacit knowledge
is translated into knowledge of the organization, so that the right decisions can be executed without the
immediate presence of a deep talent specialist. Entire S&OP process has to be done consciously
according to formalized process structure.
Fifth step is to define how the process should be monitored – monitoring applies initial key performance
indicators (KPI) suggestion with responsible persons. Suggestion is based on the clarification work and
what functions and stakeholder feel important for the process. Sixth, objective is to describe the

3
possibilities of ITS to the Case Company. The information technology systems features relevancy for the
process is investigated.
Last, theoretical S&OP process success factors are investigated and presented. Main features of Case
Company’s S&OP process are compared to the theoretical success factors and to other environmental
management companies S&OP process. On the basis of the aforementioned objectives two research
questions were defined at general level as follows:
RQ1: What aspects are vital for S&OP process, which of these should be developed?
RQ2: What are the future recommendations for the Case Company?
1.3 Limitations
S&OP process is discussed with several terms depending on its hierarchical nature. Thesis explores
S&OP process as periodic planning process in a tactical level, also referred as executive S&OP. In this
thesis by S&OP process is meant tactical level and monthly executive S&OP process. Many research
papers divides S&OP process into three different processes: strategic, tactical and operational process,
hereinafter strategic and operational processes are delimited, though the linkages and dynamics between
S&OP process and operational and strategic framework are explored.
Thesis is not describing what should be done to gain two to four maturity levels in an organization,
instead thesis specifies how the S&OP process will gain a step forward. Sourcing is delimited from the
empirical part of the thesis due to the nature of Case Company’s business. Case Company’s business
units are
1.4 Research methods
Literature review is done from the written material of the subject. Most related theory was studied in the
begging of the thesis. The empirical part of the thesis is executed as qualitative research. Qualitative
research methods used are active participant observation, qualitative interviews, enquiry, education and
a workshop, which is held in the end of the thesis project. Different interviews were conducted for
management, sales, operation, customer service and treatment centers. Interviews were held in the
beginning of the thesis project, September and October 2014. General theory of the S&OP were educated
before the participators were interviewed, to give more holistic picture about the entire process. An

4
inquiry was sent to two environmental management companies in Scandinavia. Questionnaire was
answered by persons who are responsible for companies’ S&OP process. Enquiry answers were received
in April 2015. Workshop was facilitated by the help of a big four consultation company. Workshop
participant group was broader than interviewed group, meaning that the key stakeholders were
participating to both interviews and workshop. Workshop participators were from management,
customer service and logistics, sales, treatment, and environmental construction BU. Workshop results
will be used as ground pillars, when creating future development aspects. 14 people across different units
participated to the workshop held in April 2015.
1.5 Structure
In the table 1. Is presented the structure of the thesis by chapters’ inputs and outputs. Theoretical review
is presented in the chapter two, which begins with the presentation of key linkages and fundamentals.
Demand and supply planning theories are described as well in chapter two. Afterwards process structure
and planning parameters theory is presented. At the end of the chapter two information technology and
performance measurements in S&OP contest are demonstrated. In the last subchapter 12 theoretical
success factors are listed.
Empirical part of the thesis defines the S&OP structure before restructuring, presents the development
aspects and recommendations into the future. In the third chapter the profile of the Case Company and
the initial state of the S&OP process in the beginning of the thesis project are presented. Chapter four
describes what developing aspects were implemented during the thesis work and presents
recommendations for the future. In the beginning of the chapter four production planning group, demand
and supply planning are investigated. In the middle of the chapter structure, data, process performance
development and recommendations are presented. In the end of the chapter to-be state and state of S&OP
process in other environmental management companies are illustrated. Conclusions are presented in the
fifth chapter and the thesis is summarized in the sixth chapter.

5
Table 1. Input and output chart of the structure
Input Knowledge processing
methods
Output
Background of S&OP theory
Backgrounds of the company,
which have led to the thesis project
Chapter 1: Introduction
Knowledge development
Objects of the research
Research questions
Delimitations
Research methods, execution and
structure of the study
Research questions
Delimitations
Methods
Theory about S&OP groups
(general, demand and supply
planning, structure, ITS,
performance measurement, and
success factors)
Chapter 2: Theoretical review
Processing, refining and
structuring theoretical information
Answer to the object, what are the
success factors in theory?
Object of describing the relevant
theory related to Case Company, is
achieved
12 success factors
Refined theoretical information
Case Company’s information
Chapter 3: Defining the S&OP
structure of the Case Company
Refining, structuring and
processing the empirical
information based on the existing
theoretical information
Based on the interviews and active
participation the initial state is
defined
Description about Case Company
The initial state of the Case
Company’s S&OP process,
according to theoretical groups
The initial state of the Case
Company’s S&OP process
Theoretical information
Development of reporting systems
Research questions
Delimitations
Chapter 4: Process development
and Recommendations into the
Future
Based on the interviews, inquiry,
workshop and active participation
the desired state is defined.
Analyze of the theoretical and
empirical information
To-be state of the process
Evaluation and importance of the
defined S&OP sections’ areas by
stakeholders
State of the S&OP in other
environmental management
companies
Objective of the research
Research questions and answers to
them
Chapter 5: Conclusion
Presentation, comparison, and
analyze of the information
Developing conclusion
Research results
Prioritization matrix
Relevancy of the results
Research questions
Delimitations
Methods
Delimitations
Refined theoretical information
Research results
Relevancy of the results
Chapter 6: Summary
Summary of the information
Potential further researches
Result discussion with the theory
Significance of the results
Summary about thesis
End of the thesis

6
2 THEORETICAL REVIEW
2.1 Sales and Operations Planning Overview
Past trends in commerce, such as globalization and outsourcing, have created increasingly intricate
supply chains (Ventana Research 2006, p. 3–4). Cohen and Roussel (2004, p. 14–17) mention
outsourcing as a key strategy to coordinate complex global supply chains. The concept of Supply Chain
Management (SCM) thus emerged as a response to challenges in integrating business processes (Feng et
al. 2008, p. 200–201). Alongside with this integration, companies are gaining operational Excellence by
implementing lean production principles, different tools, process methods and information systems.
(Grimson & Pyke 2007, p. 324–326).
Singh (2010, p. 23) states that, successful companies have realized that they need a structured process
for creating realistic sales and operations plans, in order to be able to compete in complex environment
and respond to the marketplace more rapidly. The concept of sales and operations planning (S&OP) has
gained increased recognition and has been put forward as the area within SCM (Grimson & Pyke 2007,
329). Sheldon (2006, p. 40) mentions that S&OP is one of the most talked process in business and it is
an integrated business management process developed in the 1980’s. Development of S&OP is based
on the need for determining future actions, both for sales and operations. This is due to the fact that off-
shoring, outsourcing, complex supply chains and extended lead times make challenges for responding to
changes in the marketplace (Ventana Research 2006, p. 4–5).
Long-term planning is considered highly important in order to have an adequate time period to make
capacity decisions when demand is either increasing or decreasing (Jonsson and Mattsson 2009, p. 120).
S&OP is a process to develop tactical plans that provide management the ability to strategically direct
its operational businesses and to achieve competitive advantage on a continuous basis (Thome et al. 2012,
p. 360). S&OP goal is to recognize short-term local demand and supply signals and utilize them to
reconcile the long-term planning - business planning and strategic planning (Cohen and Roussel 2004,
p. 7)

7
General key linkages
Sales and operations planning is the key business planning process to control and balance customer
demand and supply capabilities. Process is organization wide and its main objectives are balancing
horizontally demand and supply together, and vertically facilitating hierarchical coordination – long-term
strategic planning, business planning, detailed scheduling and daily short-term operational planning.
(Wagner et al. 2013; APICS dictionary 2013.) How S&OP connects day-to-day operations and strategic
planning is demonstrated in figure 1. S&OP process integrates all the business plans, sales, marketing,
development, manufacturing, financial, sourcing and supply chain, into one consolidated set of plans.
S&OP is a routine on-going planning, monitoring and evaluation process that covers a specific planning
horizon, usually 1–24 months depending on the available data and business environment (APICS
dictionary 2013; Grimson and Pyke 2007; IOMA 2003; Lapide 2002; Dwyer 2000).
DISCONNECT!!!
Figure 1. S&OP connects day-to-day operations and strategic planning. (Wallance & Stahl 2008, p. 12)
In S&OP process strategic and financial plans of the business are linked to the week-to-week, day-to-
day, or shift-to-shift activities such as customer orders, order entry, master scheduling, purchasing tools,
acquiring material (Wallance & Stahl 2008, p. 20–22). Many other researches presents S&OP as a link
between strategic and detailed operational planning due its position in master scheduling in
manufacturing planning control (MPC) systems. Figure 2. illustrates the alignment of S&OP process
between horizontal and functional dimensions, S&OP process is located between strategic, functional
Strategy
S&OP
Operations
Strategic Planning
Business Planning
S&OP
Operational Planning – Master
Production Scheduling, Detailed
Planning, Execution systems
Strategic Planning
Business planning
Operational Planning – Master
Production Scheduling,
Detailed Planning, Execution
systems

8
and detailed planning. As figure 2. presents S&OP is a process that integrates cross-functionally
marketing, resource, financial, supply, sourcing, production, development, sales and demand planning
into an one consolidated plan, and which also observes the vertical alignment – it combines the
company’s strategic and business plans with the operations of each separate department. (Proud 2007, p.
199.)
Figure 2. Key links in S&OP (Vollman et al. 2005).
Vollman (2005) argues that the linkage from S&OP to the master scheduling enables the connection from
strategic to the operational planning execution. Fundamental of master production schedule (MPS) is that
it should be executed in a disaggregation form. Aggregate units, outputs of tactical S&OP, are used as
inputs when modifying more detailed MPS. In MPC systems S&OP is typically the highest planning
level, due to its holistic alignment (Olhager & Selldin 2007; Olhager et al. 2001). Palmatier & Crum
(2003, p. 130) states that soundly integrated planning and control system includes both aggregate and
detailed planning methods. On the other hand, many researches state that detail level decisions are
executed elsewhere, though in connection to S&OP. As previously mentioned the exploration is
delimited from a detail-level in the further discussion, though S&OP is not going to succeed without the
proper linkage to the detailed planning.

9
When S&OP process achieves high maturity and it is executed soundly the process gains the following
linkages (Grimson & Pyke 2007; Nakano 2009; Thome et al. 2012):
- Strategic plans into executable form of operations
- Reviews company’s performance measures for continuous improvement
- Creates cross-functional and integrated planning process
- Links strategy, business and operations
- Creates value and links company performance.
Four fundamentals of S&OP
The four fundamentals of the S&OP process are demand, supply, volume and mix. One of the most
important elements of S&OP process is to provide foreseeable predictions, if supply and demand is likely
to get imbalanced. These early warnings alert people involved that demand and supply are going to be
unsynchronized. Like with demand and supply volume and mix separately needs to be treated as two
different fundamentals. It is much easier to deal with the mix issue, if volume is managed effectively. On
the other hand, mix complication become immediately more unmanageable, if the volume is not planned
well. Lots of companies get themselves in trouble, because they are not able to distinguish the volume
problem from the mix-related issues. Volume is the big picture and mix is the details and the mission of
S&OP process is to balance supply and demand at the volume-level. (Stahl and Wallance 2008, p. 7.)
Many companies look at the volumes only once or twice per year, as they do business plan. They
concentrate on the mix issues, because the mix, individual products, is in the pressure and it is experienced
as consequential and eminent. Due to this many companies define their volumes – sales rates and
production rates – once per year, when they do the annual budged. Although, during an average year
volume tends to fluctuate more often than once per year, thus quarterly and monthly variations are
general. Focusing on the mix, predicting details, not putting enough effort to the big picture is a common
problem what today’s companies face. (Stahl and Wallance 2008, p. 8.)
S&OP is about getting the volume in place and after that the mix – focusing on manufacturing plan and
control. Volume refers to rates – over all rates of sales, rates of production, aggregate inventories and
order backlogs. Companies which have planned volume through the year have found that the challenges

10
with the mix becomes less overwhelming. Resulting less inventory, better and more rapid shipments.
(Stahl & Wallance 2008, p. 8.)
2.2 Demand Inputs
Sales Forecasting
Two fundamental inputs to S&OP are demand and supply, which is explained by the most important
mission of S&OP – balance supply and demand and keep them in balance. (Stahl & Wallance T. 2008,
p. 45) Stahl & Wallance (2008, p. 39–40) states that common forecasting issues are: who does it, at what
level it is done, and how often. It is highly important that forecasting level is defined so that it is not too
detail-specific nor too pervasive. Forecasting the entire company will not provide the eligible information
for operations. On the other hand, forecasting at detail-specific level can make the forecasting more
complex. For example forecasting at stock keeping unit (SKU) level may cause more error and require a
lot more effort. From the other point of view it is better to store master data at detail-level, which makes
it possible to retain specific demand from certain customers and utilize the data when necessary. S&OP
is generally applied to product family level rather than to SKUs, because S&OP creates plans for the next
1–24 months (IOMA, 2003; Lapide, 2002, p. 13; Dwyer, 2000, p. 31). Figure 3. describes the product
structure level of forecasting.
Figure 3. Product structure level (Wallance & Stahl 2008, p. 40)
Company
Business Unit
Product Family
Product Subfamily
Brand/Model
Package Size
Stockkeeping Unit (SKU)
SKU by Customer
SKU by Customer by Location
S&OP

11
Demand planning consist of new product requirements, bids, price changes, forecast updates, and creation of
consensus forecast. This phase is approved by the senior sales and marketing executives before it is used as
an input for supply planning. The sales and marketing is responsible of demand planning, and owns the
forecasts. (Wallance & Stahl 2006, p. 55–59.) Lapide (2002, p. 12) states that marketing intelligence typically
includes pricing, promotion, competitor actions, which affects the demand. The forecast needs to be
aggregated from the detail level.
Planning Time Fence
Planning Time Fence (PTF) is the cumulative lead time of planning an order, ordering a raw material,
shipping the material and producing it. Inside the PTF, company must forecast at the detail-level. Outside
of the PTF, company should forecast at the consolidated volume-level, not including rare circumstances.
Rare circumstances refer to a raw material, which would take longer to source than the PTF. It is not
reasonable to extend the PTF, if the lead time of few products exceeds PTF. A company should forecast
and master schedule the special individual products in a detail-level. For example, if planning time fence
is four weeks, and the lead time of a rare raw material is six months, then unique raw materials PTF is
six months, and other raw materials PTF remains at four week. This could be the case of a rare wood
material, which is grown only in particular rainforest, and so harvesting, transportation, processing and
shipment requires six months. (Stahl and Wallance 2008, p. 41.)
Independent and Dependent Demand
Dependent demand is related to components or subassemblies, which are depending on the finished
products. Dependent demand can be affected through process development, for example how many
components finished product requires (Sanders 2013, p. 23). On other hand independent demand is driven
straight from the customer to company, and it is often independent from the actions of the company
(Vollman et al. 2005, p. 18). Optimization involves proper demand management – customer demand is
more or less controllably depending on the industry, and can be optimally planned in conjunction with
supply (Lapide 2006b, p. 18).

12
Constrained and unconstrained forecasts
Stahl and Wallance (2008, p. 46) states that the unconstrained forecast produces the amount what
company could produce, if they would have unlimited capacity and future sales would not be constructed
by the lack of availability. The constrained forecast represent the expectation of sales, if production,
inventory, and other restrictions are taken into consideration. Many companies apply both to demonstrate
the possible sales with ample supply, but Stahl and Wallance highlights that constrained forecast must
be a factor in the calculations for future inventories and backlogs:
Ending inventory = Beginning Inventory - Constrained Forecast + Operations Plan (1)
Constrained forecast is used for operations planning to avoid negative inventory and revenue as well as
for generating from actual sales, not from what company can theoretically sell. On the other hand, Lapide
(2004, p. 17–19) states that unconstrained forecast should incorporate all known factors that could impact
future demand, including new product introductions and promotions, and so be used as baseline for
forecasting. Unconstrained forecast is a good motivator and it is a valuable input for flexible supply
chains. (Stahl & Wallance 2008, p. 46.)
Sell-To and Sell-Through, Judgmental and Statistical Forecasts
Sell-to and sell-through forecast plays a vital role in retail industry. Sell-to forecast is what a company
thinks it will ship to customer and sell-through forecast is what company will think that company’s
customer will sell to its customers, ideally this forecast is determined with the help of customer. Sell-
through forecast plays a big role in demand planning, but sell-to forecast is used for supply planning
process. (Stahl & Wallance 2008, p. 46–47.)
Judgmental forecasting also called qualitative or managerial forecasting are subjective adjustments based
on the experts and consumers – they are appropriate when past data is not available. Judgmental methods
are based on the personal insight, panel consensus, delphi method, questionnaires, historical life-cycle
analogy and market research. Judgmental forecasting is applied usually for mid- and long-term
forecasting. Statistical also called quantitative forecasting methods are based on the past data – they are
appropriate when past data exist. Examples of statistical forecasting methods are moving averages,
simple exponential smoothing, last period demand, simple and weighted N-Period moving averages and

13
multiplicative seasonal indexes. Statistical methods are generally used for short- or mid-term forecasting.
(Waters 2003, p. 234–235.)
Judgmental and statistical forecasting have their own strengths and weaknesses, because they bring
different information to the forecasting process. Judgmental forecasting can have biases for example
optimism and pessimism, but it is based on the latest changes in the forecasting environment (Armstrong
1998, p. 270–274). On the other hand statistical forecast are objective and consistent, always generating
the forecast from the same database, however statistical forecast is as valid as the data, which they are
based on. Judgmental and statistical forecast should be integrated to gain the maximal forecasting
accuracy. A universal practice to integrate the methods is to adjust the statistical forecast with judgmental
adjustment. Sanders & Manrodt (1994, p. 94–96) stated that nine percent of 96 U.S. corporations did not
make a single adjustment to statistical forecasts and 45 percent always made judgments to statistical
forecasts. However, judgments must be done correctly otherwise they harm the forecasting accuracy.
(Sanders & Ritzman 2001, p. 405–406.)
Top-Down, Bottom-Up, and Middle-Out Forecasting
According to compensating error theory aggregated demand, where random variations and errors tend to
cancel each other out, is less fluctuating than demand of individual components. So, generally a forecast
at the aggregate level is less fluctuating than individual components’ forecasts. Compensating error
theory is illustrated in figure 4. The concept of top-down forecasting is based on this theory, it is more
accurate to forecast first at the aggregated level and then at the disaggregate level. Although, according
to Lapide (1998, p. 28–29) top-down forecasting works only, if aggregated group is made out of
components, which have the similar patterns of variation. Bottom-up forecasting is more advantageous
when individual components have different patterns of variation. At this concept of forecasting, first the
individual components are forecasted separately and afterwards the components are integrated together
to create an aggregate group forecast. (Lapide 2006a, p. 14–15.)

14
Figure 4. Aggregate forecast’s and individual forecasts’ volatility (Lapide 2006a, p.15).
Middle-Out forecasting is an integration of both the top-down and the bottom-up forecasting, where both
concepts are used. In cross-functional S&OP process accountability and commitment towards forecasting
needs to be gained, because complex environment organizations need to aggregate, disaggregate and
even translate the forecasts to each one’s most preferable form. For example, sales looks often currencies
and supply chain looks SKUs. If an organization needs to revise a demand forecast the revision needs to
percolate up and down, using top-down, bottom-up, and middle-out forecasting methods. To do this a
formal set of relationships and a forecasting hierarchy needs to be created, in terms of best understanding.
When generating various forecasting views, various rules should be embedded to the forecasting
hierarchy. (Lapide 2006a, p. 16.)
2.3 Supply Inputs – Resource Planning
The sales forecasting is used as an input for supply planning in order to plan the volumes to be produced
for each planning period during the entire planning horizon (Jonsson & Mattsson 2009, p. 194–198).
Main objective for supply planning is to minimize operational costs, maximize customer satisfaction,
and minimize inventory. Manufacturing department is responsible for giving the capacity information
related to ability to produce the required amount in demand plan. Sourcing departments responsibility is
to answer, if the suppliers have required capacity. Logistic needs to answer, if the fleet capacity is enough
for planned deliveries. Supply department is responsible for adequate inventory is supply. Having too
much capacity has to be avoided, this will instantaneously lead to higher costs and low capacity
utilization. (Schorr 2007d, p. 8–10)

15
Supply planning must identify demand shortfalls, possibilities for capacity expansion, boundary
conditions, and supply constraints, in order to support the demand plan (Cecere et al. 2009, p. 3).
Affecting inputs such as manufacturing strategy and business strategy, overall business planning must
be reviewed in supply planning. (Schorr 2007d, p. 4–6) Initial supply plan is created through resource
planning process, which includes aforementioned inputs, demand plan and production plan. (Grimson &
Pyke 2007, p. 340).
Operations
Operations include production, supply chain, purchasing and logistic. The mission of the operations is to
evaluate and modify the operations plan so that it is executable. Operations plan or production plan agrees
the rates and volumes of production to support the demand plan and reach the inventory and order
backlog goals. In some companies estimating a plan is easier than in others for example some production
resource may align with product families and some may not. Stahl and Wallance presents two resource
modules: aligned and nonaligned. In some cases, particular departments can process certain products
and so fit in with the product families – product 1 is made in department X and product 2 is made in
department Y, resources are aligned. On the other hand, if the products do not match with the
departments, resources and product families are nonaligned, see figure 5. (Stahl & Wallance 2008, p. 47–
48.)
Figure 5. Aligned and nonaligned resources (Stahl and Wallance 2008, p. 48).
Resource Requirements Planning
Resources represent the supply side of the business. The process enables operations to relate the required
capacity (demand) to available capacity (supply). When meeting the demand and keeping the operations
plan in order – managing inventories and order backlogs in their desired level – and translating operations
plan into units and work hours of each resource, the process called resource requirement planning (RRP)
is used, also referred as rough-cut capacity planning. RRP can be used at the department level as well

16
down to individual pieces of equipment. This process can be carried out for material requirement
planning from suppliers, warehouse space planning and for operations out of production such as product
design and drafting – it operates at the mix level in conjunction with master schedule. When operations
plan is rearranged into department workloads and most often modified into hours, it should be displayed
so that the operations can identify where the challenges are. (Wallance & Stahl 2008, p. 49.)
Operating approaches
The operating approaches describe the supply and demand strategies to each product family, strategies
describe whether the given family are make-to-stock, make-to-order, or finish-to-order and what are the
desired inventory and backlog levels, as what are customer service level goals. To track the customer
service level the following measures can be applied: customer orders shipped on time, reclamation level,
line-item fill rate, and completed orders. It is important to start from rough estimates and measures, and
afterwards sharpen the process up. These approaches are important, because they keep the customers
satisfied and manage inventories and order backlogs effectively, as well they play a key role in the logic
of spreadsheets and they visualize the need of continuous improvement. (Wallance & Stahl 2008, p. 49–
53.)
2.4 Structure of the S&OP process
The structure of the S&OP process has been defined by many authors (Wallance 2006; Lapide 2002;
Jonsson & Mattsson 2009; Cecere et al. 2009; Grimson & Pyke 2007; Ivert & Jonsson 2010; Chen-Ritzo
et al. 2010). The structures differ depending on the author, what process steps they are highlighting, and
the aspect of their research. For example, Cecere et al. (2009) and Chen-Ritzo et al. (2010) present few
more steps than other authors. It is recognized that the structure of the process have improved during the
last decade. The process structure is not straightforward, it is characteristic to industry (Cecere et al.
2009, p. 2–3). The goal of S&OP process is to match supply and demand as described above, so the
structures have also lots of similarities. Different process structure steps and phases according to authors
are gathered in the table 2. In this thesis S&OP process phases are dealt into data gathering, demand
planning, supply planning consensus, and after the consensus phase.

17
Table 2. S&OP process structures (Cecere et al. 2009; Wallance 2006; Lapide 2002; Ivert & Jonsson
2010; Grimson and Pyke 2007)
Authors/
Process
Phases
Cecere et al.
(2009)
Wallance &
Stahl
(2008)
Lapide (2002) Ivert &
Jonsson
(2010)
Grimson
& Pyke
(2007)
Data
Gathering
Phase
1) Collect sales and
market input
1) Data gathering
Demand
Planning
Phase
2) Develop a demand
plan
3) Demand consensus
refinement
4) Shape demand
based on what-if
analysis on demand
for supply
2) Demand planning:
Inputs sales actuals
and statistical
Forecast from phase
1) Preparation for
the S&OP meeting
1) Consensus
forecast
1) Sales
meeting
Supply
Planning
Phase
5) Develop a
constrained plan by
supply
6) Conduct a what-if
analysis
based on supply to
determine
trade-offs on the
measurements
and identify demand
shaping
opportunities
3) Supply planning:
inputs supply actuals
from phase 1)
Management forecast
from phase 2)
1) Preparation for
the S&OP meeting
2) Preliminary
delivery Plan
3) Preliminary
production plan
2) Supply
meeting
Consensus
Phase
7) Review and gain
agreement
through a consensus
meeting
4) Pre-meeting:
inputs capacity
constrains from phase
3)
5) Executive meeting
inputs:
Recommendations
and conflict
resolution from
previous phase
Output: Decisions
and game plan
2) At the S&OP
meeting
4) Adjust delivery
plan and
production plan
5) Settle delivery
and
production plan
3) S&OP
team
meeting
After the
Consensus
Phase
8) Publish the
constrained plan
9) Measure and
communicate the
plan
3) After the S&OP
meeting
4)
Implement
and
distribute the
plan 5)
Measure
process
performance

18
Ivert & Johnson (2010, p. 661) have presented five main phases in S&OP process based on Wallace and
Stahl (2004), Grimson and Pyke (2007), and Jonsson and Mattsson (2009). In the newer edition Wallance
and Stahl (2008, p. 54–66) presents a five-step monthly S&OP process, see figure 6. The five different
phases are data gathering, demand planning, supply planning, pre-meeting, and executive meeting. The
entire elapse – from the start of the month to the end of the fifth process step executive meeting – should
take about ten to twelve working days, which locates the executive meeting to the third week of the
month. The process is mid- to long-term planning process, which forecasts the patterns and trends outside
of the PTF. The process is not about detailed planning.
Figure 6. Monthly S&OP process (Wallance & Stalh 2008, p. 54)
Lapide (2002) represents a three-step process. The planning process structure consists of the following
steps preparation for the S&OP meeting, at the S&OP meeting and after the S&OP meeting. The
preparation for the meeting covers data gathering, demand and supply phases. Cecere et al. (2009, p. 2–
3) highlights the what-if analyses on supply and demand planning phases, what-if analyses are covered
more deeply in the chapter 2.5. Addition to Wallance’s process module, Cecere (2009), Grimson and
Pyke (2007) and Lapide (2002) represents extra steps after the executive meeting – the consensus phase,
which are categorized into the after the consensus phase. The presented steps are publish the consensus
plan, measure the process performance and communicate the plan. When going through the S&OP
process steps, the main thing is that the entire process works well – not hitting the occasional time frame
(Wallance & Stahl, 2008 p. 55). Overall processes have the same ground pillars and main activities, with
exception of few specifications.

19
Data Gathering Phase
Wallance (2008, p. 55) states that data gathering phase should take place in the beginning of the month
straight after the executive meeting. Phase consist of three elements: 1. Updating data from the month
that just ended, for example actuals sales and production. 2. Gathering information for sales and
marketing, to modify and update a new forecast, could include for example statistical data, judgmental
adjustments, and sales analysis data. 3. Distributing the data from this phase to appropriate people. Data
gathering phase should be completed within two days after the end of the previous month. Cecere et al.
(2009, p. 3) mentions demand data gathering from the sales department as the first step of the process
and highlights focusing on the purchasing behavior patterns and competitive analysis.
Demand Planning Phase
The demand planning phase usually starts when marketing and sales department produces a forecast for
the coming planning period. The forecast refers to product families and extends usually to a full budget
cycle in the future. (Ivert & Johnson 2010; Cecere 2009; Wallance & Stahl 2008; Grimson & Pyke 2007)
Process input for demand phase is the output of data gathering phase, for example sales actuals and
statistics (Wallance & Stahl 2008; Cecere et al. 2010). Cecere et al. (2009, p. 3) divides the demand
planning phase into three steps. After having the input from data gathering phase it is marketing and sales
department’s duty to build an unconstrained forecast using statistical analysis and managements inputs
– quantitative forecasting methods and adjustments. After generating quantitative forecast, it should be
adjusted with all known demand impacts and exceptions (Lapide 2002, p. 12; Cecere et al. p. 3).
The output of the demand planning phase is an unconstrained demand plan, which defines how much
company is planning to sell (Schorr 2007c; Grimson and Pyke 2007; Lapide 2002). What-if-analyses,
gap analysis and scenario analysis are part of the most advanced processes, Schorr (2007c, p. 8–10) and
Cecere et al. (2009, p. 3) present these in the demand planning phase. Here unit and financial demand
plans are developed and demand shaping – product promotions, contract compliance, revenue
management, timing of product introductions – are analyzed, as well as scenarios are delivered with the
base-level forecast. Cecere et al. (2009, p. 8) states that the main demand shaping tool for chemical
industry is price management and it plans to sell excess capacity in lean times and profitably allocate
capacity in high season. Theoretical steps in demand planning phase are (Grimson & Pyke 2007; Schorr
2007c, Cecere et al. 2009, Bower 2005).

20
1. Use quantitative forecasting methods and adjust forecasts with qualitative methods
2. Create an unconstructed demand plan (what company wishes to sell and deliver)
3. Include gap analysis, what-if analysis, and scenario analysis (in advanced S&OP process)
4. Demand review meeting (demand managers validation)
5. Outcome: unconstrained demand plan
Supply Planning Phase
Cecere et al. (2010, p. 3) states that demand planning phase output is the input for supply planning phase.
Two steps in supply planning phase are presented. First, supply plan should be developed by analyzing
best alternatives for the business based on the KPIs. Key objective is to identifying the shortfalls,
constrains, and capacity opportunities for the consensus phase. Agility to operations should be developed
to minimize the effect of forecasting error. Second, demand based what-if analyses are evaluated and the
demand shaping opportunities are analyzed based on the holistic KPIs, for example profitability, revenue,
working capital, and customer service. After the evaluation and analyze the supply based what-if
analyzes are developed.
Schorr (2007d, p. 8–10) presents that, such as the demand review meeting was held in the demand
planning phase, a supply review should take place. Operations department should own the supply
planning phase and the meeting’s objective is to establish a valid supply plan. The aim is to establish a
valid supply plan based on the scenarios created previously in the process. Outputs of the supply planning
phase are high-level supply plan, as well as future capacity issues, including product development trials,
testing production, and run downs on standard manufacturing resources (Mentzer & Moon 2004;
Dougherty & Gray 2006).
Theoretical steps in supply planning phase (Grimson & Pyke 2007; Schorr 2007d; Cecere et al. 2009;
Wallance & Stahl 2008)
1. Evaluate the demand shaping scenarios (the output of demand planning phase)
2. Create what-if analysis based on supply and develop supply scenarios
3. Analyze the gaps and the best alternatives for the business point of view (use KPIs)
4. Supply review meeting
5. Output: initial supply plans, scenarios, and recommended actions to close gaps

21
Consensus Phase
Wallance & Stahl (2008, p. 60–62) includes pre-meeting to the process as the fourth step. Pre-meeting is
also referred in literature as partnership, pre-S&OP, compromise, reconciliation and preparing meeting
(Dougherty & Gray 2008, p. 28). Objectives of the pre-meeting are making decisions regarding the
balancing of demand and supply, resolving problems and differences, so that recommendations can be
made at the consensus meeting, identifying topics where agreement cannot be gained, developing
scenarios and setting agenda for executive meeting. (Grimson & Pyke 2007; Schorr 2007d; Cecere et al.
2009.) Wallance & Stahl (2008, p. 62–64) describes the consensus meeting as executive meeting where
objectives are reviewed and accepted or modified. The plan made in the pre-meeting and product family
decision are put forward. The meeting is authorizing the production rate changes, reaching the consensus
where the pre-meeting was not able to, relating the currency specified S&OP information to the business
plan, reviewing the policies and strategies to balance the supply and demand. The KPIs are reviewed in
the executive meeting, for example customer service performance, special project, and other challenges
are observed to make the required decisions. Meeting frequency varies across companies. Some authors
presents more frequent time frame for meetings than monthly (IOMA, 2005; Kruse, 2004; Lapide, 2002;
Slone, 2004). As well as, according to interview of Pyke & Grimson (2007, p. 325) companies are shifting
to more frequent meeting schedule.
Theoretical steps in consensus phase (Grimson and Pyke 2007; and Schorr 2007d; Cecere et al. 2009;
Wallance & Stahl 2008)
1. Goal is to reach the consensus between supply and demand plan, which is in conjunction with
strategy and business plan, balancing the demand and supply
2. Convert initial supply and demand plan into monetary terms and compare it against with
business plan, strategy, and performance metrics
3. Include discussion of issues, risks, capacity trade-offs and opportunities
4. Output: final top-manager game plan
After the consensus meeting
Cecere et al. (2009) and Pyke & Grimson (2007) presents that final plan should be published and
measured. For distribution, primary recipients should be sales department and operations team, so that

22
the required operation targets can be reached. In general, sales team is infrequently asked to adjust sales
plans compared to operations (Pyke & Grimson 2007, p. 660). Cecere et al. (2009, p. 3) mentions
measuring the process by business based metrics such as cash flow, forecast accuracy, expected vs. actual
profitability, revenue, inventories, and service. The variance between measures varies by industry.
Grimson and Pyke (2007, p. 660) states that measurement is vital for implementation and continuous
improvement. Although, measures vary according to product line, process and industry.
Process Planning Parameters
In the literature are many different recommendations for S&OP parameters, all vary inside one scope.
Objective of this chapter is to revise the parameters’ scale used in S&OP process. Johnsson and Matsson
(2009, p. 330–335) state that parameters can be divided into following categories: planning horizon,
planning frequency, planning objects, and time fences for change in plans, see table 3. Grimson & Pyke
(2007, p. 330–335) suggest 1-18 month for planning horizon and Schorr (2007a, p. 8–11) 18-24 months.
Jonsson & Matsson (2009, p. 334) planning horizon should be as long as it takes to acquire capacity to
answer the demand opportunities. Lapide (2004a, p. 17–19) frequency of planning should be rolling
monthly, on the other hand as stated before Grimson & Pyke (2007, p. 330) suggest more frequent
planning than monthly. S&OP planning objects are aggregated product family level and the product
families should have similar characteristics – demand behavioral and resource requirements (Sing 2009,
p. 24–27). Units of capacity depends on the business but they are measured monthly (Sing 2009, p. 24).
Jonsson & Matsson (2009, p. 370–375) states that time fences for change in production plans should be
as long as it takes to get access to things needed to execute the changed plan, as well flexibility of
operation.
Table 3. S&OP parameters
Planning horizon 1-2 years
Planning frequency Rolling Monthly
Market volatility related
Planning objects Roughly – not detailed
Aggregated product family level
Products with similar characteristics
Time fences for change in
plans
As long as planning time fence
As long as lead time of capacity change
The Flexibility of operations

23
S&OP Maturity
There are many different maturity models presented in the literature. Thomé et al. (2012) investigates
maturity models and comes up with seven different maturity models. These seven models are Wing and
Perry (2001), Ventana research (2006) Cecere et al. (2009), Grimson and Pyke (2007), Viswanathan
(2009), Feng et al. (2008) and Lapide (2005). In this thesis we present Lapide (2005), Grimson and Pyke
(2007) and Cecere et al. (2009) models, because maturity of ITS can be compared effectively within the
models.
Lapide (2005, p. 18–24) presents four-stage maturity model, see appendix 1. He focuses on three areas:
meetings, process, and technology. First stage one, is where the process is in most initial stage and the
stage four is the ideal process, where all sub-processes works seamlessly, technology support S&OP
process, and external stakeholder are participating to the process. Grimson & Pyke (2007, p. 333–340)
uses Lapide’s module as a ground pillar to their own model. In the attachment 2 is Grimson & Pyke’s
(2007) integration framework, as what they call their maturity model. In this module stage one is where
no S&OP process exists and the final stage five is a proactive model similar to Lapide’s stage four.
In the model presented by Cecere at al. (2009, p. 2–6), see attachment 3, the linkage of ITS is taken more
deeply into account. In the first stage reacting, process is driven by the sales or operations basis leading
to imbalance and the S&OP process goal is to develop an operational plan. The final stage is orchestrating
where highly developed ITS communicate seamlessly together vertically and horizontally. Here S&OP
process goal is to drive optimized demand response. For conclusion all three maturity models consider
the following areas of the S&OP process: meeting and organization, cross-functional integration level,
technology and performance metrics.
2.5 Information technology systems
It is really important to recognize that all technology must be considered together within the S&OP
process’ maturity level. Lapide (2005, p. 18) reminds that according to Cecere et al. (2009) companies
have spent 12 billion in supply chain planning activities in between the years 2003–2009. All though,
spending enormous amounts of money to S&OP software, surveyed companies are not seeing the benefits
they expected, because many did not change the process for fully leverage the enabling technology.
Afterwards they recognized that the software technology itself is not really useful. The technology
becomes useful when one starts to improve the process. Without the technology S&OP process cannot
support the scale needed to achieve its all benefits. Overall, technology becomes necessary.

24
Lapide’s (2005, p. 19) supply-demand planning architecture is presented in figure 7. S&OP system is
based on the existing IT technology, with integrations to demand planning systems and supply planning
systems, like enterprise resource planning (ERP) system, manufacturing and requirements planning
(MRP), and manufacturing execution systems (MES), as well customer resource management (CRM)
system. S&OP process needs to be integrated three types of software applications supply planning,
demand planning, and S&OP workbench applications. Payne (2011) present more modern architecture
for S&OP, see figure 8.
Figure 7. Lapide S&OP architecture

25
Figure 8. Payne Reference Architecture for stage 3 S&OP
Operational planning platform consist of demand and supply management systems, new product
introduction management (NPI), analytics, business intelligence (BI), and master data management.
S&OP platform is similar to Lapide’s architecture. In the top is layer for end-user providing
visualization. All this technology has to be built to support the S&OP metric framework. Analytic tools
are different in demand planning, supply planning, and S&OP platform level. Generally, demand
planning platforms (DP) focus on predictive modules, supply planning platform (SP) focus on optimizing
costs, inventories and capabilities. S&OP platforms are tools for collaborating, visualization, integrating
data, and simulations, like what-if scenario analysis. (Payne 2011)
Demand planning software
There are many statistical forecasting tools and a multitude of open source software. Though, it cannot
be stated that forecasting accuracy has gained during the past years among with the technology
development. Quantitative tools and other group of software is used to integrate different forecast into a
User visualization/interaction
S&OP Platform
Operational planning platform
Demand management
ERP
ERP DP SP
Supply management
ERP
NPI management
ERP
Analytics / Business intelligence / Business activity monitoring
Demand
management
ERP
Supply management
ERP
NPI management
ERP
Master data management
Integration (e.g. CRM, FB/P, PLM, Sales, Excel, and BI)
Supply chain modeling
ERP
Collaboration
ERP
Performance
ERP
Workflow / BPM
ERP
Hierarchy management
ERP
Financial reconciliation
ERP
Analytics / Business intelligence / Business activity monitoring
Demand
management
ERP
Supply management
ERP
NPI management
ERP
Local BI

26
single consolidated forecast. Tools that can assist the consolidation are ERP, CRM, SCM, and BI
systems, or combinations from these systems. (Wallance & Stahl 2008, p. 67.)
Supply planning software
Lapide (2005, p. 18–19) supply plan system components support the development of supply side inputs
to the S&OP process. For example, generating inventory and production plans to best meet the
unconstrained demand plan. There is variety of supply planning systems, like ERP and other SCM
systems, they concentrate on the operational-level, when S&OP system are concentrating on tactical and
strategic-level, so ERP and SCM systems seldom answer the need for S&OP process. ERP and SCM
produce information to advanced planning and scheduling (APS) systems. According to the Association
for Operations Management (APICS, 2007) APS is included to group SCM software and is defined as:
“any computer program that uses advanced mathematical algorithms or logic to perform optimization
or simulation on finite capacity scheduling, sourcing, capital planning, resource planning, forecasting,
demand management, and others.” In the figure 9. is presented APS software modules in supply chain
planning and S&OP environment.
Figure 9. S&OP system alignment in supply chain planning matrix (Meyr et al. 2005, p. 100)
Strategic networks design’s key objective is to optimize supply planning, inventories to utilize capital
and minimize operating costs and maximize profit. Basically the design the supply chain and describe
the material inflows between suppliers, customers and all stakeholders are defined. Master planning task
is to synchronize the flow of materials with the supply chain and coordinate procurement, production,

27
and distribution. Demand planning aim is to plan strategic sales, long-term demand estimates, and mid-
term sales plans. Other software modules are functioning at the operational level, like short-term machine
scheduling, shop floor control, transportation resource allocations, order handling, and many other tasks.
(Meyr 2005, p. 99–101.) According to Ivert and Jonson (2010, p. 662) challenges in supply side have
been data integration from the multiple sources, for example demand plan, ERP, master scheduling, and
loading integrated data into optimization tools.
S&OP applications
According to Lapide (2005 p. 20) first objective of S&OP workbench is to visualize dashboards to display
metrics from supply-side and demand-side. As well as, the possibility to provide what-if-scenario
analyzes. The second type of requirement is to measure the process itself. Final requirement is that the
S&OP workbench should be well integrated to supply and demand planning systems, so that changes in
either system will automatically reflect to the S&OP plan in the workbench. See more about the measures
from the chapter 2.6. Chermack (2011, p. 16) defines performance-based scenario planning as: “A
discipline of building a set of internally consistent and imagined futures in which decisions about the
future can be played out.”
Payne (2011, p. 3–5) describes S&OP architecture to be split into two different platforms: operational
platform and S&OP platform, see figure 8. Demand and supply planning is managed in operational
platform, when collaboration, reconciliation, performance and high-level activities are managed through
S&OP platform. Payne represents key functional and technology components what are expected from a
mature S&OP platform, as follows:
1. Collaboration support: supporting external and internal stakeholder process in a global
organization.
2. Assumption management: saving and managing the assumptions on which bases the scenarios
are planned.
3. Hierarchy management: translating baseline plan into multiple views, aggregations and middle-
out forecasting.
4. Supply chain modelling: the ability to create long-term demand and supply balancing analysis
without changing back to the operation planning systems.

28
5. Financial impact analysis: translating scenarios into finance metrics and identifying what can be
achieved through different option (for example ROI, net present value, profitability, and cash
flow).
6. Workflow management: controlling the business process of S&OP.
7. Performance management: viewing key performance indicators vertically through supporting
processes and horizontally through operational and strategic activities related to S&OP.
8. Scenario management: scenarios which include financial metrics and further on develop a
suggestion to managers. As well as, ability to modify, control and manage the scenarios in
different parts and levels of a multi stakeholder organization.
9. Integrations: connecting operations, finance and execution planning capabilities.
Master data
Wallance and Stahl (2008, p. 103–105) state that S&OP process requires master data, which includes
descriptive data about product families, resources, subfamilies, for example from the product side: target
customer service levels, target inventory and backlog numbers, dollar numbers from financial plan, data
needed to unit-to-dollar conversation and from the resource side, output capacities, conversation factors
and RRP validation data to the mix assumptions. As well as, actual data from sales, production, inventory
levels, customer order booked, prior period’s forecasts and production plans, customer service level from
prior period. Data sources are ERP, CRM, demand planning systems, APS, legacy systems and others,
like mentioned before. The main point is to automate the feed into the spreadsheets or S&OP system.
Benefits and disadvantages of APS
Invert and Jonsson (2010, p. 668–672) have studied the benefits using the APS systems in S&OP process.
The results from the study are presented in the attachment 4. Results of the literature view were
investigating 18 potential benefits in the field of decision support (1–10), planning efficiency (11–14),
and learning effects (14–18). The study was conducted in demand planning, supply planning and central
planning organization involved to S&OP process. In general, decision support scored high, planning
efficiency not as high than decision support. Learning effect scored the lowest compared to other two
field. From decision support field visualization aspects and information access scored the highest. Survey
result was that time spend on planning does not decrease after implementing APS, rather workload might

29
increase. Smith (2008, p. 10–12) presented survey of dissatisfaction with the S&OP technology, where
most people answered that it is difficult to do what-if analysis (33 %), supporting applications are not
integrated with one another (31 %), and S&OP application is too complex to implement and maintain
(18 %). See the other dissatisfaction areas from appendix 4.
2.6 Performance Measurement
Measurement
Melnyk et al. (2004, p. 211) metrics communicate the internal and external performance of all
stakeholders and staff, as well measurements educate and identifies the improvement gaps. Measurement
of S&OP process is the factor, which allows the success in continuous improvement (Lapide 2004, p.
19). Vollman et al. (2005, p. 130) state that without performance monitoring the value of S&OP process
becomes certainly questionable.
Scorecards can be utilized in the S&OP, for example Kaplan and Norton (1996) present balanced
scorecard, which is more of a strategic measuring tool but it considers the operational and tactical aspects
as well, see attachment 5. When scorecards are used in S&OP process, they should focus more on
operational than strategic challenges. Key performance indicators tend to be financial at the strategic
level and closer the unit when it is at the operational level (Hope & Fraser 2003, p. 109–111). S&OP
scorecards are usually used in the actual meeting rather than manage strategic plans of a company.
Companies should include a separate scorecard for measuring the strategic performance in the S&OP
process (Bower 2005; Ventana Research 2006).
Measuring demand accuracy is one of the most popular measurement in S&OP processes (Lapide 2004;
Bower 2006; Sheldon 2006), because improvement forecast accuracy plays a vital role in seamless supply
and operations planning. Reduced forecasting error affects stock-out, inventory costs, customer service,
shipments, financial planning and capacity utilization improvements (Bower 2006, p. 22). Sheldon (2006,
p. 125) recommends using operational, business, and demand planning accuracy. The importance of
planning accuracy in S&OP is well illustrated by Vollman et al. (2005, p. 394–395): As a prerequisite to
control, the sales and operations planning process should be widely understood in the firm. The planning
process must be transparent, with clear communication of expectations, to control actual results.

30
Performance against the sales and operations plans should also be widely disseminated. When actual
results differ from plans, the source of these deviations must be analyzed and communicated.
Singh (2010, p. 26) states that sales department is measured usually by new customers and revenue, and
supply departments are measured on fulfilment and costs. See appendix. 5. where the common KPI’s
presented in literature are listed. Sheldon (2006, p. 127–128) presents that demand plan is usually
measured by accuracy in product family level. Muzumdar & Fontanella (2006, p. 36) states that demand
should be measured with customer profitability, volume growth, gross margin and order fill rates.
Whisenant (2006, p. 17–19) presents revenue forecast accuracy for demand-side metric. According to
Lapide (2005, p. 19) usual demand-side metrics are expected unfulfilled customer demand and customer
order backlogs. Other metrics for the sales department include market share, sales growth, forecast
accuracy and variance to baseline forecast (IOMA, 2005; Wing and Perry 2001; Sheldon 2006). Lapide
(2005, p. 20) forecast measures should include measures such as variance to baseline forecasts and
budgets as well the adherence to preliminary sales and operations plan.
Supply plan is usually measured with return on assets (ROA), profitability, revenue and working capital
(Cecere et al. 2007, p. 3). Whisenant (2006, p. 17–19) presents supply-side metrics inventory and supply
chain costs. Lapide (2005, p. 19) include supply-side metrics usually consist of expected plant utilizations,
production capacity shortages, and critical component shortages/surpluses. Business plan with accuracy of
monthly profit plan. Commonly used metrics for operations plan are for example line fill, obsolete
inventory, inventory on hand, expediting frequency, stock-outs, variance to standard costs, quality and
capacity utilization (IOMA 2005; IOMA 2004b; Wing and Perry 2001; Sheldon 2006).
Customer service with percent of complete orders on the initially agreed time frame. Cecere et al. (2010,
p. 4) Basic finance metrics include market share, sales, stock price, revenue, profit, earning per share and
inventory return. Basic cash flow metrics used in S&OP process are internal rate of return (IRR), return
on investment (ROI), cash-to-cash cycle, gross margin and net present value (NPV). It is important to
start from roughly estimates and measures, and afterwards sharpen the process up. (IOMA 2005; Wing
and Perry 2001; Sheldon 2006; Whisenant 2006).
The common problem with the S&OP scorecard is the lack of ownership and responsibility to the metrics.
The KPIs should be measuring everyone who is participating in the S&OP process. (Grimson & Pyke
2007, p. 337.) Milken (2008, p. 7–9) presents S&OP scorecard example, which measures five categories:

31
financials, demand production, inventory, and logistic, see figure 10. Palmatier & Crum (2003, p. 144–
145) states that S&OP measurement should link to finance and shareholders, employees and productivity,
technology, innovation, product development, and internal improvement. These are the same aspects,
which are in the balance scorecard BSC: finance, internal process, learning and growth, customer
perspective. Strategic measures should be included in the separate scorecard as aforementioned.
Figure 10. KPI Scorecard sample for S&OP Process (Milliken, 2008)
Metric formulas
In this section most common accuracy and variance metrics are presented. These were felt important
according to the Case Company’s business, and like aforementioned, demand planning metrics plays a
significant role (Lapide 2004; Bower 2006; Sheldon 2006). According to Hyndman (2006, p. 43) there
are four types of forecast-error metrics, which are scale depending, relative-error, percentage-error and
scale-free metrics. In scale-dependent errors the forecast error is presented in the formula (2) Et = Yt – Ft
, where Yt is actual value and Ft forecasted value. It is on the same scale and can be applied to anything,
for example from ships to screws. However, measures cannot be used to comparison between series that
are on different scales. (Hyndman 2006, p. 44) Two most common scale-dependent measures are based
on the absolute errors formulas (2), (3) and (4), and squared error formula (5):

32
Scale-dependent error (Et) Et = Yt – Ft (2)
Mean absolute error (MAE)
(3)
Mean absolute deviation (MAD)
(4)
Root mean squared error (RMSE)
(5)
N is the number of data values on the sets. The use of absolute values or squared values prevents negative
and positive errors from offsetting each other (Hyndman 2006, p. 44). Scale dependent measures are
popular because they are easily interpreted and computed, especially MAD. (Online Open access text
books 2015)
Accoring to Hyndman (2006, p. 45) relative-error metric is scale independent. See formula (6) where Et
is the forecast-error obtained from benchmark method, usually naive method is used where Yt is equal to
the last observation – it uses the actual value from the prior period as the forecast Ft = Yt−1. The
percentage error metrics is the formula (7). Percentage errors and relative-error are scale-independent,
which is their advantage, and so they are frequently used to compare forecast between different data
series. Though, percentage errors and relative-errors have disadvantage, when there are zero values or
values close to zero in a series, which is frequent for intermittent data. In this case measurement is
undefined or infinite. The most commonly used measure is mean absolute percentage error (MAPE),
formula (8).
Relative-error metric (Rt) Rt = Et / Yt (6)
Percentage error metrics (Pi) Pi = 100Et / Yt (7)
Mean absolute percentage error (MAPE)
(8)
The MAPE puts a heavier penalty on positive errors than on negative errors (Hyndman 2006, p. 45). Due
to this observation the usage of the symmetric mean absolute percentage error (SMAPE) was proposed

33
by Armstrong (1985, p. 270) the further version of SMAPE was introduced by Makridakis (1993, p. 528)
with absolute value corrections to denominator, see formula (9). Here At represents the actual value.
Symmetric mean absolute percentage error
(SMAPE)
(9)
In this paragraph scale-free errors methods are presented. The mean absolute scaled error (MASE)
formula (10) was introduced by Hyndman and Koehler (2006, p. 682–684) and it can be used to compare
a single series and multiple series forecasting accuracy. Hyndman (2006, p. 46) states that it is the best
accuracy metric for intermittent-demand studies, because it never gives infinite or undefined values.
Except in the case where all historical data is equal (Hyndman and Koehler 2006, p. 682). Here et = Yt −
Ft and the denominator is the average forecast error of the one-step (naive method), which uses the actual
value from the prior period as the forecast: Ft = Yt − 1.
Mean absolute scaled error (MASE)
(10)
Hoover (2009, p. 21–22) states the importance of weighed metrics, when forecaster wants better results
for more relevant series. The accuracy metric reflects the items relevancy through assigned weight. For
example, customers which produce different revenue, can be weighed according to revenue percentage.
Other factors which can be considered as weighting factors are inventory holding costs, return on invested
assets, expected sales levels, contribution margin, customer-relationship metrics, expected service level,
and inventory.
Statistical dispersion points out the distribution in a statistical data. Statistical dispersion is measured
with positive real number. Number is zero when there is no diversification in the data, and it increases
when the data becomes more diverse. The measure of dispersion is as the same unit that quantity being
measured, if the data quantity is tons then the dispersion measure is as well in tons. One measure of
dispersion is, for example, sample standard deviation. (McQuarrie 2000, p. 25.)
Variance (11)

34
Standard deviation (12)
If the X takes random values from the data and the data is finite, then standard deviation for X is the
following:
(13)
2.7 Lessons Learned – Success Factors
Boyer (2009, p. 4–10) presents 10 proven steps to successful S&OP process, which are distinct into two
phases – designing and process.. Charantan and Sandeep (2013, p. 11) investigates eight building
elements of enterprise performance, which are results from constantly scanning the developing market
place. Their research is based on the experience in customer packaged goods (CPG), retail,
pharmaceutical and high-tech industries. Charantan and Sandeep believe these elements help mitigate
the adverse impact of general S&OP challenges and achieve superior performance improvements. Smith
et al. (2012 p. 12) studies integrated business planning, where S&OP and collaborative planning,
forecasting and replenishment (CPFR) where linked together. They explore 16 companies presenting
leading-edge collaborative practice. Same success factors apply as well individually to both S&OP and
CPFR process development. Dougherty and Gray (2006, p. 167–297) studies 13 companies from across
the globe and puts together key lessons to be learned. In the table 4. most common success factors are
presented from aforementioned research papers.

35
Table 4. Success factors (Boyer 2009; Lapide 2014; Dougherty & Gray 2006; Smith et al. 2010;
Charantan & Sandeep 2013)
12 common success factor Boyer
(2009)
Lapide
(2014)
Smith et
al. (2010)
Dougherty
& Gray
(2006)
Charantan
& Sandeep
(2013)
Inter-organizational and cross-
functional teams
x x x x x
Change Management x x x x x
Process governance x x x x x
Information – Accurate, metrics and
usability
x x x x
Analytics, Linkage to ERP and IT x x x x
Continuous Improvement x x x x
Effort in Designing x x x
Commitment x x x
Time-horizon x x
Segmentation x
Inter-organizational and cross-functional teams
A design team will take care of all the process workings. The team is suggested to be a group of six
people, which include roughly top management leader, a person from IT, demand planner, operation
planner, a person from accounting, a person from sales. (Boyer 2009, p. 6.) As well as, according to
Smith et al. (2012, p. 12) 81 percent of the case companies experienced inter-organizational and cross-
functional teams are a way to successfully launch the S&OP process. Functions’ participation and
enthusiasm must be guaranteed, particularly during the times of personnel, product, organizational, or
other significant changes (Dougherty & Gray 2006, p. 50). The S&OP process must have cross-functional
participation, including all involving departments (Lapide 2014, p. 15). Aligned sub-processes cannot be
under estimated, and the linkages of S&OP process and other enterprise-wide processes must be mapped.
For example new product introduction (NPI) and trade promotions management (TPM) should be linked
effectively into S&OP process with operational and strategic dimensions. (Charantan & Sandeep 2013,
p. 12.)

36
Change management – educate everyone involved
Charantan & Sandeep (2013, p. 16–17) states that S&OP process is 60 percent change management, 30
percent process development and 10 percent technology. Senior executives often end up with a fallacy
of change management, after they discover that S&OP is more getting right kind of information in exact
time rather than a practice of change management. Effective organizational change management
implementation requires recognizing the changes in wide business environment and creating vital
adjustments for company’s needs. As well as, educating employees to the changes and achieve
employees assent to appropriate amendments. Change management leads to renewed processes by taking
small and tangible steps in the organization. Smith et al. (2012, p. 12) stated that 56 percent of 16
companies experienced change management as a vital requirement for successful S&OP process.
Educating everyone involved does not mean that top tittle persons have a good S&OP knowledge, so
everyone who affects the S&OP output should be educated. This is typically 10 percent of the company
population. (Boyer 2009, p. 6) Also, Dougherty and Gray (2006, p. 51) states that education plays a
critical role in S&OP structuring. People are the most important resource in the organization, so it is
necessary to educate them. Education should be done in multiple levels of the organization to ensure a
common understanding of principles, objectives, terminology and required resources, tasks and
activities. Educate the users, all people who are affected by the S&OP should understand the S&OP
document and have the awareness of how their decision process interdependences with S&OP process
output. (Boyer 2009, p. 9.)
Process Governance - Documentation
According to Charantan and Sandeep (2013, p. 13–14) successfully developed S&OP process cannot be
long-lasting without proper process governance, which begins with planning, defining who will do what,
when, where, how and why. It is important that different minds are required to improve the process and
that the process is constantly evaluated. See figure 11. describing governance process, which includes
process planning, execution, improvements, and control. Lapide’s (2014, p. 14) first presented success
factor is ongoing routine meetings, stating that meeting should be held irrespectively whether or not the
participants believe the meeting should take place. Boyer (2009, p. 6) make a schedule and monitor –
attendance is one of the most important keys to success, and as well is monitoring the tasks allocated in
the meetings. It is essential that everyone knows the S&OP process dates and what duties and inputs are

37
expected from one another. Smith et al. (2010, p. 12) S&OP process should be administrated through
periodic reviewing process.
Figure 11. Process governance (Charantan & Sandeep 2013, p. 13)
Process should be documented so that people can be trained and process-understanding monitored, all
key process activities should be documented (Boyer 2009, p. 9). Well documented, clearly defined and
followed process policy and procedure leads to a better formalization of the process. Also, clear
implementation guiding at the beginning of the process has been found to be exceedingly important.
S&OP process must lead to improved team work, which goes in conjunction with the developing and
operating a single company plan for a company. Which requires eliminating the maximization of local
or functional targets and objectives, herewith foster monolithic targets and objectives to the company as
a whole. Process should spend less effort on finger pointing. (Dougherty & Gray 2006, p. 50.)
Information
Information should be accurate but it does not have to be precise, perfect 100 percent accuracy is not
required but generally 95 percent accuracy is recommended on inventory, production and capacity data.
Forecasting accuracy can vary between companies, so acceptable deviation must be defined so that future
demand volatility can be modulated to S&OP plans. Information should be in a usable and focused
format, which means getting the right data in a timely manner. This highlights the challenges and fosters
a rapid and persuasive decision-making – tabular displays of quantitative data, graphical representations
and aggregations for example product family. (Dougherty and Gray 2006, p. 50–52.)
Governance
Planning
Execution
Improvements
Control

38
Lapide (2014, p. 15) states rough-cut and scarce plans should be applied. Charantan and Sandeep (2013,
p. 14–15) highlights the effectiveness of right metrics ensuring that information gets recorded at the right
time and way. Healthy organizational behaviour is driven by the right metrics. Processes should have
purposeful and meaningful metrics. Smith et al. (2012, p. 13) states that 63 percent of 16 case companies
suggested that timely information is crucial, for example early results from the process steps so that wider
cross-functional buy-in can be executed. Lapide (2014, p. 15) states that unconstrained forecast should
start the process with all demand impacts included. According to Singh (2010, p. 27) balancing supply
and demand tacit knowledge should be manage through documented playbooks, which stores the
decisions information in the right way.
Top Managements Alignment
Someone in top management, who has the authority to commit resources, must get involved into the
S&OP process. Someone who can design, finance, tie input, advocate and lead it, as well inspire and
teach the usage of the process to the top management. Activity may become optional and endure lack of
resources for example IT support, if this kind of key player is absent. (Boyer 2009, p. 4–6) Dougherty
and Gray (2006, p. 49) states that leadership and support from top management is crucial for the process
and clear definitions of roles, responsibilities and ownership should be indicated in the process.
Executives lead the process by setting an example. As well as, Smith et al. (2010, p. 12) present that 81
percent of its case companies emphasized executive commitment as prerequisite to S&OP process.
Participants need to be empowered by the executives to make decisions based on the input data, their
interactions with other members during the meetings. Collaborative process leading to consensus and
accountability – managers need to engage on executing the plans and be responsible for the delivery of
plans. (Lapide 2014, p. 15–16.)
Analytics, Linkage to ERP and IT
Analytics helps S&OP process to become more effective and cognizant of scenarios. Analytic-based
reports inform the leadership what is the S&OP balancing. Actions needs to be executed and managed
through tactical and operational S&OP. Results and trends can be seen from previous decisions and what
corrective control actions needs to be done. (Charantan & Sandeep 2013, p. 15–16.)

39
The ERP system must be driven by the outputs of S&OP, so that detailed day-to-day decisions are
synchronized with the aggregate decisions made in S&OP process (Boyer 2009, p. 9–10). Process design
is experienced as a key to success, though software tools are not highlighted in thirteen case companies,
actually none of the case companies utilized commercial S&OP software. Instead they developed own
S&OP analytics using Excel with support of programs with access to ERP and systems, usually utilizing
custom data bases (Access) and retrieval programs. (Dougherty and Gray 2006, p. 54.) Though,
technology has developed enormously in past ten years, and so statement of utilizing merely own Excel
sheets should be questioned, and hereinafter commercial analytics tools should be considered. From 16
case companies 88 percent experienced shared data and linked IT as keys to success – these two elements
were most frequently cited success factors (Smith et al. 2010, p. 12).
Continuous Improvement
In the first half a year of implementing S&OP process, meeting mechanisms, formats, data accuracy,
reports, and learning are consuming lots of time and these requires typically lots of improvements (Boyer
2009, p. 9). Charantan and Sandeep (2013, p. 16–17) continuous improvement is crucial because
development ideas will come from the participants of the process, minor improvement does not generally
require major capital investments, improvement ideas comes from employees. Once individual’s
influence is noticed, employees usually continually think ways to improve their own performance. The
opportunity of influence motivates and encourages employees to take ownership from their inputs to the
process. See figure 12. loop of continuous improvement.
Figure 12. Loop of continuous improvement (Charantan & Sandeep 2013, p. 16–17)
Plan the Improvement
Implement the Improvement
Evaluate Success of the Improvement
Activity
Decide Next Steps

40
From 16 case companies 88 percent emphasized continuous process redesign as an important requirement
(Smith et al. 2010, p. 12). Hold the first S&OP meeting iteration usually six months after the designing
process gets started. It takes usually six iterations for people to get a good understanding what is going
on and all the issues are being fixed (Boyer 2009, p. 9). Dougherty and Gray (2006, p. 57–58) S&OP
process can be streamlined as continuous improvement, lean manufacturing and total quality
management or 6 Sigma. Improvement targets and monitoring check-list of improvement should be
viewed at least annually.
Commitment
According to Boyer (2009, p. 6) attendance is one of the most important keys to success and as well is
monitoring the tasks allocated in the meetings. It is essential that everyone knows the S&OP process
dates and what duties and inputs is expected from one another. Lapide (2014, p.15) highlights the
preparation and arrangement in the pre-meeting to support the executive meeting inputs – so that rough
plans are arranged, synthesized and translated into visual form. S&OP needs to be a responsible,
disciplined, repeatable process, which runs on timely basis and according to schedule. Moderating person
is most likely a senior mid-manager. Facilitator’s goal is to drive towards consensus, not dominate the
meeting by requiring approval to his or her point of views. S&OP should not lack clearly defined roles
at the meetings. Each participant should contribute to the process by leveraging their functional expertise.
Allocate Effort to Designing
Here three prerequisites are presented, when effort is allocated to designing. Define data format – i.e. the
capacity, sales, inventory, production data formats. Determine data hierarchy by each department, for
example sales department is looking data from different point of view than production – sales looks
currencies and product categories on the contrary production looks amounts and pipelines. Third
designing pre-requirement is performance measurements. (Boyer 2009, p. 7) Process design is
experienced as a key to success and initial design should be developed in two to four months, though
time consuming to reach the perfect state is questioned, because managers will request changes to the
initial design (Dougherty & Gray 2006, p. 54–56).

41
Time-horizon
Charantan and Sandeep (2013, p. 12) present progressive time-horizons as a success factor.
Distinguishing strategic, tactical and operational time-periods from one anther is considered to be
important. Looking at the big picture, linking strategic goals with day-to-day operations and reaching
the consensus between demand, supply, and profitability are highlighted in the first S&OP building
element. Timing is crucial – all the case companies, what Dougherty and Gray (2006, p. 52–53)
presented, had one month S&OP cycle, companies experienced that marketplace, supply and demand
source dynamics may vary substantially in a month time-period. It does not mean they do, and even
that the plans do, but it means that S&OP data has the right to be reviewed once in a month. A
comprehensive planning horizon, which extends at least twelve months forward – in many cases
eighteen to twenty-four month time frame is necessary to indicate the implications of demand and
supply to top managers.
Segmentation
Supply Chain should be segmented according to used resources, such as market and customer
segmentation are well-known concepts. Potential benefits from segmentation in S&OP are effective time
and resource usage to concentrate on exception-based decision making, accurate forecast reduces
working capital and inventory, enhanced customer experience, and revenues from improved availability
of goods and fill-rates. Segmentation is on-going improvement activity to examine whether any product
is shifted across segments, for example a SKU which is pull-based replenishment could move to push-
based replenishment. (Charantan and Sandeep 2013, p. 16.)

42
3 DEFINING THE S&OP STRUCTURE OF THE CASE COMPANY
3.1 Case Company
Case Company, Ekokem, is an environmental management company, which operates in the Scandinavia.
Company provides waste treatment solutions including waste disposal, environmental and landfill
construction, recycling and waste-based energy production. Its headquarter is located in Finland and it
operates many constructions, landfills and waste centers across Finland. Case Company group operates
also in Sweden and Denmark, where a waste-to-energy treatment plant and high-temperature incineration
plants are located. (Ekokem 2015b.)
Case Company group focuses on economic cycle business – inventing new ways to utilize and accelerate
raw material and resource reuse in economic cycle. Business focuses on the foreclosure of the economic
cycle. Company increases recycling and recovery of materials, as well as contributes the understanding
of how materials will be returned back to the society, for example to customer’s raw material. Materials,
which are not profitable to be recycled or are wanted outside from the cycle due to their toxic features,
are directed into waste-to-energy plants. Thus, adequate supply of incineration-waste is ensured to
treatment plants. Case Company’s mission and values have a strong linkage to environmental-friendly
attitude. Company values and mission are presented below in the figure 13. (Ekokem 2015d.)
Figure 13. Case Company’s values and mission
Case Company Group is currently under organizational change. Business units are recycle & energy and
environmental construction, see table 5, the circles and square in the table are explained later. Recycle
and energy consists of business areas recycle materials, hazardous waste treated in high-incineration
plan, processed in physical chemical treatment and evaporator. As well as, municipal, commerce and
industry waste treated in grate incineration plants are concluded in the recycle & energy business. The
energy content of waste inflow is utilized for energy production in aforementioned centralized heating
Innovation-
willingness
Responsibility Appriciation of
the Individual
Integrity
Mission: Saving Natural Resources

43
and electricity production plants, or in energy production by customers of Case Company. Environmental
construction business unit consist of the following business areas: landfill construction projects,
remediation of contaminated areas – soil, groundwater and industrial waste waters and reutilization of
materials from energy production and industry. (Ekokem 2015a.)
Table 5. Business areas of Case Company (Ekokem 2015c)
Recycle and Energy Environmental construction
- Recycle materials
- Energy solutions
- Hazardous waste
- Municipal waste
- Commerce and industrial waste
- Plastic recycling
- Oils and support fuels
- Water processing
- Construction
- Treatment centers
- Demolition operations
- Soil remediation services
- Customer solutions
3.2 Product Planning Groups
S&OP context is illustrated in the business unit table 5. where business areas sections inside square and
circle describes S&OP process environment. Circulated business areas are planned in product family and
subfamily level and unit sections inside of the square are linked to S&OP process, as they provide spot
deals and storage capacity for the recycle and energy business units. Environmental construction area is
delimited aside from treatment centers, soil remediation and demolition operations. From recycle and
energy area hazardous, municipal, commerce and industrial waste as well oils and support fuels are
studied in the thesis.
Product families from recycle and energy are dealt in four separate groups A, B, C and D, illustrated in
figure 14. Families A and D are dealt based on the treatment lines and group B and C based on the
importance of waste types for the process. Thus C and D families are treated in the same treatment
pipeline than group B products. A group is for controversial waste, B and D families for hazardous waste
and C family for support fuel and oils. To gain more efficient end result and thou manage same time vital
waste flows for the processes, development was reduced to few groups and subgroups. Product families
are presented in the figure 14. where Case Company’s S&OP families and subfamilies are defined before
restructuring.

44
Figure 14. Case Company S&OP product families
Product family A consists of grate treated waste. The product family is divided into five different
subfamilies. These five subfamilies are dealt further into separate waste fractions, though S&OP process
does not take these into account, because these fractions would be too detail specific for the process. The
S&OP process did not took subfamilies into account. Subfamilies were dealt as one big volume in the
S&OP process as presented in the figure 14.
Family B consists of waters, which are dealt to high temperature incinerated and evaporator treated waste
waters. Like in A subfamilies these are dealt into more detail-specific fraction in operation planning.
S&OP process were managing these 6–9 subfamilies as separate volumes, not consolidating them into
one bigger flows. Family C is separated into two subfamilies – high temperature incineration support
fuels and evaporation oils. These subfamilies are separated into more detail-specific fractions in operative
S&OP and production planning. S&OP process were managing these as separate subfamilies, not
consolidating them into holistic flow, as they were treated in different processes.
Family D consists of other high temperature incineration fractions, these fractions have connections to
evaporation like product group C and B have, and as well to other resources. Product group D is dealt to
four subfamilies, from which subfamily 10 has connections to evaporation treatment and subfamily 11
to both evaporator and physical chemical treatment. Subfamilies 10–13 were managed as one
consolidated volume, as well subfamilies 10, 11 and 12 were managed separately by customer deliveries
and treatment pipelines. Subfamily 13 stands for other minor volume waste fractions together, subfamily
13 was managed as part of the consolidated volume, no allocations were made towards resources, because
of the low volumes and heterogeneous fraction type.
Family A
Subfamily 1Subfamily 2
Subfamily 3Subfamily 4
Subfamily 5
Subfamily 6Subfamily 7
Subfamily 8Subfamily 9
Subfamily 10Subfamily 11
Subfamily 12Subfamily 13
Family B Family C Family D
S&OP structure of the Case Company

45
Resources allocated vs un-allocated
To understand the classification more deeply, in figure 15. are presented the relations between waste
fractions and resources. These resources are high temperature incineration, physical-chemical treatment,
evaporator, external treatment, and waste-to-energy treatment. The overall dependencies are
multidimensional, though two separate waste fractions can be identified as inflow specific waste
fractions, these are subfamilies 7 and 9. These fractions have similar features, as the waste fractions,
which are treated in high temperature incineration, but these are treated in evaporation pipeline.
Therefore subfamilies 9 and 7 are dealt as waste-fraction point of view in family B and C with the
subfamilies 6 and 7, see figure 15. Others major flows to waste-to-energy treatment plants and to high
incineration treatment are separated to treatment pipeline based product family classification.
Figure 15. Dependencies of subfamilies and resources
Generation of production grades can be identified from evaporation treatment, where subfamily 8 from
family C and subfamily 10 and 11 from family D are producing inflows to high temperature incineration
processes. Physical-chemical treatment is generating production grade as well to high temperature
incineration process, see subfamily 11. In addition there are many other phenomenon and actions for
example storage transfers, waste converting, and internal transfers, which generates and consumes waste
fractions, though S&OP balancing process does not take these into consideration, because they are not
at aggregated level, as S&OP process‘ one of the main mission is to enable a holistic and aggregated
view from material flows.
Minor flows->
Minor flows->
Physical-ChemicalTreatment
High Temperature Incineration
Subfamily 6
Subfamily 10
Subfamily 8
Subfalmily 11
Evaporation
Subfamily 9
Subfamily 12
External treatment
Subfamily 5
Waste-to-EnergyTreatment
Subfamily 8
Subfamily 1
Subfamily 11
External treatment
Subfamily 10
Subfamiles 7Subfamily 4
Subfamily 3
Subfamily 2
Subfamily 13

46
The classification of product families to treatment pipeline and product family oriented S&OP is
illustrated in the figure16. Resources and subfamilies inside a family are described. Even though
subfamily 12 is as well processed in the waste-to-energy treatment pipeline they are not included in the
family A group nor is the treatment pipeline in the family group D. This is because the minor flows are
irrelevant for the process, as seen in figure 15. Like aforementioned family B and C were not
consolidated with the family D, even though they have all the same treatment pipelines. This is due to
the relevancy of subfamilies 6–9 for the evaporation and high temperature incineration process. The
evaporation and physical chemical treatment creates feeds to family D and C. These are not described
here as they do not consume the subfamilies.
Figure 16. Mixture of treatment pipeline and product based classification
3.3 Demand planning
Demand was planned by yearly updated sales forecast. Towards the end of the year forecast was
constrained and judgmentally adjusted by the S&OP manager. Demand planning has been the biggest
challenge in the S&OP process, because the whole demand planning function lacked a formalized
process. Demand plan was updated once a year by sales department and linked to S&OP, judgmental
adjustments were made when new information occurred in the S&OP process. All though, the key point
High Temperature Incineration
Subfamily 10
Subfamily 11
Subfamily 12
External treatment
High Temperature Incineration
Evaporation
Subfamily 8
Subfamily 9
Evaporation
High Temperature Incineration
Subfamily 7
Subfamily 6
External treatment External treatment
Subfamily 6 Subfamily 8
Subfamily 9
Subfamily 10
Subfamily 12
Waste-to-EnergyTreatment
Subfamily 5
Subfamily 1
Subfamily 2
Subfamily 3
Subfamily 4
External treatment
Subfamily 1
Subfamily 2
Subfamily 13
Family A Family B Family C Family D

47
is to get the information outside into the S&OP process. The demand planning phase of S&OP process
was executed formally once per year without an unconstrained forecast.
The sales department and customer service of the Case Company does inflow steering decisions from
customers to the plant site. S&OP process should be the cross-functional information deliver between
departments. Based on the interview 3. sales department experienced that S&OP process has not succeed
in transferring information. Sales experienced a lack in transparency to exceptional steering decisions
and reception locations. (See customer service and logistic section).
Sales department forecasts mostly currencies without ton based volumes. Volume based forecasting were
done in indefinable way and the volume based linkage to S&OP demand plan was suffering from lack of
sales information. Demand planning input lacked the volume based forecast information and output from
S&OP lacked steering decisions and reception capacities.
Case Company’s forecasting parameters are described in table 6. Sales department generated statistical
forecast once a year from the last year’s actual data. Forecast was generated at subfamily level, as the
demand is independent. Contracts were gone through after the generation. Specific season fluctuation
and spot deals were adjusted, bankrupt estates were removed, and so seasonal fluctuation was corrected.
Biggest customers were as well contacted and their delivery volumes verified, the big volume customers
are forecasted as sell-through method and low volume customers as sell-to method. Forecast for
aggregate group level are created with bottom-up technic. Both currency and volume based forecast are
created separately.
Table 6. Forecasting at the Case Company
Demand type Independent demand
Forecasting frequency Rolling yearly, informal adjustment in S&OP
forecasts
Forecasting types Constrained
Statistical adjusted afterwards (once a year) /
S&OP forecast adjusted manually when new
information occurred in the S&OP process
Sell-Through and Sell-To
Bottom-Up

48
3.4 Supply planning
“It is much easier to deal with the mix issue, if volume is managed effectively. On the other hand, mix
complication become immediately more unmanageable, if the volume is not planned well.” (Wallance
& Stahl 2008, p. 7)
Manufacturing department does a manufacturing budget once a year and it is adjusted rarely depending
on the shortfalls or surpluses of inflows, though the key point was to run at full capacity and find external
capacity when needed. S&OP was looking mainly actual processing amounts and forecasts were not in
such an important role.
Daily challenges in waste-flow were identified, supply challenges were mostly due to uncontrolled
inflow, and supply side desired a better signal from operative issues to sales department. Manufacturing
department experienced that resource allocations were difficult to manage due to unknown fact of daily
waste inflow volumes. Deficiencies in waste foreknowledge was identified and contact surface was
viewed as unclear. (Interview 4.) This is partly due to a fact that customers do not know the properties
of the waste when they are ordering a service. S&OP function were not experienced as a function for
communication between sales and production departments. Manufacturing department hoped for a
forecast and task list tracking, as well cause-and-effect relationship analysis. (Interview 5; Interview 6.)
Customer Service and logistics
Customer service communicates with the customer, if any exceptional steering decisions have been
made. Smaller customers with own deliveries to plant are communicated through customer service. When
steering decisions were changed, customer service experienced challenges in information flow. The
information flow is passed from tactical to operative S&OP process, which executes the actions and
informs customer service. Customer service imports the orders to ERP, on which the logistics plans
transportation. If the orders are correctly imported to ERP, logistic does not require anything from S&OP
process. (Interview 7.)
Customer service experienced interest on tactical S&OP output from main guidelines but felt more as a
challenge the information flow from operational S&OP. Customer service requires information if any
changes occur in the control actions and desired a report from exceptional actions. The information
should include frame conditions of the ongoing case. The most important information is what kind of

49
service the customer needs. Most challenging cases are when customers’ magnitude were small and they
do not affect the total balances at any level but causes extra work. The mass logistic was working properly
but the smaller individual transportation creates biggest challenges. (Interview 7.)
3.5 Structure of the S&OP process before refining
Waste volumes have increased almost by half from 2010. S&OP process was functioning and managing
information at the lower waste volumes, though as volumes increased more resources to S&OP process
were needed. S&OP participant gathered once per month for executive meeting and other S&OP related
work was done informally. S&OP process was mainly once a month meeting where attendance percent
was varying. Lack of S&OP linkage to operational level and especially to sales steering was identified
and the challenges were noticed at the plant site as well. One of the new missions was to create a whole
picture from tacit knowledge and control the material flows. The S&OP process lacked a visualized big
picture, which could be easily interpret among the S&OP meeting participants, and which could be
distributed to the externals, who were not participating in the meetings. Without the big picture S&OP
was doing control decisions, but the decisions were not made by the best possible information based on
the consolidated opinions, rather on the few deep talents’ information and opinions. (Interview 2.)
The current situation in the S&OP meetings is that participants are re-defining boundary conditions and
the control actions are performed in the absence of accuracy and transparency. One of the key missions
was to guide the process from event based philosophy to more advance planned process, where the
number of events declines. In an event based philosophy S&OP process is discovering solutions to newly
occurred event. Though, this is one of the most important missions of the S&OP process, but the key
point is to prevent as much of the events than possible, by constant and effectual planning, rather than
managing the events as they emerge. In the other hand, the planning cannot consume too much resources.
3.6 Process structure, planning parameters, and maturity
Process structure - Executive Meeting
S&OP participant gathered once per month for executive meeting, other S&OP related work was done
informally. S&OP process was mainly once a month meeting, where attendance percent was varying.

50
Typically two sales chiefs, sales manager, two production managers from both hazardous and
controversial wastes, logistic chief, SCM manager, chief operative manager of environmental
construction and chief operative officer of treatment centers of environmental construction, group
business director, operative officer of BU recycle and energy, chief operative officer oils and support
fuels were participating into the meetings. Meeting did not lack of attendances, all the necessary expertise
were in use of S&OP process. Information was not as ready as possible at the meetings, because the
process did not have formalized preparing meetings. Especially managers felt that S&OP lacked easily
interpret tables and visualized graphs, which are describing the upcoming trends.
Meeting agenda consisted tasks from previous S&OP, storage arrangements, product family related
issues, and environmental construction activities. The Excel figures were revised in the meetings and
environmental construction activities were managed with project list. In the table 7. is described the
process structure.
Table 7. S&OP process structure
Data Gathering
Phase
Demand Phase Supply Phase Consensus Phase After the
Consensus Phase
1) Data gathered
and updated
2) Forecast
consolidation
(unfomral)
3) S&OP
executive meeting
preparation
4) Executive
meeting
5) Task list
6) Updated S&OP
tools
7) Discussion
with external
pipelines
9) Investment
opinions
9) Steering
actions and
storage plan
10) Linkage to
operational S&OP
Planning parameters
Planning parameters of the Case Company are presented in the table 8. Demand planning horizon was
12 months for all product families, except three years for product family A. For A family, like for other
product families, first 12 months were planned in monthly-level and updated year-by-year in the fourth
quarter of the fiscal year. The other two years for family A were generated from the contract information

51
at yearly-level. The forecasts were adjusted informally and irregularly as new information occurred to
the interface of S&OP. For supply planning treatment, forecasts were made once a year and they were
adjusted depending on the shortfalls and surpluses on the balance, though adjustments were extremely
rare. Planning frequency depended on the adjustments and rough forecasts but standard planning
frequency was yearly. Like aforementioned, planning groups varied depending on the pipelines and
consequential waste inflows for the treatment pipelines. Planning objects depended on the planning group
– objects were treatment pipeline, product family or subfamily. Resources were unaligned and the
product families were developed according to these alignments.
Table 8. Case Company planning parameters before restructuring
Planning horizon 12 months, new year forecast updated towards end
of the year, adjustments when needed, three year
rough planning scope (yearly figures)
Same as the lead time for capacity changes
Planning frequency Rolling 12 months, adjusted when necessary
Constrained, Statistical & Judgmental methods,
Planning objects Treatment pipeline, Product Family level and
product subfamily level, depending on planning
groups
Planning Groups Treatment pipeline based planning and Product
Family based planning
Resources Unaligned resources, complex correlations among
resources
Maturity
The maturity of the S&OP process is illustrated by the Grimson & Pyke (2007) maturity model, see table
9. Current state is illustrated by the green square and to-be state illustrated with green arrow. The
evaluated sections are divided to meeting and collaboration, organizational, measurements information
technology, and S&OP plan integration. From all categories S&OP gets 2,6 out of 5, where stage five is
proactive stage.
The S&OP process of the Case Company meeting are on stage three as one formalized meeting is
organized once per month, though no pre-meetings existed. Organization is as well on the stage three
because S&OP is recognized as a function and S&OP coordinator manages the S&OP information and

52
materials. Resource allocated to S&OP process was varying and the S&OP lacked the continuous
improvement part as the coordinator managed other task well. It was notified that S&OP function needs
to be separated and requires more resources. Measurements are on the stage 3, though as the requirements
of measurement stage are not demanding, measurements and KPIs need more development than the
maturity model indicates. Information technology is on the stage two, because S&OP process uses ERP
and spreadsheets as tools. S&OP plan integration is on the stage two, challenges in plan integration
between different business areas were identified.
Table 9. Maturity level of the Case Company
S&OP process clearly needs improvements on the area of plan integration, information technology and
measurement, where challenges were identified. Strength of the process is on the meetings &
collaboration and organization. The green arrows describes the desired to-be state of the S&OP process.
The leap of gaining two stages can be noticed on the information technology and measurement side. The
gain of one step can be identified at organization and plan integration categories. Meeting and
collaboration is considered as the biggest strength, so resources should not be allocated to this category
in the near future. Like aforementioned this maturity level table is for illustrative purposes only and
therefore two stage developing objectives were defined. Maturity models’ stage requirements varies

53
depending on when they were developed, so if the comparison would be applied to Cecere et al. (2009)
model Case Company would get most likely an average stage between one and two.
3.7 Data, tools, and performance measuring
S&OP process was managed with Excel sheets and task lists. Four different Excel sheets existed and
they were based on the planning groups. In the product family based sheets, waste inflow were managed
in three different tables: demand table, table including supply according to resources, storage and
warehouse development, and last table including generation of production grades.
An example of family D’s demand, customers received & budgeted volumes, is illustrated in table 10.
The actual deliveries of biggest customers per ton are compared monthly to the budgeted deliveries.
Customers are not separated in the table by the subfamily deliveries, they are specified in the production
grade table. Customer based and total delivery based balance is calculated to measure mean absolute
error and relative error metric, as seen in table 10. Forecast for the deliveries at year end is generated
based on the relative error metrics, which describes the actual inflow trend.
Table 10. Excel demand table (figures are random and they do not reflect the real situation)
Second table of the sheet is supply, see table 11. Here treated waste according to subfamilies and
resources are presented towards treatment budget. Four different subfamilies can be identified and three
different resources, external treatment pipeline and two resources in the domestic area. Treatment
forecasting is followed by mean absolute error and relative error metric, based on the relative error metric,
a forecast for the end of the year is generated. In this table forecast for future storage level are displayed
in the same row than actual storage level. Depending on the date, table creates a forecast based on the
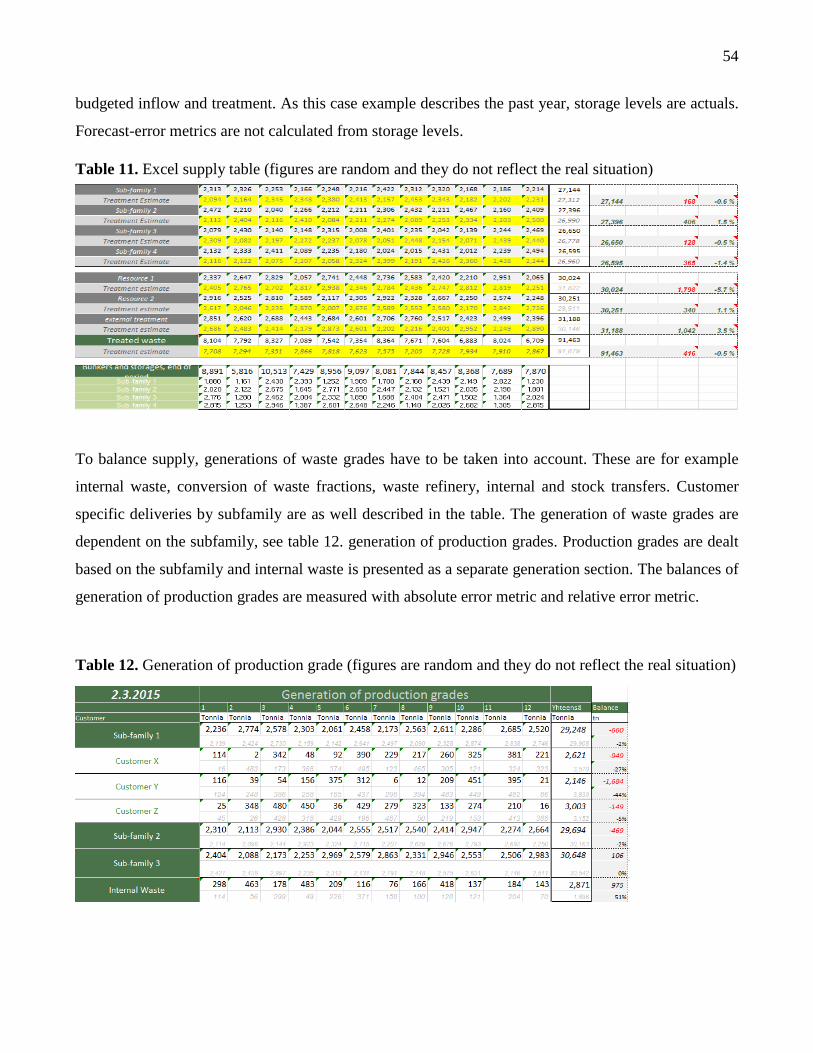
54
budgeted inflow and treatment. As this case example describes the past year, storage levels are actuals.
Forecast-error metrics are not calculated from storage levels.
Table 11. Excel supply table (figures are random and they do not reflect the real situation)
To balance supply, generations of waste grades have to be taken into account. These are for example
internal waste, conversion of waste fractions, waste refinery, internal and stock transfers. Customer
specific deliveries by subfamily are as well described in the table. The generation of waste grades are
dependent on the subfamily, see table 12. generation of production grades. Production grades are dealt
based on the subfamily and internal waste is presented as a separate generation section. The balances of
generation of production grades are measured with absolute error metric and relative error metric.
Table 12. Generation of production grade (figures are random and they do not reflect the real situation)

55
Master data and measuring
Data of actuals to the sheets are inquired from databases with structured query language (SQL). Forecast
data is in the same work book and have to be updated manually, if any adjustments occur. Manual
updating has been one big challenge for the S&OP process. As well as, to transferring the sales
departments forecast to the use of S&OP process.
During the process master data challenges were identified when consolidating the demand plan of the
process. When consolidating the demand plan demand planner, S&OP manager, SCM manager and BU
manager were compering own departments’ forecasts together, it was identified that differences occurred
in sales forecast and S&OP process demand plan. Differences were identified and further actions for
consolidation were introduced.
Sales department do not have the same product planning subfamilies in product family B than S&OP
have, so waste classification was varying frequently. Product family A, C, and D are categorized in
demand planning to same subfamilies that S&OP utilizes. When order occurred product family B was
allocated but no subfamilies were defined. Operations commented that on minor pre-clarification the
reservation area, and waste steering to sufficient treatment line would be more effortless. Classification
differences in master data was creating challenges for both S&OP process and operations.
Sales and operations planning process where mostly measured with balances and forecasting errors, by
each customer, there were no exact link to financials. Like described earlier, for demand planning relative
error metric and absolute error metrics were measuring customer based deliveries on the product family
and subfamily level. For total deliveries by planning group, trend related estimations were generated. For
supply planning phase the same metrics were applied, to treatment lines. As well as, treatment capacity
estimations towards the year end were generated for overall planning group.

56
4 PROCESS DEVELOPMENT AND RECOMMENDATIONS INTO
THE FUTURE
Processes were developed during the thesis project and used methods were mainly educations, interviews
and workshop. In this chapter the actions done to each section of former sales and operations planning
process are illustrated, as well future recommendations to achieve created target state is defined.
Developing aspects are defined by each phase of S&OP process and further recommendations are
presented.
4.1 Product planning groups
Product families were managed with two different levels (family level and subfamily level) depending
on the family. It was noticed that lot of effort was spend to describing different levels of families and
reporting these through S&OP process. The need for future development of product family planning
groups were identified and future recommendations are presented as follows. First steps is to disaggregate
product family level A – making a drop-down function of family A to subfamily level. Second step is to
aggregate families B and C – making a bottom-up function from subfamilies to product families B, C.
These subfamily and family levels should be observed simultaneously and seamlessly without separate
effort on consolidating and disaggregation. Third step is to extend the observed families to other
processes. In the figure 17. is presented the recommended product family and subfamily chart of S&OP
point of view, red area describes the former process and the green area the future development. The to-
be state is where every product family and subfamily are taken into account in S&OP process.
Figure 17. S&OP product family recommendation
Family A
Subfamily 1Subfamily 2
Subfamily 3Subfamily 4
Sub-family 5
Subfamily 6Subfamily 7
Subfamily 8Subfamily 9
Subfamily 10Subfamily 11
Subfamily 12Subfamily 13
Family B Family C Family D
S&OP recomendationS&OP before restructuring
Extend to
other
families

57
Developing aspect of S&OP product planning pipelines where identified when S&OP process was
planning at three different levels, product family level, subfamily level and treatment pipeline level, as
described in chapter 3.2. Current state of the S&OP process is that it is planning depending on the families
at three different scopes, product family (family A), subfamily (family B, C), treatment pipeline based
(family A and D). These are the best planning levels for each family but in order to gain deeper
knowledge of the balances between different subfamilies and families, modeling of planning groups
needs to be done. In the figure 18. mixture of product based and treatment line based planning are
described along with recommendations. Red color illustrates the former planning scope and the green
color describes the development aspects so together the colors characterize the to-be state of the families.
Figure 18. Mixture of product and treatment line based planning scope
To-be state was built for treatment line based point of view, evaporation, physical-chemical treatment,
high temperature incineration, and external treatment are separated as individual planning groups. S&OP
should be able to switch the planning scope depending on the case. It is vital to be able to observe the
whole balance of particular treatment line. On the other hand, the same picture can be drawn from current
planning scopes, but it would not be as time consuming and complex with the abovementioned to-be
state. To gain better insight for different correlations between the resources and waste inflows, the
possibility to switch the planning scope depending on the S&OP case, have to be developed. When the
treatment line based planning is generated, it should be possible to disaggregate to family and subfamily
level and select any subfamilies to be an observation target.
High Temperature Incineration
Subfamily 10
Subfamily 11
Subfamily 12
External treatment
High Temperature Incineration
Evaporation
Subfamily 8
Subfamily 9
Evaporation
High Temperature Incineration
Subfamily 7
Subfamily 6
External treatment External treatment
Subfamily 6 Subfamily 8
Subfamily 9
Subfamily 10
Subfamily 12
Waste-to-EnergyTreatment
Subfamily 5
Subfamily 1
Subfamily 2
Subfamily 3
Subfamily 4
External treatment
Subfamily 1
Subfamily 2
Subfamily 13
Family A Family B Family C Family D
Evaporation
HighTemperature Incineration
External tretment
Waste-to-Energy
Phy & Chem

58
For example, when business areas and operations performance are observed the multi-scope planning
parameters needs to be revised. Another example is that subfamilies may have similar properties and
they can be stored in similar tanks resulting inventory planning efficiency at operational level. This would
categorize planning scope to fluid wastes and there for reservation area planning would be easier. For
example, fluid waste for high temperature incineration type of classification, would include subfamilies
6, 8 and 10. Operations chief officer stated that it would be desirable, if S&OP process would produce
plant site planning forecasts more frequently. (Interview 5.)
4.2 Demand planning
“The entire business is based on a fact that demand must be profoundly understood” Group Business
Director (Interview 1.)
Demand planning has been the weakest link in S&OP process. Forecasting customer demand has not
been formal process and it is partly understood. In the thesis project S&OP function clarified forecasting
methodologies and established a pre-meeting where customer forecasts were manually updated to
spreadsheets. In the pre-meeting sales representatives were present and customers were contacted, if any
lack of information occurred. As well as, investigation of the dependences between ERP actual deliveries
and demand planning (DP) tool forecasts was started, to enable future linkage of DP forecast to S&OP
tools. S&OP function did not manage the forecasts in DP, it had manually updated volume based forecast
for each planning group. As the DP actuals did not depend on the delivery but on the billing date, the
dependency clarification and adjustments to S&OP sheets were started.
CRM could be linked to S&OP process to provide more input to unconstrained forecasts in the long term.
The input in sales funnel could be registered as they occur for KAM, so the linkage would enable the
automatically updated prospect to S&OP tool. The time frame of sales funnel is recorded in CRM, this
is longer than the forecasts in DP. Sales funnel would provide more input to long-term planning. Though,
first the budget and forecasts created in DP have to be linked to S&OP process.
It is extremely vital to link the sales department on the demand planning process, because then sales
department owns S&OP forecasts. As two different forecasts were identified the steps to synchronize
were put into place. Sales department’s deeper engagement to S&OP process, resulted better forecasting
accuracy metrics in S&OP process.

59
Process should be planned with one set of numbers, which are based on the best possible information.
As well as, forecast should be reflecting the most likely outcome, planned with best possible information
available. Optimistic and pessimistic forecast, beside with baseline forecast, was experienced as valid
input for the S&OP process. Forecasts have the right to be revised, and pre-meeting practice is a sufficient
way to do it.
Recommendations
S&OP had its own unconstrained forecasts and these where revised at pre-meetings. Forecasting period
should be extended to 24 months to gain more insight into the future. It is desirable to drive to the state
that sales department would create the unconstrained forecast not the S&OP function. Sales department
is establishing a forecasting process, where all KAMs are updating quarterly the biggest customers’
forecasts in BP. To get deeper understanding in prospects the CRM data, should be linked to S&OP tool,
and this should as well be validated in the demand planning meeting.
Correlation test to order intake and indicators could be applied. Order intake correlation to industry
specific indicators and macro-economic indicators, such as Brent crude oil index for oil business.
Europe’s purchasing management index (PMI), OECD composite leading indicators and volume index
of industrial output for all planning groups. These results could be utilized in statistical forecasting.
Industrial output volume could be separated to three industries C manufacturing, D energy, E water
supply and waste management, and so apply to specific planning groups depending on the customer
industries. As future recommendation, the S&OP forecasting should be expanded to other families and
environmental construction business unit. See table table 13, where recommendations are highlighted
and compared to current state.
Table 13. Recommendations for demand management and forecasting methods roles
Demand type independent demand
Forecasting frequency Rolling quarterly, 24 month time frame
Forecasting types Constrained and unconstrained
Statistical rolling yearly, adjustments if new
information occurs at pre-meeting otherwise
statistically forecast rolling quarterly and
afterwards adjustments
Sell-Through and Sell-To
Bottom-Up
Demand correlation test Compare demand actuals to example indexes
to develop the statistical forecast generation

60
4.2 Supply planning
“Operations are well evaluated and managed” Group Business Director (Interview 1.)
Objective of supply planning and management is to define the frame conditions for S&OP process. These
are theoretical storage capacities with prospects, laws restricting supply planning. As well as, S&OP
process ability to find external capacity for an event, which is defined by the frame conditions and costs
of a specific customer. S&OP supply planning is more steering related as production is running at full
capacity and S&OP is providing the material feed to process.
Frame conditions
According to interview 5, hazardous waste operations team desired that clear capacities and safety stock
volumes for each subfamily, would be taken more fundamentally into account. Technical storage
capacities were defined for all product families and subfamilies. As well as, a larger scope was defined
from the whole national perspective, rather than continuing the previous S&OP factory of headquarter
based perspective. Meaning that for subfamilies 6, 8 and 12 from product families B, C and D external
storage capacities were defined, and for product family A inflows and treatment pipelines capacities were
determined from national perspective. The following frame conditions are directing the S&OP process:
- Capacities, defined and clarified as visual reporting
- Storage rotation follow-up – manual follow-up and alarm level could be defined in the next steps.
- Aggregated S&OP perspective – Aggregated and disaggregate defined capacities
- Measurements – for example heat value, see chapter 4.5
- Expenses – Tracked and analyzed informally, in next step financials should be applied more
deeply into to the process
- Law – Present in evaluating steering decisions
Balancing supply and demand
Supply inputs, treatment forecasts and actuals, are balanced towards demand inputs, actual and forecasted
inflow, here customer deliveries. See figure 18. supply and demand actuals and forecasts. Forecast and

61
actuals are described in the same chart, creating insight into the future and describing the forecasting
efficiency. Here both forecasts are baseline forecasts generated based on the best possible information
available. Gaps in planned demand and supply can be seen and future action can be presented to balance
the gaps.
Figure 18. Supply and demand actuals and forecasts (Figures does not reflect the real situation)
The example situation would require clearance to deficit in actual customer deliveries compared to
forecast and in gap between actual deliveries and actual treatment – decreasing actual balance. Deficit in
actual deliveries, would require a statement from sales, it is important to understand the actual trend
compared to what was initially planned. Balance gives a signal to operation when deliveries exceed the
treatment capacity and vice versa, if the treatment exceeds the inflow. For example, balance differences
can result the following outputs to operations and sales: stock growth, stock spending, steering to external
treatment pipeline or outlining the possibilities of spot deals. Recommendation to future would be adding
more scenarios, for example the optimistic, pessimistic, and trend forecast generation, as well volatility
indexes and scenario possibilities could be applied.
Subfamily balances
Product subfamilies’ yearly balances inside the factory were investigated to gain transparency of the
processes. Operations and productions teams experienced that the formalized balance calculation is a
vital process to gain transparency, accurate and validate the S&OP and operations processes, as well to
maintain the master data reliability. The balance calculations were a structured and formalized process
in the past. Operations team experienced that the balance calculations should be done quarterly as

62
formalized process. Balance calculations were started from hazardous waste with operation and
manufacturing team. When the balances of previous fiscal year for product subfamilies 10, 6 11, and 8
were calculated, S&OP tool balance and master data defects were identified. Required actions to correct
the gaps were immediately put into place. Balances were calculated in disaggregate level observing
storage transfers, internal transfers, internal waste, waste converting, inflow and consumption volumes.
Relative error of five percent or lower was agreed to be the object of the balance calculation accuracy.
Monthly S&OP process do not observe waste converting as it is on aggregate level. S&OP, operations,
and production team experienced that it is necessary to continue and expand the balance calculations.
Inventory planning
Inventory planning was established as a new process in supply planning phase. Inventory forecasts were
generated from balance forecasts. Balance forecasts were created from the demand forecast and treatment
forecast scenarios. Depending on the scenarios multiple outcomes were created. In the figure 19. is
illustrated three scenarios for possible stock balance of a subfamily for the rest of the three remaining
quarters.
Figure 19. Inventory planning with scenarios (chart does not reflect the real situation)
The yellow pillars indicate actual stock, red lines present storage capacity and critical level. Storage
capacity was determined and updated depending on the information from production department.
Depending on the planning group and subfamilies critical level, was established to correspond a certain
time period of maintaining the production. Red cutline illustrates the trend forecast generated from the

63
actuals of the past months – here the sales actuals have been less than initially expected. Yellow line is
the baseline forecast generated from best possible information, this is the most likely outcome for the
storage balance. Yellow cutline describes the stock, if all prospects would be realized, for example this
scenario’s output would be stock capacity acquisition or increase of external treatment before May.
Recommendation to future would be developing pessimistic forecasts and allocating volatility indicators
and possibilities to each stock forecast scenario.
Recommendations
Palmatier & Crum (2003) S&OP is not going to succeed without the proper linkage to the detailed
planning. It is much easier to deal with the mix issue, if volume is managed effectively (Stahl &
Wallance 2008, p. 7).
In the table 14. is supply planning recommendations into the future. More scenarios could be added to
supply and demand chart, for example the optimistic, pessimistic and trend forecast generation. As well
as, volatility indexes and scenario possibilities could be applied to aggregate supply and demand chart.
S&OP, operations, and production team experienced that it is necessary to continue and expand the
subfamily based balance calculations inside the factory, as it validates the subfamily based balances in
disaggregate level. Recommendation to future would be developing as well a pessimistic forecasts and
allocating volatility indicators and possibilities to each stock forecast scenario.
Table 14. Supply planning recommendations into the future
Balancing supply and demand Expand scenarios and apply volatility indexes
Balances inside factory area Expand disaggregate balance calculation to all
planning groups and subfamilies
Inventory planning Estimated possibility percentages in different
scenarios, volatility indicators, apply pessimistic
scenario
Information flow Develop a clear information flow practice to
operations specially to logistic and customer
service.

64
4.3 Structure of the process
“S&OP data has the right to be reviewed once in a month” (Dougherty & Gray 2006, p. 53)
Executive meetings were standard and formal practice in the Case Company. Formalized demand, supply
or pre-meeting practices did not exist, to validate and refine the data presented in the executive meetings
pre-meeting practice was put into place. In the table 15. is presented ideal S&OP process structure for
the Case Company.
Table 15. To-be S&OP process structure
Data Gathering
Phase
Demand
Planning Phase
Supply Planning
Phase
Consensus Phase After the
Consensus Phase
1) S&OP team
gathers the
information from
past meeting. 2)
Updating S&OP
tool
3) No formal
meeting
4) Consensus
forecast
5) Demand plan is
revised and
possible forecast
scenarios created
6) Sales meeting
- formalize &
refine
7) Treatment
actuals and
forecast revised
8) Inventory plan
created possible
9) Supply
planning meeting
- formalize &
refine
10) Executive
meeting material
created
11) No formal
meeting,
produced material
revised by S&OP
team before
executive meeting
12) Formalized
executive meeting
13) Task lists and
updated materials
distributed
14) Summary of
game plan
- develop & refine
15)
Implementation
of decisions and
linkage to
operational S&OP
Data Gathering and Demand Planning Phase
In data gathering phase actual inflow and treatment data is updated for pre-meetings. No formal process
was established for the phase and the updating is done by S&OP team member. Demand planning
meetings were established as new consolidation and validation meeting for S&OP process. Forecasts
were adjusted manually based on the sales managers’ information, if major customer inflow changes
occurred, S&OP received information before the demand planning meeting. In the demand planning
meeting all product family groups were revised. Meetings were seen as vital process step for S&OP, as
lots of data was validated and forecast error was corrected. When moving towards sales department’s
forecasts practice subfamily group allocation defects were noticed in sales budget.
It is extremely vital to engage sales to S&OP process and align the ownership of sales forecasting to sales
departments. Linking KAMs and sales managers more deeply into the demand planning process would

65
increase the forecasting accuracy and enhance the understanding of demand. Forecasts have the right to
be revised and pre-meeting practice is a sufficient way to do it. Pre-meeting participation percent was
varying as it was still an informal meeting. It was felt that important data went side from S&OP, as the
participation percent was varying significantly.
Supply Planning Phase
In supply planning meeting treatment actual and forecast were revised. As well as, generated balance and
inventory plan was reviewed and afterwards recommendations to close the gaps were presented and an
action plan was created. The meeting focused more on the data validity than on the action plan. This is a
development aspect for the Case Company, to improve the data validity and tools’ balance calculations,
so that more attention can be drew to future game plans. Another developing aspect is to move to more
planning oriented meetings, currently the meetings are looking more to what has happened than what is
going to happen.
Supply planning was separated in controversial and hazardous waste treatment, though often both parties
were present. Supply planning meeting is not standard and its agenda is informal. It was felt that
important data went side from S&OP, as the meeting participation percent was varying significantly. For
future recommendation agenda have to be streamlined, and the reason cause relationship of the meeting
and the planning brought forward. As well as, the planning proportion of the meeting have to be
emphasized.
Consolidation Phase
Conclusion report to executive meeting was created based on the validated forecasts in the demand and
supply meeting. The meeting report was once revised before the executive meeting by the S&OP team.
Agenda of the executive meeting was the following: going through tasks list, operational challenges, and
revising the planning groups. Meeting structure was efficient and working properly. All the relevant
stakeholders are represented at the meetings, and the meeting agenda is logical and the action points are
in logical sequence.

66
After the meeting
Reports presented in the meeting were once again refined and corrected, if needed and task list updated.
Report, task list, and Excel tools were distributed. It was felt that available reports support the decision
making on an appropriate level (detailed content, summaries, graphs). Reports are robust and easy to
grasp, although the game plan, decisions and exceptions made in sales and operational should be reported
more clearly. Investment opportunities were evaluated based on these reports. As well as, measuring the
process performance has to be refined, currently process measuring is tested and developed. For
distribution, primary recipients should be sales department and operations team, so that the required
operation targets and action to close the balance gaps can be reached. Although, sales team was
infrequently asked to adjust sales plans. The required actions were put to operative level and international
level after the executive meeting. Nonetheless, more information was desired considering the steering
actions and exceptional steering decisions.
4.4 Data and tools
“The S&OP process needs to be supported by three types of software applications: 1) demand-
side planning, 2) supply-side planning, and 3) an S&OP workbench.” Lapide (2005, p. 19)
Development of Excel tools was started at the beginning of the thesis project. Development objects were
identified during the clarification work as follows:
- Creating top-down and bottom-up function – creating a holistic tool from domestic aspect and
separating headquarter as own reception location.
- Improvement of forecast generation
- Updating – adding external treatment pipelines and storage capacities
- Scenario management
- Optimization
- Storage planning function
- Visualization
- Report development
Like aforementioned, planning group recommendations were presented to make the aggregation and
disaggregation between subfamilies and families. As well as, object of switching between treatment
pipeline based locations was identified. A holistic picture was created from domestic location aspect for

67
family A, and other aspect was created from the treatment pipeline based locations, headquarter location.
At the gained maturity S&OP tool should be able to describe and switch the operation sites depending
on the ongoing case. This should be done in BI system rather than heavily in Excel, as planning objectives
could be easily changed depending on the ongoing case.
Forecast generation from past last year’s trend and seasonality were generated. Seasonality trend was
calculated based on the last year actuals and the sales forecast. Seasonality forecast created in the tool
was replacing seasonality forecast from DP. Another trend based forecast was created based on past year
actual fluctuation as presented in figure 19. Recommendation are that location based forecast should be
developed in detailed level, currently S&OP and the sales do not have location based forecasts. Another
improvement developing aspect is creating the linkage between the S&OP tool and the sales forecasts in
DP with SQL and Ms Access. Afterwards the linkage to CRM system should be implemented, this would
integrate the prospects and sales funnel more profoundly into the process.
Initially S&OP process did not have scenario management tool. Scenario conceptualization and reason
cause relationships were tested and investigated with Excel. Scenarios were tested on the demand forecast
differences – prospects, trend forecasts, customer specific, and baseline forecasts – and the correlations
to storage planning were evaluated. Future step is to link the scenario planning to financials and to
environmental construction products, so that the cost effect solutions can be evaluated. As well as, the
products, which are shipped from long distance to different pipelines, should be evaluated in the supply
planning tool with the feature of scenario management. Scenario management should be executed in the
APS, as the optimization and calculation power is insufficient in Excel.
Future elements for supply chain management related scenario planning are storage creation or
delimitation, demand change, treatment pipeline stoppages, financials relation – what is the price of the
next contract and where should interim storages be created. The following outcomes are desired to be
possible to achieve: financial effects, storage evolution, capacity situation, visualization of the plan, and
easiness in operating the system.
Analytics of optimization was not tested, although, optimization of subfamilies and waste flows between
treatment pipelines and interim storages was felt having a significant potential of operational cost
savings. Supply planning management system should be able to optimize between different scenarios.
This function should be integrated with scenario management aspect in APS.

68
Storage planning analytics were developed in Excel sheets. Storage forecast was generated automatically
into the future when new monthly actuals were registered. Sales or treatment forecast variations were
automatically taken into account. Storage planning is visualized in figure 19. and tactical level storage
planning was applied to operations.
Demand and supply planning was visualized to graphs as seen in figures 18. and 19. It was experienced
that decision could be made more easily and rapidly based on the visualized figures. Actual and forecast
comparison with KPIs were easily understood. Storage planning was also visualized as mentioned.
Visualization of the subfamilies and locations behind aggregated volumes has to be understood,
otherwise wrong conclusion can easily be made. For example, comparing subfamilies theoretical storage
capacity at national level, can create a situation, which is describing excessive total free capacity.
Visualization was experienced vital for optimization and scenario planning, as well, when planning
material flows between treatment pipelines.
Generally operational related information arouse interest and more transparency was required, thus the
development of the standard reports were initiated. User should be able to generate the reports
automatically from the S&OP tool, currently the reports are generated manually by the S&OP team.
Reports are robust and easy to grasp, though the game plan, decisions and exceptions made in S&OP
should be reported more clearly and refined. As well as, measuring the process performance reporting
has to be refined, currently process measuring is tested and developed.
4.5 Performance Measurement
Process was measured with few KPIs and they were not observed systematically in monthly meeting.
Absolute and relative forecasting error metrics were used for inflow and treatment, as seen in table 10
and 11. During the clarification work several possible KPIs were identified and the recommended metrics
by department and responsible persons are presented in table 16.

69
Table 16. Recommendations of key performance indicators for the Case Company
Department Key performance indicator Owner
Sales Inflow forecast error (Weighed, MAPE,
relative and absolute)
Sales Manager
Sales / Volume growth in euros Sales Manager
Sales Manager
Mean absolute percentage error Sales Manager
Unfilled customer demand Sales Manager
Customer satisfaction Sales Manager
Standard deviation of deliveries compared
to forecasts (product subfamilies)
Sales Manager
Waste quality error statements from
reception (Waste converting and harmful
ingredients)
KAM
Customer Service Service promise Customer Service Manager
SCM Inventory levels Inventory manager
Storage forecast accuracy rate Inventory manager
S&OP team Balance actual vs forecast S&OP manager
Executed tasks from to do list on time S&OP manager
Data reliability Controller
Production Bunker Storage Plant manager
Emission limit exceedances Plant manager
Calorific Value
Product mix Plant manager / supply manager
Safety Safety Manager
Balance (treatment efficiency) Production Manager
Treatment forecast error ( relative and
absolute)
Production Manager
Plant stoppages Production Manager
Finance Cost per treated ton per product family
- Absorption cost
- Direct Manufacturing costs
Controller
Revenue Sales Manager
EBIT Operations Manager
Operational costs Operations Manager
Inventory costs SCM Manager
Cash flow
Sales’ KPIs are mostly linked to forecasting accuracy. In the end of the chapter 2.6 is presented
forecasting formulas, most of them are recommended for future KPIs. Forecasting error is calculated
with relative, absolute, mean and weighed mean error metric. It is essential to measure the volumes with
relative and absolute error metrics, because absolute error metrics describes the dimension relationships
better to the operations. As well as, mean and weighed describes how well the overall forecasting

70
efficiency. Volume growth, which is compared to budget, should be measured by customer specific and
aggregate level. To gain better understanding from markets unfilled demand, comparison to
unconstrained forecast is suggested as a KPI. Customer satisfaction is a key measure and its responsible
person is the top manager from sales.
Standard deviation towards forecast describes the forecasting and delivery efficiency. Operations can be
planned more effectively, if the deliveries are not fluctuating too much. Acceptable fluctuation was
determined from amount of truck deliveries to the plant area. Last measure is error statements from
reservation area, meaning that waste pre-knowledge has deficiencies. Waste type can be false, or harmful
ingredients can be incorrectly reported in preliminary knowledge. In case of incorrect waste quality,
production corrects the waste quality, and at worst, it could be steered to wrong process. Harmful
ingredients are, for example iodine, chlorine and mercury. In both cases reception would do an error
statement of foreknowledge.
Customer service is measured by service promise, which describes how the small collected deliveries are
fulfilled. These are as well measured with standard deviation and forecast errors in the sales metrics but
they are dealt as one group. Customer service manager is responsible for customer service metric.
SCM and S&OP team is measured with inventory levels, when the levels are high, it restricts the
production as capacity cannot be utilized. On the other hand, sufficient safety stock must be uphold. The
storage forecast accuracy rate is presented as second metric. Third metric is the monthly balance volume
and its forecast error. Forth metric is the tasks executed on time from previous month’s task list, which
obviously describes the S&OP process influence. Last metric is data reliability, which could be measured
with correction to master data and how other stakeholders feel they can trust on S&OP reports and the
numbers behind them.
Production is measured with bunker storage levels, when the storages are in sufficient level the proper
product mix can be prepared and treatment is significantly greater. For example, if storage level decreases
by 25 percentage to optimal storage level, production would increase by roughly 4 percentages in the
waste-to-energy pipeline. Second metric is emission limit exceedances, which describes the processing
manageability. The optimal calorific value allows grater treatment, if the calorific value decreases by one
unit towards objective value, treatment would increase by 8,5 percentages in a waste-to-energy pipeline.
It should be noted, that either bunker level nor calorific value can decrease under safety point. Right
product mix enables more fluent treatment and it correlates with the calorific value. Safety is always

71
considered and it is measured with near-miss situations and accidents. Treatment efficiency is compared
to budget figures with volume and percentages, because volumes depending on the pipeline affects
balances and percentages describes the line specific efficiency. Last measure is plant stoppages where
aspects like unplanned compared to planned stoppages, duration, timing should be measured.
Finance metrics are the KPI table’s last category, here cost per treated ton by product families and
subfamilies should be described. First operating costs should be investigated with traditional costing
method, where direct fixed and variable costs are allocated to families and subfamilies, and fixed and
variable overhead costs are allocated roughly afterwards. More advanced method would be activity based
costing, where overheads could be more accurately allocated to families and subfamilies. It is essential
to describe first the direct manufacturing costs separately from overheads so that the cost structure would
be understood. Basic financial business measures revenue and earnings before interest and taxes (EBIT)
are recommended, to illustrate how large the business and effective it is. Finally operational cost and
inventory costs should be tracked.
4.6 Evaluation of the process, and as-is and to-be state
Process section evaluation
Based on the theoretical success factors and important sections emerged from the empirical part of the
thesis, ten evaluation areas were defined, see table 17. In this chapter, the results from workshop are
illustrated. Workshop participators were from management, customer service and logistics, sales,
production, and environmental construction BU. Ten evaluation sections of the process were defined as
follows: process integration, demand planning, supply planning, stakeholders, meeting effectiveness,
performance improvement, decisions making, data accuracy, reporting, and technology support.
The participations were asked to evaluate the areas from scale one to five. Supporting the rating
participator were asked to justify the section’s rating according to what does work and what does not. To
evaluate the section significance towards stakeholder, the importance of the process’ section was defined
from scale one to five. The participators were also asked to propose concrete development ideas to those
section, which was felt important but was rated low. The workshop was facilitated at the end of the thesis
project, hence results describes the state of the process in the end of the thesis project. Whereupon the
results are used as ground pillars when creating future development aspects.

72
Table 17. Classification of evaluation areas by sections
Section Evaluation area
Demand planning 1. Demand planning
Supply planning 2. Supply planning
Structure of the process 3.1 Process integration
Structure of the process 3.2 Stakeholders
Structure of the process 3.3 Meeting effectiveness
Structure of the process 3.4. Decision making
Data and tools 4.1 Data accuracy
Data and tools 4.2 Reporting
Data and tools 4.3 Technology support
Performance measurement 5. Result tracking
Process integration: process optimizes decisions across business units, business areas and functions.
There is a clear defined meeting structure for the S&OP process. The meeting timings are in a logical
sequence so that information can flow through the process. Demand planning (waste inflow): proper
forecast accuracy enables accurate S&OP planning. Demand plans are reviewed at the appropriate BU,
geography and family level. Supply planning (Treatment capacity): right level of seniority and visibility
over the production resources are granted to identify reliable supply planning. Demand planning
represents an input to the supply planning, and gaps are actively identified. Stakeholders: all the relevant
stakeholders are represented at the meetings. The attendees at the meeting have the right level of
knowledge and seniority to meet the objectives of the meeting and take the necessary decisions.
Meeting effectiveness: time and effort are involved in the S&OP process results in value added results.
Roles and responsibilities are clearly defined. Meeting is able to perform contingency and effect analysis
for multiple scenarios. Result tracking/performance improvement: Actions agreed are tracked effectively
and relevant KPIs are followed to confirm the progress. Process is linked to financials and actions agreed
are partly based on cost awareness. Decision making: decision making is based on facts and decisions
are implemented effectively. Decisions result in accurate business outcomes. Data accuracy: data is up-
to-date and it bring value to decision making. Operations and other parts of the business trust the data
produced by S&OP, for example forecasts. Reporting: available reports support the decision making on
an appropriate level, for example detailed content, summaries, and graphs. Reports are robust and easy

73
to grasp. Technology support: current systems or IT tools support the S&OP process, for example data
gathering, data consolidation, and reporting.
Sales Department
Figure 20. Sales department’s section evaluation and importance
In figure 20 is presented sales departments evaluation of the process by rating and importance. Sales
department felt that forecasting was significantly improved, as well, the decision-making in the S&OP
meetings was experienced easier, because of the enhanced fact based calculations. S&OP process result
tracking was experienced successful. Meeting efficiency was seen effective and meaningless. In general,
S&OP process needs clarification to roles and relevancy of stakeholders. Universal understanding of
different stages of the process is not yet at the sufficient level nor coherent. Cost information was not at
adequate state to support decision-making. Information flow needs to be formalized with more uniform
process. Clearer S&OP roles and responsibilities of the sales and linking the cost information more
transparently to decision-making were suggested as improvement actions. As well as, control decisions
should be exported to ITS in order to foster the systematic process and share the information more
efficiently.
0
1
2
3
4
5
Processintegration
Demandplanning
Supplyplanning
Stakeholders
Meetingeffectiveness
Resulttracking
Decisionmaking
Data accuracy
Reporting
Technologysupport
Rating
Importance

74
Production
Figure 21. Production department’s section evaluation and importance
Figure 21. describes the production’s evaluation of the process in workshop. Production felt that S&OP
process produces tactical information, which gives a holistic overview. Meetings have a clear and
coherent agenda and produced analysis from the process is at good level. The process produces clear
decisions and control activities are followed efficiently. Though, production experienced that process is
lacking accurate and real time sales and production forecasts, as can be seen in demand and supply
planning evaluation sections. Other shortcomings were that linkage to operational S&OP was
insufficient, and there was no memo from control decisions. Production desired enhancement in
monitoring of tasks’ implementation. As well as, improvement in sales’ understanding of the waste
categories’ contaminant concentrations. Production required enough mandate to take decision in the
meetings.
Environmental construction business unit
Figure 22. Business unit environmental construction evaluation and importance
0
1
2
3
4
5
Processintegration
Demandplanning
Supplyplanning
Stakeholders
Meetingeffectiven…
Resulttracking
Decisionmaking
Dataaccuracy
Reporting
Technologysupport
0
1
2
3
4
5
Processintegration
Demandplanning
Supplyplanning
Stakeholders
Meetingeffectiveness
Resulttracking
Decisionmaking
Dataaccuracy
Reporting
Technologysupport

75
Treatment center business area experienced that demand planning works for controversial waste, the
process integration is in place, the meeting practice is well established, and meeting procedures and the
efficiency was experienced having a great start. These can be seen from the figure 22. Last the data
availability was experienced at good level and from its basis illustrative reports are created. On the other
hand, business unit experienced that longer term capacity planning should be developed and that the
utilization of cost information was at elementary stage. Improvement of information flow was as well
desired. Business unit represented that information flow and communication practices should be first
enhanced. Second, supply planning tool, where cost information and scenarios could be planned at detail
level, was introduced as developing aspect to the current process state.
Management
Figure 23. Management’s section evaluation and importance
Management, represented by the controller and head of oil business, experienced that the people involved
in the function scope are sufficient. Reporting graphs were felt robust, explicit, and easy to grasp. Which
is a positive result, as lots of resources were aligned into reporting development during the thesis project.
The responsibilities and roles were felt unclear. Also, the transparency to the waste streams, which are
not followed by S&OP was experienced unclear, nonetheless these should be followed. Cost awareness
should be applied to the process, and the ITS support, as well, reliability and timing of the data were
experienced rather weak. Management proposed that the following improvement activities: improve data
quality, in order to obtain the reliability of the decision-making. More controls to the systems and
accounting practices were suggested. As well as, enhancement the data quality by implementing proper
activities for all executed steering activities, these should be executed so that activities are registered into
0
1
2
3
4
5
Processintegration
Demandplanning
Supplyplanning
Stakeholders
Meetingeffectiveness
Resulttracking
Decisionmaking
Data accuracy
Reporting
Technologysupport

76
ERP. Managers experienced that reporting systems should be developed and their usage increased.
S&OP steering action should be also implemented to the knowledge of all business areas.
As-is and to-be state of the process
In the appendix 12. a chart is presented, which describes the objective state of process. In the upper x-
axis is presented the process phases, and in the y-axis is the stakeholder departments. Lower x-axis
presents the activity types performed by each department in each phase of the process, activities are
evaluated with pros and cons. As well as, related ITS in each phase of the process are described and
future recommendations are presented. Three types of activities are described in the chart, those which
were executed already before the restructuring, those which were developed during the thesis project,
and those which are the future recommended activities.
Process begins with S&OP function updating the data from previous S&OP. Afterwards the customer
based budget is brought manually to validation meeting, where sales gives its comments from new
prospects and cases. Here the cons are that changes in customer inflow are hard to detect, because of the
manual updating, as well the new customer cases are cumbersome to update. The subfamily based
forecasts are not validated often, so there are most probably distortions. Recommendation is to create a
sales department wide rolling quarterly forecast practice and link it automatically to S&OP process. The
tool used is Excel and everything is manually updated, future linkage to DP and CRM is recommended.
Validated and edited forecast from demand planning meeting functions as input for supply planning
meeting. Treatment budget is standard and so future recommendation to create a treatment forecasts
when treatment is not likely to meet the budget. Other inputs for the meeting are storage capacities of
environmental construction business unit and storage levels from other sites. Storage levels and
capacities are inputs for the supply planning meeting, where the cons are high storage levels, and that
data from external storage locations is hard to receive. Future recommendation is to make a quarterly
inventory, so that accurate data from external storage balances can be gained. Activity to plan storages
based on scenarios was established.
For the production, high fluctuation in daily waste volume is a con. Production plans the deliveries with
actual past data, as in process industry the volumes are standard so no further disaggregation of forecast
is needed. Actual data is from ERP and it is automatically updated, which is a pros. In the supply meeting

77
the created tools are validated and an initial plan created. Logistic is an operational function in S&OP
process, where the big volumes are managed effectively, though visibility to external logistic is varying.
As well as, interim storages and temporary storages utilization is in high level, this is considered as a
con.
In consensus phase meeting are prepared and scenarios tested once again. The scenario logic is primitive
and so a scenario management should be planned with more advanced tools. Planning could be supported
with APS. Further on the meeting is facilitated with help of task list and slideshow. Before
aforementioned suggestions, presented KPIs are recommended to be followed in the meeting and after
the meeting.
After the consensus phase balance estimates are put forward to evaluate investments opinions and output
to operative S&OP is given. Task list for next month is put into practice. Steering actions, use of external
treatment and storage output are given, though a lack of information from exceptional steering actions
was experienced by sales and customer service.
New activities should include report development, KPI follow-up and extension to other BU’s and as
well environmental construction areas family and subfamily follow-up, to gain better utilization of
materials between different processes and projects. Creating a formalized information flow map to
manage the inflow, product mix, storage levels and production is recommended.
Different ITS should be applied to S&OP process, currently process is heavy regarding to the manual
updating. First, demand planning phase should be planned in DP and the data accuracy of forecast should
be developed. Next step is to link sales funnel to S&OP with CRM. Information from supply planning
process is efficiently imported from ERP. Optimization and scenario management requires more
advanced logic, and further APS could support the decision making significantly. Last developing aspect
is to link the BI tool to support the data mining and reporting the actuals and forecasts, as well creating
different product planning aspects. As BI tool exist already, BI development is the first step after the DP
linkage and forecasting practice implementation. Before APS tools are implemented to support the
scenario management, it can be done temporarily in Excel.

78
4.7 State of S&OP in environmental management companies
Inquiry was sent to two Scandinavian environmental companies, see appendix 11. Key findings included
that generally all elements were in the S&OP process of both companies A and B. It was noticed that
company A had more detailed planning in the S&OP process viewing as well SKUs, on the other hand
company B had more coherent process than Case Company and company A, as company B integrated
finance more thoroughly with the process. (Inquiry)
Key findings from demand phase were that for company B sales department were not directly linked to
S&OP, when in Case Company A it was. For company B sales forecasting process were more structured
and inclusive, as they applied more frequent forecasting and included unconstrained forecasts. Company
A planned demand based on more statistical forecast and past actual data, as well company B felt that
sales is executing judgments to forecast effectively and S&OP process’ focus more in past data.
Although, both companies felt the same challenge in sales planning, it is a reactive process and for
gaining better forecasting accuracy it should be more proactive. (Inquiry)
Supply planning was following the same procedure for both companies, based on sales forecast,
treatment forecast was updated. Further, logistics are synchronized and modified around the updated
sales as well as treatment forecast. Both companies felt that endeavors to balance demand and supply
have been quite successful, and it has expanded the actual planning horizon substantially. (Inquiry)
Company B was measuring the process more deeply with financials than company A and Case Company.
Both companies felt that their S&OP process is in low maturity and they included one formalized monthly
meeting. Company A had BI tool for supporting the S&OP process, but it did not include input from
sales and Company B supported S&OP with Excel. (Inquiry)
For conclusion demand planning is felt most challenging part in the S&OP process and supply planning
can be managed quite well. Generally the process maturities were in low stage. To compare the Case
Company, company B had more mature S&OP process, as well the S&OP process for both inquired
companies was wider considering more BUs. It is notable that demand planning was felt as cumbersome
in both companies, so it is the biggest challenge for all companies. More proactive the sales forecasting
can be the more expanded the time horizon of operational planning will turn out.

79
5 CONCLUSION
In this chapter the objective of the research – to define the holistic state of the S&OP process in the Case
Company – is answered through two research questions, in order to sum-up the conclusions of the thesis.
These questions are answered based on the view point of six sections defined in the introduction chapter,
which are product planning groups, demand planning, supply planning, structure of the process, data
and tools, and performance metrics.
RQ1: What aspects are vital for S&OP process, which of these should be developed?
Generally S&OP process was experienced important, which can be seen from the conclusion chart, figure
23. On the other hand, some sections were experienced more important than others. The most important
elements were as follows:
- Supply planning
- Structure of the process – stakeholders, meeting efficiency and process integration
- Data and tools – technology support, reporting and data accuracy
- Demand planning
Figure 24. Stakeholders’ importance and performance analysis of S&OP sections
0
1
2
3
4
5Process integration
Demand planning
Supply planning
Stakeholders
Meeting effectiveness
Result tracking
Decision making
Data accuracy
Reporting
Technology support
Conclusion
Rating Importance

80
It can be seen that decision making, reporting and demand planning scored the lowest in importance
evaluation, nevertheless they were still experienced important as none of them were rated beneath four
except decision making. Decision making was the least important for the S&OP process, which is a
positive result, taking into account that stakeholders understand that the S&OP process is not itself
making the decisions, rather it gathers the functions together, which have the pre-eminent knowledge to
make the decisions. Hereinafter the six sections are commented and their stage of relevancy and urge of
improvement illustrated.
Product planning groups
Developing aspect of S&OP product planning pipelines were identified when S&OP process was
planning at three different levels – product family level, subfamily level, and treatment pipeline level.
Currently the S&OP process is planning, depending on the four families, at three different scopes. These
are the best planning levels for each family, albeit in order to gain deeper knowledge of the balances
between different subfamilies and families, modeling of planning groups needs to be done. It is essential
to be able to define the desired planning scope, either product family, subfamily, or pipeline based scope,
depending the ongoing case. For example, this can be applied on the more efficient storage planning of
liquid wastes.
Demand planning
Demand planning has been a big challenge in the S&OP process, because the whole demand planning
function lacked a formalized process. Although, demand planning was rated lowest with supply planning,
data and tools, and process structure sections. A large gap in between the rating and importance of the
process indicates the necessity of the demand planning phase development. Demand plan was updated
once a year by sales department and linked to S&OP. Judgmental adjustments were made when new
information occurred in the S&OP process. Nonetheless, the key point is to get the information outside
into the S&OP process. A lack of ownership towards the sales forecasts in S&OP process was
experienced to be imminent.

81
S&OP process should be the cross-functional information deliver between departments. Based on the
interview 3. sales department experienced that S&OP process has not succeed in transferring information.
Forecasting customer demand has not been formal process and it is partly understood. In the thesis
project, S&OP function clarified forecasting methodologies and established a demand planning meeting,
where customer forecasts were manually updated to spreadsheets. S&OP function did not manage the
forecasts in DP, it had manually updated volume based forecast for each planning group.
Supply planning
Substantial gap between the rating and importance of supply planning was identified. The stakeholders
expected that treatment budget should be updated more frequently. Manufacturing department does a
manufacturing budget once a year and it is adjusted rarely depending on the rundowns, major shortfalls
or surpluses of inflows. On the other hand, the key point was to run at full capacity and find external
capacity when needed. S&OP was looking mainly actual processing amounts and forecasts were not in
such an important role. This should be improved so that production would adjust forecast for the use of
S&OP process.
Daily challenges in waste-flow were identified, supply challenges were mostly due to uncontrolled
inflow, and supply side desired a better signal from operative issues to sales department. Manufacturing
department experienced that resource allocations were difficult to manage due to unknown fact of daily
waste inflow volumes. Deficiencies in waste foreknowledge were identified and contact surface was
experienced unclear. S&OP function was not experienced as a function for communication between sales
and production departments, and especially sales experienced lack in transparency to exceptional steering
decisions and reception locations.
Structure of the process
S&OP process was functioning and managing information at the lower waste volumes, as volumes
increased more resources to S&OP process were needed. S&OP participant gathered once per month for
executive meeting, and other S&OP related work was done informally. Lack of S&OP linkage to
operational level and especially to sales steering was identified and the challenges were noticed at the
plant site as well.

82
Structure of the process – stakeholders, meeting efficiency, decision making and process integration –
was evaluated high in importance, although lots of improvement aspect were presented towards the
sections. The importance of the process structure was evaluated highest with the supply planning section.
Gaps between the importance and rating in stakeholders, meeting efficiency and process integration
evaluation areas can be noticed from the figure 23. Structure of the process is the cornerstone of the
seamless information flow. It is a vital improvement area to be executed at the first step, as it does not
require major effort compared to ITS, demand planning and supply planning. Decision making in the
S&OP process was generally experienced working efficiently. Although, the linkage to operations and
implementation had room for improvement. The practices how to record actions into ITS were unclear,
resulting errors in master data. This is a process aspect as the practices have to be illustrated and
distributed, to all stakeholder participating into the process either indirectly or directly, to secure that
everyone knows what are the right steps to implement the actions.
More streamlined tasks executing and task monitoring was hoped from the S&OP process. This might
been a miss evaluation as S&OP mission is not do the actual execution of the task, rather give the signals
to stakeholders at operative level, what should be done. On the other hand, S&OP process did not fully
understood how these actions should be implemented, which will support the analysis according to deficit
in the authentic control.
Data and tools
Development of Excel tools was started at the beginning of the thesis project. This can be seen in the
figure 23. as the reporting has been rated highest with result tracking and decision making. Visualization
and development of the Excel tools gained results. Nonetheless, data accuracy did not correlate with the
Excel tool development and this can be seen as gap between importance and rating. Reports were updated
manually and so the process output was lacking a real time data. This can be noticed in data accuracy
evaluation section. Sales and operations process needs improvements in overall data. In addition tools,
which support demand and supply planning, have to be developed. S&OP workbench should be
visualized and put forward with real time data. It was experienced that usage of Excel sheets is hard to
gasp among the participators. The following improvement aspect arose during the thesis project.

83
- Improve data quality
- Create a top-down and bottom-up function
- Improvement of forecast generation and linkage
- Scenario management
- Optimization
- Storage planning function
- Visualization
- Report development
Performance measurement
Process was measured with few KPIs – absolute and relative forecasting error metrics were used for
inflow and treatment. During the clarification work several stakeholder specific KPIs were identified.
Overall S&OP was following forecasting errors and variances, stakeholders experienced that result
tracking was in a good base, scoring almost the highest points. Stakeholders experienced that signals
from S&OP were sufficient when balances were going to get imbalanced. For the conclusion S&OP
process was following the metrics competently, on the other hand the metrics scale was not wide enough
to track the every part of the process.
RQ2: What are the future recommendations for the Case Company?
Recommendations towards every section are presented while answering the research question 2. These
recommendations are evaluated by the implementation benefit and resource requirement. The urgent and
easily implemented improvement recommendations should be executed firstly. New project plan for the
developing aspects to eight months were created based on the benefit, resource requirement and rating.
Prioritization matrix is presented in the figure 24. The matrix was built with the S&OP team based on
the stakeholders’ importance and performance analysis of S&OP sections. There are four types of
suggestions in the matrix.
1. Implement now – where resource requirement is low and the benefit high
2. Quick gain – resource requirement and achievable benefits are low

84
3. Question – which resource requirement is high and achievable benefit low, relevancy of the area should
be challenged
4. Long-term – which implementation requires lots of effort and the possible gain is high
Figure 25. Prioritization matrix
The development areas, which do not require as much resources are implemented first and afterwards
mostly ITS related development is put into place. It is important to prioritize the development according
to potential and less effortless actions – implement now suggestion. Efficiency of the resource allocation
to the next step of the developing process has to be profoundly considered.
Product planning groups
Product planning groups have to be developed, though it is not the first development aspect, as can be
seen the benefit is medium and the resource requirement high. This development would go along with
ITS implementation.
In the product planning groups first steps are to disaggregate the product family level A – making a drop-
down function for family A to subfamily level. Second step is to aggregate families B and C – making a
bottom-up function from subfamilies to product families B and C. These subfamilies and families should
be observed simultaneously and seamlessly without separate effort on consolidating and disaggregation.
As well as¨, possibility to choose desired planning scope depending on the ongoing case, for example
two treatment pipelines together. Third step is to extend the observed families to other processes.
Product planning groups P. Product planning groups
Demand planning 1. Demand planning
Supply planning 2. Supply planning
Structure of the process 3.1 Process integration
Structure of the process 3.2 Stakeholders
Structure of the process 3.3 Meeting effectiveness
Structure of the process 3.4. Decision making
Data and tools 4.1 Data accuracy
Data and tools 4.2 Reporting
Data and tools 4.3 Technology support
Performance measurement 5. Result tracking
Resource requirement
Implementnow
Be
ne
fit
Long term
QuestionQuick gain
P
3.1
3.2
3.3
3.4
1.
2.
4.2
4.1
4.3
5.

85
Connection enabling the observation of these dependencies on the treatment pipeline, should be applied
afterwards. This classification goes hand in hand with the master data and tool development. Perspective
of the product planning group should be evaluated in the process before the system development, so that
participants truly understand the planning scope and levels of the process.
Demand planning
Demand planning is a long-term suggestion as lots of people have to be involved, and new process and
ITS should be implemented to support the holistic integration to S&OP process. Suggestions are
presented in the table 18. Investigation of the dependences between ERP actual deliveries and DP tool
forecasts have to be initiated to enable future linkage of DP forecast to S&OP tools. Forecasting
ownership should be shifted explicitly to sales department. Forecasting should be extended from 12
months to 24 months to gain more insight into the future. It is desirable to get to the state that sales
department would create the unconstrained forecast, not the S&OP function. Sales department is
establishing a forecasting process, where all KAMs are participating in quarterly updated forecasts in
BP. To get deeper understanding in prospects the CRM data should be linked to S&OP tool, to work as
a prospect input for the process. To sharpen the demand planning process, correlation tests, which
compare the relationship between the order intake and macro economic indicators, could be applied.
Table 18. Recommendations for demand planning
Forecasting frequency Rolling quarterly, 24 months time frame
Forecasting types Constrained and unconstrained
Statistical rolling yearly, adjustments if new
information occurs at pre-meeting otherwise
statistically forecast rolling quarterly and
afterwards adjustments
Demand correlation test Compare demand actuals to example indexes to
develop the statistical forecast generation
Process Explicit ownership to sales
Supply planning
Supply planning is a long-term activity, though the effort of implementation is not as high as ITS. Supply
planning recommendations into the future are presented in table 19. Budgeting period should be more
frequent than once a year. Production forecast adjustments should be done quarterly, to provide more

86
accurate balance and inventory planning. More scenarios could be added to balance charts, for example
the optimistic, pessimistic and trend forecast generation. As well as, scenario possibilities could be
applied to aggregate balance chart. S&OP, operations, and production team experienced that it is
necessary to continue and expand the subfamily based balance calculations inside the factory, as it
validates the subfamily based balances in disaggregate level. Inventory planning should be enhanced
especially external storage locations have been challenging to monitor, future recommendation is to
establish a quararly inventory practice. As well as, scenarios should be applied to stock forecasts.
Information flow challenges should be tackled in supply planning process, especially operative actions
to logistic and customer service were unclear.
Table 19. Supply planning recommendations into the future
Budget Start more frequent production forecasting
(quarterly)
Balancing supply and demand expand scenarios
Balances inside factory area expand disaggregate balance calculation to all
planning groups and subfamilies
Inventory planning Enhance inventory planning
External storages, quarterly inventories
Estimated possibility percentages in different
scenarios, volatility indicators, apply pessimistic
scenario
Information flow Develop a clear information flow practice to
operations especially to logistic and customer
service.
Structure of the process
Structure of the process development should be started firstly, as the implementation effort is not high
and the potential benefits are significant. When the entire process is defined other section implementation
can be executed, every participant has to understand the basic idea of the process. Future educations and
promotion are recommended, so that generally S&OP process is well known function among in the Case
Company. Stakeholder did not experience that the process was formalized, task changing was felt
challenging as the boundaries between the information flow via stakeholders was indistinct. Stakeholders
did not entirely know what are their roles in the S&OP process, and which phases of the process their
input was required. Information was changed informally, so future recommendation is to define every
part of the process clearly to stakeholder, how actions are put forward, and which information should be

87
delivered to the process. Demand and supply planning meeting should be established, in which the
stakeholders can give their specified input to the process.
Data and tools
Data and tools are long-term developing suggestion, as definition and implementation requires still a
great amount of resources. Recommendation is to develop the DP platform for sales forecasting and
further on change the Excel tool to BI software. After this a supply planning tool should be implemented
to support the optimization and scenario creation in the supply planning phase.
- Manage forecast in demand planner tool
- Develop business intelligence tool to replace Excel
- Apply supply planning tool
At the gained maturity S&OP tool should be able to describe and switch the operation sites depending
on the ongoing case. This should be done in BI system rather than heavily in Excel, as planning objectives
could be easily changed depending on the ongoing case.
Forecast generation from past last year’s trend and seasonality were generated. Seasonality trend was
calculated based on the last year’s seasonality trend and the sales forecast. Seasonality forecast created
in the tool was replacing seasonality forecast from DP improvement developing aspect is creating the
linkage between the S&OP tool and the sales forecasts in DP with SQL and Ms Access. Afterwards the
linkage to CRM system to integrate the prospects and sales funnel more profoundly into the process.
Initially S&OP process did not have scenario management tool. Scenario conceptualization and reason
cause relationships were tested and investigated with Excel. Scenarios were tested on the demand forecast
differences – prospects, trend forecasts, customer specific and baseline forecasts – and the correlations
to storage planning were tested. Future step is to link the scenario planning to financials and to
environmental construction products, so that the cost effect solutions can be evaluated and logistic related
products planned more effectively. Scenario management should be executed in the APS, as the
optimization and calculation logic is insufficient in Excel.

88
Performance measurement
Suggested performance metrics are presented in the chapter 4.5 departments, which result monitoring
should be developed are sales, production, SCM, customer service, S&OP function and finance.
Performance measurement suggestion was evaluated in between implement now and long-term. It is
more an implement now suggestion, as enormous potential benefits can be gained by linking financials
into S&OP process. Every stakeholder participator in workshop felt that financials should be linked to
the process immediately. This can be implemented in parallel with process structure developing.

89
6 SUMMARY
Objective of the thesis
Thesis objective was to explore extensively the S&OP process content of the Case Company. Objectives
are categorized to seven different groups. First, process related planning groups are observed. Second,
demand management’s role in the S&OP process is clarified. Third, supply management role in the
process is investigated. Fourth, process structure efficiency is evaluated. Fifth, objective is to clarify how
the entire process should be monitored. Sixth, which information technology system (ITS) features the
process requires. Last, Case Company’s entire S&OP process is compared to theoretical success factors.
Financial aspect of the S&OP process is not part of the thesis.
Literature review was done from the written material of the subject and the empirical part of the thesis
was executed as qualitative research. Qualitative research methods used were active participant
observation, qualitative interviews, enquiry, education and a workshop held in the end of the thesis
project. Different interviews were conducted for management, sales, operation, customer service, and
treatment centers business area. Interviews were held in the beginning of the thesis project. An inquiry
was sent to two environmental management companies in Scandinavia. Questionnaire was answered by
persons who are responsible for companies’ S&OP process. Workshop was facilitated in the end of the
thesis project, key stakeholders were participating to both interviews and workshop.
Theoretical findings
Design team will take care of all the process workings. Suggested a group of six people, which include
roughly top management leader, a person from IT, demand planner, operation planner, a person from
accounting, a person from sales. S&OP process is 60 percent change management, 30 percent process
development and 10 percent technology. Senior executives often end up with a fallacy of change
management, after they discover that S&OP is more getting right kind of information in exact time rather
than a practice of change management.
Change management leads to renewed processes by taking small and tangible steps in the organization.
Educating everyone involved does not mean that top tittle persons have a good S&OP knowledge, so
everyone who affects the S&OP output should be educated. Successfully developed S&OP process

90
cannot be long-lasting without proper process governance, which begins with planning, defining who
will do what, when, where, how and why. It is important that different people are required to improve
the process and the process is constantly evaluated. It is essential that everyone knows the S&OP process
dates and what duties and inputs is expected from one another.
Information should be accurate but it does not need to be precise. Information should be in a usable and
focused format, which means getting the right data in a timely manner. Unconstrained forecast should
start the process with all demand impacts included. Someone in top management, who have the authority
to commit resources, must get involved into the S&OP process. Someone who can design, finance, tie
input, advocate and lead it, as well inspire and teach the usage of the process to the top management.
Analytics helps S&OP process to become more effective and cognizant of scenarios. Analytic-based
reports inform the leadership what is the S&OP balancing. Actions needs to be executed and managed
through tactical and operational S&OP. From previous decisions results and trends can be seen, as well
as what corrective control actions needs to be done. The ERP system must be driven by the outputs of
S&OP, so that detailed day-to-day decisions are synchronized with the aggregate decisions made in
S&OP process. Process design is experienced as a key to success.
In the first half a year meeting mechanisms, formats, data accuracy, reports, and learning are consuming
lots of time and these requires typically lots of improvements. Continuous improvement is crucial,
because development ideas will come from the participants of the process, minor improvement does not
generally require major capital investments. Attendance is one of the most important keys to success, as
well as monitoring the tasks allocated in the meetings. Present progressive time-horizons is a success
factor. Effective time and resource usage should be allocated to exception-based decision making. Also,
accurate forecast reduces working capital and inventory, and enhances customer experience and
revenues.
Initial state of the company
Waste volumes have increased almost by half from 2010. S&OP process was functioning and managing
information at the lower waste volumes. Although, as volumes increased, more resources to S&OP
process were needed. S&OP process was mainly once a month meeting, where attendance percent was
varying. Lack of S&OP linkage to operational level and especially to sales steering was identified. The

91
challenges were noticed as well at the plant site. The current situation in the S&OP meetings are that
participants are re-defining boundary conditions and the control actions are performed in the absence of
accuracy and transparency. One of the key missions was to guide the process from event based
philosophy to more advance planned process, where the number of events declines.
Product planning groups scopes are subfamily, family and treatment pipeline, based on the business area.
Demand was planned by yearly updated sales forecasts. Towards the end of the year forecasts were
constrained and judgmentally adjusted, by the S&OP manager. Demand planning has been the biggest
challenge in the S&OP process, because the whole demand planning function lacked a formalized process
and sales department did not own the S&OP demand forecasts. Manufacturing department does a
manufacturing budget once a year and it is adjusted rarely depending on the shortfalls or surpluses of
inflows. S&OP was looking mainly actual processing amounts and forecast were not in such an important
role. When steering decisions were changed, customer service experienced challenges in information
flow. S&OP maturity is low as the formalized information flow in the process was not clarified. All
relevant stakeholders did not know what their roles are in S&OP process. S&OP process was managed
with Excel sheets and task lists. Manual updating have been one challenge for the S&OP process. Tools
lacked a visual big picture and participators felt that adopting the tool was laborious, as well master data
errors were identified through the thesis project.
Empirical findings
Empirical findings are presented in two different tables. First the research question “What aspects are
vital for S&OP process, which of these should be developed?” is answered in the table 20. Second
research question “What are the future recommendations for the Case Company?” is answered in the
table 21. Research question are answered by the segmentation defined in the begging of the thesis –
product planning, groups, demand planning, supply planning structure of the process and performance
measurement

92
Table 20. Answer to research question one
RQ1: What aspects are vital for S&OP process, which of these should be developed?
Product planning groups
- Development aspect of product planning
groups
- Efforts planning with different scopes
- Hand in hand with ITS development
Demand planning
- Importance is high but it is not working at
desired level
- Sales does not own the S&OP forecast
- Not frequent enough
- Roles and process are unclear
Supply planning
- Importance is high but it is not working at
desired level
- Treatment budgets are not updated frequently
enough
- Roles and process are unclear
- S&OP was looking mainly actual processing
amounts and forecasts were not in such an
important role
- Stronger signal to operations
- Lack in transparency to exceptional steering
actions
Structure of the process
- Importance is high but it is not working at
desired level
- Lack in linkage to operational level
- Information flow challenge
Data and tools
- Importance is high but tools are heavy
- Endeavors done during the thesis project to
visualization and reporting, can be seen in
stakeholder increased satisfaction towards
reporting section
- Improve data quality
- Create a top-down and bottom-up function
- Improvement of forecast generation and
linkage
- Scenario management
- Optimization
- Storage planning function
Performance measurement
- More stakeholder specific KPIs
- Ownership of KPIs
- Stakeholders were satisfied to result tracking
- KPI scale is not wide enough

93
Table 21. Answer to research question two
RQ2: What are the future recommendations for the Case Company?
Product planning groups
- Benefit is medium and the resource
requirement high
- Disaggregate product family level A
- Aggregate families B and C
- Extend the observed families to other
processes
- Possibility to choose desired planning
scope depending on the ongoing case
(family, subfamily, pipeline)
Demand planning
- Long-term – achievable benefit is high and
the resource requirement high
- Rolling quarterly, 24 month time frame
- Establish a link to S&OP tool
- Adjustments automatically to S&OP
process
- Link the sales funnel and KAMs to the
process with formalized practice (quarterly)
- Demand correlation tests
- Explicit ownership to sales
Supply planning
- Long-term –benefit is high and the resource
requirement high
- Start more frequent production forecasting
(quarterly)
- Expand scenarios
- Expand disaggregate balance calculation to
all planning groups and subfamilies
- Enhance inventory planning
- External storages, inventories
- Clear information flow to operations
especially to logistics and customer service
Structure of the process
- Implement now – resource requirement is
low and the benefit is high
- Promote the S&OP process and educate
everyone involved
- Formalize the process
- Establish demand and supply planning
meetings
- Create information flow map
Data and tools
- Manage forecast in demand planner tool
- Develop BI tool to replace Excel
- Apply supply planning tool – manage
scenarios in advanced planning system
Performance measurement
- Start measuring and commit ownership
o Sales (relative and absolute error,
unfilled demand, deviation, waste
quality errors)

94
o Production (Bunker storage levels,
emissions, calorific value, product
mix, safety, balance, forecast error
metrics)
o S&OP team (Balance error metrics,
executed tasks, meeting
attendance)
o SCM (inventory levels, storage
forecast error)
o Customer service (Service
promise)
o Other business areas
- Apply financial metrics to enhance cost
awareness
o Cost per ton
o Revenue
o EBIT
o Operational costs
o Inventory costs
o Cash flow
End words
In general, S&OP is a continuous improvement process, in which yearly updates and evaluations
stakeholder from more structured analyze are vital for the process enhancement. The thesis project has
improved reporting significantly, although there is lots of development areas in change management and
process governance. Everyone whose work affects the S&OP process should be educated and clear roles
defined. These have been one of the success factors in theoretical findings, which point out that the Case
Company has to start developing more formalized S&OP process. Afterwards resources should be tied
to demand and supply planning, and ITS development.
S&OP enables the connection from strategic to the operational planning. Master production schedule
should be executed in a disaggregation form. Aggregate units, outputs of tactical S&OP, are used as
inputs when modifying more detailed MPS. Case Company’s S&OP outputs were not always used as
inputs for detailed planning, as the supply and demand forecast were updated only once a year. This
resulted as unsynchronized operation and sales. In practice this was seen as uncontrolled material flows
to plant area. It is important that basics of the S&OP are working. During the thesis project aggregated
S&OP volumes were updated as the disaggregated volumes were changed, although the input should first
come from S&OP to detailed planning. S&OP is not going to succeed without the proper linkage to the

95
detailed planning. It is much easier to deal with the mix issue, if volume is managed effectively. Mix
complication becomes immediately more unmanageable, if the volume is not planned well.
To compare S&OP process in other environmental management companies in Scandinavia, demand
planning was felt most challenging part in the S&OP process and, on the other hand supply planning can
be managed quite well. Generally the process maturities were in a low stage. To compare the Case
Company; company B had more mature S&OP process, as well as the S&OP process for both inquired
companies was wider considering more BUs. It is notable that demand planning was felt cumbersome in
both companies, so it is most probably a big challenge in environmental management companies. More
proactive the sales forecasting can be, the more expanded the time horizon of operational planning will
turn out. In the theory S&OP is at low maturity when it is reactive, meaning that supply chain is driving
the process with a strong sales bias leading to imbalance, and when lack of clarify to the goal of S&OP
is seen. This is one of the challenges what companies face, if they do not practice continuous
improvement and change management. S&OP easily drifts to reactive state, if resources are not allocated,
clearly defined team established, and participators’ responsibilities clarified.
The ERP system must be driven by the outputs of S&OP, so that detailed day-to-day decisions are
synchronized with the aggregate decisions made in S&OP process. Process design is experienced as a
key to success. Generally, when manufacturing industries face rapid growth process governance and
participators’ roles can be set besides unintentionally. Main demand shaping tool for chemical industry
is price management and it plans to sell excess capacity in lean times and profitably allocate capacity in
high season. In the Case Company’s S&OP process price management was not presented, although as
the maturity develops more cost awareness can be gained.
In the theory surveyed companies are not seeing the benefits they expected from S&OP software,
although they spent enormous amounts of money to S&OP software. This is because many did not change
the process for fully leverage the enabling technology. The ERP system must be driven by the outputs of
S&OP, so that detailed day-to-day decisions are synchronized with the aggregate decisions made in
S&OP process. The Case Company has to be conscious when implementing new software to support
S&OP process. Software are not by itself solving any challenges, after the process structure, roles and
activities are working horizontally and vertically seamlessly, software implementation should be
surveyed. This study proves that the theory applies for the Case Company as well, and other companies

96
which have S&OP at the first maturity stages, should first focus on the development of the own process
governance and information flow.
It would be interesting to study future investigation about the demand planning phase; how the waste
fractions convert, and what are differences between sales and production cycle? These are the question,
which should be pondered in the future study. Different correlation test and forecasting technic could be
applied to the investigation. In addition, it would be fascinating to launch detailed supply planning
investigation considering scenario managements opportunities compared to financial benefits. For
example, the presented KPIs in the empirical part of the thesis, should be monitored during the
implementation process. Hereby, the return on the investment from the acquired software could be
studied.

97
REFERENCES Books
APICS Dictionary 2013, The essential supply chain reference 14th Edn, Amer Production & Inventory,
132 p.
APICS, 2007, Using Information Technology to Enable Supply Chain Management, APICS Certified
Supply Chain Professional Learning System, The Association for Operations Management, Alexandria,
VA
Armstrong, S. J. 1985, Long-range Forecasting: From Crystal Ball to Computer: From Crystal Ball to
Computer, 2nd edn, John Wiley & Sons Inc, New York, p. 688 ISBN: 978-0471823605
Chermack, T. 2011, Scenario Planning in Organizations: How to Create, Use, and Assess Scenarios,
San Francisco, Berrett-Koehler Publishers Inc, 288 p. ISBN: 978-1605094137
Cohen, S & Roussel, J. 2004, Strategic Supply Chain Management: The Five Disciplines for Top
Performance. NY, United States of America, McGraw-Hill. 316 p. ISBN: 0-07-143217-5
Dougherty J.D. & Gray, C.D. 2005 Sales and Operations Planning – Best Practices: Lessons Learned
From Worldwide Companies. Victoria, BC, Canada, Trafford Publishing. 321 p. ISBN: 1-4120-8210-2
Jonsson, P. & Mattsson, S-A. 2009, Manufacturing, Planning and Control. London, McGraw-Hill
Higher Education. 488 p. ISBN: 978-0077117399
Kaplan, R.S. & Norton, D.P. 1996, The Balanced Scorecard: Trasnlating Strategy into Action. Boston,
Harvard Business School Press.329 p. ISBN: 0-87584-651-3
McQuarrie, D.A. 2000, Statistical Mechanics. California, University Science Books. 641 p. ISBN 1-
891389-15-7
Palmatier, G.E. & Crum, C. 2003, Enterprise sales and operations planning: Synchronizing demand,
supply and resources for peak performance, J. Ross Publishing, 266 p. ISBN: 978-1932159004
Proud, J.F. 2007, Master scheduling: A practical guide to competitive manufacturing, 3rd edn, John
Wiley & Sons, 688 p. ISBN: 978-0471757276

98
Sanders N.R. 2013, Definitive Guide to Manufacturing and Service Operations, The: Master the
Strategies and Tactics for Planning, Organizing, and Managing How Products and Services Are
Produced, 1st edn, Pearson FT Press. 192 p. ISBN: 978-0-13-343864-2
Sheldon, D.H. 2006, World class sales & operations planning: a guide to successful implementation
and robust execution. J. Ross Publishing. 226 p. ISBN 978-1-932159-53-0
Wallance, T.F. & Stahl, R.A. 2008, Sales & Operations Planning: The How-To Handbook, 3rd edn,
T.F. Wallance & Company. 224 p. ISBN: 978-0-9674884-5-5
Waters, D. 2003, Inventory Control & Management, 2nd edn, Chichester, West Sussex, England, John
Wiley & Sons. 406 p. ISBN: 0-470-85876-1
Vollman, T.E Berry, W.L Whybark, D.C. & Jacobs, F.R. 2005, Manufacturing planning and control
systems for supply chain management: The definitive guide for professionals, 5th edn, McGraw-Hill.
598 p. ISBN-13: 978-0071440332
Articles
Armstrong, J. S. & Collopy F. (1998), Integration of statistical methods and judgment for time series
forecasting: Principles from empirical research, Forecasting with Judgment, pp. 269–293
Bower, P. (2005), 12 most common threats to Sales and Operations Planning process, The Journal of
Business Forecasting, Vol. 24 Issue 3 pp. 4–14
Bower, P. (2006), How the S&OP process creates value in the supply chain, The Journal of Business
Forecasting, pp. 20–32
Boyer, J.E. (2009), 10 Proven Steps to Successful S&OP, The Journal of Business Forecasting, Vol. 28
Issue 1 pp. 4–10
Cecere, L. Barrett, J. & Mooraj, H. (2009), Sales and Operations Planning: Transformation from
Tradition. Industry Value Chain Strategies, ARM Research, pp. 1–9
Charantan, I. & Sandeep, G. (2013), Building Blocks for Successful S&OP, Supply Chain Management
Review, Vol. 17 Issue 6 pp. 10–17

99
Chen-Ritzo, C.H. Ervolina, T. Harrison, T.P. & Gupta, B. (2010), Sales and operations planning in
systems with order configuration uncertainty, European Journal of Operational Research, Vol 205 Issue
3 pp. 604–614
Dwyer, J. (2000), Box clever with planning, Works Management, Vol. 53 Issue 4 pp. 30–32
Feng, Y. D’Amours, S. & Beauregard, R. (2008), The value of sales and operations planning in
oriented strand board industry with make-to-order manufacturing system: Cross functional integration
under deterministic demand and spot market recourse, International Journal of Product Economics,
Vol. 115 pp. 189–209
Grimson, J. A. & Pyke, D. F. (2007), Sales and operations planning: an exploratory study and
framework, The International Journal of Logistics Management, Vol. 18 Issue 3 pp. 322–346
Hope, J. & Fraser, R. (2003), Who needs budgeting, Harvard Business Review, Vol. 81 Issue 2 pp.
108–115
Hyndman, R. J. & Koehler, A. B. (2006). Another look at measures of forecast accuracy, International
Journal of Forecasting, Vol. 22 Issue 4 pp. 679–688
Hyndman, R. J. (2006), Another look at forecast-accuracy metrics for intermittent demand, Foresight:
The International Journal of Applied Forecasting, Vol. 4 Issue 4 pp. 43–46
Ivert, L. & Jonsson, P. (2010), The potential benefits of advanced planning and scheduling systems in
sales and operations planning. Industrial Management & Data Systems, Vol. 110 Issue 5 pp. 659–681
Lapide L. (2005), S&OP maturity model, Juornal of Business Forecasting, Vol 24 pp. 15–28
Lapide, L. (1998), A simple view of top-down versus bottom-up forecasting, The Journal of Business
Forecasting, Vol. 17 pp. 28–29
Lapide, L. (2002), New Developments in Business Forecasting, The Journal of Business Forecasting,
Vol. 21 Issue 2 pp. 11–14
Lapide, L. (2004a), Sales and Operations Planning Part I: The Process, The Journal of Business
Forecasting, Vol. 23 Issue 3 pp. 17–19
Lapide, L. (2004b), Sales and Operations Planning Part II: Enabling Technology, The Journal of
Business Forecasting, Vol. 23 Issue 3 pp. 18–20

100
Lapide, L. (2006a), Top-down & bottom-up forecasting in S&OP. The Journal of Business Forecasting,
Vol. 25 Issue 2 pp. 14–16
Lapide, L. (2006b), Demand Management revisited. The Journal of Business Forecasting, Vol. 25 Issue
3 pp. 17–23
Lapide, L. (2014), S&OP: The Process Revisited, The Journal of Business Forecasting, Vol. 33 Issue 3
pp. 12–16
Makridakis, S. (1993), Accuracy measures: Theoretical and practical concerns, International Journal of
Forecasting, Vol. 9 pp. 527–529
Melnyk, S.A. Stewart, D.M. & Swink, M. (2004), Metrics and performance measurement in operations
management: dealing with the metrics maze, Journal of Operations Management, Vol. 22 Issue 3 pp.
209–218
Mentzer, J. T. & Moon M. A. (2004), Understanding Demand, Supply Chain Management Review,
Vol. 8 pp. 38–45
Meyr, H. Fleischmann, B. & Wagner M. (2005), Structure of Advanced Planning Systems, Supply
Chain Management and Advanced Planning, pp. 81–105
Milliken, A.L. (2008), Sales & operations planning: Building the foundations, The Journal of Business
Forecasting, Vol. 27 pp. 4–12
Muzumdar, M. & Fontanella, J. (2006), The Secrets of S&OP Success, Supply Chain Management
Review Vol. 10 Issue 3 pp. 34–41
Nakano, M. (2009), Collaborative forecasting and planning in supply chains: the impact on
performance in Japanese manufacturers, International Journal of Physical Distribution and Logistics
Management, Vol. 39 Issue 2 pp. 84–105
Olhager, J. & Selldin, E. (2007), Manufacturing planning and control approaches: market alignment
and performance, International Journal of Production Research, Vol. 45 Issue 15 p. 1469–1484
Olhager, J. Rudberg, M. & Wikner, J. (2001), Long-term capacity management: Linking the
perspectives from manufacturing strategy and sales and operations planning, International Journal
Production Economics, Vol. 69 pp. 215–225

101
Payne, T. (2011), Stage 3 S&OP Reference Architecture, Gartner Research, ID number: G00211017,
pp. 1–6
Sanders, N. R. & Manrodt, K. (1994), A survey of current forecasting practices in US corporations,
Interfaces, Vol. 24 Issue 2 pp. 92–100
Sanders, N. R. & Ritzman, L. P. (2001), Judgmental adjustment of statistical forecasts, In Principles of
forecasting, Vol. 30 pp. 405–416
Schorr, J. E. (2007a). Integrated Business Management, Business Excellence, June, pp. 8–11
Schorr, J. E. (2007c), The demand review, Business Excellence, September, pp. 8–11
Schorr, J. E. (2007d). The supply review, Business Excellence, October, pp. 8–11
Singh, M. K. (2010), What Makes a Winning S&OP Program, Supply Chain Management Review,
Vol. 14 Issue 3. pp. 22–27
Slone, R. E. (2004), Leading a supply chain turnaround, Harvard Business Review, Vol. 82 Issue 10
pp. 114–121
Smith, L. Andraski, J.C. Fawcett, S.E. (2010), INTEGRATED BUSINESS PLANNING: A Roadmap
to Linking S&IO and CPFR, Journal of Business Forecasting, Vol. 29 Issue 4 pp. 4–13
Thome, A.M.T. Scavarda, L.F. Fernandez, N.S. & Scavarda, A.J. (2012), Sales and operations planning
and the firm performance, International Journal of Productivity and Performance Management, Vol. 61
Issue 4 pp. 359–381
Ventana Research, 2006. Sales and operations Planning: Measuring Maturity and Opportunity for
Operational Performance Management. Ventana Research, San Mateo, CA, USA
Wagner, S. M. Ullrich, K.K. Transchel, S. (2013), The game plan for aligning the organization.
Business Horizons, Vol. 57 Issue 2 pp. 189-201
Whisenant, C. (2006), The politics of forecasting in sales and operations planning, The Journal of
Business Forecasting, pp. 17–19
Wing, L. & Perry, G. (2001), Toward twenty-first-century pharmaceutical sales and operations
Planning, Pharmaceutical Technology, pp. 20–26

102
Others
Online Open access text books 2015, OTexts, [Referred 13.1.2015], Available:
https://www.otexts.org/fpp/2/5
Ekokem webpage 2015a, Ekokem, [Referred 13.1.2015], Available:
http://www.ekokem.fi/en/ekokem/business
Ekokem webpage 2015b, Ekokem, [Referred 30.1.2015], Available: http://www.ekokem.fi/en/services
Ekokem webpage 2015c, Ekokem, [Referred 15.2.2015], Available:
http://www.ekokem.fi/en/ekokem/key-figures/ekokem-groups-areas-business
Ekokem webpage 2015d, Ekokem, [Referred 3.2.2015], Available:
http://www.ekokem.fi/fi/ekokem/toimintatapa
Interview 1. Management interview part 1, 20.10.2014, Logistic Chief/S&OP manager, SCM manager,
Group Business Director, Group Chief Operative Officer BU Recycling and Energy
Interview 2. Management interview part 2, 14.11.2014, Logistic Chief/S&OP Manager, SCM Manager,
Group Chief Operative Officer BU Environmental Construction, Commercial Manager
Interview 3. Sales Interview, 30.10.2014, Logistic Chief/S&OP manager, Commercial Sales Manager
Finland, Commercial Sales Manager Finland Sales South, Commercial Manager Chemical Industry,
Commercial Forest Industry Manager
Interview 4. Operations Manufacturing Interview part 1, 31.10.2014, Logistic Chief/S&OP Manager,
Operations Manufacturing Manager Finland/Energy, Project Manager Operations Manufacturing
Finland/Energy, Operations Chief Manufacturing Finland/Hazardous waste
Interview 5. Operations Manufacturing Interview part 2, 7.11.2014, Logistic Chief/S&OP Manager,
Operations Manufacturing Manager Finland/Hazardous waste
Interview 6. Treatment centers Interview, Logistic Chief/S&OP Manager, Chief Operative Officer BU
Environmental Construction Treatment centers, Chief Operative Officer and Product Group Manager
Officer BU Environmental Construction Treatment centers
Interview 7. Customer Service Interview, 21.11.2014, Customer Service Manager, Category Chief,
Back Office Manager
Inquiry. S&OP process in Scandinavian environmental management companies
Workshop meeting facilitated by a big four consultation company, 20.4.2015

103
APPENDICES Appendix 1. Lapide (2005) Maturity Model

104
Appendix 2. Grimson and Pyke (2007) Maturity Model

105
Appendix 3. Cecere et al. (2009) Maturity Model Adjusted with Gartner RAS Core Research

106
Appendix 4. Ivert & Jonsson (2010) APS systems benefits in S&OP process of a Case Company in
chemical industry.

107
Appendix 5. Balanced Scorecard Framework (Kaplan & Norton 1996)

108
Appendix 6. Common KPIs appearing in the literature
Demand - Forecasting accuracy (product family)
- Customer profitability
- Volume / Sales growth
- Gross margin
- Order fill rates
- Forecast accuracy (Revenue)
- Order backlogs
- Unfilled customer demand
- Variance to baseline forecast and
budget
- Market share
Supply
Operations
- Return on asset
- Profitability
- Revenue
- Working capital
- Inventory costs
- Supply chain costs
- Expected plant utilization
- Production capacity shortages
- Critical component shortages/surpluses
- Line fill
- Obsolete inventory
- Inventory on hand
- Expediting frequency
- Stock-outs
- Variance to standard costs
- Quality utilization
- Capacity utilization
Customer service - Completed orders
- Satisfaction
Finance - Accuracy to monthly profit plan
- Sales
- Stock Price
- Revenue
- Profit
- EPS
- Inventory return
- Market share
- IRR
- ROI
- Cash-to-cash cycle
- NPV
- Gross margin

109
Appendix 7. Management Interview
Operational
What information management receives from operational S&OP?
What information management wants from operational S&OP?
Is the operational S&OP requirement for tactical S&OP?
For how long time-horizon operational S&OP produces information?
Tactical
What information management receives from tactical S&OP?
What information management wants from tactical S&OP?
For how long time-horizon tactical S&OP produces information?
For how long time-horizon should tactical S&OP produce information?
How often should tactical S&OP produce information?
Strategic
What information management receives from strategic S&OP?
What information management wants from strategic S&OP?
For how long time-horizon strategic S&OP produces information?
For how long time-horizon should strategic S&OP produce information?
How often should strategic S&OP generate information?
Finally
How do you see S&OP links business plan and strategic planning?
How well S&OP has filled this?

110
Appendix 8. Supply Interview
Information
How often other departments contacts storage in storage-related changes?
Who is responsible for operational, tactical and strategic storage planning?
What are the biggest information-related challenges that supply department faces?
What information should S&OP produce functionally from organization?
Resources
What are the realistic storage capacities?
What fractions can be monitored?
How often storage levels can be updated?
On what level inventory is done?
On what level could inventory be done?
Who could provide input data?
What are the boundary conditions?
What fractions are the most challenging?
What are the bottle necks of storage?
What is the time-horizon to storage planning?
How often storage planning takes place?
Where is the historical data available from storages?
Finally
What input data supply department provides for S&OP process?
What input data is supply department ready to provide?
What output does supply department wants from S&OP?
What challenges supply department has identified from S&OP?
What are the typical matters supply department brings forward to S&OP process?

111
Appendix 9. Production Interview
Information
How often other departments contacts plant?
Who are responsible for operational, tactical and strategic production planning?
What are the biggest information-related challenges which production department faces?
What information should S&OP produce functionally from organization?
Resources
What are the most challenging fractions?
On which level does production department have fraction-based capacity information?
Does production department measure utilized capacity?
What are the capacities of the storages of production department?
How often and on which time-horizon it is possible to forecast production planning?
What is the state of production planning and what it could be in the future?
Finally
How often and in what level production data is generated into ERP system?
What output does production department want from S&OP process?
What challenges production department has identified from S&OP?
What are the typical matters production department brings forward to S&OP process?
How decision should be monitored in S&OP process?

112
Appendix 10. Sales Interview
Information
How Sales contacts production department when orders change?
Who are responsible for operational, tactical and strategic sales forecasting?
What are the biggest information-related challenges which sales department faces?
What information should S&OP produce functionally from organization?
Forecasting
What are forecastable fractions?
How often sales forecasting takes place?
What is the forecasting time-horizon?
What is the forecasting level?
What are the forecasted customers?
Who does the forecasting?
How forecasting accuracy is monitored?
Does sales department apply both unconstrained and constrained forecasts?
Finally
How often and on what level does sales department generate information into CRM?
What output does sales department want from S&OP process?
What challenges sales department has identified from S&OP?
How monitoring should be arranged and improved in S&OP process?
What are the typical matters sales department brings forward into S&OP process?

113
Appendix 11. Enquiry of other environmental management factories
General:
How does your S&OP process link operational planning and strategy?
Which departments (Sales, Finance, R&D, SCM, Manufacturing, Marketing, etc.) in your company are
linked to S&OP process?
What business units are participating into S&OP process?
What kind of challenges are delimited from S&OP process? (for example project business)
What is the lowest detail-level in your monthly S&OP planning (Product Family, Product Subfamily,
Model/Type, Size, SKU)?
Demand:
How do you perform foreseeable predictions to S&OP?
Is sales department linked to S&OP, if yes how?
How do you manage Sales forecast?
How often does your S&OP update forecasts? (eg. Rolling monthly)
Does your company perform constrained, unconstrained or both forecasts?
What are statistical and judgmental forecasting roles in your S&OP process?
How well does sales forecasting reflects the actual income?
Supply:
How do you link treatment forecast to S&OP process?
How do you link logistics to S&OP process?
How do you manage inventory and inventory estimates?
How does your company link Resource Requirement Planning with S&OP process?
Financials:
How do you evaluate that your S&OP process reviews company’s performance and creates value?
What are measured in S&OP process?

114
Process:
Does your company have a structured S&OP process?
If yes, what is the structure of the process?
How do you prepare S&OP meeting information? Monthly preparing?
How many participators your Firm have in the monthly executive S&OP meeting? (final meeting)
From which departments are they?
What are the steps of the S&OP process structure in your company, please describe each step with few
words?
IT:
What tools are used to manage S&OP process?
What tools are considered to be developed for the use of S&OP process?

115
Appendix 12. To-be state of S&OP process
Information flow Manual information flow
S&O
PFu
nct
ion
Pro
du
ctio
nEx
tern
al
tre
atm
ent
pip
lin
es
Sale
sSC
MC
ust
om
er
Serv
ice
Envi
ron
men
tal
Co
nst
uct
ion
Supply planning Consensus Phase (Supply Demand Balancing)Demand planning
Storage level forecasts, level following
Operative inflow estimate based on the actuals at operative level
Activities before development
Consolidation of forecast formation Actual Data
Gathering Meeting Prepearing
Executivemeeting
Data from extermalstoragesLimited
visibility to external logistics
After the ConsensusPhase
Output to operative planning
Storage output
Information from exeptionalsteering actions
Information Available
Manual likageto Logistic
S&OP task listScenario testing
Challanges of receiving
data
Validation Meeting
Validation Meeting
unformalized
Developed activites
Pros ConsRecommended activities
Consolidation of forecasts
Consolidation & validation of forecasts
ExcelExcel APSAPSExcel
CRM
Excel document
Steering actions
Extend to other Business areas
Information flow to customer service
Exeption Report
High utilization of ínterim / temporary
storages
Big volume logistic
Data Gahtering
Storage planning
Link sales forecast to inflow estimates
High Fluctuation ofwaste inflow (daily)
Challanges to create optimal
mix
High Storagelevels
KPI follow-up
Data accuracy
Data accuracy
Manualyupdated
Flexible scenariocreation
Calculation logic
Calorific value
Capasity fluctuation easily
forecasted
Effective
Capacity can be aquired
Data management
ITS
Storage capacities and levelsInformation
from projects
Data linkage manual
Extend BU's materials to followance
Use of external treatment
Consolidationreport
Investmentoppinions
Update data
Updating Forecasts (Rolling 3 months)
Create a formalized information flow map to manage the inflow, product mix, storagelevels and production
Customer BasedBudget 12 months rolling, (product subfamily) Product subfamilies'
challanges
Scenario management
Usedtool
Recommended tool
Tested
Unformalized
New customer cases
Changes in costumer inflow
Errors pre-knowledge
Logistic planning
Attandance
KPI follow-up
KPI follow-up
KPI follow-up
BI
ERP APS
DP
Automatic update
Attandance
BI
document
Treatment forecasts
Inventory (quarterly)
Updated yearly
Treatment budget rolling yearly by subfamily level
Link to operational
S&OP
Commitment
Stakeholders
Education
Process promotion
Apply financials