MASTER'S THESIS - DiVA-Portal
96
2008:007 MASTER'S THESIS Creating a Model for Customer Loyalty in Banking Industry of Iran Golrou Abdollahi Luleå University of Technology Master Thesis, Continuation Courses Marketing and e-commerce Department of Business Administration and Social Sciences Division of Industrial marketing and e-commerce 2008:007 - ISSN: 1653-0187 - ISRN: LTU-PB-EX--08/007--SE
-
Upload
khangminh22 -
Category
Documents
-
view
4 -
download
0
Transcript of MASTER'S THESIS - DiVA-Portal

2008:007
M A S T E R ' S T H E S I S
Creating a Model for Customer Loyaltyin Banking Industry of Iran
Golrou Abdollahi
Luleå University of Technology
Master Thesis, Continuation Courses Marketing and e-commerce
Department of Business Administration and Social SciencesDivision of Industrial marketing and e-commerce
2008:007 - ISSN: 1653-0187 - ISRN: LTU-PB-EX--08/007--SE
Creating a model for customer loyalty in
banking industry of Iran
Supervisors: Dr. Mohammad.M. Sepehri
Dr. Lennart Persson
Prepared by: Golrou Abdollahi
Tarbiat Modares University Faculty of Engineering
Department Industrial Engineering Luleå University of Technology
Department of Business Administration and Social Sciences Division of Industrial Marketing and E-Commerce
MSc PROGRAM IN MARKETING AND ELECTRONIC COMMERCE Joint
2007

2
In the Name of God the Compassionate the Merciful

3
I dedicate this thesis, with all my love and respect,
to my dear parents.

4
Table of content Table of content.................................................................................................................4 List of figures ....................................................................................................................6 List of tables......................................................................................................................7 Abstract.............................................................................................................................8 Acknowledgement.............................................................................................................9 Chapter 1......................................................................................................................... 10 1 Introduction ............................................................................................................... 10
1.1 Background......................................................................................................... 10 1.2 Definitions .......................................................................................................... 12
1.2.1 Who Is a Customer? ..................................................................................... 12 1.2.2 Customer churn............................................................................................ 12 1.2.3 Loyalty......................................................................................................... 13 1.2.4 Retention...................................................................................................... 13
1.3 Customer relationship ......................................................................................... 13 1.4 Banking and loyalty ............................................................................................ 14 1.5 Research Area and Problem ................................................................................ 16 1.6 Research Questions............................................................................................. 17 1.7 Research Hypotheses .......................................................................................... 17 1.8 Steps in this research:.......................................................................................... 18
Chapter 2......................................................................................................................... 19 2 Literature Review ...................................................................................................... 19
2.1 Customer’s Bond ................................................................................................ 19 2.2 Loyalty ............................................................................................................... 23
2.2.1 The difference between loyalty and retention................................................ 24 2.2.2 Customer Loyalty Objectives ....................................................................... 26 2.2.3 Loyalty Programs and Its Benefits................................................................ 28 2.2.4 Involvement of the Customer ....................................................................... 31 2.2.5 Offensive and Defensive Strategies .............................................................. 33
2.3 Is It Proper To Retain Any Customer?................................................................. 34 2.4 Perceived Quality................................................................................................ 34 2.5 Customer Satisfaction ......................................................................................... 37 2.6 Switching cost..................................................................................................... 37 2.7 Habit................................................................................................................... 39 2.8 Choosing............................................................................................................. 40 2.9 Model ................................................................................................................. 41
Chapter 3......................................................................................................................... 42 3 Methodology ............................................................................................................. 42
3.1 Research purpose ................................................................................................ 43 3.2 Research Philosophy ........................................................................................... 44 3.3 Research Approach ............................................................................................. 45 3.4 Research Strategy ............................................................................................... 45 3.5 Time Horizon...................................................................................................... 47 3.6 Data Collection Method ...................................................................................... 47

5
3.6.1 Sampling...................................................................................................... 47 3.6.2 Collecting primary data using questionnaire ................................................. 51
3.7 The credibility of the research finding................................................................. 54 3.7.1 Reliability .................................................................................................... 54 3.7.2 Validity ........................................................................................................ 55
Chapter 4......................................................................................................................... 56 4 Analyze ..................................................................................................................... 56
4.1 General Information............................................................................................ 56 4.2 Analysis of the factors......................................................................................... 57
4.2.1 Quality ......................................................................................................... 57 4.2.2 Satisfaction .................................................................................................. 61 4.2.3 Switching Cost ............................................................................................. 62 4.2.4 Choosing...................................................................................................... 64 4.2.5 Habit ............................................................................................................ 65 4.2.6 Loyalty......................................................................................................... 67
4.3 Correlation between factors................................................................................. 68 4.4 Each factor and its question’s relationship........................................................... 70 4.5 Factors relationship and suggestions ................................................................... 71
Chapter 5......................................................................................................................... 75 5 Conclusion................................................................................................................. 75
5.1 Answering the research questions and the hypothesis .......................................... 76 5.2 Final model......................................................................................................... 78 5.3 Conclusion.......................................................................................................... 80 5.4 Contribution........................................................................................................ 81 5.5 Limitations.......................................................................................................... 81 5.6 Further research .................................................................................................. 81
Reference ........................................................................................................................ 83 Appendix......................................................................................................................... 95

6
List of figures Figure 1:Internal attributes for customer loyalty intensity for consumer........................... 25 Figure 2:Internal attributes for customer loyalty intensity for businesses.......................... 25 Figure 3:Bussines Strategy .............................................................................................. 33 Figure 4:Loyalty model (Beerli, Martin and Quintana, 2004)........................................... 41 Figure 5:The research process “onion” ............................................................................ 43 Figure 6:Sampling Techniques ........................................................................................ 51 Figure 7:An illustration of the differences between validity and reliability....................... 54 Figure 8:Factors Relations ............................................................................................... 74 Figure 9:Primary Hypotheses........................................................................................... 77 Figure 10:Model Analysis Result..................................................................................... 78

7
List of tables Table 1:Categories and dimensions of bond between customers and their banks .............. 21 Table 2 :General information........................................................................................... 57 Table 3:Perceived Quality Questions ............................................................................... 58 Table 4:Perceived Quality Mean and Std. Deviation Result ............................................. 59 Table 5:Tangible Quality Average Result ........................................................................ 60 Table 6 :Intangible Quality Average Result ..................................................................... 60 Table 7:Satisfaction Questions......................................................................................... 61 Table 8: Satisfaction Mean and Std. Deviation................................................................. 62 Table 9:Satisfaction Average Result ................................................................................ 62 Table 10: Switching Cost Questions ................................................................................ 63 Table 11 :Switching Cost Mean and Std. Deviation ......................................................... 63 Table 12: Switching Cost Average Result........................................................................ 64 Table 13 :Choosing Questions ......................................................................................... 64 Table 14:Choosing Mean and Std. Deviation ................................................................... 65 Table 15 :Choosing Average Result................................................................................. 65 Table 16 :Habit Questions ............................................................................................... 65 Table 17:Habit Mean and Std. Deviation ......................................................................... 66 Table 18:Habit Average Result........................................................................................ 66 Table 19:Loyalty Questions............................................................................................. 67 Table 20:Loyalty Mean and Std. Deviation...................................................................... 67 Table 21:Loyalty Average Result .................................................................................... 68 Table 22:Correlation Result ............................................................................................. 68 Table 23:Questions Result ............................................................................................... 70

8
Abstract The customer loyalty concept has received much attention from both academics
and practitioners in different industry.
Banking industry is also not excluded and because it has a highly interaction with
the customers, getting familiar with this concept would be very important and helpful for
managers in defining strategies.
So this research attempts to find the customer loyalty factors and their relationships
with banking industry in one of the developing countries in order to provide a model for
this concept.
In order to do this a questionnaire is designed and validated ,then based on the data
which were gained from the 400 respondents’ answers to the designed questionnaire, the
analysis is done on and the results and the relations are explained.
Satisfaction, choosing, habit, tangible and intangible service quality and switching
cost are the factors which influence the loyalty factor.
To analyze the data, SPSS and LISREL software were used .
It is hoped that this Master thesis would be helpful and interesting for both
academics and practitioners.

9
Acknowledgement
I would like to express my sincere gratitude to my supervisors, Professor Sepehri at
Tarbiat Modares University of Iran and Professor Persson at Lulea University of Sweden,
for the valuable supervision, the support and encouragement they gave me.
I would like to express my thanks and honor to my dear parents for providing a
lovely and warm environment for me to live and grow up. Also I am very thankful to my
lovely Dad and Mom, this time because of their financial supports, which with out it,
studying master would remain a dream for me.
I would also like to thank my friendly sister for her supports, in doing this research.
I have a great honor to Dr. Khakzar for his helpful suggestions during the different
stages of this research.
I also want to thank all of Tarbiat Modares and Lulea university faculty members
for their help during this course.
Also I would like to thank all of the respondents whom with out their participation,
doing this research would be impossible.
Golrou Abdollahi
February 2007
10
Chapter 1 1 Introduction
“Today, a customer loss is a customer gain for a competitor. With so many
competitors, companies need to spend as much energy on retaining customers as they do
on acquiring them. Businesses that understand churn and invest accordingly will need to
invest less in placating dissatisfied customers and less in winning new ones to grow.
Businesses that do not will find rivals with better retention machines rapidly overtaking
them. Understanding how and why the churn occasion comes about will be critical.”
1.1 Background
The subject of customer retention, loyalty, and churn is receiving much-needed
attention in many industries. (Matt Hasan, 2001). This is evident from the number of
"customer intimacy" initiatives that are either under way or being considered in a variety of
companies. Top-level decision makers are making substantial investments in developing
business strategies, plans, programs and infrastructure to address the “needs” and

11
“preferences” of customers, as opposed to deciding for them what they want and cajoling
or coercing them into making purchase decisions accordingly. One manifestation of this
change is the ushering in of “relationship marketing,” where individual customers (or small
groups) are dealt with differentially and the objective is to build a lasting relationship with
them.( Matt Hasan,2001) This is very different from the old paradigm of “transaction
marketing,” where the focus is predominantly on making the current sale. The customer
market is one of the many different markets that businesses need to consider. Businesses
traditionally employed transaction marketing, i.e. marketing through 4Ps: transactions of
product, price, promotion, and place. However, over the past two decades, businesses
across all sectors have increasingly moved towards relationships, networks and
interactions.
This shift in business thinking has been necessitated in no small measure by the
commoditization of offerings and the intensification of competition in many industries,
rendering ownership of the customer relationship, the most critical business success factor.
Examples of these types of market dynamics are in long distance telecommunications as
well as the credit card, retail banking, insurance, food and beverage industries, cellular
phone service, cable TV, information services, and health care, banking service.
This customer-centric realization on the part of key decision makers is definitely a
move in the right direction. Anecdotal data from several industries indicate the importance
that business decision makers now place on customer retention, loyalty and churn.
The CRM approach to marketing has gained much currency in recent years,
seeking to establish closer relationships and interactions between a business and its most
important customers. CRM-oriented businesses market their products and services through
relationships and interactions with multiple markets, most notably the customer market,
often taking advantage of IT-based interactivity. This is why relationship marketing is
termed “customer relationship management” when it emphasizes the customer market in
particular.
Many researchers consider CRM as a new paradigm in marketing. The concept of
“paradigm” has been defined as “a set of assumptions about the social world, and about
what constitute proper techniques and topics for inquiry”. Much of the marketing literature
has regarded CRM as representing a paradigm shift in marketing thought. CRM is

12
reshaping the marketing landscape. Customer Relationship Management has overtaken the
market and it is revolutionizing marketing and reshaping entire business models.
According to Zineldin (2005), it would seem that the discussion is much similar to
the one in the 1990s on whether relationship marketing constituted a new paradigm or not.
In this respect, relationship marketing is defined as being about “establishing, developing,
and maintaining successful relational exchanges”. Exchanges would take place between
the business and important markets, including the customer market (Christopher et al.,
1991).
1.2 Definitions
1.2.1 Who Is a Customer?
Customer can be defined in different ways, for example Sara Gustafson and Erica
Lundgren (2005) described “a customer” as below:
A Customer is the most important person ever in this office . . . in person or by
mail.
A Customer is not dependent on us . . . we are dependent on him.
A Customer is not an interruption of our work . . . he is the purpose of it. We are
not doing a favor by serving him . . . he is doing us a favor by giving us the opportunity to
do so.
A Customer is not someone to argue or match wits with. Nobody ever won an
argument with a customer.
A Customer is a person who brings us his wants. It is our job to handle them
profitably to him and to ourselves.
1.2.2 Customer churn
Customer churn is the tendency for customer to move from one competitive
provider to another (Michael Fox and Missy Poje, 2002).
13
1.2.3 Loyalty
Loyalty has to be defined as an internal intensity of customers towards sticking
with or switching from their current supplier—an inherent value. Customer loyalty is when
a customer remains as a client of original supplier even if a competitor proposes more
advantageous conditions.
1.2.4 Retention
Retention is the outcome or the event that customers are retained with their current
provider.
1.3 Customer relationship
Relationship management, however, emphasizes the organization of marketing
activities around cross-functional processes as opposed to organizational functions or
departments. This results in a stronger link between the internal processes and the needs of
customers, and results in higher levels of customer satisfaction. CRM evolved from
business concepts and processes such as relationship marketing and the increased emphasis
on improved customer retention through the effective management of customer
relationships. Both RM and CRM emphasize that customer retention affects company
profitability in that it is more efficient to maintain an existing relationship with a customer
than create a new one (Zineldin, 2000, 2005) sited by (Payne et al., 1999; Reichheld,
1996).
Several studies have examined the importance for a business of retaining its
customers in great depth, with evidence suggesting that retention leads to increase market
share and eventually greater profits. Marketing tools that businesses can employ for
retaining customers may, therefore, provide for a competitive advantage. For example,
tools may contribute to product and service differentiation, as well as to create barriers for
customers switching to other products and services.
During the 1990s, many organizations and consumers experienced great
movements and actions. Some key environmental factors provided the setting whereby
companies changed their attention and orientation toward marketing and the consumer.

14
Companies have recognized the fact that they must change and restructure their
way of establishing and maintaining business relationships. For example, many
manufacturers discovered, or more adequately, re-discovered that close relationship with
customers is not valuable with constantly changing technology and increasing global
competition.
Today’s businesses are facing fierce and aggressive competition while operating in
both domestic and global markets. Most managers and marketers would of course agree
that establishing long-term business relationships is about development and survival.
According to Lewis (1991), the world has never been so interdependent. All trends point to
cooperation as a fundamental, growing force in business.
Marketing is also about how to integrate the customer into the design of the
products/services and how to design a systematic process for the interaction that will
create substance in relationships. In a competitive world, companies have to work hard to
gain any added value. They have to work with their customers to discover the new ways
for running the business more efficiently for themselves and more effectively for the
customers.
1.4 Banking and loyalty
During the past decade, the financial service sector has undergone drastic changes,
resulting in a market place which is characterized by intense competition, little growth in
primary demand and increased deregulation. (Bloemer, Ruyter,Peeters ,1998) In the new
market place, the occurrence of committed and often inherited relationships between a
customer and his or her bank is becoming increasingly scarce (Levesque and McDougall,
1996). Several strategies have been attempted to retain customers. In order to increase
customer loyalty, many banks have introduced innovative products and services (Meidan,
1996). However, as such innovations are frequently followed by similar charges; it has
been argued that a more viable approach for banks is to focus on less tangible and less
easy-to-imitate determinants of customer loyalty such as customer evaluative judgements
like service quality and satisfaction (Worcester, 1997; Yavas and Shemwell, 1996).
Banking has traditionally operated in a relatively stable environment for decades.
However, today the industry is facing a dramatically aggressive competition in a new

15
deregulated environment. The net result of the recent competition and legislation is that
traditional banks have lost a substantial proportion of their domestic business to essentially
non-bank competition. Competition will undoubtedly continue to be a more significant
factor. Finding a place in this heating sun becomes vital to the long-range profitability and
ultimate survival of the bank. Those banks that are not considering the new atmosphere to
build and protect their competitive position will likely become victims of that heating sun.
(Zineldin, 2006)
Banks begin to realize that no bank can offer all products and be the best/leading
bank for all customers. They are forced to find a new basis for competition and they have
to improve the quality of their own products/services (prodserv) (Zineldin, 1996; Olsen,
1992). A bank has to create the customer relationship that delivers value beyond the
provided by the core product. This involves added tangible and intangible elements to the
core products, thus creating and enhancing the “product surrounding”.
Positioning is an attempt to distinguish the bank from its competitors along real
dimensions in order to be the most preferred bank for a certain market segment or in other
words, if a bank can position itself favorably within a particular marketplace, relative to
competitors, that bank is a competitive one. Competitiveness means that a bank, in terms
of its competitive position, its management and marketing strategies, its use of information
technology, the quality of its products/services and its ability of managing long term
customer relationship must be increasingly responsive to the market consideration and
customer orientation.
The increasing importance of relational marketing in recent years, particularly in
the servicing and manufacturing industries, such as banks, has been accompanied by a
bundle of works on customer loyalty. Several authors emphasize the positive relationship
existing between customer loyalty and business performance (Beerli et al., 2004;
Reichheld and Sasser, 1990).
Loyal customers not only increase the value of the business, but also enable it to
maintain the costs lower than those associated with attracting new customers (Beerli et al.,
2004).
Generally, loyalty has been and continues to be defined as repeat purchasing
frequency or the relative volume of the same-brand purchasing. Many definitions in the
16
literature suffer from the problem that they record what the consumer does and none taps
into the psychological meaning of loyalty (Oliver, 1999).
By the above introduction to customer relationship, loyalty and bank, now it is time
to have a brief look at what is going to be in this research.
1.5 Research Area and Problem
Iranian banking industry is made of different banks which are in three main
categories:
• Commercial government-owned banks
• Private banks
• Specialized government banks
In the first category, the banks are owned by government and they do the
commercial tasks which are described in the Iranian banking rules. The second category
includes the banks which obey the Iranian banking rules but they are not owned by the
government. These banks are established by a person or a group of people under the
control and supervision of the central bank of Iran. These banks do the banking tasks
which are described in the banking rules of Iran. The last category is specialized
government banks which are the same as the first group but their activities are more
focused on some special tasks, like agriculture, house and buildings, etc.
Also there is one more category which does not consist the ordinary banks. It is a
monetary institute which does some limited tasks and activities and is named near-banks.
In this research only the main banking categories were considered. All of these banks have
some main tasks like credit activities, monetary activities such as opening different
accounts, payment activities…
In this environment naturally there are some customers who are using the banking
services, and because of the similarity of the offered services by different banks, I consider
the customers similar to each other.
In this competitive environment each company or bank wants to absorb the
customers .This can be done both by maintenance or having new ones. So main and clever
ones understand that they should work on the customer loyalty.

17
In this research I tried to find the main factors of the customer loyalty in banking
industry of Iran in order to help this key industry to have a wider look for supporting their
customers and finally having more loyal ones.
1.6 Research Questions
The answer to the following questions will together provide us the possibility to
reach the objective of this research.
• Can a model for customer loyalty in banking industry of Iran be specified?
• What factors influence the customer loyalty in banking industry in Iran?
• What are the relationships between the factors?
In order to answer to the research questions I defined some more detailed questions
such as:
• Does customer satisfaction influence the loyalty of the customer?
• Does customer habit influence the loyalty of the customer?
• Does switching cost influence the loyalty of the customer?
• Does perceived quality influence the loyalty of the customer?
• Does choosing influence the loyalty of the customer?
1.7 Research Hypotheses
This research attempts to determine the factors which affect customer loyalty in
banking in order to make a loyalty model for Iranian banking customers.
Therefore the following hypotheses are formulated:
H1: Choosing influences the loyalty
H2: Satisfaction influences the loyalty
H3: Switching cost influences the loyalty
H4: Habit influences the loyalty
H5: Perceived Quality influences the loyalty

18
1.8 Steps in this research:
In the second chapter we have a look on what the previous studies have done on
this topic. In the third chapter we have a look at the methodology of this research. In the
fourth chapter the analysis of the findings will be discussed, and then in chapter 5 we can
have a conclusion on what we studied. Also the final model of customer loyalty in banking
industry in Iran will be presented. Then some comments for further researches will be
given in the last chapter.

19
Chapter 2 2 Literature Review
“…Ellie Trubik and Malcolm Smith in 2000 mentioned in their research that four
attributes are suggested to help identify leaving customers in banking industry:1 the
customers had one product; 2 their major channel was a branch; 3 they had no fee
exemption; 4 they were on their third month with the bank.”
2.1 Customer’s Bond
According to Berry and Parasuraman’s (1991) conception of customers-seller bond
has three levels: level 1 – Financial bond, which refers to a bond that is tied by price; level
2 – Social bond, which refers to a bond that is formed upon a friendship between a
customer and service staff; and level 3 – Structural bond, which refers to a bond that is
formed as a result of joint investment by both the seller and the buyer. In addition to price,

20
users of services are assumed to consider their friendships with the service staff as an
important influence on their decisions to remain with a service provider, to repurchase the
same service or to purchase additional services. When applied to the context of the retail
banking industry, Berry and Parasuraman’s (1991) construct of customer-service provider
bond implies that a strong customer-bank bond takes place under three conditions: first,
when the price is the key attraction to the customer; second, when bank representatives
have the opportunity to build friendships with the customer and the customer wants to have
a friendship; and third, when both parties make beneficial joint investment and benefit
from it. However, a cash rich and time-poor customer tends to value low price less than
convenience, privacy and the freedom in doing banking chores. Additionally, a self-service
machine has made the social relationship between customers and bank service
representatives less important or even unnecessary.
Interactions between a retail bank customer and his/her bank can be grouped into
three types:
(1) Customer-bank’s technologies interactions, in the case of using self-service
machines and online services;
(2) Customer-service representative interactions, in the case of obtaining personal
services such as over the counter services and personal advices; and
(3) Hybrid interactions or a combination of (1) and (2).
Type (3) interaction occurs when both a service representative and a customer are
involved in producing, delivering and consuming a particular banking service with the use
of banking technologies and physical infrastructure, for example, a service representative
helps a customer navigate through the bank’s computer system and resolve a particular
problem over the telephone or in person at bank branches. Price, in Berry and Paraguayan’s (1991) conception of customer bond, is the first level bond that
binds customers with service providers. However, price is only one of the many components of a bank’s
service offering. A bank customer, for instance, will unlikely is bonded to a bank that has had an unreliable
ATM network even though it pays the highest interest rates on deposits. In other instances, a retail bank
customer who values cash accessibility the most may not be concerned with the quality of social relationship
or the quality of the bank’s corporate image; what he/she wants is an ATM network that works and does not
run out of cash. It is the quality of the bank’s basic products, for example, the quality of the cash accessibility
provided by an ATM network that forms the primary bond and not the price or social relationship per se. In

21
their study of consumer experience of using self-service technologies, Meuter et al. (2000) found that the
highest levels of customer complaint resulted from technology and process failures.
Table 1:Categories and dimensions of bond between customers and their banks
source: Adapted from Ahmad ,2005 ,p-9.
Primary bond may be measured in terms of the utility, reliability, and overall value
of the particular basic product. The concept “relationship quality” has been debated widely.
Undoubtedly, relationship quality is pertinent to customers in the context of relational
purchases such as in the purchase of legal advice. In the context of selling retail banking
products, relationship quality encapsulates the quality of a number of interrelated
secondary or augmented services on top of the basic products such as the level of
helpfulness of service representatives in explaining the benefits of a pension plan. The
quality of social interactions and ultimately the relationship that we proposed are a
secondary bond that augments the primary bond. Secondary bond may be measured in
terms of friendly-typed behaviors such as the trustworthiness, friendliness, empathy,

22
familiarity, caring, politeness, responsiveness, and understanding of service staff. Previous
studies (Bitner et al., 1990; Ostrom and Iacobucci, 1995; Hurley, 1998; Keaveney, 1995)
already indicated that friendly behavior improved service outcome.
In the twenty-first century, the quality of banking service infrastructure that we
recognize is pivotal for two reasons. A high quality service infrastructure, firstly, would
enable customers to have problem-free interactions with their bank’s service technologies.
Secondly, it would help service representatives to deliver a higher level of relationship
quality by improving social interactions. A fast and efficient computer-based information
system is necessary in order to make a service representative appear responsive and
helpful, for example in searching for and providing instantaneous and accurate information
that any bank customer might want to know. Moreover, an up-to-date and an in-depth
knowledge of customers will also assist service representatives to customize services, for
example, a personal insurance policy that suits the customer’s income, age, responsibility
and risks. An efficient, reliable and easy to use information system would also facilitate
and encourage a higher and faster rate of customer adoption and repeated use of self-
service technologies. Quality of service infrastructure as another category of bond that
supplements the primary bond. Secondary bond, therefore, may also be measured in terms
of the level of user friendliness and the convenience of the bank’s service infrastructure to
retail bank customers. He recognized relationship quality and the quality of service
infrastructure as two elements of the secondary bond. Satisfied, happy and loyal customers
are likely to find their relationship with their bank enjoyable. They would feel gratified and
even honored. While some bank customers prefer to have expeditious self-service banking
services, there are others who prefer to have social interactions. The latter customers don’t
mind waiting in the queue and spending their time talking with service representatives –
they see social interactions as sources of satisfaction.
Dealing with even small pockets of dissatisfaction is a necessary part of creating
an organizational culture attuned to please customers. (Stephanie Coyles &Timothy C.
Gokey, 2005)
According to Fornell (1992) extensive literature suggests that market share and
customer satisfaction leads to profitability but is not certain that market share and customer

23
satisfaction have a positive connection. Fornell (1992) states that “loyal customers are not
necessarily satisfied customers, but satisfied customers tend to be loyal customers”
2.2 Loyalty
In this part we can have a look on customer loyalty.
Asker (1991) discussed the role of loyalty in the brand equity process and
specifically noted that brand loyalty leads to certain advantages, such as reduced marketing
costs, more new customers, and greater trade leverage.
In increasingly competitive markets, being able to build consumer loyalty is seen as
the key factor in winning market share and developing a sustainable competitive
advantage.
Oliver (1999) defines brand loyalty as “a deeply held commitment to re-buy or re-
patronize a preferred product/service consistently in the future, thereby causing repetitive
same-brand or same brand-set purchasing, despite situational influences and marketing
efforts have the potential to cause switching behavior.” This emphasizes the two different
aspects of loyalty described in prior studies-behavioral and attitudinal. Chaudhuri and
Holbrook (2002) suggested that behavioral or purchase loyalty consisted of repeated
purchases of the brand, whereas attitudinal loyalty included a degree of dispositional
commitment in terms of some unique value associated with the brand. Thus, customer
loyalty here was considered bi-dimensional, including both attitudinal commitment and
behavioral re-purchase intention. Based on prior studies (Lin and Wang, 2006), customer
loyalty was defined as the customer’s favorable attitude toward a brand, resulting in repeat
purchasing behavior.
Based on the Delone and McLean (1992, 2003) IS success model, user/customer
satisfaction may be assumed to be the determinant of the net benefit or individual impact
(e.g., customer loyalty). Consumer satisfaction is believed to mediate consumer learning
due to prior experience and to explain key post purchase behaviors, such as complaining,
word of mouth, repurchase intention, and product usage (Oliver, 1980. Westbrook, R.P.
Oliver, 1991.) Anderson and Srinivasan suggested that “a dissatisfied customer is more
likely to search for information on alternatives and more likely to yield to competitor
overtures than a satisfied customer”. In addition, a past research has indicated that

24
satisfaction is a reliable predictor of re-purchase intentions (Wang, T.-I. Tang, J.-T.D.
Tang, 2001).
2.2.1 The difference between loyalty and retention
I would like to explain the two important terms: Loyalty and Retention. In a recent
survey of business executives these two terms are used synonymously. However, to be able
to gain useful insight into switching conduct of customers, it is essential to establish the
distinction between the two. As it was mentioned in the previous chapter loyalty has to be
defined as an internal intensity of customers towards sticking with or switching from their
current supplier—an inherent value. Loyalty cannot be bought. Retention is the outcome or
the event that customers are retained or stayed with their current provider. Retention can be
bought with the appropriate incentives or stimuli. Retention occurs due to the combined
effect of two forces: the internal loyalty intensity of a customer and the external incentives
or stimuli that they are subjected to in the form of product attributes, pecuniary switching
costs, price, advertising, communications, and customer care.
“Increasing the loyalty” of a customer, actually means that the retentiveness of the
customer is increased. Loyalty is internal to the customer; it can only be changed by a shift
in the customer’s own value system. Retention, however, can be manipulated by the
provider through the application of incentives .The second drawback, absolutely critical to
business decision-making, is the fact that the “complete satisfaction” approach ignores the
inefficacy of the underlying economics of achieving completely satisfied customers.
Although completely satisfying customers is an admirable goal, it is not investment-
justified in the case of every customer and could even bankrupt the provider, which is not
desirable for anyone. Instead, a mutually beneficial “win-win” relationship between
provider and customer has to be achieved that takes into account, in addition to the
traditional revenue and cost measures, the differential cost of acquiring and retaining each
customer (or group) on the basis of their internal loyalty intensity.
2.2.1.1 Internal loyalty
Loyalty does not connote desirable versus undesirable behavior; it simply indicates
the internal intensity of customers towards switching from their current provider. This
intensity, ranging from “loyalist” to “habitual switcher,” can be attributed to customers’

25
internal “make-up,” which can be captured in a composite profile defined by certain
attributes. In the case of consumers these attributes belong to socioeconomic,
demographic, values, tradition, lifestyle and related categories, as shown in Figure1.
Source: Adapted from Hasan , 2001, p-5.
Figure 1:Internal attributes for customer loyalty intensity for consumer
Source:Adapted from Hasan, 2001, p-5.
Figure 2:Internal attributes for customer loyalty intensity for businesses

26
For example, customers may be “loyal” to their current provider (i.e., not switch)
simply because they are “too lazy,” which means their comfort-related switching cost is
high. Similarly, others may not switch because of the high psychological costs or risks they
associate with dealing with an unknown entity. Whatever the source of their action or
inaction may be, it is sufficient to say that each customer has a different inherent
orientation towards switching from their current situation.
It is necessary to mention two important corollaries to the above. One is that the
individual’s attitude towards change need not apply uniformly over all facets of their life;
it is entirely possible for a person to seek variety and stability in varying degrees in
different aspects of his or her life. This means that a consumer can, for example, have
“loyalist” intensity for toothpaste but “switcher” intensity for household appliances.
Similarly, businesses also have different loyalty intensities, depending on the item.
The other corollary is that the internal intensity, although generally constant in the
short term, may change over time due to life experiences for consumers and market
experiences for businesses, particularly catastrophic ones. For these reasons it is essential
to perform the customer segmentation on a dynamic basis as frequently as is economically
justifiable. Given the inherent loyalty intensity of customers, their actions; however, can be
influenced through external stimuli or incentives, such as product attributes, price, and
pecuniary costs of switching, communications, and relationship management including
customer care. And, while the internal loyalty intensity of customers cannot be impacted,
external stimuli are within the locus of control of the provider. These are the instruments,
which the provider can manipulate to achieve the desired action from the customer.
2.2.2 Customer Loyalty Objectives
The development of customer loyalty is one of the most important issues
organization face today.
Creating loyal customers has become more and more important. This is due to the
fact that competition is increasing, as never before, which has a great impact on many
companies. To deal with this high concentrated market, businesses are attempting not only
to attract and satisfy customers but also to create a long-term relationship with these
27
customers (Gremler and Brown, 1996). Creating satisfied and loyal customers is a critical
matter for many corporations survival.
Organizations’ goal with creating customer loyalty is mainly to increase their
profits, since loyal customers have direct value on a company’s profitability. Several other
benefits can be derived from loyal customers. Seen from the organizational perspective,
loyal customers lead to increased revenues for the organization result in predictable sales
and profit streams, and are also more likely to purchase additional goods and services
(Gremler and Brown, 1999). To precisely assess the value of customer loyalty, there is the
need to look beyond the direct value it has on the organization. That is to say beyond the
direct revenue streams and add in the overall benefits related with it. For instance, loyal
customers are also more likely to talk about the brand and recommend it to their friends
and relatives, which will generate new businesses.
Many researchers ( Rust and Zahorik 1993; Rust, Zahorik and Keiningham 1995;
Loveman 1998) that encompass share of wallet and customer duration in personal retail
banking have come from studies attempting to trace the chain of effects from service
quality programs upon customer satisfaction, customer loyalty and customer profitability,
that is, the so-called service-profit chain (Heskett, Jones, Loveman, Sasser and Schlesinger
1994). Results have been mixed but seem to suggest that quality improvements help both
customer acquisition and customer retention. New customers are attracted by positive
endorsements from existing customers about quality products. Existing customers are
encouraged to remain (resulting in higher retention and lower customer churn rates for the
bank) and devote a greater share of wallet to their main bank. Reichheld (1992, 1996) has
mentioned small increases in retention rates result in measurable effects on profitability.
In a Scandinavian banking context, Storbacka (1994) demonstrated direct
relationships between customer longevity with their main bank and share of wallet given to
that bank. In New Zealand, Colgate (1999) in his study of customer satisfaction with New
Zealand banks wrote that the depth of relationship with customers (the “quality” of the
relationship rather than the number of relationships) was particularly important.
Gummesson (1999) echoed these sentiments in the context of long-term customer
relationships in general, supported by earlier work by Fornell (1992), Anderson, Fornell
and Lehman (1994).

28
Maximization of customer loyalty is a priority for most industries. It is often stated
that industries like banks need to operate on a long-term “cradle-to-grave” customer
management strategy where youthful customers are recognized as being unprofitable in
their earlier years but becoming profitable as they move on through the family lifecycle
(Ron Garland, 2002). Concomitantly, customers can become “entangled” with their main
bank to such an extent that the perceived cost of defection outweighs the benefits of
shifting banking business to a new provider.
Hallowell (1996), has identified that there is a relationship between customer
loyalty and profitability and suggests that some customers can never be satisfied while it
is unprofitable to try to satisfy others.
2.2.3 Loyalty Programs and Its Benefits
Customer Loyalty Programs have developed remarkably in the era of customer
retention in recent years. This is due to recent advances in information technology. They
have been considered by many organizations and many of them have adapted customer
loyalty programs. According to Yi and Jeon (2003) loyalty programs are introduced to
build customer loyalty. Dowling and Hammond (2003) stated that customer loyalty
programs offer rewards to customers in form of relationships and financial rewards.
Customer loyalty programs have also been willingly embraced by customers; this is due to
the benefits associated with it (O’Malley, 1998). The importance of benefits for enticing
customers into these loyalty programs and according to YI and Jeon (2003) the goal of
customer loyalty programs is to create a high level of customer retention. Gilbert referred
to O’Malley (1998) states that the basic idea of a loyalty scheme is to reward customers’
repeat purchasing and encourage loyalty by providing targets at which various benefits can
be achieved. The longer a customer stays with an organization the more profit the customer
generates (Reichheld and Sasser, 1990). This is an outcome of a number of factors relating
to the time the customer spends with the organization, and includes: the effects of the
higher initial costs of introducing and attracting a new customer; increase in the value of
purchases; increase in the number of purchases; the customer's better understanding of the
organization and vice versa; and the last one positive word-of-mouth It was recognized by
Colgate et al. (1996) and by Storbacka et al. (1994) that reduction in defection can

29
contribute to increases in profits far more than increases in the market share. The profits of
organizations can increase by 100 percent through retaining 5 percent more of their
customers (Reichheld and Sasser, 1990; O'Malley, 1998).
Moreover, seen from a customer perspective, loyalty scheme can be a way to
decrease price sensitivity, increase brand loyalty, reduce the willingness to consider
alternative brands, encourage word-of-mouth support and endorsement, attract a larger
group of customers and increase the amount product bought (Uncle et al., 2003).
Customer loyalty programs are assumed to create value for the customer and it is
due to this value that customer loyalty programs promote loyalty. On the other hand, the
degree to which customer loyalty programs offer value to customers is uncertain, mostly
because customers are not equal and value will represent different things to different
people and will also be different in different context (O’Malley, 1998). In order to make
the value of customer loyalty programs work properly and succeed, an organization needs
to understand the needs and desires of their customers. The value an organization delivers
to its customers needs to be competitive in five dimensions. Seen from a customer
perspective, the dimensions are: cash value (as a percentage of the proportion spends),
aspiration value (how much this reward motivates a customer), relevance (the extent to
which the reward is achieved), and convenience (ease of participation of the scheme),
choice (the variety of rewards offered) (O’Brien and Jones, 1995).
Even though a small number of schemes today offer all dimensions of value, it is
obvious that companies which want to play the rewards game should be sure that their
value measures up to customers’ alternatives (O’Brien and Jones, 1995). This is most
significant when customer loyalty programs are mainly used as a differentiation.
Due to the popularity and benefits derived from customer loyalty programs many
corporations have adapted these schemes. Customer loyalty programs can and do build
customer loyalty and corporations now realize how important loyalty is for their
profitability. One of the main reasons of creating loyalty programs is to increase revenues,
which can be done by either increasing purchase and usage levels and also by increasing
the range of products bought. However, there are other reasons for creating loyalty
programs including: to generate information, to reward loyal customers, to manipulate
consumer behavior and as a defensive measure toward competitors (O’Malley, 1998).

30
Getting information about customers, who they are and their purchasing behavior is
a very important input for an organization. This information will contribute to a better
understanding of the customer and corporations can use this knowledge to improve
targeting, creating offers and shift merchandise. Furthermore, this knowledge can also be
employed to reward loyal customers and also to motivate customers to try new products,
manipulate consumer behavior.
Apart from the benefits that longevity of customers brings, research findings also
suggest that the costs of customer retention activities are less than the costs of acquiring
new customers. Rust and Zahorik (1993) identify the financial implications of customer
retention, citing US Office of Consumer Affairs research that estimates that attracting new
customers may be five times as costly as keeping existing customers.
Some of the most important benefits are as below:
Benefits for company:
• Less costly to retain customers than to attract new customers.
• Generating profits
• Decrease in marketing costs
• Positive word of mouth
Benefits for customers:
• Functional benefits
o Time savings
o Convenience
o Economic benefits
o Risk reduction
• Social benefits
o Relationships
• Pleasant
• Comfortable
o Trust

31
2.2.4 Involvement of the Customer
In order to implement the loyalty programs, we have to focus on the involvement of
the customer. The interaction between customers and service providers is an important
determinant of perceptions of service quality (Zenithal et al., 1988). In some instances, this
interaction will be largely of a transactional nature but more commonly interaction occurs
within the context of an ongoing service relationship. Indeed, services marketing places
considerable emphasis on the development and management of relationships with
customers as a means of enhancing the quality of service delivery (Berry, 1983;
Christopher et al., 1991; Eiglier and Langeard, 1977). Those relationships are seen as being
of particular importance in situations in which the service is long term in nature, when
customers are heavily dependent on credence qualities in service evaluation and where
perceived risk in high (Zeithaml, 1981). Furthermore, building effective and successful
relationships can contribute significantly to customer satisfaction, loyalty, retention and
thus to improved performance (Reichheld and Sasser, 1993; Rust and Zahorik, 1993).
These all reduce the churn process.
Without customer involvement the provision of many services cannot occur, but
the way in which customers participate in the service delivery process can have important
implications for both the customer and the service provider (Farquahar, 2004; Christine T.
Ennew & Martin R. Binks1996). Customers who are willing to participate in service
delivery may expect to receive a better quality of service for a variety of reasons. These
reasons can be as follow:
First, customer participation should mean that the provider has a clear
understanding of their needs and circumstances.
Second, participative customers may also be more aware of the constraints on the
service provider in terms of what can and cannot be delivered. Accordingly, such
customers are likely to form more realistic expectations about service quality and as a
consequence the gaps between expectations and performance may be smaller.
Finally, it is possible that the willingness of consumers to participate actively in the
provision of a service can provide the organization with an opportunity to enhance service
productivity (Lovelock and Young, 1977) by harnessing the contribution of customers.

32
Ford (1990) suggests that customers will and can only be expected to participate in
a relationship if they anticipate that there will be benefits from that relationship. The role
of the relationship in reducing perceived risk has already been mentioned but other benefits
might be anticipated including enhanced service quality as a result of the delivery of a
service which more closely meets customer needs and the formation of more realistic
expectations. More generally, the quality of the interaction between buyer and supplier and
the degree of customer participation in the relationship has been identified as possible
antecedents of customer satisfaction (Solomon et al., 1985). Certainly, there is preliminary
evidence to suggest a positive relationship between good consumer behavior and
relationship satisfaction (Anderson et al., 1994). While good consumer behavior is not
necessarily equivalent to relationship participation, it would be suspected that the two are
closely associated.
Conceptually, the existence of this association can be justified in two ways. First,
greater customer participation should enable an industry for example a bank to deliver a
service which is a much better match to customers’ needs. Second, greater participation
should result in customers forming more realistic expectations of the service the industry
can deliver.
There are three important elements of a customer’s interaction with a subscription
business to consider and understand:
• Customer experience:
What measurable service experience is the customer exposed to?
• Customer perception:
How does the customer claim to value the experience?
• Customer behavior:
How does the customer actually behave after his experience?
Understanding these three areas in depth and how they relate to one another is
essential to improve those elements of customer experience that will translate into loyalty
and satisfaction. Fortunately, for most large companies, the answers are within reach. IT
systems capture large operational data sets at the customer level, and businesses can learn
to condense critical information about churn from this data.

33
Customer loyalty is used for individuals who remain clients of their original
supplier even if a competitor proposes more advantageous conditions.
Loyal customers are the most profitable ones. They are free marketing channels in
terms of the benefits received by companies from word-of-mouth. These customers are the
most liked. Miguel A.P.M. Lejeune in 2001 mentioned in his research that Churn
management consist of developing the techniques that enable firms to keep their profitable
customers and it aims at increasing customer loyalty.
2.2.5 Offensive and Defensive Strategies
Companies’ relationship to their customers can be divided into two separate
business strategies, offensive and defensive. The offensive strategy deals with attracting
new customers and the defensive with trying to keep the already existing customers. This
is shown in the figure below.
Source: Adapted from Fornell , 1992,p-8
Figure 3:Bussines Strategy
Traditionally companies devoted more resources to acquire new customers but today most
companies apply a combination of both offensive and defensive strategies. The objective
of the defensive strategy is to minimize the customers’ switching and customer retention
by protecting the brand and its market from competitors and having highly satisfied and
loyal customers.

34
2.3 Is It Proper To Retain Any Customer?
A critical fact that should be kept in mind is that, although, it may be possible to
acquire or retain any customer; it is not economically desirable to do so for every
customer.
In fact, the cost of retention of customers is inversely related to their inherent
loyalty intensity (i.e., the higher the loyalty intensity, the lower the retention costs, and
vice versa). Also acquisition costs are positively correlated to loyalty intensity: it costs
more to acquire a customer whose tendency is to stick with its current provider than one
with a greater propensity to switch. Acquisition and retention costs include the carefully
attributed costs associated with advertising, other communications, promotions and
incentives in the form of price discounts, cash and/or other goods and services, frequent-
user and affinity programs, and customer contact.
Now after reviewing the literature of banking, the loyalty of the customer, its
programs and benefits, it is time to have a look at the different factors which affect this
concept.
2.4 Perceived Quality
A concept which is very closely related with satisfaction and loyalty is perceived
quality, and the differences between these have not always been very clearly defined. They
have been used on occasion in an indistinct manner. In an attempt to clarify the distinction
between satisfaction and perceived quality, Anderson et al. (1994) consider that
satisfaction requires previous consumption experience and depends on price, whereas
quality can be perceived without previous consumption experience and does not normally
depend on price. However in circumstances where there is little available information or
where quality evaluation is difficult, price can be an indicator of quality. In this sense,
Spreng and Mackoy (1996), starting from Oliver’s (1997, 1999) conceptual model of
service quality and service satisfaction, concluded that these constructs are distinct and
have different antecedents.
Service quality has been found to have a profound input on customer satisfaction
and loyalty as a whole and is defined as the result of the comparison that customers make

35
between their expectations about a service and their perception of the way the service has
been performed (Parasuraman et al., referred to in Caruana, 2002).
According to Caruana (2002), service quality is split up into two terms, first the
technical quality, which refers to what is delivered to the customer and functional quality,
which concerns the end result of the process which was transferred to the customer.
Furthermore, service quality concerns two aspects, psychological and behavioral, which
include the accessibility to the provider, the way service providers perform their tasks, the
content of their sayings and the way the service is done. The perception of service quality
is based on the customer’s assessment of three dimensions of service encounters, which are
the customer-employee interaction, the service environment, and the service outcome.
Even though there is no consensus about conceptualizing and measuring service
quality (Carman, 1990). Aydin&Ozer (2005) assumed service quality to be “the
consumer's judgment about the overall excellence or superiority of a service” (Zeithaml,
1988). In order to have a better understanding about service quality, they also mentioned
that the attributes of service quality are as follow: services are intangible; services are
heterogeneous, meaning that their performance often varies with respect to the provider
and the customer; services cannot be placed in a time capsule and thus be tested and re-
tested over time; and the production of services is likely to be inseparable from their
consumption.
Because of the attributes of services, the evaluation of service quality is more
difficult than the evaluation of product quality. Also, the evaluation may be connected with
the service delivery process, along with output (Cody and Hope, 1999).
In general, service quality is seen as a critical factors for profitability, and thereby a
firm's success. Two underlying processes generally explain the contribution of service
quality to profitability. First, service quality is regarded as one of the few means for service
differentiation and competitive advantage that attracts new customers and contributes to
the market share (Venetis and Ghauri, 2000).
Second, service quality enhances customers' inclination to buy again, to buy more,
to buy other services, to become less price-sensitive and to tell others about their favorable
experiences (Venetis and Ghauri, 2000). For example, Bloemer et al. (1998) have pointed
out that there is a positive relationship between service quality and repurchase intention,

36
recommendation, and resistance to better alternatives. All these – repurchase intention,
recommendation and resistance to better alternatives – are behavioral intentions and
constitute customer loyalty.
Service quality has a positive effect on the bottom-line performance of a firm and
thereby on the competitive advantages that could be gained from an improvement in the
quality of service offering, so the perceived service exceeds the service level desired by
customers (Caruana, 2002; Chumpitaz, 2004).
Here perceived value which is very close in meaning to service quality is brought;
in this thesis they are considered the same.
Recently, “both managers and marketing scientists have begun focusing on the
hitherto ignored role of customer value as a key strategic variable to help explain repeat
purchase behavior, brand loyalty and relationship commitment”. Perceived value is often
assumed to involve a consumer’s assessment of the ratio of perceived benefits to perceived
costs (zeithaml, 1988). Bolton and Drew (1991) suggested that perceived value is a “richer
measure of customers’ overall evaluation of a service than perceived service quality.”
According to Parasuraman and Grewal (2000), perceived value is a function of a ‘get’
component (the benefits a buyer derives from a seller’s offering) and a ‘give’ component
(the buyer’s monetary and non-monetary costs of acquiring the offering). Our study was
primarily focused on information, system, and product/service quality as the ‘get’
component, and on the money and time spent as the ‘give’ component. Prior studies
explicitly modeled perceived performance or quality as a direct antecedent of value, which,
in turn, directly drove repurchase intention. Also, cumulative insights from prior studies
supported the general notion that perceived value contributed to customer loyalty (Voss,
Parasuraman, Grewal, Monroe, Krishnan, 1998; Dodds,1991) Anderson and Srinivasan
suggested that when the perceived value was low, customers would be more inclined to
switch to competing businesses in order to increase perceived value, thus contributing to a
decline in loyalty.
The literature relating to service management has argued that customer satisfaction
is the result of a customer’s perception of value received (Hallowel,1996).Perceived value
is considered a construct that captures any benefit-sacrifice discrepancy in the same way
that disconfirmation does for variations between expectations and perceived performance.
37
As it is explained perceived service quality and perceived value has approximately
same meaning.
2.5 Customer Satisfaction
Customer satisfaction is another antecedent of customer loyalty. In the highly
competitive business world of today, customer satisfaction can be seen as the substantial of
success, as customer satisfaction can lead to customer retention and therefore to
profitability for an organization (Jamal and Kamal, 2002). Satisfaction is a consumer’s
post-purchase evaluation and affective response to the overall product or service
experience. It is considered a strong predictor for behavioral variables such as repurchase
intentions, word-of-mouth recommendations and loyalty.
Jamal et al., (2002) described customer satisfaction generally as the full meeting of
one’s expectations. Furthermore, Jamal and Kamal (2002) describes customer satisfaction
as a feeling or attitude of a customer towards a product or service after it has been used.
Egan (2004) puts the definitions of several authors together and describes customer
satisfaction as a psychological process of evaluating perceived performance outcomes
based on predetermined expectations.
Lin (2003) defines customer satisfaction as the outcome of a cognitive and
affective evaluation of the comparison between expected and actually perceived
performance, which is based on how customers appraise delivery of goods or services. A
perceived performance, which is less than the expected, leads to an unsatisfied customer.
Perceived performance that exceeds expectations, on the other hand, leads to a satisfied
customer. The expectations of a customer are built from past buying experience, advice
from friends and counterparts, marketers’ and competitors’ information and promises.
2.6 Switching cost
Another brand loyalty antecedent is known as switching costs, which can be
defined as the technical, financial or psychological factors which make it difficult or
expensive for a customer to change brand (Selnes, 1993).
Porter (1998) defines switching costs as one-time costs facing the buyer when
switching from one supplier's product to another's. In addition to objectively measurable

38
monetary costs, switching costs may also pertain to the time and psychological effort
involved in facing the uncertainty of dealing with a new service provider (Bloemer et al.,
1998). Hence, switching costs are partly consumer-specific. For this reason, a switching
cost can be seen as a cost that deters customers from demanding a rival firm's brand
(Aydin and Ozer, 2005).
Jackson (1985) describes the switching cost as the sum of economic, psychological
and physical costs. The economic or financial switching cost is a sunk cost which appears
when the customer changes his/her brand, for example the costs of closing an account with
one bank and opening another with a competitor, the cost of changing one's long-distance
telephone service (Klemperer, 1987) or the costs of changing one's GSM operator.
Procedural switching costs stem from the process of customers' purchase decision
making and their implementation of the decision. The buying process contains the
following phases:
1. Need recognition
2. Information search
3. Evaluation of alternatives
4. Purchase decision
5. Post-purchase behavior
For example, if a consumer wishes to change his operator, he should evaluate
alternative operators with regard to different criteria, such as coverage area, billing,
customer service, value-added service, etc., complete the procedure for purchasing a new
GSM line, and finally inform people of the new GSM number.
The customer perceives high risk regarding a brand he/she has never used (Aydin
and Ozer, 2005; Sharma and Patterson, 2000). Especially in services, where customers
prefer a rival service provider, risk exists because service quality cannot be evaluated
before purchasing (Aydin and Ozer, 2005; Sharma et al., 1997).
A customer who has collected information in order to decrease his anxiety about a
wrong purchasing decision will use all previous purchase experiences. This is called “post-
purchase cognitive dissonance”. In this process, if the customer were to switch brand,
he/she would compare the switched brand and the previous brand. Therefore, the better the

39
switched brand's performance, the higher the alternative's uncertainty. Hence, customers
who want to decrease cognitive dissonance prefer the brands that they have used before
(Klemperer, 1995).
Markets with switching costs are generally characterized by consumer lock-in,
where it is observed that consumers repeatedly purchase the same brand even after
competing brands have become cheaper. One important consequence of having consumer
lock-in is the ability of firms to charge prices above marginal costs (Aydin and Ozer, 2005;
Shy, 2002). In the case of a market having switching costs, when customers select from a
number of functionally identical brands, they display brand loyalty and go on buying the
same brand (Klemperer, 1987). In short, ex ante homogeneous products may, after
purchase, be differentiated ex post by switching costs (Klemperer, 1987). Moreover, if
customers are sensitive to a product's attributes, such as quality, uncertainty will decrease
price sensitivity: in other words, the customer behaves loyally.
For these reasons, switching cost is a factor that directly influences customers'
sensitivity to price level, and so influences customer loyalty (Aydin and Ozer, 2005)
referred to (Jones et al., 2002; Bloemer et al., 1998; Burnham et al., 2003; Lee et al.,
2001).
2.7 Habit
It is a fact of life that the force of habit still dictates many behavioral intentions,
when people have gained experience. A prior research has indicated that habitual behavior
leads to the continuation of the same type of behavior. Once a behavior has become a
habit, or a well-practiced behavior, it becomes automatic and is carried out without
conscious decision. According to Lin and Wang (2006), about 40–60% of the customers
purchase from the same store is through the force of habit. They visit the websites out of
habit rather than through a conscious evaluation of the perceived benefits and costs
offered. Indeed, when habit is well-entrenched, people tend to ignore external information
or rational strategies. Such an effect is a central element in Triandis (Triandis, 1971) theory
of attitude and attitude change: that behavioral intentions are the products of attitude,
social norms, and the effects caused by habit. Prior studies comparing the Theory of
Reasoned Action and related theories using habit as an antecedent of behavioral intentions

40
have found that habit can directly affect behavioral intentions more than attitude and social
norms (Trafimow, 2000; Verplanken, Aarts,-Knippenberg, Moonen, 1998) .It is mentioned
that habit alone can explain a large proportion of the variance in the continued use of a
service. Applying these findings to loyalty suggests that customers’ intentions of repeat
purchases on a specific place, (one they have habitually used in the past), will increase, due
directly to the habit of visiting that specific place.
2.8 Choosing
In the relationship existing between the different factors and loyalty, the degree of
elaboration which is followed in the decision-making process can have a moderating
influence. Elaboration is a construct based on the information processing theory (Petty and
Cacioppo, 1997) and is determined by the motivation and the ability of a consumer to
elaborate on the brand choice (Bloemer and Ruyter, 1998). Motivation can be
operationalised by bank choice involvement and ability can be operationalised by bank
choice deliberation. (Beerli,Quintana,Martin, 2004)
Despite the fact that motivation and the ability of a consumer to elaborate on the
choice can be high if the consumer does not perceive differences among brands, the degree
of elaboration in the decision-making process may be low. Therefore the perceived
distinction between different brands is important.
Therefore, loyalty is a concept that goes beyond simple purchase repetition
behavior since it is a variable which basically consists of one dimension related to behavior
and another related to attitude where commitment is the essential feature (Day, 1969;
Jacoby and Kyner, 1973).
Beerli et al. (2004)referred to Jacoby and Chestnut (1978), Solomon (1992) and
Dick and Basu (1994), mentioned the combination of these two components enables us to
distinguish two types of customer loyalty concepts: (1)The loyalty based on inertia, where
a brand is bought out of habit merely because this takes less effort and the consumer will
not hesitate to switch to another brand if there is some convenient reason to do so; and (2)
The true brand loyalty, which is a form of repeat purchasing behavior reflecting a
conscious decision to continue buying the same brand, and it must be accompanied by an
underlying positive attitude and a high degree of commitment toward the brand.
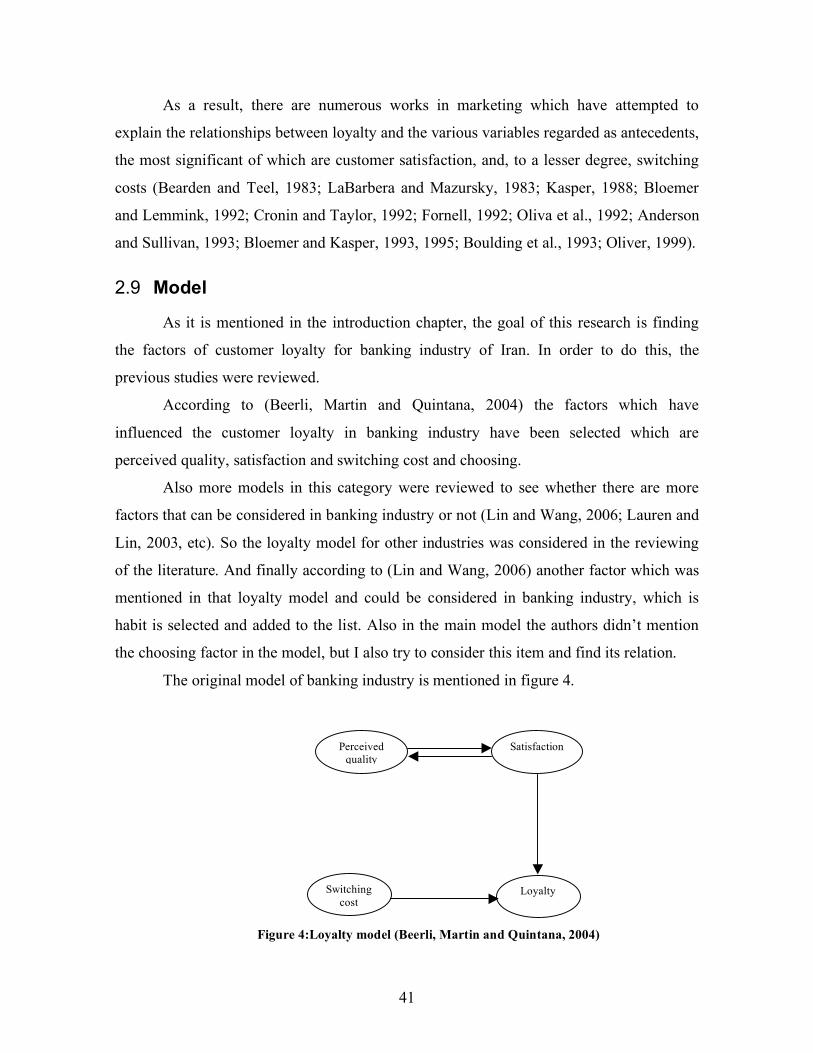
41
As a result, there are numerous works in marketing which have attempted to
explain the relationships between loyalty and the various variables regarded as antecedents,
the most significant of which are customer satisfaction, and, to a lesser degree, switching
costs (Bearden and Teel, 1983; LaBarbera and Mazursky, 1983; Kasper, 1988; Bloemer
and Lemmink, 1992; Cronin and Taylor, 1992; Fornell, 1992; Oliva et al., 1992; Anderson
and Sullivan, 1993; Bloemer and Kasper, 1993, 1995; Boulding et al., 1993; Oliver, 1999).
2.9 Model
As it is mentioned in the introduction chapter, the goal of this research is finding
the factors of customer loyalty for banking industry of Iran. In order to do this, the
previous studies were reviewed.
According to (Beerli, Martin and Quintana, 2004) the factors which have
influenced the customer loyalty in banking industry have been selected which are
perceived quality, satisfaction and switching cost and choosing.
Also more models in this category were reviewed to see whether there are more
factors that can be considered in banking industry or not (Lin and Wang, 2006; Lauren and
Lin, 2003, etc). So the loyalty model for other industries was considered in the reviewing
of the literature. And finally according to (Lin and Wang, 2006) another factor which was
mentioned in that loyalty model and could be considered in banking industry, which is
habit is selected and added to the list. Also in the main model the authors didn’t mention
the choosing factor in the model, but I also try to consider this item and find its relation.
The original model of banking industry is mentioned in figure 4.
Figure 4:Loyalty model (Beerli, Martin and Quintana, 2004)
Perceived quality
Satisfaction
Loyalty Switching cost

42
Chapter 3 3 Methodology
In this chapter, the outline of the methodology that is used in the research and the
theoretical basis behind the approach and their definitions will be explained. After
mentioning the research purpose, according to (Saunders et al., 2000)’s research process
onion, the first layer raises the question of the research philosophy. The second layer
considers the subject of the research approach that flows from our research philosophy.
Thirdly, the research strategy will be examined and the fourth layer is about time horizons

43
which are applied to the research. In the fifth layer data collection method will be
identified, and then the validity and reliability of the research will be explained.
Source: Adapted from Saunders et al. 2000
Figure 5:The research process “onion”
3.1 Research purpose
According to (Saunders et al., 2000) enquiries can be classified in terms of their
purposes as well as the research strategy which is used (Robson, 1993).
There are three categories; one of them is often used:
• exploratory study: this category is trying to find out “what is happening; to
seek new insights; to ask questions and to assess phenomena in a new light” (Robson,
1993).It is particularly a useful approach if you wish to clarify your understanding of a
problem and it is suitable when the researcher is uncertain which theories are relevant and
when important characteristics and relations are difficult to determine.
Sampling Secondary Data Observation Interview Questionnaire
Data Collection Method
Cross Sectional
Longitudinal
Experiment
Survey
Case Study
Grounded Theory
Research Strategy
Deductive
Inductive
Research Approach
Ethnography
Action Research
Positivism
Research Philosophy
Phenomenology
Time Horizon

44
• Descriptive study: The object of descriptive studies is “to portray an
accurate profile of persons, events or situations” (Robson, 1993).This may be an extension
of an exploratory research. It is necessary to have a clear picture of the phenomena of
which the data will be collected prior to the collection of the data.
• Explanatory study: establish causal relationships between variables. In these
studies the emphasis is on studying a situation or a problem in order to explain the
relationships between variables.
As we know what we want to investigate but we are not sure about the answers, we
have chosen descriptive research. Also because the relationship between the variables is
going to be discovered, it is also explanatory.
3.2 Research Philosophy
According to (Saunders et al., 2000), there are two research processes which
dominate the literature: positivism and phenomenology.
Positivism approach was influenced by the scientific discoveries made during the
18th and 19th centuries. It seemed clear at that time that the body of knowledge existed
independently of whether people knew it or not, and the scientific task was to discover this
knowledge. It was assumed that there are laws that manage the operation of the social
world and these can be discovered. Social behavior is seen as a result of external pressure
acting on relatively passive people. It was assumed that there was such a thing as absolute
truth and that it could be used (once obtained) to create a better society. This research
tradition leads to the development of methods that concentrate on producing supposedly
objective data, usually in the form of statistics.
The assumption is that “the researcher is independent of and neither affects nor is
affected by the subject of the research”.
Phenomenologists deny what positivists assert, that humans can be studied using
the same philosophical base as used in studying physical objects or other animals.
Phenomenologists assert that there is a difference between the subject matter of sociology
and natural science. Humans are active, conscious beings and they can make choices.
This line of argument is persuasive in the case of business and management
research. The critical to the positivism tradition is that the social world of business and

45
management is far too complex to lend itself to theorizing by definite laws in the same way
as the physical sciences (Saunders et al., 2000).
It is important to consider that there is no research approach “better” than another,
they are “better” at doing different things. Lots of researches are a mixture of two
philosophies (Saunders et al.,2000).In this research, in order to find the factors of the
customer loyalty model in banking industry in Iran, positivism is the philosophy .
3.3 Research Approach
The research approach is deductive when a theory and the hypothesis (or
hypotheses) are developed and a research strategy is designed to test the hypothesis, or it is
inductive when the data is collected and the theory is developed as a result of the data
analysis. The deductive approach owes more to positivism and inductive approach more to
phenomenology, although it is believed that such labeling is potentially misleading and of
no practical value (Saunders et al., 2000).
This research is deductive because first the hypotheses are developed and then the
research strategy is designed.
3.4 Research Strategy
Research strategy is a general plan of how to answer the research questions that
have been set. What matters is that the strategy that is appropriate for the research
question(s) and objectives be chosen (Saunders et al., 2000).Saunders et al. (2000)
explained that the research strategy is employed as follow:
• Experiment: Experiment is a classical form of research that owes much to
natural sciences and also social sciences, particularly psychology. It involves the definition
of theoretical hypothesis, selection of samples and allocation of them to different
experimental conditions, introduction of planned changes, measurement on some variables
and control of other variables.
• Survey: Survey method is a popular and common strategy in business
research. Surveys allow the collection of a large amount of data from a sizeable population
in a highly economical way. Based mostly on the questionnaires, the data are standardized
and allow easy comparison. It is also easily understood. But much time is spent in
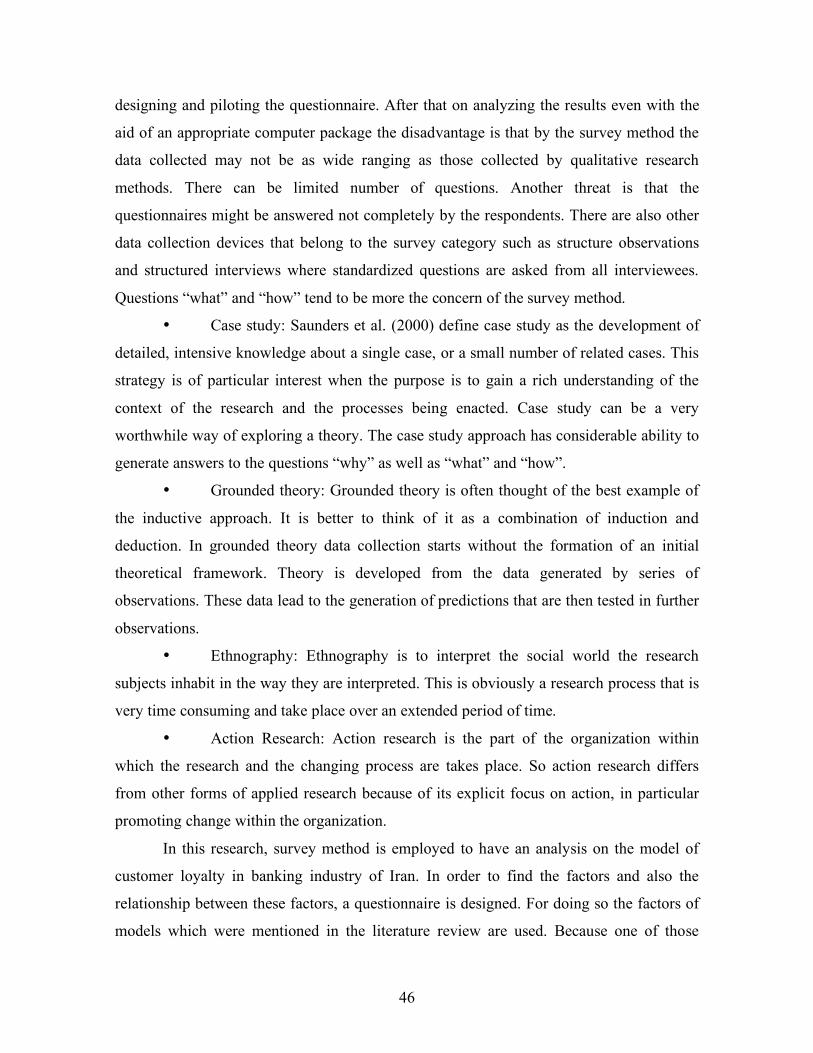
46
designing and piloting the questionnaire. After that on analyzing the results even with the
aid of an appropriate computer package the disadvantage is that by the survey method the
data collected may not be as wide ranging as those collected by qualitative research
methods. There can be limited number of questions. Another threat is that the
questionnaires might be answered not completely by the respondents. There are also other
data collection devices that belong to the survey category such as structure observations
and structured interviews where standardized questions are asked from all interviewees.
Questions “what” and “how” tend to be more the concern of the survey method.
• Case study: Saunders et al. (2000) define case study as the development of
detailed, intensive knowledge about a single case, or a small number of related cases. This
strategy is of particular interest when the purpose is to gain a rich understanding of the
context of the research and the processes being enacted. Case study can be a very
worthwhile way of exploring a theory. The case study approach has considerable ability to
generate answers to the questions “why” as well as “what” and “how”.
• Grounded theory: Grounded theory is often thought of the best example of
the inductive approach. It is better to think of it as a combination of induction and
deduction. In grounded theory data collection starts without the formation of an initial
theoretical framework. Theory is developed from the data generated by series of
observations. These data lead to the generation of predictions that are then tested in further
observations.
• Ethnography: Ethnography is to interpret the social world the research
subjects inhabit in the way they are interpreted. This is obviously a research process that is
very time consuming and take place over an extended period of time.
• Action Research: Action research is the part of the organization within
which the research and the changing process are takes place. So action research differs
from other forms of applied research because of its explicit focus on action, in particular
promoting change within the organization.
In this research, survey method is employed to have an analysis on the model of
customer loyalty in banking industry of Iran. In order to find the factors and also the
relationship between these factors, a questionnaire is designed. For doing so the factors of
models which were mentioned in the literature review are used. Because one of those

47
models is for e-commerce industry, I had to check the factors to see whether they are
appropriate for banking in Iran or not. So I had a discussion with some experts in banking
industry to show them the factors which were going to be used in the new model. After the
discussion all of the considered factors were accepted. after finalizing the factors the
questionnaire of those researches were combined together, then among those questions
some had little changes, some were eliminated, some were added and the rest were not
changed. Then a complete translated questionnaire was ready.
3.5 Time Horizon
(Saunders et al., 2000) believes that most research projects undertaken for
academic courses are necessarily time constrained. When planning for the research there
are two options in the time perspective:
• Cross –sectional: a study in which a group(s) of individuals are composed
into one large sample and studied at only a single point of time.
• Longitudinal: a study in which an individual or a group of individuals is
observed over a period of time.
In this research cross –sectional study is performed.
3.6 Data Collection Method
The gathering of data may range from a simple observation at one location to a
grandiose survey of multinational corporations at sites in different parts of the world. The
method of research can determine how the data are collected. Questionnaires, standardized
tests, observational forms, laboratory notes, and instrument calibration logs are among the
devices used to recover raw data (cooper and Schindler, 2003).
3.6.1 Sampling
If we collect and analyze data from every possible case or group member, this will
be termed a census. However, for many research questions and objectives like this research
it will be impossible to collect or analyze all the data available owing to the restriction of
time, money and often access. Sampling techniques provide a range of methods that enable
us to reduce the amount of data that is needed to be collected by considering only the data
from a sub-group rather than all possible case elements (Saunders et al., 2000).

48
As in this study there are many constraints on budget and time for surveying the
entire population and it is impracticable to survey the entire population, sampling provides
a valid alternative to the census (Saunders et al., 2000).
3.6.1.1 Population
A population consists of all elements-individuals, items, or objects-whose
characteristics are being studied. The population that is being studied is also called the
target population (Mann, 1995).The population in this research consists of the bank
customers.
3.6.1.2 Sampling Frame
The sampling frame for any probability sample is a complete list of all cases in the
population from which your sample will be drawn (Saunders et al., 2000).
As the research questions in this study concern bank customers, so the sampling
frame is a complete list of all banking customers in Iran.
3.6.1.3 Suitable Sample Size
Determining sample size is a very important issue because samples that are too
large may waste time, resources and money, while samples that are too small may lead to
inaccurate results. According to (Saunders et al., 2000) researchers normally work to a 95
percent level of certainty. This means that if your sample were selected 100 times, at least
95 of these samples would be certain to represent the characteristics of the population. The
margin of errors describes the precision of the estimation of the population. For most
business and management researches, researchers are content to estimate the population’s
characteristics to within plus or minus 3-5 percent of its true values. This means that if 45
percent of the sample is in certain category, the estimation for total population within the
same category will be somewhere between 42 and 48 percent.
According to (Cooper and Schindler, 2003) the formula for calculating the sample
size is as below:
(+,-) 0.05=desired interval range within which the population proportion is
expected (subjective decision)
49
1.96 (σρ
) =95 percent confidence level for estimating the interval within which the
population proportion is expected (subjective decision)
σρ =0.0255= standard error for the proportion (0.05/1.96)
pq = measure of sample dispersion(used here as an estimate of the population
dispersion).
n=pq /σ 2ρ
In this research, after running the 30 questionnaires, a sample size was calculated.
And the result shows 280 questionnaires.
N= 0.24*0.76 /0.0255 2 =280
In order to have an accurate model I ran 400 questionnaires, and I got 392 back.
From this number, 388 were completely useful.
So again at the end of he research I tested the above formula to see whether the
sample size was enough or not. The result shows that by 295 questionnaires would be
enough, but as I mentioned above I had more questionnaires.
n= 0.26*0.74 / 0.0255 2 = 295
3.6.1.4 Response Rate
While employing all probability samples, it is very important to consider the
response rate. According to (Saunders et al.,2000), response rates in business surveys are
usually as low as 15-20 percent for postal surveys and also response rate of between 50 to
92 percent for questionnaire surveys and of 73 to 99 percent for telephone interviews.
Therefore I asked the customer in my sample population to fill the questionnaires.
Those who didn’t want to participate mentioned the lack of time was the reason.
The response rate in this research performing the above method of data gathering
was calculated as 97 percent and this is because the questionnaires were given one by one
and face to face.
50
According to (Saunders et al., 2000) the actual sample size of this research is
calculated by this formula:
N=n*100/ (response rate)
N=280*100/97 =288
This means by spreading 288 questionnaires, I could have the minimum sample
size which is 280, but as I mentioned previously, I had 400 questionnaires and got 392
filled, among them some were useless, and 388 were gained completely useful.
3.6.1.5 Sampling Technique
According to (Saunders et al., 2000), sampling techniques can be divided into two
types:
• Probability or representing sampling: The chance or probability of each
case being selected from the known population and this is usually equal for all cases. It is
most commonly associated with survey-based researches where you need to make
interfaces from your sample about a population who answer your research questions or
meet your objectives.
• Non-probability or judgmental sampling: The probability of each case being
selected from the total population is not known and it is impossible to answer research
questions or to address the objectives that require making statistical inferences about the
characteristics of the population.
Then the first 4 banks which have the most market shares in the banking industry of
Iran similar to Beerli et al. (2004) were chosen. According to Beerli et al.(2004) and the
statistical results which shows that near to 60 percent of the banking transaction and
monetary assessments of Iranian banks are in Tehran so the questionnaires were given in
the capital. This choosing was because of the time and money limitations .Then for each
bank, the same number of branches was chosen randomly. Then the same number of
questionnaires was given to the respondents at the main door of each branch.

51
Source: Adapted from Saunders et al. 2000
Figure 6:Sampling Techniques
3.6.2 Collecting primary data using questionnaire
(Saunders et al., 2000) note that the greatest use of questionnaires is made by the
survey strategy. Questionnaires can therefore be used for descriptive research, such as that
undertaken using attitude and opinion questionnaires and questionnaires of organizational
practices will enable you to identify and describe the variability in different phenomena.
3.6.2.1 Questionnaire design
Because of the reasons mentioned above I used a self-administered questionnaire
method for collecting the primary data. More importantly replicated a study that had been
done in Taiwan by (Lin and Wang, 2006) and in Spain by (Beerli, Martin, Quintana,
2004)’s questionnaire.
Hence in this research I combine those two questionnaires and added some more to
them.
First the duplicated questions were omitted. Then because of the different
environment between the banking industry of Iran and other countries, questions had to be
checked to see whether they needed localization changes or not. Some of the questions
were edited for this reason. And a few questions were added to some of the factors. After
Sampling
Quota
Simple Random Systematic
Stratified Random
Cluster
Probability
Multi Stage
Purposive
Heterogeneous Homogeneous Critical Case Typical Case Extreme case
Non-Probability
Snow ball
Self-Selection Convenience
52
that they were translated accurately to Farsi for being simple to be understood by the
respondent.
(Salant and Dillman, 1994) argue that, to achieve a response rate as high as
possible, you need to explain clearly and concisely why you want the respondent to
complete the survey on the first page. Regarding this issue a covering letter was provided
for the first page.
The questions in the questionnaire tried to find the factors of customer loyalty in
Iran.
The above opinions were measured by requesting respondents to indicate, on a
five-point Likert-type scales, anchored on “1 = to a very little extent” through “5 = to a
very great extent”, their agreement or disagreement with a series of statements that
characterize the factors for loyalty model of the customers in banking industry in Iran.
Likert scales were developed in 1932 as the familiar five-point bipolar response
format most people are familiar with today. These scales always ask people to what extent
they agree or disagree with something, approve or disapprove something and believe
something to be true or false. There's really no wrong way to do a Likert scale, the most
important thing is to at least have five response categories (Likert, 1932).
The questionnaire also contained some personal questions to reach to some
contextual sense of the answers collected such as name, age, position, etc.
3.6.2.2 Pilot testing
According to (Saunders et al., 2000) the purpose of the pilot test is to refine the
questionnaire so that respondents will have no problems in answering the questions and
there will be no problems in recording the data.
For small-scale questionnaires, it is unlikely to have sufficient time or financial
resources for such testing. However, it is still important to have the questionnaire pilot
tested.For most questionnaires the minimum number for a pilot is 10 (Fink, 1995).
Although these questionnaires were used before but because of the little changes
that have been done I needed to have a pilot test. The pilot test was done in three stages.
The first stage was done by some banking experts to see whether the factors of this
model are proper in this environment or not. All of them agreed with the factors except the
53
factor “trust” which was in the m-commerce model, and the reason is because of the
different nature of these two industries. For this reason, I ran a short questionnaire to see
whether this factor could have influence on the loyalty or not. The questionnaire with its
analysis results are shown in appendix B. approximately all of the respondents mentioned
that they trust the banks in Iran and by having this result and the experts’ comments this
factor wasn’t used.
The next stage was done for becoming sure of the simplicity of the questionnaire.
So 20 questionnaires were given to the customers of the bank to see whether the questions
were understandable or not. In this phase I was beside each customer during the filling
process and I took notes of all of their comments. After doing the pilot test some little
editing was done.
The last phase of the pilot test was done by 30 customers to see whether every
thing was ok with the questionnaire or not. Fortunately I got the positive answer.
3.6.2.3 Some Approaches to Gain Access
Feasibility is an important determinant of what is chosen for research and how to
undertake the research (Saunders et al., 2000). Access is a problematic area. “The reality of
undertaking a research project may be to consider where you are likely able to gain access
and develop a topic to fit the nature of that access.” Several strategies can be used to gain
access. The strategies that he mentions are:
• Allowing yourself sufficient time
• Using existing contacts and developing new ones
• Providing a clear account of purpose and the type of access required
• Overcoming organizational or individual concerns about the granting of access
• Identifying possible benefits to the organization or individual in granting you
access
• Using a suitable language
• Facilitating ease of reply when requesting the access
• Developing your access on an incremental basis
• Establishing your credibility with intended participation

54
In this research a lot of time was spent on gaining access.
3.7 The credibility of the research finding
According to (Saunders et al., 2000) reducing the possibility of getting the wrong
answer means that attention has to be paid to two particular points in the research design:
• Reliability
• Validity
In order to illustrate the differences between validity and reliability (Zikmund,
2000) uses three rifle targets, Figure 7.
Source:Adapted from Saunders et al., 2000
Figure 7:An illustration of the differences between validity and reliability
3.7.1 Reliability
This is about the results of each investigation, which have to be reliable. If nothing
changes in a population between two investigations for the same purpose, it is reliable.
(Robson, 1993) asserts that there may be four threats to reliability:
• Subject error: has to do with the time the interview is carried out. It is of
great importance to select a neutral time and date.
• Subject bias: is a great problem in organizations where the management is
of an authoritarian character and the interviewee(s) might say what the manager wants
them to say, not what they feel.
• Observer error: can be lessened with a high degree of structure to the
interview schedule.

55
• Observer bias: this is a question about how the interviewer interprets the
data received.
As we dispensed the questionnaires during the exhibitions we really did not face
the subject error. For reducing the subject bias, we tried to make the respondents certain
that their answers would be considered confidential. Since the questionnaire was designed
as a survey format, we did not face the observer error or the observer bias.
A minimum (Cronbach, 1951)’s Alpha value of 0.7 indicates reliability of the
questionnaire.
3.7.2 Validity
Validity is concerned with whether the findings are really about what they appear
to be about (Saunders et al., 2000). There are three tests for validity:
• Construct validity: establishing correct operational measures for the
concepts being studied.
• Internal validity: (for explanatory and causal studies only, not for
descriptive or exploratory studies) establishing a causal relationship, whereby certain
conditions are shown to lead to other conditions.
• External validity: establishing the domain to which a study’s findings can
be generalized.
If a question can be misunderstood, the information is said to be of low validity. In
order to avoid low validity, we piloted the questionnaire after translating it into Farsi. In
addition, meetings were arranged in a semi-interview environment and questionnaires were
given to the respondents face-to-face, so that if they faced any difficulties while filling out
the questionnaire, the ambiguity could be explained. By doing so, the validity was
increased.

56
Chapter 4 4 Analyze
In this chapter the results of the statistical analysis will be presented. The
statistical analysis has been done by SPSS software and for the modeling part, has been
done by LISREL software. Then some suggestions will be given according to the results.
4.1 General Information
In the questionnaire, we asked for some general information from the customers.
(Table 2) . The result shows that the most active customers are the ones between 20 and 35
and are university graduated. Also the results show that most of them have official
occupations. This could be because of their education.

57
Table 2 : General information
Gender Female Male
57% 43%
Age Under 20 20-35 35-50 50-65 Over 65
3% 71% 20% 5% 0.5%
Education Under diploma Diploma Bachelor-Master PhD and higher
1% 27% 63% 97%
Occupation Occupying –retired Free market Not occupied –housekeeper Not answered
67% 11% 20% 2%
4.2 Analysis of the factors
4.2.1 Quality
As it was mentioned in the second chapter, quality is one of the most important
factors which have a main role on making a customer loyal or churner.
In the banking industry, the product is equal to the service. It means that a customer
perceives a service which in the customer’s view can be the same as a product of another
industry. In the previous models the authors considered quality as only one factor. So in
this research also at first the quality of the service in banking industry is considered as just
one category.
After the questionnaires were given to the respondents and I got the filled ones
back, by analyzing them in SPSS software I noticed that there could be two categories for
quality. Then by having the correlation between the questions it seemed that it could be
divided in to two separate groups. By focusing on the common attributes of each group it

58
became clear that we could break up the service quality in the banking industry into two
parts and name them: tangible quality(in which the perceived quality can be seen) and
intangible quality(in which the perceived quality can’t be seen).
Here are the whole quality questions:
Table 3:Perceived Quality Questions
Tangible perceived quality
1. The received interest from the bank is effective to continue my work with this bank.
2. Advertisement in broadcasts or relatives is effective for me to use the services of
this bank.
3. This bank’s facilities are attractive and modern. (Such as telephone banking,
internet…)
4. This bank’s employees are tidy in appearance
5. Materials associated with the services are visually clean, tidy, intact, and enough.
(Such as pen, chair…)
6. This bank informed me of its side services from the beginning.
7. The opening hours of the bank are convenient to me.
8. My needs and interests are considered in the bank’s services.
9. I use this bank because all of its services are available in the branch.
Intangible perceived quality
1. This bank insists on providing the services error-free.
2. Employees of this bank solve your problems when they promise to do so
3. This bank provides its services at the time it promises to do so
4. The bank employees are fast enough in providing the services.
5. Employees of this bank are always willing to help you o overcome the problems.
6. Employees of this bank are aware of when exactly services will be performed
7. The behavior of employees of this bank instills confidence in customers
8. Employees of this bank are constantly courteous to you
9. Employees of the bank pay special attention to you.
The Cronbach’s alpha, which was gained from these questions after running the
questionnaires, were 0.92 which was a very high one. This means that the questions were

59
reliable and also valid. But by having a deeper look at them and considering the situation
in Iranian environment, and also having the factor analysis, these questions could be
separated into two groups. Questions 1 to 9 are in tangible group and the others are in
intangible group. Again after separation, Cronbach’s alpha was tested. This time the result
of the first category was 0.84 and the result of the second was 0.90. They show that the
division is done correctly.
The table4 shows the mean and variance of the questions which are answered by
the customers. Table 4:Perceived Quality Mean and Std. Deviation Result
Mean Std. Deviation
T-Q1 3.33 1.167
T-Q2 3.37 .932
T-Q3 3.63 .989
T-Q4 3.55 1.020
T-Q5 3.42 1.116
T-Q6 3.05 1.064
T-Q7 2.77 1.239
T-Q8 3.03 .978
T-Q9 3.40 1.006
Mean Std. Deviation
I-Q1 3.28 1.065
I-Q2 3.46 .970
I-Q3 3.47 .948
I-Q4 3.24 1.165
I-Q5 3.36 1.067
I-Q6 3.33 .945
I-Q7 3.56 .998
I-Q8 3.59 .949
I-Q9 3.18 1.001

60
Mean column shows the average answers to the questions. By considering the five-
point-Likert method and also by considering that “1” is to a very little extent and “5”is to
the most extent.
In the first category the respondents felt particularly strong about the third question
because it has the highest mean in the survey with the average mean of 3.63 and the less
highly rated question is the 7th one, with the average mean of 2.77. In the second category
the 8th question has the maximum mean and the 9th question has the minimum score.
The table also shows that the modern facilities and also the respect are much more
important in the above points, so the managers can increase the perceived quality ratio by
considering the points.
Also the following tables 5 and 6 show the average of means and also variances of
the questions. Variance and Std. deviation show the spreadness of the answers. It means
that if we have a high average mean number and also high variance, it doesn’t mean that
the questions have been answered properly. It means that some thing was wrong with the
questions, and we have to find the reason. A low variance is a good symptom, because it
shows that the questions were designed in such a way that most of the customers
understand it in the same way. Table 5:Tangible Quality Average Result
Tangible Quality Category Mean
Item Means 3.284
Item Variances 1.125
Table 6 :Intangible Quality Average Result
Intangible Quality Category Mean
Item Means 3.385
Item Variances 1.029

61
4.2.2 Satisfaction
As it was mentioned in chapter 2, and as every person, at least has felt this feeling
once, all can agree that satisfaction has a major role in being loyal to a brand, company or
etc.
Satisfaction in banking industry means that the product or service which is offered
to the customer makes him/her satisfied and meets his/her expectations. This means that
the customers feel good to have the service from that bank another time. In the competitive
environment which the competitors are trying to have the other’s customers, this
antecedent can be vital. By this, the company can gain more profit. The direct monetary
profit and the indirect one which can be for example advertising by word-of-mouth process
or etc, can be the means of profit gaining.
This factor in this research is measured by four questions that are brought in table
7, and the test for reliability of these questions was done. The result of Cronbach’s alpha is
0.78 which is a good one and shows that the questions were chosen properly and they are
reliable.
Table 7:Satisfaction Questions
1. This bank doesn’t meet my needs.
2. The bank I work with is far from my expectations of an ideal bank.
3. According to my experiences, I’m satisfied with this bank.
4. In comparison to other banks, I consider this bank and its services successful.
The factor analysis for this part was done and the result shows that these 4
questions are correlated for banking industry in Iran. It means that all of these questions
are trying to show one thing, which is satisfaction in the banking industry.
The table below shows the mean and the variance of the questions which are
answered by the customer.

62
Table 8: Satisfaction Mean and Std. Deviation
Mean Std. Deviation
S1 3.36 .969
S2 2.98 1.023
S3 3.70 .867
S4 3.46 .957
It seems that most of the customers answer higher than average. The respondents
felt particularly strong about the 3rd question because it has the highest mean in the survey
and less highly rated question is the second one, with the average mean of 2.98.
In the table 9 the average of the mean and variances are shown.
Table 9:Satisfaction Average Result
4.2.3 Switching Cost
As it was mentioned in chapter 2, switching cost means the price (internal or
external) which a customer should pay for moving from one company or brand and
choosing another. According to what has been said in the previous researches, there are
some barriers for the customer in defection time, so they don’t feel that it is simple to
move.
This factor in this research is measured by three questions, which are mentioned in
the table 10.
Satisfaction Mean
Item Means
Item Variances
3.376
.913

63
Table 10: Switching Cost Questions
1. To change to another bank involves investing time in searching for information
about other banks
2. To change to another bank involves much effort in deciding which other bank to
use
3. To change to another bank involves a risk in choosing another bank which might
turn out not to satisfy me
These questions were analyzed by SPSS software and Cronbach's alpha 0.71 was
gained, which is a completely reliable result.
Then again factor analysis was done for these questions and the result shows that
the questions are trying to identify the switching cost factor. As the following table is
showing, the mean and std. Deviation are showing that the questions were understandable
for the customers, and all of the respondents had approximately a common understanding.
Table 11 :Switching Cost Mean and Std. Deviation
Mean Std. Deviation
SC1 3.22 1.034
SC2 2.97 1.014
SC3 2.97 1.006
The table 11 shows that the first question has the maximum mean in the answers,
and the other two questions have the same means. Also the std. Deviation column shows
that the most common understandable question is the third one.
By paying attention to these points, managers can understand that finding
information about the services of the new banks is the most time and energy consuming
activity for customers and they don’t feel easy to do this. So by simplifying these activities
they can gain more customers.

64
Also the average of the variance and the mean scale in table 12 is showing that the
questions have a common concept in the customers’ point of view.
Table 12: Switching Cost Average Result
Switching cost Mean
Item Means
Item Variances
3.052
1.036
4.2.4 Choosing
This factor is trying to find the importance of customer choosing power. When a
customer decides to choose a company for getting some sort of services, for example a
bank to have the financial services, if the selection of that target company is done by
considering some factors, then being loyal to that company in the future is more possible
and probable.
At the beginning, four questions were designed to estimate the factor, but by having
the factor analysis for the results of the pilot test, the forth question was eliminated. After
elimination the analysis was done again and the gained Cronbach’s alpha for this factor for
the remained 3 questions is 0.71. Also factor analysis has been done for the questions and
the result shows that they are trying to represent one factor. The result of mean and Std.
Deviation of the questions are as below. Table 13 :Choosing Questions
1. Before choosing a bank I consider its advantages and disadvantages.
2. The decision which I make for choosing a bank for the first time is very
important
3. Before choosing a bank, I compare it with other banks.
As it is shown in the results of the table 14, the highest mean and the lowest std.
Deviation are for the first question, and this shows it is important for a customer to
consider the advantages of the service provider.
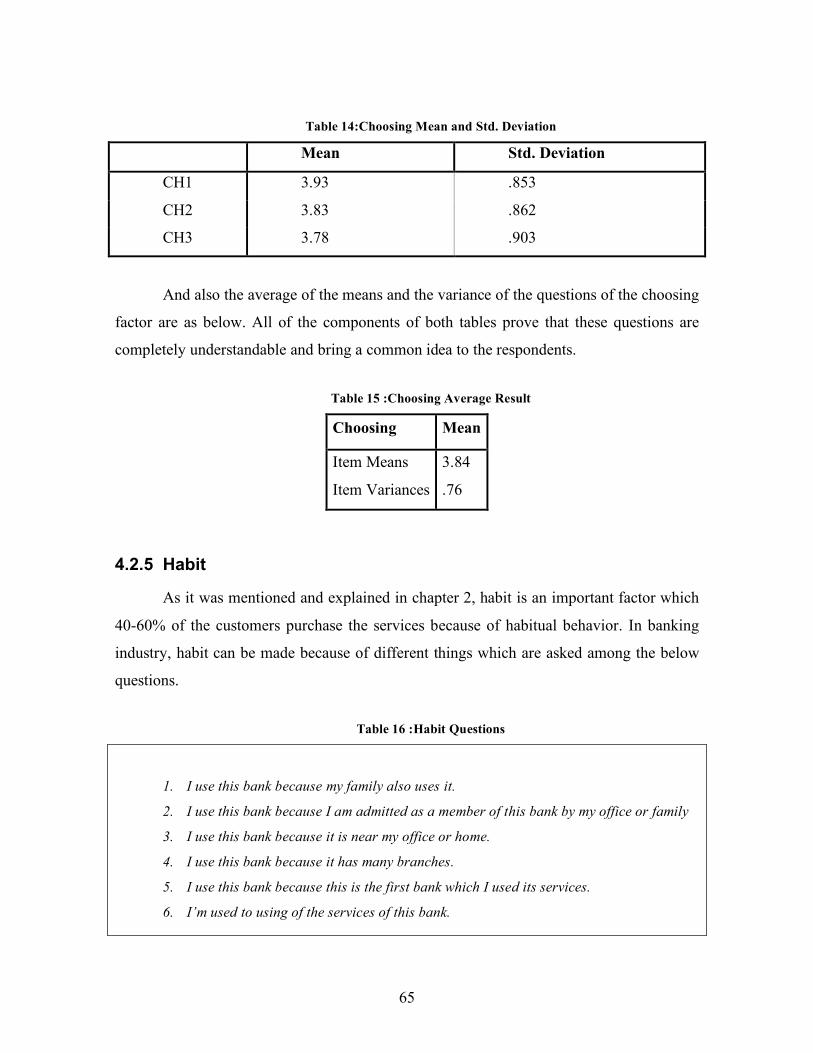
65
Table 14:Choosing Mean and Std. Deviation
Mean Std. Deviation
CH1 3.93 .853
CH2 3.83 .862
CH3 3.78 .903
And also the average of the means and the variance of the questions of the choosing
factor are as below. All of the components of both tables prove that these questions are
completely understandable and bring a common idea to the respondents.
Table 15 :Choosing Average Result
Choosing Mean
Item Means
Item Variances
3.84
.76
4.2.5 Habit
As it was mentioned and explained in chapter 2, habit is an important factor which
40-60% of the customers purchase the services because of habitual behavior. In banking
industry, habit can be made because of different things which are asked among the below
questions.
Table 16 :Habit Questions
1. I use this bank because my family also uses it.
2. I use this bank because I am admitted as a member of this bank by my office or family
3. I use this bank because it is near my office or home.
4. I use this bank because it has many branches.
5. I use this bank because this is the first bank which I used its services.
6. I’m used to using of the services of this bank.

66
After doing the analysis on the result of the pilot test, the questions were reduced
from 8 to 6 main ones, and the other two questions were not representing the habit factor.
In this part the Cronbach’s alpha which was gained from the respondents’ answers is 0.73
and it shows the reliability of the questions. Also by having the factor analysis on the
answers, the results prove that the questions are attempting to find this factor.
The table 17 shows the results of mean and Std. Deviation of the questions which
are related to the concept of habit. Also the average of the mean and variance in the next
table proves that the questions are designed correctly and have the same meaning for the
customers. Table 17:Habit Mean and Std. Deviation
Mean Std. Deviation
H1 2.75 1.096
H2 3.19 1.211
H3 3.75 1.096
H4 3.58 1.022
H5 3.24 1.120
H6 3.55 1.008
Among the above questions, the third question has the highest meaningful result
and the first one has the lowest score. Also the sixth question has the lowest std. deviation
and the second has the highest. Table 18:Habit Average Result
Habit Mean
Item Means 3.345
Item Variances 1.197
Also as a result, the distance between the branch and the office or home is the most
important for the customer, so it can be an important point to be considered by the
managers.

67
4.2.6 Loyalty
All of the factors which are mentioned above are designed to identify the
customer’s loyalty in banking industry in order to create a model in the Iranian industry.
To do so, in addition to the elements which were designed and discussed above, some
questions are trying to show the loyalty factor directly. Table 19 is showing them.
Table 19:Loyalty Questions
1. I would always recommend my bank to the others.
2. It would be difficult to change my beliefs about this bank.
3. I would always use this bank’s services.
4. I am a loyal customer to this bank.
5. I do not like to change to another bank because this bank sees my needs.
6. Even if close friends recommended another bank, my preference for this
bank would not change.
7. My intention to use the services of this bank would not be changed.
The Cronbach’s alpha of the questions is 0.84 which is a very good result. Also the
mean and Std. Deviation table of the question is showing the common understanding of the
questions.
Table 20:Loyalty Mean and Std. Deviation
Mean Std. Deviation
L1 3.63 .858
L2 3.11 .895
L3 3.72 .826
L4 3.48 .946
L5 3.41 1.080
L6 2.95 1.110
L7 2.97 1.005

68
The results show that highest mean value for the loyalty questions is for the first
one; this can help the managers to understand that a loyal person would automatically
advertise the services, and it could be an indirect profit program for the banks.
Table 21:Loyalty Average Result
Loyalty Mean
Item Means 3.323
Item Variances .932
Also the results show that the questions have the same meaning for the
respondents.
4.3 Correlation between factors
After discussing each factor and the questions which were designed to identify
them, now it’s time to analyze the correlation and relationship between the elements of the
model. Table 22:Correlation Result
Loyalty Satisfaction Tangible
Quality
Intangible
Quality
Switching
Cost Choosing Habit
Loyalty 1 0.664 0.637 0.571 0.354 0.318 0.110
Satisfaction 0.664 1 0.663 0.615 0.109 0.292 0.024
Tangible
Quality 0.637 0.663 1 0.739 0.208 0.312 0.097
Intangible
Quality 0.571 0.615 0.739 1 0.144 0.263 0.039
Switching
Cost 0.354 0.109 0.208 0.144 1 0.181 0.303
Choosing 0.318 0.292 0.312 0.263 0.181 1 0.023
Habit 0.110 0.024 0.097 0.039 0.303 0.023 1
* Correlation is significant at the 0.01 level (2-tailed)
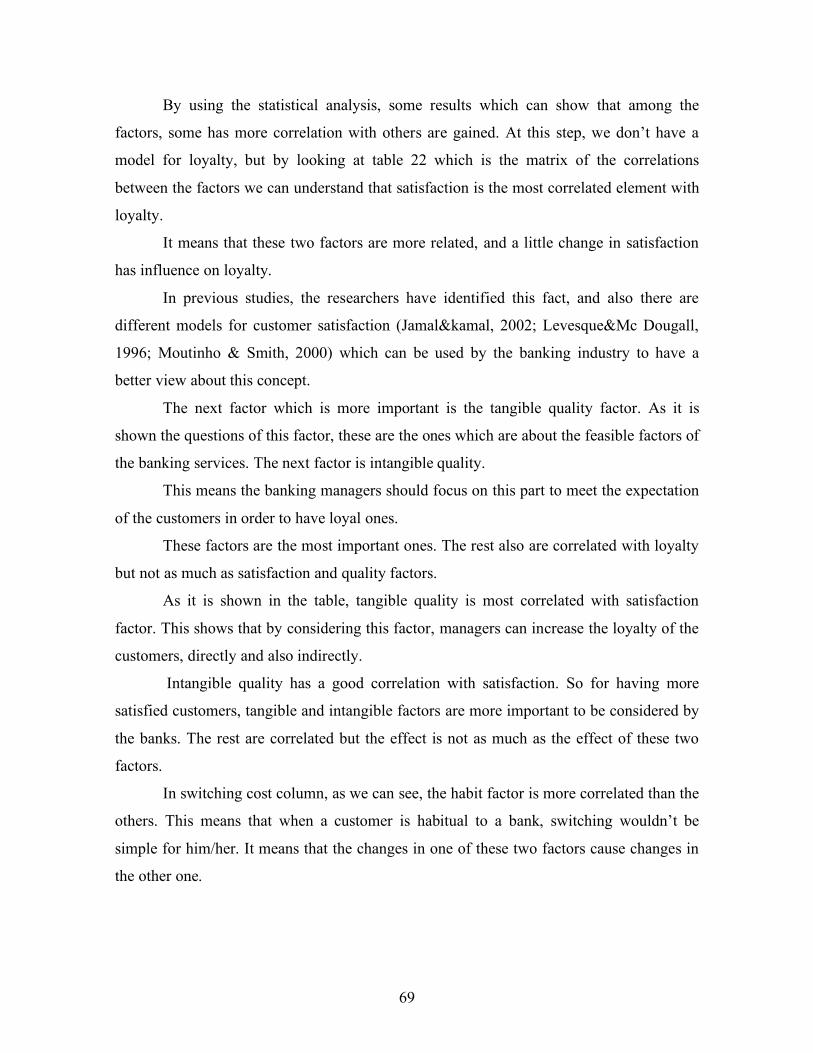
69
By using the statistical analysis, some results which can show that among the
factors, some has more correlation with others are gained. At this step, we don’t have a
model for loyalty, but by looking at table 22 which is the matrix of the correlations
between the factors we can understand that satisfaction is the most correlated element with
loyalty.
It means that these two factors are more related, and a little change in satisfaction
has influence on loyalty.
In previous studies, the researchers have identified this fact, and also there are
different models for customer satisfaction (Jamal&kamal, 2002; Levesque&Mc Dougall,
1996; Moutinho & Smith, 2000) which can be used by the banking industry to have a
better view about this concept.
The next factor which is more important is the tangible quality factor. As it is
shown the questions of this factor, these are the ones which are about the feasible factors of
the banking services. The next factor is intangible quality.
This means the banking managers should focus on this part to meet the expectation
of the customers in order to have loyal ones.
These factors are the most important ones. The rest also are correlated with loyalty
but not as much as satisfaction and quality factors.
As it is shown in the table, tangible quality is most correlated with satisfaction
factor. This shows that by considering this factor, managers can increase the loyalty of the
customers, directly and also indirectly.
Intangible quality has a good correlation with satisfaction. So for having more
satisfied customers, tangible and intangible factors are more important to be considered by
the banks. The rest are correlated but the effect is not as much as the effect of these two
factors.
In switching cost column, as we can see, the habit factor is more correlated than the
others. This means that when a customer is habitual to a bank, switching wouldn’t be
simple for him/her. It means that the changes in one of these two factors cause changes in
the other one.

70
For choosing factor, the results of this table show that loyalty, tangible quality and
intangible quality are more correlated with this factor. It means that for choosing a bank as
the service provider, quality factors can have a main role.
This table and the results which are mentioned are from the statistical analysis by
SPSS software.
At the next part, the analysis of the LISREL software on the relationship of the
factors is going to be explained.
4.4 Each factor and its question’s relationship
The important factors which are considered in this research to make the loyalty
model for banking industry in Iranian environment are as follow: Loyalty, Satisfaction,
Tangible quality, Intangible quality, Habit, Switching cost,Choosing.
For finding the relations between the factors, the LISREL software was used. All
the questions and the factors were introduced to the software in order to have the factor
analysis and also check the links between them.
Again all the questions for each factor were tested to find the relations between
them. The results are shown in the table 23.
Table 23:Questions Result
Factor and its questions T-Value Estimate Factor and its questions T-Value Estimate Switching cost
SC1 SC2 SC3
10.56 10.90 6.38
.78 .83 .36
Satisfaction S1 S2 S3 S4
12.20 9.59 12.67 7.86
.60 .47 .73 .73
Intangible Quality Q1 Q2 Q3 Q4 Q5 Q6 Q7 Q8 Q9
14.44 17.45 16.81 16.89 19.73 14.89 14.35 17.34 11.87
.72 .75 .71 .87 .89 .65 .67 73 .57
Tangible Quality Q1 Q2 Q3 Q4 Q5 Q6 Q7 Q8 Q9
6.65 7.63 11.44 14.49 15.25 11.61 8.32 13.45 12.42
.42 .38 .58 .71 .81 .62 .54 .65 .63
Habit H1 H2 H3 H4 H5
7.80 7.39 6.24 6.52 8.34
.51 .56 .43 .42 .59
Loyalty L1 L2 L3 L4 L5
12.87 11.02 13.6 13.29 13.05
.55 .50 .56 .61 .70

71
H6 7.82 .49 L6 L7
15.09 15.29
.80
.73 Choosing
CH1 CH2 CH3
11.13 9.84 9.96
.61 .51 .55
The results are made of two parts. First column is t-value that shows the validity of
the relationship between each question and the factor. When t-value is more than number
2, it means that the assumption is correct. In the table above all of the t-values are more
than 2 so all of the questions of the factors are trying to estimate their factors.
The next column is showing the coefficient of each question in defining the factor.
For example, if we want to define a formula for switching cost, it could be:
SC1 =0.78 Switching Cost
And it is the same for other factors and questions. They are shown in appendix C.
4.5 Factors relationship and suggestions
After defining the questions and the factors in the software, the relationships
between them have been extracted out and explained as below:
The analysis shows that satisfaction has a link with loyalty. This link is very strong,
and it shows that if the bank managers want to make the customers loyal, they should have
some special strategies to satisfy the customer. When a customer is satisfied with the
received services or the products of a bank, he/she doesn’t want to take the risk of
changing or moving to other competitors.
For this reason, managers should always consider the needs of the customers. It can
be the current needs or the ones which could be desired in the future. This means that the
managers should have a team which can estimate the future requirements by having the
fast movement in the world and technology, specially in the developing countries like Iran,
this movement could be a little faster, so the research team of the banks should consider
the environment and by having the focus on the culture requirements estimate the future
needs of the customer. Also the managers should consider the competitive environment,
and should think out of the box to offer the best and to satisfy the customers.
72
The next link which is going to be explained is habit. Habit also has a relationship
with loyalty. The t-value of the analysis for this relationship is more than 2, and this shows
that this relation ship exists. When a customer stays with a bank to have some sort of
services, it can have two reasons. First this customer is really satisfied with the current
services and the next reason could be the habitual behavior. It means that some sort of
reasons is related to the factor Habit. Some of the most important habitual reasons are
measured in this research like the family influence, or the distance which can make a
customer find the habit of using a special bank services. In finding the loyal customer, this
category also can be considered. But it is not as serious as the satisfied customers. Because
if the cause of the habitual behavior, like the distance or other reasons, change the
customer would stop the habit.
The customer managers should find this category and to minimize the risk of
defecting of these customers, they can find a way to change this group of customers to
satisfied ones. By doing this, the number of loyal customers is not changed at the moment
but the number of satisfied ones and also the number of future loyal customers is changed.
The next link which is valid, and its t-value is greater than 2 is the link between
switching cost and loyalty. By analyzing the answers of the three questions of this part, the
relationship between the loyalty of the customer and the switching cost can be explained as
below:
When a customer is not sure about the new bank which might be chosen, it makes
him/her not move simply and suddenly. He or she thinks that should spend more time in
order to be able to make a good decision. This process makes the customer stay more with
the current bank, because he/she considers the risk of not being satisfied with the new bank
and tries to think more about switching. By doing so, staying with the bank for a longer
time is more possible than choosing a new one carelessly.
The next factor that has a valid relationship with loyalty is choosing. In this factor
when a customer tries to find a new bank for having financial transactions, he or she tries
to compare the different banks with each other. And at last the best one will be found
(almost it is in his/her point of view), so because of the effort that the customer puts for
selecting the bank, he/she would be more satisfied with the services of the new bank. In
long time, this can make a long-term relationship, and the customer who tries to compare

73
the banks and select the proper one would be more satisfied and loyal. By this explanation,
the link between choosing and satisfaction becomes clear.
So the managers of the banks can give this permission to the banking industry’s
customers to have some sort of clear information about the services and also about the
bank itself. Choosing can have a big role in making a new customer a loyal one.
The next factors which are going to be discussed are the quality factors. As I
mentioned in the previous parts, in the main model, the researchers analyze the quality as
one factor. But by having a deeper look at this element, I found that it could be separated
into two factors, and I decided to measure them separately and find each one’s relation
with loyalty. The first category is about tangible qualities. This means the feasible
perceived quality in the branches or wherever the customer has the services, fore example,
the beauty or the neatness of the materials, has influence on the loyalty of the customer. It
is important for the customer to have the financial services in a tidy way. Also the other
element that affects this factor is the advertisements and the interest for the customers’
investments.
Intangible factor is about the infeasible quality .It also can be named as behavioral
quality, like the respectfulness of the bank’s staffs. This factor has also an important
relationship with the loyalty of the customer. Both of these factors got the valid t-value in
the analysis, but in comparison the tangible quality has a greater coefficient with loyalty.
This shows that the viable perceived quality has a greater role in making a customer loyal
or defector.
The bank managers should focus their strategies on offering the financial services
with considering these two factors. The mentioned elements can make the current customer
a loyal one. Also these two factors have influence on the satisfaction of the customer. It
means that by providing a better service, banks can make their customers more satisfied.
At the next step, they can make them loyal. As the analysis shows, these two factors have
influence on loyalty and satisfaction.
Quality factors have also influence on switching cost. It means that when a
customer receives a good quality (tangible or intangible),his/her expectations of the
banking services increase, so at the switching time, he wants to get more in the other new
banks, and this makes the movement not simple.

74
Quality factors have relationship with choosing. When a bank is offering the
financial services in a qualified way, and the customer perceived quality (tangible or
intangible) is high, at choosing time, he/she wants to compare the new bank’s services with
perceived one. This can also influence the new customers’ choosing decisions. This is
because of the effectiveness of word of mouth; new customers will come toward to have
their financial services in the mentioned bank. Also managers can advertise on the
customer perceived quality by having some researches on it and representing the results to
the public.
Also quality factors have relationship with habit. This is because when a customer
gets a good service quality, this remains in his mind and when needed he is likely to go the
same place again. So using those services becomes a habit for the customer.
Figure 8:Factors Relations
Loyalty
Switching Cost
Choosing Satisfaction
Intangible Quality
Tangible Quality
Habit

75
Chapter 5
5 Conclusion The aim of this chapter is to provide an overall conclusion regarding the findings
of this study. Based on the previous chapters this final chapter will provide answers to our
research questions. In order to do so, the research questions in chapter one, will be
answered in this final chapter. Lastly the conclusion will be presented as well as a
modified model for the customer loyalty in banking industry of Iran. Some further studies
will be mentioned at the last part.

76
5.1 Answering the research questions and the hypothesis
As it was mentioned in the previous part, the analysis of the data shows the
different links which have been explained previously. In the introduction chapter some
research questions were mentioned and I bring them again here:
• Can a model for customer loyalty in banking industry of Iran be specified?
• What factors influence the customer loyalty in banking industry in Iran?
• What are the relationships between the factors?
In order to answer to the research questions I, defined some more detailed
questions which are as below:
• Does customer satisfaction influence the loyalty of the customer?
• Does customer habit influence the loyalty of the customer?
• Does switching cost influence the loyalty of the customer?
• Does service quality influence the loyalty of the customer?
• Does choosing influence the loyalty of the customer?
According to the result of the analysis of the model, all of the research questions
can be answered.
A model for banking industry in Iran is made. And the factors which influence the
loyalty factor in this model are Satisfaction, Choosing, Switching cost, Habit, Tangible
quality and Intangible quality.Some of the factors also influence the others. The relations
were explained completely in previous parts. So the relationships of the factors are shown
in figure9.

77
Figure 9:Primary Hypotheses
During the research, one hypothesis which was about the quality changed into two
hypotheses. The final hypotheses which were considered in the research are as below:
H1: Choosing influences the loyalty
H2: Satisfaction influences the loyalty
H3: Switching cost influences the loyalty
H4: Habit influences the loyalty
H5: Perceived tangible service quality influences the loyalty
H6: Perceived intangible service quality influences the loyalty
According to the above explanation, the hypotheses of the research are all approved
(explained in previous parts). Also some more hypotheses were found in the analysis and
explained in the previous part. They are as below:
H7: Tangible quality influences satisfaction
H8: Intangible quality influences satisfaction
H9: Tangible quality influences choosing
Loyalty
Switching Cost
Choosing Satisfaction
Intangible Quality
Tangible Quality
H5 H6
H1 H2
H3
Habit
H4

78
H10: Intangible quality influences choosing
H11: Tangible quality influences switching cost
H12: Intangible quality influences switching cost
H13: Tangible quality influences habit
H14: Intangible quality influences habit
H15: Choosing influences satisfaction
5.2 Final model
The final model can be presented as follow.
Chi-Square=5653.44, DF (Degree of Freedom=595, RMSEA
(Root Mean Square Error of Approximation) =0.056, P-Value=0.00
Figure 10:Model Analysis Result
Loyalty
Switching Cost
Choosing Satisfaction
Intangible Quality
Tangible Quality
0.33 (2.31)
0.27 (2.15)
0.20 (4.01)
0.56 (6.31)
0.24 (4.85)
0.13 (2.01)
0.21 (3.04)
0.43 (7.27)
0.81 (25.51)
0.17 (2.71)
0.73 (22.74)
0.31 (5.21)
Habit
0.21 (3.04) 0.18
(2.05)
0.17 (2.71)

79
The numbers in the figure 10 show the coefficient of each factor and the ones in the
parentheses are t-values which are gained from the LISREL analysis of the model and
there are some relationships between the factors. Here a short explanation according to
what has been said in previous chapter and the numbers in the figure10 is brought.
As we can see, among the factors that have links with loyalty, satisfaction
coefficient is the highest of all. This means that satisfaction is more important for the
managers to be considered in order to make their customers loyal.
In comparison, (Beerli, Martin and Quintana, 2004) the coefficient of the
satisfaction in the perceived model (0.56) in Iran is less than the one which is chosen as the
resource model (0.83). This means that the satisfaction factor in Iran has less influence on
loyalty than Spain. This could be because of the differences in the environment and also
culture. It could be also because of the influence of the added factors on the model.
But the switching cost in Iran (0.24) has more influence than what is mentioned in
the original model (0.18). This could be because of the reasons mentioned above.
The perceived quality in the original model has no direct influence on loyalty,
while in the perceived model in Iran, both tangible and intangible perceived qualities have
influence on loyalty. (Tangible =0.33 and intangible =0.27).
The influence of tangible and intangible quality on the satisfaction factor in the
perceived model in Iran is 0.81 for tangible and 0.73 for intangible quality. Both of them
are greater than 0.23 which was mentioned in the source model. (Beerli, Martin, Quintana,
2004). This shows that the perceived quality in Iran has a major role to make the customer
satisfied and in the next step loyal.
Choosing has influence on loyalty in Iran (0.20). In the main model, (Beerli et al.,
2004) this factor wasn’t mention in the final model and the authors rejected the hypothesis
of the relationship of choosing with other factors in their model, but in this model this
relations are exist. Tangible and intangible perceived qualities also have influence on
choosing factor. When a customer decides to change his/her bank, the perceived quality of
the previous bank influences his comparison and decision. Also choosing factor has
influence on satisfaction (0.43) .When the customer spends time to compare the different
banks and find the best one based on his /her requirements, he or she would be more
satisfied with the chosen bank.
80
These perceived quality factors also have influence on habit. It is obvious that
giving good service to the customers, this can make the customer a habitual one.
Also the perceived quality factors have relation with switching cost and this is
because of the increase in the expectations of the customer for having services.
A point which should be mentioned is that in most of the different links between
both groups of quality with satisfaction, switching cost, habit and loyalty, the influence of
tangible quality is higher. This can be a point that helps managers to focus more on
tangible quality, for increasing the number of loyal customers
According to (Lin and Wang, 2006), the habit in the perceived loyalty model has
less influence (0.17) than the model of loyalty in m-commerce industry in Taiwan (0.35).
This could be because of the difference in the industries.
The main model of Beerli et al. (2004) is also tested with the gathered data in order
to have a comparison with the new provided model. The GFI (goodness of fit) parameter
of the main model is 0.80 and the GFI of the new model is 0.91. This shows that the added
factors to the previous model are done properly and in addition to the statistical result
which was mentioned previously in order to show the validity of the model, this parameter
also shows that the provided model is valid and it is improved in comparison to the
previous model.
If the managers of the banks want to have more loyal customers they can consider
the points which the analysis of the loyalty model shows.
5.3 Conclusion
Previous chapters tried to find the factors and their links with customer loyalty in
banking industry in the Iranian environment. As a conclusion this research found Habit,
Choosing, Switching cost, Tangible Quality, Intangible Quality and Satisfaction ,as the
factors which have influence on loyalty .Also these factors have relationships with each
other which were explained totally previously. And also the factors which are added to the
main model (Beerli, 2004) improve the fitness of the model.

81
5.4 Contribution
This research has been done to find the customer loyalty factors and their relations
in order to present a model for customer loyalty in banking industry. And it has been done
in Iranian environment.
This research tries to present the factors which influence in this environment for
banking industry. And different factors and also different relations were found in this
study.
As it was mentioned previously in this research, loyal customers have different
benefits for the industries. Having more profit is the simplest one to mention. Banking
industry is not excluded, so managers can consider these findings in the strategies which
are took for the bank. Also the managers can focus on some factors only. According to the
main strategy of the bank, they can choose some factors of the presented model and by
considering the relations between them they can make their sub-strategies. Also it might
differ from one bank to another and it could be because of each bank’s goal.
It is hoped that this study could help the banking industry to make a better
condition in order to have a win-win situation.
5.5 Limitations
This research has some limitations, which are time and money. Although this
sample size is proved by the cooper’s formula and it is a valid sample size, but if the time
allowed this research could be done in a bigger sample size which needs time and money.
But all of the attempts were used not to allow the limitations to have influence on
the results.
5.6 Further research
These days the loyalty concept has great importance and its different aspects can be
studied in different situations.
This research tries to investigate more factors which have links with the customer
loyalty in banking industry in comparison to the previous researches. Also different
relations were found during this study.

82
It is hoped that the findings could stimulate further research in other parts of the
world; especially in the other developing countries .If this happens, the model can be
presented in a wider area not only in Iran.
The other people who are interested in modeling could analyze, find and test more
factors according to their environment, or also the same factors in other industries.
The above points can be categorized as “the internal loyalty model further
researches”. Also a research which is about the factors that influence the “loyalty model”
can also be done in order to find the external points which could differ from one
environment to another, in case of existence.
.
83
Reference
Aaker, D.A., (1991), “Managing Brand Equity: Capitalizing on the Value of a Brand Name”,
New York: The Free Press
Ahmad,R.,(2005), “ A conceptualisation of a customer-bank bond in the context of the twenty-
first century UK retail banking industry ”,International Journal of Bank Marketing Vol.
23 No. 4, pp. 317-333
Alam,M.,Khokhar,R.,(2006), “Impact of Internet on Customer Loyalty in Swedish Banks”,
Journal of Economic Psychology, Vol. 16, pp. 311-29.
Anderson, E.W. and Sullivan, M. (1993), “The antecedents and consequences of consumer
satisfaction for firms”, Marketing Science, Vol. 12, Spring, pp. 125-43.
Anderson, E.W., C. Fornell, and D. R. Lehmann (1994), “Customer Satisfaction, Market
Share, and Profitability: Findings from Sweden,” journal of Marketing, (July), pp.53-
66.
Anderson, R.D., Granbois, D.H. and Rosen, D.L. (1994), “The effects of consumership on
financial satisfaction: are good consumers more satisfied?” Developments in Marketing
Science, Vol. XVII, pp. 427-31.
Aydin,S.,Ozer,G.,(2005), “ The analysis of antecedents of customer loyalty in the Turkish
mobile telecommunication market”, European Journal of Marketing ,Vol. 39 ,No. 7/8
,pp. 910-925.
B. Verplanken, H. Aarts, A. van-Knippenberg, A. Moonen, (1998),”Habit versus planned
behavior: a field experiment”, British Journal of Social Psychology 37(1), , pp. 111–
128.
Banwari, M. and Walfried, L. (1998), “Why do customers switch? The dynamics of
satisfaction versus loyalty”, The Journal of Service Marketing, Vol. 12 No. 3, pp. 177-
94.
Bearden, W.O. and Teel, J.E. (1983), “Selected determinants of consumer satisfaction and
complaint reports”, Journal of Marketing Research, Vol. 20, February, pp. 21-8.
Beerl,A., Martin J.D.,Quintana A.( 2004), “A model of customer loyalty in the retail banking
market “European Journal of Marketing ,Vol. 38 No. 1/2, pp. 253-275

84
Berry, L.L. (1983), “Relationship marketing”, in Berry, L.L. et al. (Eds), Emerging
perspectives in Services Marketing, AMA, Chicago, IL.
Berry, L.L. and Parasuraman, A. (1991), Marketing Services: Competing through Quality,
Free Press, New York, NY.
Bitner, M.J., Booms, B.H. and Tetreault, M.S., (1990), “The service encounter: diagnosing
favourable and unfavourable incidents”, Journal of Marketing, Vol. 54, pp. 71-84.
Bloemer, J. and Kasper, H. ,(1995), “The complex relationship between consumer satisfaction
and brand loyalty”, Journal of Economic Psychology, Vol. 16 No. 2, pp. 311-29.
Bloemer, J., Ruyter, K. and Wetzels, M. (1998), “On the relationship between perceived
service quality, service loyalty and switching costs”, International Journal of Industry
Management, Vol. 9 No. 5, pp. 436-53.
Bloemer, J.M. and Kasper, H. (1993), “Brand loyalty and brand satisfaction: the case of
buying audio cassettes anew in The Netherlands”, in Proceeding of the 22nd European
Academy Conference, Barcelona.
Bloemer, J.M. and Lemmink, J.G. (1992), “The importance of customer satisfaction in
explaining brand and dealer loyalty”, Journal of Marketing Management, Vol. 8, pp.
351-64.
Bloemer,J.,Ruyter,k.D.,Peeters,P.,(1998 ), “Investigating drivers of bank loyalty: the complex
relationship between image, service quality and satisfaction”,International Journal of
Bank marketing,Vol.16,No.7,pp. 276–286
Bolton, R.N., Drew, J.H. (1991), "A multistage model of customer's assesment of service
quality and value", Journal of Consumer Research,Vol. 17 No.4, pp.365-84.
Boulding, W., Kalra, A., Staelin, R. and Zeithaml, V.A. (1993), “A dynamic process model of
service quality: from expectations to behavioral intentions”, Journal of Marketing
Research, Vol. 30 February, pp. 7-27.
Bowen, D.E. and Schneider, B. (1988), “Services marketing and management: implications for
organizational behaviour”, in Stow, B. and Cummings, L.L. (Eds), Research in
Organizational Behaviour, Vol. 10, JAI Press, Greenwich..
Burnham, T.A., Frels, J.K., Mahajan, V. (2003), "Consumer switching costs: a typology,
antecedents and consequences", Journal of The Academy of Marketing Science, Vol.
31 No.2, pp.109-26.

85
Carman, J.M. (1990), “Consumer perceptions of service quality: an assesment of the
SERVQUAL dimensions”, Journal of Retailing, Vol. 66 No. 1, pp. 33-5.
Chaudhuri, A. and M.B. Holbrook, (2001), “The Chain of Effects from Brand Trust and Brand
Affect to Brand Performance: The Role of Brand Loyalty,” Journal of Marketing, Vol.
65, No. 2:81-93, April.
Christopher, M., Payne, A.F.T. and Ballantyne, D. (1991), Relationship Marketing: Bringing
Quality, Customer Service and Marketing Together, Butterworth Heineman, Oxford.
Chumpitaz,r.,Paparoidamis,Nicholas,G.,(2004),”service quality and marketing performance in
bssiness-to-bussiness markets;existing the mediating role of client satisfaction
managing service quality”,Vol.14,No.2/3,pp.235-248.
Clarke, M. and Payne, A.F.T. (1993), “Customer retention: does employee retention hold the
key to success?” in Emerging Issues in Marketing, Proceedings of the 1993 Marketing
Education Group Conference, Loughborough.
Cody, K., Hope, B. (1999), "EX-SERVQUAL: an instrument to measure service quality of
extranets", Proceedings of the 10th Australasian Conference on Information Systems,
Wellington, 1-3 December, p. 207.
Colgate, M., Stewart. K. and Kinsella, R. (1996), “Customer defection: a study of the student
market in Ireland”, International Journal of Bank Marketing, Vol. 14 No. 3, pp. 23-9.
Cooper,Donald R. and Schindler P.S.,(2003),Business Research Method,Mc Graw-Hill.
Cornel Wisskirchen, Dirk Vater, Tim Wright, Philippe De Backer and Christine
Detrick,(2006),” The customer-led bank: converting customers from defectors into fans
”, Journal of Strategy & Leadership ,Vol. 34 No. 2 , pp. 10-20,
Coyles,S. and Gokey,T.,(2005),” Customer retention is not enough”, Journal of Consumer
Marketing,vol.22 No.2 ,pp. 101–105
Cronin, J.J. Jr and Taylor, S.A. (1992), “Measuring service quality: a reexamination and
extension”, Journal of Marketing, Vol. 56, July, pp. 55-68.
D. Trafimow, (2000)Habit as both a direct cause of intention to use a condom and as a
moderator of the attitude-intention and subjective norm-intention relations, Psychology
and Health 15(3), pp. 383–393.
Dawes. J. and Swailes, S. (1999), “Retention sans frontieres: issues for financial service
retailers”, International Journal of Bank Marketing, Vol. 17 No. 1, pp. 36-43.

86
Day, G.S. (1969), “A two-dimensional concept of brand loyalty”, Journal of Advertising
Research,Vol. 9, September, pp. 29-35.
DeLone, W.H. and E.R. McLean, (1992) “Information Systems Success: The Quest for the
Dependent Variable,” Information Systems Research, Vol. 3, No. 1,pp.60-95.
DeLone, W.H. and E.R. McLean, (2003) “The DeLone and McLean Model of Information
Systems Success: A Ten-Year Update,” Journal of Management Information Systems,
Vol. 19, No. 4:pp.9-30
Dick, A.S. and Basu, K. (1994), “Customer loyalty: toward and integrated conceptual
framework”, Journal of the Academy of Marketing Science, Vol. 22 No. 2, pp. 99-103.
Dodds, W.B., K.B. Monroe, and D. Grewal, “Effects of Price, Brand, and Store Information on
Buyers’ Product Evaluations,” Journal of Marketing Research, Vol. 28, No. 3:307-319,
August 1991.
Eiglier, P. and Langeard, E. (1977), “A new approach to service marketing”, in Eiglier, P.,
Langeard, E., Lovelock, C.H., Bateson, J.E.G. and Young, R.F. Eds), Marketing
Consumer Services: New Insights, Marketing Science Institute report No. 77-115.
Ennew,Ch. And Binks,M.,(1996),”Good and bad customers: the benefits of participating in
the banking relationship”, International Journal of Bank Marketing Vol .14 No.2, pp.
5–13
Farquahar,J.D.,(2004),”Customer retention in retail financial services: an employee
perspective”, The International Journal of Bank Marketing ,Vol. 22 ,No. 2, pp. 86-99.
Fink,A.,(1995),The Survey Handbook.Thousnad Oaks:Sage
Ford, D. (1990), Understanding Business Markets: Interactions, Relationships, Networks,
Academic Press, London.
Fornell, C (1992). A method for improving customer satisfaction and measuring its impact on
profitability. International Public Relations Review, 15(3), 6-10.
Fornell, C. (1992), “National satisfaction barometer: the Swedish experience”, Journal of
Marketing, Vol. 56, January, pp. 6-21.
Fox,M.,Poje,m.,(2002),”Churn:are rural telcos immune?(telecommunication service providers
and customer relations)(Statistical Data Included)”, Rural Telecommunications,Vol
21,No.4,pp.20-24
87
Garland,R.,(2002),”Estimating customer defection in personal retail banking”,International
Journal of Bank Marketing ,Vol.20 No.7,pp.317-324
Gerrard, P. and Cunningham, B.J. (2003), “The diffusion of internet banking among
Singapore consumers”, International Journal of Bank Marketing, Vol. 21 No. 1, pp. 16-
28.
Gremler, D.D. and Brown, S.W. (1996), “Service loyalty; its nature, importance and
implications”, in Edvardsson, B., Brown, S.W., Johnston, R. and Scheuing, E. (Eds),
QUIS V: Advancing Service Quality: A Global Perspective, ISQA, New York, NY, pp.
171-81.
Gummesson, E (1999). Total relationship marketing: experimenting with a synthesis of
research frontiers. Australasian Marketing Journal, 7(1), 72-85.
Gustavsson,S.,Lundgren,E.,(2005),”Internationalization of SMEs ,the challenge of selecting
foreign market entry modes”,Lulea university of Sweden
H.C. Triandis, Attitude and Attitude Change, John Wiley & Sons, New York, 1971.
Hallowell, R. (1996), “The relationships of customer satisfaction, customer loyalty, and
profitability: an empirical study”, International Journal of Service Industry
Management, Vol. 7 No. 4, pp. 27-42.
Hansemark,O. &Albinsson,M.,(2004)“Customer satisfaction and retention:the experiences of
individual employees”,Journal ofManaging Service Quality,Vol.14 No.1,pp.40-57
Hart, A. and Smith, M. (1998), “The development of an activity-based customer profitability
model for the banking industry”, Managerial Auditing Journal, Vol. 13 No. 7, pp. 411-
18.
Hasan, M., “Customer Loyalty in the Age of Convergence,” 1996 Annual Review of
Communications, 1996, pp. 301- 307.
Heskett, J L, Jones, T O, Loveman, G W, Sasser W E and Schlesinger, L A (1994). Putting the
service-profit chain to work. Harvard Business Review, 72(2), 164-174.
Hurley, R.F. (1998), “Customer service behaviour in retail settings: a study of the effect of
service provider personality”, Journal of the Academy of Marketing Science, Vol. 26
No. 2, pp. 115-27.
Jackson, B.B. (1985), Winning and Keeping Industrial Customers, Lexington Books,
Lexington,MA.

88
Jacob, R., “Why Some Customers are More Equal than others,” Fortune, September, p. 215.
Jacoby, J. and Chestnut, R. (1978), Brand Loyalty: Measurement and Management, John
Wiley &Sons, New York, NY.
Jacoby, J. and Kyner, D.B. (1973), “Brand loyalty vs repeat purchasing behavior”, Journal of
Marketing Research, Vol. 10, February, pp. 1-19.
Jamal,A.,Kamal,N.,(2004)”Customer satisfaction and retail banking:an assessment of some of
the key antecedents of customer satisfaction in retail banking”, Internation Journal of
Bank Marketing,Vol.20,No.4,pp.146-160.
Jones, M.A., Beatty, S.E., Mothersbaugh, D.V. (2002), "Why customers stay: measuring the
underlying dimensions of services switching costs and managing their differential
strategic outcomes", Journal of Business Research, Vol. 55 pp.441-50.
Jones, M.A., Mothersbaugh, D.L. and Beatty, S.E. (2000), “Switching barriers and repurchase
intentions in services”. Journal of Retailing, 76(2), 259-274.
Jones, Thomas O. and W. Earl Sasser, Jr., (1995) “Why Satisfied Customers Defect,” Harvard
Business Review, November- December, pp. 88-99.
Kasper, J.D. (1988), “On problem perception, dissatisfaction and brand loyalty”, Journal of
Economic Psychology, Vol. 9, pp. 387-97.
Keaveney, S.M. (1995), “Customer switching behaviour in service industries: an exploratory
study”, Journal of Marketing, Vol. 59, pp. 71-82.
Keller,K.,(1993),” Conceptualizing, measuring, & managing customer-based brand Equity”,
Journal of Marketing, Vol.57 (January),pp. 1-22.
Klemperer, P. (1987), “Markets with consumer switching costs”, The Quarterly Journal of
Economics, Vol. 102, pp. 376-94.
Klemperer, P. (1995), "Competition when consumers have switching costs: an overview with
applications to industrial organization, macroeconomics and international trade",
Review of Economic Studies, Vol. 62 pp.515-39.
Komenar,M.(1997),Electronic Marketing, Wiley Computer publishing, New York,NY.
Kon,M.,(2004),”Customer Churn, Stop it before it starts”, Mercer Management
Journal,Vol.17,pp.54-60
LaBarbera, P.A. and Mazursky, D. (1983), “A longitudinal assesment of consumer
satisfaction/dissatisfaction”, Journal of Marketing Research, Vol. 20, November.

89
Langeard, E., Lovelock, C.H., Bateson, J.E.G. and Young, R.F. (Eds), “Marketing Consumer
Services: New Insights”, Marketing Science Institute Report No. 77-115.
Lauren,P.,lin,H.H.,(2003), “A Customer Loyalty Model for E-Service Context”, Journal of
Electronic Commerce Research, VOL. 4, NO. 4.
Lee, J., Feick, L. (2001), “The impact of switching costs on the customer satisfaction loyalty
link: mobile phone service in France”, Journal of Services Marketing, Vol. 15 No.1,
pp.35-48.
Lejeune,M.,(2001), “Measuring the impact of dataminig on churn management”,Electronic
Networking Applicatin and Policy ,Vol.11 No.5,pp.375-387
Levesque, T. and McDougall, G.H.C. (1996), “Determinants of customer satisfaction in retail
banking”, International Journal of Bank Marketing, Vol. 14 No. 7, pp. 12-20.
Lewis, J.D. (1991), “Competitive alliances redefine companies”, Management Review, Vol.
80 No. 4, pp. 14-19.
Likert,R.,(1932), “A Technique for Measurement of Attitudes” ,Archives of
Psychology,140(june)
Lin,Ch.,(2003), “A critical appraisal of customer satisfaction and e-commerce”,Managerial
Auditing Journal,Vol.18,No.3,pp.202-212.
Lin,H.H.,Wang,Y.,(2006), “An examination of the determinants of customer loyalty in mobile
commerce contexts”, Information & Management ,vol.43 ,pp. 271–282
Lovelock, C.H. and Young, R.F. (1977), “Marketing’s potential for improving productivity in
service industries”, in Eiglier, P., Langeard, E., Lovelock, C.H., Bateson, J.E.G. and
Young, R.F. (Eds), Marketing Consumer Services: New Insights, Marketing Science
Institute Report No. 77-115.
Loveman, G.W. (1998), “Employee satisfaction, customer loyalty, and financial performance:
an empirical examination of the service profit chain in retail banking”, Journal of
Service Research, Vol. 1 No. 1, pp. 18-31.
Mann, Prem S. (1995),Statistics for Business and Economics. New York : John Wiley & Sons
Inc.
Marcus, C. (1998), “A practical yet meaningful approach to customer segmentation”, Journal
of Consumer Marketing, Vol. 15 No. 5, pp. 494-504.
Martin kon, 2004 by Harvard Business School Publishing Corporation.

90
Meidan, A. (1996), Marketing Financial Services, Macmillan Press, Houndmills.
Meuter, M.L., Ostrom, A.L., Roundtree, R.I. and Bitner, M.J. (2000), “Self-service
technologies: understanding customer satisfaction with technology-based service
encounters”, Journal of Marketing, Vol. 64 No. 3, pp. 50-64.
Moutinho,L.,Smith,A.,(2000), “Modelling bank customer satisfaction through mediation of
attitudes towards human and automated banking”, International Journal of Bank
Marketing Vol.18,No.3 ,pp. 124-34.
O’brien,L.Jones,C.,(1995), “Do rewards really create aloyalty?”,Harvard Bussiness
Review,May-Jun,pp.75-82
O’Mally,L.,(1998), “Can loyalty schemes really build loyalty?”,Marketing Intelligence and
Planning,Vol.16,No.1,pp.47-55.
Oliva, T.A., Oliver, R.L. and MacMillan, I.C. (1992), “A catastrophe model for developing
services satisfaction strategies”, Journal of Marketing, Vol. 56, July, pp. 83-95.
Oliver, R.L. (1997), Satisfaction. A Behavioral Perspective on the Consumer, McGraw-Hill,
NewYork, NY.
Oliver, R.L., (1999), “Whence consumer loyalty?” ,Journal of Marketing, Vol. 63, October,
pp. 33-44.
Oliver, R.L., (1980) “A Cognitive Model of the Antecedents and Consequences of Satisfaction
Decisions,” Journal of Marketing Research, Vol. 17, No. 4,pp.460-469,.
Olsen, M. (1992), “Kvalitet i banktja¨nster”, doctoral dissertation, Department of Business
Administration, Stockholm University, Stockholm.
O'Malley, L. (1998), “Can loyalty schemes really build loyalty?”, Marketing Intelligence &
Planning, Vol. 16 No. 1, pp. 47-55.
Ostrom, A. and Iacobucci, D. (1995), “Consumer trade-offs and the evaluation of services”,
Journal of Marketing, Vol. 59, pp. 17-28.
Page, M., Pitt, L. and Berthon, P. (1996), “Analysing and reducing customer defection”, Long
Range Planning, Vol. 29 No. 6, pp. 821-4.
Parasuraman, A. and D. Grewal, (2000), “The Impact of Technology on the Quality-Value
Loyalty Chain: A Research Agenda,” Journal of the Academy of Marketing Science,
Vol. 28, No. 1:168-174.
91
Parasuraman, A., Zeithaml, V.A. and Berry, L.L. (1988), “SERVQUAL: a multiple-item scale
for measuring consumer perceptions of service quality”, Journal of Retailing, Vol. 64
No. 1, pp. 12-40.
Payne, A., Christopher, M., Clark, M. and Peck, H. (1999), Relationship Marketing for
competitive Advantage, Butterworth Heinemann, Oxford.
Pikkarainen, T., Pikkarainen, K., Karjaluoto, H. and Pahnila, S. (2004), “Consumer acceptance
of online banking: an extension of the technology acceptance model”, Internet
Research: Electronic Networking Applications and Policy, Vol. 14 No. 3, pp. 224-35.
Porter, M. (1998), Competitive Strategy: Techniques for Analyzing Industries and
Competitors,Free Press, New York, NY.pp. 393-404.
R.E. and Cacioppo, J.T. (1997), Communication and Persuasion: Central versus Peripheral
Routes to Attitude Change, Springer Verlag, New York, NY.
Ranaweera,C.& Prabhu.,(2003) , “ The influence of satisfaction, trust and switching barriers
on customer retention in a continuous purchasing setting ”International Journal of
Service Industry Management ,Vol. 14 No. 4, pp. 374-395
Reichheld, F. (1993), “Loyalty-based management”, Harvard Business Review, March-April,
pp. 64-73.
Reichheld, F. and Sasser, W.E. (1990), “Zero defections: quality comes to service”, Harvard
Business Review, September-October, pp. 105-11.
Reichheld, F. F (1992). “The truth of customer retention”, Journal of Retail Banking, 13(4),
21-24.
Reichheld, F.F (1996). “Learning from customer defections”, Harvard Business Review,
Vol.74,No.2,pp. 56-61.
Reichheld, F.F. (1996), “The Loyalty Effect”, Harvard Business School Press, Boston, MA.
Reichheld, F.F. and Sasser, W.E. (1990), “Zero defections: quality comes to services”,
Harvard Business Review, September-October, pp. 105-11.
Reichheld, Frederick, (1993), “Loyalty-Based Management,” Harvard Business Review,
March-April, p. 64.
Richards, T. (1996), “Using the conversion model to optimize customer retention”, Managing
Service Quality, Vol. 6 No. 4, pp. 48-52.
Robson, C., (1993) Real world Research.Oxford:Blackwell.
92
Rust, R. T., Zahorik, A. J., & Keiningham, T. L. (1995). “Return on quality (ROQ): Making
service quality financially accountable ”,Journal of Marketing, Vol.59,No.2,pp. 58–70.
Rust, R.T. and Zahorik, A.J. (1993), “Customer satisfaction, customer retention and market
share”, Journal of Retailing, Vol. 69, pp. 193-215.
Ryals,L.,knox,S.,(2001),”Cross-functional issues in the implementation of relationship
marketing through customer relationship management”,European Management
Journal,Vol.19,No.5,pp.534-542
Salant,P., Dillman D.A.,(1994),How to conduct your own survey.,New York:Wiley.
Saunders, Mark, lewis and Thornhill A.,(2000),Research Methods for Business
Students.England:Printhall.
Selnes, F. (1993), “An examination of the effect of product performance on brand
reputation,satisfaction and loyalty”, Journal of Marketing, Vol. 27 No. 9, pp. 19-35.
Sengupta, S., Krapfel, R. and Pusateri, M. (1997), “Switching costs in key account
relationships”, The Journal of Personal Selling and Sales Management, Vol. 17 No. 4,
Fall, pp. 9-16.
Sharma, N. and Patterson, P.G. (2000), “Switching costs, alternative attractiveness and
experience as moderators of relationship commitment in professional consumer
services”, International Journal of Service Industry Management, Vol. 11 No. 5, pp.
470-90.
Sharma, N., Patterson, P.G., Cicic, M., Dawes, P. (1997), “A contingency model of
relationship commitment for professional consumer services”, Proceedings of the 26th
EMAC Conference, Warwick, May 20-23.
Sheth, J. and Parvatiyar, A. (1995), “Relationship marketing in consumer markets: antecedents
and consequences”, Journal of the Academy of Marketing Science, Vol. 23 No. 4, pp.
255-71.
Shy, O. (2002), “A quick and easy method for estimating switching costs”, International
Journal of Industrial Organization, Vol. 20 pp.71-87.
Smith, M. and Dikolli, S. (1995), “Customer profitability analysis: an activity-based costing
approach”, Managerial Auditing Journal, Vol. 10 No. 7, pp. 3-7.
93
Solomon, M.R., Surprenant, C., Czepiel, J.A. and Guttman, E.G. (1985), “A role theory
perspective on dyadic interactions: the service encounter”, Journal of Marketing, Vol.
49,
Spreng, R.A. and Mackoy, R.D. (1996), “An empirical examination of a model of perceived
services quality and satisfaction”, Journal of Retailing, Vol. 72 No. 2, pp. 201-14.
Srinivasan, S.S., Anderson, R., Ponnavolu, K., (2002). “Customer loyalty in e-commerce: an
exploration of its antecedents and consequences”, Journal of Retailing, Vol.78, No.1,
pp. 41–50.
Stewart,K.,(1998), “An exploration of customer exit in retail banking”, International Journal of
Bank Marketing Vol.16 ,pp. 6–14
Storbacka, K (1994). “The nature of customer relationship profitability” Swedish School of
Economics and Business Administration, Research Report 55, Helsingfors.
Storbackaa, K., Strandvik, R. and GroÈnroos, C. (1994), “Managing customer relationship for
profit: the dynamics of relationship quality”, International Journal of service Industry
Management, Vol. 5 No. 5, pp. 21-38.
Trafimow, (2000), “Habit as both a direct cause of intention to use a condom and as a
moderator of the attitude-intention and subjective norm-intention relations”,
Psychology and Health, Vol.15, No.3, pp. 383–393.
Triandis, H.C., (1971), Attitude and Attitude Change, John Wiley & Sons, New York.
Trubik,E. and Smith,M.,(2000), “Developing a model of customer defection in the Australian
banking industry” Managerial Auditing Journal Vol.15 No.5 pp. 199-208.
Turel,O.,Serenko,a.,(2006), “ Satisfaction with mobile services in Canada:An empirical
investigation”, Telecommunications Policy ,Vol. 30,pp. 314–331
Uncle,M.D.,Dowling,G.R.,and Hammond,K., (2003), “Customer Loyalty and Customer
Loyalty Programms”,Journal of Consumer Marketing,Vol.20,No.4,pp.294-316.
Venetis, K.A., Ghauri, P.N. (2000), “The importance of service quality on customer retention:
an empirical study of business service relationships”, Proceedings of the Marketing in
a Global Economy Conference, Buenos Aires, June 28-July 1, pp. 215-224
Voss, G.B., A. Parasuraman, and D. Grewal, (1998), “The Roles of Price, Performance, and
Expectations in Determining Satisfaction in Service Exchanges,” Journal of Marketing,
Vol. 62, No. 4, pp.46-61.
94
Wang, Y.-S., T.-I. Tang, and J.-T.E. Tang, (2001), “An Instrument for Measuring Customer
Satisfaction toward Web Sites That Market Digital Products and Services,” Journal of
Electronic Commerce Research, Vol. 2, No. 3, pp.89-102.
Wang,H.,Pallister,J.,Foxall,G.,(2005), “Innovativeness and involvement as determinants of
website loyalty: II.Determinants of consumer loyalty in B2C e-commerce”
,www.elsevier.com/locate/technovation
Westbrook, R.A. and R.P. Oliver, (1991) “The Dimensionality of Consumption Emotion
Patterns and Consumer Satisfaction,” Journal of Consumer Research, Vol. 18, No. 1,
pp.84-91.
Worcester, R.M. (1997), “Managing the image of your bank: the glue that binds”, International
Journal of Bank Marketing, Vol. 15 No. 5, pp. 146-52.
Yavas, U. and Shemwell, D.J. (1996), “Bank image: exposition and illustration of
correspondence analysis”, International Journal of Bank Marketing, Vol. 14 No. 1, pp.
15-21.
Yi,Y.,&Jeon,H.,(2003), “Effects of loyalty programs on value perception,program loyalty,and
aabrand loyalty”,Journal of Academy of Marketing Science,Vol.31 No.3,pp.229-241.
Zeithaml, V.A. (1981), “How consumer evaluation processes differ between goods and
services”, in Donnelly, J.H. and George, W.R. (Eds), Marketing of Services, American
Marketing Association, Chicago, IL.
Zeithaml, V.A., Berry, L.L. and Parasuraman, A. (1988), “Communication and control
processes in the delivery of service quality”, Journal of Marketing, Vol. 52, April, pp.
35-48.
Zikmund,W.(2000),Business research methods(6th edition),The Dryden Press.
Zineldin, M. (1996), “Bank strategic positioning and some determinants of bank selection”,
International Journal of Bank Marketing, Vol. 14 No. 6, pp. 12-22.
Zineldin, M. (2000), TRM, Studentliteratur, Lund, Sweden.
Zineldin,M., (2005) , “Quality and customer relationship management (CRM) as competitive
strategy in the Swedish banking industry” , The TQM Magazine ,Vol. 17, No. 4, pp.
329-344
Zineldin,M.,( 2006), “ The royalty of loyalty: CRM, quality and retention ”, Journal of
Consumer Marketing ,Vol.23, No.7 ,pp. 430–437

95
Appendix
Appendix A
Ch1=0.61Choosing Ch2=0.51 Choosing Ch3=0.55 Choosing
SC1=0.78 Switching cost SC2= 0.83 Switching cost SC3=0.36 Switching cost
H1=0.51 Habit H2=0.56 Habit H3=0.43 Habit H4=0.42 Habit H5=0.59 Habit H6=0.49 Habit
L1=0.55 Loyalty L2=0.50 Loyalty L3=0.56 Loyalty L4=0.61 Loyalty L5=0.70 Loyalty L6=0.80 Loyalty L7=0.73 Loyalty
IQ1= 0.72Intangible Quality IQ2 =0.75 Intangible Quality IQ3 =0.71Intangible Quality IQ4 =0.87Intangible Quality IQ5 =0.89Intangible Quality IQ6 =0.65Intangible Quality IQ7 =0.67Intangible Quality IQ8 =0.73Intangible Quality IQ9 =0.57Intangible Quality
TQ1=0.42 Tangible Quality TQ2=0.38 Tangible Quality TQ3 =0.58 Tangible Quality TQ4 =0.71 Tangible Quality TQ5=0.81 Tangible Quality TQ6=0.62 Tangible Quality TQ7 =0.54 Tangible Quality TQ8 =0.65 Tangible Quality TQ9=0.63 Tangible Quality
S1=0.60 Satisfaction S2=0.47 Satisfaction S3=0.73 Satisfaction S4=0.73 Satisfaction
Question’s coefficient