MASTER'S THESIS - DIVA
80
MASTER'S THESIS Service Quality Assessment within Notable Chain Restaurants of Tehran Nahal Ghazali Soha Saremi Inanlou 2015 Master of Arts (60 credits) Business Administration Luleå University of Technology Department of Business Administration, Technology and Social Sciences
-
Upload
khangminh22 -
Category
Documents
-
view
0 -
download
0
Transcript of MASTER'S THESIS - DIVA
MASTER'S THESIS
Service Quality Assessment withinNotable Chain Restaurants of Tehran
Nahal GhazaliSoha Saremi Inanlou
2015
Master of Arts (60 credits)Business Administration
Luleå University of TechnologyDepartment of Business Administration, Technology and Social Sciences
2
Service Quality Assessment within Notable Chain Restaurants of Tehran
Supervisor:
Prof: Dr. Mana Farshid
By:
Nahal Ghazali &
Soha Saremi Inanlou
Institute of Training Research and Operational Consultancy for Tourism (INSTRUCT)
January, 2015
3
Acknowledgements
Of the many people who have been enormously helpful in the preparation of this
thesis, we are especially thankful to Dr. Mana Farshid, our supervisor, for her help
and support which paved the way for the accomplishment of the task. We are
grateful for her insightful comments and guidance throughout the development of this
thesis and the study it describes. We also claim being highly indebted and grateful to
Dr. Shiriyan, head of INSTRUCT, for his kind consideration throughout the process of
this research and his ever present support during the hard days of struggling with the
issue. We are also grateful to our families for the encouragement and support they
presented throughout our studies. We would like to extend our sincere gratitude to those
who completed the questionnaires and presented us with the information required. If it
were not for their help and support, we could not accomplish the task successfully.
Nahal Ghazali Soha Saremi Inanlou
4
Abstarct
The present study was an attempt to investigate service quality assessment within notable chain
restaurants of Tehran. More specifically, the study aimed at conducting a research on two
famous, active and successful chain restaurants of Tehran in comparative mode to see how well
their service qualities are and if the service quality they offer has any deficiencies. They were
selected for the present study based on their fame and background. One of these two was a
traditional food restaurant, namely Hani, and the other one was Boof restaurant which provides
fast food. To do the study, Service Quality Scale (Caruana, 2002) was employed to measure the
service quality of the restaurants aforementioned. 120 questionnaires were distributed and
seventy completed ones were returned. The customers’ presented data was used to find out the
significant factors considered in the evaluation of service quality in Haani and Boof restaurants,
satisfaction and loyalty degree of customers in these two restaurants.The data collected were
analyzed via employing SPSS software version 21, employing descriptive statistics, t-test,
andmultivariate ANOVA (MANOVA). Based on the results it was revealed that among the
service quality factors on time servicing, accountability, and staff interaction were the most
significant ones for the customers while decoration and face validity was the least significant
factor. It was also found that there was not any significant difference between Boof and Haani’s
costumer satisfactions, but in terms of loyalty factors the way the restaurant was introduced, rate
of keeping costumers and evaluation, Boof restaurant’s costumers significantly trusted the
persons who introduced it more than those of Hani, but there was not any significant difference
between these two restaurants regarding their costumers’ continuing visits costumers’
evaluations.The findings of present study could be employed by the restaurant holders to
improve their marketing strategies. Also, students of hospitality and tourism as well as

5
individuals interested in the field might get some insights covering the findings of the present
study.
6
Table of Contents
Chapter One: Background and Purpose 9 1.1 Introduction 9 1.2 Background 9 1.3 Problem Discussion 10 1.4 The Purpose of the Research 12 1.5 Outline of the Thesis 12 ChapterTwo: Review of the Related Literature 14 2.1 Introduction 14 2.2 Customer Satisfaction 14 2.3 Service Quality and its Role in the Restaurant Assessment 17 2.4 Customer Satisfaction and Service Quality 19 2.5 The Gap Model 22 2.6 The SERVQUAL Model 25 2.6.1 Research on Validity and Reliability of SERVQUAL 29 2.7 The DINESERV Model 31 2.8 Iranian Culture and Cuisine 32 2.9 Conceptual Research Model 34 Chapter Three: Methodology 37 3.1 Introduction 37 3.2 Research Design 37 3.3 Case selection 38 3.4 Two Notable Chain Restaurants in Tehran 38 3.4.1 Haani Restaurants in Tehran 38 3.4.2 Boof Restaurants In Tehran 39 3.5 Sample selection 39 3.6 Procedure 40 3.7 Insrrumentation 41 3.8 Data Analysis 42 3.9 Quality Standards 43 Chapter Four: Data Presentation 45 4.1 Introduction 45 4.2 Results 45 4.2.1Research Question 1 45 4.2.2 Research Question 2 48 4.2.3 Research Question 3 50
7
4.3 Discussion 52 Chapter Five: Conclusion and Recommendations 56 5.1 Introduction 56 5.2 Restatement of the Problem and Research Questions 56 5.3 Conclusion 57 5.4 Limitations of the Study 58 5.5 Suggestions for Further Research 58 References 60 Appendices 77 Appendix I Service Quality Scale (English Version) 77 Appendix II Service Quality Scale (Persian Version) 80
8
Chapter One
Background and Purpose
1.1 Introduction
In the present chapter of this thesis, the background of the thesis title is presented,
followed by a problem discussion. Thepurpose of the study and research questions is
established and finally the outline for this thesis is illustrated.
1.2 Background
Among the hospitality related sectors, one cannot ignore the value and importance
restaurants can have. Nor can one forget about the role the restaurants play in the social
context and Iranian culture. Evaluation of service quality in restaurants is based on a
number of factors. Susskind and Chan (2000) consider the environment and provided
services along with food quality as significant elements in assessing service quality of
the dining sector. Sulek and Hensley (2004) consider quality of the food as the most
remarkable factor among the aforementioned ones.
Internationally, restaurants and guest-receiving organizations try to measure their
customer satisfaction and investigate effective tools for developing and maintaining
standard service quality for guest satisfaction (Bashirian & Majdpour, 2011). Marković
et al. (2010) suggest that the evaluation of service quality in restaurants is challenging
9
as service outcome is not the only important variable; delivery of those services is also
a significant indication of the intended service quality.
1.3 Problem Discussion
According to Mittal and Kamakura (2001), customer satisfaction is a major element in
creation of customer’s desires for future purchases; moreover, the satisfied customers
most likelywill talk to others about their good experiences and the quality of the
received services. Indeed, particularly in the Middle Eastern cultures, this is of
paramount importance where the social life has been formed in a way that social
communication with other members enhances the society (Jamal & Naser, 2002). In
fact, satisfied customers turn to loyal consumers of the service (Mittal & Lassar, 1998).
From another perspective, word of mouth (WOM) which is spread by satisfied
customers, is considered as a more reliable means of attracting customers than other
forms of advertising (Taghizadeh et al., 2012).
Focusing on the measurement of service quality of in the Iranian restaurants is
important as like any other place all over the world, people do not pay for the low
quality services, unless they have no other choice. Considering the fact that there are a
lot of restaurants (both traditional ones and fast-foods) in Tehran, as the capital city of
Iran, and that these restaurants are competing with one another to absorb more
customers, running a research in this regard takes significance.
10
Theoretically speaking, the problem lies in the fact that in most cases the restaurants do
not evaluate their own service quality and do not try the modern ways of absorbing
customers in the aforementioned countries. Indeed, when ''customers are dissatisfied,
then they may have the option of exiting (e.g., going to a competitor) or voicing their
complaints in an attempt to receive retribution.'' (Angelova & Zekiri, 2011, p. 243).
Hayes (1998) believes that evaluating their service allows the businesses to:
• understand whether the process works well;
• make modification to the system where it is needed;
• decide whether those modifications brought about improvement; and
• making sound decisions;
In order for the company to succeed in competitions, customer satisfaction plays a
significant role (Thorsten & Alexander, 1997). Lin and Wu (2011) also believe that
long-term retention of the consumers is contingent upon satisfaction with the provided
services; nevertheless, the rate of switching will increase dramatically.
Another problem is the discrepancies between prior expectations of customers and the
actual performance of the target firm. Parasuraman et al. (1985) believe that there is
considerable confusion in the demarcation between service quality and customer
satisfaction. As these differences play a key role in determining the success or failure of
a business, it is of paramount importance to examine the issue in practice.
11
1.4 The Purpose of the Research
In the present study, the concept of service quality and the subsequent customer
satisfaction has been evaluated in Iran. In addition, this research has specifically
focused on the service quality assessment within the branches of two famous chain
restaurants in Tehran− Haani and Boof. The study is an attempt to find out ay probable
discrepancy between the clients’ expectations from the restaurants and the real services
they receive. The significant factors of service quality which are more important to the
customers of notable chain restaurants will also be discussed. As Customer satisfaction
is a substantial element for future purchase by customers who have experienced a
service before (Mittal & Kamakura, 2001), the present study aims at investigating the
most remarkable factors that influence the service quality perceived by the customers.
Thus, these research questions inform the present study:
1. What are the major factors customers consider as significant in the evaluation of
service quality?
2. How satisfied are the restaurants customers?
3. How loyal are the restaurants customers?
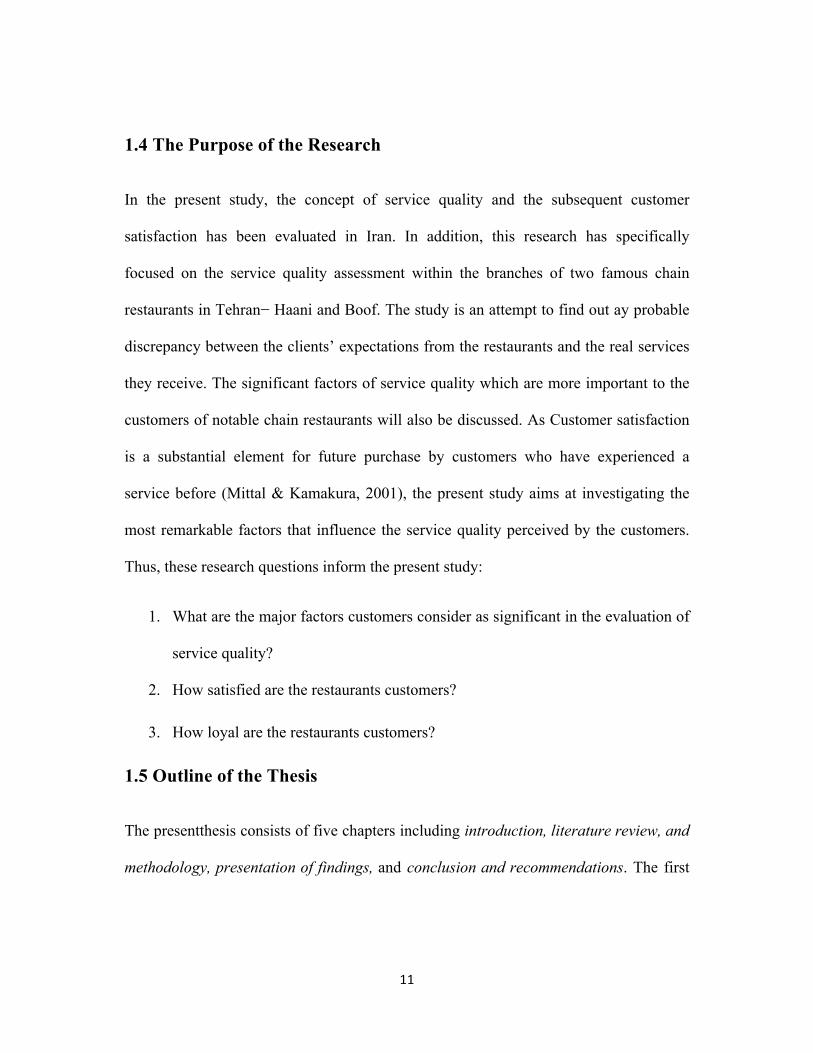
1.5 Outline of the Thesis
The presentthesis consists of five chapters including introduction, literature review, and
methodology, presentation of findings, and conclusion and recommendations. The first
12
chapter discusses the study background of the thesis, research purpose, research
questions, and the thesis outline. The second chapter deals with presents the concepts
related to the research questions of the study and the significant points found in the
previous related studies. The conceptual framework of the present study will be also
focused on this section. The methodology of this research is presented in chapter three
in which data collection and data analysis procedures will be described. The empirical
data,a profound data analysis, and data presentation will be covered in chapter four.
Finally, chapter five presents the study findings and discusses suggestions for further
research.
Figure 1.1 Outline of the Thesis
13
Chapter Two
Review of the Related Literature
2.1 Introduction
In this chapter, the theoretical concepts of the study are expanded followed by a number
of relevant studies and models which create the conceptual framework.
2.2 Customer Satisfaction
Malik and Ghaffor (2012) define the concept of customer satisfaction as meeting
customer expectations regarding the special parameters of satisfaction. Zairi (2000) also
defines this notion as the accomplishment of inner requests of consumers. Indeed, this
concept has been defined differently by field scholars. Customer satisfaction is “an
indicator of whether customers will return to a restaurant” (p. 39) as Dube et al. (1994)
suggest. Vavra (1997, p. 8) also consider customer satisfaction as ''the leading criterion
for determining the quality actually delivered to customers through the product/service
and by the accompanying servicing.''
Indeed, as the most significant concept influencing service management, customer
satisfaction has received a lot of attention from marketers and researchers (Rust &
14
Oliver, 1994). The concept of customer satisfaction has thus been applied to service
industry by many scholars (e.g. Andaleeb & Conway, 2006; Oh, 2000). In addition,
Yüksel and Yüksel (2002) connect this satisfaction concept to the intention for repeat
purchasing and positive word-of-mouth.
The expectancy/disconfirmation paradigm in process theory (Mohr, 1982)
provides the grounding for the vast majority of satisfaction studies and
encompasses four constructs:
1. expectations;
2. performance;
3. disconfirmation; and
4. satisfaction
Dis/confirmation arises from discrepancies between prior expectations and actual
performance. There has been significant effort in the past to look at the area of service
quality, customer satisfaction and, to a lesser extent, service loyalty. However, there is
considerable confusion in the demarcation between service quality and customer
satisfaction. GroÈnroos (1984, 1990) and Parasuraman et al. (1985, 1988, 1994), both
argue that perceived service quality results from the comparison that customers make
between expected quality and experienced or outcome quality. The
expectancy/disconfirmation paradigm that ultimately results in satisfaction or
dissatisfaction makes a similar point. Regarding the chronological order, service quality
15
happens first and then leads to customer satisfaction. According to Cronin and Taylor
(1992, 1994), customer satisfaction is regarded as an antecedent of service quality;
nevertheless, their research the opposite. Thus, Service quality was proposed as one of
the contributing aspects of customer satisfaction (Ruyter et al., 1997; Spreng &
Mackoy, 1996).
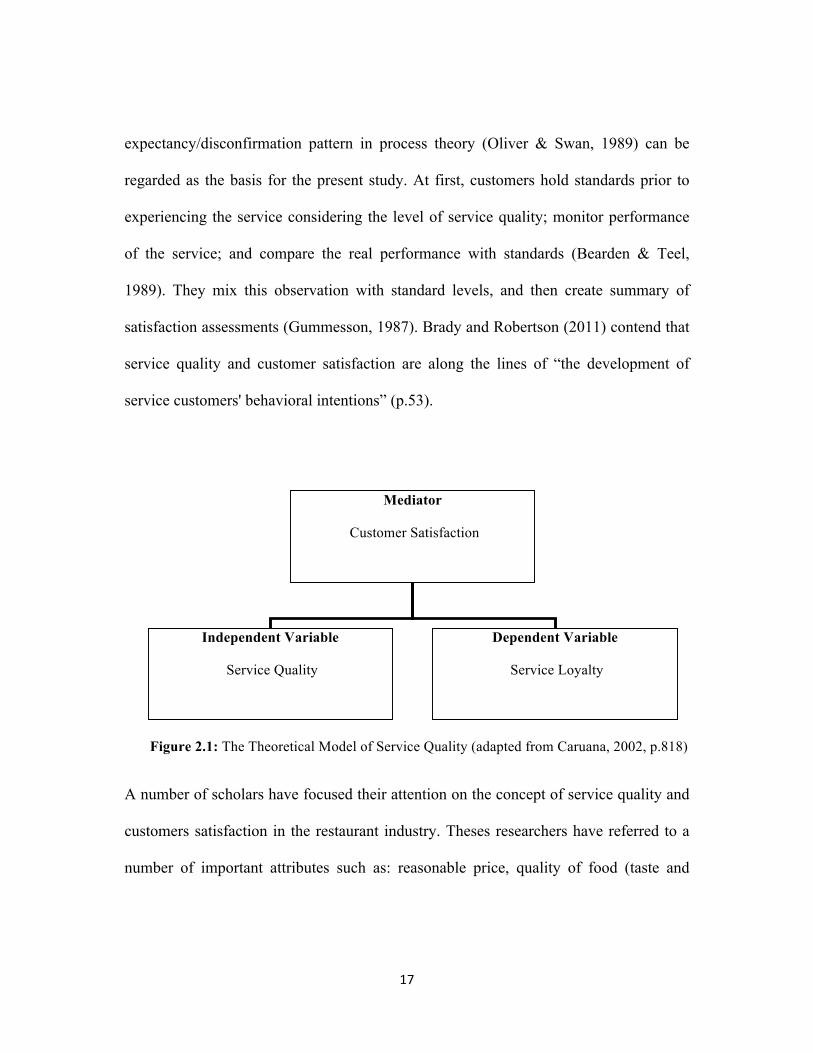
On the basis of the above, customer satisfaction is indicated as acting as a mediator in
the link between service quality and service loyalty, as shown in Figure 2.1.In the
satisfaction literature “expectation reflect anticipated performance” (Churchill and
Suprenant, 1982, p.492) made by the customer about the levels of performance during a
transaction. This study employs a cultural perspective to explore the role and effects of
service quality and satisfaction on such behavioral outcomes as repurchase intentions,
loyalty, and word of mouth. Previous research in other cultures (Brady & Robertson;
2011; Caruana, 2002; GroÈnroos; 1990; Selnes, 1993) has revealed that high service
quality affects the behavioral intentions of the customers and consumers' level of
satisfaction.
Mittal and Lassar (1998) refer to the strong connection between satisfaction and
customer loyalty. In addition, Oliver (1993) considers the satisfaction variable as the
central part of the marketing philosophy of any business. Lim (2010) contends that the
physical environment in restaurants can have a great effect on customers' pleasure.
16
2.3 Service Quality and its Role in the Restaurant Assessment
Caruana (2002) believes that service loyalty might be considered one of the most
essential constructs in services marketing as the final effect is indicated by the
repurchasing by customers; thus, these loyal customers with their repeated purchases
are regarded as the heart of any business. The demographic characteristics of loyal
customers is one the most significant aspects that has raised the attention of the scholars
and whether any variables like these can be more essential than others and how these
information can be used for different intentions (Caruana, 2002). Nevertheless, Caruana
(2002) believes that the connection of service loyalty with other variables such as
customer satisfaction and service quality has received a lesser amount of attention.
The work by Parasuraman et al. (1998) was the starting point for examining service
quality academically which has attracted a considerable amount of attention by both
researchers and practitioners in recent years (Caruana, 2002). Caruana (2002) believes
that one of the most remarkable reasons for this interest in service quality examination
is the advantages it can bring about on the bottom-line performance for business.
Although the concept of customer satisfaction and service quality have been considered
as rather independent terms among the academics, practitioners of the field see no such
difference and thus use them interchangeably (Oliver, 1993).
Caruana (2002) states that the three concepts of customer satisfaction, service quality,
and service loyalty are connected to each other. From a theoretical point of view, the
17
expectancy/disconfirmation pattern in process theory (Oliver & Swan, 1989) can be
regarded as the basis for the present study. At first, customers hold standards prior to
experiencing the service considering the level of service quality; monitor performance
of the service; and compare the real performance with standards (Bearden & Teel,
1989). They mix this observation with standard levels, and then create summary of
satisfaction assessments (Gummesson, 1987). Brady and Robertson (2011) contend that
service quality and customer satisfaction are along the lines of “the development of
service customers' behavioral intentions” (p.53).
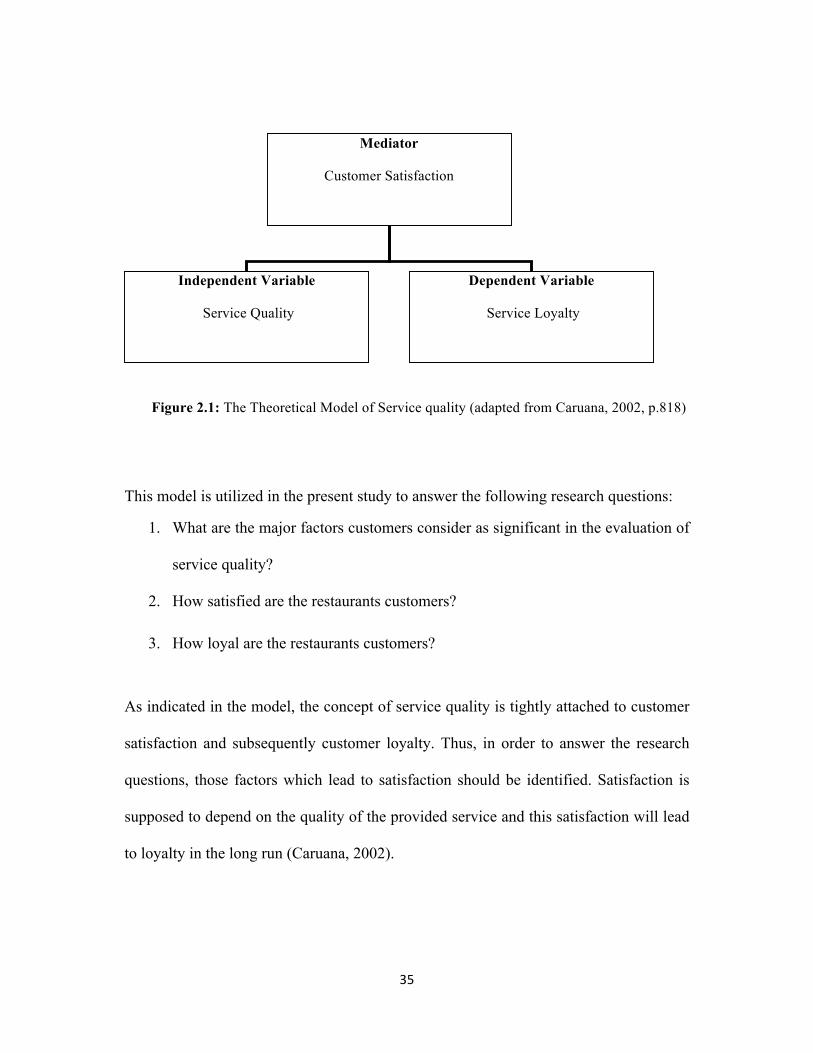
Figure 2.1: The Theoretical Model of Service Quality (adapted from Caruana, 2002, p.818)
A number of scholars have focused their attention on the concept of service quality and
customers satisfaction in the restaurant industry. Theses researchers have referred to a
number of important attributes such as: reasonable price, quality of food (taste and
Mediator
Customer Satisfaction
Independent Variable
Service Quality
Dependent Variable
Service Loyalty
18
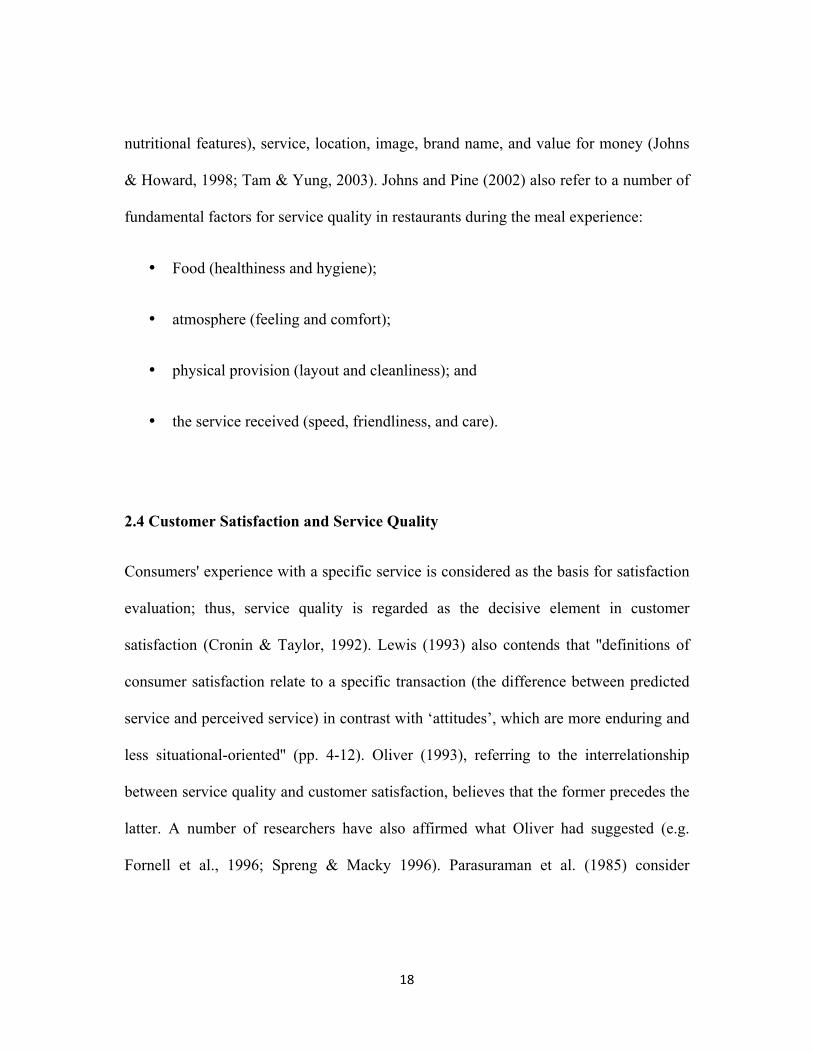
nutritional features), service, location, image, brand name, and value for money (Johns
& Howard, 1998; Tam & Yung, 2003). Johns and Pine (2002) also refer to a number of
fundamental factors for service quality in restaurants during the meal experience:
• Food (healthiness and hygiene);
• atmosphere (feeling and comfort);
• physical provision (layout and cleanliness); and
• the service received (speed, friendliness, and care).
2.4 Customer Satisfaction and Service Quality
Consumers' experience with a specific service is considered as the basis for satisfaction
evaluation; thus, service quality is regarded as the decisive element in customer
satisfaction (Cronin & Taylor, 1992). Lewis (1993) also contends that ''definitions of
consumer satisfaction relate to a specific transaction (the difference between predicted
service and perceived service) in contrast with ‘attitudes’, which are more enduring and
less situational-oriented'' (pp. 4-12). Oliver (1993), referring to the interrelationship
between service quality and customer satisfaction, believes that the former precedes the
latter. A number of researchers have also affirmed what Oliver had suggested (e.g.
Fornell et al., 1996; Spreng & Macky 1996). Parasuraman et al. (1985) consider
19
perceived service quality as the determining factor for satisfaction on the part of the
customers. Saravana & Rao (2007) also affirm this idea as they connect satisfaction to
the quality of the service provided by the target firm.
Wilson et al. (2008) asserted that the two aforementioned concepts are connected;
nevertheless, they consider satisfaction as an umbrella term. For example, Zeithaml et
al. (2006) believe that many other factors can contribute to satisfaction, such as price
and product quality.
Currently, the increased competition has made service quality a popular domain of
academic research and an attentive competitive benefit satisfying relationships with
consumers (Zeithmal, 2000). Although service quality has aroused considerable interest
in research, there are difficulties measuring and even defining it since there is no
consensus in general (Wisniewski, 2001). Eshghi et al. (2008) define service quality as
the overall evaluation of a service by the customers.
Service quality is regarded as a significantaspect of competitiveness (Lewis, 1989).
Providing outstanding service quality and customer satisfaction is the criticalconcern
and challenge facing the current service industry (Hung et al., 2003). Service quality is
an essentialissue in both service industries and business (Zahari et al., 2008). The extent
a service meets customer needs and expectations or exceeds them is considered as
another explanation for service quality (Asubonteng et al., 1996; Dotchin& Oakland,

20
1994a; Lewis & Mitchell, 1990; Seilier, 2004; Wisniewiski& Donnelly, 1996; Zahari et
al., 2008).
Throughout the last two decades, service quality has attracted a lot of attention of
practitioners, researchers, and managersdue to its impact on business performance,
return of investment, lower costs, customer loyalty,customer satisfaction, and gaining
profit (Cronin & Taylor, 1992; Lasser et al., 2000; Leonard &Sasser, 1982; Newman,
2001; Seth &Deshmukh, 2005; Sureshchander et al., 2002).
Service quality is also synonymous to customer opinionabout how a service meets or
exceeds their expectations (Czepiel, 1990). Munusamy et al. (2010) characterize service
quality as the difference between customer's expectations and the perceptions of the
received service Customer expectation and perception are the two majorcomponents of
service quality (Munusamy et al., 2010). Consumersevaluate quality as low
whenperception does not meet their expectation and quality as high ifperception
exceeds their expectations (Oliver, 1980).
In both developed and developing countries, the speedyprogress and competition of
service quality has made it indispensable for companies to measure the quality of their
service encounters (Brown & Bitner, 2007). According to Seth and Deshmukh (2005),
some conceptual models have been createdfor measuring service quality which enable
identifying quality problems and thus aid in planning for initiating a quality

21
improvement program.Indeed, the efficiency, profitability, and overall performance of
these industries will improve (Seth & Deshmukh, 2005).
2.5 The Gap Model
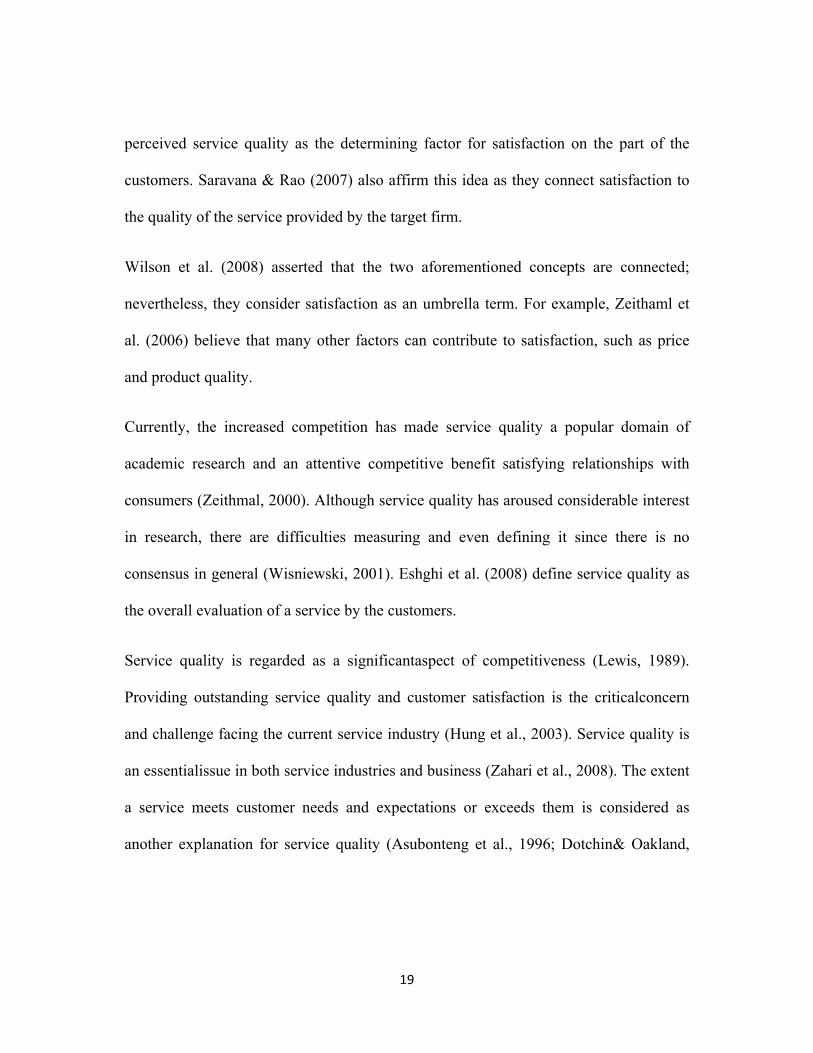
In a period of time between 1985 and 1994, Parasuraman, Zeithaml, and Berry
conducted a number of research projects in different service domains. They contended
that the 'gap' between service quality expectations and the perceptions of the customers
after delivery of the service could be measured with their so called Gap Model (Blešić
et al., 2011).
22
Figure 2.2 The Gap Model (Parasuraman et al., 1986, p. 44)
This model gives the highest credit to the attitudes of customers and their perception of
the provided service (ibid). According to Ljubojević (2004), the framework illustrates
the development of the service quality notion. Parasuraman et al. (1985) summarizes the
concept of discrepancy in the target service offer by 5 gaps:
23
• Gap 1: the discrepancy between customers' expectations and the way they are
perceived by the service management.
• Gap 2: the difference between the perception of the firm of customers'
expectations and service quality specifications.
• Gap 3: the discrepancy between service quality specifications of the firm and
how the service is delivered in reality.
• Gap 4: the difference between service delivery and customers' expectations
based on the firms' description.
• Gap 5: the discrepancy between customers' expectations of the firm and their
perception of that service.
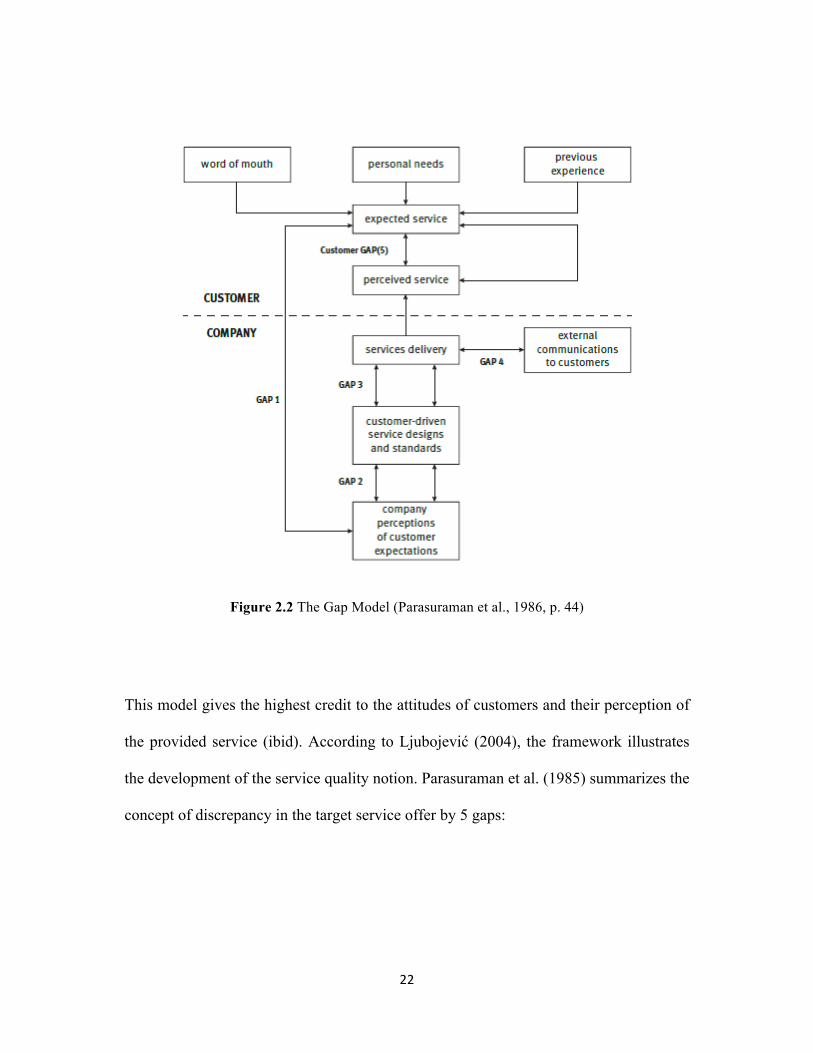
Nitin et al. (2005) states that service quality based on the Gap model (Figure 2.2) can be
formulated as:
In the formula:
• SQ represents service quality;
• k indicates the number of features or attributes
24
• Pij shows the performance perception of i based on the effect of j
• Elj represents the expected quality from j in comparison with standards set for i.
The Gap model was later improved by Parasuraman, Zeithaml and Berry (1985, 1988,
1994) and was introduced as the SERVQUAL scale for measurement of expectations
and perception of service quality.
2.6 The SERVQUAL Model
Parasuraman et al. (1988) proposed the SERVQUAL model in order to measure gap 5
of the Gap Model. They utilized ten factors in their service quality framework:
tangibility, responsiveness, courtesy, reliability, security, accessibility, credibility,
communication, and understanding the customer. These ten factors are summarized in
five dimensions (Shahin, 2006; Van Iwaarden et al., 2003):
1. Tangibles: physical equipment, facilities, and appearance of the staff.
2. Reliability: capability to carry out the promised service perfectly.
3. Responsiveness: eagerness to help customers and provide quick service.
4. Assurance: understanding and politeness of employees and their ability to
establish trust and confidence.
5. Empathy: caring and individualized attention to the customers.

25
Figure 2.3 SERVQUAL Model (Parasuraman et al., 1988, cited in Cronin & Taylor, 1992)
The SERVQUAL model includes a questionnaire that judges the five aforementioned
generic service dimensions through 22 questions, assessing both expectation and
performance with a seven-point Likert scale. Service quality, in this approach is
evaluated by calculating the gap (difference) between customer expectations and
perceptions (service quality= P – E). 'P' indicates customer opinion of a service and 'E'
stands for expectations before the actual service is delivered (Lewis & Booms, 1983;
Parasuraman et al., 1985). If the answer is positive, satisfaction is affirmed; otherwise,
dissatisfaction is reported. This equation is generally identified as gap analysis (Zahari
et al., 2008); nevertheless, this model only evaluates gap 5.
26
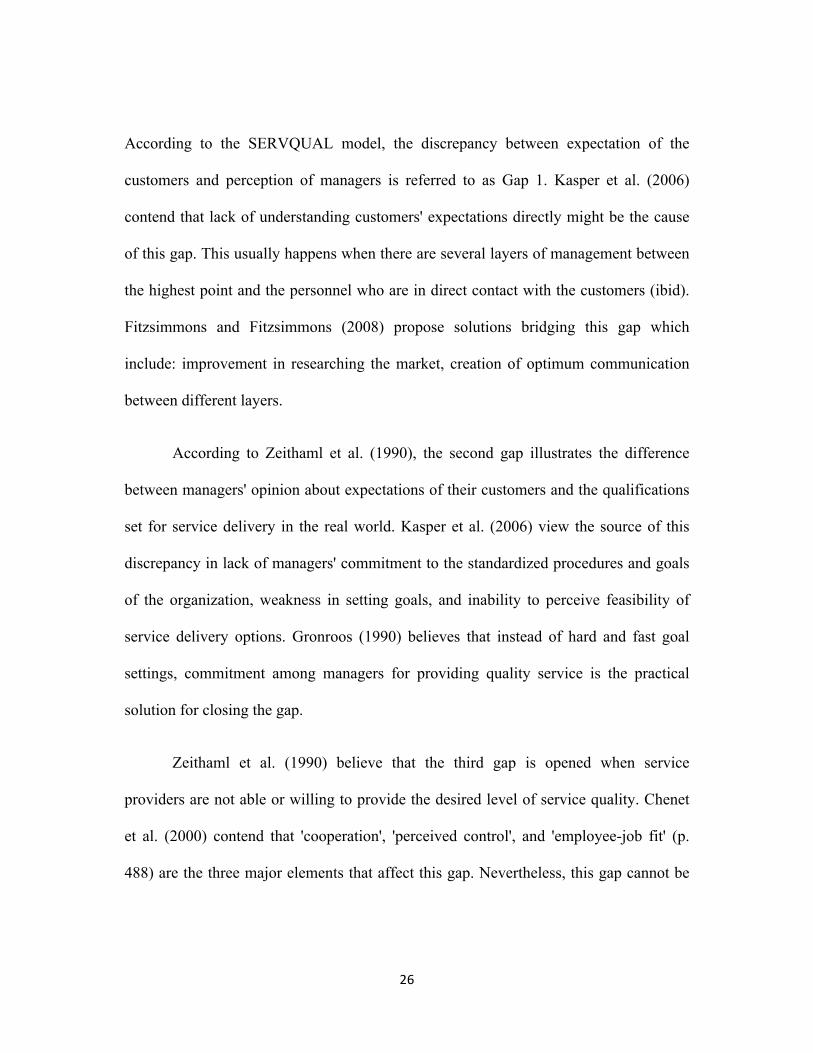
According to the SERVQUAL model, the discrepancy between expectation of the
customers and perception of managers is referred to as Gap 1. Kasper et al. (2006)
contend that lack of understanding customers' expectations directly might be the cause
of this gap. This usually happens when there are several layers of management between
the highest point and the personnel who are in direct contact with the customers (ibid).
Fitzsimmons and Fitzsimmons (2008) propose solutions bridging this gap which
include: improvement in researching the market, creation of optimum communication
between different layers.
According to Zeithaml et al. (1990), the second gap illustrates the difference
between managers' opinion about expectations of their customers and the qualifications
set for service delivery in the real world. Kasper et al. (2006) view the source of this
discrepancy in lack of managers' commitment to the standardized procedures and goals
of the organization, weakness in setting goals, and inability to perceive feasibility of
service delivery options. Gronroos (1990) believes that instead of hard and fast goal
settings, commitment among managers for providing quality service is the practical
solution for closing the gap.
Zeithaml et al. (1990) believe that the third gap is opened when service
providers are not able or willing to provide the desired level of service quality. Chenet
et al. (2000) contend that 'cooperation', 'perceived control', and 'employee-job fit' (p.
488) are the three major elements that affect this gap. Nevertheless, this gap cannot be
27
illustrated without two endogenous factors which are commitment and trust. Gronroos
(2007) suggested solutions for bridging the aforementioned gap: introduction of
efficient internal marketing in the intended sector, change in the supervisory
arrangement, and superior training for employees.
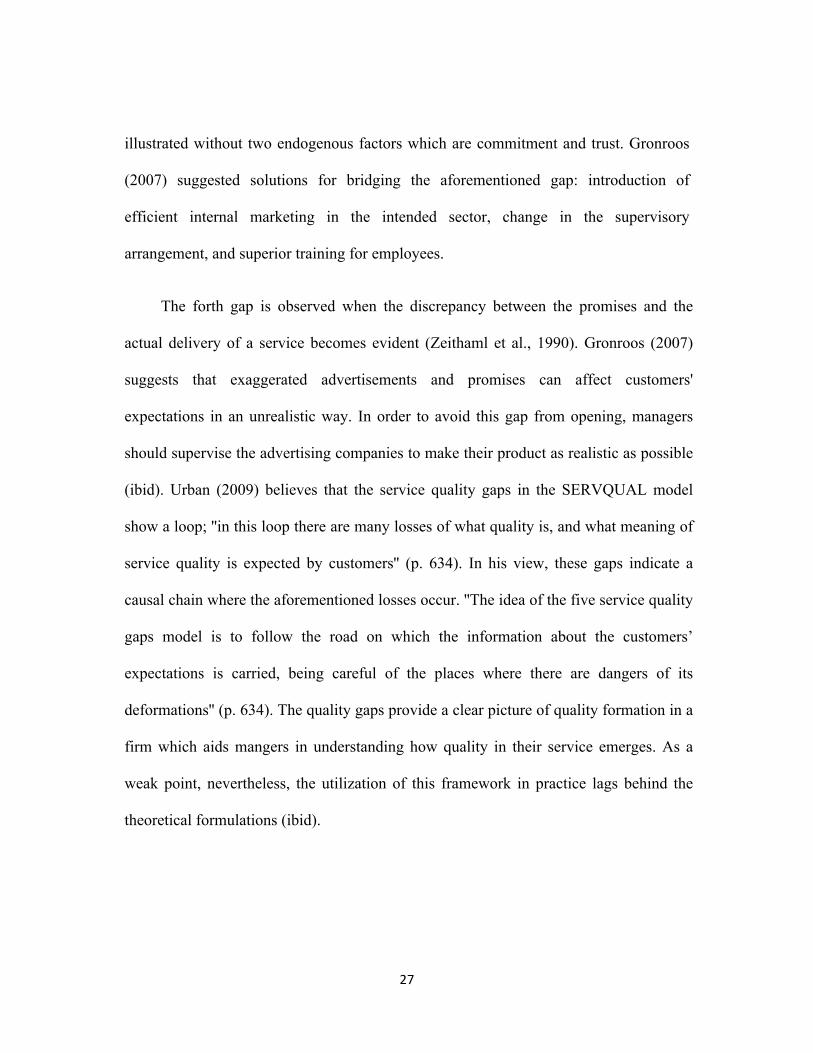
The forth gap is observed when the discrepancy between the promises and the
actual delivery of a service becomes evident (Zeithaml et al., 1990). Gronroos (2007)
suggests that exaggerated advertisements and promises can affect customers'
expectations in an unrealistic way. In order to avoid this gap from opening, managers
should supervise the advertising companies to make their product as realistic as possible
(ibid). Urban (2009) believes that the service quality gaps in the SERVQUAL model
show a loop; ''in this loop there are many losses of what quality is, and what meaning of
service quality is expected by customers'' (p. 634). In his view, these gaps indicate a
causal chain where the aforementioned losses occur. ''The idea of the five service quality
gaps model is to follow the road on which the information about the customers’
expectations is carried, being careful of the places where there are dangers of its
deformations'' (p. 634). The quality gaps provide a clear picture of quality formation in a
firm which aids mangers in understanding how quality in their service emerges. As a
weak point, nevertheless, the utilization of this framework in practice lags behind the
theoretical formulations (ibid).
28
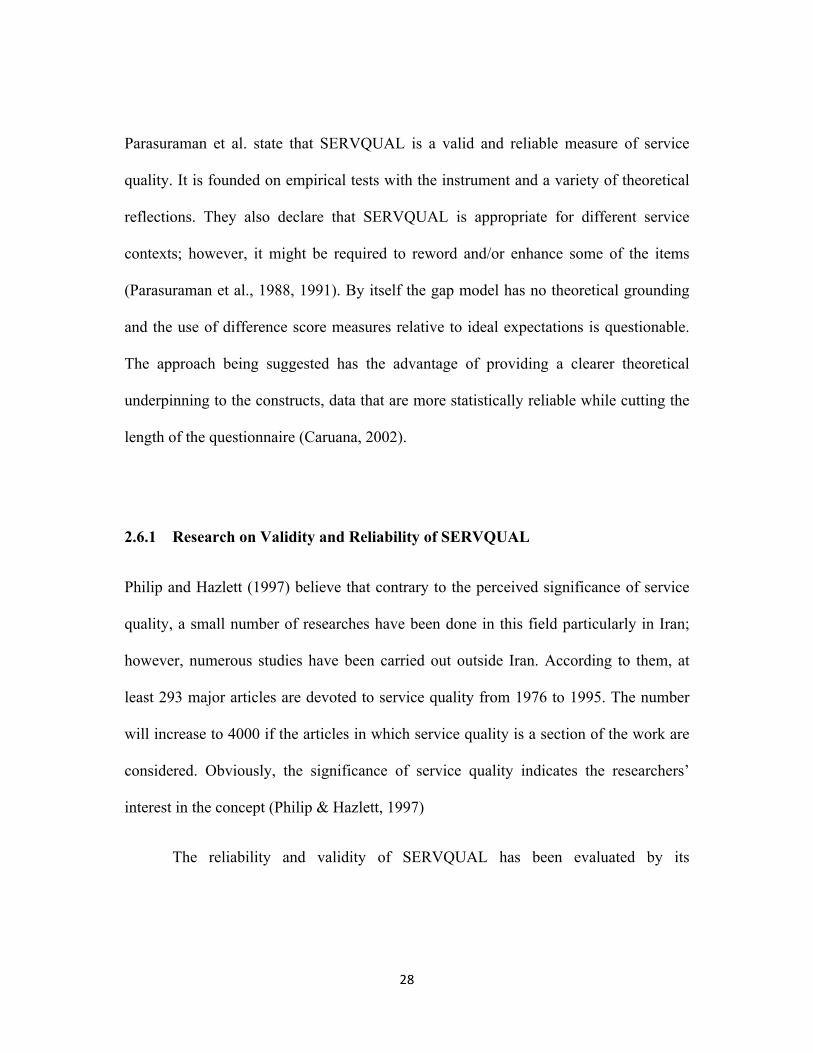
Parasuraman et al. state that SERVQUAL is a valid and reliable measure of service
quality. It is founded on empirical tests with the instrument and a variety of theoretical
reflections. They also declare that SERVQUAL is appropriate for different service
contexts; however, it might be required to reword and/or enhance some of the items
(Parasuraman et al., 1988, 1991). By itself the gap model has no theoretical grounding
and the use of difference score measures relative to ideal expectations is questionable.
The approach being suggested has the advantage of providing a clearer theoretical
underpinning to the constructs, data that are more statistically reliable while cutting the
length of the questionnaire (Caruana, 2002).
2.6.1 Research on Validity and Reliability of SERVQUAL
Philip and Hazlett (1997) believe that contrary to the perceived significance of service
quality, a small number of researches have been done in this field particularly in Iran;
however, numerous studies have been carried out outside Iran. According to them, at
least 293 major articles are devoted to service quality from 1976 to 1995. The number
will increase to 4000 if the articles in which service quality is a section of the work are
considered. Obviously, the significance of service quality indicates the researchers’
interest in the concept (Philip & Hazlett, 1997)
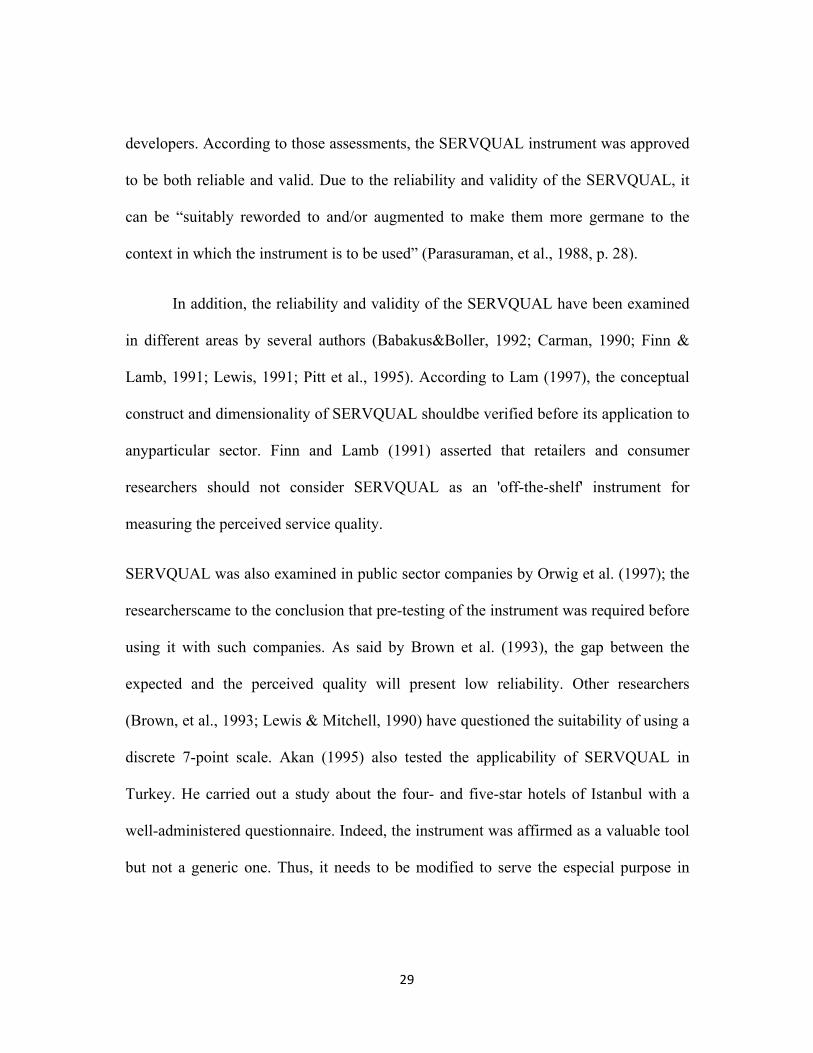
The reliability and validity of SERVQUAL has been evaluated by its
29
developers. According to those assessments, the SERVQUAL instrument was approved
to be both reliable and valid. Due to the reliability and validity of the SERVQUAL, it
can be “suitably reworded to and/or augmented to make them more germane to the
context in which the instrument is to be used” (Parasuraman, et al., 1988, p. 28).
In addition, the reliability and validity of the SERVQUAL have been examined
in different areas by several authors (Babakus&Boller, 1992; Carman, 1990; Finn &
Lamb, 1991; Lewis, 1991; Pitt et al., 1995). According to Lam (1997), the conceptual
construct and dimensionality of SERVQUAL shouldbe verified before its application to
anyparticular sector. Finn and Lamb (1991) asserted that retailers and consumer
researchers should not consider SERVQUAL as an 'off-the-shelf' instrument for
measuring the perceived service quality.
SERVQUAL was also examined in public sector companies by Orwig et al. (1997); the
researcherscame to the conclusion that pre-testing of the instrument was required before
using it with such companies. As said by Brown et al. (1993), the gap between the
expected and the perceived quality will present low reliability. Other researchers
(Brown, et al., 1993; Lewis & Mitchell, 1990) have questioned the suitability of using a
discrete 7-point scale. Akan (1995) also tested the applicability of SERVQUAL in
Turkey. He carried out a study about the four- and five-star hotels of Istanbul with a
well-administered questionnaire. Indeed, the instrument was affirmed as a valuable tool
but not a generic one. Thus, it needs to be modified to serve the especial purpose in
30
different environments (Akan, 1995).
2.7 The DINESERV Model
Stevens et al. (1995) introduced the DINESERV scale with five aspects which are
similar to the SERVQUAL model. In an attempt to complete the scale, Johns and Tyas
(1996) designed a 7-dimension model consisting of: responsiveness, empathy, food,
assurance, reliability, tangibles, and tangibles 2. In line with them, Qin et al. (2010)
introduced another scale including six aspects: responsiveness, empathy, assurance,
reliability, tangible, and recovery.
According to Tan et al. (2014), ''the DINESERV instrument was proposed as a reliable
and comparatively easy to use tool for determining how guests evaluate restaurant
service quality'' (p. 34). They also contend that ''the original DINESERV tool consisted
of 29 items, measured on a seven-point scale. DINESERV items also fall into five
service quality dimensions'' (p.34).
The researchers state that in the context of a restaurant, tangibles include the face of a
restaurant, its cleanliness and the appearance of the staff. ''Reliability involves freshness
and temperature of the food, accurate billing and receiving ordered food.
Responsiveness in restaurants relates to staff assistance with the menu or appropriate
and prompt response to customers’ needs and requests'' (ibid, p. 34). The next
dimension, assurance, is the trust customers put in staffs' recommendations or the health

31
of the food. ''Finally, empathy refers to providing personalised attention to customers by
being considerate towards customers’ problems'' (Tan et al., 2014, p. 43).
A number of researchers have considered this tool as a reliable and valid scale for
assessing the food industry (Bougoure & Neu, 2010); nevertheless, the scale is very
similar to the SERVQUAL model. Thus, Kim et al. (2003) believe that three
dimensions should be included in the tangibles factor: appearance of facilities, menu,
and the comfortableness of facilities. In addition, Olorunniwo and Hsu (2006) affirm
the cultural variations in perception of the customers; the original scale was formulated
in western context and thus needs modifications when it comes to other countries.
Markovic et al. (2010) suggest that the scale should be updated as it includes very
general items and also it was generated many years ago.
2.8 Iranian Culture and Cuisine
Through the study of any culture, a good understanding of the people and the related
societies can be attained. Indeed, this is also the case with Iran and the present study
makes an attempt to focus on Iranian cuisine within two chain restaurants. The Iranian
culture and can express Iranian identity according to the well-known Iranologist Nelson
Frye's book on Persia as he asserts that "Iran's prize possession has been its culture"
(p.9).
32
Iranian or Persian cuisine is concerned with the traditional and modern ways of
cooking exclusive to Iran and its culture. Although the neighbor countries have
influenced the Iranian cooking style, the culinary of Iran has its own unique
characteristics. The dietary style of Iranians basically includes bread in different forms:
Barbari, Sangak, Lavash, and Taftoon baked in large clay ovens called 'tanur'. Another
kind of especial diary product made at home is yoghurt or 'mast' with its specific
fermentation process. Mast is also used to make Iranian soup and is a vital part of oil
production.
Iranian cuisine, furthermore, includes several dishes cooked with rice. Iranians
believe that rice grain holds the “it is the god” inscription. Fathi, (2010) contends that
Iranians feel closer to their creator by taking rice. Boiled rice with vegetables, meats,
and seasonings ('Plou') is one of the most popular dishes in Iran. To name a few, Chelo-
kebab, rice with lamb, meatballs with rice, Koofte, Shishlik kebab with rice, and Chelo-
khoresh can be mentioned.
Sweets are also a significant part of Iranian cuisine. Containing egg yolks,
almonds, and cardamom, 'Baghlava' is one of the most delicious ones. Sprouted wheat
grain, honey, cinnamon, and lime juice are usually the most significant ingredients of
Iranian sweets.
Regarding dessert drink in Iran, Orange syrup ('Sharbat-portagal') is one of the most
favorite ones including a mixture of orange peels, orange juice, thin sugar syrup, and
33
rose water. The most preferred drink among the Iranians is tea which is served without
milk in pubs or 'GhahveKhane'.
2.9 Conceptual Research Model
Based on the literature on service quality, specifically, due in large part to the differing
theories offered in the literature as to the relationship between service quality and
satisfaction and their effects on behavioral intentions, the present researcher has tried to
examine the extent to which the causal order of service quality and satisfaction is
considered significant in the Iranian culture.
This study tries to investigate the role and effects of service quality and
satisfaction on behavioral customer outcomes such as repurchase intentions, word of
mouth, and loyalty. The literature and previous research in other cultures has indicated
that high service quality has an effect on the behavioral intentions of the customers and
consumers' level of satisfaction (Brady & Robertson; 2011; Caruana, 2002; GroÈnroos;
1990; Selnes, 1993).
It is clear from GroÈnroos (1984) that the most important aspect to perceived
service quality is the functional rather than the technical side of quality. The gap model
and its resultant SERVQUAL measure primarily focus on what GroÈnroos (1984, 1990)
terms the functional aspect of quality. It is suggested that these two models represent
parallel concepts that can both be viewed as one type of confirmation/disconfirmation in

34
satisfaction theory. It is for this reason that we adopt the suggestion by Rust et al. (1996,
p. 249) who argue that service quality is simply confirmation/disconfirmation and who
advocate the direct measurement of the perception items in SERVQUAL in relation to
respondents' expectations.
As Caruana (2002) argues that service quality, service loyalty, and customer satisfaction
are interconnected. He believes that in measuring service quality, one should take into
consideration the concepts of service loyalty and customer satisfaction.
In this regard in his seminal article he presents the trinity service quality model he
considers service quality as an Independent Variable which would affect the service
loyalty as the dependent variable. These two are connected through the mediating
factor, satisfaction on the customers’ side. The present study also ties to study the
service quality of two famous chain restaurants in Tehran and has employed the very
theoretical and conceptual model presented by Caruana (2002). The model is as
follows:
35
Figure 2.1: The Theoretical Model of Service quality (adapted from Caruana, 2002, p.818)
This model is utilized in the present study to answer the following research questions:
1. What are the major factors customers consider as significant in the evaluation of
service quality?
2. How satisfied are the restaurants customers?
3. How loyal are the restaurants customers? As indicated in the model, the concept of service quality is tightly attached to customer
satisfaction and subsequently customer loyalty. Thus, in order to answer the research
questions, those factors which lead to satisfaction should be identified. Satisfaction is
supposed to depend on the quality of the provided service and this satisfaction will lead
to loyalty in the long run (Caruana, 2002).
Mediator
Customer Satisfaction
Independent Variable
Service Quality
Dependent Variable
Service Loyalty
36
Chapter Three
Methodology
3.1 Introduction
The present section deals with describing the participants of the study, the
instruments used for data collection, and the procedure which will be taken
throughout the study. The assumed data analysis and quality standards will also
be briefly presented.
3.2 Research Design
The present study deals with a qualitative measure of data collection in order to answer
the three posed research questions. According to Dornyei (2007), this type of research
was traditionally utilized in the social sciences; however, to gather in-depth data from
human behavior in various disciplines, qualitative research is given a high credit. In its
first phase, the present research enjoys an Ex post Facto Design. The reason is that,
based on Wilsonet, al. (2010), there is no treatment involved in the study, nor is the
study concerned with any leaning process the participants might have gone through as a
significant factor. No control is implemented over the effect of independent variable of
the study (Service Quality) on the dependent variable (Service Loyalty). None of the
variables of the study are manipulated to cause changes, either. What is of paramount
37
importance then is the type and strength of the connection between variables of the
study; therefore an Ex Post Facto Design is the appropriate design for the
accomplishment of the purpose of the study (Field, 2009).
3.3 Case selection
The present study was an attempt to investigate service quality assessment within
notable chain restaurants of Tehran. More specifically, the study aimed at conducting a
research on two famous, active and successful chain restaurants of Tehran in
comparative mode to see how well their service qualities are and if the service quality
they offer has any deficiencies. They were selected for the present study based on their
fame and background. One of these two was a traditional food restaurant, namely
Haani, and the other one was Boof restaurant which provides fast food.
3.3.1Two Notable Chain Restaurants in Tehran
3.1.1.1Haani Restaurants in Tehran
Located in Beheshti St. (Between Bokharest St. & Modarres Highway.)
in Tehran, HaaniParseh restaurant has changed to one of the most notable self-service
restaurants in Iran. Its head, Ms. Tarighat, is an innovative lady who has full mastery
over Iranian cuisine. The restaurant serves high quality traditional food and recently has
focused on serving Pizza as well. Another innovation of Haani restaurant is the
38
conserved stew (Iranian Khoresh) which has attracted the attention of a lot of people in
the supermarkets where it is sold.
3.1.1.2Boof Restaurants in Tehran
In 1375 the first branch of Boof chain restaurants was established in ValiAsr St. in
Tehran was established. From the beginning, the founders' strategy was to create
multiple branches in Tehran and other parts of the country (particularly in provincial
capitals). Today, the founders claim that the only fast food which has a management
system integrated with the academic structure in Iran is Boof. Currently the company
has 47 branches in Tehran and other parts of the country. Based on the planning of the
founders, 110 branches are planned to be established of which 100 will be in Iran and
10 other branches in other countries. In this regard, opening a foreign branch in
Malaysia (Kuala Lumpur) is considered a great step toward the target.
3.1 Sample selection
The participants of the study were 120 clients (both male and female) attending two
amous chain restaurants of Tehran (60 attending each of Haani and Boof resturants) in
different days, especially on Fridays when the restaurants are more occupied. In order to
collect the data, convenience sampling was used because we had to choose from among
the customers attracted to the restaurants and those who received services there. On the
other hand, as these people were selected by chance, they could best represent the
39
sample population. The questionnaires were distributed among the participants after
their dining experience (Marković et al., 2010). Based on Creswell (2013), the least
number of individuals for data collection via questionnaire is not limited and the more
data the better. Meanwhile based on the famous table of determining sample size for
research activities (Krejcie & Morgan, 1970), the minimum sample out of the huge
population is 100. To collect the data 120 questionnaires were distributed to cover the
minimum sample required to run the research. Out of 120 questionnaires distributed, 70
returned ones were complete and usable (37 females and 33 males). These participants
received the valid SERVQUAL questionnaire developed by Caruana (2002) while they
were being served in the restaurants or after they left the restaurant.
3.2 Procedure
The Farsi version of the questionnaire was validated by the supervision committee
before administration. Then, the restaurant managers were briefed about the issue and
the concept of the research, and then they were offered the Farsi questionnaire. This
provided them with an atmosphere of trust and cooperation. Then the specific time and
day to do the research was decided upon and the questionnaires was distributed. The
researchers distributed 120 questionnaires to the customers collect the data. The
collected data then were analyzed using SPSS version 21 and the required measures
were taken. The analyzed data were used to answer the questions of the study.
40
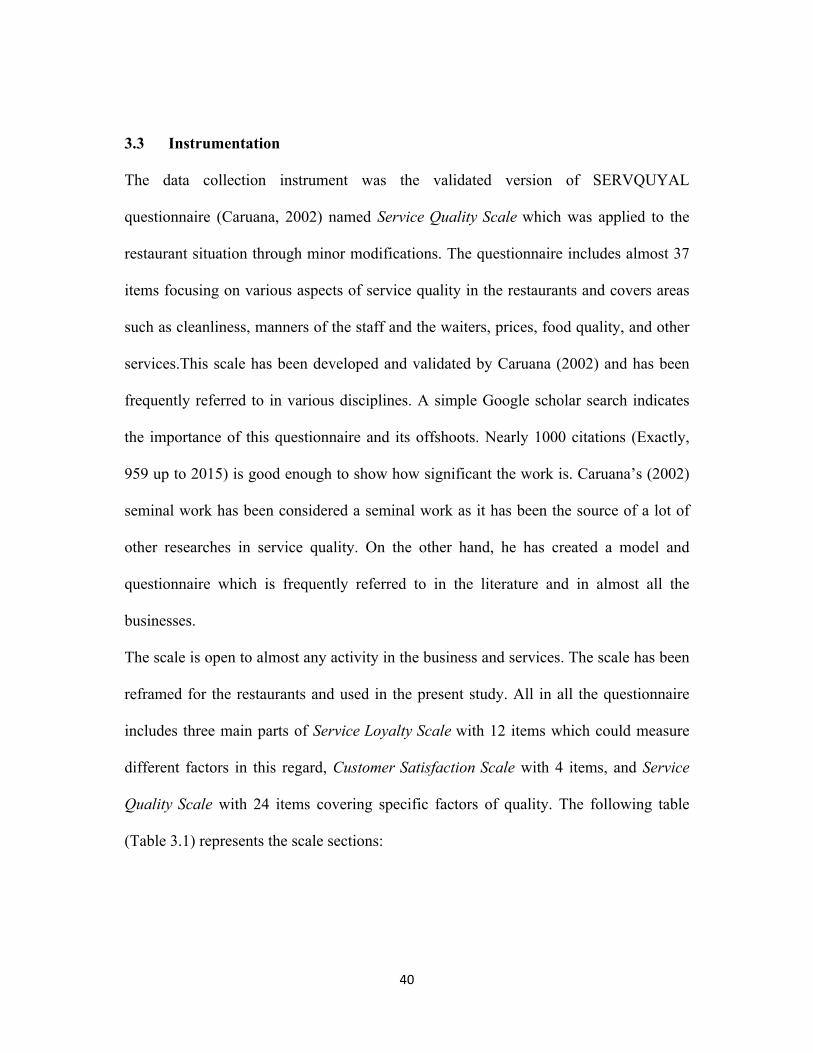
3.3 Instrumentation
The data collection instrument was the validated version of SERVQUYAL
questionnaire (Caruana, 2002) named Service Quality Scale which was applied to the
restaurant situation through minor modifications. The questionnaire includes almost 37
items focusing on various aspects of service quality in the restaurants and covers areas
such as cleanliness, manners of the staff and the waiters, prices, food quality, and other
services.This scale has been developed and validated by Caruana (2002) and has been
frequently referred to in various disciplines. A simple Google scholar search indicates
the importance of this questionnaire and its offshoots. Nearly 1000 citations (Exactly,
959 up to 2015) is good enough to show how significant the work is. Caruana’s (2002)
seminal work has been considered a seminal work as it has been the source of a lot of
other researches in service quality. On the other hand, he has created a model and
questionnaire which is frequently referred to in the literature and in almost all the
businesses.
The scale is open to almost any activity in the business and services. The scale has been
reframed for the restaurants and used in the present study. All in all the questionnaire
includes three main parts of Service Loyalty Scale with 12 items which could measure
different factors in this regard, Customer Satisfaction Scale with 4 items, and Service
Quality Scale with 24 items covering specific factors of quality. The following table
(Table 3.1) represents the scale sections:
41
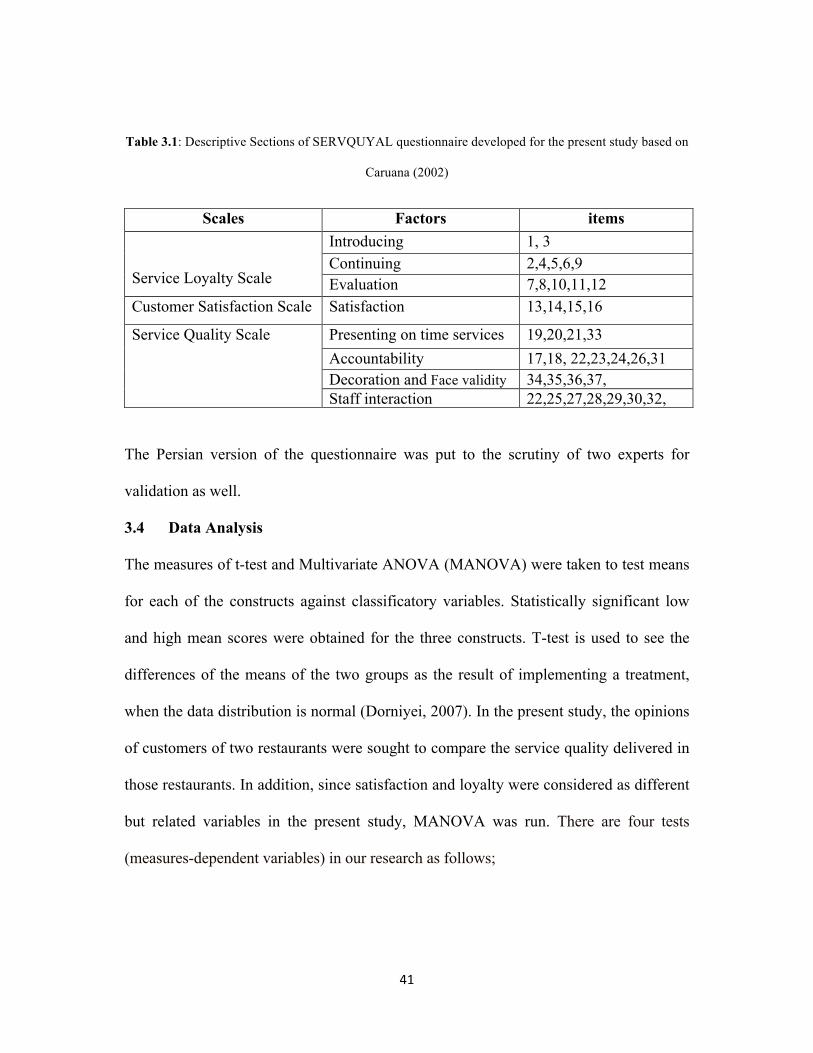
Table 3.1: Descriptive Sections of SERVQUYAL questionnaire developed for the present study based on
Caruana (2002)
Scales Factors items
Service Loyalty Scale
Introducing 1, 3 Continuing 2,4,5,6,9 Evaluation 7,8,10,11,12
Customer Satisfaction Scale Satisfaction 13,14,15,16
Service Quality Scale Presenting on time services 19,20,21,33 Accountability 17,18, 22,23,24,26,31 Decoration and Face validity 34,35,36,37, Staff interaction 22,25,27,28,29,30,32,
The Persian version of the questionnaire was put to the scrutiny of two experts for
validation as well.
3.4 Data Analysis
The measures of t-test and Multivariate ANOVA (MANOVA) were taken to test means
for each of the constructs against classificatory variables. Statistically significant low
and high mean scores were obtained for the three constructs. T-test is used to see the
differences of the means of the two groups as the result of implementing a treatment,
when the data distribution is normal (Dorniyei, 2007). In the present study, the opinions
of customers of two restaurants were sought to compare the service quality delivered in
those restaurants. In addition, since satisfaction and loyalty were considered as different
but related variables in the present study, MANOVA was run. There are four tests
(measures-dependent variables) in our research as follows;
42
Ø On Time Service
Ø Accountability
Ø Decoration and Face Validity
Ø Staff Interaction
We have four different means in our work. Statistically speaking Manova (Multivariate
Analysis of Variances) is the only test that enables us to compare more than two means
(Ashrafi, 2012).
3.5 Quality Standards
The researchers firstly translated SERVQUYAL questionnaire into Farsi with some
minor modifications. Then the first draft of the questionnaire was put to the scrutiny of
the two experts of the field and the supervision committee.The designed questionnaire
was distributed among 30 customers for piloting. Modifications were made to the
questionnaire based on the piloting results. The final version of the instrument was
distributed among 120 customers while being served in the restaurants or after they
leave the restaurant.Due to the piloting phase and recurrent modifications made to the
questionnaire, the validity and reliability of this instrument was affirmed to a great
extent. Caruana (2002, p.828) asserts that the reliability index o eth questionnaire based
on Cronbach’s alpha was α=0.62. Meanwhile the pilot study done by the present
researchers represented α=0.71., with 30 participants filling out the questionnaire. The
final calculation of the data with 70 participants was also done and reliability indices of
43
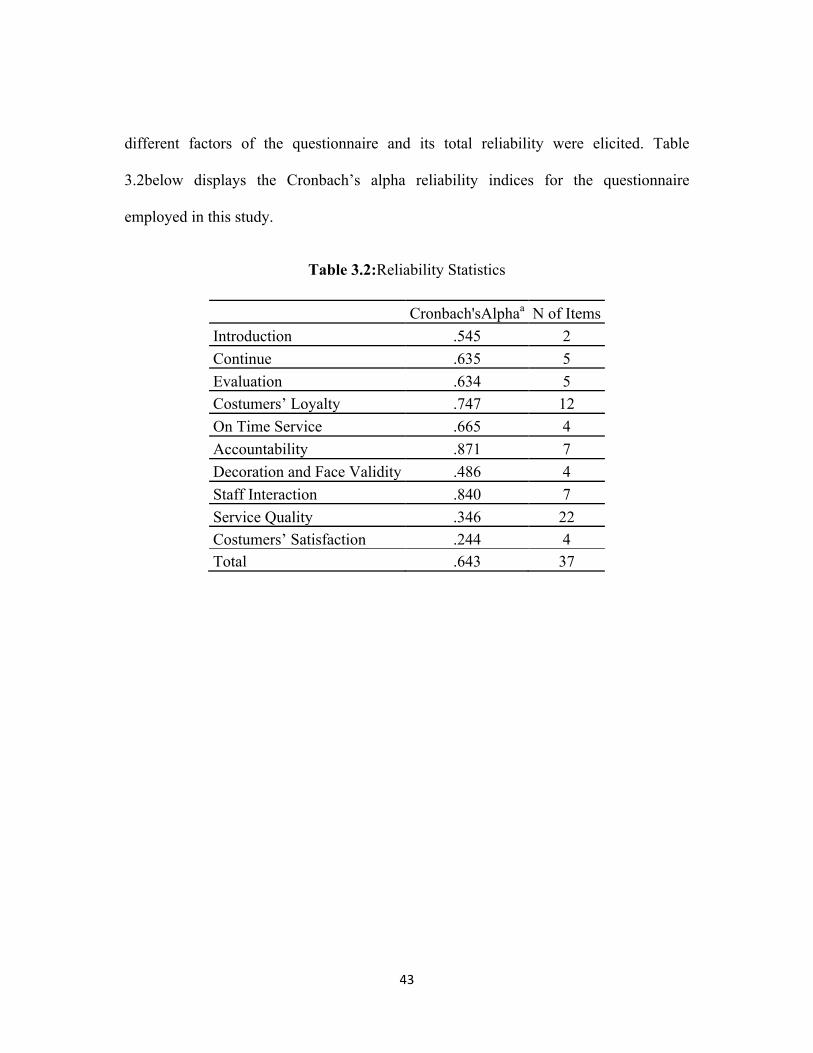
different factors of the questionnaire and its total reliability were elicited. Table
3.2below displays the Cronbach’s alpha reliability indices for the questionnaire
employed in this study.
Table 3.2:Reliability Statistics
Cronbach'sAlphaa N of Items Introduction .545 2 Continue .635 5 Evaluation .634 5 Costumers’ Loyalty .747 12 On Time Service .665 4 Accountability .871 7 Decoration and Face Validity .486 4 Staff Interaction .840 7 Service Quality .346 22 Costumers’ Satisfaction .244 4 Total .643 37
44
Chapter IV
Presentation of Findings
4.1 Introduction
This chapter deals with presenting the data. The data for the present study was collected
from 70 customers (male and female) eating at the two restaurants under investigation.
37 of the respondents were females and 33 were males. The research questions of the
study are presented and then the data for each of them will be given.
The first research question of the study deals with determining the major factors
customers consider as significant in the evaluation of service quality in Haani and Boof
restaurants. The second research question, however, deals with customer satisfaction
and the third one with customers’ loyalty in both restaurants.
4.2 Results
4.2.1 Research Question 1
1. What are the major factors customers consider as significant in the evaluation of
service quality?
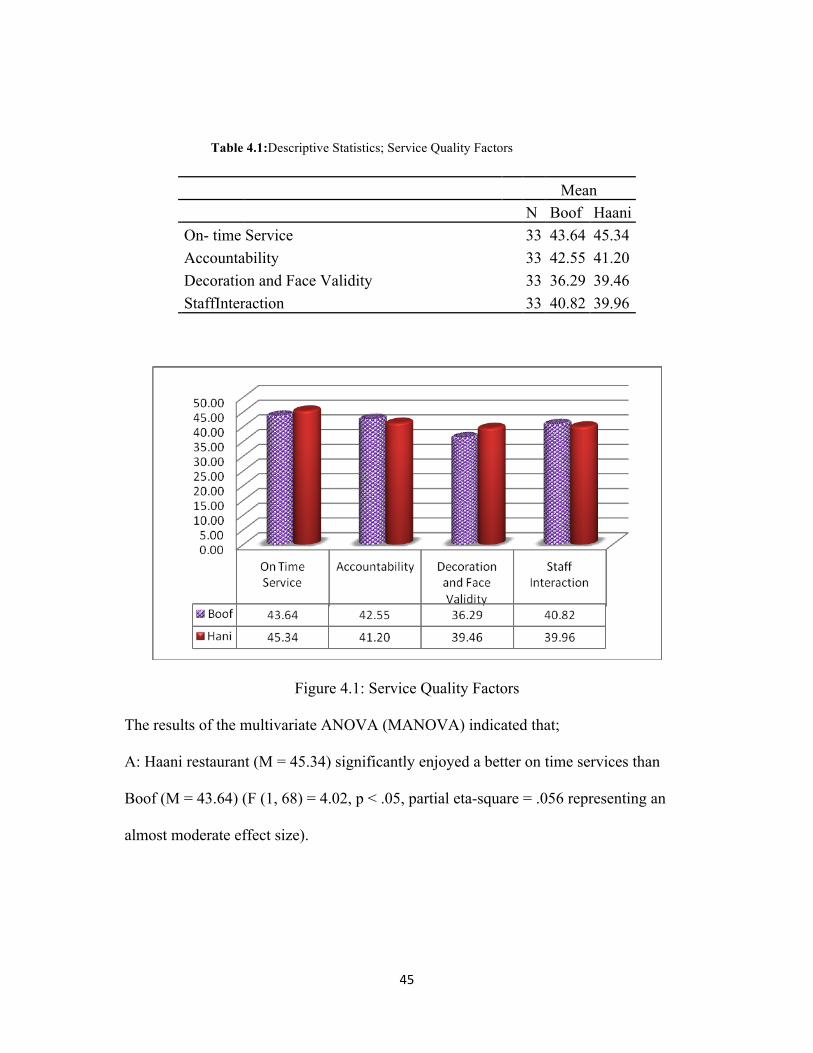
Table 4.1 displays the mean scores for the four factors of service quality in Haani and
Boof restaurants. Haani restaurant presented better on time services (M = 45.34) and
had better decoration and face validity (M = 39.46) than the Boof restaurant. On the
other hand, Boof restaurant enjoyed a higher level of accountability (M = 42.55) and
had better staff interaction (M = 40.80) than Haani restaurant.
45
Table 4.1:Descriptive Statistics; Service Quality Factors
Mean N Boof Haani
On- time Service 33 43.64 45.34 Accountability 33 42.55 41.20 Decoration and Face Validity 33 36.29 39.46 StaffInteraction 33 40.82 39.96
Figure 4.1: Service Quality Factors
The results of the multivariate ANOVA (MANOVA) indicated that;
A: Haani restaurant (M = 45.34) significantly enjoyed a better on time services than
Boof (M = 43.64) (F (1, 68) = 4.02, p < .05, partial eta-square = .056 representing an
almost moderate effect size).
46
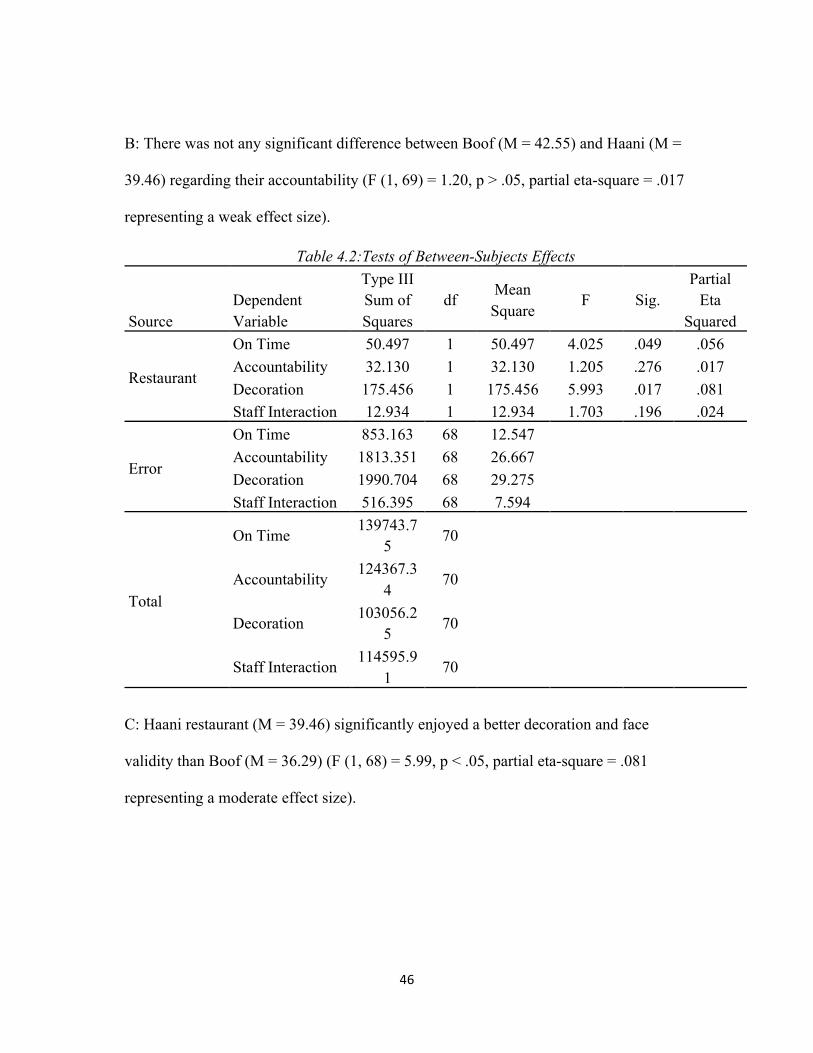
B: There was not any significant difference between Boof (M = 42.55) and Haani (M =
39.46) regarding their accountability (F (1, 69) = 1.20, p > .05, partial eta-square = .017
representing a weak effect size).
Table 4.2:Tests of Between-Subjects Effects
Source Dependent Variable
Type III Sum of Squares
df Mean Square
F Sig. Partial
Eta Squared
Restaurant
On Time 50.497 1 50.497 4.025 .049 .056 Accountability 32.130 1 32.130 1.205 .276 .017 Decoration 175.456 1 175.456 5.993 .017 .081 Staff Interaction 12.934 1 12.934 1.703 .196 .024
Error
On Time 853.163 68 12.547 Accountability 1813.351 68 26.667 Decoration 1990.704 68 29.275 Staff Interaction 516.395 68 7.594
Total
On Time 139743.7
5 70
Accountability 124367.3
4 70
Decoration 103056.2
5 70
Staff Interaction 114595.9
1 70
C: Haani restaurant (M = 39.46) significantly enjoyed a better decoration and face
validity than Boof (M = 36.29) (F (1, 68) = 5.99, p < .05, partial eta-square = .081
representing a moderate effect size).
47
B: There was not any significant difference between Boof (M = 40.82) and Haani (M =
39.96) regarding their staff interactions (F (1, 69) = 1.70, p > .05, partial eta-square =
.024 representing a weak effect size).
The data obtained from the qualitative analysis can shed light on the success of these
two famous restaurants. As illustrated in the literature and according the SERVQUAL
and DINESERV models, the four aforementioned dimensions are among the most
significant ones (on time service, accountability, decoration, and staff interaction).
Thus, it can be concluded that the factors for a high degree of service quality are met by
the two restaurants.
4.2.2Research Question 2
How satisfied are the restaurants customers?
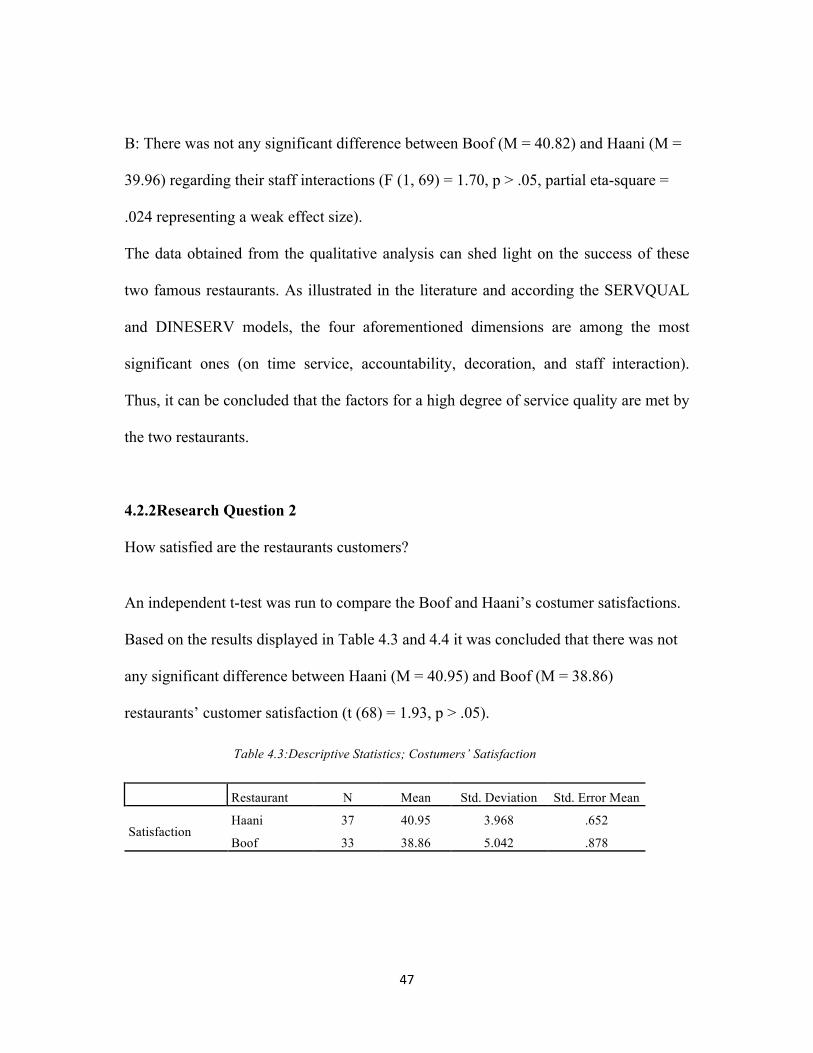
An independent t-test was run to compare the Boof and Haani’s costumer satisfactions.
Based on the results displayed in Table 4.3 and 4.4 it was concluded that there was not
any significant difference between Haani (M = 40.95) and Boof (M = 38.86)
restaurants’ customer satisfaction (t (68) = 1.93, p > .05).
Table 4.3:Descriptive Statistics; Costumers’ Satisfaction
Restaurant N Mean Std. Deviation Std. Error Mean
Satisfaction Haani 37 40.95 3.968 .652
Boof 33 38.86 5.042 .878
48
Table 4.4: Independent Samples Test; Costumers’ Satisfaction
Levene's Test for Equality of Variances
t-test for Equality of Means
F Sig. t df Sig. (2-tailed)
Mean Differen
ce
Std. Error
Difference
95% Confidence Interval of the
Difference
Lower Upper
Equal variances assumed .306 .582 1.93 68 .058 2.082 1.079 -.070 4.235
Equal variances not assumed
1.90 60.6 .062 2.082 1.094 -.105 4.269
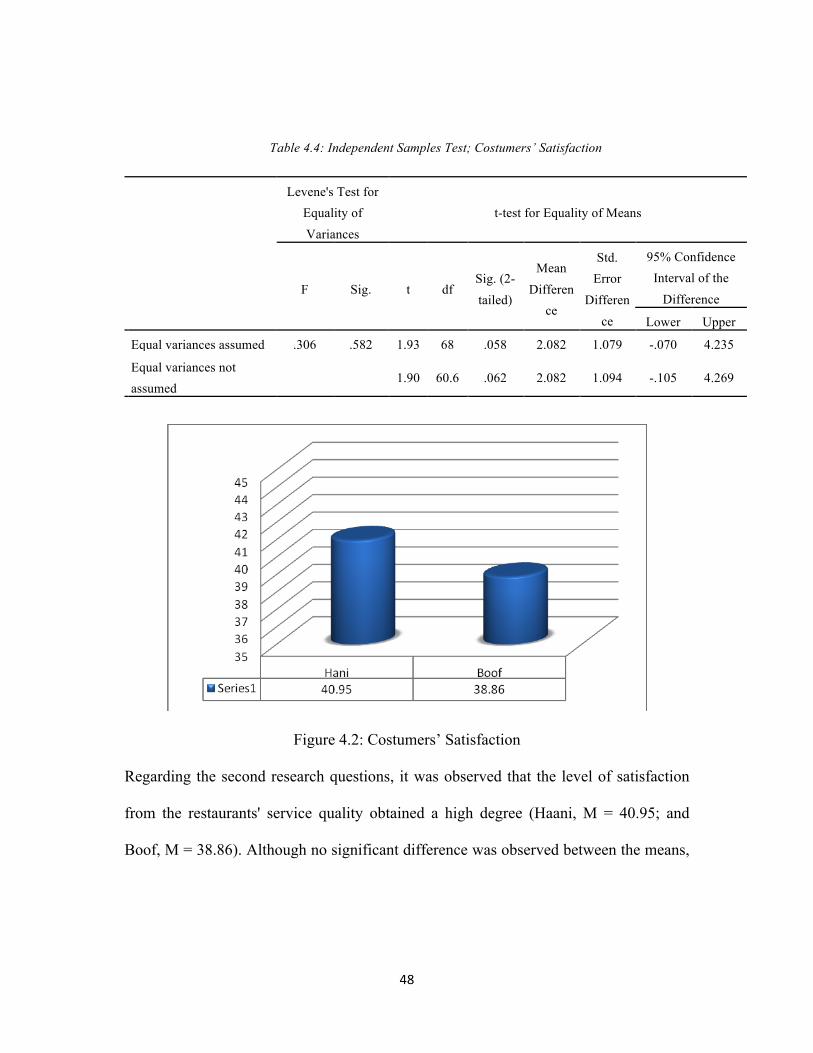
Figure 4.2: Costumers’ Satisfaction
Regarding the second research questions, it was observed that the level of satisfaction
from the restaurants' service quality obtained a high degree (Haani, M = 40.95; and
Boof, M = 38.86). Although no significant difference was observed between the means,
49
it can be inferred from the means that the two restaurants were successful to keep their
customers satisfied.
4.2.3 Research Question 3
How loyal are the restaurants customers?
Table 4.5 displays the mean scores for the three factors of costumers’ loyalty in Haani
and Boof restaurants. For Boof restaurant (M = 43.03), the way the restaurant was
introduced was more important than Haani (M = 40.81). Boof restaurant also showed a
higher rate of keeping its costumers (M = 40) than Haani (M = 39.73). Boof also
enjoyed a higher evaluation (M = 39.82) than Haani (M = 39.41).
Table 4.5: Descriptive Statistics; Costumers’ Loyalty Mean
N Boof Haani
Introduction 33 43.03 40.81
Continue 33 40.00 39.73
Evaluation 33 39.82 39.41
50
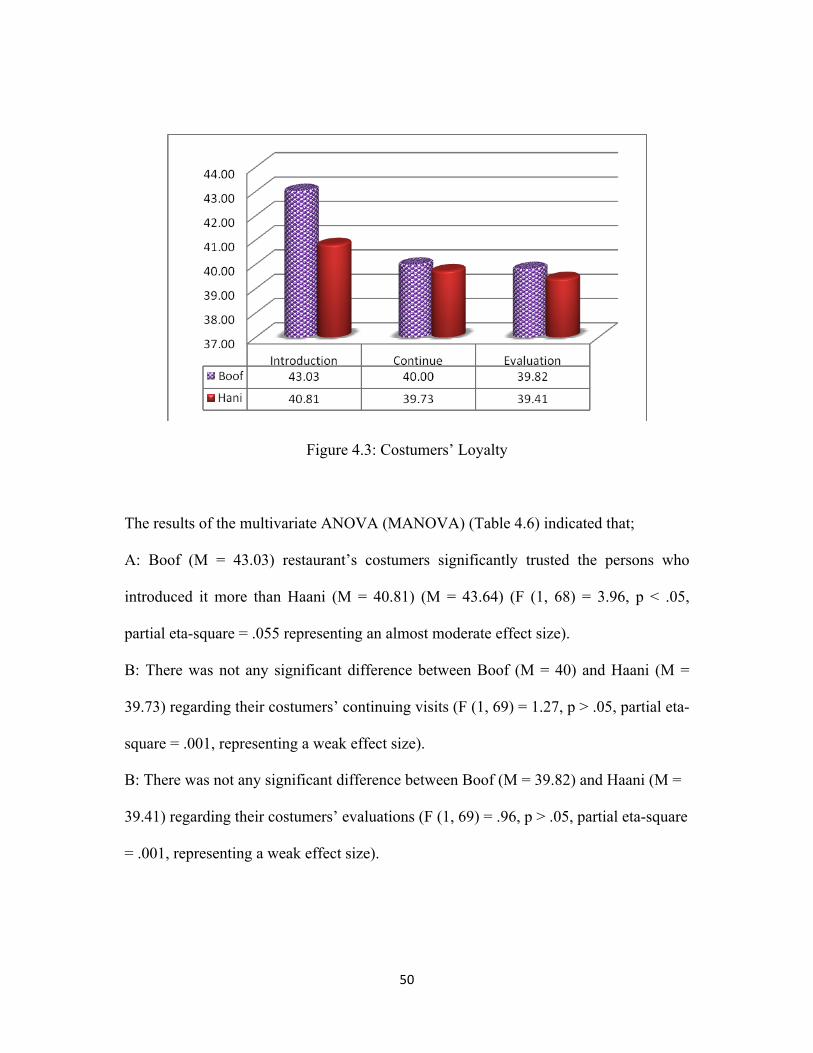
Figure 4.3: Costumers’ Loyalty
The results of the multivariate ANOVA (MANOVA) (Table 4.6) indicated that;
A: Boof (M = 43.03) restaurant’s costumers significantly trusted the persons who
introduced it more than Haani (M = 40.81) (M = 43.64) (F (1, 68) = 3.96, p < .05,
partial eta-square = .055 representing an almost moderate effect size).
B: There was not any significant difference between Boof (M = 40) and Haani (M =
39.73) regarding their costumers’ continuing visits (F (1, 69) = 1.27, p > .05, partial eta-
square = .001, representing a weak effect size).
B: There was not any significant difference between Boof (M = 39.82) and Haani (M =
39.41) regarding their costumers’ evaluations (F (1, 69) = .96, p > .05, partial eta-square
= .001, representing a weak effect size).

51
Table 4.6:Tests of Between-Subjects Effects
Source Dependent Variable
Type III Sum of Squares
df Mean Square
F Sig. Partial
Eta Squared
Restaurant Introduction 85.926 1 85.926 3.968 .050 .055 Continue 1.274 1 1.274 .042 .837 .001 Evaluation 2.972 1 2.972 .096 .757 .001
Error Introduction 1472.645 68 21.657 Continue 2041.297 68 30.019 Evaluation 2097.828 68 30.850
Total Introduction 124200.0 70 Continue 113244.0 70 Evaluation 111872.0 70
Considering the third research question i.e. the loyalty issue, the significant effect of
word of mouth was established as discussed in the literature; costumers of Boof
significantly trusted the persons who introduced it more than Haani. In addition, as both
restaurants try to keep their customers satisfied by means of high service quality,
customers' evaluation and continuing visits were at a high degree.
4.3 Discussion
The findings of the present study suggest that Based on the results it was revealed that
among the service quality factors on time servicing, accountability, and staff interaction
were the most significant ones for the customers while decoration and face validity was
the least significant factor. It was also found that there was not any significant
52
difference between Boof and Haani’s costumer satisfactions, but in terms of loyalty
factors the way the restaurant was introduced, rate of keeping costumers and evaluation,
Boof restaurant’s costumers significantly trusted the persons who introduced it more
than those of Haani, but there was not any significant difference between these two
restaurants regarding their costumers’ continuing visits costumers’ evaluations.
Findings of the present study are in line with the findings of the previous research
reported in the literature. Bearden and Teel (1989) found a high correlation between
consumer susceptibility and interpersonal influences and presented that continuous
good services can minimize the susceptibility of the customers. Czepiel (1990) asserted
that customer loyalty and retention is possible through keeping and managing
relationships with customers. Dotchin and Oakland (1994a) argued that classifying
services and understanding the customer needs will lead to presenting high quality
services and this way customer loyalty meets an increase. In this regard, Akan (1995)
found that service quality and customer satisfaction are in correlation and in case the
services offered do not lose their quality and keep up grading the customer satisfaction
and consequently, customer loyalty will be increased.
Although Eshghi, et al (2008) have focused on service quality and customer
satisfaction in the telecommunications services, their finding is noteworthy and could be
employed in other industries including restaurant management and hospitality related
concepts. They found that customer satisfaction is bound to the services offered and
53
their quality even in the novel services about which the public do not have enough
information or with which they are not fully familiar. Similar results were observed in
the present research as customer satisfaction and service quality were found to be highly
connected.
Referring to Iranian cooking and the presence of new tastes in the Iranian cuisine,
Fathi (2010) implies that in the food and restaurant industry keeping the high quality
and continuing with a recognized trend will increase customer loyalty to the producer.
Indeed, the loyalty issue was reported at high degrees in the present research as both
restaurants were famous and utilized service quality dimensions to retain their
customers. In line with the findings of the present research, Bashirian and Majdpour
(2011) also presented that standard service quality holds a significant role in satisfying
customers.
Theoretically speaking GroÈnroos (1984, 1990, and 2007) discusses the relationship
between service quality, customer satisfaction, and service loyalty. The same trend was
observed in the present paper as well. Kasper et al. (2006) also assert that successful
marketing should take accounts of service quality and customer satisfaction as well as
lip servicing. They believe that being well-mannered and presenting enough
information to the customers play a significant role in customer retention and this
increase service loyalty. Caruana (2002) likewise confirms that service quality, service
loyalty, and customer satisfaction are interrelated. The conceptual research model in the
54
present research was borrowed from Caruana (2002). Consequently, the results obtained
from this research could affirm those reported by Caruana.
Supporting the SERVQUAL model, Ahmed et al. (2010) investigated the connection
between service quality and customer satisfaction. The researchers were interested in
the repurchase intention of the customers as the result of their satisfaction in telecom
sector. Five dimensions of empathy, tangibles, responsiveness, assurance, and reliability
were of interest in their study.
In another study investigating the link between customer satisfaction and service
quality, Gera (2011) examined the relationship between service quality, satisfaction,
value, and behavioral intentions in the banking sector. The results indicated the
significant influence of service quality on value perception and consumer satisfaction.
According to Agbor (2011), believes the studies carried out in the domain of service
quality and customer satisfaction until 2011 report:
• Service quality and satisfaction of the customers are related;
• The SERVQUAL model can be used to measure service quality; and
• Service quality can also be assessed by other functional and technical
dimensions of service quality other than the SERVQUAL model.
55
Chapter Five
Conclusion and Recommendations
5.1 Introduction
The first part of the present chapter deals with restatement of the problem, as well as the
research questions, sand an overview of the procedures taken throughout the study, and
the conclusion drawn. This is followed by the pedagogical implications and suggestions
for further research.
5.2 Restatement of the Problem and Research Questions
The present study was an attempt to investigate service quality assessment within
notable chain restaurants of Tehran. More specifically, the study aimed at conducting a
research on two famous, active and successful chain restaurants of Tehran in
comparative mode to see how well their service qualities are and if the service quality
they offer has any deficiencies.The present study therefore aimed at assessing the
service quality of two notable chain restaurants in Tehran, namely Haani and Boof.
These restaurants are famous for their food quality and have built their reputations over
half a century.As Customer satisfaction is a substantial element for future purchase by
customers who have experienced a service before (Mittal & Kamakura, 2001), the
present study was aims to investigate the most remarkable factors influencing the
service quality perceived by the customers. In addition, two famous chain restaurants
and the quality of their different branches in Tehran are studied to find the real service
56
quality provided in each of them. In this regard the following research questions were
raised:
1. What are the major factors customers consider as significant in the evaluation of
service quality?
2. How satisfied are the restaurants customers?
3. How loyal are the restaurants customers?
To answer the questions raised, Service Quality Scale (Caruana, 2002) was employed to
measure the service quality of the restaurants aforementioned. 120 questionnaires were
distributed and seventy completed ones were returned. The customers’ presented data
was used to find out the significant factors considered in the evaluation of service
quality in Haani and Boof restaurants, satisfaction and loyalty degree of customers in
these two restaurants.The data collected were analyzed via employing SPSS software
version 21, employing descriptive statistics, t-test, and multivariate ANOVA
(MANOVA).
5.3 Conclusion
The present study endeavored to assess the service quality in two chain restaurants in
Tehran, namely Boof and Haani. After obtaining the qualitative data and analyzing
them, it was revealed that Haani restaurant significantly enjoyed a better on time
services than Boof; however,Boof enjoyed a higher evaluation than Haani. Also, there
57
was not any significant difference between Boof and Haani restaurant regarding their
accountability and staff interaction. There was also a significant difference between
these two restaurants customer’s satisfactions. Finally, Boof restaurant’s costumers
significantly trusted the persons who introduced it more than Haani, and there was not
any significant difference between Boof and Haani regarding their costumers’
continuing visits. Also, there was not any significant difference between Boof and
Haani regarding their costumers’ evaluations.
5.4 Limitations of the Study
As it is with other research, the present study suffers from a number of limitations. The
first is related to the number of participants. Although 120 questionnaires were
distributed, only 70 were returned and utilized in the study. Another limitation is the
number of restaurants compared in the experiment i.e. Hani and Boof. Regarding the
time constraints, it was not feasible to compare a larger number. In addition, only four
dimensions were examined: on-time service, accountability, decoration and face
validity, and staff interaction. Thus, such factors as trained vs. less trained staff,
restaurants income, and staff motivation were not touched.
5.5 Suggestions for Further Research
1. The findings of the present study focused on assessing the service quality of two
restaurants and customer satisfaction as well as service loyalty in these two places. The
58
study meanwhile did not focus on the issue of training the staff in this regard. Other
studies might be needed to focus on this significant point seeking for the difference
between the performance of the trained staff and the in-service or less trained ones in
this regard.
2. The relationship between customer loyalty, customer satisfaction, and the quality of
services offered in restaurants and the income of the restaurants in different levels and
conditions could be another topic of research which could be pursued in order to see
how important these factors could be for different restaurants.
3. Customer satisfaction and staff motivation and satisfaction degree are related together
(Verhoef, 2003). Meanwhile such a study for the Iranian restaurants in different forms
and products has not been done yet, and could be conducted to see of the relationship
works well in this context or not.
59
References
Agbor, J. M. (2011). The relationship between customer satisfaction and service
quality: A study of three Service sectors in Umeå. Masters Thesis, Umea School
of Business.
Ahmed, I., Nawaz, M.M., Usman, A., Shaukat, M.Z., Ahmed, N., & Wasin-ul- R.
(2010). Does service quality affect students' performance? Evidence from
institutes of higher learning. African Journal of Business Management, 4 (16),
3457-3462.
Akan, P. (1995). Dimensions of service quality: A study in Istanbul. Managing Service
Quality, 5 (6), 39–43.
Andaleeb, S. S., & Conway, C. (2006). Customer satisfaction in the restaurant industry:
An examination of the transaction-specific model. Journal of Services
Marketing, 20(1), 3-11.
Angelova, B., & Zekiri, J. (2011). Measuring customer satisfaction with service quality
using American Customer Satisfaction Model (ACSI Model). International
Journal of Academic Research in Business and Social Sciences, 1(3), 232-258.
Ashrafi, H.R. (2012). Statistics for human sciences. Tehran: Shahid Rajaei University
Press.
60
Asubonteng, P., McCleaty, K.J., & Swan, J.E. (1996). SERVQUAL revisited: A critical
review of service quality. Journal of Service Marketing, 10(6), 62-81.
Bashirian, N., & Majdpour, T. (2011). The role of standard service quality in front
office of five star hotels in Tehran in order to satisfy customers. Master's Thesis,
Luleå University of Technology, Department of Business Administration,
Technology and Social Sciences.
Bearden, W. O., & Teel, R. G. N. J. (1989). Measurement of consumer susceptibility to
interpersonal influence. Journal of Consumer Research, 15(4), 473-481.
Blešić, I., Ivkov-Džigurski, A., Dragin, A., Ivanović, L., & Pantelić, M. (2011).
Application of gap model in the researches of hotel services quality.
International scientific journal–Turizam, 15(1), 40-52.
Bougoure, U. S., & Neu, M. K. (2010). Service quality in the Malaysian fast food
industry: An examination using DINESERV. Services Marketing Quarterly,
31(2), 194-212
Brady, M. K., & Robertson, C.J. (2011). Searching for a consensus on the antecedent
role of service quality and satisfaction: An exploratory cross-national
study. Journal of Business Research, 51(1), 53-60.
61
Brown, S.W., & Bitner, M.J. (2007). Mandating a service revolution for marketing. In
R.F. Lush, & S.L. Vargo (Eds.),The service-dominant logic of marketing:
Dialog, debate and directions (pp. 393-405). Armonk, NY: M.E. Sharp.
Brown, T. J., Churchill G. A., & Peter, J. P. (1993). Improving the measurement of
service quality. Research note. Journal of Retailing, 69 (1), 126–139.
Caruana, A. (2002). Service loyalty: The effects of service quality and the mediating
role of customer satisfaction. European journal of marketing, 36(7/8), 811-828.
Chenet, P.,Tynan, C., & Money, A. (2000). The service performance gap: Testing the
redeveloped casual model.European Journal of Marketing 34(3/4), 472–495.
Creswell, J. W. (2013). Research design: Qualitative, quantitative, and mixed methods
approaches. University of Nebraska, Lincoln: Sage.
Cronin, J.J., & Taylor, S.A. (1992). Measuring service quality: A re-examination and
extension. Journal of Marketing, 6(7), 55-68.
Cronin, J.J., & Taylor, S.A. (1994). SERVPERF versus SERVQUAL: Reconciling
performance based and perception based ± minus ± expectation measurements
of service quality. Journal of Marketing, 58, 125-131.
customer loyalty in service industry. Novin Marketing Research Journal, 2(3),
27-45
62
Czepiel, J. (1990). Managing relationships with customers: A differentiation philosophy
of marketing. In D. E. Bowen, R. B. Chase, & T. G. Cummings (Eds.), Service
management effectiveness (pp. 299-323). San Francisco: Jossey-Bass.
Dornyi, Z.(2007). Research methods in applied linguistics. Oxford University Press
Dotchin, J.A., & Oakland, J.S. (1994a). Total quality management in services. Part 1:
Understanding and classifying services. International Journal of Quality &
Reliability Management, 11(3), 9-26.
Dotchin, J.A., & Oakland, J.S., (1994b). Total quality management in services. Part 2:
Service quality. International Journal of Quality & Reliability Management,
11(3), 27-42.
Dube, L., Renaghan, L. M., & Miller, J. M. (1994). Measuring customer satisfaction for
strategic management. Cornell Hotel and Restaurant Administration Quarterly,
35(1), 39-47.
Eshghi, A., Roy, S., &Ganguli, S. (2008). Service quality and customer satisfaction: An
empirical investigation in Indian mobile Telecommunications services.
Marketing Management Journal, 18(2), 119-144.
Fathi, M. (2010). Iranian cooking: Iranian tastes. 700 types of Iranian food, sweets, and
300 key points in cooking. Tehran: Fakhroldin Publishers.
63
Field, A. (2009). Discovering statistics using SPSS. Los Angeles: Sage Publications
Limited.
Finn, D. W., & Lamb, C. W. (1991). An evaluation of the SERVQUAL scale in a
retailing setting. Advances in Consumer Research, 18 (4), 483–490.
Fitzsimmons, J. A., & Fitzsimmons, M. J. (2008). Service management: Operations,
strategy, information technology(6th ed.).New York: McGraw-Hill.
Frye, R.A. (1951). The Near East and the great powers. Cambridge, Mass.: Harvard
University Press.
Fu, Y. Y., & Parks, S. (2001). The relationship between restaurant service quality and
consumer loyalty among the elderly. Journal of Hospitality & Tourism
Research, 25(3), 320-336.
Gera, R. (2011). Modelling the service antecedents of favorable and unfavorable
behavior intentions in life insurance services in India: An SEM study. Int. J.
Qual. Serv. Sci., 3(2), 225-242.
GroÈnroos, C. (1984). A service quality model and its market implications. European
Journal of Marketing, 18 (4), 36-44.
GroÈnroos, C. (1990). Service management and marketing: Managing the moments of
truth in service competition. Massachusetts, Toronto: Lexington Books.
64
GroÈnroos, C. (2007). Service Marketing and management: Customer management in
service competition. West Sussex: John Wiley & Sons.
Gummesson, E. (1987). Lip service – A neglected area in services marketing. The
journal of Services Marketing, 1(1), 19-23.
Hayes, B. E. (1992). Measuring customer satisfaction: Development and use of
questionnaires. Milwaukee, Wisconsin: ASQC Quality Press.
Hayes, B. E. (1998). Measuring customer satisfaction: Survey design, use, and
statistical analysis methods. Milwaukee, Wisconsin: ASQ Quality Press.
Haywood-Farmer, J., & Stuart, F.I., (1990). An instrument to measure the degree of
professionalism in a professional service. Service Industries Journal, 10(2), 336-
347.
Hung, Y.H., Huang, M.L., & Chen, K.S. (2003). Service quality evaluation by service
quality performance matrix. Total quality Management & Business Excellence,
14(1), 79-89.
Jamal, A., &Naser, K. (2002). Customer satisfaction and retail banking: An assessment
of some of the keyantecedents of customer satisfaction in retail banking.
International Journal of Bank Marketing, 20(4), 146-160.
65
Johns, N., & Howard, A., (1998). Customer expectations versus perceptions of service
performance in the foodservice industry. International Journal of Service
Industry Management, 9 (3), 248-265.
Johns, N., & Pine, R. (2002). Consumer behavior in the food service industry: A
review. International Journal of Hospitality Management, 21, 119–134.
Johns, N., & Tyas, P. (1996). Use of service quality gap theory to differentiate between
foodservice outlets. The Service Industries Journal, 16(3), 321-46.
Kasper, H., Helsdingen, V. P., &Gabbott, M. (2006). Service marketing management: A
strategic perspective. West Sussex: John Wiley & Sons.
Kim, H.J., McCahon, C., & Miller, J. (2003). Assessing service quality in Korean
casualdining restaurants Using DINESERV. Journal of Foodservice Business
Research, 6(1), 67-86.
Krejcie, R.V., & Morgan, D.W. (1970). Determining sample size for research activities.
Educational and Psychological Measurement, 30, 607-610.
Lam, S. S. K. (1997). SERVQUAL: A tool for measuring patients’ opinions of hospital
service quality in Hong Kong. Total Quality Management, 8 (4), 145–152.
Lasser, W.M., Manolis, C., & Winsor, R.D. (2000). Service quality perspectives and
satisfaction in private banking. Journal of Service Marketing, 14(3), 244-271.
66
Leonard, F.S., &Sasser, W.E. (1982). The incline of quality. Harvard Business Review,
60(5), 163-171.
Lewis, B. R. (1989). Quality in service sector – A review. International Journal of
Brand Marketing, 7(5), 4-12.
Lewis, B. R. (1991). Service quality: An international comparison of bank customers’
expectations and perceptions. Journal of Marketing Management, 7 (1), 47–62.
Lewis, B. R., & Mitchell, V.W. (1990). Defining and measuring the quality of customer
service. Marketing Intelligence & Planning, 8(6), 11-17.
Lewis, R.C., & Booms, B.H. (1983). The marketing aspects of service quality. In Berry,
L., Shostack, G. &Upah, G. (Eds). Emerging perspectives on service marketing
(pp. 99-107). Chicago, LL: American Marketing Association.
Lim, H. (2010). Understanding Americancustomer perceptions on Japanesefood and
services in the U.S. UNLVTheses dissertations professionalpapers capstones.
Lin, J. S. C., & Wu, C. Y. (2011). The role of expected future use in relationship based
service retention. Managing Service Quality, 21(5), 535-551.
Ljubojević, Č. (2004). Marketing of services, Faculty of Service Business, Novi Sad.
67
Malik, E., &Ghaffor, M. (2012). Impact ofbrand image, service quality and priceon
customer satisfaction in Pakistantelecommunication sector.International Journal
of Business andSocial Science, 3(2), 123.
Marković, S., Raspor, S., & Šegarić, K. (2010). Does restaurant performance meet
customers’ expectations? An assessment of restaurant service quality using a
modified DINESERV approach. Tourism and Hospitality Management, 16(2),
181-195
Markovic, S., Raspor, S., & Sergaric, K. (2010). Does restaurant performance meet
customers’ expectations? An assessment of restaurant service quality using a
modified DINSERV approach. Tourism and Hospitality Management, 16(2),
181-195.
Marković,S., Raspor, S., &Šegarić, K. (2010). Does restaurant performance meet
customers’ expectations? An assessment of restaurant service quality using a
modified DINESERV approach. Tourism and Hospitality Management, 16 (2),
181-195.
Mittal, B., & Lassar, W. M. (1998). Why do customers switch? The dynamics of
satisfaction versus loyalty. Journal of Services Marketing, 12(3), 177-194.
Mittal, B., &Lassar, W.M. (1998). Whydo customers switch? The dynamicsof
satisfaction versus loyalty. Journalof Services Marketing, 12(3), 177-194
68
Mittal, V., & Kamakura, W.A. (2001). Satisfaction, repurchase intent, and repurchase
behavior: Investigatingthe moderating effect of customer characteristics. Journal
of Marketing Research, 38(1), 131-142.
Mohr, L.B. (1982). Explaining organizational behavior. San Francisco, CA: Jossey-
Bass.
Munusamy, J., Chelliah, S., &Mun, H. (2010). Service quality delivery and its impact
on customer satisfaction in the banking sector in Malaysia. International
Journal of Innovation, Management and Technology, 1 (4), 398-404.
Najafi, S.V., Saati, S., Bighami, M.K., & Abdi, F. (2013). How do customers evaluate
hotel service quality? An empirical study in Tehran hotels. Management Science
Letters, 3(12).
Newman, K. (2001). Interrogating SERVQUAL: A critical assessment of service
quality measurement in a high street retail bank. International Journal of Bank
Marketing, 19(3), 126-139.
Nitin, S., Deshmukh, S.G., & Perm, V. (2005). Service quality models: A review.
International Journal of Quality and Reliability Management, 22 (9), 913-949.
Oh, H. (2000). Diners' perceptions of quality, value, and satisfaction: A practical
viewpoint. Cornell Hotel and Restaurant Administration Quarterly, 41(3), 58-66.
69
Oliver, R. L. (1980). A cognitive model of the antecedents and consequences of
satisfaction decisions. Journal of Marketing Research, 17, 460-469.
Oliver, R. L. (1993). A conceptual model of service quality and service satisfaction:
Compatible goals, different concepts. In Swartz, T.A., Bowen, D.E., & Brown,
S.W. 7Eds), Advances in services marketing and management: Research and
practice (Vol. 2, pp. 65-85). Greenwich, CT: JAI Press.
Oliver, R. L., & Swan, J. E. (1989). Consumer perceptions of interpersonal equity and
satisfaction in transactions: A field study approach. Journal of Marketing, 53(2),
21-35.
Olorunniwo, F., & Hsu, M. K. (2006). A typology analysis of service quality, customer
satisfaction and behavioral intentions in mass services. Managing Service
Quality, 16(2), 106-123.
Orwig, R. A., Pearson, J., & Cochran, D. (1997). An empirical investigation into the
validity of SERVQUAL in the public sector. Public Administration Quarterly,
21 (1), 54–68.
Parasuraman, A., Zeithaml, V.A., & Berry, L.L. (1985). A conceptual model of service
quality and its implications for future research. Journal of Marketing, 49(4), 41-
50.
70
Parasuraman, A., Zeithaml, V.A., & Berry, L.L. (1988). SERVQUAL: A multiple-item
scale for measuring consumer perceptions of service quality. Journal of
Retailing, 64 (1), 12-40.
Parasuraman, A., Zeithaml, V.A., & Berry, L.L. (1991). Refinement and reassessment
of the SERVQUAL scale. Journal of Retailing, 67(4), 420-450.
Philip, G., &Hazlett, S.A. (1997). The measurement of service quality: A new P-C-P
attributes model. International Journal of Quality & Reliability Management,
14(3), 260-286.
Pitt, L. F., &Jeantriut, B. (1994). Management of customer expectations in service
firms: A study and a checklist. The Service Industries Journal, 14(2), 170-189.
Pitt, L. F., Watson, R. T., &Kavan, C. B. (1995). Service quality: A measure of
information systems effectiveness. MIS Quarterly, 19 (2), 173–187.
Qarehchi,M., &Dabuyan, F. (2011) the relation between employee loyalty and
Qin, H., Prybutok, V. R., & Zhao, Q. (2010). Perceived service quality in fast-food
restaurants: Empirical evidence from China. International Journal of Quality &
Reliability Management, 27 (4), 424-437
Rust, R. T., & Oliver, R. L. (1994). Service quality: Insights and managerial
implications from the frontier. CA: Sage, Thousand Oaks.
71
Rust, R.T., Zahorik, A.J., &Keiningham, T.L. (1996). Service Marketing. New York,
NY: Harper Collins.
Ruyter, K., Bloemer, J., &Peeters, P. `Merging service quality and service satisfaction:
An empirical test of an integrative model. Journal of Economic Psychology, 18,
387-406.
Seilier, V.L. (2004). Examining Service Quality for homebuyers in the residential real
state brokerage industry. PhD thesis, Sydney: University of Western Sydney.
Selnes, F. (1993). An examination of the effect of product performance on brand
reputation, satisfaction and loyalty. European Journal of Marketing,27(9), 19-
35.
Selnes, F. (1993). An examination of the effect of product performance on brand
reputation, satisfaction and loyalty, European Journal of Marketing, 27(9), 19-35.
Seth, N., &Deshmukh, S.G. (2005). Service quality models: A review. International
Journal of Quality & Reliability Management, 22(9), 913-949.
Shahin, A. (2006). SERVQUAL and model of service quality gaps: A framework for
determining and prioritizing critical factors in delivering quality services. In
ParthaSarathy V. (Ed.), Service quality – Anintroduction (pp. 117-131). Andhra
Pradesh: ICFAI University Press.
72
Spreng, R.A., &Mackoy, R.D. (1996). An empirical examination of a model of
perceived service quality and satisfaction. Journal of Retailing, 72 (2), 201-214.
Stevens, P., Knuston, B., & Patton, M. (1995). DINESERV: A tool for measuring
service quality in restaurants. Cornell Hotel and Restaurant Administration
Quarterly, 36(2), 56-60.
Sulek, J. M.,& Hensley, R. L. (2004). The relative importance of food, atmosphere and
fairness or wait. The Cornell Hotel and Restaurant Administration Quarterly, 45
(3), 235-247.
Sureshchander, G.S., Rajendran, C., &Anatharaman, R.N. (2002). The relationship
between service quality and customer satisfaction: A factor specific approach.
Journal of Service Marketing, 16(4), 363-379.
Susskind, A. M., & Chan, E. K. (2000). How restaurant features affect check averages:
A study of the Toronto restaurant market. The Cornell Hotel and Restaurant
Administration Quarterly, 41 (6), 56-63.
Taghizadeh, H., Taghipourian, M.J., & Khazaei, A. (2012). The effect of customer
satisfaction on word of mouth communication. Research Journal of Applied
Sciences, Engineering and Technology, 5(8), 2569-2575.
73
Tam, W.Y., & Yung, N.L.A. (2003). Managing customer for value in catering industry
(fast food) in Hong Kong. MBA thesis, The Chinese University of Hong Kong.
Tan, Q., Oriade, A., & Fallon, P. (2014). Service quality and customer satisfaction in
Chinese fast food sector: a proposal for CFFRSERV. Advances in Hospitality
and Tourism Research (AHTR), 2(1), 30-53.
Thorsten, H. T., & Alexander, K. (1997). Theimpact of customer satisfaction
andrelationship quality on customerretention: a critical reassessment andmodel
development. Psychology&Marketing, 14(8), 737–764.
Tse, D.K., & Wilton, P.C. (1988). Models of consumer satisfaction formation: An
extension. Journal of Marketing Research, XVII, 460-469.
Urban, W. (2009). Service quality gaps and their role in service enterprises
development. Technological and Economic Development of Economy, 15(4),
631–645.
Van Iwaarden, J., van der Wiele, T., Ball, L., & Millen, R. (2003). Applying
SERVQUAL to web sites: An exploratory study. International Journal of
Quality & Reliability Management, 20(8), 919-935.
74
Vavra, T. G. (1997). Improving your measurement of customer satisfaction: A guide to
creating, conducting, analyzing, and reporting customer satisfaction
measurement programs. Milwaukee, Wisconsin: ASQ quality press.
Verhoef, P. C. (2003). Understanding the effect of customer relationship management
efforts on customer retention and customer share development.Journal of
marketing, 67(4), 30-45.
Wilson, A., Johns, R., Miller, K., & Pentecost, R. (2010). Presenting and using the
research results. In Marketing research: An integrated approach (pp. 243-259).
Retrieved from University of Canberra E-Reserve.
Wisniewski, M. (2001). Using SERVQUAL to assess customer satisfaction with public
sector services. Managing Service Quality, 11(6), 380-388.
Wisniewski, M., & Donnelly, M. (1996). Measuring service quality in the public sector:
the potential for SERVQUAL. Total quality Management, 7(4), 357-365.
Yüksel, A., & Yüksel, F. (2002). Measurement of tourist satisfaction with restaurant
services: A segment-based approach. Journal of Vacation Marketing, 9(1), 52-
68.
75
Zahari, W., Yusoff, W., & Ismail, M. (2008). FM-SERVQUAL: A new approach of
service quality measurement framework in local authorities. Journal of
Corporate Real Estate, 10(2), 130-144.
Zairi, M. (2000). Managing customerdissatisfaction through effectivecomplaint
management systems. TheTQM Magazine, 12(5), 331-335.
Zeithaml, V. (2000). Service quality, profitability and the economic worth of customers:
What we know and what we need to learn. Journal of the Academy of Marketing
Science, 28 (1), 67- 85.
Zeithaml, V. A., Parasuraman, A., & Berry, L. L. (1990). Delivering service quality:
Balancing customer perceptions and expectations. New York: The Free Press.
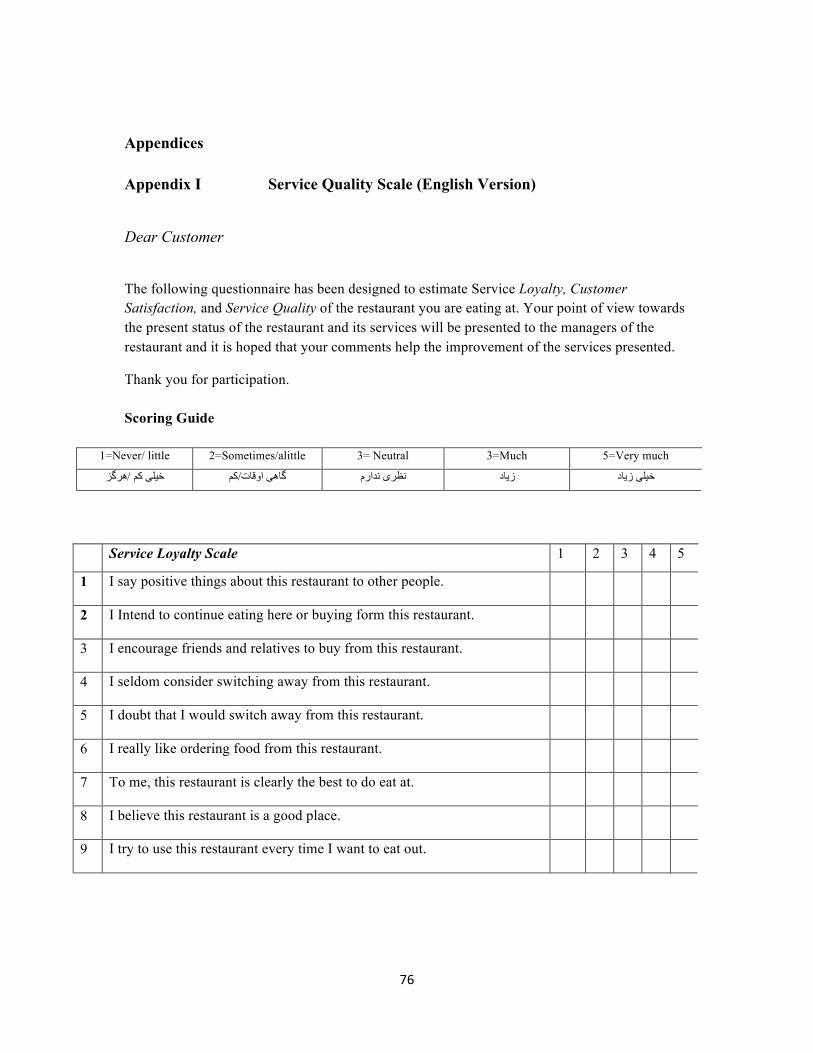
76
Appendices
Appendix I Service Quality Scale (English Version)
Dear Customer
The following questionnaire has been designed to estimate Service Loyalty, Customer Satisfaction, and Service Quality of the restaurant you are eating at. Your point of view towards the present status of the restaurant and its services will be presented to the managers of the restaurant and it is hoped that your comments help the improvement of the services presented.
Thank you for participation.
Scoring Guide
5=Very much 3=Much 3= Neutral 2=Sometimes/alittle 1=Never/ little
خيیلی کم /هھھھرگز گاهھھھی ااووقاتت/کم نظریی ندااررمم ززيیادد خيیلی ززيیادد
5 4 3 2 1 Service Loyalty Scale
I say positive things about this restaurant to other people. 1
I Intend to continue eating here or buying form this restaurant. 2
I encourage friends and relatives to buy from this restaurant. 3
I seldom consider switching away from this restaurant. 4
I doubt that I would switch away from this restaurant. 5
I really like ordering food from this restaurant. 6
To me, this restaurant is clearly the best to do eat at. 7
I believe this restaurant is a good place. 8
I try to use this restaurant every time I want to eat out. 9
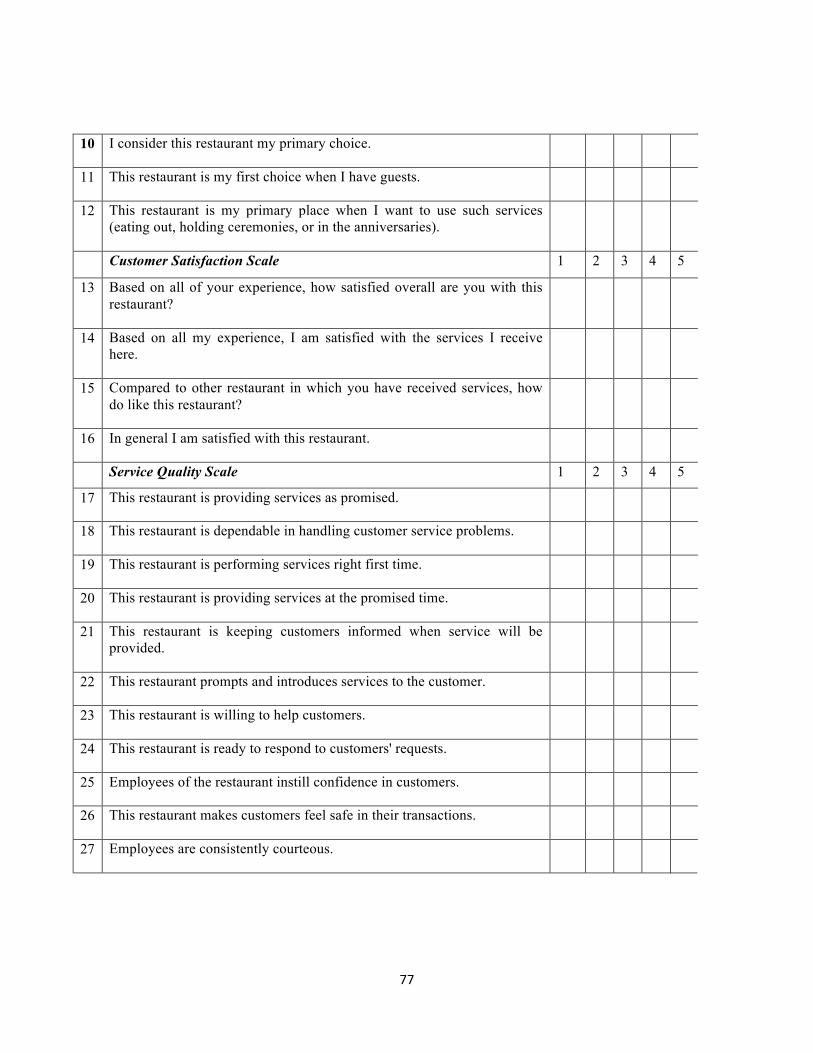
77
I consider this restaurant my primary choice. 10
This restaurant is my first choice when I have guests. 11
This restaurant is my primary place when I want to use such services (eating out, holding ceremonies, or in the anniversaries).
12
5 4 3 2 1 Customer Satisfaction Scale
Based on all of your experience, how satisfied overall are you with this restaurant?
13
Based on all my experience, I am satisfied with the services I receive here.
14
Compared to other restaurant in which you have received services, how do like this restaurant?
15
In general I am satisfied with this restaurant. 16
5 4 3 2 1 Service Quality Scale
This restaurant is providing services as promised. 17
This restaurant is dependable in handling customer service problems. 18
This restaurant is performing services right first time. 19
This restaurant is providing services at the promised time. 20
This restaurant is keeping customers informed when service will be provided.
21
This restaurant prompts and introduces services to the customer. 22
This restaurant is willing to help customers. 23
This restaurant is ready to respond to customers' requests. 24
Employees of the restaurant instill confidence in customers. 25
This restaurant makes customers feel safe in their transactions. 26
Employees are consistently courteous. 27
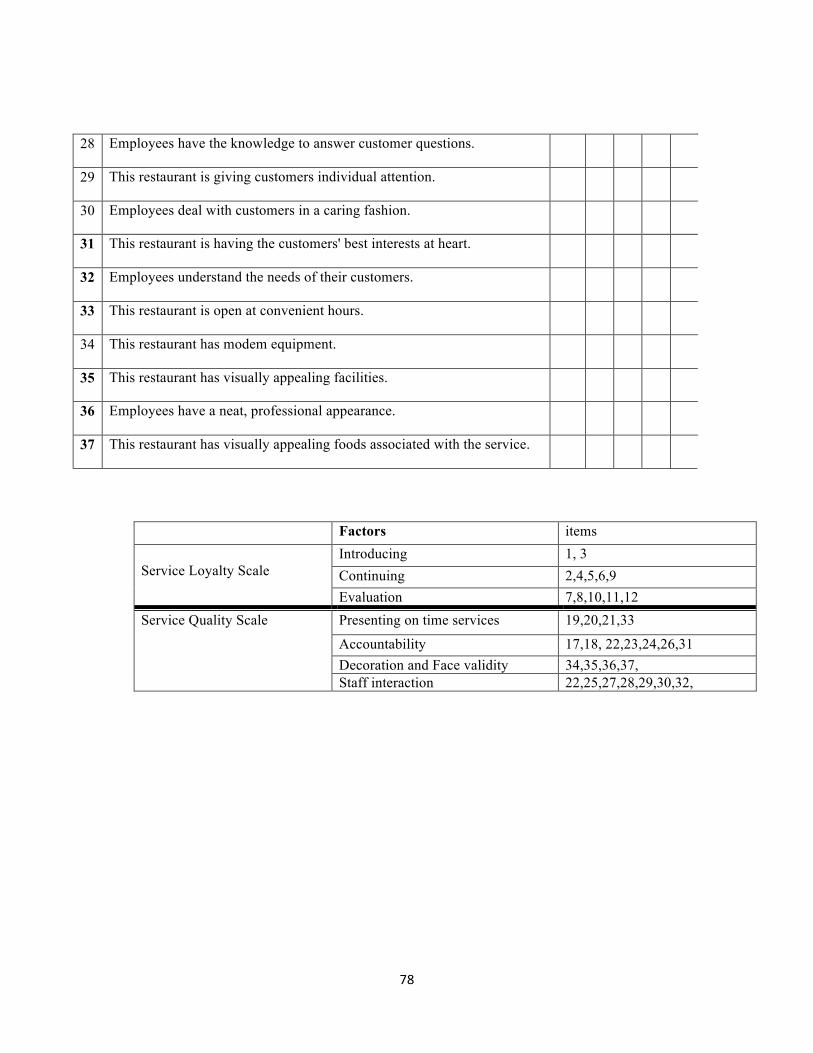
78
Employees have the knowledge to answer customer questions. 28
This restaurant is giving customers individual attention. 29
Employees deal with customers in a caring fashion. 30
This restaurant is having the customers' best interests at heart. 31
Employees understand the needs of their customers. 32
This restaurant is open at convenient hours. 33
This restaurant has modem equipment. 34
This restaurant has visually appealing facilities. 35
Employees have a neat, professional appearance. 36
This restaurant has visually appealing foods associated with the service. 37
Factors items Service Loyalty Scale
Introducing 1, 3 Continuing 2,4,5,6,9 Evaluation 7,8,10,11,12
Service Quality Scale Presenting on time services 19,20,21,33
Accountability 17,18, 22,23,24,26,31 Decoration and Face validity 34,35,36,37, Staff interaction 22,25,27,28,29,30,32,

79
Appendix II Service Quality Scale (Persian Version)
خيیلی کم /=1هھھھرگز =2گاهھھھی ااووقاتت/کم =3نظریی ندااررمم =3ززيیادد =5خيیلی ززيیادد
����� �������
منن ررااجع بهھ اايینن ررستوورراانن تعرريیفف خووبب وو مثبتت ميیكنمم ١۱
.منن بهھ غذذاا خووررددنن بهھ اايینن ررستوورراانن اادداامهھ مي ددهھھھمم وو اازز آآنن غذذاا تهھيیهھ مي كنمم ٢۲
اازز اايینن ررستوورراانن خرريیدد كننددمنن ددووستانن ووااقوواامم رراا تشوويیقق مى كنمم ٣۳
بهھ نددررتت فكرر عووضض كررددنن اايینن ررستوورراانن رراا با جايیي ددااررمم ٤
منن شكك ددااررمم بخووااهھھھمم نظظررمم رراا ددررباررهه اايینن ررستوورراانن عووضض كنمم ٥
منن ووااقعأ ددووستت ددااررمم اازز اايینن ررستوورراانن سفاررشش ددهھھھمم ٦
بهھ نظظررمم ليینن ررستوورراانن بهھترريینن جايي برراايي غذذاا خووررددنن ااستت ٧۷
منن باوورر ددااررمم اايینن ررستوورراانن بهھ ططوورر ووااضح بهھترريینن جايي برراايي خووررددنن غذذاا ااستت ٨۸
منن سعي ميیكنمم برراايي غذذاا خووررددنن خاررجج اازز خانهھ اايینن ررستوورراانن رراا اانتخابب كنمم ٩۹
١۱١۱اايینن ررستوورراانن ااووليینن اانتخابب منن ددرر ررستوورراانهھا ااستت ووقتي مهھمانن ددااررمم٬،اايینن ررستوورراانن ااووليینن -
گذذيینهھ منن ااستت
١۱٠۰
اايینن ررستوورراانن برراايي مررااسمم ووجشنن هھھھا ددرر ااوولوويیتت ااستت ١۱١۱
منن ررااجع بهھ اايینن ررستوورراانن تعرريیفف خووبب وو مثبتت ميیكنمم ١۱٢۲
����� ����� �����
با تمامم تجارربي كهھ دداارريیدد٬، چقددرر اازز اايینن ررستوورراانن ررااضي بوودديیدد؟ ١۱٣۳
با هھھھمهھ تجرربيیاتمم ٬، اازز تمامم سرروويیسس اايینن ررستوورراانن ررااضي بووددمم ١۱٤
ددرر مقايیسهھ با ررستوورراانن هھھھايي دديیگرر٬، آآيیا اازز سرروويیسس اايینن ررستوورراانن ررااضي بوودديیدد؟ ١۱٥
منن اازز اايینن ررستوورراانن ددرر مجمووعع ررااضي هھھھستمم ١۱٦
���������� ����� ����� ���
ررستوورراانن ططبقق تعهھددااتشش سرروويیسس رراا اانجامم ميیددهھھھدد ١۱٧۷
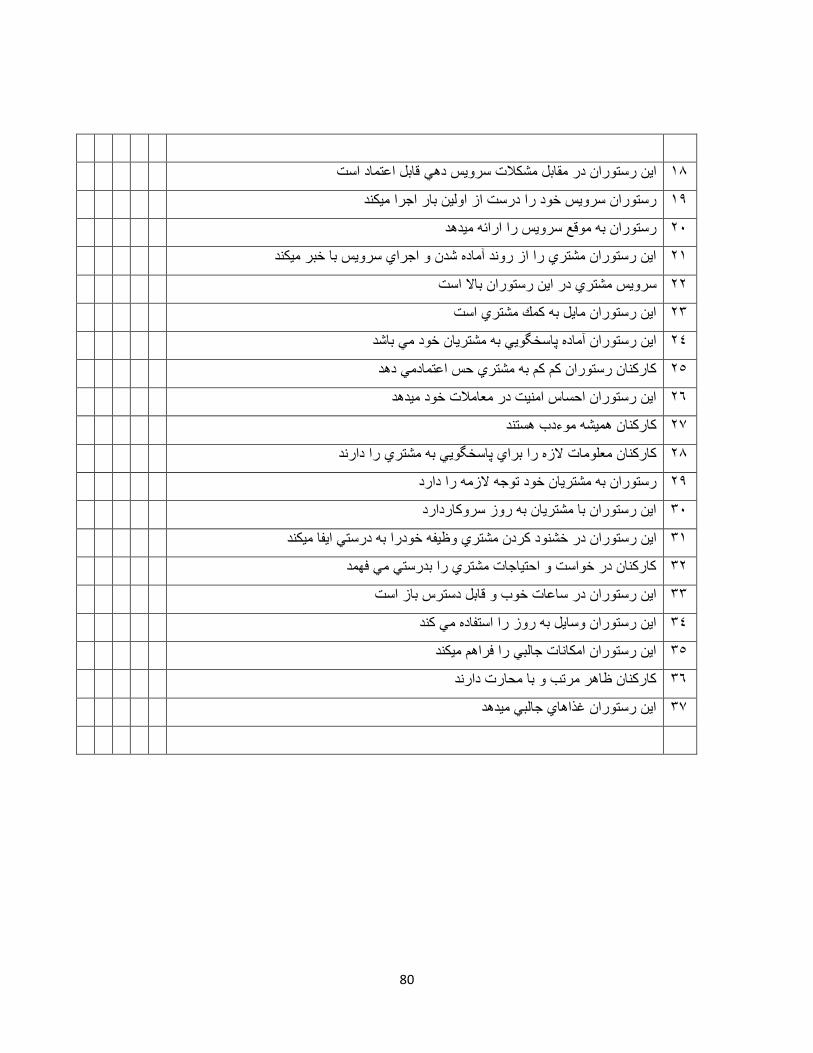
80
قابلل ااعتمادد ااستتاايینن ررستوورراانن ددرر مقابلل مشكالتت سرروويیسس ددهھھھي ١۱٨۸
ررستوورراانن سرروويیسس خوودد رراا ددررستت اازز ااووليینن بارر ااجرراا ميیكندد ١۱٩۹
ررستوورراانن بهھ مووقع سرروويیسس رراا اارراائهھ ميیددهھھھدد ٢۲٠۰
اايینن ررستوورراانن مشترريي رراا اازز ررووندد آآماددهه شددنن وو ااجرراايي سرروويیسس با خبرر ميیكندد ٢۲١۱
سرروويیسس مشترريي ددرر اايینن ررستوورراانن باال ااستت ٢۲٢۲
توورراانن مايیلل بهھ كمكك مشترريي ااستتاايینن ررس ٢۲٣۳
اايینن ررستوورراانن آآماددهه پاسخگوويیي بهھ مشترريیانن خوودد مي باشدد ٢۲٤
كارركنانن ررستوورراانن كمم كمم بهھ مشترريي حسس ااعتماددمي ددهھھھدد ٢۲٥
اايینن ررستوورراانن ااحساسس اامنيیتت ددرر معامالتت خوودد ميیددهھھھدد ٢۲٦
كارركنانن هھھھميیشهھ مووءددبب هھھھستندد ٢۲٧۷
الززهه رراا برراايي پاسخگوويیي بهھ مشترريي رراا ددااررندد كارركنانن معلووماتت ٢۲٨۸
ررستوورراانن بهھ مشترريیانن خوودد تووجهھ الززمهھ رراا دداارردد ٢۲٩۹
اايینن ررستوورراانن با مشترريیانن بهھ ررووزز سررووكارردداارردد ٣۳٠۰
اايینن ررستوورراانن ددرر خشنوودد كررددنن مشترريي ووظظيیفهھ خووددرراا بهھ ددررستي اايیفا ميیكندد ٣۳١۱
يي رراا بددررستي مي فهھمددكارركنانن ددرر خووااستت وو ااحتيیاجاتت مشترر ٣۳٢۲
اايینن ررستوورراانن ددرر ساعاتت خووبب وو قابلل ددستررسس بازز ااستت ٣۳٣۳
اايینن ررستوورراانن ووسايیلل بهھ ررووزز رراا ااستفاددهه مي كندد ٣۳٤
٣۳٥ اايینن ررستوورراانن اامكاناتت جالبي رراا فررااهھھھمم ميیكندد
كارركنانن ظظاهھھھرر مررتبب وو با محاررتت ددااررندد ٣۳٦
٣۳٧۷ ميیددهھھھدداايینن ررستوورراانن غذذااهھھھايي جالبي