ACKNOWLEDGEMENTS - DIVA
127
ACKNOWLEDGEMENTS First of all, the authors of this thesis would like to give a run of applause to our supervisor Frederic Bill for all the support and guidance along this well experienced journey. Many interesting thesis and non-thesis subjects have been discussed in your office and many laughs have given us the strength to keep fighting in both good and bad times. Onwards, we would like to thank our examiner professor Mosad Zineldin for great feedback during the seminars and a good guidance when we have been lost in space. Furthermore, warm greetings to all our 150 respondents participating in our survey. We are very greatful that so many people gave us a bit of their time in order to help us, both in rain and in sunshine. And last but not least, a great acknowledges to the five kindly retail store managers on City Gross, Coop Extra, Ica Maxi, Lidl and Willy:s that received us with open arms and we most appreciate your helpfulness and contribution to this study. Now, we are looking forward to graduate! Thank you all once again! _____________________ _____________________ Sophie Lindgren Amanda Tuvhag 860310 871015
-
Upload
khangminh22 -
Category
Documents
-
view
1 -
download
0
Transcript of ACKNOWLEDGEMENTS - DIVA
ACKNOWLEDGEMENTS
First of all, the authors of this thesis would like to give a run of applause
to our supervisor Frederic Bill for all the support and guidance along this
well experienced journey. Many interesting thesis and non-thesis subjects
have been discussed in your office and many laughs have given us the
strength to keep fighting in both good and bad times.
Onwards, we would like to thank our examiner professor Mosad Zineldin
for great feedback during the seminars and a good guidance when we have
been lost in space.
Furthermore, warm greetings to all our 150 respondents participating in
our survey. We are very greatful that so many people gave us a bit of their
time in order to help us, both in rain and in sunshine.
And last but not least, a great acknowledges to the five kindly retail store
managers on City Gross, Coop Extra, Ica Maxi, Lidl and Willy:s that
received us with open arms and we most appreciate your helpfulness and
contribution to this study.
Now, we are looking forward to graduate! Thank you all once again!
_____________________ _____________________
Sophie Lindgren Amanda Tuvhag
860310 871015

ABSTRACT Master Thesis in Marketing, School of Business and Economics at
Linnaeus University, spring 2012
Authors: Sophie Lindgren and Amanda Tuvhag
Title: Corporate Social Responsibility – A successful business strategy or just a
trend?
Purpose: First of all, this thesis wants to describe managers’ expectations
regarding customers’ perception about their retail stores CSR initiatives and
furthermore their implemented CSR initiatives. Secondly, to describe customer
awareness and engagement towards retail stores CSR initiatives. Finally, to
compare the results from retail store and customers, in purpose to identify
possible gaps between these two.
Research questions:
RQ1: What expectations regarding customers’ perception of retail stores CSR
initiatives do manager of such stores have and how do they perform CSR
activities?
RQ2: How aware are customer regarding retail stores CSR initiative and what
level of engagement do customer have concerning retail stores CSR activities?
Method: The empirical material is based on both a quantitative and a qualitative
investigation. The quantitative investigation is the main study and contains of a
customer survey whereby the collected sample consist of 150 respondents. A pilot
study have been conducted in order to improve the intension of the survey.
Further, the qualitative investigation contains five in-depth semi-strucutred
interviews with local store managers of the selected retail stores.
Conclusion: Customer thinks retail stores CSR initiatives are important, but they
seldom support them. Retail store expect customers to value CSR products/action
low in relation to other factors, but retail store are engaging themselves in several
CSR actions.
Keywords: Corporate Social Responsibility (CSR), marketing strategy, business
ethics, sustainability, reputation, food industry, retailers, gap-model, perception,
customer, retail store industry, expectation, environmentally certified, ecological
products, fair trade.

Table of Contents
1. INTRODUCTION ............................................................................................................... 1
1.1 BACKGROUND ............................................................................................................... 1
1.2 PROBLEM DISCUSSION ............................................................................................... 3
1.3 RESEARCH QUESTIONS ............................................................................................... 6
1.4 PURPOSE ......................................................................................................................... 6
1.5 DELIMITATIONS ........................................................................................................... 7
1.6 KEYWORDS ..................................................................................................................... 7
1.7 THEORETICAL RELEVANCE ....................................................................................... 7
1.8 EMPIRICAL RELEVANCE ............................................................................................. 7
1.9 DISPOSITION .................................................................................................................. 7
2. METHODOLOGY .............................................................................................................. 9
2.1 POSITIVISM VERSUS HERMENEUTIC ...................................................................... 9
2.2 DEDUCTIVE VERSUS INDUCTIVE APPROACH ...................................................... 9
2.3 QUANTITATIVE VERSUS QUALITATIVE APPROACH ....................................... 10
2.3.1 PRIMARY AND SECONDARY DATA COLLECTION ..................................................... 11
2.4 QUANTITATIVE RESEARCH ..................................................................................... 12
2.4.1 SURVEYS ..................................................................................................................................... 12
2.4.2 SAMPLE ....................................................................................................................................... 13
2.4.3 THIS QUANTIATIVE STUDY -‐ SURVEY ........................................................................... 14
2.5 QUALITATIVE RESEARCH ........................................................................................ 16
2.5.1. INTERVIEWS ............................................................................................................................ 16
2.5.2 DATA COLLECTION ................................................................................................................ 16
2.5.3 THIS QUALITATIVE STUDY-‐ IN-‐DEPTH INTERVIEWS ............................................ 17
2.6 SOCIAL DESIRABILITY BIAS .................................................................................... 18
2.7 CRITERIONS ................................................................................................................. 19
2.7.1 CRITERIONS IN THIS STUDY .............................................................................................. 20
2.8 OPERATIONALIZATION ............................................................................................ 21
2.8.1 OPERATIONALIZATION OF THIS STUDY ...................................................................... 21
2.8.2 PILOT STUDY ............................................................................................................................ 22
2.8.3 SURVEY ........................................................................................................................................ 22
2.8.4. IN-‐DEPTH INTERVIEWS ..................................................................................................... 26
3. THEORETICAL FRAMEWORK .................................................................................... 28
3.1 THE HISTORY OF CORPORATE SOCIAL RESPONSIBILITY .............................. 28
3.2 CSR TODAY ................................................................................................................... 28

3.3 CSR PYRAMIAD ............................................................................................................ 30
3.3.1 ECONOMIC RESPONSIBILITIES ........................................................................................ 30
3.3.2 LEGAL RESPONSIBILITIES .................................................................................................. 31
3.3.3 ETHICAL RESPONSIBILITIES ............................................................................................. 31
3.3.4 PHILANTHROPIC RESPONSIBILITIES ............................................................................ 31
3.4 CSR FROM A CONSUMERS POINT OF VIEW ......................................................... 32
3.5 CSR FROM A FOOD RETAIL STORES POINT OF VIEW ....................................... 34
3.5.1 CSR-‐ALTERNATIVE FOR FOOD RETAIL STORES ....................................................... 35
3.5.2 CSR PRODUCTS ........................................................................................................................ 36
3.6 SERVICE QUALITY – 5 GAP MODEL ........................................................................ 38
3.7 CSR MODEL OF THE STUDY ..................................................................................... 39
4. EMPIRICAL INVESTIGATION ..................................................................................... 42
4.1 QUANTITATIVE INVESTIGATION .......................................................................... 42
4.2 VARIABLES OVERVIEW ............................................................................................. 42
4.2.1 VARIABLE AGE ......................................................................................................................... 42
4.2.2 VARIABLE GENDER ................................................................................................................ 44
4.2.3 VARIABLE HOUSEHOLD ...................................................................................................... 45
4.2.4 VARIABLE EDUCATION ........................................................................................................ 46
4.2.5 VARIABLE OCCUPATION ..................................................................................................... 47
4.2.6 VARIABLE INCOME ................................................................................................................ 48
4.3 RELATIONSHIP VARIABLES .................................................................................... 49
4.3.1 CUSTOMERS’ ATTITUDES TOWARDS SOCIAL RESPONSIBILITY ....................... 49
4.3.2 IMPORTANT FACTORS INFLUENCING CUSTOMERS CHOICE OF RETAIL
STORE ..................................................................................................................................................... 51
4.3.3 AWARENESS OF CSR PRODUCTS ..................................................................................... 52
4.3.4 PURCHASING CSR PRODUCTS ........................................................................................... 53
4.3.5 AWARENESS AND PURCHASING CSR PRODUCTS .................................................... 55
4.3.6 REASONS FOR PURCHASING CSR PRODUCTS ............................................................ 56
4.3.7 REASONS FOR NOT PURCHASING CSR PRODUCTS .................................................. 57
4.3.8 PURCHASING CSR PRODUCTS AND SOCIAL RESPONSIBILITY ........................... 58
4.3.9 CUSTOMERS GRADING OF IMPORTANT FACTORS IN RETAIL STORES .......... 59
4.3.10 IMPORTANT PRODUCTS FEATURES ........................................................................... 61
4.3.11 THE IMPORTANCE FOR RETAIL STORES TO PROVIDE CSR PRODUCTS ...... 62
4.3.12 PREFERABLE RETAIL STORES ....................................................................................... 63
4.3.13 NON-‐PREFERABLE RETAIL STORE .............................................................................. 64
4.3.14 REASONS WHY CUSTOMERS DO NOT PURCHASE AT RETAIL STORES ........ 65
4.4 QUALITATIVE INVESTIGATION – INTERVIEWS ................................................ 66

4.4.1 PART I – GENERAL OVERVIEW OF RETAIL STORES ................................................ 67
4.4.2. PART II – CUSTOMERS’ PERCEPTION ........................................................................... 72
4.4.3. PART III – PRODUCTS AND RANGE ................................................................................ 74
5. ANALYSIS ......................................................................................................................... 82
5.1 CUSTOMER AWARENESS VERSUS RETAILSTORES EXPECTATIONS ........... 82
5.1.1 CUSTOMERS’ ATTITUDES AND KNOWLEDGE REGARDING CSR ....................... 82
5.1.2 CUSTOMERS’ AWARENESS OF CSR PRODUCTS ......................................................... 85
5.1.3 RETAIL STORES EXEPTATION OF CUSTOMERS ATTITUDE AND KNOWLEDE
OF CSR ..................................................................................................................................................... 85
5.1.4 GAP 1 -‐ BETWEEN CUSTOMERS KNOWLEDGE AND RETAIL STORES
EXPECTATIONS .................................................................................................................................. 87
5.1.5. CUSTOMERS ACTUAL ENGAGEMENT/PURCHASE OF CSR-‐ INITIATIVES .... 87
5.1.6. RETAIL STORES CSR INITIATIVES .................................................................................. 92
6. CONCLUSION .................................................................................................................. 97
6.1 RESULT OF THE STUDY ............................................................................................. 97
6.2 OWN REFLECTIONS .................................................................................................... 98
6.3 FURTHER RESEARCH ................................................................................................ 99
REFERENCE LIST ............................................................................................................. 100
SCIENTIFIC ARTICLES ................................................................................................... 100
LITERATURE .................................................................................................................... 102
ELECTRONIC ARTICLES ................................................................................................ 103
ELECTRONIC BOOKS ...................................................................................................... 104
ELECTONIC SOURCES .................................................................................................... 104
REPORTS ........................................................................................................................... 104
INTERVIEWS .................................................................................................................... 104
APPENDIX 1 – CUSTOMER SURVEY ................................................................................ 1
APPENDIX 2 – INTERVIEW GUIDE ENGLISH VERSION ............................................. 4
APPENDIX 3 – OPERATIONALIZATION OF PILOT STUDY ....................................... 6
APPENDIX 4 – TABLES AND FIGURES FOR THE QUANTITATIVE
INVESTIGATION ................................................................................................................... 7
APPENDIX 5 -‐ RANDOM WALKING SCHEDULE ......................................................... 16
TABLES, FIGURES AND DIAGRAM OVERVIEW
TABLES OVERVIEW
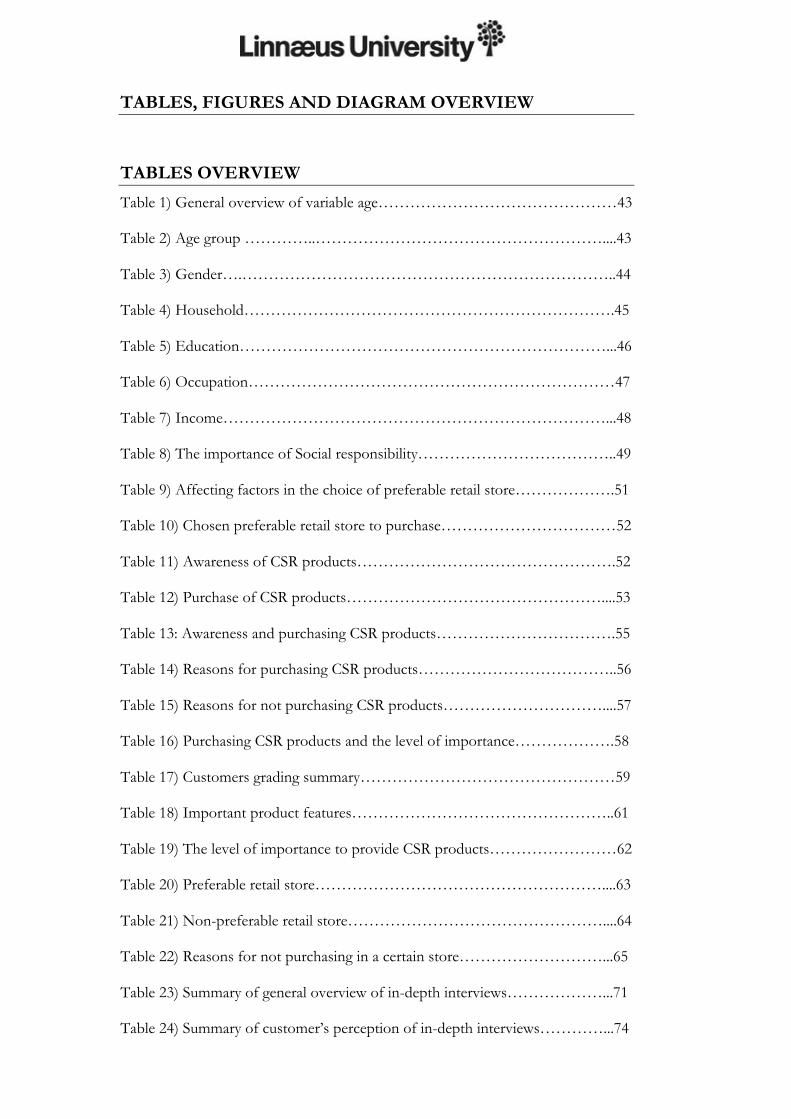
Table 1) General overview of variable age………………………………………43 Table 2) Age group …………..………………………………………………....43 Table 3) Gender….……………………………………………………………..44 Table 4) Household…………………………………………………………….45 Table 5) Education……………………………………………………………...46 Table 6) Occupation……………………………………………………………47 Table 7) Income………………………………………………………………...48 Table 8) The importance of Social responsibility………………………………..49 Table 9) Affecting factors in the choice of preferable retail store……………….51 Table 10) Chosen preferable retail store to purchase……………………………52 Table 11) Awareness of CSR products………………………………………….52 Table 12) Purchase of CSR products…………………………………………....53 Table 13: Awareness and purchasing CSR products…………………………….55 Table 14) Reasons for purchasing CSR products………………………………..56 Table 15) Reasons for not purchasing CSR products…………………………....57 Table 16) Purchasing CSR products and the level of importance……………….58 Table 17) Customers grading summary…………………………………………59 Table 18) Important product features…………………………………………..61 Table 19) The level of importance to provide CSR products……………………62 Table 20) Preferable retail store………………………………………………....63 Table 21) Non-preferable retail store…………………………………………....64 Table 22) Reasons for not purchasing in a certain store………………………...65 Table 23) Summary of general overview of in-depth interviews………………...71 Table 24) Summary of customer’s perception of in-depth interviews…………...74

Table 25) Summary of products and range of in-depth interviews……………...81
FIGURE OVERVIEW
Figure 1) CSR model created by the researchers…………………….…........……6
Figure 2) Triangulation overview…………………………………………...…...11
Figure 3) Operationalization of the study………………………………………22
Figure 4) The pyramid of Corporate Social Responsibility……………………...30
Figure 5) Gap model…………………………………………………………....39
Figure 6) CSR model created by the researchers………………………………..41
Figure 7) CSR model created by the researchers…………………….…........…..82
Figure 8) Modified figure of Carroll’s pyramid – customers……………………92
Figure 9) Modified figure of Carroll’s pyramid – retail stores…………………...96
DIAGRAM OVERVIEW
Diagram 1): Age group……………………………………………………….....43
Diagram 2): Gender…………………………………………………………….44
Diagram 3): Household…………………………………………………………45
Diagram 4): Education………………………………………………………….46
Diagram 5): Occupation………………………………………………………...47
Diagram 6): Income…………………………………………………………….48
1
1. INTRODUCTION The introduction chapter explains the background of why corporate social responsibility (CSR) is so crucial for companies today. Further explain the current situation of the retail store industry regarding CSR- initiatives. This part is followed by a problem question that ends with a purpose for this study.
1.1 BACKGROUND
In the year of 1960, Keith Davis was one of the first famous authors to present a
definition of what corporate social responsibility means:
“Social responsibility refers to corporations’ decisions and actions takes for reasons at least
partially beyond the firm’s direct economic or technical interest.”
Another famous author named Milton Friedman made an entrance in the early
1970’s in the debate about companies’ social responsibility with the classical article
“The Social Responsibility of Businesses Is to Increase Its Profits”. Friedman later
became a great part of today’s debate regarding business CSR initiatives (May, et
al. 2007). Further, Friedman meant that Corporate Social Responsibility (CSR) had
its origin in socialism, where regulation of politics determined where limited
resources should be allocated (Carroll 1979). Carroll was deeply critical to the
discussion regarding that companies should expand their responsibilities further
than to maximize their shareholders gain (May, et al. 2007). Instead, Friedman
believed that society should gain most profit if companies made decisions based
on the interest of its shareholders. Furthermore, that business leaders should try to
earn as much money as possible at the same time as the companies are following
the public norms and regulations of the society (May, et al. 2007).
In the year of 1991, Carroll (1991) stated that during the last 30 years, corporations
have struggle with the big issue of social responsibility. Carroll (1991) means that
in the past, the main argument for corporations to take responsibility was to
maximize the financial return to its shareholders. Carroll (1991) discusses what it
actually means for a corporation to be socially responsible. For almost 50 years
now, academics have fought in order to establish a common definition that every
academics try to agree about, but without result (Carroll, 1991).
Even without an accepted definition, Corporate Social Responsibility has a long
tradition in many countries (e.g. Carroll, 1999; Jones et al. 2007). Its growth over
the last decade has advanced as a response to perceived failures or limitations of

2
governmental regulation following privatization, globalization and reforms of the
Western world. In addition, a shift in values and preferences of more wealthy
citizens has developed, especially in Western societies. The revolution in
communication technology has led to the rapid and wide spread of information;
this can also explain the increasing importance of CSR (Hartmann, 2011). Indeed,
CSR was implemented by even more companies, investors and business schools
during the 21st century decade, while civil society, academia and the media also
became increasingly familiar with the topic. According to the European
Commission (2010), it is particularly in the wake of the financial and economic
crisis that broke down in 2008 that CSR is more relevant than ever. It is a call for
more responsible businesses; rebuilding trust is a top priority among businesses in
the Western world (European Commission, 2010).
CSR has developed to one of the top priorities of businesses over the last decade
and during 2011, CSR have been ranked as the number one focus of managers in
the global retail and consumer goods sector (Hartmann, 2011).
When it comes to taking Corporate Social Responsibility, the food sector faces
specific challenges for some particular reasons. First, the food sector has a high
impact and strongly depends on natural, human and physical resources
(Hartmann, 2011). Second, Maloni and Brown (2006) means that food covers
basic human needs, people have strong views on what they eat. This leads to a
complex set of requirements for food sector regarding the production of the raw
materials, the environmental energy, water and waste and social conditions like
labor standards (Maloni and Brown, 2006). As well as the whole value chain and
the quality, healthiness and safety of products (Maloni and Brown, 2006).
The environmental impact of food production, processing and distribution but
also the food safety and quality aspect or animal welfare issues has been under
observation by society for a long time. Even though, the scientific discussion of
the CSR concept with focus on the food sector is still under progress (Piacentini et
al. 2000).

3
1.2 PROBLEM DISCUSSION
According to Piacentini et al. (2000), pressure has increased to pay more attention
to social responsibility in order to create general benefits for society. Corporate
Social Responsibility involves companies to take responsibility more than simply
economic and legal parts (Boatright, 1997). This often contains to take social,
economic and moral responsibility of the company but also the management of
the corporate responsibility actions of organisations (Cannon, 1992).
Carroll (1991) presented four aspects of social responsibilities to describe
corporate social responsibility closer: the economic, legal, ethical, and
philanthropic aspects. These kinds of responsibilities have always existed at some
point, but it has only been during recent years that both ethical and philanthropic
functions have taken an important place in society (Carroll, 1991).
Despite no general accepted definition of CSR as a concept, European
Commission 2002 have established a definition which is often used by different
authors (e.g. Fox (2004); Tencati et al. (2004); Spence (2007); Fougére & Solitander
(2009); Steurer (2010)) during discussions concerning CSR:
“Whereby companies integrate social and environmental concerns in their business operations and
in their interaction with their stakeholders on a voluntary basis”.
(European Commission, 2002)
The European Commission (2002) further means that the main function of an
organization is to create value through producing goods and services that society
demands, in order to generate profit for its shareholders and welfare for society.
However, new social and market pressures are gradually leading to a change in the
values and in the horizon of business activity (European commission, 2002).
Vogel (2006) states that organisations are engaging themselves in Corporate Social
Responsibility in a new, much broader way and changes have been done by large
organisation since the beginning of 1990. For example, the Swedish brand IKEA
requires its rug suppliers in India to prohibit the employment of children and
provides families with financial assistance to help keep their children out of the
labour market and prohibit child labour (Vogel, 2006). Ben & Jerry’s, the US ice-
cream company have taken actions regarding social and environmental questions
above the legislation, where they implement green purchasing and improve their
supply policies to retailers (Piacentini et al. (2000). Starbucks, as well as many other
major coffee distributors and retailers, sells coffee marked with fair trade label,

4
which guarantee coffee producers an above world market price for their products.
The famous fast food chain Mc Donalds has adopted the European Union
restrictions in the use of growth-promoting antibiotics for its suppliers of beef and
chicken in the United Sates (Vogel, 2006). Hollender (2004) claims that corporate
social responsibility is the future of business. It is what companies have to do to
survive and prosper in a world where more and more of their behaviour is under
microscope (Hollender, 2004).
At the same time as the companies engaging themselves more frequently in CSR,
Carrigan & Attlia 2001 through Maignan 2001 states that during the last decades,
the customers have also become more aware of CSR as a phenomenon. Several
researchers support the statement that the increased attention of CSR seems to
affect costumers purchase decision (e.g. Brown & Dacin (1997); Mohr and Webb
(2005); Sen and Bhattacharya (2001)). Studies made by the authors show that
customers take their commitment to CSR initiative into account when evaluating
companies and products. On the other hand, Green and Peloza (2011) means that
in the customers purchasing decision the CSR initiatives only plays a minor roll
(Green and Peloza 2011). Either way, negative CSR information has much
stronger effect on the customer evaluation than positive news (Brown and Dacin
1997; Marin and Ruiz 2007: Sen and Bhattacharya 2001) Moreover; consumer
identification with the company plays a important role when evaluating
companies. The more consumers able to identify themselves with a company, the
more they benefit it. (Sen and Bhattacharya, 2001).
According to Öberseder et al. (2011), different forms of CSR can impact customer
behaviour in different ways. Customers do not perceive all forms of CSR in the
same manner. Several authors (e.g. Ellen et al. (2006); Vlachos et al. (2009))
determine that CSR implicitly assumes that it is a “win-win” outcome resulting
from social support and positive responses (Öberseder et al. 2011). In order to
support organisations with CSR initiative, customers must receive value from the
exchange. Consumers’ generally values CSR activities based on their personal
interests, own personal morals, values and priorities (Öberseder et al. 2011).
Regarding purchase of CSR products (e.g. environmental certified and ecological
products), the generally customer is relatively young, high-income earner and a
high degree of education (Chinnici et al. 2002; Pedersen and Neergaard, 2006;
Onyango et al. 2007). There are two particular benefits, which motivate customers
to purchase CSR products (Padel and Foster, 2005; Honkanen et al. 2006; Perrini

5
et al. 2009). First, private benefits such as CSR products are believed to be more
health promoting, safer, better tasting, richer in nutrients than conventional
products (Perrini et al. 2009). Second, public benefits such as CSR products are
believed to be better for the environment and animal welfare than conventional
products. (Perrini et al. 2009).
The study reveal a gap between how many consumers are interested in buying
ecological and environmental certified products and how many actually purchase
them (Perrini et al. 2009). Perrini et al. (2009) report that only 27 percent of those
who prefer ecological and environmental certified products actually buy them.
Gaps between believes of consumers and their actual behaviors have often been
found in surveys about green consumption in general (Pickett-Baker and Ozaki,
2008). Bonini & Oppenheim (2008) state that 87 percent of consumers worry
about the environmental and social impacts of their purchases, but only 33 percent
buy green products (Bonini & Oppenheim, 2008).
There are two main factors where transaction barriers affect consumers’ interest of
buying organic products. (Tsakiridou et al, 2008). First, the premium price of
organic products, attributable to the high production costs and the relatively
inefficient distribution chain that characterize the ecological farming system
(Kihlberg and Risvik, 2007). Secondly, the limited availability of ecological
products on the market, attributable not only to limited production but also to the
relatively limited distribution even in the most advanced countries, where
ecological products are less common than their traditional products (Lea and
Worsley, 2005).
The customers’ perception of organizations CSR initiatives and the purchase of
CSR products are complex phenomena. Customers that believe that it is important
to take social responsibility for the environment are increasing (Carrigan and Attlia
2001: Maignan 2001). Further, customers are becoming more aware of ecological,
environmental, faire-trade products. Still, in the customers buying decision, the
CSR initiatives only plays a minor roll (Green and Peloza 2011). As mentioned
before, there is a gap between the number of consumers that are interested in
buying CSR products and how many actually purchasing them (Perrini et al. 2009).
Therefore, this research created a described figure to investigate 2 gaps between
the customer and the retail store.

6
Figure 1: The researchers own designed figure regarding the company-customer relationship from a CSR
perspective
The first gap contains the customers’ expected CSR service against the retail
stores. The gap involves differences between customers’ attitudes and knowledge
and companies expectation of customers’ attitudes and knowledge of retail stores
CSR initiative. The second gap presents the actual customers engagement or CSR
against the retail stores actual CSR engagement. Gap 2 involves the differences
between customers’ engagement and purchase of retail stores CSR initiatives and
retails stores implemented CSR initiatives and products. The model has been
designed after Parasuraman (1985) gap model of service quality. The Gap model
by Parasuraman shows the company-customer relationship in relation to service
quality, (Seth et al. 2004) this study will instead investigate the company and
customers relationship from a CSR perspective.
1.3 RESEARCH QUESTIONS
RQ1: What expectations regarding customers’ perception of retail stores CSR
initiatives do manager of such stores have and how do they perform CSR
activities?
RQ2: How aware are customer regarding retail stores CSR initiative and what
level of engagement do customer have concerning retail stores CSR activities?
1.4 PURPOSE
First of all, this thesis aims to describe managers’ expectations regarding
customers’ perception about their retail stores CSR initiatives and furthermore
their implemented CSR initiatives. Secondly, to describe customer awareness and
engagement towards retail stores CSR initiatives. Finally, to compare the results

7
from retail store and customers, in purpose to identify possible gaps between these
two.
1.5 DELIMITATIONS
This thesis will include five of Sweden’s most established and leading retail stores
chains. The empirical investigation is limited to retail stores located in Växjö and
the population represents the inhabitants of Växjö City between the ages of 18-84
years. Another delimitation to mention is the fact that the thesis will only
contribute two of the gaps within the gap model, named gap 1 and gap 5 which
the researchers consider is the suitable gaps for this thesis and the other will be
excluded.
1.6 KEYWORDS
Corporate Social Responsibility (CSR), marketing strategy, business ethics,
sustainability, reputation, food industry, retailers, gap-model, perception,
customer, retail store industry, expectation.
1.7 THEORETICAL RELEVANCE
This thesis will contribute with knowledge about customers’ attitudes and
engagement towards companies CSR initiatives. Furthermore, give knowledge
regarding how different factors affecting the customers’ attitudes and engagement
regarding retail stores CSR initiatives. Last, this thesis will also contribute with
knowledge regarding possible gaps between retail stores and customers regarding
CSR.
1.8 EMPIRICAL RELEVANCE
This thesis will contribute with insight about customer attitudes and engagement
towards retail stores CSR-initiative. Additionally also explain how different factor
affects the customers attitudes and engagement of the retail stores CSR initiative.
1.9 DISPOSITION Chapter 1 – Introduction
The introduction chapter explains the background of why corporate social
responsibility (CSR) is so crucial for companies today. Further, explaining the
current situation of the retail store industry regarding CSR initiatives. This part is
followed by a problem question that ends with a purpose for this study.

8
Chapter 2 – Methodology
Methodology chapter explains how researchers have proceeded to complete the
study. Scientists clarify and argue for the choices made and the method used to
collect the empirical material. Method chapter is introduced with an overview of
the research structure of the study then followed by both a qualitative and a
quantitative study.
Chapter 3 – Theoretical framework
This chapter begins with a historical theoretical introduction of CSR, followed by
an explanation of Carroll’s’ pyramid. Further, the theoretical framework explains
customers’ perception of companies CSR-initiatives and retail stores engagement
regarding social responsibility. Last, the Gap model by Parasuraman will be
introduced and explain the complexity of the consumer-company relationship.
This theoretical part is used in purpose to answer the research question and
develop an understanding of the chosen theories.
Chapter 4 – Empirical investigation
The following chapter contains a summary of the data collection and empirical
investigation. There have been in total 150 survey answers and five in-depth semi-
structured interviews. This chapter will explain the qualitative investigation in two
different ways; one where tables are used to identify patterns and second part is a
describing summary, which explains the patterns more deeply. Further the
quantitative investigation will be presented by chi-square-test and tables but also
by a describing text.
Chapter 5 – Analysis
The analysis will illustrate the result from the empirical investigations what will be
argued from selected theories. The analysis will be divided in three different parts:
The first part will describe Gap 1, the second part will describe Gap 2.
Chapter 6 – Conclusion
In this chapter, the conclusion of the study will be presented. The conclusion will
answer the purpose and further the own reflections are presented where the
researchers reflect what could have been done different and have a critical sight
against the thesis. To conclude, a presentation for further research within the
subject will also be find in this chapter.

9
2. METHODOLOGY Methodology chapter explains how researchers have proceeded to complete the study. Scientists
clarify and argue for the choices made and the method used to collect the empirical material.
Method chapter is introduced with an overview of the research structure of the study then followed
by both a qualitative and a quantitative study.
2.1 POSITIVISM VERSUS HERMENEUTIC
There are two frequently used scientific knowledge strategies, positivism and
hermeneutic (Thurén 2007). According to Bryman & Bell (2010), positivism
supports the use of scientific methods in the study of social reality and all its
aspects. Further, Bryman & Bell (2010) state that positivism has its origin in
natural science and supports the use of scientific methods in the study of social
reality. Positivistic approach use different hypotheses and later through
observation, i.e. through empirical examination verify selected hypotheses or not
(Patel & Davidson, 2011). Hermeneutic on the other hand, has also its origin
within natural science but separates the difference between natural and social
phenomena (Halvorsen, 1996). From the beginning, hermeneutic where shaped
for interpretation and understanding (Bryman & Bell, 2010). Through the
hermeneutic approach, scientist studying, interpret and trying to understand the
basic conditions of human existence (Patel & Davidson, 2011). The hermeneutic
scientist perceives their thought, impressions, emotions and knowledge as assets
instead of barriers in order to interpret and understand the object of research
(Patel & Davidson, 2011).
This study has used a positivistic approach to develop the problem question after
scientific knowledge from existing theories and was conducted through
information from a quantitative study.
2.2 DEDUCTIVE VERSUS INDUCTIVE APPROACH
Thurén (2007) state there are two ways to draw conclusions, through deductive or
inductive approach. Inductive approach is based on empirical knowledge and
deductive approach is based on logic knowledge (Thurén, 2007). Further,
Halvorsen (1996) states that theories are the basis for a deductive approach.
Through inductive approach, general conclusions can be drawn based on the
empirical data and thereby be required by quantification (Thurén, 2007).

10
According to Halvorsen (1996), an inductive approach introduces the study with
observations without any theories; instead a logical conclusion will be drawn
(Halvorsen, 1996; Thurén, 2007). Bryman & Bell (2010) stated that if the study
wants to increase its credibility, it is beneficial to use both a deductive and
inductive approach (Bryman & Bell, 2010).
This thesis has used a deductive approach and has explored theories as a ground
for the empirical investigation. Further, existing theories was used to draw logical
conclusions compared to the findings from the empirical data of retail stores CSR-
initiative.
2.3 QUANTITATIVE VERSUS QUALITATIVE APPROACH
Many authors writing about methodological issues, chooses to separate between
quantitative and qualitative approach (Bryman & Bell, 2010). A quantitative study
is conducted when the collected data is measurable, i.e. if it can be expressed in
numbers (Halvorsen, 1996). Furthermore, a qualitative study is collected data that
tell something about the qualitative (non-measurable) characteristics of the survey
units (Halvorsen, 1996). A qualitative approach differs from a quantitative
approach in several ways, a quantitative approach processing more words then
numbers (Bryman & Bell, 2010).
According to Bryman & Bell (2010), a triangulation have been conducted, where
the researchers use more than one method or data source in the study of social
phenomena. The concept of triangulation is a special approach where more than
one method can apply, which results in greater reliability of results (Bryman &
Bell, 2010). Bryman & Bell (2010) means that triangulation can be used to double-
check the results from both the quantitative and qualitative study. Furthermore,
Bryman & Bell (2010) means that a quantitative approach can be used to confirm
the qualitative results and vice versa. Bryman & Bell (2010) mentioned that the
amount of “combination studies” have increased since the beginning of 1980’s.

11
Figure 2: The figure illustrates the thesis triangulation including the quantitative, investigation he
qualitative investigation together with a pilot study
This study conducted both a qualitative and a quantitative approach. The intention
with the qualitative investigation was to interview local retail store managers to
identify interesting areas regarding CSR. Subsequently, to investigate retail store
managers’ expectations of customers’ attitudes and engagement of retail stores
CSR initiatives. The qualitative research was combined with quantitative research
based on customers’ view of retail stores. The ambition was to identify the
customers’ attitudes and engagement towards retail stores CSR-initiative. The
study wanted to compare the results from both studies in order to fulfill the
research questions, to discover possible relations and identify valuable patterns.
This is further explaining in the operationalization. A qualitative research with in-
depth semi-structured interviews together with a customer survey and a pilot study
has resulted in a triangulation. The pilot study was implemented to test the
consumer survey before the random walking method. The triangulation was also
selected to broaden the study, collect more interesting data and reach a more
valuable result. The researchers would not risk creating and further handling out a
survey that later on was found to be useless and did not collect the requested data.
2.3.1 PRIMARY AND SECONDARY DATA COLLECTION
According to Svenning (2003), there is a difference between primary and
secondary data, frequently also called primary and secondary sources. Svenning
(2003) explains primary data as a concept whereby the researcher collect
information about states, events and processes at the actual source. According to
Ejvegård (2009), a researcher always has responsibility to control the presented
information before, and a general rule is always to refer to the primary data
(Ejvegård, 2009). Further, Svenning (2003) states that it is always preferable to use
primary data but in those situations where a primary data is not available; a
secondary data can be utilized. If situation with secondary data occurs, some point

12
of distortion always has to be expected, with other words expect a warp from the
primary data. Political, religious, moral and other forms of information filter can
be the reason that a distortion occurs for the primary data (Svenning 2003).
This study is based on purely primary data through in-depth interviews from retail
managers and customer surveys. The population contains of inhabitants in Växjö
city and retail stores in local areas. Due to primary data collection is possible and
the study can conduct a sample that represents the population properly, secondary
data collection is not necessarily. To minimize the risk of possible distortion, a
primary data collection has been used. Thereby, the researchers could decide
which factors that will be taken under considerations. The selected factors to be
analyzed within this study are age, gender, household, education, occupation and
the sixe of household.
2.4 QUANTITATIVE RESEARCH
2.4.1 SURVEYS
According to Bryman & Bell (2010), the big difference between surveys and
structured interviews is that an interviewer is usually not present to ask the
questions; therefore the respondents have to read, understand and answer the
questions by themselves. According to Patel & Davidson (2011), there are
different kinds of survey methods. The first thing to associate with surveys might
be a survey sent by mail, but Patel & Davidson (2011) presents another survey
method called “survey under guidance” which practically means that the scientist
bring the survey to the respondents personally and supports with possible
questions and clarify some confusions (Patel & Davidson, 2011). Compared with
structured interviews, surveys tend to have fewer open questions, since it tends to
be easier to answer closed questions. It will minimize the risk by using a simple
design that is easy to understand, and therefore respondents will not fail into
complete the survey. It is also important to keep the survey short to reduce the
risk of “survey tiredness”, since it is easier for a respondent to decline a survey
than to cancel an interview (Bryman & Bell 2010).
An advantage with survey is the ability to exclude the so-called interview effect.
What Bryman & Bell (2010) means with the “interview effect” is circumstances or
factors that affecting the interviewer and the result. Factors like ethnical and social
background and gender of the interviewer can contribute to a distorted in the

13
given responses by the respondent. Another advantage with surveys is the ability
to prevent variation when it comes to formulation of questions. Surveys do not
suffer from the problem that different interviewers formulate the questions in a
different way.
During a “survey under guidance” or an interview, it is important to keep a high
motivation to reduce the risk of affecting the respondent negatively (Patel &
Davidson, 2011). It is also very essential to express a natural interest and
understanding for the respondent, otherwise it is easy for the respondent to raise a
defensive attitude if it feels
2.4.2 SAMPLE
According to Bryman & Bell (2010), the requirement to create a sample is
generally necessary for all quantitative studies. Further on, keep in mind that
whether striving towards a generalized study or not, the presented sample must be
representative (Bryman & Bell, 2010). The population basically has to consist of all
units to make the samples from (Patel & Davidson, 2011). The sample is the part
of the population selected for the study; it is either a part or subset of the
population. (Bryman & Bell, 2010). Sample technique can be based on probability
sample (randomness) or non-probability sample (Patel & Davidson, 2011).
Jacobsen (2002) states a common problem for researchers; they can rarely
investigate all they want to investigate. The researchers cannot investigate
everything that everyone does, especially when it comes to qualitative methods.
Jacobsen (2002) identifies some steps to facilitate the selection of a sample such as
obtain overview of all the exploring material with factors like unlimited time,
money, and analysis capabilities (Jacobsen, 2002).
According to Bryman & Bell (2010), a probability sample is selected on a random
basis, which means that one knows the probability that each unit in the population
is selected. A general assumption made saying that a representative sample will
result when using probability sampling (Bryman & Bell, 2010). According to
Bryman & Bell (2010), the aim of probability sample is to minimize the sampling
error. What Bryman & Bell (2010) means with a sampling error is the difference
between a sample and the population that the sample is based on, even in the case
where a probability sample have been used. The most basic form of probability
sampling is simple random sampling (Bryman & Bell, 2010). It means that each
unit in the population should have the same opportunity to be included in the
14
sample. One variant of the simple random sampling is the systematic sample
where the units are selected directly from the sampling frame, i.e. without using a
random number table (Bryman & Bell 2010).
According to Bryman & Bell (2010), a non-probability sample is different from a
random sampling technique; instead some units in the population are more likely
than others to become a part of the sample. A non-probability sample can be
divided in three different kinds of sample; convenience sample, snowball sample
or quota sample. Bryman & Bell (2010) further explains that the convenience
sample consists of the name suggests, by such persons, as the moment happens to
be available to the researcher. The problem with this sample is that it is often
impossible to generalize the result, because the knowledge about which population
this sample is representative of is missing (Bryman & Bell, 2010)
2.4.3 THIS QUANTITATIVE STUDY - SURVEY
The quantitative research contains a customer survey, which will be collected by
random waking method in Växjö city. The random walking was performed by
collect data from respondents in Växjö city. To achieve a probability sample, a
computer program was randomly determined the first street in the register and
thereafter, a structured sample was conducted selecting every tenth street in the
register until 15 random streets was conducted (Appendix 5). In order to make the
sample as valid as possible, the data was conducted Monday to Sunday on
different hours during the day to reach as many different types of respondents as
possible. Therefore, the survey started to distribute at 9 am, 12 am and 5 pm
during the days. 12 am was selected to reach people during there lunch breaks and
17 pm was selected to reach them after work.
In order to achieve a randomly selected method, the respondents were strategically
selected. Due to the fact that the streets had different levels of movements, further
required that different strategically methods had to be used. During streets with
high movements, the next respondents were selected after availability as soon as
the survey was completed. During streets with low movements, every person was
asked to participate in the survey. The population was the inhabitants of Växjö city
in ages between 18-84 years. The chosen interval of age is chosen due to the fact
that a customer that stands for the own purchase of a household is generally
between these ages. The age question is an open question, in purpose to later
divide the respondents in four different age cluster; young age, young middle age,

15
middle age and senior age. The total number population of Växjö in 2010 were 61
192 people (Vaxjo.se (1)). Unfortunately this research has not identified any source
of population in Växjö between the ages of 18-77. Therefore, an own calculated
average population has been conducted. It gives a similar picture of the real
population. According to SCB (2010), the average age of a Swedish woman are 83
years old, and for a man 79 years old. If the assumed population of Växjö are
equal divided between all ages, the population will be (77-18)/(83-0) = 71 % of
total population which gives the calculation: 0,71*61 192 = 43 446. This gives a
population of 43 446 possible respondents in this thesis. The reason why the
researchers decided to do this choice, was because the number of inhabitants in
Växjö reflects all the inhabitants which means that people under 18 would be in
the population, which would give a distorted amount because that target group is
not interesting for this thesis.
This sample represented people with different gender, ethnical backgrounds,
economic situations and locations in Växjö, in ambition to cover varieties in the
population. The respondents was selected in a way that gave the survey a high
probability as possible; in purpose to give all people the same chance to be
selected. The research conducted 150 filled in surveys with answers to represent
the sample of the population. The survey partly contained closed questions where
the respondents chose from different alternatives. They were complemented by a
few open questions to give deeper information about chosen subject. By using
customer survey, the study will investigate how different factors affect the
answers. The chosen variables are age, gender, household, education, occupation
and income and further identify patterns by using these factors that will contribute
useful implications to the study.
This study intends to collect answers whereby the respondents would fill in the
questions by themselves. During the random walking period, it was observed that
most of the respondents had an easier attitude when they did not have to fill out
the surveys by them selves. So, the researchers decide to keep asking questions and
fill out the surveys by themselves to achieve continuity through the method. It
appeared to result in a more successful way, because the interviewer had a more
open conversation with the respondents and collect more useful information
above the question frame.
16
2.5 QUALITATIVE RESEARCH
2.5.1. INTERVIEWS
According to Bryman & Bell (2010), interviews are very common phenomena
within the social world, not least because the society today contains different
forms of interviews. Despite what kind of interview form, all kind of interviews
has common goals. Interviews strives to achieve some kind of information
exchange, that certain rules decides the level of formality together with the
practical of the conversation (Bryman & Bell, 2010).
In a semi-structured interview, a list of relatively specific topics will be brought up
(often called an interview guide), but the respondent has great freedom to design
the answers on its own (Bryman & Bell 2010). The questions does not necessary
have to arise in the right order as the interview guide. In the same way, questions
can be arising that was not included in the interview guide from the beginning, if
the interviewer relates to something the respondent mentions (Bryman & Bell
2010).
The essential part in using an interview guide is to create designed questions that
allow the researchers to gather further information regarding respondents’
perception and opinions. Construction of questions should not be so specific that
it prevents alternative ideas or approaches that arise during the collection of data.
Bryman & Bell (2010) also think it is important to ask about background
information like the respondents’ age, gender and name and about the specific
position within the organization (Bryman & Bell 2010).
2.5.2 DATA COLLECTION
According to Jacobsen (2002), the collected data during an open interview consists
of words, sentence and stories. Usually, this interview proceeds face to face but
can also be conducted by telephone (Jacobsen 2002). According to Jacobsen
(2002), individual interviews can be more costly compared to telephone interviews.
Furthermore, Jacobsen (2002) means that people seem to easier talk about
sensitive subjects face to face rather than by telephone. The most reasonable cause
is probably because it is easier for two persons to get a more personal contact
when they are physically meeting (Jacobsen 2002). Jacobsen (2002) states that by a
telephone interview, the ability to observe how the respondent occurs gets
eliminated. Jacobsen (2002) thinks it is easier to identify insecurity when the

17
interviewer can see the respondent and have the ability to change subject. Further,
Jacobsen (2002) states that it is essential to remember the whole conversation
afterwards and use a recorder could partly solve this problem (Jacobsen, 2002).
Patel & Davidson (2011) state a skeptical point of view with the transcribing part.
During the transcribing progress, it occurs a more or less conscious influence on
the recorder material (Patel & Davidson, 2011). Patel & Davidson (2011) means
that spoken and written language are not the same. Factors like gestures, facial
expressions, emphases and body language excludes when spoken language become
written language (Patel & Davidson (2011).
2.5.3 THIS QUALITATIVE STUDY- IN-DEPTH INTERVIEWS
A semi-structured interview is conduct in purpose to have an open conversation
with local store managers and ask open questions, which gives objective answers
and avoid subjective answers. By conduct a semi-structured interview, a general
picture of the subject is given and a deeper insight in a local store managers point
of view. The semi- structured interviews contain of five in-depth interviews by
local store managers of the five biggest and most famous retail stores in Växjö. By
gathering individual information from the local store managers, the study could
conduct expert knowledge in the topic. Therefore, using an in-depth interview
method was suitable to collect deep and broad information regarding retail stores
CSR initiatives. A local store manager has deep knowledge about the companies’
social responsibility but also about customers’ attitudes and can therefore add
valuable data to the study. By using open questions, a personal interview is
suitable; the interviewer and the respondent had an open discussion to get deeper
knowledge about the subject and the retail store situation
The study was introduced by getting in touch with the local store manager of the
five different food stores. The store managers received a letter whereby
information about the researchers was presented and the actual purpose with the
study. The reason to visit the local stores in Växjö was to achieve a good and more
intimate interview situation where it is easier to analyze and confirm certain
answers or facial experience compared to a telephone interview. Compared to a
physical interview, expressions and feelings are more difficult to analyze if the
interview is conducted through telephone and the interviewer is not be able to see
the respondent.

18
During the interviews, all interviews were recorded to be able to make a
transcription afterwards, but also to make it easier to reproduce a correct
interpretation of the respondents. The respondents were notified in advance and
were asked for permission about recording and all agreed. The respondents were
also notified about the ability to be anonymous and that the material is only used
for transcription. There were no clear observations that the recording influenced
the interviews negatively, except one. In the beginning, the local store manager
gave short answers and did not felt so comfortable with the recording. But after a
few minutes, the manager forgot about the recording machine and responded in a
natural way. It was observed by a comparison to the other interviews because this
local store manager introduced the interview by giving short answers compared to
the rest of the local store managers. He was also doubtful to the recording from
the beginning of the interview.
During the interviews, notes were taken to facilitate an overview over collected
data and to easier remember what have gone through. One person made notes and
the other person held the conversation to keep the discussion fluent; therefore
two persons conducted the interview. All interviews lasted for about 60 minutes
except one that only lasted in 30 minutes. That particular manager got interrupted
several times during the interview and the stress level increased. This could affect
the result negatively because the interview did not reach as deep answers as
expected. Even though, useful information was conduced and considered valuable
to the study. In all five interviews, the manager selected locations where the
interview was conducted. Four out of five interviews were conducted in the
managers’ office and one was conducted in a staff room, which resulted in some
disturbing factors like staff and deliveries.
2.6 SOCIAL DESIRABILITY BIAS
Measurement errors can occur during data, which can result that the data does not
correctly reflect the reality (Graziano & Raulin, 2010). One kind of measurement
error is response set bias, where the respondents answer in a specific way
regardless the situation (Graziano & Raulin, 2010). Social desirability is a powerful
and common the response set bias. Further, this will affect the respondent to
answer in a social acceptable manner. The influence of social desirability can affect
the validity of the measurements and create measurement error (Graziano &
Raulin, 2010).

19
The collected data of the study can be influenced of response set bias, especially
regarding retail stores obligation for taking social responsibility. The respondent
might feel that they have to answer in a social acceptable manner. Respondents
could have answered that it is important for retail stores to take social
responsibility even if they in practice do not care or have limited knowledge. This
could affect the empirical result. The same applies for customers purchase of CSR
products, respondents could answered that they purchase CSR products even if
they do not. In ambition to answer in a social acceptable manner and hypothetical
prevent the feeling of being judge for not purchasing CSR awareness. Therefore,
the researchers designed a control question whereby they could get signals if the
respondent created response set bias or not. The respondent that purchased CSR
products where also asked what type of products they purchase, if they could not
give any examples the researcher perceived the answers as response set bias.
2.7 CRITERIONS
Thurén (2007) states that in a quantitative study, inductive study, the researcher
must be particularly careful with two important aspects, reliability and validity.
Reliability means that the results are measured correctly and will be consistent
results, regardless of who is measuring. (Graziano & Raulin, 2010). Bryman & Bell
(2010) stresses that the level of reliability is a question of whether the results of a
study will be the same if the study would take place again, or if the results are
affected by random or temporary conditions. The trustworthiness of the
measurements is also described by the reliability. If the study can be generalized
and used in similar situations and environments, it will be considered as
generalizable (Bryman & Bell, 2010). According to Thurén (2007), the study
reaches higher reliability when no impacts from coincidence affect the results. To
reduce the risk of coincidence, there should be at least two independent observers
(Graziano & Raulin, 2010). Researchers generally use a correlation coefficient to
qualify the degree of reliability (Graziano & Raulin, 2010). The measurement
reliability is crucial for a research. If the measurements are unreliable, the study
cannot contribute with any useful information (Graziano & Raulin, 2010).
Validity in relation to reliability means that the study examines what it intended to
investigate and nothing else (Thurén 2007). Validity can be described in other
word as relevance (Halvorsen, 1996). Even though, the measurement is reliable
and consistency gives the same results, it does not necessary mean that it is valid
(Graziano & Raulin, 2010). Due to the fact that if the measurement is not the right

20
one that was intended to be measured, the results will not be seen as valid
(Graziano & Raulin, 2010). The challenge is to collect data, which are relevant to
the research questions and the purpose of the study. The defined validity cannot
be empirical measured. Instead, the researchers have to estimate and argue for
their stand point (Halvorsen 1996). Validity like reliability is not an all or nothing
concept; there can be different levels from non to perfect validity (Graziano &
Raulin, 2010). Furthermore as reliability, validity is often qualified by using
correlation coefficients (Graziano & Raulin, 2010). Finally, Bryman & Bell (2010)
explains reliability and validity as two of the most important criterions for
evaluating research within business.
2.7.1 CRITERIONS IN THIS STUDY
The empirical findings are conducted both by a quantitative and a qualitative
research. The quantitative study consists of a survey, which is designed after
theory from existing researches. In ambition to higher the validity of the study, the
researchers used existing theory as a ground to select correct variables to measure
in relation to the purpose of the study and research questions, to higher the
validity. Theories from different authors (e.g. Jacobsen, 2002, Bryman & Bell,
2010, Patel & Davidson, 2011) were used as tools to design the survey correctly.
In objective to create better reliability by avoid misinterpretation of questions,
developing relevant questions and take important factors into consideration.
Regarding the survey sample, it was conducted by random walking method that
gives the study a probability sample. This method is selected to increase reliability
and validity of the research. The amount of respondents is fixed on 150 to
decrease the impact from deviations and to achieve empirical saturations.
A pilot study of the customer survey was also made to clarify the validity and
reliability of the research. The ambition with the pilot study was to identify
possible unimportant questions, which would not contribute with relevant
information. Furthermore to examine if there where any vague questions which
could have made respondents answering in an incorrect way and further lead to
bias. The pilot study gave the authors a chance to correct and change the survey in
order to measure the correct factors in content to the research questions and
thereby strengthened the validity (Appendix 3).

21
2.8 OPERATIONALIZATION
When the study gathered data and went from existing theories to new empirical
research, it is often indicates that the theoretical definition is not enough. The
theoretical definition does not give sufficient clear instructions of how to measure
variables in the correct manner in relation to the research questions (Halvorsen,
1996). Instead an operational definition is used, to translating information from a
abstract level to a concrete level. ((Graziano & Raulin, 2010). An operational
definition means that the variable is defined in terms with the procedure used to
measure and manipulate data (Graziano & Raulin, 2010). Furthermore, it is named
operational definition because it determines which operations are essential for the
study to decide if the empirical phenomena fall within the theoretical framework
(Halvorsen, 1996). Operationalization translates the theoretical concepts to an
empirical level. Further, this will describe how the used theoretical concepts will be
measured (Graziano & Raulin, 2010). When an operational definition is conducted
comparable to existing research will be drawn. At the same time, the
operationalization should describe how different variable is measured from both a
theoretical and a practical sense (Graziano & Raulin, 2010). In every study, the
operationalization has to define variables as clearly and precisely as possible
(Graziano & Raulin, 2010).
2.8.1 OPERATIONALIZATION OF THIS STUDY
The operationalization contains four parts (Appendix 3). First, to investigate
customers’ attitudes and second the customers engagement of retail stores CSR
initiatives. This study used a quantitative collection by customer survey supported
by theory of customers’ perception and purchase of CSR products. Third, to
investigate retail stores expectations of customers’ perception of CSR initiatives
and last to investigate retail stores CSR initiatives. This study used a qualitative
data collection of in-depth interviews supported by relevant theories regarding
companies CSR initiatives. The findings of the quantitative and the qualitative
parts will be compared to investigate potential gaps between retail stores and
customers.

22
Figure 3: This figure explains the researchers’ own operationalization between the quantitative
and the qualitative investigation and further see a clearly picture where the different gaps are going
to be explored.
2.8.2 PILOT STUDY
The authors arranged a pilot study to pre-test the survey. The ambition was to
identify possible gaps and see if changes have to be done before starting the actual
data collection. In the appendix, different parts will describe the changes that were
made in the survey after conducting information and feedback from 10 random
customers, which are not included in the sample. The random customers that
participated in the pilot study were decided by the researchers and were people in
their surrounding like friends and family in different ages that could have been a
respondent within the survey (Appendix 3).
2.8.3 SURVEY
The operationalization is mainly based on the survey used in the study. With the
ambition to find information regarding customers’ attitudes and engagement of
CSR and CSR products. The pilot study identified certain flaws in the questions
and a new version could be presented which made sure that the questions was
perceived as they where intended to. The participated people in the pilot study
either filled out the survey by themself with guidance from the interviewer or the
interviewer asked the respondents questions. For easier understanding of the
questions, the respondent had chance to ask the interviewer questions (Appendix
2).

23
PART I
Part one contains five questions regarding the respondents’ age, gender,
household, education, occupation and income. Some of the questions could be
perceived as uncomfortable for the respondents and were carefully taking into
consideration. Therefore, when the questions were asked in a private area so that
no third parties could take part of the information and affect the result.
QUESTION 1-5: Age, gender, household, education, occupation & income
Theoretical purpose: According to Öberseder et al. (2011) consumers generally values
CSR activities based on their personal interests, personal morals, values and
priorities. Öberseder et al. (2011) states, that the customers’ income affects a
customer perception regarding the importance of CSR.
Research purpose: By knowing the respondents’ age, gender, household, education,
occupation and income, the researchers wanted to see if possible similarities
and/or differences can be identified between the respondents. In ambition to
generally examine if these five factors affect customers perception of retailers CSR
initiatives or not.
PART II
Part two contains question 6-9 regarding customers perception and purchases
decision in retail stores. There were three different types of questions; The first
were a table, were the respondents could make a cross on the chosen alternative.
The second was a grading system table, where the respondent could grade
between 0-5 and the questions were easy formulated and an instruction how to
answers was exemplified.
(0= No opinion, 1= Bad, 2= Less good, 3 =Okay, 4= Good, 5= Very good).
QUESTION 6(a-c): Choice of preferable retail store & affecting factors
Theoretical purpose: According to Hartmann (2011), responsible organizations have
the potential to influence a number of consumers, which can contribute with
positive outcomes such as customer loyalty, product consideration, company and
product evaluation, purchase intention and willingness to pay. On the other hand,
Green and Peloza (2011) means that in the customers buying decision, the CSR-
initiatives only plays a minor roll (Green and Peloza 2011). Öberseder et al. (2011)
further states that the consumers price perception in relation to income influence
the ability to take CSR into account.

24
Research purpose: By comparing the result of chosen retail store and why
respondents prefer a certain retail store to another, the researchers wants to
examine dependent factors. Furthermore, to investigate if retail stores CSR
initiatives plays a crucial roll in the choice of retail stores. Finally, to see if the five
factors presented above (in question 1-5) could have any affect in the grading of
chosen retail store.
QUESTION 7(a-c): Choice of non-preferable retail store & affecting factors
Theoretical purpose: Maloni and Brown (2006) means that requirements from the
society pressure the food sector regarding the production of the raw materials, the
environmental energy, water and waste, and social conditions like labor standards.
As well as the whole value chain and the quality, healthiness and safety of products
(Maloni and Brown, 2006). Several authors state that negative CSR information
has much stronger effect on the customers’ evaluation than positive news (Brown
and Dacin 1997; Marin and Ruiz 2007: Sen and Bhattacharya 2001.
Research purpose: To investigate why customers do not prefer particular retail stores,
and what is the underlying reason are to reject specific retail stores. Further, to
examine which roll the retail stores CSR initiatives have regarding this matter.
PART III
Part three contains question 10-15 regarding customers’ perception and purchase
of CSR products, such as environmental certified, ecological and fair-trade
products. The questions are presented in the same way as in part 2, in three
different ways.
QUESTION 9 & 10: The customers’ perception of product range and
product features
Theoretical purpose. Chinnici et al. 2002; Pedersen and Neergaard, 2006; Onyango
et al. 2007 indicates that customers that purchase CSR products are relatively
young, high-income earner and a high degree of education. Furthermore, they are
generally women with children. Öberseder et al. (2011) further states that the
consumers’ price perception in relation to income influences the ability to take
CSR into account.
Research purpose: By asking about customers buying intentions of different products
features, such as low-price, quality, ecological, environmental certified, locally
produced, the researchers could identify possible patterns in correlation to the six

25
factors (age, gender, household, education, occupation and income) to observe
customers’ attitudes to CSR products.
QUESTION 11,12 & 13 (a-c) The customers’ knowledge and willingness to
purchase CSR-products
Theoretical purpose: There are two particular benefits, which motivate purchase of
ecological and environmental products (Padel and Foster, 2005; Honkanen et al.
2006; Perrini et al. 2009): First, the private benefits, ecological products are
believed to be more health promoting, safer, better tasting, and richer in nutrients
than conventional products (Perrini et al. 2009). Second is public benefits, which
believed that ecological products are better for the environment and animal
welfare than conventional products. (Perrini et al, 2009).
Research purpose: Question 11,12, 13 (a-c), was asked to find out customers
knowledge and purchases intention for CSR products. Moreover, observe the
relation between knowledge and why customers purchasing CSR products.
Furthermore, to examine which types of CSR -products customers generally
purchase.
QUESTION 14 (a-b) & 15: Why customers do not purchase CSR-products
Theoretical purpose: Green and Peloza (2011) means that in customers buying
decision the CSR-initiatives only plays a minor roll. According to Tsakiridou et al
(2008), there are two barriers that affect the interest for consumers to seriously
consider buying organic products. First, the premium price of organic products, in
relation to the high production costs. Further the relatively inefficient distribution
chain that characterizes the ecological farming system (Kihlberg and Risvik, 2007).
Secondly, the limited availability of ecological products on the market, attributable
not only to limited production but also to the relatively limited distribution even in
the most advanced countries, were ecological products are less common than their
traditional products (Lea and Worsley, 2005).
Research purpose: By asking why customer does not purchase CSR products, the
researchers wanted to examine the underlying factors and if the price actually have
a crucial part. Second, observe what factors that have to change to increase the
customers’ willingness to purchase CSR products.

26
QUESTION 16: The customer perception of the importance of retail stores
social responsibility
Theoretical purpose: Several researchers support the statement that the increased
attention of CSR seems to affect costumers’ purchase decision (e.g. Brown and
Dacin (1997): Mohr and Webb (2005); Sen and Bhattacharya, (2001)). Hartmann
(2011) states that social responsible organizations have the potential to influence a
number of consumer related outcomes such as customer loyalty, product
consideration, company and product evaluation, purchase intention and
willingness to pay.
Research purpose: Question 16 was asked to investigate the customers generally
opinion on retail stores responsibility to society. As well as to find out if it is for
importance and to see how the answers are in relation to the rest of the survey.
QUESTION 17: The customers’ perception regarding the importance of
CSR products
Theoretical purpose: The survey reveal a gap between how many consumers are
interested in buying ecological and environmental certified products and how
many actually buying them (Perrini et al. 2009). Perrini et al. (2008) report that
only 27% of those who prefer ecological and environmental certified production
actually buy them. Gaps between believes of consumers and their actual behaviors
have often been found in surveys about green consumption in general (Pickett-
Baker and Ozaki, 2008). Bonini & Oppenheim (2008) state that 87% of the
consumers worry about the environmental and social impacts of their purchases,
but only 33% buy green products (Bonini & Oppenheim, 2008).
Research purpose: By asking if the customer thinks it is important for retail store to
provide CSR products, the researchers wants to investigate customers’ generally
perception of CSR products importance in retail stores. Furthermore, to examine
their purchase of products in question 10 in relation to their generally opinion in
question 17.
2.8.4. IN-DEPTH INTERVIEWS
The qualitative investigation contained five in-depth interviews with the ambition
to give information of retail stores expectation of customer’s attitudes towards
CSR initiatives and furthermore identify retail stores CSR initiatives. and warm
declaration.

27
Part 1
General overview of companies
Theoretical purpose: Carroll (1991) states that there are four aspects of social
responsibility within CSR; economical, legal, ethical and philanthropic. With
question 1-5, the retail stores position in the pyramid of corporate social
responsibility can be identified.
Empirical purpose: By asking question 1-5 (see appendix 2) general information of
retail stores can be conducted. Further, to see how much of the general statement
that involves indications of activities of CSR purpose.
Part 2
Retail stores expectations of customers
Theoretical purpose: Brown and Dacin (1997); Mohr and Webb (2005); Sen and
Bhattacharya (2001); Green and Peloza (2011); Ellen et al (2006); Vlachos et al.
(1997) arguing different perception of customers attitudes and changing in their
awareness of companies CSR initiatives.
Empirical relevance: Question 6-12 (Appendix 1) were asked with the ambition of
identify retail stores expectations of customer’s perception of CSR importance in
relation to other factors.
Part 3
Expectations of customers’ purchase of CSR-products and engagement in
CSR activities
Theoretical relevance: Hartmann (2011); Cannon (1992); Maloni and Brown (2006);
Cooke (1997); McWilliams and Siegel (2001); Siegel and Vitaliano (2007);
Wilkinson and Balmer (1996); De Boer (2003); Sammer and Wûstenhagen (2006);
Perrini et al (2009); FAO (2008); Willer (2009); Jonas and Roosen (2005) argue the
situation of today in the retail store sector regarding CSR activities and the
increasing supply of CSR-products. Further what affects and what influence CSR
initiatives.
Empirical relevance: Question 7-19 was asked out of two main reasons. First to
gathering information about retail stores expectation of customers’ purchase of
CSR-products. Second, to see how retail stores engagement in CSR activities and
to identify their ecological and environmental product range.

28
3. THEORETICAL FRAMEWORK This chapter begins with a historical introduction of CSR, followed by an explanation of Carroll’s
CSR pyramid. Further, the theoretical framework explains customers’ perception of companies
CSR-initiatives and retail stores engagement regarding social responsibility. Last, the Gap model
of Parasuraman will be introduced and further explain the complexity of the consumer-company
relationship. This theoretical part is used in purpose to answer the research questions and develop
an understanding of the chosen theories.
3.1 THE HISTORY OF CORPORATE SOCIAL RESPONSIBILITY
In the year of 1991, Carroll (1991) stated that during the last 30 years, corporations
have struggle with the big issue of social responsibility. Carroll (1991) means that
in the past, the main argument for corporations to take responsibility was to
maximize the financial return to its shareholders.
Milton Friedman made an entrance in 1970 in the debates regarding companies’
social responsibility with the classical article “The Social Responsibility of
Businesses Is to Increase Its Profits”. Friedman has become ground for today’s
debates regarding business CSR initiatives. (May et al. 2007). In contrast to
previous authors, Friedman stated that Corporate Social Responsibility (CSR) had
its origin in socialism, where regulation of politics determined were limited
resources should be allocated. Friedman was deeply critical that companies should
expand their responsibilities further than to maximize their shareholders gain
(Carroll, 1979). He believed that society should profit most if a company made
decisions based on the interest of it is shareholders. Furthermore, he meant that
business leaders should try to earn as much money as possible at the same time as
the company is following the public society norms and regulations (May et al.
2007).
During the year of 1979, Carroll presented a descriptive model to describe
organizations cooperate social responsibility. The pyramid model of Carroll’s
(1979) became very important and not only the economic and legal responsibility,
also the ethical and philanthropic aspects were taking into account.
3.2 CSR TODAY
Still today there is no general accepted definition of the concept CSR. Even
though, European Commission (2002) have established a definition often used by

29
different authors (e.g. Fox (2004); Tencati et al. (2004); Spence (2007); Fougére &
Solitander (2009); Steurer, R (2010)) discussing the concept of CSR:
“Whereby companies integrate social and environmental concerns in their business operations and
in their interaction with their stakeholders on a voluntary basis”
(European Commission, 2002).
European Commission (2002) further means that the main function of an
organization is to create value through producing goods and services that society
demands, thereby generating profit for its owners and shareholders as well as
welfare for society, particularly through an on-going process of job creation.
However, new social and market pressures are gradually leading to a change in the
values and in the horizon of business activity (European commission, 2002).
Organisations are engaging themselves in corporate social responsibility more then
ever and changes by large organisation have been done since the beginning of
1990s. For example the Swedish, famous brand IKEA requires its rug suppliers in
India to prohibit the employment of children and provides families with financial
assistance to help keep their children out of the labour market and prohibit child
labour. Starbucks, as well as many other major coffee distributors and retailers,
sells coffee marked with fair trade label, which guarantee coffee producers an
above world market price for their products. The famous fast food chain Mc
Donald’s has adopted the European Union restrictions in the use of growth-
promoting antibiotics for its suppliers of beef and chicken in the United Sates.
PepsiCo, along with more than a dozen oil companies and consumer goods
manufactures, has withdrawn its investments from Burma because of human
rights concerns (Vogel, 2006).
The organisations above are examples of corporate social responsibility that is,
working with improvement of the workplace and benefit society in ways that go
above and beyond what companies are legally required to do. In Vogel 2006 article
Jeffery Hollender claims that corporate Social Responsibility is the future of
business. It is what companies have to do to survive and prosper in a world where
more and more of their behaviour is under microscope” (Vogel, 2006).
The growth of CSR over the last decade has also advanced as a response to
perceived failures or limitations of governmental regulation following
privatization, globalization and reforms of the Western world. In addition, a shift
in values and preferences of more affluent citizens especially in Western societies

30
as well as the revolution in communication technology that have eased the rapid
and wide spread of information can explain its increasing importance (Hartmann,
2011). Indeed, CSR was implemented by even more companies, investors and
business schools in the first decade of the 21st century, while civil society,
academia and the media also became increasingly familiar with the topic. It is
particularly in the wake of the financial and economic crisis that broke in 2008 that
CSR is more relevant then ever as calls for more responsible business are heard
and rebuilding trust is a top priority among businesses in the Western world
(European Commission, 2010).
3.3 CSR PYRAMIAD
Carroll (1991) suggested four aspects of social responsibilities within CSR:
economic, legal, ethical, and philanthropic. These responsibilities have always
existed at some point, but it has been during recent years that both ethical, and
philanthropic functions have taken an important place in the society. Carroll
(1991) presents all of these four different categories closer.
Figure 4: The pyramid of Corporate Social Responsibility created by Carroll A. B. (1991) “The
pyramid of corporate social responsibility: Toward the Moral Management of Organizational
Stakeholders”
3.3.1 ECONOMIC RESPONSIBILITIES
In the beginning, businesses were created as economic objects intended to provide
goods and services to social customers. The primary motive was to establish as the
primary motivation for entrepreneurship. Businesses were created to produce
goods and services that consumers wanted and needed (Carroll, 1991).
Carroll (1991) explains that it is important for corporations to perform in a reliable
way in order to maximize earnings per share and to earn as much profits as
Philanthropic responsibil0es
Ethical responsibili0es
Legal responsibili0es
Economic responsibili0es

31
possible. Furthermore, the author stated that importance also lies in keeping a
durable and competitive position on the market, to reach a high level of operation
efficiency and to have a successful organization by being defined as one
corporation that is consistently profitable (Carroll, 1991).
3.3.2 LEGAL RESPONSIBILITIES
Carroll (1991) state that it is essential for a corporation to perform in a consistent
way with expectations of government and law and also comply with different
states, federal, and local principles. He further list that it is essential to be an
honest corporation and successful organization that is being defined as one and
that also achieves its legal responsibilities. Last but not least, Carroll (1991) states
that it is essential for a corporation to provide goods and services that at least
reaches up to the minimal law regulations (Carroll, 1991).
3.3.3 ETHICAL RESPONSIBILITIES
Carroll (1991) defined five different components regarding the ethical
responsibilities and the first one treats the importance, like the other
responsibilities, in a manner consistent with expectations of social morals and
ethical norms. He explained that it is essential to both recognize and respect new
ethical or moral norms generally assumed by society. Further on, he stat that it is
essential for a corporation to prevent ethical norms from being compromised in
order to achieve corporate goals. Good Corporation is being defined as doing
what is expected morally or ethically, and that is very essential according to Carroll
(1991). According to Carroll (1991), the last component in the ethical
responsibility is the importance that corporate integrity and ethical behavior go
beyond simple agreement with laws and regulations (Carroll, 1991).
3.3.4 PHILANTHROPIC RESPONSIBILITIES
According to Carroll (1991), importance lies in the fact that corporation performs
in a consistent way with the philanthropic expectations of society. It is also
essential to assist the fine and performing arts and also that managers and
employees participate in voluntary activities within their local communities. It is
also essential to support private and public educational institutions and to help
voluntarily those projects that improve a community’s “quality of life” (Carroll,
1991).

32
3.4 CSR FROM A CONSUMERS POINT OF VIEW
In Öberseder et al. (2011) article regarding customer’s relation towards CRS,
Carrigan and Attlia 2001: Maignan 2001 states that during the last decades the
customers have become more aware of the phenomena of CSR. There are several
different factors that have been contributing to a crucial part for the process.
Regarding the supply side, organisations are increasing their effort in
communicating their CSR contributions. While on the demand side, consumer
group getting more involved in action towards companies with irresponsible
cooperate behaviour and more often demonstrating boycotts (Snider et al. 2003).
Several researchers support the statement that the increased attention of CSR
seems to affect costumers purchase decision (e.g. Brown and Dacin (1997): Mohr
and Webb (2005); Sen and Bhattacharya, (2001). However, in the customers
buying decision the CSR initiatives only plays a minor roll (Green and Peloza
2011). Either way, negative CSR information has much stronger effect on the
customer evaluation than positive news (Brown and Dacin 1997; Marin and Ruiz
2007: Sen and Bhattacharya 2001)
Peloza (2011) states that CSR contribute to a customer’s well being, and
companies that are engaged with CSR get rewarded for it. Hartmann (2011) states
that over the past 15 years a research stream has gradually evolved investigating
the impact of CSR on consumers’ attitude and behavior. The study provide
evidence that responsible organizations conduct has the potential to influence a
number of consumer related outcomes such as customer loyalty, product
consideration, company and product evaluation, purchase intention and
willingness to pay. However, some researchers suggest that customers’ responses
to CSR are depending on how the CSR is manifested. For example, Creyer and
Ross (1996) find that cause-related marketing (donating a percentage of sales) is
less effective than employee volunteerism or unrestricted cash donations at
countering negative news about a company. Other studies (Menin and Kahn
(2003)) shows that customer are more likely to support organisations that engage
in cause-related marketing when it is compared to support a given social issue with
no explicit request to purchase from the organisation.
There are several different studies in how different forms of CSR can impact the
behaviour of the customer. Customers do not perceive all forms of CSR in the
same manner. Different authors (e.g. Ellen et al. (2006); Vlachos et al. (2009))
determine that CSR implicitly assumes that it is a “win-win” outcome resulting

33
from social support and positive responses. But in order to support organisations
with CSR initiative, customers must gain from the exchange. Murray and Vogel
(1997) adds customer support for CSR as an exchange process: The exchange is
one in which the organisations offers something of value such as social benefit or
public service and in return receive approval and support of customers. Clarkson
(1995) argues that values and personal judgement are needed to answer
fundamental questions such as: Social responsible to whom? Social responsible to
what? Social performance judged by whom and by what standards? (Clarkson,
1995).
Consumers’ generally values CSR activities based on their personal interests,
personal morals, values and priorities (Öberseder et al. 2011). Further, Vogel
(2006) explains the dilemma how to appreciate CSR with the following question:
“Should Wal-Mart be consider as responsible company for providing customers with low-pricing
goods or an irresponsible one for paying its employees low wages and driving out independent
wholesalers?”
(Vogel, 2006)
Consumer’s perception of companies’ motives for engaging in CSR also plays a
crucial part in their responses to the concept (Ellen et al. (2006); Vlachos et al.
(2009)). Ellen et al. (2006) identify different types of attributions: other centred
(stakeholder-driven and value-driven attributions), self-centred (strategy-driven
and egoistically attribution) and win-win. Other centred attributions refer to
customers’ perception that companies feel morally committed and see it as their
responsibility to help. Self-centred once describe companies engaging in CSR for
strategic reasons (e.g. To increase their profits.) Most consumers describe mixed
motives to corporate engagement in CSR and view companies in a positive light
when they credit CSR-related efforts with a combination of value-driven and
strategic attribution. (Ellen et al. 2006; Vlachos et al. 2009). Becker-Olsen et al.
(2006) conclude that social motivation is essential for a positive consumer
reaction, while profit motivated initiatives have a negative impact. Customer
support for corporate social responsibility (CSR) is well established, and
companies are expected to involving themselves in some form of CSR.
Finally, its important to remember that the customer’s income affects a customer
perception of the importance of CSR (Öberseder et al. 2011). Further the
consumers price perception in relation to their income influence a person’s ability
to take CSR into account (Öberseder et al. 2011).

34
3.5 CSR FROM A FOOD RETAIL STORES POINT OF VIEW
CSR has developed to one of the top priorities of businesses over the last decade
having been ranked in 2011 as the number one focus of managers in the global
retail and consumer goods sector (Hartmann, 2011). CSR is both the social,
economic and moral responsibilities of the corporation but also the moral
responsibility of the corporation, like management of the corporations’
responsibility of the businesses (Cannon, 1992).
In the context of CSR, the food retail sector faces specific challenges in particular
for three reasons. First, the food sector influence and strongly depends on natural,
human and physical resources (Hartmann, 2011). Second, as food covers basic
human needs people have strong views on what they eat. This leads to a complex
set of requirements for the food sector regarding the production of the raw
materials, the environmental, energy and water use; waste and social such as labor
conditions, as well as the whole value chain and the quality, healthiness and safety
of products (Maloni and Brown, 2006). Third, the food chain has a unique and
complex structure. Since small and large enterprises differ in their approach to
CSR, this implies potential conflicts regarding CSR involvement in the food supply
chain (Hartmann, 2011).
According to Piacentini et al. (2000) there has been a lack of research into this
kind of ethical aspects applied on CSR. Cooke (1997) further states that the only
ambition for a manager is to maximize the shareholders financial outcome but at
the same time act ethically, legally, morally and honestly. Today, the biggest
concern for managers is still to, as mentioned before, maximize the financial
outcome for the owners (Piacentini et al. (2002).
The theoretical and empirical studies also indicate that CSR allows organizations
to differentiate. As food enterprises operate in fixed markets, differentiation
strategy through CSR can improve organizations competitiveness (McWilliams &
Siegel, (2001); Heyder & Theuvsen, (2009)). Organization that are able to create a
reputation of being reliable and honest by their CSR policy, will be assumed to
have high product and process attributes (McWilliams & Siegel, (2001); Siegel &
Vitaliano, (2007)). Over the last decades, food production has been repeatedly in
the spot light. Scandals concerning rotten meat and poor labor conditions have
gained considerable media attention and put the reputation of the whole sector at
risk (Albersmeier & Spiller, 2009).

35
General support of CSR among consumers are relative high, although consumers
have a criticisms against that activities within social responsibility are only for
business, rather than honest philanthropic interests. Another evidence for this
skepticism presented by Shaw and Clarke (1999), who believe that there is always a
general skepticism regarding retail stores social responsibility behavior, even more
when it is in relation to ethical products. Corporations that actively working with
social responsibility appears not communicating their social activities to the
society. (Wilkinson and Balmer, 1996) Further on, L’Etang (1995) means that the
reason why corporations are serving social responsibility is because it is generally
expected from public more than a philanthropic reason. There are unclear patterns
regarding social responsibility within retailers, although the larger retailers generally
have a bigger capability and capacity to actively work with CSR rather then the
smaller retailers (Piacentini et al. 2000).
3.5.1 CSR-ALTERNATIVE FOR FOOD RETAIL STORES
All companies despite industry are affected by the increasing societal demand for
CSR. However, given the characteristics of an industry, the pressure exerted on
companies to take up CSR likely differs, for example with the sectors’ economic
and social impact. While there are sectors such as mining that have a stronger
impact on the environment, there is no other sector that is highly dependent on
natural resources as the food sector. At the same time having considerable and
diverse impacts on the environment (Jones et al. (2005); Maloni & Brown, (2006)).
In addition, the food sector is linked to several societal concerns. Some of those
are e.g. animal welfare, treatment of wastage and labor rights (Heyder & Theuvsen,
2009). Furthermore, ethical issues relating to procurement processes have been
under special public observation because of the danger of power abuse and unfair
practices. Bargaining power in the food sector rests often with large processors
and retailers while their suppliers, partly located in developing countries, can often
only accept the offers they receive (Jones et al. 2005; Maloni & Brown, 2006).
Thus, the food sector is likely to be the target of a large number of requests by
government, None Governmental Organizations (NGO) and activists.
However, the pressure regarding implementing CSR does not only differ between
industries but also within an industry between enterprises. Size seems to be a
crucial factor in this respect as society when CSR requests falls disproportionally
on large companies. The EU food sector is characterized by a heterogeneous
structure – an atomistic structure at the primary stage, a high level of

36
concentration in retailing and the dominance of micro and small enterprises as
regards numbers but not output in food processing (Piacentini et al. 2000).
3.5.2 CSR PRODUCTS
CSR-products are often symbolized with social responsible attributes, such as
toxic-free or non-animal-tested ingredients (McWilliam & Siegel, 2001).
Customers’ believes that, by using these products, customers are indirectly
supporting a cause and rewarding firms that devote resources to CSR. Consumers
oriented CSR may also involve intangible attributes, such as reputation for quality
or reliability (McWilliam & Siegel, 2001). Fombrun & Shanley (1990) together with
Weigelt & Camerer (1988) have described how reputation building is an integral
component of strategy formulation. A reputation for quality and reliability may be
especially important for food products (McWilliam & Siegel, 2001). The
presumption firms that actively support CSR are more reliable and therefore, their
products are of higher quality (Perrini et al, 2009).
There is strong evidence regarding the fact that many consumers value CSR
attributes (McWilliam & Siegel, 2001). A growing number of companies have
incorporated CSR into their marketing strategies, because they wish to exploit the
appeal of CSR to key segments of the market (McWilliam & Siegel, 2001). CSR as
a differentiation strategy are used for to particular reason to create new demand
and to gain premium price for an existing product (Perrini et al. 2009). CSR can be
a method to achieve differentiation, because it allows managers to simultaneously
satisfy personal interests and to achieve product differentiation (McWilliam &
Siegel, 2001) Differentiating through CSR resources, such as recycled products or
organic pest control, may also include investment in research and development
(Perrini et al, 2009). Organic products, such as ecological and environmental
certified products, belong to the larger category of ethical or sustainable products,
which indicate that a product possesses certain socially or environmentally
desirable qualities (De Boer, 2003). In 2000, the EU label for ecological and
environmental certified products was introduced in order to increase the credibility
of ecological products among European consumers as well as to ensure better
identification of these products in the market (Commission of the European
Communities, 2004). The labels, supported by third-party certifications, can
increase the credibility attribute for products. (Sammer and Wüstenhagen, 2006).
Even though, the label products must be perceived, understood, trusted and
valued before consumers can take ecological products into consideration in

37
decision-making processes (Perrini et al, 2009). While many ethical labels have
earned wide popularity, not all of them have reached out widely or effectively
enough (Perrini et al, 2009).
According to Food and Agriculture Organization, FAO (2008), organic products is
still a niche and covers about 2 % of global food sale, even though the consumer
interest still increasing. During 2007, the international sales of organic products
increased with almost 3 billion euros compared to the year before (Willer, 2009).
The consumer demand for ecological and environmental certified products is
mostly concentrated in Europe and North America (Willer, 2009). The European
retail industry has played an active part in the growth of the market for organic
products (Perrini et al, 2009). In 1990, major grocery retail chains began to sell
ecological products – especially fruit, vegetables, meat and dairy foods (Jonas &
Roosen, 2005). These products became widely available in supermarkets and
hypermarkets, both in the leading European counties and in North America.
There, large retailers such as Wal-Mart or Subway began to offer diverse range of
ecological products (Perrini et al, 2009). As customers began to notice them in
supermarkets, retailers further diversified by adding private-label products to their
inventory, increasing consumption by adding competitive prices among ecological
and environmental products (Bentley, 2009). Many of these private labels are now
marketed under group names, such as ‘O Organics’ by Safeway in the US, ‘Grünes
Land’ by Metro in Germany or ‘Bio-logici’ by Coop in Italy (Perrini et al, 2009).
Several authors in the 20:th century (Chinnici et al. 2002; Pedersen and Neergaard,
2006; Onyango et al. 2007) indicates that customer of ecological food are relatively
young, high-income earner and a high degree of education. Furthermore, they are
generally women with children. There are two particular benefits, which motivate
purchase of ecological products (Padel & Foster, 2005; Honkanen et al. 2006;
Perrini et al, 2009). First private benefits, ecological and environmental products
are believed to be more health promoting, safer, better tasting, and richer in
nutrients than conventional products (Perrini et al, 2009). Second public benefits,
ecological products are believed to be better for the environment and animal
welfare than conventional products. (Perrini et al. 2009).
Surveys reveal a gap between how many consumers are interested in buying
ecological and environmental certified products and how many actually buy them
(Perrini et al, 2009). Bellows et al. (2008) through Perrini et al 2009 report that
only 27% of those who prefer ecological production methods actually buy organic.

38
Gaps between consumer’s attitude and their actual behaviors have often been
found in surveys about green consumption in general (Pickett-Baker and Ozaki,
2008). Bonini & Oppenheim (2008) state that 87% of consumers worry about the
environmental and social impacts of their purchases, but only 33% buy green
products (Bonini & Oppenheim, 2008).
There are transaction barriers that affect consumer interest of buying organic
products; the two main factors are presented below. (Tsakiridou et al, 2008). First
of all, the premium price of organic products in relation to the high production
costs and the relatively inefficient distribution chain that characterize the
ecological farming system (Kihlberg and Risvik, 2007). Secondly, the limited
availability of ecological products on the market, attributable not only to limited
production but also to the relatively limited distribution even in the most advanced
countries, where ecological products are less common than their traditional
products (Lea and Worsley, 2005). Thus, brands can shift consumer attitudes to
more sustainable consumption. For example, affective marketing could convert
passive green consumers who are willing to pay premium prices for environmental
certified products to greener consumption (Ottman, 1998).
3.6 SERVICE QUALITY – 5 GAP MODEL
Seth et al. (2004) state that during the last two decades, the focus areas regarding
organizations have changed to maximize profits through increased customer
satisfactions that earlier only focused on maximize profits. The high level of
competition between organizations has forced them to put more focus on the way
that they deliver and not only at the process in itself. The hierarchic system with
the vertical functional approach is being replaced with more horizontal business
approaches. Seth et al. (2004) further state that organizations working harder to
improve sharing information with customers. Seth et al. (2004) also claims that
organizations have more pressure regarding introducing new products and services
more quickly to the market now then before. It is more important to integrate
customers’ driver processes and use fast response on the customers needs and
wants. Seth et al. (2004) thinks that organizations can get great success by using
Internet to spread and access information. Furthermore, Seth et al. (2004) means
that in the year of 2004, society it is more a must then a desire to be able to deliver
the services better then the competitors’ can. Seth et al. (2004) illustrates a model
that was originally created by Parasuraman et al. (1985). The model is called the
gap model and provides that service quality is a function between expectation and
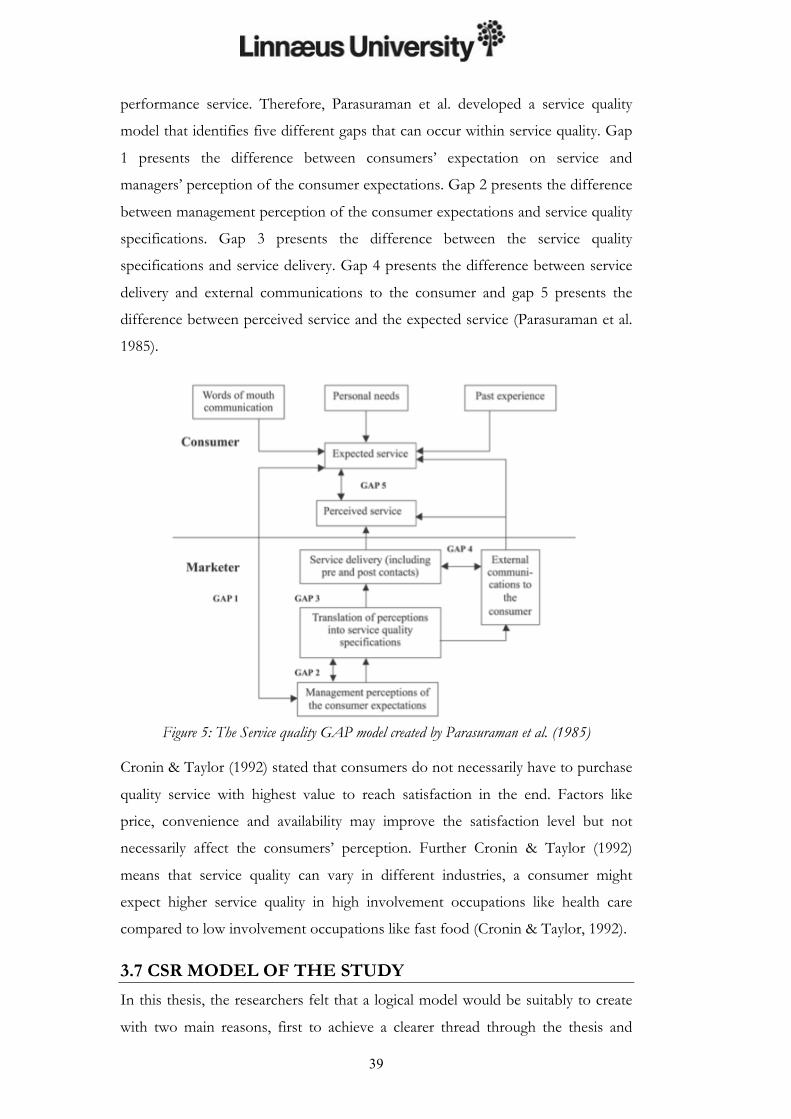
39
performance service. Therefore, Parasuraman et al. developed a service quality
model that identifies five different gaps that can occur within service quality. Gap
1 presents the difference between consumers’ expectation on service and
managers’ perception of the consumer expectations. Gap 2 presents the difference
between management perception of the consumer expectations and service quality
specifications. Gap 3 presents the difference between the service quality
specifications and service delivery. Gap 4 presents the difference between service
delivery and external communications to the consumer and gap 5 presents the
difference between perceived service and the expected service (Parasuraman et al.
1985).
Figure 5: The Service quality GAP model created by Parasuraman et al. (1985)
Cronin & Taylor (1992) stated that consumers do not necessarily have to purchase
quality service with highest value to reach satisfaction in the end. Factors like
price, convenience and availability may improve the satisfaction level but not
necessarily affect the consumers’ perception. Further Cronin & Taylor (1992)
means that service quality can vary in different industries, a consumer might
expect higher service quality in high involvement occupations like health care
compared to low involvement occupations like fast food (Cronin & Taylor, 1992).
3.7 CSR MODEL OF THE STUDY
In this thesis, the researchers felt that a logical model would be suitably to create
with two main reasons, first to achieve a clearer thread through the thesis and

40
always be able to lie back to the model if focus is lost but also to clarify the
purpose with the thesis. During the empirical investigation, the Gap model was
found that originally was created by Parasuraman (1985). The different gaps were
easy to linking with the CSR problems that the researchers have identified and
investigated within the thesis. Actually, the main thing with the Gap model is that
it actually treats five different service qualities and presenting the possible gaps
between companies and customers. When the researchers tried to implement
different CSR issues in the gaps, they noticed that it actually was working. The
main reason for understanding why this new model are created, is that the
researchers perceives CSR as a type of service quality and with that in mind it is
easier to implement the different gaps from a CSR perspective. Mainly, gap 1 and
gap 5 were chosen in the Gap model that treats the problem questions in this
thesis. Gap 1 presents the expected service from the customers in relation to
management perception of the customer expectation. In this thesis, to adjust the
model to CSR, gap 1 presents the customers expected CSR service against the
retail stores. Gap 1 deals with customers’ attitudes and knowledge about CSR; are
they aware of CSR products? How important is social responsibility in the society?
What is the general opinion regarding CSR products and its responsibility towards
a sustainably society? Further, the companies in the original Gap model have been
replaced with the retail store managers and discusses the retail stores’ expectations
on customers attitudes and knowledge towards CSR products: Gap 1 will
investigate what retail stores believe that the customers think is important.
Further, how the retail store thinks that customers perceive the CSR initiative of
the retail store and what managers perceive regarding customers perception of the
actual retail store.
Further, gap 5 that is named gap 2 in this thesis and model considers the
customers expected service in relation with the perceived one. In gap 2, the actual
customer engagement is being presented against the retail stores actual CSR
engagement. Different questions are being asked in order to achieve knowledge
regarding how customers engage themselves in CSR initiatives. The researchers
want to find out what the customers’ actually thinks about CSR products and
initiatives and what factors that are important for them in the choice of retail
store. Further, the CSR knowledge level of the customers wants to be investigated
and how many that truly purchases CSR products for the household. The main
reasons for not purchasing CSR products will also be identified thanks to the

41
model. Furthermore, the thesis wants to investigate what type of customers
purchase CSR products and what factors affect the purchase. Also identify the
main reason why some customers do not purchase CSR products and the main
reason for that. Last, with help from the new model, the different changing factors
will try to be identified that will get the customer to eventually purchase CSR
products in the future.
Figure 6: The researchers own designed figure regarding the company-customer relationship from a
CSR perspective
Lets go back to gap 1 in the original gap model, and three different boxes are
included as underlying factors under “Expected service” and are identified as
world of mouth (WOM), personal needs and past experience. In this thesis, the
researchers have made a decision to not include these underlying factors in the
innovative model because of two reasons. First, because that is not what this thesis
is going to investigate and a clear focus needs to be followed throughout the end.
Secondly, the model was supposed to scale of some of the factors in order to
decrease the complexity within the concept of CSR. According to the purpose of
the thesis, the underlying factors are not included in this thesis.

42
4. EMPIRICAL INVESTIGATION The following chapter contains a summary of the data collection and empirical investigation.
There have been in total 150 answers on the surveys and five in-depth semi-structured interviews.
This chapter will introduce with the quantitative investigation where all the chi-square tests and
tables are being presented but also a describing text to further develop the tables that have been
conducted. Secondly, the qualitative investigation will be presented in three different parts where
part I presents the general view of retail stores, part II presents the questions regarding customers’
perception and part III presents the product and range questions. Beneath each part, there are a
table that summarize everything in the in-depth interviews to easier get an overview and see
possible similarities and differences between the received answers from retail stores.
4.1 QUANTITATIVE INVESTIGATION
The quantitative research contains of 150 customer surveys, which have been
collected by random waking method in Växjö City area. (Appendix 4). The first
part in the quantitative investigation contains information regarding respondents’
variety of age, gender, household, education, occupation and income. With other
words, the selected six variables in this thesis. Further, all the Cross tabulations
and Frequencies are presented and most of the tables have been listed 1-5
according to the question to get a more clear view of the answers.
4.2 VARIABLES OVERVIEW
4.2.1 VARIABLE AGE
The collected sample represents individuals between the ages of 18 – 77 years old.
Further, the mean age was identified as 38 (37,99), median age was 33 (32,50) and
the most common age of the participated respondents in the survey was 23 years
old (Mode age).

43
Table 1: The table illustrates a general overview of the presented data regarding the age.
Further, to easier identify possible correlation between age and other variables, the
age were divided into four different age groups:
Table 2: The table illustrates the distribution between the four different age groups.
Diagram 1: The figure illustrates the distribution of four different age groups.
69
36
24 21
0
10
20
30
40
50
60
70
80
1 (18-‐30) 2 (31-‐45) 3 (46-‐62) 4 (63-‐77)
Age Group

44
4.2.2 VARIABLE GENDER
Women represented 58,7% of the total participated respondents and men
represented 41,3% (88 women and 62 men).
Table 3: The table illustrates the distribution between participating women and men.
Diagram 2: The figure illustrates the distribution between women and men.
88
62
0 10 20 30 40 50 60 70 80 90 100
Woman Man
Gender

45
4.2.3 VARIABLE HOUSEHOLD
Table 4: The table illustrates the different sizes of household that have participating in the survey.
The average participant household contained of 1-2 persons. Household including
1 member covered 34,7% and 2 persons covered 35,3%. 10% of the respondents
lived in a household with 3 persons and 14% with 4 persons. Only 4.7 % and 1,3
% (9 persons in total) lives in a household with 5 persons or more. The household
cluster is showed below illustrated in diagram 3.
Diagram 3: The table illustrates the distribution between how many persons that are including in
every household that have been participated.
52 53
15 21
7 2 0
10
20
30
40
50
60
1 person 2 persons 3 persons 4 persons 5 persons 6 or more
Household

46
4.2.4 VARIABLE EDUCATION
Table 5: The table illustrates the different highest education level that the respondents had.
The education variable was divided into five different categories; whereby the
respondents were suppose to answer the question, of their highest education level.
Of 150 respondents, the most frequent education level was University with 43 %
of the respondents followed by secondary school 3 years with 40%. Secondary
school 3 years includes both employees but also students that have not finished
their higher level of education yet. The numbers are also illustrated in the table
below:
Diagram 4: The table illustrates the distribution of highest education level.
4 5
60
9
72
0
10
20
30
40
50
60
70
80
Elementary school
Secondary school 2 years
Secondary school 3 years
Vocational education
University
Education

47
4.2.5 VARIABLE OCCUPATION
Table 6: The table illustrates the different occupation of the respondents.
All respondents answered the questions regarding their current occupation; the
table illustrates the six different categories. The most common ones remained was
employees with 55,3% and secondly students with 25,3%. Self-employed includes
all the people with own business and was 6%. The senior category attained 11,3%
and only 1 unemployed. The last category named “Other” involves people that
mentioned their current occupation as sickness retired and the study only 2
persons. Persons that said that there current occupation were parental, where
categorized under employees.
Diagram 5: The figure illustrates the distribution of different occupations.
83
9 1
38
17 2 0 10 20 30 40 50 60 70 80 90
Occupation

48
4.2.6 VARIABLE INCOME
Table 7: The table illustrates the different intervals of total gross income per year.
The study selected to categorize income in 7 different levels with SEK 150 000
interval. The first category contains low-income persons, mostly represented
students, sickness retired and few seniors. The most common income category
with 22% are group 2 between 150 000 – 299 000. Note that the numbers are
asked in gross income but also income in one household per year. In this thesis,
most of the respondents are low or medium income persons but also a few high-
income individuals participated in the survey (4,7%). The amount of 8 persons
(5,3%) chose not to answer the questions regarding their gross income with the
reason that it is a private question, this number can be read-out from the missing
category named “Unknown” which means that an answers have been left out.
Diagram 6: The table illustrates the distribution of the total gross income per year.
19
33
28 29
17
9 7
0
5
10
15
20
25
30
35
-‐149999 150 000 -‐ 299 999
300 000 -‐ 449 999
450 000 -‐ 599 999
600 000 -‐ 749 999
750 000 -‐ 899 999
900 000 <
Income

49
4.3 RELATIONSHIP VARIABLES
4.3.1 CUSTOMERS’ ATTITUDES TOWARDS SOCIAL RESPONSIBILITY
Table 8: The table illustrates the importance of social responsibility
As the table above shows, 64% think that social responsibility is rather important
or crucial for purchasing in a certain retail store. Many respondents stated that
they think social responsibility is very important for retail stores to obligate.
Further when the question were asked whether they think it is crucial or not for
purchasing in that certain store, many respondents claimed that it is only
important but not crucial in the choice of retail store. Onwards, it is only 2% that
think it is crucial for purchasing products, and would change retail store if they
decided to not take a social responsibility towards the society.
The result shows that there are differences regarding the importance of social
responsibility in relation to age. First the results shows, (Appendix 3) that the
older respondents’ in group 3 and4 values social responsibility higher then the
younger respondents group 1 and 2. The older respondents is the more important
they think it is that retail store obligate social responsibility. In age group 1 and 2,
the answers are more spread between the opinions not important at all to
important. In age group 1, 4,3% does not think that social responsibility is
important at all, 8,7% think it is less important, 19,4% does not have any opinion
and about 55% think it is rather important or crucial. The number of respondents
is increasing on the important opinion the older they are. In age group 3 and 4,
about 80% think that social responsibility is important or crucial.

50
From a gender perspective, the empirical findings show that there are some
differences between women and men regarding the importance of social
responsibility (Appendix 3). 69 % of the women think it is important for retail
store to take social responsibility, only 52,4 % of men thinks the same. There are
more men that answered that they “Not important at all”, 6,3 % of men and “Less
Important” 11,1% of men in relation to women 1.1 % “Not important at all” and
8 % “Less important”. The response rate that answered “No opinion” women and
men where almost equally represented (Women 20,7 % and Men 27,0 %). When
investigate how the difference occur regarding the total amount of members
within the household, a spread opinion are identified along the way. Every
category is superior regarding respondents that think that social responsibility is
important, but the household that differ the most are household with 1 person,
where 32,7 (17) does not have an opinion about retail stores obligations to take
responsibility. Regarding the influence of the respondents’ education level, the
finding shows that if the level of education does not have an impact on the way
the respondents answered. Either way, it is hard to see any relation patterns when
the respondents representing the different category vary too much to see any
correlation or differences. (Appendix 3). By observing the influence of the
respondents occupation following findings could be shown. There are differences
between the different occupations; the larges difference is the response rate of
“Importance” between seniors and employees/students/self employees. 94,1 % of
the seniors thinks it is important but only 56,6 % of the employees, 63,2 % of
students, 44,4 % self employees. Employees stand for almost all the respondent
that thinks social responsibility is “Less important”(12 of 14 are employees). There
are differences in the answers with respondents with different income.
Respondents with 149 000 or less answered either “have no opinion” with 42,1 %
or important” with 56 %. Of income group 2 (150 000-299 000) 72,7 % thinks it´s
important and 18,2 % have no opinion. Income group 3 (300 000 -449 000),
Income group 4 (450 000-599 000) and income group 5 (600 000-749 000) answer
quite the similar, they have quite spread answers in regarding social responsibility
(see appendix 3). The age group 6 (750 000-899 000) answered “important” 5/6
(85,7 %) respondents.

51
4.3.2 IMPORTANT FACTORS INFLUENCING CUSTOMERS CHOICE OF RETAIL STORE
Table 9: The table illustrates the different affecting factors that the customer have answered
regarding the choice of preferable retail store
The result of this question was based on an open question, whereby the customer
came up with factors why they purchase at a certain store. The answers was
summarized and the final ranking list of the result is shown below:
1. Location (41,3%) 2. Product range (38%) 3. Price (34,7%) 4. Satisfying store (30%) 5. Product quality (24%) 6. Fast purchase (12,7%) 7. Staff (10%) 8. Habits (8%) 9. CSR products (4%)
As been shown in the table, “Location” is the most common factors, which was
identified for being the reason why customer chose to purchase in a certain store.
Shortly after, with 38% is the product range. The store provides a good, broad and
wide product range was the customers could find whatever they are looking for.
At third place, with 34,7% is the factor price presented followed closely by factor
number 4, satisfying store with 30%. What covers a satisfying store is an overall
feeling about that the store is good, that the atmosphere and appealing is pleasant.
As a fifth factor, the product quality is represented with 24%. Further, the
percentage drops slightly and next factor is represented by 12,7%, fast purchase.
Fast purchase means that it is easy to find the products in the store, and contains

52
an easy customer lap in the store. The size of the retail store is not too big and the
customer like that they do not need to spend more time then necessarily with
purchasing food. They mentioned that it could sometimes by stressful or
frustrating when the purchase does not go smooth and the purchasing process
becomes complex. The last factors that were mention were staff (10%), habits
(8%) and CSR products (4%). Further, 6 respondents only mentioned the CSR
products, and two-thirds of them prefer to go to Coop Extra (2 respondents) or
Willy:s (2 respondents) in order to purchase CSR products. Ica Maxi is also
mentioned once by 1 respondent’s and remembers that this is the main reason for
the customers’ why they chose to purchase at each retail store.
Table 10: The table illustrates the chosen retail store where customers go in order to purchase
CSR products
4.3.3 AWARENESS OF CSR PRODUCTS
Table 11: The table illustrates the frequency and percentage of the sample that the respondents
have answered regarding if they are aware of CSR products or not.
Regarding the respondents awareness of CSR products, 90,7% of the total sample
answered positive and consider themselves aware of CSR products. Only 9,3%
answered that they did not were aware of CSR products at all. What can be
showed with the variable age is the fact that there is a higher level of awareness in
age group 1,2 and 3 compared to age group 4. Age group 1,2 and 3 are both

53
indicate around 90% each in their own category, but age group 4 is only
representing 66,7% awareness. The age group with the highest level of awareness
is age group 1 with 98,6% of the respondents saying that they are away of CSR
products. Age group 1 is respondents between the ages of 18-30. Next variable is
gender which shows that they are no difference between men and women in the
awareness of CSR products, the same percentage are aware and the same
percentage are not aware. There are still about 90% awareness and 10% not
awareness in the gender table. (Appendix 3) Further, next variable to consider is
the household variable, which illustrates that the awareness is about the same in
every household category and it circles around 85%-95% awareness. The two
household categories which stands out the most are households with 4 members
that every single household are aware of CSR products compared to households
with 2 members where 15% are not aware of CSR products. In the survey, the 1
and 2 members household are overrepresented. Regarding education level, it can
be shown that people with a secondary school education, a vocational education
or a university level are aware between 90%-100% The respondents with a lower
level of education have also a lower awareness of CSR products. But in contradict
to that, 10% of the respondents with a University level does not know about CSR
products.
4.3.4 PURCHASING CSR PRODUCTS
Table 12: The table illustrates the frequency of the respondents that answered if they purchase
CSR products or not.
Purchase CSR products: 91 respondents (60,7%)
Does not purchase CSR products: 59 respondents (39,3%)

54
Regarding the question whereby the random selected respondents consume
products with CSR or not, as much as 60,7% answered that they did. The
respondents that answered “Sometimes” or “Once in a while” is also included
under the same category. Further, 39,3% answered that they do not purchase CSR
products. In relation with the variable age group, the table shows (Appendix 3)
that the older the respondents are, the more likely to purchase CSR products.
Age group 3 are most likely to buy with 87,5% saying that they are purchasing
CSR products and only 12,5% that does not purchase. In age group 1, there are
almost equal between the respondents purchasing and not purchasing CSR
products. In age group 2, the numbers are about two-thirds (2/3) that purchase
CSR products and one-third (1/3) that does not. In age group 3, almost 90%
purchase and only 12,5% does not. In the oldest age group (62-77) are again
almost equal where 57,1% purchases CSR products and 42,9% does not. In the
gender variable, there are about two-thirds (2/3) of the women that purchase and
one third that does not. In the male section, there are 50% purchasing and 50%
that does not. The household table (Appendix 3) shows that half of the
households with 1 member, are purchasing and half of them are not. In household
with 2 members, 64,2% purchase CSR products and 35,8% does not. In age group
3, 60% purchase and 40% does not. Household with 4 or 5 members are likely the
same percentage where around 70% purchase and 30% does not.
Regarding education level, the higher education level, they are higher likely to
purchase. From bottom to top, the elementary school respondents are answering
like 75% are not purchasing but 25% does. In secondary school with 2 years, 80%
purchasing and 20% does not. Secondary school 3 years is more equal with almost
half respondents purchasing and half does not. The respondents that are having a
vocational education are less likely to purchase CSR products with only one-third
answering that they do. People with a University education are most likely to
purchase CSR products with 70% saying that they do and 30% saying that the do
not. To see the difference between occupation and purchasing CSR products, a
table shows that two third of all the employees that have participated in the survey
(83 persons), 66,3% are purchasing CSR products and the same regarding self-
employee and seniors as well. Regarding the student category, it is about equal
between purchasing and not. When looking at it from an economical perspective,
it clearly shows that the more income a household earns a year, the more likely to
purchase CSR products. From households that earn up to SEK 149 000, only one

55
third are purchasing products. People which income level is between 150 000 –
599 999 are the same likely to purchase CSR products with 60% saying that they
do. The two highest income levels are landing on 70% versus 77% purchasing
CSR products when they are having an gross income from 600 000 and more.
4.3.5 AWARENESS AND PURCHASING CSR PRODUCTS
Table 13: The table illustrates a Crosstab between awareness of CSR in relation with purchasing
CSR.
A cross tab were conducted in order to identify any possible correlation between
“4.3.3 Awareness of CSR products” with “4.3.4 Purchasing of CSR products”. In
the left column, the awareness of CSR products are presented with a negative or a
positive answer and in the top frame, the consumption of CSR products answers
are also presented with a negative and a positive answer. To start with, 63,2% of
the respondents that where aware of CSR products, also states that they are
purchasing them (the upper left box in the table). Further, of totally 136
respondents that stated that they are aware of CSR products, 50 of them are not
purchasing CSR products, that represent 36,8% (the upper right box in the table).
The lower left box in the table represents the respondents that first answered that
they are not aware of CSR products, but do purchase them. In total, 14
respondents are not aware of CSR, and 35,7% of 14 respondents represent 5
respondents that are not aware but do purchase them. Furthermore, the lower
right hand box in the table represent the respondents that give a negative (No)
answer of being aware of CSR products and does not purchase them either.

56
4.3.6 REASONS FOR PURCHASING CSR PRODUCTS
Table 14: The table illustrates the different mentioned reasons for purchasing CSR products
1. Environment (50,5%)
2. Quality (29,7%)
3. Healthy (16,5%)
4. Feels good (14,3%)
5. For society (8,8%)
6. Unintentionally (6,6%)
7. Animal treatment (4,4%), Other (4,4%)
8. Don’t know (2,2%)
The respondents that answered that they are purchasing CSR products were
further asked why they purchase CSR products. 50,5% answered that it is because
of the environment and second place, with 29,7,5% was quality mentioned.
Different answers are included under this category, like better quality on CSR
products; it tastes better or does not include any chemicals substances. On third
place health was mention by 16,5%, of the respondents. Further, 14,3% think it
feels good both for the conscience and for personal gain. Forward, 8,8% are
purchasing CSR products for society and 6,6% purchase it without knowledge,
with other words unintentionally. 4,4% purchase CSR products with animals in
mind. Only 2,2% answered that they do not know and 4,4% answered other

57
options. Other includes reasons like “when it is affordable” (2 persons) or
“because they believe in it. (1 person)
4.3.7 REASONS FOR NOT PURCHASING CSR PRODUCTS
Table 15: The table illustrates the frequencies and the percentage in brackets how many
respondents that thought each factor were the reason for purchasing CSR products
1. Expensive (59,3%)
2. Don’t care (32,2%)
3. No difference (10,2%)
4. Not a habit (6,8%), No credibility (6,8%)
5. Lack of knowledge (5,1%), Other (5,1%)
6. Laziness (3,4%)
The table shows the different factors that have been mentioned in relation with
respondents answering on the reasons why they do not purchase CSR products.
“Sum Yes” stands for all the respondents that have mentioned the factor, and how
many in total. The frequency is first presented followed by the corresponding
percentage brackets. The right column are the total respondents that has not
mentioned the given factor with the same structure, the frequency are first
presented followed by the corresponding percentage in brackets. First, when the
respondents’ were asked about the reason why they do not purchase CSR
products, 59,3% answered that it is because it is too expensive. There is too big
difference from ordinary products compared with CSR products, and when the
respondents are uncertain on what they are getting out of the extra crowns they do
not think it is worth spending those money. On next place, 32,2% does not
purchase CSR products because they do not care at all about them. CSR products

58
do not appeal them and it is nothing that they care about in daily life. Next factor
to be brought up is “No difference”, which represented by 10,2% of the
respondents that claims that they are not purchasing CSR products. They mean
that they do not believe, think or feel any different between CSR products and
ordinary ones and for that reason, having a hard time convince there selves to
purchase a more expansive product when they are not noticed any notable
difference. With the same percentage, respondents mentioned either that it is not a
habit for them or that they do not feel any credibility towards CSR products.
(6,8%) The respondents that stated that purchasing CSR products are not a habit
for them, means that they are purchasing groceries a lot with habits and it is hard
to implement a new product into customers purchasing habits. It is even hard to
make the respondents see the CSR alternative in the shelf together with all the
other alternatives. The other mentioned factor, no credibility stands for
respondents that do not believe in CSR products that much that they will purchase
them. If the credibility would increase, they might be a change for them to
purchase it but at the moment, they feel that the credibility is not as high as it can
be.
4.3.8 PURCHASING CSR PRODUCTS AND SOCIAL RESPONSIBILITY
Table 16: The table illustrates the relation between the question which respondents that purchase
CSR products or not and the level of importance with social responsibility
According to the table, a crosstab have been created to clearly show the relation
between the respondents that purchase CSR products and the respondents that
have claimed how important social responsibility is in society. The interesting data
in this survey is the fact that 59 respondents have claimed that they do not
purchase CSR products, but anyhow 55, 9% of those respondents still think it is
important for retail stores to take social responsibility. A more logical data
presents that by the 91 respondents that purchasing CSR products, 80, 2% of

59
them also think that it is important. Only 7,7% of the purchasing respondents,
hold an opinion that it is crucial in the choice of retail store. No one of the
purchasing respondents have state the opinion that it is not important at all, and
2,2% that purchase CSR products think that it is less important. It is also
interesting to see that there are one respondent mentioning that it is crucial with
social responsibility in the society, but even so, the respondent does not purchase
CSR products.
4.3.9 CUSTOMERS’ GRADING OF IMPORTANT FACTORS IN RETAIL STORES
Table 17: The table illustrates how the respondents have grade the different factors with the
frequencies identified and the corresponding percentage within brackets.
According to the table, the crucial factors for this thesis are represented in the left
column under “Factors”. What can be identified from the table is the amount and
percentage of every respondents answer regarding different factors and different
opinions. So, for an example, only 3 respondents (2%) each does not have an
opinion regarding price or quality on their preferable retail store which they
selected in the survey. Continuing, 56 respondents (37,3%) have no opinion
regarding environmentally certified products in their preferable retail store, which
is about 2/3 of the whole sample. Other factors like charity, ecologically produced
products and locally produced, which can be summarized as CSR products, are
also representing a high number of respondents that does not hold any opinion
about the mentioned factors. Charity represents as much as 64% respondents,
which is about two third and further represent the category that most respondents
did not have an opinion about. As number two, locally produced is representing
38% having no opinion about the factor and further environmentally certified with
37,3%. As number four, and the last CSR products that are being presented in the
table is ecologically produced products with 28,7% which shows that people are
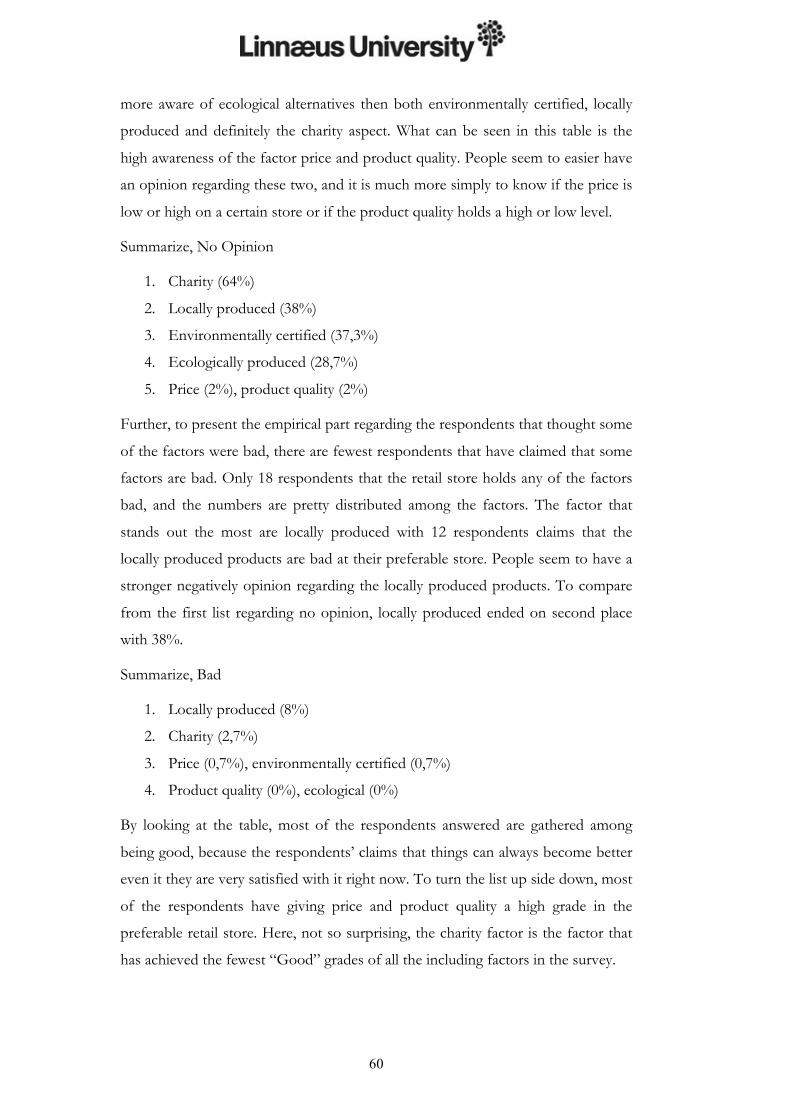
60
more aware of ecological alternatives then both environmentally certified, locally
produced and definitely the charity aspect. What can be seen in this table is the
high awareness of the factor price and product quality. People seem to easier have
an opinion regarding these two, and it is much more simply to know if the price is
low or high on a certain store or if the product quality holds a high or low level.
Summarize, No Opinion
1. Charity (64%)
2. Locally produced (38%)
3. Environmentally certified (37,3%)
4. Ecologically produced (28,7%)
5. Price (2%), product quality (2%)
Further, to present the empirical part regarding the respondents that thought some
of the factors were bad, there are fewest respondents that have claimed that some
factors are bad. Only 18 respondents that the retail store holds any of the factors
bad, and the numbers are pretty distributed among the factors. The factor that
stands out the most are locally produced with 12 respondents claims that the
locally produced products are bad at their preferable store. People seem to have a
stronger negatively opinion regarding the locally produced products. To compare
from the first list regarding no opinion, locally produced ended on second place
with 38%.
Summarize, Bad
1. Locally produced (8%)
2. Charity (2,7%)
3. Price (0,7%), environmentally certified (0,7%)
4. Product quality (0%), ecological (0%)
By looking at the table, most of the respondents answered are gathered among
being good, because the respondents’ claims that things can always become better
even it they are very satisfied with it right now. To turn the list up side down, most
of the respondents have giving price and product quality a high grade in the
preferable retail store. Here, not so surprising, the charity factor is the factor that
has achieved the fewest “Good” grades of all the including factors in the survey.

61
Summarize, Good
1. Product quality (62,7%)
2. Price (52%)
3. Ecologically produced (28,7%)
4. Environmentally certified (22,7%)
5. Locally produced (16%)
6. Charity (8%)
4.3.10 IMPORTANT PRODUCTS FEATURES
Table 18: The table illustrates different important product features that were important for the
customers that the retail store provides.
The participants answered a question regarding what types of products are most
important for a retail store to provide. The respondents had several options (Low-
price, quality, environmentally certified, ecological, fair trade, locally produced or
other). Se the results below:
1. Quality (78,7 %)
2. Low-price (44%)
3. Locally produced (36,7)
4. Environmentally certified (30%) and ecological products (30%)
5. Fair trade (14%)
Product quality was most important for the respondents, with 78% answers. In
second place, low-price with 44% was considered important for retail store to
provide. Third was locally produced with 36,7%, closely followed by
environmentally certified and ecological products (30%) that both share a forth

62
place in the ranking system. Last but not least, the respondents think that fair trade
is the less important type of product for retail store to provide. Note that the
respondents were allowed to put more than one cross.
4.3.11 THE IMPORTANCE FOR RETAIL STORES TO PROVIDE CSR PRODUCTS
Table 19: The table illustrates what level of importance the respondents consider the retail store to
provide CSR products is.
According to the table, 70,7% holds an opinion that it is important for retail stores
to provide CSR products and 5,3% thinks that it is crucial in the choice of retail
store. They mean that they who think it is important but not crucial would not
visit or change retail store, if they know that the retail store did not provide CSR
products. Regarding this question, 14% of the respondents did not have an
opinion regarding the importance of providing CSR products. Only 2,7% holds an
opinion, that providing CSR products are not important at all, and 7,3% thinks
that providing CSR products are less important. Many respondent had an opinion
that they think it is good that retail stores provide CSR products, but not for
themselves but for others that are looking for that type of products. Many
respondents that did not purchase CSR products still thought that it was
important for the retail store to provide.

63
4.3.12 PREFERABLE RETAIL STORES
Table 20: The table illustrates the customers’ choice regarding which retail store they prefer to
purchase in.
1. Ica Maxi (28%)
2. Willy:s (27,3%)
3. Other (18,7%)
4. City Gross (15,3%
5. Coop Extra (8,7%)
6. Lidl (2%)
As the table shows, both Willy:s and Ica Maxi seem to be the most popular retail
store to purchase groceries in. “Other retail stores are representing the third place
and includes for example retail stores like Ica, Coop Oxtorget and Coop Nära.
Retail stores that are having a nearby location and have built a strong long-lasting
relationship with its customers seem to cover up the option for other retail stores.
Next, City Gross is represented with 15,3% of the respondents’ opinion and then
Coop Extra with 87%. Lidl is last with only 2% as the most preferable retail store
to purchase in.

64
4.3.13 NON-PREFERABLE RETAIL STORE
Table 21: The table illustrated (opposite to 4.12) the customers’ choice regarding which retail
store they do not prefer to purchase in.
1. Lidl (55,3%)
2. Other (10,7%)
3. City Gross (6,7%)
4. Coop Extra (6%)
5. Ica Maxi (5,3%), Willy:s 5,3%
Regarding the choice of non-preferable retail store to purchase groceries in,
Lidl is at first place with 55,3% of the respondents that believes that Lidl is not
a retail store they prefer to purchase in. At second place, other retail store is
represented with 10,7% and retail stores like Netto and Ica was mentioned in
this category. The missing category called “Unknown” is representing the 16
respondents that did not have a certain retail store that they could decide
about and chosen to not answer the question at all. At third place, City Gross
was the retail store with 6,7% of the respondents answer. Further, Coop Extra
had 6% of the surveys opinion that it is not a preferable retail store to
purchase in for different reasons. Last, both Ica Maxi and Willy:s is last with
5,3%.

65
4.3.14 REASONS WHY CUSTOMERS DO NOT PURCHASE AT RETAIL STORES
Table 22: The table illustrated the most common factors that were mentioned when the
respondents were asked for the affecting reasons why they did not purchase at a certain store.
In the total row, the number shows how many respondents that mentioned the
factors to the left in the factors row. So of all the respondents that did answer
which retail store they did not prefer to purchase, 8 respondents mentioned that is
was because of for example because it is a foreign store. Of 8 respondents’ Lidl
was most common retail store that was mentioned 7 out of 8 respondents. What
foreign store means is that the respondents does not purchase at Lidl because it is
a foreign company and not Swedish. Next factor is price, where can be seen that
11 respondents’ mentioned it to be one of the main reasons and Coop Extra was
mentioned most of the times by 4 respondents. In this case, the price was
mentioned because the customers’ think that for instance Coop Extra have to
expensive prices and that is the main reason why they do not purchase groceries at
that certain retail store. Next row treats the factor staff, which shows a more
equally distribution of the answers. By total 8 respondents that mentioned the
staff, 2 of them does not prefer City Gross, 2 of them does not prefer Coop Extra
and two of them does not prefer Lidl. Comments that received regarding this
factor was for example that the staff was unpleasant or had a general low service
level. As many as 39 respondents mentioned a disorganized retail store as a main
reason and Lidl was brought up 23 times out of 39 in the same survey. The

66
respondents can explain a disorganized store as a messy, unattractive or dirty retail
store. A large-sized retail store seems to be a bigger issue for many respondents
then that was believed in the beginning. 12 respondents mentioned that they want
fast purchase and gets frustrated and irritated when they are not able to find the
products in the store. They want a fast purchase and do not want to walk around
in the store for several hours. City Gross was the most common retail store with 9
out of 12 respondents thinking that City Gross it to large-sized. Some of the
respondents mean that they rather go to smaller retail stores that have a good
product range, rather then to City Gross because of the large size. They are aware
of the fact that City Gross have a good and wide range, but they do not want to go
and purchase groceries for more then necessary. 34 respondents mentioned that
the products were the reason, and Lidl was selected 29 out of 34 times. The
respondents that selected products mean for example that it could be undesirable
brands that they are not familiar with and do not trust. Many respondents want
Swedish brands they know from before and having a hard time implement new
products that they have never tried before. 6 out of 6 mentioned HR policy
together with Lidl as a main reason. HR-policy is the way they treated their
employees and customer choose not to purchase because they think that Lidl
treats their staff wrong.
The most common factors that were mentioned by 55 times were product range,
where Lidl is representing 42 out of them. A negative product range is the main
reason for customers to deselect a retail store, it depends that the retail store does
not have neither a broad or a wide product range and the customers do not feel
that they are will find everything that they are looking for. It is more time-
consuming for a respondent to visit several stores to find everything on the
grocery-list, rather then go to own specific store they know have everything or
anyhow the most in their product range. Last it reputation that was mentioned 9
times, and Lidl is representing 7 of them. A bad reputation is hard to define what
the respondents said, but the claimed that with a bad reputation the customers
have to be convinced once again to erase the bad reputation into something good.
4.4 QUALITATIVE INVESTIGATION – INTERVIEWS
The qualitative interview contains of five in-depth interviews with five managers
of Växjö’s large-sized retail store. The qualitative data is presented in a summary
version in three boxes below and are more detailed explained in the text. The data
is divided in three different parts. The first part is general data regarding the
67
interviewed retail stores. Second part explains retail store managers expectation of
customer perception of their store and products. The third is about retail store
managers perception of their products, product range and CSR initiative.
4.4.1 PART I – GENERAL OVERVIEW OF RETAIL STORES
Q1. THE ORGANISATION STRUCTURE
According to the retail store manager of Växjö, ICA Maxi is owned by merchants
and they decide actions that the retail store will execute. Further, Ica Maxi is
steered from a central department in Stockholm where main decision is decided
for the whole concern. Coop Extra, in contrast to Ica Maxi, is customer-owned
and democratically controlled, and the refund distributes back to the customer.
Coop Extra is steered from a central department in Stockholm. Lidl, unlike the
others, is part of a foreign owned concern. Lidl organization is a limited
partnership organization and steered from a central department in Germany. City
Gross is part of a family-owned organization and is central steered from
Hässleholm. Willy:s is owned by the concern Axfood, where the retail store chain
is a small part of the whole organization. Willy:s is centrally steered from
Gothenburg.
Q2. COMPANY POLICY
Ica Maxi: “ Be the best employer in the industry in the local area”.
Coop Extra: “Caring, honesty and innovation”
Lidl: “Diversity, fairness, no discrimination and equal rights”
City Gross: “Innovators, who dare to be different: we take social responsibility
and care about our world. Characterized by continuity and sustainability”
Willy:s: “To be Sweden’s cheapest grocery bag”
Q3. MAIN GOAL BEYOND MAKING PROFIT
Ica Maxi’s main goal beyond making profit is mainly to satisfy the customers, have
a good ranch, easy purchasing and a pleasant store environment. The manager
adds that Maxi should have a wide and deep product range whereby customers
have an opportunity to buy all they need under one roof. Further, that customer
should feel welcome during their shopping, it is important for customers to feel
noticed and for employees to put the customer in focus. Beyond making profit,
Coop Extra’s primary goal is to have satisfied customers. A manager needs to have
68
satisfied employees to get satisfied customers. Unpleasant employees are the worst
a manager can have. The main goal of Lidl is to be established and to have easy
and fast purchasing process. City Gross wants to facilitate the purchase with a
preferable price for customers, as well being a large employer, which further
support the local area. Finally, Willy:s states that their main purpose is to ensure
the Swedish inhabitants to purchase low-price food.
Q4. THE COMPANY IN TEN YEARS
Ica Maxi´s manager thinks that in ten years, Ica Maxi will have several concepts
within the retail chain, different types of stores, which is specialized to satisfy
customer. Different sizes of retail store offer different concepts. Coop Extra on
the other hand, believe that the organization are going to be more rationalized, for
example have auto-order in the colonial area and more self-service system and
better logistics overall. Further, the manager means that it probably will be an
intensive discussion in the industry regarding cash system and self-service system.
The manager of Lidl states that they will expand the organization and will be more
successful in ten years.. Their leading star is fast purchase with no line and friendly
employees. City Gross is more competitive and states that they want to overtake
markets share from their main competitors. City Gross also wants to be perceived
as number one but actually be number 2 on the market. Further, they want to be
the best employer in the area and if someone wants to work in the retail store
industry, City Gross should be the first alternative. Finally Willy:s manager states
that they will probably play the same roll as they do today but be more advanced
in the technological area. The managers also states that the future relays on how
the market will develop, if there is new actors in ten years maybe the situation will
change. Further, he thinks that the whole industry will change to a more self-
service system use; they are already now implementing self-scanning machines. He
adds that the importance of auto-orders will increase. This will lead to fewer
employees working in the store.
Q5. WHAT DISTINGUISH YOUR STORE FROM OTHER RETAIL
STORE
Ica Maxi´s manager thinks that they are more structured and organized than other
retail stores. Further, that they have a good environment, which contributes to a
great atmosphere. The manager of Coop Extra states that they perceived as more
personal than other retail stores in the industry. It is a policy to have customer

69
contact but at a genuine level and not overact the relation. Lidl are not a full range
store like many others. The manager of Lidl adds that they have many German
products which customer only can by from them. For 7 years ago, they almost had
only German brands but ever since, change their product range towards more
Swedish brands. Some of the products that were replaced with Swedish products
were later demanded from the customer whereby Lidl returned the products into
the product range. Lidl wants to have a German concept store, which will be
different from other retail stores. City Gross manager says that special product
section differentiate them from others as well as their wide range and their high
quality meat section. Willy:s states that price and simplicity makes them different
from other retail store because they only focuses being a food store and excluding
special products, which results in an easier and faster purchase. Willy:s philosophy
is easy and fast grocery shopping. Customer should get inspired during the visit.
Willy:s is more a Monday to Friday store and at ICA Maxi and City Gross,
customers spend more time and are more busy at the weekends.
Q6. CHANGES AND DEVELOPMENTS IN THE STORE TODAY
Ica Maxi is working with a better customer lap, more and better temporary batcher
offers, increasing fresh food and locally produced products. The manager states
that trend goes towards a more manual system process of food, especially for
vegetable, fruits, meat and delicately. The delicacy disappeared in retail stores a few
years ago but is now making a comeback. The manager thinks that customer want
to have the opportunity to buy over counter but seldom buys products from the
deli, the same stands for ecological products. All customers want ecological
products to exist in the product range but many rarely purchase it. Coop Extra are
working with more self-owned brands where the margin control can be higher as
well as extend opening hours for increased availability. Coop Extra should always
be perceived as available for the customers. The manager of Lidl state that during
the last 7 years, they have changed from German products to more Swedish
products. Further, Lidl have improved their cash system, as well putting more
focus on the store environment. Further, more self-owned brands, better product
transport and implementing more of the Swedish brands. City Gross are getting
more personal and focusing on more manual selling such as fish, bakery, florists
and café in the store. City Gross puts special effort into the meat section, they are
the only one who meat butchering by them. Willy:s are processing to wide its

70
range and generally improving their product range. Right now Willy:s puts much
effort in reducing costs in their store drift by reducing employee and sell costs.
They have also implemented environmentally certified products and are now
environmentally certified.

71
Table 23: Summarized table of the general overview of the retail stores
Retail stores Retail 4 City Gross
Retail 2 Coop Extra
Retail 1 Ica Maxi
Retail 3 Lidl
Retail 5 Willy:s
Q1: The organisation structure
Family owned by Bergendahls Steered by central department in Hässleholm
Owned by its customers. Steered by central department in Stockholm
Run by merchants. Steered by central department in Stockholm
Limited partnership Steered from Germany
Owns by listed Axfood Steered by central department in Gothenburg
Q2: Company policy
Innovators who dare to be different; we take social responsibility and care about our world. Characterized by continuity and sustainability
Caring, honesty and innovation
Be the best employer in the industry in the local area
Diversity, fairness, no discrimination, equal rights
To be Sweden’s cheapest grocery bag
Q3: Main goal - beyond making profit
Facilitate for the customers to purchase, to be a large employer and support the area
Satisfied staff = satisfied customers
The customer, have a good ranch, easy to purchase, nice environment
Establishment, fast and easy purchase
Ensure the Swedish inhabitants to purchase cheap food
Q4: The company in ten years
To overtake market shares from our main competitors Be perceived as number 1 but be number 2 in the industry
Be more efficient and rationalize more, auto order in the colonial area. More self-service systems and better logistics
Create more concepts within the retail chain
Expand the organisation Being more successful
Play the same role in the market as today. Advanced in the technological area. It depends if new actors will enter the market. The work process will be changed to more self-service systems
Q5: What distinguish your store from other retail chains?
Large special department, wide ranch and good meat section
A little bit more personal than others
Structure and manners. Good environment and great atmosphere
A little bit odd with foreign products, but we are changing more against Swedish brands also
Price and simplicity. Easy purchase, and exclusively a food store, no special products
Q6: Changes and developments in the store
More personal, more manual selling like fish, bakery, florists, café in the store, floor renovation
Self own brands that will control the margins, opening hours (availability), maintenance
Better customer lap, more and better temporary batches offers, more fresh food based, more locally produced
The cash system, aware of environment, more self owned brands, product transport, more Swedish brands, fair trade coffee
Wider ranch, much focus on store drift regarding reduced employee and sell costs, recent environmentally certified
72
4.4.2. PART II – CUSTOMERS’ PERCEPTION
Q1. MANAGERS’ EXPECTATIONS OF CUSTOMERS PERCEPTION
OF THEIR STORE
The manager of Ica Maxi expects customer to perceive their store as a wide range
store. When Ica Maxi have looked at customers price experience, they could see
that they where perceived more expensive than they actually are. According to the
manager of Ica Maxi, it is probably because the store perceives as much more
expensive when they have a large sized vegetables and fruit department and fresh
food range. The manager ads that customer perceives the premium products more
than the low-priced products and this can further affect the price experience.
Further, as a well-managed store, gives an organized and unitary impression. The
manager of Coop Extra thinks that their store perceives more personal than others
and their customer service is better. They want to be perceived with high quality
and wide range and not as a low-priced retail store. Lidl on the other hand believe
they are perceived as a low-priced retail store with quality conscious. Customer
often gives positive feedback about the quality of the products. On the other
hand, Lidl states that they probably are perceived as a retail store with limited
capacity. The manager wishes that the store had at least 1000 more products. City
Gross believed that they generally have satisfied customers, further are noticed by
their exclusive meat and wide range and perceives as a store providing everything.
Willy:s thinks they perceives as the cheapest retail store in town and have a
complete range. They also believe that the customer have noticed their
modernization during the last years.
Q2. DIFFERENCE IN CUSTOMERS PURCHASE BEHAVIOUR
Ica Maxi thinks that the customer changes their demand to more semi-
manufactured food rather than origin of raw materials. The manager ads that the
consumption of semi-manufactured food is a result of people getting more
stressed. Further, both men and women works today and have less time for
cooking and grocery shopping. The manager of Coop Extra means that it is a big
difference between customers purchase behavior now compared to before. The
food is much cheaper than before which makes the customer buy more semi-
manufactured food as well as more fast food and restaurant food. He further
states that Coop Extra is today loosing market shares towards fast food
restaurants. He believed that in the future, Coop Extra would offer fast food
alternatives. Lidl states that during recession, customers spend less money at

73
unnecessary purchases. City Gross means that the purchases have changed to
grocery bag segment where complete meals for a week are prepared. The manager
of City Gross means that there are still much to improve and develop within the
segment, for example to simplify customers’ meals planning. Today, Swedish
people are really bad at variety their meals. A household rotates between 9-11
different meals. At the same time, the food interest is increasing, City Gross have
never sold so many cooking books, it have never been so many cooking programs
at TV and the discussion have never been so intense regarding what customers eat.
The manager of City Gross means that stress probably influences this trend,
people are activating themselves much more today. Willy:s have seen a tendency
that customers are moving more towards fast cooking during Monday until Friday
and more advanced meals during the weekends. They also stated that fresh
produced products have increased especially during the weekends. Semi-structured
products and fast food increasing more and more at the same time as the customer
demands fresh food and replacing canned food.
Q3. CUSTOMERS’ PERCEPTION OF PRODUCTS
Ica Maxi believes that their products are perceived more expensive than they
actually are. Coop Extra on the other hand think that their products are perceived
as high quality products, widest in the ecological products section and famous for
their self owned ecological brand Änglamark. Coop Extra states that they generally
sell more ecological and premium products than their competitors. They believe
that they have more conscious customers than the other retail stores, which
consider quality before price. Lidl thinks that the customers perceived them as a
store with limited supply with few products in every category but with low priced
products with quality features. City Gross expect their customer to perceive them
as specialized in many areas. For example that they have meat counter, café,
bakery, florist and have a wide product range. Overall perceived as a high quality
store rather than a low-priced store. The manager believes that their customers
have a higher income in relation to their competitors. City Gross in Växjö is not
that good at selling low-priced products. Willy:s thinks that the customers are
aware that Willy:s provides the same products as the other more expensive retail
store in the industry.

74
Table 24: Summarized table of the customers’ perception
4.4.3. PART III – PRODUCTS AND RANGE
Q1. IMPROVEMENT AND DEVELOPMENT OF PRODUCT
RANGE
City Gross central department steer the products and professional development
and decides which product will be launched and implemented. Though, the
local stores have some local power over product implementation, local store
can decide some improvement or changes in the store. Coop Extra means that
the fruit and vegetable department have been improved, now they sell all types
of fruits all year around. Ica Maxi and City Gross states that their central
department steer their product supply and launched products. Lidl are also
steered from a central department in Germany. They add that more ecological
and fair-trade alternatives are implemented. Willy:s as the other are steered by
the central department, where they work with NKI (Satisfied customer index),
which investigate the customers’ demand and what products should be tested
and launched in the store.
Retail stores Retail 4 City Gross
Retail 2 Coop Extra
Retail 1 Ica Maxi
Retail 3 Lidl
Retail 5 Willy:s
Q1: Consumers’ perception of the store
Satisfied customers, exclusive meat, wide ranch
More personal, stand out in customer-service, we want to be perceived as the bigger retail stores
Wide ranch, perceived more expensive than what it actually are. Well-managed and perceived as unitary
Low-priced retail store, quality conscious
Cheapest retail store in town. Complete range. Modernized the last years
Q2: Differences in consumers’ purchase behavior
Grocery-bag segment, selling complete meals
The food is much cheaper than before. More semi-manufactured food, more fast food and restaurant food
We are moving more and more towards semi-manufactured food rather than origin of raw materials
While regression customers spend less money at unnecessary purchases. Even at our store, customer purchase anyway
Powerful change against faster cooking in the week and more advanced in weekends. Increase of fresh products
Q3: Consumers perception of the products
More manual levels like meat counter, café, bakery, florist, manual, wide ranch.
High quality, Änglamark, much ecological food, more conscious customers
Wide ranch, perceives more expensive than we are
Limited supply, runs from central department, few product in every category
Our customer has such a good knowledge to know that we sell the same products as the other retail stores in the industry.

75
Q2. PROVIDES DIFFERENT ALTERNATIVES IN THE SAME
PRODUCT RANGE
City Gross provide products in different price ranges. First, low priced
products where their house brand Budget is represented. Budget should not be
the cheapest alternative in the store, but be placed in the same category. City
Gross have just recently started to offer house brands alternative in the middle-
priced section. Favorite is there house brand, which is high quality to a
reasonable price. Last, they offer plenty of premium alternatives but have not a
house brand alternative in this category. The manager of Coop Extra states
that it is important that customer have opportunity to find everything they need
in the store. As City Gross, Coop Extra have three different price categories
and own house brands in every category. Extra (low-priced), Prima (middle
priced) and Premium (exclusive) and they are represented in every product
segment. Änglamark is ecological and environmental certified brand, which
gives the customer chance to be environmental conscious. Ica Maxi states that
they can provide an alternative in every product range. They can provide a low-
priced, middle-priced and luxury priced alternatives. The manager of Lidl states
that they have a limited product range but they can offer an alternative in every
product range. Lidl have not 23 alternatives in every product category instead
they have 4 different alternatives. They offer their own house brands and then a
market-leading brand and further provide it in almost every range. Willy:s
manager states that they have both wide and depth in their product range. The
fresh food section has expanded and the store is also putting a lot more focus
on that section.
Q3. HOW REGULATION AFFECT IMPLEMENTIONS OF NEW
PRODUCTS
The manager of City Gross means that overall, the law regulation is good and
does not limit them so much. Further, the industry needs to have clear rules
about food treatment. He ads that it is important that the provided products
are good quality, as the store can be proud of. City Gross does not sell anything
from the black list; they have agreed to implement stricter policies regarding
those products. The central department of Coop Extra treats this kind of
questions. To follow the regulation from the government, Coop Extra ensure
that the requirements are fulfilled by the suppliers both with nationally and
locally suppliers. Ica Maxi has a computerized control system so that the

76
regulations can be followed. Regarding black listed products, the manager
means that it is an ethical question and that opinions can variety, therefore it is
important to have a policy that handles these questions. For Ica Maxi, this
policy is made from a central level where they have valued and chose position
in the subject. He adds that it is always up to the retail store in the end to
decide what they want to do; the policy from the central department is only
recommendations. Lidl means that they follow all the rules they have to follow.
The manager of Lidl states that it is crucial to have strict regulations. Lidl think
it is most important to have a zero tolerance level regarding alcohol purchasing
under 18, the same goes for red bull in 15. The central departments take
decision and food inspectors are visiting the retail store to conduct certain
check-ups. Willy:s have recently been environmentally certified which makes it
harder for Willy:s to satisfy customers demand together with regulations. If no
regulations exists, Willy:s decisions are based on customers opinions.
Q4. SPECIAL REQUIREMENTS FOR NEW PRODUCTS
The central department of City Gross takes decisions regarding new products
implementations. At a local level, City Gross can comment and give
suggestions to the central department and affect the launch of new products.
Generally, there is a trend for locally produced products. City Gross does not
sell anything from the “black list”. Many customers request about certain
products, but City Gross have a policy against black listed food. Coop Extra
means that new products have the same requirements as all of the other. The
health and environment inspector have to approve them. Coop Extra
implementation of new products is also organized at a central level, though; the
manager controls the local suppliers. The manager of Ica Maxi states that they
use different process regarding the situation. If Ica Maxi does not provide the
products, the process is more regulated. The manager of Lidl states that a food
inspector decides what the retail store can or cannot sell the food inspector
might introduce new guidelines, which have to be taking into consideration in
decision-making process. Willy:s manager state that some products are missing
any regulations. In those cases, Willy:s make their own ethical decisions based
on the customers’ opinions. They feel that this will contribute to the
environment of the society and they have an environmentally position at
Axfood which controls those parts.
77
Q5. SOCIAL RESPONSIBILITY
City Gross have CSR activities both from a local and a central level. At a
central level, they operate “Latvia project” where City Gross donates food and
money to orphans in Latvia. At local level, City Gross managing a local project
named “Old fellow” where the churches in town donate food to homeless
people. Furthermore, City Gross supports organization such as RIA
(organization for homeless and alcoholic people), Blenda (organization for
abused women) and different sport clubs. The manager adds that the believe
in customers attention regarding City Gross charity process is nothing they are
aware of, but it is not the point for City Gross. It is mainly for relieve their
conscious by supporting our environment. Coop Extra are also engaging
themselves in CSR-activities, the most implemented and expanded project is
“Coop without borders” which has been in progress for many years. They
donate money for each sold plastic bag and the collected money are creating
new threes. Just recently, they have implemented new recycle systems for can
and plastic bottles, where the customer can chose to donate the money to
better cause. Coop Extra also supports an aid agency called “Save the
children”. The manager of Ica Maxi means that it is much social responsibility
to take in considers, what to do and not to do. One of them is using recycling
system. For some years ago they implemented an “eat soon” system where
products with short expiration date gets a reduced price in ambition to reduce
wastage. Finally the manager said, “We have a whole program where we try to
live up to the societies expectations” and they operate both on a local and
national level. Lidl manager states that they take a local social responsibility by
accepting interns, school children and reducing the number of paper flyers.
The employees of Lidl represent people from different ethnical backgrounds.
Lidl donates products to RIA, an organization for homeless people. Willy:s
takes social responsibility by accepting interns and people under labor training.
Willy:s manager states that they guarantee that the food is secure in the
environment in the retail store. Willy:s guarantee that no black listed fish is for
sale in the store. In contrast to the other stores Willy:s does not sponsor
money to organizations or sport clubs. The manager states that it contradicts
their business idea of supplying the lowest price. Though, they donate money
to “Save the children”.

78
Q6. CSR PRODUCTS
The manager of Willy:s claims that their ecologically product purchase are
increasing, gradually but not in a rapidly direction. There is a certain target
group that value ecologically products high, but there is no majority on those
kinds of products. Willy:s ecological product range is actually the broadest in
the business, according to an investigation designed not long ago . The only
problem is that Willy:s have been bad telling the customers about it. Price
investigations have only been done, saying that Willy:s manage to keep their
business concept with the lowest grocery bag even in the ecological product
group. If an ecological product will be introduced in the product range, it has
to be affordable as well to keep the business concept. But Willy:s are good in
ecological alternatives, the customers does not know about it. By looking at
the market shares, Coop Extra is best of ecological alternatives but that is
because they were very early with the concept and has good reputation about
being good on it. At the same time, Willy:s have a complete range but has not
got the message through.
The manager of City Gross states that there is a trend regarding locally
produced products right now, and if there are a certain product that City
Gross wants to implement in their system, it can rather be interesting locally
for the store of Växjö or nationally for all City Gross stores. The manager of
Ica Maxi states that every customer wants to have ecological alternatives in the
store, but people rarely purchase it. It is more focus on fresh good right now.
Further, the manager says that locally produced are more popular right now
rather then ecological products. Customer feels more inherence against locally
produced; one reason is because it feels better in a more healthy way when it
has not been a long transportation route. It is easy to understand! Compared
to an ecological product where the customer thinks it is more diffused and
does not know exactly what it is. Ecological products are products that have
not been sprayed with pesticides. Right now, a big focus relays on locally
produced and conduct different campaigns together with Kalmar, different
local supplier every week represented in the store. The manager of Ica Maxi
means that a negative aspect with ecological products are the fact that
customers’ associate the name with a more expensive product then the once
they use to purchase and therefore make another selection. So actually,
ecological products are a lot about psychology and what the customers
79
associate with what. When ecological products were introduced, it was much
more expensive and some how felt more exclusive. There are many times that
ecological products are more expensive then others, but the difference have
reduced a lot during the past years and it is not so big difference any more.
The manager of Ica Maxi told a good example of an old situation whereby the
same psychological aspect occurred. There were a product that was gluten free
and the brand pronounces that very clearly on the package. It ended up that
the supplier had to remade the layout on the package and reduces the size of
the text because every customer that was not gluten allergic did not bought the
product just because. And the fact was just the normal product, but they
pronounced the gluten free aspect more for a negative aspect. The manager of
Lidl states that the ecologically products in the product range are the Swedish
brands, for example the milk is locally produced. There are customers’ asking
for it, but in the other way, customers’ knows that Lidl is German with
German products and have more and more implemented a Swedish products.
The reason why Lidl can keep low prices is because the orders consist of big
quantities. The manager of Lidl is not so aware about the locally produced
process within Lidl, because it is steered from Germany. Further, Lidl have the
environment more and more in their thoughts, Fair trade have increased
within the product range and today there are about 5-6 different products. Lidl
have also some ecological alternatives, the frozen food have increased during
the last years. The manager of Lidl thinks that the ecological range is being
improved and develops all the time. Lidl is today more aware about the impact
on the environment and care about the animal treatment. Fresh food like
vegetables are something that Lidl are increasing today compared with the
years before.

80
Retail store Retail 4 City Gross
Retail 2 Coop Extra
Retail 1 Ica Maxi
Retail 3 Lidl
Retail 5 Willy’s
Q1: Improvement & development of product range
We have a central department for product and professional development; we have local opinions that can impact
Fruit & vegetables have developed, now available all year around
Much steered from central department, suppliers provide product news
Yes, but it is steered rom central department. More ecological and fair-trade alternative, also ecological vegetables
Central department, we work a lot with NKI (Satisfied customer index) what is in demand, trying different new products
Q2: Provides different alternatives in the same product range
Different brands: Budget, then house-brands, Favorit, brand products and last premium
Yes, three different categories; Extra, Coop Prima and Änglamark. In practically every range. A customer should be able to buy ecological if they want to.
We can provide different alternatives in basically every product range; we provide a cheap, in between and a little more expensive alternative.
We do not have the widest product range, but we have alternative in every product range. We have our own brands and a market-leading brand.
Yes, both width and depth, width is the amount of different product categories and depth is different alternatives within same product category. Both market-leaders and our own brands.
Q3: How regulation affect implement of new products
Law regulation over all is good; we need to have clear rules about food handling, with high quality. It is very strict rules about expiration date.
We always have Coop to trust. When it comes to chemicals, it is hardly restricted. Coop conducts every control with suppliers. We also work with local suppliers.
Strict rules what we can and can’t do, not least the fresh food; everything is computerized with regular cleaning.
We follow every rule that needs to be followed. If we are not allowed to sell, we follow the rules. This is steered from central department. Food inspection visits us and makes controls.
Willy:s have recent became environmentally certified which means that it is hard to meat customers demand against regulations. Sometimes there is no regulation; we take our decision based on customers’ opinions.
Q4: Special requirements for new products
Steered from a central department. We do not sell any thing from the “black list”. Many customers request about certain products, but we have a policy to not sell that kind of food.
Steered from a central department regarding implementation of new products. Have to be approved from environmental inspector,
Different processes depending on if ICA provides it or not, otherwise it is more regulated.
Food inspector, they might introduce new guidelines but we change the store after that, zero tolerance selling alcohol to people younger then 18, redbull 15 years old.
Sometimes it is not regulated; we make our own ethical decisions based on the customers’ opinions. Such a large retail store wants to do our bit to help. Axfood conduct an environment manager.

81
Q5: Social responsibility
Project both centrally and locally, Centrally project “Latvia project” about donates food and money to an orphanage in Latvia. Locally project “Old Fellow” and churches in town where we donate food to homeless people. We are helping companies like Ria, Blenda and sports clubs.
“Coop without borders”, collects money on every plastic bag. Money goes to plant new trees. We have done that for a long time. Also recycle cans, a bottom to donate money, Coop has a aid agency beyond “Save the children”
Recycling, “eat once” is products with short expiration date that we lower the price to reduce the wastage. We have a whole program were we try to live up to society’s expectations.
We receive trainees, school children, reduce free flyers, mixing employees with different ethnical background, donate products to Ria (homeless organization),
Recycling, we guarantee that the food is secure in our environment. We guarantee no black listed fish, we receive trainees, we guarantee safety inspections, watch the working environment, employee feels safe. No sponsorship, it contradicts our business idea supplying the lowest price. Chariy to “Save the children”
Q6: CSR-products
Think more it is a trend of locally produced rather than ecological products.
We provide ecological product in every category. Our house brand Änglamark is very established. We are best at selling ecological products. We have more environmental conscious customer than other retail stores.
Its increasing and are getting less expensive. If more people buy it, it will be cheaper. There are people who reject a product just because its ecological, they associate it with expensive. Locally produced products are increasing more.
We are more aware of the environment and animal treatment. Fair trade and ecological are increasing more, especially ecological vegetables. We care more about the environment; we have at least 5-6 products of fair trade and some ecological alternatives.
It´s not in a peak, but it slowly increasing. There are a percentage of the target group which buys ecological, environmental and ecological products but not the majority
Table 25: Summarized table of the products and range

82
5. ANALYSIS The analysis will illustrate the result from the empirical investigations what will be argued from
selected theories. The analysis will be divided in three different parts: The first part will describe
Gap 1, the second part will describe Gap 2.
Figure 7: CSR model created by the researchers
5.1 CUSTOMER AWARENESS VERSUS RETAILSTORES EXPECTATIONS
This part of the thesis will explain the gap between the customers’ attitudes and
knowledge regarding retail stores social responsibility and retail stores expectation
of customers’ attitudes and knowledge of their CSR initiatives. First, the
customers’ attitudes and knowledge of retail stores CSR-initiative will be
presented. Second, retail store managers’ expectations on customers’ attitudes and
knowledge regarding CSR. Finally, a comparing part of customer’s attitude and
retail stores expectation will present differences and similarities and the gap
between those two.
5.1.1 CUSTOMERS’ ATTITUDES AND KNOWLEDGE REGARDING CSR
Customers attitude regarding the importance of social responsibility Brown &
Dacin (1997), Mohr & Webb (2005), Sen & Bhattacharya (2001) studies show that
customer take CSR into account when they evaluating companies. This study
shows the majority of the respondents believe that it is important for retail store to
take social responsibility. Though, only 2 % answered that social responsibility was
a crucial factor in choice of retail store. On the other hand one-third answered
“No opinion”, “less important” or “not important at all”. This can indicate that

83
the majority thinks social responsibility is important but still not essential enough
to affect choice of retail store. In contrast, one third thinks social responsibility is
overrated and do not care if retail stores take social responsibility or not. Existing
theory states that even if the customer support for CSR is relative high, there are
customer which have criticism against CSR-activities, that believes CSR are only
for business and not for a honest good cause (Mac Williams & Siegel, 2001). Even
though existing theory (Carrigan & Attila; Maignan, 2001) means customer have
become more aware of CSR this study shows that there are still a relative
pronounced number of respondents that do not have an opinion regarding retail
stores obligation of CSR activities. The high number of “No opinion” initiates a
relative high percentage of customers, which could be unaware of the meaning of
social responsibility. Further, maybe social responsibility is not implemented
enough to make all customers aware of what social responsibility actually stands
for.
Öberseder et al (2011) states that customer generally value CSR activities based on
their personal interest, according to their own personal moral, values and
priorities. From a gender perspective, more women than men think that social
responsibility is important. Male respondents attitude concerning CSR are more
spread then women. The women either think it is important or claims that they
does not have an opinion. This can indicate to that men have a more negative
attitude towards social responsibility. Either they do not care or do not think it´s
important for them regarding choice of retail store. It may be as Mac Williams &
Siegel, 2001 theory mention before; men are more skeptics of retail stores motives
of their CSR initiatives. Women on the other hand are more positive towards
retail store taking social responsibility. They value and take social responsibility
action into consideration in choice of retail store.
There are differences between age groups in attitude towards retail stores
obligation of take social responsibility. Older customers think it´s more important
for retail store to take social responsibility. Further, young customer thinks that
social responsibility is more important then the younger middle aged customers.
Younger customers attend to live by themselves or in a household with two
persons. Compared to the younger middle age customers, which more often are 3-
4 members within the household. Middle age and seniors think also CSR is more

84
important than young middle age. It can be that middle age people around 46-62,
most likely have older or even grown up children that does not have to be
supplied in the same manner as young children. This can indicate that older
customers may have better capacity to take social responsibility into consideration
in the choice of retail store. The importance of retail store taking social
responsibility can also depend on which economical and civil status the customer
has in a certain age group. Another important aspect to take in consider customers
time capacity, the most of the young middle age customers have probably less time
in relation to the other customers. The more time a customer have to care and to
dispose, the more time they can spend on reflecting the importance of social
responsibility. The majority of customers with no opinion are young adults even
though they are the customer group with most awareness. It maybe is because
young customer can be considering as new customers in retail stores. They could
newly moved to an own home, which means that they have recently started to
purchase their own food. Young adults may purchase the same products as were
purchased in their family home, and no new approaches can impact in such an
early stage. More importantly young age customer have probably low income with
results in that they do not prioritize CSR even if they are aware of what CSR is.
Middle age and senior tend to be more certain in their opinions regarding retail
stores obligation to take social responsibility.. Older customers has likely older
children or consists of households with 1-2 members who give them more time
and money to consider social responsibility and at the same time having an
economical support for acting on it. Young middle customers are probably the
customer group with least amount of time and limited financial resources where
many have young children to take care of while they work full time. This can affect
that they does not take into account or puts weight in retail stores taking social
responsibility or not, because they do not have the same conditions.
Regarding the influence of income in different attitudes towards CSR, customer
with higher income seems to appreciative social responsibility more. Customers
with low income seem to be more neutral to CSR. Almost half of them have no
opinion regarding the importance of CSR. This support previous theory
(Öberseder et.al (2011)), means that customers income affects a customers
perception of the importance of CSR and that the customers price perception in
relation to their income influence a person’s ability to take CSR into account.

85
5.1.2 CUSTOMERS’ AWARENESS OF CSR PRODUCTS
Carrigan & Attlia 2001, Maignan 2001 states that during the last decades
customers have become more aware of CSR. This study’s results support previous
research, almost all of the respondents are aware of CSR –products. Only a tenth
of customer’s do not know what ecological and environmental products are. Most
of customers which are aware of CSR-products thinks it is important for retail
store to provide them but not essential. Many of those think it is important mainly
because other customers should have the opportunity to purchase them. Only a
few customers believe it is crucial in the decision of retail store. This indicates that
in general, customers have a positive attitude towards CSR products and think
they have important attributes. Even though, a fifth of customers, who are aware
of CSR-products, do not think CSR products are important for retail store to
provide. This shows that it is a significant part of customers, which have a
negative attitude towards CSR-products, or do not care if retail store provide
them.
From a gender perspective, there are more women that think CSR-product is
important in relation to men. By customer who thinks CSR is important 67,9% of
them are women and only 32% of them are men. There are also more men that
are neutral towards CSR than woman. By customer who has no opinion regarding
the importance of CSR only 28,6% represented women compared to 71,4%
represented men. As a conclusion more men than woman are negative towards
CSR, they think CSR is less important or do not care about CSR product..
5.1.3 RETAIL STORES EXEPTATION OF CUSTOMERS ATTITUDE AND KNOWLEDE OF CSR
Retail stores expectations of customers’ attitudes about retail store
obligation to take social responsibility
Hartmann (2011) states that CSR have developed to be one of the top priorities of
business and was ranked 2011 as the number one focus of manager in the global
retail store industry. Comparing this statement with this study’s qualitative
empirical data the results shows that retail store priorities CSR less. When
managers’ were asked how customers’ perceive their store, social responsibility
was mentioned very vague. The activities of corporate social responsibility do not
come naturally on speech. Instead, the manager believes that customer’s primary
demand product quality, a broad product range and price. Even though, the

86
manager states that customers’ purchase more fruits and vegetables and the
demand for fresh food increases, which indirect could include ecological and fair
trade products. However, a number of retail stores states that customers’ purchase
more semi-manufactured and fast food. The retail stores believes that people get
more stressed and adds less time on food during the week days and are a
underlying factor to why semi-manufactured food increasing more powerful.
Today, both man and woman are working and have less time over for cooking,
which results in an increased demand of fast and simple food solutions. At the
same time, the food are cheaper today compared with before, which allows
customers’ to have the opportunity to purchase what ever they want, i.e. restaurant
food and semi-manufactured food does not become a matter of price. Unlike, the
manager states that customers’ cares about food content, purchase more cooking
books and never have so many food shows been on television. One manager
mentions that a difference can be seen on the weekends when people are
purchasing with more awareness and more fresh food. This can initiative that time
has a crucial factor in the degree of customers’ ability to consider social
responsibility in their choice of retail store and food purchasing. Another manager
states that under recession, people spend less money on food and on unnecessarily
purchase and do not prioritize CSR-products.
One manager states that it believed that they have more aware customers’
compared to their competitors. That there customers’ have a better economy and
are more environmentally aware and at the same time less price- sensitive. Further,
they sell more ecological products then any other retail store and their customers’
consider quality before price. This store may use CSR-initiative as segmentation in
the market; while another has low-price to differentiate them they use CSR-
product and high quality. Existing theory (McWilliams & Siegel, 2001) states that
there are organizations today which incorporate CSR into their marketing
strategies, to differentiate from their competitors to create new demand or to
command premium prices for existing products.
This study support previous research (Kihlberg and Risvik, 2007), many
customers’ consider CSR products as a premium product, a more exclusive and
expensive product. One manager claims that there are even customers’ that
deselect ecological products due to the fact that it is ecological products.
Customers’ associate ecological products with exclusive product and deselect just

87
because of that. At the same time, one-manager states that ecological and
environmentally certified products increasing, which also contributes to a lower
price. There is still a crucial margin down to ordinary products. The managers’ also
indicates that customers’ purchase on old habits, much because of stress and limit
of time. There can be a logical explanation as Lea and Worsley (2005) states the
limited supply of ecological products in relation to traditional products affecting
the customer’s purchase towards traditional products. This can explain the
statement said by one manager (which is supported by Perrini et al, 2009 survey),
many customers’ believes that CSR products are important and wants to purchase
them, but in practice they do not. Customers’ want CSR products to be available
in the store as an alternative, but are not something that they naturally buy.
5.1.4 GAP 1 - BETWEEN CUSTOMERS KNOWLEDGE AND RETAIL STORES EXPECTATIONS
Generally, there are considerably more similarities rather then differences between
customers attitudes towards retail stores CSR initiatives and retail stores
expectations of customers perception of their CSR initiatives. Even though, there
are some gaps between customer and retail stores. First retail stores believes
customer getting more stressed and that the purchasing of semi structured
products, fast food and restaurant food are increasing and have no time to
prioritize the retail stores CSR initiatives. In practice most of the customer are
aware of retail stores CSR initiatives but to a limited amount. Customers are aware
of CSR-products existents but rarely know what their stand for. Second the retail
stores expect customers to mainly prioritize quality and price, and that CSR
products are unimportant. At the same time retail stores expect customers to
purchase CSR products more than before. In practice customers think as retail
store expect, price and quality are the main factors in their purchase. Although,
customers believe CSR products are important for retail stores to provide, but
mainly because other customer should have the opportunity to by them. Third,
retail store manager expect customer to perceive CSR-products as to expensive
and that they customers purchase after habit, where CSR-products are not
included. In reality customers thinks CSR products is good but expensive. There
is also a customer group, which do not believe in the CSR concept at all.
5.1.5. CUSTOMERS ACTUAL ENGAGEMENT/PURCHASE OF CSR- INITIATIVES
CSR importance in choice of retail store

88
Brown & Dacin (1997), Mohr & Webb (2005), Sen & Bhattacharya (2001) studies
show that customer take CSR into account when they evaluating companies. In
contradictory this study results shows that customers’ values and prioritize CSR
very low compared to other factors. Most of the customers mainly selects retail
store after the retail stores location. Further, factors like product range, price,
product quality, fast purchase, staff and habit are mentioned more often then CSR
initiatives and products. However, it could be that CSR factors are indirect
affecting the crucial importance of product quality, product range, staff and so
forth. Previous research reveals that companies that actively support CSR are
more reliable and have higher quality (McWilliams & Siegel, 2001). Only 4 %
customer’s states that CSR products are crucial for retail store to provide. This
signpost that a small target group of customers think CSR implement and their
products are crucial in the choice of retail store. Even though it could be perceived
as a relative low number of respondents, it´s complement previous research quite
well, which say that 2 % of the global sales consist CSR products (FAO, 2008).
Existing theory states that responsible organizations has the potential to influence
a number of customers’ related outcomes such as loyalty, product consideration,
company and product evaluation, purchase intention and willingness to pay
(Hartmann, 2011). By comparing these with the numbers regarding how
customers have grade their preferable retail store, the result shows that customers
properly have low awareness or do not care about CSR activities (charity activities,
ecological and environmental products). The majority (63%) has no opinion about
retail stores charity activities. Previous research states that companies, which are
donating a percentage of sales, is less effective than for example employee
volunteerism (Creyer and Ross, 1996). This can explain the low numbers, many of
the stores provides this kind of donations. On the other hand Menin & Kahn
(2003) study shows that customer are more likely to support organizations that
donate a percentage of sales when it´s compared to support a social issue with no
explicit request of purchase. This study shows that customer don´t care if their
retail store provides charity or not as long as the retail store have reasonable prices
and good quality. Sadly the results don´t show in which extend they would support
the retail stores charity activities.

89
More than a third of customers have no opinion regarding ecological and
environmental products. Though, in relation only 2 % have no opinion regarding
price and quality. Regarding important factors for a retail store to offer, quality and
price is highly prioritized, therefore customer should per automatic have better
awareness of these products comparing too CSR-products which they priorities
remarkable low. Customers do not think that the preferable retail stores have great
CSR initiatives in retail stores. Almost no customer believes that the preferable
retail have very good charity, ecological or environmental supply. This supports
previous statement that customer is not aware or do not prioritize CSR activities.
Previous studies shows that customer’s response to CSR depends on how the CSR
is manifested. Even though none of the CSR factor is prioritized, it seems to be
that environmental and ecological products that influence the customer most and
charity least.
Non-preferable stores and customers CSR-perception
Customer avoid going to retail stores mainly because of undesirable product range,
either-because of lack of quality or limited alternatives in the product range.
Customers also dismiss retail stores if they perceive the store to be disorganized,
large sized, questioned HR-policy, unfriendly staff or bad reputation in general.
The result shows there is particular one retail store that customers dismissed.
Where the customer criticized hard in all of the mentioned factors expect to be a
large sized store. Existing theory means people have a strong opinion on what
they eat and that they have requirements regarding quality of products,
environmental condition and social such as labor conditions (Maloni & Brown
(2006). This research supports that quality are an important factor but have no
supporting results regarding the importance of environment condition, if the
stores organization structure are not included. There are also uncertain how much
the non-preferable retail stores CSR initiatives affect the customers opinion,
though respondents care about retail stores labor conditions of their employees.
Previous research means that negative CSR information has much stronger effect
on the customer evaluation than positive news (Brown and Dacin 1997; Marin and
Ruiz 2007: Sen and Bhattacharya 2001). In this study can partly agree but at the
same time there are also other factors that influence more. As mention before it
could certainly be that retail stores lack of CSR initiatives affects customers

90
judgment and perceive retail store negative after missing CSR communication
from the retail store.
CSR –products importance in relation to other products
Theories argue the importance of CSR in customer’s purchase decision, e.g. Morh
and Webb (2005), Sen & Bhattacharya (2001) states that CSR affects the
customers purchase decision and that customers take CSR initiative into
consideration when they evaluate product. Green & Peloza (2011) on the other
hand mean that CSR initiative only plays a minor roll in customers purchase
decision. This study shows that when the respondents’ had to choose the factors
that influence the purchase of products, the study detect that CSR products was
particularly low prioritized in comparison with traditional products. Instead, the
customers’ believed that quality were the most important factor and then product
quality and low-price. The result from the empirical investigation also shows that
locally produced products are being more prioritized then environmentally
certified and ecological alternatives. Customers’ care least about fair trade
products.
Reasons for purchasing CSR-products
Despite of the fact that CSR products where not the main products that
customers’ demands, it is two-thirds of the respondents that actually purchase
CSR products. Customer which purchase CSR products often only purchase them
once in a while, especially when it feels affordable. Existing theory states in order
to support organization with CSR initiatives, customers must receive value in
exchange (Öberseder et al. 2011). This study shows three different types of
customer groups of CSR products. Group one; purchase CSR products in order to
take social responsibility to society and its environment. Group one represent the
majority of the respondents, this demonstrates that customers mainly purchase
CSR products to take social responsibility to society and environment. Group 2
purchases CSR products because of quality. As previous theory confirms
(McWilliams & Siegel, 2001) many customers perceive CSR products as high
quality and tastier. Other respondents purchase CSR product because they believe
that CSR products are healthier than traditional products. Group number 2
represent one-third of the customers and purchase CSR products for personal
gain. Last, group number 3 purchase CSR products without any certain reason.

91
This customer group represents a very small part (about a tenth of the total
sample). The results support previous theories (Padel & Foster, 2005: Honkanen
et al, 2006, Perrini et al, 2009), which states that there are two main reasons for
customer to buy CSR-products, personal benefits and public benefits.
Furthermore, this study shows that public benefit is the main reason and that
private benefit is the second reason for buying CSR-products. Moreover, a minor
customer group buys CSR products for no particular reason.
Reasons for not purchasing CSR-products
As existing theory states there are reasons affecting customers interest of buying
CSR products, primary premium price and availability (Tsakiridou et al, 2008,
Kilhlberg & Risvik, 2007, Lea & Worsley, 2005). This study shows about one-third
of the respondents does not purchase CSR products. The majority of this group
believes CSR products are too expensive. A third of the customer who do not buy
CSR products does not care about CSR products and their advantage. These
customers’ could represent the respondents who answered “less important” or
“not important at all” concerning the importance for retail store to provide CSR
products. With other words, they represent customers which don´t care if
organizations take social responsibility or provide CSR-products, independent
price. In contrast to customer who believes CSR products is too expensive, where
CSR products become a matter of price. This supports Lea & Worsley (2005)
study, which presents that the limited availability of ecological products, the
ecological products are less common than traditional products and are therefore
not prioritized. This study contribute with some interesting results that there is a
customer group, which think that CSR products lacks credibility. The respondents
which believe that there are no difference between ecological and environmental
products and lacks credibility represent a fifth of customers.. It may be as theory
states that these customers are skeptic of the companies’ motives of engaging
towards CSR, that they are only for business and not for philanthropic reasons.
(Shaw & Clarke, 1999).
Customers CSR engagement/ Carroll’s pyramid
Carroll (19991) means that there are four different level of social responsibility,
economical, legal, ethical and philanthropic. If the customers of retail store would
be placed in Carroll’s pyramid, the customers can be divided into three different
groups. The first group represent active CSR purchaser, which thinks social

92
responsibility is crucial for retail stores to provide. Further they buy CSR products
for helping the society, environment and for own health. They represent a minimal
part of all customers. The second customer group is occasionally CSR purchaser.
They think social responsibility is important but they purchase or support retail
stores CSR activities rarely. When they purchase CSR –products to fit into the
social acceptable manner and feel that they have contribute to society. This
customer group represent majority of all customers. Third and last, customer
group represent non-CSR purchaser, who don´t care about retail stores CSR
initiatives. They think retails stores CSR initiatives lacks credibility or they just
don´t care. They don´t purchase any CSR products instead they prioritize price
and quality. The different customer groups are represented below. Carroll’s model
has been modified due to the fact that legal responsiveness don´t concerns
customer in the same way as for companies.
Figure 8: Modified picture of Carroll’s pyramid where the customers are positioned.
5.1.6. RETAIL STORES CSR INITIATIVES
There are distinctive indications of social awareness in the retail stores general
policies. Some of them more clear then others, but general speaking, every retail
store shows tendency of taking social responsibility. One retail store strives to be
the best employer in the local retail store industry, which definitely can be
considered having a goal with a social responsibility purpose. Another retail store
have a more diffuse statement; to be caring, honest and innovation. Even though
it can perceive as CSR relevant. The third retail store strives to be diversity, no
discrimination and equal rights as being inspired that the organization are having
values that shows responsiveness. The retail store that communicates most of CSR
initiative is the one who says that they want to be innovators and dares to be
different. Further, the policy states that they are taking an social responsibility and
Ac0ve CSR purchaser
Occa0onally CSR-‐purchaser
Non CSR-‐purchaser
Philantropical engagment
Ethical engagment
Economical engagment

93
care about a world that reflects long-term sustainability. The fifth and last policy is
about providing Sweden’s cheapest grocery bag to their customer.
Snider et.al (2003) states companies are increasing their effort in communicating
their CSR contributions. This study’s result shows that retail stores prioritize other
activities before CSR initiative. First of all, they are trying to satisfy their customers
by provide a good product range, easy purchase, good prices and an inviting
environment. Many managers point out the importance of having a pleased and
accommodating staff. One of the manager’s main goals is to be the biggest
employer in the city. Even though CSR is not the center point for retail stores
manager today, not even in relation to retail stores future. Instead most of the
retail store manager argues for efficiency in the industry, by implementing self-
service systems, auto orders and a improved logistic system. Further to expand
and taking market shares for their main competitors. Indication of CSR are very
vague, there are only one manager with a CSR perspective on the future. He wants
to be the most attractive employer.
The supply of CSR-products
According to Perrini et al. (2009) since the introduction of CSR-products in the
90-th, the supply of CSR has increased enormous. Still traditionally products
represents the majority of products in the product range and CSR products is only
a niche (FAO, 2008) As shown from the results of this study previous research
seems to be supported. Several managers’ points out that they have an increased
supply on fresh food and locally produced products. Further, they think that
customers demands increasing for a manual treatment of products, i.e. charcuterie,
quality vegetables and fruits. Most importantly they have increased their ecological
supply, retail stores have start to offer own brands in the ecological range. One
store has recently become environmentally certified and put effort on expanding
their ecological and environmental range. Another manager states that they already
today have a broad range with the environmental and ecological range. They offer
at least one CSR alternative in every product category. One retail store only
provides few ecological and environmentally alternatives. The retail store went
form offering no CSR-products to provide 6-7 different products during 7 years.
This has to be considering as an unnoticeable change. Even though the manager
believes in an increasing number of CSR products in the future. Though it seems,
that the development of own brands are more in focus then to expand the CSR

94
range. Retail store is more interesting in increasing their profit margins by
introducing their own alternatives in different product categories rather then
expand their CSR-range.
Social responsibility activities
Piacentini et al. (2000), Vogel (2006) states the pressure has increased for
companies to pay more attention to social responsibility. Companies take social,
economic and moral responsibility both from an internal and external aspect.
(Cannon, 1992). This study shows that retail stores take a quite broad social
responsibility. The level of engagement is different between the retail stores.
Generally the retail stores operates both national and local CSR activities. They
have large central projects, where they donate money to charities such as “Save the
children”. Two of the retail stores have own developed projects, which they
operate on a national level. Some of the retail stores have a recycle system where
the customer have the opportunity to donate money to “Save the children” instead
of get the refund back. Carroll (1992) states its essential that manager and
employees participate in voluntary activities within their local communities. Retail
store takes social responsibility on local level. Generally retail stores donate
money to local charities and organization for homeless people and women support
center. The retail stores also take social responsibility by accepting interns and
offer them jobs. Overall, the manager means that they have environmental and
social responsibility awareness. They have implemented recycle system and
environmental conscious waste systems and “short date” system to reduce
wastage. One retail store also supports local sports clubs and their events.
Wilkinson & Balmer (1996) states that corporations that actively working with
social responsibility appears to not communicate their social advantage to the
society. This study support previous statement, one manager states that they do
not communicate their CSR actions to society, because it is not the purpose for
the actions. Instead he means that if they say that they are honest and caring they
also have to act after it.
Retail store position in Carroll’s pyramid
The five retail stores level of CSR initiatives varies. If the retail stores are
categorized after Carroll (1991) pyramid with four different level of social
responsibility they would be placed on different level. The retail store, which could

95
be seen as taking most responsibility, is Coop Extra. Coop Extra are engaged in
both, national and local charities. They have a recycle system and are generally
environmental aware. They also offer the broadest CSR-range of the retail stores
and have their own CSR house brand Änglamark. They take social responsibility
above what the society demand and have position in the philanthropic
responsibility. City Gross would be placed closely under; they are engaged in both
national and locally charities. Further, they support sports clubs and try to
establish an attractive HR-policy together with environmental awareness above the
legal regulations. They can be also bee seen as taking corporate social
responsibility over the society’s demand, though their CSR alternatives are limited,
but slowly increasing. Then Ica Maxi would be placed under ethical responsibility.
They take social responsibility and have high environmental awareness, desirable
HR-policy both nationally and locally. They offer a wide and depth CSR-range.
They take social responsibility into account above the legal regulation Willy:s on
the other hand have just recently getting environmental certified and has
introduced more CSR products in their product range. They also donate money to
charities but do not support any local organizations. They are increasing their CSR
activities but are still some steps away from Coop Extra, City Gross and Ica Maxi.
Their main purpose is to supply customer with low prices as long as the regulation
allows. They can be categorized within the ethical position but close to legal
responsibility in Carroll´s pyramid. Lidl is the retail store with least CSR-activities.
They support local charities and are taking environmental action after what the law
requires. The only have 6-7 products with CSR features. Lidl state that if they are
going to support customers with low price alternatives they have to reduce
unnecessary costs. They can be categorized as taking legal responsibilities. Ica
Maxi and Willy:s are the most preferable stores even if they don´t take the most
social responsibility. Coop Extra which is seen as the most corporate social
responsible are placed very low in the list. This can be because most customers
might feel that their prices are too high. Even if Lidl offer low-price and thinks
they sell quality products most customer avoid purchasing in their stores. This can
indicate that regardless price and quality, the store have to reach a certain standard,
where CSR plays an influencing roll. It is a balanced between taking to much social
responsibility so the prices goes up and taking to low responsibility, where the
store is perceived as disorganized, bad employee condition and limited product
range.

96
Figure 9: Modified picture of Carroll’s pyramid where the retail stores have been positioned.
5.1.7. THE GAP 2 - CUSTOMERS ENGAGEMENT AND RETAIL
STORES CSR-INITIATIVES
There are more radical differences between customer and retail store in Gap 2
then in Gap 1. First of all, retail store are involved in charity both nationally and
locally. Even so customer do not seems notice their charities. Customer can´t
grade their most preferable retail stores charity activities. The majority of
customers have no opinion and almost no one thinks their preferable store have
good or very good charity activities. This indicates that it´s a quite large gap
between what the retail stores do and what customers perceive. Second, the retail
stores CSR initiatives vary between each store and the gap between each of them
and customers vary. Lidl have the biggest gap between what they do and how
customers engage themselves in CSR. Even though price and quality is important,
customer care of the total impression of a retail store. The retail stores CSR
initiatives plays a crucial part, as previous theory have stated, negative CSR news is
more damaging than positive for retail stores. Therefore should Lidl pay more
attention on implementing CSR activities and further communicate them to the
society. Third, customers thinks it is important for retail store to provide CSR-
products but only buys them occasionally. Retail stores are increasing their
ecological and environmental product range even though they think customers
cares most of all about price and quality.
Coop Extra
City Gross
Ica Maxi
Willy´s
Lidl
Philanthropic responsibil0es
Ethical responsibili0es
Legal responsibili0es
Economic responsibili0es

97
6. CONCLUSION In this chapter, the conclusion of the study will be presented. The conclusion will answer the
purpose and further the own reflections are presented where the researchers reflect what could have
been done different and have a critical sight against the thesis. To conclude, a presentation for
further research within the subject will also be find in this chapter.
6.1 RESULT OF THE STUDY
RQ1: What expectations regarding customers’ perception of retail stores CSR
initiatives do manager of such stores have and how do they perform CSR
activities?
RQ2: How aware are customer regarding retail stores CSR initiative and what
level of engagement do customer have concerning retail stores CSR activities?
Retail stores believes customer do not prioritize retail stores CSR product and
initiatives, instead customers are mainly focusing on quality and price.
Furthermore retail stores believe that customer is getting more stressed and the
purchasing of semi-manufacturing are increasing, instead of CSR products. Retail
store expect customers to want the alternative to purchasing CSR product but they
don´t buy them in practice. Even though, retail stores take social responsibility
and offer CSR products. The level of engagement varies between the retail stores.
In general, retail stores support charity both at national and local level, have
environmental awareness by wastage and recycling systems together with offering
several CSR products, such as environmental certified, ecological and fair trade
products.
Generally customers are aware of CSR and thinks retail stores CSR initiatives and
products are important, mostly because other customer should have the alternative
of purchasing them. Even if the knowledge is limited, most of the customers are
aware of CSR. There are three different groups of customers. First, the active CSR
purchaser that believes it´s essential for retail store to take social responsibility,
CSR-products are crucial for their purchase. Second, the occasionally CSR
purchaser that believes CSR is important but rarely purchase CSR products. They
think retail store should offer CSR-products but seldom purchase them. Finally,
the non-CSR purchaser that either does not care or thinks retail stores CSR
initiatives lacks credibility. They do not purchase CSR products because they either

98
think traditional product are as good or they don´t believe in the CSR concept in
general.
6.2 OWN REFLECTIONS
In this thesis, there are some identified aspects to take in consideration when the
investigation has come to an end and the results have been analysed. First of all, a
larger sample could have been collected in order to reach a higher level of
reliability that later could be given a stronger empirical material to analyse. What
happened in this thesis was that the respondents felt an empirical saturation where
the answers started to tell the same things and possible pattern were identified
early in the quantitative investigation. Further, the researchers felt that the
collected data was enough and that several variables within the survey were
possible to measure. Today, the researchers can admit that more collected surveys
could have been preferable because some categories are underrepresented which
could further present some distorted data.
Furthermore, the qualitative investigation was from the beginning a pre-study for
the researchers to create a better insight into the subject, both CSR initiative but
also a better insight in the daily thinking process and distribution of retail store
managers. Afterwards, the in-depth interviews gave more useful information then
believed and turned later into a qualitative investigation that gave the thesis a more
weight than before. Although, the questions in the qualitative investigation could
have been formulated in a different way that could have giving more useful
information to compare with the customer survey. In the beginning, it is hard to
know what kind of information the qualitative investigation will give and what
questions to ask. Many of the questions in the qualitative investigation are of
interesting quality, but not for this thesis and were therefore not included in the
analysis.
The six variables age, gender, household, occupation, education and income are
variables that could help the researchers in the analysis part and further discuss
how these variables are affecting the questions regarding CSR and social
responsibility. Regarding the age gender, it is hard to know in advance how old the
respondents are going to be, because of the chosen methodology. By achieving a
random selection from the population, it is hard to achieve a spread age group.
When looking at the data, age group 1 (18-30) is overrepresented in the study and
the reason is probably because Växjö city is a big student city where many students

99
lives and therefore the change to bump into a student on the random walking
roads are bigger then in an ordinary city.
6.3 FURTHER RESEARCH
First of all, a rich ground of empirical data has been conducted but more could
have been done, unfortunately both time and financial limitations put an end to
that. First of all, the innovative model created by the researchers could have been
conducted on many different ways. For one example, the three different
underlying factors under “Expected service” could have been highlighted and get a
more stringently focus. There are a lot of interesting findings to identify regarding
world of mouth, personal needs and past experience that this thesis has not been
possible to conduct a deeper investigation.
When taking a look at the produced data from SPSS, there are a lot of tables that
proved to be very interesting and showed very interesting relationship. For
example, it would be interesting to analyze the different produced numbers for
price, product range, product quality and staff and analyze them one by one and
not in relation with CSR initiative. It would also be interesting to conduct a more
deeper investigation in what kind of different CSR products that customers
purchase, how the customers chose what kind of CSR products they are
purchasing and an investigation more an a selecting products in the retail store
level. For the third, it would be interesting and as the researchers noticed
meanwhile this thesis was written, that there are a lack of knowledge and
information regarding CSR products. It would therefore be interesting to see how
suppliers work with marketing CSR products and what marketing strategies that
are the most effective and what a company should avoid when it comes to
marketing CSR products.

100
REFERENCE LIST SCIENTIFIC ARTICLES
Brown, J. T & Dacin A. P (1997) “The Company and the Product: Corporate Associations and Consumer Product Responses” Vol. 61 No 1p. 68-84
Carrigan, M. & Attalla. A., (2001) "The myth of the ethical consumer – do ethics matter in purchase behavior?" Journal of Consumer Marketing, Vol. 18 No: 7, p.560 – 57
Carroll, A. B., (1979), “A Three-dimensional Conceptual Model Of Corporate Performance” Academy of Management. Vol. 4. No 4. p. 497 505
Carroll, A. B., (1991), “The Pyramid of Corporate Social Responsibility: Toward the Moral Management of Organizational Stakeholders “ Business Horizons. Vol. 34, No. 4. p. 39-48
Chinnici G, D’Amico M, Pecorino, B. (2002). “A multivariate statistical analysis on the consumers of organic products” British Food Journal Vol. 104. No.3. p. 187–199.
Cronin, J. J., Jr. & S. A., Taylor (1992) “Measuring Service Quality: Reexamination and Extension”. Journal of Marketing. Vol. 56. No. 3. p. 55-68
De Boer J. (2003) “Sustainability labeling schemes: the logic of their claims and their functions for stakeholders. Business Strategy and the Environment. Vol. 12. Issue 4 pages 254-264
Ellen, P. S., Webb, D. J., Mohr, L. A. (2006) “Building corporate associations: Consumer attribution for corporate socially responsible programs” Journal of the Academy Of Marketing Science. Vol. 34. No. 2. p. 147-157
Fombrun, C., & Shanley, M. (1990). “Reputation building and corporate strategy” The Academy of Management Journal. Vol. 33. No. 2. p. 233-258
Fougére, M. and Solitander, N. (2009) “Against Corporate Responsibility: Critical Reflections on Thinking, Practice, Content and Consequences” Wiley InterScience, Vol. 16, Issue 4. p. 217-227
Fox, T. (2004) “Corporate social responsibility and development in quest of agenda” Society for International Development, Vol. 47. No. 3. p. 29-36
Frankental, P (2001) "Corporate social responsibility – a PR invention?", Corporate Communications: An International Journal, Vol. 6 No: 1, p.18 – 23
Green, T., Peloza, J. (2011) ”How does corporate responsibility create value for customers”. Journal of Consumer Marketing. Vol. 28. No. 1. p. 48-56
Hartmann M. (2011). “Corporate Social Responsibility in the food sector” European Review of Agricultural Economics. Vol. 38. Issue 3. P. 297-324
Hollender, J (2004) “What Matters Most: Corporate values and social responsibility” California Management Review. Vol. 46. No. 4. p. 111-119

101
Honkanen P, Verplanken B, Olsen SO. (2006). Ethical values and motives driving organic food choice. Journal of Consumer Behaviour Vol. 5. Issue 5. p 420–430
Jonas A, Roosen J. (2005) “Private labels for premium products – the example of organic food” International Journal of Retail and Distribution Management Vol. 33 No.8. p. 636–653
Kihlberg. I & Risvik E. (2007). “Consumers of organic foods – value segments and liking of bread” Food Quality and Preference Vol 18. Issue 3. p 471–48.
Lea. E &Worsley T. (2005). “Australians’ organic food beliefs, demographics and values” British Food Journal. Vol. 107 No. 11. 855–869
L'Etang. J (1995), “Ethical corporate social responsibility: A framework for managers”, Journal of Business Ethics Vol. 14. No 2. P. 125-132
Maignan. I (2001) “Consumers' Perceptions of Corporate Social Responsibilities: A Cross-Cultural Comparison” Journal of Business Ethics Vol. 30. No. 1. p. 57-72
Maloni, M. J. and Brown, M. E. (2006). “Corporate social responsibility in the supply chain: an application in the food industry” Journal of Business Ethics. Vol 68. Issue 1. p 35–52
Marin, L, Ruiz S. and Rubio A. (2007) “The Role of Identity Salience in the Effects of Corporate Social Responsibility on Consumer Behavior” Journal of Business Ethics, Vol. 84. No. 1. p. 65-78
McWilliams. A & Siegel. D, (2001)“Corporate Social Responsibility: A Theory of the Firm Perspective” The Academy of Management Review. Vol 21. Issue 1. p. 117-12.
Onyango B, Hallman WK, Bellows AC. (2007) “Purchasing organic food in U.S. food systems: a study of attitude and practice” British Food Journal. Vol. 109. No. 5. p. 399–411.
Padel S, Foster C. (2005) “Exploring the gap between attitudes and behaviour. Understanding why consumers buy or do not buy organic food” British Food Journal Vol. 107. No. 8. p. 606–625
Piacentini, M., MacFadyn, L., Eadie, D. (2000) “Corporate social responsibility in food retailing” International Journal of Retail & Distribution Management. Vol. 28. No. 11. p. 459-469
Pedersen E. R, Neergaard P. (2006) “Caveat emptor – let the buyer beware! Environmental labeling and the limitations of ‘green’ consumerism” Business Strategy and the Environment Vol. 15. No. 1. p. 15–29
Perrini. F, Castaldo, S, Misani, N & Tencati, (2010) “The impact of corporate social responisibility associations on trust in Organic Products marketed by Mainstream Retailers: a Study of Italian Consumers. Business Strategy and the Environment. Vol. 19 Issue 8. p 512–526
Pickett-Baker J, Ozaki R. (2008) “Pro-environmental products: marketing influence on consumer purchase decision” Journal of Consumer Marketing Vol. 25. No. 5. p. 281–293.

102
Porter, M., E. (2006) “Strategy and Society: The link between Competitive Advantage and Corporate Social Responsibility” Harvard Business Review. P.78-94 (December 2006)
Sammer K, Wüstenhagen R. (2006). The influence of eco-labeling on consumer behaviour – results of a discrete choice analysis for washing machines. Business Strategy and the Environment Vol.15. Issue 3. p 185–199.
Sen, S. & Bhattacharya C. B. (2001) “Does Doing Good Always Lead to Doing Better? Consumer Reactions to Corporate Social Responsibility” Journal Of Marketing Research. Vol. 38, No. 2, p. 225-243
Seth, N., & Deshmukh, S.G. (2004) “Service quality models: a review” International Journal Of Quality & Reliability Management. Vol. 22. No. 9. p. 913-949
Spence, J. L. (2007) “CSR and Small business In a European Policy Context: The five “C”’s of CSR and Small Business Research Agenda 2007” Business and Society Review. Vol. 112, No. 4. P. 533-552
Steurer, R. (2010) “The role of governments in corporate social responsibility: characterizing public policies on CSR in Europe” Policy Science. Vol. 43. No. 1. p. 49-72
Tencati, A., Perrini, F., Pogutz, S. (2004) “New tools to Foster Corporate Social Responsible Behavior” Journal of Business Ethics. Vol. 53 p.173-190
Tsakiridou E, Boutsouki C, Zotos Y, Mattas K. (2008) “Attitudes and behaviour towards organic products: an exploratory study “International Journal of Retail and Distribution Management Vol. 36, No. 2. p. 158–175
Vlachos, P. A., Tsamakos, A. Vrechopoulos, A. P., Avramidis, P. K. (2009) “Corporate Social Responsibility: Attributions, loyalty, and the mediating role of trust. Journal of the Academy Of Marketing Science. Vol. 37. No. 2. p. 170-180
Webb I. D & Mohr A. L (2005) “Building corporate associations: Consumer attributions for corporate socially responsible programs” Journal of the Academy of marketing Science. Vol. 34, No. 2. p. 147-157
Öberseder, M, Shlegelmilch, B. B., Gruber, V. (2011) ““Why Don’t Consumers Care About CSR?”: A Qualitative Study Exploring the Role of CSR in Consumption Decisions” Journal of Business Ethics. Vol. 104. No. 4. p.449-460
LITERATURE
Boatright, J. R., (1997) “Ethics and the conduct of Business”, Second edition, Prentice-Hall, Engelwood Clidds, NJ.
Bryman, A., & Bell, E. (2010) Företagsekonomiska forskningsmetoder, Edition 1:1, Liber Economy, Malmö, Sweden.
Bryman, A. & Bell, E. (2011) Business Research Methods, Third edition, Oxford University Press, New York, USA.
Cannon, T. (1992) “Corporate Responsibility” first edition, Financial Times, Pitman

103
Publishing London
Ejvegård, R. (2009) “Vetenskaplig metod” Forth edition, Studentlitteratur AB, Lund, Sweden
Graziana M. A & Raulin L. M (2010), “Research Methods: A Process of Inquiry,
7/E,” Pearsons Copyright, Buffalo
Halvorsen, K. (1996) “Samhällsvetenskaplig metod”, Fifth edition, Studentlitteratur AB, Lund, Sweden
Jacobsen, D.I. (2002) “Vad, hur och varför? Om metodval I företagsekonomi och andra samhällsvetenskapliga ämnen”, Edition 1:10, Studentlitteratur AB, Lund, Sverige.
Patel, R. & Davidson, B. (2011) “Forskningsmetodikens grunder”, Edition 4:1, Studentlitteratur AB, Lund, Sweden
Svenning, C. (2003) Metodboken, Fifth edition, Lorentz Förlag, Eslöv, Sweden
Thurén, T. (2007) Vetenskapsteori för nybörjare, Edition 2:1, Liber AB, Malmö, Sweden
Vogel, D (2006) The Market for Virtue: “The Potential and Limits of Corporate Social Responsibility” Brookings Institution Press, 2005
ELECTRONIC ARTICLES
Bonini S. M. J. & Oppenheim J. M. (2008). “Helping “green” products grow”.
McKinsey Quarterly:
http://ww1.mckinsey.com/clientservice/sustainability/pdf/helping_green_produ
cts_grow.pdf
Ottman (1998), “Green marketing: opportunity for innovation” The Journal of Sustainable Product Design.
http://www.eco-design.gr/docs/dis_tools/98d7.pdf#page=60
Willer H. 2009. The world of organic agriculture (2009): summary. In The World of Organic Agriculture. Statistics and Emerging Trends 2009,Willer H, Klicher L (eds). Bonn; 19–24.
http://orgprints.org/18380/
Commission of the European Communities (2004). “European Action Plan for Organic Food and Farming” (Brussels: COM (2004) 415 final)
http://eur-lex.europa.eu/LexUriServ/LexUriServ.do?uri=COM%3A2004%3A0415%3AFIN%3AEN%3APDF

104
ELECTRONIC BOOKS
May, S.K., Cheney, G. & Roper, J. (2007). The Debate over Corporate Social Responsibility, Oxford University Press, New York,
http://www.google.se.proxy.lnu.se/books?hl=sv&lr=&id=wrDJpCuodNwC&oi=fnd&pg=PR5&dq=May,+S.K.,+Cheney,+G.+%26+Roper,+J.+(2007).+The+Debate+over+Corporate+Social+Responsibility,+&ots=5aVswVA4X9&sig=ZuS8b97s6XfxD_xDsxYX031ZR2s&redir_esc=y#v=onepage&q&f=false
ELECTONIC SOURCES
Csripraktiken.se (1), visited 2012-02-22
http://www.csripraktiken.se/2008/10/02/sveriges-gronaste-varumarken-och-vad-du-kan-lara-av-dem
Vaxjo.se (1), visited 2012-03-15
http://www.vaxjo.se/Kommun--politik/Statistik-undersokningar-och-kvalitet/Statistik/Folkmangd/ 2012-04-28
SCB (Växjö, visited 2012-05-17)
http://www.scb.se/Pages/PressRelease____310406.aspx
Food and Agriculture Organization (FAO) 2012. Organic Agriculture. (Växjö, visited: 2012-05-24)
http://www.fao.org/organicag/oa-faq/oa-faq10/en/
REPORTS
European Commission, 2010 - Corporate Social Responsibility- National Public
Policies in the European Union, Knopf, Jutta; Kahlenborn, Walter; Hajduk,
Thomas; Weiss, Daniel; Feil, Moira; Fiedler, Romy; Klein, Johanna. European
Commission. Directorate-General for Employment, Social Affairs and Inclusion
Unit C2. Manuscript completed in November 2010
European commission, (2002) Brussels, 2.7.2002, COM (2002) 347 final.
Communication from the Commission concerning Corporate Social
Responsibility: A business contribution to Sustainable Development
INTERVIEWS
Interview with Willy:s, 2012-03-28
Interview with Lidl, 2012-02-17
Interview with City Gross, 2012-02-16
Interview with Ica Maxi, 2012-02-14
Interview with Coop Extra, 2012-02-14

1
APPENDIX 1 – CUSTOMER SURVEY
1. Age: ________years Gender: Woman� Man � 2. Household: (Amount of persons)
1 person 2 persons 3 persons 4 persons 5 persons Other
3. Highest completed education:
Elementary Secondary 2 y Secondary 3 ye Vocational University
4. Occupation:
Employee Self-employee Unemployed Student Senior Other
If other, please inform occupation:_____________________________________________ 5. Income of the household (Gross income, per year)
-149′ 150′-299′ 300′-449′ 450′-599′ 600′-749′ 750′-899′ ≥900′
6 (a). Which of the following retail store do you prefer to purchase? (Mark with an X)
City Gross Coop Extra Ica Maxi Lidl Willy:s Other
If other, please inform retail store:_____________________________________________ 6 (b). Regarding selected retail store in 6a, what factors influence you to purchase there? Answer:_________________________________________________________________________________________________________________________________________________________________________________________________________________________________________________________________________________________ 6 (c). Regarding selected retail store in 6a, grade (1-5) all factors for the certain retail store:
0 = No opinion 1 = Bad 2 = Less Good 3 = Okay 4 = Good 5 = Very Good
7 (a). In witch of the following retail stores do you prefer not to purchase in? (Mark with a X) If other, please inform retail store:_____________________________________________ 7 (b). Regarding selected retail store in 7a, what factors influence you to purchase there? Answer:_________________________________________________________________________________________________________________________________________________________________________________________________________________
Price Product quality Product range Environment Staff Charity Ecological Locally prod.
City Gross Coop Extra Ica Maxi Lidl Willy:s Annan

2
7 (c). Regarding selected retail store in 7a, grade (1-5) all factors for the certain retail store: 0 = No Opinion 1 = Bad 2 = Less Good 3 = Okay 4 = Good 5 = Very Good
8. How much of the income do you spend on groceries in a retail store? (Mark with an X)
9. Which retail store do you consider have the best product range? (Mark with an X)
If other, please inform retail store:_____________________________________________ 10. What product features do you think is important for a retail store to provide?
If other, please inform retail store: _____________________________________________ 11. Are you aware of CSR products? YES NO 12. Do you purchase CSR products? YES NO (Note that if you answered “No” on question 12, you can go directly to question 14) 13 (a). Why du you purchase CSR products? Answer:_________________________________________________________________________________________________________________________________________ 13 (b). What type of CSR products do you purchase? Please give some examples. Answer:________________________________________________________________________________________________________________________________________ 14 (a). If No in question 12, why do you not purchase CSR products? Answer:_________________________________________________________________________________________________________________________________________ 14 (b). If No in question 12, would you consider purchasing CSR products? YES NO 15. If No in question 12, which factors would make you consider start purchasing CSR
products? Answer:_________________________________________________________________________________________________________________________________________
Price Product quality Product range Environmentally Staff Charity Ecological Locally
- 999 1000-1999 2000-2999 3000-3999 4000-4999 5000-5999 6000 or more
City Gross Coop Extra Ica Maxi Lidl Willy:s Annan
Low-price Quality Environmentally Ecologically Fair trade Locally produced Other

3
16. How important for retail stores to take social responsibility in the society? Crucial Important No opinion Less Important Not important at all
17. How important do you think it is for a retail store to provide CSR alternatives? Crucial Important No opinion Less Important Not important at all

4
APPENDIX 2 – INTERVIEW GUIDE ENGLISH VERSION 1. Name? Age? Position? How many years have you been working in retailer
industry?
2. How does your company policy look like?
3. Describe how you think your company will look like in 10 years?
4. Beyond making a profit, what is your companies’ primary goal?
5. In what areas develop/change your store mainly in the current situation?
6. How do you think consumers perceive your store? (Price, supply, quality?)
7. How do you think your consumers perceive your products?
8. How do regulation affect the consumers perception of the store?
9. How do you distinguish your retail store from others in the same business?
10. In what areas do you think the store has evolved / changed most in recent
years?
11. How do your retail store work with to improvement/developing your product
range?
12. Can you see any differences in consumers purchasing behavior today
compared with in relation to before?
13. Do you educates your employees to give more knowledge about your product
range? If yes, how
14. Do you offer your consumers different alternatives in the same product range?
If yes, how?
15. Do you work with any certain product campaigns at the moment?
16. How do you perceive the response from your consumers in different product
campaigns? Is there any specific case that stands out?
17. How does the law affect your work with selecting and providing different
products? Do you perceive that it is areas that can be hardly/less controlled?
18. When you are ordering new products, what do you prioritize? Do you have
certain conditions that have to be controlled? What is your opinion regarding what

5
kind of products those are okay to sell and are not okay? If you have decided to
not order a product, on what command?
19. How do you work with responsibility against your environment? Can you give
any examples?

6
APPENDIX 3 – OPERATIONALIZATION OF PILOT STUDY The authors arranged a pilot study to pre-test the survey. The ambition was to
identify possible gaps and see if changes have to be done before starting the actual
data collection. In this appendix different parts will describe the changes that
where made in the questionnaire after conducting information and feedback from
10 random customers, which are not included in the sample.
The questionnaire starts with an overview section, where the respondents age,
gender, occupation, income and household was asked. In this part the researchers
had to do some adjustments after the pilot study. For example the interval of
income was changes as well as the heading of the question. It was rephrased from
being the respondent income to the households shared income, to reduce
confusion and for easier understanding. The main argument was, if the respondent
household contained of two or more people, their income should also be taken in
consideration. Furthermore the different alternatives of occupations were
adjusted. First the questionnaire asked if the respondent either was a full time or a
part time employee. The pilot study resulted in the conclusion that the information
was unnecessary for the study and chose to remove part and full time employee
and only have employed as an option. Due to the option did not contribute with
any useful information in relation to the studies purpose and research question.
The second part (the main part) where the respondents purchasing habits, opinion
on product and their general view of CSR was conducted the response options
was changed from 1-5 (1 = bad, 2=Less good d, 3=Have no opinion, 4=Good,
5= Very good) to 0-6 (0= No opinion, 1=Bad, 2= Less good, 3= Okay, 4=Good,
5= Very good). This was mad after releasing that the respondent answered no
opinion when the actually wanted to answer okay, this could lead to bias. The pilot
study indicated that the respondent should have the option to answer okay but
also the rights answer no opinion, to minimize the risk of distortion affecting the
results.
Overall the pilot study went well and the participants contributed with useful
information and feedback. The researchers also felt that the questionnaire was
overall easy to understand and the demanded time felt reasonable.

7
APPENDIX 4 – TABLES AND FIGURES FOR THE QUANTITATIVE INVESTIGATION
AWARENESS OF CSR PRODUCTS
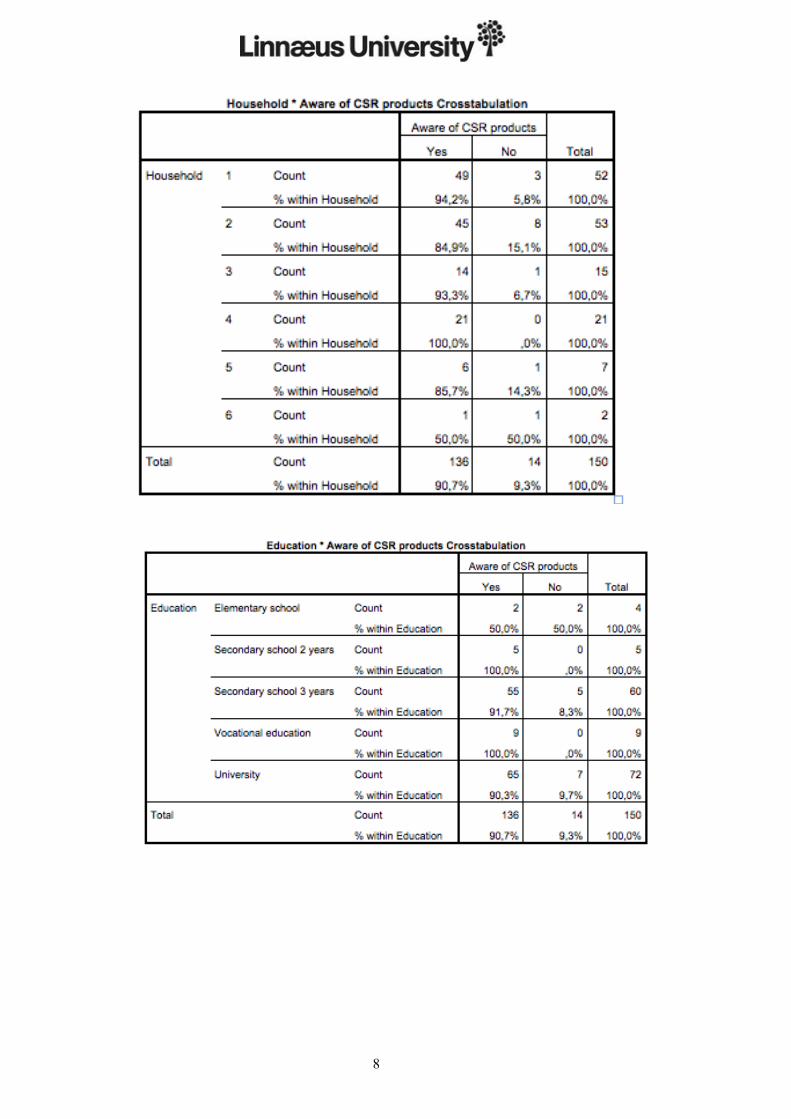
8

9

10
PURCHASE CSR PRODUCT

11

12

13
THE IMPORTANCE OF SOCIAL RESPONSIBILITY

14

15

16
APPENDIX 5 - RANDOM WALKING SCHEDULE
STREETS DAYS AREA
1. Korsövägen 2012-04-26 Hovshaga
2. Krusbärsvägen 2012-04-26 Hovshaga
3. Kurortsvägen 2012-04-28 Sandsbro
4. Källebergsvägen 2012-04-26 Hovshaga
5. Lidhemsgatan 2012-04-27 Växjö City
6. Lillestadsvägen 2012-04-28 Växjö Norr
7. Linodlarvägen 2012-04-29 Växjö Öster
8. Lungadalsvägen 2012-04-30 Teleborg
9. Lyckestigen 2012-04-27 Hovshaga
10. Lövängsvägen 2012-05-02 Sandsbro
11. Marsvägen 2012-05-03 Danneborg
12. Minkvägen 2012-05-03 Dalbo
13. Musikvägen 2012-04-27 Hovshaga
14. Måsvägen 2012-05-02 Högstorp
15. Norregårdsvägen 2012-04-27 Hovshaga