In tamil script, Acknowledgements: Acknowledgements: Our Sincere ...
Price, Quality, and International Agricultural Trade
Darian Woods with Andrew Coleman
Motu Working Paper 12-08 Motu Economic and Public Policy Research
July 2012
i
Author contact details Darian Woods The Treasury [email protected]
Andrew Coleman Motu Economic and Public Policy Research and the Treasury [email protected]
Acknowledgements This paper was written under the Motu-led “Coordination and Cooperation for Effective Climate Policy Design and Implementation” research project, funded by MPI through the Sustainable Land Management and Climate Change fund. Thanks are also due to Andrew Coleman, Suzi Kerr and Chris Young for their comments on this paper, as well as participants in Motu’s AgDialogue workshop for their feedback.
Motu Economic and Public Policy Research PO Box 24390 Wellington New Zealand
Email [email protected] Telephone +64 4 9394250 Website www.motu.org.nz
© 2012 Motu Economic and Public Policy Research Trust and the authors. Short extracts, not exceeding two paragraphs, may be quoted provided clear attribution is given. Motu Working Papers are research materials circulated by their authors for purposes of information and discussion. They have not necessarily undergone formal peer review or editorial treatment. ISSN 1176-2667 (Print), ISSN 1177-9047 (Online).

ii
Abstract The average value of a particular class of agricultural exports varies widely across different destinations. This raises the question: in the event of a supply shock, such as the implementation of the Emissions Trading Scheme, can farmers offset higher costs by raising their average prices by contracting exports to lower value destinations? If the difference in value reflects different prices because producers have market power, the answer will be “yes”. If the difference in value reflects differences in the quality of goods exported to different destinations, the answer is “no.” This paper use a variety of trade data and techniques to examine which explanation is most likely to be relevant. While the answers are not definitive, there is little support for the hypothesis that exports are curtailed to lower value destinations when supply costs increase.
JEL codes D43, F12, F14, F18, Q17, Q64, Q56
Keywords Agriculture, exports, emissions trading scheme, price, quality, market power, international trade, New Zealand
iii
Contents 1. Introduction ........................................................................................................................................ 1
2. Background Issues ............................................................................................................................. 4
3. Price Variation across Countries: Market Segmentation v Quality Differences ....................... 5
4. Premium Measures ............................................................................................................................ 7
5. Data .................................................................................................................................................... 12
6. Trends in Quality Premiums over Time ....................................................................................... 12
7. Sectors of Competition ................................................................................................................... 17
8. Exchange Rates and the New Zealand Premium........................................................................ 21
9. Do Different Unit Values Affect Exporters’ Decisions? ........................................................... 23
10. Conclusion ........................................................................................................................................ 27
11. References ......................................................................................................................................... 28
Appendix A: 4-digit Product Codes and the Importer Premium for Frozen Sheep Meat and Butter ............................................................................................................................................... 31
Appendix B: 10-digit Product Codes, and Agricultural Trade between Australia and New Zealand ............................................................................................................................................ 34
Figures and Tables
Figure 1: International Market Segmentation ......................................................................................... 6
Figure 2: Quality Differences .................................................................................................................... 7
Table 1: Importer Premium Variance .................................................................................................... 13
Table 2: New Zealand Premium Variance ............................................................................................ 13
Figure 3: Importer Premium, World ...................................................................................................... 14
Figure 4: Frozen Sheep Meat Importer Premium ................................................................................ 15
Figure 5: Unsalted Butter Importer Premium ...................................................................................... 16
Figure 6: Agricultural Exports’ New Zealand Premium ..................................................................... 17
Table 3: Price or Quality Competition ................................................................................................... 19
Figure 7: An appreciating New Zealand dollar with quality competition ......................................... 21
Figure 8: A depreciating New Zealand dollar with market power..................................................... 22
Table 4: Importer Premium t-tests ......................................................................................................... 25
Table 5: NZ Premium t-tests .................................................................................................................. 26
Table A1: Frozen Sheep Meat Importer Premium .............................................................................. 32
Table A2: Unsalted Butter Importer Premium OLS ........................................................................... 33
Table B1: Price v Quality Competition, Trade in Beef and Sheep Meat between Australia and
New Zealand, 1988 to 2008: ................................................................................................. 35
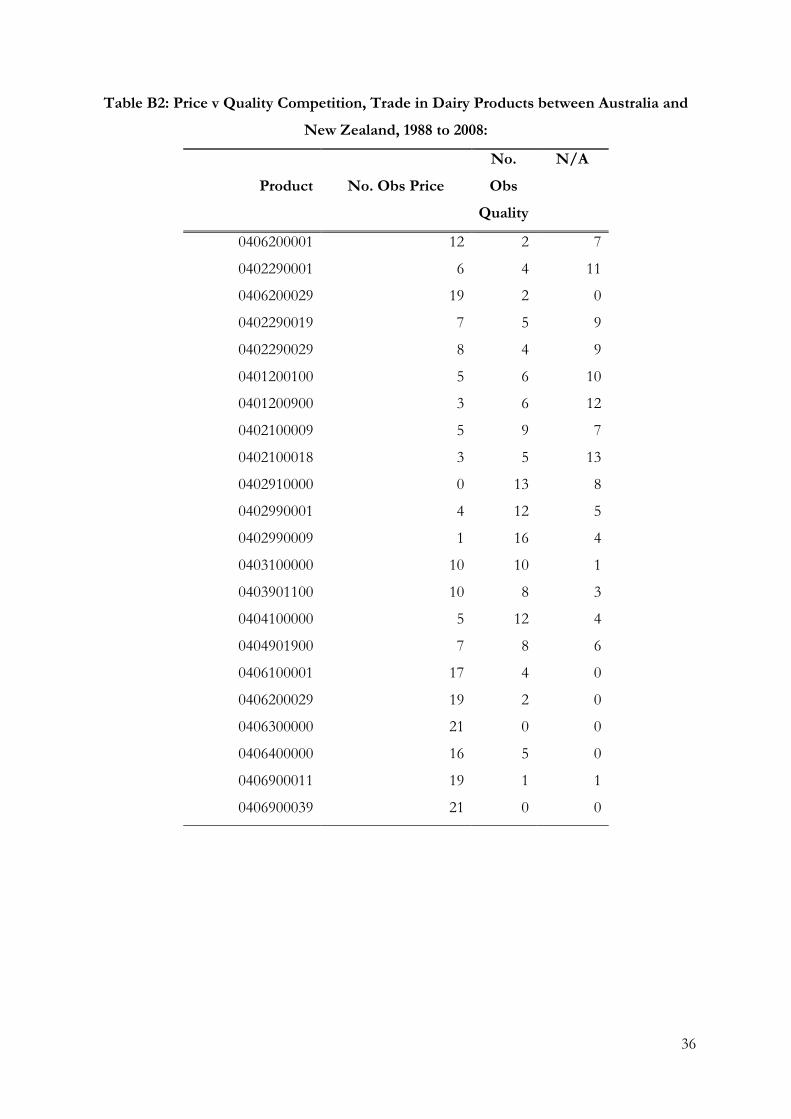
Table B2: Price v Quality Competition, Trade in Dairy Products between Australia and New
Zealand, 1988 to 2008: .......................................................................................................... 36

1
1. Introduction
The agriculture sector is responsible for 47% of New Zealand’s greenhouse gas
emissions and will be included in New Zealand’s Emissions Trading Scheme (ETS) in 2015
(MAF, 2009; NZ Government, 2010). As dairy, beef and sheep farming are the largest
contributors of greenhouse gases within the sector, their inclusion in the ETS will have a large
effect on this type of farming. To these farmers, the ETS represents a negative supply shock that
raises costs and lowers profits. In the most adverse scenario, if farmers or processors are
required to pay the full price of emissions and the price of a carbon-equivalent tonne of
emissions costs $50 or more, MAF (2008) predicts a 123% reduction in the average dairy farm’s
profit. In a more likely scenario, in which the price of emissions is $15 per carbon-equivalent
tonne and in which farmers are allocated free permits equivalent to 90% of their 2005 emissions,
MAF predicts a 12% decline in national dairy profits and a 5% decline in national sheep and beef
profits.
The MAF profitability estimates were calculated under the assumption that “farmers
[will] do nothing to adapt to the new cost structure over time” (p. 1). This assumption is
unrealistic as farmers can alter their production techniques in response to changes in input prices
or pollution charges. Moreover, it is sometimes suggested that farmers and processors could
adapt to the new cost structure by increasing their average prices, either by reducing the quantity
exported to markets in which they have market power, or by reducing exports to the countries
with the lowest prices. In general, the more that New Zealand exporters have market power, the
more they will be able to raise average prices in response to a cost shock.
In this paper, we explore whether farmers are likely to have sufficient market power to
raise their prices by examining the pattern of export shipments and receipts in different countries
over the last two decades. Unfortunately, there is no single definitive technique we can use.
Rather, we approach the question from a variety of different angles. Overall, we find little
evidence that agricultural producers have enough market power to allow them to raise average
prices significantly in response to an increase in costs. The strongest evidence comes from the
way prices in overseas countries respond to changes in the New Zealand exchange rate.
Nonetheless, the countries with the fastest increase in dairy imports in the 1990s were those with
the lowest average values, suggesting there may be some scope for average prices in this sector to
increase if the quantity of exports was reduced.
To establish whether producers can exploit market power to change prices in response to
a cost shock, high-quality price and quantity data are needed. Unfortunately, such data are not
2
typically available. Rather, quantity and unit value data are typically obtained, where unit values
are the average price of a class of a good sent to a country, equal to the total revenue divided by
the number (or weight) of items sold. Unit values are not the same as prices, as they do not
distinguish between the different quality levels of the goods within a class, all of which are sold at
different prices. By using the finest classification of goods possible, some of these problems are
mitigated, but in general even the finer classifications (such as the chardonnay variety of wine)
include goods that vary significantly in terms of quality and price. For this reason, while the
central purpose of this paper is to analyse whether prices for identical New Zealand goods vary by
destination, providing farmers with the ability to adjust prices to mitigate the effects of the ETS,
much of the focus involves ways of answering this question with unit value data.
The data show that the unit values of New Zealand agricultural products differ widely
across export destinations. The most likely reason for these different unit values is that products
sold in different markets have different quality levels, although prices for the same quality goods
in each country are the same. If quality differences are the cause of the different unit values
across countries, it will be difficult for producers to offset the lower profitability caused by the
ETS. The main alternative explanation is that the goods sold in different markets have the same
quality, but because New Zealand exporters have sufficient market power to segment markets
across countries, they can charge different prices. This market power could stem from the way
producers market their goods, or from quotas or other quantity restrictions limiting access to
these markets. If market segmentation enables exporters to price differently in different markets,
exporters can raise prices and shift the products to a new combination of importing countries in
response to increased costs. These two arguments are explored in section 3. They represent the
extreme range of implications of the extent that agricultural producers can adjust prices in
response to the ETS.
In section 4, the measurement of unit values is discussed in greater detail. Different
export destinations pay consistently different unit values for New Zealand agricultural products,
even for ostensibly homogeneous products disaggregated at a fine ten-digit Harmonised System
(HS) level. We use unit value data to create two measures of the extent that average prices vary
across markets. First, we look at the relative unit values for a single product paid by the different
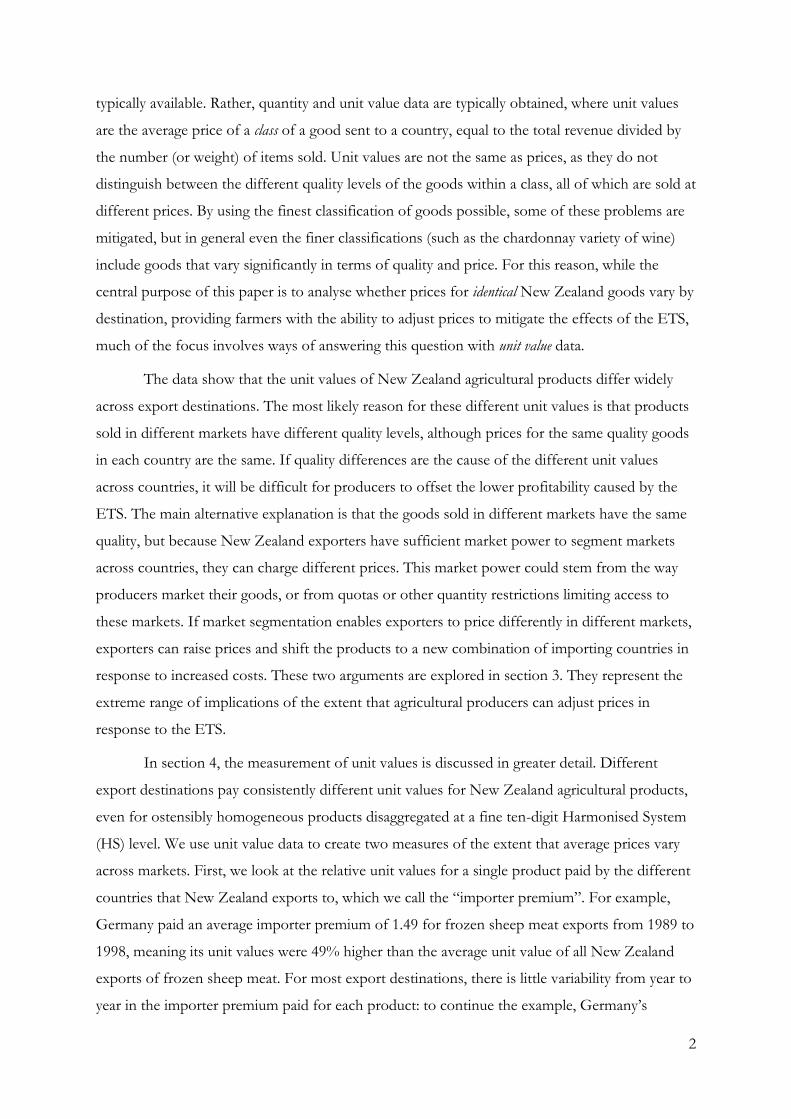
countries that New Zealand exports to, which we call the “importer premium”. For example,
Germany paid an average importer premium of 1.49 for frozen sheep meat exports from 1989 to
1998, meaning its unit values were 49% higher than the average unit value of all New Zealand
exports of frozen sheep meat. For most export destinations, there is little variability from year to
year in the importer premium paid for each product: to continue the example, Germany’s
3
importer premium was 1.50 from 1999 to 2008. The second measure is called the “New Zealand
premium”. It compares the unit value of exports from New Zealand of a particular product to a
particular country with the unit values of that country’s imports from all other countries. This is
an indication of whether New Zealand is sending goods that are higher or lower in value than
other exporting countries to a particular importing country. As discussed in sections 5 and 6, the
New Zealand premium in an importing country during one year is a strong predictor of its likely
premium in subsequent years. A high New Zealand premium is consistent with New Zealand
exports being able to compete on quality. Conversely, a low New Zealand premium suggests that
the product is primarily competing on the basis of price.
We extend the analysis of world trade patterns in section 7. By comparing a New
Zealand product’s unit value with that product’s average world unit value, we can infer whether
New Zealand generally competes on price or quality. The method we use is a simplification of a
technique developed by Karl Aiginger (1988). The extent that a market is dominated by either
price competition or quality competition is an indication of a market’s ability to absorb price
increases.
In section 8 we use exchange rate data to test for market power. If world agricultural
markets are competitive, New Zealand’s exchange rate should not affect the price that importers
pay for New Zealand products. We test this hypothesis and find no correlation between
exchange rates and the prices that importers pay. We believe this evidence, which is consistent
with the hypothesis that the different markets are price competitive, is the strongest evidence in
the paper.
In section 9 we analyse the dynamic pattern of unit values and exports. We test the
hypothesis that exporters’ decisions to increase or decrease quantities sent to a particular country
depend on relative unit values. First, we explore a variety of scenarios that illustrate the ways unit
values could affect the dynamic patterns of exports, starting with scenarios that assume markets
can be segmented. For example, if lower-paying countries are “dumping grounds” for temporary
surpluses, countries with increased imports from New Zealand should have a lower-than-average
premium. Moreover, a very large expansion one year will be followed by a very large contraction
the next. In this case both contracting and expanding markets should be associated with a lower-
than-average premium. Other possible scenarios are discussed in the section. To examine the
way that differences in unit values are related to agricultural export volumes, we estimate the
mean unit value premiums in expanding and contracting markets and find that expanding
markets are associated with lower unit values in some product categories.

4
2. Background Issues
The ETS will raise New Zealand agricultural producers’ costs. Economic logic suggests
producers will want to pass on these costs if possible, or reduce production, and thus that an
increase in the strictness of a country’s environmental regulation relative to others should
decrease its industries’ output and competitiveness. Yet literature on the costs of environmental
regulation is surprisingly mixed. Dean reviews empirical studies on environmental compliance
costs (ECC) in Europe and notes that because ECC are small relative to an industry’s average
costs, “there is little evidence of any significant impact of ECC on the pattern of trade” (Dean,
1992, pp. 11). This evidence is in contrast with the predictions of MAF (2008) and Ballingall et
al. (2009), who argue there will be non-negligible reductions in New Zealand’s welfare following
the application of the ETS to the agricultural sector. For example, Ballingall et al. (2009, pp. 7)
argue that “[P]rivate consumption (household spending) falls after an ETS is introduced, with
these falls larger in the long run scenarios.”
The difference between these studies may be due to the differences between the
magnitude of European ECC and the ETS. Dean cites studies that show a marginal reduction in
exports when ECC are found to be 1–2% of total exports’ value (p. 6). The ETS, on the other
hand, may impose higher costs on farmers. Nonetheless, the differences between many ex-post
empirical studies on the effects of environmental regulation on industry and the ex-ante MAF
report remain stark, partly because of the MAF assumption that “farmers do nothing to adapt to
the new cost structure over time” (p. 1).
It is possible that farmers could respond to the ETS by using a different combination of
production techniques to the raise the quality of their output. For instance, a cheese
manufacturer could produce a more labour-intensive high-quality cheese and reduce emissions-
heavy milk inputs. The scope of quality differences between products is called a “quality ladder”
(Khandelwal 2008). “Quality” has two important dimensions: it may refer to horizontal or
vertical quality. Vertical product differentiation is a feature that most consumers prefer, such as
higher fuel efficiency in cars. It has been the focus of most literature on product quality, both
because producers can choose different techniques or different inputs to produce at different
points on a quality ladder, and because countries specialise in different quality levels (Schott
2004). Some products, such as electronics, have long vertical quality ladders. Others, such as
agricultural produce, have short vertical quality ladders, although there is scope for horizontal
product differentiation for a particular quality level. Despite this, quality ladders help explain

5
differences in unit values across countries. Schott further noted that high-priced goods are
generally more capital or skill intensive than low-priced goods in the same product category.
Horizontal product differentiation is a product feature that is preferred by some
consumers rather than others, such as a car’s colour. Horizontal differentiation is important as
even the most finely disaggregated product category has some room for horizontal
differentiation, enabling producers some scope for market segmentation through reputation,
intangible marketing campaigns or inexplicable uniform differences in consumers’ willingness to
pay for various brands. When companies have this market power, they can set prices differently
in different countries, charging premiums in some markets without losing most of their
customers.
3. Price Variation across Countries: Market Segmentation v
Quality Differences
Market segmentation occurs if New Zealand agricultural processors hold market power
and can sell an identical product in each country at different monopolistic prices. Consider an
example of two countries. If market segmentation occurs, the demand and marginal-revenue
curves differ in slope in the two countries, but New Zealand agricultural processors have the
same marginal cost curves for supplying each country. The ETS will increase the marginal cost in
both markets. In response, exporters will reduce quantity and increase prices in both countries,
but they will increase prices relatively more and reduce exports relatively less in the country with
the steeper demand curve.

6
Figure 1: International Market Segmentation
Figure 1 illustrates the possible response to an increase in marginal costs when an
agricultural processor has market power and sells an identical product to two countries that
differ in the elasticity of their demand. The introduction of the ETS raises the marginal cost
curve from MC0 to MC1. To maximise revenue, exporters increase the price more in the country
with the inelastic demand curve, Germany, than in the country with the more elastic demand
curve, Egypt. (PG0 to PG1 is a larger increase than PE0 to PE1.) Despite the lower price increase,
Egypt’s quantity decrease, qE0 to qE1, is larger than Germany’s quantity decrease, qG0 to qG1.
Unambiguously, New Zealand producers will reduce agricultural exports and lose surplus when
the ETS is introduced. But market power through branding and product differentiation would
allow New Zealand producers to increase prices to compensate, especially in countries with a
steeper demand curve. This would offset the reduction in producer surplus.
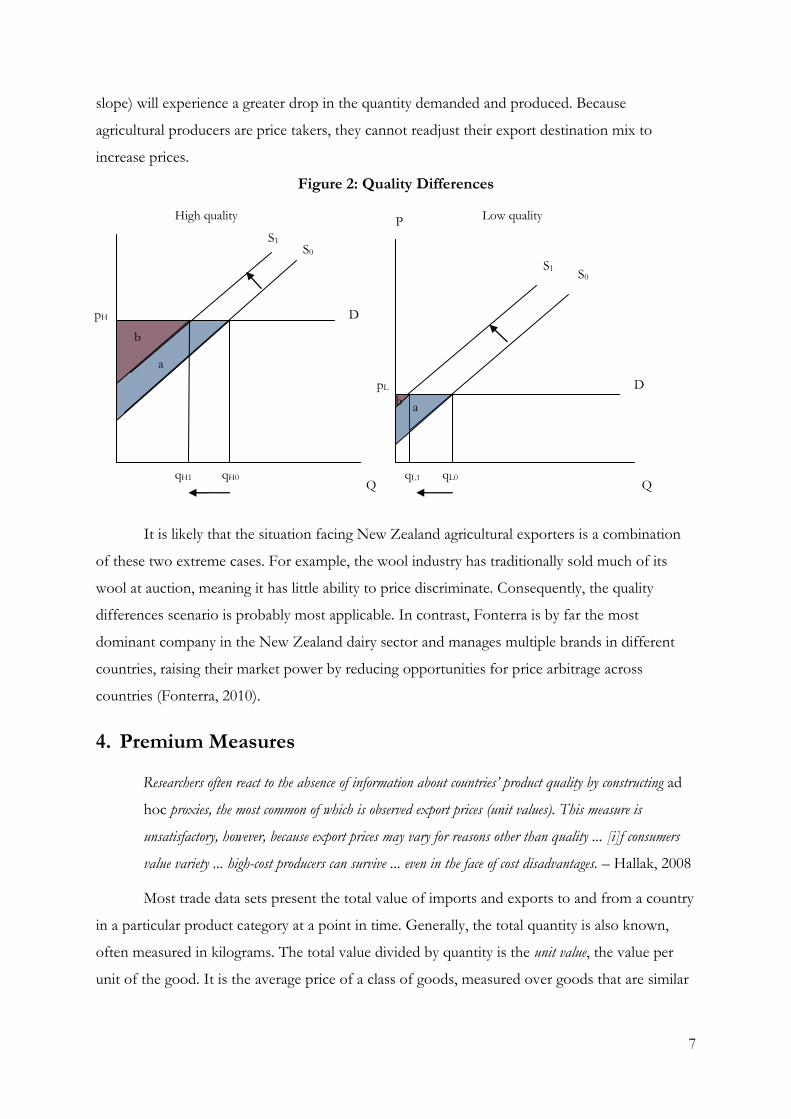
In the second scenario that can explain different unit values, agricultural goods are
commodities that are traded competitively, but different qualities are traded in different markets.
This is illustrated in figure 2. In both markets the demand curve is perfectly elastic or horizontal,
but the demand and supply curves are lower in the low-quality market, reflecting the lower price
of the product. In both cases, the introduction of the ETS shifts the supply curves left.
As the figure shows, when the supply curves shifts left from S0 to S1, the price remains
the same and quantity reduces from q0 to q1The producer surplus shrinks from area a to b. If the
supply curves have different slopes, the quality with the more elastic supply curve (shallower
MC, MR
MC MC
D MR
Q
Germany
MC1
qG0
PE0
PG0
PG1
qG1
MC, MR
D
MR
Q
Egypt
MC1
qE1
PE1
qE0
7
slope) will experience a greater drop in the quantity demanded and produced. Because
agricultural producers are price takers, they cannot readjust their export destination mix to
increase prices.
Figure 2: Quality Differences
It is likely that the situation facing New Zealand agricultural exporters is a combination
of these two extreme cases. For example, the wool industry has traditionally sold much of its
wool at auction, meaning it has little ability to price discriminate. Consequently, the quality
differences scenario is probably most applicable. In contrast, Fonterra is by far the most
dominant company in the New Zealand dairy sector and manages multiple brands in different
countries, raising their market power by reducing opportunities for price arbitrage across
countries (Fonterra, 2010).
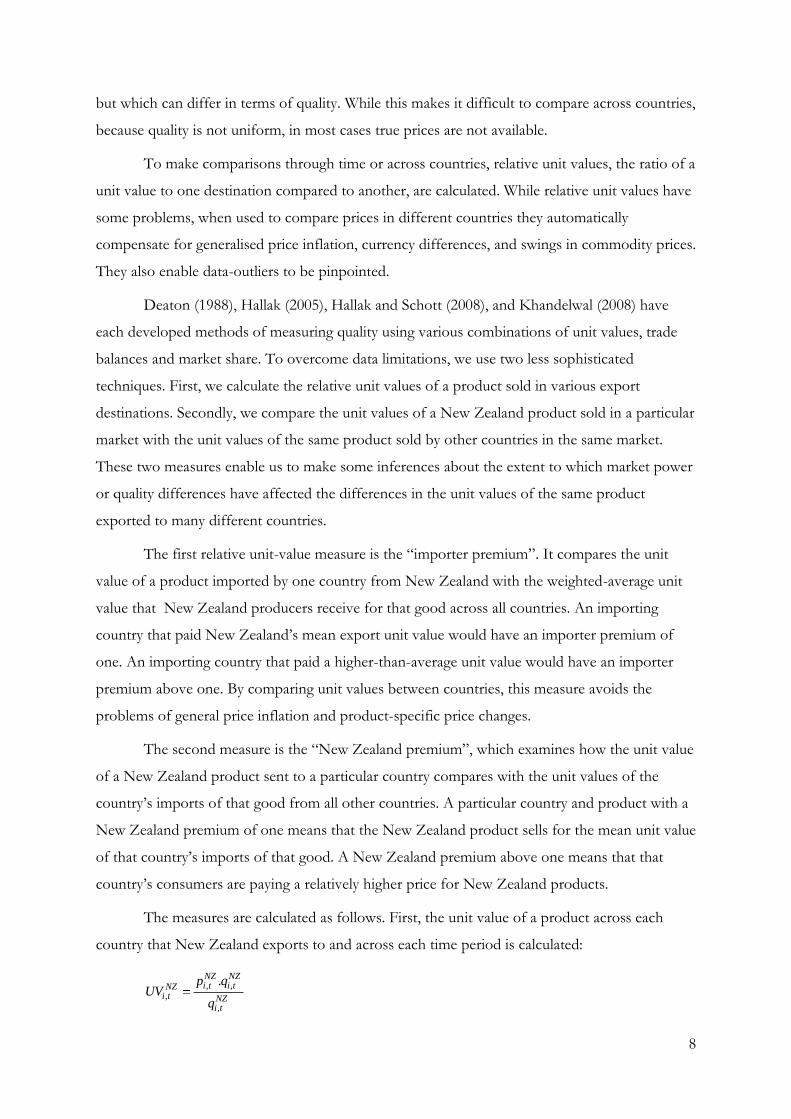
4. Premium Measures
Researchers often react to the absence of information about countries’ product quality by constructing ad
hoc proxies, the most common of which is observed export prices (unit values). This measure is
unsatisfactory, however, because export prices may vary for reasons other than quality ... [i]f consumers
value variety ... high-cost producers can survive ... even in the face of cost disadvantages. – Hallak, 2008
Most trade data sets present the total value of imports and exports to and from a country
in a particular product category at a point in time. Generally, the total quantity is also known,
often measured in kilograms. The total value divided by quantity is the unit value, the value per
unit of the good. It is the average price of a class of goods, measured over goods that are similar
Q Q
P P
D
D
S0
S0
pH
pL
High quality Low quality
S1
S1
qL0 qH0 qL1 qH1
b
a
b a
8
but which can differ in terms of quality. While this makes it difficult to compare across countries,
because quality is not uniform, in most cases true prices are not available.
To make comparisons through time or across countries, relative unit values, the ratio of a
unit value to one destination compared to another, are calculated. While relative unit values have
some problems, when used to compare prices in different countries they automatically
compensate for generalised price inflation, currency differences, and swings in commodity prices.
They also enable data-outliers to be pinpointed.
Deaton (1988), Hallak (2005), Hallak and Schott (2008), and Khandelwal (2008) have
each developed methods of measuring quality using various combinations of unit values, trade
balances and market share. To overcome data limitations, we use two less sophisticated
techniques. First, we calculate the relative unit values of a product sold in various export
destinations. Secondly, we compare the unit values of a New Zealand product sold in a particular
market with the unit values of the same product sold by other countries in the same market.
These two measures enable us to make some inferences about the extent to which market power
or quality differences have affected the differences in the unit values of the same product
exported to many different countries.
The first relative unit-value measure is the “importer premium”. It compares the unit
value of a product imported by one country from New Zealand with the weighted-average unit
value that New Zealand producers receive for that good across all countries. An importing
country that paid New Zealand’s mean export unit value would have an importer premium of
one. An importing country that paid a higher-than-average unit value would have an importer
premium above one. By comparing unit values between countries, this measure avoids the
problems of general price inflation and product-specific price changes.
The second measure is the “New Zealand premium”, which examines how the unit value
of a New Zealand product sent to a particular country compares with the unit values of the
country’s imports of that good from all other countries. A particular country and product with a
New Zealand premium of one means that the New Zealand product sells for the mean unit value
of that country’s imports of that good. A New Zealand premium above one means that that
country’s consumers are paying a relatively higher price for New Zealand products.
The measures are calculated as follows. First, the unit value of a product across each
country that New Zealand exports to and across each time period is calculated:
, ,,
,
.NZ NZi t i tNZ
i t NZi t
p qUV
q

9
where i = importing country
t = annual time period
, ,.NZ NZi t i tp q = value of New Zealand product in country i at time t
,NZi tq = quantity of New Zealand product in country i at time t
To calculate the importer premium we define the weighted-average unit value of exports
from New Zealand to all countries in a given time period:
, ,*
,
.NZ NZi t i tNZ i
t NZi ti
p qP
q
The importer premium (MPr) for country i is calculated by:
,, *
,
MPr
NZi t
i t NZi t
UV
P
The value MPr measures a New Zealand product’s unit value to one destination relative
to other countries. For example, if this product is wine, MPr is the unit value of the New
Zealand wine exported to country m in time period t, divided by the weighted-average unit value
of New Zealand’s wine exported to all countries in that same time period.
The second relative unit-value measure is calculated from the perspective of the
importing country. This measures the extent that a particular New Zealand export (e.g. wine) to
a particular destination (e.g. the United Kingdom) is priced below or above the average price of
the product in the importing country and thus indicates the level of New Zealand’s prices and
how they are changing over time. Let the weighted-average unit value of all exports to one
country in a given time period be:
, ,*,
,
.x xi t i tx x
i t xi tx
p qP
q
where x = countries exporting to importing country
The New Zealand premium is calculated by:
,, *
,
NZPr
NZi t
i t xi t
UV
P
In this paper we use the importer premium and New Zealand premium to measure the
extent that exports to different countries have different unit values, and to make inferences
about prices in these countries. However, both measures have their limitations when used in
10
isolation, in part because of they way they can change through time in response to changes in the
pattern of exports. For this reason, the measures are best used in conjunction with other
indicators of export patterns. These limitations can be illustrated by example. Imagine that New
Zealand wine has two vertically differentiated quality levels, high and low, and that trade data
aggregates both qualities into the same category, wine. As the following examples show, changes
in the importer premium (MPr) do not always indicate an increase in quality, and vice versa.
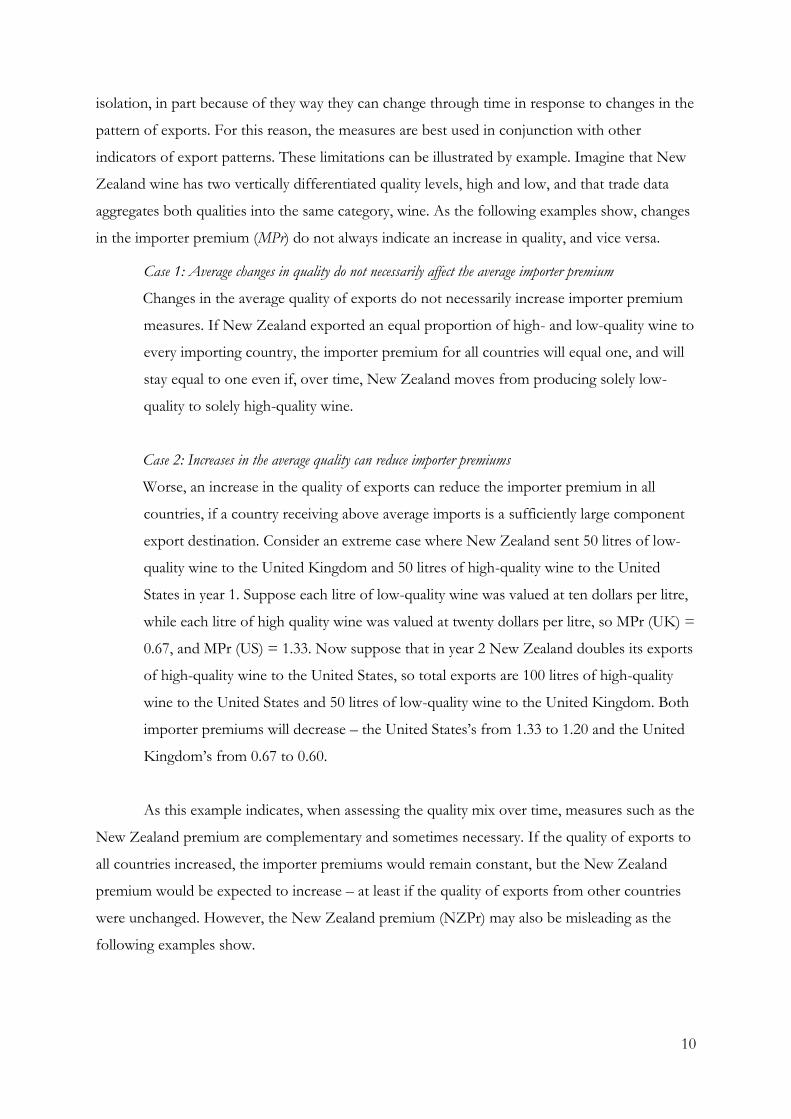
Case 1: Average changes in quality do not necessarily affect the average importer premium
Changes in the average quality of exports do not necessarily increase importer premium
measures. If New Zealand exported an equal proportion of high- and low-quality wine to
every importing country, the importer premium for all countries will equal one, and will
stay equal to one even if, over time, New Zealand moves from producing solely low-
quality to solely high-quality wine.
Case 2: Increases in the average quality can reduce importer premiums
Worse, an increase in the quality of exports can reduce the importer premium in all
countries, if a country receiving above average imports is a sufficiently large component
export destination. Consider an extreme case where New Zealand sent 50 litres of low-
quality wine to the United Kingdom and 50 litres of high-quality wine to the United
States in year 1. Suppose each litre of low-quality wine was valued at ten dollars per litre,
while each litre of high quality wine was valued at twenty dollars per litre, so MPr (UK) =
0.67, and MPr (US) = 1.33. Now suppose that in year 2 New Zealand doubles its exports
of high-quality wine to the United States, so total exports are 100 litres of high-quality
wine to the United States and 50 litres of low-quality wine to the United Kingdom. Both
importer premiums will decrease – the United States’s from 1.33 to 1.20 and the United
Kingdom’s from 0.67 to 0.60.
As this example indicates, when assessing the quality mix over time, measures such as the
New Zealand premium are complementary and sometimes necessary. If the quality of exports to
all countries increased, the importer premiums would remain constant, but the New Zealand
premium would be expected to increase – at least if the quality of exports from other countries
were unchanged. However, the New Zealand premium (NZPr) may also be misleading as the
following examples show.
11
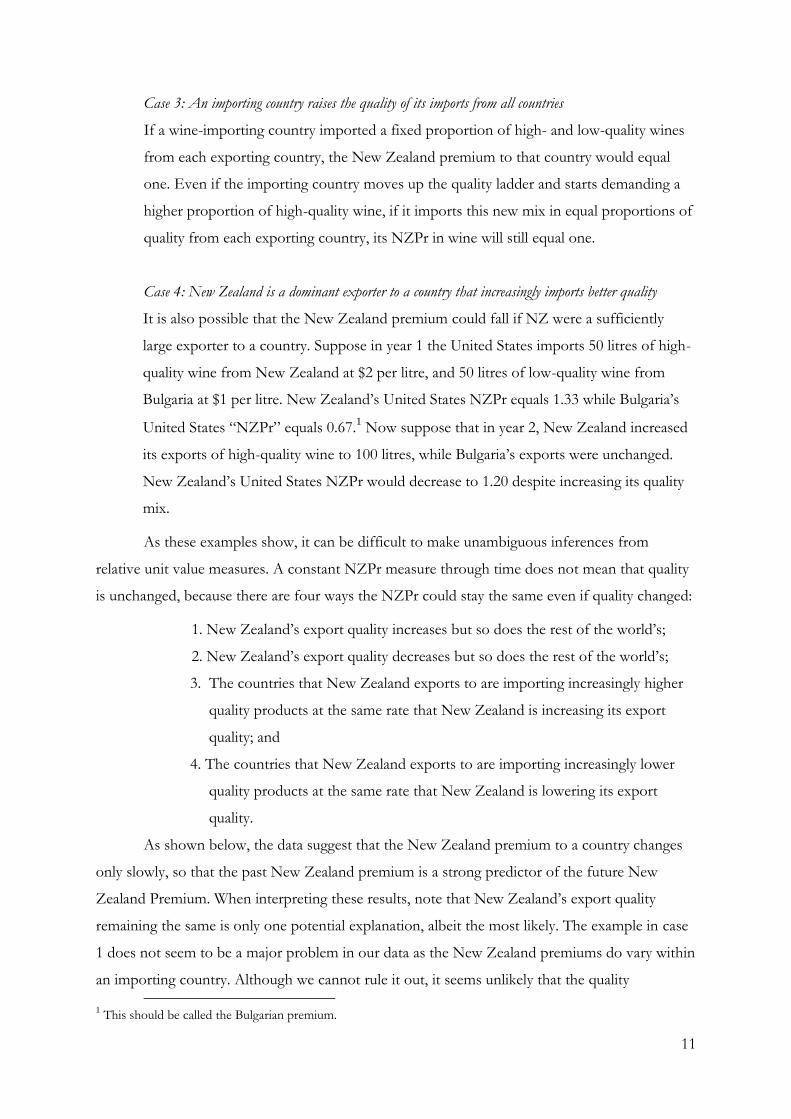
Case 3: An importing country raises the quality of its imports from all countries
If a wine-importing country imported a fixed proportion of high- and low-quality wines
from each exporting country, the New Zealand premium to that country would equal
one. Even if the importing country moves up the quality ladder and starts demanding a
higher proportion of high-quality wine, if it imports this new mix in equal proportions of
quality from each exporting country, its NZPr in wine will still equal one.
Case 4: New Zealand is a dominant exporter to a country that increasingly imports better quality
It is also possible that the New Zealand premium could fall if NZ were a sufficiently
large exporter to a country. Suppose in year 1 the United States imports 50 litres of high-
quality wine from New Zealand at $2 per litre, and 50 litres of low-quality wine from
Bulgaria at $1 per litre. New Zealand’s United States NZPr equals 1.33 while Bulgaria’s
United States “NZPr” equals 0.67.1 Now suppose that in year 2, New Zealand increased
its exports of high-quality wine to 100 litres, while Bulgaria’s exports were unchanged.
New Zealand’s United States NZPr would decrease to 1.20 despite increasing its quality
mix.
As these examples show, it can be difficult to make unambiguous inferences from
relative unit value measures. A constant NZPr measure through time does not mean that quality
is unchanged, because there are four ways the NZPr could stay the same even if quality changed:
1. New Zealand’s export quality increases but so does the rest of the world’s;
2. New Zealand’s export quality decreases but so does the rest of the world’s;
3. The countries that New Zealand exports to are importing increasingly higher
quality products at the same rate that New Zealand is increasing its export
quality; and
4. The countries that New Zealand exports to are importing increasingly lower
quality products at the same rate that New Zealand is lowering its export
quality.
As shown below, the data suggest that the New Zealand premium to a country changes
only slowly, so that the past New Zealand premium is a strong predictor of the future New
Zealand Premium. When interpreting these results, note that New Zealand’s export quality
remaining the same is only one potential explanation, albeit the most likely. The example in case
1 does not seem to be a major problem in our data as the New Zealand premiums do vary within
an importing country. Although we cannot rule it out, it seems unlikely that the quality
1 This should be called the Bulgarian premium.
12
demanded by the rest of the world is growing worse as world incomes rise. For this reason, we
can infer that New Zealand is either not outpacing quality growth compared to the rest of the
world or exporting similar quality over time.
5. Data
The import and export data used in this paper come from two sources. We use data from
Statistics New Zealand’s Infoshare for the finely disaggregated import and export information
specific to New Zealand that are used to calculate the importer premium measure. We use data
compiled by Robert C. Feenstra et al. (2004) for world-wide import and export data to calculate
the New Zealand premium measure.
The Statistics New Zealand Overseas Merchandise Trade data are originally sourced
from the New Zealand Customs Service. These are annual observations of products sorted into
ten-digit HS categories from 1988 to 2008. We use data from the agricultural sectors that
contribute most to New Zealand’s greenhouse emissions – dairy, beef, sheep, and wool. Each
export product category describes the annual export quantity (usually in kilograms) and the total
Free on Board2 (FOB) value, in New Zealand dollars. Each import product category describes
the annual import quantity and the total Cost, Insurance, Freight3 (CIF) value, also in New
Zealand dollars.
An enormous quantity of data are needed to calculate the New Zealand premium:
basically all trade flows between all centres for every year for a particular category of goods.
Rather than obtain this data for 10-digit product categories from scratch, we have used a dataset
assembled by Feenstra (2004). Feenstra’s data consists of annual import and export data in four-
digit SITC (Rev.2) product categories from 1988 to 2000. These data are aggregated from
worldwide trade flow reports. Priority is given to importer countries’ reports. We isolate 13
product categories that include dairy, beef, sheep, and wool. For each export and import
category, the quantity of trade in kilograms and the value in United States dollars, measured in
either FOB or CIF terms depending on the observation.
6. Trends in Quality Premiums over Time
This section describes the patterns of the importer premium and New Zealand premium
measures for New Zealand’s agricultural exports, 1988–2008. There are two main features of the
2 Free on Board (FOB) is the good’s value, transport costs split between buyer and seller 3 Cost, Insurance, Freight (CIF) is the good’s value plus cost, insurance and freight costs
13
data: (1) the premiums differ widely across countries, indicating either large differences in the
quality or the prices of exports; and (2) the premiums for a particular country are persistent
through time.
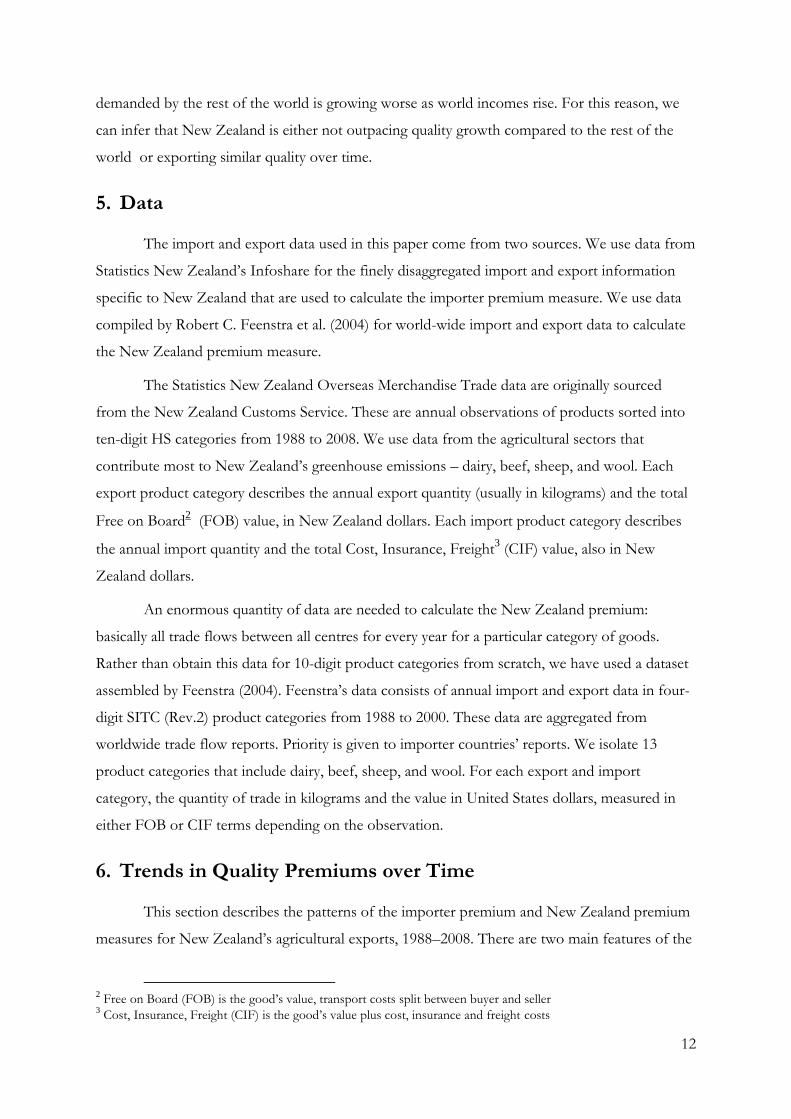
Export unit values vary greatly. For unsalted butter, the highest unit value is 1.4 times as
large as the lowest unit value, while for frozen sheep meat the ratio is over 8. In tables 1 and 2,
products are divided into three categories according to their relative variability, measured as the
standard deviation over both time and country of each premium measure. Low-variance
products have a premium standard deviation of 0.5 or less, medium-variance products have a
premium standard deviation between 0.5 and 1, and high-variance products have a premium
standard deviation of 1 or more. (By definition, the relative premium and New Zealand premium
both have a mean of one.) The lowest variance items are dairy items or wool.
Table 1: Importer Premium Variance
Product Code
High variance
(Std. dev ≥ 1)
Sheep meat (0112), Sheep skins (2116),
Woollen fabrics (6542)
Medium variance
(0.5 < Std. dev < 1)
Beef (0111), Fresh milk (0223), Butter
(0230), Carded wool (2687)
Low variance
(Std. dev ≤ 0.5)
Concentrated milk (0224), Cheese (0240),
Greasy wool (2681), Degreased wool
(2682), Casein (5922)
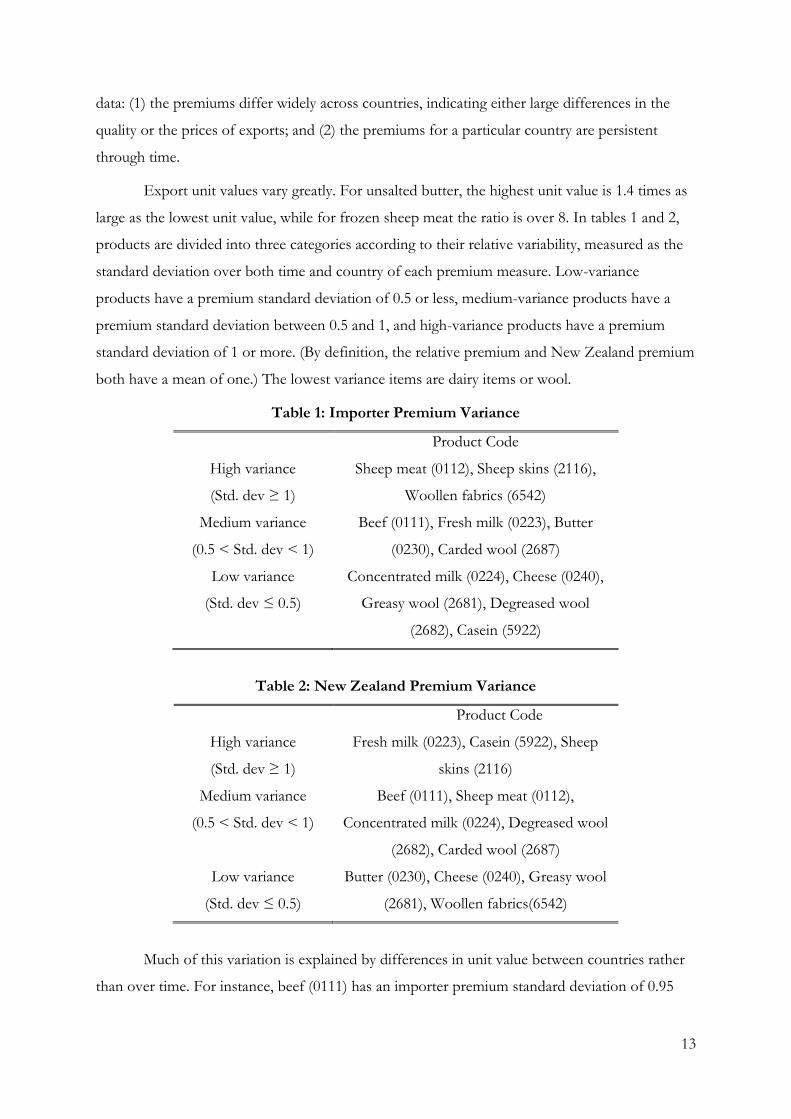
Table 2: New Zealand Premium Variance
Product Code
High variance
(Std. dev ≥ 1)
Fresh milk (0223), Casein (5922), Sheep
skins (2116)
Medium variance
(0.5 < Std. dev < 1)
Beef (0111), Sheep meat (0112),
Concentrated milk (0224), Degreased wool
(2682), Carded wool (2687)
Low variance
(Std. dev ≤ 0.5)
Butter (0230), Cheese (0240), Greasy wool
(2681), Woollen fabrics(6542)
Much of this variation is explained by differences in unit value between countries rather
than over time. For instance, beef (0111) has an importer premium standard deviation of 0.95
14
across all countries and all time periods, but the premium for beef exports to the United States
has a standard deviation of only 0.004.
In general, the importer premium and the New Zealand premium are strongly persistent
through time. For example, a country with a New Zealand premium higher than one in a given
year is likely to have a New Zealand premium higher than one the next year. A straightforward
way to demonstrate this persistence is to plot the relationship between the relative unit value
premium from the second part of the period against its value in the first half. If the premiums
are persistent, the graph will be a straight line with a slope of one.
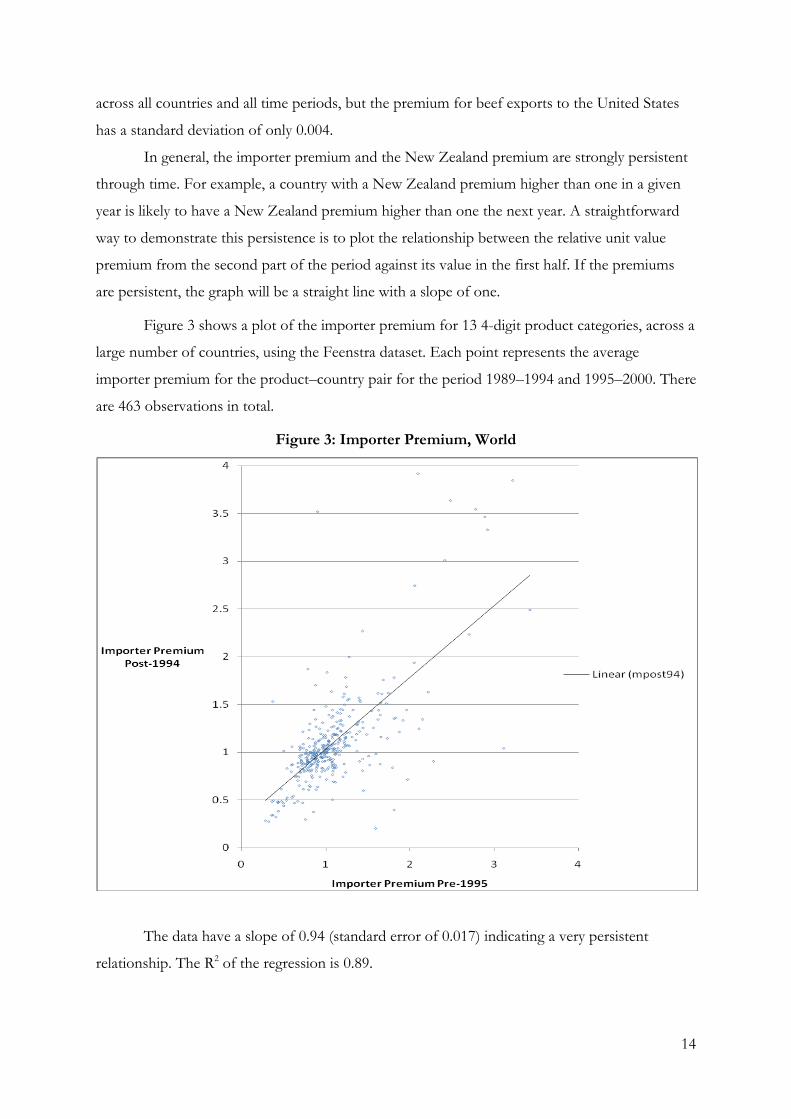
Figure 3 shows a plot of the importer premium for 13 4-digit product categories, across a
large number of countries, using the Feenstra dataset. Each point represents the average
importer premium for the product–country pair for the period 1989–1994 and 1995–2000. There
are 463 observations in total.
Figure 3: Importer Premium, World
The data have a slope of 0.94 (standard error of 0.017) indicating a very persistent
relationship. The R2 of the regression is 0.89.

15
Figures 4 and 5 provide a similar demonstration for the importer premium of two 10-
digit products: a) frozen sheep meat (0204430009, Meat; of sheep [excluding lamb], boneless
cuts, frozen) and b) unsalted butter (0405100001/0405000001, Dairy produce; derived from
milk, butter, unsalted). These graphs provide greater detail, showing the size of each export
market. In each case, the importer premium is persistent. The slope of the “frozen sheep meat”
graph is 1.06 (standard error of 0.11); the slope of the “butter” graph is 0.68 (standard error =
0.02).4 Note that the importer premiums for butter vary much less than the importer premiums
for frozen sheep meat, most likely because the category has much less quality variation.
Moreover, each product has one country which has a much lower unit value than the others: for
butter, this is Egypt (importer premium = 0.84) while for sheep meat it is China (importer
premium = 0.21).
Figure 4: Frozen Sheep Meat Importer Premium
4 The data for each graph are in table A1 and A2 in Appendix A.
Canada
China
Denmark
France
Germany
Belgium
Japan
Netherlands Switzerland
Taiwan
UK
USA
0
0.2
0.4
0.6
0.8
1
1.2
1.4
1.6
1.8
0 0.5 1 1.5 2
Mean importer premium, 1999 -
2008
Mean importer premium, 1989 - 1998

16
Figure 5: Unsalted Butter Importer Premium
The New Zealand premium measures are also very persistent. Figure 6 plots the New
Zealand premiums calculated for the 13 4-digit agricultural goods. Each of the 460 observations
is the premium calculated over the periods 1989–1994 and 1995–2000 for a particular good and
country. Extreme outliers, such as goods for which the New Zealand premium is over ten in
either period, are removed as it is likely they reflect measurement error. The slope of the line is
0.85 (standard error = 0.03) with an R2 of 0.87.
Azerbaijan
China
Iran Morocco
Saudi Arabia Taiwan
Australia
Belgium
Egypt
Japan Russia
Singapore
0.8
0.85
0.9
0.95
1
1.05
1.1
1.15
0.8 0.85 0.9 0.95 1 1.05 1.1 1.15 1.2
Mean importer premium, 1999 -
2008
Mean importer premium, 1989 - 1998

17
Figure 6: Agricultural Exports’ New Zealand Premium
The persistence of the New Zealand premium measures suggests importing countries
persistently identify New Zealand products with particular horizontal or vertical quality
characteristics. These quality characteristics enable New Zealand prices to differ from those of
other countries. If the characteristics largely reflect horizontal quality differences, the scope to
vary prices across countries for the same product will be larger than if they reflect vertical
differences, as they indicate some market power within the markets. An approximate method to
distinguish these competing explanations is discussed in the next section.
7. Sectors of Competition
To help clarify whether a New Zealand product is generally competing on price or on
quality, we use a technique based on a method developed by Karl Aiginger (1997). Aiginger
divides a country’s products into four types based on whether the country has a trade surplus or
deficit in the product, and whether its mean unit value is higher or lower than its trading
partners’ mean unit value. The basic idea is best understood by example. Consider a product
18
such as cheese. A country that imports a lot of low-priced cheese and exports a small quantity of
high-priced cheese is most likely a high-cost niche producer engaging in quality competition,
whereas if it is a net importer and only exports low-priced cheese, it is an inefficient producer
engaging in price competition. In contrast, if it is a net exporter of low-value cheese it is most
likely an efficient producer engaging in price competition, while if it is a net exporter and getting
high prices, it is most likely an efficient producer engaging in quality competition.
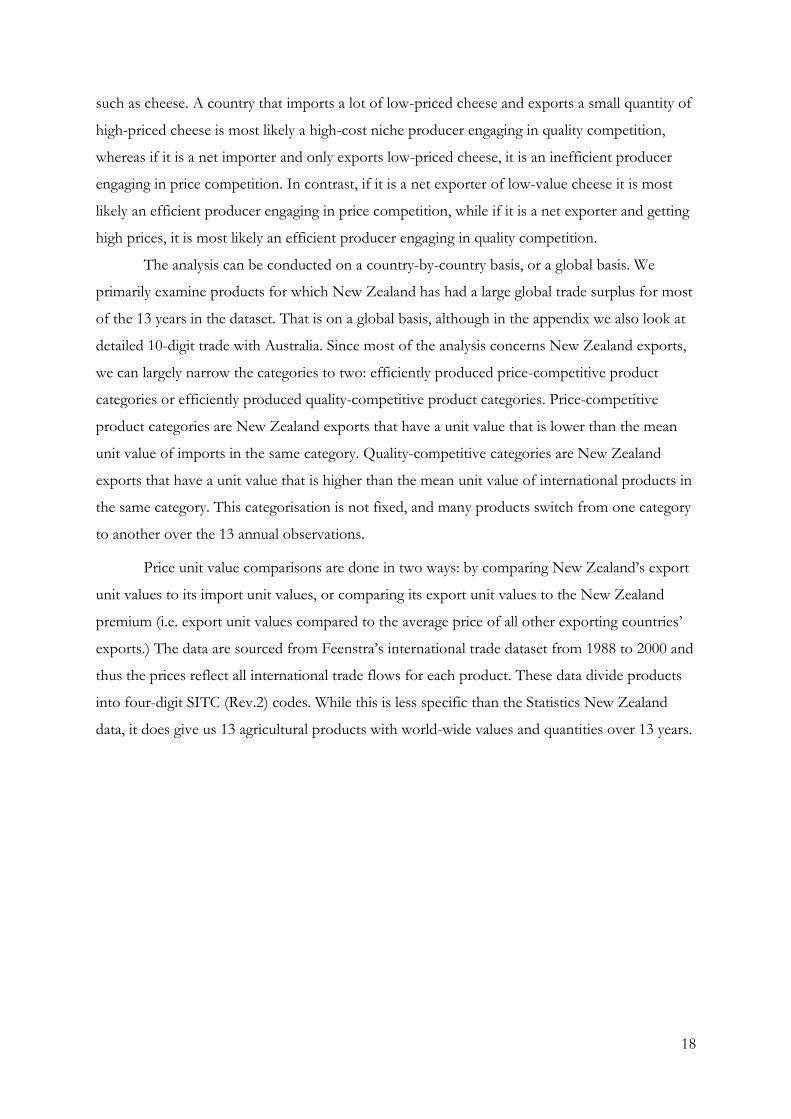
The analysis can be conducted on a country-by-country basis, or a global basis. We
primarily examine products for which New Zealand has had a large global trade surplus for most
of the 13 years in the dataset. That is on a global basis, although in the appendix we also look at
detailed 10-digit trade with Australia. Since most of the analysis concerns New Zealand exports,
we can largely narrow the categories to two: efficiently produced price-competitive product
categories or efficiently produced quality-competitive product categories. Price-competitive
product categories are New Zealand exports that have a unit value that is lower than the mean
unit value of imports in the same category. Quality-competitive categories are New Zealand
exports that have a unit value that is higher than the mean unit value of international products in
the same category. This categorisation is not fixed, and many products switch from one category
to another over the 13 annual observations.
Price unit value comparisons are done in two ways: by comparing New Zealand’s export
unit values to its import unit values, or comparing its export unit values to the New Zealand
premium (i.e. export unit values compared to the average price of all other exporting countries’
exports.) The data are sourced from Feenstra’s international trade dataset from 1988 to 2000 and
thus the prices reflect all international trade flows for each product. These data divide products
into four-digit SITC (Rev.2) codes. While this is less specific than the Statistics New Zealand
data, it does give us 13 agricultural products with world-wide values and quantities over 13 years.

19
Table 3: Price or Quality Competition
Product category Price comp.,
NZ imports
(years)
Quality comp.,
NZ imports
(years)
Price comp.,
world imports
(years)
Quality comp.,
world imports
(years)
Bovine meat, fresh, chilled or frozen 3 observations 10 observations 12 observations 1 observation
Meat of sheep & goats, fresh, chilled or frozen 13 observations 7 observations 6 observations
Milk & cream, fresh, not concentrated or
sweetened
9 observations 4 observations 13 observations
Milk & cream, concentrated or sweetened 13 observations 1 observation 12 observations
Butter 4 observations 9 observations 1 observation 12 observations
Cheese & curd 13 observations 13 observations
Sheep & lamb skin with wool on 2 observations 11 observations 13 observations
Wool, greasy or fleece-washed, of sheep or lambs 4 observations 9 observations 5 observations 8 observations
Wool, degreased, uncombed, of sheep or lambs 10 observations 3 observations 13 observations
Sheep’s or lambs’ wool, or other animal hair,
carded or combed
8 observations 5 observations 13 observations
Albuminoid substances; glues [includes casein] 13 observations 13 observations
Fabrics, woven, of sheep’s or lambs’ wool or of
fine hair
13 observations 4 observations 9 observations
Fabrics, woven, of sheep’s or lambs’ wool or of
fine hairs n.e.s.
4 observations [9
missing dates]
13 observations

20
The results are shown in table 3. The first two columns in the table are based on a
comparison of New Zealand import and export unit values. The last two columns are based on a
comparison of New Zealand’s export unit values with the price of other countries’ exports (i.e.
the New Zealand premium). By comparing the two methods’ results, we can see which New
Zealand exports clearly have a lower- or higher-than-average unit value. Products that both
methods describe as price competitive in at least eight of the 13 years are cheese and three
categories of wool.5 Products that both methods describe as quality-competitive are fresh milk,
butter, and casein; and wool fabric.6 Most meat products were ambiguous. Under the assumption
that firms find it easier to exploit market power when they are not competing on price, these
results suggest that New Zealand producers of dairy products industry (excluding cheese) have
the most scope to adjust prices without losing in external markets.
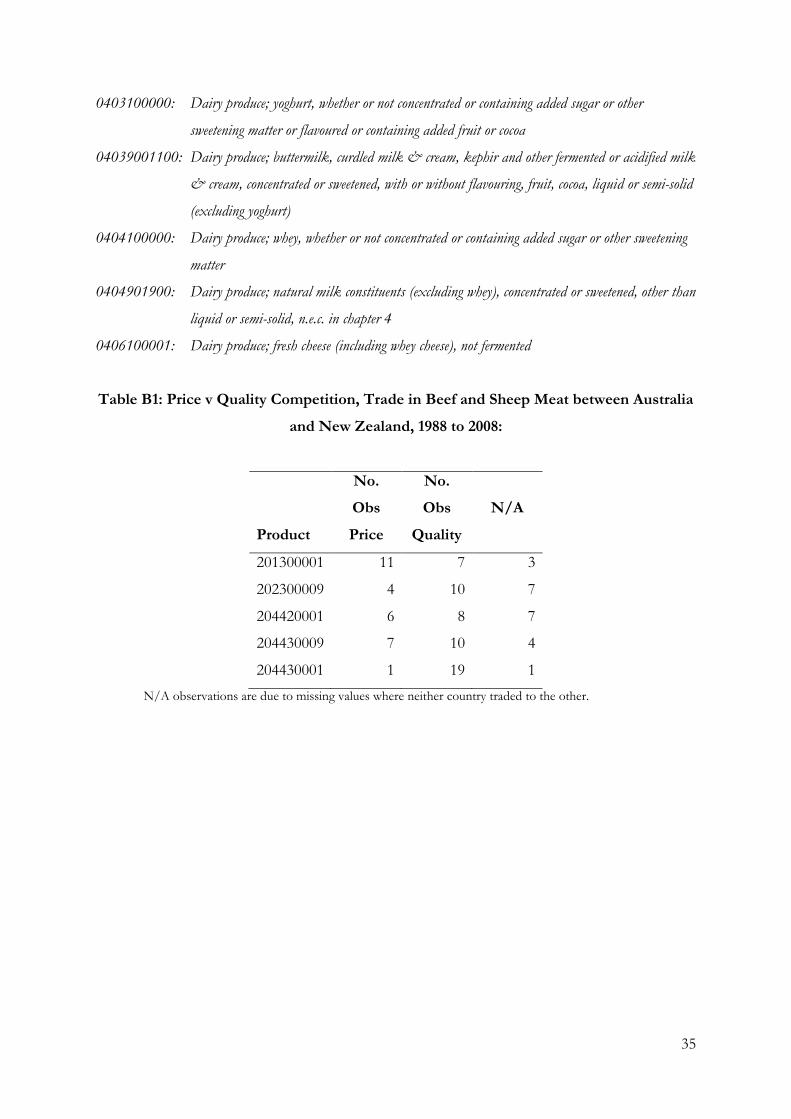
A complementary picture was obtained by analysing the bilateral trade between Australia
and New Zealand using 10-digit product categories covering dairy and meat products for the
period 1988 to 2008. There are 22 dairy products and five bovine and ovine meat products with
sufficient observations to use. The results, in Appendix B, suggest that New Zealand firms
competed on the basis of price in all eight cheese subcategories, but competed in terms of quality
in fresh cream and milk (butter had insufficient data to analyse). They also competed in terms of
quality in some specialised lamb products.
Overall, this analysis provides a way of systematically classifying some of New Zealand’s
agricultural exports, according to their relative price in third markets. Since the data requirements
for this comparison are very large – basically all international trade flows in a product category –
we have only attempted an exploratory analysis using 4-digit trade data. Analysis by country at
the ten-digit level would be more revealing about the areas where New Zealand producers are
consistently able to obtain prices higher than those of competing countries in third markets. As it
stands, the results show that producers of dairy products (except cheese) export at higher values
than other countries, suggesting these products compete with a quality dimension, thus giving
producers the greatest ability to raise average prices in the event of a cost shock.
5 Cheese & curd; wool, degreased, uncombed, of sheep of lambs; and sheep’s or lambs’ wool, or other animal hair, carded or combed. 6 Milk & cream, concentrated or sweetened; butter; albuminoid substances, glue [includes casein]; wool, greasy or fleece-washed off sheep or lambs; fabrics, woven of sheep’s or lambs’ wool or of fine hair; and fabrics, woven, of sheep’s or lambs’ wool or of fine hairs n.e.s.

21
8. Exchange Rates and the New Zealand Premium
In this section the response of the New Zealand premium measure to the exchange rate
is estimated. If New Zealand’s agricultural export markets are competitive, a change in New
Zealand’s exchange rate should not affect the price importing countries pay for New Zealand
products in their own currency. However, if New Zealand producers hold market power, an
appreciating New Zealand dollar could be associated with a higher New Zealand premium and a
depreciating New Zealand dollar should be associated with a lower New Zealand premium.
Figures 7 and 8 show how the prices of New Zealand products vary in response to
changes in the exchange rate for two different cases. Figure 7 shows the case when demand is
perfectly elastic (the horizontal curve) and producers have upward sloping supply curves but
little market power. Both curves are measured in the importing country’s currency. When the
New Zealand dollar appreciates against the importing country’s currency, the importing
country’s demand curve does not change, but from the importing country’s perspective New
Zealand’s costs have risen. This leads to a contraction in the quantity exported but no change in
the importing country’s unit value. Consequently, the New Zealand premium will not change in
response to the change in the exchange rate.
Figure 7: An appreciating New Zealand dollar with quality competition
Q
New Zealand
Premium
D
S0
p0
S1
q0 q1
b
a

22
Figure 8: A depreciating New Zealand dollar with market power
Figure 8 shows the case when the New Zealand producer has market power. In response
to an exchange rate appreciation, the marginal cost curve rises but the demand curve is
unchanged. To maximise profits in response to the rising costs, the producer should raise prices
from p0 to p1 and the quantity should contract from q0 to q1.
To examine how unit values respond to the exchange rate, we regress a time series of the
New Zealand premium for a good–country pair against a time series for the exchange rate
between New Zealand and that country, and test whether the coefficient is significantly different
from zero:
0 1Pr ln( )it it i i itNZ S S
where i is a country–good specific fixed effect
it iS S is the exchange rate at time t divided by the average exchange rate over the period
(the New Zealand price of a foreign currency).
The New Zealand premium is calculated using Feenstra’s data. A positive and statistically
significant coefficient β1 is consistent with New Zealand exporters holding market power.
Fourteen regressions were estimated: one for each of the 13 4-digit product categories,
and then all 13 together. If data were not available for all 13 years, or exports to that country
were less than $12,000 in 2000, the data were excluded. This narrowed the criteria to the largest
18 export destinations. The exchange rate data came from the St Louis Federal Reserve’s
MC0
New Zealand Premium
D
MR
Q
MC1
q1
P1
q0
P0
23
database, Federal Reserve Economic Data (FRED), with each United States exchange rate to a
third country converted to an exchange rate with New Zealand using the NZ–US exchange rate.
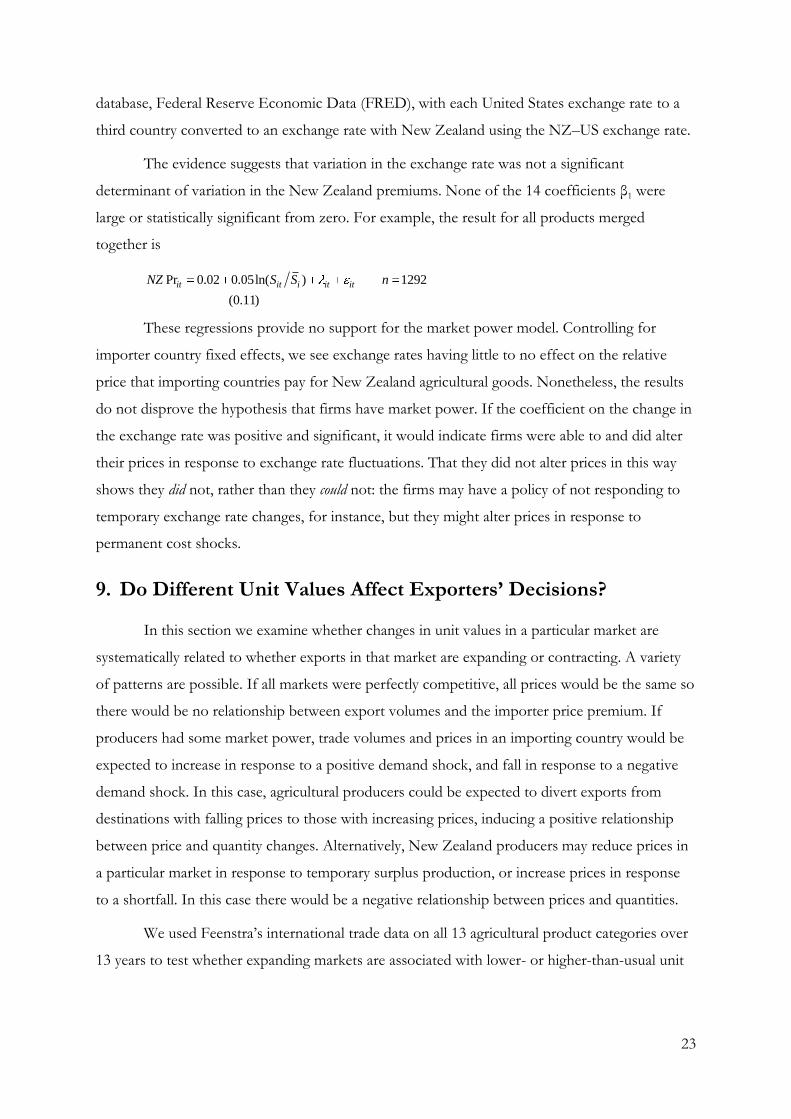
The evidence suggests that variation in the exchange rate was not a significant
determinant of variation in the New Zealand premiums. None of the 14 coefficients β1 were
large or statistically significant from zero. For example, the result for all products merged
together is
Pr 0.02 0.05ln( ) 1292
(0.11)
it it i it itNZ S S n
These regressions provide no support for the market power model. Controlling for
importer country fixed effects, we see exchange rates having little to no effect on the relative
price that importing countries pay for New Zealand agricultural goods. Nonetheless, the results
do not disprove the hypothesis that firms have market power. If the coefficient on the change in
the exchange rate was positive and significant, it would indicate firms were able to and did alter
their prices in response to exchange rate fluctuations. That they did not alter prices in this way
shows they did not, rather than they could not: the firms may have a policy of not responding to
temporary exchange rate changes, for instance, but they might alter prices in response to
permanent cost shocks.
9. Do Different Unit Values Affect Exporters’ Decisions?
In this section we examine whether changes in unit values in a particular market are
systematically related to whether exports in that market are expanding or contracting. A variety
of patterns are possible. If all markets were perfectly competitive, all prices would be the same so
there would be no relationship between export volumes and the importer price premium. If
producers had some market power, trade volumes and prices in an importing country would be
expected to increase in response to a positive demand shock, and fall in response to a negative
demand shock. In this case, agricultural producers could be expected to divert exports from
destinations with falling prices to those with increasing prices, inducing a positive relationship
between price and quantity changes. Alternatively, New Zealand producers may reduce prices in
a particular market in response to temporary surplus production, or increase prices in response
to a shortfall. In this case there would be a negative relationship between prices and quantities.
We used Feenstra’s international trade data on all 13 agricultural product categories over
13 years to test whether expanding markets are associated with lower- or higher-than-usual unit

24
values. The two relative unit value measures are compared with a measure of quantity change.
For each product, the relative quantity measure is calculated as:
, 5 , 5
, 5 ,
i t i ti
i t i t
i i
Q QQ
Q Q
For each product, each country is ranked by their level of quantity change. The average
relative unit value is calculated for the 15 largest expanding markets and the 15 largest
contracting markets. We then test whether the two groups have the same relative unit value
measure, using a simple difference in means test.
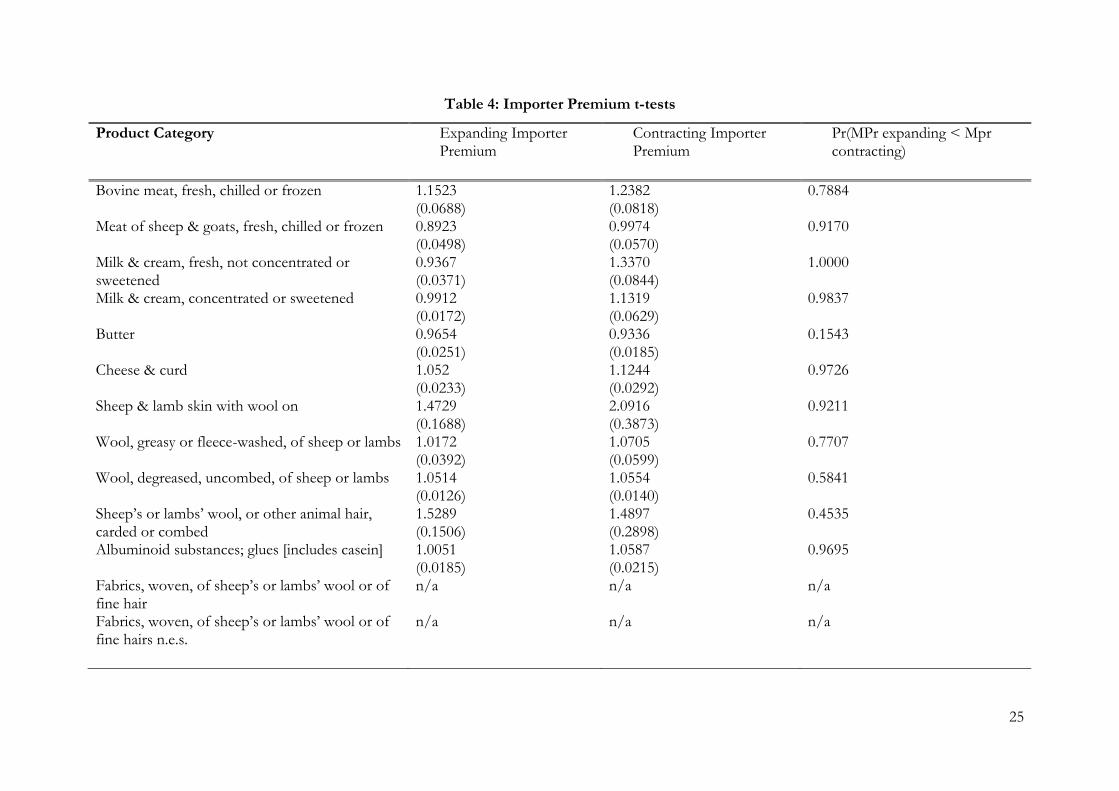
Tables 4 and 5 show our results using the importer premium and the New Zealand
premium respectively. The importer premium was higher for contracting markets than for
expanding markets for nine of the thirteen 4-digit groups. In three cases the differences are
sizeable and statistically significant at the 5% level; in one case the difference is statistically
significant but not large; and in two others the differences are large and significant at the 10%
level. The statistically significant examples of goods with lower unit values in expanding markets
than contracting markets are all dairy goods including casein, cheese, and fresh milk. It appears,
therefore, that the big increases in dairy exports over the period occurred in markets where
prices were at a discount to those in established markets.
The differences in the New Zealand premiums between expanding and contracting
markets are less marked. For six out of ten products, contracting markets have higher New
Zealand premiums than expanding markets, but only one of these differences (fresh milk) is
statistically significant. For two out of ten products, contracting markets have lower New
Zealand premiums than expanding markets, with one result (degreased wool) statistically
significant. (The other markets were either nearly identical, or had too few countries to estimate.)
The evidence that expanding dairy markets tend to have lower unit values than
contracting markets does not prove that dairy producers have market power. It is possible that
dairy producers sell in perfectly competitive markets and New Zealand producers increased their
production of lower quality goods during this period – a story consistent with the evidence from
section 7 that cheese producers tend to engage in price competition rather than quality
competition. Nonetheless, this evidence is consistent with the story that dairy producers have
some market power, even if this stems from the existence of dairy produce quotas in high-priced
markets. Since the expanding markets have typically offered lower-than-average prices, if New
Zealand dairy producers reduce output in response to a cost increase, it is plausible they could
raise average prices by contracting sales in these newly expanding, low-priced markets.
25
Table 4: Importer Premium t-tests
Product Category Expanding Importer Premium
Contracting Importer Premium
Pr(MPr expanding < Mpr contracting)
Bovine meat, fresh, chilled or frozen 1.1523 (0.0688)
1.2382 (0.0818)
0.7884
Meat of sheep & goats, fresh, chilled or frozen 0.8923 (0.0498)
0.9974 (0.0570)
0.9170
Milk & cream, fresh, not concentrated or sweetened
0.9367 (0.0371)
1.3370 (0.0844)
1.0000
Milk & cream, concentrated or sweetened 0.9912 (0.0172)
1.1319 (0.0629)
0.9837
Butter 0.9654 (0.0251)
0.9336 (0.0185)
0.1543
Cheese & curd 1.052 (0.0233)
1.1244 (0.0292)
0.9726
Sheep & lamb skin with wool on 1.4729 (0.1688)
2.0916 (0.3873)
0.9211
Wool, greasy or fleece-washed, of sheep or lambs 1.0172 (0.0392)
1.0705 (0.0599)
0.7707
Wool, degreased, uncombed, of sheep or lambs 1.0514 (0.0126)
1.0554 (0.0140)
0.5841
Sheep’s or lambs’ wool, or other animal hair, carded or combed
1.5289 (0.1506)
1.4897 (0.2898)
0.4535
Albuminoid substances; glues [includes casein] 1.0051 (0.0185)
1.0587 (0.0215)
0.9695
Fabrics, woven, of sheep’s or lambs’ wool or of fine hair
n/a n/a n/a
Fabrics, woven, of sheep’s or lambs’ wool or of fine hairs n.e.s.
n/a n/a n/a

26
Table 5: NZ Premium t-tests
Product Category Expanding Importer Premium
Contracting Importer Premium
Pr(MPr expanding < Mpr contracting)
Bovine meat, fresh, chilled or frozen 1.1766 (0.0680)
1.2669 (0.0621)
0.8357
Meat of sheep & goats, fresh, chilled or frozen 1.0085 (0.0147)
1.0128 (0.0122)
0.5890
Milk & cream, fresh, not concentrated or sweetened 1.2533 (0.0683)
1.8641 (0.3198)
0.9641
Milk & cream, concentrated or sweetened 1.1450 (0.0375)
1.3278 (0.1196)
0.9264
Butter 0.9676 (0.0108)
0.9531 (0.0108)
0.2485
Cheese & curd 0.8254 (0.0160)
0.8623 (0.0400)
0.8031
Sheep & lamb skin with wool on 3.3671 (0.4662)
3.2678 (0.5837)
0.4475
Wool, greasy or fleece-washed, of sheep or lambs 0.9811 (0.0212)
1.0719 (0.0879)
0.8415
Wool, degreased, uncombed, of sheep or lambs 0.9574 (0.0877)
0.7144 (0.0819)
0.0272
Sheep’s or lambs’ wool, or other animal hair, carded or combed
2.9272 (0.5901)
3.3736 (0.5884)
0.7035
Albuminoid substances; glues [includes casein]
Fabrics, woven, of sheep’s or lambs’ wool or of fine hair
N/a n/a n/a
Fabrics, woven, of sheep’s or lambs’ wool or of fine hairs n.e.s.
N/a n/a n/a

27
10. Conclusion
This paper has tried to ascertain if there is evidence that agricultural producers might be
able to offset an increase in costs by obtaining higher average prices for the goods they sell. If
producers have market power, they could do this by raising prices in existing markets or by
diverting goods from low-priced to high-priced markets. Both strategies would represent a
profit-maximising approach to a cost increase such as that which will occur when the ETS is
introduced. The evidence that the average value of agricultural products varies widely by export
destination means the idea has initial plausibility.
A fundamental difficulty inherent in tackling this problem concerns data – either the
analysis is restricted to a particular, extremely detailed, product category (such as 18-month aged
cheddar), in which case it is difficult to generalise, or it is done at a level at which each product
category includes goods that differ by quality. We have adopted the latter approach, and
concentrated on 13 different agricultural products for which global trade data were available,
supplementing these data with more detailed product categories where appropriate. This choice
meant it was possible to collect sufficient data to calculate the New Zealand premium, the
measure of the premium New Zealand producers get for their product in each overseas market
compared to all other exporters in the world. However, it also means that any comparison of
average prices (unit values) is bedevilled with the difficulty of knowing whether quality
differences or market power are the primary cause of average price differences.
Overall, we found little evidence that New Zealand agricultural producers have much
market power. Possibly the most telling evidence is the unresponsiveness of unit values to
exchange rate movements: when the New Zealand dollar changes value, producers do not appear
to reposition their prices relative to those of similar products sold in overseas markets by
producers from other countries. This does not rule out the possibility that they would not
reposition their prices in response to a permanent cost shock, because they may believe exchange
rate movements are temporary and respond differently to permanent and temporary cost
changes. Nonetheless, the absence of evidence of a response to temporary cost changes does not
provide evidence that producers can or will raise prices in response to a permanent cost increase.
The most interesting evidence concerns dairy prices. New Zealand is one of the world’s
largest exporters of dairy produce, but it does not get a premium price in world markets, except
for fresh milk and cream. This would suggest it mainly competes on price. At the same time,
dairy prices in the fastest expanding markets are lower than those in the fastest contracting

28
markets, suggesting some market power. These two pieces of evidence are consistent with the
argument that access to quantity-restricted markets provides producers with some market power,
enabling them to charge higher prices in established rather than new markets. If this is the case,
there is some scope for dairy producers to alter their mix of exports if costs increase, reducing
exports to low-priced countries. However, it appears unlikely that this is significant enough to
offset a substantial increase in costs, as the price differences by destination are relatively modest
for dairy products such as butter, cheese or casein.
11. References
Aiginger, Karl. 1997. “The Use of Unit Values to Discriminate Between Price and Quality
Competition,” Cambridge Journal of Economics, 5:21, pp. 571–92.
Ballingall, John, Chris Schilling and Adolf Stroombergen. 2009. “Economic Modelling of New
Zealand Climate Change Policy.” Report to the Ministry for the Environment by NZIER and
Infometrics, Ministry for the Environment, Wellington.
Cassells, Sue M. and Anton D. Meister. 2008. “Cost and Trade Impacts of Environmental
Regulations: Effluent Control and the New Zealand Dairy Sector,” Department of
Applied Economics, Massey University, Palmerston North. Available online at
http://economics-finance.massey.ac.nz/publications/discuss/dp00-08.pdf. Last accessed
20 July 2012.
Dean, J. M. 1992. “Trade and the Environment: A Survey of the Literature,” Policy Research
Working Paper WPS966, World Bank, Washington, DC.
Fabling, Richard, Arthur Grimes and Lynda Sanderson. 2009. “Whatever Next? Export Market
Choices of New Zealand Firms,” Reserve Bank Discussion Paper DP2009/19, Reserve Bank
of New Zealand, Wellington. Available online at
http://www.rbnz.govt.nz/research/discusspapers/dp09_19.pdf. Last accessed 20
January 2010.
Fonterra. 2010. “Consumer Brands.”
http://www.fonterra.co.nz/wps/wcm/connect/fonterracom/fonterra.com/Ou
r+Products/Consumer+Brands/. Last accessed 20 July 2012.
Feenstra, Robert C. “Quality Change under Trade Restraints in Japanese Autos,” Quarterly Journal
of Economics, 1:103, pp. 131–146.
Feenstra, Robert C., Robert E. Lipsey, Haiyan Deng, Alyson C. Ma, and Hengyong Mo. 2004.
“World Trade Flows: 1962–2000.” NBER Working Paper No. 11040, National Bureau of
29
Economic Research, Cambridge MA. Available online at
http://www.nber.org/papers/w11040. Last accessed 20 January 2010.
FRED, Federal Reserve Economic Data, Federal Reserve Bank of St. Louis: Exchange Rates.
Available online at http://research.stlouisfed.org/fred2/categories/158. Last accessed 5
February 2010.
General Accounting Office. 1995. “US Imports: Unit Values Vary Widely for Identically
Classified Commodities.” Report to the Chairman, Subcommittee on Trade, Committee on Ways
and Means, House of Representatives, Report GAO/GGD-95-90, United States General
Accounting Office, Washington D.C.
Hallak, Juan Carlos and Peter K. Schott. 2008. “Estimating Cross-Country Differences in
Product Quality.” NBER Working Paper No. 13807, National Bureau of Economic
Research, Cambridge MA. Available online at http://www.nber.org/papers/w13807.
Last accessed 20 January 2010.
Hallak, Juan Carlos. 2005. “Product Quality and the Direction of Trade.” Available online at
http://www-personal.umich.edu/~hallak/quality_direction.pdf. Last accessed 20 January
2010.
Khandelwal, Amit. 2008. “The Long and Short (of) Quality Ladders.” Available online at
http://www-personal.umich.edu/~hallak/quality_direction.pdf. Last accessed 20 January
2010.
New Zealand Government. 2009. “Emissions Trading Scheme Basics,”
http://www.climatechange.govt.nz/emissions-trading-scheme/basics.html. Ministry for
the Environment, Wellington, New Zealand. Last accessed 20 January 2010.
Ministry of Agriculture and Forestry. 2008. “Projected Impacts of the New Zealand Emissions
Trading Scheme at the Farm Level,” MAF, Wellington, New Zealand. Available online at
http://www.maf.govt.nz/climatechange
/reports/Projected-Impacts-of-NZETS.pdf. Last accessed 20 January 2010.
MAF. 2009. “Identification of Requirements for Verification Technologies to Support Farm &
Paddock-scale Greenhouse Gas Mitigation – Part One of Three: Literature Review,”
Wellington, New Zealand. Available online at http://www.mpi.govt.nz/news-
resources/publications. Last accessed 20 July 2012.
Schott, Peter K. 2004. “Across-Product Versus Within-Product Specialization in International
Trade.” Quarterly Journal of Economics, 119:2, pp. 647–677.

30
Statistics New Zealand. 2010. Infoshare. Available online at http://www.stats.govt.nz/infos
hare/. Last accessed 20 January 2010.
31
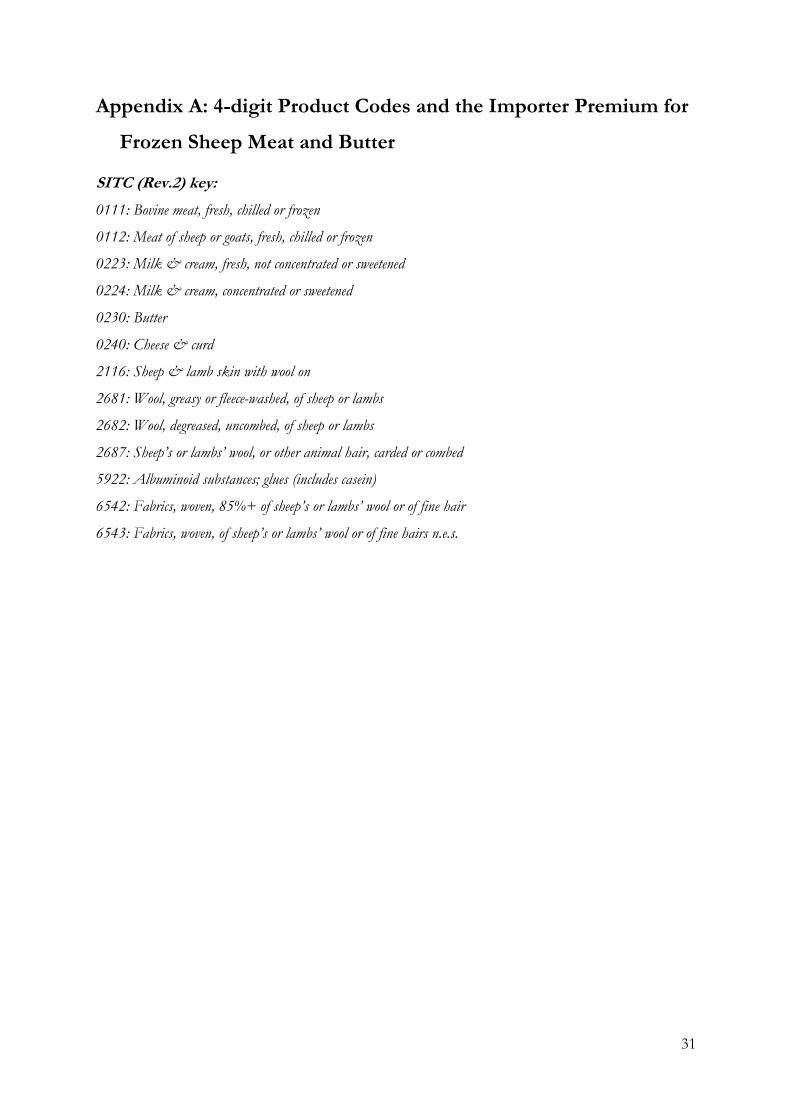
Appendix A: 4-digit Product Codes and the Importer Premium for
Frozen Sheep Meat and Butter
SITC (Rev.2) key:
0111: Bovine meat, fresh, chilled or frozen
0112: Meat of sheep or goats, fresh, chilled or frozen
0223: Milk & cream, fresh, not concentrated or sweetened
0224: Milk & cream, concentrated or sweetened
0230: Butter
0240: Cheese & curd
2116: Sheep & lamb skin with wool on
2681: Wool, greasy or fleece-washed, of sheep or lambs
2682: Wool, degreased, uncombed, of sheep or lambs
2687: Sheep’s or lambs’ wool, or other animal hair, carded or combed
5922: Albuminoid substances; glues (includes casein)
6542: Fabrics, woven, 85%+ of sheep’s or lambs’ wool or of fine hair
6543: Fabrics, woven, of sheep’s or lambs’ wool or of fine hairs n.e.s.

32
Table A1: Frozen Sheep Meat Importer Premium
Country Mean Importer Premium
89–98
Mean Importer Premium
99–08
Belgium 1.29 1.38
Canada 1.05 0.94
China, People’s Republic of 0.29 0.21
Denmark 1.03 1.25
France 0.96 1.01
Germany 1.20 1.62
Japan 0.87 0.79
Netherlands 1.15 1.42
Switzerland 1.75 1.52
Taiwan 0.82 0.60
United Kingdom 0.95 0.83
United States of America 0.91 0.92

33
Table A2: Unsalted Butter Importer Premium OLS
Country Mean Importer Premium
89–98
Mean Importer Premium
99–08
Australia 1.06 1.10
Azerbaijan 1.06 1.04
Belgium 0.93 0.89
China, People’s Republic of 0.98 1.08
Egypt 0.89 0.84
Iran 1.13 1.01
Japan 1.14 1.04
Morocco 1.04 1.01
Russia 0.96 1.03
Saudi Arabia 1.11 1.08
Singapore 1.05 1.09
Taiwan 1.07 1.09
34
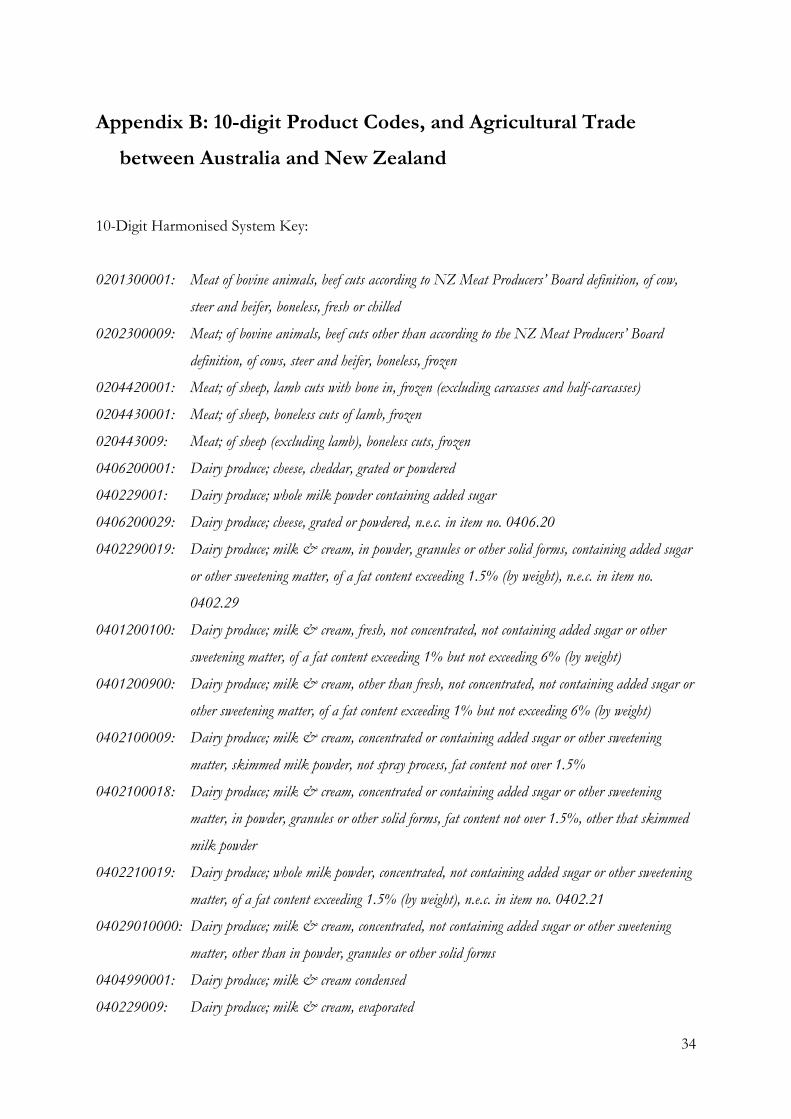
Appendix B: 10-digit Product Codes, and Agricultural Trade
between Australia and New Zealand
10-Digit Harmonised System Key:
0201300001: Meat of bovine animals, beef cuts according to NZ Meat Producers’ Board definition, of cow,
steer and heifer, boneless, fresh or chilled
0202300009: Meat; of bovine animals, beef cuts other than according to the NZ Meat Producers’ Board
definition, of cows, steer and heifer, boneless, frozen
0204420001: Meat; of sheep, lamb cuts with bone in, frozen (excluding carcasses and half-carcasses)
0204430001: Meat; of sheep, boneless cuts of lamb, frozen
020443009: Meat; of sheep (excluding lamb), boneless cuts, frozen
0406200001: Dairy produce; cheese, cheddar, grated or powdered
040229001: Dairy produce; whole milk powder containing added sugar
0406200029: Dairy produce; cheese, grated or powdered, n.e.c. in item no. 0406.20
0402290019: Dairy produce; milk & cream, in powder, granules or other solid forms, containing added sugar
or other sweetening matter, of a fat content exceeding 1.5% (by weight), n.e.c. in item no.
0402.29
0401200100: Dairy produce; milk & cream, fresh, not concentrated, not containing added sugar or other
sweetening matter, of a fat content exceeding 1% but not exceeding 6% (by weight)
0401200900: Dairy produce; milk & cream, other than fresh, not concentrated, not containing added sugar or
other sweetening matter, of a fat content exceeding 1% but not exceeding 6% (by weight)
0402100009: Dairy produce; milk & cream, concentrated or containing added sugar or other sweetening
matter, skimmed milk powder, not spray process, fat content not over 1.5%
0402100018: Dairy produce; milk & cream, concentrated or containing added sugar or other sweetening
matter, in powder, granules or other solid forms, fat content not over 1.5%, other that skimmed
milk powder
0402210019: Dairy produce; whole milk powder, concentrated, not containing added sugar or other sweetening
matter, of a fat content exceeding 1.5% (by weight), n.e.c. in item no. 0402.21
04029010000: Dairy produce; milk & cream, concentrated, not containing added sugar or other sweetening
matter, other than in powder, granules or other solid forms
0404990001: Dairy produce; milk & cream condensed
040229009: Dairy produce; milk & cream, evaporated
35
0403100000: Dairy produce; yoghurt, whether or not concentrated or containing added sugar or other
sweetening matter or flavoured or containing added fruit or cocoa
04039001100: Dairy produce; buttermilk, curdled milk & cream, kephir and other fermented or acidified milk
& cream, concentrated or sweetened, with or without flavouring, fruit, cocoa, liquid or semi-solid
(excluding yoghurt)
0404100000: Dairy produce; whey, whether or not concentrated or containing added sugar or other sweetening
matter
0404901900: Dairy produce; natural milk constituents (excluding whey), concentrated or sweetened, other than
liquid or semi-solid, n.e.c. in chapter 4
0406100001: Dairy produce; fresh cheese (including whey cheese), not fermented
Table B1: Price v Quality Competition, Trade in Beef and Sheep Meat between Australia
and New Zealand, 1988 to 2008:
Product
No.
Obs
Price
No.
Obs
Quality
N/A
201300001 11 7 3
202300009 4 10 7
204420001 6 8 7
204430009 7 10 4
204430001 1 19 1
N/A observations are due to missing values where neither country traded to the other.
36
Table B2: Price v Quality Competition, Trade in Dairy Products between Australia and
New Zealand, 1988 to 2008:
Product No. Obs Price
No.
Obs
Quality
N/A
0406200001 12 2 7
0402290001 6 4 11
0406200029 19 2 0
0402290019 7 5 9
0402290029 8 4 9
0401200100 5 6 10
0401200900 3 6 12
0402100009 5 9 7
0402100018 3 5 13
0402910000 0 13 8
0402990001 4 12 5
0402990009 1 16 4
0403100000 10 10 1
0403901100 10 8 3
0404100000 5 12 4
0404901900 7 8 6
0406100001 17 4 0
0406200029 19 2 0
0406300000 21 0 0
0406400000 16 5 0
0406900011 19 1 1
0406900039 21 0 0
Recent Motu Working Papers
All papers in the Motu Working Paper Series are available on our website www.motu.org.nz, or by contacting us on
[email protected] or +64 4 939 4250.
12-08 Woods, Darian, with Andrew Coleman. 2012. “Price, Quality, and International Agricultural Trade.”
12-07 Olssen, Alex, Wei Zhang, David Evison, and Suzi Kerr. 2012. “A Forest-Profit Expectations Dataset for New
Zealand, 1990–2008”.
12-06 Kerr, Suzi, and Alex Olssen. 2012. “Gradual Land-Use Change in New Zealand: Results from a Dynamic
Econometric Model”.
12-05 Abramitzky, Ran, and Isabelle Sin. 2012. “Book Translations as Idea Flows: The Effects of the Collapse of
Communism on the Diffusion of Knowledge”.
12-04 Fabling, Richard, and David C. Maré. 2012. “Cyclical Labour Market Adjustment in New Zealand: The Response of
Firms to the Global Financial Crisis and its Implications for Workers”.
12-03 Kerr, Suzi, and Adam Millard-Ball. 2012. “Cooperation to Reduce Developing Country Emissions”.
12-02 Stillman, Steven, Trinh Le, John Gibson, Dean Hyslop and David C. Maré. 2012. “The Relationship between
Individual Labour Market Outcomes, Household Income and Expenditure, and Inequality and Poverty in New
Zealand from 1983 to 2003”.
12-01 Coleman, Andrew. 2012. “The Effect of Transport Infrastructure on Home Production Activity: Evidence from
Rural New York, 1825–1845”.
11-15 McDonald, Hugh, and Suzi Kerr. 2011. “Trading Efficiency in Water Quality Trading Markets: An Assessment of
Trade-Offs”.
11-14 Anastasiadis, Simon, Marie-Laure Nauleau, Suzi Kerr, Tim Cox, and Kit Rutherford. 2011. “Does Complex
Hydrology Require Complex Water Quality Policy? NManager Simulations for Lake Rotorua”.
11-13 Tímár, Levente. 2011. “Rural Land Use and Land Tenure in New Zealand”.
11-12 Grimes, Arthur. 2011. “Building Bridges: Treating a New Transport Link as a Real Option”.
11-11 Grimes, Arthur, Steven Stillman and Chris Young. 2011. “Homeownership, Social Capital and Parental Voice in
Schooling”.
11-10 Maré, David C., and Richard Fabling. 2011. “Productivity and Local Workforce Composition”.
11-09 Karpas, Eric, and Suzi Kerr. 2011. “Preliminary Evidence on Responses to the New Zealand Emissions Trading
Scheme”.
11-08 Maré, David C., and Andrew Coleman. 2011. “Patterns of firm location in Auckland”.
11-07 Maré, David C., and Andrew Coleman. 2011. “Estimating the determinants of population location in Auckland”.
11-06 Maré, David C., Andrew Coleman and Ruth Pinkerton. 2011. “Patterns of population location in Auckland”.
11-05 Maré, David C., Richard Fabling, and Steven Stillman. 2011. “Immigration and Innovation”.
11-04 Coleman, Andrew. 2011. “Financial Contracts and the Management of Carbon Emissions in Small Scale Plantation
Forests”.
11-03 Bergstrom, Katy, Arthur Grimes, and Steven Stillman. 2011. “Does Selling State Silver Generate Private Gold?
Determinants and Impacts of State House Sales and Acquisitions in New Zealand”.
11-02 Roskruge, Matthew, Arthur Grimes, Philip McCann, and Jacques Poot. 2011. “Homeownership and Social Capital
in New Zealand”.
11-01 Fabling, Richard. 2011. “Keeping It Together: Tracking Firms on New Zealand’s Longitudinal Business Database”.
Copyright © 2022 FDOKUMEN