Insulin Resistance - DIVA
56
ACTA UNIVERSITATIS UPSALIENSIS UPPSALA 2017 Digital Comprehensive Summaries of Uppsala Dissertations from the Faculty of Medicine 1316 Insulin Resistance Causes, biomarkers and consequences CHRISTOPH NOWAK ISSN 1651-6206 ISBN 978-91-554-9856-6 urn:nbn:se:uu:diva-316891
-
Upload
khangminh22 -
Category
Documents
-
view
1 -
download
0
Transcript of Insulin Resistance - DIVA

ACTAUNIVERSITATIS
UPSALIENSISUPPSALA
2017
Digital Comprehensive Summaries of Uppsala Dissertationsfrom the Faculty of Medicine 1316
Insulin Resistance
Causes, biomarkers and consequences
CHRISTOPH NOWAK
ISSN 1651-6206ISBN 978-91-554-9856-6urn:nbn:se:uu:diva-316891

Dissertation presented at Uppsala University to be publicly examined in Room E10:1309(BMC Navet), Biomedicinskt Centrum (BMC), Husargatan 3, Uppsala, Monday, 22 May 2017at 09:15 for the degree of Doctor of Philosophy (Faculty of Medicine). The examination willbe conducted in English. Faculty examiner: Senior Research Fellow (Sir Henry Dale Fellow)Rachel Freathy (Medical School, University of Exeter, Exeter, UK).
AbstractNowak, C. 2017. Insulin Resistance. Causes, biomarkers and consequences. DigitalComprehensive Summaries of Uppsala Dissertations from the Faculty of Medicine 1316.54 pp. Uppsala: Acta Universitatis Upsaliensis. ISBN 978-91-554-9856-6.
The worldwide increasing number of persons affected by largely preventable diseases likediabetes demands better prevention and treatment. Insulin is required for effective utilisation ofcirculating nutrients. Impaired responsiveness to insulin (insulin resistance, IR) is a hallmark oftype 2 diabetes and independently raises the risk of heart attack and stroke. The pathophysiologyof IR is incompletely understood. High-throughput measurement of large numbers of circulatingbiomarkers may provide new insights beyond established risk factors.
The aims of this thesis were to (i) use proteomics, metabolomics and genomics methods inlarge community samples to identify biomarkers of IR; (ii) assess biomarkers for risk predictionand insights into aetiology and consequences of IR; and (iii) use Mendelian randomisationanalysis to assess causality.
In Study I, analysis of 80 circulating proteins in 70-to-77-year-old Swedes identifiedcathepsin D as a biomarker for IR and highlighted a tentative causal effect of IR on raised plasmatissue plasminogen activator levels. In Study II, nontargeted fasting plasma metabolomics wasused to discover 52 metabolites associated with glycaemic traits in non-diabetic 70-year-oldmen. Replication in independent samples of several thousand persons provided evidence fora causal effect of IR on reduced plasma oleic acid and palmitoleic acid levels. In Study III,nontargeted metabolomics in plasma samples obtained at three time points during an oralglucose challenge in 70-year-old men identified associations between a physiologic measure ofIR and concentration changes in medium-chain acylcarnitines, monounsaturated fatty acids, bileacids and lysophosphatidylethanolamines. Study IV provided evidence in two large longitudinalcohorts for causal effects of type 2 diabetes and impaired insulin secretion on raised coronaryartery disease risk.
In conclusion, the Studies in this thesis provide new insights into the pathophysiologyand adverse health consequences of IR and illustrate the value of combining traditionalepidemiologic designs with recent molecular techniques and bioinformatics methods. Theresults provide limited evidence for the role of circulating proteins and small molecules in IRand require replication in separate studies and validation in experimental designs.
Keywords: insulin resistance, diabetes, insulin secretion, cardiovascular, mendelianrandomization, proteomics, metabolomics, genomics, molecular epidemiology, complexdisease, risk prediction, coronary heart disease, stroke, hyperglycemia
Christoph Nowak, Department of Medical Sciences, Molecular epidemiology, Husargatan 3,Biomedicinskt Centrum (BMC), Uppsala University, SE-75123 Uppsala, Sweden.
© Christoph Nowak 2017
ISSN 1651-6206ISBN 978-91-554-9856-6urn:nbn:se:uu:diva-316891 (http://urn.kb.se/resolve?urn=urn:nbn:se:uu:diva-316891)

To my family; to Mendel

It was evening when K. arrived. The village lay deep in snow. There was nothing to be seen of the Castle Mount, for mist and darkness surrounded it, and not the faintest glimmer of light showed where the great castle lay. For a long time, K. stood on the wooden bridge leading from the road to the village, looking up at what seemed to be a void.
Franz Kafka. The Castle [1922, translated from German]
Эта песня последней встречи. Я взглянула на темный дом. Только в спальне горели свечи Равнодушно-желтым огнем. [The song of the last meeting. I see that dark house again. Only bedroom candles burning, With a yellow, indifferent, flame.]
Anna Akhmatova. Песня последней встречи [1911, translated from Russian]
I Among twenty snowy mountains, The only moving thing Was the eye of the blackbird. XIII It was evening all afternoon. It was snowing And it was going to snow. The blackbird sat In the cedar-limbs.
Wallace Stevens. Thirteen ways of looking at a blackbird [1917]

List of Paper
This thesis is based on the following papers, which are referred to in the text by their Roman numerals.
I Nowak, C., Sundström, J., Gustafsson, S., Giedriatis, V., Lind, L., Ingelsson, E., Fall, T., (2016) Protein biomarkers for insulin resistance and type 2 diabetes risk in two large community cohorts. Diabetes, 65(1):276-284
II Nowak, C., Salihovic, S., Ganna, A., Brandmaier, S., Tukiainen, T., Broeckling, C.D., Magnusson, P.K., Prenni, J.E., Wang-Sattler, R., Peters, A., Strauch, K., Meitinger, T., Giedraitis, V., Ärnlöv, J., Berne, C., Gieger, C., Ripatti, S., Lind, L., Pedersen, N.L., Sundström, J., Ingelsson, E., Fall, T., (2016) Effect of insulin resistance on monounsaturated fatty acid levels: a multi-cohort non-targeted metabolomics and Mendelian randomization study. PLOS Genetics, 12(10):1-19
III Nowak, C., Trombley, S., Salihovic, S., Castillejo-Lopez, C., Ganna, A., Shen, X., Cook, N., Broeckling, C.D., Prenni, J.E., Berne, C., Giedraitis, V., Ärnlöv, J., Lind, L., Sundström, J., Fall, T.,* Ingelsson, E.,* Metabolite profiles during an oral glucose tolerance test reveal new associations with clamp-measured insulin sensitivity. Manuscript
IV Nowak, C., Sundström, J., Ingelsson, E.,* Fall, T.,* Type 2 diabetes, glycaemic traits and cardiovascular disease: a Mendelian Randomization study. Manuscript
*shared last authors
Reprints were made with permission from the respective publishers.

Related publications not included in the thesis
• Nowak, C., Ingelsson, E., Fall, T., (2015) Use of type 2 diabetes risk scores in clinical practice: a call for action, Lancet Diabetes Endocrinol, 3(3):166-167
• Fall, T., Salihovic, S., Brandmaier, S., Nowak, C., Ganna, A.,
Gustafsson, S., Broeckling, C.D., Prenni, J.E., Kastenmuller, G., Peters, A., Magnusson, P.K., Wang-Sattler, R., Griedraitis, V., Berne, C., Gieger, C., Pedersen, N., Ingelsson, E., Lind, L., (2016) Non-targeted metabolomics combined with genetic analyses identifies bile acid synthesis and phospholipid metabolism as being associated with incident type 2 diabetes, Diabetologia, 59(10):2114-2124
• Stenemo, M., Nowak, C., Byberg, L., Sundström, J., Giedraitis, V.,
Lind, L., Ingelsson, E., Fall, T.,* Ärnlöv, J.,* Circulating proteins as predictors of incident heart failure in the elderly. Submitted manuscript
*shared last authors

Contents
1. Introduction ............................................................................................... 111.1. Global significance of cardiometabolic diseases ........................... 111.2. Role of molecular biomarkers ........................................................ 11
2. Insulin resistance ................................................................................... 132.1. Pathophysiology ............................................................................. 132.2. Epidemiology ................................................................................. 142.3. Measurement .................................................................................. 152.4. Genetics .......................................................................................... 16
3. Omics biomarkers .................................................................................. 183.1. Overview ........................................................................................ 183.2. Proteomics ...................................................................................... 193.3. Metabolomics ................................................................................. 19
4. Mendelian randomisation ...................................................................... 224.1. Concept .......................................................................................... 224.2. Principles and application .............................................................. 234.3. Sources of bias ............................................................................... 25
5. Aims ....................................................................................................... 275.1. General aim .................................................................................... 275.2. Specific aims of the studies ............................................................ 27
6. Study samples ........................................................................................ 286.1. ULSAM .......................................................................................... 286.2. PIVUS ............................................................................................ 286.3. TwinGene ....................................................................................... 296.4. UK Biobank ................................................................................... 296.5. Samples contributing summary-level data ..................................... 29
7. Methods ................................................................................................. 317.1. Measurement of insulin resistance ................................................. 317.2. Further methods and statistical analysis ......................................... 31

8. Main results and discussion ................................................................... 348.1. Study I ............................................................................................ 348.2. Study II ........................................................................................... 368.3. Study III ......................................................................................... 368.4. Study IV ......................................................................................... 388.5. Strengths and limitations ................................................................ 39
9. Conclusion and future perspective ......................................................... 40
10. Summary in Swedish - sammanfattning på svenska ............................ 43
11. Acknowledgements .............................................................................. 45
12. References ............................................................................................ 47

Abbreviations
CAD Coronary artery disease CETP Cholesteryl ester transfer protein CI Confidence interval CVD Cardiovascular disease DNA Deoxyribonucleic acid FABP4 Fatty acid-binding protein 4 FA Fatty acid FDR False discovery rate GC Gas chromatography GWAS Genome-wide association study HDL-C High-density lipoprotein-cholesterol HGF Hepatocyte growth factor HOMA-IR Homeostasis model assessment insulin resistance HR Hazard ratio IL-1ra Interleukin-1 receptor antagonist IR Insulin resistance LC Liquid chromatography LDL-C Low-density lipoprotein-cholesterol LysoPE Lysophosphatidylethanolamine MetS Metabolic syndrome MI Myocardial infarction MR Mendelian randomisation MS Mass spectrometry NMR Nuclear magnetic resonance OR Odds ratio PIVUS Prospective investigation of the vasculature in Uppsala seniors RCT Randomised controlled trial RNA Ribonucleic acid SCD-1 Stearoyl coenzyme A desaturase 1 SD Standard deviation SNP Single nucleotide polymorphism T2D Type 2 diabetes mellitus t-PA Tissue plasminogen activator ULSAM Uppsala longitudinal study of adult men UPLC Ultra performance liquid chromatography


11
1. Introduction
1.1. Global significance of cardiometabolic diseases Cardiovascular diseases (CVD), including ischaemic stroke, myocardial infarction and renal insufficiency, are the leading causes of death wordwide1, resulting in 17.9 million fatalities in 2015 - an increase of 12.5% since 20052. Three quarters of cardiovascular deaths occur in low and middle-income countries and a large proportion of CVD can be prevented by addressing behavioural risk factors like unhealthy diet, sedentary lifestyle and smoking1,3. Type 2 diabetes mellitus (T2D) is a major contributor to cardiovascular morbidity and accounted for 1.5 million deaths worldwide in 2015 - an increase of 32.1% over ten years2. The number of individuals affected by diabetes in 2015 exceeded 415 million (1 in 11 adults) and is projected to grow to 642 million by 20404. An ageing population and the rise in obesity have contributed to an increase in the prevalence of diabetes from 3.6% in 1980 to 8.8% in 2014 for men, and from 4.7% to 8.2% in women5. Annually, diabetes accounts for over 12% of global health expenditure4 and the loss of 64 million years of healthy life6.
Type 2 diabetes develops due to impaired insulin-stimulated glucose uptake (insulin resistance, IR) and pancreatic beta cell dysfunction7. Insulin resistance affects a growing proportion of the global population, is the main precursor of T2D, and independently raises the risk of CVD8-12. The continuing increase in IR and T2D with the resulting global toll of premature death and disability due to largely preventable afflictions demand new and innovative approaches to better prevention and treatment. A priority is the identification of at-risk persons, given an estimated 46.5% of diabetic persons who are currently undiagnosed4.
1.2. Role of molecular biomarkers Traditional risk factors for IR and T2D - including non-modifiable factors (e.g., South East Asian ethnicity9) and preventable factors (e.g., physical inactivity and smoking4,8,9) - have provided pathophysiologic insights, led to a selection of risk scores, and enabled treatment advances13,14. Nonetheless, the number of affected persons continues to increase, risk prediction is still poor, and a molecularly targeted ‘precision medicine’ approach to treatment

12
is far from reality. The clinical and aetiological heterogeneity of T2D and IR is more and more being recognised but currently ill-defined15. Tremendous progress in biomedical technology, computing power and bioinformatics increasingly enables high-throughput profiling of molecular markers in thousands of individuals. So-called -omics platforms measure large numbers of molecules that cover a range of physiologic levels - from profiling of deoxyribonucleic acid (DNA) in genomics to the measurement of broad classes of metabolites in metabolomics. Molecular biomarkers may contribute new information beyond established paradigms and the aim of this thesis is to evaluate their role in providing insights into pathophysiology, risk assessment and complications of IR.

13
2. Insulin resistance
2.1. Pathophysiology Insulin resistance is defined as impaired insulin-stimulated glucose uptake8,9; or, in a broader sense, as the desensitisation of the body's response to insulin encompassing growth, development and metabolism16. In this thesis, IR is primarily defined as the relative decline in uptake of circulating glucose by insulin-responsive tissues given the same concentration of plasma insulin. The resulting hyperglycaemia is a major pathogenic mechanism for adverse macro- and microvascular consequences. If accompanied by pancreatic beta cell dysfunction and relative insulin deficiency, IR can progress to T2D7,9,12. Rare forms of monogenic IR caused, e.g., by mutations in the insulin receptor gene INSR17, are not subject of this thesis, which addresses the common polygenic form of IR. Figure 1 summarises the main components of IR.
Figure 1. Components and consequences of IR

14
The pathophysiology of IR is complex and incompletely understood. All organ systems contribute to IR and predominate in different physiologic states. Following a meal and during physical exercise, skeletal muscle is the major determinant of insulin sensitivity18. In the fasted state, IR is mainly determined by hepatic regulation of glycolysis and gluconeogenesis12,19. Adipose tissue has a minor contribution to whole-body insulin sensitivity but functions as an important endocrine and inflammatory mediator for other organs20,21. Inflammatory cells, including macrophages22, T cells23 and B cells24, residing in adipose tissue also contribute to IR and the role of the central nervous system is increasingly being recognised25.
Importantly, insulin sensitivity is a continuous trait. Although some studies use cut-off values on different measures to define ‘insulin resistant’ and ‘insulin sensitive’ persons26, this approach is flawed. First, there is no single measure of IR - most large studies use surrogate measures based on fasting blood samples and methods vary in their specificity for hepatic or muscle IR. Second, what determines clinically significant IR varies between ethnic groups and is co-determined by compensatory hyperinsulinaemia and beta cell dysfunction. Third, although large longitudinal studies like the Framingham Heart Study27 and the Insulin Resistance Atherosclerosis Study28 have provided major insights, the consequences of pre-diabetic IR are still underexplored and the majority of affected persons continue to be undetected.
2.2. Epidemiology The role of IR in the global ‘epidemic’ of lifestyle-related diseases was highlighted by Gerald Reaven in his 1988 Banting Lecture29. Reaven outlined IR as a common contributor to the adverse constellation of abdominal obesity, hypertension, impaired glucose tolerance and dyslipidaemia (later called the metabolic syndrome, MetS) that is estimated to put over a quarter of U.S. adults at elevated cardiovascular risk8. A modelling study in the United States estimated that preventing IR in young adults could avoid 42% of myocardial infarctions (MI) and that IR was a more important CVD risk factor than hypertension30.
Because of the difficulties of measuring IR, no specific prevalence estimates have been reported. Best estimates derive from studies of the MetS, which is intimately related to IR. For instance, a Spanish study found that the MetS affected 22.7% of 11,149 adults in 2008−2011, with increased prevalence in under-65-year-old men31. A 2012 survey of 1,178 adults in urban India found an age-standardised prevalence of the MetS of 24.9% among men and 42.3% among women, and an association with unhealthy diet32. Although more common in older age, IR already affects a significant

15
number of teenagers, with 6.7% of male and 2.1% of female 12-to-17-year-old U.S. Americans affected by the MetS in 1999−200433.
Obesity and sedentary lifestyle are the main modifiable risk factors for IR and account for up to half of its variability in non-diabetic persons34. Still, many obese individuals are not insulin resistant and a large number of lean persons develop IR16,35. Beyond obesity per se, recent studies indicate that fat distribution in internal rather than peripheral depots appears to affect IR36. Predisposing lifestyle factors include smoking, alcohol abuse and low-fibre/high-sugar diet3,37,38. Non-modifiable risk factors include non-European ethnicity37,39 and a genetic predisposition due to common low-effect polymorphisms16,40. After accounting for other risk factors, advancing age has only a small effect on IR41,42.
The consequences of IR can be chronic and debilitating. Insulin resistance is the major modifiable risk factor for T2D12,43,44. It is also an independent risk factor for coronary artery disease (CAD)11,45-47, thromboembolic stroke11,45,48 and other age-related diseases8,10,16,49. As summarised in Figure 1, IR is associated with a cluster of adverse metabolic traits including dyslipidaemia, hypertension and low-grade inflammation, all of which raise the risk of cardiovascular, renal and other diseases. The significant number of persons at risk for adverse health consequences because of IR implies that better ways of identifying high-risk individuals who do not to meet diagnostic criteria for T2D are urgently needed. This quest for improving population health by defining new markers and molecular mechanisms of IR is the motivation for this thesis.
2.3. Measurement The assessment of IR is not trivial. Glucose metabolism is rapid, dependent on body composition and dietary habits, and the physiologic contributors to IR differ between fasted and fed, rested and exercised state50,51. The liver is the main determinant of IR in the fasted state51, whereas skeletal muscle is the major glucose-disposing organ in the postprandial period18. Whilst IR varies considerably between persons49, it is relatively stable within individuals over time52.
The ‘gold standard’ for measuring IR is the assessment of glucose uptake in response to insulin. Methods include radioactively labelled glucose tracing53, the insulin suppression test54 and clamp studies51,55. Studies II and III use the hyperinsulinaemic-euglycaemic clamp method55, which suppresses hepatic gluconeogenesis by continuous insulin infusion, whilst a feedback loop between a blood glucose analyser and a glucose infusion adjusted in response ensures a steady euglycaemic state. The M/I index reflects the amount of glucose disposal from blood per unit of insulin infusion and quantifies insulin sensitivity. Although a close reflection of

16
physiology, clamp studies are cumbersome as fasted subjects undergo several-hour-long medically monitored testing that involves insulin infusions at supra-physiologic levels. The associated personnel, time, and fitness requirements render large-scale studies difficult.
Simpler surrogate measures are based on plasma glucose and insulin levels obtained after a two-hour oral glucose test (e.g., the minimal model56 and the Matsuda index57) or in the fasted state (e.g., the Homeostasis Model Assessment IR, HOMA-IR19). Most epidemiologic studies and Study I use HOMA-IR. It is calculated in its simplest form as the product of fasting plasma glucose and insulin levels divided by a constant, and was derived from mathematical models of insulin secretion as a function of glucose and insulin levels during euglycaemic clamp assessment in a small sample of healthy and diabetic volunteers19,58. The HOMA-IR presumes a feedback loop in the fasted state between hepatic glucose release and pancreatic insulin secretion59. Whilst HOMA-IR estimates fasting IR based on routine laboratory values, its correlation with physiologic methods is only moderate, with reported values between 0.6−0.916,26,49,60. Although not optimally reflective of the physiology, HOMA-IR can provide reasonable population estimates of future CVD and diabetic complications and has been applied in a variety of contexts26. Examples include the evaluation of glycaemic treatment targets in the UK Prospective Diabetes Study61, risk assessment for CAD62, evaluation of benefits from a Mediterranean diet63, and the discovery of genetic effects on IR64.
The choice of measure (reviewed in65-67) depends on the aim of the study, sample size and resource considerations. For instance, is the aim to assess hepatic (HOMA-IR) or peripheral IR (clamp); fasting (HOMA-IR) or stimulated state (Matsuda index); a dynamic (minimal model) or steady state (clamp); population averages (HOMA-IR) or individual values (clamp)?
2.4. Genetics The heritability of IR in family studies is estimated between 40%−50%, although a wide range values have been reported28,68-72. Up to 44% of the heritability is assumed to be explained by currently largely unidentified genetic polymorphisms found in a least 5% of the population73. The majority of known genetic variants associated with T2D affect insulin secretion; only a minority act primarily on IR74 and several obstacles have rendered the identification of genetic contributions to IR difficult. There are no large samples with physiologic measures of insulin sensitivity; the largest genome-wide association study (GWAS) of up to 46,186 non-diabetic adults used HOMA-IR64. Fasting measures like HOMA-IR do not allow for interrogation of organ-level or postprandial IR that may differ in genetic origins. The importance of taking the assessment method into account is

17
highlighted by two studies that found only modest genetic correlations of −0.53 and −0.57 between heritability estimates for HOMA-IR and euglycaemic clamp75 or minimal model76, respectively. In the largest GWAS of physiologic measures of IR to date in 5,624 persons in the GENEticS of Insulin Sensitivity (GENESIS) consortium77, no individual single nucleotide polymorphism (SNP) was associated with IR at genome-wide significance (P > 5 × 10⁻⁸). The authors nonetheless pursued a variant (rs1208A>G) in NAT2 associated with IR at P = 9.8 × 10⁻⁷. Subsequent functional studies in mice provided evidence for a causal role of NAT2 in insulin response, demonstrating the value of genetic interrogation of IR for potentially clinically actionable discoveries and the insufficient size of current samples to detect relevant signals77.
A distinct genetic contribution to IR was further demonstrated by Dimas and colleagues78, who identified five genetic clusters for T2D, one of which comprised IR-associated loci (PPARG, KLF14, IRS1, GCKR). Scott and colleagues40 derived a ten-SNP genetic risk score for IR by selecting variants with genome-wide significant associations with fasting insulin and nominal associations (P < 0.05) with raised plasma triglyceride and reduced high-density lipoprotein-cholesterol (HDL-C) as hallmarks of common IR. The score was validated with clamp measures in 1,899 non-diabetic persons and is used as genetic instrument for IR in this thesis. Scott and colleagues' and others' efforts36,40,79 to utilise genomics for aetiologic insights have led to an interesting discovery that disentangles the relationship between obesity, IR and cardiometabolic risk: Genetic IR is inversely associated with obesity, hip circumference and body fat percentage, and one mechanism by which it raises cardiometabolic risk appears to be impaired peripheral adipose tissue expansion and ectopic fat deposition in internal organs in situations of energy surplus. This adipose tissue expandability hypothesis concurs with the raised cardiovascular risk observed in rare monogenic forms of lipodystrophy/IR and the large number of lean persons with impaired insulin sensitivity36,80.

18
3. Omics biomarkers
3.1. Overview Recent advances in experimental and data analytics enable increasingly high-throughput measurements of large numbers of molecules in biological samples. These -omics methods enable the quantitative assessment of broad molecular classes at almost any physiological level. Examples include the typing of DNA sequences (genomics), measurement of ribonucleic acid (RNA) transcripts (transcriptomics), or quantification of nucleotide methylation patterns (epigenomics)81. Assessing (patho-)physiologic mechanisms at multiple biologic levels is particularly promising for complex diseases caused by interactions between environmental and genetic factors14,82. Challenges are posed by computational and analytical complexity inherent particularly in untargeted approaches. In this thesis, proteins (proteomics) and small molecules (metabolomics) are measured to identify biomarkers of IR. Genomics profiling of participants in the Studies was carried out in previous projects and forms the bedrock of causal inference testing in this thesis.
Targeted methods measure a pre-specified subset of molecules. Nontargeted or untargeted methods capture all detectable signals and attempt annotation of as many molecular species as possible in the experimental data. Generally, targeted methods have the advantage of greater reliability due to comparison with established reference samples, but are restricted in the range of detected molecules that are specified a priori. Nontargeted methods measure a potentially unlimited range of markers restricted only by platform technology; albeit, the current lack of standardised methods, data processing complexity and the availability of annotation resources pose difficulties82,83.
Metabolomics in particular has the potential to highlight new mechanisms as it encompasses the most integrated level of physiology closest to the phenotype and comprises oligopeptides, carbohydrates, nucleotides and other products or substrates of biological pathways84. New biomarkers for adverse glycaemic traits are needed to improve prevention and treatment. Yet, despite the large number of risk scores13 and tentative molecular biomarkers, practical progress regarding risk assessment and individualised treatment has stalled in recent years85. Coupled with the increasing availability of biological samples in large representative cohorts, -omics

19
methods offer an emerging approach to biomarker discovery in diabetic pathology14. Metabolomics, for instance, has been used to identify circulating biomarkers for IR86 and T2D87. This thesis aims to contribute new insights into adverse glycaemic traits by combing proteomics, metabolomics and genomics.
3.2. Proteomics The human plasma proteome is defined here as the ensemble of circulating proteins that have a molecular mass exceeding the renal filtration threshold of ~4,500 Dalton. The origins of its constituents are diverse – proteins may be, e.g., secreted by solid tissues, derived from exogenous sources, or have leaked into the circulation due to tissue damage88. Plasma and serum proteomics as used in Study I have previously shown useful for biomarker discovery in complex diseases like chronic lung disease89 and may contribute to understanding diabetogenesis90. For instance, plasma proteomics was used to assess diabetes risk in women with the polycystic ovarian syndrome91 and to predict diabetic nephropathy92. Initially hailed as a highly promising approach to integrative systems biology and biomarker discovery93,94, proteomics - and all other -omics technologies - are best applied as complimentary tools instead of separate entities. Rather like, in order to understand the function of the heart, it will not suffice to observe a single cardiomyocyte in a culture dish, but requires study at the tissue, organ and whole-body level, -omics methods represent overlapping and mutually informative approaches to understanding biology.
3.3. Metabolomics Metabolomics describes the high-throughput measurement of large numbers of small molecules (usually <1,500 Dalton) in biological specimens. The range of detected molecules depends on the method and can include lipids, carbohydrates, nucleotides and amino acids. The two main methods for quantifying metabolites are mass spectrometry (MS)95, usually preceded by separation steps via liquid chromatography (LC) or gas chromatography (GC); and nuclear magnetic resonance (NMR) spectroscopy96.
The metabolome comprises the totality of small molecules in a biologic system encompassing any substrate or product of biologic pathways. Depending on the context, one may refer to the adipocyte metabolome, the liver metabolome, the mouse metabolome, et cetera. Large epidemiologic studies mostly assess readily accessible specimens like plasma, urine or faeces. Plasma metabolomics has been used, for instance, to study the risk of CVD97 and T2D98, and the role of branched-chain amino acids in IR14.

20
The scope, application and technical properties of NMR and MS methods differ. Chiefly, proton-ion NMR (1H-NMR) spectroscopy measures the resonance frequency of hydrogen nuclei within an external magnetic field, exploiting the dependence between nuclear spin and magnetic moment that is molecule-specific. Measurements are reproducible, non-destructive, allow repeated in vivo application, require minimal sample preparation and are captured in a snapshot. Shortcomings include NMR's low sensitivity, limited molecular range, requirement of sufficient concentrations and comparative inflexibility with regard to hardware modifications.
In MS methods, samples are passed via an inlet through an ionisation source (e.g., electrospray) where molecules are fragmented into ionised components by an electron ‘storm’. A subsequent mass analyser (e.g., time-of-flight) and detector capture fragments separated by molecular mass. The resulting mass-charge (m/z) spectra are specific for each molecule, with the degree of fragmentation dictated by the ionisation voltage. Tandem-MS, as used in Studies II and III, adds a high-voltage MS step to obtain more detailed fragmentation. Spectra require meticulous quality control to identify relevant signals from background noise. In most nontargeted applications, MS is preceded by LC or GC to separate molecules according to biochemical properties. In LC (used in this thesis), liquidised samples usually undergo protein extraction and are then passed through a column lined with a stationary phase that ‘holds on’ to molecules based on, for example, charge or polarity. Molecules leave the column to enter the MS inlet separated by their retention time. Following data processing, LC-MS metabolomics results in consensus spectra for metabolic features characterised by retention time and m/z. Metabolite annotation involves matching of empirical spectra to reference spectra. Ideally, features can be matched to an in-house reference library created using the same experimental set-up. This ‘gold standard’ annotation is commonly hampered by limited library size. Lower-confidence annotation proceeds by matching to public data repositories like METLIN (https://metlin.scripps.edu/). Shortcomings of MS methods are the lack of agreed methodological standards, demanding quality control and between-sample variability that renders comparisons between laboratories difficult. In contrast to NMR, MS methods are destructive and require more laborious sample preparation. Advantages of MS include high sensitivity extending to tiny concentrations and the ability to capture a potentially unlimited array of metabolites. Different combinations of LC, GC, ionisation sources, voltages, and mass analysers enable a broad scope of metabolites and spectral information to be obtained. The potential of LC/GC-MS methods, however, is currently limited by data complexity and economic realities.
In summary, both NMR and MS metabolomics are powerful and complimentary methods with broad applications. The scope of metabolomics ranges from high-throughput, translational applications for potential clinical

21
use to detailed interrogation of complex biology. In Studies II and III, we combine ultra performance LC and tandem-MS (UPLC-MS) in an untargeted design to identify biomarkers for IR.

22
4. Mendelian randomisation
4.1. Concept The efficiency of commercial drug discovery has declined dramatically in recent decades due, in large part, to lack of treatment efficacy99,100 and poor predictability of pre-clinical models101. Identifying new treatment targets requires an understanding of causality between associated variables. Public health interventions rely on the modification of causes rather than mere correlates of ill health; but causes, consequences and confounders are difficult to disentangle in real-world settings. Increasingly, large studies enable the exploitation of natural genetic variation to predict long-term consequences of functional mutations on health outcomes101. For example, obesity is associated with heart failure risk102; the causal direction, however, cannot be established in observational designs. Since assignment of persons to different levels of obesity in a randomised controlled trial (RCT) is hardly feasible, a method called Mendelian randomisation (MR) – ‘nature’s RCT’ – has been developed for causal inference testing in epidemiology. Mendelian randomisation analysis uses genetic variants associated with an exposure as instruments to test for causal effects on an outcome103. Using an MR approach, researchers found an association between an obesity-associated mutation in the FTO locus and heart failure that provided evidence for a causal effect of obesity102 and suggests that reducing overweight can reduce heart failure risk. Figure 2 illustrates the principles of MR.

23
Figure 2. Diagram illustrating the hypothetical causal relationship between an inherited polymorphism (e.g., in FTO), an exposure (e.g., obesity) and an outcome (e.g., heart failure). Horizontal pleiotropy is introduced if the genetic variant affects several traits that influence the outcome. Bias from confounders in the exposure-outcome relationship that occurs after conception is presumed minimal.
4.2. Principles and application Most epidemiologic studies are observational and assess correlations between variables. However, often the question of interest is whether an exposure causes an outcome. Observational designs struggle to assess causation since they are subject to confounding. For example, observational studies of over 300,000 participants showed that an increase in plasma HDL-C by one standard deviation (SD) was associated with an average 29% lower risk of heart disease104. Given the clinical success of low-density lipoprotein-cholesterol (LDL-C)-lowering drugs in reducing cardiovascular risk, one suggestion was that raising HDL-C levels might protect from CVD. Several drug companies launched major efforts resulting in advanced clinical testing of cholesteryl ester transfer protein (CETP) inhibitors that reliably increase plasma HDL-C. The expectation was that the HDL-C-raising effect of CETP inhibitors would be beneficial for CVD risk. This assumption proved wrong. After more than a decade of development, the two CETP inhibitors evacetrapib and dalcetrapib that had advanced to phase III trials were discontinued because of futility. Neither had reduced cardiovascular risk105. This example illustrates the shortcoming of observational designs: The observed association could originate from a causal effect of HDL-C on cardiovascular risk. Alternatively, a predisposition to, or subclinical form of CVD might cause reduced HDL-C levels (reverse causation). Finally,
24
confounding variables may influence both, HDL-C and CVD, with no independent effect once confounders are accounted for.
Mendelian randomisation analysis is a statistical method for causal inference testing in epidemiologic designs where RCTs cannot be implemented103. According to Gregor Mendel's second law of independent assortment, genetic variants are randomly passed on from parents to offspring. If genetic variants are robustly associated with the exposure, they can be used as instrumental variables in a design analogous to an RCT. As random allocation to the exposure occurs at conception, effects are less prone to confounding from environmental variables and reverse causation106. A usual approach in MR studies is to use common, tolerated germline SNPs associated with the exposure as instruments. The main assumptions of MR are that the genetic instrument (i) is associated with the exposure; (ii) is independent of confounders; and (iii) acts on the outcome only through the exposure (absent pleiotropy, Figure 2)107. Provided these assumptions are met and other biases accounted for, an MR design can provide causal evidence that may justify targeted manipulation in experimental or RCT settings. It does not replace these methods; rather it can guide intervention planning and public health.
Returning to the example above: Evidence from MR designs could have predicted the failure of HDL-C-raising drugs for reducing CVD risk. Voight and colleagues108 constructed a genetic instrument of 14 SNPs associated with HDL-C and tested for associations with MI in 12,482 case and 41,331 control adults. In observational analysis, a one-SD increase in HDL-C reduced lifetime risk of MI (odds ratio, OR, 0.62, 95% confidence interval, CI, 0.58 − 0.66). In MR analysis, however, there was no association between genetically determined HDL-C and MI risk (OR, 0.93, 95% CI, 0.68 − 1.26). The likely absence of a causal effect of HDL-C on CVD risk was later confirmed using different genetic instruments109,110. Evidence from MR analysis could therefore potentially have predicted the futility of raising plasma HDL-C for the prevention of cardiovascular events.
Other translational applications of MR include the prediction of side effects. Proprotein convertase subtilisin/kexin type 9 inhibitors are a class of LDL-C-lowering drugs originating in the discovery that persons with an inherited loss-of-function variant in PCSK9 have reduced LDL-C levels and CVD risk111. The causal effect of PCSK9 mutation → lower LDL-C → lower CVD risk was later confirmed in MR studies112. Clinical trials of several years' duration cannot assess long-term consequences of drugs and MR can provide evidence due to the lifelong effects of germline mutations. This approach showed that LDL-C-associated variants in PCSK9 raise the risk of T2D, suggesting that drug targeting may do so as well113. Another example is the use of MR to assess concerns about cardiovascular side effects of anti-diabetic drugs. The likely safety of glucagon-like peptide 1 agonist drugs was suggested by associations between a glucose-lowering

25
allele in the target protein's gene GLP1R and reduced CVD risk (OR, 0.93, 95% CI, 0.87 − 0.98)114.
4.3. Sources of bias Mendelian randomisation analysis is liable to multiple biases that need to
be accounted for to allow meaningful conclusions. Since its introduction to epidemiology in 2003103, the method has been progressively developed to encompass Egger regression115, tests for pleiotropy116, summary-level data methods117, two-sample MR118, and multi-SNP genetic instruments119. The field of MR research is constantly evolving and the predicted availability of larger, more diverse and more detailed geno- and phenotype studies may show its full potential. Important biases are briefly mentioned here. • Population stratification. In a heterogeneous population, genetic effects
may differ between subgroups of persons due to, e.g., ancestry. The selection of homogeneous samples and adjustment for genetic principle components can control for stratification. Sample size permitting, separate models in subgroups might be implemented. Limitations include difficulties in identifying population structure and low generalizability from selective samples.
• Canalisation. During an individual's development, behavioural or biologic mechanisms may compensate for a genetic predisposition. Canalisation is less likely to affect traits with tolerated consequences or effects that manifest late in life. No method exists to adjust for canalisation.
• Trait heterogeneity. A genetic variant can affect aspects of a trait differently. This can be problematic if MR studies for complex traits rely on few variants in loci with similar biologic function as instruments and if the exposure definition in the genetic discovery sample differs from the MR sample. For instance, the instrument for IR in this thesis was selected based on associations with glucose and insulin levels. It is conceivable that other aspects of IR, like its effect on cell proliferation, have different genetic contributions.
• Linkage disequilibrium. Correlated and co-inherited SNPs in genetic scores can cause variance inflation. A common approach is to limit the selection of variants to those in low linkage disequilibrium (e.g., r2 ≤ 0.05 in Study IV). Limitations are that reference genomes for estimating correlations may rely on small samples or different ethnicities than the study population.
• Weak instruments. Since most complex traits like IR and T2D are affected by a large number of individually low-effect SNPs74, their use as instruments in MR analysis may limit statistical power. One solution is the combination of low-effect variants in genetic scores.

26
• Limited power. Given the small proportion of variance explained by currently identified genetic variants in complex phenotypes, MR requires large sample sizes to detect effects. A way to maximise power is the use of summary data from large samples117. Currently, however, data are available for few traits only and case numbers limited. Null results in MR studies require careful consideration of statistical power.
• Winner’s curse. In GWASs that select the most strongly associated SNP for regions in high linkage disequilibrium, chance correlations between variants and confounders can overestimate effects in MR120. This is unproblematic if genetic discovery and MR sample do not overlap; otherwise causal estimates may be biased toward the null121.
• Pleiotropy. Pleiotropy occurs if genetic instruments influence multiple exposures that affect the outcome. It is unproblematic if genetic effects follow a causal chain and depend on each other (vertical pleiotropy). Bias can be introduced if a variant acts on the outcome through different traits at the same biologic or temporal level (horizontal pleiotropy)122. Pleiotropy can be limited by selecting SNPs exclusively associated with the exposure; but identifying pleiotropic traits is limited by available data and prior assumptions. Sensitivity tests include scatter plots of genetic associations with exposure and outcome, and funnel plots of instrument strength against causal estimate. MR Egger regression of SNP-outcome on SNP-exposure effects was adopted by Bowden and colleagueas115 from a method to adjust for small-study bias in meta-analysis. Egger regression allows a free intercept that can adjust for directional pleiotropy; albeit at the cost of less precise estimates. The method requires that instrument strength be independent of the direct effect (InSIDE) - an assumption that is difficult to test empirically.

27
5. Aims
5.1. General aim The aim of the four Studies was to improve risk prediction, characterisation of the pathophysiology, and assessment of detrimental health consequences of IR and adverse glycaemic traits in the general population.
5.2. Specific aims of the studies The aim of Study I was to discover circulating biomarkers for IR among 80 cardiovascular or inflammatory proteins measured by high-throughput proximity extension assay in non-diabetic adults. Secondary aims were to assess causation between biomarkers and IR, and to test biomarkers for predicting ten-year risk of T2D.
The aim of Study II was (i) to identify plasma metabolites by nontargeted metabolomics that were associated with physiologic measures of IR and insulin secretion in non-diabetic adults; and (ii) to test for causal effects of IR on circulating metabolite levels in independent large population samples.
The aim of Study III was to discover plasma metabolites whose concentration change during a two-hour oral glucose challenge was associated with a physiologic measure of IR in non-diabetic men who underwent nontargeted metabolomics profiling of blood samples obtained at three time points.
The aim of Study IV was to identify in an MR framework independent causal effects of T2D, IR, impaired insulin secretion and fasting hyperglycaemia on CAD, ischaemic stroke and all-cause mortality risk.

28
6. Study samples
6.1. ULSAM The Uppsala Longitudinal Study of Adult Men (ULSAM) is an ongoing study maintained by the Department of Public Health and Caring Sciences and the Department of Geriatrics at Uppsala University. In 1970, all 2,841 men residing in Uppsala county, Sweden, who were born between 1920−1924 were invited to participate and 2,322 men (81.7%) enrolled123. Baseline assessment included anthropometric, biochemical and questionnaire measures with follow-ups conducted every five to ten years thereafter (detailed here http://www.pubcare.uu.se/ulsam/). Metabolomics and proteomics analysis was done in blood samples obtained at age 70 and 77 years, respectively, and hyperinsulinaemic-euglycaemic clamp testing was done at age 70 years. Blood samples were stored at −70°C to −80°C in liquid nitrogen until analysis. Data obtained at assessment age 70 (Studies II and III), 77 (Study I), 82 (Study I) and 88 years (Study I) were used in this thesis. Ethical permission was granted by the ethics commission of Uppsala University (ULSAM-70, Dnr. 251/90; ULSAM-77, Dnr. 97/329; ULSAM-82, Dnr. 2/605; ULSAM-88, Dnr. 2007/338).
6.2. PIVUS In 2001, the Prospective Investigation of the Vasculature in Uppsala Seniors (PIVUS) project invited an unselected sample of Uppsala community residents aged 70 years to participate in a longitudinal study to validate measures of endothelial function124. Of the 2,025 invited persons, 1,016 (50.2%, half of whom were women) agreed to participate. Regular biomedical assessments (detailed here http://www.medsci.uu.se/pivus/) are conducted every five to ten years. Proteomics and metabolomics profiling was done in blood samples obtained at age 70 years (stored at −70°C to −80°C in liquid nitrogen until analysis). Data obtained at assessment age 70 (Studies I to III), 75 (Study I) and 80 years (Study I) were used. Ethical permission was granted by the ethics commission of Uppsala University (PIVUS-70, Dnr. 00419; PIVUS-75, Dnr. 2005/M-079; PIVUS-80, Dnr. 2011/045).

29
6.3. TwinGene The TwinGene project is a longitudinal cohort of 12,591 persons listed in the Swedish Twin Registry maintained by Karolinska Institutet in Stockholm to examine associations between genetic data and cardiovascular outcomes125. Swedish twins born before 1958 were assessed twice (1998−2002 and 2004−2008) by telephone interview and in local health centres for blood sampling and anthropometric measurements (detailed here http://ki.se/en/meb/twingene-and-genomeeutwin/). Study II uses a subsample established in a previous project126 that selected all incident cases of T2D, CAD, ischaemic stroke and dementia up to 31 December 2010. Cases were stratified by sex and median age and matched to a random selection of a proportional number of 1,643 control persons without events. Blood samples were immediately stored on ice, sent by overnight shipment to Karolinska Institutet and kept in liquid nitrogen at −70°C to −80°C until analysis. Plasma metabolomics data from 1,669 non-diabetic persons are used in Study II.
6.4. UK Biobank The UK Biobank study recruited between 2006−2010 over 500,000 U.K. residents aged 37−73 years to undergo medical and test centre assessments (detailed here http://www.ukbiobank.ac.uk/). Death, hospital and cancer register linkage is continuously being performed and long-term follow-up assessments are planned. Study IV uses data from 120,091 genotyped participants of British decent with follow-up data up to 31 January 2016. Ethical permission was granted by the UK Biobank Ethics and Governance Council (application number 13721, principle investigator Dr Erik Ingelsson).
6.5. Samples contributing summary-level data Summary-level data were used from the following studies that are either available in the public domain, were obtained on application to the respective data management boards, or were contributed by co-authors: CARDIoGRAMplusC4D127, DIAGRAMv3128, MAGIC64,129,130, Global Lipids Genetics Consortium (GLGC)131, GIANT132, KORA133, TwinsUK134, CHARGE135, and a Finnish consortium136. Co-authors of Study II provided summary results from a re-analysis of non-diabetic persons in KORA for replication of biomarker results (published as a Supplement to Study II). Ethical permission was granted by the respective institutional review boards.
30
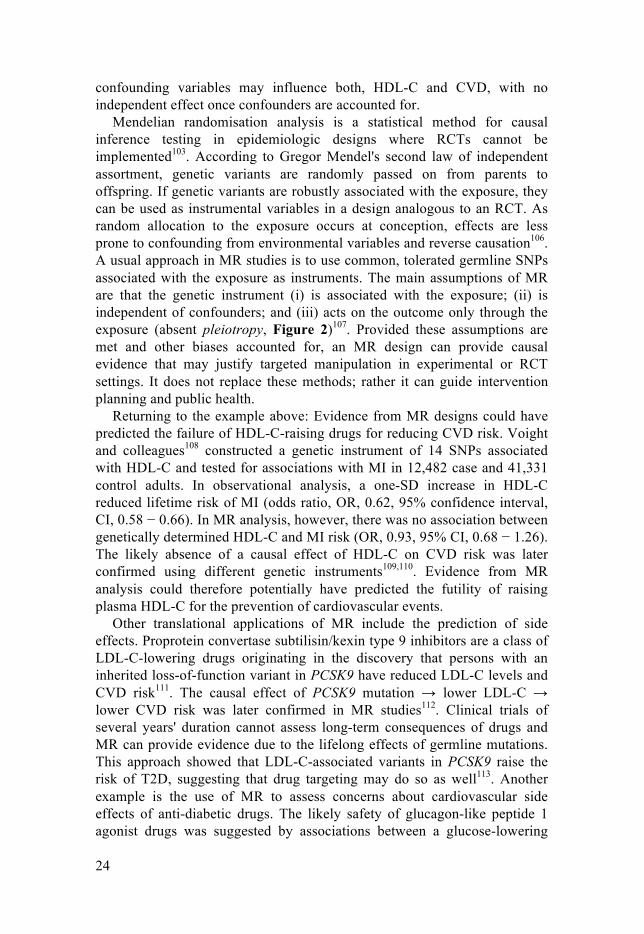
Figure 3 give details on phenotypes, sample sizes and the parts of this thesis that studies contributed to.
Figure 3. Overview of the Studies, their contribution and the samples used.

31
7. Methods
7.1. Measurement of insulin resistance In Study I, HOMA-IR was calculated from fasting plasma as (glucosemmol/L × insulinmU/L) / 22.5. Insulin was measured by enzyme-linked immunosorbant assay, glucose was measured by the glucose dehydrogenase method in plasma (ULSAM) and whole blood (PIVUS; converted to plasma values by adding 11%), and natural log-transformed to normality. In Studies II and III, the hyperinsulinaemic-euglycaemic clamp method by de Fronzo and colleagues55 modified with a higher insulin infusion rate was performed within one week of oral glucose testing in ULSAM. A bolus injection of semisynthetic human insulin was given followed by continuous infusion (56 mU × min−1 × m2 × body surface area−1) for 110 min. Steady-state glycaemia of 5.1 mmol/L was achieved by titration of a 20% glucose infusion and GlucAnalyzer readings every 5 min. Steady-state concentrations were obtained as the mean value between 60−120 min. The insulin sensitivity index M/I (mg × kg−1 × kg × body weight−1 × min−1 per mU/L × 100) was calculated by dividing the glucose disposal index M (the amount of glucose taken up between 60−120 min) by the mean insulin concentration during the corresponding period.
7.2. Further methods and statistical analysis In Study I, fasting plasma and serum samples from non-diabetic participants in PIVUS-70 (n = 827, 51.1% women) and ULSAM-77 (n = 540 men) were analysed by Olink Proseek Multiplex CVD 96x96 proximity extension assay that quantifies 92 cardiovascular and inflammatory proteins. After quality control, 80 proteins were tested for association with log-HOMA-IR in linear regression adjusted for age, sex and confounding risk factors identified by directed acyclic graph. Proteins associated at a 5% false discovery rate (FDR137) in PIVUS were replicated in ULSAM at a 5% FDR. Adjusted Cox regression assessed biomarkers for predicting ten-year risk of T2D in the combined cohorts. Following random split into a two-thirds training and one-third validation set, LASSO-penalised Cox regression was used to select most informative biomarkers that were tested for improvement in risk prediction when added to the Framing Offspring Study T2D score44. Change
32
in C-index (discrimination) and Grønnesby-Borgan’s test (calibration) were used to assess performance. Bidirectional MR analysis was carried out using a ten-SNP instrument for IR40 and genome-wide significant SNPs from the literature, or, if unavailable, from GWAS in PIVUS/ULSAM as instruments for biomarkers. Causal estimates were calculated based on the Wald ratio with standard errors estimated by the delta method102.
In Study II, nontargeted metabolomics profiling by UPLC-MS was used in fasting plasma samples from non-diabetic persons in ULSAM-70 (n = 904 men), PIVUS-70 (n = 994, 50.7% women) and TwinGene (n = 1,669, 68.6 ± 8.3 years, 58.9% women). In ULSAM, age-adjusted linear regression assessed associations between 192 annotated metabolites and clamp M/I, log-insulinogenic index (delta-insulin / delta-glucose during 0−30 min of oral glucose challenge) and log-disposition index (M/I × insulinogenic index). Metabolites that passed a 5% FDR were tested for causal effects of IR → metabolite in the combined PIVUS and TwinGene samples. As in Studies I and IV, we used a validated40 ten-SNP instrument for IR in comprehensive MR and sensitivity analysis encompassing Wald ratio, MR Egger, heterogeneity and plot methods. We replicated causal effects in the independent plasma metabolite GWASs in KORA/TwinsUK (n = 7,826), CHARGE (n = 8,961) and a Finnish consortium (n = 8,330).
In Study III, fasting plasma from 470 non-diabetic men in ULSAM-70 was obtained at baseline, 30 min, and 120 min during a 75g oral glucose challenge, and analysed by nontargeted UPLC-MS as in Study II. Within one week, participants underwent hyperinsulinaemic-euglycaemic clamp testing. In a first step, age- and sample quality-adjusted linear regression was used for associations between clamp M/I and 192 metabolites at any time-point (clamp M/I = M0 + M30 + M120), and metabolites retained if they explained more variance than a null model of confounders-only in likelihood ratio test at the Bonferroni-corrected level. In a second step, we tested whether associated metabolites’ change in concentration over time was associated with IR (clamp M/I = delta-M0/30 + delta-M30/120) after Bonferroni correction.
In Study IV, we used MR analysis to test for causal effects of T2D, IR, impaired insulin secretion and raised fasting glucose on CAD, ischaemic stroke and all-cause mortality risk. Outcomes were assessed in individual-level data from 120,091 European adults in the UK Biobank (52.7% women, 63.8 ± 7.9 years) and summary-level data from CARDIoGRAMplusC4D (n = 63,746 cases of CAD and n = 130,681 controls). MR analysis comprised the fixed-effect inverse variance-weighted method, MR Egger and scatter plots of genetic associations. Studies, phenotypes and sample sizes that contributed summary-level data are shown in Figure 3. A two-sample MR approach was used, where genetic associations with outcomes were

33
estimated in the UK Biobank and in CARDIoGRAMplusC4D, and trait associations derived from summary data in the largest available GWASs. For T2D and fasting glucose, we constructed genetic instruments of SNPs associated (P < 5 × 10⁻⁸) with T2D or fasting glucose, respectively, in GWAS. For variants in linkage disequilibrium with r2 ≥ 0.05, the one with the lower P-value was retained. To minimise pleiotropy, SNPs were excluded if (i) associated with plasma lipids, body mass index, or waist-hip ratio in GWAS; or (ii) associated with blood pressure in the UK Biobank at P < 10−4; or (iii) more likely to act through any of the above pleiotropic traits (SNPs above the 90th percentile of the distribution of βtrait / logORT2D; or βtrait
/ βglucose; in SD-units). 51 SNPs were selected for T2D and 18 SNPs for fasting glucose. We used previously validated genetic scores as instruments for IR (ten SNPs) and impaired insulin secretion (18 SNPs)40. In the UK Biobank, mortality after baseline assessment in 2007−2010 was available up to 31 January 2016 and genetic associations were assessed in Cox regression; CAD and ischaemic stroke were defined as self-reported or according to hospital records and assessed by logistic regression. Analyses were adjusted for age, sex, genotyping platform, test centre and ten genetic principal components. Case definitions of CAD in CARDIoGRAMplusC4D followed standard definitions and logistic regression was adjusted for age and sex.

34
8. Main results and discussion
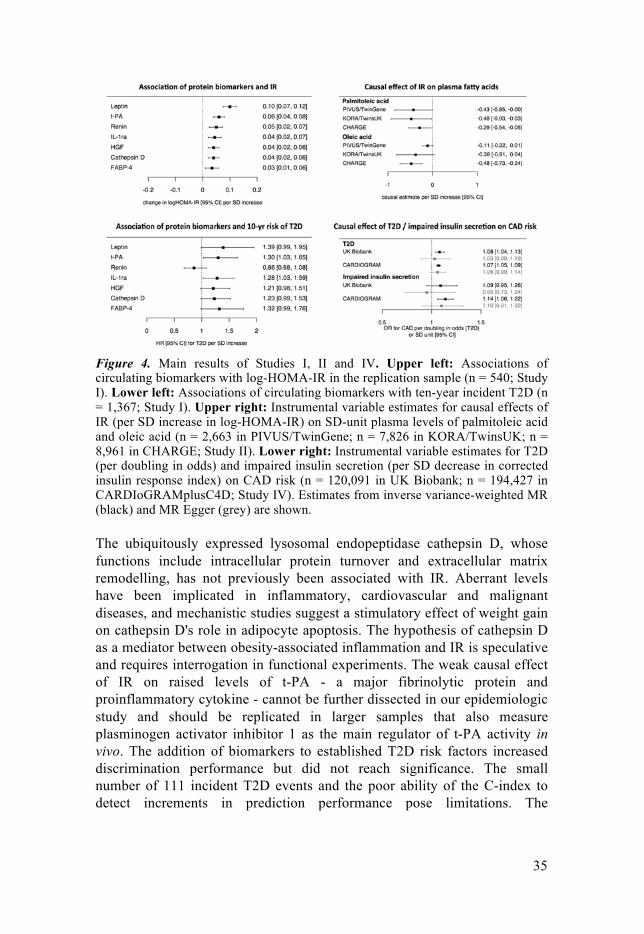
8.1. Study I In Study I, we identified cathepsin D as a circulating biomarker for IR and replicated associations of the six previously reported biomarkers leptin, tissue-plasminogen activator (t-PA), renin, interleukin-1 receptor antagonist (IL-1ra), hepatocyte growth factor (HGF) and fatty acid-binding protein 4 (FABP4). In cross-sectional analysis, all biomarkers were positively associated with IR. Higher levels of t-PA (P = 0.029) and IL-1ra (P = 0.025) were associated with ten-year risk of T2D (n = 111 events). Figure 4 shows associations with IR and T2D. In MR analysis, we found a nominally significant causal effect of IR on raised t-PA concentrations (P = 0.012). The addition of biomarkers to established risk factors in the Framingham Offspring Study T2D score did not improve prediction (delta-C, 0.02, 95% CI, −0.08 to 0.12).
35
Figure 4. Main results of Studies I, II and IV. Upper left: Associations of circulating biomarkers with log-HOMA-IR in the replication sample (n = 540; Study I). Lower left: Associations of circulating biomarkers with ten-year incident T2D (n = 1,367; Study I). Upper right: Instrumental variable estimates for causal effects of IR (per SD increase in log-HOMA-IR) on SD-unit plasma levels of palmitoleic acid and oleic acid (n = 2,663 in PIVUS/TwinGene; n = 7,826 in KORA/TwinsUK; n = 8,961 in CHARGE; Study II). Lower right: Instrumental variable estimates for T2D (per doubling in odds) and impaired insulin secretion (per SD decrease in corrected insulin response index) on CAD risk (n = 120,091 in UK Biobank; n = 194,427 in CARDIoGRAMplusC4D; Study IV). Estimates from inverse variance-weighted MR (black) and MR Egger (grey) are shown.
The ubiquitously expressed lysosomal endopeptidase cathepsin D, whose functions include intracellular protein turnover and extracellular matrix remodelling, has not previously been associated with IR. Aberrant levels have been implicated in inflammatory, cardiovascular and malignant diseases, and mechanistic studies suggest a stimulatory effect of weight gain on cathepsin D's role in adipocyte apoptosis. The hypothesis of cathepsin D as a mediator between obesity-associated inflammation and IR is speculative and requires interrogation in functional experiments. The weak causal effect of IR on raised levels of t-PA - a major fibrinolytic protein and proinflammatory cytokine - cannot be further dissected in our epidemiologic study and should be replicated in larger samples that also measure plasminogen activator inhibitor 1 as the main regulator of t-PA activity in vivo. The addition of biomarkers to established T2D risk factors increased discrimination performance but did not reach significance. The small number of 111 incident T2D events and the poor ability of the C-index to detect increments in prediction performance pose limitations. The

36
translational potential of the high-throughput protein assay used in Study I to assess IR and predict T2D remains uncertain.
8.2. Study II In Study II, we identified 52 fasting plasma metabolites associated with IR or insulin secretion in non-diabetic men. Biomarkers implicated bile acid, glycerophospholipid and caffeine metabolism for IR; and fatty acid biosynthesis for impaired insulin secretion. In MR analysis in separate samples, we found evidence for a causal effect of IR on reduced plasma levels of the monounsaturated fatty acids (FA) oleate and palmitoleate (Figure 4). A trend for an effect of IR on raised tyrosine levels could not be replicated although limited sample size may have contributed. The mechanisms of the observed causal effects cannot be explored in our epidemiologic design. One hypothesis, for which we found limited support from publicly deposited animal experiment data, is that a genetic predisposition to IR affects activity and expression of the rate-limiting enzyme stearoyl-CoA desaturase 1 (SCD-1) in monounsaturated FA biosynthesis. In vitro models of IR demonstrate reduced expression of SCD-1. Pharmacologic inhibition of SCD-1 has been shown to decrease oleate and palmitoleate levels with beneficial effects on IR, but to lead to a concurrent increase in saturated FA concentration, that in turn has been linked to atherosclerosis. One speculative hypothesis is that (i) IR-mediated inhibition of SCD-1 has a compensatory beneficial effect on insulin sensitivity via reduced oleate and palmitoleate levels; but (ii) concomitantly raises CVD risk by elevating saturated FA levels. This model chimes with findings of an elevated CVD risk in IR that is independent of T2D risk but remains speculative until addressed in functional studies.
8.3. Study III In Study III, we identified nine metabolites whose change in plasma concentration during a two-hour glucose challenge was associated with a physiologic measure of IR; C10-carnitine, C12-carnitine, oleate, palmitoleate, lysophosphatidylethanolamine (LysoPE) 18:1, LysoPE(18:2), LysoPE(20:4), hexose, and the bile acid deoxycholate-glycine. Across all persons, deoxycholate-glycine and hexose levels rose between 0−30 min and plateaued between 30−120 min. All other biomarker levels changed little between 0−30 min and declined from 30−120 min. The strongest associations with IR were found for the medium-chain acylcarnitines C10 and C12, whose levels between 30−120 min decreased sharply in the most insulin sensitivity persons, whilst this decrease was blunted in more insulin

37
resistant persons. Figure 5 illustrates C10- and C12-carnitine concentrations over time according to quartile of IR. The association with IR appeared to depend on chain length; none of the other acylcarnitines (C2, C8, C14, C16, C18) showed similar associations with IR.
Figure 5. Plasma levels of C10- and C12-carnitine during oral glucose challenge according to quartile of insulin sensitivity (clamp M/I, n = 470; Study III). Quartile 1 (Q1) comprises the most insulin resistant persons.
To our knowledge, this is the first large community study that combines clamp assessment of IR, nontargeted metabolomics and repeated sampling during a glucose challenge. New associations between IR and postprandial concentrations of medium-chain acylcarnitines, monounsaturated FAs, and LysoPEs were found. The complexity of UPLC-MS metabolomics may pose questions regarding reproducibility. Reassurance in our study is provided by an expected association of hexose (presumably reflecting mainly glucose although detailed annotation was not possible). Hexose levels rose during the early phase after glucose ingestion and slowly returned to baseline thereafter in persons with the least IR. In the most insulin resistant persons, hexose levels declined more slowly and remained elevated after two hours.
The blunted decline of medium-chain acylcarnitine levels in IR that was not observed for shorter or longer chain lengths is intriguing. Acylcarnitines function predominantly as intermediates in FA metabolism and aid transport of cytosolic FAs into mitochondria for beta-oxidation. No consensus on their role in IR has been reached and studies report beneficial as well as harmful effects depending on design, organism and sample type. Our results in plasma are difficult to relate to cellular physiology as circulating C10- and C12-carnitine could originate, e.g., from blood-borne lipoproteins or cellular export. Competing theories to explain repeatedly reported associations between IR and medium-chain acylcarnitines in different compartments exist. One hypothesis posits a dysfunction of FA beta-oxidation caused by IR, which leads to upstream accumulation of acylcarnitines as ‘bystanders’. Another hypothesis suggests the primacy of slowed beta-oxidation and

38
resulting acylcarnitine accumulation with toxic effects on insulin sensitivity as a cause of IR. Alternatively, overactive beta-oxidation to compensate for impaired glucose metabolism in IR has been suggested, which would augment the synthesis of acylcarnitine intermediates with raised plasma levels reflecting a ‘spill over’ from cellular pools. Pending functional studies, our results cannot support either theory but contribute two important insights: First, in order to understand the pathophysiology of IR, it is not sufficient to rely on cross-sectional and fasting associations, but requires additional dynamic profiling during metabolic challenges. Second, a simplified view of IR as primarily a defect of glucose metabolism fails to capture impairments in other insulin-mediated processes - notably FA metabolism. A more integrated view of the biology of IR encompassing not just metabolic, but also hormonal and other effects, is desirable.
8.4. Study IV In Study IV, we found evidence for a causal effect of T2D on raised CAD risk, as well as tentative evidence for a comparable causal effect of impaired insulin secretion. Figure 4 illustrates causal effects in the UK Biobank (n = 7,179 cases) and CARDIoGRAMplusC4D (n = 63,746 cases) studies and compares instrumental variable estimates in inverse variance-weighted and MR Egger analysis. The intercepts in Egger regression failed to reach nominal significance (P > 0.05) for either exposure, suggesting absent directional pleiotropy. If bias from pleiotropy is presumed negligible, estimates in inverse variance-weighted MR (where the intercept is constrained to zero) provide more robust results. The effect of impaired insulin secretion on raised CAD risk was only detected in CARDIoGRAMplusC4D but directionally consistent in the UK Biobank, which included about ten-times fewer cases. This causal association has not previously been reported and awaits replication after accumulation of more cases and the release of genotype data for all 500,000 individuals in the UK Biobank. We found that a doubling in the odds of T2D caused an average 7% increase in lifetime-risk of CAD (OR, 1.07, 95% CI, 1.05 − 1.09, P = 1.2 × 10⁻⁹). A similar effect has been reported in CARDIoGRAMplusC4D before138. Study IV contributes new results (i) by confirming the effect in the independent UK Biobank study whose non-selective recruitment is more reflective of the general population than the heterogeneous case-control studies that contributed to CARDIoMGRAMplusC4D; (ii) by constructing a genetic instrument for T2D through expansive consideration of pleiotropy that may be more specific than previous efforts; and (iii) by using MR Egger in sensitivity analysis. The findings in Study IV support public health interventions targeting T2D to prevent CVD and suggest impaired insulin

39
secretion as an independent cardiovascular risk factor whose causal role requires replication in future studies.
8.5. Strengths and limitations Epidemiologic studies are limited in generalizability, power and extrapolation to pathophysiologic mechanisms as a function of inclusion criteria, assessment methods and sample size. The main cohorts used in this thesis - ULSAM and PIVUS - comprise advanced-age Swedes of European decent and ULSAM recruited only men. Whether results apply to other age and ethnic groups is uncertain. Proteomics in Study I is limited by the selection of proteins, the high failure rate in quality control (13% of proteins) and the lack of genetic instruments for many proteins. Metabolomics by UPLC-MS in Studies II and III is limited by the platform that detects certain metabolites (e.g., polar amino acid) poorly, the availability of reference spectra and uncertainty about the biologic origin of metabolites. Blood samples were obtained and immediately transferred for storage in liquid nitrogen but used for both applications after a ~20 year delay with unknown consequences for possible biomarker degradation. Mendelian randomisation analysis in Study IV is limited by low power in the UK Biobank, uncertainty about the suitability of some genetic instruments and lack of exposure data. Other shortcomings are the use of HOMA-IR as a surrogate in Study I and an inability to assess some assumptions of MR analysis (e.g., InSIDE and canalisation).
Despite their limitations, all four Studies add new puzzle pieces to the emerging understanding of the causes, correlates and consequences of IR. Figure 3 summarises their contribution. Apart from integrating traditional epidemiologic modelling (e.g., risk prediction) with novel biomarker applications, the strength of our Studies include the use of ‘gold standard’ measures for IR in Studies II and III, high-quality phenotyping in large longitudinal community-based samples, broad-based application of an MR framework to address possible biases, the discovery/validation designs in Studies I and II, and the replication of results in Study II on different metabolomics platforms in independent samples.

40
9. Conclusion and future perspective
The four Studies in this thesis contribute to the understanding of IR by highlighting new associations with circulating cathepsin D (Study I) and medium-chain acylcarnitines (Study III). Tentative evidence for causal effects of IR on t-PA (Study I) and monounsaturated FA concentrations (Study II) in plasma expand the concept of IR beyond its role in hyperglycaemia and T2D. The insights on risk prediction and pathophysiology in Studies I to III are imbued with clinical meaning in Study IV, which suggests that T2D and impaired insulin secretion raise CAD risk. The results were obtained in epidemiologic designs and carry the inevitable uncertainty of statistical analysis. Replication in separate samples and experimental validation are desirable. Beyond their focus on cardiometabolic pathology, the Studies demonstrate the value of cross-disciplinary research involving clinicians, chemists, and epidemiologists; the power of data sharing and international collaboration; and the integration of traditional methods in epidemiology with novel -omics and bioinformatics tools.
The work in this thesis was conducted amid a gathering wave of tremendous advances in biomedical technology, computing power and availability of unprecedented amounts of in-depth data from large samples. This ‘big data revolution’ and the integration of digitised information on health and disease are likely to lead to significant improvements in population-level and individual well-being. The fast-paced evolution of high-throughput methods and collaborations across academic, commercial and governmental institutions promises great benefits for global health, as illustrated by the Human Genome Project139 and former U.S. President Barack Obama’s 2015 launch of the Precision Medicine Initiative140. There are, however, important challenges, some of which are mentioned below.
Science infrastructure. Many grant allocation systems in academia are out-dated. Established funding models commonly support short-term, hypothesis-driven research; yet, data-driven projects require sustainable investments to establish longitudinal resources of sufficient magnitude and often start with an open research question. The current climate tends to favour publication quantity over quality; particularly early-career investigators are required to demonstrate output and may forgo more elaborate but time-consuming designs that might result in more meaningful, higher-impact findings. For example, there are over 90 overlapping risk

41
scores for T2D, most of which claim better performance than other scores with little effort being devoted to follow-up or validation13. Which - if any - of these score are actually being used by healthcare workers in day-to-day practice? A less competitive, more collaborative spirit in academia might allow more truly meaningful contributions. An example of persistent follow-up from tentative associations in an epidemiologic cohort to experimental validation is the discovery of NAT2 as a causal gene in IR77 (illustrated in Section 2). An example of how data sharing can produce useful resources is the Exome Aggregation Consortium (ExAC) browser of ~60,000 individuals' whole-exome sequences, recently enlarged to the genome Aggregation Database (gnomAD, http://gnomad.broadinstitute.org/) to comprise ~123,000 exome and ~14,000 whole-genome sequences available by open access.
Analytical challenges. Computational resources to cope with the growing amount of data could become the bottleneck of ‘big data medicine’. Sophisticated software platforms like HAIL (https://hail.is/) for efficient processing and innovative algorithms for data dimension reduction like Sparse Module Activity Factorization (SMAF)141 are in development. The increasing complexity of analytical pipelines, however, also mandates close cross-disciplinary collaboration with analysts. Improved training programmes that convey up-to-date bioinformatics skills are a vital component of moving forward. The traditional overreliance on null hypothesis significance testing and the bias in scientific publications introduced by P-value thresholds and misunderstanding of basic statistics has been emphasised142. Established analytical procedures and academic tradition are unlikely to suffice for making the most of the new opportunities.
Ethical challenges and involving the public. The ethical challenges around data sharing and electronic healthcare records regarding, e.g., confidentiality, informed consent, data security and commercial interests, are significant and require careful consultation of everyone involved. Dilemmas are posed by chance discoveries of pathogenic findings in research volunteers and by false believes about the certainty of results in commercially marketed genetic and other tests. A crucial task remains the communication of research to the public in ways that avoid sparking unrealistic expectations and scaremongering. As researchers, we are dependant on each person's altruistic motivation to share their private information for the greater good of society, which mandates a humble and conscientious approach to science. Finally, each individual's ability to derive meaning from the growing list of risk estimates may reach limits; what consequences is someone to draw from an enumeration of lifetime risks for 300 diseases that vary between 2% and 8% and for the majority of which no preventative treatments exist? There are a myriad of other challenges that need to be carefully considered as we move forward. The awe-inspiring

42
progress of molecular sciences over the last centuries and the clinical advances in complex diseases of growing global significance in recent decades bode well for the future, provided everyone is given an equal voice and global diversity is given a true reflection.

43
10. Summary in Swedish – sammanfattning på svenska
Allt fler insjuknar runt om i världen i sjukdomar som har samband med förändrade levnadsvanor, och som i likhet med typ 2 diabetes ofta hade kunnat förebyggas. För att bromsa denna ”epidemi1” av livsstilssjukdomar krävs bättre metoder för att på ett tidigt stadium kunna förutsäga vem som riskerar att insjukna och därmed också ge förbättrade möjligheter till prevention och behandling.
Insulinresistens (IR) innebär att kroppen inte svarar normalt på hormonet insulin, vilket bland annat kan leda till nedsatt upptag av blodglukos och andra näringsämnen. Insulinresistens är ett viktigt kännetecken för typ 2 diabetes och utgör också en oberoende riskfaktor för hjärt- kärlsjukdom. De biologiska mekanismerna bakom utveckling av insulinresistens är inte helt klarlagda. Den senaste tidens snabba utveckling av analysmetoder för att mäta ett stort antal biomarkörer i stora befolkningsstudier öppnar upp för nya möjligheter att undersöka dessa mekanismer.
De fyra studierna i avhandlingen utnyttjade blodprover från stora befolkningsstudier för identifiering och karaktärisering av biomarkörer för IR. Ett urval av protein-markörer som tidigare kopplats till inflammation och hjärtkärlsjukdom utvärderades för möjlig koppling till insulinresistens i Studie I. I Studie II och III uppmättes ett stort antal små ämnen i blodet, metaboliter, före (Studie II) och efter intag av 75 g glukos (Studie III). I Studie IV användes en genetisk epidemiologisk analysmetod, Mendelsk randomisering, för att utvärdera om insulinresistens och andra diabetesrelaterade mått, orsakar en ökning av dödlighet och hjärt- kärlsjukdom. I denna analys användes flera genetiska varianter kopplade till riskfaktorer som insulinresistens som en sammansatt så kallad instrumentvariabel för att testa orsakssamband. Eftersom slumpen avgör vilka anlag som nedärvs till barnen, så har analysmetoden liknats vid en randomiserad klinisk prövning och vanliga problem i epidemiologiska studier såsom störfaktorer undviks. Eftersom tolkningen av resultaten från denna typ av studier kräver att vissa villkor är uppfyllda har vi använt oss av nya metoder för att utvärdera detta. Vissa av villkoren går inte att utvärdera varför resultaten från Mendelsk randomisering bör tolkas med försiktighet vad gäller orsakssamband. Vidare experimentella studier är därför nödvändiga.

44
Målet för avhandlingsprojektet var att i) använda proteomik, metabolomik och genomik i stora befolkningsstudier för att identifiera nya biomarkörer för insulinresistens; ii) utvärdera dessa biomarkörer för riskprediktion samt koppling till sjukdomsutveckling; och iii) använda Mendelsk randomisering för att utvärdera orsakssamband mellan IR och andra diabetesfenotyper och sjukdom.
I Studie I analyserades 80 proteiner hos 1367 70-77-åriga svenskar. Vi identifierade cathepsin D som en ny biomarkör för insulinresistens och fann preliminära bevis för att insulinresistens kausalt påverkar nivåerna av ett annat protein, ”tissue plasminogen activator”. I Studie II, fann vi 52 metaboliter korrelerade till insulinresistens och/eller insulinsekretion hos 910 70-åriga män. Mendelsk randomisering i de svenska materialen kombinerat med internationella studier visade att insulinresistens minskar nivåerna av två enkelomättade fettsyror. I Studie III, återigen på 70-åriga män, fann vi att nivåerna av medellånga acylkarnitiner, enkelomättade fettsyror, gallsyror och lysofosfatidyletanolaminer under en glukosbelastning var korrelerade med insulinresistens. I studie IV fann vi resultat som stödjer ett orsaksamband mellan typ 2 diabetes, nedsatt insulinsekretion och kranskärlsjukdom.
De fyra studierna i detta avhandlingsarbete bidrar till ökad förståelse för IR genom att belysa kopplingen till cathepsin D och medellånga acylkarnitiner. Preliminära bevis för ett orsaksamband mellan insulinresistens och plasma tissue plasminogen activator och enkelomättade fettsyror ökar förståelsen för effekterna av IR på risken för hjärtkärlsjukdom, fettsyrametabolism och koagulation hos personer som inte utvecklat diabetes. Insikterna inom IR epidemiologi och patofysiologi från Studie I-III ges en klinisk betydelse i Studie IV som föreslår att typ 2 diabetes och försämrad insulinsekretion oberoende ökar risken för hjärt- kärlsjukdom. Slutsatserna av denna avhandling är baserade på epidemiologisk forskning och har därför en statistisk osäkerhet. Begränsningar i studierna innefattar urvalet och storleken på studierna (medelålders européer), begränsad förmåga att testa villkor för Mendelsk randomisering, osäker mätning av insulinresistens i vissa studier, val av kandidatproteiner och behov av experimentell validering. Validering i externa studier och validering i randomiserade interventionsstudier är därför nödvändig.
Sammanfattningsvis så bidrar studierna i den här avhandlingen med nya insikter inom patofysiologi och konsekvenser av insulinresistens och illustrerar värdet av att kombinera traditionella epidemiologiska metoder med moderna molekylära tekniker och bioinformatik.

45
11. Acknowledgements
I am deeply grateful to my main supervisor, Tove Fall, for the opportunities, support and help she has offered me. I have not been an easy person at times and I am amazed by Tove's patience and thank her for her persistence. Tove, I owe you this Ph.D. and you embody the role model of a scientist I shall always aspire to.
My co-supervisor and group leader, Erik Ingelsson, is an inspiration as a scientist, academic leader and as a person, and I am indebted to his support and long-term view in guiding my progression. I also thank my co-supervisor and genius clinician-scientist Johan Sundström for his support - the treasure trove of ideas and constructive feedback to be found in a reply to a quick question has been astonishing.
I am humbled by the devotion to meaningful research that Mwenya, Samira, Stefan, Lisa and Markus have taught me, whose feedback and suggestions in our weekly Epi-/Bioinformatics Group meetings have improved my work a lot. I am grateful to Professor Christian Berne for contributing an academic lifetime's worth of encouragement and a historical perspective to our group.
I want to thank Susanne, Casimiro and Naomi from our Cell Group for teaching me the basics of cell culture research and allowing me a glimpse of the hardships of wet lab research. I have huge respect for your work and struggles to establish a functioning lab from scratch. Susanne, thank you so much for your positivism and instructions. Casimiro, I am sorry I could not pursue our knockouts further; your work won't be forgotten.
A big thank you goes to the whole of the Molecular Epidemiology unit and the respectful and truly enjoyable atmosphere at BMC: Anastasia, Bene, Manoj, Marcel, Dan, Joao, Andrea, Silvia, Åsa, Sitaf, Sari, Tiffany, and everyone else I had the privilege to meet.
The Department of Medical Sciences (IMV) at Uppsala Universitet and the Science for Life infrastructure have provided the fertile ground for my research and professional development. I particularly thank Birgitta Sembrant, Anna Foyer and Susanne Westholm for administrative support.

46
I am grateful for the many opportunities for presenting our research and learning new methods at international conferences and academic institutions enabled through the generous support of Sweden's science infrastructure, as well as the European Foundation for the Study of Diabetes, Svenska Läkaresällskapet, Hjärt-Lungfonden, Instutitut Français de Suède, and Svenska Sällskapet för Medicinsk Forskning.
Thanks to all the volunteers who participated in the studies in this thesis. A particular thanks goes to the healthcare and administrative staff of the Uppsala-based ULSAM and PIVUS cohorts, as well as the Stockholm-based TwinGene project. I thank all my collaborators and co-authors for enabling this work.
The voluntary work to improve science education and communication together with my colleagues and friends Monika, Doug, Amy, Julie, Lauren and the other early-career scientists of the Training & Development Committee of the American Society of Human Genetics has been (and continues to be) an enriching experience.
Establishing my life beyond academia north of Uppsala would not have been possible without the good people of Örkälla samfällighet.

47
12. References
1. World Health Organization. Global status report on noncommunicable diseases 2014. World Health Organization, Geneva, Switzerland (2014).
2. GBD 2015 Mortality and Causes of Death Collaborators. Global, regional, and national life expectancy, all-cause mortality, and cause-specific mortality for 249 causes of death, 1980-2015: a systematic analysis for the Global Burden of Disease Study 2015. Lancet 388, 1459-1544 (2016).
3. Ley, S.H., Hamdy, O., Mohan, V. & Hu, F.B. Prevention and management of type 2 diabetes: dietary components and nutritional strategies. Lancet 383, 1999-2007 (2014).
4. International Diabetes Federation. IDF Diabetes Atlas, 7th ed. International Diabetes Federation, Brussels, Belgium (2016).
5. NCD Risk Factor Collaboration (NCD-RisC). Worldwide trends in diabetes since 1980: a pooled analysis of 751 population-based studies with 4.4 million participants. Lancet 387, 1513-30 (2016).
6. GBD 2015 DALYs and HALE Collaborators. Global, regional, and national disability-adjusted life-years (DALYs) for 315 diseases and injuries and healthy life expectancy (HALE), 1990-2015: a systematic analysis for the Global Burden of Disease Study 2015. Lancet 388, 1603-1658 (2016).
7. Kahn, S.E., Cooper, M.E. & Del Prato, S. Pathophysiology and treatment of type 2 diabetes: perspectives on the past, present, and future. Lancet 383, 1068-83 (2014).
8. Meigs, J.B. Epidemiology of the insulin resistance syndrome. Curr Diab Rep 3, 73-9 (2003).
9. Chatterjee, S., Kamlesh, K. & Davies, M. Type 2 diabetes. Lancet (2017). Published online 9 February 2017. doi: 10.1016/S0140-6736(17)30058-2.
10. Facchini, F.S., Hua, N., Abbasi, F. & Reaven, G.M. Insulin resistance as a predictor of age-related diseases. J Clin Endocrinol Metab 86, 3574-8 (2001).
11. Yip, J., Facchini, F.S. & Reaven, G.M. Resistance to insulin-mediated glucose disposal as a predictor of cardiovascular disease. J Clin Endocrinol Metab 83, 2773-6 (1998).
12. Lillioja, S. et al. Insulin resistance and insulin secretory dysfunction as precursors of non-insulin-dependent diabetes mellitus. Prospective studies of Pima Indians. N Engl J Med 329, 1988-92 (1993).
13. Nowak, C., Ingelsson, E. & Fall, T. Use of type 2 diabetes risk scores in clinical practice: a call for action. Lancet Diabetes Endocrinol 3, 166-7 (2015).
14. Roberts, L.D., Koulman, A. & Griffin, J.L. Towards metabolic biomarkers of insulin resistance and type 2 diabetes: progress from the metabolome. Lancet Diabetes Endocrinol 2, 65-75 (2014).
15. Tuomi, T. et al. The many faces of diabetes: a disease with increasing heterogeneity. Lancet 383, 1084-94 (2014).
16. Einhorn, D. et al. American College of Endocrinology position statement on the insulin resistance syndrome. Endocr Pract 9, 237-52 (2003).

48
17. Krook, A., Brueton, L. & O'Rahilly, S. Homozygous nonsense mutation in the insulin receptor gene in infant with leprechaunism. Lancet 342, 277-8 (1993).
18. DeFronzo, R.A. & Tripathy, D. Skeletal muscle insulin resistance is the primary defect in type 2 diabetes. Diabetes Care 32 Suppl 2, S157-63 (2009).
19. Matthews, D.R. et al. Homeostasis model assessment: insulin resistance and beta-cell function from fasting plasma glucose and insulin concentrations in man. Diabetologia 28, 412-9 (1985).
20. Alkhouri, N. et al. Adipocyte apoptosis, a link between obesity, insulin resistance, and hepatic steatosis. J Biol Chem 285, 3428-38 (2010).
21. Dali-Youcef, N., Mecili, M., Ricci, R. & Andres, E. Metabolic inflammation: connecting obesity and insulin resistance. Ann Med 45, 242-53 (2013).
22. Lumeng, C.N., Deyoung, S.M., Bodzin, J.L. & Saltiel, A.R. Increased inflammatory properties of adipose tissue macrophages recruited during diet-induced obesity. Diabetes 56, 16-23 (2007).
23. Feuerer, M. et al. Lean, but not obese, fat is enriched for a unique population of regulatory T cells that affect metabolic parameters. Nat Med 15, 930-9 (2009).
24. Ying, W. et al. Adipose tissue B2 cells promote insulin resistance through leukotriene LTB4/LTB4R1 signaling. J Clin Invest (2017).
25. Heni, M., Kullmann, S., Preissl, H., Fritsche, A. & Haring, H.U. Impaired insulin action in the human brain: causes and metabolic consequences. Nat Rev Endocrinol 11, 701-11 (2015).
26. Wallace, T.M., Levy, J.C. & Matthews, D.R. Use and abuse of HOMA modeling. Diabetes Care 27, 1487-95 (2004).
27. Raghavan, S. et al. Metabolic factors and genetic risk mediate familial type 2 diabetes risk in the Framingham Heart Study. Diabetologia 58, 988-96 (2015).
28. Henkin, L. et al. Genetic epidemiology of insulin resistance and visceral adiposity. The IRAS Family Study design and methods. Ann Epidemiol 13, 211-7 (2003).
29. Reaven, G.M. Banting lecture 1988. Role of insulin resistance in human disease. Diabetes 37, 1595-607 (1988).
30. Eddy, D., Schlessinger, L., Kahn, R., Peskin, B. & Schiebinger, R. Relationship of insulin resistance and related metabolic variables to coronary artery disease: a mathematical analysis. Diabetes Care 32, 361-6 (2009).
31. Guallar-Castillon, P. et al. Magnitude and management of metabolic syndrome in Spain in 2008-2010: the ENRICA study. Rev Esp Cardiol (Engl Ed) 67, 367-73 (2014).
32. Prasad, D.S., Kabir, Z., Dash, A.K. & Das, B.C. Prevalence and risk factors for metabolic syndrome in Asian Indians: A community study from urban Eastern India. J Cardiovasc Dis Res 3, 204-11 (2012).
33. Ford, E.S., Li, C., Zhao, G., Pearson, W.S. & Mokdad, A.H. Prevalence of the metabolic syndrome among U.S. adolescents using the definition from the International Diabetes Federation. Diabetes Care 31, 587-9 (2008).
34. Bogardus, C., Lillioja, S., Mott, D.M., Hollenbeck, C. & Reaven, G. Relationship between degree of obesity and in vivo insulin action in man. Am J Physiol 248, E286-91 (1985).
35. Penesova, A. et al. Insulin resistance in young, lean male subjects with essential hypertension. J Hum Hypertens 25, 391-400 (2011).
36. Lotta, L.A. et al. Integrative genomic analysis implicates limited peripheral adipose storage capacity in the pathogenesis of human insulin resistance. Nat Genet 49, 17-26 (2017).

49
37. McNaughton, S.A., Mishra, G.D. & Brunner, E.J. Dietary patterns, insulin resistance, and incidence of type 2 diabetes in the Whitehall II Study. Diabetes Care 31, 1343-8 (2008).
38. Hu, F.B. et al. Diet, lifestyle, and the risk of type 2 diabetes mellitus in women. N Engl J Med 345, 790-7 (2001).
39. Laws, A. et al. Resistance to insulin-stimulated glucose uptake and dyslipidemia in Asian Indians. Arterioscler Thromb 14, 917-22 (1994).
40. Scott, R.A. et al. Common genetic variants highlight the role of insulin resistance and body fat distribution in type 2 diabetes, independent of obesity. Diabetes 63, 4378-87 (2014).
41. Muller, D.C., Elahi, D., Tobin, J.D. & Andres, R. The effect of age on insulin resistance and secretion: a review. Semin Nephrol 16, 289-98 (1996).
42. Oya, J. et al. Effects of age on insulin resistance and secretion in subjects without diabetes. Intern Med 53, 941-7 (2014).
43. Imamura, F. et al. Risk factors for type 2 diabetes mellitus preceded by beta-cell dysfunction, insulin resistance, or both in older adults: the Cardiovascular Health Study. Am J Epidemiol 177, 1418-29 (2013).
44. Wilson, P.W. et al. Prediction of incident diabetes mellitus in middle-aged adults: the Framingham Offspring Study. Arch Intern Med 167, 1068-74 (2007).
45. Pyorala, M., Miettinen, H., Halonen, P., Laakso, M. & Pyorala, K. Insulin resistance syndrome predicts the risk of coronary heart disease and stroke in healthy middle-aged men: the 22-year follow-up results of the Helsinki Policemen Study. Arterioscler Thromb Vasc Biol 20, 538-44 (2000).
46. Pyorala, K., Savolainen, E., Kaukola, S. & Haapakoski, J. Plasma insulin as coronary heart disease risk factor: relationship to other risk factors and predictive value during 9 1/2-year follow-up of the Helsinki Policemen Study population. Acta Med Scand Suppl 701, 38-52 (1985).
47. Rutter, M.K., Meigs, J.B., Sullivan, L.M., D'Agostino, R.B., Sr. & Wilson, P.W. Insulin resistance, the metabolic syndrome, and incident cardiovascular events in the Framingham Offspring Study. Diabetes 54, 3252-7 (2005).
48. Noda, H. et al. The impact of the metabolic syndrome and its components on the incidence of ischemic heart disease and stroke: the Japan public health center-based study. Hypertens Res 32, 289-98 (2009).
49. Yeni-Komshian, H., Carantoni, M., Abbasi, F. & Reaven, G.M. Relationship between several surrogate estimates of insulin resistance and quantification of insulin-mediated glucose disposal in 490 healthy nondiabetic volunteers. Diabetes Care 23, 171-5 (2000).
50. Kim, J.K. Hyperinsulinemic-euglycemic clamp to assess insulin sensitivity in vivo. Methods Mol Biol 560, 221-38 (2009).
51. Choukem, S.P. & Gautier, J.F. How to measure hepatic insulin resistance? Diabetes Metab 34, 664-73 (2008).
52. Facchini, F., Humphreys, M.H., Jeppesen, J. & Reaven, G.M. Measurements of insulin-mediated glucose disposal are stable over time. J Clin Endocrinol Metab 84, 1567-9 (1999).
53. Kraegen, E.W., Jenkins, A.B., Storlien, L.H. & Chisholm, D.J. Tracer studies of in vivo insulin action and glucose metabolism in individual peripheral tissues. Horm Metab Res Suppl 24, 41-8 (1990).
54. Greenfield, M.S., Doberne, L., Kraemer, F., Tobey, T. & Reaven, G. Assessment of insulin resistance with the insulin suppression test and the euglycemic clamp. Diabetes 30, 387-92 (1981).

50
55. DeFronzo, R.A., Tobin, J.D. & Andres, R. Glucose clamp technique: a method for quantifying insulin secretion and resistance. Am J Physiol 237, E214-23 (1979).
56. Bergman, R.N., Ider, Y.Z., Bowden, C.R. & Cobelli, C. Quantitative estimation of insulin sensitivity. Am J Physiol 236, E667-77 (1979).
57. Matsuda, M. & DeFronzo, R.A. Insulin sensitivity indices obtained from oral glucose tolerance testing: comparison with the euglycemic insulin clamp. Diabetes Care 22, 1462-70 (1999).
58. Turner, R.C., Holman, R.R., Matthews, D., Hockaday, T.D. & Peto, J. Insulin deficiency and insulin resistance interaction in diabetes: estimation of their relative contribution by feedback analysis from basal plasma insulin and glucose concentrations. Metabolism 28, 1086-96 (1979).
59. Turner, R.C., Oakley, N.W. & Nabarro, J.D. Control of basal insulin secretion, with special reference to the diagnosis of insulinomas. Br Med J 2, 132-5 (1971).
60. Bonora, E. et al. Homeostasis model assessment closely mirrors the glucose clamp technique in the assessment of insulin sensitivity: studies in subjects with various degrees of glucose tolerance and insulin sensitivity. Diabetes Care 23, 57-63 (2000).
61. U.K. Prospective Diabetes Study 16. U.K. prospective diabetes study 16. Overview of 6 years' therapy of type II diabetes: a progressive disease. U.K. Prospective Diabetes Study Group. Diabetes 44, 1249-58 (1995).
62. Sasso, F.C. et al. Glucose metabolism and coronary heart disease in patients with normal glucose tolerance. JAMA 291, 1857-63 (2004).
63. Shai, I. et al. Weight loss with a low-carbohydrate, Mediterranean, or low-fat diet. N Engl J Med 359, 229-41 (2008).
64. Dupuis, J. et al. New genetic loci implicated in fasting glucose homeostasis and their impact on type 2 diabetes risk. Nat Genet 42, 105-16 (2010).
65. Matsuda, M. Measuring and estimating insulin resistance in clinical and research settings. Nutr Metab Cardiovasc Dis 20, 79-86 (2010).
66. Wallace, T.M. & Matthews, D.R. The assessment of insulin resistance in man. Diabet Med 19, 527-34 (2002).
67. Muniyappa, R., Lee, S., Chen, H. & Quon, M.J. Current approaches for assessing insulin sensitivity and resistance in vivo: advantages, limitations, and appropriate usage. Am J Physiol Endocrinol Metab 294, E15-26 (2008).
68. Panhuysen, C.I. et al. A genome scan for loci linked to quantitative insulin traits in persons without diabetes: the Framingham Offspring Study. Diabetologia 46, 579-87 (2003).
69. Wu, K.D. et al. Clustering and heritability of insulin resistance in Chinese and Japanese hypertensive families: a Stanford-Asian Pacific Program in Hypertension and Insulin Resistance sibling study. Hypertens Res 25, 529-36 (2002).
70. Mayer, E.J. et al. Genetic and environmental influences on insulin levels and the insulin resistance syndrome: an analysis of women twins. Am J Epidemiol 143, 323-32 (1996).
71. Freeman, M.S., Mansfield, M.W., Barrett, J.H. & Grant, P.J. Heritability of features of the insulin resistance syndrome in a community-based study of healthy families. Diabet Med 19, 994-9 (2002).
72. Edwards, K.L. et al. Heritability of factors of the insulin resistance syndrome in women twins. Genet Epidemiol 14, 241-53 (1997).
73. Brown, A.E. & Walker, M. Genetics of Insulin Resistance and the Metabolic Syndrome. Curr Cardiol Rep 18, 75 (2016).

51
74. Fuchsberger, C. et al. The genetic architecture of type 2 diabetes. Nature 536, 41-7 (2016).
75. Rasmussen-Torvik, L.J. et al. Heritability and genetic correlations of insulin sensitivity measured by the euglycaemic clamp. Diabet Med 24, 1286-9 (2007).
76. Bergman, R.N. et al. Minimal model-based insulin sensitivity has greater heritability and a different genetic basis than homeostasis model assessment or fasting insulin. Diabetes 52, 2168-74 (2003).
77. Knowles, J.W. et al. Identification and validation of N-acetyltransferase 2 as an insulin sensitivity gene. J Clin Invest 125, 1739-51 (2015).
78. Dimas, A.S. et al. Impact of type 2 diabetes susceptibility variants on quantitative glycemic traits reveals mechanistic heterogeneity. Diabetes 63, 2158-71 (2014).
79. Yaghootkar, H. et al. Genetic evidence for a normal-weight "metabolically obese" phenotype linking insulin resistance, hypertension, coronary artery disease, and type 2 diabetes. Diabetes 63, 4369-77 (2014).
80. Yaghootkar, H. et al. Genetic Evidence for a Link Between Favorable Adiposity and Lower Risk of Type 2 Diabetes, Hypertension, and Heart Disease. Diabetes 65, 2448-60 (2016).
81. Schneider, M.V. & Orchard, S. Omics technologies, data and bioinformatics principles. Methods Mol Biol 719, 3-30 (2011).
82. Fuhrer, T. & Zamboni, N. High-throughput discovery metabolomics. Curr Opin Biotechnol 31, 73-8 (2015).
83. Fearnley, L.G. & Inouye, M. Metabolomics in epidemiology: from metabolite concentrations to integrative reaction networks. Int J Epidemiol 45, 1319-1328 (2016).
84. Blow, N. Metabolomics: Biochemistry's new look. Nature 455, 697-700 (2008).
85. Echouffo-Tcheugui, J.B., Dieffenbach, S.D. & Kengne, A.P. Added value of novel circulating and genetic biomarkers in type 2 diabetes prediction: a systematic review. Diabetes Res Clin Pract 101, 255-69 (2013).
86. Palmer, N.D. et al. Metabolomic profile associated with insulin resistance and conversion to diabetes in the Insulin Resistance Atherosclerosis Study. J Clin Endocrinol Metab 100, E463-8 (2015).
87. Floegel, A. et al. Identification of serum metabolites associated with risk of type 2 diabetes using a targeted metabolomic approach. Diabetes 62, 639-48 (2013).
88. Anderson, N.L. & Anderson, N.G. The human plasma proteome: history, character, and diagnostic prospects. Mol Cell Proteomics 1, 845-67 (2002).
89. Chen, H., Wang, D., Bai, C. & Wang, X. Proteomics-based biomarkers in chronic obstructive pulmonary disease. J Proteome Res 9, 2798-808 (2010).
90. Sundsten, T. & Ortsater, H. Proteomics in diabetes research. Mol Cell Endocrinol 297, 93-103 (2009).
91. Galazis, N., Afxentiou, T., Xenophontos, M., Diamanti-Kandarakis, E. & Atiomo, W. Proteomic biomarkers of type 2 diabetes mellitus risk in women with polycystic ovary syndrome. Eur J Endocrinol 168, R33-43 (2013).
92. Pena, M.J. et al. Plasma proteomics classifiers improve risk prediction for renal disease in patients with hypertension or type 2 diabetes. J Hypertens 33, 2123-32 (2015).
93. Banks, R.E. et al. Proteomics: new perspectives, new biomedical opportunities. Lancet 356, 1749-56 (2000).

52
94. Patterson, S.D. & Aebersold, R.H. Proteomics: the first decade and beyond. Nat Genet 33 Suppl, 311-23 (2003).
95. Ganna, A. et al. A workflow for UPLC-MS non-targeted metabolomic profiling in large human population-based studies. bioRxiv. Posted November 12, 2015. doi: https://doi.org/10.1101/002782.
96. Soininen, P. et al. High-throughput serum NMR metabonomics for cost-effective holistic studies on systemic metabolism. Analyst 134, 1781-5 (2009).
97. Wurtz, P. et al. Metabolite profiling and cardiovascular event risk: a prospective study of 3 population-based cohorts. Circulation 131, 774-85 (2015).
98. Wang, T.J. et al. Metabolite profiles and the risk of developing diabetes. Nat Med 17, 448-53 (2011).
99. Cook, D. et al. Lessons learned from the fate of AstraZeneca's drug pipeline: a five-dimensional framework. Nat Rev Drug Discov 13, 419-31 (2014).
100. Scannell, J.W., Blanckley, A., Boldon, H. & Warrington, B. Diagnosing the decline in pharmaceutical R&D efficiency. Nat Rev Drug Discov 11, 191-200 (2012).
101. Plenge, R.M., Scolnick, E.M. & Altshuler, D. Validating therapeutic targets through human genetics. Nat Rev Drug Discov 12, 581-94 (2013).
102. Fall, T. et al. The role of adiposity in cardiometabolic traits: a Mendelian randomization analysis. PLoS Med 10, e1001474 (2013).
103. Smith, G.D. & Ebrahim, S. 'Mendelian randomization': can genetic epidemiology contribute to understanding environmental determinants of disease? Int J Epidemiol 32, 1-22 (2003).
104. The Emerging Risk Factors Collaboration et al. Major lipids, apolipoproteins, and risk of vascular disease. JAMA 302, 1993-2000 (2009).
105. Filippatos, T.D., Klouras, E., Barkas, F. & Elisaf, M. Cholesteryl ester transfer protein inhibitors: challenges and perspectives. Expert Rev Cardiovasc Ther 14, 953-62 (2016).
106. Lawlor, D.A., Harbord, R.M., Sterne, J.A., Timpson, N. & Davey Smith, G. Mendelian randomization: using genes as instruments for making causal inferences in epidemiology. Stat Med 27, 1133-63 (2008).
107. Burgess, S., Timpson, N.J., Ebrahim, S. & Davey Smith, G. Mendelian randomization: where are we now and where are we going? Int J Epidemiol 44, 379-88 (2015).
108. Voight, B.F. et al. Plasma HDL cholesterol and risk of myocardial infarction: a mendelian randomisation study. Lancet 380, 572-80 (2012).
109. Do, R. et al. Common variants associated with plasma triglycerides and risk for coronary artery disease. Nat Genet 45, 1345-52 (2013).
110. White, J. et al. Association of Lipid Fractions With Risks for Coronary Artery Disease and Diabetes. JAMA Cardiol 1, 692-9 (2016).
111. Cohen, J.C., Boerwinkle, E., Mosley, T.H., Jr. & Hobbs, H.H. Sequence variations in PCSK9, low LDL, and protection against coronary heart disease. N Engl J Med 354, 1264-72 (2006).
112. Ference, B.A. et al. Variation in PCSK9 and HMGCR and Risk of Cardiovascular Disease and Diabetes. N Engl J Med 375, 2144-2153 (2016).
113. Schmidt, A.F. et al. PCSK9 genetic variants and risk of type 2 diabetes: a mendelian randomisation study. Lancet Diabetes Endocrinol 5, 97-105 (2017).
114. Scott, R.A. et al. A genomic approach to therapeutic target validation identifies a glucose-lowering GLP1R variant protective for coronary heart disease. Sci Transl Med 8, 341ra76 (2016).

53
115. Bowden, J., Davey Smith, G. & Burgess, S. Mendelian randomization with invalid instruments: effect estimation and bias detection through Egger regression. Int J Epidemiol 44, 512-25 (2015).
116. Bowden, J. et al. A framework for the investigation of pleiotropy in two-sample summary data Mendelian randomization. Stat Med (2017). Published online 23 January 2017. doi: 10.1002/sim.7221.
117. Burgess, S., Butterworth, A. & Thompson, S.G. Mendelian randomization analysis with multiple genetic variants using summarized data. Genet Epidemiol 37, 658-65 (2013).
118. Burgess, S., Scott, R.A., Timpson, N.J., Davey Smith, G. & Thompson, S.G. Using published data in Mendelian randomization: a blueprint for efficient identification of causal risk factors. Eur J Epidemiol 30, 543-52 (2015).
119. Burgess, S. & Thompson, S.G. Use of allele scores as instrumental variables for Mendelian randomization. Int J Epidemiol 42, 1134-44 (2013).
120. Goring, H.H., Terwilliger, J.D. & Blangero, J. Large upward bias in estimation of locus-specific effects from genomewide scans. Am J Hum Genet 69, 1357-69 (2001).
121. Haycock, P.C. et al. Best (but oft-forgotten) practices: the design, analysis, and interpretation of Mendelian randomization studies. Am J Clin Nutr 103, 965-78 (2016).
122. Paaby, A.B. & Rockman, M.V. The many faces of pleiotropy. Trends Genet 29, 66-73 (2013).
123. Hedstrand, H. A study of middle-aged men with particular reference to risk factors for cardiovascular disease. Upps J Med Sci Suppl 19, 1-61 (1975).
124. Lind, L., Fors, N., Hall, J., Marttala, K. & Stenborg, A. A comparison of three different methods to determine arterial compliance in the elderly: the Prospective Investigation of the Vasculature in Uppsala Seniors (PIVUS) study. J Hypertens 24, 1075-82 (2006).
125. Magnusson, P.K. et al. The Swedish Twin Registry: establishment of a biobank and other recent developments. Twin Res Hum Genet 16, 317-29 (2013).
126. Ganna, A. et al. Large-scale metabolomic profiling identifies novel biomarkers for incident coronary heart disease. PLoS Genet 10, e1004801 (2014).
127. CARDIoGRAMplusC4D Consortium et al. Large-scale association analysis identifies new risk loci for coronary artery disease. Nat Genet 45, 25-33 (2013).
128. Morris, A.P. et al. Large-scale association analysis provides insights into the genetic architecture and pathophysiology of type 2 diabetes. Nat Genet 44, 981-90 (2012).
129. Scott, R.A. et al. Large-scale association analyses identify new loci influencing glycemic traits and provide insight into the underlying biological pathways. Nat Genet 44, 991-1005 (2012).
130. Prokopenko, I. et al. A central role for GRB10 in regulation of islet function in man. PLoS Genet 10, e1004235 (2014).
131. Willer, C.J. et al. Discovery and refinement of loci associated with lipid levels. Nat Genet 45, 1274-83 (2013).
132. Locke, A.E. et al. Genetic studies of body mass index yield new insights for obesity biology. Nature 518, 197-206 (2015).
133. Shin, S.Y. et al. An atlas of genetic influences on human blood metabolites. Nat Genet 46, 543-50 (2014).
134. Illig, T. et al. A genome-wide perspective of genetic variation in human metabolism. Nat Genet 42, 137-41 (2010).
54
135. Wu, J.H. et al. Genome-wide association study identifies novel loci associated with concentrations of four plasma phospholipid fatty acids in the de novo lipogenesis pathway: results from the Cohorts for Heart and Aging Research in Genomic Epidemiology (CHARGE) consortium. Circ Cardiovasc Genet 6, 171-83 (2013).
136. Kettunen, J. et al. Genome-wide association study identifies multiple loci influencing human serum metabolite levels. Nat Genet 44, 269-76 (2012).
137. Benjamini, E.J. & Hochberg, Y. Controlling the false discovery rate: a practical and powerful approach to multiple testing. J R Statist Soc B 57, 289-300 (1995).
138. Ahmad, O.S. et al. A Mendelian randomization study of the effect of type-2 diabetes on coronary heart disease. Nat Commun 6, 7060 (2015).
139. Green, E.D., Watson, J.D. & Collins, F.S. Human Genome Project: Twenty-five years of big biology. Nature 526, 29-31 (2015).
140. Collins, F.S. & Varmus, H. A new initiative on precision medicine. N Engl J Med 372, 793-5 (2015).
141. Cleary, B., Cong, L., Lander, E. & Regev, A. Composite measurements and molecular compressed sensing for highly efficient transcriptomics. bioRxiv. Posted January 2, 2017. doi: https://doi.org/10.1101/091926.
142. Szucs, D. & Ioannidis, J.P.A. When null hypothesis significance testing is unsuitable for research: a reassessment. bioRxiv. Posted August 25, 2016. doi: https://doi.org/10.1101/071530.


Acta Universitatis UpsaliensisDigital Comprehensive Summaries of Uppsala Dissertationsfrom the Faculty of Medicine 1316
Editor: The Dean of the Faculty of Medicine
A doctoral dissertation from the Faculty of Medicine, UppsalaUniversity, is usually a summary of a number of papers. A fewcopies of the complete dissertation are kept at major Swedishresearch libraries, while the summary alone is distributedinternationally through the series Digital ComprehensiveSummaries of Uppsala Dissertations from the Faculty ofMedicine. (Prior to January, 2005, the series was publishedunder the title “Comprehensive Summaries of UppsalaDissertations from the Faculty of Medicine”.)
Distribution: publications.uu.seurn:nbn:se:uu:diva-316891
ACTAUNIVERSITATIS
UPSALIENSISUPPSALA
2017