Lack of the architectural factor HMGA1 causes insulin resistance and diabetes in humans and mice
9
NATURE MEDICINE VOLUME 11 | NUMBER 7 | JULY 2005 765 Lack of the architectural factor HMGA1 causes insulin resistance and diabetes in humans and mice Daniela Foti 1,7 , Eusebio Chiefari 1,7 , Monica Fedele 2 , Rodolfo Iuliano 1 , Leonardo Brunetti 1 , Francesco Paonessa 1 , Guidalberto Manfioletti 3 , Fabrizio Barbetti 4 , Arturo Brunetti 5 , Carlo M Croce 6 , Alfredo Fusco 2 & Antonio Brunetti 1 Type 2 diabetes mellitus is a widespread disease, affecting millions of people globally. Although genetics and environmental factors seem to have a role, the cause of this metabolic disorder is largely unknown. Here we report a genetic flaw that markedly reduced the intracellular expression of the high mobility group A1 (HMGA1) protein, and adversely affected insulin receptor expression in cells and tissues from four subjects with insulin resistance and type 2 diabetes. Restoration of HMGA1 protein expression in subjects’ cells enhanced INSR gene transcription, and restored cell-surface insulin receptor protein expression and insulin-binding capacity. Loss of Hmga1 expression, induced in mice by disrupting the Hmga1 gene, considerably decreased insulin receptor expression in the major targets of insulin action, largely impaired insulin signaling and severely reduced insulin secretion, causing a phenotype characteristic of human type 2 diabetes. Type 2 diabetes mellitus is a genetically heterogeneous disorder involving resistance of peripheral tissues to insulin and reduced insulin secretion from pancreatic beta cells 1–3 . Despite extensive studies, the cause of these defects remains elusive. The interaction of insulin with target cells is mediated by the insulin receptor, a specific glycoprotein located on the plasma membrane. The insulin receptor serves a crucial role both in directing insulin to specific target tissues and in initiating the response of these tissues to the hormone 4 . The insulin receptor is of major importance in certain states of insulin resistance in humans, in which abnormalities of the receptor may lead to defective transmembrane signaling 3,5 . Insulin-resistant individuals with reduced or absent insulin receptor expression in target tissues have been described 3,5 . Many of these individuals have point mutations in the coding sequence of INSR, the gene that encodes insulin receptor. Receptor abnormalities resulting from defects in the generation of INSR mRNA have been reported in individuals with apparently normal INSR genes, suggesting defects in gene regulation 5 . HMGA1 is a small basic protein that binds to AT-rich regions of DNA and functions mainly as a specific cofactor for gene activation 6–8 . HMGA1 by itself has no intrinsic transcriptional activity; rather, it can transactivate promoters through mechanisms that facilitate the assembly and stability of stereospecific DNA-protein complexes that drive gene transcription 6–8 . As part of an investigation into the molecular basis regulating the human INSR gene, we previously showed that HMGA1 is required for proper INSR gene transcription 9,10 . Furthermore, human diabetes associated with defects in a nuclear regulatory protein identical or highly related to HMGA1 has been reported earlier by our group 10,11 . We report herein four individuals with insulin resistance and type 2 diabetes. In all, cell-surface insulin receptors were decreased and INSR gene transcription was considerably impaired, although the INSR genes were normal. In these individuals, the expression of HMGA1 was markedly reduced, suggesting that this defect may induce insulin resistance and diabetes. RESULTS Characteristics of HMGA1-deficient individuals Clinical, biochemical and genetic features of diabetic individuals with defects in HMGA1 expression are reported in Table 1. Patient 1(ref. 10), a nonobese 45-year-old Italian man with the usual features of type 2 diabetes, came to medical attention because of his fasting hyperglycemia and hyperinsulinemia. Patient 2 (ref. 11), an 11-year-old Japanese boy, was diagnosed with type 2 diabetes at age 6 and had the male form of type A insulin resistance with acanthosis nigricans. Patient 3, an 11-year-old Italian girl with type A insulin resistance, came to medical attention because of hyperinsulinemia. At that time, she was noted to be diabetic (2 h glucose, 202 mg/dl), although she did not have fasting hyperglycemia. She had acanthosis nigricans, hyperandrogenism and obesity. Her mother (patient 4), aged 35 years and with a history of hypertension, presented with hirsutism, acanthosis nigricans and obesity. She had hyperinsulinemia and diabetes (2 h glucose, 206 mg/dl), without fasting hyperglycemia. 1 Dipartimento di Medicina Sperimentale e Clinica “G. Salvatore,” Università di Catanzaro “Magna Græcia,” via T. Campanella 115, 88100 Catanzaro, Italy. 2 Dipartimento di Biologia e Patologia Cellulare e Molecolare c/o Istituto di Endocrinologia ed Oncologia Sperimentale del CNR, Università di Napoli “Federico II,” e NOGEC-CEINGE, Biotecnologie Avanzate, via Pansini 5, 80131 Napoli, Italy. 3 Dipartimento di Biochimica, Biofisica e Chimica delle Macromolecole, Università di Trieste, via Giorgieri 1, 34127 Trieste, Italy. 4 IRCCS, Ospedale Pediatrico Bambino Gesù, 00100 Roma, Italy. 5 Istituto di Biostrutture e Bioimmagini, CNR, Università di Napoli “Federico II,” via Pansini 5, 80131 Napoli, Italy. 6 Division of Human Cancer Genetics, Comprehensive Cancer Center, The Ohio State University, 410 West 12th Avenue, Columbus, Ohio 43210, USA. 7 These authors contributed equally to this work. Correspondence should be addressed to A.B. ([email protected]). Published online 29 May 2005; doi:10.1038/nm1254 ARTICLES © 2005 Nature Publishing Group http://www.nature.com/naturemedicine
Transcript of Lack of the architectural factor HMGA1 causes insulin resistance and diabetes in humans and mice

NATURE MEDICINE VOLUME 11 | NUMBER 7 | JULY 2005 765
Lack of the architectural factor HMGA1 causes insulin resistance and diabetes in humans and miceDaniela Foti1,7, Eusebio Chiefari1,7, Monica Fedele2, Rodolfo Iuliano1, Leonardo Brunetti1, Francesco Paonessa1, Guidalberto Manfioletti3, Fabrizio Barbetti4, Arturo Brunetti5, Carlo M Croce6, Alfredo Fusco2 & Antonio Brunetti1
Type 2 diabetes mellitus is a widespread disease, affecting millions of people globally. Although genetics and environmental factors seem to have a role, the cause of this metabolic disorder is largely unknown. Here we report a genetic flaw that markedly reduced the intracellular expression of the high mobility group A1 (HMGA1) protein, and adversely affected insulin receptor expression in cells and tissues from four subjects with insulin resistance and type 2 diabetes. Restoration of HMGA1 protein expression in subjects’ cells enhanced INSR gene transcription, and restored cell-surface insulin receptor protein expression and insulin-binding capacity. Loss of Hmga1 expression, induced in mice by disrupting the Hmga1 gene, considerably decreased insulin receptor expression in the major targets of insulin action, largely impaired insulin signaling and severely reduced insulin secretion, causing a phenotype characteristic of human type 2 diabetes.
Type 2 diabetes mellitus is a genetically heterogeneous disorder involving resistance of peripheral tissues to insulin and reduced insulin secretion from pancreatic beta cells1–3. Despite extensive studies, the cause of these defects remains elusive. The interaction of insulin with target cells is mediated by the insulin receptor, a specific glycoprotein located on the plasma membrane. The insulin receptor serves a crucial role both in directing insulin to specific target tissues and in initiating the response of these tissues to the hormone4. The insulin receptor is of major importance in certain states of insulin resistance in humans, in which abnormalities of the receptor may lead to defective transmembrane signaling3,5. Insulin-resistant individuals with reduced or absent insulin receptor expression in target tissues have been described3,5. Many of these individuals have point mutations in the coding sequence of INSR, the gene that encodes insulin receptor. Receptor abnormalities resulting from defects in the generation of INSR mRNA have been reported in individuals with apparently normal INSR genes, suggesting defects in gene regulation5.
HMGA1 is a small basic protein that binds to AT-rich regions of DNA and functions mainly as a specific cofactor for gene activation6–8. HMGA1 by itself has no intrinsic transcriptional activity; rather, it can transactivate promoters through mechanisms that facilitate the assembly and stability of stereospecific DNA-protein complexes that drive gene transcription6–8. As part of an investigation into the molecular basis regulating the human INSR gene, we previously showed that HMGA1 is required for proper INSR gene transcription9,10. Furthermore, human diabetes associated with defects in a nuclear
regulatory protein identical or highly related to HMGA1 has been reported earlier by our group10,11.
We report herein four individuals with insulin resistance and type 2 diabetes. In all, cell-surface insulin receptors were decreased and INSR gene transcription was considerably impaired, although the INSR genes were normal. In these individuals, the expression of HMGA1 was markedly reduced, suggesting that this defect may induce insulin resistance and diabetes.
RESULTSCharacteristics of HMGA1-deficient individualsClinical, biochemical and genetic features of diabetic individuals with defects in HMGA1 expression are reported in Table 1. Patient 1(ref. 10), a nonobese 45-year-old Italian man with the usual features of type 2 diabetes, came to medical attention because of his fasting hyperglycemia and hyperinsulinemia. Patient 2 (ref. 11), an 11-year-old Japanese boy, was diagnosed with type 2 diabetes at age 6 and had the male form of type A insulin resistance with acanthosis nigricans. Patient 3, an 11-year-old Italian girl with type A insulin resistance, came to medical attention because of hyperinsulinemia. At that time, she was noted to be diabetic (2 h glucose, 202 mg/dl), although she did not have fasting hyperglycemia. She had acanthosis nigricans, hyperandrogenism and obesity. Her mother (patient 4), aged 35 years and with a history of hypertension, presented with hirsutism, acanthosis nigricans and obesity. She had hyperinsulinemia and diabetes (2 h glucose, 206 mg/dl), without fasting hyperglycemia.
1Dipartimento di Medicina Sperimentale e Clinica “G. Salvatore,” Università di Catanzaro “Magna Græcia,” via T. Campanella 115, 88100 Catanzaro, Italy. 2Dipartimento di Biologia e Patologia Cellulare e Molecolare c/o Istituto di Endocrinologia ed Oncologia Sperimentale del CNR, Università di Napoli “Federico II,” e NOGEC-CEINGE, Biotecnologie Avanzate, via Pansini 5, 80131 Napoli, Italy. 3Dipartimento di Biochimica, Biofisica e Chimica delle Macromolecole, Università di Trieste, via Giorgieri 1, 34127 Trieste, Italy. 4IRCCS, Ospedale Pediatrico Bambino Gesù, 00100 Roma, Italy. 5Istituto di Biostrutture e Bioimmagini, CNR, Università di Napoli “Federico II,” via Pansini 5, 80131 Napoli, Italy. 6Division of Human Cancer Genetics, Comprehensive Cancer Center, The Ohio State University, 410 West 12th Avenue, Columbus, Ohio 43210, USA. 7These authors contributed equally to this work. Correspondence should be addressed to A.B. ([email protected]).
Published online 29 May 2005; doi:10.1038/nm1254
A R T I C L E S©
2005
Nat
ure
Pub
lishi
ng G
roup
ht
tp://
ww
w.n
atur
e.co
m/n
atur
emed
icin
e

766 VOLUME 11 | NUMBER 7 | JULY 2005 NATURE MEDICINE
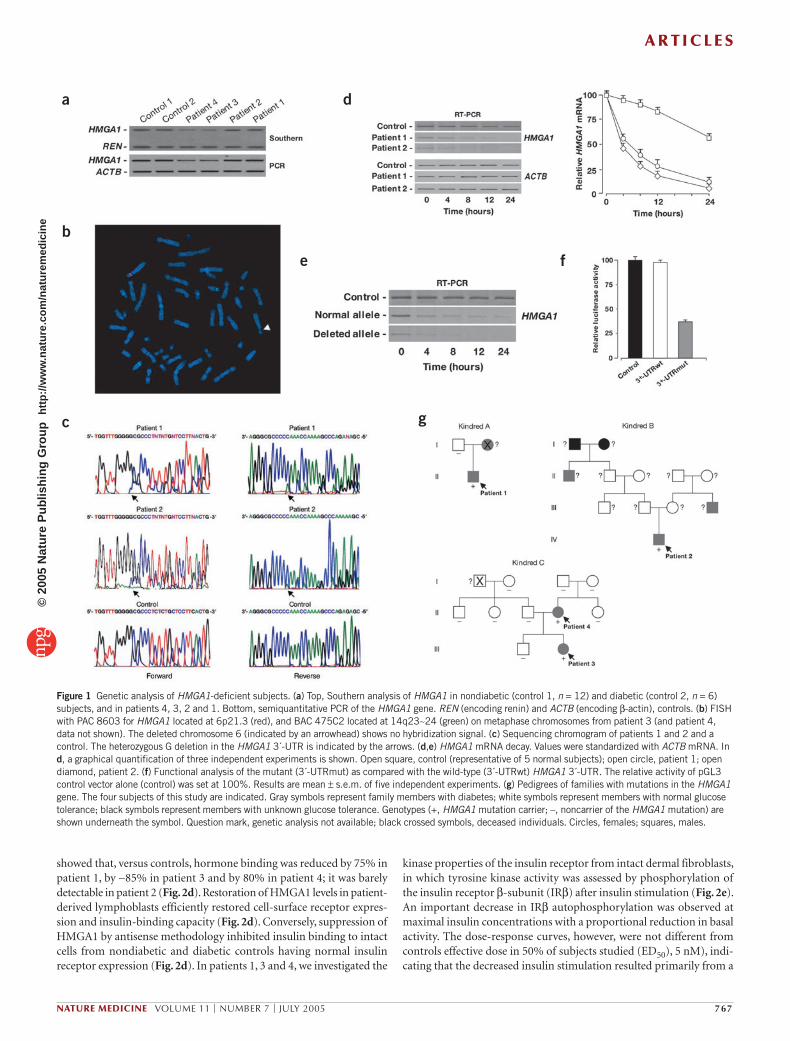
Genetic analysis of HMGA1-deficient individualsTo cast light on the mechanisms underlying decreased HMGA1 pro-tein expression in these individuals, we carried out genomic Southern blot hybridization and dosage analysis of the HMGA1 gene (Fig. 1a). No major gene rearrangements or reductions were found in patients 1 and 2. In contrast, a 50% reduction in the dosage of the HMGA1 gene was found in peripheral blood lymphocytes and cultured lym-phoblasts from patients 3 and 4, and this result is consistent with the loss of one allele (hemizygous deletion) of HMGA1 from chromosome 6p21, as documented by fluorescence in situ hybridization (FISH; Fig. 1b). In both subjects, the mutation in the HMGA1 gene segregated with the disease. A heterozygous single-nucleotide deletion was found in exon 8 (a G deletion at position 895 in the 3´ untranslated region (UTR) of the gene) in cDNA and genomic DNA from B lymphoblasts of patients 1 and 2 (Fig. 1c). No genetic abnormalities of HMGA1 were identified in blood lymphocytes and cultured lymphoblasts from 18 control subjects (12 healthy subjects and 6 type 2 diabetic subjects with normal insulin receptor expression). Also, neither the 148 recruited diabetic individuals nor the 288 healthy individuals examined harbored mutations in the HMGA1 gene, indicating that the identified mutations are significantly associated with the described phenotype (P < 0.05).
mRNA decay and functional analysis of the HMGA1 3´-UTRTo determine whether the mutation in the 3´-UTR of HMGA1 in patients 1 and 2 affected HMGA1 expression, we examined the half-life of HMGA1 mRNA in patients’ lymphoblasts. HMGA1 mRNA has a half-life of ∼30 h12. HMGA1 mRNA half-life decreased from ∼26 h in control cells to ∼4 h in diabetic individuals’ cells (Fig. 1d). When we performed the analysis
on the single alleles (normal and deleted) from both subjects, the deleted mRNA decayed even faster (Fig. 1e). Notably, normal mRNA degradation also increased, indicating that the mutated allele exerts a dominant- negative effect. When the deleted 1,342-bp 3´-UTR was cloned into the 3´ position of a luciferase reporter gene and its expression analyzed in transient transfection studies, luciferase activity decreased by ∼60% (Fig. 1f), thereby indicating that this mutation negatively affects expression. This observation agrees with previous results indicating that the HMGA1 3´-UTR has a role in HMGA1 gene regulation13.
Pedigrees of families with HMGA1 gene mutationsAvailable family trees of all kindreds with HMGA1 gene mutations are shown in Figure 1g. Patient 1 (kindred A) has no siblings. In his clinically unaffected father, no mutations were detected at this locus. His deceased mother had diet-treated diabetes. Patient 2 (kindred B) is of Japanese origin. Both parents had normal a glucose-tolerance test. A maternal uncle and a paternal grand-uncle had a history of diabetes. There was no consanguinity in the family, but screening of these individuals is unavailable. In patient 3 (kindred C), the normal allele was inherited from the father, whereas the chromosome 6 missing the HMGA1 allele was inherited from the mother (patient 4). Mother and daughter showed a superimposable phenotype. No hemizygous deletion was detected in both parents and sister of patient 4, none of whom had diabetes. Non-paternity was excluded, indicating a de novo mutation in this individual. All other family members, including patient 3’s father and brother, were clinically unaffected, and no reduction in gene dosage was detected in their blood lymphocytes. No mutations were detected in the single HMGA1 gene allele of patients 3 and 4.
Role of HMGA1 in INSR gene expression and functionINSR mRNA and protein expression were much lower in patient-derived lymphoblasts (and fibroblasts, data not shown) versus the 18 nondiabetic and diabetic control subjects with normal insulin receptor expression (Fig. 2a). Reduced insulin receptor expression in lymphoblasts paralleled the decrease in HMGA1 mRNA and protein levels (Fig. 2a). Although insulin receptor downregulation by chronic sustained hyperinsulinemia may exacerbate the decrease in insulin receptors in target cells in vivo, consistent with the in vitro data, immunoblots of skeletal muscle from patient 1 and abdominal subcutaneous adipose tissue from patient 4 showed that insu-lin receptor expression was severely attenuated in these insulin- responsive tissues, in which the amount of HMGA1 protein was decreased (Fig. 2b). Reduced HMGA1 protein expres-sion in affected individuals was substantiated by chromatin immunoprecipitation, showing that occupancy on the endogenous INSR locus by HMGA1 was reduced in vivo in intact cells (Fig. 2c).
In many individuals with reduced or absent insulin receptors, the biochemical defect is located at the level of the insulin receptor and can be identified by alterations in insulin bind-ing14. An 125I-labeled insulin binding assay on intact cells from HMGA1-deficient individuals
Table 1 Clinical, biochemical and molecular genetic characteristics of the four subjects
Patient 1 Patient 2 Patient 3
(daughter)
Patient 4
(mother)
Clinical features
Sex Male Male Female Female
Age 45 11 11 35
BMI 22 ND 30.2 34.4
Age at diagnosis 42 6 10 34
Acanthosis nigricans No Yes Yes Yes
Biochemical features
Plasma glucose (mg/dl)
fasting 250 100 80 102
2 h after 75 g glucose (OGTT) ND 310 202 206
Plasma insulin (µU/ml)
fasting 34 300 224.5 62
2 h after 75 g glucose (OGTT) ND 1,845 510 102
Familial features
Parental consanguinity No No No No
OGTT in parents Father normal Normal Father normal Normal
Family history of diabetes Yes Yes Yes Yes
Genetic features
INSR sequence Normal Normal Normal Normal
INSR mRNA Reduced Reduced Reduced Reduced
INSR alleles ND Equally expressed
Equally expressed
Equally expressed
BMI, body mass index; OGTT, oral glucose-tolerance test. ND, not determined. Diabetes was diagnosed according to World Health Organization criteria.
A R T I C L E S©
2005
Nat
ure
Pub
lishi
ng G
roup
ht
tp://
ww
w.n
atur
e.co
m/n
atur
emed
icin
e
NATURE MEDICINE VOLUME 11 | NUMBER 7 | JULY 2005 767
showed that, versus controls, hormone binding was reduced by 75% in patient 1, by ∼85% in patient 3 and by 80% in patient 4; it was barely detectable in patient 2 (Fig. 2d). Restoration of HMGA1 levels in patient-derived lymphoblasts efficiently restored cell-surface receptor expres-sion and insulin-binding capacity (Fig. 2d). Conversely, suppression of HMGA1 by antisense methodology inhibited insulin binding to intact cells from nondiabetic and diabetic controls having normal insulin receptor expression (Fig. 2d). In patients 1, 3 and 4, we investigated the
kinase properties of the insulin receptor from intact dermal fibroblasts, in which tyrosine kinase activity was assessed by phosphorylation of the insulin receptor β-subunit (IRβ) after insulin stimulation (Fig. 2e). An important decrease in IRβ autophosphorylation was observed at maximal insulin concentrations with a proportional reduction in basal activity. The dose-response curves, however, were not different from controls effective dose in 50% of subjects studied (ED50), 5 nM), indi-cating that the decreased insulin stimulation resulted primarily from a
a
b
c g
e f
d
Figure 1 Genetic analysis of HMGA1-deficient subjects. (a) Top, Southern analysis of HMGA1 in nondiabetic (control 1, n = 12) and diabetic (control 2, n = 6) subjects, and in patients 4, 3, 2 and 1. Bottom, semiquantitative PCR of the HMGA1 gene. REN (encoding renin) and ACTB (encoding β-actin), controls. (b) FISH with PAC 8603 for HMGA1 located at 6p21.3 (red), and BAC 475C2 located at 14q23∼24 (green) on metaphase chromosomes from patient 3 (and patient 4, data not shown). The deleted chromosome 6 (indicated by an arrowhead) shows no hybridization signal. (c) Sequencing chromogram of patients 1 and 2 and a control. The heterozygous G deletion in the HMGA1 3´-UTR is indicated by the arrows. (d,e) HMGA1 mRNA decay. Values were standardized with ACTB mRNA. In d, a graphical quantification of three independent experiments is shown. Open square, control (representative of 5 normal subjects); open circle, patient 1; open diamond, patient 2. (f) Functional analysis of the mutant (3´-UTRmut) as compared with the wild-type (3´-UTRwt) HMGA1 3´-UTR. The relative activity of pGL3 control vector alone (control) was set at 100%. Results are mean ± s.e.m. of five independent experiments. (g) Pedigrees of families with mutations in the HMGA1 gene. The four subjects of this study are indicated. Gray symbols represent family members with diabetes; white symbols represent members with normal glucose tolerance; black symbols represent members with unknown glucose tolerance. Genotypes (+, HMGA1 mutation carrier; –, noncarrier of the HMGA1 mutation) are shown underneath the symbol. Question mark, genetic analysis not available; black crossed symbols, deceased individuals. Circles, females; squares, males.
A R T I C L E S©
2005
Nat
ure
Pub
lishi
ng G
roup
ht
tp://
ww
w.n
atur
e.co
m/n
atur
emed
icin
e

768 VOLUME 11 | NUMBER 7 | JULY 2005 NATURE MEDICINE
decrease in receptor numbers. These observations show that reduced insulin binding is the primary defect in these individuals and that defects in HMGA1 may cause decreased insulin receptor expression and induce insulin resistance.
Insulin signaling and glucose homeostasis in miceTo probe further the role of HMGA1 in the pathogenesis of insulin resistance and diabetes, we generated Hmga1 knockout mice using gene- targeting techniques in embryonic stem cells15. Tissue expression of insulin receptor was severely attenuated in Hmga1-null (Hmga1–/–) mice, and reduced by 50% in heterozygous (Hmga1+/–) mutants (Fig. 3a). This reduction seemed highly specific for the insulin receptor, as abnormalities were not found in the expression of the insulin receptor substrate 1 (IRS1)16,17 or other components of the insulin signaling pathway, such as the regulatory p85 subunit of phosphatidylinositol (PI) 3-kinase16,17 and the protein kinase Akt18 (Fig. 3a). Reduced insulin receptor expression in mutant animals paralleled the decrease in insulin-stimulated IRβ autophosphorylation and IRS1 and Akt phosphorylation in skeletal muscle (Fig. 3a), liver and fat (data not shown), as measured after a 120-min hyperinsulinemic-euglycemic clamp period, during which steady-state plasma insulin concentrations were similar in Hmga1-deficient mice and wild-type controls (859.1 ± 35.6 versus 847.9 ± 42.2 pM, respectively). The impairment of insulin signal transduction in Hmga1-deficient mice was confirmed in immunoprecipitation-ELISA assays, showing reduced PI 3-kinase activity in tissues from fasted animals acutely injected with insulin (Fig. 3b).
We next evaluated the effect of Hmga1 knockout on glucose homeostasis by measuring plasma glucose and insulin levels in fasted mice. Whereas glucose levels did not differ among mice with diverse genotypes at 3, 6 and 9 months of age, plasma insulin was lower in Hmga1-deficient animals (Fig. 3c). Blood glucose in fasted wild-type mice subjected to intraperitoneal glucose-tolerance test increased
2.2-fold within 30 min of glucose injection, and returned to baseline 2 h later (Fig. 3d). By contrast, glycemia increased 2.9-fold in Hmga1- deficient mice within 30 min and the animals were still hyperglycemic 2 h later. Glucose intolerance was 40% impaired glucose tolerance and
Figure 2 Functional significance of HMGA1 in INSR gene expression and function. (a) Left, comparison of INSR mRNA and protein content with HMGA1 mRNA and protein expression in cultured lymphoblasts from patients and controls. IP/WB, immunoprecipitation/western blot. Control 1, representative of 12 normal subjects; control 2, representative of 6 type 2 diabetic patients with normal insulin receptor expression. C/EBPβ and β-actin, control of nuclear and total cellular protein loading, respectively. Right, quantification of RT-PCR from controls (healthy subjects, 1–12; diabetic patients with normal insulin receptor expression, 13–18), and patients (P) 1, 2, 3 and 4. Normalized mRNA is expressed as percent of maximal value (100%). Black bars, INSR; gray bars, HMGA1. *P < 0.0001 compared with control group mean. (b) Immunoblots of insulin receptor and HMGA1 in insulin-responsive tissues. Control 1 and control 2, representative of eight normal subjects and ten individuals with type 2 diabetes with normal insulin receptor expression, respectively. (c) Chromatin immunoprecipitation of the INSR promoter gene in EBV-transformed lymphoblasts. Control, representative of three normal subjects. FTH1, human gene encoding ferritin H; mAb, monoclonal antibody; pAb, polyclonal antibody. (d) Comparison of insulin receptor protein content and 125I-labeled insulin binding (expressed as percentage of total) with HMGA1 protein expression in cultured lymphoblasts. Specific insulin binding is expressed as percentage of total/107 cells. Results are the mean ± s.e.m. for three separate assays. Black bars, Control 1, representative of 12 normal subjects; white bars, Control 2, representative of 6 type 2 diabetic patients with normal insulin receptor expression; gray bars, Patients 1, 2, 3 and 4. s, sense; as, antisense. (e) Top, representative autoradiograms of insulin-stimulated IRβ autophosphorylation in fibroblasts. Bottom, densitometric scanning of the autoradiograms from patients 1 (open circles), 3 (open diamonds), 4 (open triangles) and controls (open squares, n = 8). Phosphorylation is expressed in relative units to that in control subjects (basal activity = 1). Mean maximal stimulation in control subjects was 4.2 ± 0.3-fold above basal.
a
b
c
d
e
A R T I C L E S©
2005
Nat
ure
Pub
lishi
ng G
roup
ht
tp://
ww
w.n
atur
e.co
m/n
atur
emed
icin
e

NATURE MEDICINE VOLUME 11 | NUMBER 7 | JULY 2005 769
∼50% diabetes in Hmga1–/– mice (n = 15), and 71% impaired glucose tolerance and 28% diabetes in the Hmga1+/– mice (n = 7) by World Health Organization criteria (Fig. 3d). Of the 22 Hmga1-deficient mice characterized, only 2 (9%) had blood glucose concentrations within the range measured in wild-type controls (n = 7). Approximately 50% of Hmga1–/– mice had an abnormal response to glucose (hyperglycemia > 200 mg/dl 2 h after challenge), whereas only 14% of controls had mild hyperglycemia 2 h after challenge. Different results have been
obtained previously with mice carrying only one disrupted Insr allele. In fact, ∼10% of Insr+/– animals, which are insulin sufficient, devel-oped diabetes19. In Hmga1-deficient mice, consistent with the ubiq-uitous distribution of HMGA1, insulin receptor expression was also considerably reduced in pancreatic tissue (Fig. 3e). Loss of insulin secre-tion in response to glucose has been reported in IRβ knockout mice with tissue-specific knockout of the INSR in pancreatic beta cells20. As in the IRβ knockout mice, plasma insulin after glucose challenge was lower in
a b
c d
e f g
Figure 3 Analysis of insulin signaling proteins, glucose homeostasis and insulin secretion, and insulin-tolerance test (ITT) in mice with different genotypes. (a) Left, western blot of immunoprecipitated insulin receptor from insulin target tissues. Hmga1 expression is shown in fat. Right, immunoblots of phosphorylated (pIRβ, pIRS1, pAkt) and total signaling proteins in skeletal muscle of clamped mice. Representative autoradiograms of 6–8 mice per group are shown. (b) PI 3-kinase activity. Representative autoradiograms from tissues of mice before (–) and after (+) insulin injection are shown. The position of PI 3-phosphate (PI3P) is indicated. Results are presented as increase in PI 3-kinase activity over basal after insulin stimulation. Values are the mean ± s.e.m. for 8–12 mice for each group. Gray bars, Hmga1–/–; white bars, Hmga1+/–; black bars, Hmga1+/+. *P < 0.01 versus control mice. (c) Blood glucose (left) and plasma insulin (right) concentrations from fasted mice at different ages. Each bar represents the mean ± s.e.m. (n = 5–13); black bars, Hmga1+/+; white bars, Hmga1+/–; gray bars, Hmga1–/–. (d) Left, intraperitoneal glucose-tolerance test (IPGTT) in weight-matched mice. Values are expressed as mean ± s.e.m. (n = 7–15). Open squares, Hmga1+/+; open circles, Hmga1+/–; open diamonds, Hmga1–/–. ***P < 0.0001; **P < 0.001; *P < 0.05; Hmga1+/+ versus Hmga1–/–. #P < 0.01 Hmga1+/+ versus Hmga1+/–. Right, blood glucose values from IPGTT (time 0 and 120 min) are shown for individual animals of the indicated genotype. The bar indicates the mean blood glucose concentration for each group. P < 0.01, Hmga1–/– and Hmga1+/– versus control (120 min). (e) mRNA analysis of INSR in mouse pancreatic tissue by RT-PCR. (f) Glucose-stimulated acute-phase insulin secretion in fasted mice. Data represent the average ± s.e.m. for five mice per genotype. Open squares, Hmga1+/+; open circles, Hmga1+/–; open diamonds, Hmga1–/–. (g) Left, ITT. Open squares, Hmga1+/+ (n = 11); open circles, Hmga1+/– (n = 9); open diamonds, Hmga1–/– (n = 7). *P < 0.0001; Hmga1-deficient mice versus Hmga1+/+. Right, steady-state glucose infusion rate from averaged rates of 90–120 min of hyperinsulinemic-euglycemic glucose clamp. Data represent the average ± s.e.m. for six experiments. *P < 0.005; Hmga1-deficient mice versus control group.
A R T I C L E S©
2005
Nat
ure
Pub
lishi
ng G
roup
ht
tp://
ww
w.n
atur
e.co
m/n
atur
emed
icin
e

770 VOLUME 11 | NUMBER 7 | JULY 2005 NATURE MEDICINE
Hmga1-mutant animals than in controls. In particular, the acute first-phase insulin secretory response was severely reduced in Hmga1–/– mice, thereby showing a glucose-induced insulin secretory defect (Fig. 3f).
Insulin sensitivity, Glut4 and IGFBP1 expression in miceNormal fasting glycemia in Hmga1-deficient animals, notwithstand-ing hypoinsulinemia, suggests insulin hypersensitivity. Accordingly, the glucose-lowering effect of exogenous insulin was enhanced in Hmga1-deficient mice during insulin-tolerance test, and the glucose infusion rate necessary to maintain euglycemia was higher in mutant mice during hyperinsulinemic-euglycemic clamp (Fig. 3g). Insulin hypersensitivity despite impairment of insulin function supports the existence of alternative pathways of insulin signaling promoting glucose uptake and utilization in peripheral tissues by either insulin-dependent or insulin-independent mechanisms17,21. On the other hand, concomitant insulin resistance and insulin hypersensitivity in peripheral tissues may paradoxically coexist as observed in livers of lipodystrophic and ob/ob mice22, as well as in Cdk4 knockout mice with defective pancreatic beta cell development and blunted insulin secretion23.
In mice overexpressing the insulin-regulatable glucose transporter (Glut4), the amount of Glut4 in the plasma membrane often increases without the need for insulin signaling24. Immunoblotting of adipose and muscle plasma membranes showed a two- to threefold increase of Glut4 in the insulin hypersensitive Hmga1-deficient mice compared to controls (Fig. 4a). To clarify the mechanisms for this increase, we measured insulin-like growth factor-1 (IGF-1) and IGF-binding protein-1 (IGFBP1) in age- and body weight–matched mutant and wild-type animals. IGF-1–mediated recruitment of Glut4 to plasma membranes has been observed in L6 muscle cells25 and 3T3-L1 adipocytes26. Moreover, treatment of individuals with type 2 diabetes with IGF-1 has been shown to increase insulin sensitivity and improve metabolic control27. IGFBP1 has a key role in modulating IGF-1–related functions. Under physi-ological circumstances, IGFBP1 seems to regulate bioavailable IGF-1 in response to acute metabolic changes (e.g., in response to food and exer-cise)27. A potentially positive role of HMGA1 in IGFBP1 gene expression has been postulated previously on the basis of experimental evidence showing that HMGA1 binds the IGFBP1 gene promoter7,28. Consistent with this observation, IGFBP1 protein levels were 50–70% lower in Hmga1-deficient mice compared with controls (Fig. 4a). No differences were observed between genotypes with regard to IGF-1 serum levels (data not shown). These data suggest that HMGA1 deficiency adversely affects IGFBP1 expression, and this, in animals with a disadvantageous metabolic risk profile, might reflect an adaptive mechanism to increase
IGF-1’s bioactivity, leading to recruitment of Glut4 to plasma membrane and insulin hypersensitivity. This interpretation agrees with results indicating that in rodents, IGF-1 can lower glycemia after saturation of IGF-1 binding to circulating IGFBPs29.
PET and glucose turnover in wild-type and mutant mice By using positron emission tomography (PET) with 18F-labeled 2-fluoro-2-deoxy-D-glucose (FDG), we measured organ glucose uptake. Comparative evaluation of the PET scans showed higher delayed uptake of FDG in the limb and heart, with more marked washout from liver in mutant animals (Fig. 4b). Visual assessment of whole-body distribu-tion also showed more evident renal activity in both scans in knockout mice compared to controls. Because of the limited spatial resolution of the PET study (4 mm full width at half maximum) and the limited
a
c
b
Figure 4 Glut4 and IGFBP1 protein expression, PET and glucose turnover studies in wild-type and mutant mice. (a) Representative Glut4 immunoblots of adipose and muscle plasma membrane (left), and IGFBP1 immunoblots of fasting serum and whole-cell liver extract (right). Densitometric analyses of six to nine independent blots are shown. Black bars, Hmga1+/+, n = 9; white bars, Hmga1–/–, n = 6. *P < 0.01 versus Hmga1+/+. (b) Whole-body reconstructions of PET studies. Shown are PET scan images of a representative control mouse (left) and a representative Hmga1 knockout mouse (right) after 15 min acquisition, starting 5 min (Scan 1) and 35 min (Scan 2) after tracer administration, respectively. FDG uptake ratios for heart, liver and forelimb using brain uptake as reference are shown (black bars, Hmga1+/+; white bars, Hmga1–/–). Data represent mean ± s.e.m. for three mice of each genotype. B, brain; Bl, bladder; H, heart; K, kidney; L, liver. (c) In vivo glucose transport in soleus skeletal muscle and epididymal fat tissue (upper panels), and whole-body glucose uptake and hepatic glucose production (lower panels) in mice under basal and hyperinsulinemic clamp conditions. Results are the mean values ± s.e.m. for six animals per genotype. *P < 0.005 versus control mice.
A R T I C L E S©
2005
Nat
ure
Pub
lishi
ng G
roup
ht
tp://
ww
w.n
atur
e.co
m/n
atur
emed
icin
e

NATURE MEDICINE VOLUME 11 | NUMBER 7 | JULY 2005 771
amount of fat tissue in the examined mice, we were unable to define a reliable region of interest on a fat-tissue area. Insulin-stimulated labeled 2- deoxyglucose uptake in isolated epididymal adipocytes of Hmga1- deficient mice was significantly increased over that of controls (21 ± 4 and 16 ± 2 in Hmga1–/– and Hmga1+/– mice, respectively, versus 11 ± 2 nmol/106 cells/min in controls; P < 0.05). No substantial difference was found in basal 2-deoxyglucose uptake (7.2 ± 3 and 6.3 ± 2 in Hmga1–/– and Hmga1+/–, respectively, versus 5.0 ± 2 nmol/106 cells/min in controls). Consistent with these observations, glucose uptake in skeletal muscle and fat was higher in mutant mice under hyperinsulinemic clamp, whereas no differences with controls were found under basal conditions (Fig. 4c). Accordingly, under clamp conditions, Hmga1-deficient mice showed an increase in the whole-body glucose uptake compared with controls (Fig. 4c). Under hyperinsulinemic conditions, glucose production was higher in mutant mice (Fig. 4c), indicating that liver insulin sensitivity is reduced in Hmga1 knockout animals. Thus, the higher Glut4 content in Hmga1-deficient mice through the increased capacity for Glut4-mediated glucose uptake into muscle and fat represents the primary cause lead-ing to insulin hypersensitivity in these animals, in which a dissociation between increased muscle and fat and decreased liver insulin sensitivity is detectable during hyperinsulinemic clamp.
Hmga1-deficient pancreatic tissue and in vitro insulin secretion Histological analysis of pancreatic sections showed differences in the morphology and size of islets among the three genotypes. Islets from mutant animals were 50–80% smaller and more irregular in shape compared with wild-type islets (Fig. 5a), indicating that decreased
a
b
c
Figure 5 Pancreatic islet morphology and insulin content, analysis of Pdx1 and inhibition of in vitro insulin secretion. (a) Top, hematoxylin and eosin staining (magnification, ×20) and insulin (brown) and glucagon (green) fluorescent immunostaining (magnification, ×40) of pancreas sections from wild-type (+/+) and Hmga1–/– (–/–) mice. Bottom, pancreas weight, islet number and size, and beta-cell number in Hmga1+/+ (black bars) and Hmga1–/– (white bars) mice. Data represent mean ± s.e.m. for three mice of each genotype. (b) Ins1 and Ins2 mRNA in mouse pancreas as detected by RT-PCR. (c) Left, electrophoretic mobility shift assay (EMSA) of Pdx1 and Hmga1 binding to the Ins1 promoter. A and B, supershift of Pdx1 and Hmga1, respectively. Arrowhead, free probe. Center, western blot (WB) of Pdx1 from pancreatic nuclear extracts. Right, insulin secretion from Hmga1 antisense–treated INS-1 cells. Results are mean ± s.e.m. for three independent experiments conducted in triplicate. Immunoblot of Hmga1 is shown in the autoradiogram.
insulin secretion in mutant animals may also depend on reduced beta cell mass. This has been confirmed by measuring total pancreas insu-lin content, showing that insulin transcripts were reduced in Hmga1-deficient mice (Fig. 5b). Because the islet phenotype in Hmga1–/– mice is markedly different from INSR+/– mice, this indicates that mecha-nisms other than the insulin receptor downregulation are responsible for the reduced islet mass. Given its pleiotropic effects, a functional interplay between HMGA1 and the homeodomain transcription fac-tor Pdx1 (a key regulator of pancreatic islet development and beta-cell function) has been reported in the context of the Ins1 gene and other pancreatic islet–specific genes30. Binding of Pdx1 to the insulin gene promoter was reduced in nuclear extracts from Hmga1-defi-cient mice, in which, however, Pdx1 protein expression was unaffected (Fig. 5c). Furthermore, perturbation of Hmga1 in the insulin-secreting beta cell line INS-1 transfected with Hmga1 antisense expression vectors, impaired glucose-stimulated insulin secretion (Fig. 5c), suggesting that Hmga1 may have a direct role in insulin production and pancreatic islet development through Pdx1 and/or other molecular partners.
Thus, the deficit in both insulin secretion and beta-cell mass underlies the hypoinsulinemia of Hmga1-knockout mice. This condition, partially attenuated by insulin hypersensitivity of peripheral tissues, is unable to overcome the concomitant insulin resistance caused by reduced insulin receptor expression and ensure euglycemia in postprandial states.
DISCUSSIONHere we report a new genetic defect that markedly reduces the expression of HMGA1, and adversely affects insulin receptor expression and func-
A R T I C L E S©
2005
Nat
ure
Pub
lishi
ng G
roup
ht
tp://
ww
w.n
atur
e.co
m/n
atur
emed
icin
e

772 VOLUME 11 | NUMBER 7 | JULY 2005 NATURE MEDICINE
tion in insulin target cells and tissues. Our findings provide concordant support for the hypothesis that, in affected individuals, this defect may induce insulin resistance and type 2 diabetes. Although the mutant mouse model does not entirely match the situation in HMGA1-deficient indi-viduals, three common biochemical and metabolic disorders (reduced insulin receptor expression, reduced insulin signaling and diabetes) can be detected in both species carrying the same gene defect. The discrep-ancy in insulin secretion between humans (hyperinsulinemic) and mice (hypoinsulinemic) with insulin receptor defects is not a new finding and has been attributed to various factors20,21,31. Hypoinsulinemia in Hmga1 knockout mice is related to defects in both insulin secretion and beta-cell mass. The lack of these defects in HMGA1-deficient individuals may reflect differences between mice and humans in terms of transcriptional activation of HMGA1-responsive genes associated with pancreatic islet morphogenesis and function. This explanation is supported by obser-vations indicating that substantial interspecies differences exist in pan-creatic islet development and function, as well as in the susceptibility to beta-cell injury32,33. It can be hypothesized that species differences in pancreatic islet tissue responsiveness may mean that quantitative dec-rements in HMGA1 function have different adverse effects in human and mouse, with the former more resistant and less responsive to these changes. Discrepancies between humans and mice carrying the same gene defect emphasize the role of nongenetic environmental factors and genetic modifiers in determining the phenotypic variations in humans and animal models. Here we show that IGFBP1 is reduced in the insulin hypersensitive Hmga1-deficient mice, and such a reduction is generally assumed to increase IGF-1’s biological activity with improvement of insu-lin sensitivity. Decreased IGFBP1 serum levels have also been detected in the available HMGA1-deficient subjects, patients 1, 3 and 4. An explana-tion for the partial divergence between humans (insulin resistant) and mice (insulin sensitive) with HMGA1 and INSR gene defects could be the different responsiveness to the IGF-1–IGFBP1 system in the two species. In fact, whereas in rodents IGF-1 can lower glycemia through its own receptor in the absence of insulin receptors, IGF-1 does not improve the metabolic control in most individuals with genetic syndromes of insulin resistance carrying INSR gene mutations29.
In conclusion, our findings identify HMGA1 as a crucial effector in controlling glucose homeostasis and indicate that impaired HMGA1 function may contribute to the development of specific forms of dia-betes mellitus. Also, they provide a paradigm to suggest another type of molecule, HMGA1, which should be searched for in investigations designed to evaluate the causes of genetic and acquired syndromes of insulin resistance and diabetes.
METHODSSubject selection. We studied 123 individuals with insulin resistance and type 2 diabetes (with and without obesity) attending the authors’ clinic at the Policlinico “Mater Domini” in Catanzaro. We measured insulin binding to circulating monocytes and erythrocytes in all individuals. Patient 1 was identified within a subgroup of 13 individuals for having decreased insulin binding to intact cells and reduced insulin receptor expression in the absence of INSR gene mutations. Patient 2 was reported previously11. He presented with clinical and biochemi-cal features similar to those of patients 3 and 4, who were identified within a cohort of 28 individuals (4 men and 24 women, aged 11–44 years) recruited over a 4-year period with severe insulin resistance and acanthosis nigricans, in the absence of endogenous antibodies specific for insulin receptor. We selected these three individuals for having decreased insulin receptor expression and reduced insulin binding to intact cells in the presence of normal INSR genes. None had been treated with either insulin or oral antidiabetic drugs during the month preceding the study. The studies were approved by the local ethics committee (Comitato Etico Regione Calabria, Azienda Ospedaleria “Mater Domini,” Catanzaro). We obtained informed consent from all individuals or their parents.
Analysis of DNA and FISH. We isolated genomic DNA from peripheral blood lymphocytes of patients and controls. Each of the 22 exons and all the exon-intron junctions, plus the entire promoter region of the INSR gene were ampli-fied by PCR using allele-specific primers. We performed direct DNA sequencing using the Sanger method or using an automated sequencing system (Applied Biosystems) in both sense and antisense directions. We used genomic DNA from lymphocytes and Epstein-Barr virus (EBV)-transformed lymphoblasts of patients and healthy individuals as template in conventional PCR using primers for the HMGA1 gene. PCR products were sequenced in an automated sequencing sys-tem, in both sense and antisense directions. For gene dosage, Southern and FISH analyses see Supplementary Methods online.
Transfection studies, 125I-labeled insulin binding and in vitro insulin secretion. For
antisense experiments, we transfected EBV-transformed lymphoblasts with expres-
sion vector containing the HMGA1 cDNA in either the sense or antisense orientation
as described previously9,10. For the selection of transfected cells, lymphoblasts were
cotransfected with the pEGFP vector (Clontech) and collected 18 h later with a FACS
Vantage cell sorter (Becton Dickinson). Sorted cells were maintained in culture and
insulin binding to intact cells was performed 72 h after transfection9,10. For luciferase
assay and in vitro insulin secretion, see Supplementary Methods online.
Generation of Hmga1-deficient mice. We used gene-targeting techniques in embryonic stem cells to generate a null mutation at the Hmga1 genomic locus. Exon 3, which contains the start site, and exons 4 and 5 of the mouse Hmga1 gene were deleted and replaced with a gene conferring neomycin resistance. We identified het-erozygous progeny of chimeric animals by Southern blot of EcoRI-digested tail DNA, and we established matings to produce mice heterozygous or homozygous for the Hmga1 null allele. Heterozygous mutant mice were viable and fertile. Heterozygous intercrosses yielded homozygous mutant viable offspring at nonmendelian frequen-cies, suggesting that some homozygous mutants died prenatally. Gene inactivation was verified by RT-PCR using total RNA from muscle and fat. All animal work was carried out at the Animal Facility at the Istituto dei Tumori di Napoli using approved animal protocols and in accordance with institutional guidelines.
Glucose-tolerance tests and insulin release in mice. We fasted mice for 12 h and then administered an intraperitoneal glucose injection (2 g/kg body weight). We collected blood from the orbital sinus, and measured glycemia at the indicated times, before and after injection, using the Glucocard glucometer (Menarini). For insulin release, we injected glucose (3 g/kg body weight) and collected a 200-µl sample of orbital blood at the indicated time in chilled heparinized tubes, immediately centrifuged the sample and stored the plasma at –20 °C. Insulin was measured in 5 µl of plasma using an ultrasensitive mouse insulin ELISA kit (Mercodia).
PET. We performed in vivo PET-computed tomography studies in fasting anes-thetized Hmga1-null (n = 3) and wild-type mice (n = 3) after administration of 8 MBq radiolabeled FDG into the tail vein, followed by intraperitoneal administra-tion of insulin. The PET-CT protocol included a localizer scan, a high resolution (0.63-mm slice thickness) whole-body CT study and two 15-min whole-body PET acquisitions starting 5 and 35 min after tracer administration, respectively, to obtain information related to early phase and the metabolic (delayed) uptake of FDG. For assessment of FDG distribution, see Supplementary Methods online.
Statistical analysis. The unpaired Student t-test was used for statistical analysis of gene expression data from normal and diabetic subjects, and to evaluate the differences between the groups of mice. For all analyses, P < 0.05 was considered significant. Statistical analysis of genetic variation in HMGA1 was performed by Fisher Exact Test using the Prism GraphPad program (GraphPad Software).
GenBank accession numbers. The GenBank accession number for HMGA1 cDNA is BC008832 and for the HMGA1 genomic sequence, NT_007592.
Note: Supplementary information is available on the Nature Medicine website.
ACKNOWLEDGMENTSWe are grateful to L. Levintow for critical reading of the manuscript, and N. Perrotti for helpful discussion. We thank T. Maniatis, D. Thanos and J. Bullerdiek for providing plasmids; V. Orlando and P. Malatesta for advice on ChIP and FISH,
A R T I C L E S©
2005
Nat
ure
Pub
lishi
ng G
roup
ht
tp://
ww
w.n
atur
e.co
m/n
atur
emed
icin
e

NATURE MEDICINE VOLUME 11 | NUMBER 7 | JULY 2005 773
respectively; G. Donato for pancreatic histology studies; C. Capula for referring patients with insulin resistance. Also, we thank the Laboratorio di Diagnosi PrePostnatale Malattie Metaboliche (Istituto G. Gaslini) for the service of the “Cell line and DNA bank from patients affected by genetic disease”. We are indebted to A. Luciano and the staff of the Animal Facility for animal care. This work was supported by Telethon-Italy, grants E613 and GGP04245, and MIUR, protocols 2002062899-002 and 2004062059-002 Italy to A.B.We dedicate this article to the memory of Pope John Paul II, who said, “Science can purify religion from error and superstition. Religion can purify science from idolatry and false absolutes.”
COMPETING INTERESTS STATEMENTThe authors declare that they have no competing financial interests.
Received 23 September 2004; accepted 3 May 2005Published online at http://www.nature.com/naturemedicine/
1. Kahn, C.R. Insulin action, diabetogenes, and the cause of type II diabetes (Banting Lecture). Diabetes 43, 1066–1084 (1994).
2. Polonsky, K.S., Sturis, J. & Bell G.I. Non-insulin-dependent diabetes mellitus – a genetically programmed failure of the beta cell to compensate for insulin resistance. N. Engl. J. Med. 334, 777–783 (1996).
3. Taylor, S.I. Insulin resistance or insulin deficiency: which is the primary cause of NIDDM? Diabetes 43, 735–740 (1994).
4. Goldfine, I.D. The insulin receptor: molecular biology and transmembrane signalling. Endocr. Rev. 8, 235–255 (1987).
5. Taylor, S.I. et al. Mutations in the insulin receptor gene. Endocr. Rev. 13, 566–595 (1992).
6. Bustin, M. Regulation of DNA-dependent activities by the functional motifs of the high-mobility-group chromosomal proteins. Mol. Cell. Biol. 19, 5237–5246 (1999).
7. Reeves, R., Beckerbauer, L. HMGI/Y proteins: flexible regulators of transcription and chromatin structure. Biochim. Biophys. Acta. 1519, 13–29 (2001).
8. Thanos, D., & Maniatis, T. The high mobility group protein HMG I(Y) is required for NF-kB-dependent virus induction of the human IFN-β gene. Cell 71, 777–789 (1992).
9. Brunetti, A., Manfioletti, G., Chiefari, E., Goldfine, I.D. & Foti, D. Transcriptional regulation of human insulin receptor gene by the high-mobility-group protein HMGI-Y. FASEB J. 15, 492–500 (2001).
10. Foti, D., Iuliano, R., Chiefari, E. & Brunetti, A. A nucleoprotein complex containing Sp1, C/EBPβ, and HMGI-Y controls human insulin receptor gene transcription. Mol. Cell. Biol. 23, 2720–2732 (2003).
11. Brunetti, A., Brunetti, L., Foti, D., Accili, D. & Goldfine, I.D. Human diabetes associ-ated with defects in regulatory proteins for the insulin receptor gene. J.Clin. Invest. 97, 258–262 (1996).
12. Holth, L.T., Thorlacius, A.E. & Reeves, R. Effect of epidermal growth factor and estrogen on the regulation of the HMGI/Y gene in human mammary epithelial cell lines. DNA Cell Biol. 16, 1299–1309 (1997).
13. Borrmann, L., Wilkening, S. & Bullerdiek, J. The expression of HMGA genes is regulated by their 3’UTR. Oncogene 20, 4537–4541 (2001).
14. Kahn, C.R. et al. The syndromes of insulin resistance and acanthosis nigricans. N. Engl. J. Med. 294, 739–745 (1976).
15. Fidanza, V. et al. Double knockout of the ALL-1 gene blocks hematopoietic differentia-tion in vitro. Cancer. Res. 56, 1179–1183 (1996).
16. White, M.F. The IRS-signalling system: a network of docking proteins that mediate insulin action. Mol. Cell. Biochem. 182, 3–11 (1998).
17. Saltiel, A.R. & Pessin, J.E. Insulin signaling pathways in time and space. Trends Cell Biol. 12, 65–71 (2002).
18. Cho, H. et al. Insulin resistance and a diabetes mellitus-like syndrome in mice lacking the protein kinase Akt2 (PKBβ). Science 292, 1728–1731 (2001).
19. Bruning, J.C. et al. Development of a novel polygenic model of NIDDM in mice hetero-zygous for IR and IRS-1 null alleles. Cell 88, 561–572 (1997).
20. Kulkarni, R.N. et al. Tissue-specific knockout of the insulin receptor in pancreatic β cells creates an insulin secretory defect similar to that in type 2 diabetes. Cell 96, 329–339 (1999).
21. Kitamura, T., Kahn, C.R. & Accili, D. Insulin receptor knockout mice. Annu. Rev. Physiol. 65, 313–332 (2003).
22. Shimomura, I. et al. Decreased IRS-2 and increased SREBP-1c lead to mixed insulin resistance and sensitivity in livers of lipodystrophic and ob/ob mice. Mol. Cell. 6, 77–86 (2000).
23. Rane, S.G. et al. Loss of Cdk4 expression causes insulin-deficient diabetes and Cdk4 activation results in β-islet cell hyperplasia. Nat. Genet. 22, 44–52 (1999).
24. Belke, D.D., Larsen, T.S., Gibbs, E.M., & Severson, D.L. Glucose metabolism in per-fused mouse hearts overexpressing human GLUT-4 glucose transporter. Am. J. Physiol. Endocrinol. Metab. 280, E420–E427 (2001).
25. Bilan, P.J., Ramlal, T., & Klip, A. IGF-1 mediated recruitment of glucose transporters from intracellular membranes to plasma membranes in L6 muscle cells. Adv. Exp. Med. Biol. 293, 273–288 (1991).
26. Weiland, M. et al. The signaling potential of the receptors for insulin and insulin-like growth factor I (IGF-I) in 3T3-L1 adipocytes: comparison of glucose transport activity, induction of oncogene c-fos, glucose transporter mRNA, and DNA-synthesis. J. Cell. Physiol. 149, 428–435 (1991).
27. Sandhu, M.S. et al. Circulating concentrations of insulin-like growth factor-I and development of glucose intolerance: a prospective observational study. Lancet. 359, 1740–1745 (2002).
28. Allander, S.V. et al. Hepatic nuclear factor 3 and high mobility group I/Y proteins bind the insulin response element of the insulin-like growth factor-binding protein-1 promoter. Endocrinology. 138, 4291–4300 (1997).
29. Di Cola, G., Cool, M.H., & Accili, D. Hypoglycemic effect of insulin-like growth factor-1 in mice lacking insulin receptors. J. Clin. Invest. 99, 2538–2544 (1997).
30. Ohneda, K., Mirmira, R.G., Wang, J., Johnson, J.D. & German, M.S. The homeodomain of PDX-1 mediates multiple protein-protein interactions in the formation of a tran-scriptional activation complex on the insulin promoter. Mol. Cell. Biol. 20, 900–911 (2000).
31. Taylor, S.I. Deconstructing type 2 diabetes. Cell 97, 9–12 (1999).32. Kim, S.K., & Hebrok, M. Intercellular signals regulating pancreas development and
function. Genes & Dev. 15, 111–127 (2001).33. Eizirik, D.L. et al. Major species differences between humans and rodents in the
susceptibility to pancreatic β-cell injury. Proc. Natl. Acad. Sci. USA. 91, 9253–9256 (1994).
A R T I C L E S©
2005
Nat
ure
Pub
lishi
ng G
roup
ht
tp://
ww
w.n
atur
e.co
m/n
atur
emed
icin
e