
Architectural Acoustics Illustrated
282
-
Upload
khangminh22 -
Category
Documents
-
view
5 -
download
0
Transcript of Architectural Acoustics Illustrated


ArchitecturAl Acoustics
illustrAted

ArchitecturAl Acoustics
illustrAtedMichAel erMAnn
Associate ProfessorVirginia Tech School of Architecture + Design
Cover Design: C. WallaceCover Photographs: Water Ripples © iStock.com/portishead1; Danish Radio Concert Hall photo by Bjarne Bergius Hermansen
This book is printed on acid-free paper.
Copyright © 2015 by Michael Ermann. All rights reserved.
Published by John Wiley & Sons, Inc., Hoboken, New Jersey.
Published simultaneously in Canada.
No part of this publication may be reproduced, stored in a retrieval system, or transmitted in any form or by any means, electronic, mechanical, photocopying, recording, scanning, or otherwise, except as permitted under Section 107 or 108 of the 1976 United States Copyright Act, without either the prior written permission of the Publisher, or authorization through payment of the appropriate per-copy fee to the Copyright Clearance Center, 222 Rosewood Drive, Danvers, MA 01923, (978) 750-8400, fax (978) 646-8600, or on the web at www.copyright.com. Requests to the Publisher for permission should be addressed to the Permissions Department, John Wiley & Sons, Inc., 111 River Street, Hoboken, NJ 07030, (201) 748-6011, fax (201) 748-6008, or online at www.wiley.com/go/permissions.
Limit of Liability/Disclaimer of Warranty: While the publisher and author have used their best efforts in preparing this book, they make no representations or warranties with the respect to the accuracy or completeness of the contents of this book and specifically disclaim any implied warranties of merchantability or fitness for a particular purpose. No warranty may be created or extended by sales representatives or written sales materials. The advice and strategies contained herein may not be suitable for your situation. You should consult with a professional where appropriate. Neither the publisher nor the author shall be liable for damages arising herefrom.
For general information about our other products and services, please contact our Customer Care Department within the United States at (800) 762-2974, outside the United States at (317) 572-3993 or fax (317) 572-4002.
Wiley publishes in a variety of print and electronic formats and by print-on-demand. Some material included with standard print versions of this book may not be included in e-books or in print-on-demand. If this book refers to media such as a CD or DVD that is not included in the version you purchased, you may download this material at http://booksupport.wiley.com. For more information about Wiley products, visit www.wiley.com.
Library of Congress Cataloging-in-Publication Data:Ermann, Michael (Michael A.) Architectural acoustics illustrated / Michael Ermann, Associate Professor, Virginia Tech School of Architecture + Design. pages cm Includes bibliographical references and index. ISBN 978-1-118-56849-1 (hardback); 978-1-118-98689-9 (ebk); 978-1-118-98690-5 (ebk); 978-1-118-98692-9 (ebk) 1. Architectural acoustics. 2. Architectural acoustics—Pictorial works. I. Title. NA2800.E76 2015 729′.29—dc23 2014040589Printed in the United States of America10 9 8 7 6 5 4 3 2 1

For Lauren, Zachary, and Miles

vii
Contents
Acknowledgments xi
Introduction xiii
1. Basic Theory 1
sound Level 2Sound Level 2Source Path Receiver 4Measuring Sound Level 5Measuring Sound Level 8Multiple Sound Sources 9Decibel Addition 10
sound Propagation 11Sound Propagation 11Directivity 12
sound Frequency 13Frequency 13Octave Bands 17Sound Level Perception and Frequency 19A‐Weighted Decibels 20The Special Case of Low‐Frequency Sound 22
2. sound aBsorPTion 25Principles of Absorptive and Reflective Surfaces 26Absorption Coefficient 27Types of Sound Absorbers 29Room Constant 33Room Average Absorption 33Noise Reduction Coefficient (NRC) 36Sound Absorption Data 38
3. room acousTics 57
room acoustics Qualities 58Impulse Response 58
viii Contents
Reverberance 60Optimal Reverberation Time 65Clarity 66Variable Acoustics 70Reverberation Time Calculation Checklist 74Room Shaping for Speech and Music 75Loudness 76Balconies 80Sightlines 82Warmth 83Concert Hall Types 85Spatial Impression 87Intimacy 94Diffusion 95
Theater Planning 97Stage Acoustics 97Orchestra Pits 101What Makes a Good Room for Music? 102Performance Venue Seats 106
acoustic defects 109Acoustic Defects 109
Performance Venues 114Room Acoustics History 114Performance Venues to Visit 117
design checklists 118Rooms for Unamplified Music Performance Checklist 118Other Types of Rooms Checklist 119
sound system design 123Electronic Sound Reinforcement 123
4. noise conTroL 131
sound isolation Principles 132Apartment Layout Graphic Quiz 132Flanking 133

Contents ix
Flanking Graphic Checklist 134Flanking Noise Checklist 134
measures of airborne sound isolation 140Transmission Loss (TL) 140Sound Transmission Class (STC) 142How to Measure Sound Transmission Class (STC) 144Target STC Ratings 146Noise Reduction (NR) 147Achieving Higher Acoustical Privacy 148
Background noise 152Background Noise 152Noise Criteria (NC) 153Speech Intelligibility and Noise 155Open‐Plan Office Acoustics 157Sound Transmission Loss Data 162Noise Reduction Example Problem 175Air‐Structure‐Air Flanking 178Acoustic Privacy Checklist 179Apartment Layout Quiz Answer 180
door and Window sound isolation 182Doors 182Noise Isolation and Windows 184
impact noise 185Impact Noise Isolation 185How to Measure IIC 190Impact Noise Checklist 192Recommended Floor‐Ceiling Assemblies 195Resiliently Mounted Room Surfaces 197
community noise 202Principles of Community Noise 202Building‐in‐Building Design 202Noise Sources 204Community Noise Research 207Community Noise Example Problem 208

x Contents
Outdoor Barriers 209Outdoor Barriers Checklist 210Outdoor Barrier Example Problem 212Wind Turbine Noise 214Community Noise Checklist 215
mechanical system noise 217Principles of Mechanical System Noise 217Ducted Fan Noise 220Mechanical Room Graphic Checklist 224Ducted Air Turbulence Noise 225Vibration Isolation 229Mechanical Noise Checklist 232Plumbing Noise 237Isolating Pipes from Structure 238Plumbing Noise Checklist 239
index 243

xi
Acknowledgments
Thanks most to Nawazish Nanji, whose pen drew every illustration in this book.
Thanks to M. David Egan, whose text was the inspiration for this one.
Thanks also to the other authors (G. Z. Brown, Mark DeKay, and Francis Ching among them) dedicated to rigorously translating the technology of building into the graphic language of architecture.
Also, thank you to the following for contributing to this effort with your experience, research, work, and generosity.
Wolfgang Ahnert, Mohamed Ait Allaoua, Ed Arenius, Vinny Argentina, Michael Asheim, Chris Barnobi, Tobias Behrens, Les Blomberg, Joe Bridger, Todd Brooks, Wilson Byrick, Robert Calvey, Coryn Carson, Ian Clemons, Amparo de Jaramillo, Mark DeKay, Damian Doria, Paul Drougas, Lauren Duda, Curt Eichelberger, Julia Ellrod, David Ermann, Lauren Ermann, Marlene Ermann, Kristin Fields, Emily Garber, Elzo Gernhart, Carl Giegold, Martin Gold, Matt Golden, Jessica Green, Chris Heinbaugh, Ian Hoffman, Kirsten Hull, Chris Jackson, Myung‐Jun Kim, Sky Kim, Bert Kinzey, Rob Lilkendey, John LoVerde, Richard Maurer, Rachel Montague, Wilson Murphy, Michael New, Kelsey Oesmann, Tom Ohmsen, Tim Owen, Carl Rosenberg, Ken Roy, Natalie Russell, Doug Salvemini, Ron Sauro, Fred Schafer, Gary Siebein, Stephen Skorski, Kerrie Standlee, Noral Stewart, Aaron Thompson, Nancy Timmerman, Brandon Tinianov, Jonas Vadstrup, Matt Van Wagner, Sami Weller, Jonathan Werstein, David Woolworth, Bill Yoder, Matt Yourshaw, Keith Zawistowski, Marie Zawistowski

xiii
Introduction
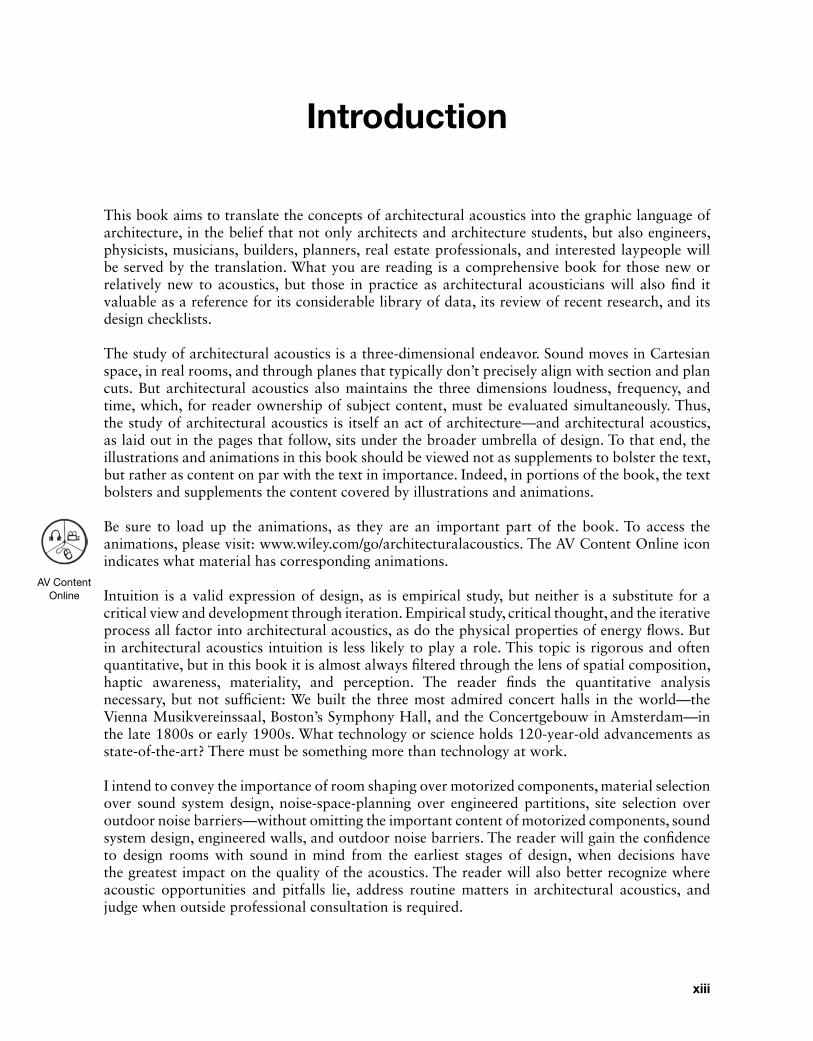
This book aims to translate the concepts of architectural acoustics into the graphic language of architecture, in the belief that not only architects and architecture students, but also engineers, physicists, musicians, builders, planners, real estate professionals, and interested laypeople will be served by the translation. What you are reading is a comprehensive book for those new or relatively new to acoustics, but those in practice as architectural acousticians will also find it valuable as a reference for its considerable library of data, its review of recent research, and its design checklists.
The study of architectural acoustics is a three‐dimensional endeavor. Sound moves in Cartesian space, in real rooms, and through planes that typically don’t precisely align with section and plan cuts. But architectural acoustics also maintains the three dimensions loudness, frequency, and time, which, for reader ownership of subject content, must be evaluated simultaneously. Thus, the study of architectural acoustics is itself an act of architecture—and architectural acoustics, as laid out in the pages that follow, sits under the broader umbrella of design. To that end, the illustrations and animations in this book should be viewed not as supplements to bolster the text, but rather as content on par with the text in importance. Indeed, in portions of the book, the text bolsters and supplements the content covered by illustrations and animations.
Be sure to load up the animations, as they are an important part of the book. To access the animations, please visit: www.wiley.com/go/architecturalacoustics. The AV Content Online icon indicates what material has corresponding animations.
Intuition is a valid expression of design, as is empirical study, but neither is a substitute for a critical view and development through iteration. Empirical study, critical thought, and the iterative process all factor into architectural acoustics, as do the physical properties of energy flows. But in architectural acoustics intuition is less likely to play a role. This topic is rigorous and often quantitative, but in this book it is almost always filtered through the lens of spatial composition, haptic awareness, materiality, and perception. The reader finds the quantitative analysis necessary, but not sufficient: We built the three most admired concert halls in the world—the Vienna Musikvereinssaal, Boston’s Symphony Hall, and the Concertgebouw in Amsterdam—in the late 1800s or early 1900s. What technology or science holds 120‐year‐old advancements as state‐of‐the‐art? There must be something more than technology at work.
I intend to convey the importance of room shaping over motorized components, material selection over sound system design, noise‐space‐planning over engineered partitions, site selection over outdoor noise barriers—without omitting the important content of motorized components, sound system design, engineered walls, and outdoor noise barriers. The reader will gain the confidence to design rooms with sound in mind from the earliest stages of design, when decisions have the greatest impact on the quality of the acoustics. The reader will also better recognize where acoustic opportunities and pitfalls lie, address routine matters in architectural acoustics, and judge when outside professional consultation is required.
AV Content Online


Basic Theory
2 Architectural Acoustics Illustrated
sound LeveL
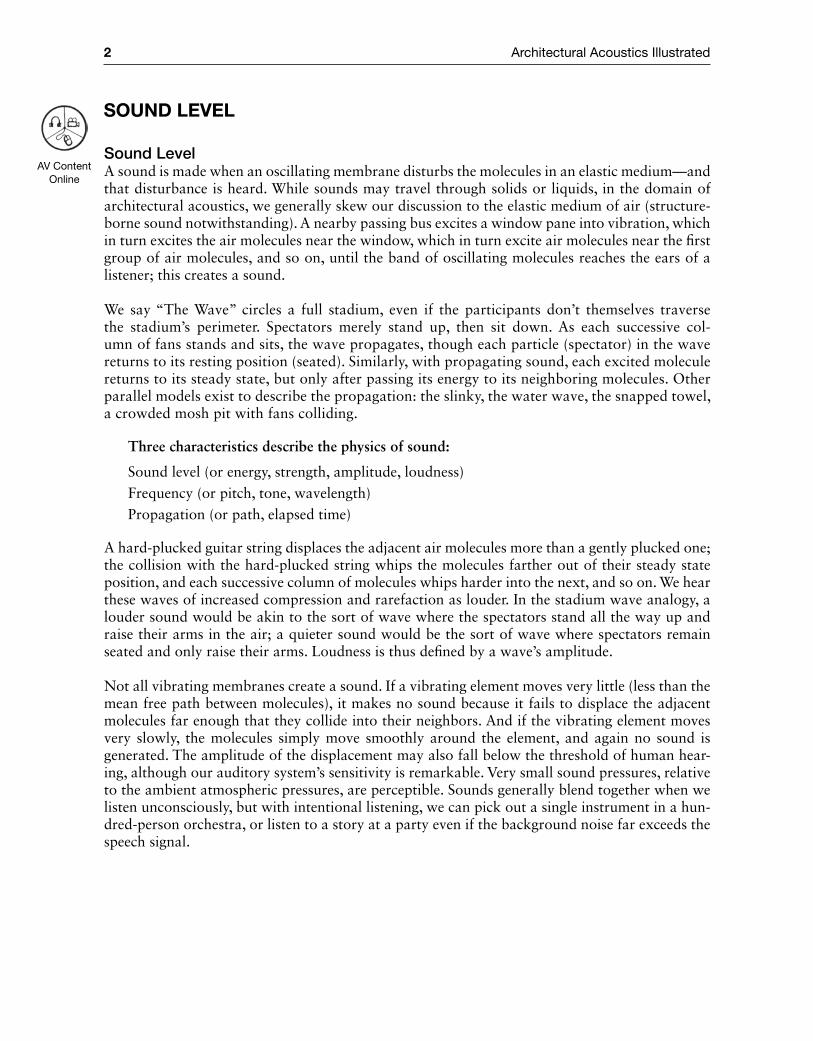
Sound LevelA sound is made when an oscillating membrane disturbs the molecules in an elastic medium—and that disturbance is heard. While sounds may travel through solids or liquids, in the domain of architectural acoustics, we generally skew our discussion to the elastic medium of air (structure-borne sound notwithstanding). A nearby passing bus excites a window pane into vibration, which in turn excites the air molecules near the window, which in turn excite air molecules near the first group of air molecules, and so on, until the band of oscillating molecules reaches the ears of a listener; this creates a sound.
We say “The Wave” circles a full stadium, even if the participants don’t themselves traverse the stadium’s perimeter. Spectators merely stand up, then sit down. As each successive col-umn of fans stands and sits, the wave propagates, though each particle (spectator) in the wave returns to its resting position (seated). Similarly, with propagating sound, each excited molecule returns to its steady state, but only after passing its energy to its neighboring molecules. Other parallel models exist to describe the propagation: the slinky, the water wave, the snapped towel, a crowded mosh pit with fans colliding.
Three characteristics describe the physics of sound:
Sound level (or energy, strength, amplitude, loudness)Frequency (or pitch, tone, wavelength)Propagation (or path, elapsed time)
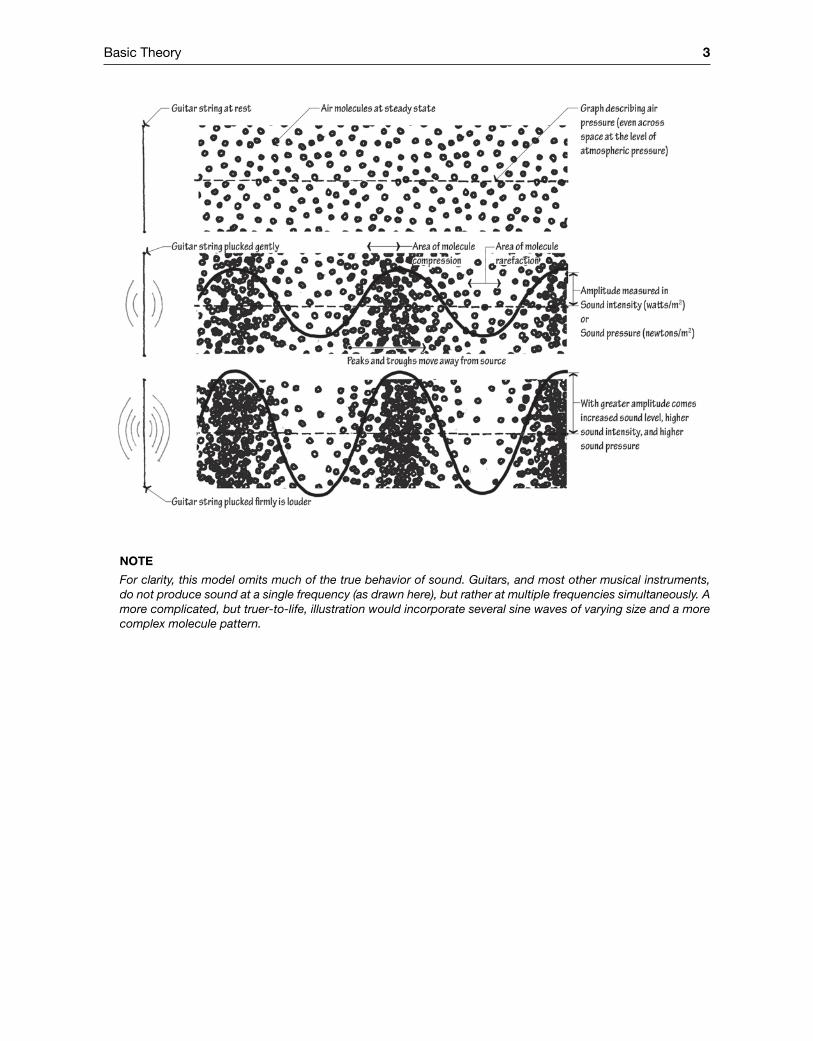
A hard‐plucked guitar string displaces the adjacent air molecules more than a gently plucked one; the collision with the hard‐plucked string whips the molecules farther out of their steady state position, and each successive column of molecules whips harder into the next, and so on. We hear these waves of increased compression and rarefaction as louder. In the stadium wave analogy, a louder sound would be akin to the sort of wave where the spectators stand all the way up and raise their arms in the air; a quieter sound would be the sort of wave where spectators remain seated and only raise their arms. Loudness is thus defined by a wave’s amplitude.
Not all vibrating membranes create a sound. If a vibrating element moves very little (less than the mean free path between molecules), it makes no sound because it fails to displace the adjacent molecules far enough that they collide into their neighbors. And if the vibrating element moves very slowly, the molecules simply move smoothly around the element, and again no sound is generated. The amplitude of the displacement may also fall below the threshold of human hear-ing, although our auditory system’s sensitivity is remarkable. Very small sound pressures, relative to the ambient atmospheric pressures, are perceptible. Sounds generally blend together when we listen unconsciously, but with intentional listening, we can pick out a single instrument in a hun-dred‐person orchestra, or listen to a story at a party even if the background noise far exceeds the speech signal.
AV Content Online
Basic Theory 3
noTe
For clarity, this model omits much of the true behavior of sound. Guitars, and most other musical instruments, do not produce sound at a single frequency (as drawn here), but rather at multiple frequencies simultaneously. A more complicated, but truer‐to‐life, illustration would incorporate several sine waves of varying size and a more complex molecule pattern.
4 Architectural Acoustics Illustrated
Source Path Receiver
Basic Theory 5
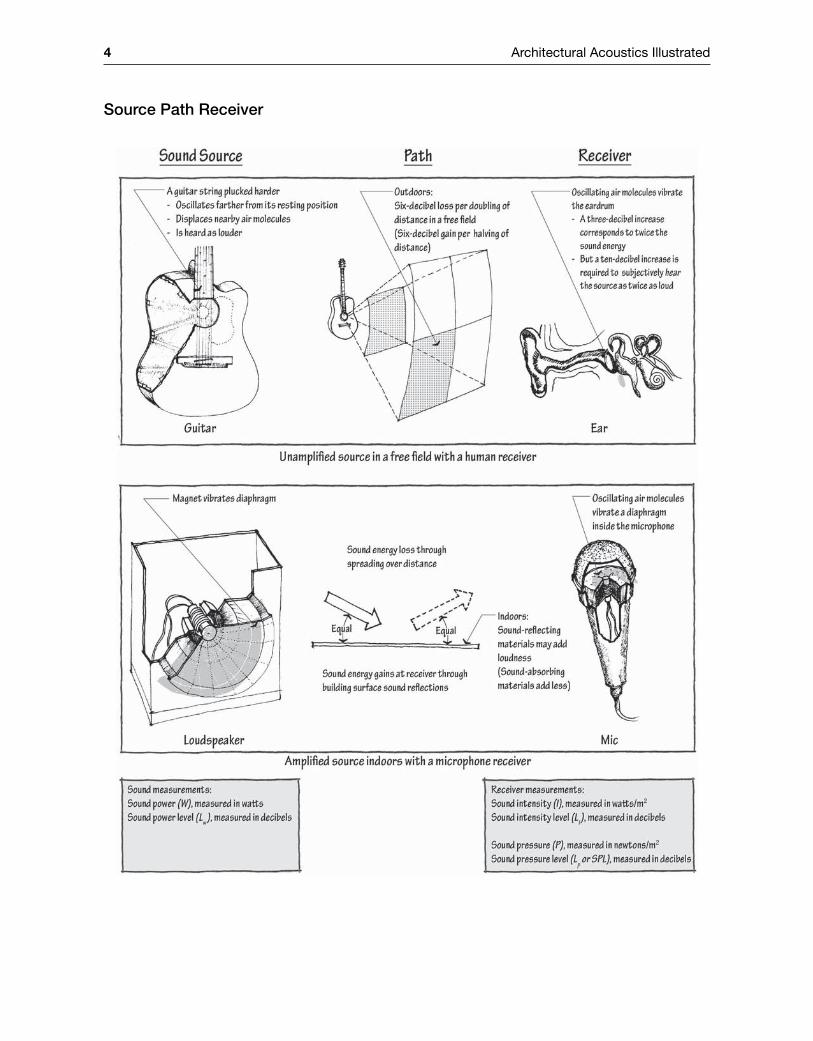
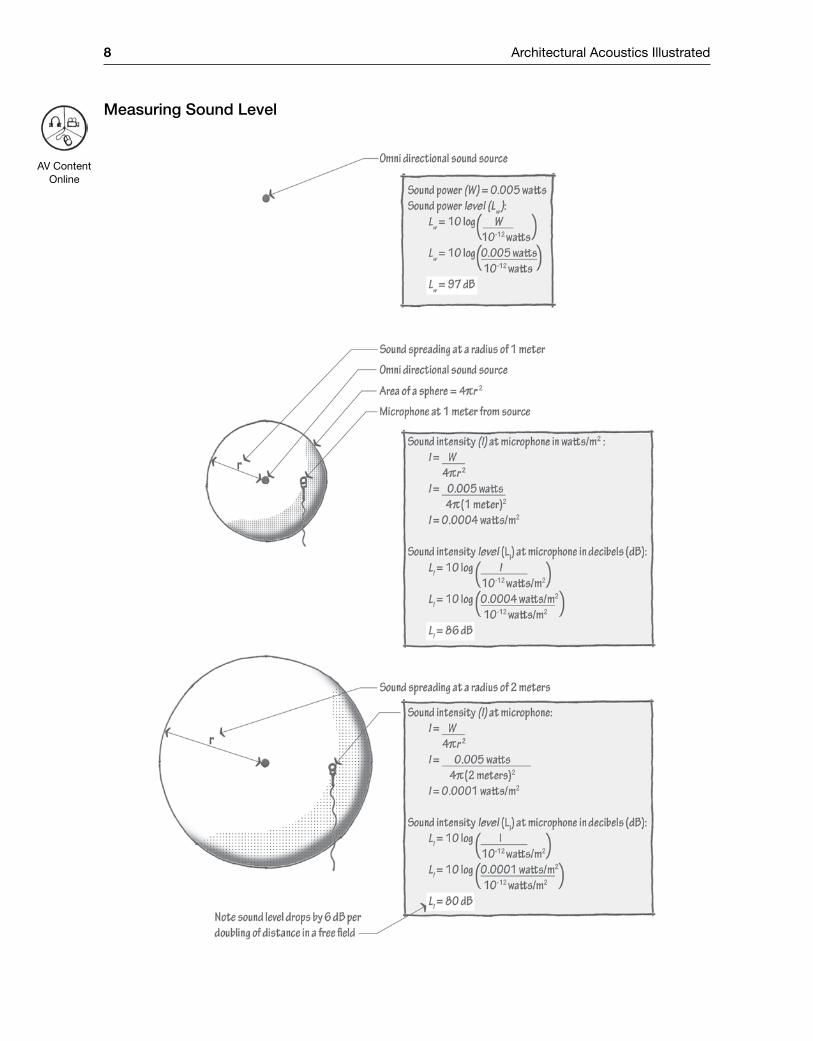
Measuring Sound LevelSound power (W) describes the strength at the source, and sound intensity (I) or sound pressure (P) describes the strength at the receiver, accounting for distance, room surface sound absorption, room geometry, and other environmental effects.
Sound power is measured at a source (piano, noisy air conditioner, human voice), to quantify how much sound energy that source radiates:W = sound power, measured in watts
A microphone measures in one of two different methods at a receiver to quantify how much sound is arriving:I = sound intensity, measured as the source power divided by the area over which the source energy has spread, expressed in the units watts/m2
orP = sound pressure measured as the amplitude of the sound wave, in the units newtons/m2
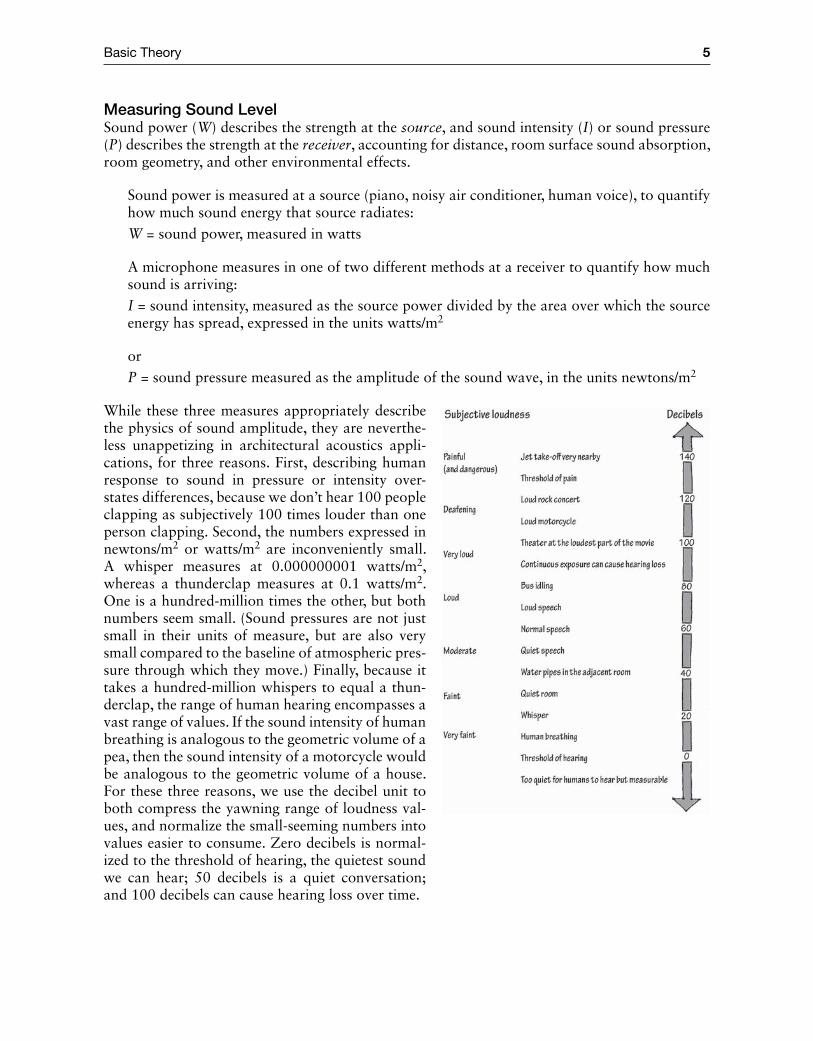
While these three measures appropriately describe the physics of sound amplitude, they are neverthe-less unappetizing in architectural acoustics appli-cations, for three reasons. First, describing human response to sound in pressure or intensity over-states differences, because we don’t hear 100 people clapping as subjectively 100 times louder than one person clapping. Second, the numbers expressed in newtons/m2 or watts/m2 are inconveniently small. A whisper measures at 0.000000001 watts/m2, whereas a thunderclap measures at 0.1 watts/m2. One is a hundred‐million times the other, but both numbers seem small. (Sound pressures are not just small in their units of measure, but are also very small compared to the baseline of atmospheric pres-sure through which they move.) Finally, because it takes a hundred‐million whispers to equal a thun-derclap, the range of human hearing encompasses a vast range of values. If the sound intensity of human breathing is analogous to the geometric volume of a pea, then the sound intensity of a motorcycle would be analogous to the geometric volume of a house. For these three reasons, we use the decibel unit to both compress the yawning range of loudness val-ues, and normalize the small‐seeming numbers into values easier to consume. Zero decibels is normal-ized to the threshold of hearing, the quietest sound we can hear; 50 decibels is a quiet conversation; and 100 decibels can cause hearing loss over time.
6 Architectural Acoustics Illustrated
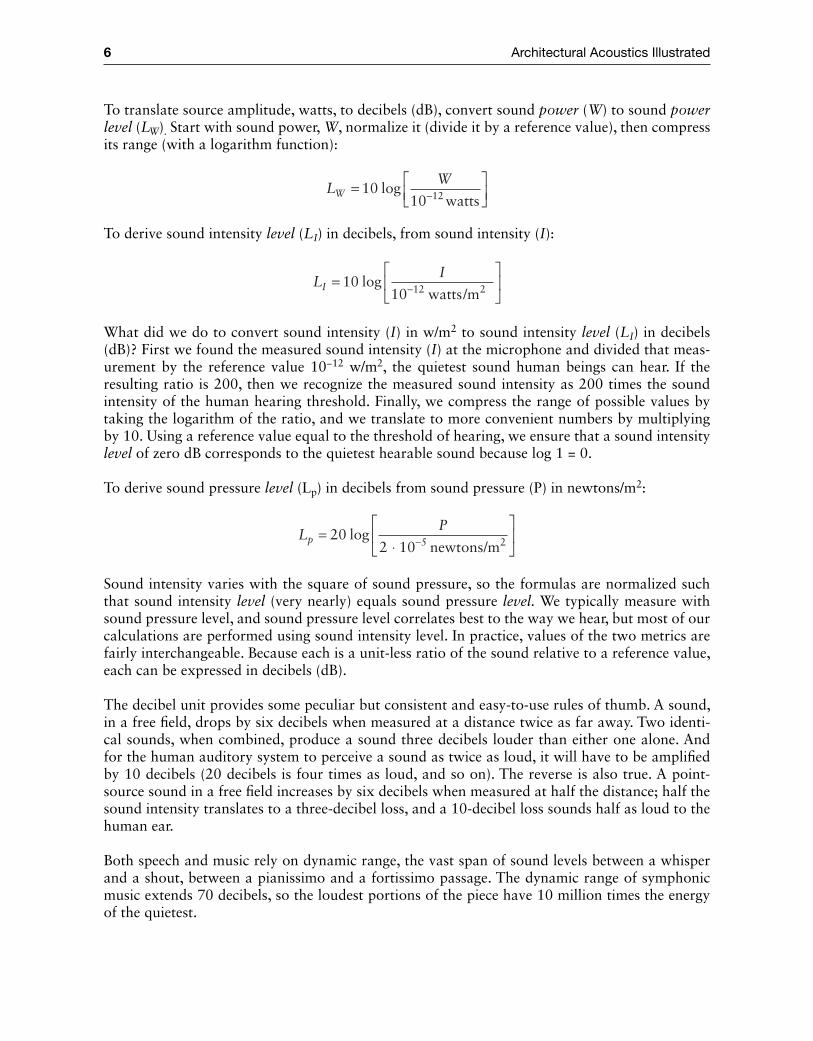
To translate source amplitude, watts, to decibels (dB), convert sound power (W) to sound power level (LW). Start with sound power, W, normalize it (divide it by a reference value), then compress its range (with a logarithm function):
LW
W =
−10
10 12log
watts
To derive sound intensity level (LI) in decibels, from sound intensity (I):
LI
I =
−10
10 12 2log
watts/m
What did we do to convert sound intensity (I) in w/m2 to sound intensity level (LI) in decibels (dB)? First we found the measured sound intensity (I) at the microphone and divided that meas-urement by the reference value 10−12 w/m2, the quietest sound human beings can hear. If the resulting ratio is 200, then we recognize the measured sound intensity as 200 times the sound intensity of the human hearing threshold. Finally, we compress the range of possible values by taking the logarithm of the ratio, and we translate to more convenient numbers by multiplying by 10. Using a reference value equal to the threshold of hearing, we ensure that a sound intensity level of zero dB corresponds to the quietest hearable sound because log 1 = 0.
To derive sound pressure level (Lp) in decibels from sound pressure (P) in newtons/m2:
LP
p =⋅
−20
2 10 5 2log
newtons/m
Sound intensity varies with the square of sound pressure, so the formulas are normalized such that sound intensity level (very nearly) equals sound pressure level. We typically measure with sound pressure level, and sound pressure level correlates best to the way we hear, but most of our calculations are performed using sound intensity level. In practice, values of the two metrics are fairly interchangeable. Because each is a unit‐less ratio of the sound relative to a reference value, each can be expressed in decibels (dB).
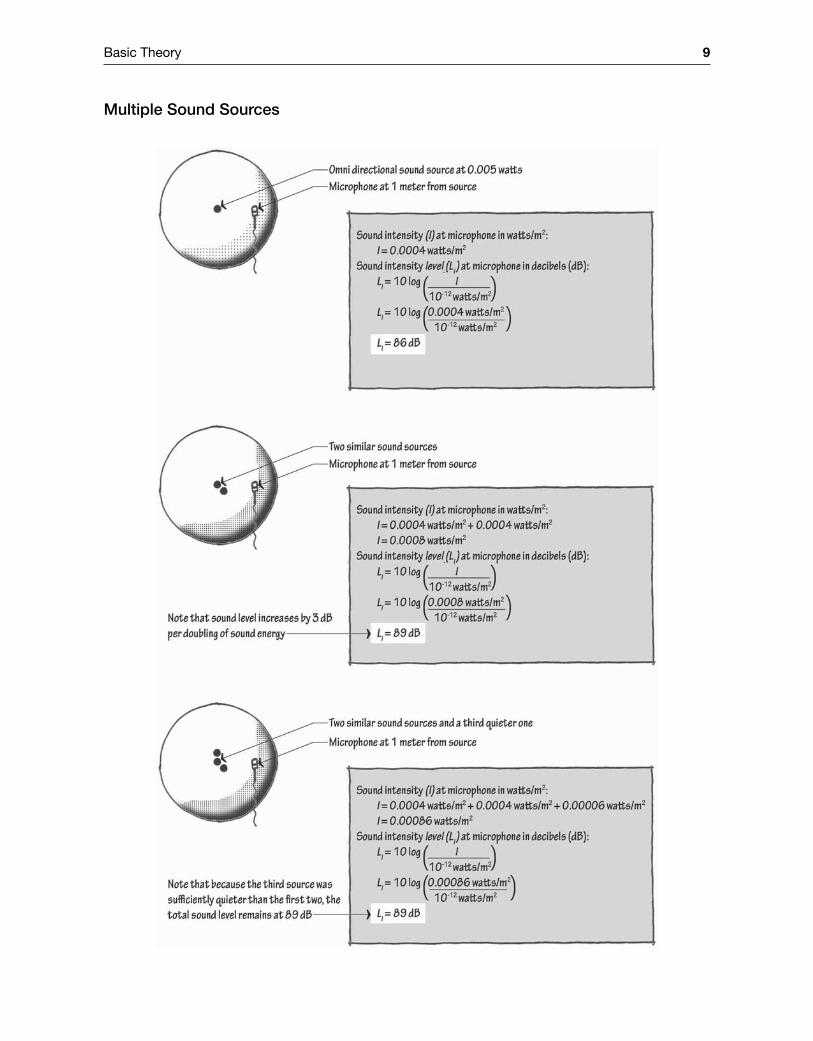
The decibel unit provides some peculiar but consistent and easy‐to‐use rules of thumb. A sound, in a free field, drops by six decibels when measured at a distance twice as far away. Two identi-cal sounds, when combined, produce a sound three decibels louder than either one alone. And for the human auditory system to perceive a sound as twice as loud, it will have to be amplified by 10 decibels (20 decibels is four times as loud, and so on). The reverse is also true. A point‐source sound in a free field increases by six decibels when measured at half the distance; half the sound intensity translates to a three‐decibel loss, and a 10‐decibel loss sounds half as loud to the human ear.
Both speech and music rely on dynamic range, the vast span of sound levels between a whisper and a shout, between a pianissimo and a fortissimo passage. The dynamic range of symphonic music extends 70 decibels, so the loudest portions of the piece have 10 million times the energy of the quietest.
Basic Theory 7
noTe
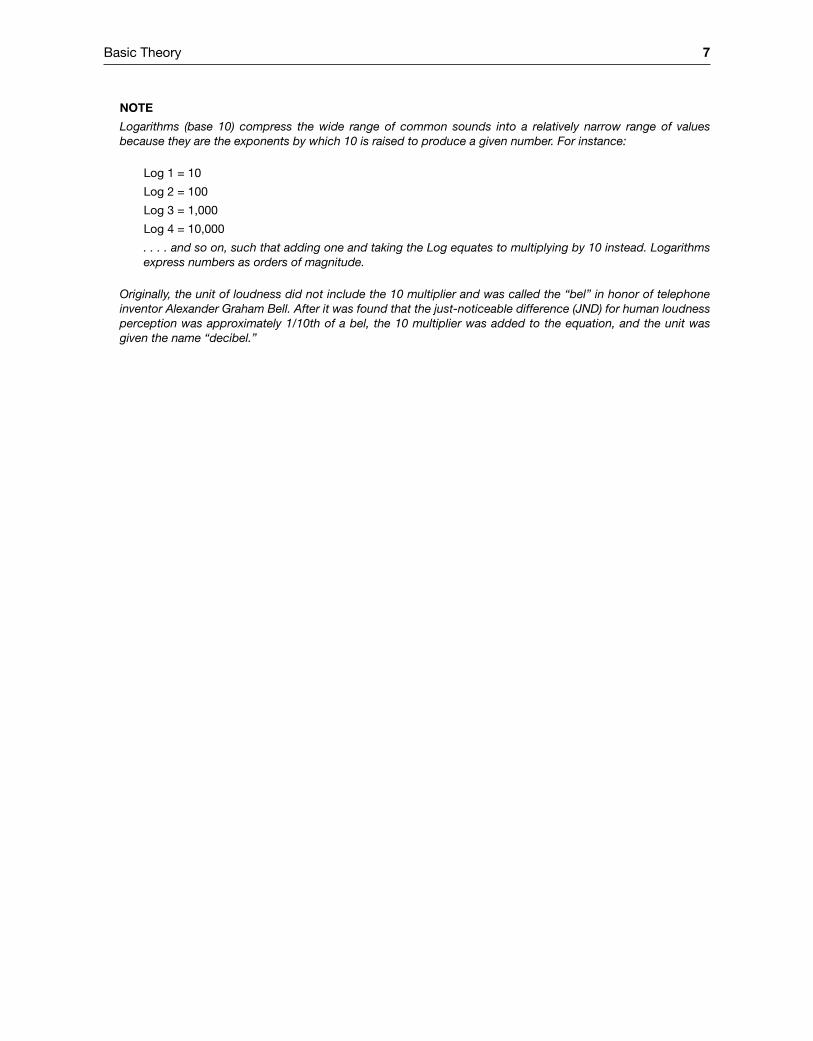
Logarithms (base 10) compress the wide range of common sounds into a relatively narrow range of values because they are the exponents by which 10 is raised to produce a given number. For instance:
Log 1 = 10
Log 2 = 100
Log 3 = 1,000
Log 4 = 10,000
. . . . and so on, such that adding one and taking the Log equates to multiplying by 10 instead. Logarithms express numbers as orders of magnitude.
Originally, the unit of loudness did not include the 10 multiplier and was called the “bel” in honor of telephone inventor Alexander Graham Bell. After it was found that the just‐noticeable difference (JND) for human loudness perception was approximately 1/10th of a bel, the 10 multiplier was added to the equation, and the unit was given the name “decibel.”
8 Architectural Acoustics Illustrated
Measuring Sound Level
AV Content Online
Basic Theory 9
Multiple Sound Sources
10 Architectural Acoustics Illustrated
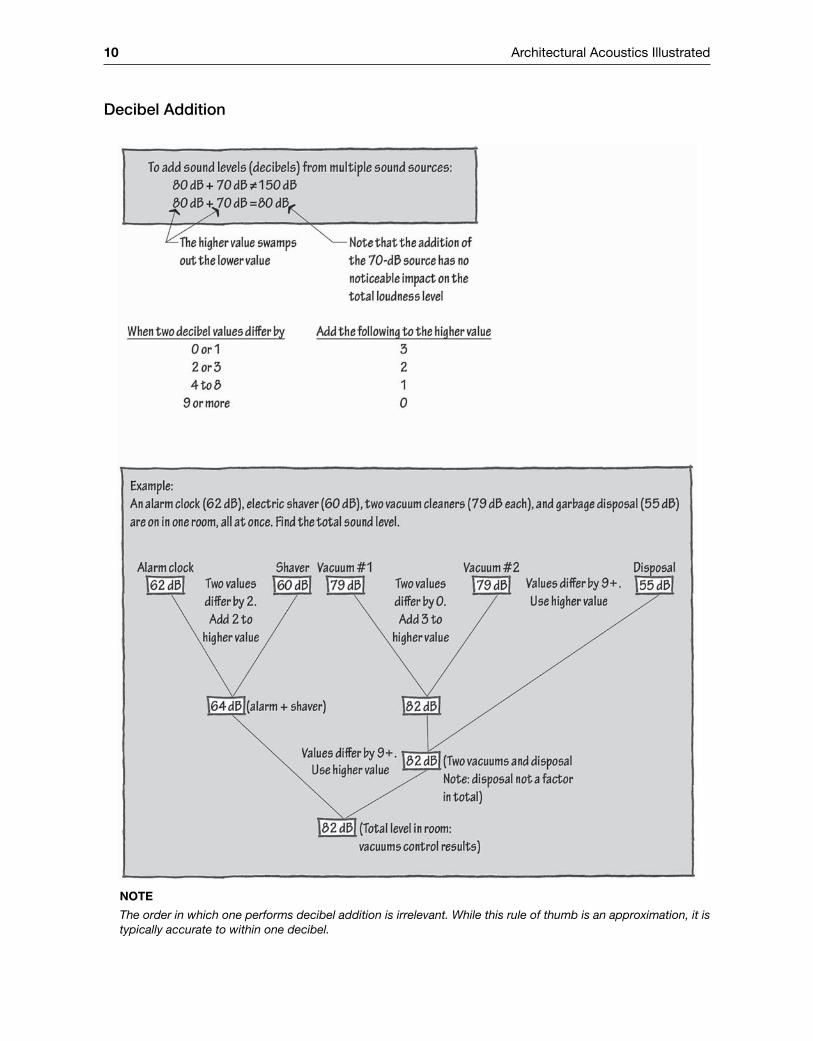
Decibel Addition
noTe
The order in which one performs decibel addition is irrelevant. While this rule of thumb is an approximation, it is typically accurate to within one decibel.
Basic Theory 11
sound ProPagaTion
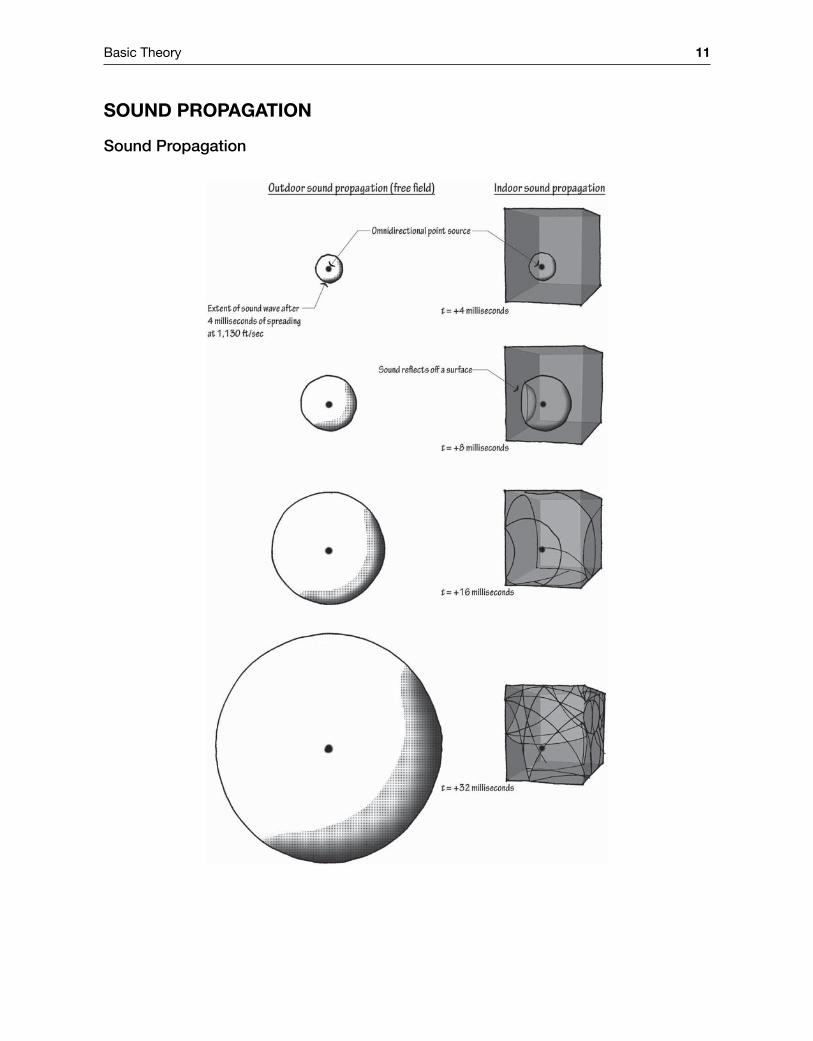
Sound Propagation
12 Architectural Acoustics Illustrated
Direct sound decays at the same rate inside as outside, shedding six decibels per doubling of dis-tance because the same sound energy is spread over four times the area every time the distance is doubled. What differs is the reflected sound off the room boundary surfaces inside. Depending on materiality, sound energy hitting a surface will reflect off a surface as the spreading sound‐front sphere folds in on itself with each successive reflection.
Directivity
Basic Theory 13
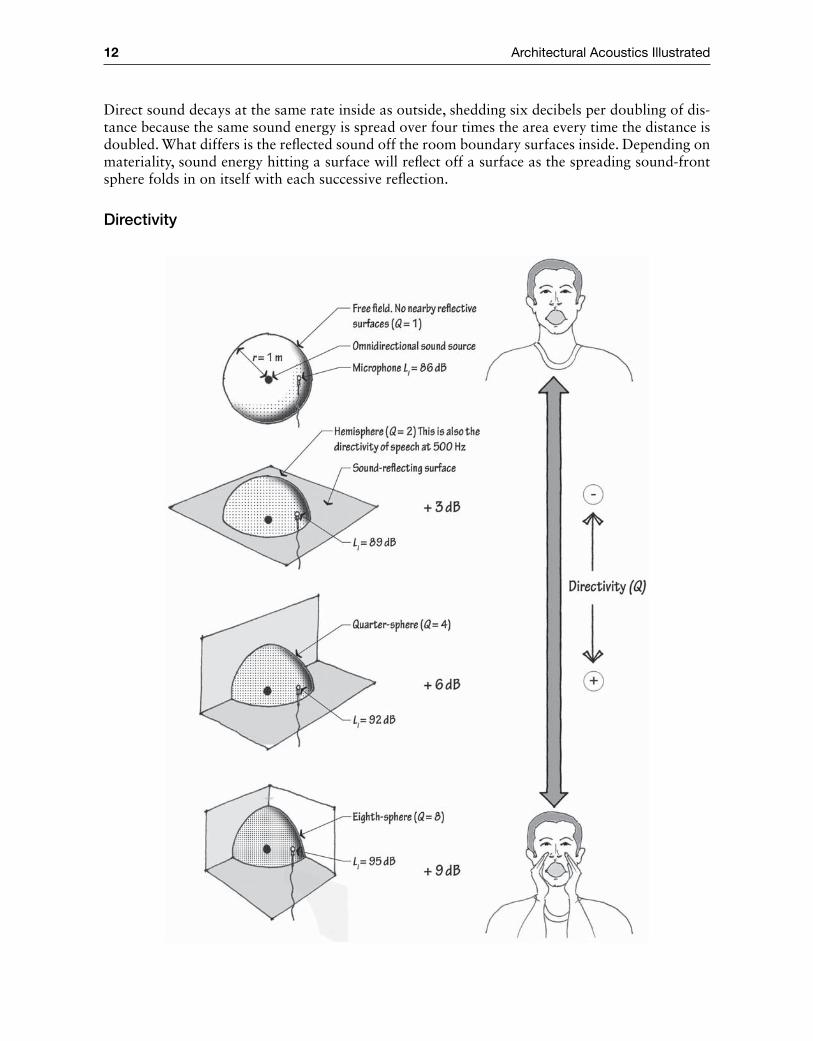
IW Q
r= •
4 2π
Where I is the intensity at a given angle
Q is the directivity, per the graphic, and
4 π r2 is the area of the sphere of radius r, over which the sound is spread
sound Frequency
FrequencyIn 1957 a seven‐year‐old boy, Joe Engressia, foiled the phone system. Blind since birth, abused at school, and possessing both a 172 IQ and perfect pitch, Engressia noticed a 2,600‐Hz frequency pure tone buzzing in the background during long‐distance calls. He discovered that whistling the same tone, the fourth E above middle C, disconnected the call. More experimentation led him to a system, later termed “phreaking,” which tricked the phone company’s computers into provid-ing free long‐distance calls for the whistler. Because long‐distance calls were very expensive at the time, and because the phone company’s computer was seen as the most complex of its time, phreaking became a 1970s pastime for a subculture of socially awkward teens interested in tech-nology; it was the precursor to computer hacking. A young Steve Jobs, after reading a story on the phenomenon, recruited his friend Steve Wozniak, and the two of them designed, manufactured, and sold “blue boxes,” electronic tone generators that allowed users to make free long‐distance calls. Jobs once said, “If we hadn’t made blue boxes, there would have been no Apple.”
Sounds have a loudness associated with each frequency, and describing the quality of a sound in decibels without specifying the frequency content is a bit like describing the quality of the weather in temperature without mentioning if skies are clear or rainy. When sound includes abundant high‐pitched or treble energy, it is said to be heavy on high‐frequency content, and when sound includes abundant low‐pitched or bass energy, it contains ample low‐frequency content.
In the same way that a drumroll, when sufficiently rapid, begins to approach a tone to our ears rather than individual taps, sound is made up of beats per second. Each time a high‐pressure wave of molecules impinges upon the listener, it’s heard as a beat, and measured in hertz (Hz), or cycles per second. If the beats come one per second, it is said they have a frequency of one hertz. One hundred beats per second, or pressure waves per second, measures one hundred hertz.
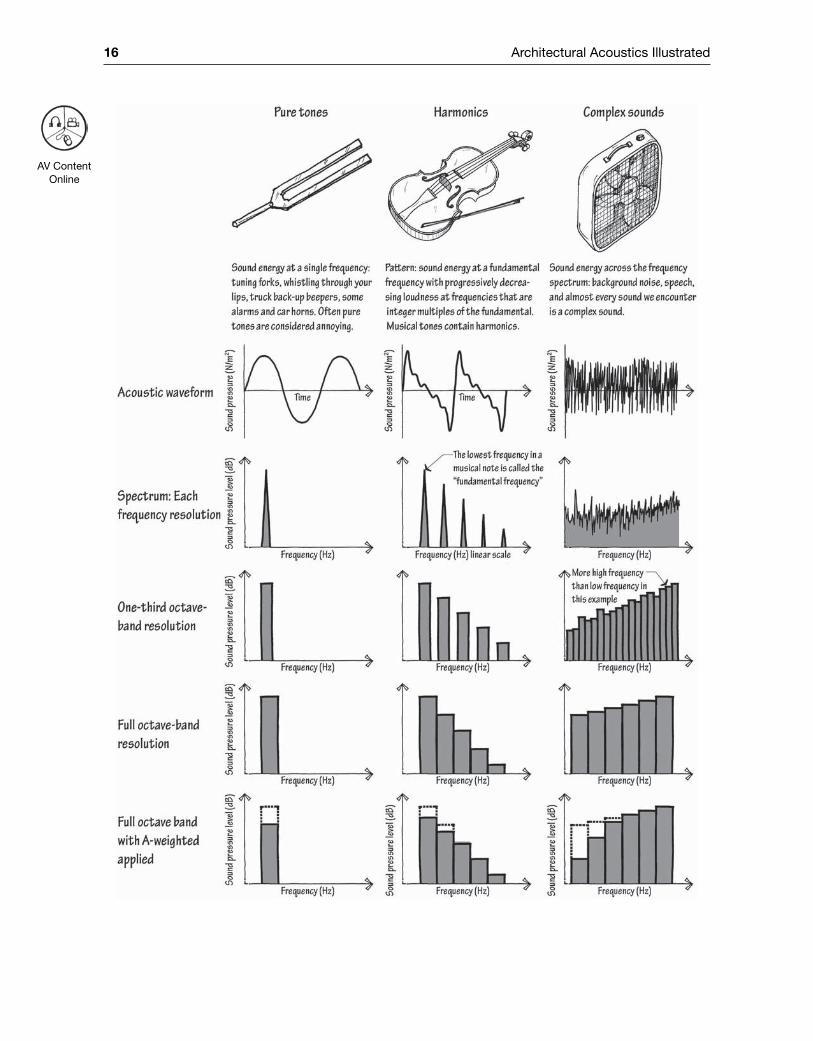
Human hearing spans an audible range from 20 Hz to 20,000 Hz. Sounds with fewer than 20 beats per second are heard as separate thumps, rather than as a tone; sounds more than 20,000 hertz are inaudible altogether, as in a dog‐whistle. If all the energy is focused at a single frequency, it is termed a “pure tone,” which can be annoying to listen to. Tuning forks, car horns, truck back‐up beepers, and whistles may be, or may approximate, pure tones. Notes produced by musi-cal instruments, by contrast, have energy in patterns of frequencies, which are called “harmonic sounds.” Most of the everyday sounds and noises we hear, including speech, traffic noise, and an audience clapping, are called “complex sounds,” with varying levels of sound across the audible frequency spectrum.

14 Architectural Acoustics Illustrated
Given that sound travels at a fixed rate of 1,128 feet per second (344 m/s) in air, it follows that higher‐frequency sound with more rapid progressions of molecule compressions and rarefac-tions also features shorter dimensions between compressions. This distance, the wavelength, is described by the formula:
λwavelengthspeed of sound
frequency
C
f=
So given that the speed of sound is 1,128 feet per second, and middle C on the piano is 256 Hz, we see that the wavelength associated with middle C is calculated as:
λwavelength = =1 1284 4
, /.
ft s256 Hz
ft
Higher‐frequency sounds have shorter wavelengths, and lower‐frequency sounds have longer ones. The distance between compressions and rarefactions in the waveform describing middle C is thus about equal to the height of an adolescent child; the 20‐Hz lowest audible bass tone is about the length of a small banquet room; and the 20,000‐Hz highest audible treble tone is about the width of a finger. Bats, using echolocation to find something as small as a mosquito, transmit frequencies as high as 100,000 Hz so that the sound’s wavelength will be small enough to “see” the insect. Bats chirp well above the human frequency perception threshold, in frequen-cies that high can’t be heard by human beings. (Or, putting it another way, human beings can’t hear wavelengths that small.) For the entire frequency range of human hearing, wavelengths are at the scale of architecture. This is important because when sound rays impinge on surfaces that are much longer than their wavelengths, they reflect in something approaching a ray; when they impinge upon surfaces that are much smaller than they are, they move right around them, like an ocean wave moving around a swimmer. As sound impacts a building surface that is of a similar dimension to the wavelength, the sound reflects and scatters.
Although healthy ears hear the full range, from 20 Hz to 20,000 Hz, the kind of cumulative hear-ing loss that most of us suffer shrinks that range over time. Depending on how loudly the music one listens to is played, and one’s exposure to continuous loud sounds (greater than 80 decibels), it is common for tones above 17,000 Hz to lose audibility for those in their 20s, and tones above 10,000 Hz to lose audibility when we are in our 50s.
Basic Theory 15
noTe
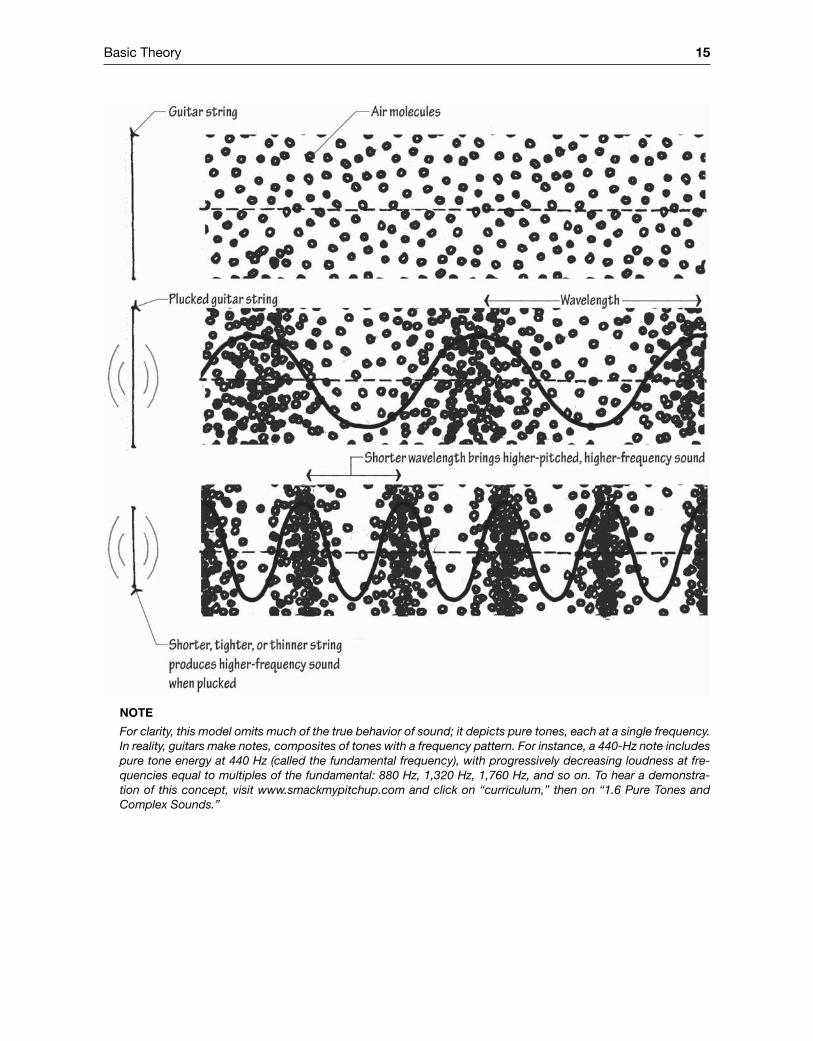
For clarity, this model omits much of the true behavior of sound; it depicts pure tones, each at a single frequency. In reality, guitars make notes, composites of tones with a frequency pattern. For instance, a 440‐Hz note includes pure tone energy at 440 Hz (called the fundamental frequency), with progressively decreasing loudness at fre-quencies equal to multiples of the fundamental: 880 Hz, 1,320 Hz, 1,760 Hz, and so on. To hear a demonstra-tion of this concept, visit www.smackmypitchup.com and click on “curriculum,” then on “1.6 Pure Tones and Complex Sounds.”
16 Architectural Acoustics Illustrated
AV Content Online
Basic Theory 17
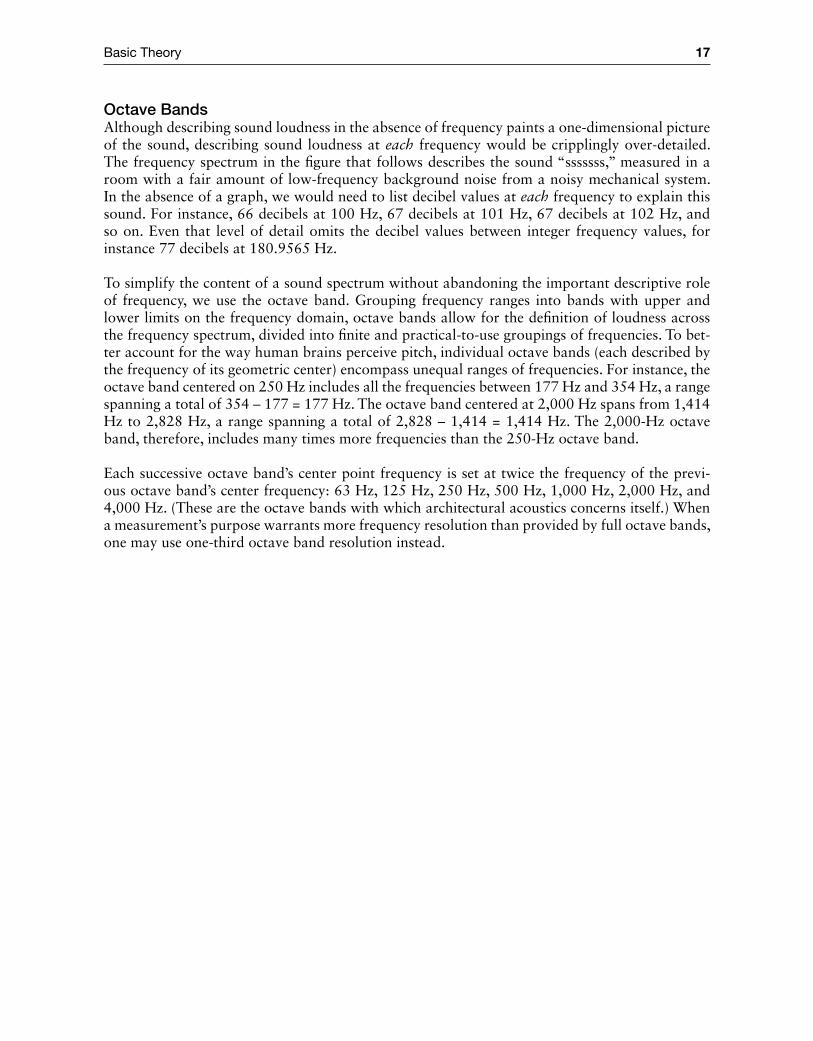
Octave BandsAlthough describing sound loudness in the absence of frequency paints a one‐dimensional picture of the sound, describing sound loudness at each frequency would be cripplingly over‐detailed. The frequency spectrum in the figure that follows describes the sound “sssssss,” measured in a room with a fair amount of low‐frequency background noise from a noisy mechanical system. In the absence of a graph, we would need to list decibel values at each frequency to explain this sound. For instance, 66 decibels at 100 Hz, 67 decibels at 101 Hz, 67 decibels at 102 Hz, and so on. Even that level of detail omits the decibel values between integer frequency values, for instance 77 decibels at 180.9565 Hz.
To simplify the content of a sound spectrum without abandoning the important descriptive role of frequency, we use the octave band. Grouping frequency ranges into bands with upper and lower limits on the frequency domain, octave bands allow for the definition of loudness across the frequency spectrum, divided into finite and practical‐to‐use groupings of frequencies. To bet-ter account for the way human brains perceive pitch, individual octave bands (each described by the frequency of its geometric center) encompass unequal ranges of frequencies. For instance, the octave band centered on 250 Hz includes all the frequencies between 177 Hz and 354 Hz, a range spanning a total of 354 – 177 = 177 Hz. The octave band centered at 2,000 Hz spans from 1,414 Hz to 2,828 Hz, a range spanning a total of 2,828 – 1,414 = 1,414 Hz. The 2,000‐Hz octave band, therefore, includes many times more frequencies than the 250‐Hz octave band.
Each successive octave band’s center point frequency is set at twice the frequency of the previ-ous octave band’s center frequency: 63 Hz, 125 Hz, 250 Hz, 500 Hz, 1,000 Hz, 2,000 Hz, and 4,000 Hz. (These are the octave bands with which architectural acoustics concerns itself.) When a measurement’s purpose warrants more frequency resolution than provided by full octave bands, one may use one‐third octave band resolution instead.
18 Architectural Acoustics Illustrated
Basic Theory 19
Sound Level Perception and Frequency
20 Architectural Acoustics Illustrated
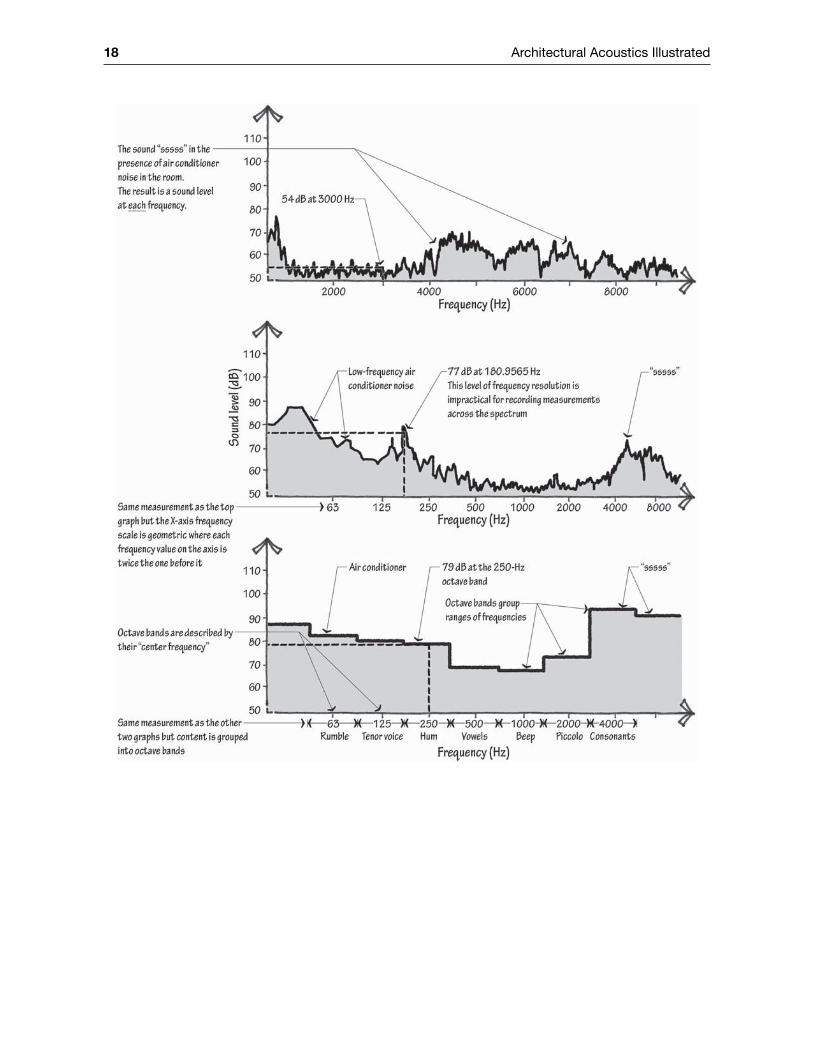
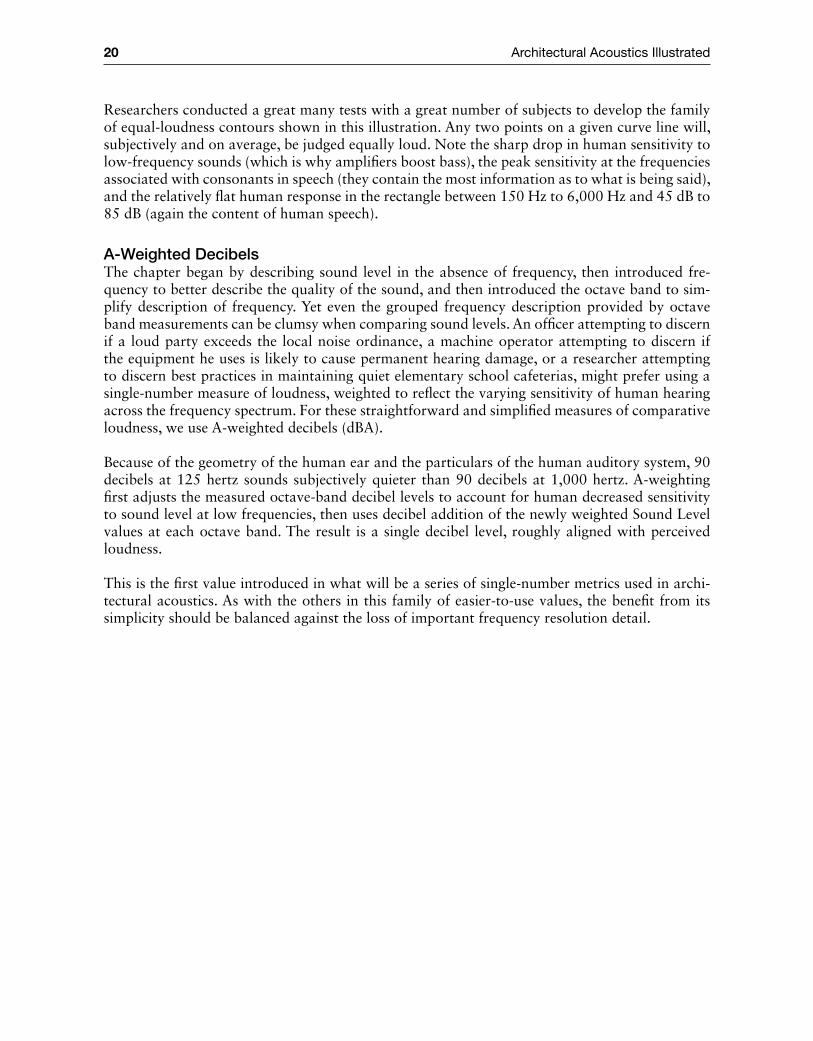
Researchers conducted a great many tests with a great number of subjects to develop the family of equal‐loudness contours shown in this illustration. Any two points on a given curve line will, subjectively and on average, be judged equally loud. Note the sharp drop in human sensitivity to low‐frequency sounds (which is why amplifiers boost bass), the peak sensitivity at the frequencies associated with consonants in speech (they contain the most information as to what is being said), and the relatively flat human response in the rectangle between 150 Hz to 6,000 Hz and 45 dB to 85 dB (again the content of human speech).
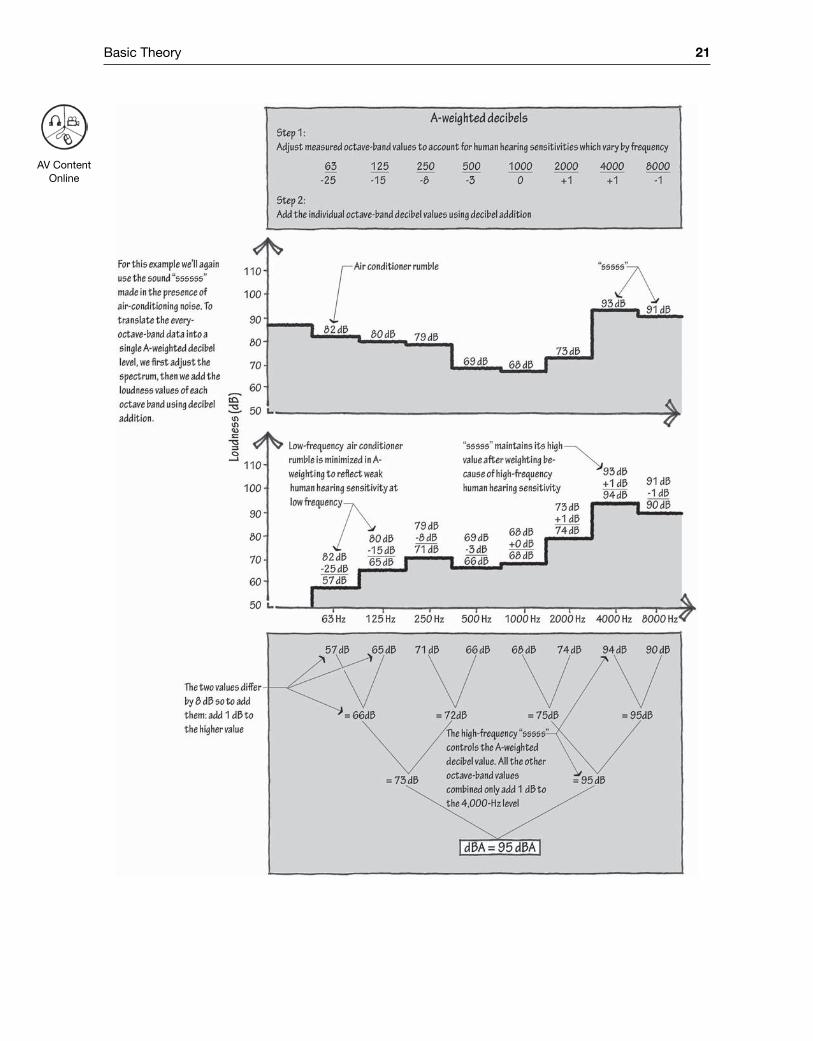
A‐Weighted DecibelsThe chapter began by describing sound level in the absence of frequency, then introduced fre-quency to better describe the quality of the sound, and then introduced the octave band to sim-plify description of frequency. Yet even the grouped frequency description provided by octave band measurements can be clumsy when comparing sound levels. An officer attempting to discern if a loud party exceeds the local noise ordinance, a machine operator attempting to discern if the equipment he uses is likely to cause permanent hearing damage, or a researcher attempting to discern best practices in maintaining quiet elementary school cafeterias, might prefer using a single‐number measure of loudness, weighted to reflect the varying sensitivity of human hearing across the frequency spectrum. For these straightforward and simplified measures of comparative loudness, we use A‐weighted decibels (dBA).
Because of the geometry of the human ear and the particulars of the human auditory system, 90 decibels at 125 hertz sounds subjectively quieter than 90 decibels at 1,000 hertz. A‐weighting first adjusts the measured octave‐band decibel levels to account for human decreased sensitivity to sound level at low frequencies, then uses decibel addition of the newly weighted Sound Level values at each octave band. The result is a single decibel level, roughly aligned with perceived loudness.
This is the first value introduced in what will be a series of single‐number metrics used in archi-tectural acoustics. As with the others in this family of easier‐to‐use values, the benefit from its simplicity should be balanced against the loss of important frequency resolution detail.
22 Architectural Acoustics Illustrated
The Special Case of Low‐Frequency SoundMiddle‐ and high‐frequency sound wavelengths occupy dimension on the order of the scale of the diameter of the human ear canal. It is these frequencies, then, that resonate in our auditory system, which is why we are more sensitive to frequencies at 500 Hz and above than to those at 250 Hz and below. Our ears’ sensitivities to these frequencies reflect an evolutionary prefer-ence for speech communication through higher‐frequency consonants. We now capitalize on that sensitivity when creating the sound spectrum for car horns, truck back‐up beepers, sirens, alarm clocks, and other machine‐generated noises intended to get our attention. Because of our sensitiv-ity to mid‐ and high‐frequency sounds, and because of mid‐ and high‐frequencies’ outsized role in promoting speech intelligibility, the field of architectural acoustics justifiably focuses its attention on this window of the sound spectrum.
Yet low‐frequency sounds should command our attention too, despite our diminished sensitiv-ity to them. That is because bass tones more easily move through barriers such as car windows, building skins, and room partitions. They are more omnidirectional, more readily bend around buildings, and diffract around outdoor roadway barriers; in the presence of dance music, they vibrate our chest cavities and shake our ceiling tiles. Researchers now believe that pure tones at about 22.5 Hz may trigger a fight‐or‐flight response in people. Low‐frequency sounds are what build up annoying resonances (also called standing waves) in small spaces such as music practice rooms, but they also give us a desired sense of “warmth” in a symphony hall.
Picture a swimmer in an ocean with a nearby sea wall. When the waves come, they smack the long sea wall and bounce back out to sea. But those same waves don’t ricochet off the relatively small swimmer—they diffract around him instead. In the same way, middle‐ and high‐frequency sounds, whose wavelengths are short compared to building surfaces, can be easily modeled in geo-metric acoustics, using rays and arrows. That model breaks down and loses its usefulness when the wavelengths are long relative to the room surfaces. Modal low‐frequency sounds behave more like waves and less like rays. They are more difficult to model in space, yet more sensitive to the geometric particulars of the source, surface, and receiver locations. At low frequencies, two adja-cent seats in a theater may experience remarkably different sound fields—or they may experience almost identical sound fields.
Electronically amplified “thumping” music has high bass content, but so might a television or a movie playing in the adjacent cinema. Truck engines, bus engines, train engines, and aircraft jet engines have low‐end content—as do car, motorcycle, personal watercraft, and snowmobile engines (and that is before some vehicle operators intentionally modify their exhaust systems to sound more throaty and muscular). Finally, fans, pumps, elevators, garbage disposals, generators, trash compactors, and garage door openers—many of the machines found in buildings—generate considerable low‐frequency noise.
ReferencesCavanaugh, W. et al. (ed.). 2010. Architectural Acoustics, 2nd ed. John Wiley & Sons. Hoboken, NJ,
pp. 1–23.Egan, M. D. 2007. Architectural Acoustics. J. Ross Publishing. Plantation, FL, pp. 1–36.Long, M. 2006. Architectural Acoustics. Elsevier. Burlington, MA, pp. 37–71.Mehta, M. et al. 1998. Architectural Acoustics. Merrill Prentice Hall. Upper Saddle River, NJ, pp. 1–20.Tattoni, G. www.smackmypitchup.com.
AV Content Online

Basic Theory 23
Sound Level Data
Source dBA Absorption Coefficient (Hz)
63 125 250 500 1000 2000 4000
Hz Hz Hz Hz Hz Hz Hz
OutsideHighway at 50 ft (15m) 78 78 78 75 73 75 69 62Highway at 200 ft (60m) 66 70 69 62 59 63 60 52Primary road at 50 ft (15m) 64 67 63 60 57 61 58 50Primary road at 200 ft (60m) 51 63 57 48 42 47 45 38Large cooling tower at 50 ft (15m) 63 69 62 56 54 55 57 58Small cooling tower at 50 ft (15m) 61 68 65 56 55 57 53 52Truck reverse beep 94 82 78 77 76 94 66 63Car starting 92 90 81 80 86 87 86 86Car alarm 90 55 51 70 79 78 82 87Basketball dribble 87 90 91 82 79 82 81 77Bus idling 81 83 83 80 73 78 73 67Loud car radio 74 73 77 73 73 69 66 52Car idling 69 81 81 67 62 61 57 53Ambient rain noise 63 72 63 58 56 56 56 57Ocean wave, water’s edge 54 62 60 54 51 49 45 42
InsideMovie theater 103 125 113 100 95 90 92 89Slammed door 90 98 87 86 86 86 83 75Vacuum 84 63 72 70 79 76 80 76Beneath wood stairs 83 84 91 83 78 74 75 73Alarm clock buzzer 81 43 39 63 81 74 74 66Elementary school cafeteria 81 62 61 68 75 79 75 68Hair dryer 81 80 76 71 75 77 74 75Toilet flushing 81 49 65 86 81 70 66 62Television 76 58 70 74 70 69 72 64Acoustic guitar 74 62 75 79 71 67 62 54Cell phone ring 74 48 55 54 52 70 67 69Faucet 73 46 50 50 56 57 68 69Restaurant with music 69 71 69 66 66 66 60 52Normal conversation 68 47 53 54 36 66 56 52Door closed normally 66 70 66 64 59 60 58 60Oven exhaust fan 64 43 43 55 63 61 51 46Boiling water 58 50 54 58 52 52 52 49Dehumidifier 57 53 55 56 56 52 49 44Small heat pump 54 60 59 55 49 47 47 41Microwave 52 38 47 55 51 46 39 30Noisy refrigerator 51 56 49 57 49 40 34 30Office with computers 48 55 52 51 45 42 37 30Noisy diffuser 47 54 50 47 43 42 40 35Water pipes from adjacent wall 42 51 50 44 39 33 32 29

Sound AbSorption
26 Architectural Acoustics Illustrated
Principles of Absorptive and Reflective Surfaces
AV Content Online
Sound Absorption 27
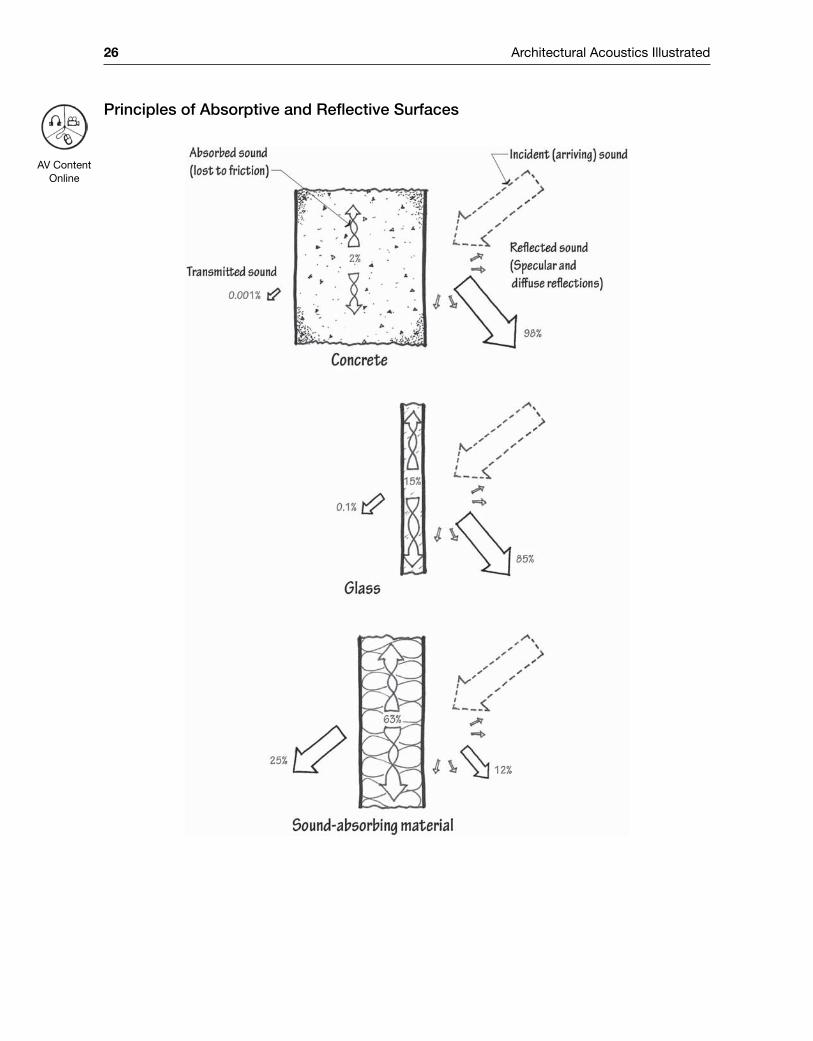
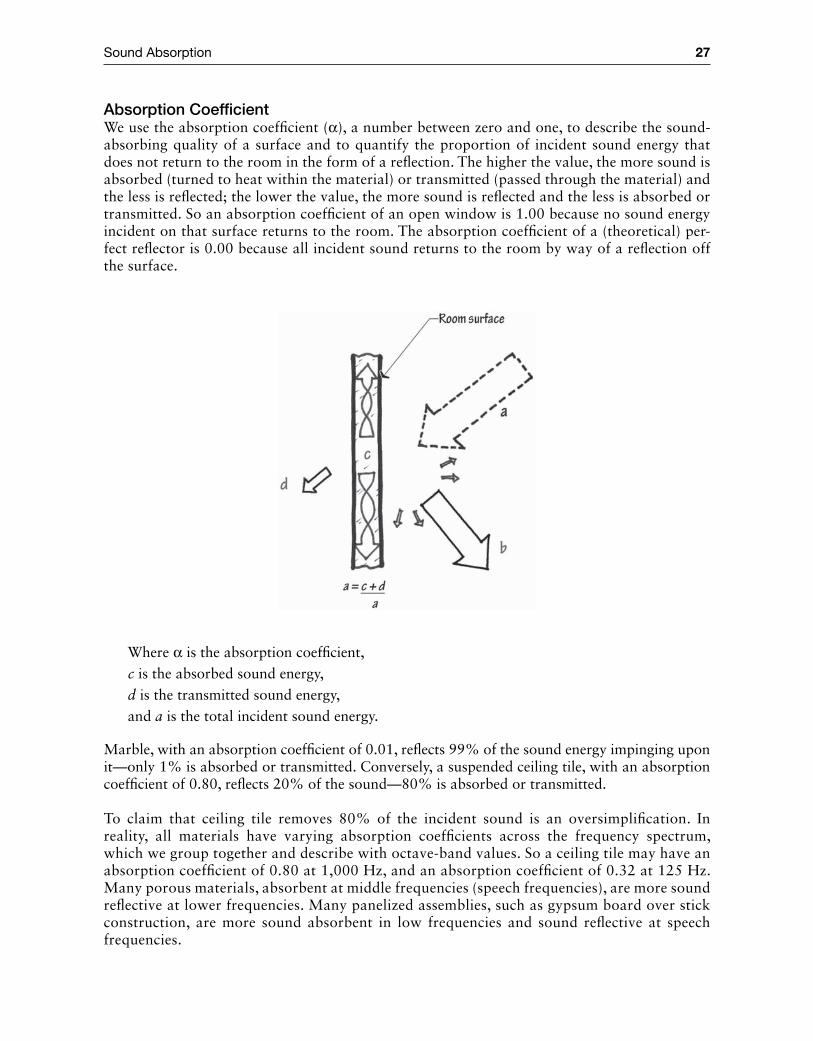
Absorption CoefficientWe use the absorption coefficient (α), a number between zero and one, to describe the sound‐absorbing quality of a surface and to quantify the proportion of incident sound energy that does not return to the room in the form of a reflection. The higher the value, the more sound is absorbed (turned to heat within the material) or transmitted (passed through the material) and the less is reflected; the lower the value, the more sound is reflected and the less is absorbed or transmitted. So an absorption coefficient of an open window is 1.00 because no sound energy incident on that surface returns to the room. The absorption coefficient of a (theoretical) per-fect reflector is 0.00 because all incident sound returns to the room by way of a reflection off the surface.
Where α is the absorption coefficient,c is the absorbed sound energy,d is the transmitted sound energy,and a is the total incident sound energy.
Marble, with an absorption coefficient of 0.01, reflects 99% of the sound energy impinging upon it—only 1% is absorbed or transmitted. Conversely, a suspended ceiling tile, with an absorption coefficient of 0.80, reflects 20% of the sound—80% is absorbed or transmitted.
To claim that ceiling tile removes 80% of the incident sound is an oversimplification. In reality, all materials have varying absorption coefficients across the frequency spectrum, which we group together and describe with octave‐band values. So a ceiling tile may have an absorption coefficient of 0.80 at 1,000 Hz, and an absorption coefficient of 0.32 at 125 Hz. Many porous materials, absorbent at middle frequencies (speech frequencies), are more sound reflective at lower frequencies. Many panelized assemblies, such as gypsum board over stick construction, are more sound absorbent in low frequencies and sound reflective at speech frequencies.

28 Architectural Acoustics Illustrated
Higher values of the absorption coefficient accompany materials that are (a) more porous, (b) less smooth, (c) of less weight, (d) thicker (provided the thicker material is porous), (e) mounted over an airspace, or (f) of less mass (where more of the energy passes through or is translated to mechanical energy, as in a panel absorber). Higher α values are characterized by a fiber orienta-tion that constructs multitudes of tiny interconnecting air pockets. Materials with lower absorp-tion coefficient values are smooth, dense, flush‐mounted, and massive. Materials with absorption coefficients greater than 0.50 are generally considered sound‐absorbent materials, and materials with absorption coefficients less than 0.20 are generally considered sound‐reflective materials. We typically don’t perceive an absorption coefficient change of less than 0.10, and we judge a change of greater than 0.40 to be considerable.
note
Though theoretically impossible, published absorption coefficients may exceed 1.00. This is because of a quirk in the way surface samples are tested in laboratories. In the tables that follow, published absorption coefficients that exceed 1.00 are rounded down to 1.00.
Sound Absorption 29
Types of Sound Absorbers
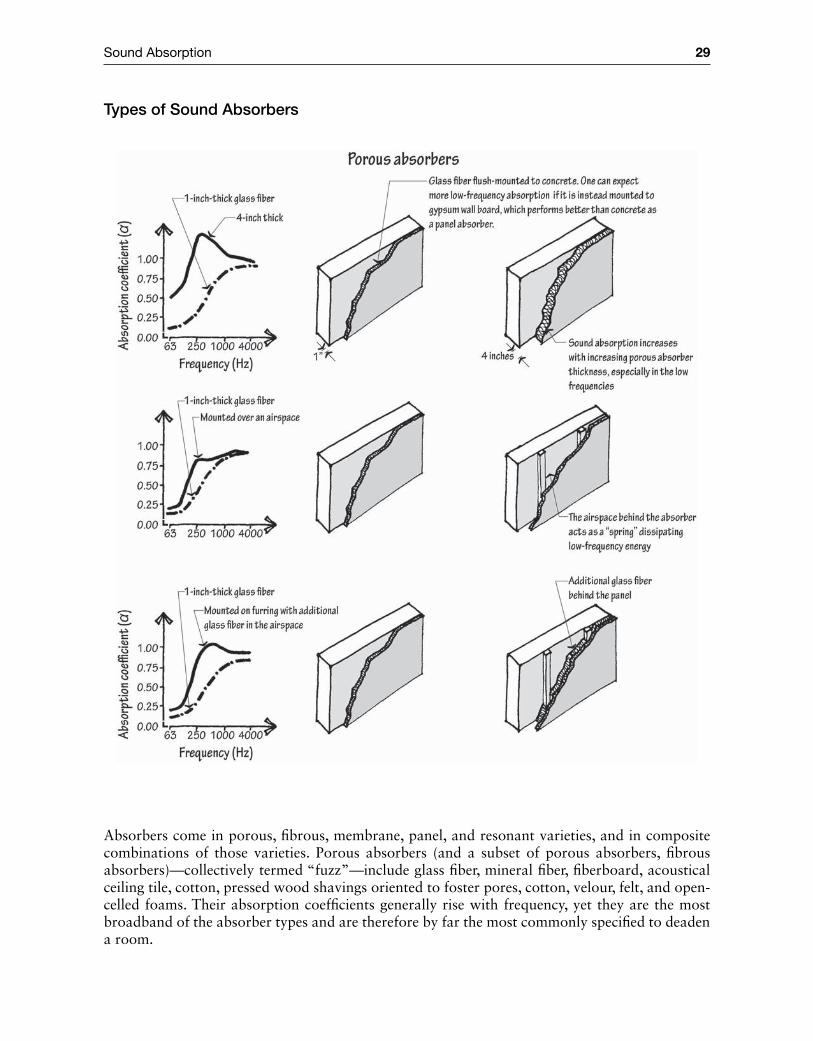
Absorbers come in porous, fibrous, membrane, panel, and resonant varieties, and in composite combinations of those varieties. Porous absorbers (and a subset of porous absorbers, fibrous absorbers)—collectively termed “fuzz”—include glass fiber, mineral fiber, fiberboard, acoustical ceiling tile, cotton, pressed wood shavings oriented to foster pores, cotton, velour, felt, and open‐celled foams. Their absorption coefficients generally rise with frequency, yet they are the most broadband of the absorber types and are therefore by far the most commonly specified to deaden a room.
30 Architectural Acoustics Illustrated
Sound Absorption 31
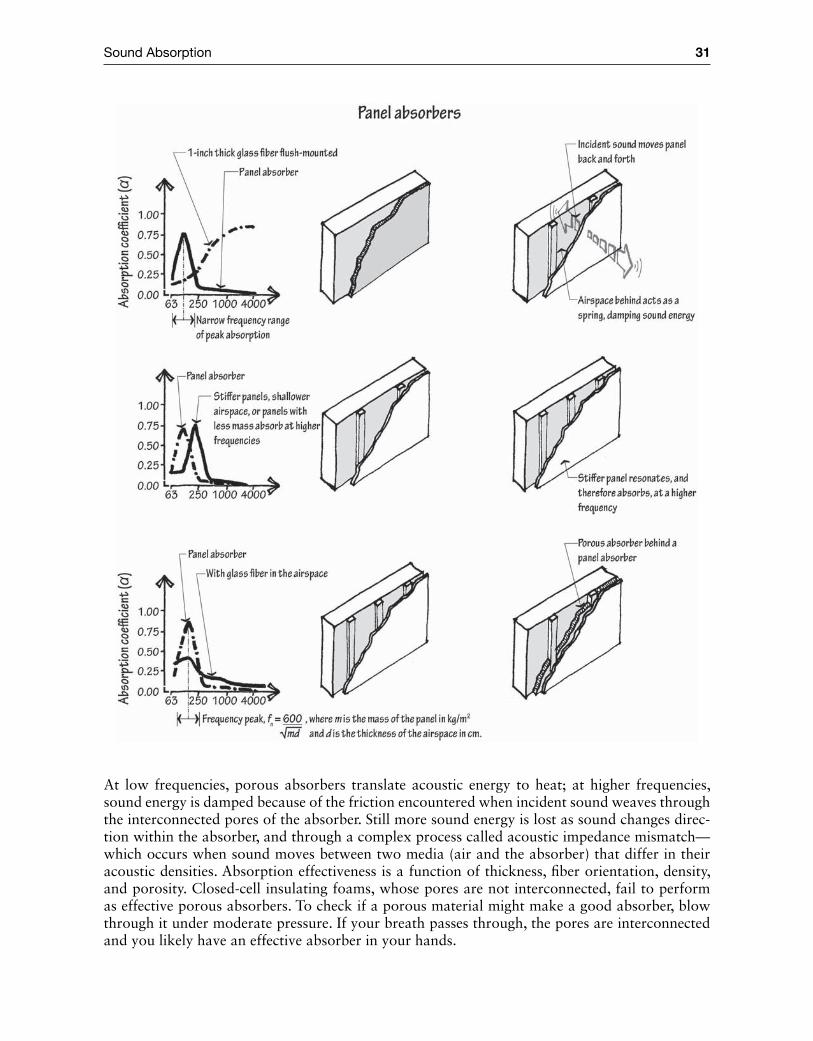
At low frequencies, porous absorbers translate acoustic energy to heat; at higher frequencies, sound energy is damped because of the friction encountered when incident sound weaves through the interconnected pores of the absorber. Still more sound energy is lost as sound changes direc-tion within the absorber, and through a complex process called acoustic impedance mismatch—which occurs when sound moves between two media (air and the absorber) that differ in their acoustic densities. Absorption effectiveness is a function of thickness, fiber orientation, density, and porosity. Closed‐cell insulating foams, whose pores are not interconnected, fail to perform as effective porous absorbers. To check if a porous material might make a good absorber, blow through it under moderate pressure. If your breath passes through, the pores are interconnected and you likely have an effective absorber in your hands.
32 Architectural Acoustics Illustrated
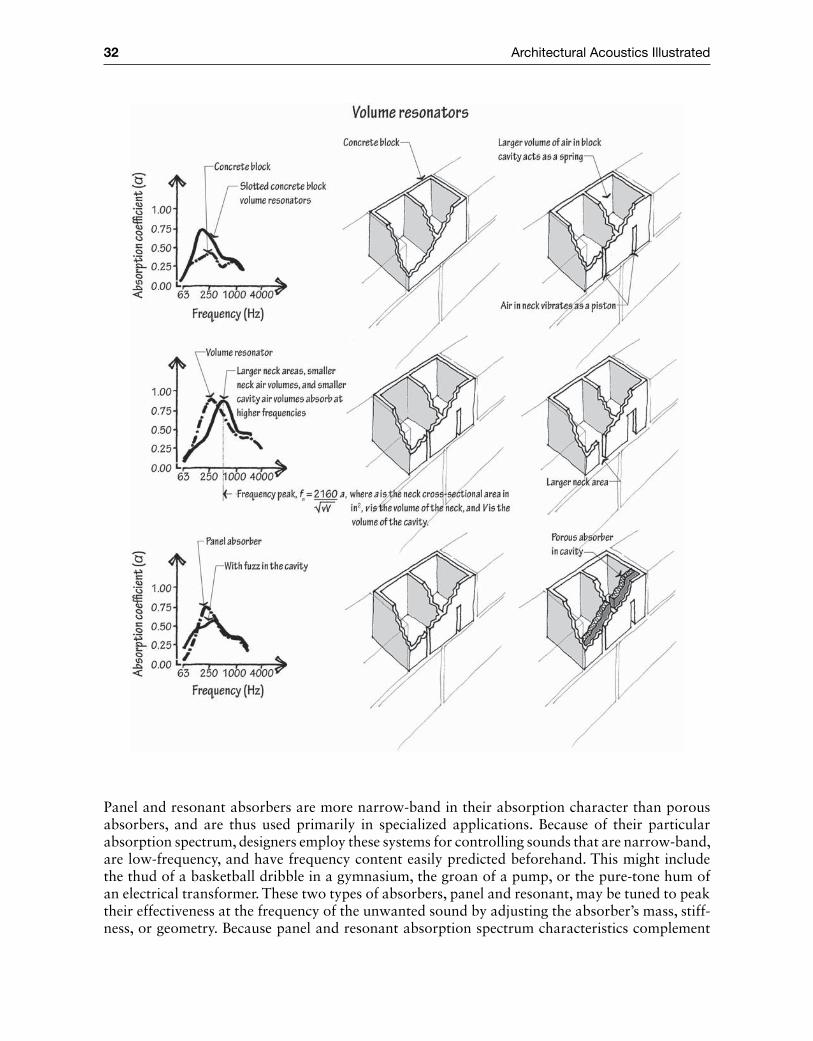
Panel and resonant absorbers are more narrow‐band in their absorption character than porous absorbers, and are thus used primarily in specialized applications. Because of their particular absorption spectrum, designers employ these systems for controlling sounds that are narrow‐band, are low‐frequency, and have frequency content easily predicted beforehand. This might include the thud of a basketball dribble in a gymnasium, the groan of a pump, or the pure‐tone hum of an electrical transformer. These two types of absorbers, panel and resonant, may be tuned to peak their effectiveness at the frequency of the unwanted sound by adjusting the absorber’s mass, stiff-ness, or geometry. Because panel and resonant absorption spectrum characteristics complement
Sound Absorption 33
those of porous absorbers, which are less effective at low frequencies, panel absorbers or resonant absorbers may be used in conjunction with porous absorbers in rooms like recording studios to flatten the absorption frequency spectrum. The two types of absorbers together are more broad-band than either one is alone.
Room ConstantThe total absorption in a room, the “room constant,” measured in a unit called sabins, is not only the result of the absorption coefficient of the surfaces, but also of the total surface area. More‐absorbent surfaces attenuate sound energy through loss to friction, but so do more surfaces of the same absorption profile. To calculate the total absorption in sabins,
A s s sroom constant = + + +α α α1 1 2 2 3 3 … and so on
Where A is the total absorption in the room, termed the “room constant” and measured in a unit called sabins,
α1 is the absorption coefficient of the first surface, α2 is the absorption coefficient of the second surface, α3 is the absorption coefficient of the third surface, and so on
s1 is the area of the first surface, s2 is the area of the second surface, s3 is the area of the third surface, and so on
So to calculate the total room absorption at 1,000 Hz of a small office with 100 square feet of wood floor (α1 = 0.06) and 500 square feet of gypsum board (α2 = 0.04), multiply each absorp-tion coefficient by its corresponding surface area, and sum them up.
Aroom constant = × + ×( ). ( . )0 06 100 0 04 500sf sf
The total sound absorption in the office measures 26 sabins. If we replace 100 square feet of gyp-sum board in the office with 100 square feet of a porous absorber (α3 = 0.90), the total absorption climbs more than fourfold to 112 sabins. If we then add more surfaces by breaking up the office with 100 additional square feet of partial‐height gypsum board partitions (α2 = 0.04), we’ve added an additional 4 sabins for a total of 116. For reference, a small sound‐reflective room may have a room constant on the order of 25 sabins, and a large, sound‐absorbent room may have a room constant on the order of 5,000 sabins.
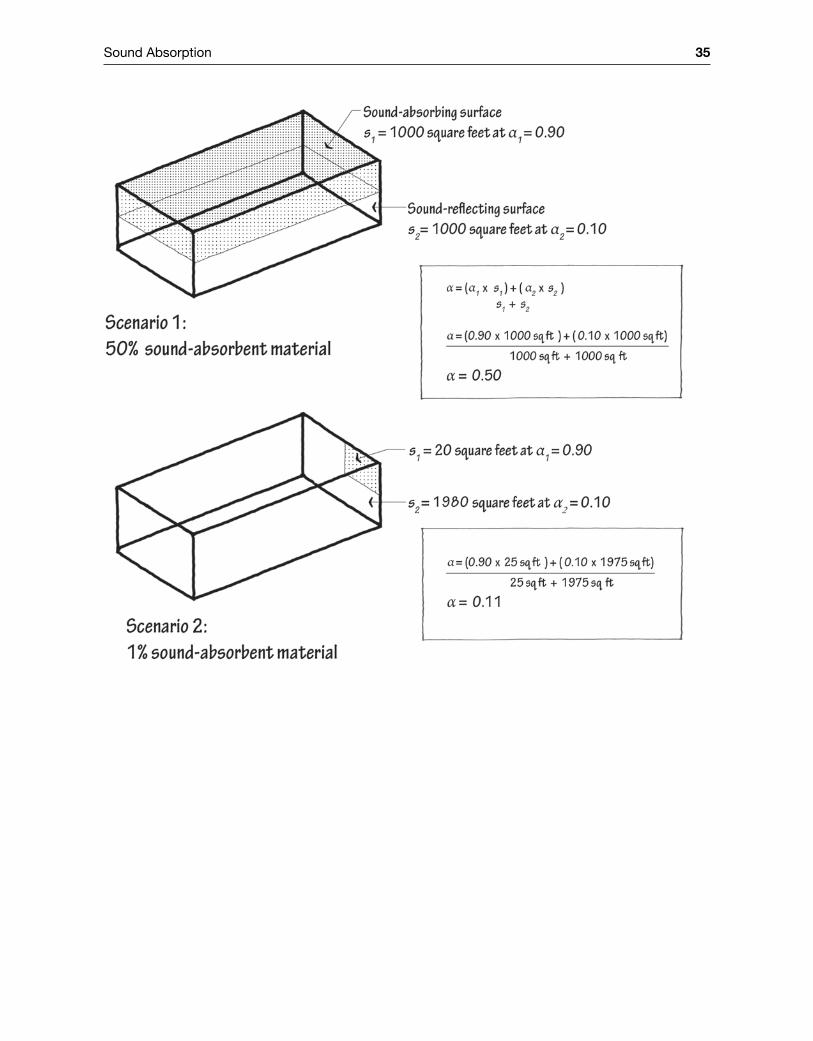
Room Average AbsorptionTo find an average absorption in a room ( α ), it is not enough to arithmetically average the absorption coefficients of all the materials. Suppose you occupied a large all‐marble room, with a 1,000‐Hz absorption coefficient of 0.01. Then you dropped a small fleck of (α = 0.80) shredded fiberboard acoustical ceiling tile to the floor. By doing so, you obviously didn’t move the average absorption coefficient of the room to the average of 0.01 and 0.80, or about 0.40. There is far more marble than fiberboard, so the average absorption coefficient for the whole room must be
34 Architectural Acoustics Illustrated
closer to that of the marble. We therefore area‐weight the average absorption to reflect the surface area of the marble relative to that of the fiberboard.
αα α α
avg absorptiontotal
s s sS
=+ + + …1 1 2 2 3 3 and so on
Where α is the area‐weighted average absorption coefficient, “alpha‐bar”α1 is the absorption coefficient of the first surface, α2 is the absorption coefficient of the sec-ond surface, α3 is the absorption coefficient of the third surface, and so ons1 is the area of the first surface, s2 is the area of the second surface, s3 is the area of the third surface, and so onstotal is the total area of all surfaces in the room.
So to calculate the average absorption at 1,000 Hz of that same small office with 100 square feet of wood floor (α1 = 0.06) and 500 square feet of gypsum board (α2 = 0.04), multiply each absorption coefficient by its corresponding surface area, sum them up, and divide the sum by the total surface area in the room.
αavg absorption = × + ×+
( . ) ( . )( )
0 06 100 0 04 500100
sf sfsf 500 sf
The area‐weighted average sound absorption coefficient in the office measures 0.043. Because there is more gypsum board (α2 = 0.04) than wood (α1 = 0.06), the area‐weighted average is closer to that of gypsum board than to that of wood. If we replace 100 square feet of gypsum board in the office with 100 square feet of a porous absorber (α3 = 0.90), the α climbs from 0.043 to 0.186, about four times the value. For reference, a sound‐absorbent room, such as a recording studio, may have an average absorption coefficient of 0.70, and a racquetball court may have an average absorption coefficient of 0.02.
As designers add absorption to a room, it approaches a free‐field condition (no surfaces to reflect off), reverberance is lowered, and sound energy is removed from the space. We use sound‐absorbing materials to quiet a noisy space (an indoor dog kennel), reduce reverberance for speech intelligibility (a classroom), or apply sound‐absorbing materials to a surface that might otherwise create an acoustic defect (an echo from a distant surface). We use sound‐reflecting surfaces when we want to increase the reverberance in a space (concert hall), or we specify sound‐reflecting surfaces to provide beneficial sound reflections that might bolster loudness (surfaces of a lecture room near the lecturer). Some styles of music (romantic clas-sical) require rooms with more sound reflections, and others (club music) require rooms with more sound absorption. This might necessitate a room with variable acoustics. Absorbent velour banners or curtains can retract or deploy to change the acoustic quality of the room, or panels may slide or rotate to hide a sound‐reflective surface and simultaneously expose a sound‐absorbing surface, or they may reveal a sound‐reflecting surface to cover a sound‐absorbing one.
Sound Absorption 35
36 Architectural Acoustics Illustrated
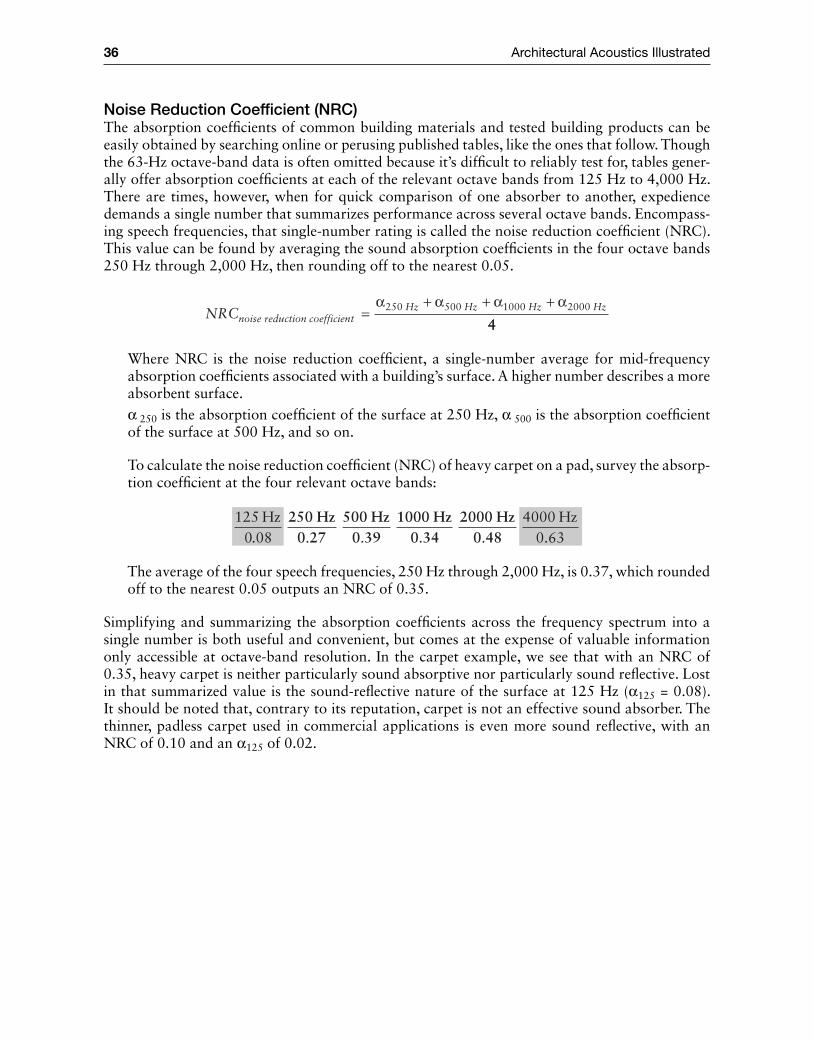
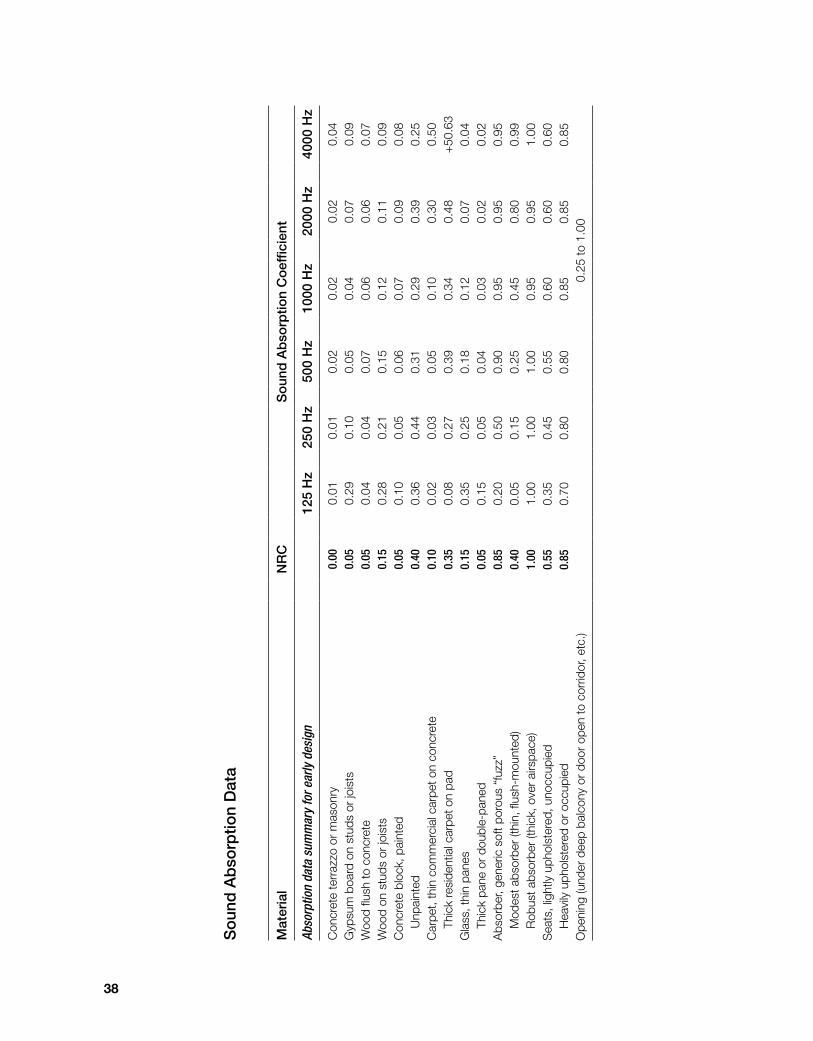
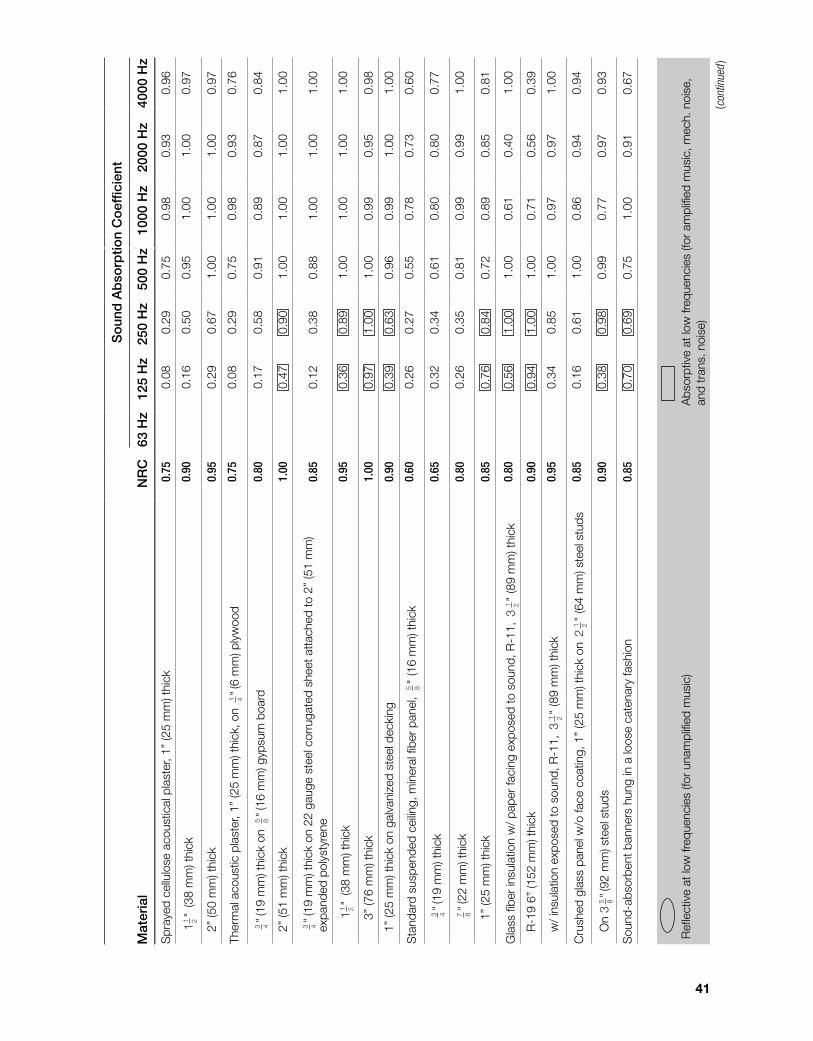
Noise Reduction Coefficient (NRC)The absorption coefficients of common building materials and tested building products can be easily obtained by searching online or perusing published tables, like the ones that follow. Though the 63‐Hz octave‐band data is often omitted because it’s difficult to reliably test for, tables gener-ally offer absorption coefficients at each of the relevant octave bands from 125 Hz to 4,000 Hz. There are times, however, when for quick comparison of one absorber to another, expedience demands a single number that summarizes performance across several octave bands. Encompass-ing speech frequencies, that single‐number rating is called the noise reduction coefficient (NRC). This value can be found by averaging the sound absorption coefficients in the four octave bands 250 Hz through 2,000 Hz, then rounding off to the nearest 0.05.
NRCnoise reduction coefficientHz Hz Hz Hz=
+ + +α α α α250 500 1000 2000
44
Where NRC is the noise reduction coefficient, a single‐number average for mid‐frequency absorption coefficients associated with a building’s surface. A higher number describes a more absorbent surface.α 250 is the absorption coefficient of the surface at 250 Hz, α 500 is the absorption coefficient of the surface at 500 Hz, and so on.
To calculate the noise reduction coefficient (NRC) of heavy carpet on a pad, survey the absorp-tion coefficient at the four relevant octave bands:
125 40000 63
Hz0 08
Hz. . . . . .
250 Hz0 27
500 Hz0 39
1000 Hz0 34
2000 Hz0 48
The average of the four speech frequencies, 250 Hz through 2,000 Hz, is 0.37, which rounded off to the nearest 0.05 outputs an NRC of 0.35.
Simplifying and summarizing the absorption coefficients across the frequency spectrum into a single number is both useful and convenient, but comes at the expense of valuable information only accessible at octave‐band resolution. In the carpet example, we see that with an NRC of 0.35, heavy carpet is neither particularly sound absorptive nor particularly sound reflective. Lost in that summarized value is the sound‐reflective nature of the surface at 125 Hz (α125 = 0.08). It should be noted that, contrary to its reputation, carpet is not an effective sound absorber. The thinner, padless carpet used in commercial applications is even more sound reflective, with an NRC of 0.10 and an α125 of 0.02.

Sound Absorption 37
38
So
und
Ab
sorp
tion
Dat
a
Mat
eria
lN
RC
So
und
Ab
sorp
tion
Co
effic
ient
Abso
rptio
n da
ta s
umm
ary
for e
arly
des
ign
125
Hz
250
Hz
500
Hz
1000
Hz
2000
Hz
4000
Hz
Con
cret
e te
rraz
zo o
r m
ason
ry0.00
0.01
0.01
0.02
0.02
0.02
0.04
Gyp
sum
boa
rd o
n st
uds
or jo
ists
0.05
0.29
0.10
0.05
0.04
0.07
0.09
Woo
d flu
sh to
con
cret
e0.05
0.04
0.04
0.07
0.06
0.06
0.07
Woo
d on
stu
ds o
r jo
ists
0.15
0.28
0.21
0.15
0.12
0.11
0.09
Con
cret
e bl
ock,
pai
nted
0.05
0.10
0.05
0.06
0.07
0.09
0.08
U
npai
nted
0.40
0.36
0.44
0.31
0.29
0.39
0.25
Car
pet,
thin
com
mer
cial
car
pet o
n co
ncre
te0.10
0.02
0.03
0.05
0.10
0.30
0.50
Th
ick
resi
dent
ial c
arpe
t on
pad
0.35
0.08
0.27
0.39
0.34
0.48
+50
.63
Gla
ss, t
hin
pane
s0.15
0.35
0.25
0.18
0.12
0.07
0.04
Th
ick
pane
or
doub
le‐p
aned
0.05
0.15
0.05
0.04
0.03
0.02
0.02
Abs
orbe
r, ge
neric
sof
t por
ous
“fuz
z”0.85
0.20
0.50
0.90
0.95
0.95
0.95
M
odes
t abs
orbe
r (th
in, fl
ush‐
mou
nted
)0.40
0.05
0.15
0.25
0.45
0.80
0.99
R
obus
t abs
orbe
r (th
ick,
ove
r ai
rspa
ce)
1.00
1.00
1.00
1.00
0.95
0.95
1.00
Sea
ts, l
ight
ly u
phol
ster
ed, u
nocc
upie
d0.55
0.35
0.45
0.55
0.60
0.60
0.60
H
eavi
ly u
phol
ster
ed o
r oc
cupi
ed0.85
0.70
0.80
0.80
0.85
0.85
0.85
Ope
ning
(und
er d
eep
balc
ony
or d
oor
open
to c
orrid
or, e
tc.)
0.25
to 1
.00
39
Mat
eria
lN
RC
So
und
Ab
sorp
tion
Co
effic
ient
63 H
z12
5 H
z25
0 H
z50
0 H
z10
00 H
z20
00 H
z40
00 H
z
Soun
d Re
flect
ors
M
arbl
e/gl
azed
tile
on
conc
rete
0.00
0.01
0.01
0.01
0.01
0.01
0.02
0.02
Te
rraz
zo0.00
0.01
0.01
0.01
0.02
0.01
0.02
0.02
P
oure
d co
ncre
te, s
moo
th0.00
0.01
0.00
0.01
0.02
0.02
0.02
0.05
Rou
gh0.05
0.02
0.01
0.02
0.04
0.06
0.08
0.10
B
rick,
ung
laze
d &
pai
nted
0.00
0.01
0.01
0.02
0.02
0.02
0.03
Ung
laze
d0.05
0.02
0.02
0.03
0.04
0.05
0.07
Li
nole
um/r
ubbe
r/vi
nyl/a
spha
lt on
con
cret
e0.05
0.02
0.03
0.03
0.03
0.03
0.02
Lino
leum
ove
r pl
ywoo
d on
2 ×
8 (3
8 m
m ×
184
mm
) joi
sts
0.10
0.09
0.08
0.08
0.08
0.09
0.07
G
ypsu
m b
oard
, 1 2"
(13
mm
) thi
ck, o
n 2
× 4s
(38
mm
× 8
9 m
m) 1
6” (4
06 m
m) o
.c.
0.05
0.29
0.10
0.05
0.04
0.07
0.09
On
woo
d jo
ists
0.05
0.29
0.10
0.05
0.04
0.07
0.09
On
conc
r ete
0.05
0.15
0.10
0.05
0.04
0.07
0.09
On
stee
l joi
sts
0.10
0.05
0.10
0.10
0.10
0.07
0.02
P
last
er o
n la
th, s
uspe
nded
on
stee
l joi
sts
w/
airs
pace
bet
wee
n st
ruct
ure
and
ceilin
g0.05
0.14
0.10
0.06
0.05
0.04
0.03
W
ood
parq
uet o
n co
ncre
te0.05
0.04
0.04
0.07
0.06
0.06
0.07
P
lyw
ood,
3 8"
(10
mm
) thi
ck, fl
ush
to c
eilin
g0.05
0.28
0.10
0.06
0.05
0.04
0.11
W
ood,
var
nish
ed o
ver
plyw
ood
on 2
× 8
(38
mm
× 1
84 m
m) j
oist
s0.10
0.15
0.12
0.10
0.07
0.06
0.07
W
ood
plat
form
, airs
pace
ove
r 2
× 4
(38
mm
× 8
9 m
m) s
leep
ers
on c
oncr
ete
0.20
0.40
0.30
0.20
0.17
0.15
0.10
C
MU
, pai
nted
or
glaz
ed0.05
0.10
0.05
0.06
0.07
0.09
0.08
Unp
aint
ed0.40
0.36
0.44
0.51
0.29
0.39
0.25
R
ubbe
r ca
rpet
on
conc
rete
0.10
0.04
0.04
0.08
0.12
0.10
0.10
C
arpe
t, 1 4"
(6 m
m) t
hick
, flus
h to
floo
r0.10
0.02
0.03
0.05
0.10
0.30
0.50
Indo
or/o
utdo
or c
arpe
t0.20
0.01
0.05
0.10
0.20
0.45
0.65
C
arpe
t, so
ft,
1 2"
(13
mm
) thi
ck o
n co
ncre
te0.20
0.09
0.08
0.21
0.26
0.27
0.37
Hea
vy c
arpe
t0.30
0.02
0.06
0.14
0.37
0.60
0.65
On
foam
rub
ber
back
ing
0.35
0.08
0.27
0.39
0.34
0.48
0.63
C
ork
tile,
3 4"
(19
mm
) thi
ck, o
n co
ncre
te0.15
0.08
0.02
0.08
0.19
0.21
0.22
Refl
ectiv
e at
low
freq
uenc
ies
(for
unam
plifi
ed m
usic
)A
bsor
ptiv
e at
low
freq
uenc
ies
(for
ampl
ified
mus
ic, m
ech.
noi
se,
and
tran
s. n
oise
)
(con
tinue
d)
40
Poro
us A
bsor
bers
Shr
edde
d fib
er b
oard
, flus
h m
ount
& 1
” (2
5 m
m) t
hick
0.40
0.06
0.13
0.24
0.45
0.82
0.64
P
aint
ed o
n3 4"(
19 m
m) f
urrin
g0.45
0.07
0.15
0.36
0.65
0.71
0.81
Fabr
ic c
over
ed0.60
0.13
0.19
0.45
0.86
0.80
0.84
w
/ fu
rrin
g &
1”
(25
mm
) gla
ss fi
ber
0.80
0.16
0.43
1.00
1.00
0.79
0.98
21 2"(
64 m
m) g
lass
fibe
r0.85
0.32
0.70
1.00
0.93
0.76
0.94
1
1 2"(
38 m
m) t
hick
0.55
0.07
0.22
0.48
0.82
0.64
0.96
Pai
nted
on
3 4"(
19 m
m) f
urrin
g0.60
0.15
0.26
0.62
0.83
0.70
0.91
2”
(51
mm
) thi
ck0.60
0.15
0.26
0.62
0.94
0.64
0.92
Pai
nted
on
3 4"(
19 m
m) f
urrin
g0.70
0.15
0.36
0.74
0.82
0.82
0.92
w/
furr
ing
& 2
1 2"(
64 m
m) g
lass
fibe
r0.95
0.42
0.89
1.00
0.85
1.00
0.94
2
1 2"
(64
mm
) thi
ck0.65
0.20
0.31
0.72
0.84
0.77
0.90
3”
(76
mm
) thi
ck0.80
0.21
0.41
1.00
0.75
1.00
0.97
Shr
edde
d fib
er b
oard
, in
drop
cei
ling
& p
aint
ed, 1
” (2
5 m
m) t
hick
0.45
0.40
0.33
0.35
0.48
0.60
0.93
w
/ la
rge
airs
pace
, 16”
(406
mm
)0.45
0.40
0.33
0.35
0.48
0.60
0.93
w/
1” (2
5 m
m) g
lass
fibe
r0.75
0.01
0.18
0.47
0.87
1.00
0.70
1.00
w/
35 8"(
92 m
m) g
lass
fibe
r0.85
0.85
0.81
0.84
0.82
0.83
1.00
w/
61 4"(
159
mm
) gla
ss fi
ber
0.95
1.00
1.00
1.00
0.94
0.93
1.00
2”
(51
mm
) thi
ck0.60
0.43
0.50
0.42
0.62
0.86
1.00
3”
(76
mm
) thi
ck0.70
0.70
0.50
0.52
0.76
0.92
1.00
Aco
ustic
pla
ster
, 1”
(25
mm
) thi
ck, s
moo
th fi
nish
on
gyps
um b
oard
0.50
0.01
0.07
0.39
0.69
0.83
0.87
S
emi‐s
moo
th fi
nish
0.65
0.03
0.19
0.55
0.97
0.93
0.99
Te
xtur
ed fi
nish
0.65
0.04
0.17
0.55
0.96
0.96
0.88
1”
thic
k, s
emi‐s
moo
th fi
nish
on
met
al la
the,
att
ache
d to
1 ×
2 (1
9 m
m ×
38
mm
) w
ood
fram
ing
16”
(406
mm
) o.c
. hun
g fro
m c
eilin
g st
ruct
ure
w/
airs
pace
0.55
0.08
0.38
0.60
0.64
0.54
0.51
1 2"(
13 m
m) t
hick
, sm
ooth
fini
sh o
n 1”
(25
mm
) fur
ring
strip
s0.55
0.08
0.38
0.60
0.64
0.54
0.51
w/
1” (2
5 m
m) g
lass
fibe
r in
sula
tion
0.65
0.21
0.62
0.73
0.68
0.53
0.49
Aco
ustic
pla
ster
5 8"(
16 m
m) t
hick
on
35 8"(
92 m
m) s
teel
stu
ds0.75
0.27
0.77
0.94
0.71
0.59
0.75
1 2"(
13 m
m) t
hick
w/
2” (5
0 m
m) g
lass
fibe
r in
sula
tion
0.65
0.71
0.81
0.68
0.52
0.49
0.54
5 8"(
16 m
m) t
hick
w/
2” (5
0 m
m) g
lass
fibe
r in
sula
tion
0.85
0.41
1.00
1.00
0.71
0.70
0.78
Mat
eria
lN
RC
So
und
Ab
sorp
tion
Co
effic
ient
63 H
z12
5 H
z25
0 H
z50
0 H
z10
00 H
z20
00 H
z40
00 H
z
Refl
ectiv
e at
low
freq
uenc
ies
(for
unam
plifi
ed m
usic
)A
bsor
ptiv
e at
low
freq
uenc
ies
(for
ampl
ified
mus
ic, m
ech.
noi
se,
and
tran
s. n
oise
)
41
(con
tinue
d )
Refl
ectiv
e at
low
freq
uenc
ies
(for
unam
plifi
ed m
usic
)A
bsor
ptiv
e at
low
freq
uenc
ies
(for
ampl
ified
mus
ic, m
ech.
noi
se,
and
tran
s. n
oise
)
Spr
ayed
cel
lulo
se a
cous
tical
pla
ster
, 1”
(25
mm
) thi
ck0.75
0.08
0.29
0.75
0.98
0.93
0.96
1
1 2"
(38
mm
) thi
ck0.90
0.16
0.50
0.95
1.00
1.00
0.97
2”
(50
mm
) thi
ck0.95
0.29
0.67
1.00
1.00
1.00
0.97
Ther
mal
aco
ustic
pla
ster
, 1”
(25
mm
) thi
ck, o
n 1 4"(
6 m
m) p
lyw
ood
0.75
0.08
0.29
0.75
0.98
0.93
0.76
3 4"(
19 m
m) t
hick
on
5 8"(
16 m
m) g
ypsu
m b
oard
0.80
0.17
0.58
0.91
0.89
0.87
0.84
2”
(51
mm
) thi
ck1.00
0.47
0.90
1.00
1.00
1.00
1.00
3 4
"(19
mm
) thi
ck o
n 22
gau
ge s
teel
cor
ruga
ted
shee
t att
ache
d to
2”
(51
mm
) ex
pand
ed p
olys
tyre
ne0.85
0.12
0.38
0.88
1.00
1.00
1.00
11 2"
(38
mm
) thi
ck0.95
0.36
0.89
1.00
1.00
1.00
1.00
3” (7
6 m
m) t
hick
1.00
0.97
1.00
1.00
0.99
0.95
0.98
1”
(25
mm
) thi
ck o
n ga
lvan
ized
ste
el d
ecki
ng0.90
0.39
0.63
0.96
0.99
1.00
1.00
Sta
ndar
d su
spen
ded
ceilin
g, m
iner
al fi
ber
pane
l, 5 8"
(16
mm
) thi
ck0.60
0.26
0.27
0.55
0.78
0.73
0.60
3 4"(
19 m
m) t
hick
0.65
0.32
0.34
0.61
0.80
0.80
0.77
7 8"(
22 m
m) t
hick
0.80
0.26
0.35
0.81
0.99
0.99
1.00
1” (2
5 m
m) t
hick
0.85
0.76
0.84
0.72
0.89
0.85
0.81
Gla
ss fi
ber
insu
latio
n w
/ pa
per
faci
ng e
xpos
ed to
sou
nd, R
‐11,
31 2"
(89
mm
) thi
ck0.80
0.56
1.00
1.00
0.61
0.40
1.00
R
‐19
6” (1
52 m
m) t
hick
0.90
0.94
1.00
1.00
0.71
0.56
0.39
w
/ in
sula
tion
expo
sed
to s
ound
, R‐1
1, 3
1 2"
(89
mm
) thi
ck0.95
0.34
0.85
1.00
0.97
0.97
1.00
Cru
shed
gla
ss p
anel
w/o
face
coa
ting,
1”
(25
mm
) thi
ck o
n 2
1 2"
(64
mm
) ste
el s
tuds
0.85
0.16
0.61
1.00
0.86
0.94
0.94
O
n 3
5 8"(
92 m
m) s
teel
stu
ds0.90
0.38
0.98
0.99
0.77
0.97
0.93
Sou
nd‐a
bsor
bent
ban
ners
hun
g in
a lo
ose
cate
nary
fash
ion
0.85
0.70
0.69
0.75
1.00
0.91
0.67
Mat
eria
lN
RC
So
und
Ab
sorp
tion
Co
effic
ient
63 H
z12
5 H
z25
0 H
z50
0 H
z10
00 H
z20
00 H
z40
00 H
z
42
Gla
ss fi
ber
tile,
3 4"(
19 m
m) t
hick
0.85
0.74
0.89
0.67
0.89
0.95
1.00
1”
(25
mm
) thi
ck0.90
0.77
0.74
0.75
0.95
1.00
1.00
1
1 2"(
38 m
m) t
hick
1.00
0.78
0.93
0.88
1.00
1.00
1.00
Fi
lm‐f
aced
,5 8"(
16 m
m) t
hick
0.60
0.42
0.33
0.30
0.84
0.78
0.65
w/
mic
rope
rfora
ted
film
0.70
0.81
0.70
0.57
0.82
0.80
0.68
1” (2
5 m
m) t
hick
0.70
0.56
0.63
0.69
0.83
0.71
0.55
2” (5
1 m
m) t
hick
0.80
0.52
0.82
0.88
.91
0.75
0.55
3” (7
6 m
m) t
hick
0.90
0.64
0.88
1.00
0.91
0.84
0.62
P
aint
ed,
3 4"(
19 m
m) t
hick
, w/
wov
en g
lass
fibe
r fa
bric
fini
sh0.90
0.78
0.93
0.70
0.91
0.98
1.00
P
aint
ed,
7 8"(
22 m
m) t
hick
0.90
0.89
0.95
0.77
0.96
1.00
0.97
1” (2
5 m
m) t
hick
0.95
0.64
0.97
0.82
1.00
1.00
1.00
11 2"(
38 m
m) t
hick
0.95
0.38
0.82
0.97
1.00
1.00
1.00
Fabr
ic C
urta
ins
Velo
ur
Li
ghtw
eigh
t 10
oz/y
d2 (0
.33
kg/m
2 ), h
ung
stra
ight
in c
onta
ct w
ith w
all
0.15
0.03
0.04
0.11
0.17
0.24
0.35
M
ediu
m‐w
eigh
t 14
oz/y
d2 (0
.50
kg/m
2 ), f
olde
d to
1 2ar
ea0.55
0.07
0.31
0.49
0.75
0.70
0.60
H
eavy
wei
ght 1
8 oz
/yd2
(0.6
1 kg
/m2 )
, fol
ded
to1 2
area
0.60
0.14
0.35
0.55
0.72
0.70
0.65
Cot
ton
clot
h, 1
0 oz
/yd2
(0.3
3 kg
/m2 )
, fol
ded
to7 8
area
0.25
0.03
0.12
0.15
0.27
0.37
0.42
3 4
fold
0.40
0.04
0.23
0.14
0.57
0.53
0.40
1 2
fold
0.60
0.07
0.31
0.49
0.81
0.66
0.54
Ligh
twei
ght c
urta
in, 6
oz/
yd2
(0.2
0 kg
/m2 )
, hun
g3
1 2"(
90 m
m) f
rom
wal
l0.45
0.05
0.05
0.06
0.39
0.63
0.70
0.73
Fibe
rgla
ss c
urta
in 8
.5 o
z/yd
2 (0
.30
kg/m
2 ), f
olde
d to
1 2ar
ea0.55
0.09
0.32
0.68
0.83
0.39
0.76
Mat
eria
lN
RC
So
und
Ab
sorp
tion
Co
effic
ient
63 H
z12
5 H
z25
0 H
z50
0 H
z10
00 H
z20
00 H
z40
00 H
z
Refl
ectiv
e at
low
freq
uenc
ies
(for
unam
plifi
ed m
usic
)A
bsor
ptiv
e at
low
freq
uenc
ies
(for
ampl
ified
mus
ic, m
ech.
noi
se,
and
tran
s. n
oise
)
43
Glas
sD
oubl
e‐pa
ne w
indo
w:
1 8"(
3 m
m) t
hick
gla
ss w
/11 4"(
32 m
m) a
irspa
ce0.05
0.15
0.05
0.03
0.03
0.03
0.03
w
/ 3 8"(
10 m
m) a
irspa
ce0.05
0.02
0.06
0.03
0.03
0.02
0.02
Sin
gle
pane
: hea
vy a
nd la
rge
0.05
0.18
0.06
0.04
0.03
0.02
0.02
1 8"(
3 m
m) t
hick
0.15
0.35
0.25
0.18
0.12
0.07
0.04
Seat
ing
Not
e –
Abs
orpt
ion
valu
es a
re p
er s
q fo
ot, n
ot p
er p
erso
nFu
lly o
ccup
ied
audi
ence
are
a of
0.0
7 pe
rson
s/ft2
(0.7
2 pe
rson
s/m
2 )0.50
0.10
0.21
0.41
0.65
0.75
0.71
0.
10 p
erso
ns/f
t2 (1
.04
pers
ons/
m2 )
0.65
0.16
0.29
0.55
0.80
0.92
0.90
0.
14 p
erso
ns/f
t2 (1
.52
pers
ons/
m2 )
0.75
0.22
0.38
0.71
0.95
0.99
0.99
0.
19 p
erso
ns/f
t2 (2
.00
pers
ons/
m2 )
0.80
0.26
0.46
0.87
0.99
0.99
0.99
Uno
ccup
ied
seat
s, li
ghtly
uph
olst
ered
(per
ft2 )
0.60
0.36
0.47
0.57
0.62
0.62
0.60
M
ediu
m‐u
phol
ster
ed (p
er ft
2 )0.70
0.54
0.62
0.68
0.70
0.68
0.66
Hea
vy‐u
phol
ster
ed (p
er ft
2 )0.80
0.70
0.76
0.81
0.84
0.84
0.81
Fully
occ
upie
d se
ats,
ligh
tly u
phol
ster
ed (p
er ft
2 )0.75
0.51
0.64
0.75
0.80
0.82
0.83
W
oode
n pe
ws
(per
ft2 )
0.80
0.57
0.61
0.75
0.86
0.91
0.86
M
ediu
m‐u
phol
ster
ed (p
er s
f2 )0.80
0.62
0.72
0.80
0.83
0.84
0.85
H
eavy
‐uph
olst
ered
(per
ft2 )
0.85
0.72
0.80
0.86
0.89
0.90
0.90
Aud
ienc
e st
andi
ng, 0
.26
pers
ons/
ft2 (2
.7 p
erso
ns/m
2 )0.85
0.29
0.23
0.44
0.95
1.00
1.00
1.00
Mem
bran
es &
Lin
ers
Hea
vy s
truc
tura
l mem
bran
e0.10
0.21
0.16
0.15
0.08
0.06
0.04
w
/ in
terio
r m
embr
ane
liner
0.65
0.53
0.45
0.69
0.75
0.69
0.58
w/
2” (5
1 m
m) t
hick
insu
latio
n0.80
0.68
0.74
0.90
0.86
0.74
0.61
Line
r on
ly0.80
0.54
0.70
0.82
0.85
0.75
0.61
Outd
oor S
urfa
ces
W
ater
sur
face
, stil
l (sw
imm
ing
pool
)0.02
0.01
0.01
0.01
0.02
0.02
0.03
Tr
ees,
8’ (
2.4
m) h
igh
firs,
20
ft2 /tr
ee (1
.9m
2 /tr
ee) g
roun
d ar
ea0.15
0.03
0.06
0.11
0.17
0.27
0.31
S
and,
4”
(102
mm
) thi
ck0.45
0.15
0.35
0.40
0.50
0.55
0.80
G
rass
, 2”
(51
mm
) hig
h0.60
0.11
0.26
0.60
0.69
0.92
0.99
G
rave
l, lo
ose
& m
oist
, 4”
(102
mm
) thi
ck0.70
0.25
0.60
0.65
0.70
0.75
0.80
S
now
, 4”
(102
mm
) thi
ck0.90
0.45
0.75
0.90
0.95
0.95
0.95
A
ir, s
abin
s pe
r 10
00 c
u ft,
50%
RH
0.90
0.9
2.3
7.2
Refl
ectiv
e at
low
freq
uenc
ies
(for
unam
plifi
ed m
usic
)A
bsor
ptiv
e at
low
freq
uenc
ies
(for
ampl
ified
mus
ic, m
ech.
noi
se,
and
tran
s. n
oise
)
Mat
eria
lN
RC
So
und
Ab
sorp
tion
Co
effic
ient
63 H
z12
5 H
z25
0 H
z50
0 H
z10
00 H
z20
00 H
z40
00 H
z

44 Architectural Acoustics Illustrated
ReferencesAcoustical and Insulating Materials Association (AIMA). Bulletin published annually from 1941 to 1974.
“Performance Data, Architectural Acoustical Materials.”Adelman‐Larsen, N. et al. “Suitable Reverberation Times for Halls for Rock and Pop Music.” Journal of the
Acoustical Society of America, January 2010.Beranek, L. “Audience and Chair Absorption in Large Halls.” Journal of the Acoustical Society of America,
January 1969.Burd, A. et al. “Data for the Acoustic Design of Studios.” British Broadcasting Corporation, BBC Engineer-
ing Monograph no. 64, November 1966.Carpet and Rug Institute, The. 1970. “Sound Conditioning with Carpet. A study of acoustical properties of
carpet including: sound absorption, impact noise reduction, surface noise reduction”Crocker, M. 1998. Handbook of Acoustics. John Wiley & Sons. Hoboken, NJ.Egan, M. D. 2007. Architectural Acoustics. J. Ross Publishing. Plantation, FL, pp. 46–49, 52–53.Evans E. and E. Bazley 1964. “Sound Absorbing Materials.” H. M. Stationery Office, London.Hedeen, R. 1980. Compendium of Materials for Noise Control. National Institute for Occupational Safety
and Health (NIOSH), Publication no. 80‐116. Cincinnati, Ohio, May 1980.Karlen, L. 1983. Acoustics in Rooms and Buildings. Svensk Byggtjänst. Stockholm.Kingsbury, H. and W. Wallace. “Acoustic Absorption Characteristics of People.” Sound and Vibration,
December 1968.Long, M. 2006. Architectural Acoustics. Elsevier. Burlington, MA, pp. 235–284.Mariner, T. “Control of Noise by Sound Absorbent Materials.” Noise Control, July 1957.Moore, J. and R. West. “In Search of an Instant Audience.” Journal of the Acoustical Society of America,
December 1970.Moulder, R. and J. Merrill, “Acoustical Properties of Glass Fiber Roof Fabrics.” Sound and Vibration,
October 1983.Newell, P. 2011. Recording Studio Design. Focal Press. Oxford, pp. 98–110.Purcell, W. “Materials for Noise and Vibration Control.” Sound and Vibration, July 1982.Siekman, W. “Outdoor Acoustical Treatment: Grass and Trees.” Journal of the Acoustical Society of
America, October 1969.
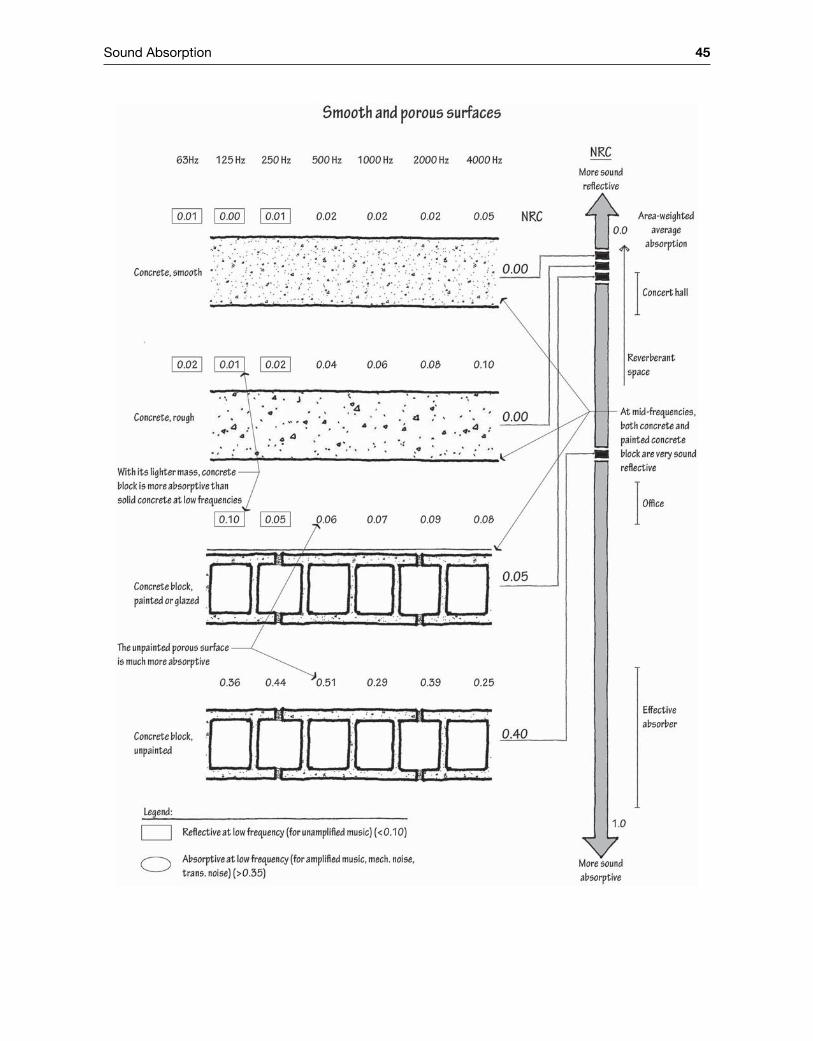
Sound Absorption 45
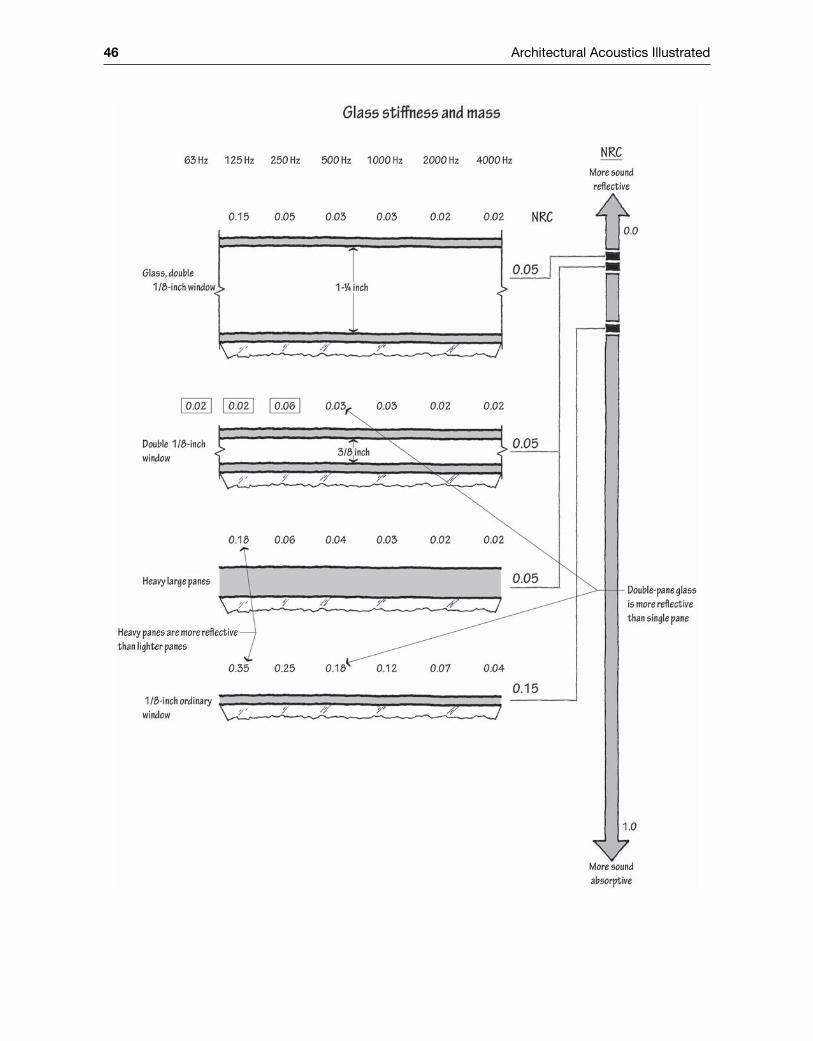
46 Architectural Acoustics Illustrated
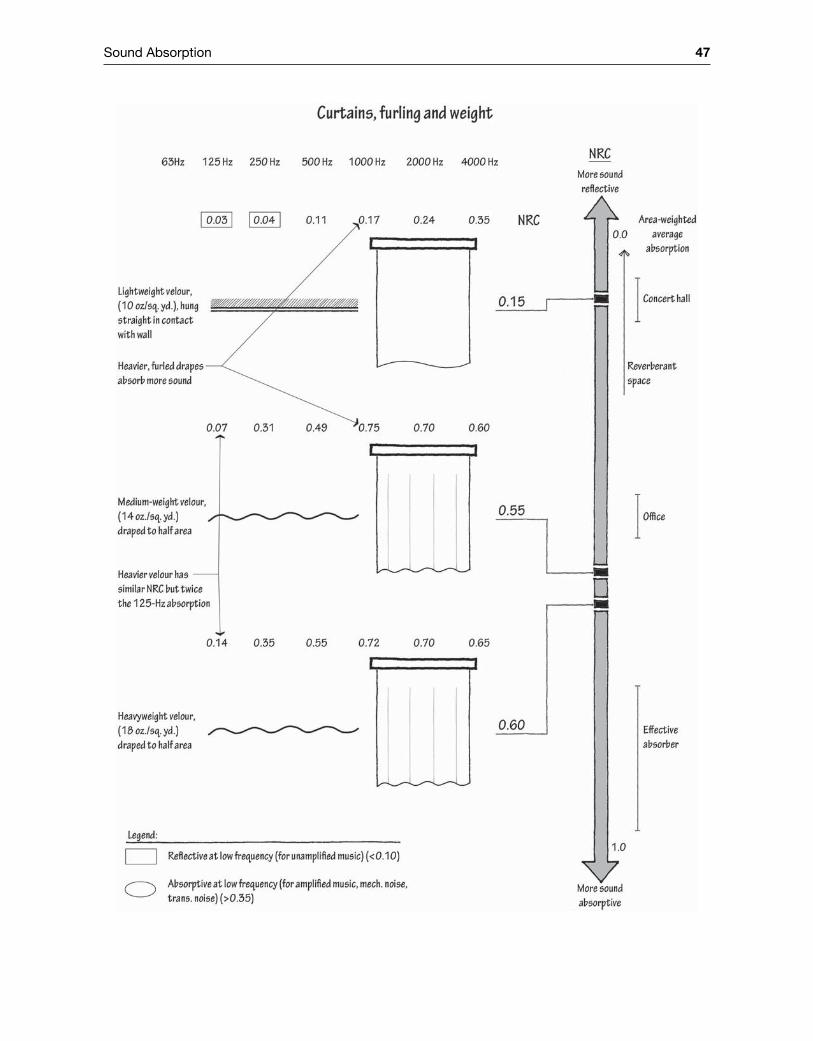
Sound Absorption 47
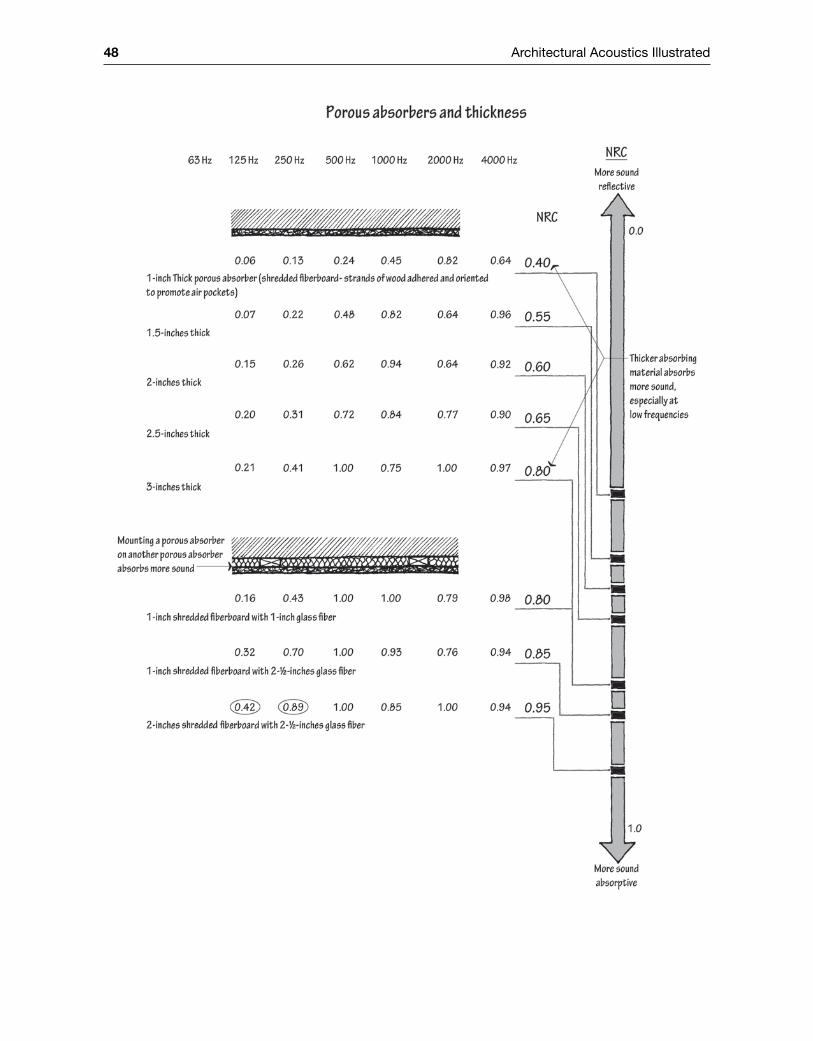
48 Architectural Acoustics Illustrated
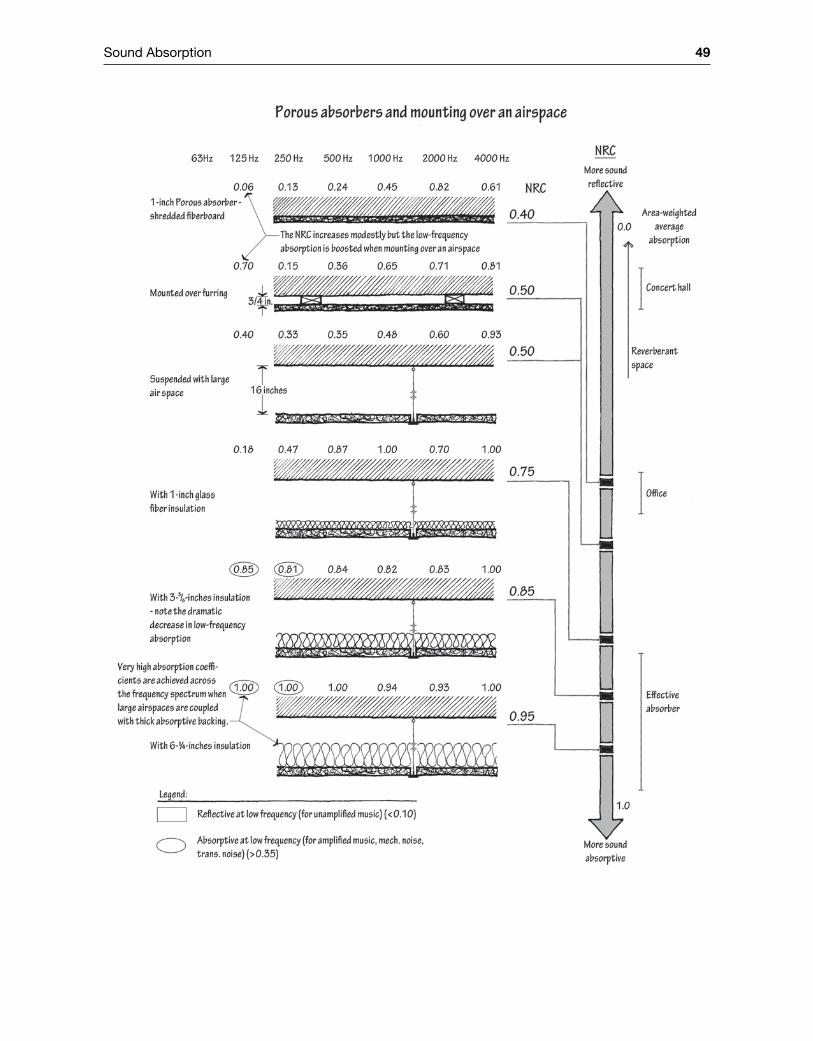
Sound Absorption 49
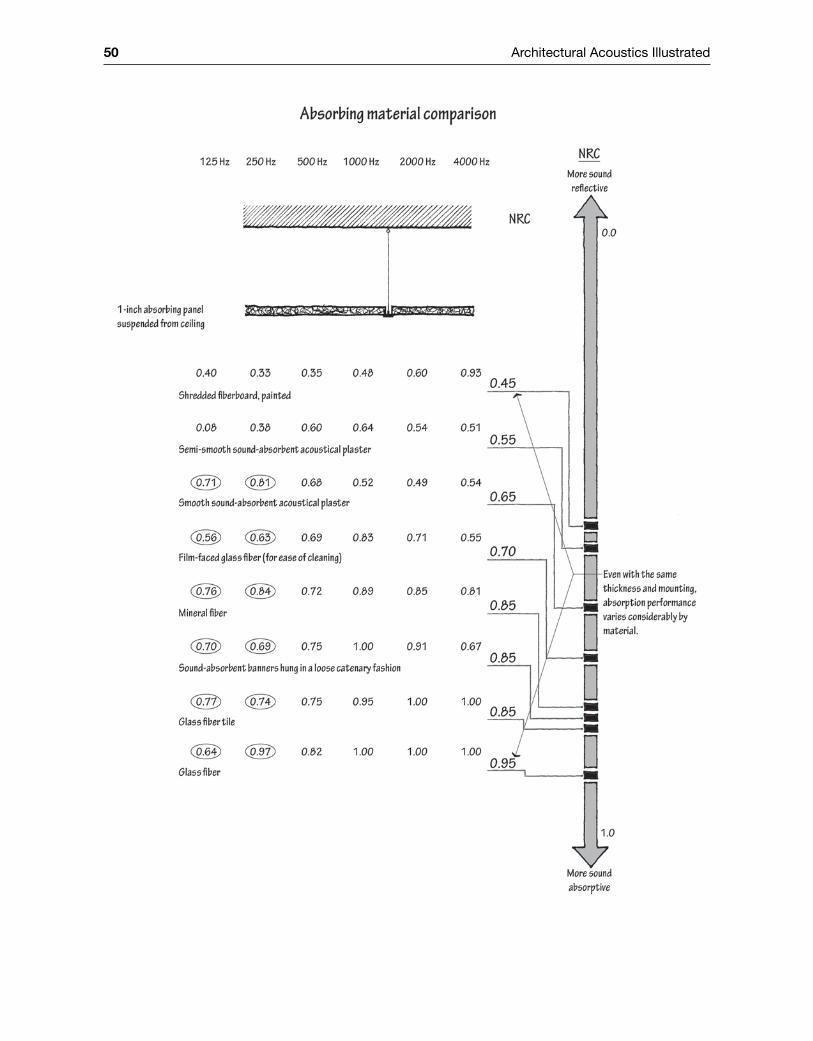
50 Architectural Acoustics Illustrated
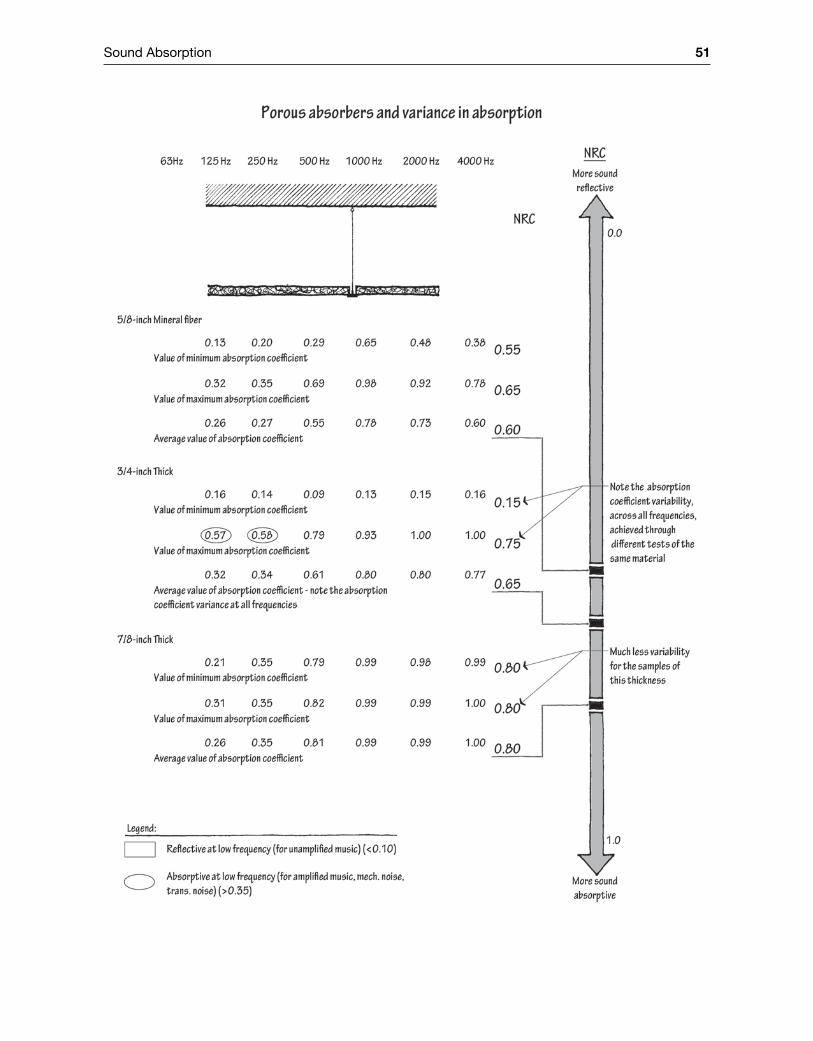
Sound Absorption 51
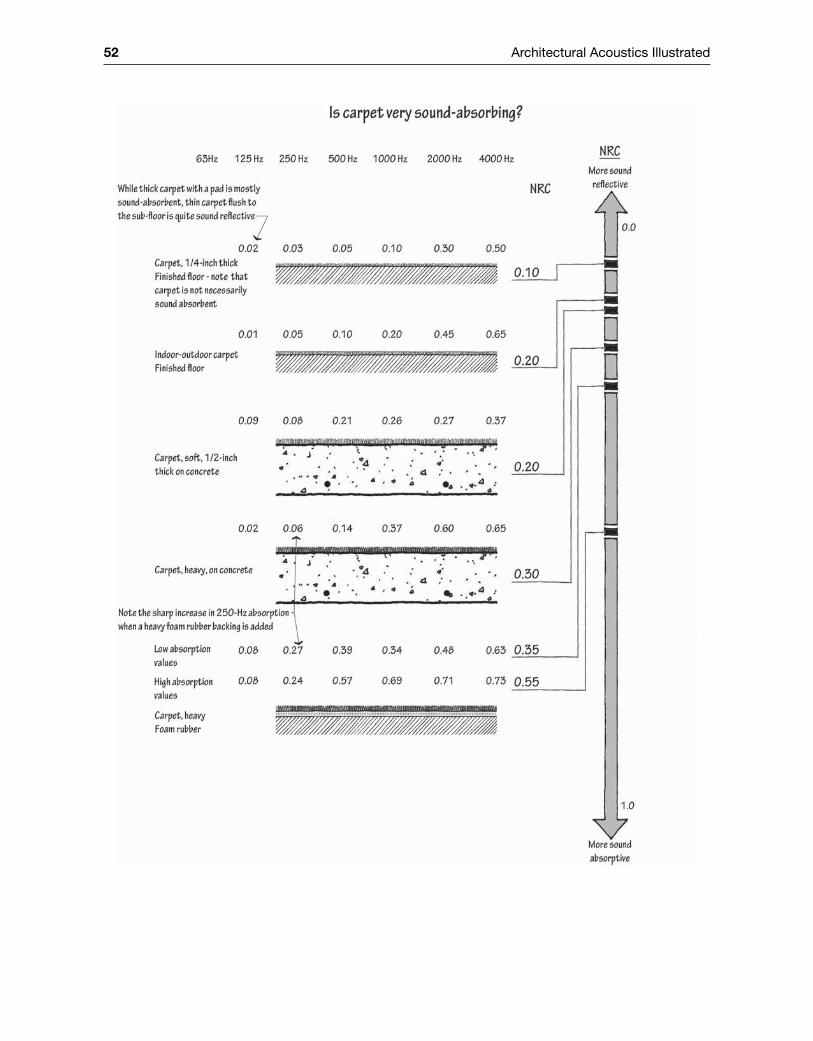
52 Architectural Acoustics Illustrated
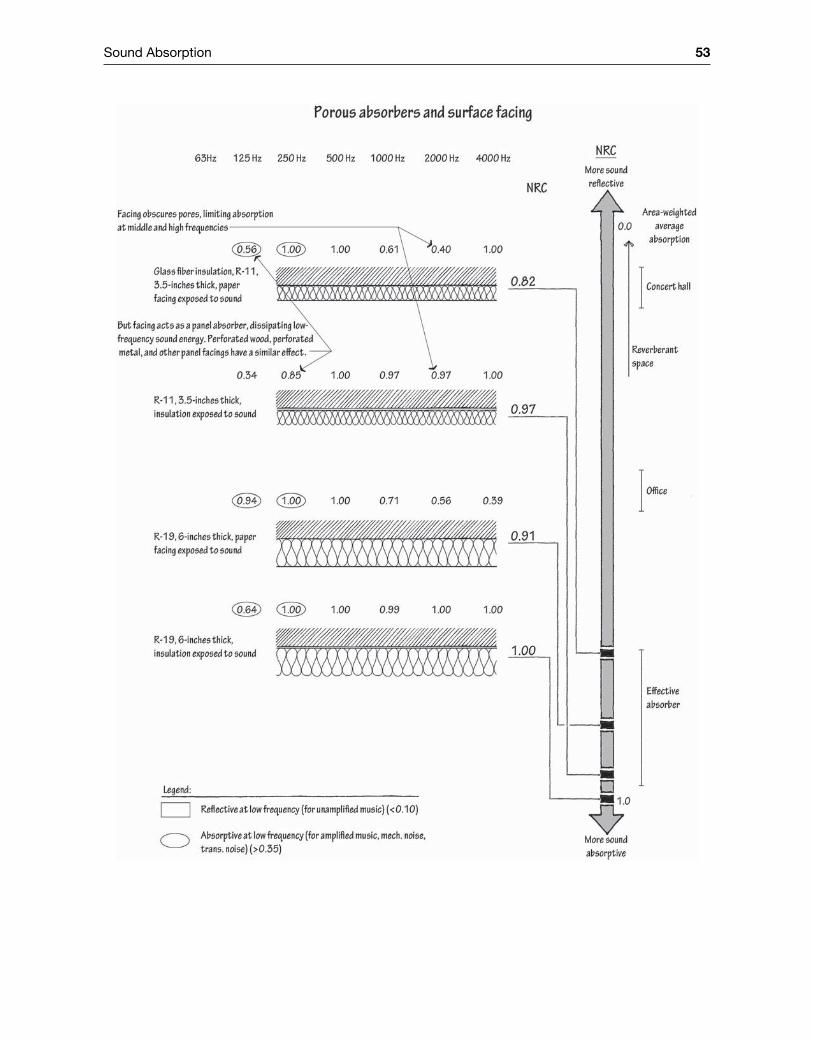
Sound Absorption 53
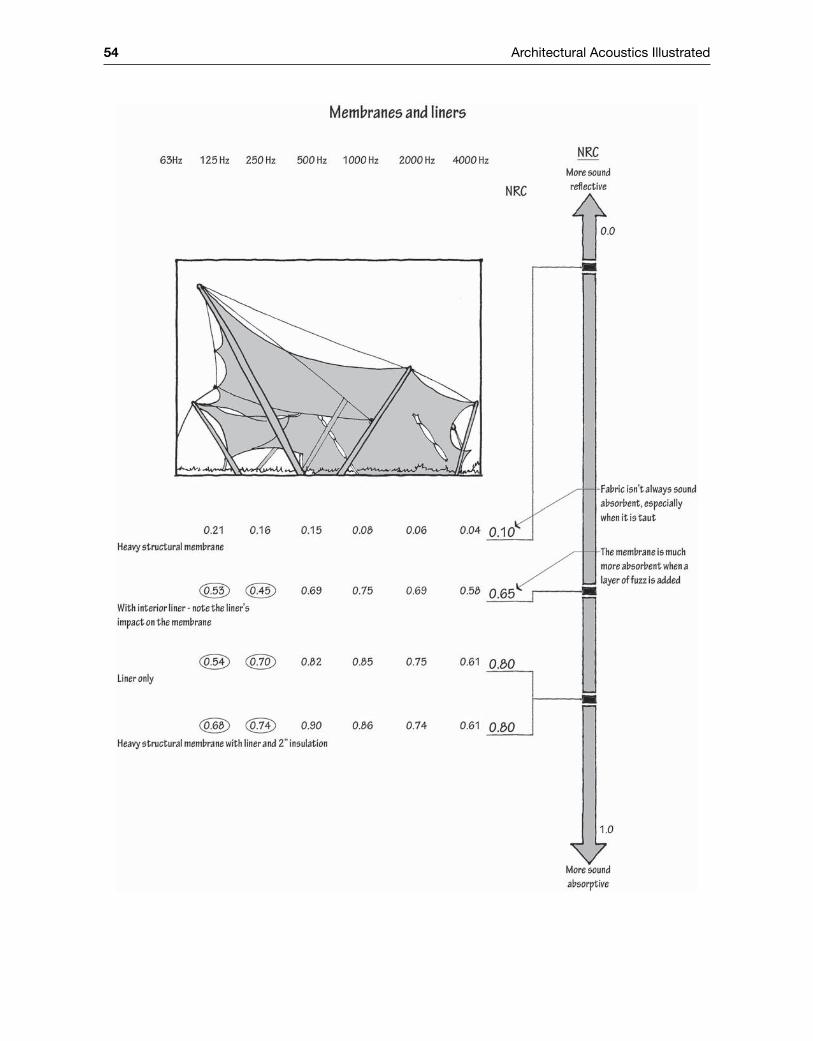
54 Architectural Acoustics Illustrated
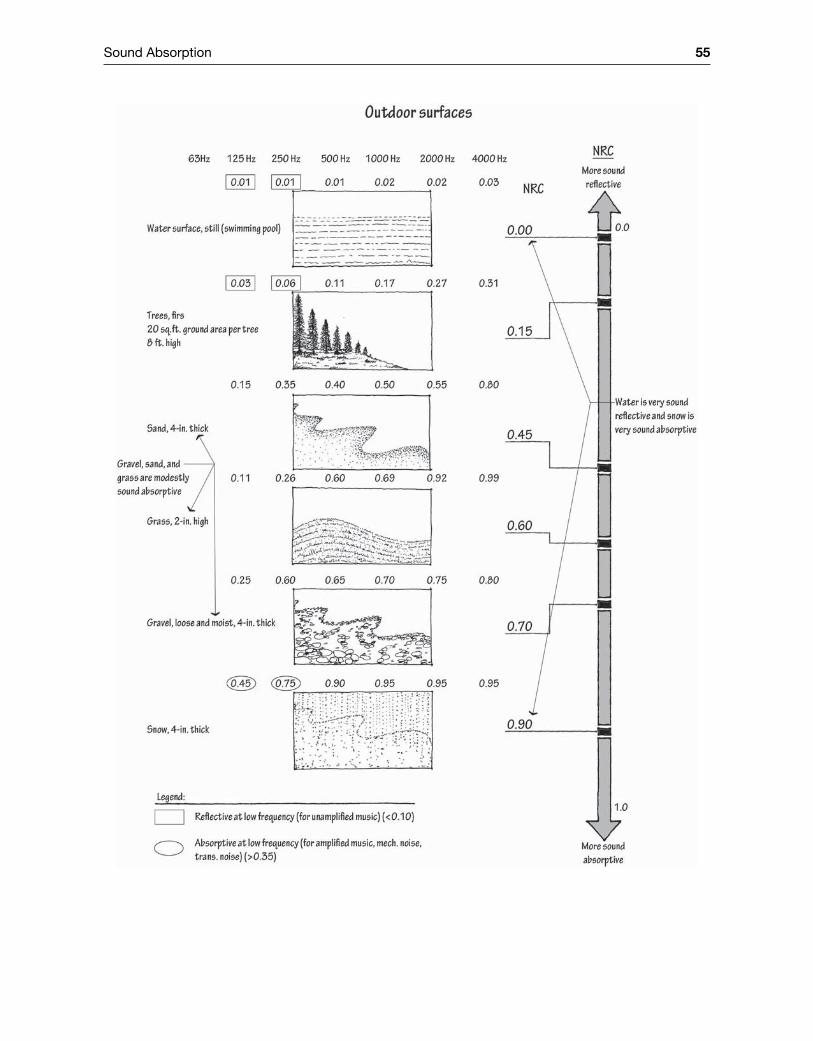
Sound Absorption 55

Room Acoustics
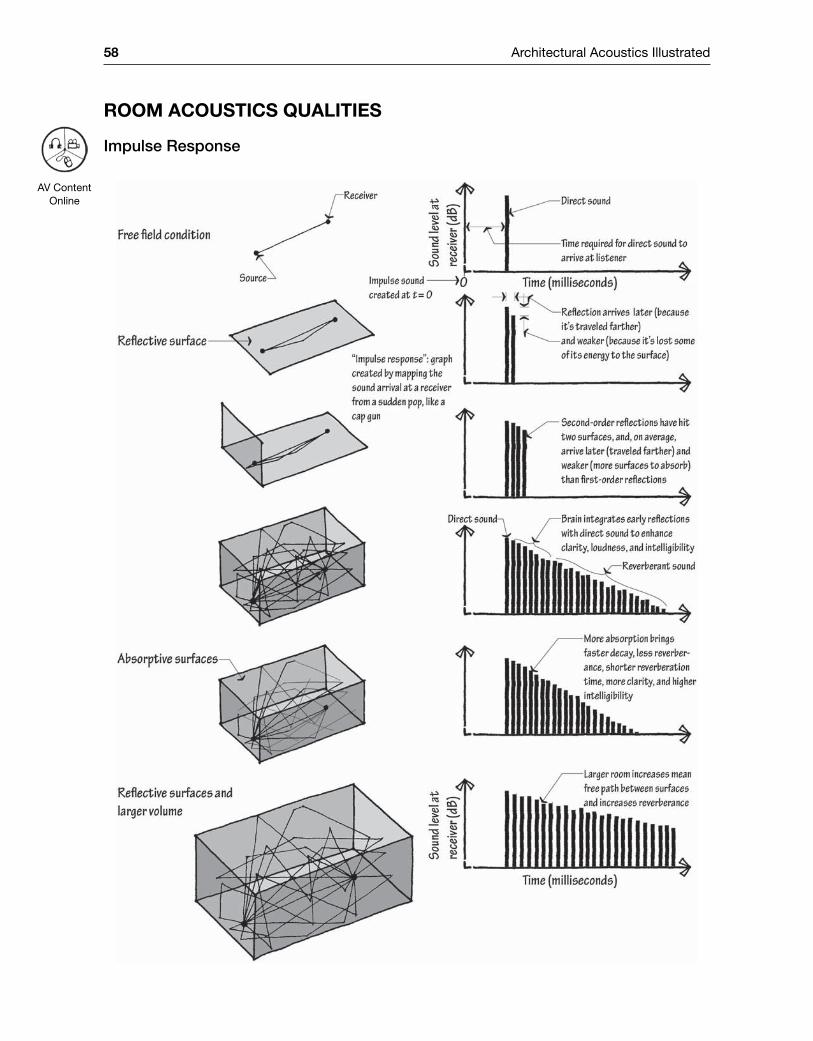
58 Architectural Acoustics Illustrated
Room Acoustics QuAlities
Impulse Response
AV Content Online
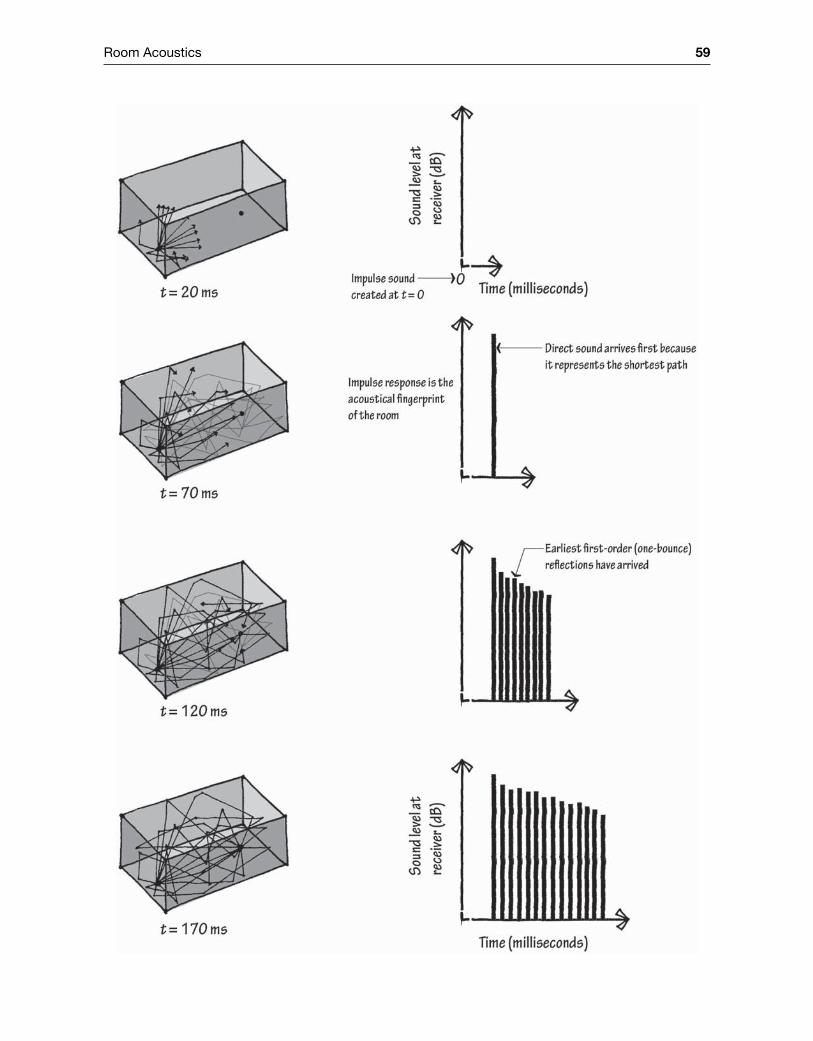
Room Acoustics 59
60 Architectural Acoustics Illustrated
In a large room, one impulse sound, like that generated with a cap gun or popped balloon, may pass a listener 8,000 times per second after it is abruptly stopped. The mapping of these sound front arrivals over time is called the impulse response, and the impulse response can be thought of as the acoustical fingerprint of a room. It represents what is heard from a single musical note or a single speech syllable (each of which arrives in a burst, like an impulse) and can show arrival time, loudness, reverberance, frequency content, directionality of sound reflections, and acoustic defects. Total sound level is a function of the total area under the impulse response on the graph.
We can derive the reverberation time of a room by fitting a smooth line to the decay rate of its impulse. And we can spot a pronounced echo by identifying a strong, late reflection that, on the graph, towers vertically over its adjacent neighbors on the time axis. But even experienced acousticians have difficulty evaluating the subtleties of a room’s acoustic character with only the impulse response to examine. That said, comparisons between two impulse responses—whether generated in a physical model, in a software model, or in a constructed room—can illuminate the location of a surface generating a troublesome reflection, or the acoustical impact of proposed changes in the architecture of the room, such as the addition of a balcony or the opening of a door linked to a reverberation chamber.
Because speech and music are both marked by sound spurts separated by short periods of quiet, many of the requirements for good speech intelligibility match requirements for good music listening. Still, listening for music requires a different character of room—a different impulse response—one where sound lingers longer, arrives at the head from the side, and is richer in low‐frequency content.
ReverberanceThe Fogg Art Museum opened on Harvard University’s campus in 1895 with a lecture hall that was functionally unusable. The room, a hard‐surfaced affair, semicircular in both plan and sec-tion, caused speech to remain audible for more than five seconds. A syllable spoken would linger in the room to muddy the next 15 syllables in the sentence!
Seven hundred miles to the west and a decade earlier, Wallace Clement Sabine’s mother had taken a dominant role in her children’s education, and she enrolled Wallace in college at a young age. After graduating from Ohio State University at the age of 18, Wallace started graduate school at Harvard. Mother Sabine left her less‐ambitious husband and moved to Boston with Wallace (and Wallace’s sister, who was at M.I.T.). Upon completion of his graduate studies in physics, Sabine was offered a faculty position at Harvard. That’s when university president Charles William Eliot solicited help righting the Fogg Museum lecture room’s acoustics from 27‐year‐old Sabine, who was, at the time, researching electricity. The president asked the physics professor to bring the lecture hall in line with the beloved Sanders Theatre, also on Harvard’s campus.
Sabine spent the next two years taking acoustical measurements at the Fogg Museum, as well as in other buildings on campus. While many of his contemporaries were searching for methods to render sound visible so that it could be studied, Sabine preferred to listen to sound. He used an organ pipe to excite the room, a stopwatch to time the audible sound decay, and his judgment to determine when the persistent sound level had dropped below his ability to hear it. Sabine and his students worked between the hours of midnight and 4:00 a.m. to minimize noise they might encounter from other students in the daytime. They carried three‐inch cushions from Sanders Theatre (the room with the exemplary acoustics) across campus to the Fogg, and hung them on
AV Content Online
AV Content Online
Room Acoustics 61
the wall to gauge their effect on the sound’s decay, only to return the cushions to Sanders before classes started the next day. Legendarily meticulous in his research methods, Sabine at one point trashed three months of data when he discovered that his choice of clothing had a minor impact on the room’s sound decay rate; he completed the balance of his measurements wearing the same clothes each session. In 1897, when the university president asked Sabine to complete his study, Sabine pleaded for more time to collect data, but, tired of waiting, President Elliot insisted that Sabine fix the theater based on data already collected. Now denied permission to continue taking measurements, Sabine was forced to examine his numbers, and he experienced a breakthrough. He discovered the mathematical relationship between the size of a room, its surface materiality, and the reverberance in the room.
As sound ricochets inside an enclosed space, and reflections beget reflections‐of‐reflections, sound seems to linger. The persistence of sound in a room after the sound source is suddenly stopped is dubbed reverberance. Sound experiences the twin phenomena of time and attenuation, mak-ing big rooms sound like big rooms and small rooms sound like small rooms, racquetball courts sound like racquetball courts, and plush living rooms sound like plush living rooms. In architec-tural acoustics, more reverberance is neither universally desired nor universally avoided. Rather, each use for a space has an appropriate level of reverberance, a target to be aimed for, or a “sweet spot” to achieve. Generally, in unamplified spaces, the desired reverberance is a function of the balance of speech‐to‐music planned for the room, with speech requiring less reverberance to maintain intelligibility, and music requiring more reverberance to maintain a quality called “fullness.” (Think of the street‐performer saxophonist positioning himself adjacent to a mostly enclosed alley so that his notes will linger a bit longer.) In amplified speech or music, generally less reverberance is desired because (a) reflecting amplified sound can more easily muddy the effect and (b) if reverberance is desired, it can be easily added digitally to the recorded track or live feed.
Of course, Wallace Clement Sabine didn’t discover reverberance, but he did give the world a win-dow into how sound decays. He completed the first measurements of the absorption coefficients of materials, and he formulated the relationship linking a room’s geometric volume and boundary surface materiality with its reverberance. He found that the rate of sound decay in a room was the same whether he excited the room with one organ pipe, two organ pipes, or four organ pipes. In equal time intervals, sound energy decays by the same fraction of its initial value, and the loss of sound energy is always a constant percentage of the total amount of energy. The formula he proposed, the “Sabine formula” for calculating reverberation time, is written as
RTV
Sreverberation time
volume
area of the wall abscoeff
=0.05
1 1
⋅⋅ α oof the wall area of theceiling abscoeff of theceilingS( ) ( )⋅+ ..2 2α .. and so on
WhereRT is the “reverberation time,” the time in seconds required for sound to decay by 60 decibelsV is the volume of the space measured in cubic feetSn is the surface area of a given material in the room in square feetαn is the absorption coefficient of that same material
Sabine determined that the qualitative impression of reverberance could be expressed as the quantitative value of reverberation time, the number of seconds required for sound in a space to decay (once it is abruptly stopped) by some fixed decibel value. In this case, 60 decibels (or a drop to one‐millionth the sound energy) was chosen as the reference decay. RT is sometimes instead
62 Architectural Acoustics Illustrated
written as T60 or RT60. Nominally, a small office may have a reverberation time of 0.25 seconds, which means that a sound inside the room, when cut off suddenly, decays 60 decibels in a quar-ter‐second. For reference, a classroom may measure 0.50 seconds, a theater 1.0 second, a concert hall 2.0 seconds, and a cathedral 10.0 seconds. That cathedral, with a ten‐second reverberation time, sees sound travel two miles before its level drops 60 decibels (1,128 feet per second times 10 seconds). At first approximation, the sound is weakened from impacts with the room boundary; therefore, a larger space, as measured in the numerator of the formula, has a longer mean free path between surface impacts, and correspondingly slower decays and longer reverberation times. In large spaces, the sound lingers because, in a given time window, it has lost its sound energy to fewer surfaces than would be the case in smaller spaces, where impacts come more frequently. Spaces with fewer surfaces to absorb sound, and spaces finished with more reflective surfaces that absorb less sound, also have longer reverberation times. The Sabine formula measures this in the denominator, which multiplies the surface area of each building material by its corresponding absorption coefficient, then adds each of the products together. The result is an equivalent absorp-tion area, measured in the unit “sabins.” Twenty square feet of a material with 0.50 absorption coefficient returns 10 sabins. Consequently, the formula suggests that a room with 650 sabins of total absorption is equivalent to a room that has 650 square feet of open window but is other-wise completely (theoretically) sound reflective on all other surfaces. Professor Sabine had origi-nally used the less universal unit of Sanders Theatre cushions to measure total absorption in the denominator (i.e., “The courtroom has 825 Sanders Cushions of total room sound absorption”), but scrapped that system in favor of equivalent absorption area, which he thought to be more intuitive and widely accessible: One sabin equals one square foot of open aperture.
Notionally, sound energy never fully dissipates, but rather continues to dwindle indefinitely. The Sabine formula seeks the statistical location‐independent and time‐independent sound decay rate—an average for the room, uninfluenced by the kind of location‐based peculiarities that might bring an unusually strong early reflection from one particular source position in space to one par-ticular receiver position in space. In order to minimize the impact of geometric idiosyncrasies and strong early reflections, reverberation measurements “throw out” the first five decibels of decay. After that threshold, impulse sounds typically weaken at a constant rate throughout the room, at least for middle and high frequencies. Further, to measure the full 60‐decibel decay requires a source very loud relative to the background noise. Often practical limits to both the sound source power available for taking measurements and the quiet available in the room prohibit a sufficient sound level range between source and noise floor. Reverberation time may be expressed with T30, which measures the time required to drop 30 decibels (from −5 decibels to −35 decibels relative to the direct sound peak) and doubles that 30‐decibel‐drop time to extrapolate a 60‐decibel‐drop reverberation time. Similarly T20 extrapolates by tripling the time required for a 20‐decibel decay, and early decay time (EDT) multiplies by six the time required for a ten‐decibel decay. Only in the stop‐chords of music is a full reverberant tail audible, so EDT is thought to be the best measure of reverberance in running music, and EDT has proven to be more highly correlated to subjective rankings of concert halls than other methods of measuring reverberance.
The reverberation time metric, one of the four or five most important acoustic factors in per-formance spaces, is also the most widely applicable room acoustics measurement in the greatest number of room types. Jazz clubs, banquet halls, classrooms, offices, and almost all types of rooms where listening is important have their own window on the reverberance continuum. Too much reverberance, and notes or syllables smear together; too little reverberance, and musical loudness or fullness might suffer. Further, because the Sabine formula is easy to calculate and doesn’t require measurement in an extant room, it can be estimated during the design phase,
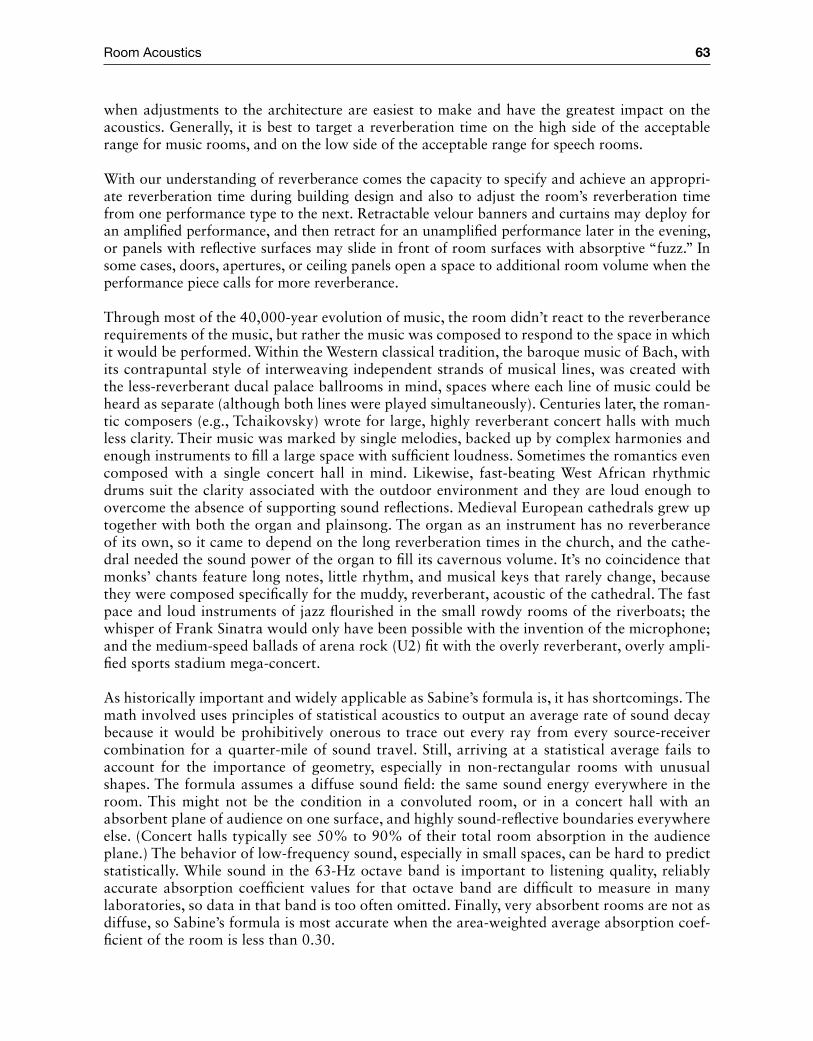
Room Acoustics 63
when adjustments to the architecture are easiest to make and have the greatest impact on the acoustics. Generally, it is best to target a reverberation time on the high side of the acceptable range for music rooms, and on the low side of the acceptable range for speech rooms.
With our understanding of reverberance comes the capacity to specify and achieve an appropri-ate reverberation time during building design and also to adjust the room’s reverberation time from one performance type to the next. Retractable velour banners and curtains may deploy for an amplified performance, and then retract for an unamplified performance later in the evening, or panels with reflective surfaces may slide in front of room surfaces with absorptive “fuzz.” In some cases, doors, apertures, or ceiling panels open a space to additional room volume when the performance piece calls for more reverberance.
Through most of the 40,000‐year evolution of music, the room didn’t react to the reverberance requirements of the music, but rather the music was composed to respond to the space in which it would be performed. Within the Western classical tradition, the baroque music of Bach, with its contrapuntal style of interweaving independent strands of musical lines, was created with the less‐reverberant ducal palace ballrooms in mind, spaces where each line of music could be heard as separate (although both lines were played simultaneously). Centuries later, the roman-tic composers (e.g., Tchaikovsky) wrote for large, highly reverberant concert halls with much less clarity. Their music was marked by single melodies, backed up by complex harmonies and enough instruments to fill a large space with sufficient loudness. Sometimes the romantics even composed with a single concert hall in mind. Likewise, fast‐beating West African rhythmic drums suit the clarity associated with the outdoor environment and they are loud enough to overcome the absence of supporting sound reflections. Medieval European cathedrals grew up together with both the organ and plainsong. The organ as an instrument has no reverberance of its own, so it came to depend on the long reverberation times in the church, and the cathe-dral needed the sound power of the organ to fill its cavernous volume. It’s no coincidence that monks’ chants feature long notes, little rhythm, and musical keys that rarely change, because they were composed specifically for the muddy, reverberant, acoustic of the cathedral. The fast pace and loud instruments of jazz flourished in the small rowdy rooms of the riverboats; the whisper of Frank Sinatra would only have been possible with the invention of the microphone; and the medium‐speed ballads of arena rock (U2) fit with the overly reverberant, overly ampli-fied sports stadium mega‐concert.
As historically important and widely applicable as Sabine’s formula is, it has shortcomings. The math involved uses principles of statistical acoustics to output an average rate of sound decay because it would be prohibitively onerous to trace out every ray from every source‐receiver combination for a quarter‐mile of sound travel. Still, arriving at a statistical average fails to account for the importance of geometry, especially in non‐rectangular rooms with unusual shapes. The formula assumes a diffuse sound field: the same sound energy everywhere in the room. This might not be the condition in a convoluted room, or in a concert hall with an absorbent plane of audience on one surface, and highly sound‐reflective boundaries everywhere else. (Concert halls typically see 50% to 90% of their total room absorption in the audience plane.) The behavior of low‐frequency sound, especially in small spaces, can be hard to predict statistically. While sound in the 63‐Hz octave band is important to listening quality, reliably accurate absorption coefficient values for that octave band are difficult to measure in many laboratories, so data in that band is too often omitted. Finally, very absorbent rooms are not as diffuse, so Sabine’s formula is most accurate when the area‐weighted average absorption coef-ficient of the room is less than 0.30.
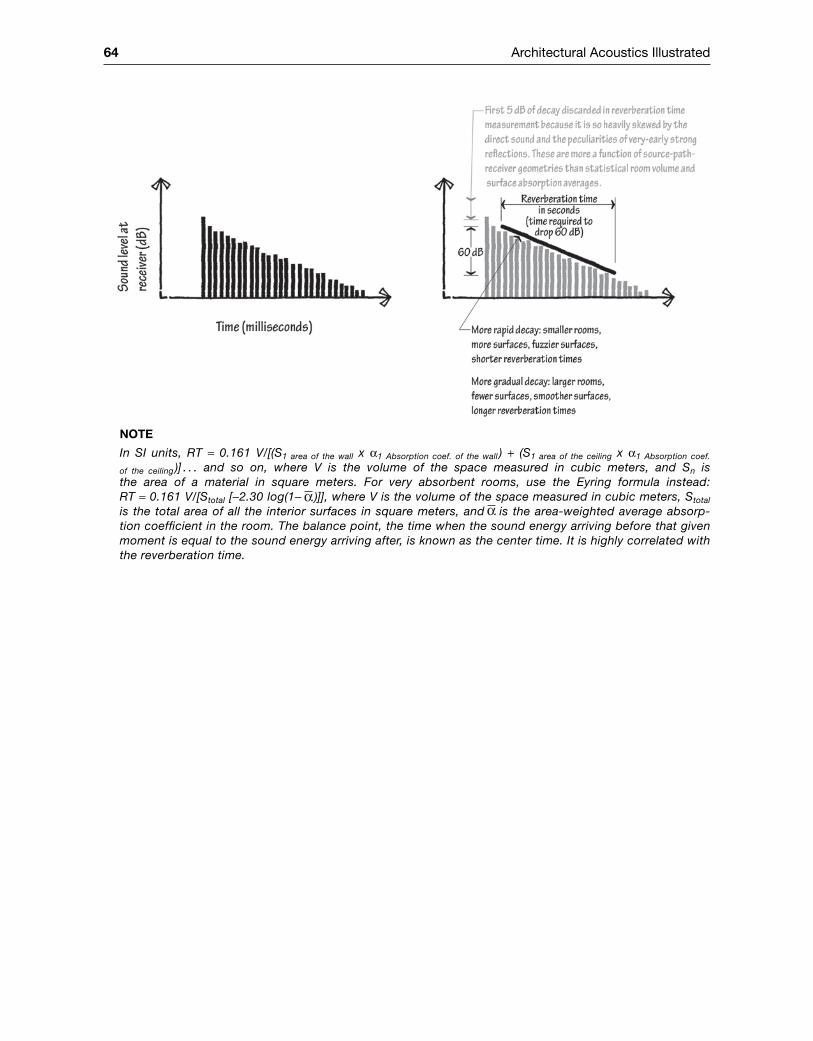
64 Architectural Acoustics Illustrated
Note
In SI units, RT = 0.161 V/[(S1 area of the wall x α1 Absorption coef. of the wall ) + (S1 area of the ceiling x α1 Absorption coef.
of the ceiling )] . . . and so on, where V is the volume of the space measured in cubic meters, and Sn is the area of a material in square meters. For very absorbent rooms, use the Eyring formula instead: RT = 0.161 V/[Stotal [-2.30 log(1- α )]], where V is the volume of the space measured in cubic meters, Stotal is the total area of all the interior surfaces in square meters, and α is the area‐weighted average absorp-tion coefficient in the room. The balance point, the time when the sound energy arriving before that given moment is equal to the sound energy arriving after, is known as the center time. It is highly correlated with the reverberation time.
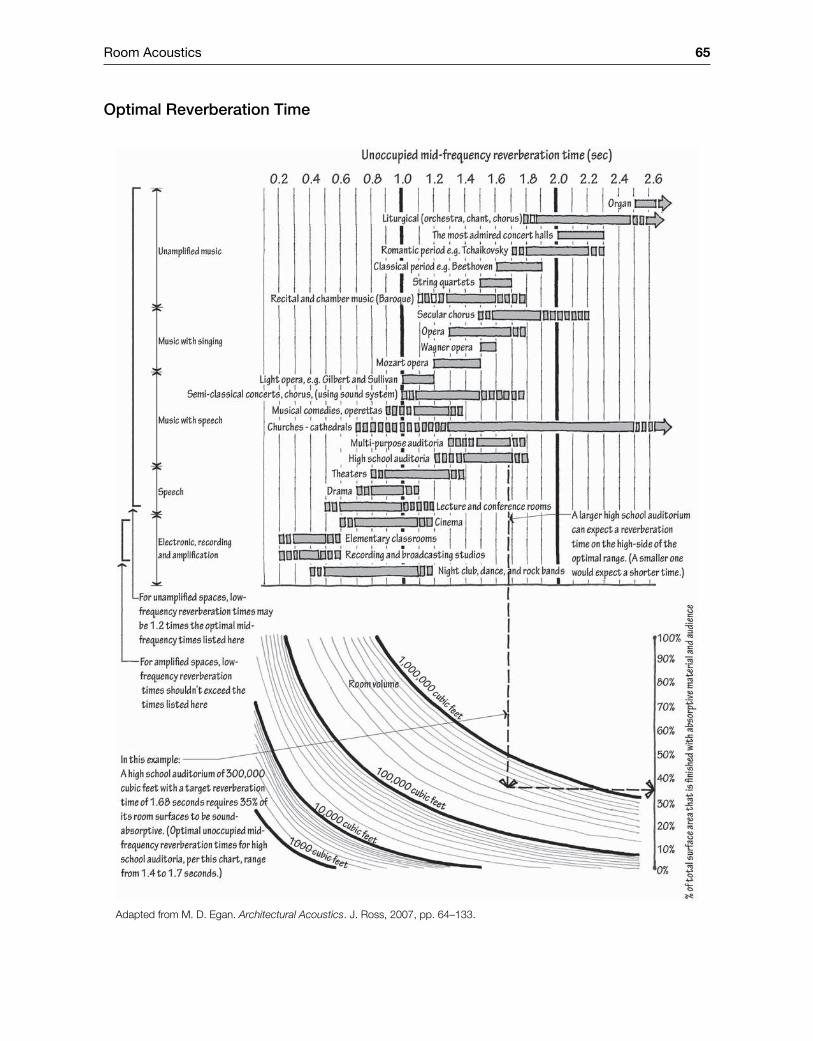
Room Acoustics 65
Optimal Reverberation Time
Adapted from M. D. Egan. Architectural Acoustics. J. Ross, 2007, pp. 64–133.
66 Architectural Acoustics Illustrated
Note
This optimal reverberation time monograph is for preliminary design purposes only. After room is designed and materials chosen, detailed octave‐band‐resolution reverberation time calculations should be conducted. The opti-mal reverberation times given here are targets for mid‐frequency (average of the 500‐Hz and 1,000‐Hz octave band values) measured in the unoccupied condition. No single reverberation time is perfect for all uses of a room, so variations up to 10% from targets are common. For desired warmth in unamplified music listening, low‐frequency reverberation times should increase to something on the order of 20% longer than mid‐frequency values. To avoid undesirable “boomy‐ness” in spaces for speech or amplified music listening, low‐frequency reverberation times should nearly equal those at mid‐frequency. Upholstered seats count as “absorptive material” in this calculation. For this graph, it is assumed that the room aspect ratio is 2H long by 1.5H wide by H high and that absorbing mate-rial measures a 0.75 absorption coefficient. The non‐absorbing surfaces in the room are assumed to have absorp-tion coefficients of 0.07. Large examples of a type of room should target longer reverberation times within the range given, and smaller examples of a type of room should target shorter reverberation times within the range given.
ClarityIf reverberance is the smearing or blending of successive syllables and musical notes, the acousti-cal quality of “clarity” is reverberance’s opposite—the differentiation of each syllable and musical note. Clarity and reverberance are highly (inversely) correlated, so rooms with high reverberation times suffer from a loss of clarity, and rooms with a low reverberation time enjoy a richness of clarity. Yet a measure of each is desired. Rather than a singular focus on the rate of sound decay, achieving clarity also demands maximizing both the direct sound and the very early sound reflec-tions that arrive just after the direct sound.
The human brain combines the arriving direct sound with early‐arriving sound reflections, increas-ing the distinctness of each note and allowing each syllable of speech to stand apart from those before and after it. The integration of, nominally, the first 50 milliseconds of reflections (speech) and 80 milliseconds of reflections (music) into a single fused louder image is called the “Haas effect,” after the man who discovered it over the course of his late 1940s Ph.D. research, Helmut Haas. The phenomenon is also called the “precedence effect.” Haas found that the auditory sys-tem uses the direct sound to locate the source, but it is the early reflections that promote clarity.
More recent research suggests that the 50‐millisecond and 80‐millisecond cutoff point values (speech and music respectively) between the zone of early reflections and the zone of reverber-ant energy (and echo) may represent too short a time window. Our brains likely fuse reflections arriving up to 200 milliseconds after the direct sound, with the cutoff time a function of (a) the balance of speech to music, (b) the type of music, and even (c) the shape of the room. Whether the threshold is 50 milliseconds, 80 milliseconds, or 200 milliseconds, the time window threshold of early reflections is of course not measured after the sound is made, but rather after the direct sound arrives at the listener location.
This understanding has a profound effect on the shaping of rooms. To enhance clarity (and loud-ness), maximize the direct sound by limiting the distance between the source and receiver. Provide good sightlines to the musician or lecturer. Because human eyes and ears are on the same hori-zontal plane, clear sightlines to the stage typically afford the listener unblocked access to direct sound, so raked seating planes promote acoustical clarity. Maximizing early sound reflections further promotes clarity as it mitigates unwanted echo, which comes from strong sound reflec-tions that arrive too late to support clarity, and are too loud to make up the reverberant decay. The positions and angles of walls and ceiling segments should be shaped to encourage strong first‐order reflections (those that arrive after a single bounce off a sound‐reflective surface). To promote clarity and mitigate echoes, sound‐absorbing materials (as much as needed to achieve
AV Content Online
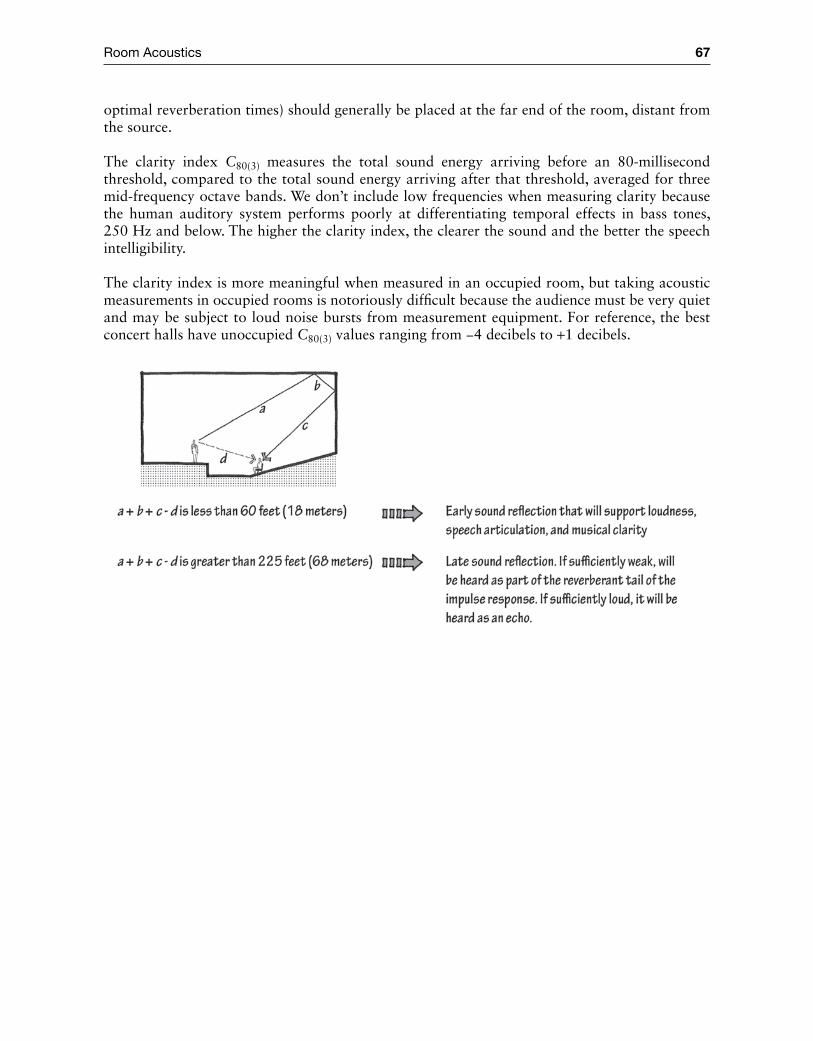
Room Acoustics 67
optimal reverberation times) should generally be placed at the far end of the room, distant from the source.
The clarity index C80(3) measures the total sound energy arriving before an 80‐millisecond threshold, compared to the total sound energy arriving after that threshold, averaged for three mid‐frequency octave bands. We don’t include low frequencies when measuring clarity because the human auditory system performs poorly at differentiating temporal effects in bass tones, 250 Hz and below. The higher the clarity index, the clearer the sound and the better the speech intelligibility.
The clarity index is more meaningful when measured in an occupied room, but taking acoustic measurements in occupied rooms is notoriously difficult because the audience must be very quiet and may be subject to loud noise bursts from measurement equipment. For reference, the best concert halls have unoccupied C80(3) values ranging from −4 decibels to +1 decibels.
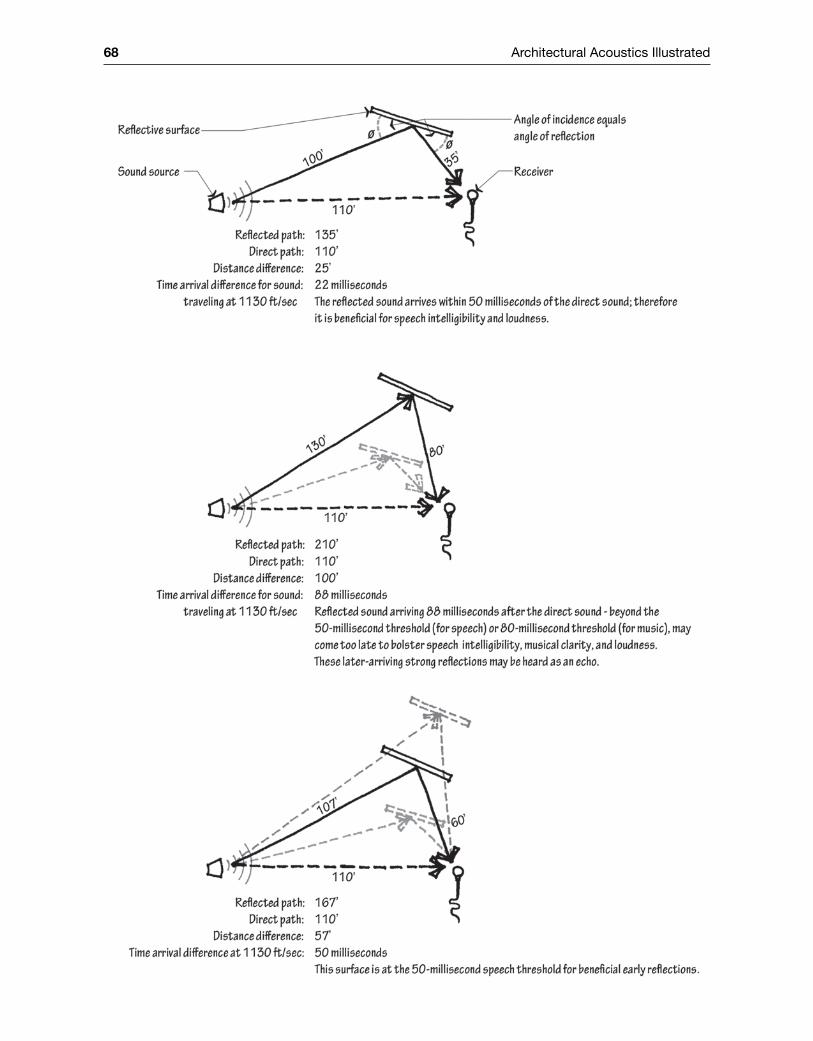
68 Architectural Acoustics Illustrated
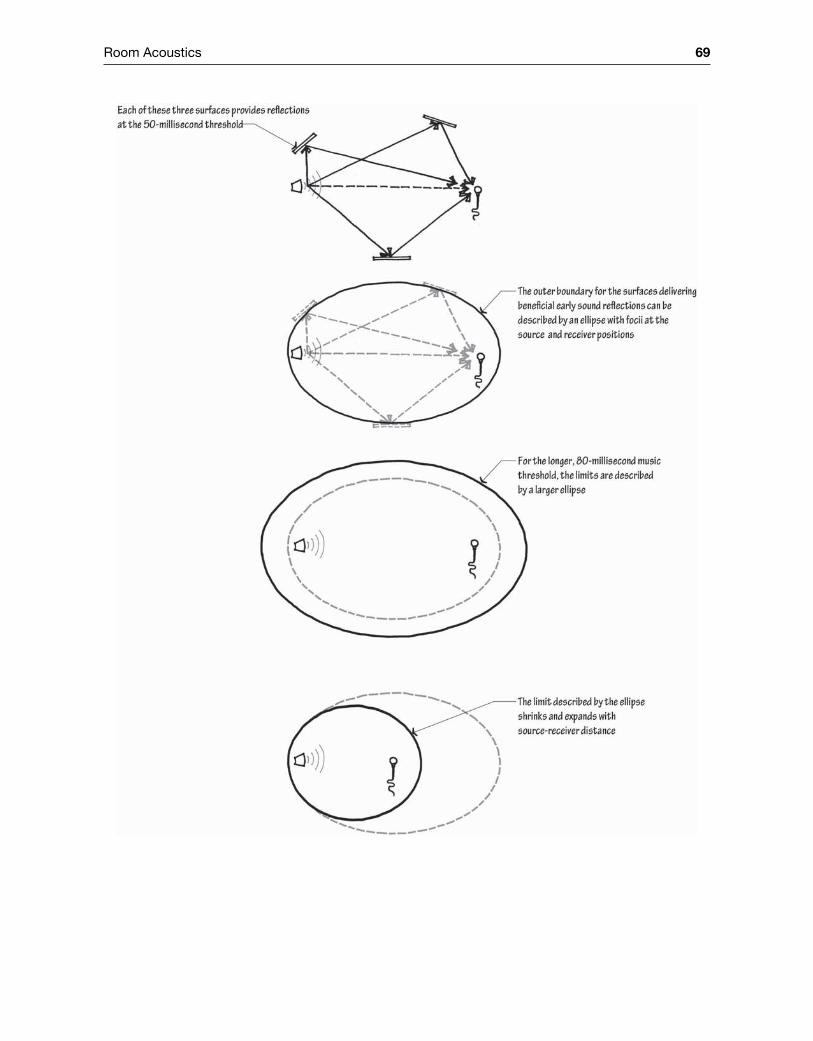
Room Acoustics 69
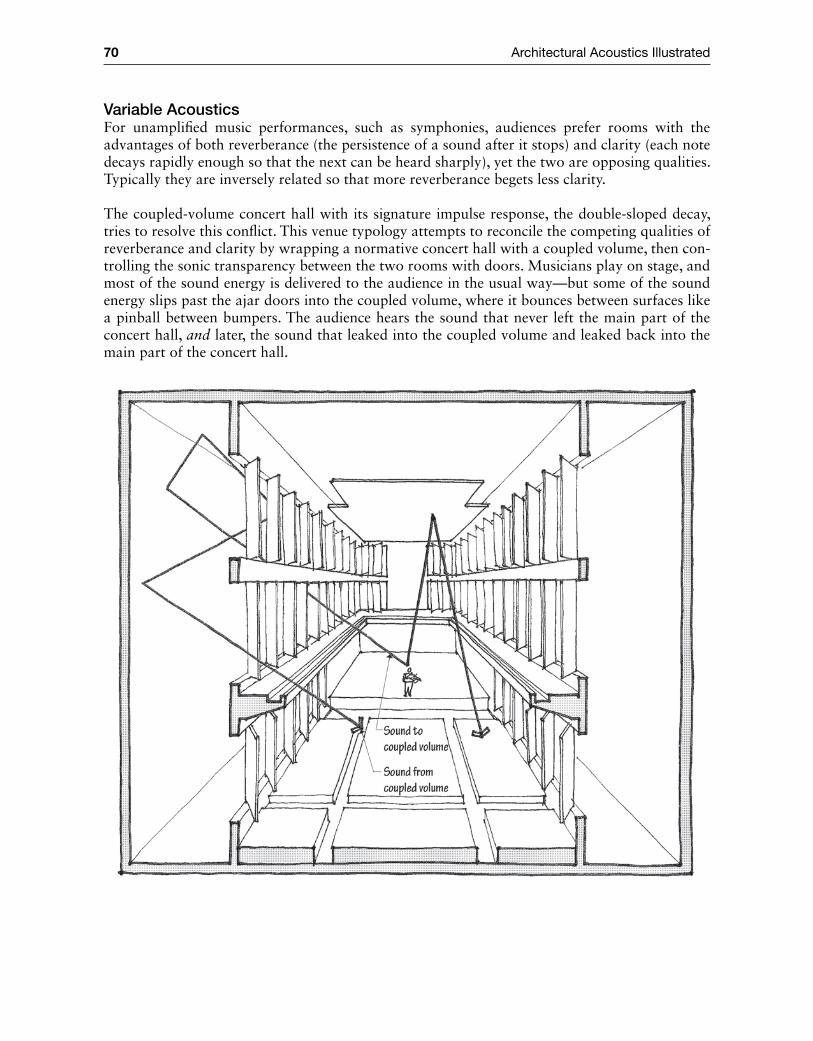
70 Architectural Acoustics Illustrated
Variable AcousticsFor unamplified music performances, such as symphonies, audiences prefer rooms with the advantages of both reverberance (the persistence of a sound after it stops) and clarity (each note decays rapidly enough so that the next can be heard sharply), yet the two are opposing qualities. Typically they are inversely related so that more reverberance begets less clarity.
The coupled‐volume concert hall with its signature impulse response, the double‐sloped decay, tries to resolve this conflict. This venue typology attempts to reconcile the competing qualities of reverberance and clarity by wrapping a normative concert hall with a coupled volume, then con-trolling the sonic transparency between the two rooms with doors. Musicians play on stage, and most of the sound energy is delivered to the audience in the usual way—but some of the sound energy slips past the ajar doors into the coupled volume, where it bounces between surfaces like a pinball between bumpers. The audience hears the sound that never left the main part of the concert hall, and later, the sound that leaked into the coupled volume and leaked back into the main part of the concert hall.
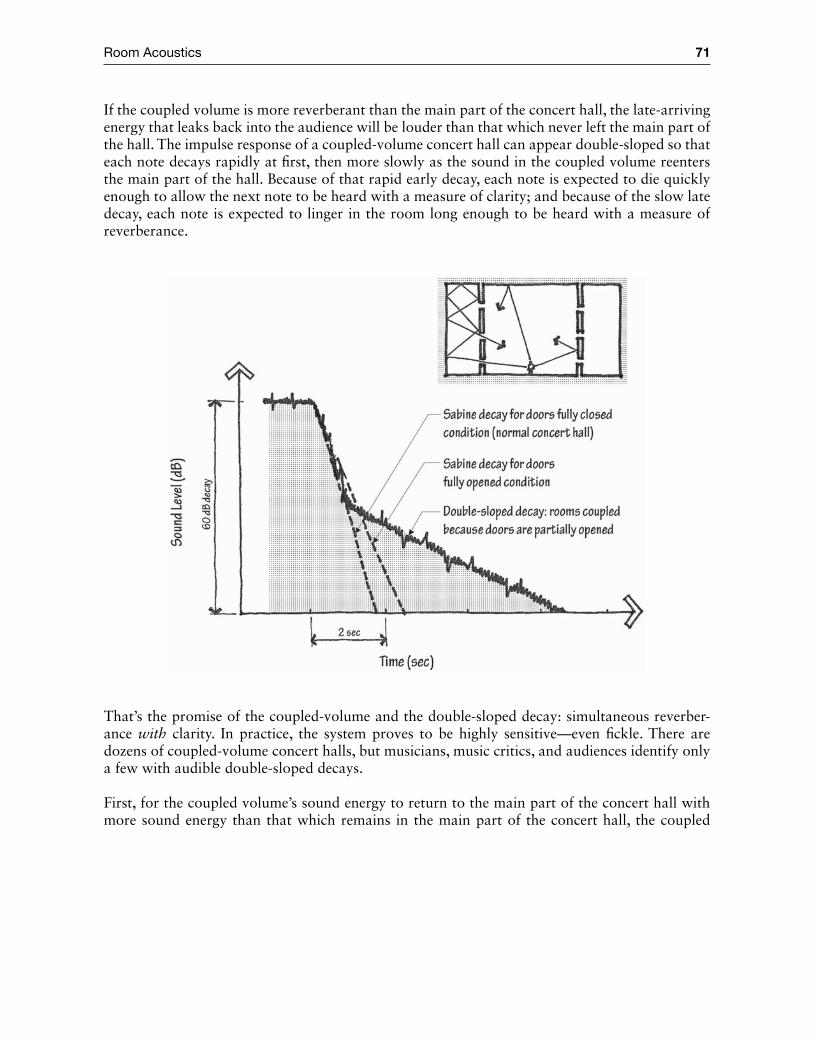
Room Acoustics 71
If the coupled volume is more reverberant than the main part of the concert hall, the late‐arriving energy that leaks back into the audience will be louder than that which never left the main part of the hall. The impulse response of a coupled‐volume concert hall can appear double‐sloped so that each note decays rapidly at first, then more slowly as the sound in the coupled volume reenters the main part of the hall. Because of that rapid early decay, each note is expected to die quickly enough to allow the next note to be heard with a measure of clarity; and because of the slow late decay, each note is expected to linger in the room long enough to be heard with a measure of reverberance.
That’s the promise of the coupled‐volume and the double‐sloped decay: simultaneous reverber-ance with clarity. In practice, the system proves to be highly sensitive—even fickle. There are dozens of coupled‐volume concert halls, but musicians, music critics, and audiences identify only a few with audible double‐sloped decays.
First, for the coupled volume’s sound energy to return to the main part of the concert hall with more sound energy than that which remains in the main part of the concert hall, the coupled
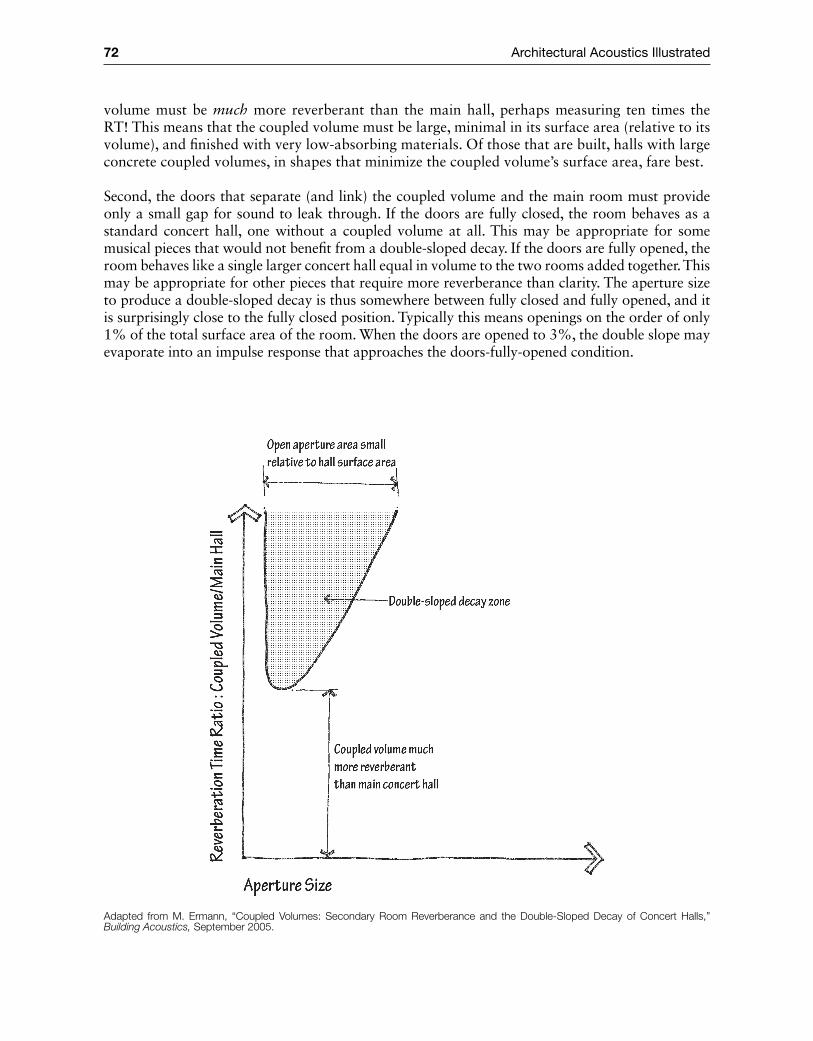
72 Architectural Acoustics Illustrated
volume must be much more reverberant than the main hall, perhaps measuring ten times the RT! This means that the coupled volume must be large, minimal in its surface area (relative to its volume), and finished with very low‐absorbing materials. Of those that are built, halls with large concrete coupled volumes, in shapes that minimize the coupled volume’s surface area, fare best.
Second, the doors that separate (and link) the coupled volume and the main room must provide only a small gap for sound to leak through. If the doors are fully closed, the room behaves as a standard concert hall, one without a coupled volume at all. This may be appropriate for some musical pieces that would not benefit from a double‐sloped decay. If the doors are fully opened, the room behaves like a single larger concert hall equal in volume to the two rooms added together. This may be appropriate for other pieces that require more reverberance than clarity. The aperture size to produce a double‐sloped decay is thus somewhere between fully closed and fully opened, and it is surprisingly close to the fully closed position. Typically this means openings on the order of only 1% of the total surface area of the room. When the doors are opened to 3%, the double slope may evaporate into an impulse response that approaches the doors‐fully‐opened condition.
Adapted from M. Ermann, “Coupled Volumes: Secondary Room Reverberance and the Double‐Sloped Decay of Concert Halls,” Building Acoustics, September 2005.
Room Acoustics 73
Third, the background noise in coupled‐volume concert halls must be very low. Of course, limit-ing the background noise is an important part of any space for unamplified music listening, but it takes on added importance in coupled‐volume concert halls because if the noise floor is too high, the entire double‐sloped effect is lost beneath the noise level from a nearby road or mechanical equipment or adjacent lobby.
The potential to reconcile the competing qualities of reverberance and clarity, and doing so through spatial and geometrical manipulation, remains alluring. Yet, research fails to show that audiences can detect the double‐sloped decay in stop‐chords. Even more unclear is whether they can detect the double slope in running music—and when listeners can detect the double slope, it is further unresolved as to whether they prefer the double slope to a traditional single‐sloped Sabine decay.
The coupled‐volume approach is but one (albeit the most elaborate one) in a collection of strate-gies that uses a dynamic architecture to vary a room’s acoustic quality. Variable acoustics might provide a means of adapting a space to a specific musical piece, or it might be used to simulate the sound absorptance of an audience during rehearsal when no audience is present, or it might allow architects to tune a room after it is built.
The most common expression of variable acoustics allows for a range of reverberation times. Retractable sound‐absorbing banners or curtains deploy to reduce the RT, or retract to increase it. Alternately, sound‐reflecting panels slide away to reveal a sound‐absorbing or sound‐diffusing panel behind them, and slide back when reflections are preferred instead. Other schemes feature rotating triangular wedges with one side sound reflective, one side sound absorptive, and a third sound diffusive. In each case, the room’s operator or the orchestra conductor decides which type of surface the sound “sees” that evening.
74 Architectural Acoustics Illustrated
Reverberation Time Calculation Checklist1. Recognize what the sound “sees.” If one surface covers another, or almost covers another, you
need only account for the one “visible” surface. In the cafeteria example, the seated students were accounted for in lieu of (rather than in addition to) the 3,000‐square‐foot area of wood floor underneath them. It makes no sense to assume that the banners hanging from the cafete-ria ceiling have an “acoustical” surface area equal to the square footage of material in place. As far as the sound is concerned, the banners appear instead to cover a single surface equal to the area of the ceiling.
2. Approximate when appropriate. Because the cafeteria is not a space for unamplified music listening, precision at early stages of design may be unnecessary. Exit signs, light fixtures, door handles, or other surfaces smaller than a door can typically be omitted in the calculation.
3. Substitute one material for another when required. Manufacturers make sound absorption data available for their products, but in early stages of design, when specific manufacturers have not yet been selected, data for some materials may not be readily available. Even later in design, a material, or an unusual application of a material, may be absent data. In these cases, substitute a material of similar mass, surface texture, and mounting. (What is the weight per square foot? Is there an air space behind, or is it flush‐mounted?)
4. Average the absorption data of two materials if you are uncertain which to use as a substitu-tion. Because of their geometry, sound moving to the ceiling banners typically impinges on more surfaces (and therefore endures more absorption) than sound moving to the wall banners. The banner data available is for the wall‐banner condition, so an average value is used instead for the ceiling: the mean absorption of velour curtains and fabric‐wrapped glass fiber.
5. Be accurate when calculating the room’s volume. While a 10% underestimation of the absorp-tion coefficient of the 5,000 square feet of glass in the cafeteria results in no meaningful change in the calculated reverberation time, a 10% underestimation of the room’s volume erroneously drops the calculated reverberation time from 3.1 seconds to 2.8 seconds.
6. Consider the edges of seating blocks when calculating the area of audience surface. If a block of seated people is exposed to an aisle, include an extra three‐foot strip of audience, the length of the aisle, when estimating the audience’s surface area. This correction accounts for the audi-ence edge portion, visible in elevation, exposed to the room. Audience block edges flush to a wall are not “seen” by the sound energy and needn’t be included. See the diagram in the section “Performance Venue Seats.”
AV Content Online

Room Acoustics 75
Room Shaping for Speech and Music
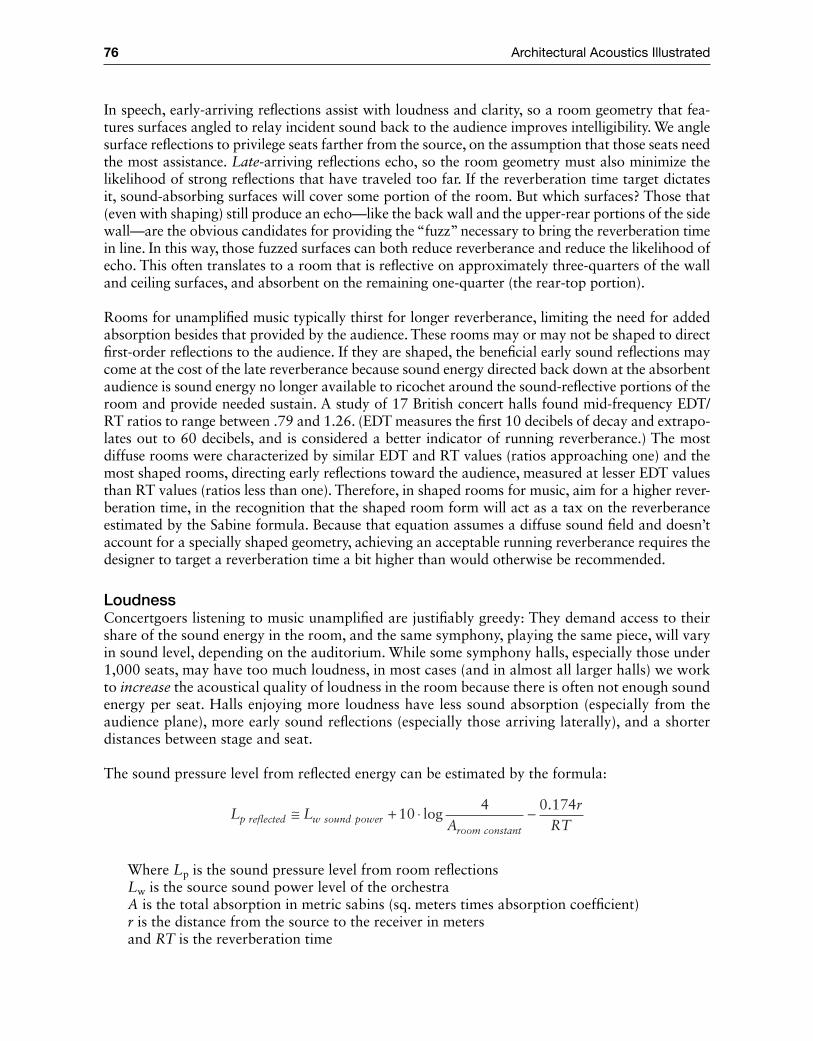
76 Architectural Acoustics Illustrated
In speech, early‐arriving reflections assist with loudness and clarity, so a room geometry that fea-tures surfaces angled to relay incident sound back to the audience improves intelligibility. We angle surface reflections to privilege seats farther from the source, on the assumption that those seats need the most assistance. Late‐arriving reflections echo, so the room geometry must also minimize the likelihood of strong reflections that have traveled too far. If the reverberation time target dictates it, sound‐absorbing surfaces will cover some portion of the room. But which surfaces? Those that (even with shaping) still produce an echo—like the back wall and the upper‐rear portions of the side wall—are the obvious candidates for providing the “fuzz” necessary to bring the reverberation time in line. In this way, those fuzzed surfaces can both reduce reverberance and reduce the likelihood of echo. This often translates to a room that is reflective on approximately three‐quarters of the wall and ceiling surfaces, and absorbent on the remaining one‐quarter (the rear‐top portion).
Rooms for unamplified music typically thirst for longer reverberance, limiting the need for added absorption besides that provided by the audience. These rooms may or may not be shaped to direct first‐order reflections to the audience. If they are shaped, the beneficial early sound reflections may come at the cost of the late reverberance because sound energy directed back down at the absorbent audience is sound energy no longer available to ricochet around the sound‐reflective portions of the room and provide needed sustain. A study of 17 British concert halls found mid‐frequency EDT/RT ratios to range between .79 and 1.26. (EDT measures the first 10 decibels of decay and extrapo-lates out to 60 decibels, and is considered a better indicator of running reverberance.) The most diffuse rooms were characterized by similar EDT and RT values (ratios approaching one) and the most shaped rooms, directing early reflections toward the audience, measured at lesser EDT values than RT values (ratios less than one). Therefore, in shaped rooms for music, aim for a higher rever-beration time, in the recognition that the shaped room form will act as a tax on the reverberance estimated by the Sabine formula. Because that equation assumes a diffuse sound field and doesn’t account for a specially shaped geometry, achieving an acceptable running reverberance requires the designer to target a reverberation time a bit higher than would otherwise be recommended.
LoudnessConcertgoers listening to music unamplified are justifiably greedy: They demand access to their share of the sound energy in the room, and the same symphony, playing the same piece, will vary in sound level, depending on the auditorium. While some symphony halls, especially those under 1,000 seats, may have too much loudness, in most cases (and in almost all larger halls) we work to increase the acoustical quality of loudness in the room because there is often not enough sound energy per seat. Halls enjoying more loudness have less sound absorption (especially from the audience plane), more early sound reflections (especially those arriving laterally), and a shorter distances between stage and seat.
The sound pressure level from reflected energy can be estimated by the formula:
L LA
rRTp reflected w sound power
room constant
≅ + ⋅ −104 0 174
log.
Where Lp is the sound pressure level from room reflectionsLw is the source sound power level of the orchestraA is the total absorption in metric sabins (sq. meters times absorption coefficient)r is the distance from the source to the receiver in metersand RT is the reverberation time
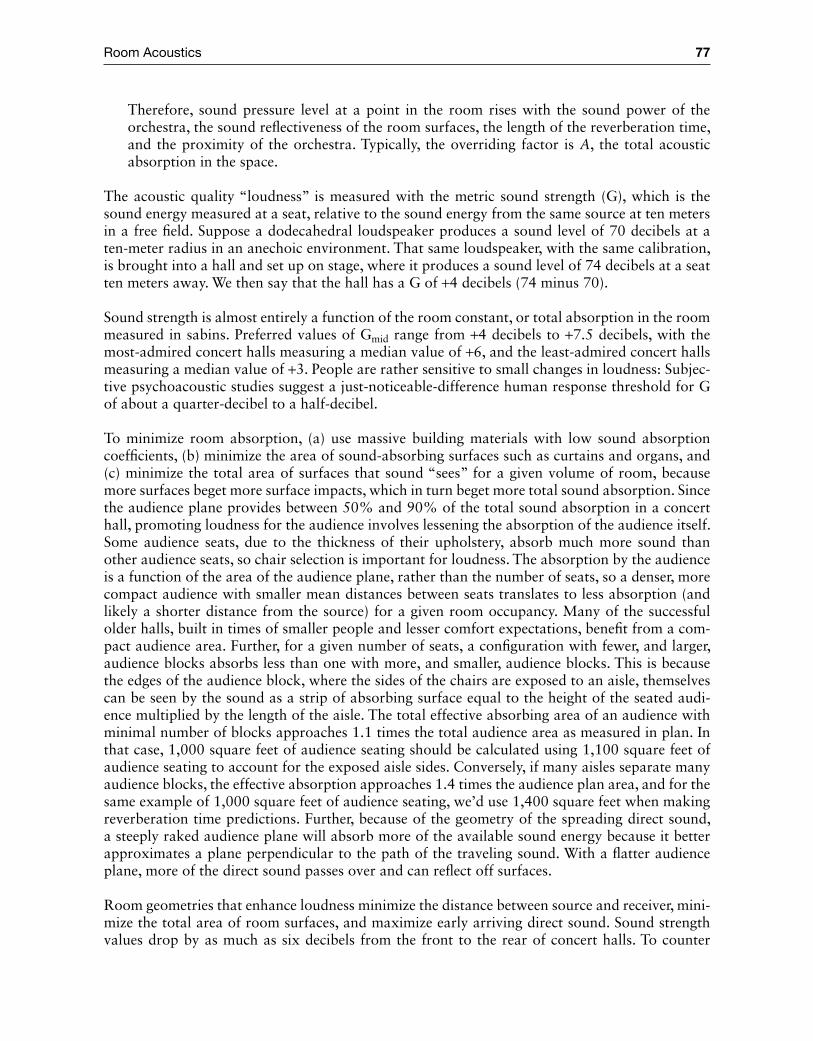
Room Acoustics 77
Therefore, sound pressure level at a point in the room rises with the sound power of the orchestra, the sound reflectiveness of the room surfaces, the length of the reverberation time, and the proximity of the orchestra. Typically, the overriding factor is A, the total acoustic absorption in the space.
The acoustic quality “loudness” is measured with the metric sound strength (G), which is the sound energy measured at a seat, relative to the sound energy from the same source at ten meters in a free field. Suppose a dodecahedral loudspeaker produces a sound level of 70 decibels at a ten‐meter radius in an anechoic environment. That same loudspeaker, with the same calibration, is brought into a hall and set up on stage, where it produces a sound level of 74 decibels at a seat ten meters away. We then say that the hall has a G of +4 decibels (74 minus 70).
Sound strength is almost entirely a function of the room constant, or total absorption in the room measured in sabins. Preferred values of Gmid range from +4 decibels to +7.5 decibels, with the most‐admired concert halls measuring a median value of +6, and the least‐admired concert halls measuring a median value of +3. People are rather sensitive to small changes in loudness: Subjec-tive psychoacoustic studies suggest a just‐noticeable‐difference human response threshold for G of about a quarter‐decibel to a half‐decibel.
To minimize room absorption, (a) use massive building materials with low sound absorption coefficients, (b) minimize the area of sound‐absorbing surfaces such as curtains and organs, and (c) minimize the total area of surfaces that sound “sees” for a given volume of room, because more surfaces beget more surface impacts, which in turn beget more total sound absorption. Since the audience plane provides between 50% and 90% of the total sound absorption in a concert hall, promoting loudness for the audience involves lessening the absorption of the audience itself. Some audience seats, due to the thickness of their upholstery, absorb much more sound than other audience seats, so chair selection is important for loudness. The absorption by the audience is a function of the area of the audience plane, rather than the number of seats, so a denser, more compact audience with smaller mean distances between seats translates to less absorption (and likely a shorter distance from the source) for a given room occupancy. Many of the successful older halls, built in times of smaller people and lesser comfort expectations, benefit from a com-pact audience area. Further, for a given number of seats, a configuration with fewer, and larger, audience blocks absorbs less than one with more, and smaller, audience blocks. This is because the edges of the audience block, where the sides of the chairs are exposed to an aisle, themselves can be seen by the sound as a strip of absorbing surface equal to the height of the seated audi-ence multiplied by the length of the aisle. The total effective absorbing area of an audience with minimal number of blocks approaches 1.1 times the total audience area as measured in plan. In that case, 1,000 square feet of audience seating should be calculated using 1,100 square feet of audience seating to account for the exposed aisle sides. Conversely, if many aisles separate many audience blocks, the effective absorption approaches 1.4 times the audience plan area, and for the same example of 1,000 square feet of audience seating, we’d use 1,400 square feet when making reverberation time predictions. Further, because of the geometry of the spreading direct sound, a steeply raked audience plane will absorb more of the available sound energy because it better approximates a plane perpendicular to the path of the traveling sound. With a flatter audience plane, more of the direct sound passes over and can reflect off surfaces.
Room geometries that enhance loudness minimize the distance between source and receiver, mini-mize the total area of room surfaces, and maximize early arriving direct sound. Sound strength values drop by as much as six decibels from the front to the rear of concert halls. To counter
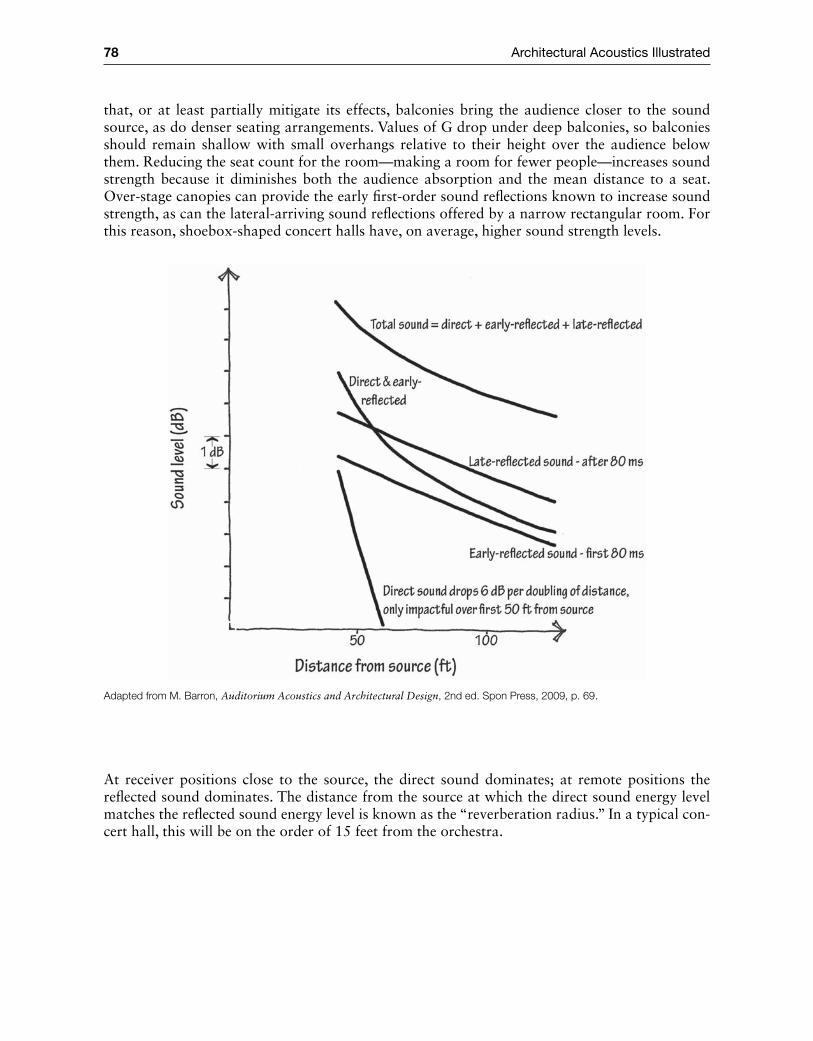
78 Architectural Acoustics Illustrated
that, or at least partially mitigate its effects, balconies bring the audience closer to the sound source, as do denser seating arrangements. Values of G drop under deep balconies, so balconies should remain shallow with small overhangs relative to their height over the audience below them. Reducing the seat count for the room—making a room for fewer people—increases sound strength because it diminishes both the audience absorption and the mean distance to a seat. Over‐stage canopies can provide the early first‐order sound reflections known to increase sound strength, as can the lateral‐arriving sound reflections offered by a narrow rectangular room. For this reason, shoebox‐shaped concert halls have, on average, higher sound strength levels.
Adapted from M. Barron, Auditorium Acoustics and Architectural Design, 2nd ed. Spon Press, 2009, p. 69.
At receiver positions close to the source, the direct sound dominates; at remote positions the reflected sound dominates. The distance from the source at which the direct sound energy level matches the reflected sound energy level is known as the “reverberation radius.” In a typical con-cert hall, this will be on the order of 15 feet from the orchestra.
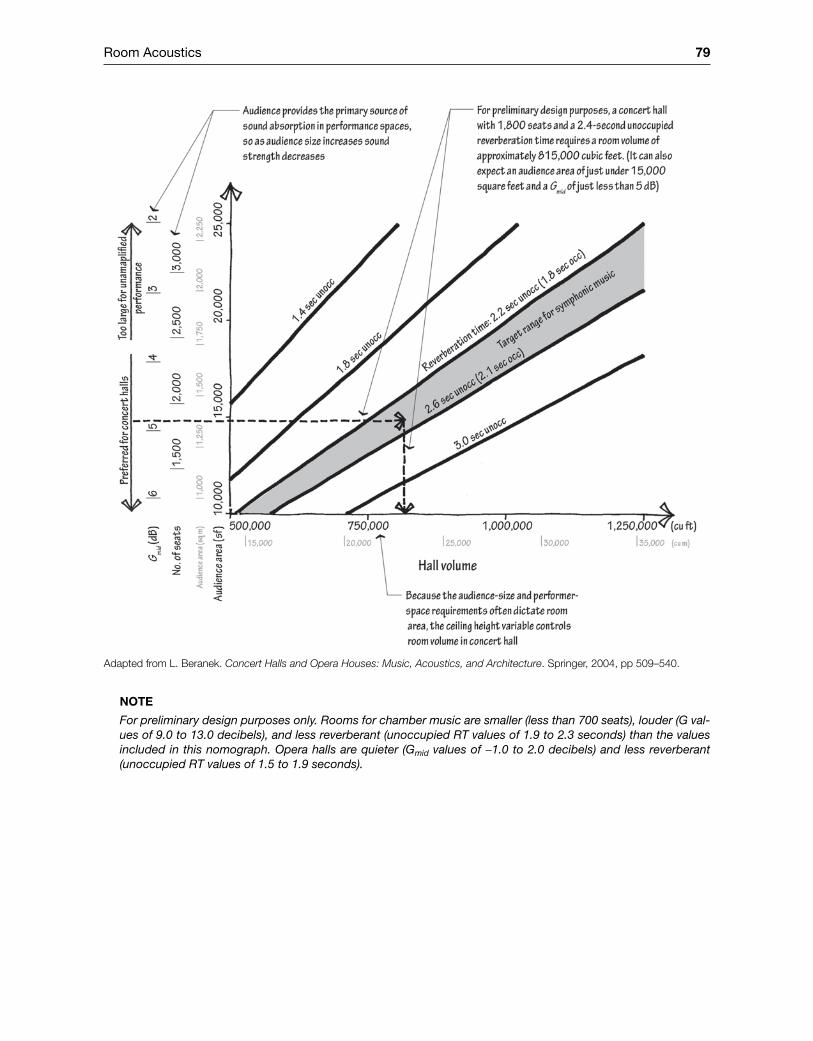
Room Acoustics 79
Note
For preliminary design purposes only. Rooms for chamber music are smaller (less than 700 seats), louder (G val-ues of 9.0 to 13.0 decibels), and less reverberant (unoccupied RT values of 1.9 to 2.3 seconds) than the values included in this nomograph. Opera halls are quieter (Gmid values of -1.0 to 2.0 decibels) and less reverberant (unoccupied RT values of 1.5 to 1.9 seconds).
Adapted from L. Beranek. Concert Halls and Opera Houses: Music, Acoustics, and Architecture. Springer, 2004, pp 509–540.
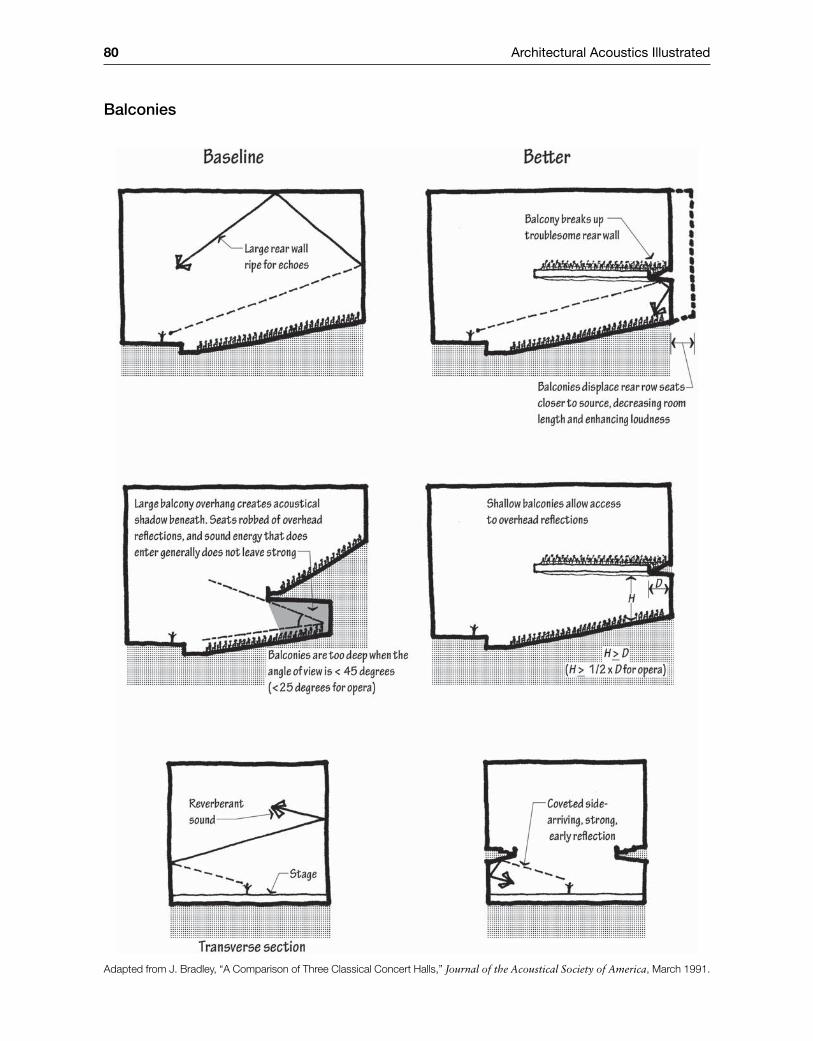
80 Architectural Acoustics Illustrated
Balconies
Adapted from J. Bradley, “A Comparison of Three Classical Concert Halls,” Journal of the Acoustical Society of America, March 1991.
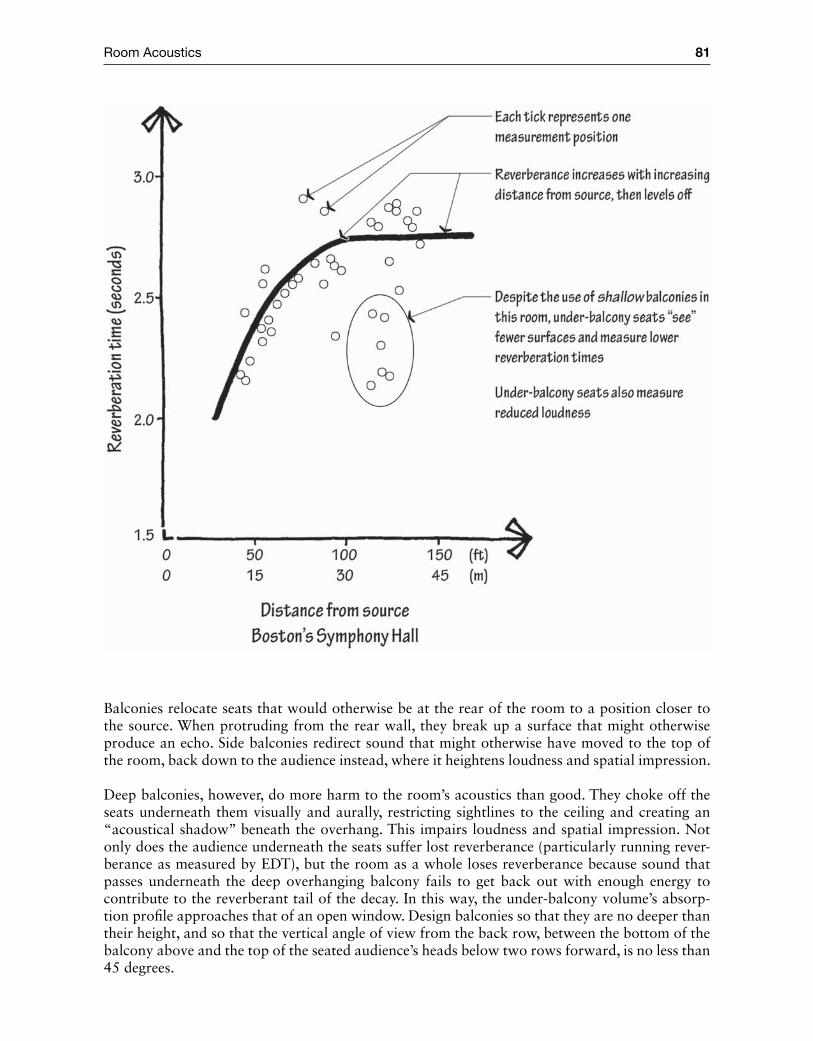
Room Acoustics 81
Balconies relocate seats that would otherwise be at the rear of the room to a position closer to the source. When protruding from the rear wall, they break up a surface that might otherwise produce an echo. Side balconies redirect sound that might otherwise have moved to the top of the room, back down to the audience instead, where it heightens loudness and spatial impression.
Deep balconies, however, do more harm to the room’s acoustics than good. They choke off the seats underneath them visually and aurally, restricting sightlines to the ceiling and creating an “acoustical shadow” beneath the overhang. This impairs loudness and spatial impression. Not only does the audience underneath the seats suffer lost reverberance (particularly running rever-berance as measured by EDT), but the room as a whole loses reverberance because sound that passes underneath the deep overhanging balcony fails to get back out with enough energy to contribute to the reverberant tail of the decay. In this way, the under‐balcony volume’s absorp-tion profile approaches that of an open window. Design balconies so that they are no deeper than their height, and so that the vertical angle of view from the back row, between the bottom of the balcony above and the top of the seated audience’s heads below two rows forward, is no less than 45 degrees.
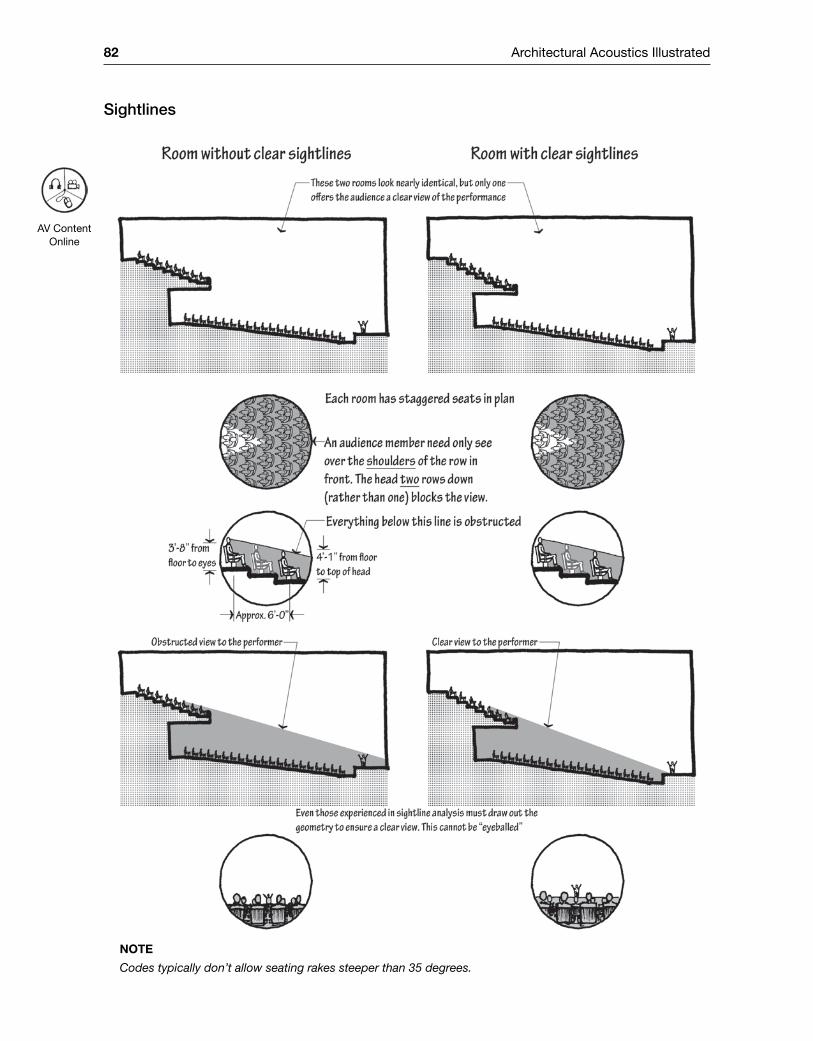
82 Architectural Acoustics Illustrated
Sightlines
Note
Codes typically don’t allow seating rakes steeper than 35 degrees.
AV Content Online
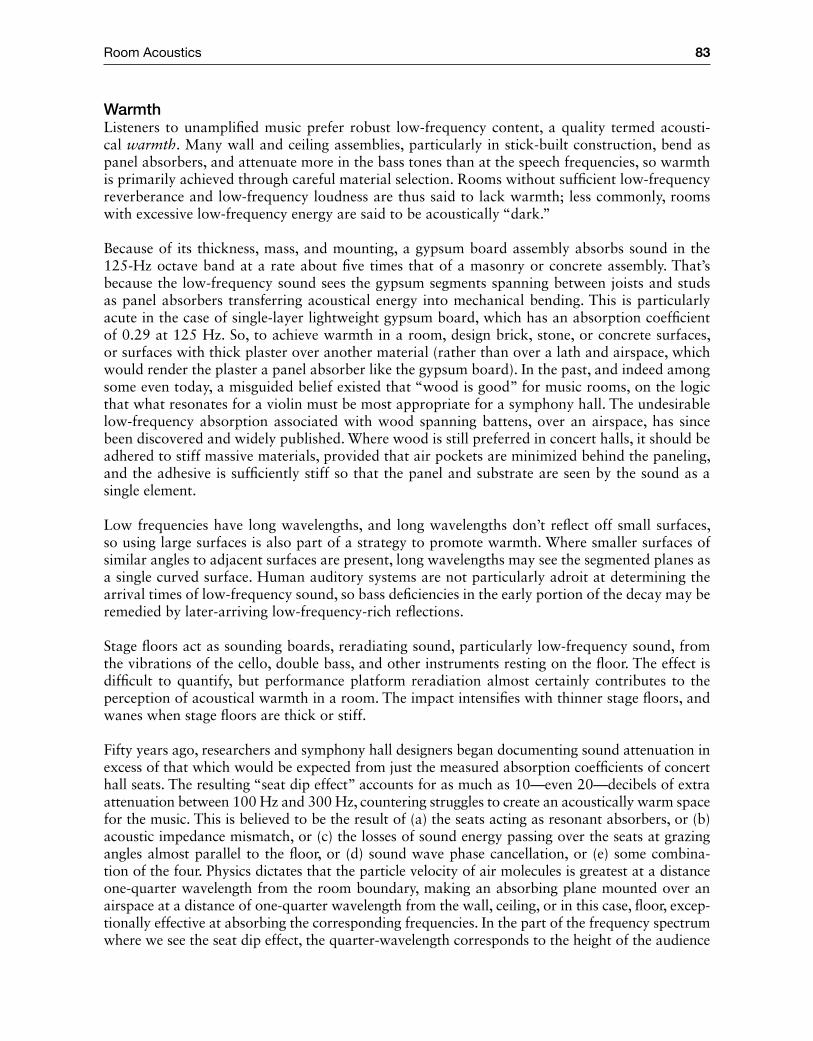
Room Acoustics 83
WarmthListeners to unamplified music prefer robust low‐frequency content, a quality termed acousti-cal warmth. Many wall and ceiling assemblies, particularly in stick‐built construction, bend as panel absorbers, and attenuate more in the bass tones than at the speech frequencies, so warmth is primarily achieved through careful material selection. Rooms without sufficient low‐frequency reverberance and low‐frequency loudness are thus said to lack warmth; less commonly, rooms with excessive low‐frequency energy are said to be acoustically “dark.”
Because of its thickness, mass, and mounting, a gypsum board assembly absorbs sound in the 125‐Hz octave band at a rate about five times that of a masonry or concrete assembly. That’s because the low‐frequency sound sees the gypsum segments spanning between joists and studs as panel absorbers transferring acoustical energy into mechanical bending. This is particularly acute in the case of single‐layer lightweight gypsum board, which has an absorption coefficient of 0.29 at 125 Hz. So, to achieve warmth in a room, design brick, stone, or concrete surfaces, or surfaces with thick plaster over another material (rather than over a lath and airspace, which would render the plaster a panel absorber like the gypsum board). In the past, and indeed among some even today, a misguided belief existed that “wood is good” for music rooms, on the logic that what resonates for a violin must be most appropriate for a symphony hall. The undesirable low‐frequency absorption associated with wood spanning battens, over an airspace, has since been discovered and widely published. Where wood is still preferred in concert halls, it should be adhered to stiff massive materials, provided that air pockets are minimized behind the paneling, and the adhesive is sufficiently stiff so that the panel and substrate are seen by the sound as a single element.
Low frequencies have long wavelengths, and long wavelengths don’t reflect off small surfaces, so using large surfaces is also part of a strategy to promote warmth. Where smaller surfaces of similar angles to adjacent surfaces are present, long wavelengths may see the segmented planes as a single curved surface. Human auditory systems are not particularly adroit at determining the arrival times of low‐frequency sound, so bass deficiencies in the early portion of the decay may be remedied by later‐arriving low‐frequency‐rich reflections.
Stage floors act as sounding boards, reradiating sound, particularly low‐frequency sound, from the vibrations of the cello, double bass, and other instruments resting on the floor. The effect is difficult to quantify, but performance platform reradiation almost certainly contributes to the perception of acoustical warmth in a room. The impact intensifies with thinner stage floors, and wanes when stage floors are thick or stiff.
Fifty years ago, researchers and symphony hall designers began documenting sound attenuation in excess of that which would be expected from just the measured absorption coefficients of concert hall seats. The resulting “seat dip effect” accounts for as much as 10—even 20—decibels of extra attenuation between 100 Hz and 300 Hz, countering struggles to create an acoustically warm space for the music. This is believed to be the result of (a) the seats acting as resonant absorbers, or (b) acoustic impedance mismatch, or (c) the losses of sound energy passing over the seats at grazing angles almost parallel to the floor, or (d) sound wave phase cancellation, or (e) some combina-tion of the four. Physics dictates that the particle velocity of air molecules is greatest at a distance one‐ quarter wavelength from the room boundary, making an absorbing plane mounted over an airspace at a distance of one‐quarter wavelength from the wall, ceiling, or in this case, floor, excep-tionally effective at absorbing the corresponding frequencies. In the part of the frequency spectrum where we see the seat dip effect, the quarter‐wavelength corresponds to the height of the audience
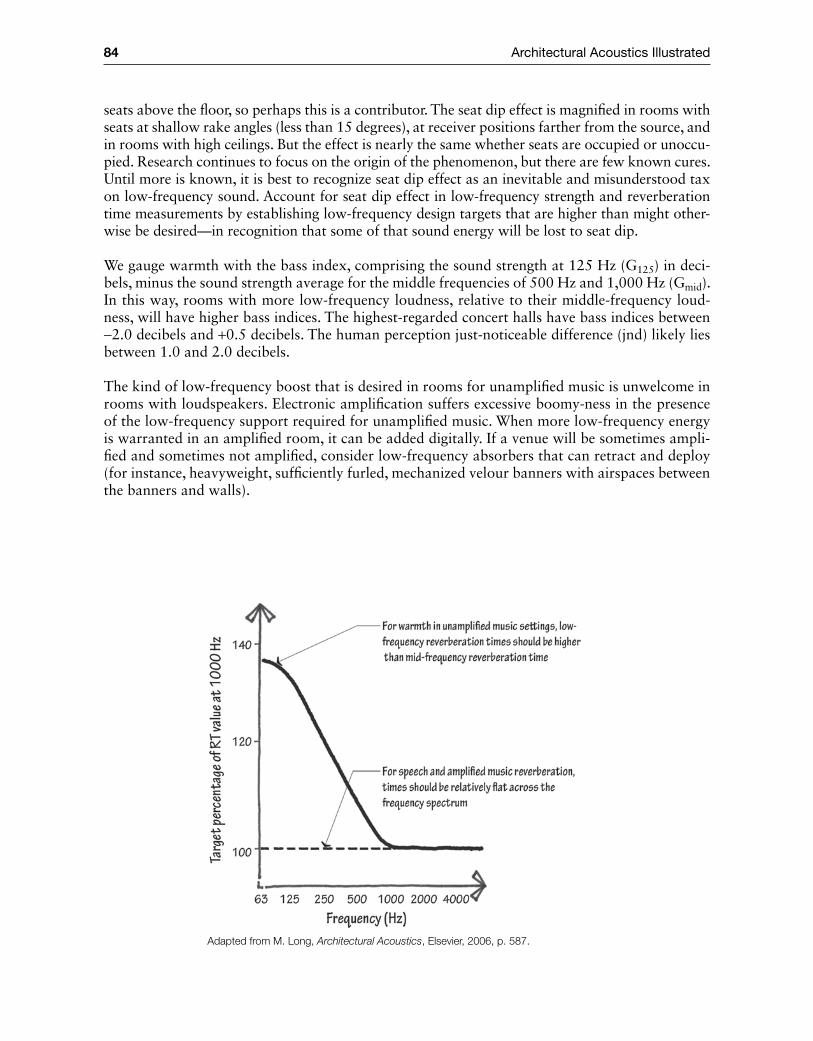
84 Architectural Acoustics Illustrated
seats above the floor, so perhaps this is a contributor. The seat dip effect is magnified in rooms with seats at shallow rake angles (less than 15 degrees), at receiver positions farther from the source, and in rooms with high ceilings. But the effect is nearly the same whether seats are occupied or unoccu-pied. Research continues to focus on the origin of the phenomenon, but there are few known cures. Until more is known, it is best to recognize seat dip effect as an inevitable and misunderstood tax on low‐frequency sound. Account for seat dip effect in low‐frequency strength and reverberation time measurements by establishing low‐frequency design targets that are higher than might other-wise be desired—in recognition that some of that sound energy will be lost to seat dip.
We gauge warmth with the bass index, comprising the sound strength at 125 Hz (G125) in deci-bels, minus the sound strength average for the middle frequencies of 500 Hz and 1,000 Hz (Gmid). In this way, rooms with more low‐frequency loudness, relative to their middle‐frequency loud-ness, will have higher bass indices. The highest‐regarded concert halls have bass indices between -2.0 decibels and +0.5 decibels. The human perception just‐noticeable difference (jnd) likely lies between 1.0 and 2.0 decibels.
The kind of low‐frequency boost that is desired in rooms for unamplified music is unwelcome in rooms with loudspeakers. Electronic amplification suffers excessive boomy‐ness in the presence of the low‐frequency support required for unamplified music. When more low‐frequency energy is warranted in an amplified room, it can be added digitally. If a venue will be sometimes ampli-fied and sometimes not amplified, consider low‐frequency absorbers that can retract and deploy (for instance, heavyweight, sufficiently furled, mechanized velour banners with airspaces between the banners and walls).
Adapted from M. Long, Architectural Acoustics, Elsevier, 2006, p. 587.
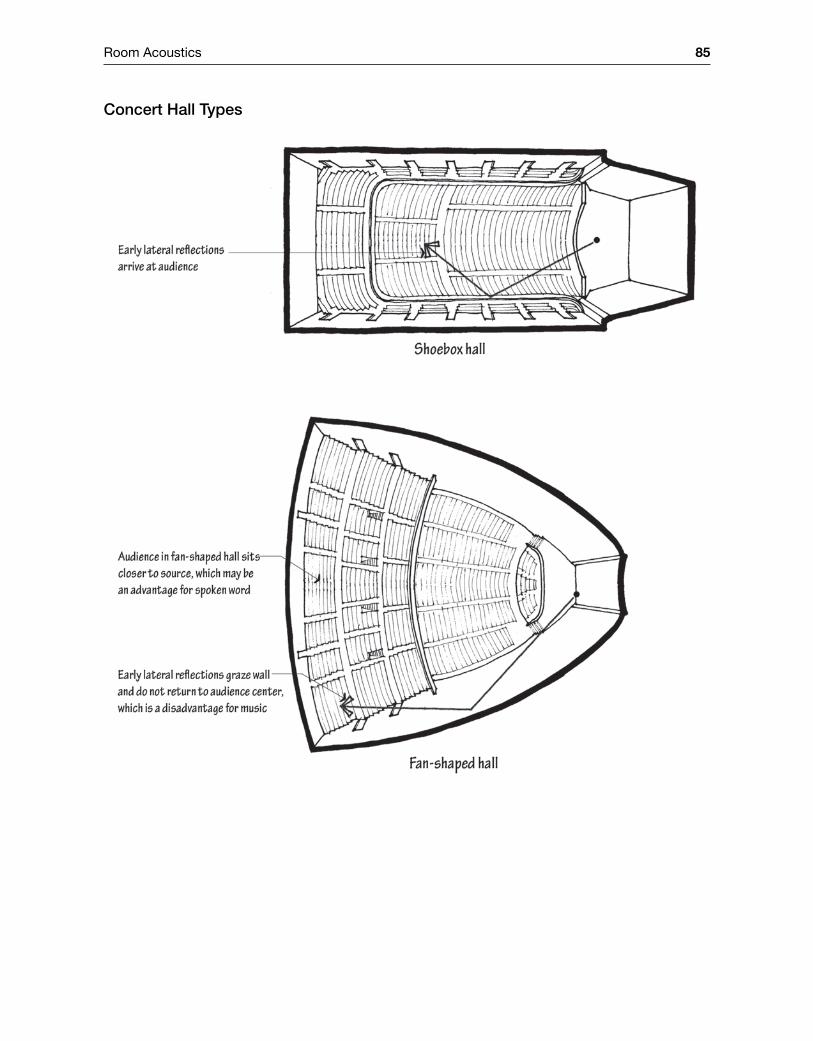
Room Acoustics 85
Concert Hall Types
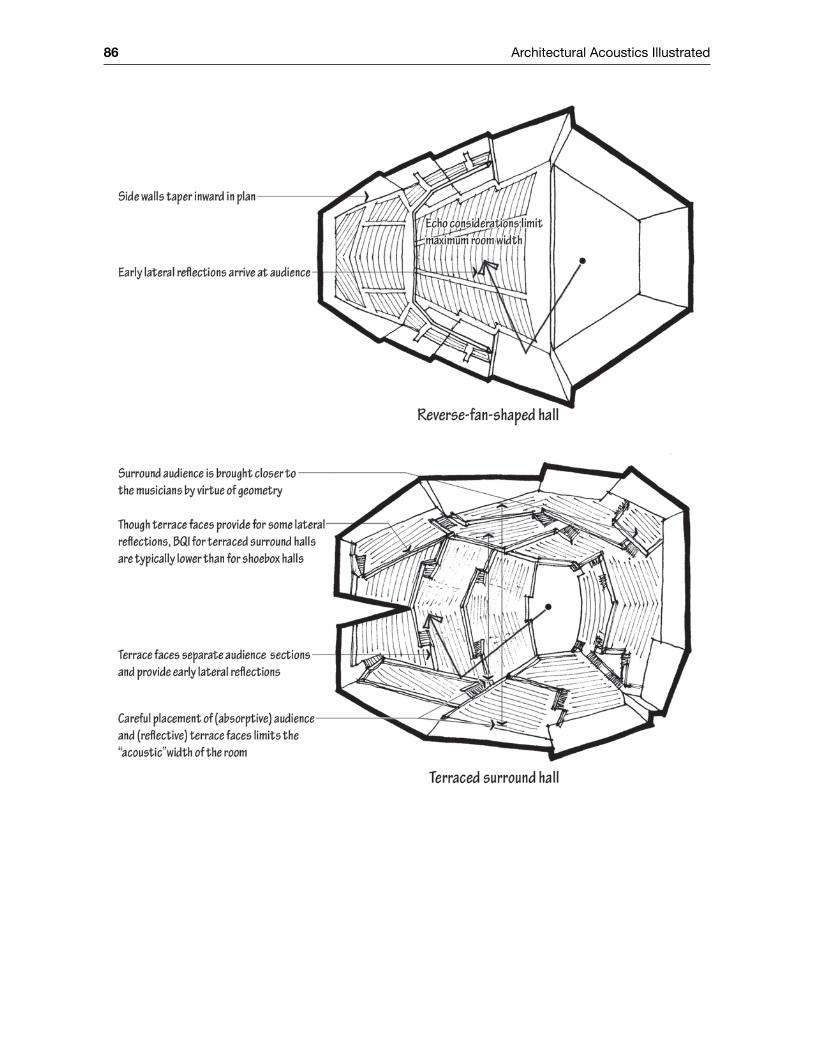
86 Architectural Acoustics Illustrated
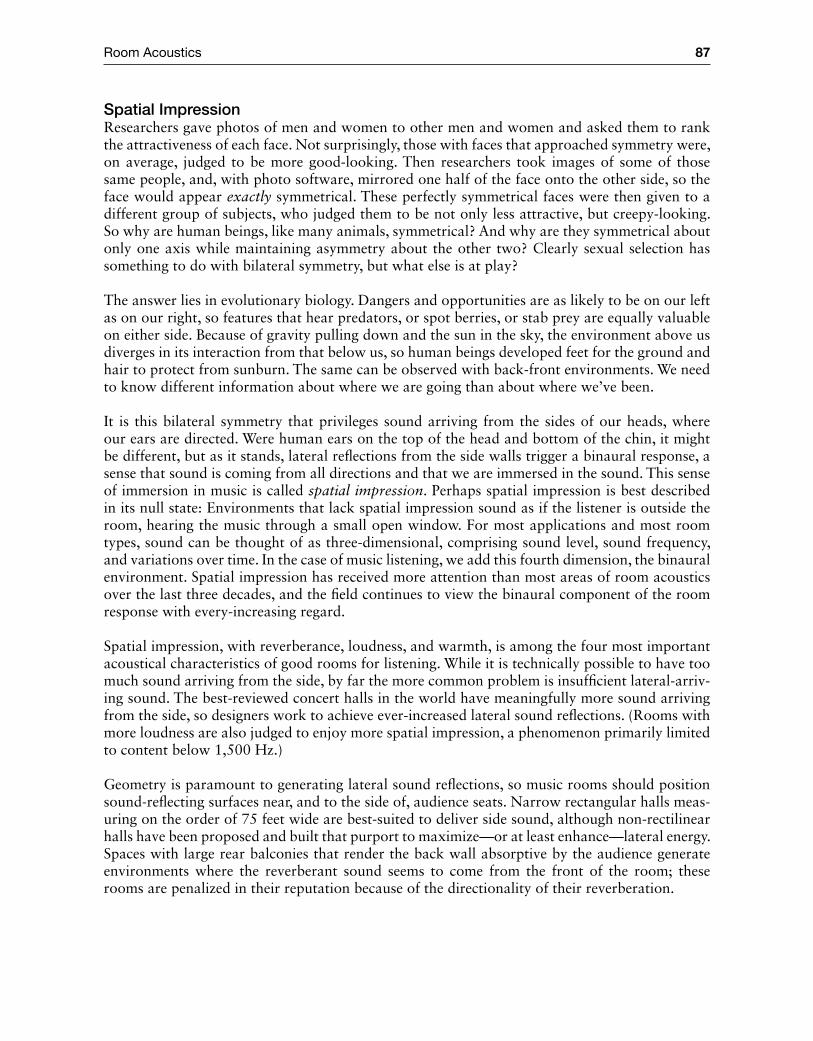
Room Acoustics 87
Spatial ImpressionResearchers gave photos of men and women to other men and women and asked them to rank the attractiveness of each face. Not surprisingly, those with faces that approached symmetry were, on average, judged to be more good‐looking. Then researchers took images of some of those same people, and, with photo software, mirrored one half of the face onto the other side, so the face would appear exactly symmetrical. These perfectly symmetrical faces were then given to a different group of subjects, who judged them to be not only less attractive, but creepy‐looking. So why are human beings, like many animals, symmetrical? And why are they symmetrical about only one axis while maintaining asymmetry about the other two? Clearly sexual selection has something to do with bilateral symmetry, but what else is at play?
The answer lies in evolutionary biology. Dangers and opportunities are as likely to be on our left as on our right, so features that hear predators, or spot berries, or stab prey are equally valuable on either side. Because of gravity pulling down and the sun in the sky, the environment above us diverges in its interaction from that below us, so human beings developed feet for the ground and hair to protect from sunburn. The same can be observed with back‐front environments. We need to know different information about where we are going than about where we’ve been.
It is this bilateral symmetry that privileges sound arriving from the sides of our heads, where our ears are directed. Were human ears on the top of the head and bottom of the chin, it might be different, but as it stands, lateral reflections from the side walls trigger a binaural response, a sense that sound is coming from all directions and that we are immersed in the sound. This sense of immersion in music is called spatial impression. Perhaps spatial impression is best described in its null state: Environments that lack spatial impression sound as if the listener is outside the room, hearing the music through a small open window. For most applications and most room types, sound can be thought of as three‐dimensional, comprising sound level, sound frequency, and variations over time. In the case of music listening, we add this fourth dimension, the binaural environment. Spatial impression has received more attention than most areas of room acoustics over the last three decades, and the field continues to view the binaural component of the room response with every‐increasing regard.
Spatial impression, with reverberance, loudness, and warmth, is among the four most important acoustical characteristics of good rooms for listening. While it is technically possible to have too much sound arriving from the side, by far the more common problem is insufficient lateral‐arriv-ing sound. The best‐reviewed concert halls in the world have meaningfully more sound arriving from the side, so designers work to achieve ever‐increased lateral sound reflections. (Rooms with more loudness are also judged to enjoy more spatial impression, a phenomenon primarily limited to content below 1,500 Hz.)
Geometry is paramount to generating lateral sound reflections, so music rooms should position sound‐reflecting surfaces near, and to the side of, audience seats. Narrow rectangular halls meas-uring on the order of 75 feet wide are best‐suited to deliver side sound, although non‐rectilinear halls have been proposed and built that purport to maximize—or at least enhance—lateral energy. Spaces with large rear balconies that render the back wall absorptive by the audience generate environments where the reverberant sound seems to come from the front of the room; these rooms are penalized in their reputation because of the directionality of their reverberation.

88 Architectural Acoustics Illustrated
Adapted from T. Hanyu and S. Kimura, “A New Objective Measure for Evaluation of Listener Envelopment Focusing on the Spatial Balance of Reflections,” Applied Acoustics, February 2001.
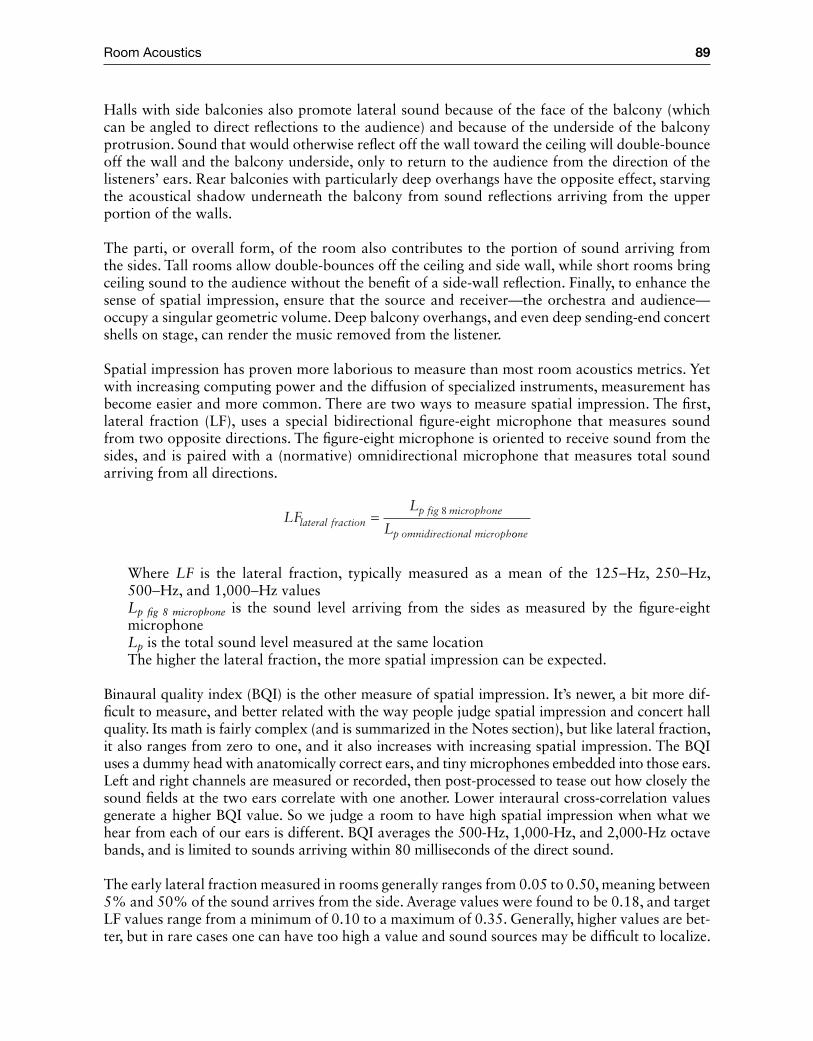
Room Acoustics 89
Halls with side balconies also promote lateral sound because of the face of the balcony (which can be angled to direct reflections to the audience) and because of the underside of the balcony protrusion. Sound that would otherwise reflect off the wall toward the ceiling will double‐bounce off the wall and the balcony underside, only to return to the audience from the direction of the listeners’ ears. Rear balconies with particularly deep overhangs have the opposite effect, starving the acoustical shadow underneath the balcony from sound reflections arriving from the upper portion of the walls.
The parti, or overall form, of the room also contributes to the portion of sound arriving from the sides. Tall rooms allow double‐bounces off the ceiling and side wall, while short rooms bring ceiling sound to the audience without the benefit of a side‐wall reflection. Finally, to enhance the sense of spatial impression, ensure that the source and receiver—the orchestra and audience—occupy a singular geometric volume. Deep balcony overhangs, and even deep sending‐end concert shells on stage, can render the music removed from the listener.
Spatial impression has proven more laborious to measure than most room acoustics metrics. Yet with increasing computing power and the diffusion of specialized instruments, measurement has become easier and more common. There are two ways to measure spatial impression. The first, lateral fraction (LF), uses a special bidirectional figure‐eight microphone that measures sound from two opposite directions. The figure‐eight microphone is oriented to receive sound from the sides, and is paired with a (normative) omnidirectional microphone that measures total sound arriving from all directions.
LFL
Llateral fractionp fig microphone
p omnidirectional microph
= 8
oone
Where LF is the lateral fraction, typically measured as a mean of the 125-Hz, 250-Hz, 500-Hz, and 1,000-Hz valuesLp fig 8 microphone is the sound level arriving from the sides as measured by the figure‐eight microphoneLp is the total sound level measured at the same locationThe higher the lateral fraction, the more spatial impression can be expected.
Binaural quality index (BQI) is the other measure of spatial impression. It’s newer, a bit more dif-ficult to measure, and better related with the way people judge spatial impression and concert hall quality. Its math is fairly complex (and is summarized in the Notes section), but like lateral fraction, it also ranges from zero to one, and it also increases with increasing spatial impression. The BQI uses a dummy head with anatomically correct ears, and tiny microphones embedded into those ears. Left and right channels are measured or recorded, then post‐processed to tease out how closely the sound fields at the two ears correlate with one another. Lower interaural cross‐correlation values generate a higher BQI value. So we judge a room to have high spatial impression when what we hear from each of our ears is different. BQI averages the 500‐Hz, 1,000‐Hz, and 2,000‐Hz octave bands, and is limited to sounds arriving within 80 milliseconds of the direct sound.
The early lateral fraction measured in rooms generally ranges from 0.05 to 0.50, meaning between 5% and 50% of the sound arrives from the side. Average values were found to be 0.18, and target LF values range from a minimum of 0.10 to a maximum of 0.35. Generally, higher values are bet-ter, but in rare cases one can have too high a value and sound sources may be difficult to localize.
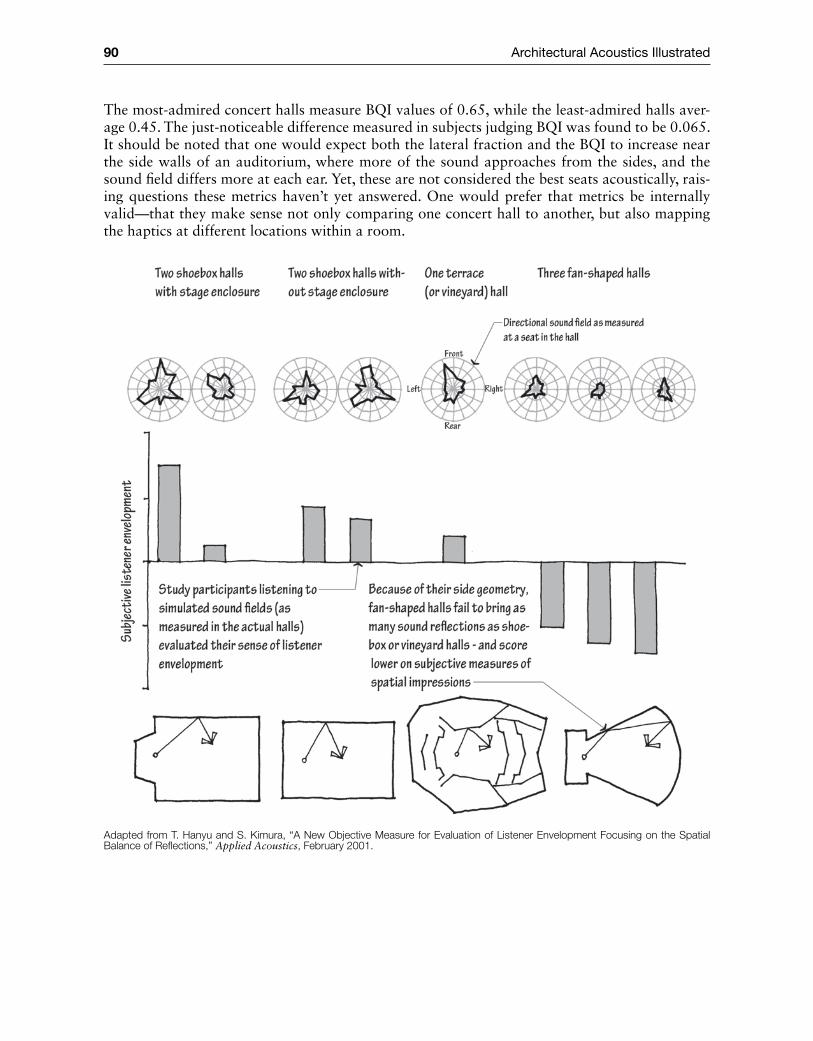
90 Architectural Acoustics Illustrated
The most‐admired concert halls measure BQI values of 0.65, while the least‐admired halls aver-age 0.45. The just‐noticeable difference measured in subjects judging BQI was found to be 0.065. It should be noted that one would expect both the lateral fraction and the BQI to increase near the side walls of an auditorium, where more of the sound approaches from the sides, and the sound field differs more at each ear. Yet, these are not considered the best seats acoustically, rais-ing questions these metrics haven’t yet answered. One would prefer that metrics be internally valid—that they make sense not only comparing one concert hall to another, but also mapping the haptics at different locations within a room.
Adapted from T. Hanyu and S. Kimura, “A New Objective Measure for Evaluation of Listener Envelopment Focusing on the Spatial Balance of Reflections,” Applied Acoustics, February 2001.
Room Acoustics 91
Until now in this chapter, the discussion of spatial impression has been covered as a singular topic. But recent research has teased out two very separate phenomena nested under the binaural umbrella of spatial impression, each separated from the other temporally. Early lateral reflec-tions arriving within the 80‐millisecond threshold after the direct sound arrives contribute to a quality known as apparent source width (ASW); late lateral reflections arriving after the 80‐mil-lisecond threshold contribute to a quality known as listener envelopment (LEV). Before 1960 it was believed that the late sound was most important. Between the 1960s and late 1980s, it was believed that the early sound was paramount. The current consensus is that both early and late sound are important, but differ in their effects.
A broad apparent source width (the early side‐arriving sound, also called auditory spaciousness or source broadening) gives listeners the sense that they and the orchestra occupy the same space, and that the orchestra is playing together as an ensemble. It is measured by the lateral fraction taken over the first 80 milliseconds, or by the BQI (which always measures the first 80 millisec-onds). The later sound represented by listener envelopment is heavily influenced by the late lateral loudness (GLL), although over time the direction of successive wave fronts becomes ever more omnidirectional. Because late sound level is heavily dependent on total room absorption, and total room absorption for concert halls is heavily dependent on audience area, music rooms with small audience areas enjoy high levels of listener envelopment. Measures of the lateral fraction after 80 milliseconds and measures of interaural cross‐correlation after 80 milliseconds are used to quantify listener envelopment.
Note
Binaural quality index (BQI) is equal to 1 – IACC, where IACC is the interaural cross‐correlation, a measure of the maximum difference in the sounds at the ears produced by a sound source on the stage. To calculate IACC, start with the interaural cross‐correlation function
IACF T p t p t dt p dt p dtt t
tL R t
tL t
tR( ) [ ( ) ( ) ] / [= ∫ + ∫ ∫
1
2
1
2
1
22 2τ where pL and pR are the sound pressures at the left and right
ears, and τ is varied over the range of -1 to +1 to account for the approximately 1 millisecond required for sound to pass from one side of the head to the other. Then interaural cross‐correlation (IACCt) is equal to IACFt τ( ) max for -1 < τ < +1.
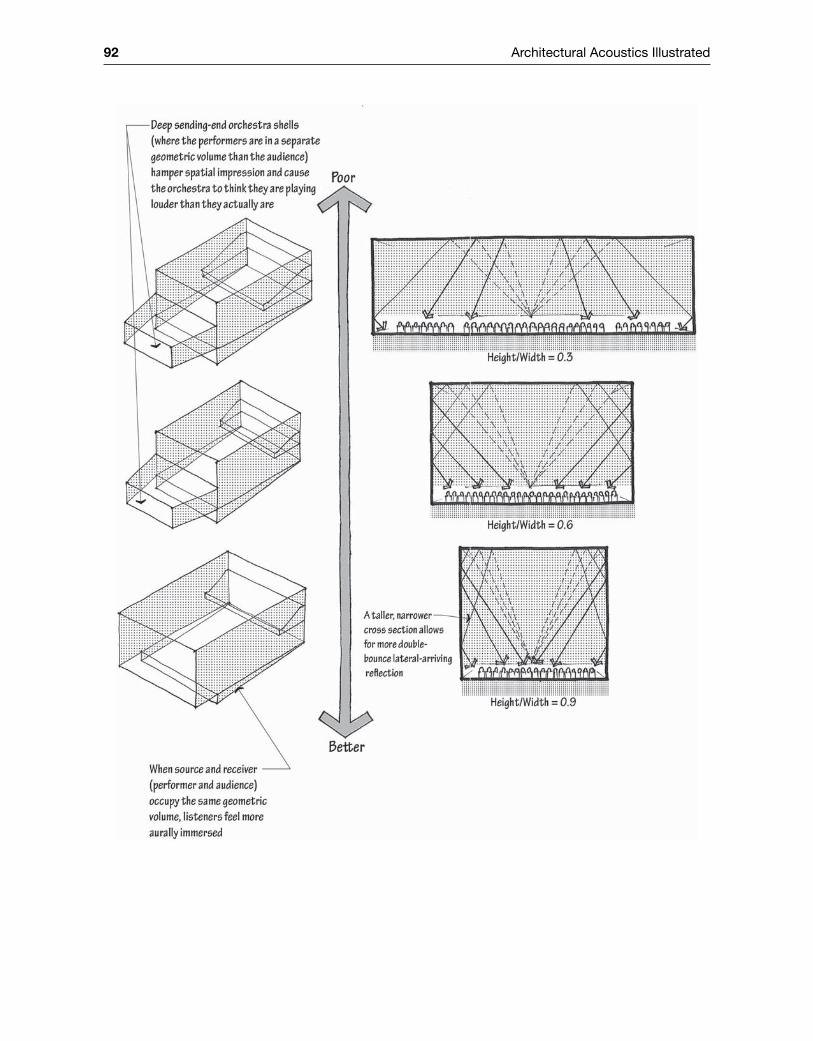
92 Architectural Acoustics Illustrated
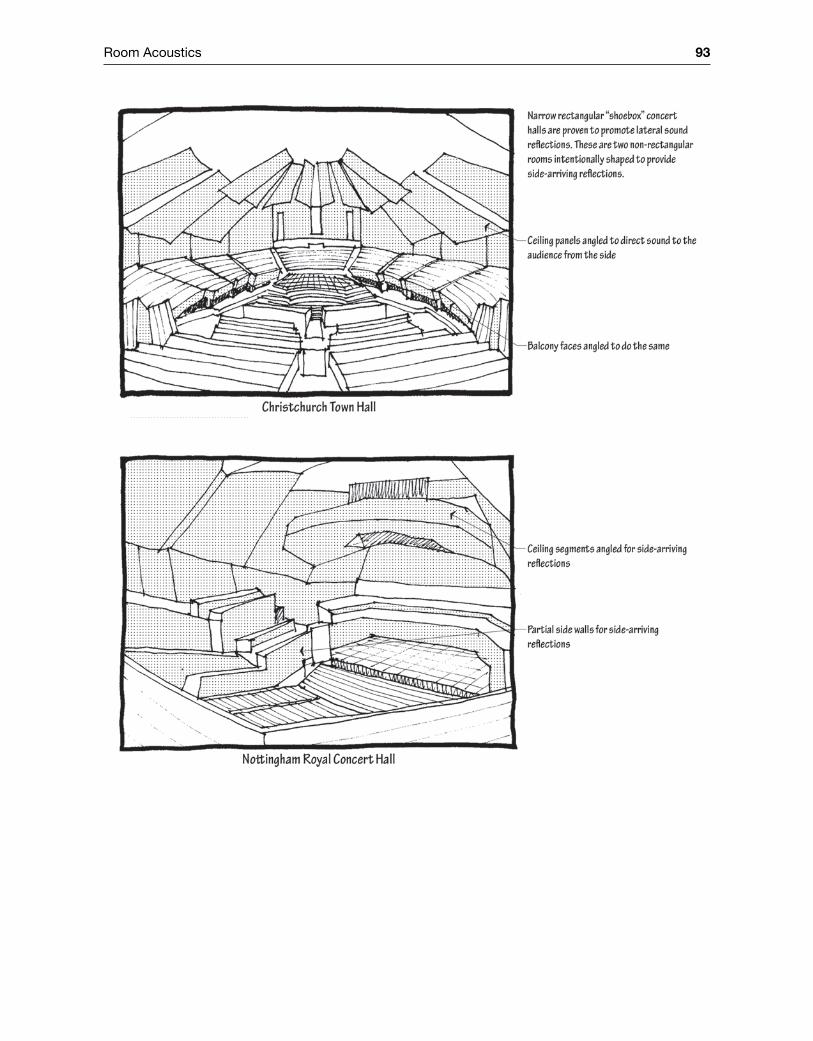
Room Acoustics 93
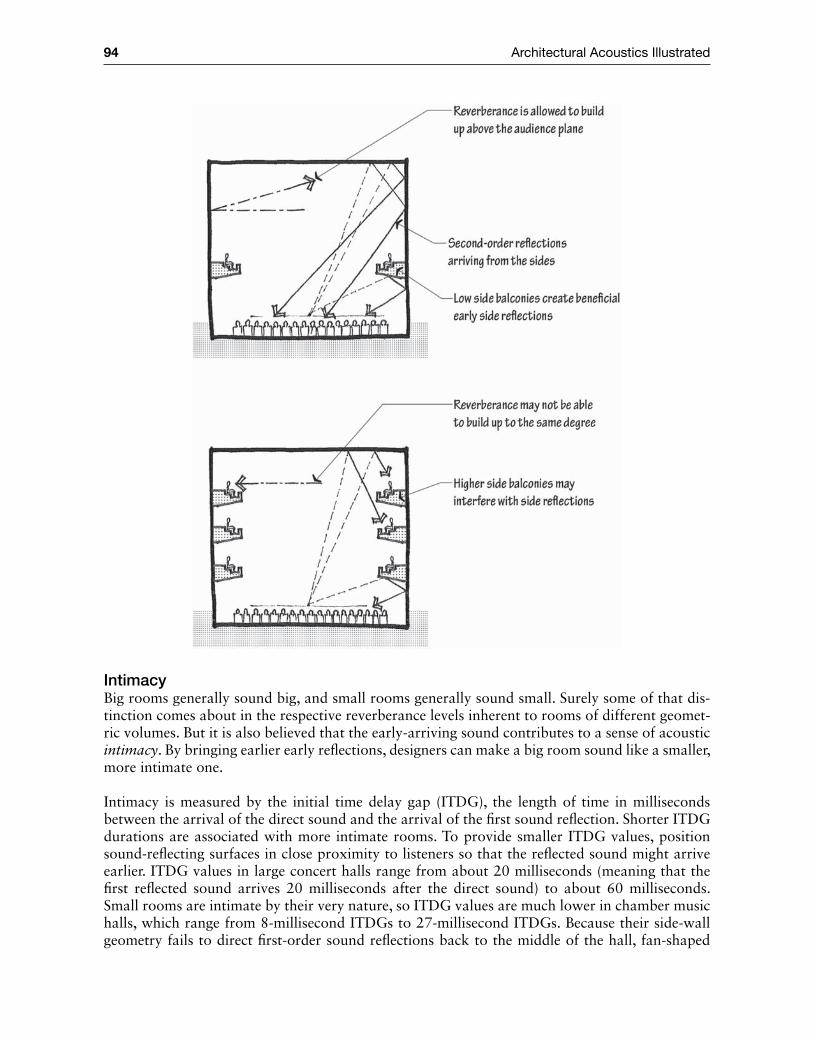
94 Architectural Acoustics Illustrated
IntimacyBig rooms generally sound big, and small rooms generally sound small. Surely some of that dis-tinction comes about in the respective reverberance levels inherent to rooms of different geomet-ric volumes. But it is also believed that the early‐arriving sound contributes to a sense of acoustic intimacy. By bringing earlier early reflections, designers can make a big room sound like a smaller, more intimate one.
Intimacy is measured by the initial time delay gap (ITDG), the length of time in milliseconds between the arrival of the direct sound and the arrival of the first sound reflection. Shorter ITDG durations are associated with more intimate rooms. To provide smaller ITDG values, position sound‐reflecting surfaces in close proximity to listeners so that the reflected sound might arrive earlier. ITDG values in large concert halls range from about 20 milliseconds (meaning that the first reflected sound arrives 20 milliseconds after the direct sound) to about 60 milliseconds. Small rooms are intimate by their very nature, so ITDG values are much lower in chamber music halls, which range from 8‐millisecond ITDGs to 27‐millisecond ITDGs. Because their side‐wall geometry fails to direct first‐order sound reflections back to the middle of the hall, fan‐shaped
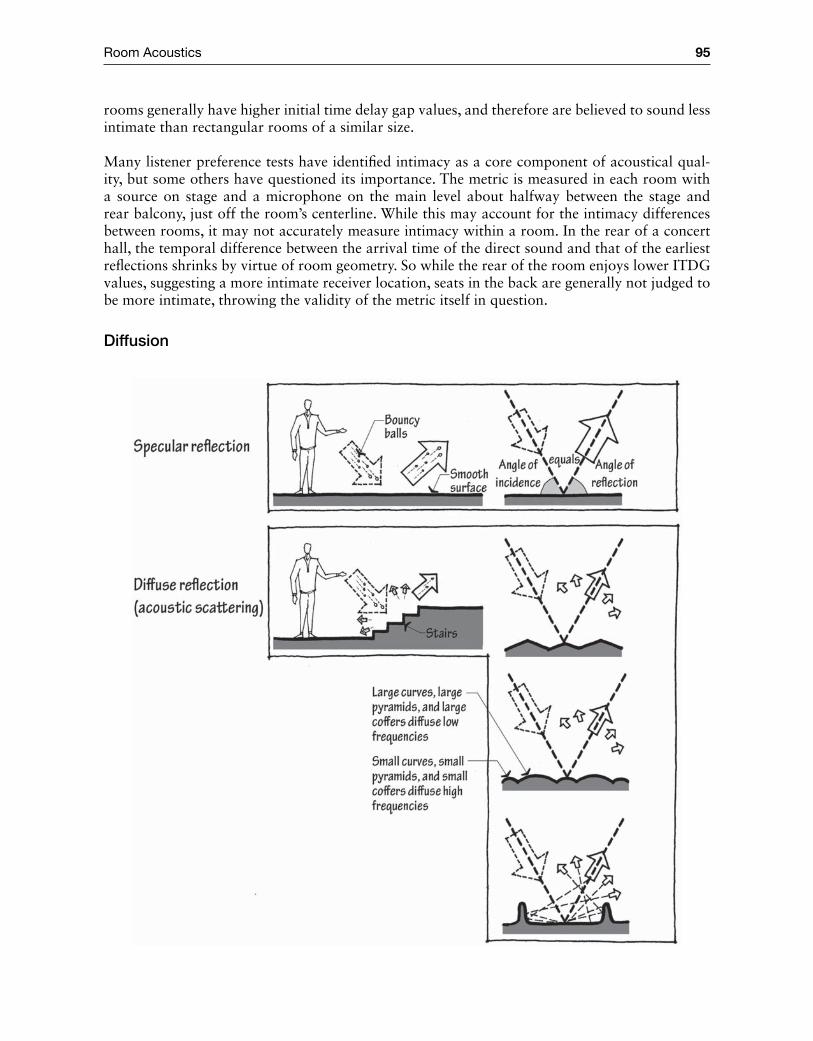
Room Acoustics 95
rooms generally have higher initial time delay gap values, and therefore are believed to sound less intimate than rectangular rooms of a similar size.
Many listener preference tests have identified intimacy as a core component of acoustical qual-ity, but some others have questioned its importance. The metric is measured in each room with a source on stage and a microphone on the main level about halfway between the stage and rear balcony, just off the room’s centerline. While this may account for the intimacy differences between rooms, it may not accurately measure intimacy within a room. In the rear of a concert hall, the temporal difference between the arrival time of the direct sound and that of the earliest reflections shrinks by virtue of room geometry. So while the rear of the room enjoys lower ITDG values, suggesting a more intimate receiver location, seats in the back are generally not judged to be more intimate, throwing the validity of the metric itself in question.
Diffusion
96 Architectural Acoustics Illustrated
In a “specular sound reflection,” the angle of incident sound equals the angle of reflected sound. Think of a billiard ball ricocheting off the rail of a billiard table, or light reflecting from a clean mirror. In diffuse sound reflections, or scattering, the sound behaves more like light reflecting from a fogged mirror, dispersing the reflected sound over a wider area. Most materials provide both specular and diffuse reflections; the proportion of specular and diffuse reflections differenti-ates surfaces. To effectively scatter reflected sound, the degree of texturing must be high; slight variations and modest curves produce slight and modest scattering effects. The deeper the tex-tured surface, the lower the frequency diffused, so coffers or projections should extend at least one‐quarter wavelength (one to two feet deep) to diffuse appropriately across the frequency spec-trum. By breaking up and scattering sound reflections, diffusing surfaces can mitigate a wall or ceiling that might otherwise generate echo, flutter echo, acoustic glare, sound focusing, or acous-tic creep. This is especially useful when treating an acoustic defect (and the surface that causes it) with absorption might deprive the space of needed reverberance.
Even in the absence of a major acoustic defect, diffusion may be beneficial to rooms for music listening. Every great concert hall maintains a high degree of diffusing surfaces to homogenize the sound across the listening locations, staving off harsh reflections that can make the sound “brittle.” Studies of chamber music and opera venues also suggest the need for diffusion. As with optical glare, a collection of hard, flat, and large surfaces can deliver a severe, unforgiving aural environment. Specular sound reflections from large surfaces devoid of diffusing texture may also cause an image shift, whereby the listener perceives the source to emanate from somewhere between the true source location and the location of the harsh reflecting surface. The human audi-tory system exaggerates this effect with reflections from the overhead plane, relative to those that arrive laterally. (Image shift is also notorious in spaces with electronic amplification, where the loudspeaker’s sound may arrive both stronger and earlier than that from the source.)
The type of reflection from a surface depends on the length of the surface relative to the length of the incident sound wavelength. So diffusing surfaces of repeated regular elements, equal in length, may favor reflections in one frequency over those of another. This can cause a shift in the perceived frequency of the reflected sound called “tone coloration,” which sounds like a fre-quency shift in the direction of a more shrill, almost metallic timbre. While this is often subtle, it is audible to the discerning music listener, and it can be avoided by varying the size of diffusing surfaces throughout the room.
The usefulness of craggy surfaces for mitigating an acoustic defect is not in question, but the importance of scattering as a best practice to “spread out” the reflected sound in music rooms without known defects has been debated for decades without a settled consensus. Many believe that scattering is very important to room acoustics for symphonic music (and many do not).
Note
The scattering coefficient has been developed to quantify the amount of scattering a surface produces. It varies between zero and one, and measures the proportion of reflected sound that is scattered. This is especially useful in acoustical modeling software. To date, obtaining scattering coefficient values for building materials has been more difficult than finding published absorption coefficients for those same materials.
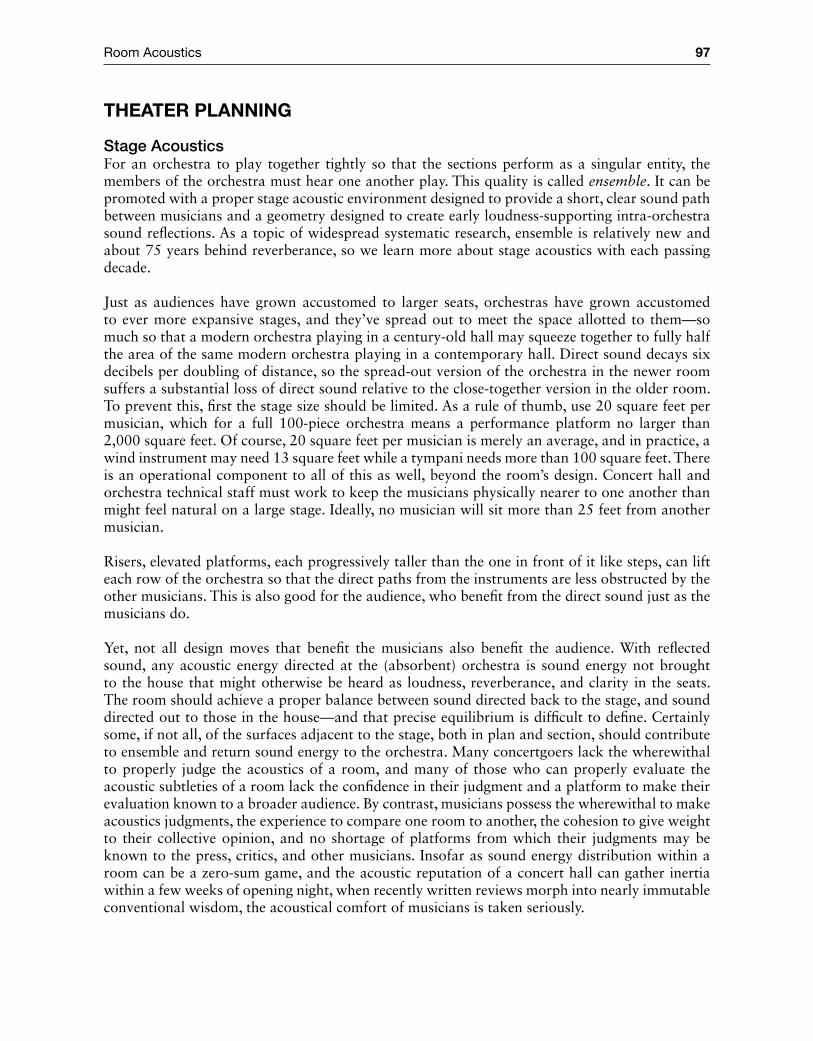
Room Acoustics 97
theAteR PlANNiNg
Stage AcousticsFor an orchestra to play together tightly so that the sections perform as a singular entity, the members of the orchestra must hear one another play. This quality is called ensemble. It can be promoted with a proper stage acoustic environment designed to provide a short, clear sound path between musicians and a geometry designed to create early loudness‐supporting intra‐orchestra sound reflections. As a topic of widespread systematic research, ensemble is relatively new and about 75 years behind reverberance, so we learn more about stage acoustics with each passing decade.
Just as audiences have grown accustomed to larger seats, orchestras have grown accustomed to ever more expansive stages, and they’ve spread out to meet the space allotted to them—so much so that a modern orchestra playing in a century‐old hall may squeeze together to fully half the area of the same modern orchestra playing in a contemporary hall. Direct sound decays six decibels per doubling of distance, so the spread‐out version of the orchestra in the newer room suffers a substantial loss of direct sound relative to the close‐together version in the older room. To prevent this, first the stage size should be limited. As a rule of thumb, use 20 square feet per musician, which for a full 100‐piece orchestra means a performance platform no larger than 2,000 square feet. Of course, 20 square feet per musician is merely an average, and in practice, a wind instrument may need 13 square feet while a tympani needs more than 100 square feet. There is an operational component to all of this as well, beyond the room’s design. Concert hall and orchestra technical staff must work to keep the musicians physically nearer to one another than might feel natural on a large stage. Ideally, no musician will sit more than 25 feet from another musician.
Risers, elevated platforms, each progressively taller than the one in front of it like steps, can lift each row of the orchestra so that the direct paths from the instruments are less obstructed by the other musicians. This is also good for the audience, who benefit from the direct sound just as the musicians do.
Yet, not all design moves that benefit the musicians also benefit the audience. With reflected sound, any acoustic energy directed at the (absorbent) orchestra is sound energy not brought to the house that might otherwise be heard as loudness, reverberance, and clarity in the seats. The room should achieve a proper balance between sound directed back to the stage, and sound directed out to those in the house—and that precise equilibrium is difficult to define. Certainly some, if not all, of the surfaces adjacent to the stage, both in plan and section, should contribute to ensemble and return sound energy to the orchestra. Many concertgoers lack the wherewithal to properly judge the acoustics of a room, and many of those who can properly evaluate the acoustic subtleties of a room lack the confidence in their judgment and a platform to make their evaluation known to a broader audience. By contrast, musicians possess the wherewithal to make acoustics judgments, the experience to compare one room to another, the cohesion to give weight to their collective opinion, and no shortage of platforms from which their judgments may be known to the press, critics, and other musicians. Insofar as sound energy distribution within a room can be a zero‐sum game, and the acoustic reputation of a concert hall can gather inertia within a few weeks of opening night, when recently written reviews morph into nearly immutable conventional wisdom, the acoustical comfort of musicians is taken seriously.
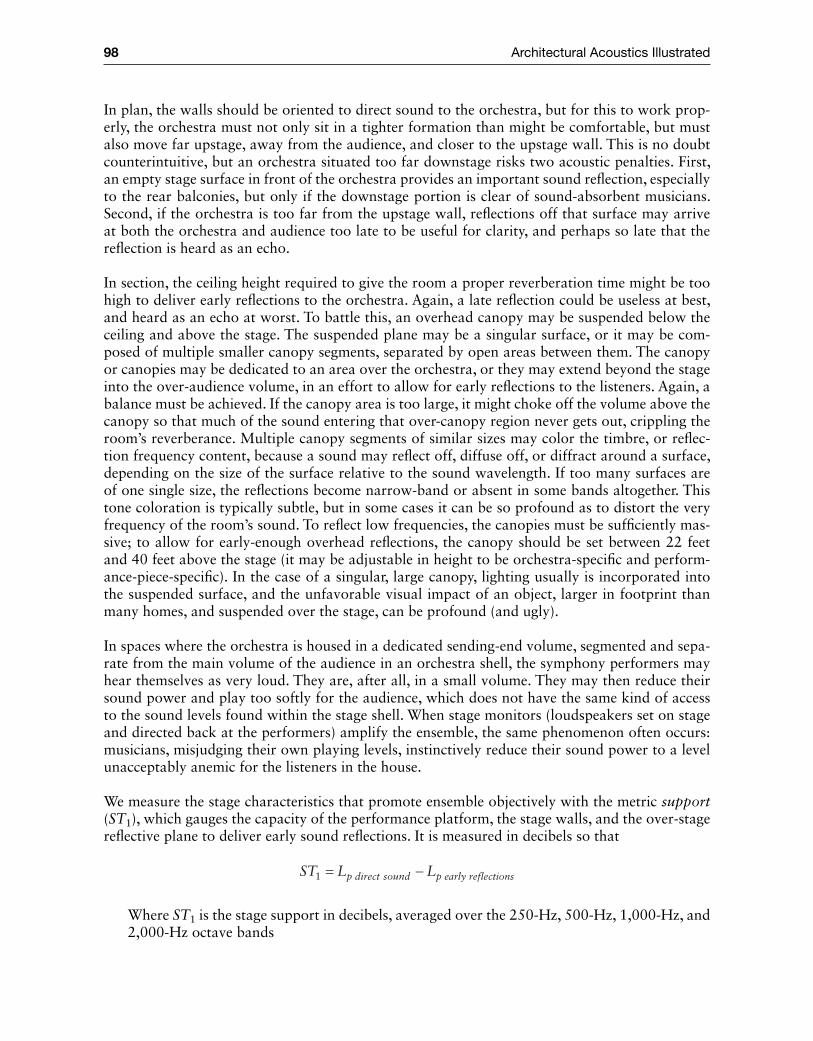
98 Architectural Acoustics Illustrated
In plan, the walls should be oriented to direct sound to the orchestra, but for this to work prop-erly, the orchestra must not only sit in a tighter formation than might be comfortable, but must also move far upstage, away from the audience, and closer to the upstage wall. This is no doubt counterintuitive, but an orchestra situated too far downstage risks two acoustic penalties. First, an empty stage surface in front of the orchestra provides an important sound reflection, especially to the rear balconies, but only if the downstage portion is clear of sound‐absorbent musicians. Second, if the orchestra is too far from the upstage wall, reflections off that surface may arrive at both the orchestra and audience too late to be useful for clarity, and perhaps so late that the reflection is heard as an echo.
In section, the ceiling height required to give the room a proper reverberation time might be too high to deliver early reflections to the orchestra. Again, a late reflection could be useless at best, and heard as an echo at worst. To battle this, an overhead canopy may be suspended below the ceiling and above the stage. The suspended plane may be a singular surface, or it may be com-posed of multiple smaller canopy segments, separated by open areas between them. The canopy or canopies may be dedicated to an area over the orchestra, or they may extend beyond the stage into the over‐audience volume, in an effort to allow for early reflections to the listeners. Again, a balance must be achieved. If the canopy area is too large, it might choke off the volume above the canopy so that much of the sound entering that over-canopy region never gets out, crippling the room’s reverberance. Multiple canopy segments of similar sizes may color the timbre, or reflec-tion frequency content, because a sound may reflect off, diffuse off, or diffract around a surface, depending on the size of the surface relative to the sound wavelength. If too many surfaces are of one single size, the reflections become narrow‐band or absent in some bands altogether. This tone coloration is typically subtle, but in some cases it can be so profound as to distort the very frequency of the room’s sound. To reflect low frequencies, the canopies must be sufficiently mas-sive; to allow for early‐enough overhead reflections, the canopy should be set between 22 feet and 40 feet above the stage (it may be adjustable in height to be orchestra‐specific and perform-ance‐piece‐specific). In the case of a singular, large canopy, lighting usually is incorporated into the suspended surface, and the unfavorable visual impact of an object, larger in footprint than many homes, and suspended over the stage, can be profound (and ugly).
In spaces where the orchestra is housed in a dedicated sending‐end volume, segmented and sepa-rate from the main volume of the audience in an orchestra shell, the symphony performers may hear themselves as very loud. They are, after all, in a small volume. They may then reduce their sound power and play too softly for the audience, which does not have the same kind of access to the sound levels found within the stage shell. When stage monitors (loudspeakers set on stage and directed back at the performers) amplify the ensemble, the same phenomenon often occurs: musicians, misjudging their own playing levels, instinctively reduce their sound power to a level unacceptably anemic for the listeners in the house.
We measure the stage characteristics that promote ensemble objectively with the metric support (ST1), which gauges the capacity of the performance platform, the stage walls, and the over‐stage reflective plane to deliver early sound reflections. It is measured in decibels so that
ST L Lp direct sound p early reflections1 = −
Where ST1 is the stage support in decibels, averaged over the 250‐Hz, 500‐Hz, 1,000‐Hz, and 2,000‐Hz octave bands
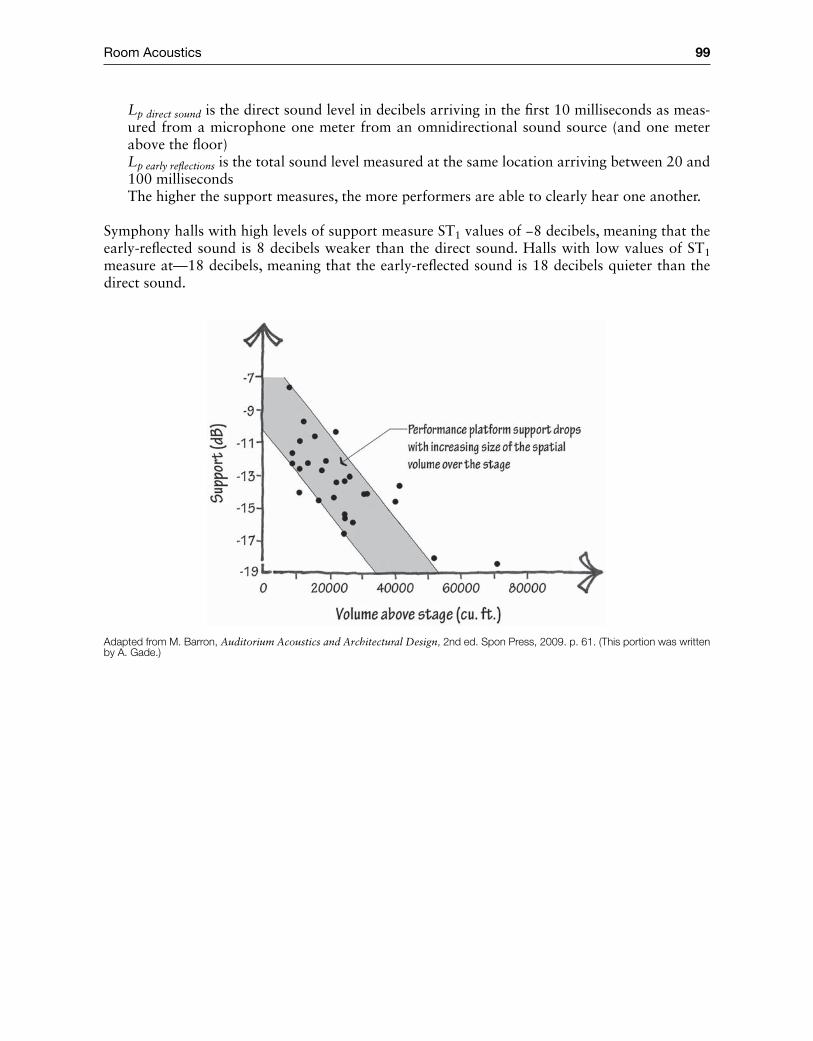
Room Acoustics 99
Lp direct sound is the direct sound level in decibels arriving in the first 10 milliseconds as meas-ured from a microphone one meter from an omnidirectional sound source (and one meter above the floor)Lp early reflections is the total sound level measured at the same location arriving between 20 and 100 millisecondsThe higher the support measures, the more performers are able to clearly hear one another.
Symphony halls with high levels of support measure ST1 values of −8 decibels, meaning that the early‐reflected sound is 8 decibels weaker than the direct sound. Halls with low values of ST1 measure at—18 decibels, meaning that the early‐reflected sound is 18 decibels quieter than the direct sound.
Adapted from M. Barron, Auditorium Acoustics and Architectural Design, 2nd ed. Spon Press, 2009. p. 61. (This portion was written by A. Gade.)
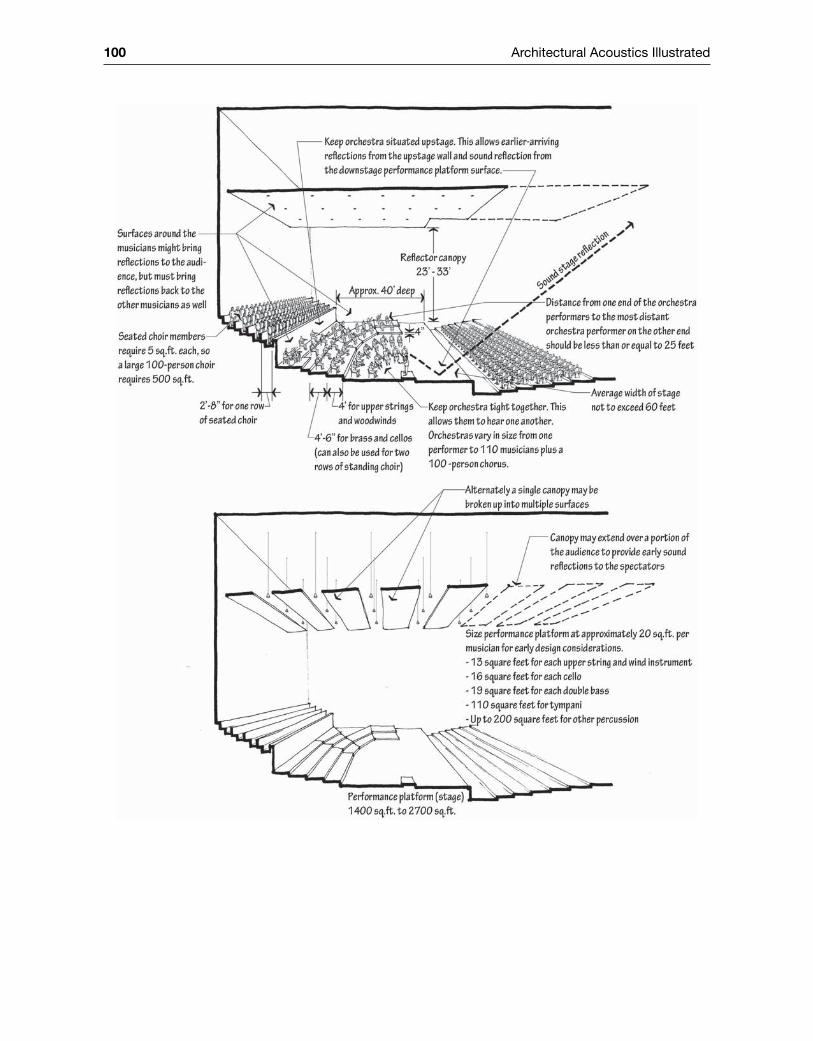
100 Architectural Acoustics Illustrated
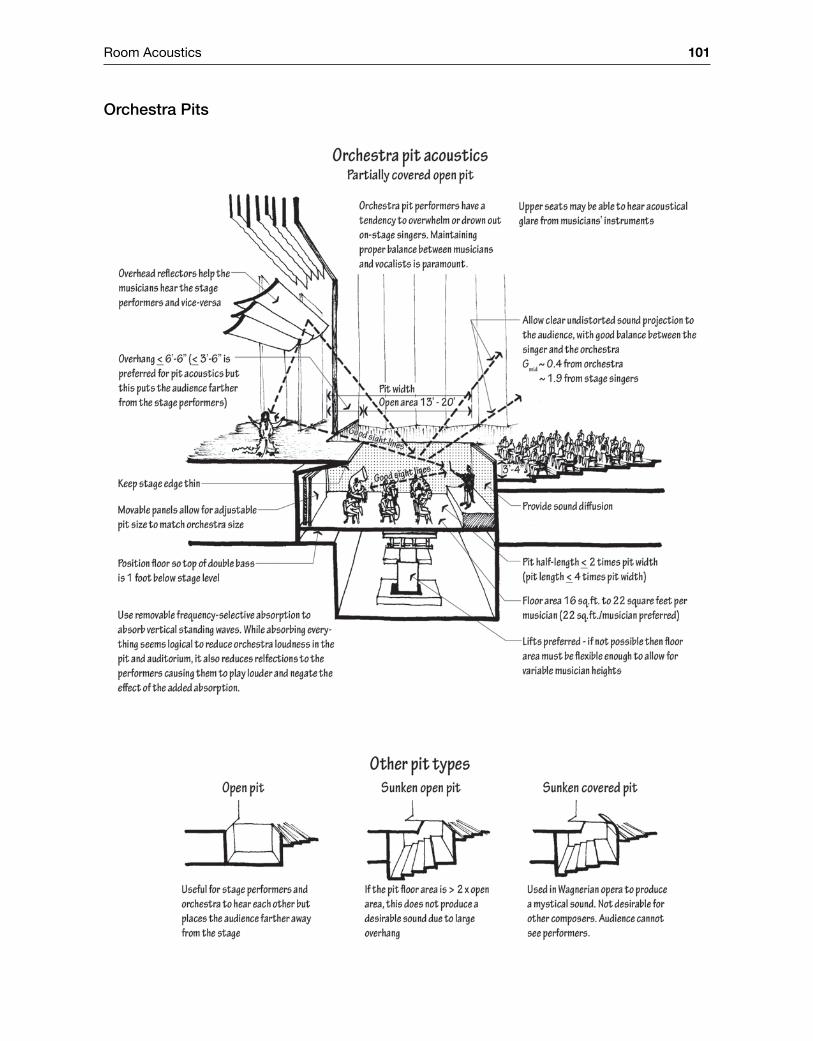
Room Acoustics 101
Orchestra Pits
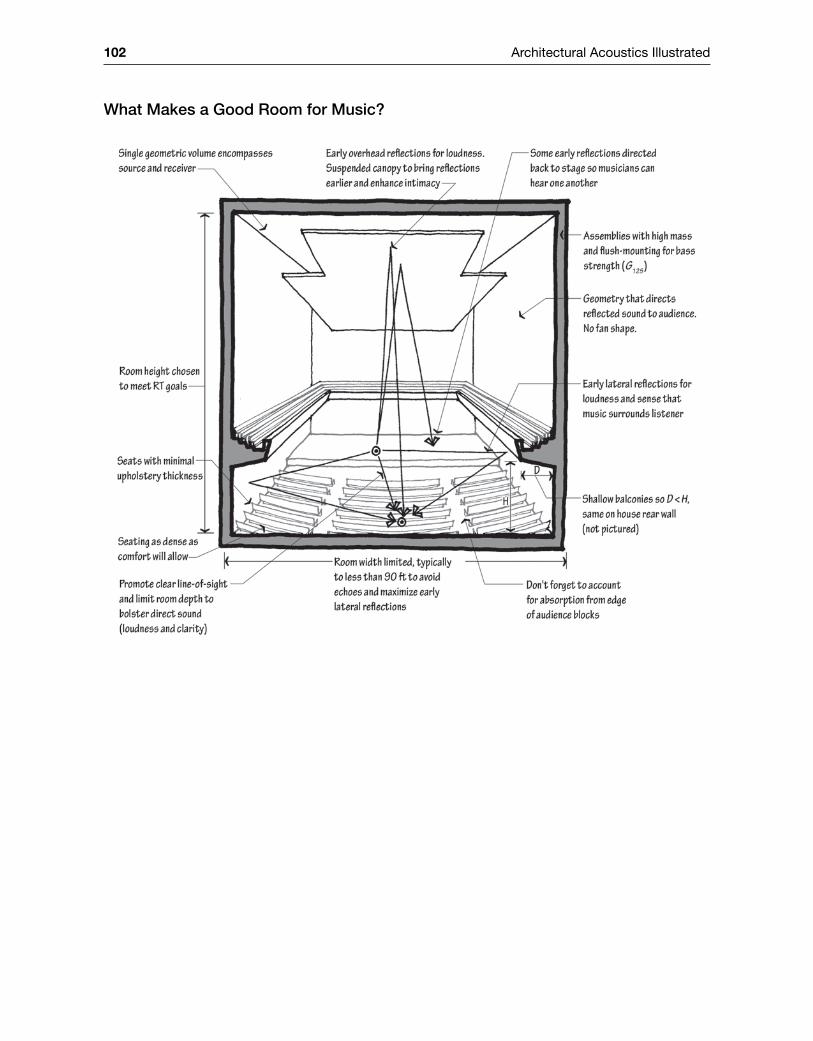
102 Architectural Acoustics Illustrated
What Makes a Good Room for Music?
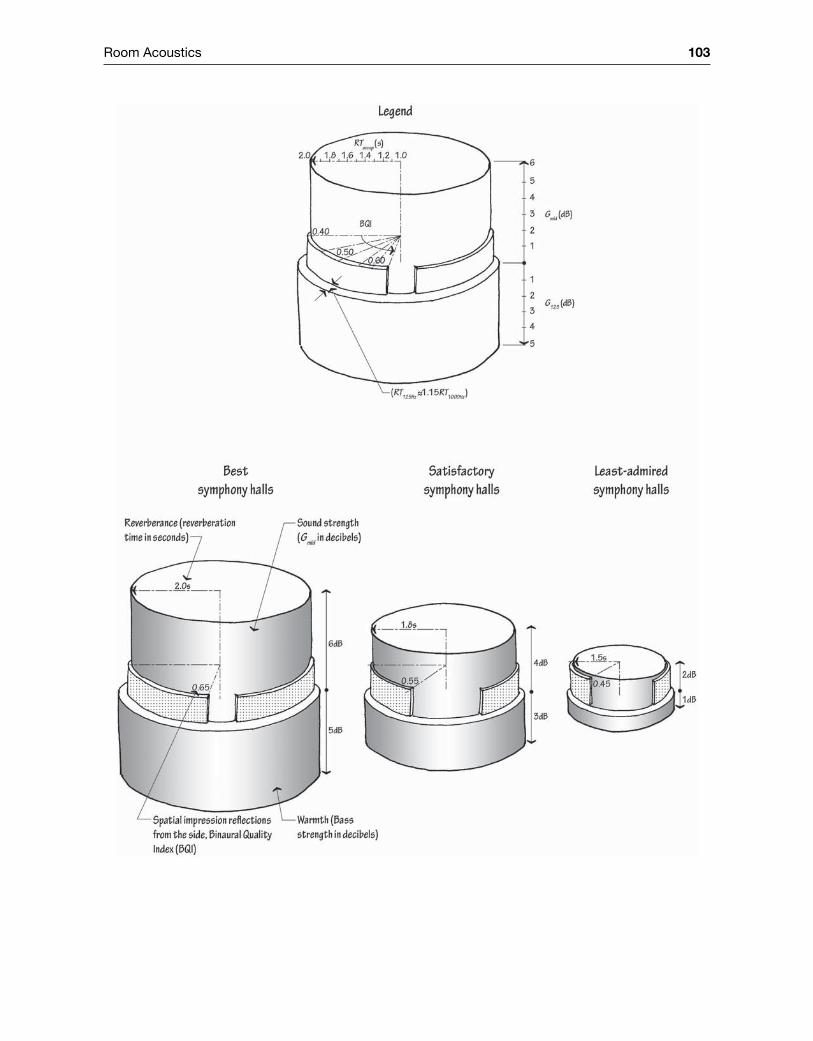
Room Acoustics 103
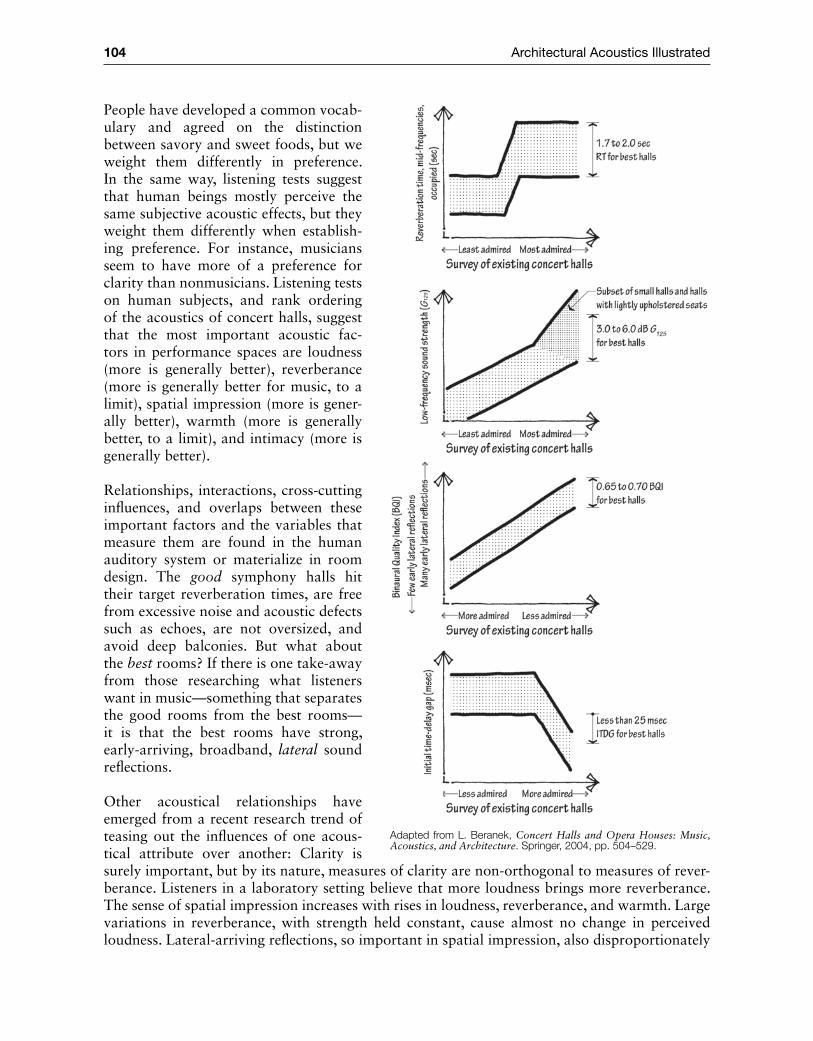
104 Architectural Acoustics Illustrated
People have developed a common vocab-ulary and agreed on the distinction between savory and sweet foods, but we weight them differently in preference. In the same way, listening tests suggest that human beings mostly perceive the same subjective acoustic effects, but they weight them differently when establish-ing preference. For instance, musicians seem to have more of a preference for clarity than nonmusicians. Listening tests on human subjects, and rank ordering of the acoustics of concert halls, suggest that the most important acoustic fac-tors in performance spaces are loudness (more is generally better), reverberance (more is generally better for music, to a limit), spatial impression (more is gener-ally better), warmth (more is generally better, to a limit), and intimacy (more is generally better).
Relationships, interactions, cross‐cutting influences, and overlaps between these important factors and the variables that measure them are found in the human auditory system or materialize in room design. The good symphony halls hit their target reverberation times, are free from excessive noise and acoustic defects such as echoes, are not oversized, and avoid deep balconies. But what about the best rooms? If there is one take‐away from those researching what listeners want in music—something that separates the good rooms from the best rooms—it is that the best rooms have strong, early‐arriving, broadband, lateral sound reflections.
Other acoustical relationships have emerged from a recent research trend of teasing out the influences of one acous-tical attribute over another: Clarity is surely important, but by its nature, measures of clarity are non‐orthogonal to measures of rever-berance. Listeners in a laboratory setting believe that more loudness brings more reverberance. The sense of spatial impression increases with rises in loudness, reverberance, and warmth. Large variations in reverberance, with strength held constant, cause almost no change in perceived loudness. Lateral‐arriving reflections, so important in spatial impression, also disproportionately
Adapted from L. Beranek, Concert Halls and Opera Houses: Music, Acoustics, and Architecture. Springer, 2004, pp. 504–529.
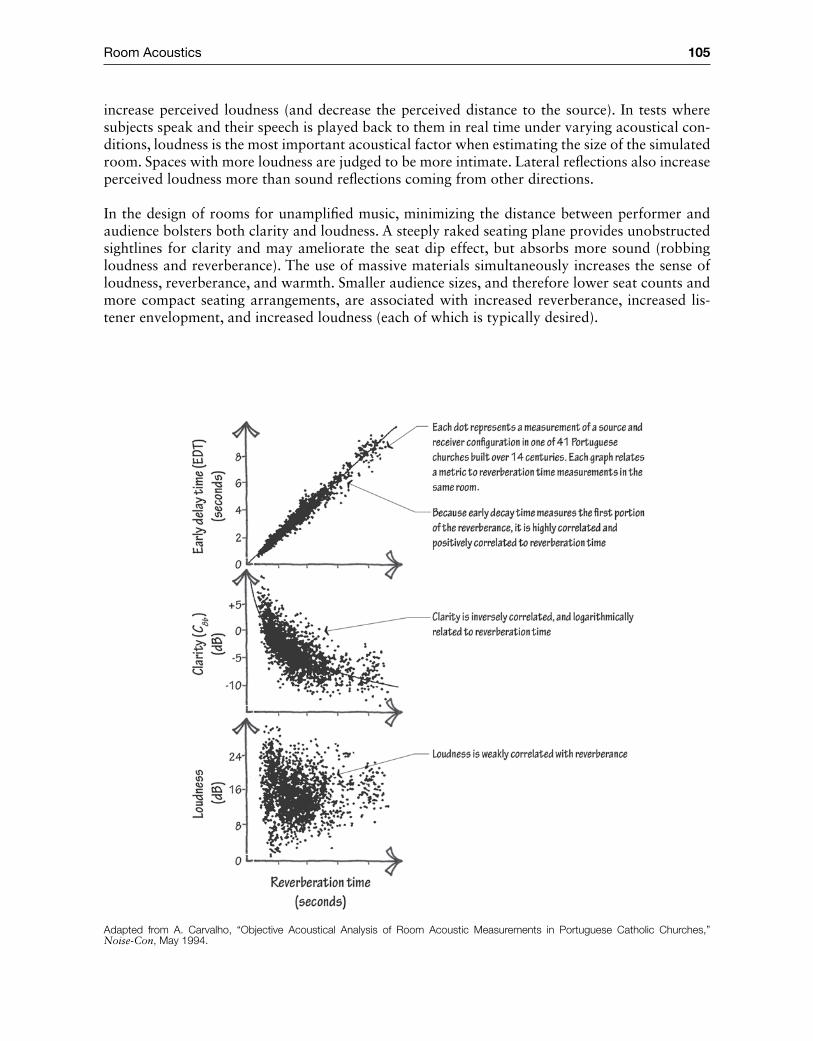
Room Acoustics 105
increase perceived loudness (and decrease the perceived distance to the source). In tests where subjects speak and their speech is played back to them in real time under varying acoustical con-ditions, loudness is the most important acoustical factor when estimating the size of the simulated room. Spaces with more loudness are judged to be more intimate. Lateral reflections also increase perceived loudness more than sound reflections coming from other directions.
In the design of rooms for unamplified music, minimizing the distance between performer and audience bolsters both clarity and loudness. A steeply raked seating plane provides unobstructed sightlines for clarity and may ameliorate the seat dip effect, but absorbs more sound (robbing loudness and reverberance). The use of massive materials simultaneously increases the sense of loudness, reverberance, and warmth. Smaller audience sizes, and therefore lower seat counts and more compact seating arrangements, are associated with increased reverberance, increased lis-tener envelopment, and increased loudness (each of which is typically desired).
Adapted from A. Carvalho, “Objective Acoustical Analysis of Room Acoustic Measurements in Portuguese Catholic Churches,” Noise‐Con, May 1994.
106 Architectural Acoustics Illustrated
Performance Venue SeatsOn September 23, 1962, New York’s Philharmonic Hall (since renamed Avery Fisher Hall) at Lincoln Center opened to great fanfare—and grave disappointment. The new home for the New York Philharmonic was anxiously anticipated; a six‐year research effort involving visits to con-cert venues throughout the world, and interviews with newspaper music critics and the world’s leading maestros served as the foundation for its acoustic design. The concert was broadcast throughout America as a two‐hour live CBS special. The music critics’ and musicians’ responses were mixed at first, then harsher in the ensuing weeks. Many of those in architectural acoustics at the time still recall the press reaction to the room’s sound with an uncanny immediacy. The hall’s design was inspired by Boston’s Symphony Hall, among the most respected venues built. So what went wrong? First, at 100 feet across (to Boston’s 75 feet), the room was too wide to deliver sufficient early‐arriving lateral reflections. House‐left audience members may even hear side‐wall echo from stage‐right sources if the room is too wide. Second, the diffusion slated for the walls was taken out of the design as part of cost‐cutting measures. Third, the contractors misread the drawings and positioned the suspended canopy six feet too low. Even with hindsight, it’s difficult to know what the fatal blow was, but perhaps it was this: At the last minute, the client demanded that 2,760 seats be shoehorned into the room, which had been designed to seat 2,400. More seat-ing area generally robs a room of reverberance, loudness, and warmth; this phenomenon is called the “large concert hall problem.”
Unamplified music venues generally thirst for ever more reverberance, loudness, and warmth, so designers strive to limit the absorptance of room surfaces. This leaves the absorbent audience seating area with an outsized role as the only surface with a meaningful capacity to dampen sound energy. Limiting the seat count—or, more accurately, the seating area—is key. The best concert halls have smaller seat counts and/or more dense seating configurations.
So that warmth doesn’t suffer, select seats that are not too absorbent in the low frequencies. So that the room environment during rehearsals most resembles the room environment during per-formances, specify chairs that have an unoccupied absorption profile similar to their occupied absorption profile. To achieve these objectives, chairs should be made of molded plywood with seat‐bottom upholstery no thicker than two inches (this typically means no springs) and seat‐back upholstery no thicker than one inch. The seat‐back upholstery should cover as little of the surface as possible while still maintaining comfort. Don’t cover the armrest or backside with soft surfaces, as that can make the audience plane too absorptive. Indeed, there is anecdotal evidence that just spraying the upholstery with a stain guard can measurably alter the seating plane’s absorption profile. Absorption coefficient laboratory testing of the actual seats that will be used in a room is recommended.
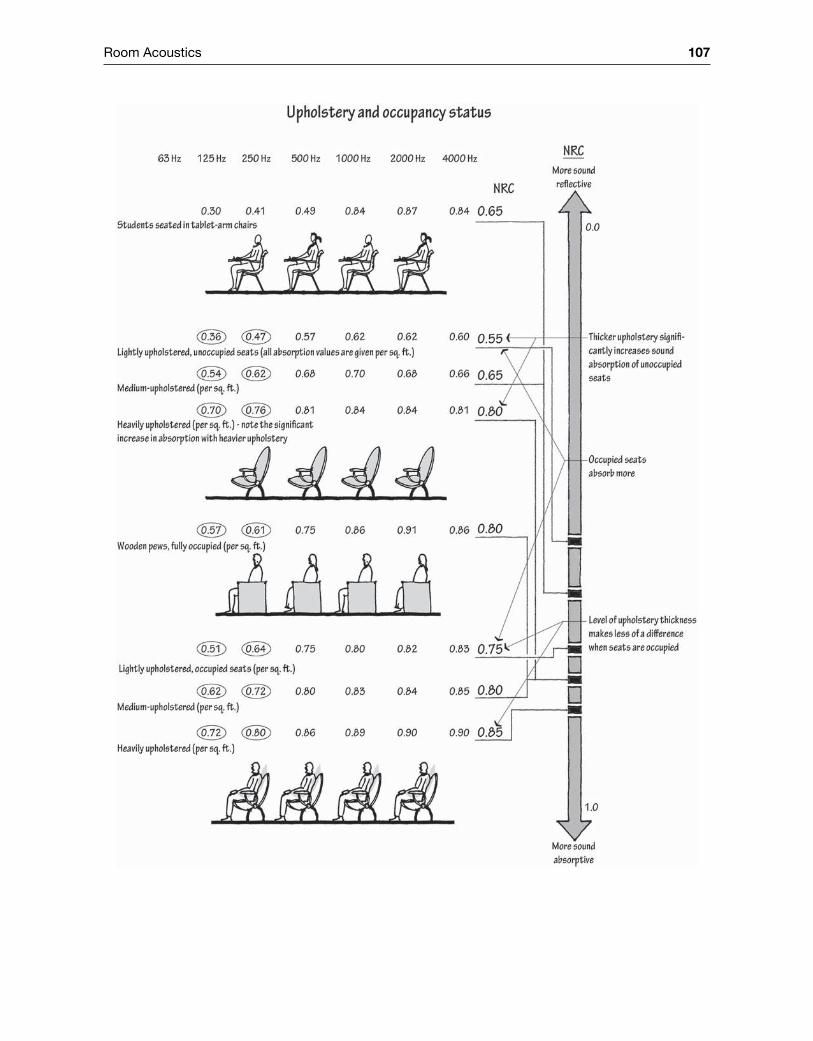
Room Acoustics 107
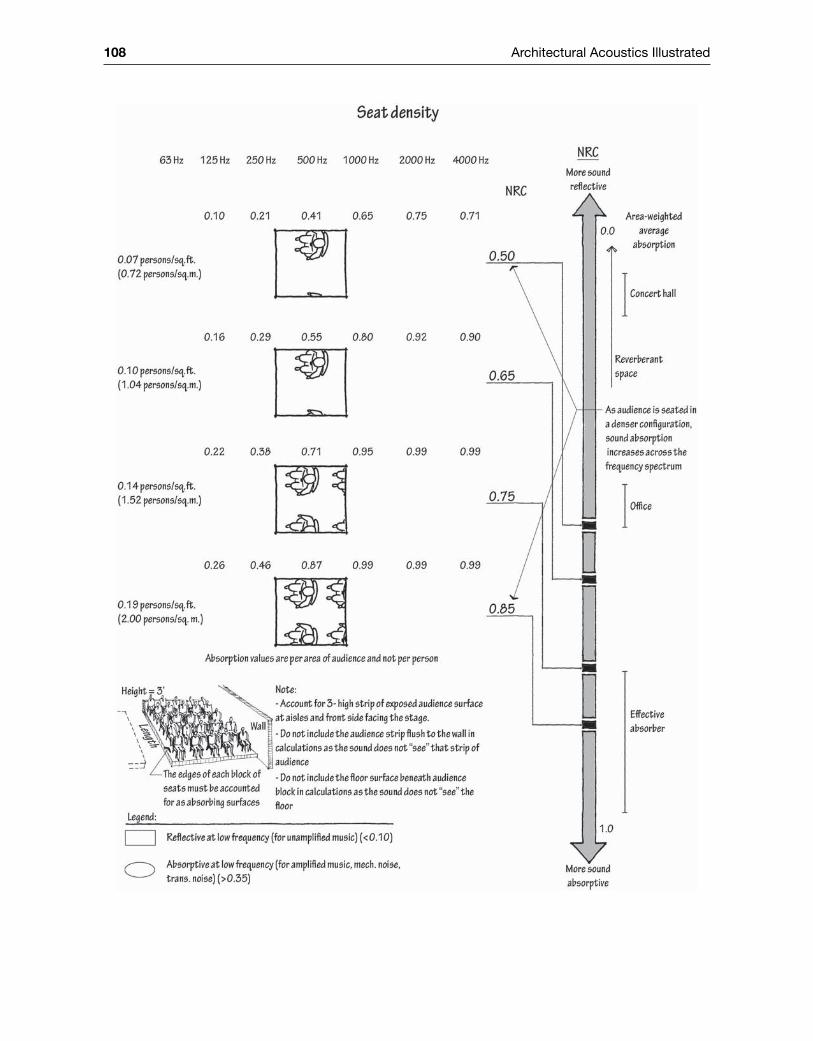
108 Architectural Acoustics Illustrated
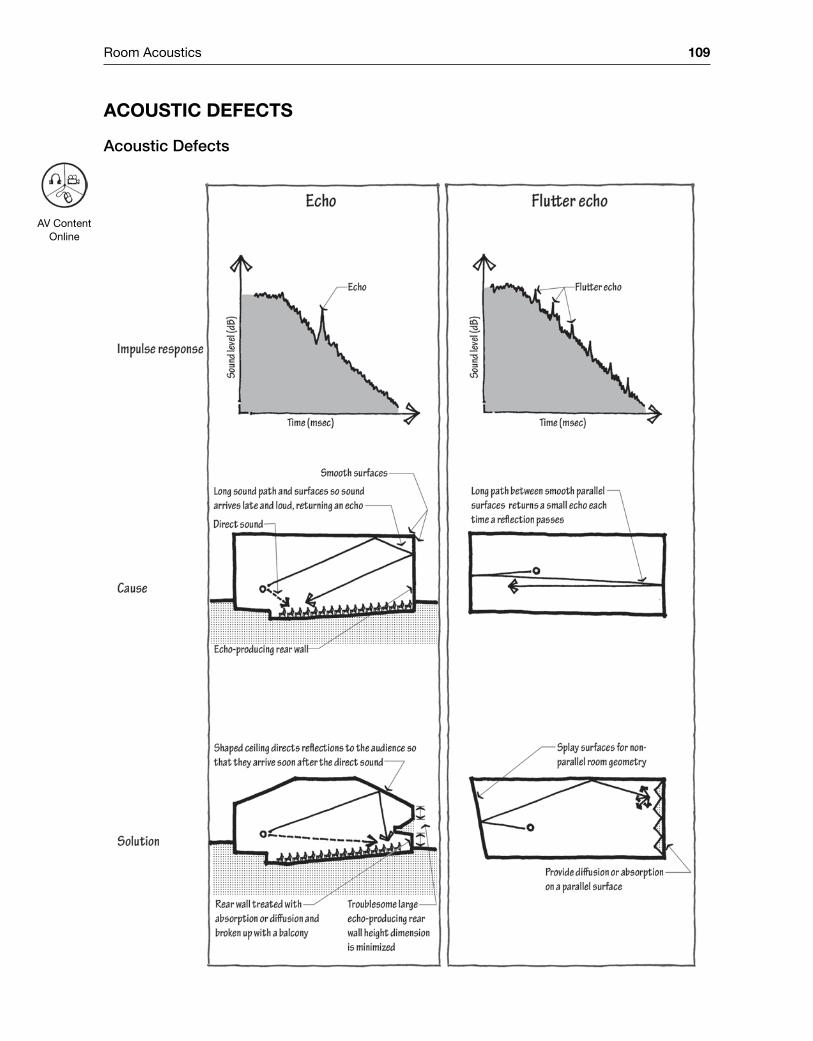
Room Acoustics 109
Acoustic Defects
Acoustic Defects
AV Content Online
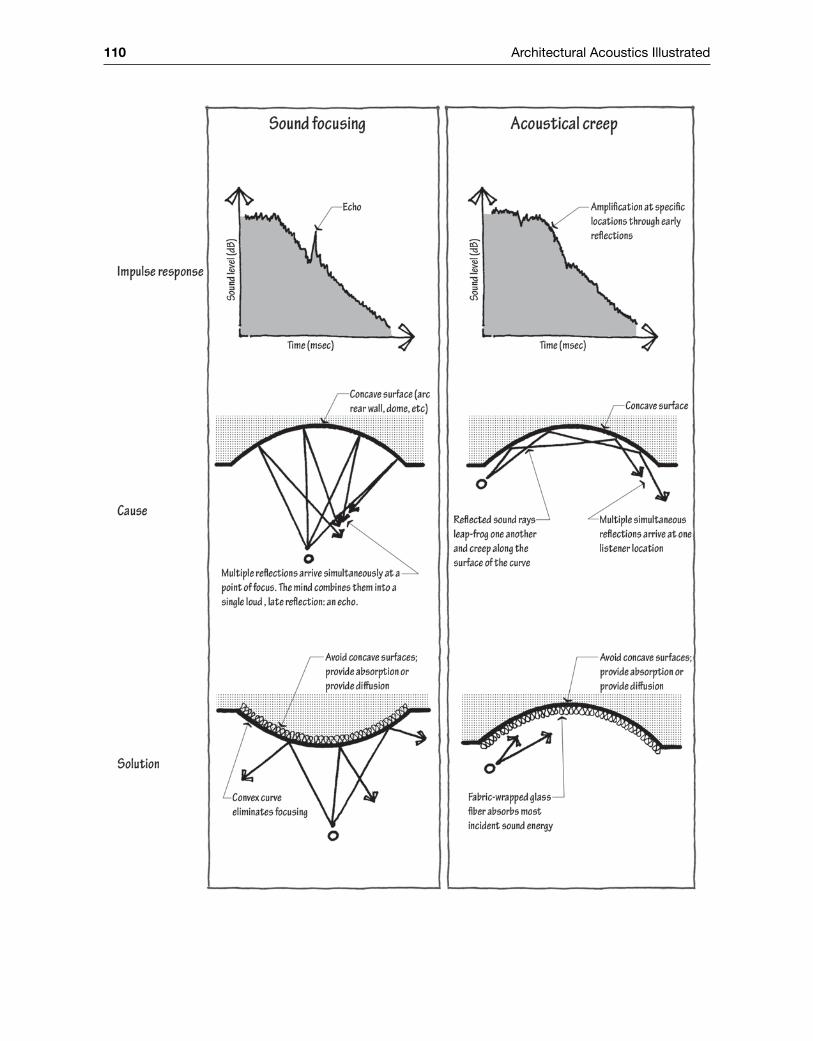
110 Architectural Acoustics Illustrated
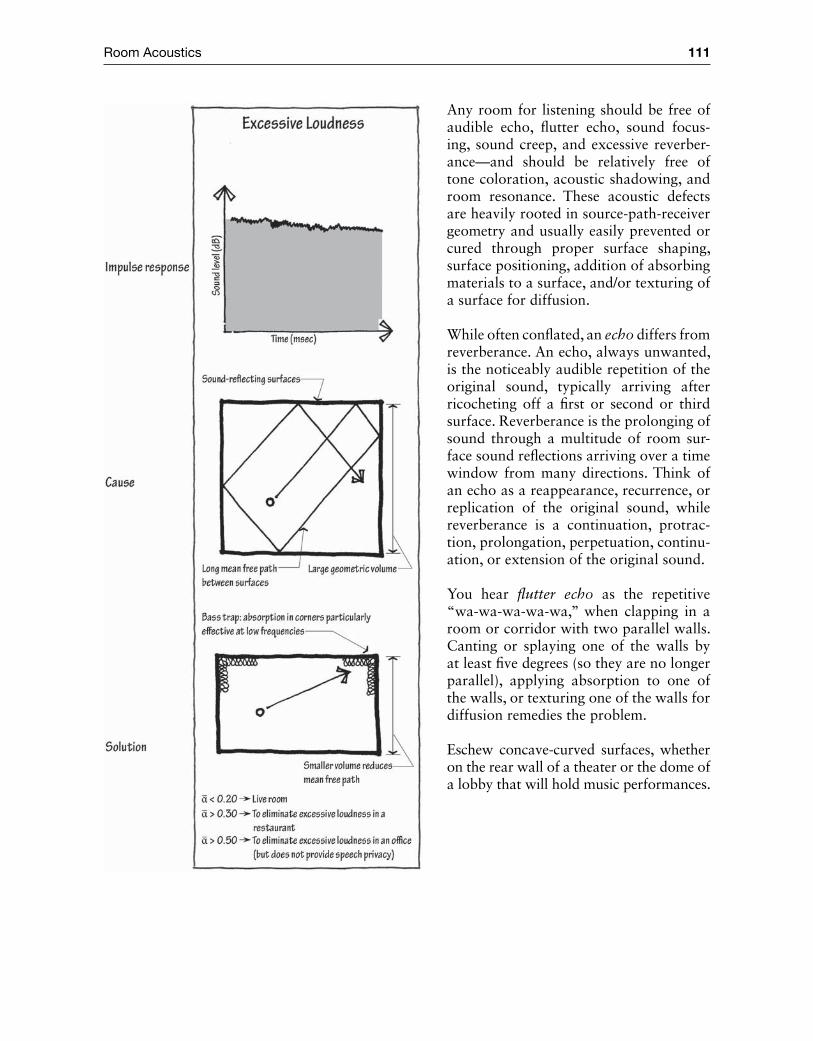
Room Acoustics 111
Any room for listening should be free of audible echo, flutter echo, sound focus-ing, sound creep, and excessive reverber-ance—and should be relatively free of tone coloration, acoustic shadowing, and room resonance. These acoustic defects are heavily rooted in source‐path‐receiver geometry and usually easily prevented or cured through proper surface shaping, surface positioning, addition of absorbing materials to a surface, and/or texturing of a surface for diffusion.
While often conflated, an echo differs from reverberance. An echo, always unwanted, is the noticeably audible repetition of the original sound, typically arriving after ricocheting off a first or second or third surface. Reverberance is the prolonging of sound through a multitude of room sur-face sound reflections arriving over a time window from many directions. Think of an echo as a reappearance, recurrence, or replication of the original sound, while reverberance is a continuation, protrac-tion, prolongation, perpetuation, continu-ation, or extension of the original sound.
You hear flutter echo as the repetitive “wa‐wa‐wa‐wa‐wa,” when clapping in a room or corridor with two parallel walls. Canting or splaying one of the walls by at least five degrees (so they are no longer parallel), applying absorption to one of the walls, or texturing one of the walls for diffusion remedies the problem.
Eschew concave‐curved surfaces, whether on the rear wall of a theater or the dome of a lobby that will hold music performances.
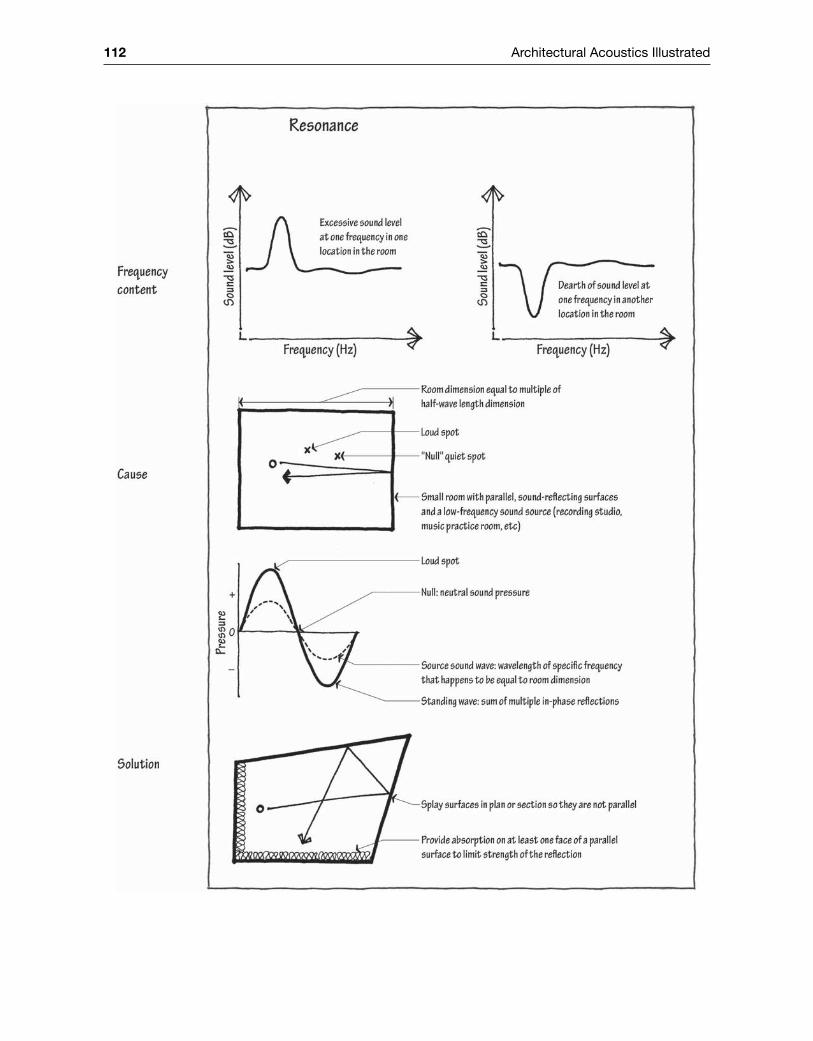
112 Architectural Acoustics Illustrated

Room Acoustics 113
Reflective curves like these focus sound the way a curved mirror or lens focuses light. The multi-ple reflections arrive at the focal point simultaneously, an echo is heard, and the areas not in the focal point fail to get reflections, generating acoustical dead spots. The simultaneously arriving reflections from a curved surface can produce a reflection louder than even the direct sound.
That said, the Albert Theater in Chicago intentionally promotes sound‐focusing for room acous-tics. In an effort to bring early reflections to the middle column of seats farthest from the walls, a convex‐curved ceiling element is oriented to focus sound to the center of the room. The designers believe this makes up for some of the side‐wall reflections that are mostly absorbed by the time they reach the inboard seats.
Sound creep produces the whispering galleries of old domed government buildings, where even quiet speech can be heard at a great distance (provided both the listeners and speakers are stand-ing just so). Again, sound‐reflective concave curves are to blame. Sound rays leapfrog one another, crisscrossing paths along the chords of the arc, and converge on the other side, where those early‐arriving reflections heighten loudness and intelligibility. This is not a sign of excellent acoustics as volunteer docents might claim, but rather an unwanted effect, peculiar to only a few spots in a room, that is better left to children’s science museums.
Excessive reverberance muddles speech, and excessive loudness can elevate the sound level in an elementary school cafeteria to values that, were people exposed for more of the day, might dam-age human hearing. Each of these defects is caused by surfaces that are too reflective, and each is remedied by the addition of absorption.
If a room element or surface obscures another area, we say the receiver locations affected lie in the acoustical shadow of the source. In auditoria, shadowing is most associated with overly deep balconies that block sound reflections from a portion of the solid subtended angle of view.
Low‐frequency spatial peculiarities like resonance are difficult to precisely predict, but they can be rendered less likely to occur through proper design. In one American semi‐enclosed amphi-theater, the mixing board location happens to be within the audience at a 50‐Hz null location. Sound engineers working shows boost the amplified bass unnecessarily because they can’t hear much of the 50‐Hz energy. No matter how adamantly the venue staff warns them, touring engi-neers rely on their ears (their ears got them where they are in their careers), thus exposing the rest of the audience to excessive bass content that only the engineers can’t hear. Low‐frequency sound wavelengths have dimensions on the order of the dimensions of a room, so at those tones, standing waves and phase cancellations may form. As the waves bounce back and forth along the same path, tracing and retracing, high sound pressure (at a particular frequency) builds up in some locations, while nulls with pressures equal to the atmospheric pressure appear in other spots. Resonance presents particular problems in small rooms for music that have sound‐reflec-tive parallel walls (for instance, in music practice rooms). The frequencies affected vary with the distances between room walls, but playing a pure tone on the order of 100 Hz might reveal spots in the room that are unusually loud, and other spots (sometimes only two feet from the loud-speaker source) where the sound seems to disappear.
As with loudness, our understanding of a sound’s frequency is a function of the direct sound and the blending of the direct and reflected sound. When the reflected sound’s frequency content doesn’t match the original sound, the room’s timbre may shift, triggering tone coloration. The effect is typically subtle, but when it happens in rooms for music listening, the consequences are
114 Architectural Acoustics Illustrated
meaningful. Tone coloration can be triggered by resonance that heightens or kills certain frequen-cies in particular positions. Selective absorption by an abundantly used building material can cause timbre shift, as might be the case if gypsum board, nailed to joists and studs, acts as a panel absorber on a narrow frequency band. Seat dip effect can color the tone, as can the widespread use of similarly sized reflectors or diffusers.
PeRfoRmANce VeNues
Room Acoustics HistoryMonks wrote their medieval liturgical music, with its hardly intelligible Gregorian chanting, spe-cifically for the reverberant cathedrals of a millennium ago. Highly articulated song would have been lost in the cavernous stone spaces. Likewise, traditional West African music, with its loud instruments and intricate rhythms, was responsive to its own outdoor (almost anechoic) envi-ronment. Bach composed his fast‐tempo contrapuntal work, with two or more simultaneous intertwining melodies (sometimes changing keys), for the less reverberant (but still hard‐surfaced) ducal chapels and chamber orchestras. One hundred and fifty years later, Wagner wrote some of his operas specifically for performance in his Festspielhaus, and Berlioz did the same for Paris’s Les Invalides. Others of the romantic period—Schubert, Mendelssohn, Brahms, Tchaikovsky, Strauss, Ravel, and DeBussy—responded to the changing mores of the age (no more shouting during performances) with pieces that featured greater dynamic range (loud and quiet passages). They reacted to the larger contemporary halls, dedicated to concerts and more reverberant, with work that was more textural than intricate. More recently, punk rock bands established concise rhythms, responding to the less reverberant and more amplified clubs that hosted them; arena bands composed medium‐speed rock ballads, adapting to the noxious combination of heavy amplification and sports stadiums standing in as performance halls. Most musicians allowed their work to diverge in two distinct streams, one for live performance and another for digital record-ing. This was one thread of the history of musical and theatrical performance—music composi-tion in service of the rooms of an epoch.
The opposite happened too. The music adapted to the architecture, but also the architecture adapted to the music. Not only did Wagner write music for his opera house, but he intentionally designed his opera house with a larger orchestra pit to allow for more and bigger (low‐frequency) instruments. Patrons built the large concert halls of the mid‐1800s to best feature the work of the classical period, from a century prior. Cinemas evolved from hard‐surfaced theaters with stages and balconies to soft‐surfaced neutral spaces—better to control sound reflections and reverber-ance with electronics than to cede the onus to the room’s quirks.
The most highly regarded performance venues were completed around the year 1900. A fair ques-tion is: What other field deeply rooted in empiricism and physics peaked more than a century ago? An accounting follows.
AV Content Online
AV Content Online
AV Content Online
Room Acoustics 115
Lightweight construction We design buildings, including performance venues, to be lighter today. What once would have been masonry may now be gypsum board. Massive materials, like masonry, reflect considerably more low‐frequency sound energy.
Long spans Steel trusses now allow long spans and wider room width. Rooms that once would have been limited by the spanning capacity of timbers may now be much wider. Narrow rooms allow for better spatial impression, loudness, and intimacy.
Architectural minimalism Modernism ushered in a wholesale rejection of ornament. What once would have been ornate and sound‐diffusing may now be stark and prone to specular sound reflections and “acoustical glare.”
Background noise Mechanical systems (air conditioning) and urban cacophony (car alarms) have proliferated, while digital recording has raised expectations for intense quiet between notes.
Large seats Changing expectations of comfort have ballooned audience seat size. Two thousand seats now create a larger area of absorption than seating once did, depleting both loudness and reverberance. Orchestras demand more space too, compounding the problem.
Revenue generation Monarchs once supported the performing arts, so ticket sales didn’t drive design decisions. Now typically performances are more responsible for funding themselves, so what once would have been a 1,500‐seat venue may now be a 2,700‐seat venue, diminishing loudness correspondingly.
Democracy The use of balconies, once common as a means of separating the aristocracy above from commoners below, was seen as anachronistic. Balconies were swapped for one‐level fan‐shaped plans, which appeared to better promote egalitarian values. This drained the room of early lateral sound reflections and therefore sapped the room of spatial impression.
Multi‐use The financial pressure to create revenue and limit expenses led to the proliferation of multi‐use halls, with large symphonies, small ensembles, theater, opera, comedy, lectures, and conventions using the same space. The compromises necessary to keep the room viable for each of these uses doomed the room to an existence not properly suited for any of them.
Geometry After the discovery of the reverberation time equation, but before more was known about the precedence effect and the importance of spatial impression, some designers thought that Sabine’s equation had “solved” acoustic design for auditoria. They speculated that any room shape could be utilized, provided its total room volume and total absorption situated it in the range of appropriate reverberation times.
Survival bias When a beloved hall catches fire, is bombed in war, suffers a partial collapse during an earthquake, catches the eye of a residential developer, or is found to be riddled with asbestos, the community rallies to save it. When a rotten hall is threatened or partially destroyed, it is removed without notice. Thus, surviving older halls are more likely to be high performers. This is the case with New York’s Carnegie Hall, whose reputation for excellent acoustics spared it demolition.
Amplification The room requirements to support electronic amplification, which thrives on short reverberation times, run counter to the requirements to support unamplified performance, which thrives on longer reverberation times.
Performance quality A room’s reputation for acoustics is impacted by the quality of the orchestra that plays there. In this way, homes for excellent orchestras acquire an advantage, and many of the venues that house venerated symphonies are older.
Give it time With clear‐eyed recognition of the forces listed here, and an ever‐expanding library of empirical findings in the field, many believe we live in another age of great performance space design. These newer rooms, however, must age before they are evaluated historically.
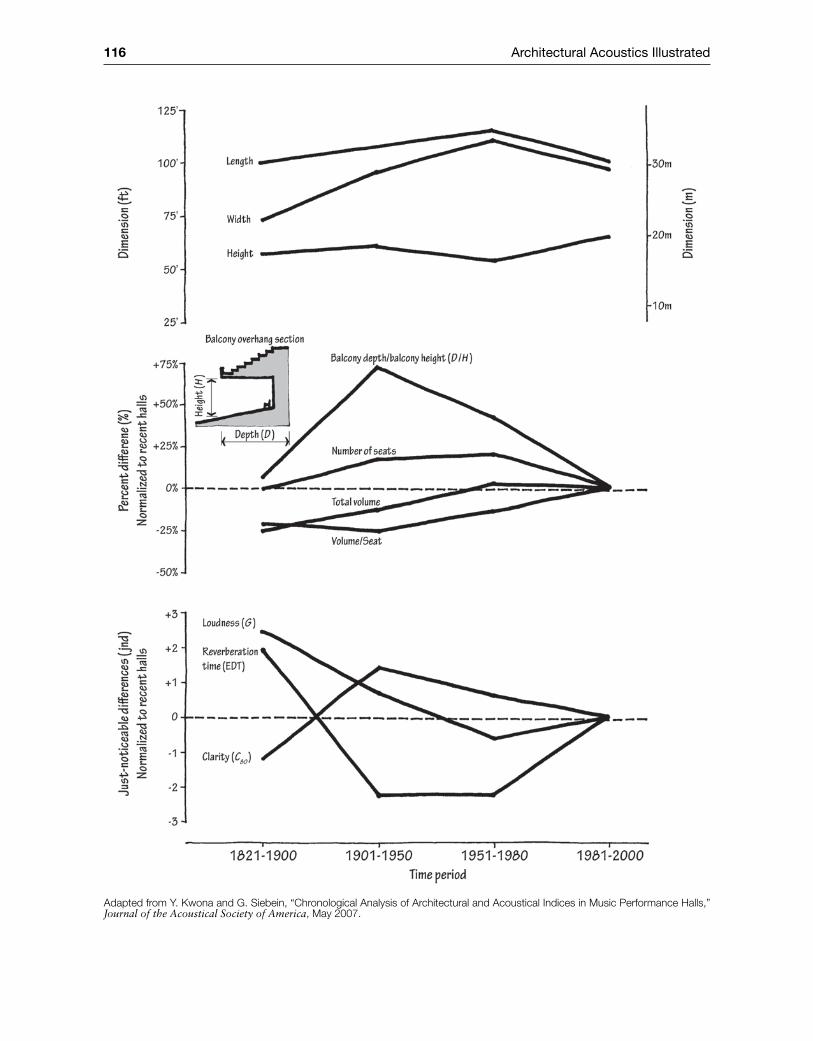
116 Architectural Acoustics Illustrated
Adapted from Y. Kwona and G. Siebein, “Chronological Analysis of Architectural and Acoustical Indices in Music Performance Halls,” Journal of the Acoustical Society of America, May 2007.
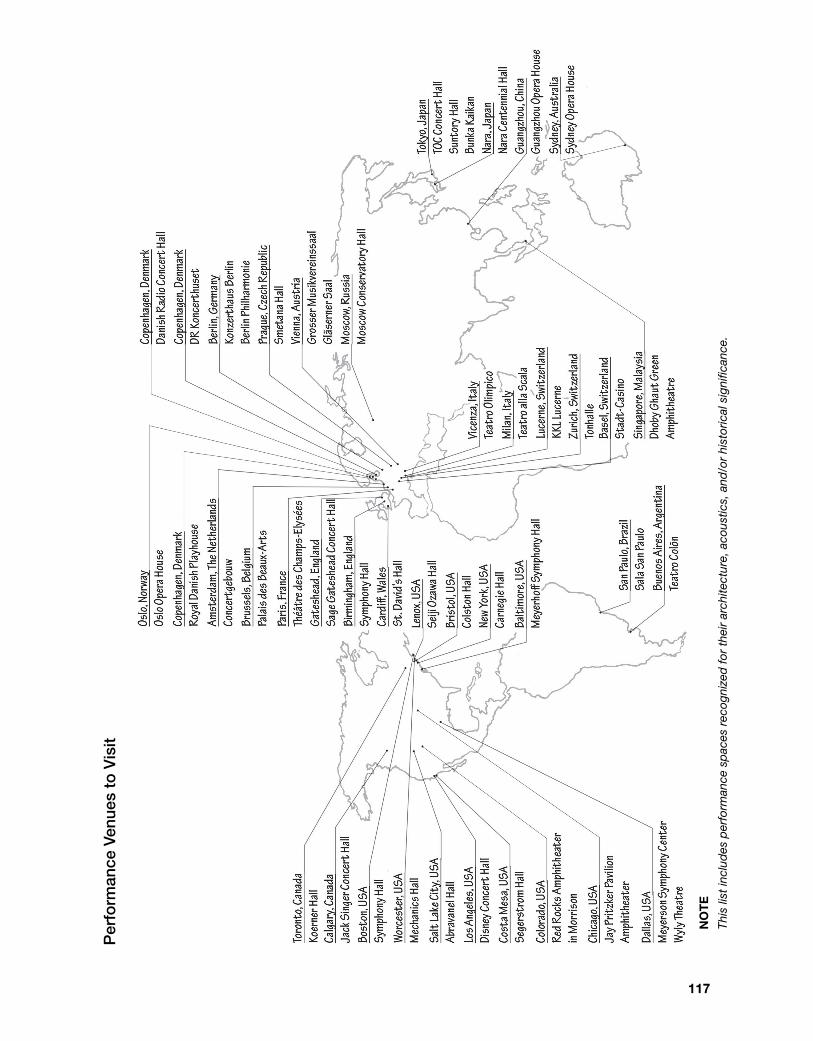
117
Per
form
ance
Ven
ues
to V
isit
No
te
This
list
incl
udes
per
form
ance
sp
aces
rec
ogni
zed
for
thei
r ar
chite
ctur
e, a
cous
tics,
and
/or
hist
oric
al s
igni
fican
ce.
118 Architectural Acoustics Illustrated
DesigN checklists
Rooms for Unamplified Music Performance ChecklistWhen making rooms for music, designers should prioritize (1) absence of background noise, (2) absence of echo and other acoustic defects, (3) appropriate reverberance, (4) sufficient loudness, (5) enhanced spatial impression, (6) robust warmth, and (7) limited seat count. The most consis-tent performers are rectangular rooms with shoebox proportions, although other, more experi-mental, forms have also done well. The best halls prioritize strong, low‐frequency, early‐arriving lateral sound reflections.
Room Shaping 1. Include the musicians and audience in the same geometric volume. Avoid the kind of outcrop-
pings that occur with deep under‐balcony spaces and spatially distinct stage areas. (Loudness, spatial impression)
2. Define a room geometry to bring strong early sound reflections to the audience. (Loudness, clarity)
3. Shape the room to deliver lateral reflections from the side walls or, in the case of a vineyard arrangement, terrace walls. (Spatial impression)
4. Limit the width of the room so first‐order lateral sound reflections arrive early to the seated audience. For rectangular rooms, widths generally shouldn’t exceed 90 feet. (Loudness, spa-tial impression, clarity, intimacy, absence of acoustic defects)
5. Limit the audience size. Take special care designing rooms with more than 2,000 seats to ensure proper loudness. In rooms with more than 2,600 seats there is likely not enough sound energy to reach everyone. The most respected halls average 1,850 seats in capacity. (Loudness, intimacy)
6. Limit the length of the room. Get as many people as close to the source as reasonable. Posi-tion seats no farther than 100 feet from the stage on the main level, and no farther than 130 feet to the farthest balcony seat. (Loudness, intimacy)
7. Utilize balconies. They bring the listeners closer. In the case of side balconies, they direct sound otherwise destined for the ceiling back toward the main‐level audience block. Limit side balconies to one or two rows of seats, because deeper side balconies often cannot provide clear stage sightlines for the third or fourth row. (Loudness, spatial impression)
8. Size the room to achieve the appropriate reverberation time. Because the width and length of the room are limited by other acoustic considerations, often the ceiling height must be adjusted to ensure proper room volume. For unamplified music rooms, plan on employing high ceilings. Several of the most respected concert halls have height‐to‐width ratios greater than 0.7. (Reverberance)
9. Limit absorption in the room, outside of that brought by the absorptance of audience and performers. (Reverberance, loudness, warmth)
10. Shape the sending end to provide beneficial reflections and increase directivity. This should happen in both plan and section. (Loudness, clarity)
11. Rake the seating plane. Because the ears sit at about the same level on the head as the eyes, a clear line of sight to the source also ensures direct sound access. Use stepped seating for rooms with more than 100 people. Know that too‐steeply‐raked seating absorbs more of the direct sound because the source “sees” more of the absorptive seating plane. (Loudness, reverberance)
12. Treat the rear wall. It is the most likely source of echo, and should therefore be minimized in height with balconies, diffusion, or sloped ceilings. (Absence of acoustic defects)
Room Acoustics 119
13. Avoid concave curves. Domes and other concave curved surfaces produce sound creep and sound focusing. (Absence of acoustic defects)
14. Consider the overhead plane. This might involve shaping the ceiling or hanging a suspended sound‐reflective canopy. Overhead reflections are important for loudness, but the high ceil-ing height needed for proper reverberance may delay first‐order ceiling reflections such that they come after the 80 millisecond threshold required for integration with the direct sound. These reflections are useful both for audience and musicians on stage, who need to hear one another. A suspended canopy over the stage and first rows of the audience can simultaneously allow for a high ceiling and early overhead sound reflections. The importance of a canopy is not universally accepted in the field, and there is some debate as to its usefulness. (Loudness, reverberance)
15. Vary the sizes of reflecting surfaces. Large surfaces are needed to reflect low‐frequency sound. (Warmth, diffusion)
Surfaces 1. Design the audience plane with acoustics in mind. Reverberation and loudness requirements
often dictate that the only meaningful absorbing surfaces in a room for music are the seats and the people who occupy them. Note that seats and absorption coefficients vary consider-ably from one upholstered condition and seating configuration to another. Seating densities should fall between 6.5 and 9.0 square feet per person, and seats that excessively absorb bass should be avoided. (Loudness, reverberance, warmth)
2. Reflect low‐frequency sound. Specify smooth, high‐mass reflecting surfaces, flush‐mounted and absent air spaces. Use plaster (minimum one inch thick), painted concrete block, or poured concrete for side‐wall construction. Wood, wood veneers, and lightweight stud assem-blies are notorious for disproportionally absorbing low‐frequency sound and robbing a room of bass response. (Warmth)
3. Detail for surface irregularities. Convex curves, pyramids, coffers, canted and angled sur-faces, protruding pilasters, piers, and other craggy surfaces with varying dimensions generate diffuse reflections. Diffusion protects against echo, flutter echo, creep, sound focusing, and “acoustical glare” associated with flat surfaces. It is especially helpful near the sending (stage) end and on surfaces, such as rear walls, that are most likely to create echo problems. The rela-tive importance of diffusing surfaces is not universally agreed upon in the field. (Diffusion)
4. Provide for variable acoustics. Retractable sound‐absorbing banners or curtains allow for a wider range of reverberation times, and therefore a wider range of performance types. Curtains are also helpful in simulating the reverberance of a full hall during a rehearsal with unoccupied audience seats. (Reverberance)
General 1. Limit background noise. Specify quiet air‐conditioning systems, and locate machinery far
from the performance space. Design vestibules as sound and light locks separating lobbies, loading docks, backstage areas, and other ancillary spaces from the performance room. Back-ground noise from outdoor sources should be inaudible. (Loudness, clarity, absence of acous-tic defects)
2. Consider subtle electronic sound reinforcement. (Loudness, reverberance)
Other Types of Rooms ChecklistWhen designing any acoustically sensitive space, many of the rules established for unamplified music halls still apply. Ensure an absence of acoustic defects like excessive background noise and
120 Architectural Acoustics Illustrated
echo, maximize early sound reflections, and ensure appropriate reverberation times. What fol-lows is a list of other important priorities for specific room types.
Opera Houses 1. Use architecture to help maintain the balance of orchestra and vocalist. Opera struggles to
keep the many instruments of the pit from overwhelming a lone voice on the stage. 2. Right‐size the reverberance. Because of its reliance on both symphonic music and tongue‐
twisting librettos, opera performance demands more reverberance than a theater, but less reverberance than a symphony hall. Appropriate reverberation times range between 1.2 sec-onds and 1.8 seconds (mid‐frequency, unoccupied). When opera is performed in the language of the audience, as is often the case in Europe, the lower end of that range allows for more intelligibility of the vocal content and story dialog. In other places, where the audience typi-cally doesn’t understand what is sung, the higher end of that range is more appropriate.
3. Provide lateral sound reflections. Researchers find spatial impression to be vitally important to opera as well.
4. Allow for deep stages with tall fly towers (at least 1.5 times the proscenium height). Limit the seat count; the farthest seats should be no more than 100 feet from the stage and no wider than the line 30 degrees splayed from the near edge of the proscenium opening.
Theaters 1. Provide clear sightlines to the stage and limit the distance to the farthest seat. This may neces-
sitate steep audience seating rakes that absorb wanted sound. 2. Design buffer zones (storage rooms, corridors, etc.) between the theater house and noisy
spaces such as the wood shop, loading dock, exterior areas, bathrooms, lobbies, and mechani-cal rooms.
3. Shape the ceiling and walls to provide strong early sound reflections—and prohibit strong late sound reflections.
4. Recognize that theater lighting will occupy much of the ceiling surface that would otherwise be used for overhead sound reflections. Also, the stage house fly loft will reroute much of the sound energy intended for the audience to a death above the stage.
5. Allow space in the ceiling for a central cluster loudspeaker system above, and slightly in front of, the stage.
Multipurpose Spaces 1. Know that it is generally impossible to achieve excellent acoustics for music and speech when
both are performed in the same room. (Think of a single stadium used for two sports.) Mul-tipurpose spaces include the infamous “cafetoriums” in schools; the divisible halls in hotel conference centers that house banquets, meetings, and dances; and the medium‐sized‐city multipurpose auditoria intended to host every imaginable type of performance from dance to opera to Broadway musical to stand‐up comedy. Music requires reverberation times on the order of two seconds, and speech calls for reverberation times less than half that.
2. Consider an adjustable acoustic environment to bridge the yawning range of appropri-ate reverberation times needed for the venue’s different uses. This could include kinetic absorptive surfaces, such as panels that slide and flip, or curtains/banners that deploy and retract.
Room Acoustics 121
Lecture Halls 1. Design fan‐shaped rooms to bring the audience closer to the stage (less than 125‐degree
angle), or rectilinear rooms to promote lateral reflections and keep the audience in clear view of the screen at the front of the room.
2. Splay the surfaces near the sending end (ceiling and at least one wall) so that the opposite sides are nonparallel and less likely to build up flutter echo.
3. Position absorptive materials on the back wall and the upper‐rear portions of the side walls as needed to optimize reverberation time. This has the added advantage of absorbing what might otherwise be echo reflections, while allowing the surfaces most likely to deliver early‐arriving first‐order reflections to remain sound reflective.
4. Rake the audience at least 7 degrees, and put the source on a raised stage to maintain clear lines of sight and direct sound.
5. Keep the ceiling sound‐reflective and low enough so that the room volume is between 80 and 150 cubic feet per seat.
6. Know that speech is not audible more than 35 feet from the source without careful acoustic design or amplification. Rooms with more than 100 seats should have electronic sound rein-forcement.
7. Use automatic door closers without latches to minimize the disruption by latecomers.
School Classrooms 1. Install sound‐absorbing material equal in area to approximately the floor area. This does not
all have to be on the ceiling. 2. Ensure sound‐reflecting surfaces in the middle of the ceiling and the wall surfaces nearest to
the source to provide beneficial early first‐order reflections. 3. Run walls from structural deck below all the way to structural deck above. Avoid partial‐
height walls separating classrooms. 4. Locate the mechanical room as far as possible from the quiet learning spaces. Use ducted
air‐handling units from remote locations.
Conference Rooms 1. Detail the ceiling over the table so that it is sound reflective. 2. Limit the ceiling height over the table to less than ten feet.
Worship Spaces 1. Identify the music‐speech balance. Worship services often include a measure of both speech
and music, but the weighting between the two varies across congregations. Organ requires very long reverberation times; music requires long reverberation times; and speech requires short reverberation times. Added reverberance may also save the congregant from a feeling of “singing alone” during group chants or “speaking alone” during group prayers and respon-sive readings.
2. Design a space with a long reverberation time for music and an excellent amplification system for speech in cases where neither speech nor music dominates the service.
3. Size rooms to be 180 to 300 cubic feet per person if speech dominates the service, and 200 to 400 cubic feet per person if music dominates.
4. If music dominates, use a rectilinear plan or other configuration that promotes lateral reflections.
5. Elevate the person speaking. If the ceiling is high, suspend a sound‐reflective canopy to help direct early reflections to the congregants.
122 Architectural Acoustics Illustrated
6. Maintain a singular room volume. Avoid deep balconies, convoluted room shapes with deep occupied alcoves, concave surfaces, and deep recesses for organs.
7. Use automatic door closers without latches to minimize the disruption of latecomers.
Amphitheaters 1. Recognize that without drastic measures (i.e., burying a busy rail line, relocating an industrial
plant, or moving a roadway), some sites are just too noisy to locate an amphitheater, period. 2. Angle band shell surfaces and outbuildings to bring early‐arriving first‐order sound reflec-
tions to the front of the audience. 3. Use amplification when the audience is large or the site is noisy. This may require an array of
many loudspeakers suspended high above the ground throughout the audience. So that listen-ers adjacent to the loudspeaker aren’t blown away, and listeners remote from the loudspeak-ers can still hear, make the far‐throw distance of each loudspeaker no more than double the near‐throw distance.
4. Put loudspeakers on a delay so that the direct sound from the source on stage arrives before the amplified sound from the loudspeaker.
5. Examine the geometry of the site for large building surfaces positioned so that they might deliver unwanted late‐arriving echoes.
Night Clubs and Small Rock Music Venues 1. Maintain a “flat” reverberation time, one that doesn’t rise in the 63‐Hz and 125‐Hz octave
bands, as many rooms for music do. This takes work because standing audience members absorb five times more in the mid- and high octave bands than the low octave bands, so mea-sured empty‐room reverberation times must dip down in the low frequencies to account for the audience impact.
2. Keep reverberation times low. For room volumes ranging from 30,000 to 200,000 cubic feet, reverberation times should lie between 0.6 and 1.2 seconds. Reviewers judge the best halls as “crisp” (least reverberant), and the least‐liked rooms generally are described as “boomy” (most reverberant).
3. When adding digital reverberance to an amplified track, use a filter to target only the mid- and high frequency so bass beats don’t sound smeared.
Cinemas 1. Place sound absorption on virtually every surface except the floor. 2. Isolate one cinema from the adjacent cinema with minimum STC 65 barriers (see the follow-
ing chapter, “Noise Control”).
Recording Studios 1. Achieve very low reverberation times. This requires ample absorption on most surfaces. 2. Avoid room resonance. Small rooms with parallel sound‐reflective walls produce standing
waves, so if a surface is sound reflective, splay, apply diffusion, or apply absorption on the opposite surface. This includes the floor‐ceiling surfaces.
3. Maintain excellent noise isolation, both from the inside to out, and from the outside to in. The audible conversation in the hallway can ruin the recording track, and the rock band recording this morning can ruin relations with the neighbors.
4. Start big. The sound isolation and absorption measures will eat up considerable room height; the room’s raw floor‐to‐ceiling height should be at least 13 feet tall before finishes are added.
Room Acoustics 123
souND system DesigN
Electronic Sound ReinforcementThe author, attending a sporting event in a new stadium, was perplexed. The arena was less than half full, and the fans around me appeared placid, yet the fan noise was electric. I can only specu-late that the audience noise was either picked up by microphones in other seating sections and amplified to mine or—like a sitcom laugh track—recorded elsewhere from some other location at an earlier time and piped in. Yet the enthusiastic crowd noise didn’t sound amplified. It lacked the distant, tinny, echo‐y character endemic to stadiums, and instead sounded immediate, proximate, and ambient. Such is the state of contemporary electronic sound reinforcement. If it’s done cor-rectly, it’s difficult to detect the presence of the loudspeaker system at all.
Often loudspeakers are exposed, in plain sight, but you too have likely been unknowingly in the presence of amplified sound from hidden equipment. Masking noise commonly plays over hid-den speakers in open‐plan offices to preserve some of the privacy of conversations; loudspeak-ers amplify speech in lecture rooms; and digital reverberance radiates from hidden equipment, enhancing the extant reverberance in rooms for music. This is despite the criticism of purists who deride amplification as ersatz or saccharine.
Effective amplification systems preserve localization, the listeners’ sense that the sound they’re hearing is approaching from the original source, rather than approaching from the nearest loud-speaker. This typically necessitates loudspeakers in the vertical plane above the source, with the amplified sound arriving to the ear after the direct sound, and amplifiers set not‐too‐loud. It is common, but misguided, to design two separate loudspeaker groupings, one to each side of the source, to achieve a “stereo” effect. This destroys localization. Because one’s ears are on either side of the head, the human auditory system is better at locating sound in the horizontal plane than in the vertical plane. For this reason, amplified sound arriving from the vertical plane com-mon to the source is more easily recognized as emanating from the direction of the source. For tall rooms this translates to central cluster loudspeaker groupings high above the middle of the stage, 20 to 40 feet above, and slightly in front of the source. Amplified sound arrives after the direct sound because it’s traveled farther. Because it doesn’t come from either side, the system maintains proper localization. (Electronic reverberation systems and other digital effects may require loudspeakers in multiple locations throughout a room.) In long, low rooms, a single cluster fails to bring appropriate sound levels to both the front and back of the room simultane-ously. Alternately, many smaller loudspeakers may be integrated into the seatback in front of each row of listeners. For those spaces, a loudspeaker array with digitally delayed signals allows the amplified sound to arrive after the direct sound.
In amplified spaces, aim the loudspeakers to fully cover the audience, but not so close to the edges that sound spills over to the walls and other non‐audience surfaces of the room. (Loudspeakers have narrow directivity in higher frequencies, and approach omni‐directionality with decreas-ing frequency.) When amplified sound reflects off room surfaces, it becomes muddled. Besides, if reverberance is required, it can be added electronically, baked into the signal upstream of the loudspeaker rather than delivered by the room. For this reason, amplified spaces require much shorter reverberation times and more absorbent room surfaces.
To prevent screeching feedback, aim loudspeakers so they don’t point to microphones. This can be difficult if the source is a roamer, as with a stand‐up comedian who walks the aisles interacting with the audience. Don’t run microphone, loudspeaker, and amplifier cables in the same conduit
124 Architectural Acoustics Illustrated
or very close together, as the electromagnetism of one may interfere with the signal of the other, again causing signal distortion.
Finally, the technicians who mix and signal shape (with an equalizer) in real time during a show require an environment that sounds like the room they’re mixing for, and it is best to locate them in the room itself. It’s part art and part science; the sound engineers can best hear and react to the effects of the sound equipment if they are within the same space as the audience. Sacrifice some audience seats (50 square feet or more) for a remote mixing station in the house, which will typically communicate to a semi‐enclosed sound booth in the back of the house, behind the last row of seats on one or more of the levels. (Do not locate the remote mixing station exactly at house‐center because, in symmetrical rooms, that is a location rife with phase cancelation, room modes, and acoustic resonance peculiarities. Better to be just outside the center line of the room, about two‐thirds of the way back on the main level.)
To determine the maximum distance between loudspeaker and listener
dQVT
≅ 0 1.
Where d is the maximum loudspeaker‐to‐listener distance in feetQ is the loudspeaker directivity (narrow beam spread loudspeakers have values approaching 15, and speakers with wider coverage approach Q values of 2)V is the room volume in cubic feetT is the reverberation time in seconds
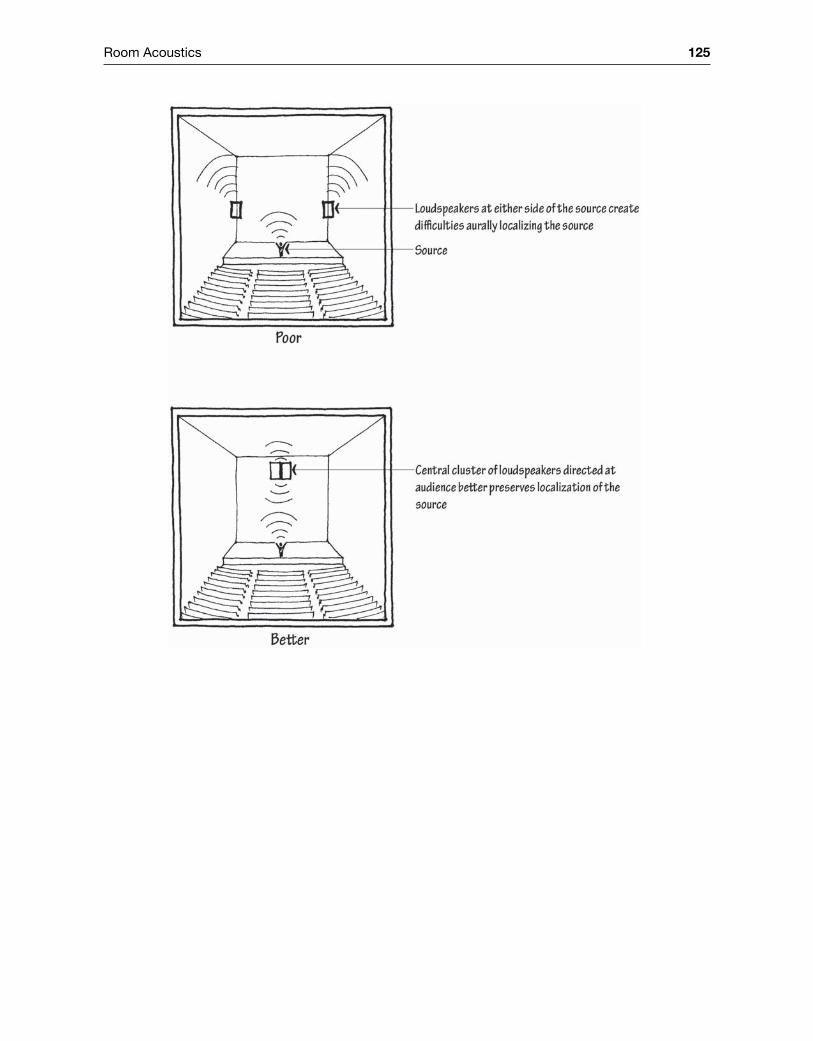
Room Acoustics 125
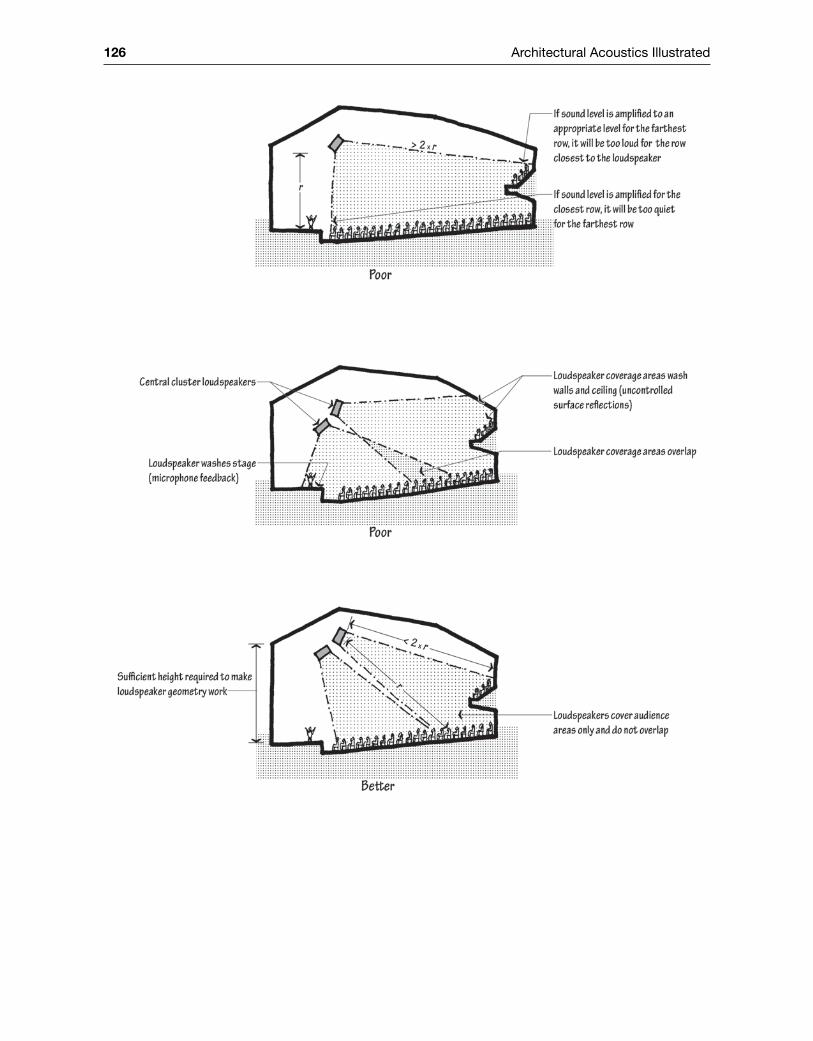
126 Architectural Acoustics Illustrated
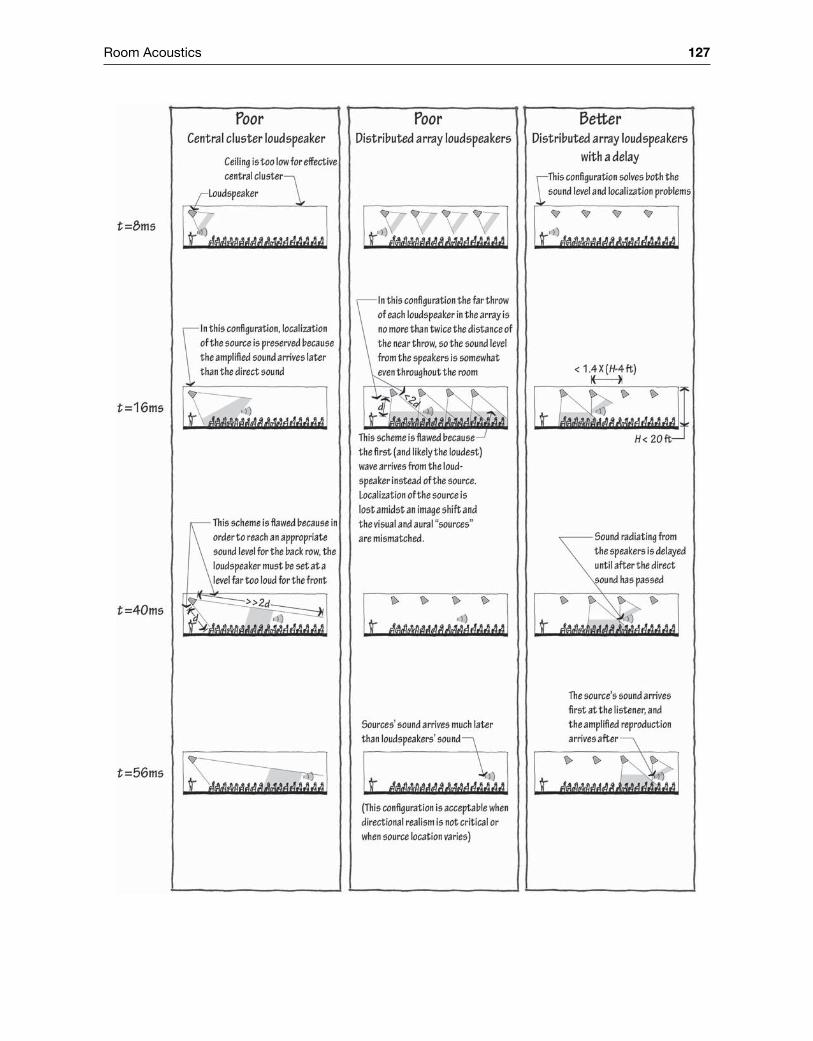
Room Acoustics 127

128 Architectural Acoustics Illustrated
ReferenceAdelman‐Larsen, N. et al. “Suitable Reverberation Times for Halls for Rock and Pop Music.” Journal of the
Acoustical Society of America, January 2010.American National Standards Institute. 2002. ANSI S12.60, Acoustical Performance Criteria, Design
Requirements, and Guidelines for Schools.Ando, Y. 1998. Architectural Acoustics: Blending Sound Sources, Sound Fields, and Listeners. Springer‐Verlag.Barron, M. 2009. Auditorium Acoustics and Architectural Design, 2nd ed. Spon Press.Barron, M. “Measured Early Lateral Energy Fractions in Concert Halls and Opera Houses.” Journal of
Sound and Vibration, April 20, 2000.Barron, M. “Late Lateral Energy Fractions and the Envelopment Question in Concert Halls.” Applied
Acoustics, 2001.Barron, M. “Subjective Study of British Symphony Concert Halls.” Acta Acoustica united with Acoustica,
June 1988, pp. 1–14, 42–43.Barron, M. and L. Lee. “Energy Relations in Concert Auditoriums.” Journal of the Acoustical Society of
America, August 1988.Beranek, L. 2004. Concert Halls and Opera Houses: Music, Acoustics, and Architecture. Springer.Beranek, L. 2008. Riding the Waves: A life in Sound, Science, and Industry. MIT Press. Cambridge, MA,
pp. 146–151.Beranek, L. “The Sound Strength Parameter G and Its Importance in Evaluating and Planning the Acoustics
of Halls for Music.” Journal of the Acoustical Society of America, May 2011.Beranek, L. “Subjective Rank‐Orderings and Acoustical Measurements for Fifty‐Eight Concert Halls,”
Journal of the European Acoustics Association, Vol. 89, 2003, pp. 494–508.Bradley, J. “Some Further Investigations of the Seat Dip Effect.” Journal of the Acoustical Society of America,
July 1991.Byrne, D. “How Architecture Helped Music Evolve,” TED Talks, February 2010.Cavanaugh, W. et al. (ed.). 2010. Architectural Acoustics, 2nd ed. John Wiley & Sons. Hoboken, NJ, pp.
136, 213.Cox, T. and P. D’Antonio. 2009. Acoustic Absorbers and Diffusers: Theory, Design and Application. CRC
Press.Cremer, L. and H. Müller. 1978. Principles and Applications of Room Acoustics, Vol. 1. Applied Science
Publishers, pp. 189–292.Dammerud, J. and M. Barron. “Attenuation of Direct Sound and the Contributions of Early Reflections
within Symphony Orchestras.” Journal of the Acoustical Society of America, October, 2010.Egan, M. D. 2007. Architectural Acoustics. J. Ross Publishing. Plantation, FL, pp. 64–173, 88–170,
355–381, 666.Egan, M. D. 2000. Architectural Acoustics Workbook. Newman Foundation.Ermann, M. “Double Sloped Decay: Subjective Listening Test to Determine Perceptibility and Preference.”
Building Acoustics, June 2007.Ermann, M. and M. Johnson. “Exposure and Materiality of the Secondary Room and Its Impact on the
Impulse Response of Coupled Volumes.” Journal of Sound and Vibration, December 2004.Haan, C. and F. Fricke. 1993. “Surface Diffusivity as a Measure of the Acoustic Quality of Concert Halls.”
Proceedings of the Conference of the Australia and New Zealand Architectural Science Association.Hidaka, T. and N. Nishihara. “A New Definition of Boundary Point Between Early Reflections and Late
Reverberation in Room Impulse Responses.” Journal of the Acoustical Society of America, July 2007, pp. 326–332.
Hidaka, T. and N. Nishihara. “Objective Evaluation of Chamber‐music Halls in Europe and Japan.” Jour-nal of the Acoustical Society of America, July, 2004.
Hidaka, T. et al. “Relation of Acoustical Parameters with and without Audiences in Concert Halls and a Simple Method for Simulating the Occupied State.” Journal of the Acoustical Society of America, March, 2001.
Iglehart, F. “Combined Effects of Classroom Reverberation and Noise on Speech Perception by Students with Typical and Impaired Hearing. Internoise, August 2009.

Room Acoustics 129
Izenour, G. 1997. Theater Design, 2nd ed. Yale University Press, New Haven, CT.Knudsen, V. and C. Harris. 1978. Acoustical Designing in Architecture. Acoustical Society of America.Kuttruff, H. 2009. Room Acoustics. CRC Press, pp. 154–157, 221–228.Lee, D. et al. “The Effect of Loudness on the Reverberance of Music: Reverberance Prediction Using Loud-
ness Models.” Journal of the Acoustical Society of America, February 2012, pp. 1194–1205.Lokki, T. and J. Pätynen. “Lateral Reflections are Favorable in Concert Halls Due to Binaural Loudness.”
Journal of the Acoustical Society of America, October 2011.Long, M. 2006. Architectural Acoustics. Elsevier. New York, NY, pp. 1–35, 587, 653–692, 701–702.Mehta, M. et al. 1998. Architectural Acoustics. Merrill Prentice Hall, pp. 217–218.Newell, P. 2011. Recording Studio Design. Focal Press.Newhouse, V. 2012. Site and Sound: The Architecture and Acoustics of New Opera Houses and Concert
Halls. Montecelli Press.Okano, T. “Judgments of Noticeable Difference in Sound Fields of Concert Halls Caused by Intensity Vari-
ations in Early Reflections.” Journal of the Acoustical Society of America, January 2002.Ryu, J. and J. Jeon. “Subjective and Objective Evaluations of a Scattered Sound Field in a Scale Model
Opera House.” Journal of the Acoustical Society of America, September 2008.Sabine, W. C. 1923. Collected Papers on Acoustics. Harvard University Press. Cambridge, MA, pp. 3–67.Schroeder, M. “New Method of Measuring Reverberation Time.” Journal of the Acoustical Society of
America, Vol. 37, 1965, pp. 409–412.Siebein, G. W. 1990. Demonstration of Basic Acoustical Principles Using Scale Models. A Video Produced
for the Acoustical Society of America Newman Fund Schultz Grant.Siebein, G. W. and M. Gold. 1998. “New Methods to Integrate Acoustic Design Principals [sic] in Archi-
tectural Practice.” FA/AIA Annual Meeting Continuing Education Program, Environment/Technology Track, pp. 3‐18 to 3‐20.
Soulodre, G. and J. Bradley. “Subjective Evaluation of New Room Acoustics Measures.” Journal of the Acoustical Society of America, Vol. 98, 1995, pp. 294–301.
Takahashi, D. “Seat Dip Effect: The Phenomena and the Mechanism.” Journal of the Acoustical Society of America, July 2004.
Thompson, E. 2004. The Soundscape of Modernity: Architectural Acoustics and the Culture of Listening in America, 1900–1933. MIT Press. Cambridge, MA.
Yaday, M. et al. “Auditory Room Size Perceived from Room Acoustic Simulation With Autophonic Stim-uli.” Acoustics Australia, December 2011.

Noise CoNtrol
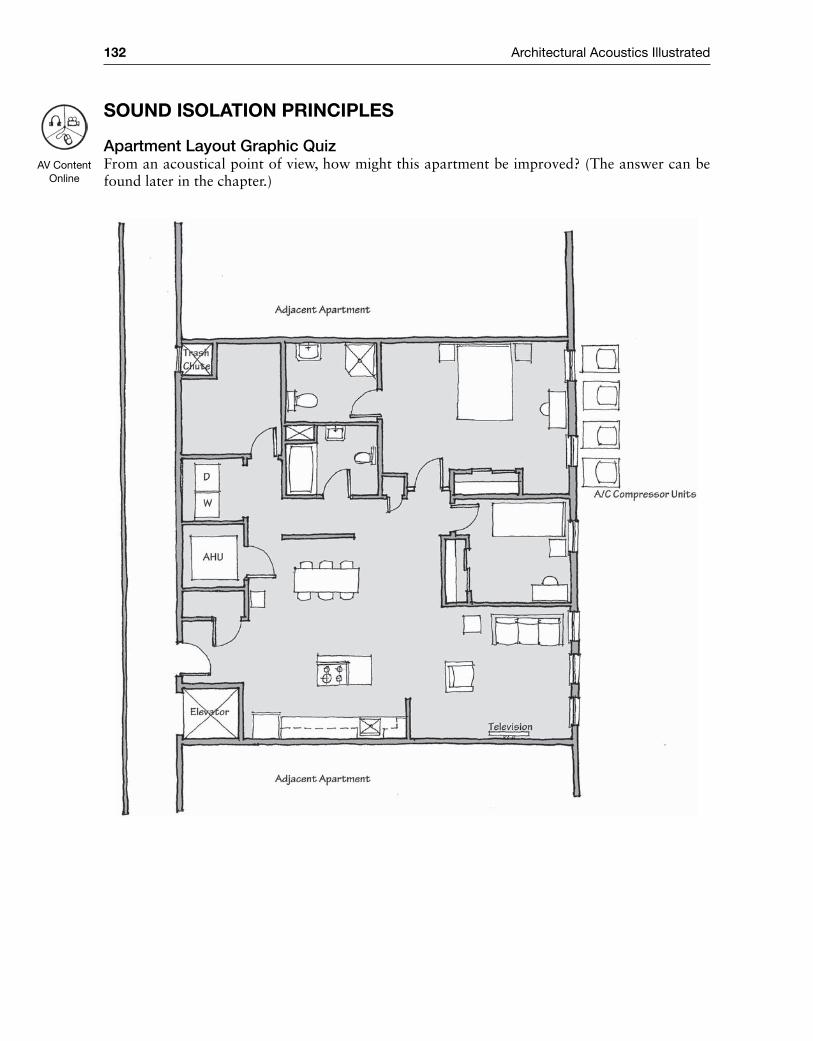
132 Architectural Acoustics Illustrated
souNd isolatioN PriNCiPles
Apartment Layout Graphic QuizFrom an acoustical point of view, how might this apartment be improved? (The answer can be found later in the chapter.)
AV Content Online
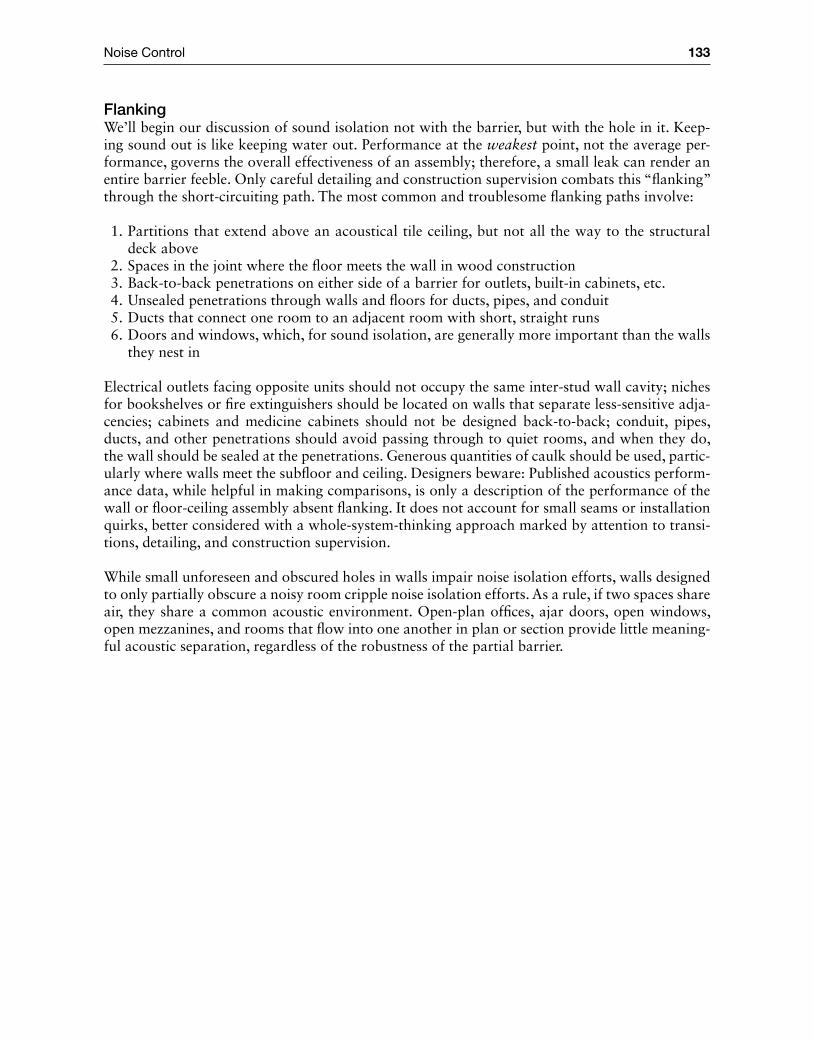
Noise Control 133
FlankingWe’ll begin our discussion of sound isolation not with the barrier, but with the hole in it. Keep-ing sound out is like keeping water out. Performance at the weakest point, not the average per-formance, governs the overall effectiveness of an assembly; therefore, a small leak can render an entire barrier feeble. Only careful detailing and construction supervision combats this “flanking” through the short‐circuiting path. The most common and troublesome flanking paths involve:
1. Partitions that extend above an acoustical tile ceiling, but not all the way to the structural deck above
2. Spaces in the joint where the floor meets the wall in wood construction 3. Back‐to‐back penetrations on either side of a barrier for outlets, built‐in cabinets, etc. 4. Unsealed penetrations through walls and floors for ducts, pipes, and conduit 5. Ducts that connect one room to an adjacent room with short, straight runs 6. Doors and windows, which, for sound isolation, are generally more important than the walls
they nest in
Electrical outlets facing opposite units should not occupy the same inter‐stud wall cavity; niches for bookshelves or fire extinguishers should be located on walls that separate less‐sensitive adja-cencies; cabinets and medicine cabinets should not be designed back‐to‐back; conduit, pipes, ducts, and other penetrations should avoid passing through to quiet rooms, and when they do, the wall should be sealed at the penetrations. Generous quantities of caulk should be used, partic-ularly where walls meet the subfloor and ceiling. Designers beware: Published acoustics perform-ance data, while helpful in making comparisons, is only a description of the performance of the wall or floor‐ceiling assembly absent flanking. It does not account for small seams or installation quirks, better considered with a whole‐system‐thinking approach marked by attention to transi-tions, detailing, and construction supervision.
While small unforeseen and obscured holes in walls impair noise isolation efforts, walls designed to only partially obscure a noisy room cripple noise isolation efforts. As a rule, if two spaces share air, they share a common acoustic environment. Open‐plan offices, ajar doors, open windows, open mezzanines, and rooms that flow into one another in plan or section provide little meaning-ful acoustic separation, regardless of the robustness of the partial barrier.
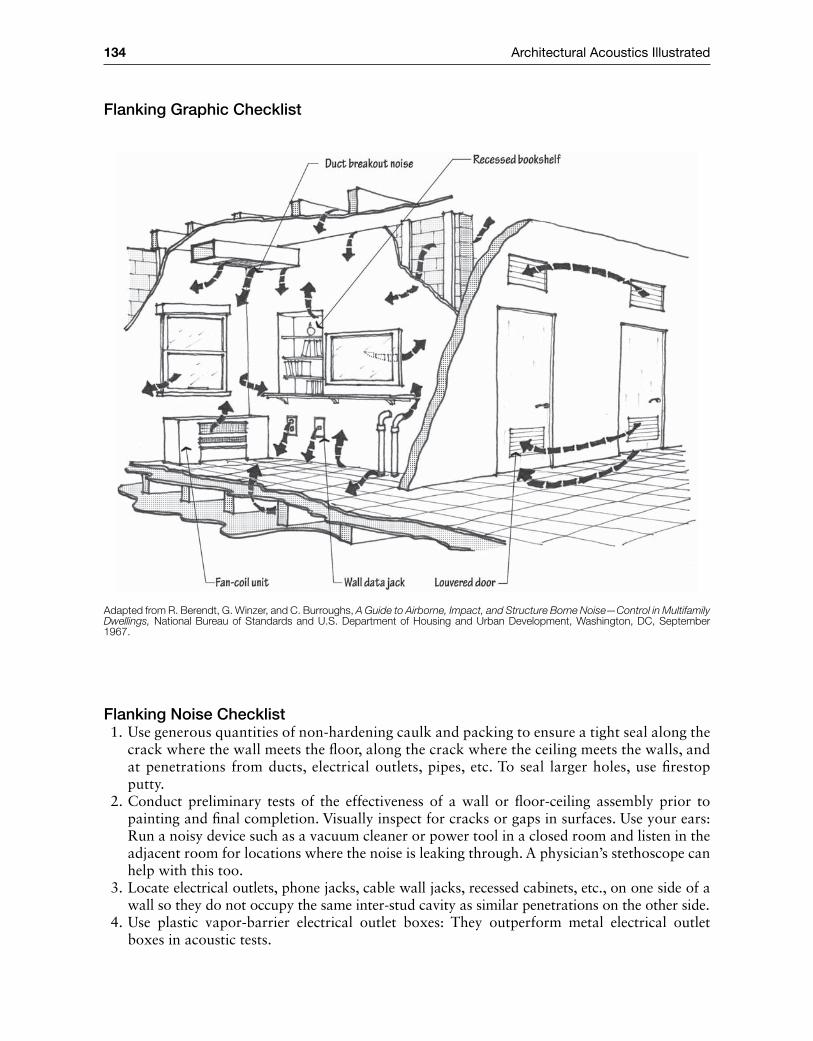
134 Architectural Acoustics Illustrated
Flanking Graphic Checklist
Adapted from R. Berendt, G. Winzer, and C. Burroughs, A Guide to Airborne, Impact, and Structure Borne Noise—Control in Multifamily Dwellings, National Bureau of Standards and U.S. Department of Housing and Urban Development, Washington, DC, September 1967.
Flanking Noise Checklist 1. Use generous quantities of non‐hardening caulk and packing to ensure a tight seal along the
crack where the wall meets the floor, along the crack where the ceiling meets the walls, and at penetrations from ducts, electrical outlets, pipes, etc. To seal larger holes, use firestop putty.
2. Conduct preliminary tests of the effectiveness of a wall or floor‐ceiling assembly prior to painting and final completion. Visually inspect for cracks or gaps in surfaces. Use your ears: Run a noisy device such as a vacuum cleaner or power tool in a closed room and listen in the adjacent room for locations where the noise is leaking through. A physician’s stethoscope can help with this too.
3. Locate electrical outlets, phone jacks, cable wall jacks, recessed cabinets, etc., on one side of a wall so they do not occupy the same inter‐stud cavity as similar penetrations on the other side.
4. Use plastic vapor‐barrier electrical outlet boxes: They outperform metal electrical outlet boxes in acoustic tests.
Noise Control 135
5. Design for building control joints where needed. The proper use of control joints to account for differential expansion and contraction will minimize the future cracking of walls, and therefore minimize the potential for sound flanking through cracks. Because control joints offer vibration isolation as well, locate rotating and reciprocal‐motion equipment such as pumps, compressors, chillers, cooling towers, generators, exhaust fans, air handlers, washers, and dryers on an independent building segment—separated from quiet spaces with building control joints.
6. Resiliently (nonrigidly) connect room surfaces to the structure. This breaks the “weak link” sound path that might bridge, for instance, across a stud rigidly attached to gypsum board.
7. Specify resilient sound isolation clips with hat channel to attach gypsum board to walls. These clip systems outperform resilient channel in acoustic tests for walls (resilient channel works just as well on ceilings) and are less likely to be short‐circuited. Flanking issues can arise when improperly long drywall screws are used and short‐circuit the resilient channel by biting directly into the joist or stud. Cabinets or baseboard trim attached directly to the studs can also short‐circuit the isolation provided by resilient connections.
8. Avoid doors with louvers in all noise‐sensitive rooms. Doors with seals outperform doors without them; doors with gaps at their bases less than 1
16‐inch outperform those with gaps of 14‐inch or more.
9. Extend partitions above dropped ceilings, all the way to the structural deck above. While acoustical ceiling tile is effective at absorbing the sound in a room, it typically does not impede sound from leaking into an above‐ceiling plenum, then from that plenum to an adja-cent room. When partitions do not extend all the way to the deck above, either seal the partition to the slab in the plenum with sheets of mass‐loaded vinyl, or specify a high ceiling attenuation class (CAC) ceiling tile (which provides sound absorption and sound isolation).
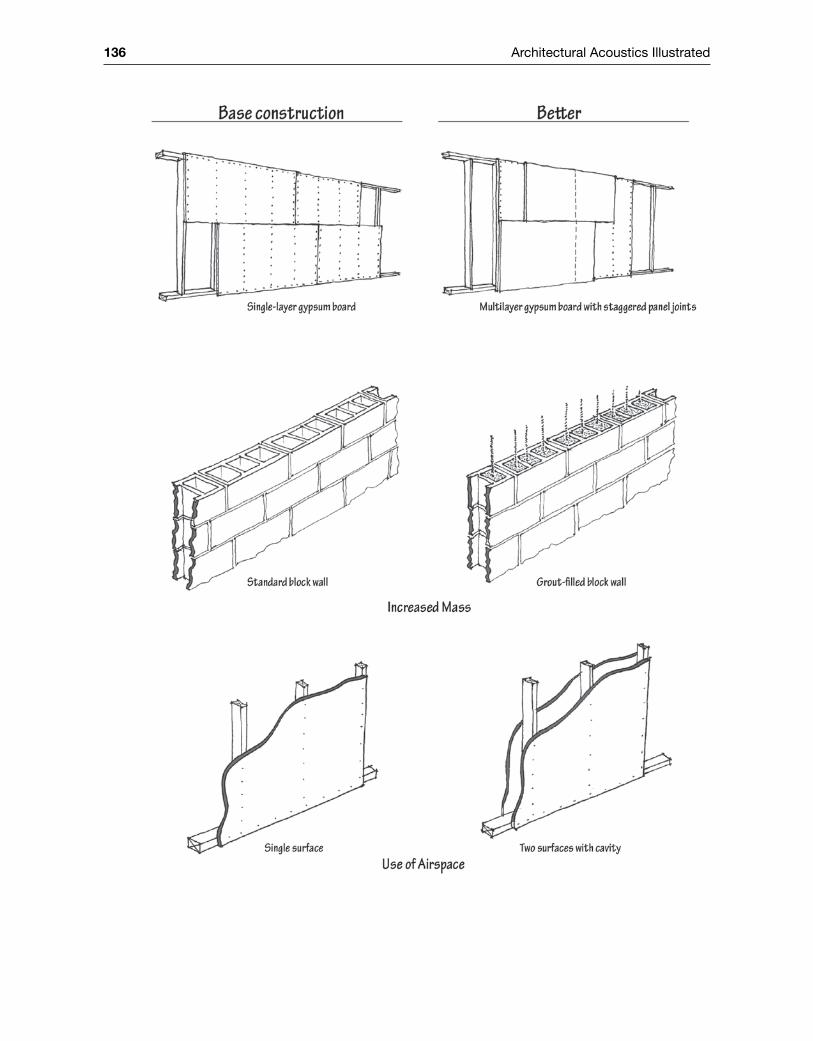
136 Architectural Acoustics Illustrated

Noise Control 137

138 Architectural Acoustics Illustrated
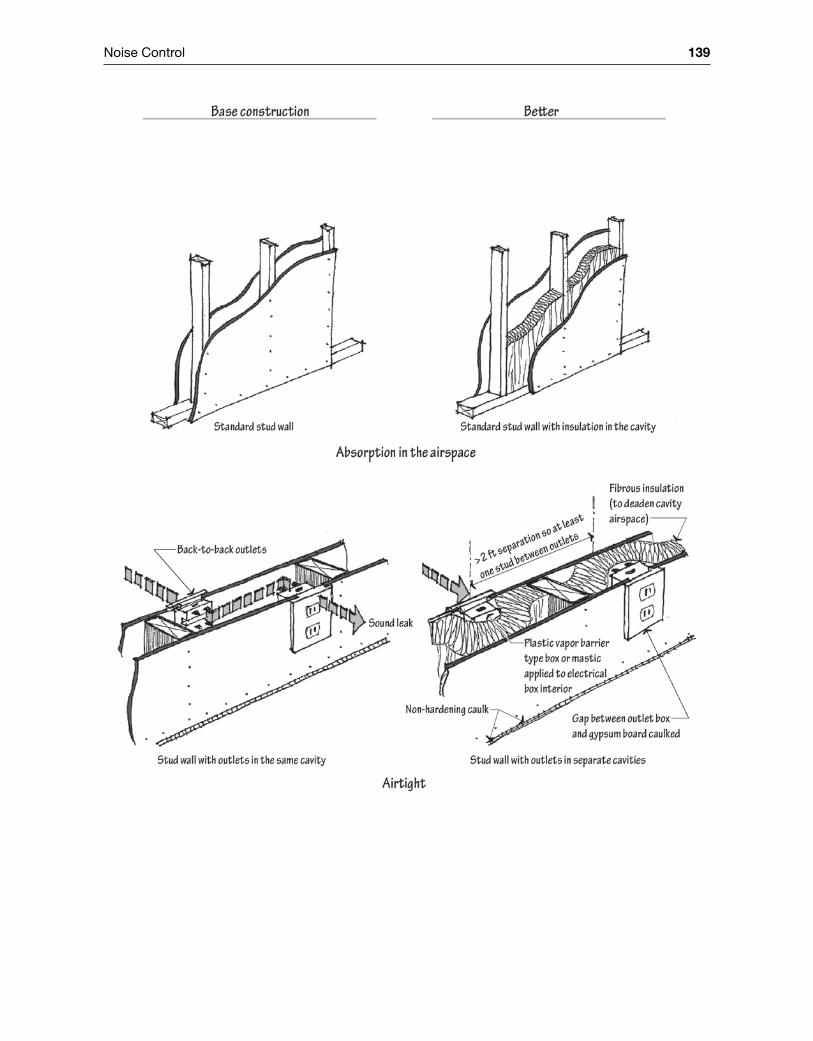
Noise Control 139
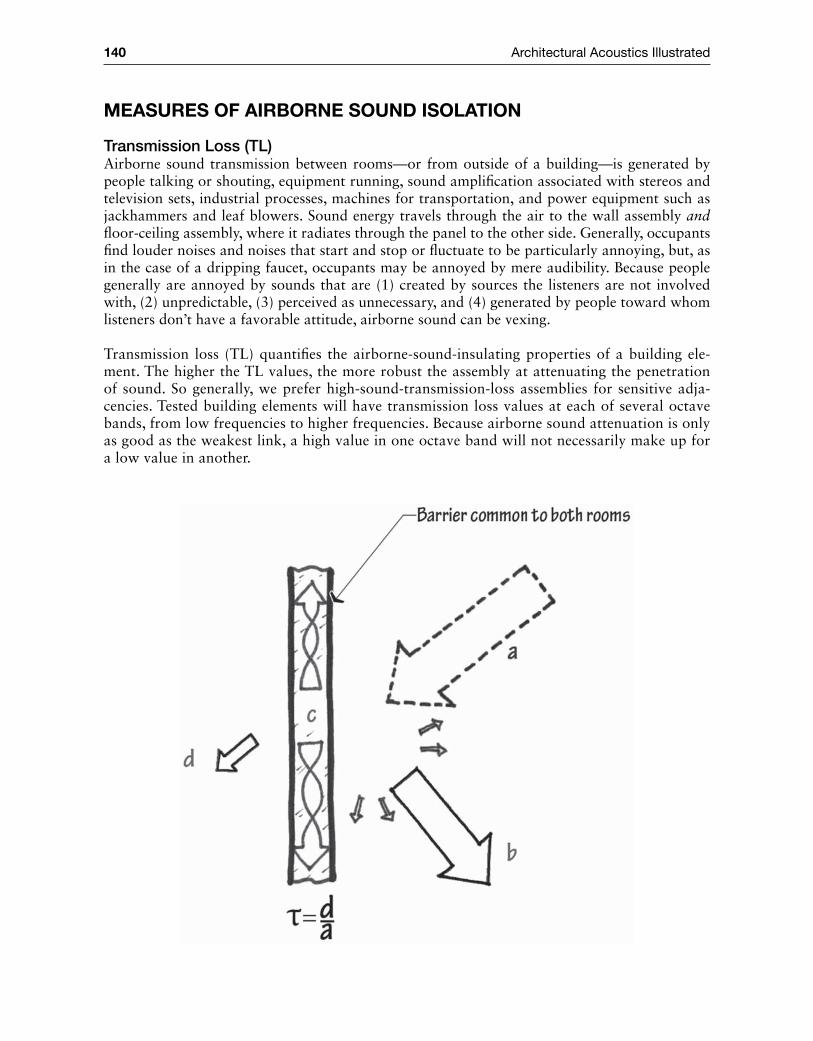
140 Architectural Acoustics Illustrated
Measures of airborNe souNd isolatioN
Transmission Loss (TL)Airborne sound transmission between rooms—or from outside of a building—is generated by people talking or shouting, equipment running, sound amplification associated with stereos and television sets, industrial processes, machines for transportation, and power equipment such as jackhammers and leaf blowers. Sound energy travels through the air to the wall assembly and floor‐ceiling assembly, where it radiates through the panel to the other side. Generally, occupants find louder noises and noises that start and stop or fluctuate to be particularly annoying, but, as in the case of a dripping faucet, occupants may be annoyed by mere audibility. Because people generally are annoyed by sounds that are (1) created by sources the listeners are not involved with, (2) unpredictable, (3) perceived as unnecessary, and (4) generated by people toward whom listeners don’t have a favorable attitude, airborne sound can be vexing.
Transmission loss (TL) quantifies the airborne‐sound‐insulating properties of a building ele-ment. The higher the TL values, the more robust the assembly at attenuating the penetration of sound. So generally, we prefer high‐sound‐transmission‐loss assemblies for sensitive adja-cencies. Tested building elements will have transmission loss values at each of several octave bands, from low frequencies to higher frequencies. Because airborne sound attenuation is only as good as the weakest link, a high value in one octave band will not necessarily make up for a low value in another.
Noise Control 141
Transmission loss (TL) in decibels can be calculated:
TLtransmission loss = −10log τ
Where the sound transmission coefficient, τ, is the fraction (between 0 and 1) of the total sound energy striking the barrier that is transmitted to the receiving room
One can sometimes hear the bass beat of a car stereo for what seems like a two‐block radius, yet can’t make out the lyrics until the car is close and the door is opened. Low‐frequency sound energy travels far, and easily moves through some building assemblies, particularly lightweight constructions. The low‐pitched hum of an air‐handling unit in the next room, the groan of a bus accelerating outside, and the amplified bass notes associated with loud stereos transmit through many wall and floor‐ceiling assemblies (and cars) barely attenuated. Designers beware: Examine published or measured TL values at low frequencies when low tones will be present in the source spectrum. When accounting for low‐frequency noises associated with amplified music, trans-portation noise, and mechanical equipment rumble, select a building assembly with high 63‐Hz, 125‐Hz, and 250‐Hz octave‐band TL values.
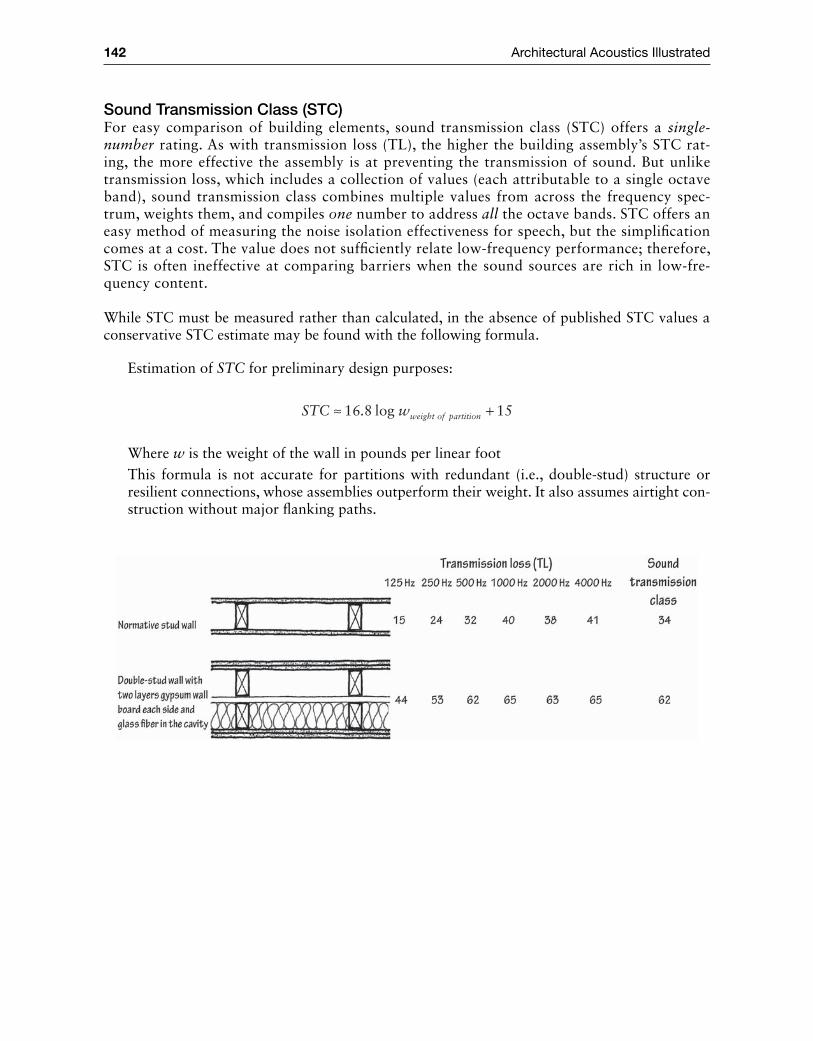
142 Architectural Acoustics Illustrated
Sound Transmission Class (STC)For easy comparison of building elements, sound transmission class (STC) offers a single‐number rating. As with transmission loss (TL), the higher the building assembly’s STC rat-ing, the more effective the assembly is at preventing the transmission of sound. But unlike transmission loss, which includes a collection of values (each attributable to a single octave band), sound transmission class combines multiple values from across the frequency spec-trum, weights them, and compiles one number to address all the octave bands. STC offers an easy method of measuring the noise isolation effectiveness for speech, but the simplification comes at a cost. The value does not sufficiently relate low‐frequency performance; therefore, STC is often ineffective at comparing barriers when the sound sources are rich in low‐fre-quency content.
While STC must be measured rather than calculated, in the absence of published STC values a conservative STC estimate may be found with the following formula.
Estimation of STC for preliminary design purposes:
STC wweight of partition≈ +16 8 log 15.
Where w is the weight of the wall in pounds per linear footThis formula is not accurate for partitions with redundant (i.e., double‐stud) structure or resilient connections, whose assemblies outperform their weight. It also assumes airtight con-struction without major flanking paths.
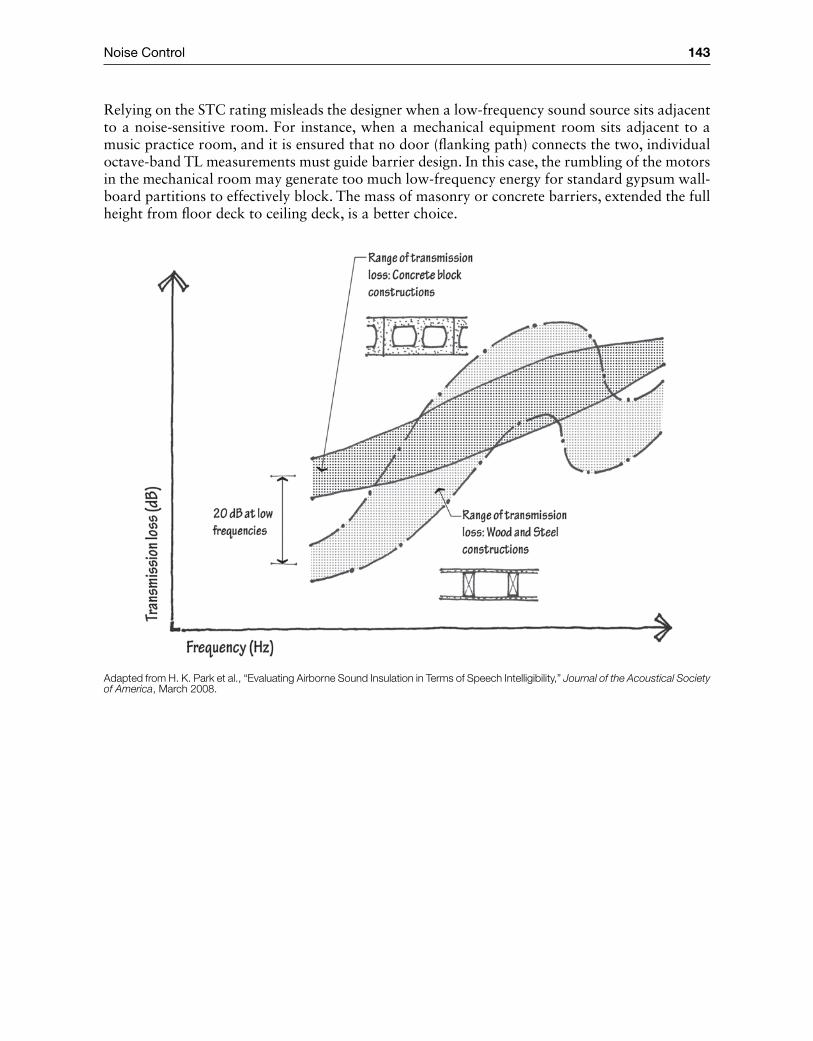
Noise Control 143
Relying on the STC rating misleads the designer when a low‐frequency sound source sits adjacent to a noise‐sensitive room. For instance, when a mechanical equipment room sits adjacent to a music practice room, and it is ensured that no door (flanking path) connects the two, individual octave‐band TL measurements must guide barrier design. In this case, the rumbling of the motors in the mechanical room may generate too much low‐frequency energy for standard gypsum wall-board partitions to effectively block. The mass of masonry or concrete barriers, extended the full height from floor deck to ceiling deck, is a better choice.
Adapted from H. K. Park et al., “Evaluating Airborne Sound Insulation in Terms of Speech Intelligibility,” Journal of the Acoustical Society of America, March 2008.
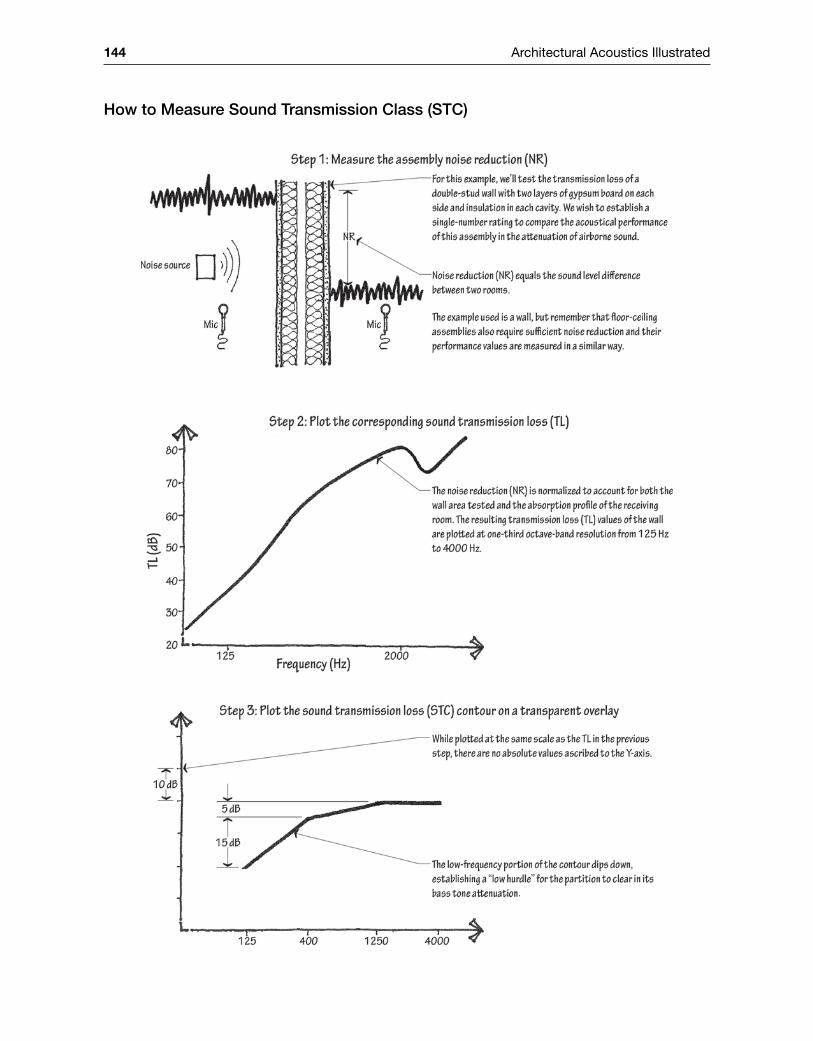
144 Architectural Acoustics Illustrated
How to Measure Sound Transmission Class (STC)
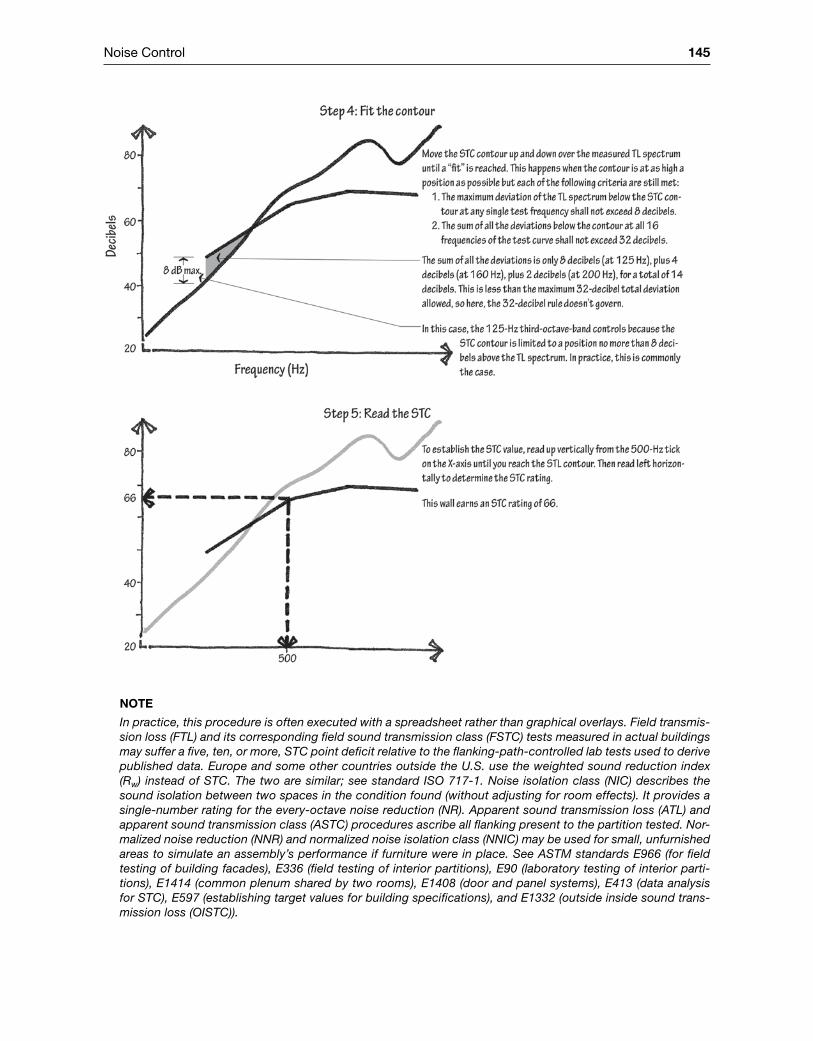
Noise Control 145
Note
In practice, this procedure is often executed with a spreadsheet rather than graphical overlays. Field transmis-sion loss (FTL) and its corresponding field sound transmission class (FSTC) tests measured in actual buildings may suffer a five, ten, or more, STC point deficit relative to the flanking‐path‐controlled lab tests used to derive published data. Europe and some other countries outside the U.S. use the weighted sound reduction index (Rw) instead of STC. The two are similar; see standard ISO 717‐1. Noise isolation class (NIC) describes the sound isolation between two spaces in the condition found (without adjusting for room effects). It provides a single‐number rating for the every‐octave noise reduction (NR). Apparent sound transmission loss (ATL) and apparent sound transmission class (ASTC) procedures ascribe all flanking present to the partition tested. Nor-malized noise reduction (NNR) and normalized noise isolation class (NNIC) may be used for small, unfurnished areas to simulate an assembly’s performance if furniture were in place. See ASTM standards E966 (for field testing of building facades), E336 (field testing of interior partitions), E90 (laboratory testing of interior parti-tions), E1414 (common plenum shared by two rooms), E1408 (door and panel systems), E413 (data analysis for STC), E597 (establishing target values for building specifications), and E1332 (outside inside sound trans-mission loss (OISTC)).
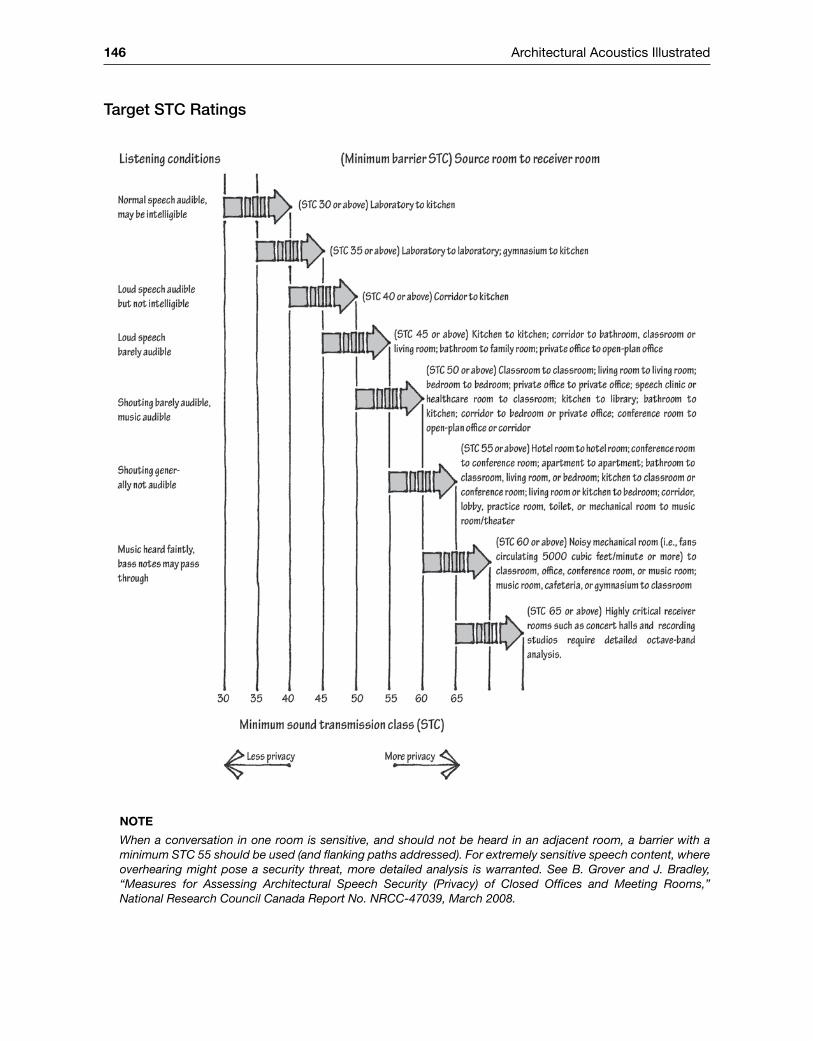
146 Architectural Acoustics Illustrated
Target STC Ratings
Note
When a conversation in one room is sensitive, and should not be heard in an adjacent room, a barrier with a minimum STC 55 should be used (and flanking paths addressed). For extremely sensitive speech content, where overhearing might pose a security threat, more detailed analysis is warranted. See B. Grover and J. Bradley, “Measures for Assessing Architectural Speech Security (Privacy) of Closed Offices and Meeting Rooms,” National Research Council Canada Report No. NRCC‐47039, March 2008.
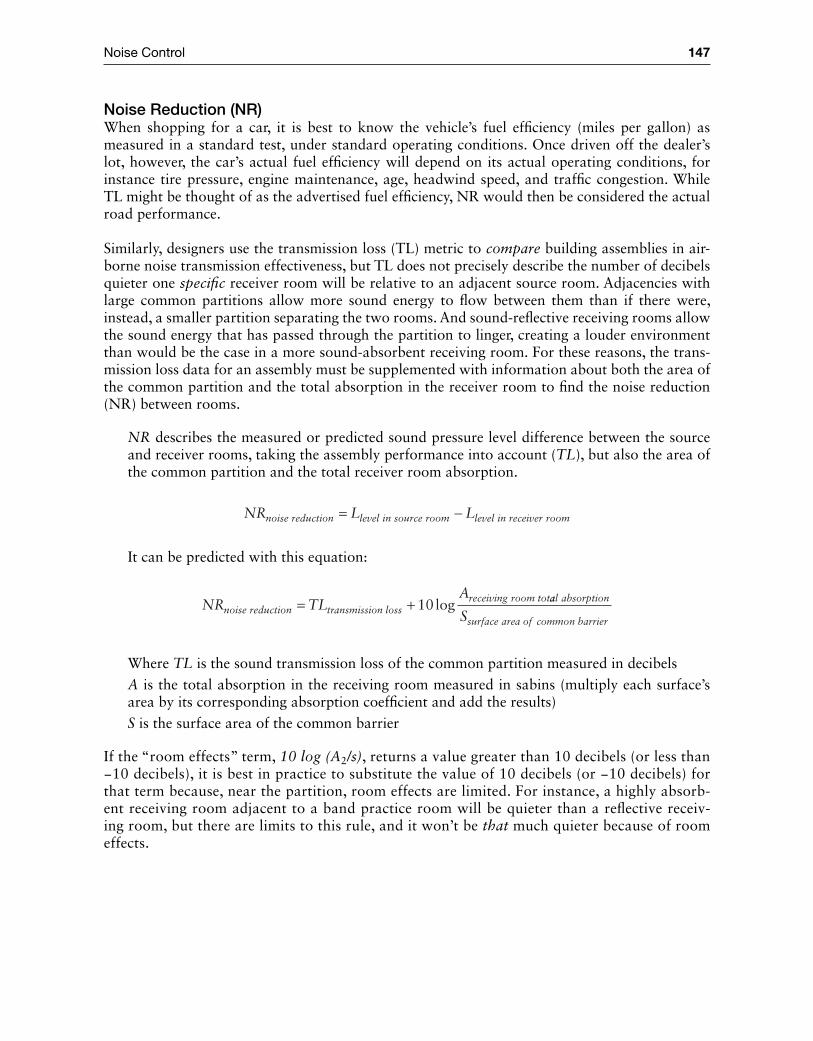
Noise Control 147
Noise Reduction (NR)When shopping for a car, it is best to know the vehicle’s fuel efficiency (miles per gallon) as measured in a standard test, under standard operating conditions. Once driven off the dealer’s lot, however, the car’s actual fuel efficiency will depend on its actual operating conditions, for instance tire pressure, engine maintenance, age, headwind speed, and traffic congestion. While TL might be thought of as the advertised fuel efficiency, NR would then be considered the actual road performance.
Similarly, designers use the transmission loss (TL) metric to compare building assemblies in air-borne noise transmission effectiveness, but TL does not precisely describe the number of decibels quieter one specific receiver room will be relative to an adjacent source room. Adjacencies with large common partitions allow more sound energy to flow between them than if there were, instead, a smaller partition separating the two rooms. And sound‐reflective receiving rooms allow the sound energy that has passed through the partition to linger, creating a louder environment than would be the case in a more sound‐absorbent receiving room. For these reasons, the trans-mission loss data for an assembly must be supplemented with information about both the area of the common partition and the total absorption in the receiver room to find the noise reduction (NR) between rooms.
NR describes the measured or predicted sound pressure level difference between the source and receiver rooms, taking the assembly performance into account (TL), but also the area of the common partition and the total receiver room absorption.
NR L Lnoise reduction level in source room level in receiver room= −
It can be predicted with this equation:
NR TLA
noise reduction transmission lossreceiving room tot= + 10log aal absorption
surface area of common barrierS
Where TL is the sound transmission loss of the common partition measured in decibelsA is the total absorption in the receiving room measured in sabins (multiply each surface’s area by its corresponding absorption coefficient and add the results)S is the surface area of the common barrier
If the “room effects” term, 10 log (A2/s), returns a value greater than 10 decibels (or less than −10 decibels), it is best in practice to substitute the value of 10 decibels (or −10 decibels) for that term because, near the partition, room effects are limited. For instance, a highly absorb-ent receiving room adjacent to a band practice room will be quieter than a reflective receiv-ing room, but there are limits to this rule, and it won’t be that much quieter because of room effects.
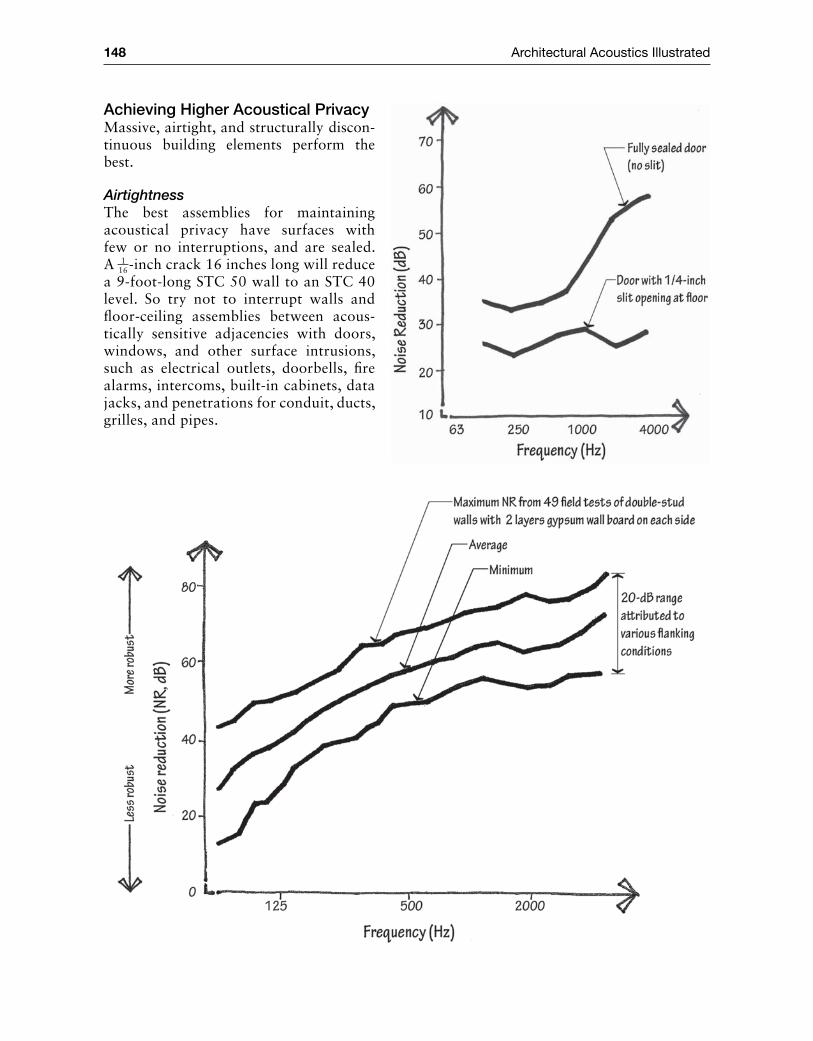
148 Architectural Acoustics Illustrated
Achieving Higher Acoustical PrivacyMassive, airtight, and structurally discon-tinuous building elements perform the best.
AirtightnessThe best assemblies for maintaining acoustical privacy have surfaces with few or no interruptions, and are sealed. A 1
16‐inch crack 16 inches long will reduce a 9‐foot‐long STC 50 wall to an STC 40 level. So try not to interrupt walls and floor‐ceiling assemblies between acous-tically sensitive adjacencies with doors, windows, and other surface intrusions, such as electrical outlets, doorbells, fire alarms, intercoms, built‐in cabinets, data jacks, and penetrations for conduit, ducts, grilles, and pipes.
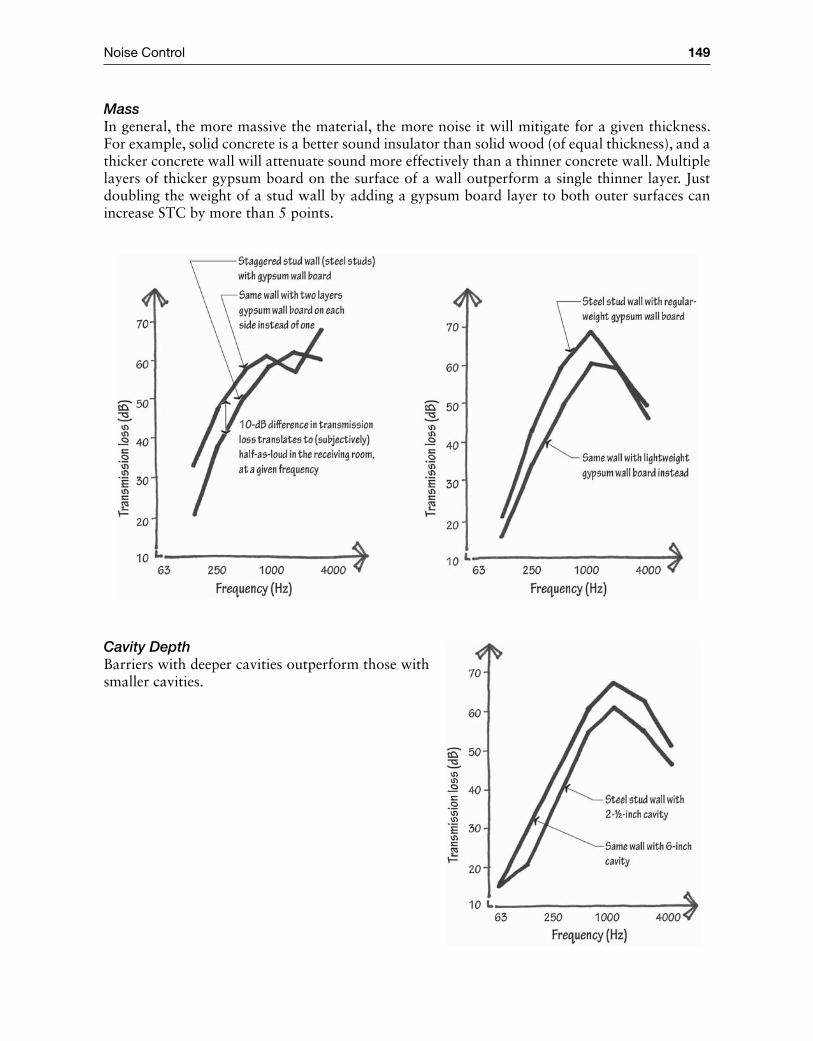
Noise Control 149
MassIn general, the more massive the material, the more noise it will mitigate for a given thickness. For example, solid concrete is a better sound insulator than solid wood (of equal thickness), and a thicker concrete wall will attenuate sound more effectively than a thinner concrete wall. Multiple layers of thicker gypsum board on the surface of a wall outperform a single thinner layer. Just doubling the weight of a stud wall by adding a gypsum board layer to both outer surfaces can increase STC by more than 5 points.
Cavity DepthBarriers with deeper cavities outperform those with smaller cavities.
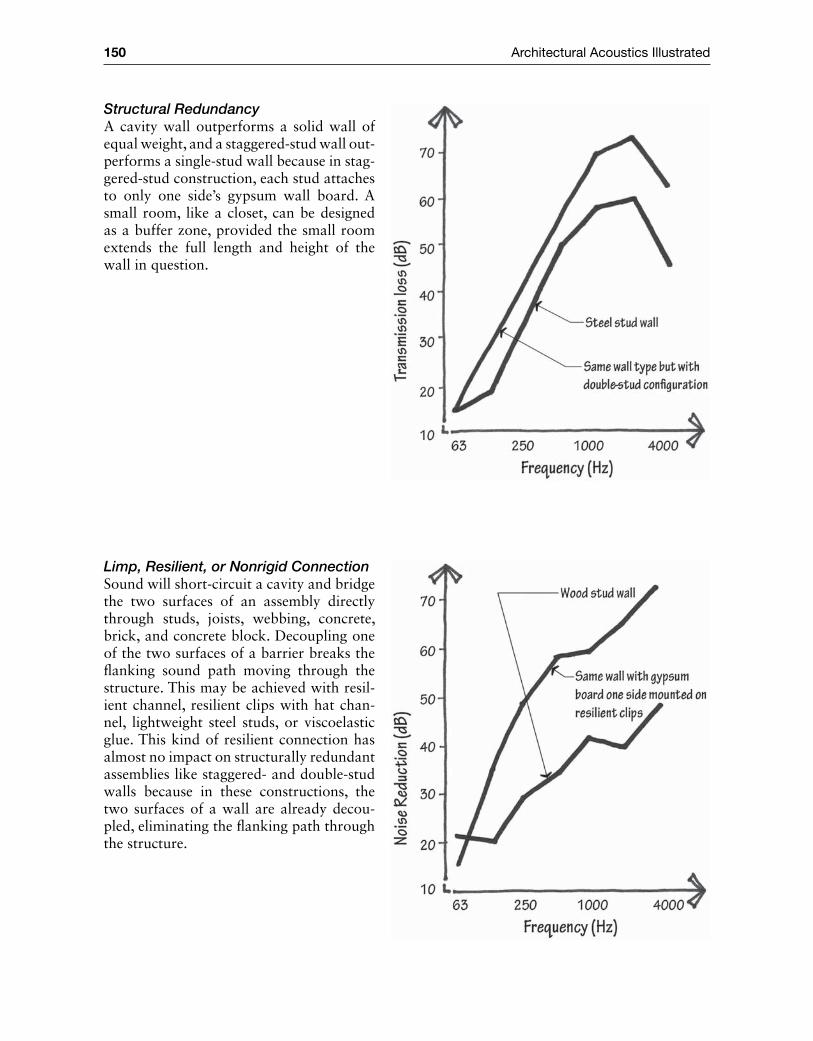
150 Architectural Acoustics Illustrated
Structural RedundancyA cavity wall outperforms a solid wall of equal weight, and a staggered‐stud wall out-performs a single‐stud wall because in stag-gered‐stud construction, each stud attaches to only one side’s gypsum wall board. A small room, like a closet, can be designed as a buffer zone, provided the small room extends the full length and height of the wall in question.
Limp, Resilient, or Nonrigid ConnectionSound will short‐circuit a cavity and bridge the two surfaces of an assembly directly through studs, joists, webbing, concrete, brick, and concrete block. Decoupling one of the two surfaces of a barrier breaks the flanking sound path moving through the structure. This may be achieved with resil-ient channel, resilient clips with hat chan-nel, lightweight steel studs, or viscoelastic glue. This kind of resilient connection has almost no impact on structurally redundant assemblies like staggered‐ and double‐stud walls because in these constructions, the two surfaces of a wall are already decou-pled, eliminating the flanking path through the structure.
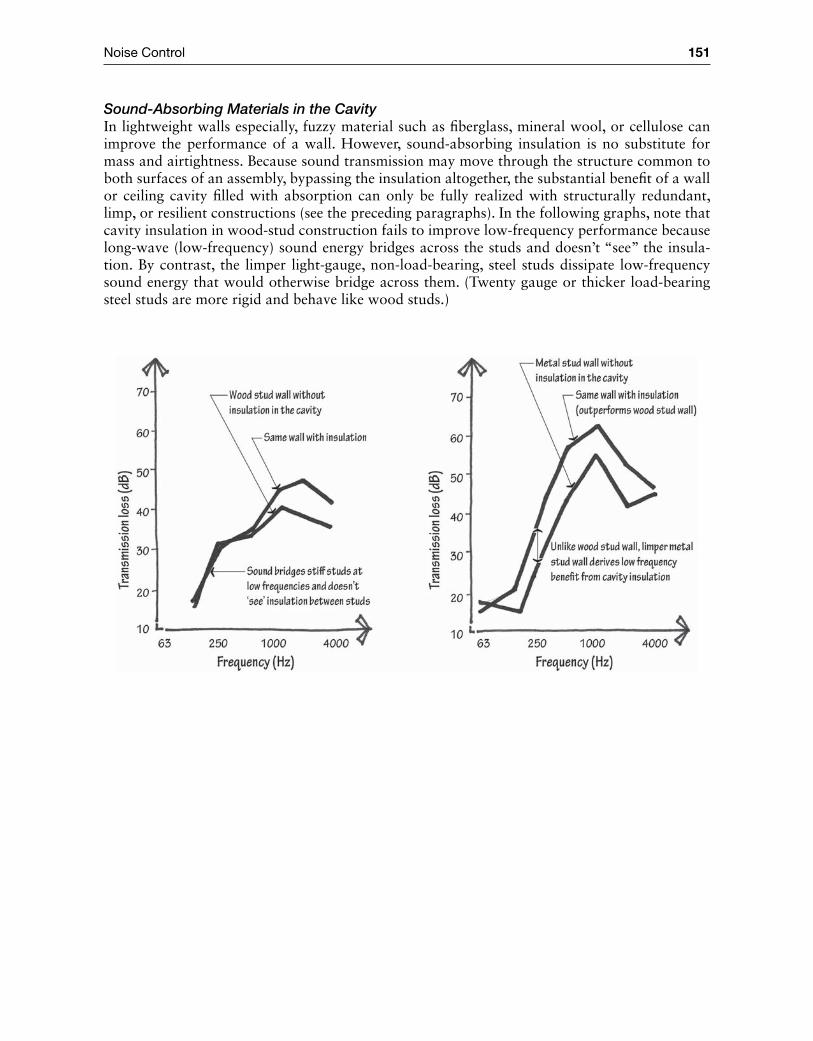
Noise Control 151
Sound‐Absorbing Materials in the CavityIn lightweight walls especially, fuzzy material such as fiberglass, mineral wool, or cellulose can improve the performance of a wall. However, sound‐absorbing insulation is no substitute for mass and airtightness. Because sound transmission may move through the structure common to both surfaces of an assembly, bypassing the insulation altogether, the substantial benefit of a wall or ceiling cavity filled with absorption can only be fully realized with structurally redundant, limp, or resilient constructions (see the preceding paragraphs). In the following graphs, note that cavity insulation in wood‐stud construction fails to improve low‐frequency performance because long‐wave (low‐frequency) sound energy bridges across the studs and doesn’t “see” the insula-tion. By contrast, the limper light‐gauge, non‐load‐bearing, steel studs dissipate low‐frequency sound energy that would otherwise bridge across them. (Twenty gauge or thicker load‐bearing steel studs are more rigid and behave like wood studs.)

152 Architectural Acoustics Illustrated
baCkgrouNd Noise
Background NoiseIn the late 1990s, forty experienced female clerical workers answered an advertisement to take part in a study at Cornell University. They were split into two groups, and each was assigned a manuscript to type into a computer for three hours. To mislead participants, researchers told them they were part of an experiment to test the effects of different office furniture, and assigned one group to a quiet office and another group to a noisier office. The noisier office was not excep-tionally noisy, but rather filled with the kind of low‐intensity buzz common to many open‐plan offices. Urine sample comparisons revealed that those working in the noisy office had stress hormone levels significantly higher than those working in the quiet office. The noisy group also displayed signs of reduced motivation.
These findings parallel legions of others derived from a century’s worth of research into the effects of noise. We know that long‐term exposure to loud sounds contributes to hearing loss; those who sleep in noisier environments are more prone to heart disease; and subjects suffer cognitively when assigned to tasks that involve careful listening in noisy environments.
Background noise comes in four flavors: (a) very loud noise that, over time, can cause hearing loss, as in machine shops and rock concerts, (b) loud noise that interferes with speech intelligibility, as in a noisy restaurant or in a banquet hall with a clamoring air conditioner, (c) noise—perhaps even relatively quiet noise—that interferes with very quiet activities, like a distant train during the nighttime sleep hours or a distant cough during a recording at a studio, and (d) noise that, by its content rather than its level, annoys building occupants, like the footfall pattering impact noise of an upstairs neighbor’s dog, or a dripping faucet while you are trying to concentrate.
Acousticians measure background noise in “A‐weighted” decibels. This single‐number meas-ure weights noise per human sensitivity to frequency. It is common in environmental (outdoor) noise measurements, and is easily read from the most rudimentary sound‐level meters. While the A‐weighted metric is sometimes used for measuring indoor noise, it is not the best way to do so because it lacks sufficient spectral frequency‐specific information. For this reason, avoid A‐weighted decibels for maximum room noise design specifications.
More appropriate for indoor noise is the noise criteria (NC) metric. Room noise is measured at octave bands (or one‐third‐octave bands) and plotted on a graph with NC curves. The noise cri-teria value is the highest NC curve “touched” by the noise spectrum measured. Like A‐weighted decibels, NC accounts for diminished human sensitivity to noise in the lower frequencies.
The higher the NC level, the noisier the environment; for reference, occupants judge an NC‐25 room as quiet and an NC‐60 room as noisy.
Note
Researchers and practitioners have developed other less‐commonly‐used methods of measuring background noise in order to refine noise criteria (NC). Room noise criteria (RNC), complicated to execute, measures low‐fre-quency modulations or surging associated with high duct velocities adjacent to noise‐sensitive spaces. Speech‐interference level (SIL) averages the sound pressure level measurements at speech frequencies (500 Hz, 1000 Hz, 2000 Hz, and 4000 Hz). Balanced noise criteria (NCB), room criteria (RC), and room criteria mark II (RC Mark II) are now‐obsolete attempts to add low‐ and high‐ frequency resolution to the more common NC metric. For most applications, use noise criteria (NC) to both specify maximum sound levels and measure in situ room noise conditions.
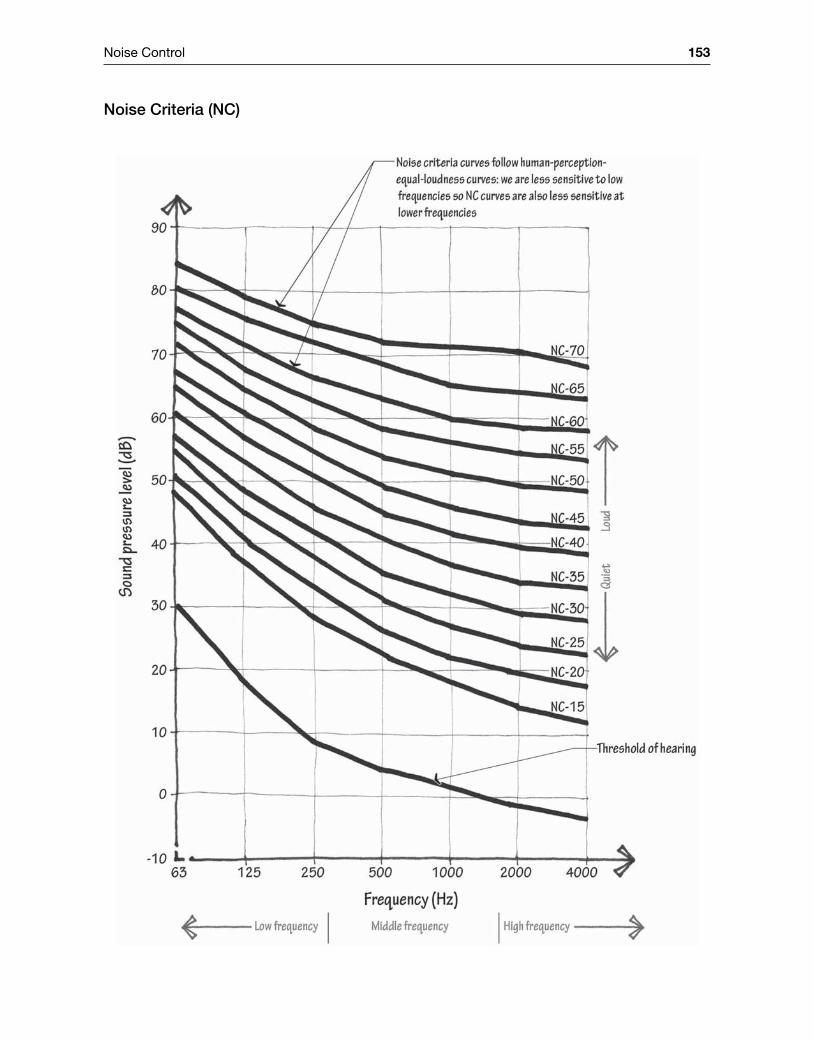
Noise Control 153
Noise Criteria (NC)
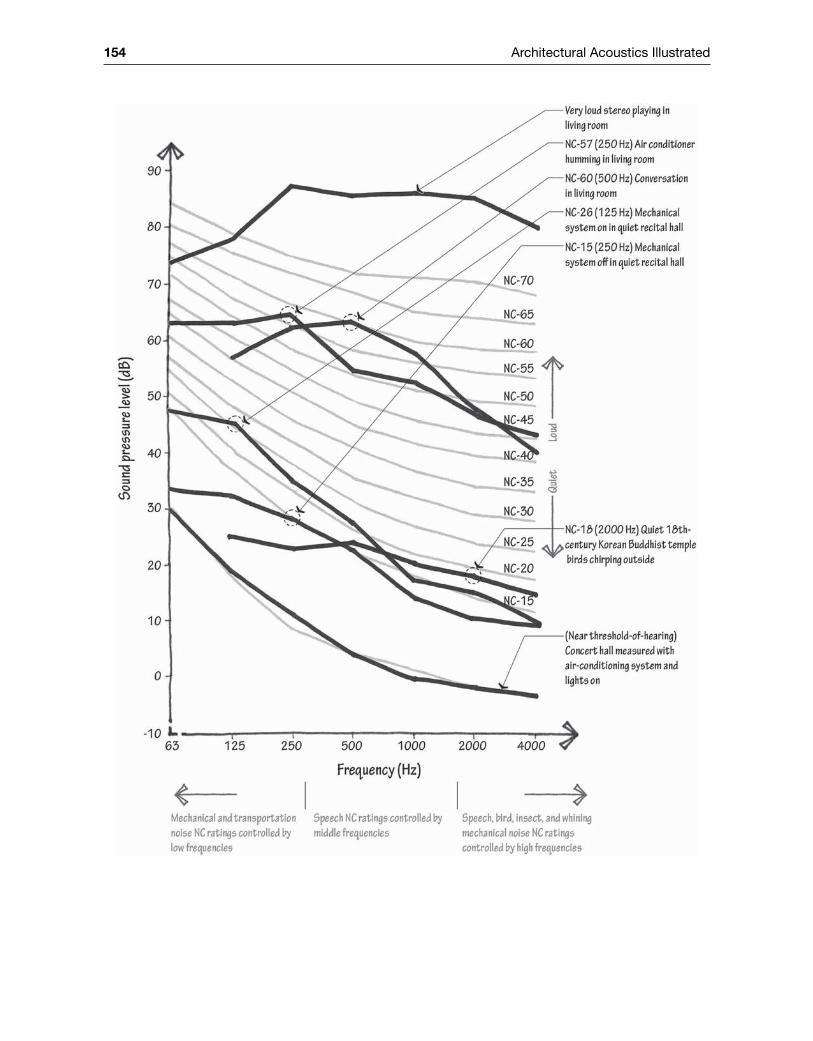
154 Architectural Acoustics Illustrated
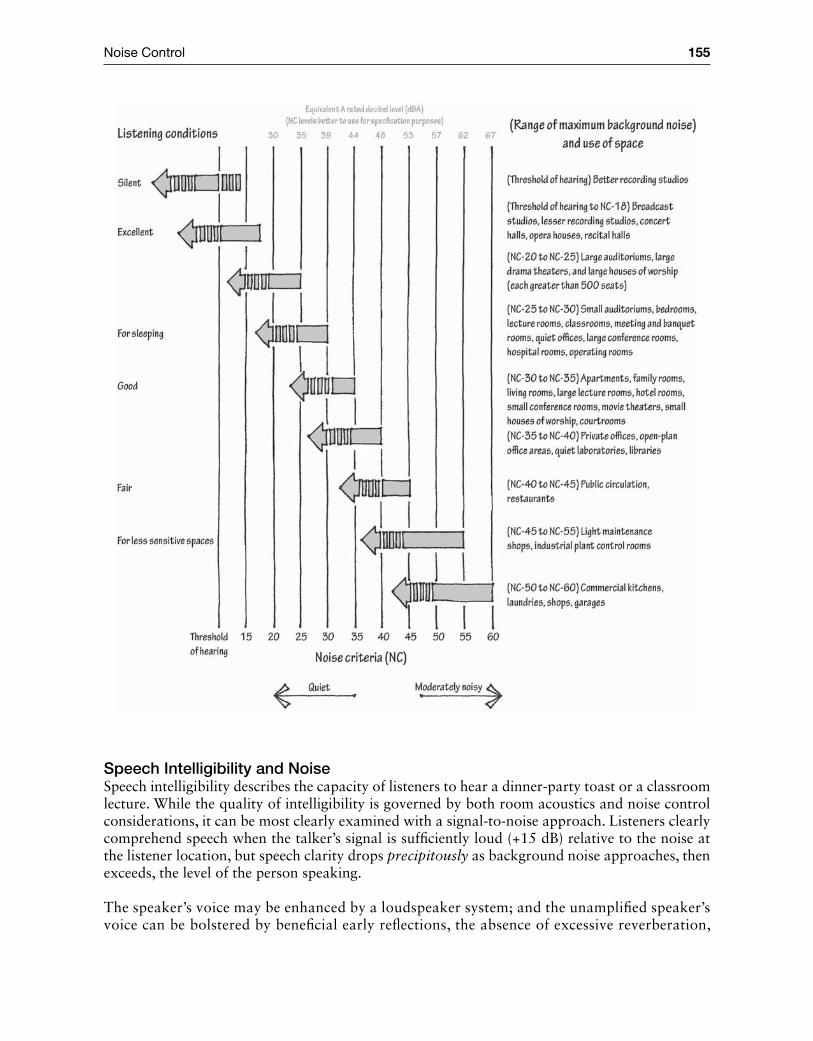
Noise Control 155
Speech Intelligibility and NoiseSpeech intelligibility describes the capacity of listeners to hear a dinner‐party toast or a classroom lecture. While the quality of intelligibility is governed by both room acoustics and noise control considerations, it can be most clearly examined with a signal‐to‐noise approach. Listeners clearly comprehend speech when the talker’s signal is sufficiently loud (+15 dB) relative to the noise at the listener location, but speech clarity drops precipitously as background noise approaches, then exceeds, the level of the person speaking.
The speaker’s voice may be enhanced by a loudspeaker system; and the unamplified speaker’s voice can be bolstered by beneficial early reflections, the absence of excessive reverberation,
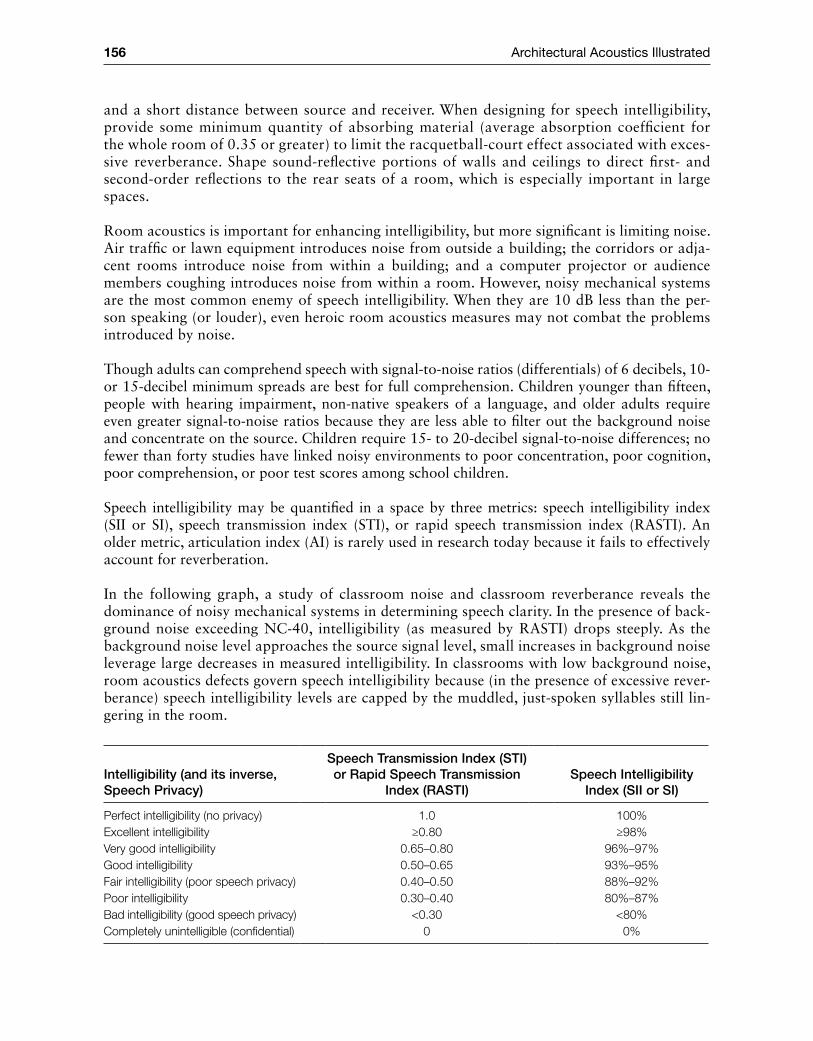
156 Architectural Acoustics Illustrated
and a short distance between source and receiver. When designing for speech intelligibility, provide some minimum quantity of absorbing material (average absorption coefficient for the whole room of 0.35 or greater) to limit the racquetball‐court effect associated with exces-sive reverberance. Shape sound‐reflective portions of walls and ceilings to direct first‐ and second‐order reflections to the rear seats of a room, which is especially important in large spaces.
Room acoustics is important for enhancing intelligibility, but more significant is limiting noise. Air traffic or lawn equipment introduces noise from outside a building; the corridors or adja-cent rooms introduce noise from within a building; and a computer projector or audience members coughing introduces noise from within a room. However, noisy mechanical systems are the most common enemy of speech intelligibility. When they are 10 dB less than the per-son speaking (or louder), even heroic room acoustics measures may not combat the problems introduced by noise.
Though adults can comprehend speech with signal‐to‐noise ratios (differentials) of 6 decibels, 10‐ or 15‐decibel minimum spreads are best for full comprehension. Children younger than fifteen, people with hearing impairment, non‐native speakers of a language, and older adults require even greater signal‐to‐noise ratios because they are less able to filter out the background noise and concentrate on the source. Children require 15‐ to 20‐decibel signal‐to‐noise differences; no fewer than forty studies have linked noisy environments to poor concentration, poor cognition, poor comprehension, or poor test scores among school children.
Speech intelligibility may be quantified in a space by three metrics: speech intelligibility index (SII or SI), speech transmission index (STI), or rapid speech transmission index (RASTI). An older metric, articulation index (AI) is rarely used in research today because it fails to effectively account for reverberation.
In the following graph, a study of classroom noise and classroom reverberance reveals the dominance of noisy mechanical systems in determining speech clarity. In the presence of back-ground noise exceeding NC‐40, intelligibility (as measured by RASTI) drops steeply. As the background noise level approaches the source signal level, small increases in background noise leverage large decreases in measured intelligibility. In classrooms with low background noise, room acoustics defects govern speech intelligibility because (in the presence of excessive rever-berance) speech intelligibility levels are capped by the muddled, just‐spoken syllables still lin-gering in the room.
Intelligibility (and its inverse, Speech Privacy)
Speech Transmission Index (STI) or Rapid Speech Transmission
Index (RASTI)Speech Intelligibility
Index (SII or SI)
Perfect intelligibility (no privacy) 1.0 100%Excellent intelligibility ≥0.80 ≥98%Very good intelligibility 0.65–0.80 96%–97%Good intelligibility 0.50–0.65 93%–95%Fair intelligibility (poor speech privacy) 0.40–0.50 88%–92%Poor intelligibility 0.30–0.40 80%–87%Bad intelligibility (good speech privacy) <0.30 <80%Completely unintelligible (confidential) 0 0%

Noise Control 157
Adapted from G. W. Siebein et al., “Ten Ways to Provide a High‐Quality Acoustical Environment in Schools,” Journal of Language, Speech, and Hearing Services in Schools, October 2000.
Open‐Plan Office Acoustics“I currently work in a cubicle—my neighbors are a man in the midst of a divorce, a woman with a problem child, another woman with an elderly parent who should be in a care facility. The only cure for my personal hell would be a quiet room with a door. Perhaps my employer would then get his money’s worth from my workday. . . . did I mention that I am across from the copier?”
–Unknown worker’s blog post in response to the New York Times article “Beyond the Cubicle,” by Allison Arieff, July 18, 2011
Researchers at the University of California Berkeley Center for the Built Environment asked more than 20,000 study participants—office workers in 142 buildings—a series of questions aimed at gauging building occupant satisfaction. Respondents were most unhappy with the acoustics in
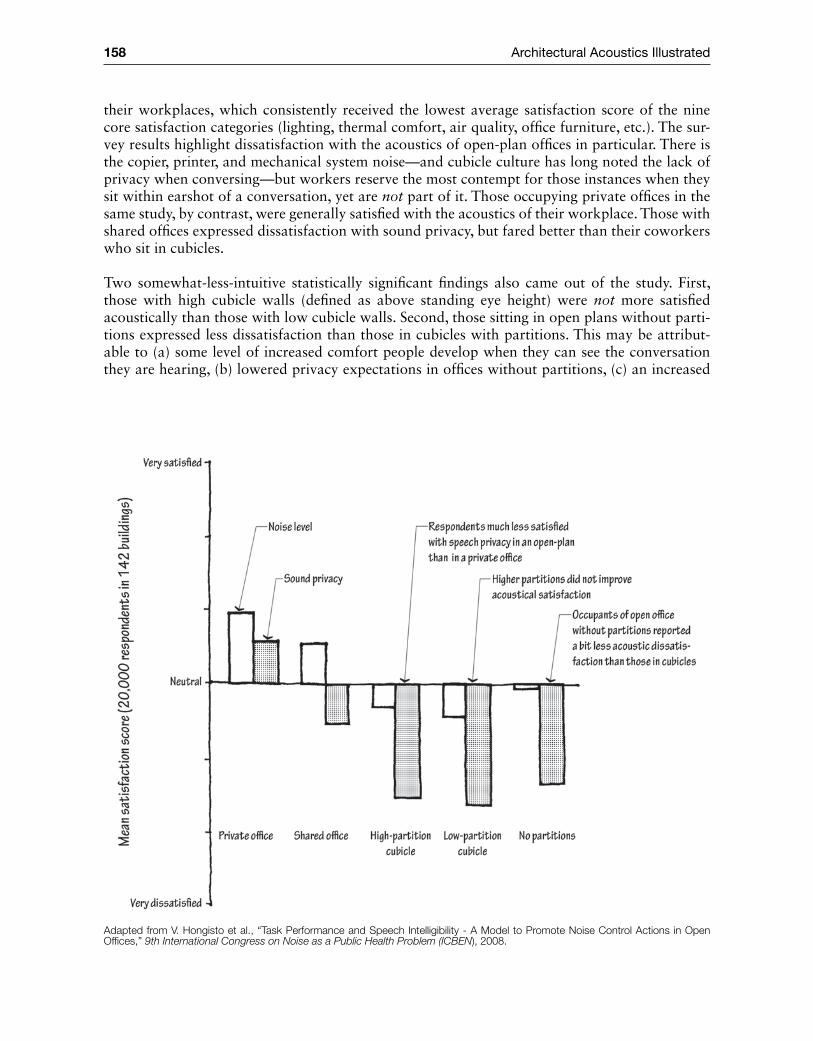
158 Architectural Acoustics Illustrated
their workplaces, which consistently received the lowest average satisfaction score of the nine core satisfaction categories (lighting, thermal comfort, air quality, office furniture, etc.). The sur-vey results highlight dissatisfaction with the acoustics of open‐plan offices in particular. There is the copier, printer, and mechanical system noise—and cubicle culture has long noted the lack of privacy when conversing—but workers reserve the most contempt for those instances when they sit within earshot of a conversation, yet are not part of it. Those occupying private offices in the same study, by contrast, were generally satisfied with the acoustics of their workplace. Those with shared offices expressed dissatisfaction with sound privacy, but fared better than their coworkers who sit in cubicles.
Two somewhat‐less‐intuitive statistically significant findings also came out of the study. First, those with high cubicle walls (defined as above standing eye height) were not more satisfied acoustically than those with low cubicle walls. Second, those sitting in open plans without parti-tions expressed less dissatisfaction than those in cubicles with partitions. This may be attribut-able to (a) some level of increased comfort people develop when they can see the conversation they are hearing, (b) lowered privacy expectations in offices without partitions, (c) an increased
Adapted from V. Hongisto et al., “Task Performance and Speech Intelligibility ‐ A Model to Promote Noise Control Actions in Open Offices,” 9th International Congress on Noise as a Public Health Problem (ICBEN), 2008.
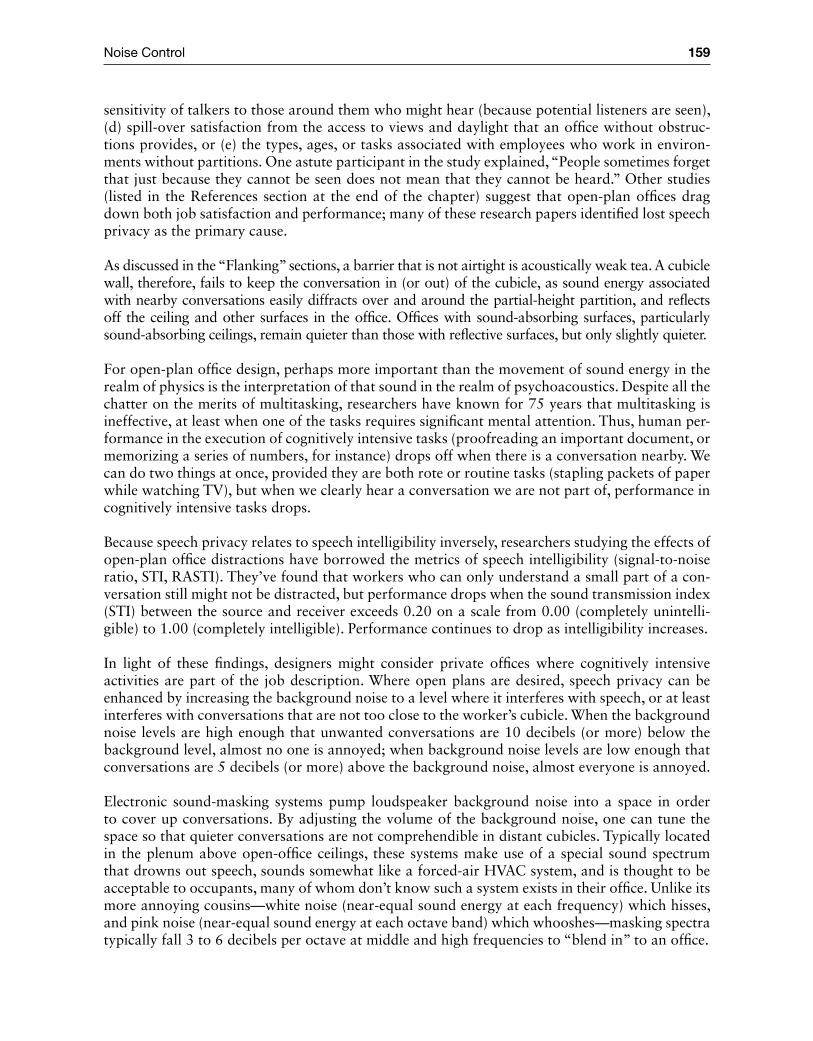
Noise Control 159
sensitivity of talkers to those around them who might hear (because potential listeners are seen), (d) spill‐over satisfaction from the access to views and daylight that an office without obstruc-tions provides, or (e) the types, ages, or tasks associated with employees who work in environ-ments without partitions. One astute participant in the study explained, “People sometimes forget that just because they cannot be seen does not mean that they cannot be heard.” Other studies (listed in the References section at the end of the chapter) suggest that open‐plan offices drag down both job satisfaction and performance; many of these research papers identified lost speech privacy as the primary cause.
As discussed in the “Flanking” sections, a barrier that is not airtight is acoustically weak tea. A cubicle wall, therefore, fails to keep the conversation in (or out) of the cubicle, as sound energy associated with nearby conversations easily diffracts over and around the partial‐height partition, and reflects off the ceiling and other surfaces in the office. Offices with sound‐absorbing surfaces, particularly sound‐absorbing ceilings, remain quieter than those with reflective surfaces, but only slightly quieter.
For open‐plan office design, perhaps more important than the movement of sound energy in the realm of physics is the interpretation of that sound in the realm of psychoacoustics. Despite all the chatter on the merits of multitasking, researchers have known for 75 years that multitasking is ineffective, at least when one of the tasks requires significant mental attention. Thus, human per-formance in the execution of cognitively intensive tasks (proofreading an important document, or memorizing a series of numbers, for instance) drops off when there is a conversation nearby. We can do two things at once, provided they are both rote or routine tasks (stapling packets of paper while watching TV), but when we clearly hear a conversation we are not part of, performance in cognitively intensive tasks drops.
Because speech privacy relates to speech intelligibility inversely, researchers studying the effects of open‐plan office distractions have borrowed the metrics of speech intelligibility (signal‐to‐noise ratio, STI, RASTI). They’ve found that workers who can only understand a small part of a con-versation still might not be distracted, but performance drops when the sound transmission index (STI) between the source and receiver exceeds 0.20 on a scale from 0.00 (completely unintelli-gible) to 1.00 (completely intelligible). Performance continues to drop as intelligibility increases.
In light of these findings, designers might consider private offices where cognitively intensive activities are part of the job description. Where open plans are desired, speech privacy can be enhanced by increasing the background noise to a level where it interferes with speech, or at least interferes with conversations that are not too close to the worker’s cubicle. When the background noise levels are high enough that unwanted conversations are 10 decibels (or more) below the background level, almost no one is annoyed; when background noise levels are low enough that conversations are 5 decibels (or more) above the background noise, almost everyone is annoyed.
Electronic sound‐masking systems pump loudspeaker background noise into a space in order to cover up conversations. By adjusting the volume of the background noise, one can tune the space so that quieter conversations are not comprehendible in distant cubicles. Typically located in the plenum above open‐office ceilings, these systems make use of a special sound spectrum that drowns out speech, sounds somewhat like a forced‐air HVAC system, and is thought to be acceptable to occupants, many of whom don’t know such a system exists in their office. Unlike its more annoying cousins—white noise (near‐equal sound energy at each frequency) which hisses, and pink noise (near‐equal sound energy at each octave band) which whooshes—masking spectra typically fall 3 to 6 decibels per octave at middle and high frequencies to “blend in” to an office.
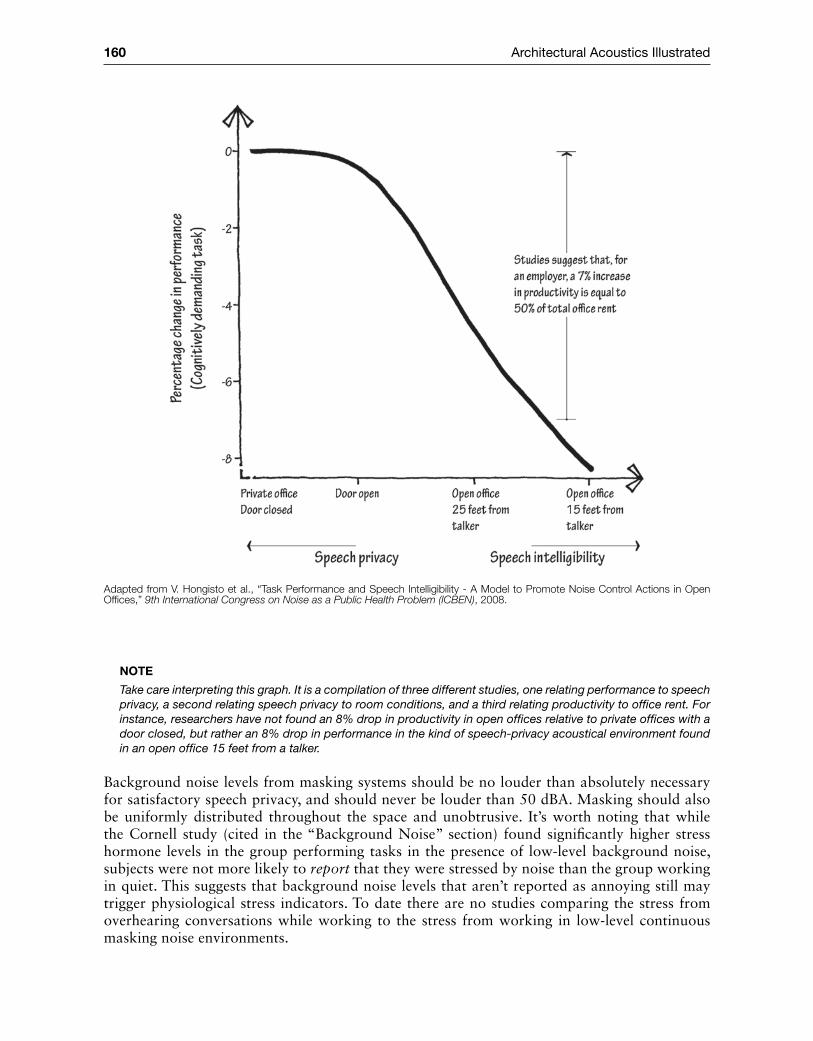
160 Architectural Acoustics Illustrated
Note
Take care interpreting this graph. It is a compilation of three different studies, one relating performance to speech privacy, a second relating speech privacy to room conditions, and a third relating productivity to office rent. For instance, researchers have not found an 8% drop in productivity in open offices relative to private offices with a door closed, but rather an 8% drop in performance in the kind of speech‐privacy acoustical environment found in an open office 15 feet from a talker.
Background noise levels from masking systems should be no louder than absolutely necessary for satisfactory speech privacy, and should never be louder than 50 dBA. Masking should also be uniformly distributed throughout the space and unobtrusive. It’s worth noting that while the Cornell study (cited in the “Background Noise” section) found significantly higher stress hormone levels in the group performing tasks in the presence of low‐level background noise, subjects were not more likely to report that they were stressed by noise than the group working in quiet. This suggests that background noise levels that aren’t reported as annoying still may trigger physiological stress indicators. To date there are no studies comparing the stress from overhearing conversations while working to the stress from working in low‐level continuous masking noise environments.
Adapted from V. Hongisto et al., “Task Performance and Speech Intelligibility ‐ A Model to Promote Noise Control Actions in Open Offices,” 9th International Congress on Noise as a Public Health Problem (ICBEN), 2008.

Noise Control 161
Executives and facilities management personnel may prefer open‐floor plans because they save space by allowing for greater worker density. They also require simpler HVAC and lighting systems. Conventional wisdom has it that open plans foster communication and collaboration because they encourage informal meetings and casual conversations. It’s true that in open plans you don’t have to make an appointment with people to talk to them; however, studies show that conversations in open offices tend to be more superficial because those conversing are self‐con-scious about being overheard. Again the type of work being done in the space becomes impor-tant because the need for continuous collaboration inherent in newsrooms, trading floors, and political campaign offices is not the same as the need for collaboration and speech privacy of, for instance, a call center.
All of this plays out with a backdrop of evolving open‐office etiquette. Headphones are ubiq-uitous in some open‐plan offices, either to drown out the nearby conversations, or as a sign to colleagues that “My cubicle is not taking meetings right now.” Headphones are the new wall. As the typewriter gave way to the computer, and the phone gives ground to e‐mail and text messag-ing, will quieter offices translate to fewer distractions? Will the drop in background noise make conversations more audible to more neighbors, or, as happened in the Boston Public Library’s reverberant reading room, will office workers become ever more aware that their voices are car-rying to those outside the intended circle of conversation and hush themselves?
The stakes are high because office workers are expensive. On average, an office worker who occupies a given area of floor will cost an employer 6.5 times the cost of rent of that same area of floor, so slight improvements in occupant productivity in offices can leverage large gains in profit. Bolstering the many studies that demonstrate a fall‐off in open‐office concentration is a Finnish study of 689 workers in 11 offices that found self‐estimated daily waste of working time due to noise was twofold for those in open offices compared to those in private offices. As built‐envi-ronment research disseminates into business management and real estate courses, decisions will increasingly be filtered through lenses that include the effects of indoor quality life‐cycle analysis, absenteeism, health gains, and especially productivity.
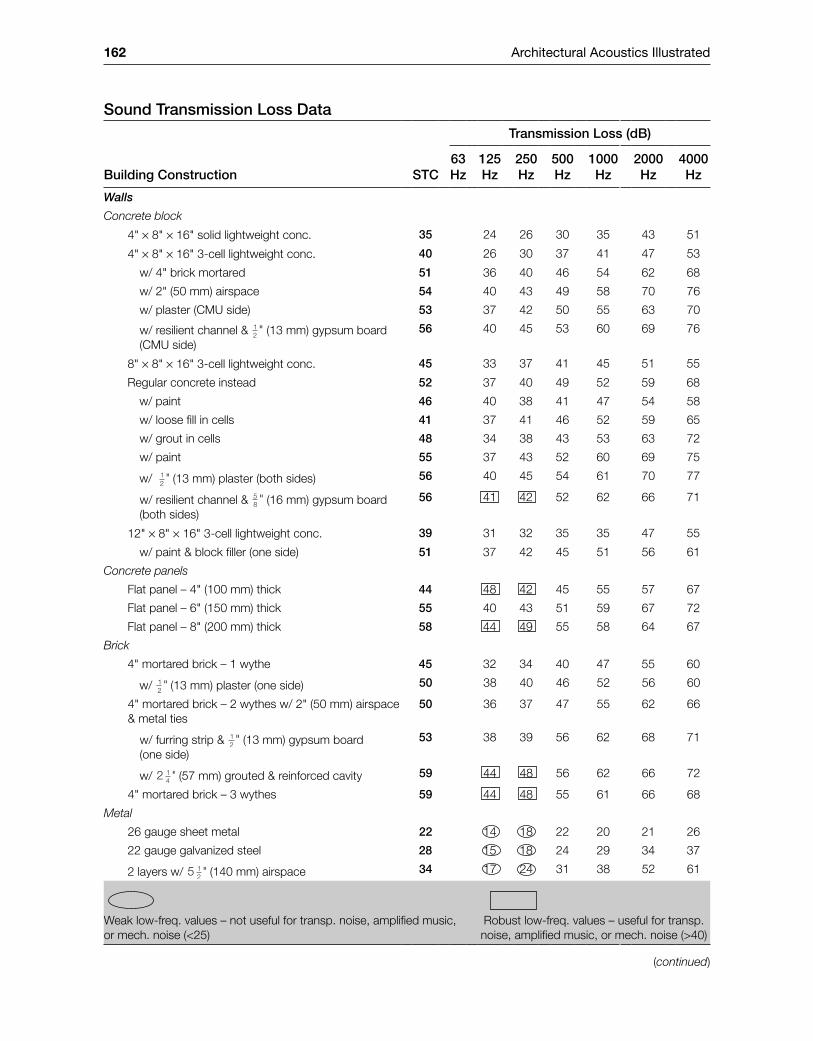
162 Architectural Acoustics Illustrated
Sound Transmission Loss Data
Building Construction STC
Transmission Loss (dB)
63 Hz
125 Hz
250 Hz
500 Hz
1000 Hz
2000 Hz
4000 Hz
Walls
Concrete block
4" × 8" × 16" solid lightweight conc. 35 24 26 30 35 43 51
4" × 8" × 16" 3‐cell lightweight conc. 40 26 30 37 41 47 53
w/ 4" brick mortared 51 36 40 46 54 62 68
w/ 2" (50 mm) airspace 54 40 43 49 58 70 76
w/ plaster (CMU side) 53 37 42 50 55 63 70
w/ resilient channel & 12 " (13 mm) gypsum board
(CMU side)56 40 45 53 60 69 76
8" × 8" × 16" 3‐cell lightweight conc. 45 33 37 41 45 51 55
Regular concrete instead 52 37 40 49 52 59 68
w/ paint 46 40 38 41 47 54 58
w/ loose fill in cells 41 37 41 46 52 59 65
w/ grout in cells 48 34 38 43 53 63 72
w/ paint 55 37 43 52 60 69 75
w/ 12 " (13 mm) plaster (both sides) 56 40 45 54 61 70 77
w/ resilient channel & 58 " (16 mm) gypsum board
(both sides)56 41 42 52 62 66 71
12" × 8" × 16" 3‐cell lightweight conc. 39 31 32 35 35 47 55
w/ paint & block filler (one side) 51 37 42 45 51 56 61
Concrete panels
Flat panel – 4" (100 mm) thick 44 48 42 45 55 57 67
Flat panel – 6" (150 mm) thick 55 40 43 51 59 67 72
Flat panel – 8" (200 mm) thick 58 44 49 55 58 64 67
Brick
4" mortared brick – 1 wythe 45 32 34 40 47 55 60
w/ 12 " (13 mm) plaster (one side) 50 38 40 46 52 56 60
4" mortared brick – 2 wythes w/ 2" (50 mm) airspace & metal ties
50 36 37 47 55 62 66
w/ furring strip & 12 " (13 mm) gypsum board
(one side)53 38 39 56 62 68 71
w/ 2 14 " (57 mm) grouted & reinforced cavity 59 44 48 56 62 66 72
4" mortared brick – 3 wythes 59 44 48 55 61 66 68
Metal
26 gauge sheet metal 22 14 18 22 20 21 26
22 gauge galvanized steel 28 15 18 24 29 34 37
2 layers w/ 5 12 " (140 mm) airspace 34 17 24 31 38 52 61
Weak low‐freq. values – not useful for transp. noise, amplified music, or mech. noise (<25)
Robust low‐freq. values – useful for transp. noise, amplified music, or mech. noise (>40)
(continued)
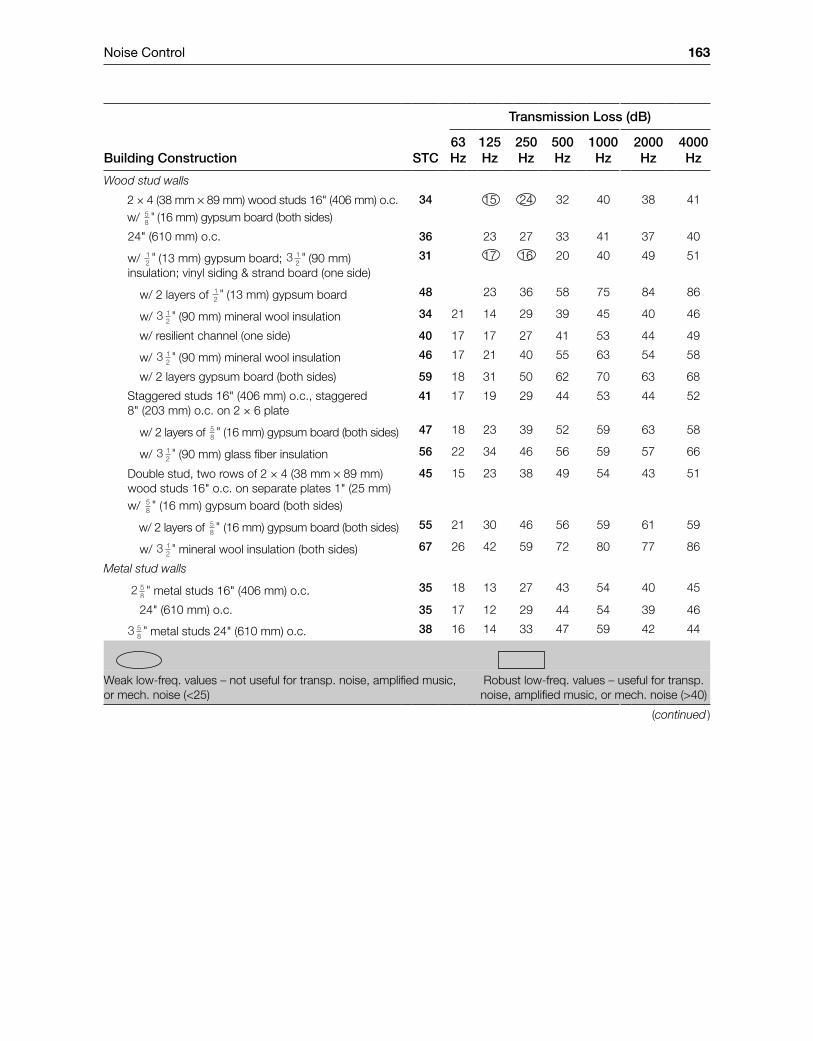
Noise Control 163
Building Construction STC
Transmission Loss (dB)
63 Hz
125 Hz
250 Hz
500 Hz
1000 Hz
2000 Hz
4000 Hz
Wood stud walls
2 × 4 (38 mm × 89 mm) wood studs 16" (406 mm) o.c. w/ 5
8 " (16 mm) gypsum board (both sides)34 15 24 32 40 38 41
24" (610 mm) o.c. 36 23 27 33 41 37 40
w/ 12 " (13 mm) gypsum board; 3 1
2 " (90 mm) insulation; vinyl siding & strand board (one side)
31 17 16 20 40 49 51
w/ 2 layers of 12 " (13 mm) gypsum board 48 23 36 58 75 84 86
w/ 3 12 " (90 mm) mineral wool insulation 34 21 14 29 39 45 40 46
w/ resilient channel (one side) 40 17 17 27 41 53 44 49
w/ 3 12 " (90 mm) mineral wool insulation 46 17 21 40 55 63 54 58
w/ 2 layers gypsum board (both sides) 59 18 31 50 62 70 63 68
Staggered studs 16" (406 mm) o.c., staggered 8" (203 mm) o.c. on 2 × 6 plate
41 17 19 29 44 53 44 52
w/ 2 layers of 58 " (16 mm) gypsum board (both sides) 47 18 23 39 52 59 63 58
w/ 3 12 " (90 mm) glass fiber insulation 56 22 34 46 56 59 57 66
Double stud, two rows of 2 × 4 (38 mm × 89 mm) wood studs 16" o.c. on separate plates 1" (25 mm) w/ 5
8 " (16 mm) gypsum board (both sides)
45 15 23 38 49 54 43 51
w/ 2 layers of 58 " (16 mm) gypsum board (both sides) 55 21 30 46 56 59 61 59
w/ 3 12 " mineral wool insulation (both sides) 67 26 42 59 72 80 77 86
Metal stud walls
2 58 " metal studs 16" (406 mm) o.c. 35 18 13 27 43 54 40 45
24" (610 mm) o.c. 35 17 12 29 44 54 39 46
3 58 " metal studs 24" (610 mm) o.c. 38 16 14 33 47 59 42 44
Weak low‐freq. values – not useful for transp. noise, amplified music, or mech. noise (<25)
Robust low‐freq. values – useful for transp. noise, amplified music, or mech. noise (>40)
(continued )
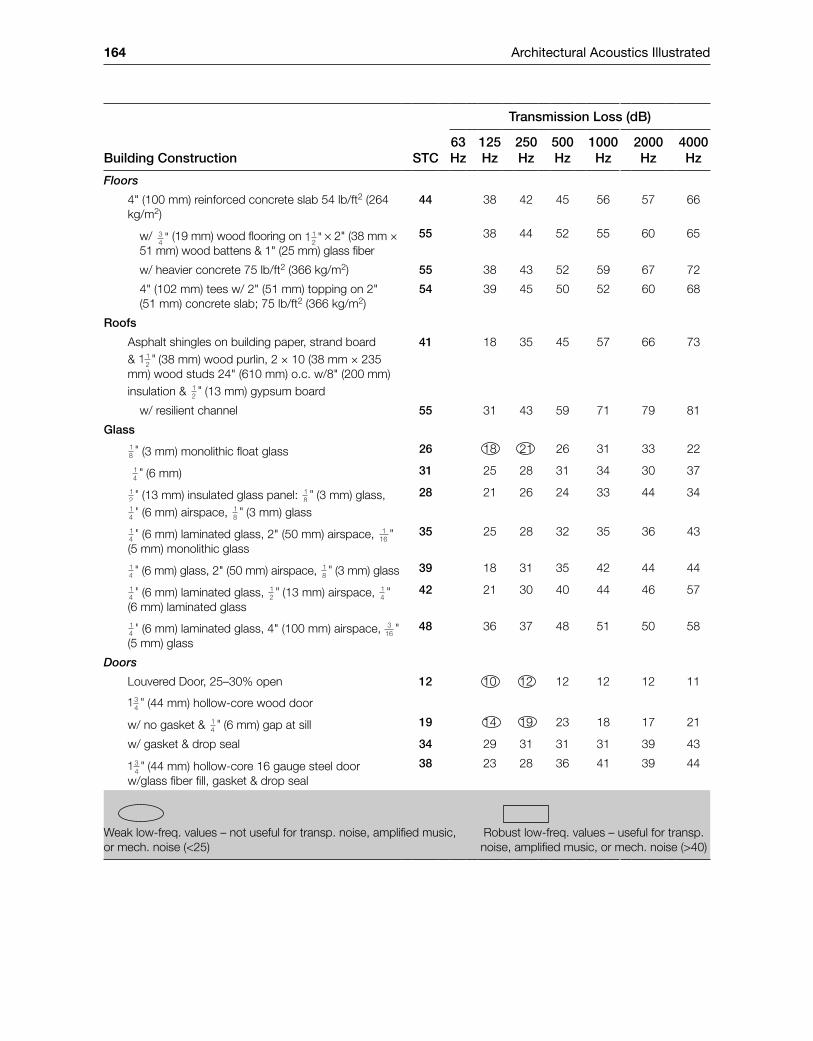
164 Architectural Acoustics Illustrated
Building Construction STC
Transmission Loss (dB)
63 Hz
125 Hz
250 Hz
500 Hz
1000 Hz
2000 Hz
4000 Hz
Floors
4" (100 mm) reinforced concrete slab 54 lb/ft2 (264 kg/m2)
44 38 42 45 56 57 66
w/ 34 " (19 mm) wood flooring on 11
2 " × 2" (38 mm × 51 mm) wood battens & 1" (25 mm) glass fiber
55 38 44 52 55 60 65
w/ heavier concrete 75 lb/ft2 (366 kg/m2) 55 38 43 52 59 67 72
4" (102 mm) tees w/ 2" (51 mm) topping on 2" (51 mm) concrete slab; 75 lb/ft2 (366 kg/m2)
54 39 45 50 52 60 68
Roofs
Asphalt shingles on building paper, strand board & 11
2 " (38 mm) wood purlin, 2 × 10 (38 mm × 235 mm) wood studs 24" (610 mm) o.c. w/8" (200 mm) insulation & 1
2 " (13 mm) gypsum board
41 18 35 45 57 66 73
w/ resilient channel 55 31 43 59 71 79 81
Glass
18 " (3 mm) monolithic float glass 26 18 21 26 31 33 22
14 " (6 mm) 31 25 28 31 34 30 37
12 " (13 mm) insulated glass panel: 18 " (3 mm) glass,
14 " (6 mm) airspace, 1
8 " (3 mm) glass
28 21 26 24 33 44 34
14 " (6 mm) laminated glass, 2" (50 mm) airspace, 116 "
(5 mm) monolithic glass35 25 28 32 35 36 43
14 " (6 mm) glass, 2" (50 mm) airspace, 18 " (3 mm) glass 39 18 31 35 42 44 44
14 " (6 mm) laminated glass, 12 " (13 mm) airspace, 1
4 " (6 mm) laminated glass
42 21 30 40 44 46 57
14 " (6 mm) laminated glass, 4" (100 mm) airspace, 316 "
(5 mm) glass48 36 37 48 51 50 58
Doors
Louvered Door, 25–30% open 12 10 12 12 12 12 11
134 " (44 mm) hollow‐core wood door
w/ no gasket & 14 " (6 mm) gap at sill 19 14 19 23 18 17 21
w/ gasket & drop seal 34 29 31 31 31 39 43
134 " (44 mm) hollow‐core 16 gauge steel door
w/glass fiber fill, gasket & drop seal38 23 28 36 41 39 44
Weak low‐freq. values – not useful for transp. noise, amplified music, or mech. noise (<25)
Robust low‐freq. values – useful for transp. noise, amplified music, or mech. noise (>40)
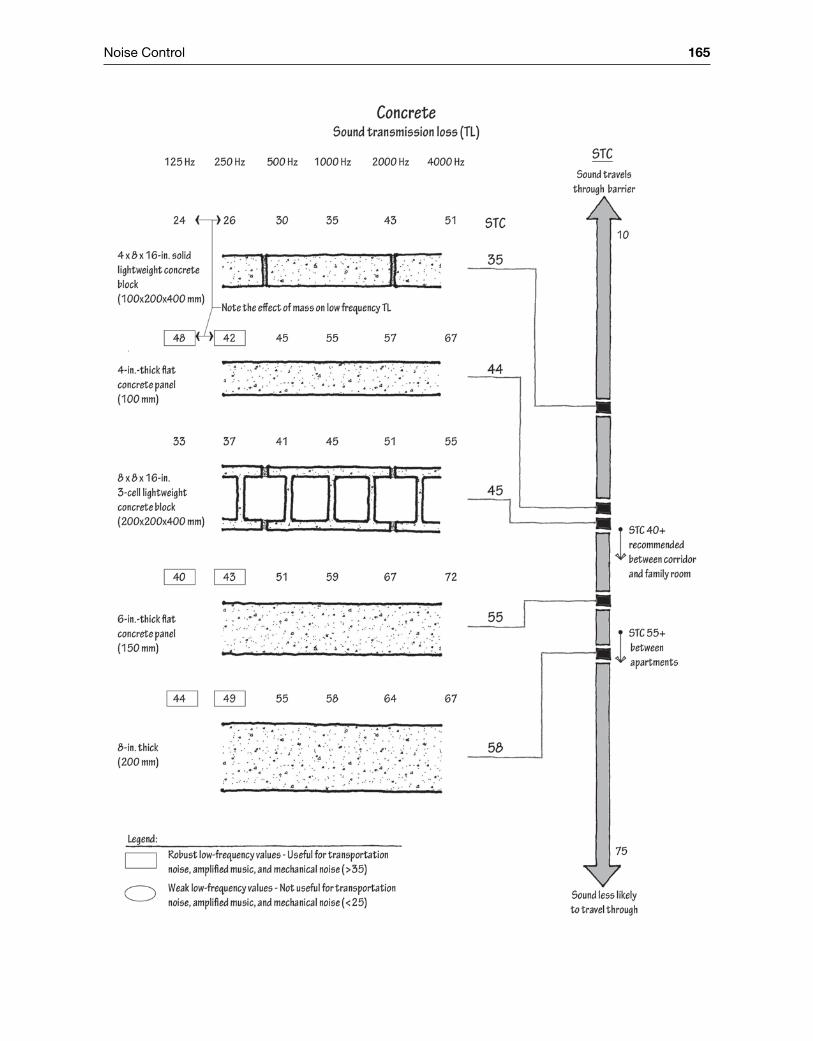
Noise Control 165
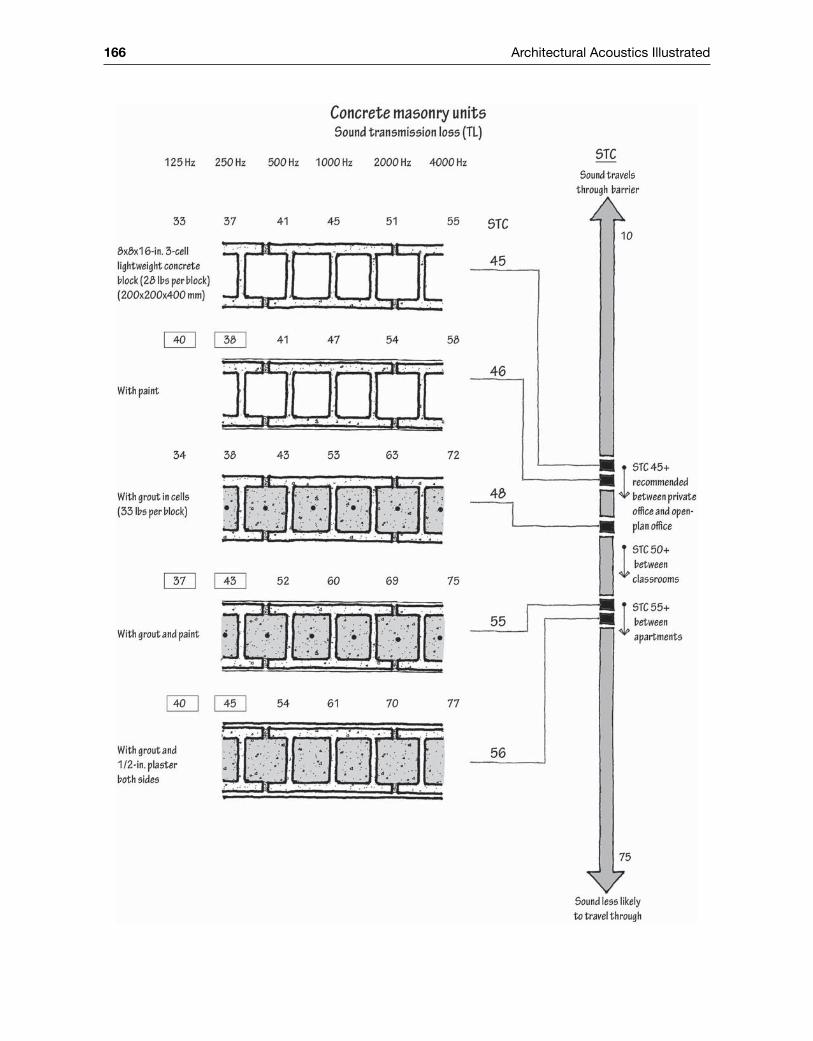
166 Architectural Acoustics Illustrated
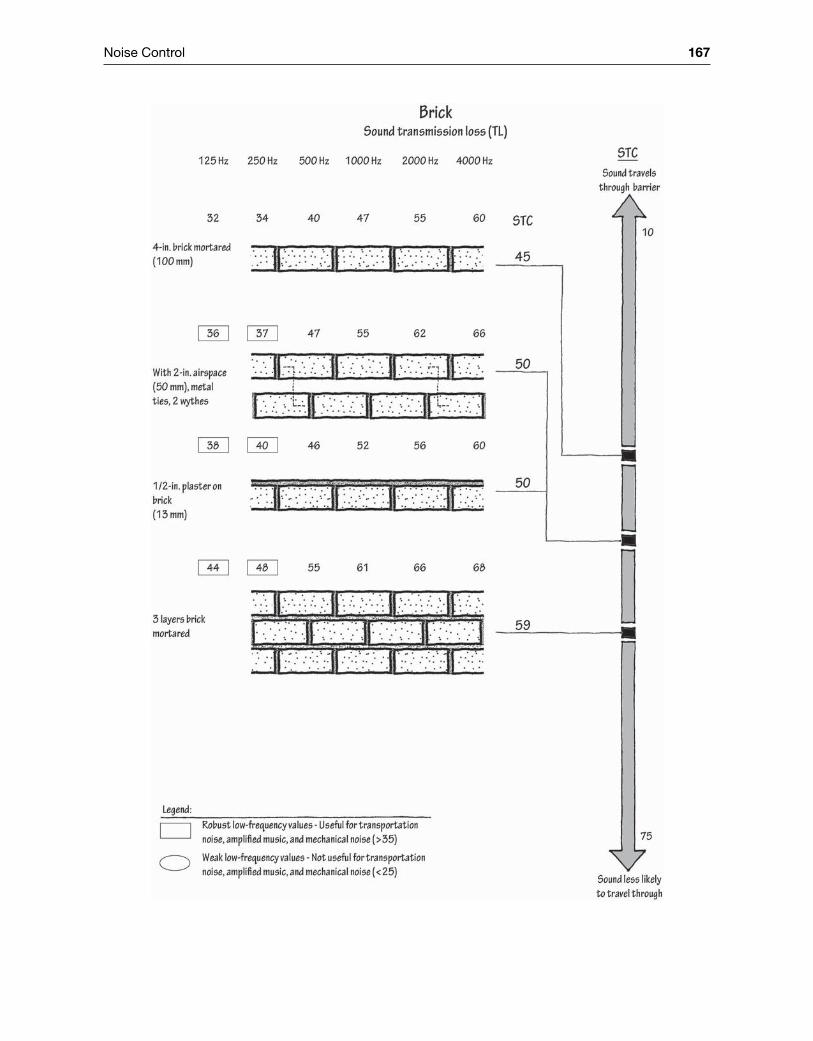
Noise Control 167
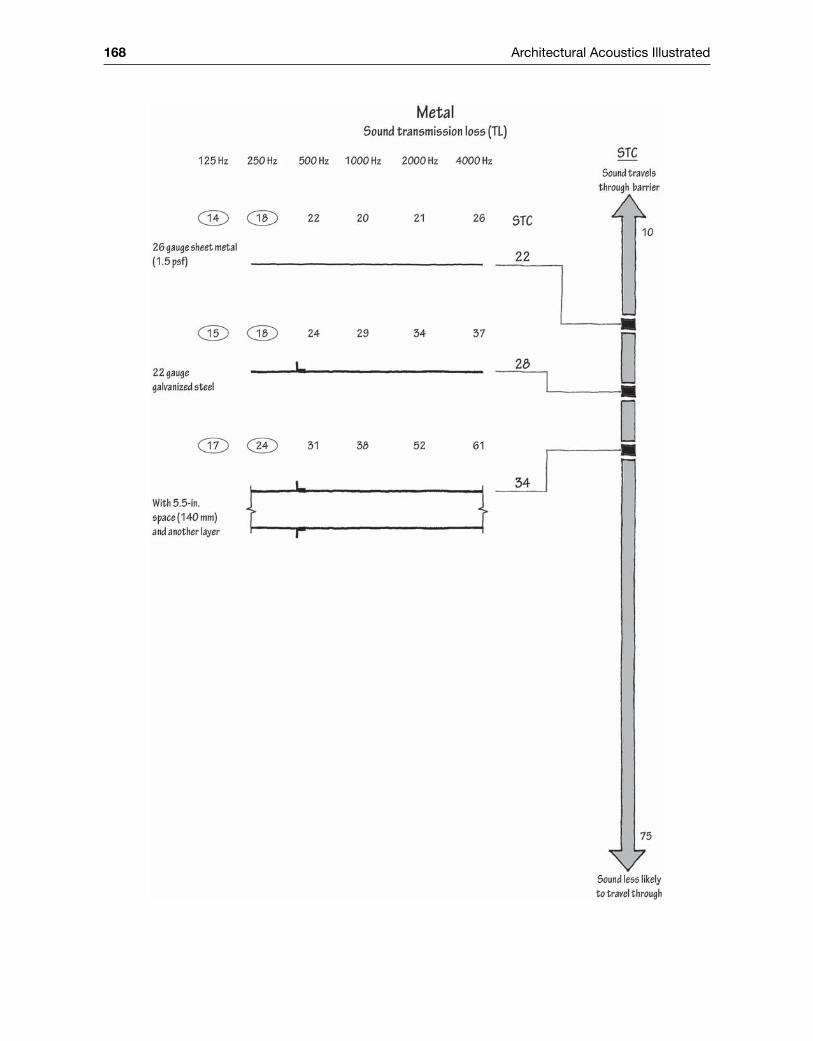
168 Architectural Acoustics Illustrated
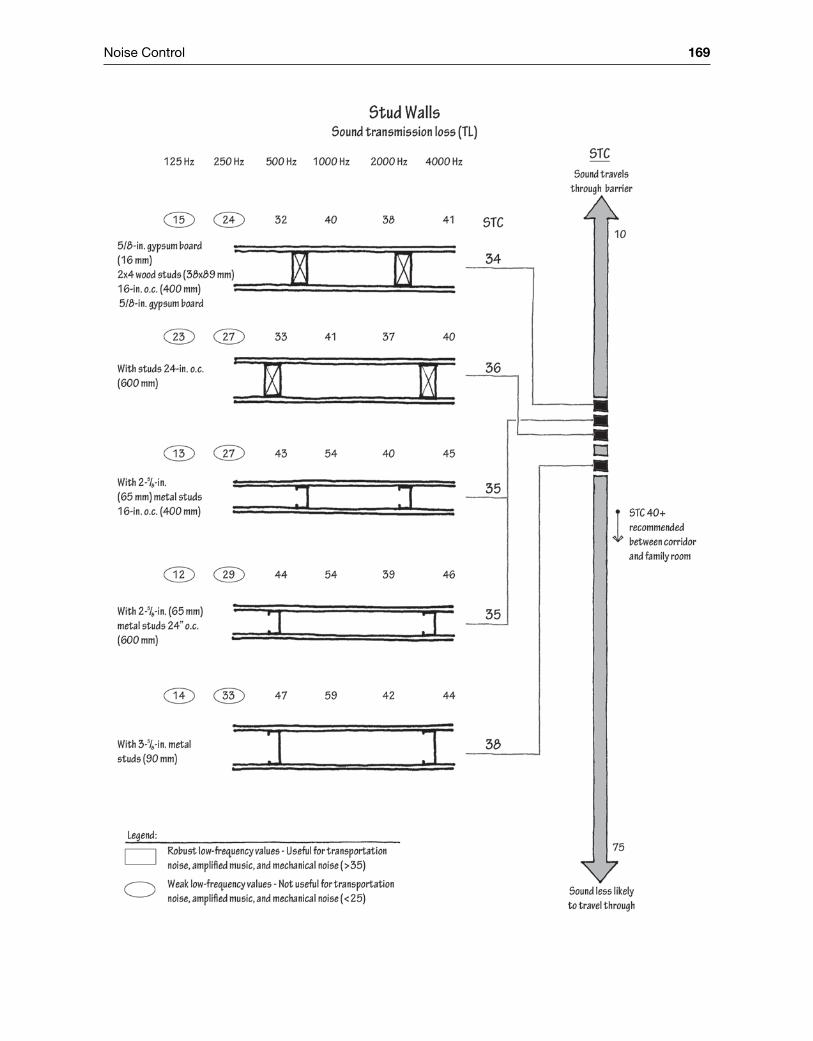
Noise Control 169
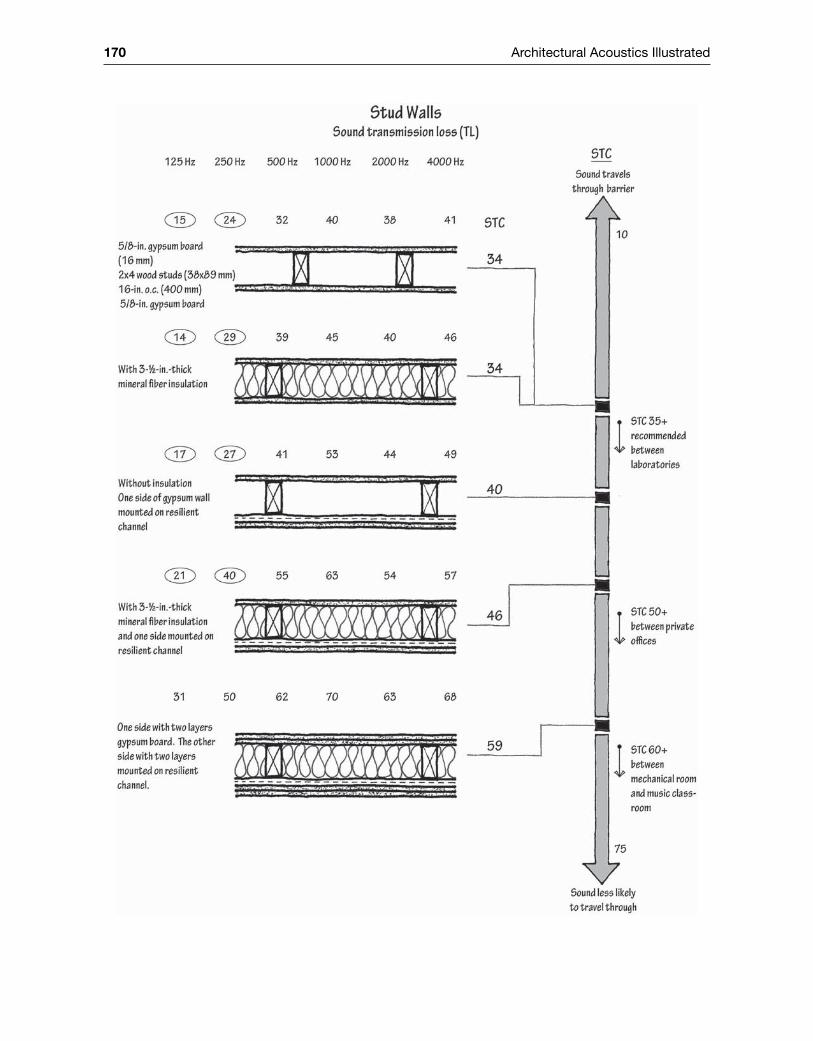
170 Architectural Acoustics Illustrated
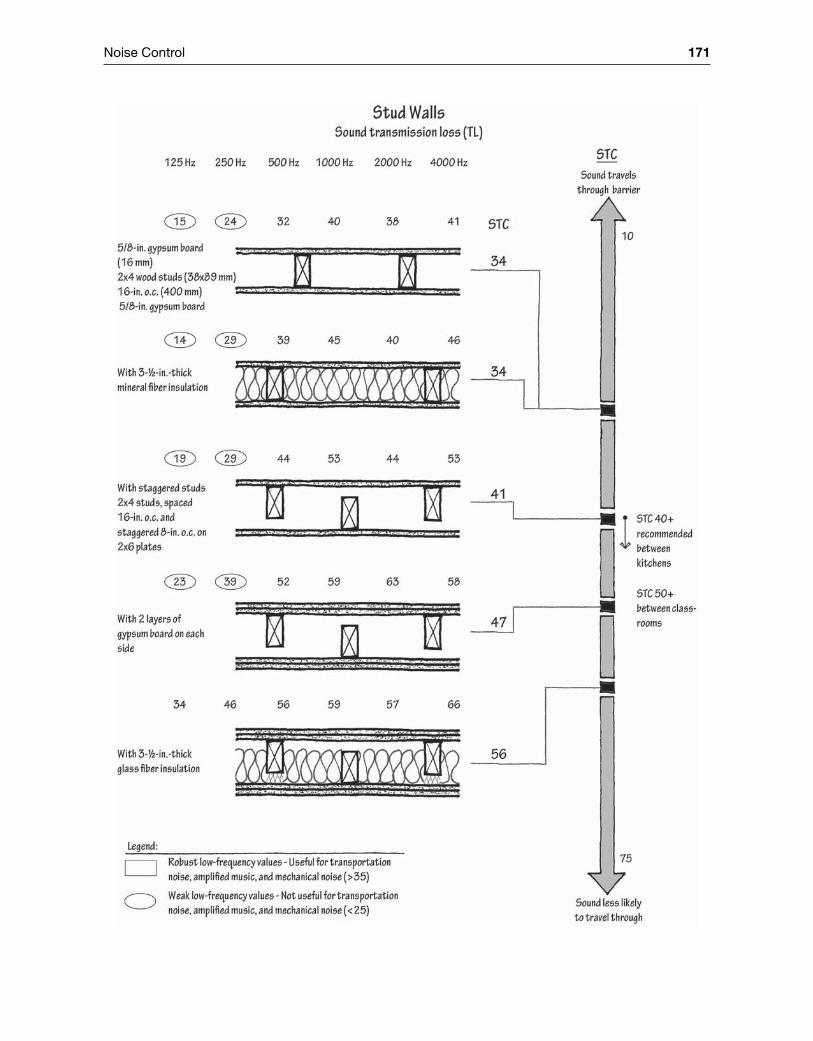
Noise Control 171
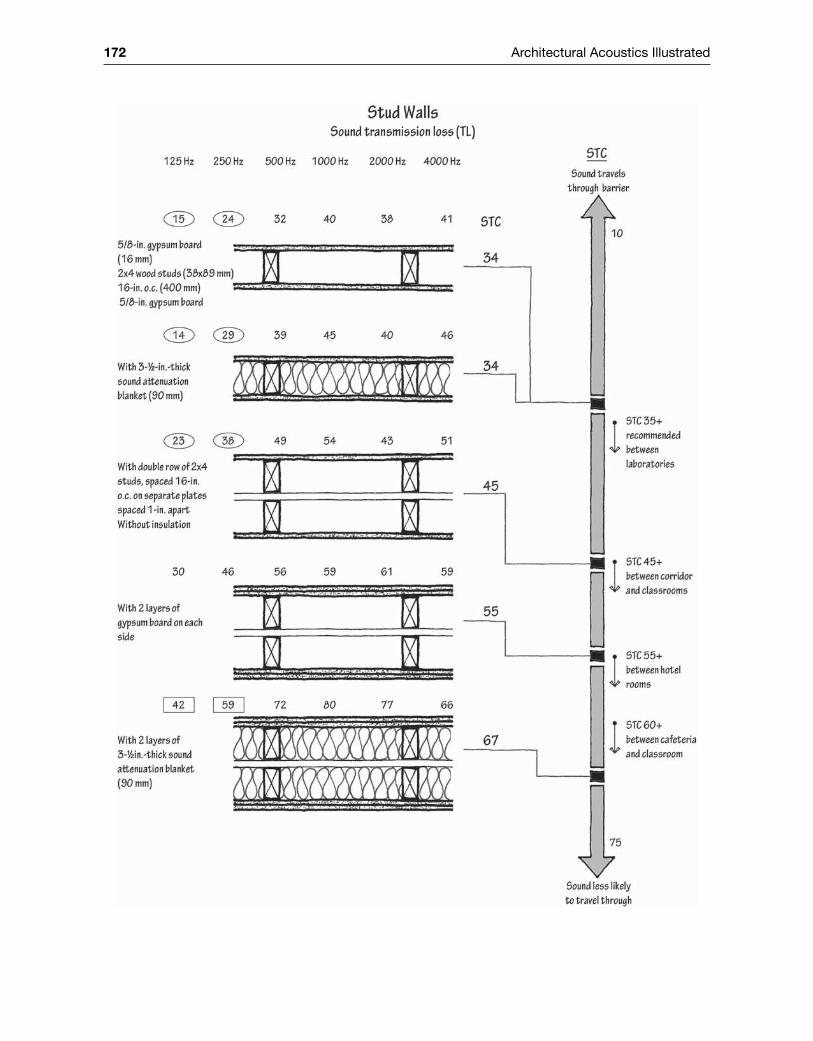
172 Architectural Acoustics Illustrated
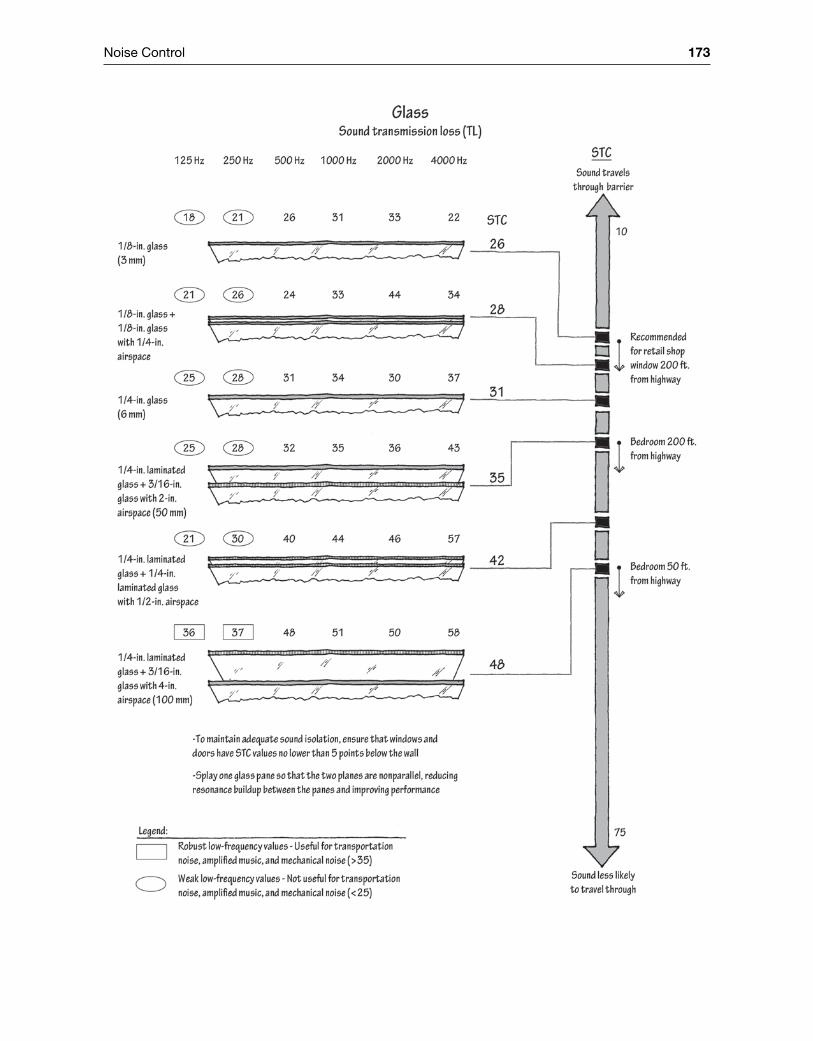
Noise Control 173
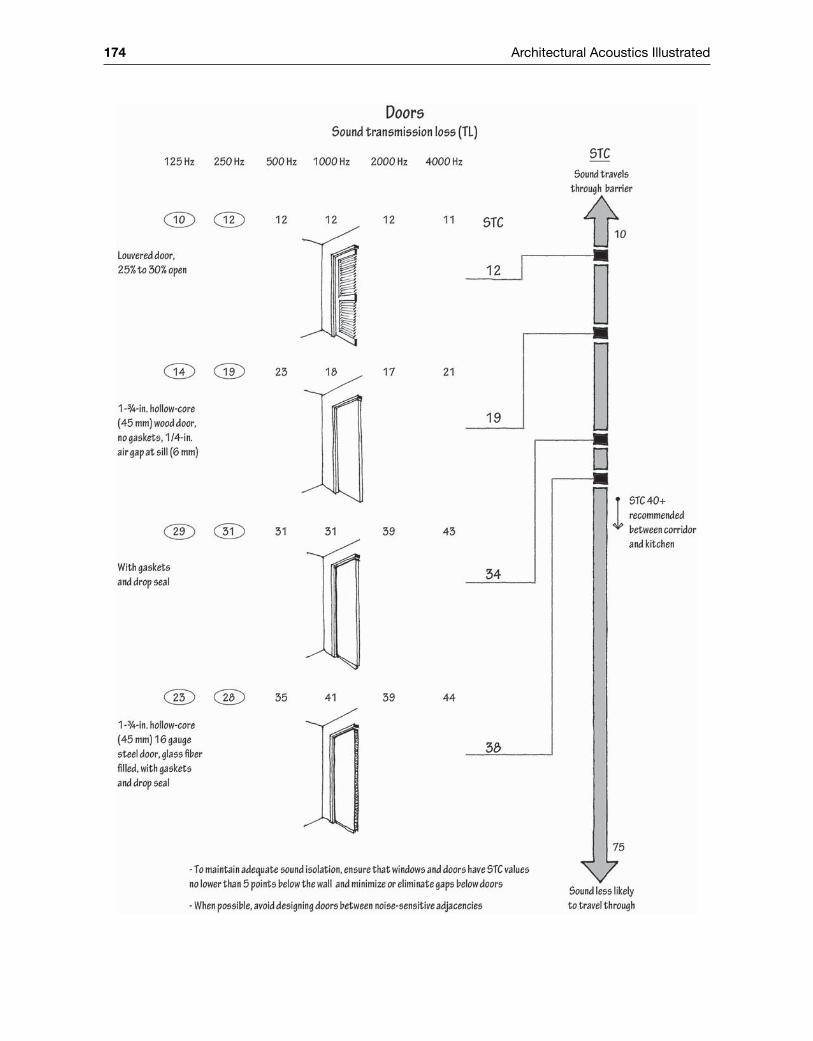
174 Architectural Acoustics Illustrated
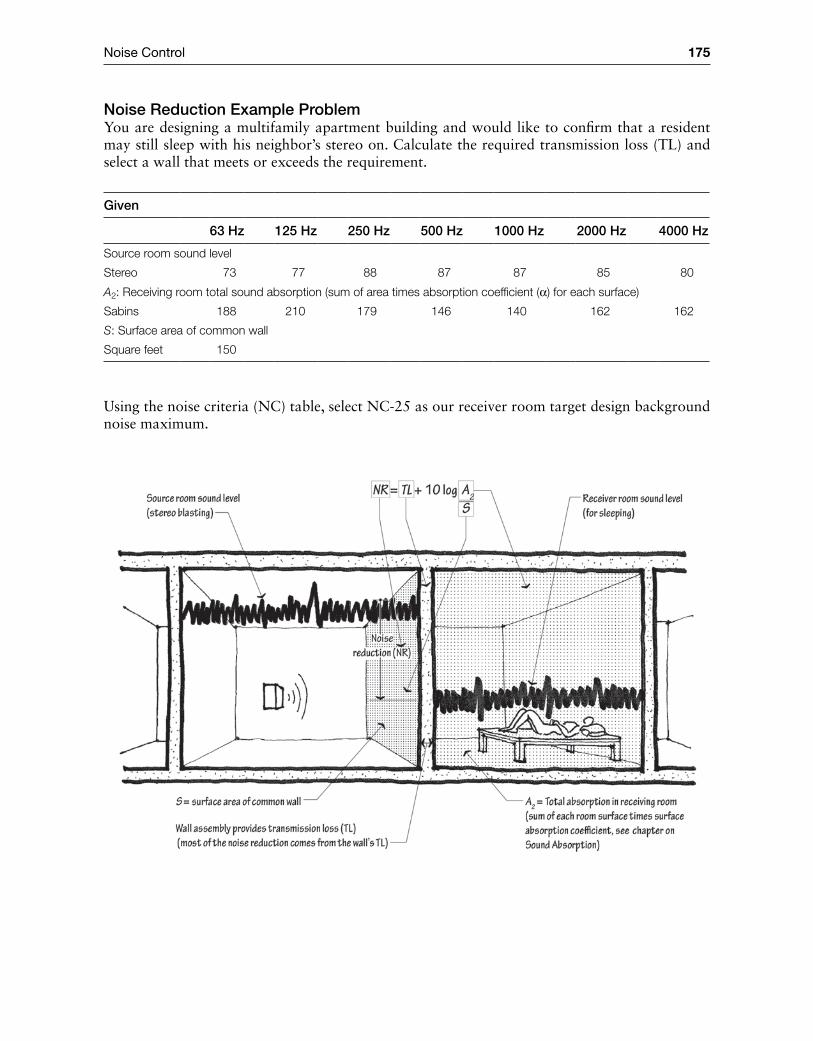
Noise Control 175
Noise Reduction Example ProblemYou are designing a multifamily apartment building and would like to confirm that a resident may still sleep with his neighbor’s stereo on. Calculate the required transmission loss (TL) and select a wall that meets or exceeds the requirement.
Given
63 Hz 125 Hz 250 Hz 500 Hz 1000 Hz 2000 Hz 4000 Hz
Source room sound level
Stereo 73 77 88 87 87 85 80
A2: Receiving room total sound absorption (sum of area times absorption coefficient (α) for each surface)
Sabins 188 210 179 146 140 162 162
S: Surface area of common wall
Square feet 150
Using the noise criteria (NC) table, select NC‐25 as our receiver room target design background noise maximum.
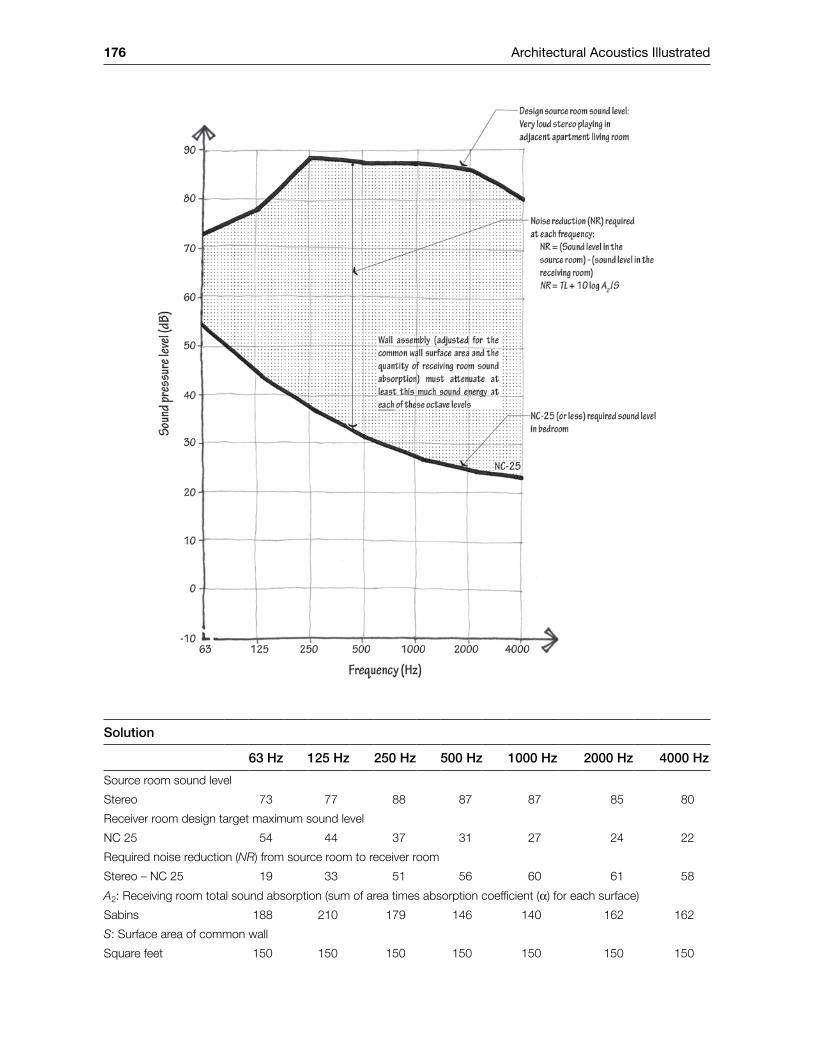
176 Architectural Acoustics Illustrated
Solution
63 Hz 125 Hz 250 Hz 500 Hz 1000 Hz 2000 Hz 4000 Hz
Source room sound level
Stereo 73 77 88 87 87 85 80
Receiver room design target maximum sound level
NC 25 54 44 37 31 27 24 22
Required noise reduction (NR) from source room to receiver room
Stereo – NC 25 19 33 51 56 60 61 58
A2: Receiving room total sound absorption (sum of area times absorption coefficient (α) for each surface)
Sabins 188 210 179 146 140 162 162
S: Surface area of common wall
Square feet 150 150 150 150 150 150 150
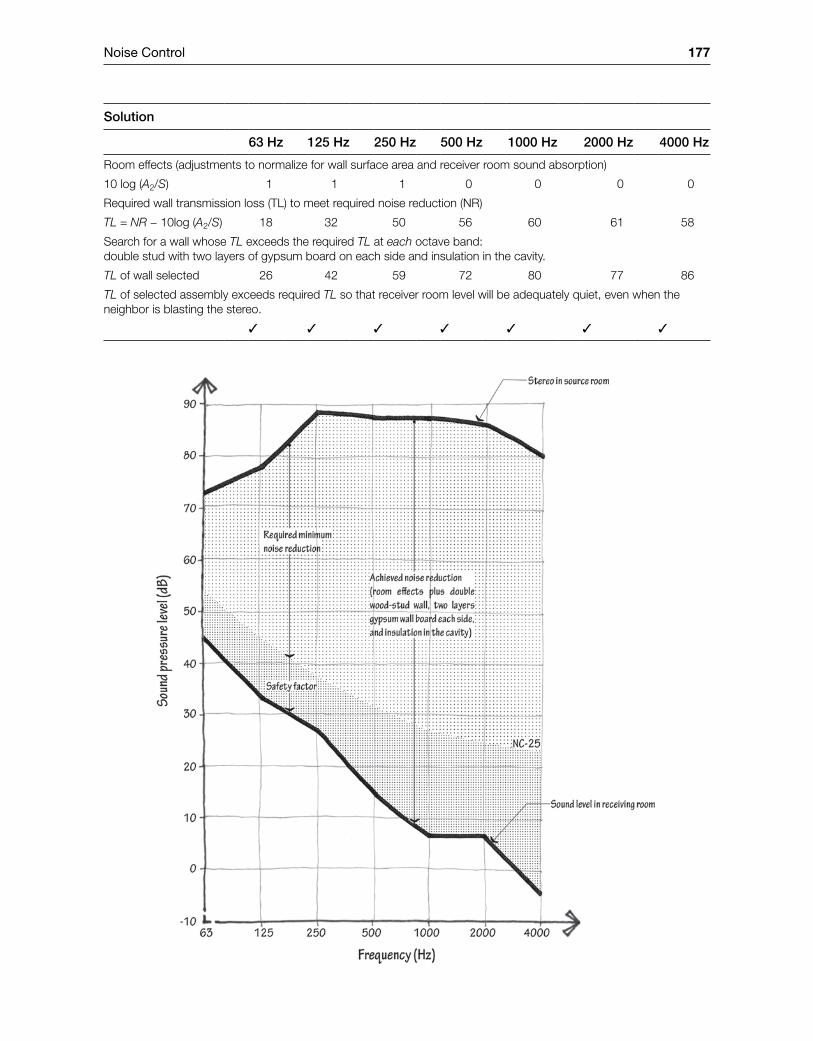
Noise Control 177
Solution
63 Hz 125 Hz 250 Hz 500 Hz 1000 Hz 2000 Hz 4000 Hz
Room effects (adjustments to normalize for wall surface area and receiver room sound absorption)
10 log (A2/S) 1 1 1 0 0 0 0
Required wall transmission loss (TL) to meet required noise reduction (NR)
TL = NR − 10log (A2/S) 18 32 50 56 60 61 58
Search for a wall whose TL exceeds the required TL at each octave band: double stud with two layers of gypsum board on each side and insulation in the cavity.
TL of wall selected 26 42 59 72 80 77 86
TL of selected assembly exceeds required TL so that receiver room level will be adequately quiet, even when the neighbor is blasting the stereo.
✓ ✓ ✓ ✓ ✓ ✓ ✓
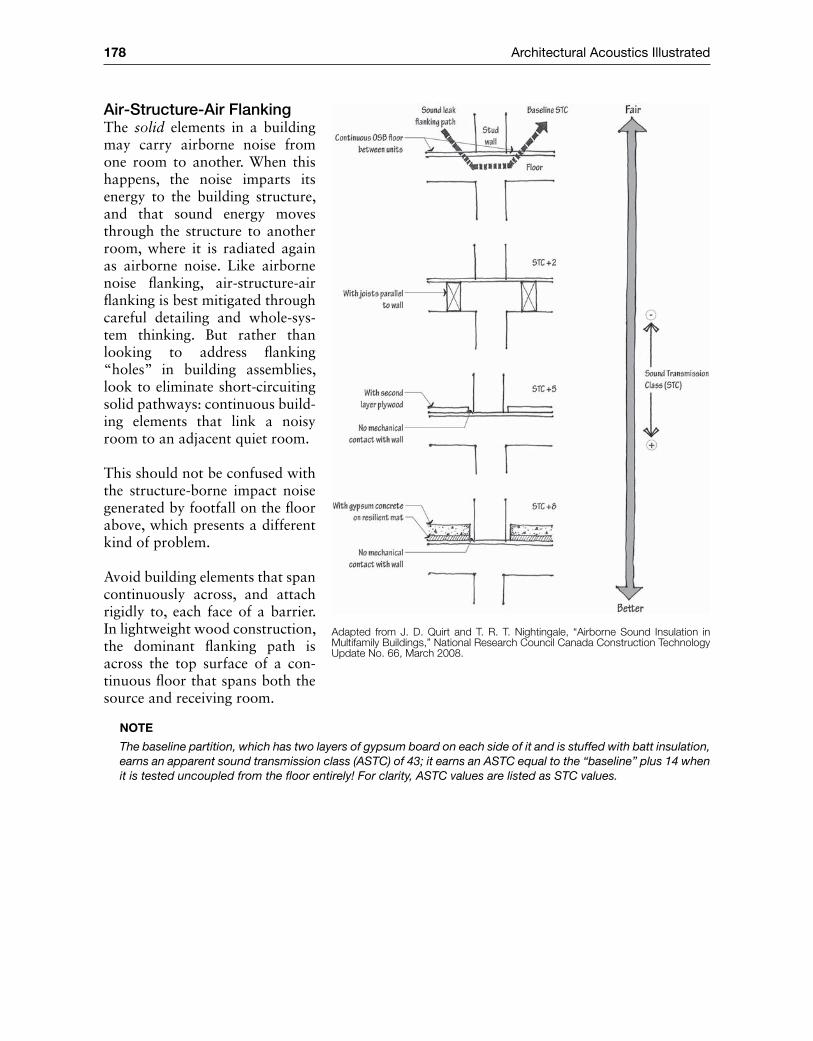
178 Architectural Acoustics Illustrated
Air‐Structure‐Air FlankingThe solid elements in a building may carry airborne noise from one room to another. When this happens, the noise imparts its energy to the building structure, and that sound energy moves through the structure to another room, where it is radiated again as airborne noise. Like airborne noise flanking, air‐structure‐air flanking is best mitigated through careful detailing and whole‐sys-tem thinking. But rather than looking to address flanking “holes” in building assemblies, look to eliminate short‐circuiting solid pathways: continuous build-ing elements that link a noisy room to an adjacent quiet room.
This should not be confused with the structure‐borne impact noise generated by footfall on the floor above, which presents a different kind of problem.
Avoid building elements that span continuously across, and attach rigidly to, each face of a barrier. In lightweight wood construction, the dominant flanking path is across the top surface of a con-tinuous floor that spans both the source and receiving room.
Note
The baseline partition, which has two layers of gypsum board on each side of it and is stuffed with batt insulation, earns an apparent sound transmission class (ASTC) of 43; it earns an ASTC equal to the “baseline” plus 14 when it is tested uncoupled from the floor entirely! For clarity, ASTC values are listed as STC values.
Adapted from J. D. Quirt and T. R. T. Nightingale, “Airborne Sound Insulation in Multifamily Buildings,” National Research Council Canada Construction Technology Update No. 66, March 2008.
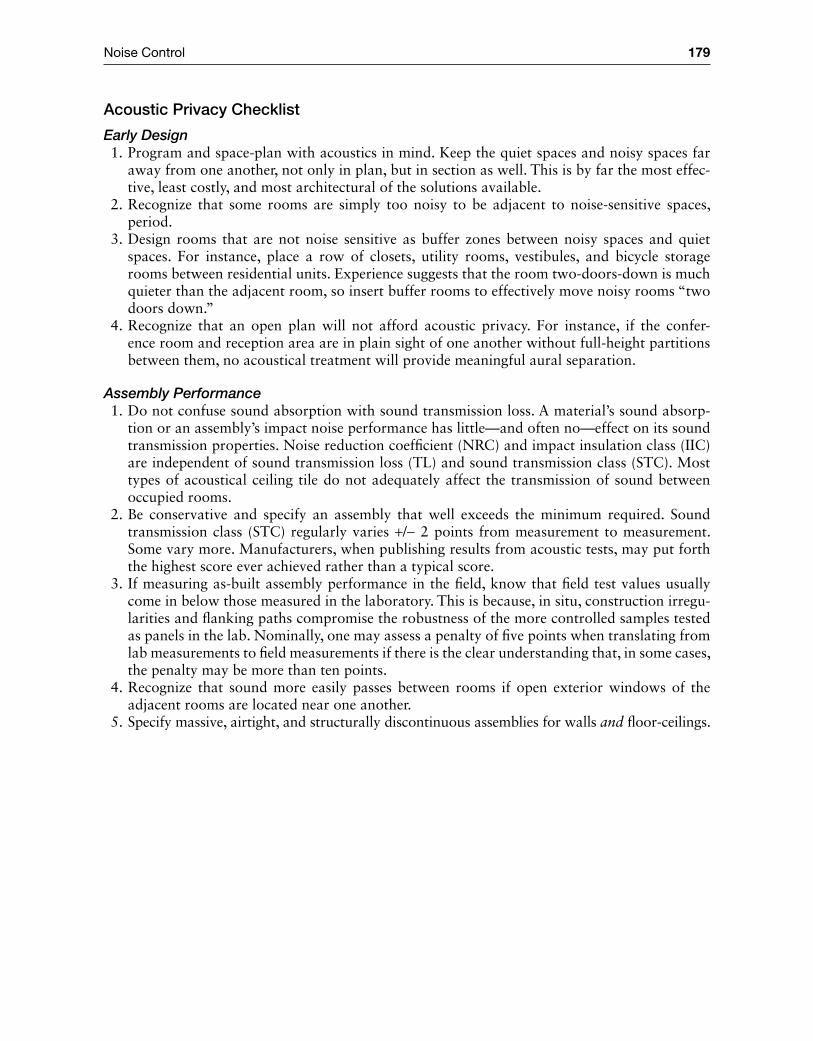
Noise Control 179
Acoustic Privacy Checklist
Early Design 1. Program and space‐plan with acoustics in mind. Keep the quiet spaces and noisy spaces far
away from one another, not only in plan, but in section as well. This is by far the most effec-tive, least costly, and most architectural of the solutions available.
2. Recognize that some rooms are simply too noisy to be adjacent to noise‐sensitive spaces, period.
3. Design rooms that are not noise sensitive as buffer zones between noisy spaces and quiet spaces. For instance, place a row of closets, utility rooms, vestibules, and bicycle storage rooms between residential units. Experience suggests that the room two‐doors‐down is much quieter than the adjacent room, so insert buffer rooms to effectively move noisy rooms “two doors down.”
4. Recognize that an open plan will not afford acoustic privacy. For instance, if the confer-ence room and reception area are in plain sight of one another without full‐height partitions between them, no acoustical treatment will provide meaningful aural separation.
Assembly Performance 1. Do not confuse sound absorption with sound transmission loss. A material’s sound absorp-
tion or an assembly’s impact noise performance has little—and often no—effect on its sound transmission properties. Noise reduction coefficient (NRC) and impact insulation class (IIC) are independent of sound transmission loss (TL) and sound transmission class (STC). Most types of acoustical ceiling tile do not adequately affect the transmission of sound between occupied rooms.
2. Be conservative and specify an assembly that well exceeds the minimum required. Sound transmission class (STC) regularly varies +/− 2 points from measurement to measurement. Some vary more. Manufacturers, when publishing results from acoustic tests, may put forth the highest score ever achieved rather than a typical score.
3. If measuring as‐built assembly performance in the field, know that field test values usually come in below those measured in the laboratory. This is because, in situ, construction irregu-larities and flanking paths compromise the robustness of the more controlled samples tested as panels in the lab. Nominally, one may assess a penalty of five points when translating from lab measurements to field measurements if there is the clear understanding that, in some cases, the penalty may be more than ten points.
4. Recognize that sound more easily passes between rooms if open exterior windows of the adjacent rooms are located near one another.
5. Specify massive, airtight, and structurally discontinuous assemblies for walls and floor‐ceilings.
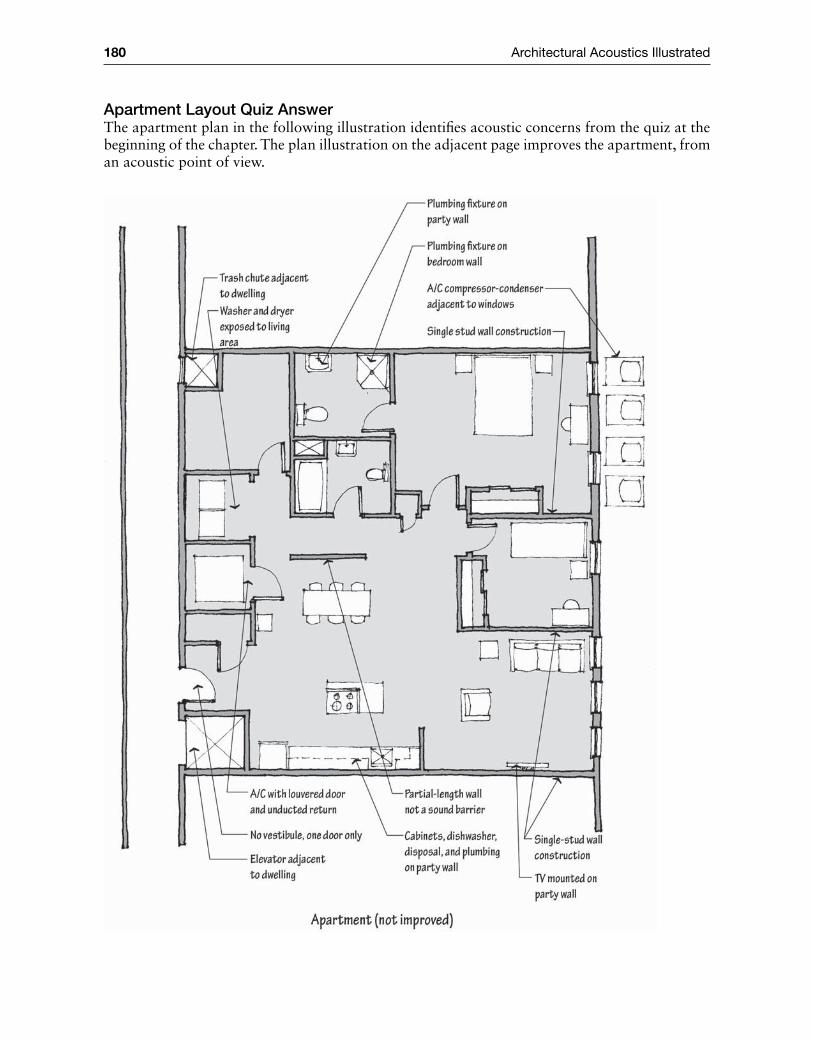
180 Architectural Acoustics Illustrated
Apartment Layout Quiz AnswerThe apartment plan in the following illustration identifies acoustic concerns from the quiz at the beginning of the chapter. The plan illustration on the adjacent page improves the apartment, from an acoustic point of view.

Noise Control 181
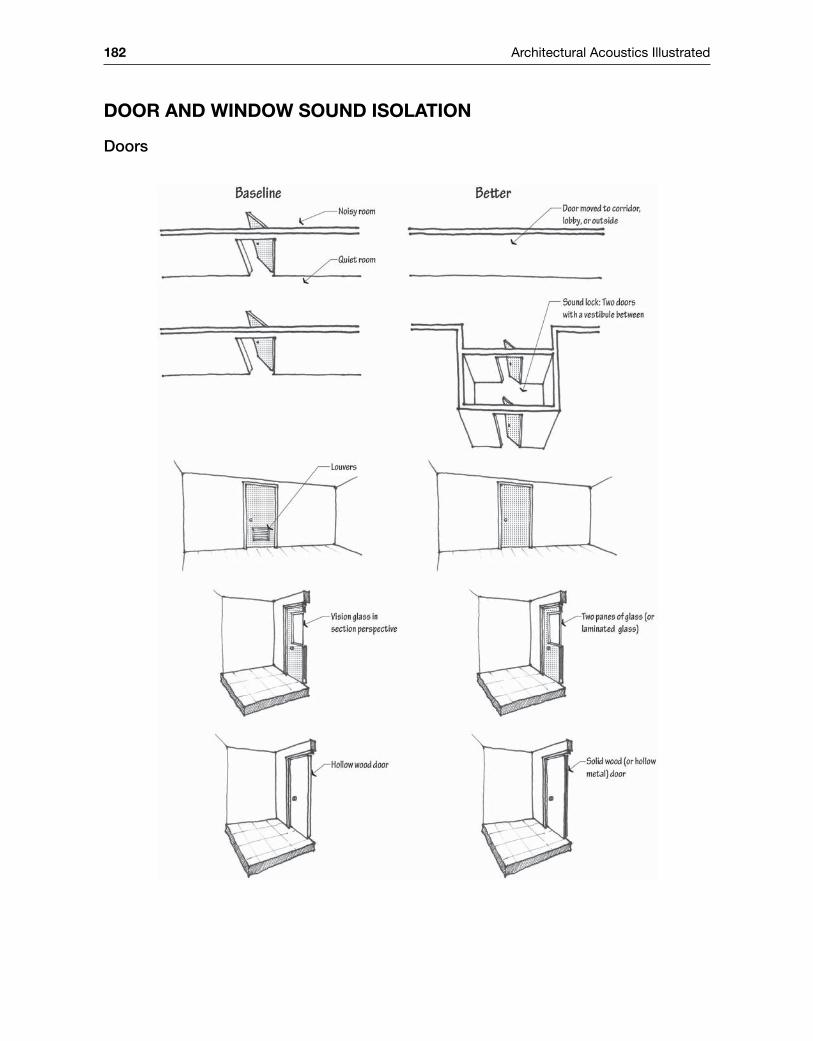
182 Architectural Acoustics Illustrated
door aNd WiNdoW souNd isolatioN
Doors
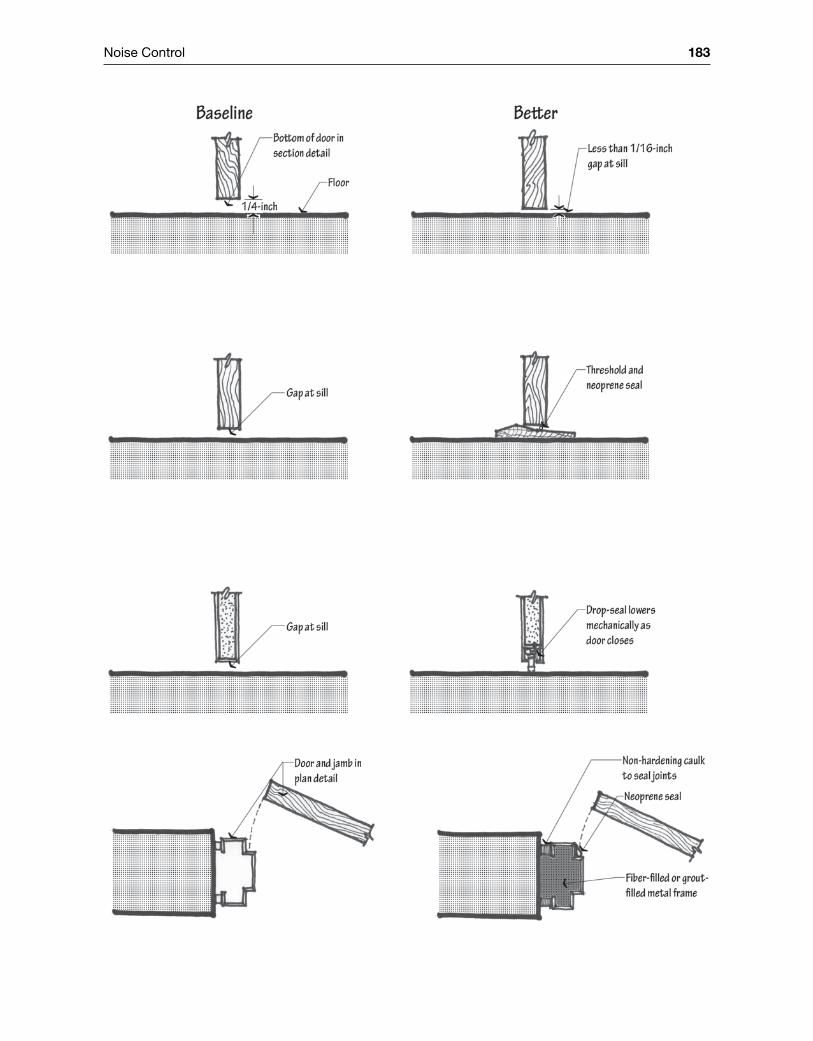
Noise Control 183

184 Architectural Acoustics Illustrated
Noise Isolation and WindowsKeeping sound out is like keeping water out; the weakest region of the building envelope governs effectiveness. If a wall with an STC of 45 contains windows with an STC of 26 covering just 30% of the wall area, the composite STC of the partition drops from 45 to 31. Because an open bedroom window provides almost no meaningful barrier against exterior noise, some sites may simply not be appropriate for some building uses.
As a rule, at frequencies where the transmission loss of a window is at least 10 decibels below that of the wall, the window controls. So for a wall (250‐Hz TL of 33 decibels) with a window (TL of 21 decibels at that same octave band) there is a difference of 33 minus 21 equals 12 decibels. This means that improvements to the 250‐Hz wall transmission loss value will likely not benefit the inte-rior space (without corresponding improvements to the window transmission loss). In this example, and many more like it, design effort priorities should be directed at the window, not the wall.
Note
A building façade’s performance may also be measured and reported as outdoor‐indoor transmission class (OITC). Like STC, OITC is a single‐number rating used to describe a building assembly’s noise isolation robust-ness, but OITC weights more heavily the low‐frequency sound associated with transportation noise (likely to present itself to building skins). It therefore is thought to be more appropriate for façades.

Noise Control 185
iMPaCt Noise
Impact Noise IsolationImpact noise is both particularly common and particularly difficult to mitigate, especially in mul-tifamily housing. Currently, the field often defines floor‐ceiling construction not through design standards or building codes, but rather through litigation. Impact noise, as a type of structure‐borne sound, arises from impacts and vibrations transmitted directly to the building structure. These sounds can be loud and sporadic, therefore particularly annoying to building occupants, and unless they are accounted for in the initial design, structure‐borne noise problems are difficult to correct.
Impact noises are radiated to structure through furniture movement, machinery, dropped items, rolling carts, kitchen activities, fitness activities, hammering, and slammed doors—but in almost all cases, impact noise discussion can be limited to footfall noise. When feet strike a floor, they can set the structure into vibration, and structure‐borne sound is radiated to both sides of a floor‐ceil-ing assembly, often to a room below. Because structure‐borne noise can travel quite far, footfall noise may be heard at great distances from the source.
The types of floor‐ceiling assemblies that do well at keeping airborne noise out of a room below a source are not necessarily effective at keeping structure‐borne impact noise from radiating down-ward; and the types of assemblies that resist the creation and transmission of impact noise do not necessarily perform well when subject to airborne noise.
Impact Insulation Class (IIC)Impact insulation class (IIC) provides a single‐number rating and a means for comparing the per-formance of floor‐ceiling assemblies for the transmission of impact noise. The higher the impact insulation class (sometimes written as impact isolation class but still abbreviated as IIC), the bet-ter the assembly performs. A floor with no acoustic consideration in its design might earn an IIC of about 30, and most occupants would find that unacceptable; a floor that takes acoustics into careful consideration might achieve an IIC of 70, and most occupants would find that accept-able. Yet if a designer has taken some acoustic care in the design of a floor‐ceiling assembly, and achieves an (International Building Code minimum) IIC of 50 . . . well, some residents will find that satisfactory and some will not.
In lightweight wood or steel frame construction, maintaining appropriate impact noise sound isolation may be quite rare, even if IIC ratings exceed minima. Research and experience suggest that the low‐pitched thud associated with footfall and deflection in these types of buildings may not be practically mitigated to a level that many occupants would judge to be acceptable. Because annoyance from footfall is related to the mere audibility (as well as the magnitude) of the noise, designers should consider avoiding lightweight construction altogether in favor of a concrete building when residential units will be stacked. If building in wood, one might consider gypsum concrete floor toppings to add mass and stiffness, establishing appropriate occupant expectations, or adopting a townhouse regime where units are not stacked vertically. In wood construction, even if floors boast high IIC ratings—ratings that if found in concrete construction would sug-gest proper performance—they may not be judged acceptable to a portion of reasonably minded building residents.
Achieving Higher Impact Noise Performance in Design 1. Programming. As with most problems related to noise control, positioning noisy areas so that
they are far from quiet areas is often the best of the solutions available. To mitigate problems

186 Architectural Acoustics Illustrated
that might arise from impact noise, consideration should be given as to whether a parti that involves vertically stacking residential units is necessary at all.
2. Damping at point of impact. The most effective method to bolster the performance of a floor‐ceiling assembly is to prevent the impact sound energy from entering the building struc-ture altogether. This can be achieved by specifying carpet with a soft underlayment, cork, or rubber tile surfaces. Of course, even if carpet is specified, occupants may swap out their soft surface for a hard one sometime after taking ownership of a unit, significantly decreasing its impact noise performance.
3. Damping between a hard finish surface and a structural surface. A resilient underlayment can consist of a mesh, pad, board, or mat layer. These are typically proprietary systems and are not equal in performance. In general, thick underlayments far outperform thinner underlay-ments, and those with thicknesses less than 3
8 inch should be avoided, especially in light wood construction. In concrete construction, a “floating floor” may be used to isolate a concrete pad from the structural floor below it. In this system, a second floor surface hovers on spring or neoprene isolators. Most of the effective underlayments will add a not‐insignificant thick-ness to the floor assembly, which can complicate the installation of cabinets and doors. When designing for an underlayment or floating floor, carefully detail to eliminate flanking paths at penetrations and walls.
4. Damping between the structural floor and the ceiling below. Generally, floor‐ceiling assem-blies with ceilings outperform those with exposed overhead structure. Decoupling the ceiling from the structure with spring hangers, resilient channel, or resilient brackets, increases per-formance further. For concrete construction, maintain four inches minimum airspace between the ceiling and the structure above it (eight inches is better).
5. Insulation in the cavity. The use of sound‐absorbing fiberglass, cellulose, or mineral wool insulation in the cavity between the floor above and the ceiling below increases impact insula-tion performance. This “fuzz” in the cavity benefits frame construction only slightly but has a more meaningful impact in concrete constructions with suspended ceilings.
6. Stiffness and mass. While “click‐clack” sounds are associated with an inadequately resilient floor surface assembly, a “thud” sound is associated with insufficient stiffness. In wood con-struction, short joist spans, nominally those 14 feet or less, outperform floors with longer joist spans in the field; floors with denser joist spacing, 16 inches on‐center or less, outper-form floors with sparser joist spacing. Lab tests published for floor‐ceiling assemblies do not currently account for the variability of joist spans, and manufacturers may disingenuously test a stiffer structure in the lab than normally specified in the field to bolster a product’s IIC numbers. To achieve appropriate stiffness and mass in wood construction, a concrete or gyp-sum‐concrete floor topping should be used.
7. Flanking. The acoustical benefit of underlayments or resilient ceiling mounts can be compro-mised if the independence of resilient components is short‐circuited. Special care is required in detailing and construction oversight to ensure that resiliently supported floors, floated floors, and resiliently hung ceilings make no rigid contact with structure that bridges between floors. When floors are isolated on an underlayment or floated, use a soft proprietary perimeter board at the edge of the floor surface in each room to keep structure‐borne acoustic energy from transferring to the walls. Floor moldings should be attached to the walls, but make no mechanical contact with the resiliently mounted floor (use non‐hardening caulk). Nor should spring‐ and resiliently hung ceilings mechanically contact walls (again, use non‐hardening caulk to make the seal). Be wary: Pipes, conduit, ducts, and other services penetrating a damped floor‐ceiling assembly will short‐circuit the resilient layer unless carefully detailed so as to avoid simultaneous mechanical contact with the floor surface and ceiling or structure.
Noise Control 187
Shortcomings of the IIC RatingWhile the IIC rating is widely referenced, it does not always measure the likelihood of annoyance from footfall. First, assigning a single value as an acoustic metric oversimplifies the important role that frequency‐dependency plays in sound. Second, IIC ratings, especially those measured by product manufacturers, are tested in laboratory conditions, but in‐the‐field performance is known to vary from that which is measured in the lab. Third, published IIC values often do not take into account the span (stiffness) of the floor structure. Fourth, floor‐ceiling assemblies are fickle in their transmission of sound. A seemingly small change in the section detail may lever-age large variations in sound isolation. It is therefore difficult to estimate an IIC rating, and since most floor‐ceiling assemblies haven’t been tested exactly as specified, it may be difficult to know exactly how your assembly will perform. Finally, and most importantly, in its calculation the IIC metric doesn’t properly account for the low‐frequency thud associated with footfall in wood and lightweight steel construction. Whenever possible, examine the original lab test document to verify the structure’s stiffness and to compare the low‐frequency third‐octave‐band spectral performance. Nonetheless, IIC is widely used, and no better measurements have yet found broad acceptance (in the United States). It’s best to view IIC as a useful but flawed instrument.
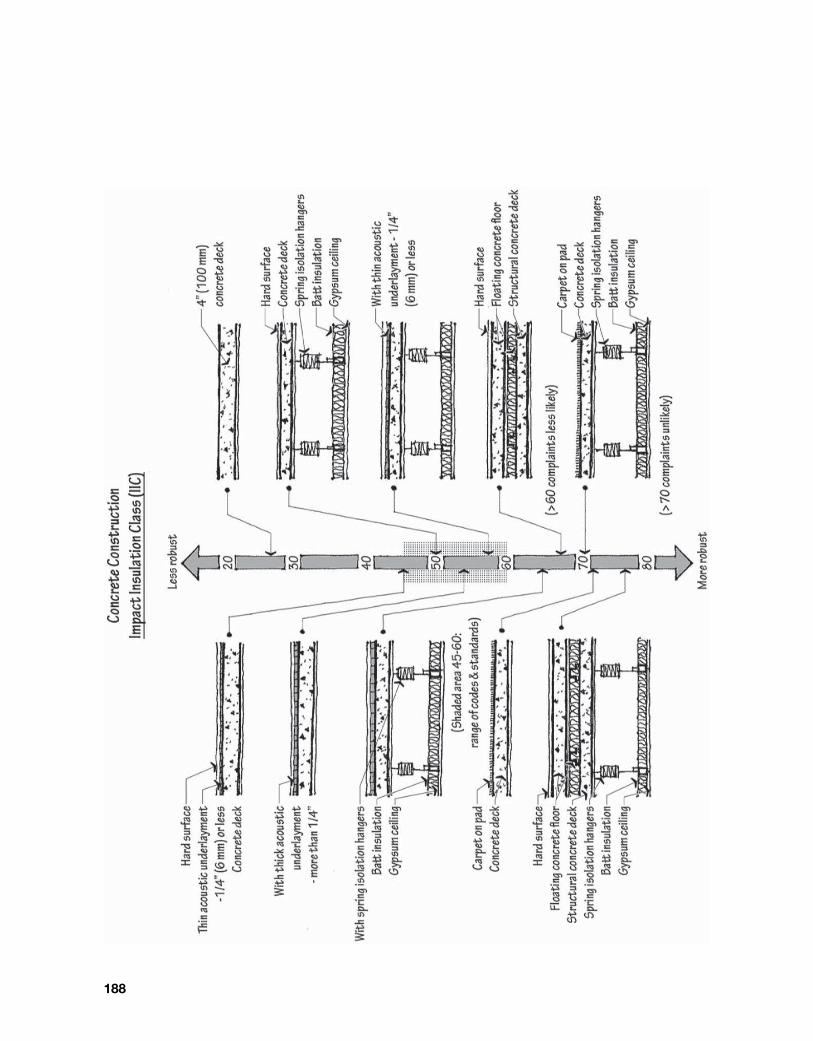
188
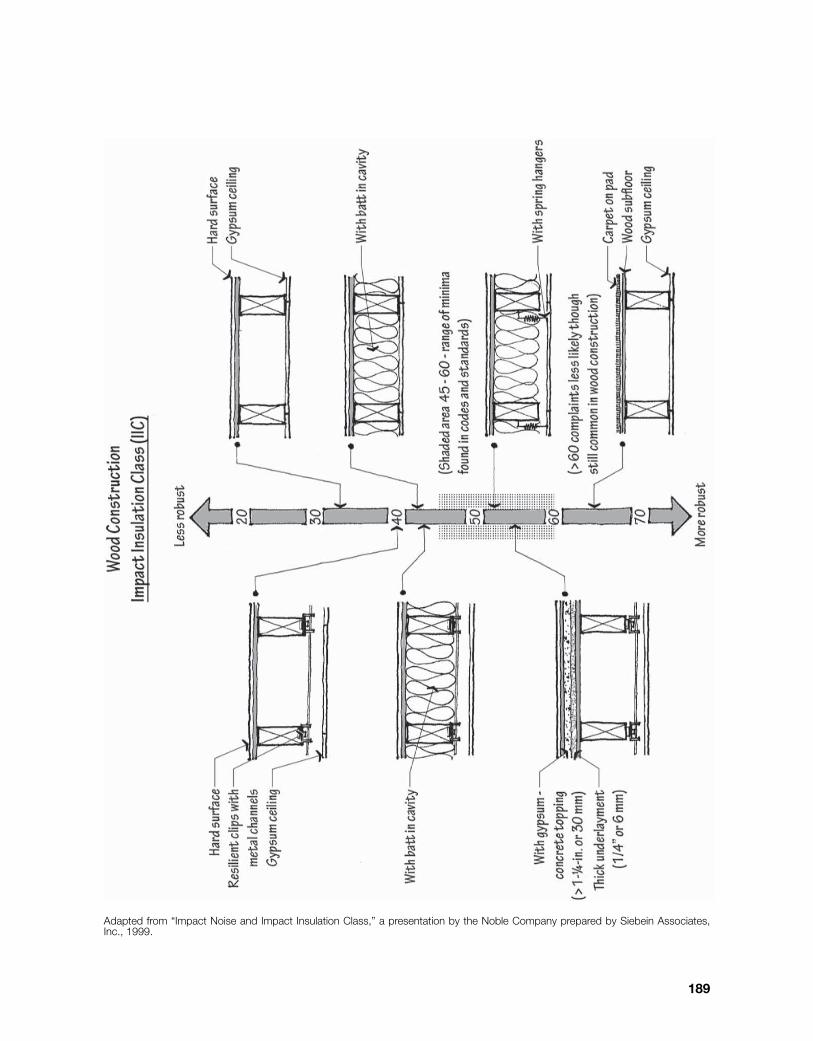
Adapted from “Impact Noise and Impact Insulation Class,” a presentation by the Noble Company prepared by Siebein Associates, Inc., 1999.
189
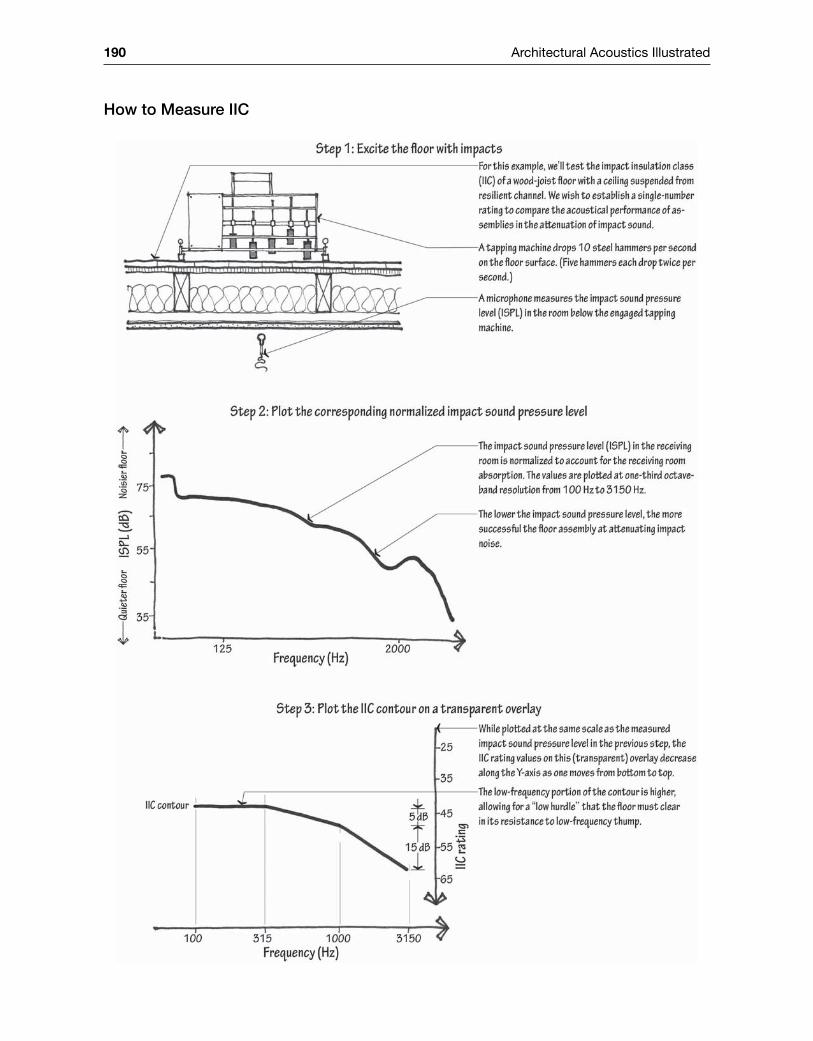
190 Architectural Acoustics Illustrated
How to Measure IIC
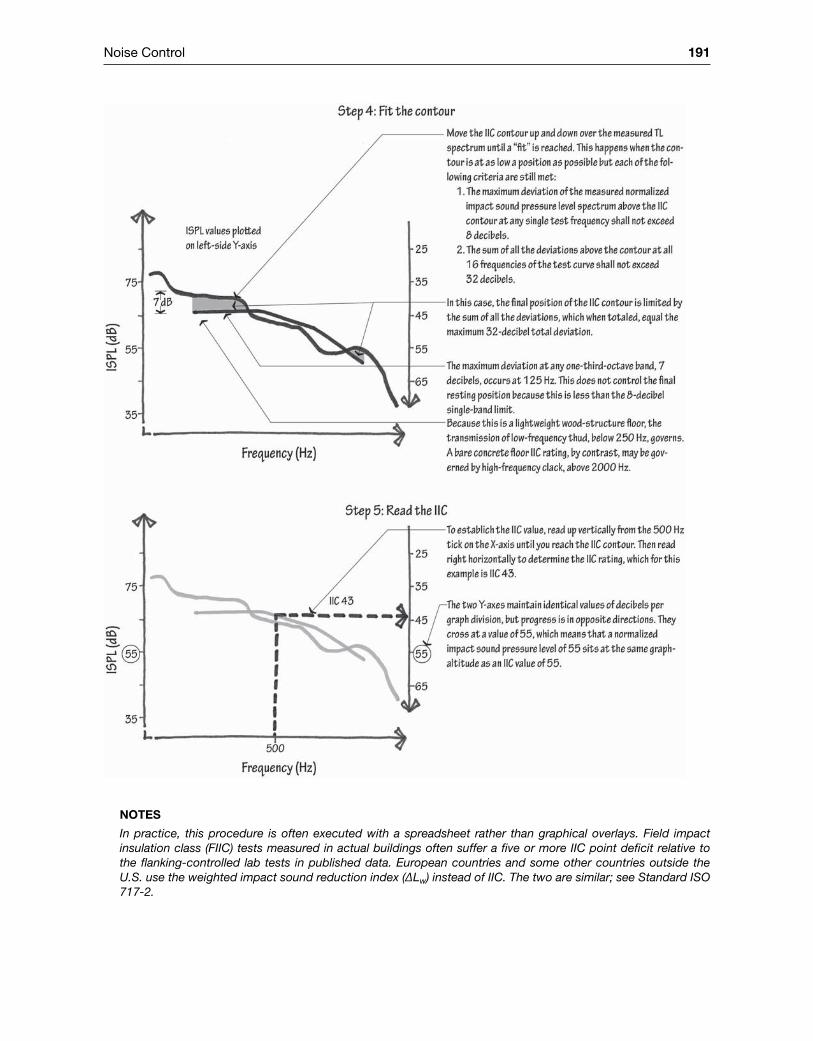
Noise Control 191
Notes
In practice, this procedure is often executed with a spreadsheet rather than graphical overlays. Field impact insulation class (FIIC) tests measured in actual buildings often suffer a five or more IIC point deficit relative to the flanking‐controlled lab tests in published data. European countries and some other countries outside the U.S. use the weighted impact sound reduction index (ΔLw) instead of IIC. The two are similar; see Standard ISO 717‐2.
192 Architectural Acoustics Illustrated
Impact Noise Checklist
Early Design 1. Don’t stack residential units vertically. Consider a townhouse configuration instead, if possible. 2. Don’t program noisy spaces likely to generate footfall above quiet spaces. 3. Use concrete. Many researchers and practitioners believe there is no way to achieve accept-
able low‐frequency impact noise isolation performance with wood or light steel construction. 4. Know that, at present, minimum code performance is not aligned with widespread occupant
satisfaction. Prepare residents to maintain reasonable expectations and educate clients on the topic of impact noise.
5. Avoid designing kitchens and baths above living rooms or bedrooms. They are more likely to have tile surfaces.
Assembly Performance 1. Avoid excessive floor deflection in wood and light steel construction. Although a floor joist system
may be adequate for load requirements, it may deflect sufficiently underfoot to cause squeaking or thud. This generally occurs when the joist is too shallow or the spacing between joists is too wide. For typical residential floor construction, the deflection of the floor should not exceed 18 inch under a uniform dead‐load distribution of 40 pounds per square foot. This amounts to approximately one‐fourth of the conventional deflection limitations, which are based on 1
360 of the floor span. 2. Remember that strong acoustical performance at airborne sound isolation (STC) or sound absorp-
tion (NRC) does not (necessarily) equate to good acoustical performance at impact noise isolation. 3. Where hard surfaces exist, use thick resilient underlayments or floating floors to isolate the
finished floor from the structure. 4. Design resiliently mounted sound‐barrier gypsum ceilings under structural floors. Extend ceil-
ings to cover the entire space, rather than only some rooms. Acoustical ceiling tile (ACT) ceil-ings offer scant impact noise protection.
5. In concrete construction, maintain an airspace (with fiberglass insulation) of at least four inches between the structural floor and the hung ceiling. Eight inches is better
6. Detail and specify resilient clips with metal channels or resilient channels to support gypsum board ceilings. If using resilient channels, (a) carefully supervise their installation, (b) use high‐quality stock, and avoid channels heavier than 25 gauge that is not really resilient, (c) limit the length of screws attaching the ceiling to ensure they don’t engage the structure beyond the resil-ient channel, (d) don’t install the channel between two layers of gypsum board, upside down, or with the solid part of the web at joists, and (e) don’t excessively overlap the ends of the channel.
7. Insert stepped blocking between joists in wood construction to make the assembly stiffer. 8. Provide fiberglass batt insulation in the airspace between the structure and the ceiling. 9. Install closers and impact snubbers on cabinet doors, and require felt sliders for chairs and
other movable furniture.
Flanking 1. Because flanking paths are the enemy of effective isolation, carefully detail the edge of the
floor and penetrations of the assembly so that resilient surfaces do not make mechanical con-tact with the rest of the building. Use generous quantities of non‐hardening caulk, glass fiber packing, and firestop putty.
2. Know that ceiling‐mounted recessed lights and ducted air inlets/outlets in a ceiling can com-promise the performance of the assembly.
3. Detail the perimeter of the ceiling so that it doesn’t make mechanical contact with the wall. Seal the ceiling perimeter with non‐hardening caulk. The wall board should extend up beyond the ceiling board: If a resiliently mounted ceiling gypsum board plane rests on the wall board, the wall board may support the ceiling board, negating the ceiling’s resilient connection.
AV Content Online
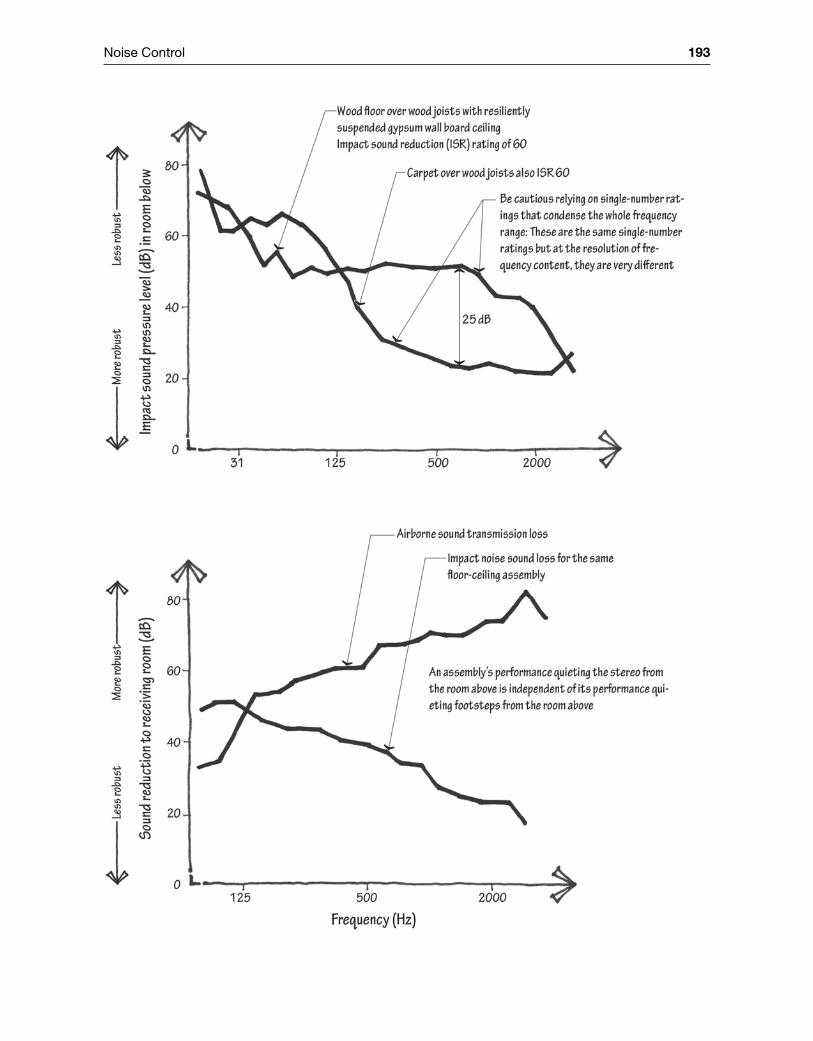
Noise Control 193

194 Architectural Acoustics Illustrated
Adapted from Veneklasen Associates, Inc., John Lo Verde and Wayland Dong
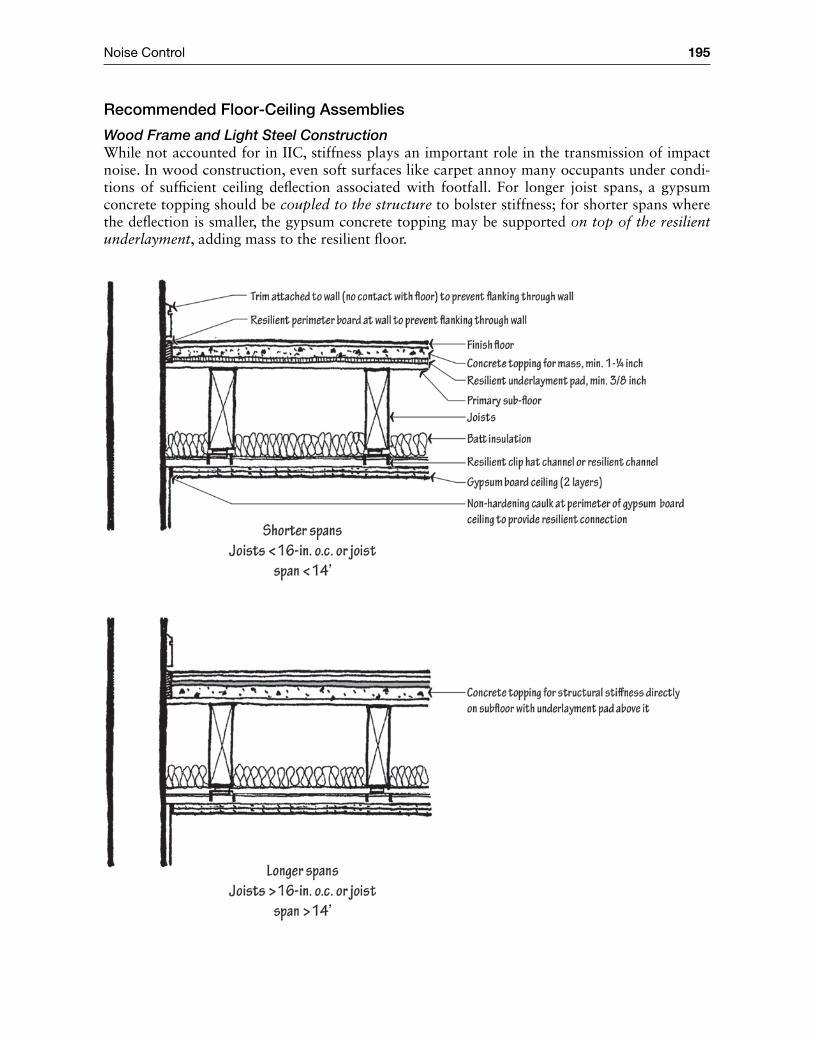
Noise Control 195
Recommended Floor‐Ceiling Assemblies
Wood Frame and Light Steel ConstructionWhile not accounted for in IIC, stiffness plays an important role in the transmission of impact noise. In wood construction, even soft surfaces like carpet annoy many occupants under condi-tions of sufficient ceiling deflection associated with footfall. For longer joist spans, a gypsum concrete topping should be coupled to the structure to bolster stiffness; for shorter spans where the deflection is smaller, the gypsum concrete topping may be supported on top of the resilient underlayment, adding mass to the resilient floor.
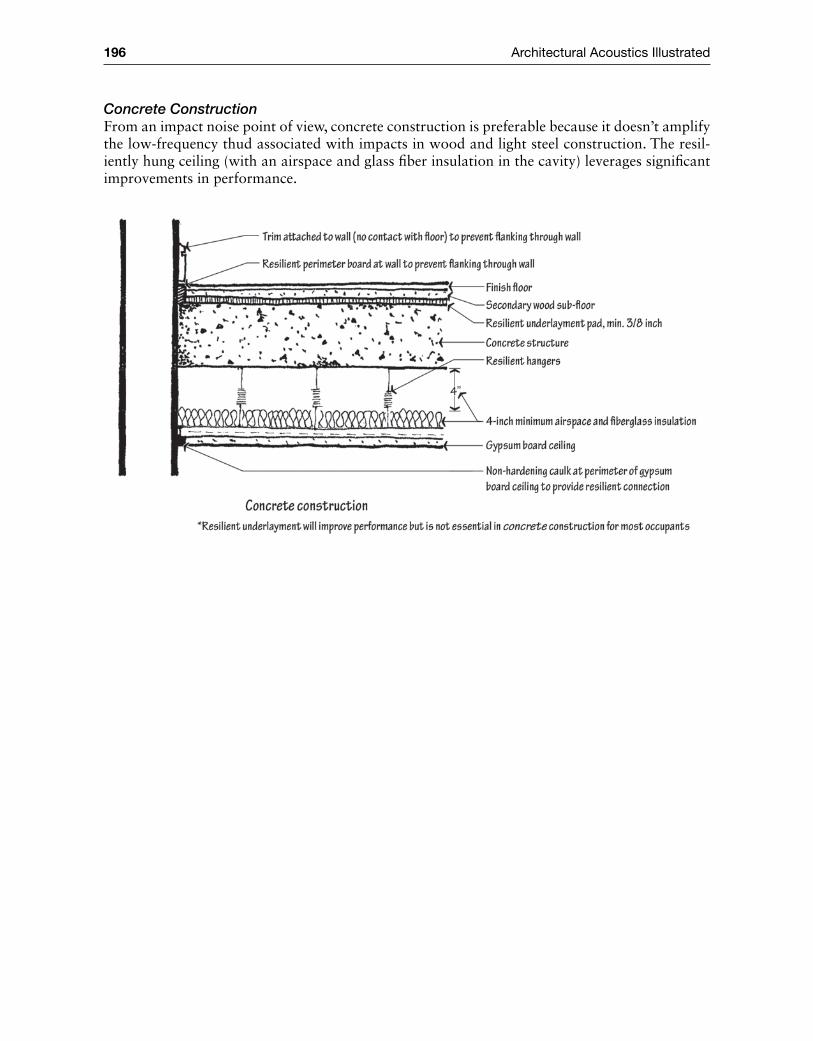
196 Architectural Acoustics Illustrated
Concrete ConstructionFrom an impact noise point of view, concrete construction is preferable because it doesn’t amplify the low‐frequency thud associated with impacts in wood and light steel construction. The resil-iently hung ceiling (with an airspace and glass fiber insulation in the cavity) leverages significant improvements in performance.
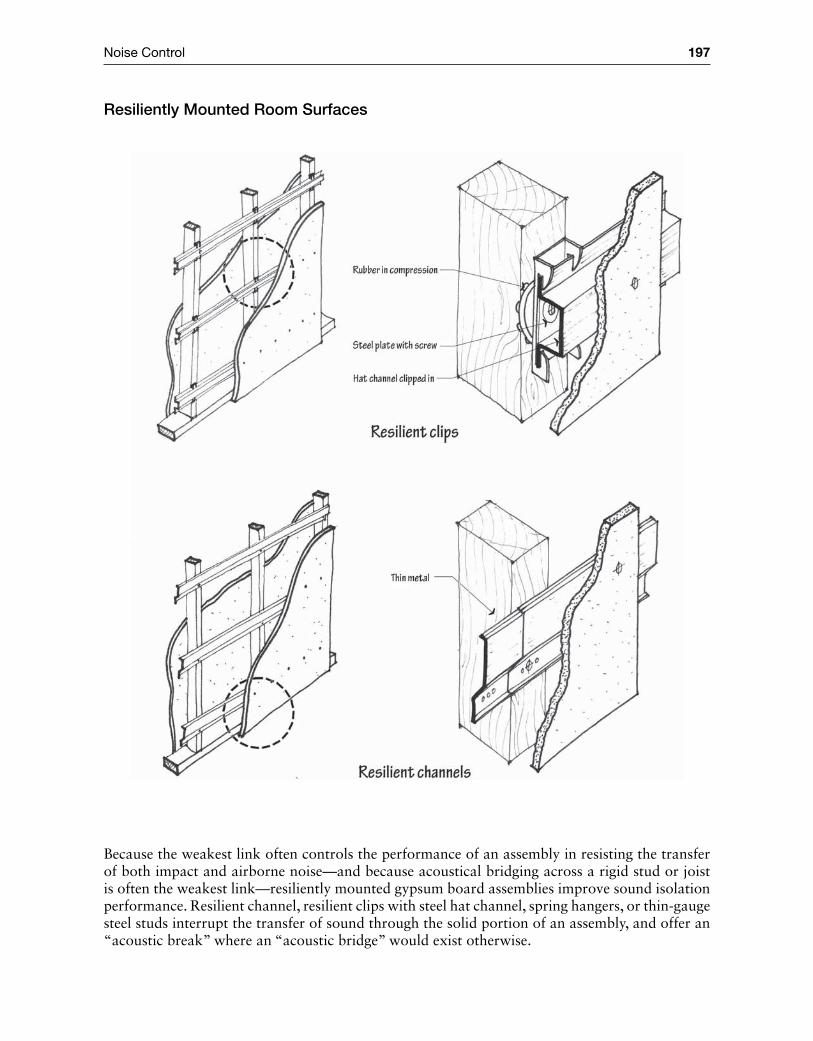
Noise Control 197
Because the weakest link often controls the performance of an assembly in resisting the transfer of both impact and airborne noise—and because acoustical bridging across a rigid stud or joist is often the weakest link—resiliently mounted gypsum board assemblies improve sound isolation performance. Resilient channel, resilient clips with steel hat channel, spring hangers, or thin‐gauge steel studs interrupt the transfer of sound through the solid portion of an assembly, and offer an “acoustic break” where an “acoustic bridge” would exist otherwise.
Resiliently Mounted Room Surfaces

198 Architectural Acoustics Illustrated
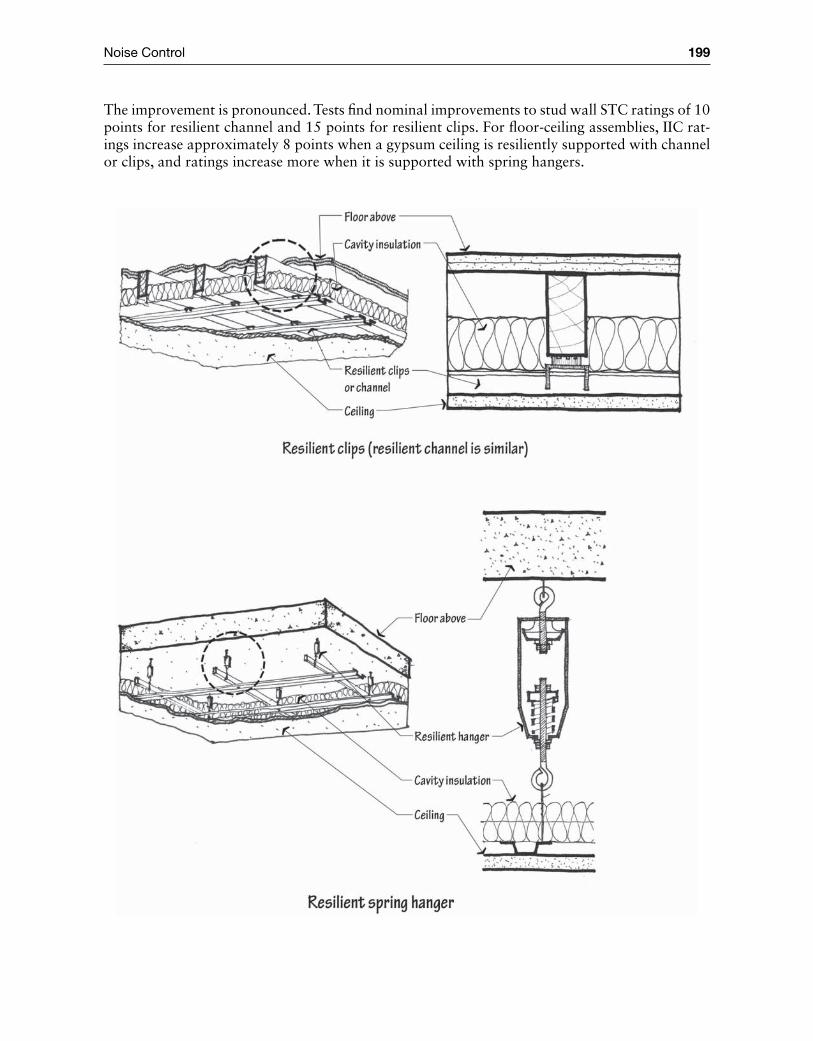
Noise Control 199
The improvement is pronounced. Tests find nominal improvements to stud wall STC ratings of 10 points for resilient channel and 15 points for resilient clips. For floor‐ceiling assemblies, IIC rat-ings increase approximately 8 points when a gypsum ceiling is resiliently supported with channel or clips, and ratings increase more when it is supported with spring hangers.
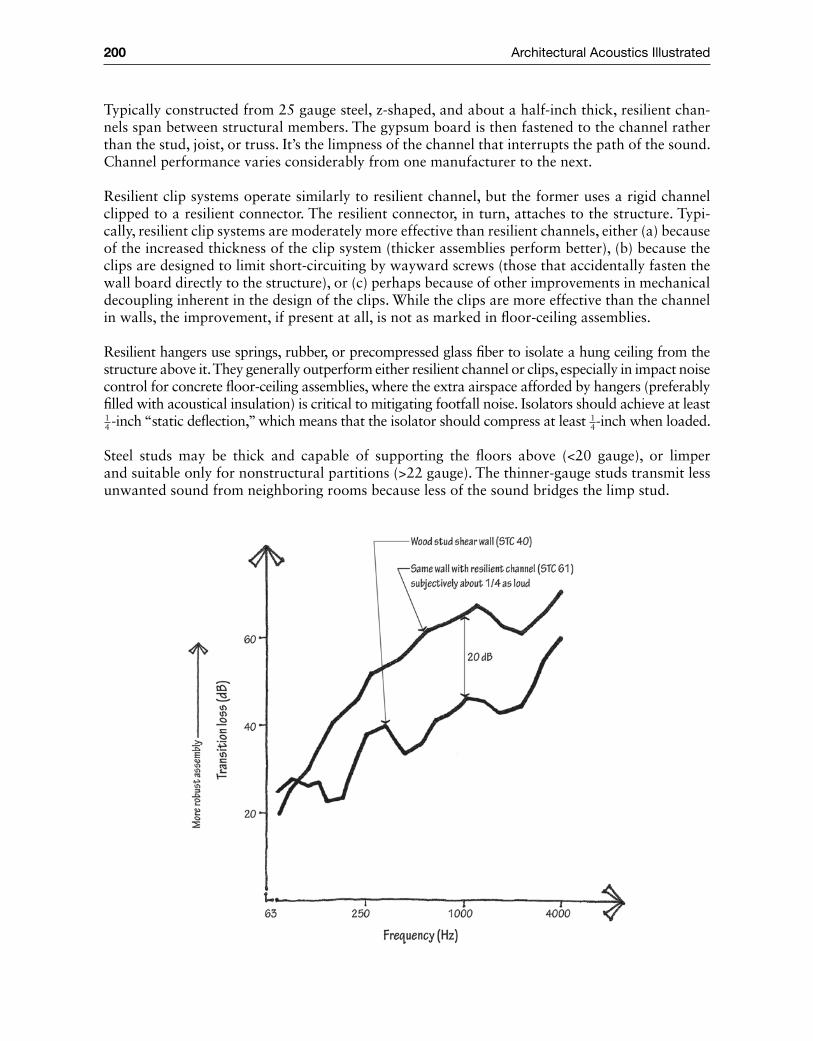
200 Architectural Acoustics Illustrated
Typically constructed from 25 gauge steel, z‐shaped, and about a half‐inch thick, resilient chan-nels span between structural members. The gypsum board is then fastened to the channel rather than the stud, joist, or truss. It’s the limpness of the channel that interrupts the path of the sound. Channel performance varies considerably from one manufacturer to the next.
Resilient clip systems operate similarly to resilient channel, but the former uses a rigid channel clipped to a resilient connector. The resilient connector, in turn, attaches to the structure. Typi-cally, resilient clip systems are moderately more effective than resilient channels, either (a) because of the increased thickness of the clip system (thicker assemblies perform better), (b) because the clips are designed to limit short‐circuiting by wayward screws (those that accidentally fasten the wall board directly to the structure), or (c) perhaps because of other improvements in mechanical decoupling inherent in the design of the clips. While the clips are more effective than the channel in walls, the improvement, if present at all, is not as marked in floor‐ceiling assemblies.
Resilient hangers use springs, rubber, or precompressed glass fiber to isolate a hung ceiling from the structure above it. They generally outperform either resilient channel or clips, especially in impact noise control for concrete floor‐ceiling assemblies, where the extra airspace afforded by hangers (preferably filled with acoustical insulation) is critical to mitigating footfall noise. Isolators should achieve at least 14 ‐inch “static deflection,” which means that the isolator should compress at least 1
4‐inch when loaded.
Steel studs may be thick and capable of supporting the floors above (<20 gauge), or limper and suitable only for nonstructural partitions (>22 gauge). The thinner‐gauge studs transmit less unwanted sound from neighboring rooms because less of the sound bridges the limp stud.
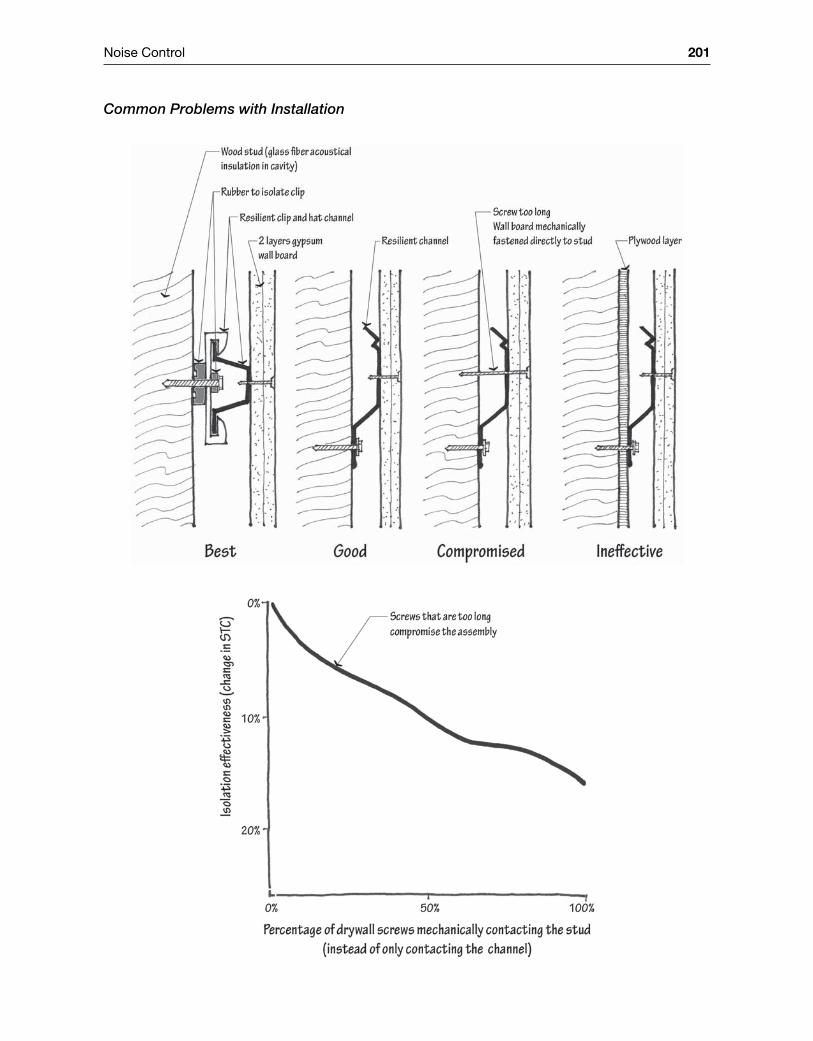
Noise Control 201
Common Problems with Installation
202 Architectural Acoustics Illustrated
CoMMuNity Noise
Principles of Community NoiseExcessive community noise is common, a source of great annoyance, and a danger to human health. The U.S. census puts the proportion of Americans complaining of street noise at one in four, which ranks above crime, litter, and the other neighborhood problems surveyed as the greatest single source of dissatisfaction related to where people live. And the number of peo-ple exposed to unacceptable noise continues to grow. Rural communities have more firearms and recreational vehicles (ATVs, snowmobiles, and boats), and they often show a libertarian streak when considering noise ordinances—while simultaneously maintaining expectations of a quiet rural environment. In the suburbs, city dwellers have brought their noise with them, and supplemented it with lawnmowers, pool filters, leaf blowers, and outdoor air‐conditioning equipment. Urban communities have long dealt with noise, most commonly stemming from transportation and neighbors.
Epidemiologists have known of the link between very high levels of noise at work and hearing loss, but now there is increasing evidence that long‐term exposure to low levels of nighttime noise during sleep may be dangerous. Much of that noise is coming through the bedroom window. On the evolutionary time scale, human beings introduced the electric light only recently, and now purposeful activities litter the once‐tranquil nighttime. Noise at 45 dBA—typically too quiet to actually awaken a person—is more than enough to disrupt sleep, and the effect is espe-cially acute in children. The result for those living with environmental noise: a 20% to 40% increased risk of heart attack, a 14% increased likelihood of hypertension for every 10 decibels of noise, and increased rates of annoyance, mental health problems, headaches, drowsiness, irritation, speech interference, delayed speech and reading in children, cognitive impairment, and memory loss.
Building‐in‐Building DesignActs of architecture—space planning, siting, building orientation, scale, composition, materiality, detailing, construction supervision, and design—typically prove the most effective modes of noise control. In the example that follows, Adler and Sullivan’s Chicago Auditorium Building of 1889 uses a layer of offices and a hotel to isolate a theater in the center of the structure. In this way the performances are buffered from street noise and light, while the daylight‐thirsty offices and hotel rooms ring the perimeter.
The theater was unusually large at 4,300 seats. While the building‐in‐building parti serves as a case study in effective noise buffering, it also serves as a case study in poor room acoustics. Appropriate rooms for unamplified performances are typically less than half that seated capac-ity (see the preceding chapter, “Room Acoustics”). At large sizes there is simply not enough sound energy for everyone in the audience to enjoy. The farthest seats are too far from the source, the side walls are too far apart to bring early‐arriving beneficial first‐order sound reflec-tions, echoes are generated, and there is too much sound‐absorbing audience to hit target reverberation times.
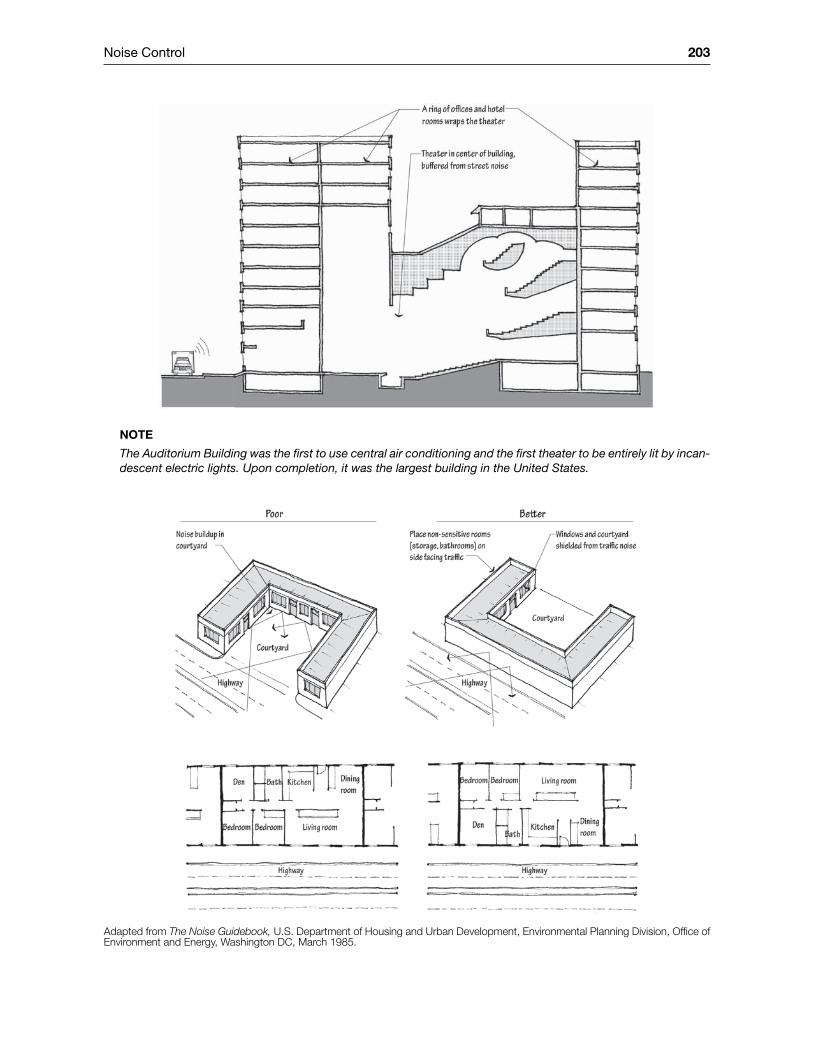
Noise Control 203
Note
The Auditorium Building was the first to use central air conditioning and the first theater to be entirely lit by incan-descent electric lights. Upon completion, it was the largest building in the United States.
Adapted from The Noise Guidebook, U.S. Department of Housing and Urban Development, Environmental Planning Division, Office of Environment and Energy, Washington DC, March 1985.
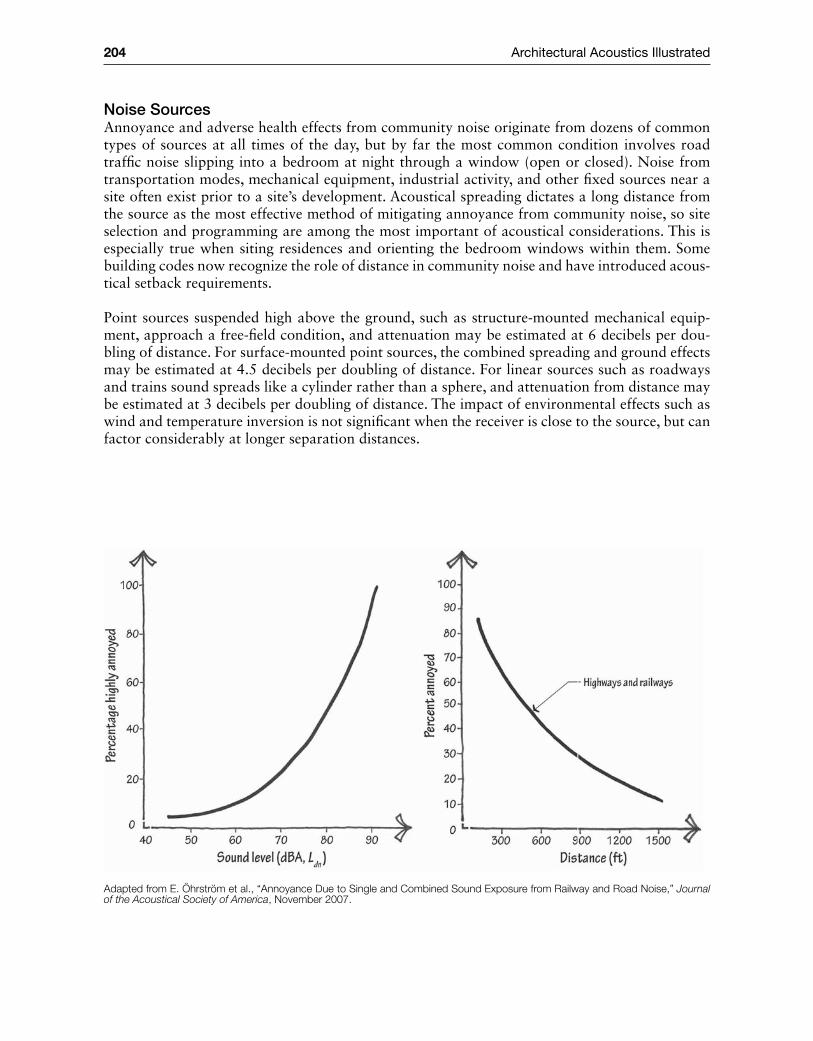
204 Architectural Acoustics Illustrated
Noise SourcesAnnoyance and adverse health effects from community noise originate from dozens of common types of sources at all times of the day, but by far the most common condition involves road traffic noise slipping into a bedroom at night through a window (open or closed). Noise from transportation modes, mechanical equipment, industrial activity, and other fixed sources near a site often exist prior to a site’s development. Acoustical spreading dictates a long distance from the source as the most effective method of mitigating annoyance from community noise, so site selection and programming are among the most important of acoustical considerations. This is especially true when siting residences and orienting the bedroom windows within them. Some building codes now recognize the role of distance in community noise and have introduced acous-tical setback requirements.
Point sources suspended high above the ground, such as structure‐mounted mechanical equip-ment, approach a free‐field condition, and attenuation may be estimated at 6 decibels per dou-bling of distance. For surface‐mounted point sources, the combined spreading and ground effects may be estimated at 4.5 decibels per doubling of distance. For linear sources such as roadways and trains sound spreads like a cylinder rather than a sphere, and attenuation from distance may be estimated at 3 decibels per doubling of distance. The impact of environmental effects such as wind and temperature inversion is not significant when the receiver is close to the source, but can factor considerably at longer separation distances.
Adapted from E. Öhrström et al., “Annoyance Due to Single and Combined Sound Exposure from Railway and Road Noise,” Journal of the Acoustical Society of America, November 2007.
Noise Control 205
Types of Environmental Noises: 1. Predictable noises over which designers may have control: A building’s outdoor fans, air‐condi-
tioner condenser units, compressors, pumps, cooling towers, refrigeration equipment, garage door openers, trash dumpsters with slamming lids, generators, noisy fitness activities (playgrounds, basketball courts, aerobic dancing with music), and areas with frequent loudspeaker use.
2. Predictable noises that designers should account for but may have little control over: Vehicles, trains, aircraft, night clubs (especially those with outdoor amplified music), amphitheaters, dog kennels, firing ranges, heavy munitions testing sites, quarries with blasting, industrial activities (check the zoning of a property and consider zoning’s impact on noise code enforcement), pneu-matic hammering, metal impacts, riveting, noisy motor sports (auto raceways, snowmobiles, boats, dirt bikes, and ATVs), wind turbines, sonic booms, explosives, and fixed sirens.
3. Occasional noises over which designers likely have little control or recourse and which likely needn’t be accounted for in design: Car alarms, motorcycles and cars with intentionally altered mufflers, emergency vehicle sirens, boom cars, power lawn and snow‐removal equip-ment, occasional construction activities (hoe rams, rock drills, pile drivers, pavement break-ers, vacuum excavator trucks, and blasting events), intermittent parties with amplified music, loud outdoor conversations, fireworks, neighborhood dogs barking, and bird/insect noise.
Several methods are used to measure on‐site noise. Noting the method used is almost as impor-tant as noting the sound level reported. For example, an occasional but loud impact might not reveal itself in a long‐term noise level average.
In the frequency domain, noise ordinances and researchers typically measure in A‐weighted deci-bels. Less common, C‐weighted decibel readings are similar to A‐weighted in that they reduce measurements to a single number, but C‐weighting better accounts for the low‐frequency content of transportation and mechanical system noise (dBC is often 10 to 20 decibels higher than dBA). Reductive single‐number metrics like A‐ and C‐weighted sound levels are useful for comparing sites and quantifying annoyance. However, for assessing a particular site for the type of building façade it will require, individual octave band measurements are necessary so that they may later inform an appropriate transmission loss (TL) or outdoor-indoor transmission loss (OITL).
In the time domain, the type of sound (steady or intermittent, constant or impulsive) and the time it arrives (day or night) have given birth to several different measurement types customized to the circumstance.
Lz Equivalent sound level. Average of the steady noise level over a period of time. Correlates well with human reaction to constant or near‐constant noises. This type of measurement was formerly denoted as Leq.
Ldn Day‐night sound level (sometimes written as DNL). Similar to Leq but with a ten‐decibel “penalty” added to any sound arriving at night (10 p.m. to 7 a.m.). A common metric used in noise ordinances, federal agency regulations, and research. Most regulations written after 1995 establish a maximum Ldn of 55 or lower, though some older ones use an Ldn of 65 as the maximum. Europe uses a similar measure, day‐evening‐night sound level (Lden), which, besides the ten‐decibel nighttime penalty, applies a five‐decibel penalty to evening sounds.
L90 The noise level exceeded 90% of the time. Used to assess the background noise level between occasional louder noises (for instance, the sound level between aircraft take‐offs or between firing range events).
L10 The noise level exceeded 10% of the time. Used to assess the level of occasional loud sounds (for instance, the sound level of aircraft take‐off or of firing range events).
NEF Noise Exposure Forecast. Takes into account the sound level, the number of events, the impulsiveness of events, and the tonality of events. Often used to measure aircraft noise.
Lmax The single highest sampled level of sound. Nighttime Lmax levels may be useful for enforcement and design because loud single events can interrupt sleep.
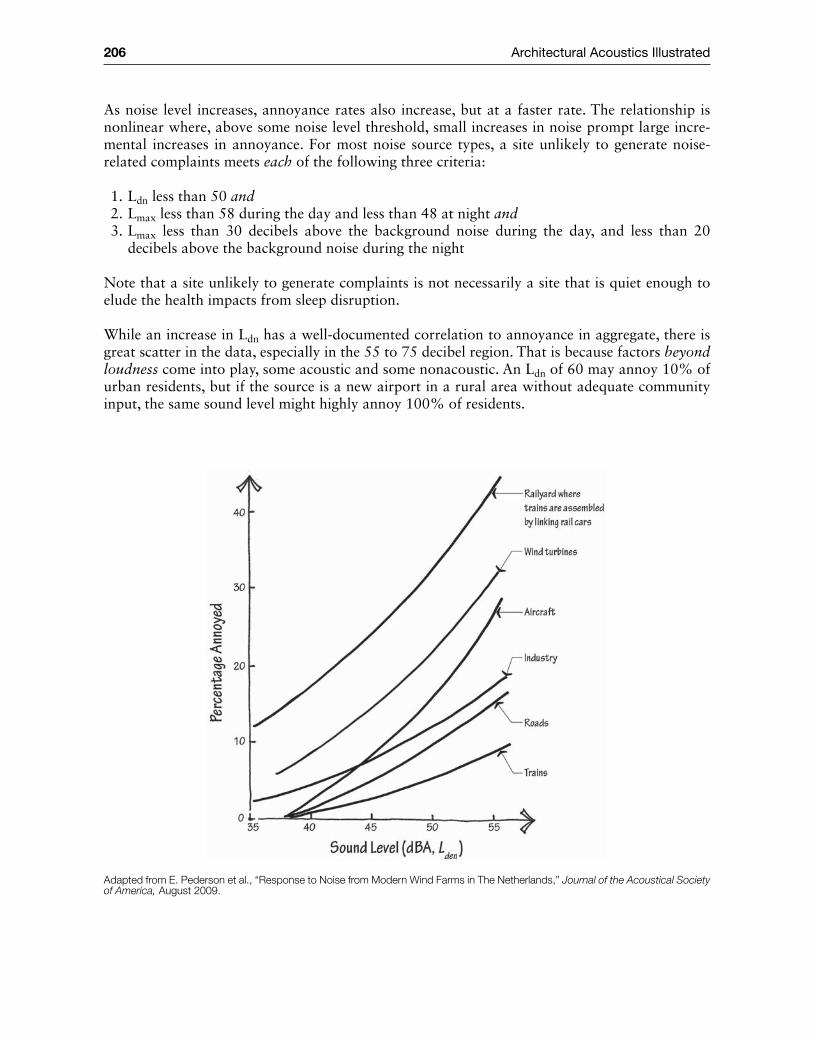
206 Architectural Acoustics Illustrated
As noise level increases, annoyance rates also increase, but at a faster rate. The relationship is nonlinear where, above some noise level threshold, small increases in noise prompt large incre-mental increases in annoyance. For most noise source types, a site unlikely to generate noise‐related complaints meets each of the following three criteria:
1. Ldn less than 50 and 2. Lmax less than 58 during the day and less than 48 at night and 3. Lmax less than 30 decibels above the background noise during the day, and less than 20
decibels above the background noise during the night
Note that a site unlikely to generate complaints is not necessarily a site that is quiet enough to elude the health impacts from sleep disruption.
While an increase in Ldn has a well‐documented correlation to annoyance in aggregate, there is great scatter in the data, especially in the 55 to 75 decibel region. That is because factors beyond loudness come into play, some acoustic and some nonacoustic. An Ldn of 60 may annoy 10% of urban residents, but if the source is a new airport in a rural area without adequate community input, the same sound level might highly annoy 100% of residents.
Adapted from E. Pederson et al., “Response to Noise from Modern Wind Farms in The Netherlands,” Journal of the Acoustical Society of America, August 2009.
Noise Control 207
Acoustic factors related to annoyance (in approximate order of importance)
Loudness Louder noises annoy more.
Impulsiveness Sources with short durations, usually less than one second, annoy more (dog barks, industrial hammering). Footfall also falls into this category.
Fluctuations Changes in time (aircraft take‐off), loudness (wind turbines), and frequency (emergency sirens) annoy more.
Tonality Sources with energy content at one frequency or narrow‐band noise annoy more (truck‐reverse beeper, whining fan with faulty bearing).
Window state Open windows almost eliminate façade attenuation altogether, so noise in nice weather annoys more than noise in cold weather (neighbor’s outdoor party, air‐conditioner condenser unit).
Rattle Low‐frequency noises vibrate walls and windows, and more easily transmit through building envelopes, so they annoy more (boom cars, quarry blasts).
Audibility Sometimes sounds are annoying just because they are audible. (A dripping faucet is more annoying than running water.)
Nonacoustic factors related to annoyance (in approximate order of importance)
Time of occurrence Noises occurring during periods of rest annoy more (night, weekends).
Expectations People occupying zones that they feel are “supposed” to be quiet are more likely to be annoyed (rural areas, hospitals).
Responsiveness When authorities or officials associated with the noise source are not perceived as earnest, empathetic, or competent, more people are annoyed.
New sources Noises not present during move‐in trigger a greater response.
Window state While occupants expect and tolerate more noise when windows are open relative to when they are closed, they may become highly annoyed when loud outdoor noises prevent them from opening their windows.
Attitude toward noise source
Noise sources associated with beneficial or necessary activities (ambulance siren, my livelihood) are less annoying than exploitative or frivolous activities (motorcycle with altered muffler, someone else’s livelihood).
Unwanted content Distracting or superfluous speech or music is more annoying (overheard phone conversation or undesirable music).
Permanence Permanent noise sources (roads) annoy more than temporary noise sources at the same loudness (road construction), especially if there is an expectation that the noise level will increase in the future (airports).
Sensitivity to noise The same noise spectral content and loudness level affects different people in different ways.
Fairness The feeling that “my neighborhood is impacted and others are not” is more likely to engender annoyance.
Fear of danger Sources that pose a danger annoy more (hunting activities, polluting industries).
Predictability Unpredictable noises annoy more (sonic booms).
Community Noise ResearchIn Florida, residents in a neighborhood of manufactured houses complained of a noisy nearby nightclub. Low‐frequency sound energy from loudspeakers easily transmitted through the façade of the nightclub, which consisted of a single layer of thin‐gauge corrugated metal (the warm cli-mate necessitated no insulation or double‐layer assembly). Then, the low‐frequency noise easily passed through the mobile home walls (highway weight limits necessitate low‐mass construction of the houses). Interviews with the residents revealed a particular annoyance with wall‐hung pic-tures in their homes that vibrated late at night.
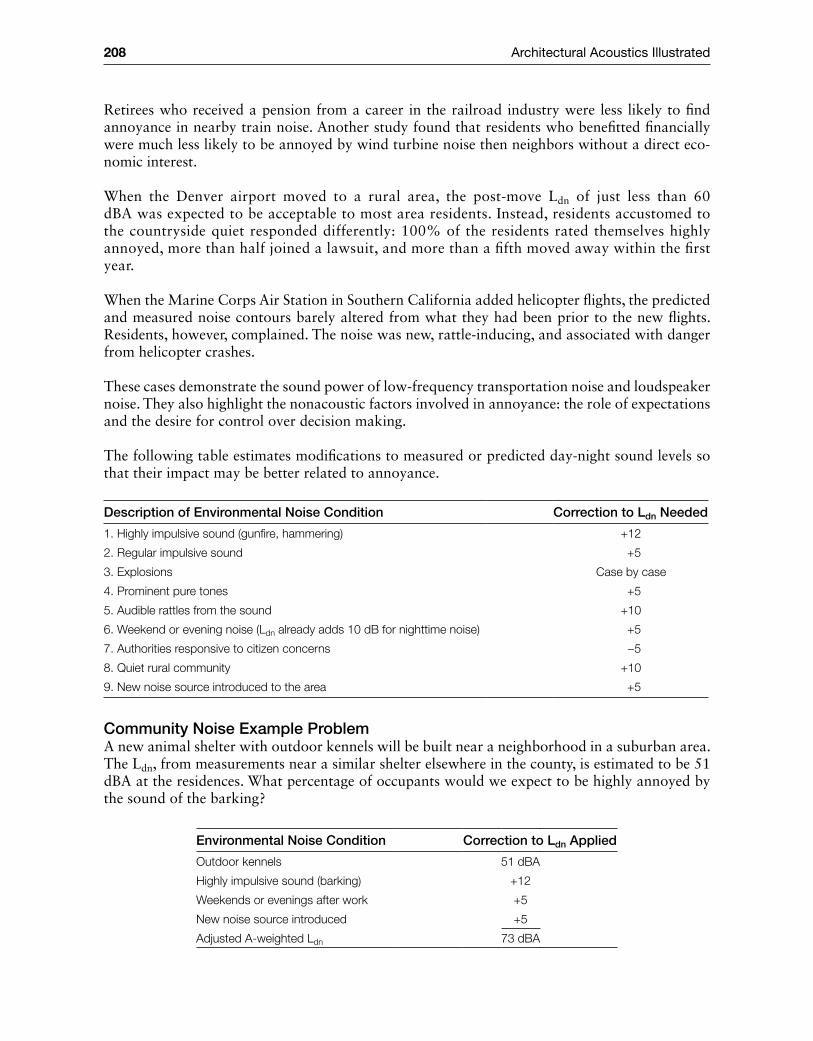
208 Architectural Acoustics Illustrated
Retirees who received a pension from a career in the railroad industry were less likely to find annoyance in nearby train noise. Another study found that residents who benefitted financially were much less likely to be annoyed by wind turbine noise then neighbors without a direct eco-nomic interest.
When the Denver airport moved to a rural area, the post‐move Ldn of just less than 60 dBA was expected to be acceptable to most area residents. Instead, residents accustomed to the countryside quiet responded differently: 100% of the residents rated themselves highly annoyed, more than half joined a lawsuit, and more than a fifth moved away within the first year.
When the Marine Corps Air Station in Southern California added helicopter flights, the predicted and measured noise contours barely altered from what they had been prior to the new flights. Residents, however, complained. The noise was new, rattle‐inducing, and associated with danger from helicopter crashes.
These cases demonstrate the sound power of low‐frequency transportation noise and loudspeaker noise. They also highlight the nonacoustic factors involved in annoyance: the role of expectations and the desire for control over decision making.
The following table estimates modifications to measured or predicted day‐night sound levels so that their impact may be better related to annoyance.
Description of Environmental Noise Condition Correction to Ldn Needed
1. Highly impulsive sound (gunfire, hammering) +12
2. Regular impulsive sound +5
3. Explosions Case by case
4. Prominent pure tones +5
5. Audible rattles from the sound +10
6. Weekend or evening noise (Ldn already adds 10 dB for nighttime noise) +5
7. Authorities responsive to citizen concerns −5
8. Quiet rural community +10
9. New noise source introduced to the area +5
Community Noise Example ProblemA new animal shelter with outdoor kennels will be built near a neighborhood in a suburban area. The Ldn, from measurements near a similar shelter elsewhere in the county, is estimated to be 51 dBA at the residences. What percentage of occupants would we expect to be highly annoyed by the sound of the barking?
Environmental Noise Condition Correction to Ldn Applied
Outdoor kennels 51 dBA
Highly impulsive sound (barking) +12
Weekends or evenings after work +5
New noise source introduced +5
Adjusted A‐weighted Ldn 73 dBA
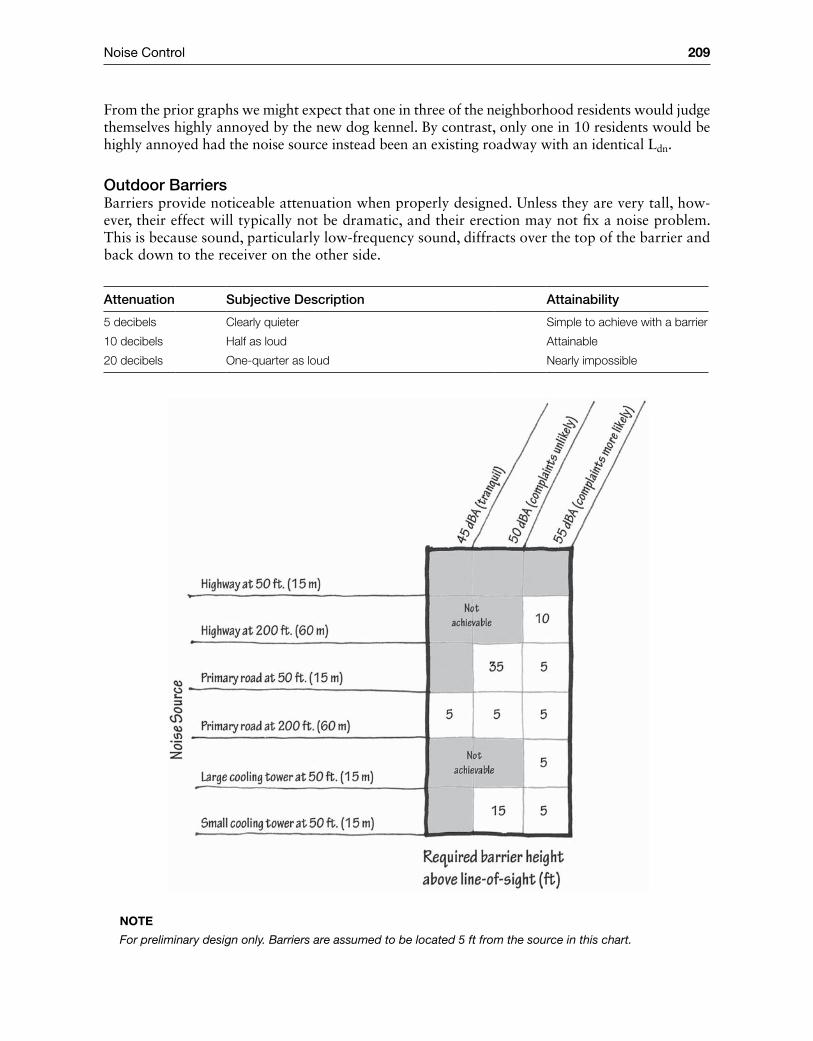
Noise Control 209
From the prior graphs we might expect that one in three of the neighborhood residents would judge themselves highly annoyed by the new dog kennel. By contrast, only one in 10 residents would be highly annoyed had the noise source instead been an existing roadway with an identical Ldn.
Outdoor BarriersBarriers provide noticeable attenuation when properly designed. Unless they are very tall, how-ever, their effect will typically not be dramatic, and their erection may not fix a noise problem. This is because sound, particularly low‐frequency sound, diffracts over the top of the barrier and back down to the receiver on the other side.
Attenuation Subjective Description Attainability
5 decibels Clearly quieter Simple to achieve with a barrier
10 decibels Half as loud Attainable
20 decibels One‐quarter as loud Nearly impossible
Note
For preliminary design only. Barriers are assumed to be located 5 ft from the source in this chart.
210 Architectural Acoustics Illustrated
Outdoor Barriers Checklist 1. Locate barriers either as close as reasonable to the source or as close as reasonable to the
receiver. This will help to ensure that the receiver is well within the barrier’s shadow zone. 2. Design barriers so that, at a minimum, they break the line of sight between the source and the
receiver. Higher is better. 3. Extend barriers to a length, in each direction, at least four times the distance between the
receiver and the barrier. 4. Avoid breaks in barriers for driveways or street intersections that compromise the wall’s
effectiveness. 5. Account for flanking sound, reflecting off surfaces and bouncing into the acoustical shadow
zone. These reflections may arrive from tree branches on a berm barrier, a sound‐reflective barrier on the opposite side of the road, or a tall building’s balcony or roof overhang on either side of the road.
6. In instances where reflected sound may build up between two barriers, one on each side of a road, cant the barriers so they are nonparallel, or use a weather‐resistant sound‐ absorptive finish. This may be made of glass fiber encased in thin plastic, rock wool, or special air‐entrained sound‐absorbing concrete. With barriers in place on each side of the road, absorp-tion may increase the double‐barrier’s effectiveness by 10 decibels because sound reflections are not allowed to build up between the walls. For a one‐side‐only barrier, with no reflective surface opposite it, a sound‐absorptive finish will not be necessary.
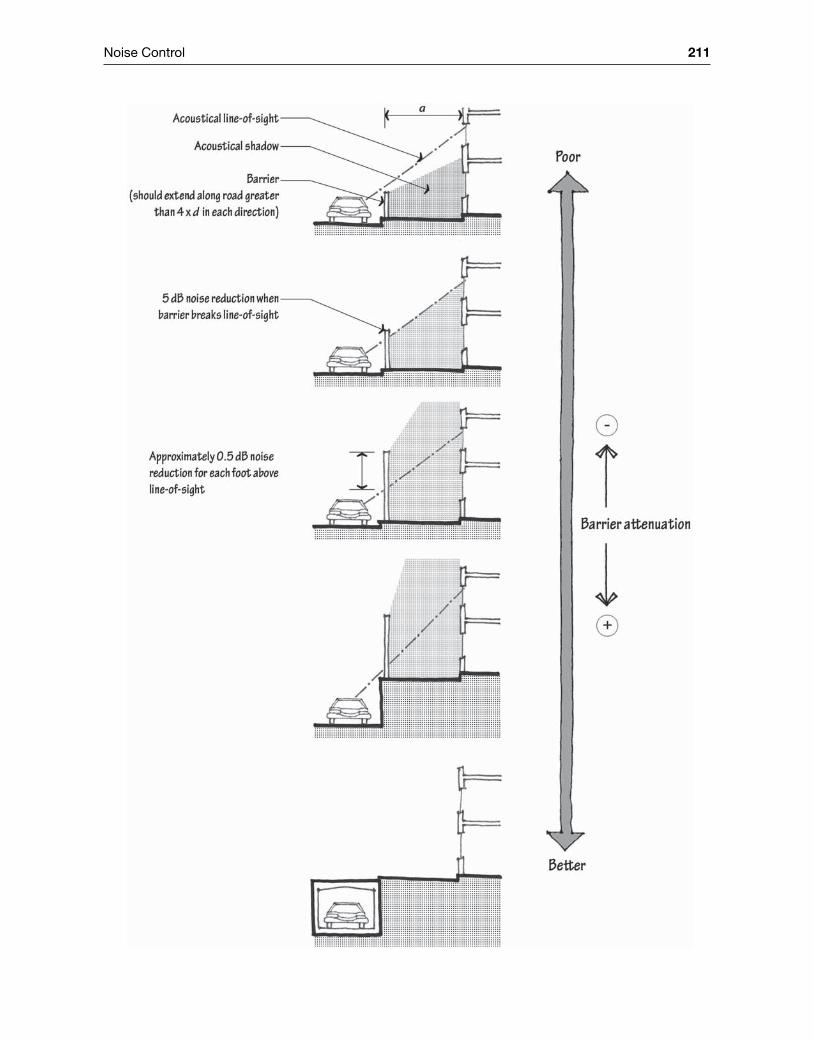
Noise Control 211

212 Architectural Acoustics Illustrated
Attenuation from the insertion of a barrier in decibels:
AHR
fattenuation frequency= + −10 10 172
log log
Where H is the height of the barrier above the line of sight, and R is either (1) the distance between the source and the barrier, or (2) the distance between the receiver and the barrier, which-ever is shorter.
Outdoor Barrier Example ProblemA homeowner builds an outdoor patio in his backyard, which sits on a hill above a busy second-ary road. He builds a one‐story wall to attenuate some road noise for those seated at a table adja-cent to the wall. How much sound reduction, quantitatively and qualitatively, could he expect to gain from his patio wall? See the following drawing for the source‐path‐receiver configuration.
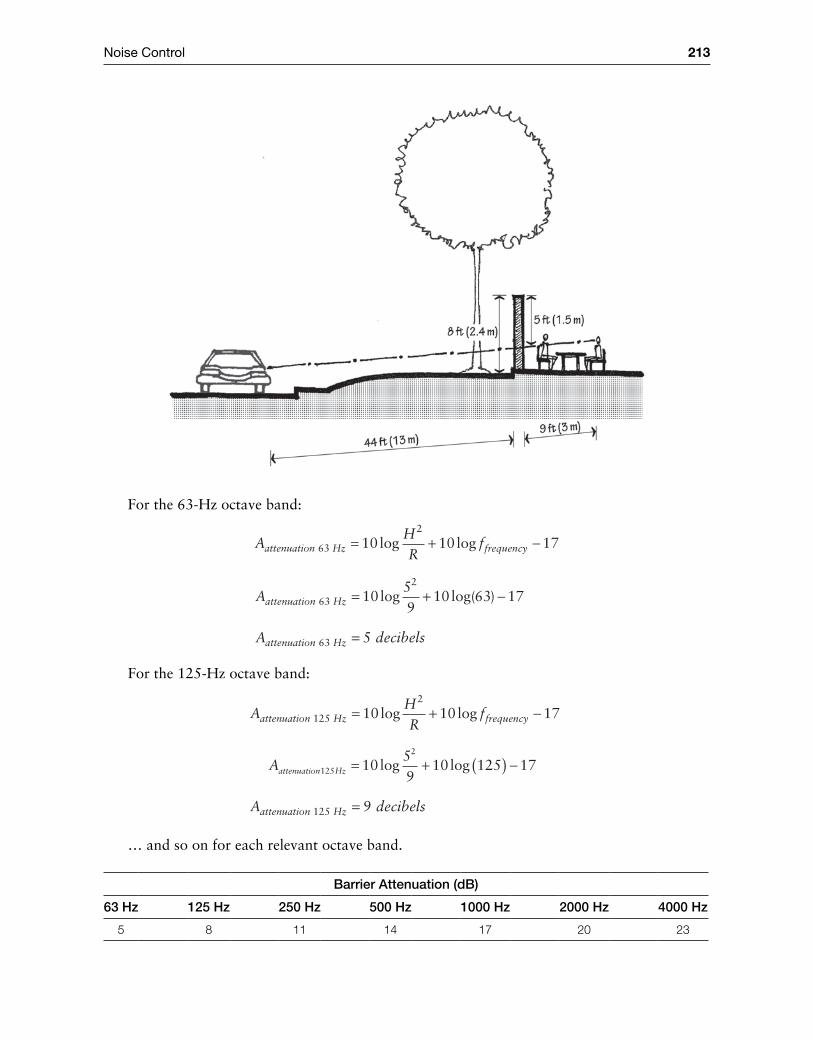
Noise Control 213
For the 63‐Hz octave band:
AHR
fattenuation Hz frequency63
2
10 10 17= + −log log
Aattenuation Hz63
2
1059
10 63 17= + −log log( )
A decibelsattenuation Hz63 5=
For the 125‐Hz octave band:
AHR
fattenuation Hz frequency125
2
10 10 17= + −log log
Aattenuation Hz125
2
1059
10 125 17= + ( ) −log log
A decibelsattenuation Hz125 9=
… and so on for each relevant octave band.
Barrier Attenuation (dB)
63 Hz 125 Hz 250 Hz 500 Hz 1000 Hz 2000 Hz 4000 Hz
5 8 11 14 17 20 23
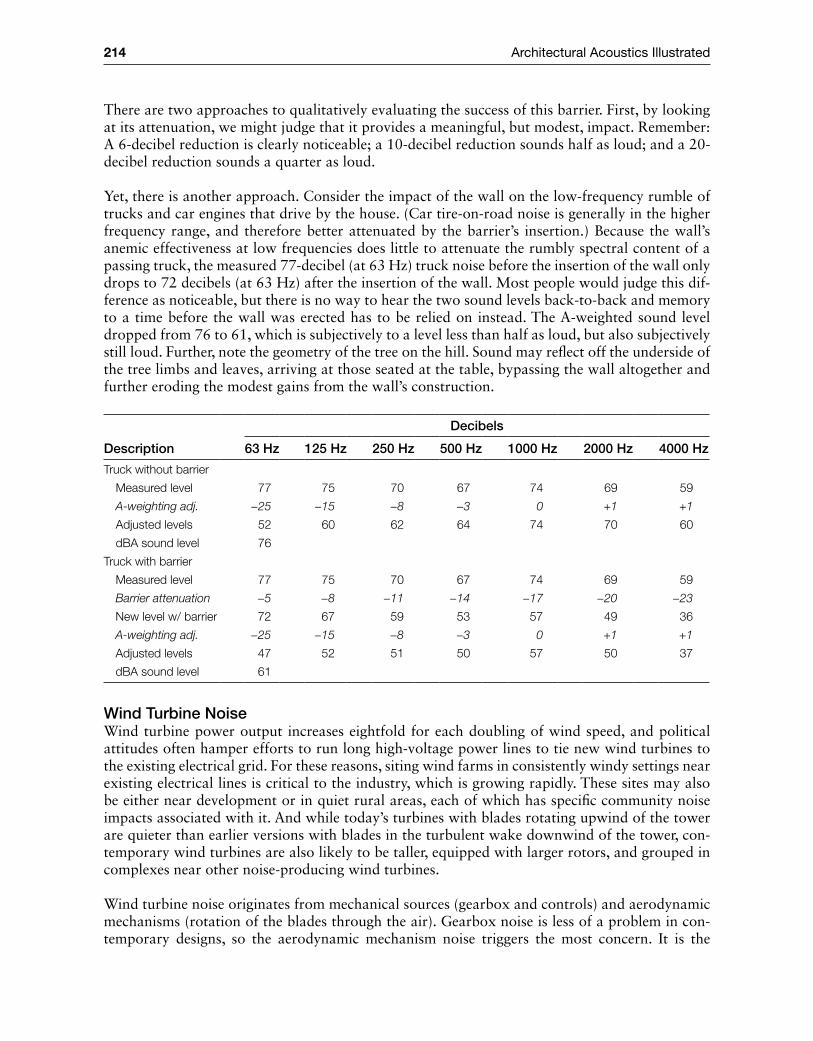
214 Architectural Acoustics Illustrated
There are two approaches to qualitatively evaluating the success of this barrier. First, by looking at its attenuation, we might judge that it provides a meaningful, but modest, impact. Remember: A 6‐decibel reduction is clearly noticeable; a 10‐decibel reduction sounds half as loud; and a 20‐decibel reduction sounds a quarter as loud.
Yet, there is another approach. Consider the impact of the wall on the low‐frequency rumble of trucks and car engines that drive by the house. (Car tire‐on‐road noise is generally in the higher frequency range, and therefore better attenuated by the barrier’s insertion.) Because the wall’s anemic effectiveness at low frequencies does little to attenuate the rumbly spectral content of a passing truck, the measured 77‐decibel (at 63 Hz) truck noise before the insertion of the wall only drops to 72 decibels (at 63 Hz) after the insertion of the wall. Most people would judge this dif-ference as noticeable, but there is no way to hear the two sound levels back‐to‐back and memory to a time before the wall was erected has to be relied on instead. The A‐weighted sound level dropped from 76 to 61, which is subjectively to a level less than half as loud, but also subjectively still loud. Further, note the geometry of the tree on the hill. Sound may reflect off the underside of the tree limbs and leaves, arriving at those seated at the table, bypassing the wall altogether and further eroding the modest gains from the wall’s construction.
Description
Decibels
63 Hz 125 Hz 250 Hz 500 Hz 1000 Hz 2000 Hz 4000 Hz
Truck without barrier
Measured level 77 75 70 67 74 69 59
A‐weighting adj. −25 −15 −8 −3 0 +1 +1
Adjusted levels 52 60 62 64 74 70 60
dBA sound level 76
Truck with barrier
Measured level 77 75 70 67 74 69 59
Barrier attenuation −5 −8 −11 −14 −17 −20 −23
New level w/ barrier 72 67 59 53 57 49 36
A‐weighting adj. −25 −15 −8 −3 0 +1 +1
Adjusted levels 47 52 51 50 57 50 37
dBA sound level 61
Wind Turbine NoiseWind turbine power output increases eightfold for each doubling of wind speed, and political attitudes often hamper efforts to run long high‐voltage power lines to tie new wind turbines to the existing electrical grid. For these reasons, siting wind farms in consistently windy settings near existing electrical lines is critical to the industry, which is growing rapidly. These sites may also be either near development or in quiet rural areas, each of which has specific community noise impacts associated with it. And while today’s turbines with blades rotating upwind of the tower are quieter than earlier versions with blades in the turbulent wake downwind of the tower, con-temporary wind turbines are also likely to be taller, equipped with larger rotors, and grouped in complexes near other noise‐producing wind turbines.
Wind turbine noise originates from mechanical sources (gearbox and controls) and aerodynamic mechanisms (rotation of the blades through the air). Gearbox noise is less of a problem in con-temporary designs, so the aerodynamic mechanism noise triggers the most concern. It is the
Noise Control 215
reason maximum rotor tip speeds are constrained. The rotation produces a periodic swishing sound in the 500‐Hz to 2,000‐Hz octave bands, repeated about once per second. Turbines aren’t typically as loud as other sources of industrial or transportation noise at a similar distance, but it is the unusual quality of this repeated amplitude modulation that makes wind turbine noise more annoying than other types at the same sound level. Very quiet rural communities without the masking of nighttime traffic noise are particularly affected.
The second major concern centers on the frequency content of the noise. Wind turbines produce significantly more sound energy in the low frequencies than in the middle and high frequencies. Such noises are less likely to be mitigated by lightweight building envelopes, and more likely to cause sleep disruption. Because windows resonate at 180 Hz to 300 Hz, the same frequency range as generated by wind turbines, the transmission loss through the glazed building skin may be very low. And nighttime temperature inversions may bend sound downward toward the ground, canceling the normal spreading sound level loss at some distant locations.
There are reports of wind turbine infrasound (sound below the human threshold of 20 Hz). Human sensitivity to infrasound peaks near 4 Hz, and wind turbine amplitude modulation sits at about 1 Hz. A review of the literature suggests that it’s not clear that infrasound is present near wind turbines, perhaps because the machines don’t produce infrasound or perhaps because infrasound is difficult to measure. The possible presence of infrasound may trigger the reports of headaches, disequilibrium, nausea, vertigo, anxiety, and panic attacks in the presence of wind turbine noise. Researchers are attempting to sort out whether these reports are anecdotal, or trou-bling trends on a dose‐response curve that hasn’t yet been discovered.
Minimum distances between wind turbines and occupied buildings not affiliated with the opera-tion of the plant are site‐specific. They depend on (a) the number of turbines, (b) the size and height of the turbines, (c) the wind speeds, (d) the presence of temperature inversions, and other atmospheric conditions on site, (e) the line‐of‐sight configuration between rotors and buildings, (f) the sound power level generated by the specific turbines operating, and (g) the other back-ground noise present at the site. Generally, care should be taken when locating buildings and turbines within one mile of one another, or where the sound level at the receiver location exceeds 40 dBA; caution and special study are in order when the turbines are less than 1
2‐mile away.
Community Noise Checklist
Site 1. Recognize that on some sites it is too noisy to build some types of program, even if it is per-
missible under noise zoning. 2. Consider occupant expectations. Rural residents are likely to have a lower threshold for com-
munity noise than downtown residents. Of course, at some sound levels, there is too much noise, regardless of expectations.
3. Know that noise ordinances and noise zoning policies are blunt instruments. Some are effec-tive, objective, or common‐sense oriented, but few are all three; and they may change for a given neighborhood during the life of the building.
4. When possible, don’t locate housing within 1,500 feet of a train track or highway. 5. Beware of sites with statistically “acceptable” noise levels, but periodic loud noises, separated
by intervals of quiet. Intermittent noises are more annoying than continuous ones, so if a loud noise source arrives regularly, it is often the maximum level that governs occupant satisfaction. Sites with regular spikes in noise levels, such as those near airports, train lines, firing ranges, and
216 Architectural Acoustics Illustrated
quarries, can have relatively low average noise levels that aren’t representative of the true subjec-tive response to the site noise. An effective approach involves analyzing both average and maxi-mum noise levels.
6. Know that what is now a quiet site might not remain a quiet site at some later time. While it is difficult to predict the path of a future expressway or the site of a future industrial plant, ask around. There may be, for instance, plans to build a motor speedway nearby.
7. Check zoning ordinances. Areas that are primarily residential may not be listed as residential noise zones; areas that were once residential may be rezoned to encourage industrial develop-ment or thoroughfare construction.
8. Use site features such as hills or slopes, earth berms, thin‐wall barriers, and nearby buildings to reduce intruding environmental noise by interrupting the direct sound path. Thin plantings of trees and vegetation, less than 100 ft. deep, are normally not effective as noise control barriers.
9. Lay “quiet asphalt,” a special open‐pore or rubberized surface, to reduce tire‐pavement noise on high‐speed roadways by 5 to 10 dBA. The acoustical benefit is equivalent to a roadway wall barrier—or a 70% decrease in traffic volume.
Design 1. Position outbuildings, such as grounds equipment storage buildings, parking garages, and
maintenance facilities, so that they are buffers to noise. Arrange them so they block the direct line of sight from windows to the noise source. Parks and parking lots can be positioned to increase the distance between a noise source and a residence.
2. Orient quiet spaces, such as bedrooms, so their wall exposure is on a building face away from the noise source. Noisier spaces, such as kitchens, bathrooms, and utility spaces can be used as buffers on the noisy face of the building.
3. Locate exterior doors on the quieter side of a building. Specify outside doors with gaskets and drop seals. Avoid the use of mail slots, pet doors, or similar openings.
4. Thick windowpanes outperform thin ones; double‐pane windows typically outperform single‐pane windows; windows with larger spacing between panes outperform those with smaller spacing. For these reasons, interior and exterior storm windows are effective. Of course, any increased performance evaporates when the occupant opens the window.
5. Use gravel ballast, green roofs, or building‐in‐building design where impact noise from rain is a concern, as might be the case for a recording studio. Airborne noise transfer through roofs is typically not a concern unless the noise source is located overhead or is especially loud.
6. Keep noisy exterior building equipment, such as fans, air‐conditioning compressor units, cool-ing towers, pumps, generators, electrical transformers, and dumpsters (whose lids slam shut) out of direct line of sight from—and far from—windows. Institute a “buy quiet” program for outdoor mechanical equipment and lawn‐care equipment. Noise from air‐cooled outdoor condenser units in split‐system air conditioning systems is a particularly common problem.
7. Design outdoor mechanical systems so that they are far from neighbors’ bedroom windows and outdoor gathering spaces. Normative condenser units often don’t meet noise ordinance requirements, enforcement of which is typically measured at the boundary of the two lots.
8. Consider construction activity noise, especially for large projects that require long build times and urban projects that require nighttime construction (for traffic congestion reasons). Schedule work during less sensitive time periods, position a noise compliance technician on‐site, use quieter equipment, install manually adjustable, ambient‐sensitive, or broadband truck backup alarms.
9. Low‐energy mechanical systems can be low‐noise systems. Often efficient equipment is also quieter. Passive thermal design can reduce the size of (or need for) outdoor mechanical equipment. Ground‐source‐coupled “geo‐thermal” heat pumps have no noisy outdoor equip-ment, though they may pose an indoor noise threat if located near occupied spaces.
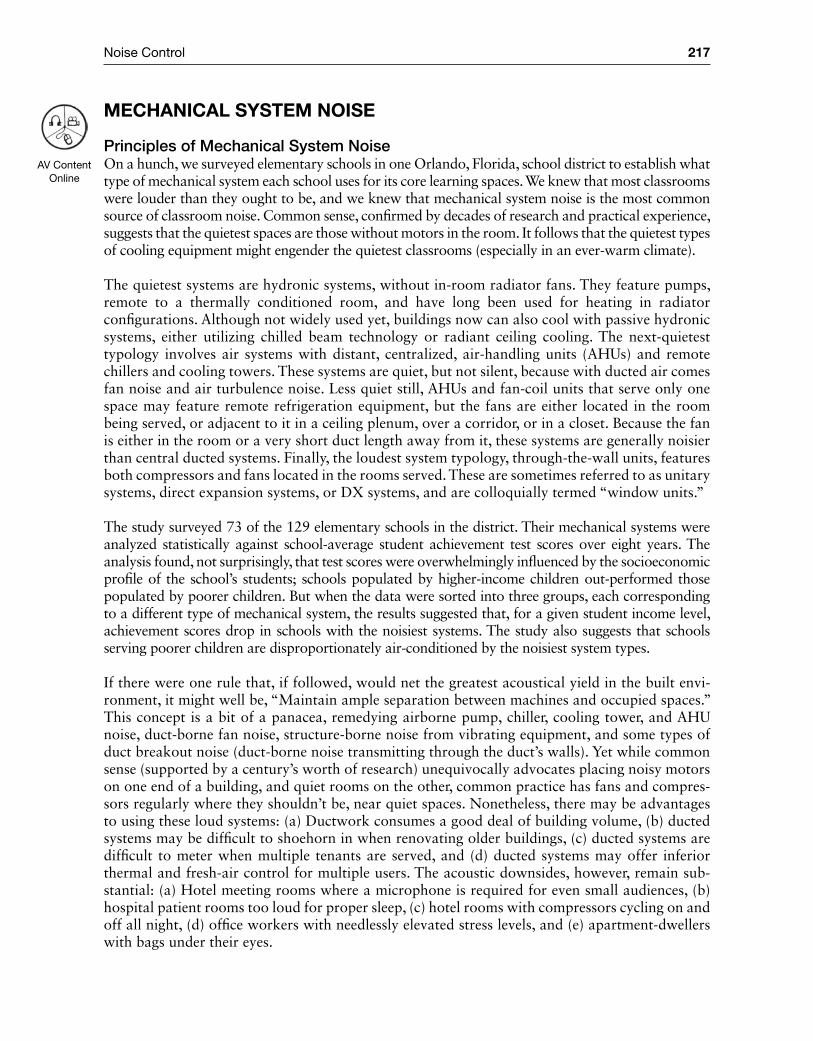
Noise Control 217
MeChaNiCal systeM Noise
Principles of Mechanical System NoiseOn a hunch, we surveyed elementary schools in one Orlando, Florida, school district to establish what type of mechanical system each school uses for its core learning spaces. We knew that most classrooms were louder than they ought to be, and we knew that mechanical system noise is the most common source of classroom noise. Common sense, confirmed by decades of research and practical experience, suggests that the quietest spaces are those without motors in the room. It follows that the quietest types of cooling equipment might engender the quietest classrooms (especially in an ever‐warm climate).
The quietest systems are hydronic systems, without in‐room radiator fans. They feature pumps, remote to a thermally conditioned room, and have long been used for heating in radiator configurations. Although not widely used yet, buildings now can also cool with passive hydronic systems, either utilizing chilled beam technology or radiant ceiling cooling. The next‐quietest typology involves air systems with distant, centralized, air‐handling units (AHUs) and remote chillers and cooling towers. These systems are quiet, but not silent, because with ducted air comes fan noise and air turbulence noise. Less quiet still, AHUs and fan‐coil units that serve only one space may feature remote refrigeration equipment, but the fans are either located in the room being served, or adjacent to it in a ceiling plenum, over a corridor, or in a closet. Because the fan is either in the room or a very short duct length away from it, these systems are generally noisier than central ducted systems. Finally, the loudest system typology, through‐the‐wall units, features both compressors and fans located in the rooms served. These are sometimes referred to as unitary systems, direct expansion systems, or DX systems, and are colloquially termed “window units.”
The study surveyed 73 of the 129 elementary schools in the district. Their mechanical systems were analyzed statistically against school‐average student achievement test scores over eight years. The analysis found, not surprisingly, that test scores were overwhelmingly influenced by the socioeconomic profile of the school’s students; schools populated by higher‐income children out‐performed those populated by poorer children. But when the data were sorted into three groups, each corresponding to a different type of mechanical system, the results suggested that, for a given student income level, achievement scores drop in schools with the noisiest systems. The study also suggests that schools serving poorer children are disproportionately air‐conditioned by the noisiest system types.
If there were one rule that, if followed, would net the greatest acoustical yield in the built envi-ronment, it might well be, “Maintain ample separation between machines and occupied spaces.” This concept is a bit of a panacea, remedying airborne pump, chiller, cooling tower, and AHU noise, duct‐borne fan noise, structure‐borne noise from vibrating equipment, and some types of duct breakout noise (duct‐borne noise transmitting through the duct’s walls). Yet while common sense (supported by a century’s worth of research) unequivocally advocates placing noisy motors on one end of a building, and quiet rooms on the other, common practice has fans and compres-sors regularly where they shouldn’t be, near quiet spaces. Nonetheless, there may be advantages to using these loud systems: (a) Ductwork consumes a good deal of building volume, (b) ducted systems may be difficult to shoehorn in when renovating older buildings, (c) ducted systems are difficult to meter when multiple tenants are served, and (d) ducted systems may offer inferior thermal and fresh‐air control for multiple users. The acoustic downsides, however, remain sub-stantial: (a) Hotel meeting rooms where a microphone is required for even small audiences, (b) hospital patient rooms too loud for proper sleep, (c) hotel rooms with compressors cycling on and off all night, (d) office workers with needlessly elevated stress levels, and (e) apartment‐dwellers with bags under their eyes.
AV Content Online
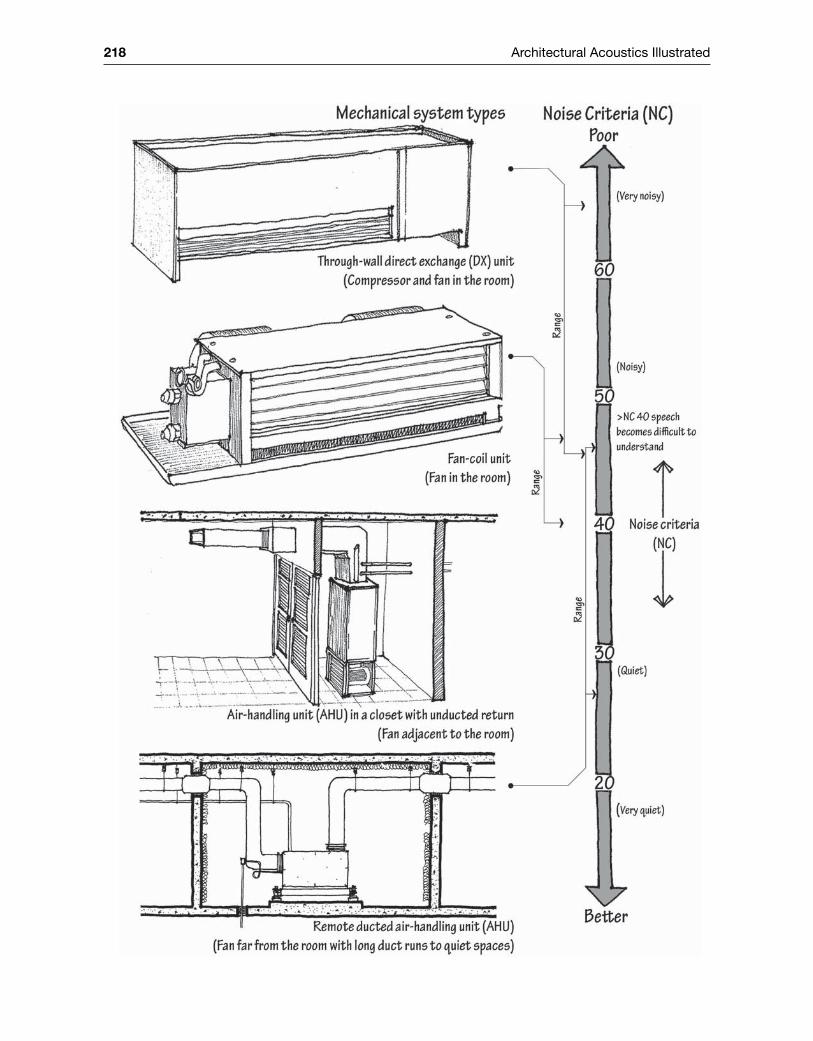
218 Architectural Acoustics Illustrated
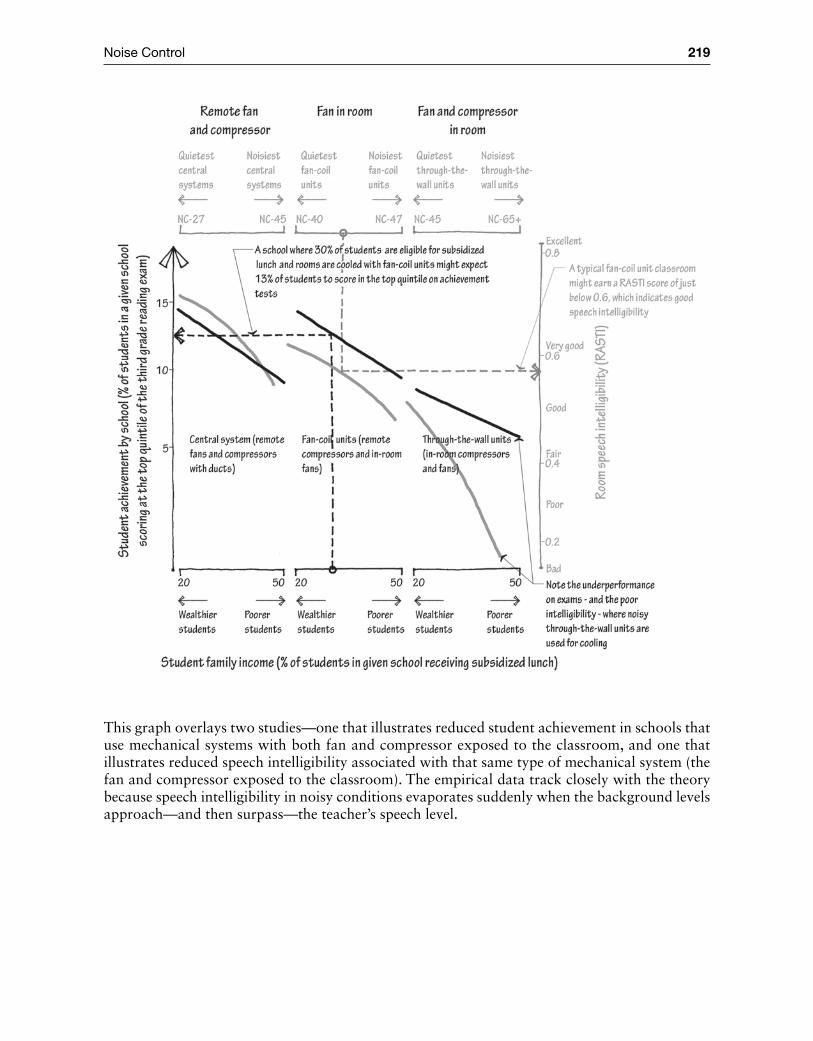
Noise Control 219
This graph overlays two studies—one that illustrates reduced student achievement in schools that use mechanical systems with both fan and compressor exposed to the classroom, and one that illustrates reduced speech intelligibility associated with that same type of mechanical system (the fan and compressor exposed to the classroom). The empirical data track closely with the theory because speech intelligibility in noisy conditions evaporates suddenly when the background levels approach—and then surpass—the teacher’s speech level.
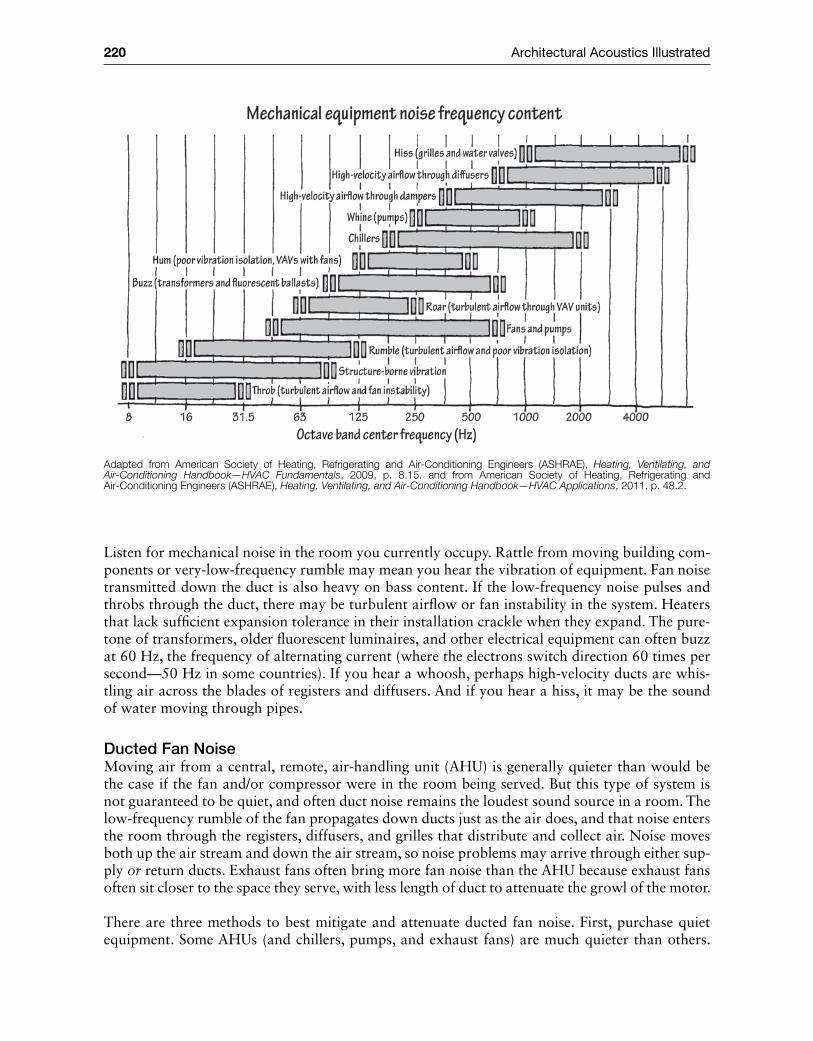
220 Architectural Acoustics Illustrated
Adapted from American Society of Heating, Refrigerating and Air‐Conditioning Engineers (ASHRAE), Heating, Ventilating, and Air‐Conditioning Handbook—HVAC Fundamentals, 2009, p. 8.15. and from American Society of Heating, Refrigerating and Air‐Conditioning Engineers (ASHRAE), Heating, Ventilating, and Air‐Conditioning Handbook—HVAC Applications, 2011, p. 48.2.
Listen for mechanical noise in the room you currently occupy. Rattle from moving building com-ponents or very‐low‐frequency rumble may mean you hear the vibration of equipment. Fan noise transmitted down the duct is also heavy on bass content. If the low‐frequency noise pulses and throbs through the duct, there may be turbulent airflow or fan instability in the system. Heaters that lack sufficient expansion tolerance in their installation crackle when they expand. The pure‐tone of transformers, older fluorescent luminaires, and other electrical equipment can often buzz at 60 Hz, the frequency of alternating current (where the electrons switch direction 60 times per second—50 Hz in some countries). If you hear a whoosh, perhaps high‐velocity ducts are whis-tling air across the blades of registers and diffusers. And if you hear a hiss, it may be the sound of water moving through pipes.
Ducted Fan NoiseMoving air from a central, remote, air‐handling unit (AHU) is generally quieter than would be the case if the fan and/or compressor were in the room being served. But this type of system is not guaranteed to be quiet, and often duct noise remains the loudest sound source in a room. The low‐frequency rumble of the fan propagates down ducts just as the air does, and that noise enters the room through the registers, diffusers, and grilles that distribute and collect air. Noise moves both up the air stream and down the air stream, so noise problems may arrive through either sup-ply or return ducts. Exhaust fans often bring more fan noise than the AHU because exhaust fans often sit closer to the space they serve, with less length of duct to attenuate the growl of the motor.
There are three methods to best mitigate and attenuate ducted fan noise. First, purchase quiet equipment. Some AHUs (and chillers, pumps, and exhaust fans) are much quieter than others.
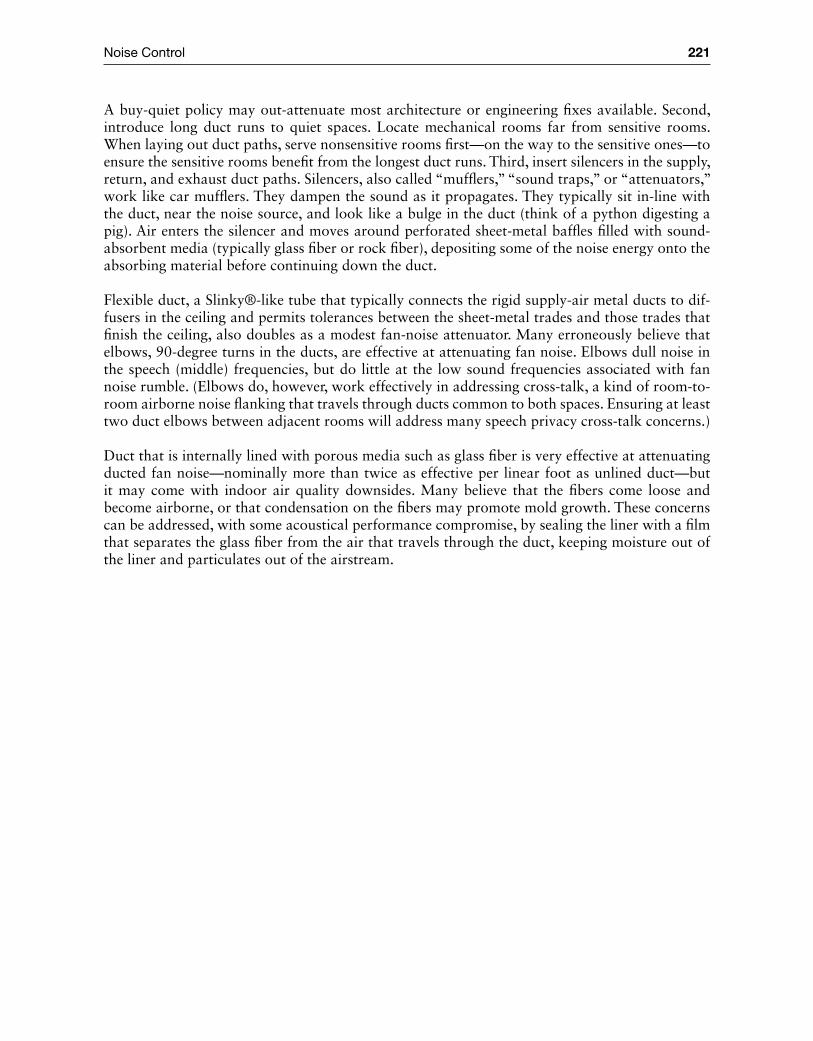
Noise Control 221
A buy‐quiet policy may out‐attenuate most architecture or engineering fixes available. Second, introduce long duct runs to quiet spaces. Locate mechanical rooms far from sensitive rooms. When laying out duct paths, serve nonsensitive rooms first—on the way to the sensitive ones—to ensure the sensitive rooms benefit from the longest duct runs. Third, insert silencers in the supply, return, and exhaust duct paths. Silencers, also called “mufflers,” “sound traps,” or “attenuators,” work like car mufflers. They dampen the sound as it propagates. They typically sit in‐line with the duct, near the noise source, and look like a bulge in the duct (think of a python digesting a pig). Air enters the silencer and moves around perforated sheet‐metal baffles filled with sound‐absorbent media (typically glass fiber or rock fiber), depositing some of the noise energy onto the absorbing material before continuing down the duct.
Flexible duct, a Slinky®‐like tube that typically connects the rigid supply‐air metal ducts to dif-fusers in the ceiling and permits tolerances between the sheet‐metal trades and those trades that finish the ceiling, also doubles as a modest fan‐noise attenuator. Many erroneously believe that elbows, 90‐degree turns in the ducts, are effective at attenuating fan noise. Elbows dull noise in the speech (middle) frequencies, but do little at the low sound frequencies associated with fan noise rumble. (Elbows do, however, work effectively in addressing cross‐talk, a kind of room‐to‐room airborne noise flanking that travels through ducts common to both spaces. Ensuring at least two duct elbows between adjacent rooms will address many speech privacy cross‐talk concerns.)
Duct that is internally lined with porous media such as glass fiber is very effective at attenuating ducted fan noise—nominally more than twice as effective per linear foot as unlined duct—but it may come with indoor air quality downsides. Many believe that the fibers come loose and become airborne, or that condensation on the fibers may promote mold growth. These concerns can be addressed, with some acoustical performance compromise, by sealing the liner with a film that separates the glass fiber from the air that travels through the duct, keeping moisture out of the liner and particulates out of the airstream.
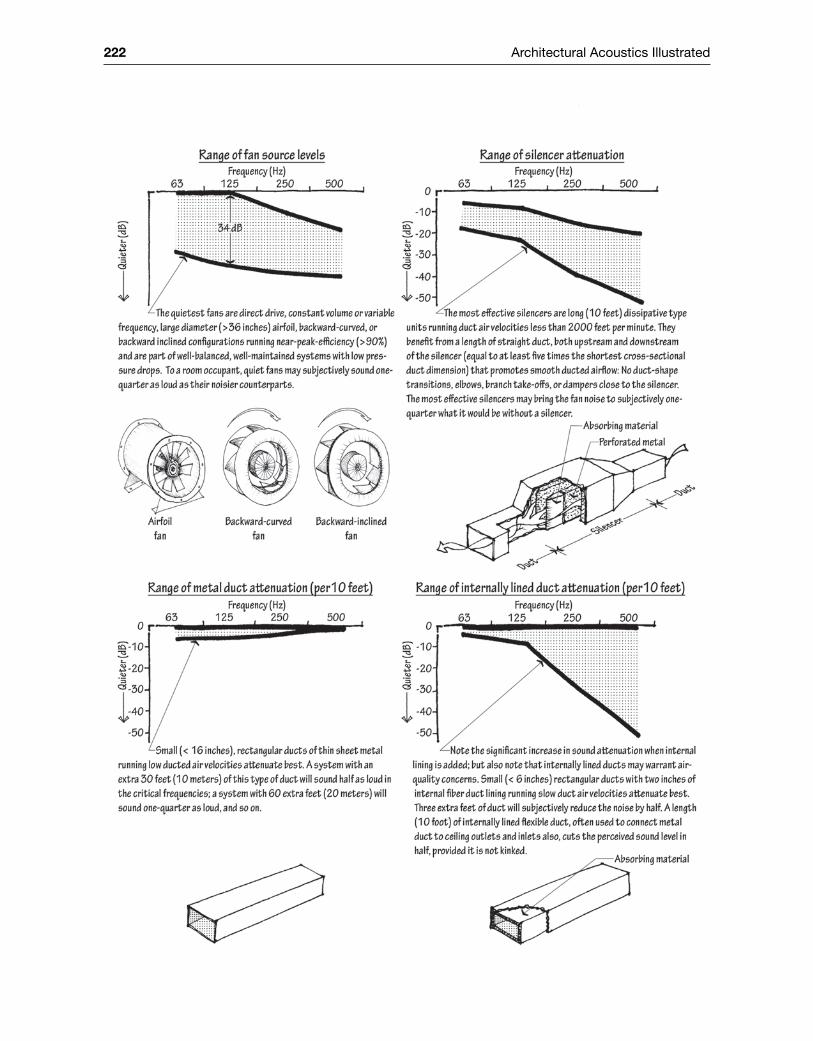
222 Architectural Acoustics Illustrated

Noise Control 223
Because duct length and the use (or absence) of silencers often control a room’s sound level for a given fan serving it, the following graphic may be used for initial design purposes. Follow the graph: Clearly, both long silencers and long duct lengths are required for quiet rooms. Some fans are much quieter than others, an important factor not accounted for by this rule of thumb.
Note
This graph serves initial design purposes only and is not appropriate for final estimations. It assumes that the 125‐Hz octave band and supply air duct will control the NC level. It also assumes a 91‐dB source level at 125 Hz, a duct diameter between 16 and 45 inches, a 225‐square‐foot coverage area per air diffuser, a 2‐CFM supply air per square foot of floor area rate in an internal‐load‐dominated building, a distance between room air diffuser and occupant ear of 4 feet, a room area of 300 square feet, and a safety factor of 5 dB. While each of these by itself is a reasonable (and reasonably conservative) assumption, one may expect that another configuration will differ meaningfully from this rule‐of‐thumb estimate. Actual published, calculated, or measured supply and return sound power noise spectra, specific to a building, complemented with an HVAC system configuration, also specific to a building, are always preferable to these kind of assumptions.
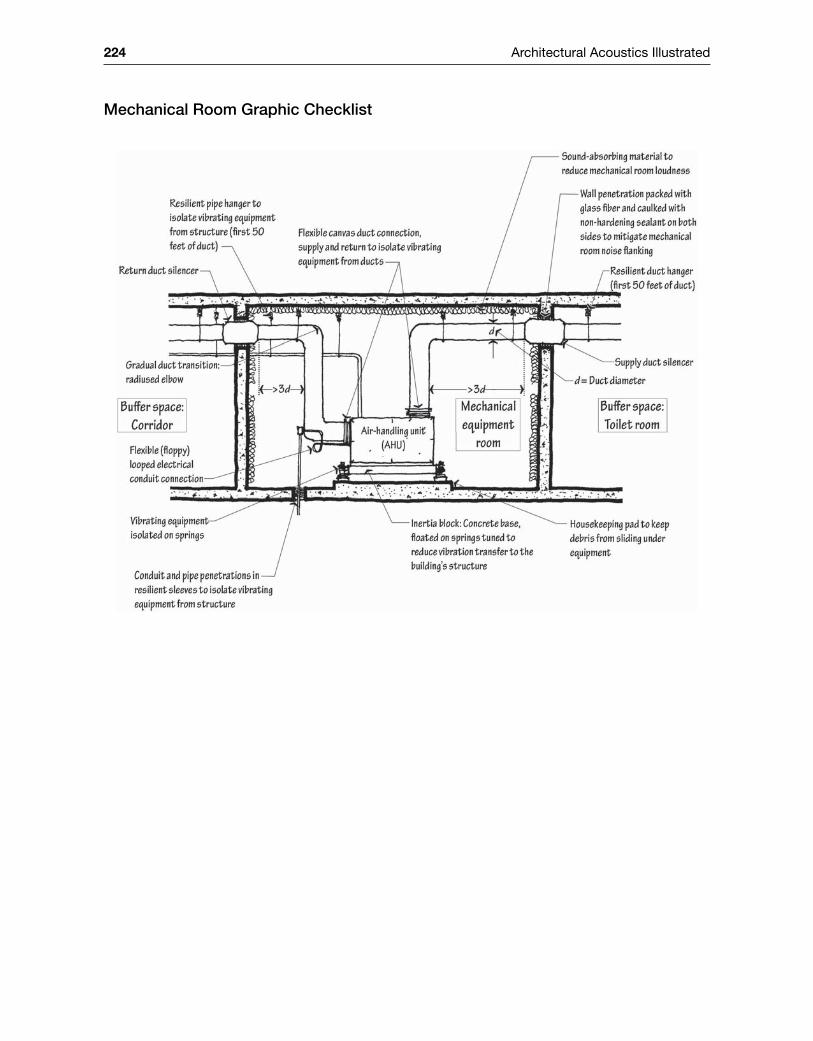
224 Architectural Acoustics Illustrated
Mechanical Room Graphic Checklist
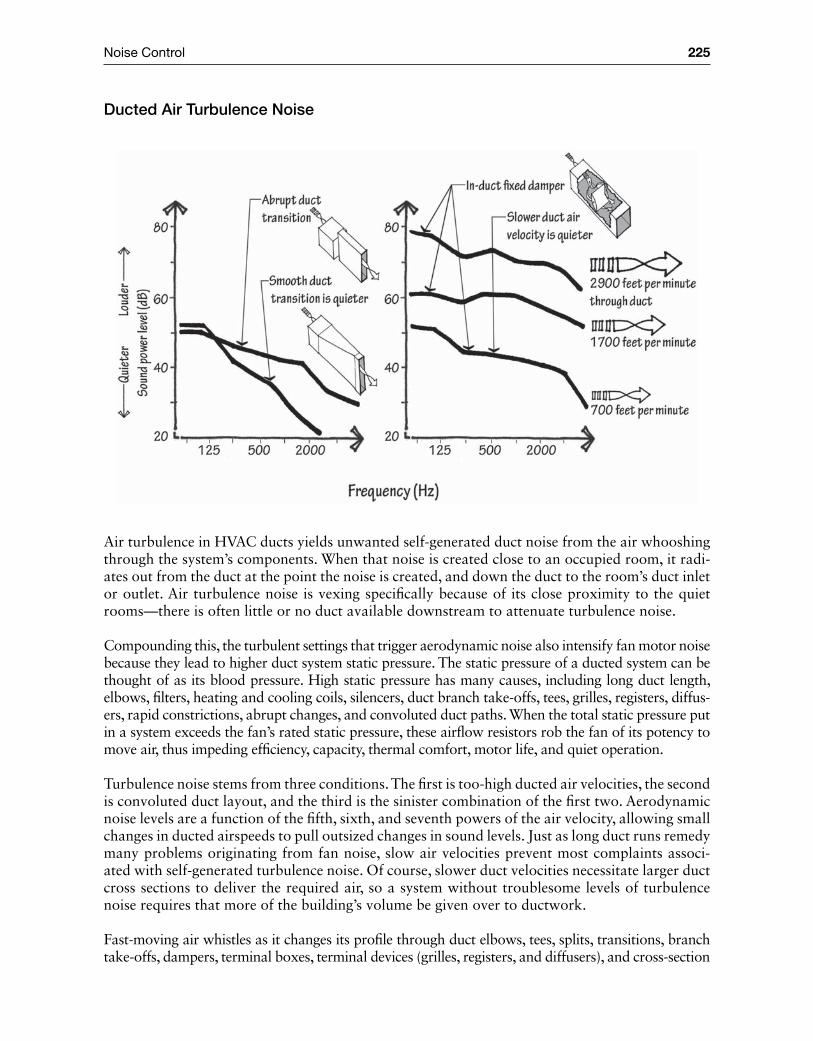
Noise Control 225
Ducted Air Turbulence Noise
Air turbulence in HVAC ducts yields unwanted self‐generated duct noise from the air whooshing through the system’s components. When that noise is created close to an occupied room, it radi-ates out from the duct at the point the noise is created, and down the duct to the room’s duct inlet or outlet. Air turbulence noise is vexing specifically because of its close proximity to the quiet rooms—there is often little or no duct available downstream to attenuate turbulence noise.
Compounding this, the turbulent settings that trigger aerodynamic noise also intensify fan motor noise because they lead to higher duct system static pressure. The static pressure of a ducted system can be thought of as its blood pressure. High static pressure has many causes, including long duct length, elbows, filters, heating and cooling coils, silencers, duct branch take‐offs, tees, grilles, registers, diffus-ers, rapid constrictions, abrupt changes, and convoluted duct paths. When the total static pressure put in a system exceeds the fan’s rated static pressure, these airflow resistors rob the fan of its potency to move air, thus impeding efficiency, capacity, thermal comfort, motor life, and quiet operation.
Turbulence noise stems from three conditions. The first is too‐high ducted air velocities, the second is convoluted duct layout, and the third is the sinister combination of the first two. Aerodynamic noise levels are a function of the fifth, sixth, and seventh powers of the air velocity, allowing small changes in ducted airspeeds to pull outsized changes in sound levels. Just as long duct runs remedy many problems originating from fan noise, slow air velocities prevent most complaints associ-ated with self‐generated turbulence noise. Of course, slower duct velocities necessitate larger duct cross sections to deliver the required air, so a system without troublesome levels of turbulence noise requires that more of the building’s volume be given over to ductwork.
Fast‐moving air whistles as it changes its profile through duct elbows, tees, splits, transitions, branch take‐offs, dampers, terminal boxes, terminal devices (grilles, registers, and diffusers), and cross‐section
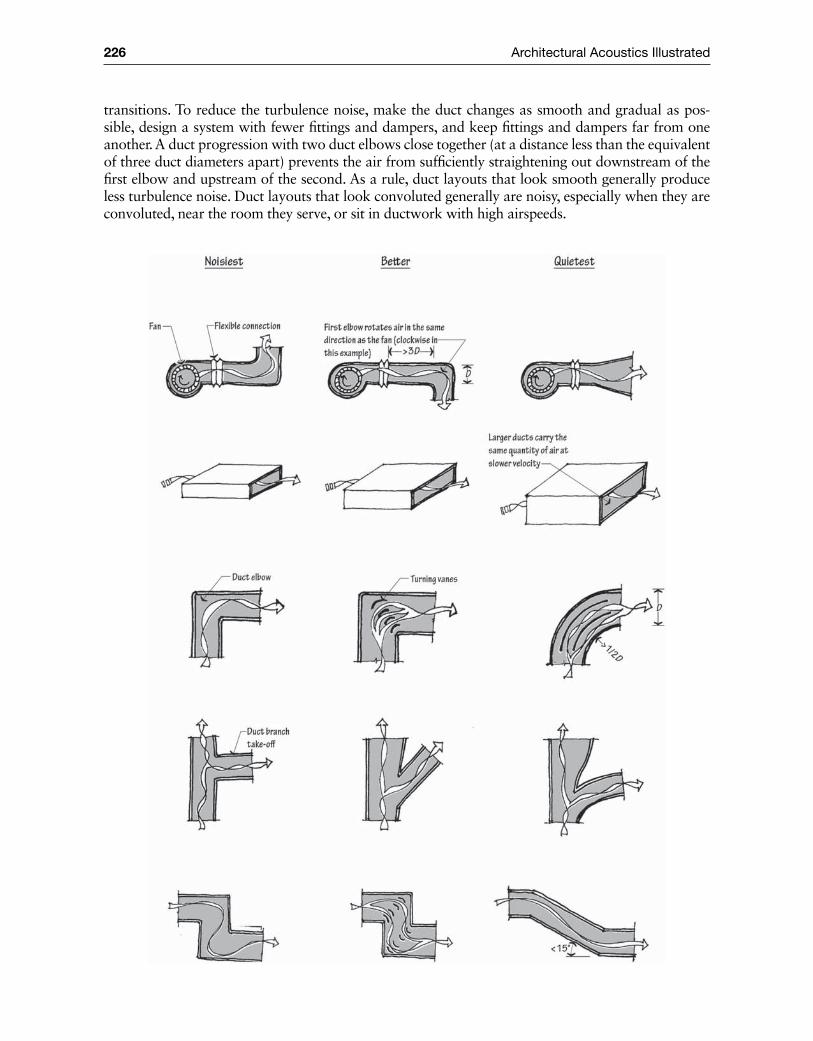
226 Architectural Acoustics Illustrated
transitions. To reduce the turbulence noise, make the duct changes as smooth and gradual as pos-sible, design a system with fewer fittings and dampers, and keep fittings and dampers far from one another. A duct progression with two duct elbows close together (at a distance less than the equivalent of three duct diameters apart) prevents the air from sufficiently straightening out downstream of the first elbow and upstream of the second. As a rule, duct layouts that look smooth generally produce less turbulence noise. Duct layouts that look convoluted generally are noisy, especially when they are convoluted, near the room they serve, or sit in ductwork with high airspeeds.
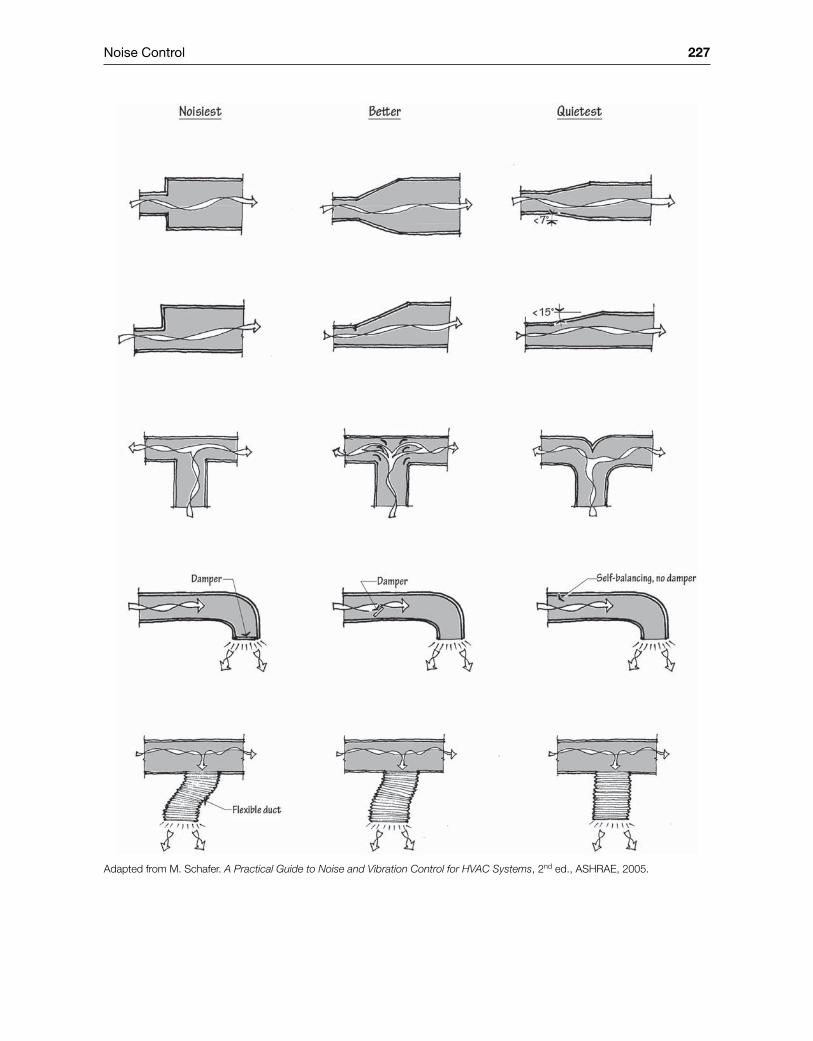
Noise Control 227
Adapted from M. Schafer. A Practical Guide to Noise and Vibration Control for HVAC Systems, 2nd ed., ASHRAE, 2005.

228 Architectural Acoustics Illustrated
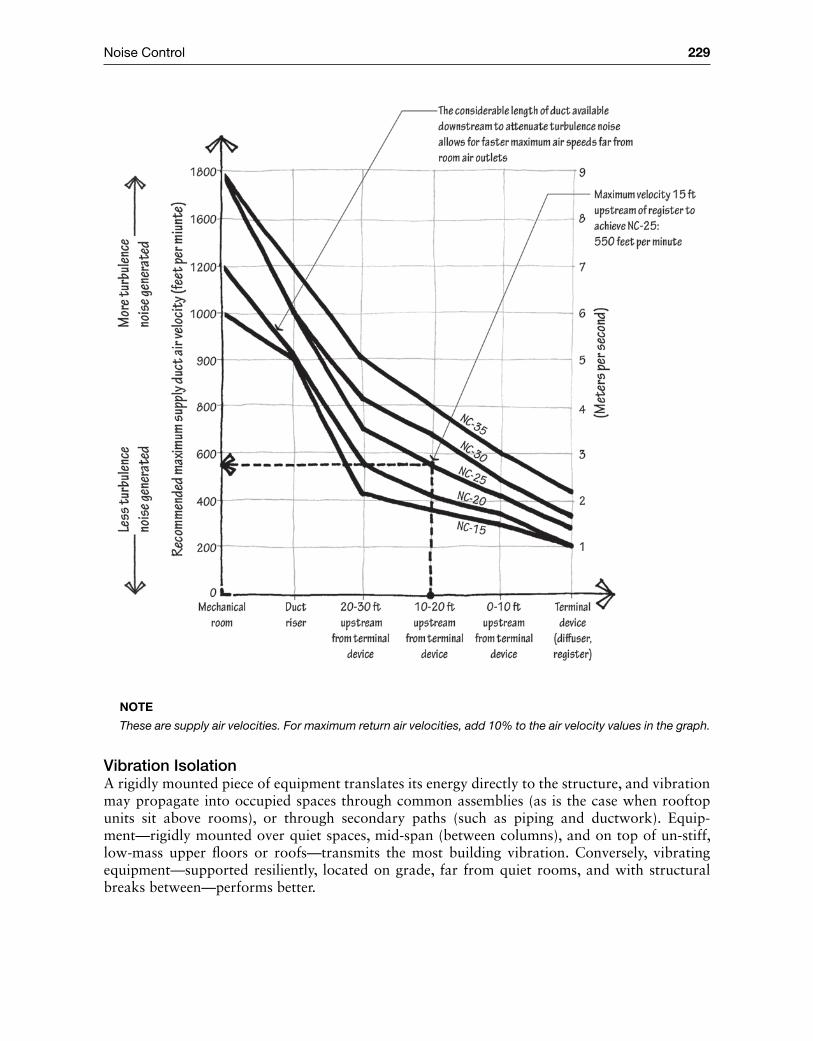
Noise Control 229
Note
These are supply air velocities. For maximum return air velocities, add 10% to the air velocity values in the graph.
Vibration IsolationA rigidly mounted piece of equipment translates its energy directly to the structure, and vibration may propagate into occupied spaces through common assemblies (as is the case when rooftop units sit above rooms), or through secondary paths (such as piping and ductwork). Equip-ment—rigidly mounted over quiet spaces, mid‐span (between columns), and on top of un‐stiff, low‐mass upper floors or roofs—transmits the most building vibration. Conversely, vibrating equipment—supported resiliently, located on grade, far from quiet rooms, and with structural breaks between—performs better.
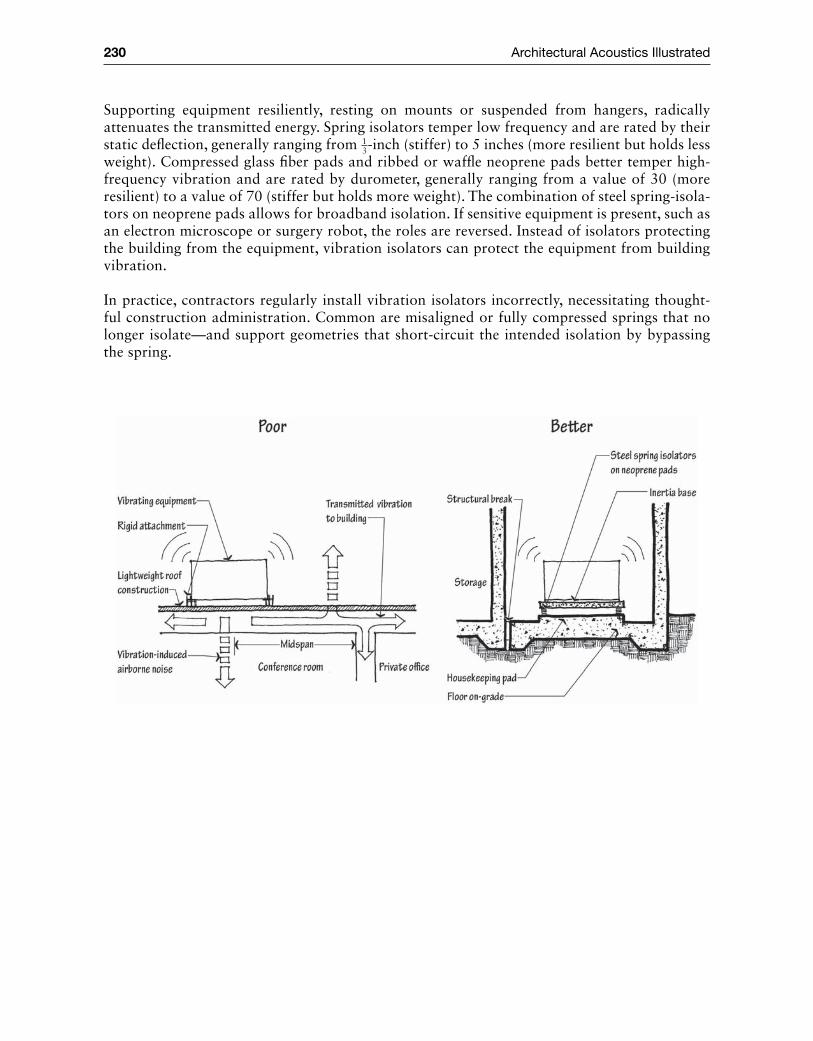
230 Architectural Acoustics Illustrated
Supporting equipment resiliently, resting on mounts or suspended from hangers, radically attenuates the transmitted energy. Spring isolators temper low frequency and are rated by their static deflection, generally ranging from 1
3‐inch (stiffer) to 5 inches (more resilient but holds less weight). Compressed glass fiber pads and ribbed or waffle neoprene pads better temper high‐frequency vibration and are rated by durometer, generally ranging from a value of 30 (more resilient) to a value of 70 (stiffer but holds more weight). The combination of steel spring‐isola-tors on neoprene pads allows for broadband isolation. If sensitive equipment is present, such as an electron microscope or surgery robot, the roles are reversed. Instead of isolators protecting the building from the equipment, vibration isolators can protect the equipment from building vibration.
In practice, contractors regularly install vibration isolators incorrectly, necessitating thought-ful construction administration. Common are misaligned or fully compressed springs that no longer isolate—and support geometries that short‐circuit the intended isolation by bypassing the spring.
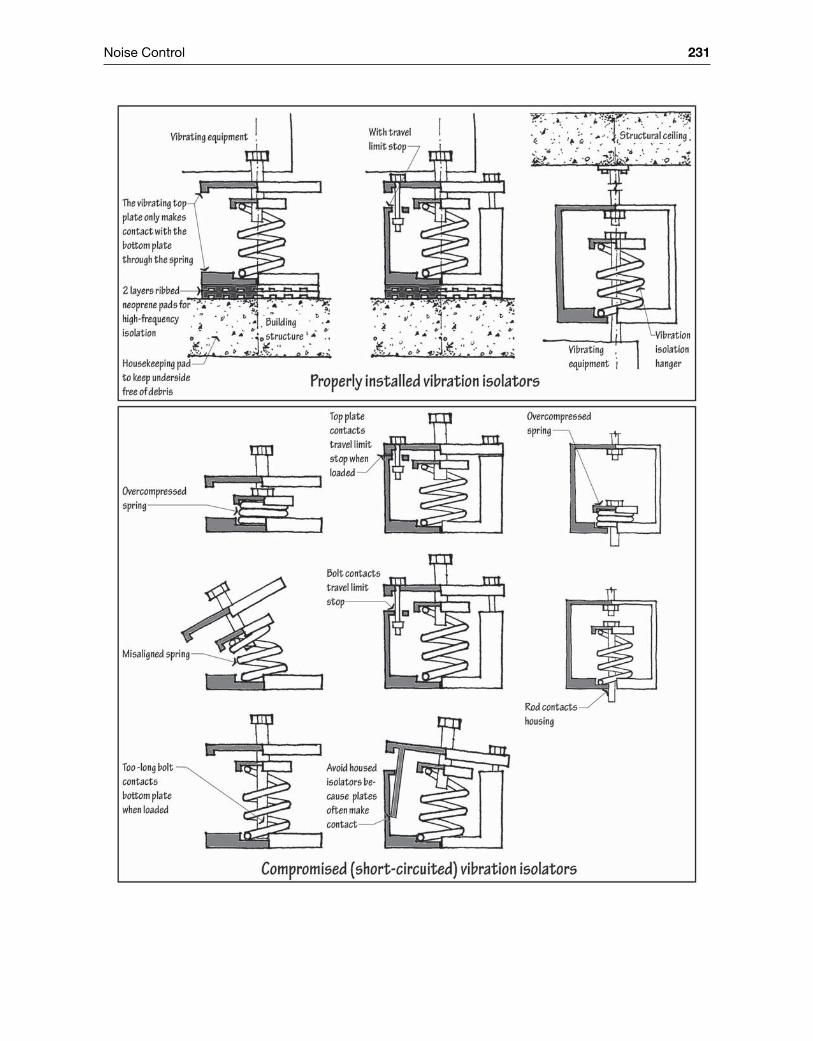
Noise Control 231
232 Architectural Acoustics Illustrated
Mechanical Noise Checklist
Note
Some of this checklist is written in a voice for mechanical engineers in later stages of HVAC system design, fabrication, and construction.
Early Design 1. Design the HVAC system early in the process, concurrently with the initial structural layout.
The more noise control you design in, the less you will need to add on. 2. Locate mechanical equipment far from quiet spaces. The following may radiate airborne,
structure‐borne, or duct‐borne noise: AHUs, exhaust fans, chillers, motors, pumps, genera-tors, compressors, other reciprocating or rotating equipment, electrical transformers, swim-ming pool equipment, expanding heating elements (creaking), dishwashers, clothes washers, dryers, garbage disposals, trash shoots, elevator equipment, garage door openers, switchgear, lighting ballasts, and dimmers.
3. Position buffer zones—e.g., storage rooms and corridors—between rooms housing mechani-cal equipment and quiet rooms.
4. Recognize that noise moves in plan and section. Noisy sources directly below or above quiet spaces can pose problems too. This is magnified when vibrating equipment, such as an air‐handling unit, is located above a quiet space.
5. Design for long duct runs—supply and return and exhaust. They are often the best defense against mechanical system noise. While this would seem obvious, it is often not carried out in practice, probably because (1) it is not given sufficient attention in early stages of design, (2) locating mechanical equipment, particularly air‐handling units, in close proximity to the spaces they serve minimizes construction costs and energy use associated with conditioned air distribution, and (3) metering centrally located equipment may be more difficult when multiple tenants are involved.
6. Use central HVAC systems because they are typically quieter than distributed systems. Remote chillers (far from occupants) are generally quieter than individual split system air condi-tioners; hydronic systems (without fans) are almost always quieter than forced air systems. Emerging passive chilled beam and hydronic cooling technology promises to be very quiet.
7. Specify quiet equipment. Some air‐handling units are much quieter than others of the same size; some dishwashers can barely be heard, while others roar. Establish lists of multiple prod-ucts from different manufacturers that meet required performance criteria, and then consult with a qualified professional to determine the quietest ones to use. If possible, purchase mul-tiple brands of, say, a computer projector, and keep only the quietest one.
8. Support vibrating equipment on‐grade where possible. When equipment must be located on higher floors, it should be located directly above a structural support.
9. Avoid rooftop mechanical systems, as they often cause noise problems, especially for top‐floor occupants: (1) Rooftop units may have both fans and compressors and are therefore especially noisy, (2) structure‐borne noise radiates through the roof to the ceiling, (3) air-borne noise radiates through the roof, windows, and exterior doors, and (4) duct‐borne noise propagates through the short duct runs associated with single‐zone rooftop units.
10. Design high‐mass, airtight assemblies to enclose mechanical rooms. 11. Orient mechanical room doors so that they open to rooms with little need for quiet, such as
corridors. Mechanical room walls should be massive and sealed airtight around duct, pipe, conduit, and the many other penetrations typically required to bring air, power, and water to and from mechanical rooms.
Noise Control 233
12. Accommodate engineers when they ask for larger mechanical rooms. Rooms that are too small often result in too‐small equipment, shoehorned‐in equipment, small ducts with higher air velocities, convoluted duct routing with closely spaced fittings, and insufficient mainte-nance, each of which generates noise. For preliminary design purposes, a mechanical room’s floor area should be at least 15 square feet per 1,000 CFM of AHU fan capacity (3 m2 for each m3/sec of airflow). Allow a minimum two‐foot clearance around all equipment.
13. In early space planning, recognize that ductwork—especially the larger ductwork associated with slow air velocities and quiet spaces—requires considerable building volume.
14. Locate noisy outdoor equipment, such as cooling towers and compressor/condenser units, far from windows. When a noisy piece of equipment is close to windows, build opaque walls around the machine, as high as the top of the window. In plan, build the walls as close as pos-sible, but far enough so that air‐cooled equipment retains its access to air.
Fans 1. Specify systems running at high efficiency and low static pressure. “Right‐size” fans because
oversized and undersized fans fail to operate at or near their rated peak efficiency, generating as much as 15 additional decibels of noise across the frequency spectrum.
2. Install quiet fan types, because the noisiest fan configurations run about 20 decibels louder than the quietest for the same application—subjectively four times as loud. Although forward curved fans are commonly used, they are known for low‐frequency (16 Hz to 63 Hz) rumble from airflow turbulence generated at blade tips. The problem is exacerbated by either opera-tion at less‐than‐maximum efficiency or non‐ideal discharge conditions where duct fittings sit near the fan outlet. Airfoil, backward‐curved, and backward‐inclined fans offer quieter regimes, especially for high‐CFM, high‐static‐pressure applications.
3. Design fans to operate at low discharge velocity, safely away from the stall region, and near the peak of the horsepower curve. Stall occurs when air responds to the higher static pressure at the fan’s exit and “chooses” not to move. Fans operating in the stall region make more noise.
4. Compare equipment with noise in mind. Manufacturers are able to provide octave‐band sound data estimates for their AHU equipment, including supply duct, return duct, and in‐mechanical‐room radiated levels. Fan noise tracks loosely with brake horsepower, so when comparing different AHUs, opt for the one operating with the lower brake horsepower. (Sometimes called pure horsepower, brake horsepower describes a motor’s power before the addition of the gears, pulleys, belts, and other system components that might slow the motor down.)
5. Select quiet ceiling exhaust and cabinet exhaust fans. They are typically noise‐rated in “sones,” whereby each doubling of the sone value is equivalent to approximately a 10‐dB increase in noise. Where noise is a concern, specify one‐sone fans, which run about 40 dBA.
6. Avoid fan‐powered mixing boxes when they are near, or serve, noise‐sensitive spaces. 7. Allow adequate clearance around the inlets for housed fans. Belt guards and inlet screens can
decrease airflow, increasing noise generation. 8. Select fans for VAV systems to operate at peak efficiency at an operating point between 70%
and 80% of the maximum required system capacity, because that is where the fan will operate most of the time.
9. Select systems with variable‐speed fan motor drives or variable‐pitch fan blades when the AHU must change its output air quantity to respond to need. These systems are quieter than ones involving discharge dampers to vary CFM because the dampers, which are typically located immediately downstream of the supply fan, reduce airflow, boost the pressure drop,
234 Architectural Acoustics Illustrated
and generate turbulence. To vary fan speeds, current source inverters and pulse‐width modu-lation are quieter than voltage source inverters.
10. Air‐condition with central systems that feature remote chillers and fans far from occu-pied rooms. Fan‐coil units should be avoided in noise‐sensitive spaces. But where they are used, specify electronically communicated three‐phase motors and fan‐motor subassemblies mounted on spring isolators within the unit housings. Motors operated on three‐phase elec-tricity make less noise than those supplied by single‐phase because in single‐phase motors the back‐and‐forth motion of electrons jolts and vibrates the motor at the rhythm of the alternating current (60 times per second or 60 Hz in the U.S., 50 Hz in some other countries). In three‐phase power, motors operate more smoothly because the back‐and‐forth electron rhythm is staggered in each of the three wires.
11. Avoid lightweight roof structure when rooftop systems must be used, and locate equipment over a column or bearing wall (rather than at mid‐span), at least 25 feet from occupied spaces. The roof structure should be stiff enough so that it deflects no more than an additional ¼ inch when loaded with the rooftop mechanical equipment. Mount the unit on a vibration isolation roof curb. Avoid downblast units; select instead side‐discharge units or down‐discharge units with a discharge plenum. When units must be located above quiet spaces, construct a steel frame with high‐deflection springs to support them.
Ducts 1. Use canvas or elastomeric flexible duct connections where supply and return ducts meet the
air‐handling unit. These look like accordions and link the AHU to the ducts that serve them with minimal vibration transfer to the ducts.
2. Specify rectangular ducts of thin gauge for best fan noise attenuation. Unlined rectangular duct attenuates appreciably, but unlined round duct provides almost no sound attenuation between the fan and duct outlet because the circular geometry is much more rigid and thus doesn’t absorb as much sound energy.
3. Know that internally lined duct is very effective at attenuating both fan and turbulence noise. Two‐inch liners meaningfully outperform one‐inch liners. Despite some publications’ claims to the contrary, there is no evidence that external duct lining increases acoustic performance in mitigating duct‐borne fan noise.
4. Duct return air back to equipment with similar noise control measures (duct length, silencer selection) as required for supply air. Noise travels both ways, so it will readily move upstream.
5. Use silencers. Duct silencers may be required on supply and return and exhaust ducts. This may necessitate a distance on the order of 20 feet on both the main supply and main return ducts between the air‐handling unit and first duct branch‐off or elbow. This will allow you to account for the silencer and sufficient straight ducts upstream and downstream of the silencer. The industry also makes specialized elbow silencers when straight runs are not available.
6. Select silencers with static pressure losses of 0.25 inches of water or less, including system effects, to minimize noise from silencer airflow turbulence.
7. Install special types of silencers when air quality concerns prohibit the use of glass fiber, as may be the case in hospitals and laboratories which fear that the fibers might promote mold growth, might come loose and introduce particulates in the air, or might trap chemicals, odors, or bacteria between their fibers. These include dissipative silencers with a film encasing the fiber, or reactive silencers (also called “pack‐less” or “no‐fill” silencers) that avoid the use of low‐density fiber altogether.
8. Maintain air velocities through silencers less than 2,000 feet per minute. At high velocities, air whistles across silencer baffles and may generate its own noise.
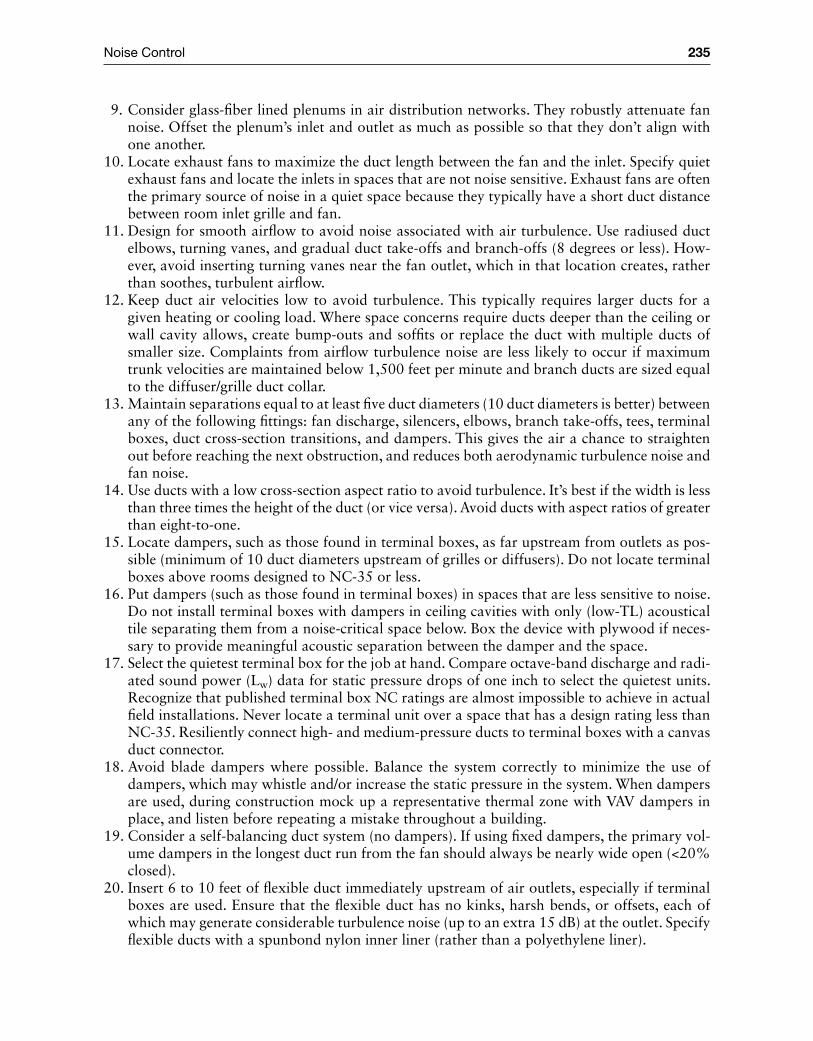
Noise Control 235
9. Consider glass‐fiber lined plenums in air distribution networks. They robustly attenuate fan noise. Offset the plenum’s inlet and outlet as much as possible so that they don’t align with one another.
10. Locate exhaust fans to maximize the duct length between the fan and the inlet. Specify quiet exhaust fans and locate the inlets in spaces that are not noise sensitive. Exhaust fans are often the primary source of noise in a quiet space because they typically have a short duct distance between room inlet grille and fan.
11. Design for smooth airflow to avoid noise associated with air turbulence. Use radiused duct elbows, turning vanes, and gradual duct take‐offs and branch‐offs (8 degrees or less). How-ever, avoid inserting turning vanes near the fan outlet, which in that location creates, rather than soothes, turbulent airflow.
12. Keep duct air velocities low to avoid turbulence. This typically requires larger ducts for a given heating or cooling load. Where space concerns require ducts deeper than the ceiling or wall cavity allows, create bump‐outs and soffits or replace the duct with multiple ducts of smaller size. Complaints from airflow turbulence noise are less likely to occur if maximum trunk velocities are maintained below 1,500 feet per minute and branch ducts are sized equal to the diffuser/grille duct collar.
13. Maintain separations equal to at least five duct diameters (10 duct diameters is better) between any of the following fittings: fan discharge, silencers, elbows, branch take‐offs, tees, terminal boxes, duct cross‐section transitions, and dampers. This gives the air a chance to straighten out before reaching the next obstruction, and reduces both aerodynamic turbulence noise and fan noise.
14. Use ducts with a low cross‐section aspect ratio to avoid turbulence. It’s best if the width is less than three times the height of the duct (or vice versa). Avoid ducts with aspect ratios of greater than eight‐to‐one.
15. Locate dampers, such as those found in terminal boxes, as far upstream from outlets as pos-sible (minimum of 10 duct diameters upstream of grilles or diffusers). Do not locate terminal boxes above rooms designed to NC‐35 or less.
16. Put dampers (such as those found in terminal boxes) in spaces that are less sensitive to noise. Do not install terminal boxes with dampers in ceiling cavities with only (low‐TL) acoustical tile separating them from a noise‐critical space below. Box the device with plywood if neces-sary to provide meaningful acoustic separation between the damper and the space.
17. Select the quietest terminal box for the job at hand. Compare octave‐band discharge and radi-ated sound power (Lw) data for static pressure drops of one inch to select the quietest units. Recognize that published terminal box NC ratings are almost impossible to achieve in actual field installations. Never locate a terminal unit over a space that has a design rating less than NC‐35. Resiliently connect high‐ and medium‐pressure ducts to terminal boxes with a canvas duct connector.
18. Avoid blade dampers where possible. Balance the system correctly to minimize the use of dampers, which may whistle and/or increase the static pressure in the system. When dampers are used, during construction mock up a representative thermal zone with VAV dampers in place, and listen before repeating a mistake throughout a building.
19. Consider a self‐balancing duct system (no dampers). If using fixed dampers, the primary vol-ume dampers in the longest duct run from the fan should always be nearly wide open (<20% closed).
20. Insert 6 to 10 feet of flexible duct immediately upstream of air outlets, especially if terminal boxes are used. Ensure that the flexible duct has no kinks, harsh bends, or offsets, each of which may generate considerable turbulence noise (up to an extra 15 dB) at the outlet. Specify flexible ducts with a spunbond nylon inner liner (rather than a polyethylene liner).
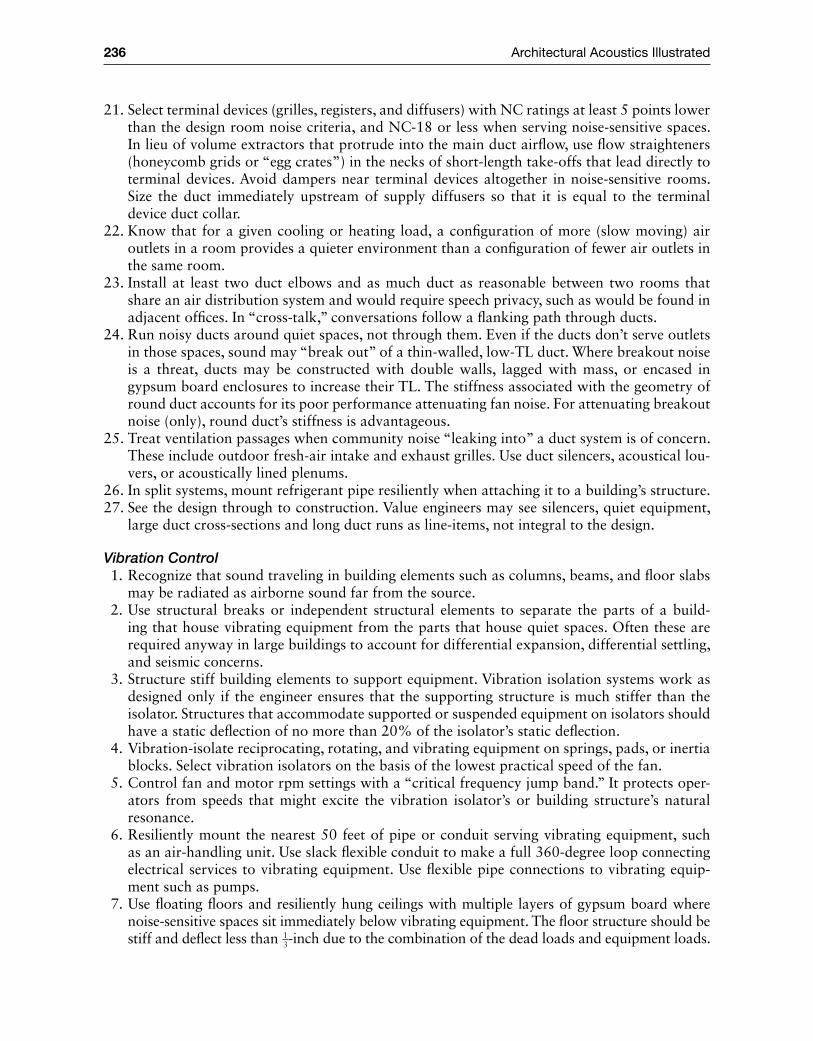
236 Architectural Acoustics Illustrated
21. Select terminal devices (grilles, registers, and diffusers) with NC ratings at least 5 points lower than the design room noise criteria, and NC‐18 or less when serving noise‐sensitive spaces. In lieu of volume extractors that protrude into the main duct airflow, use flow straighteners (honeycomb grids or “egg crates”) in the necks of short‐length take‐offs that lead directly to terminal devices. Avoid dampers near terminal devices altogether in noise‐sensitive rooms. Size the duct immediately upstream of supply diffusers so that it is equal to the terminal device duct collar.
22. Know that for a given cooling or heating load, a configuration of more (slow moving) air outlets in a room provides a quieter environment than a configuration of fewer air outlets in the same room.
23. Install at least two duct elbows and as much duct as reasonable between two rooms that share an air distribution system and would require speech privacy, such as would be found in adjacent offices. In “cross‐talk,” conversations follow a flanking path through ducts.
24. Run noisy ducts around quiet spaces, not through them. Even if the ducts don’t serve outlets in those spaces, sound may “break out” of a thin‐walled, low‐TL duct. Where breakout noise is a threat, ducts may be constructed with double walls, lagged with mass, or encased in gypsum board enclosures to increase their TL. The stiffness associated with the geometry of round duct accounts for its poor performance attenuating fan noise. For attenuating breakout noise (only), round duct’s stiffness is advantageous.
25. Treat ventilation passages when community noise “leaking into” a duct system is of concern. These include outdoor fresh‐air intake and exhaust grilles. Use duct silencers, acoustical lou-vers, or acoustically lined plenums.
26. In split systems, mount refrigerant pipe resiliently when attaching it to a building’s structure. 27. See the design through to construction. Value engineers may see silencers, quiet equipment,
large duct cross‐sections and long duct runs as line‐items, not integral to the design.
Vibration Control 1. Recognize that sound traveling in building elements such as columns, beams, and floor slabs
may be radiated as airborne sound far from the source. 2. Use structural breaks or independent structural elements to separate the parts of a build-
ing that house vibrating equipment from the parts that house quiet spaces. Often these are required anyway in large buildings to account for differential expansion, differential settling, and seismic concerns.
3. Structure stiff building elements to support equipment. Vibration isolation systems work as designed only if the engineer ensures that the supporting structure is much stiffer than the isolator. Structures that accommodate supported or suspended equipment on isolators should have a static deflection of no more than 20% of the isolator’s static deflection.
4. Vibration‐isolate reciprocating, rotating, and vibrating equipment on springs, pads, or inertia blocks. Select vibration isolators on the basis of the lowest practical speed of the fan.
5. Control fan and motor rpm settings with a “critical frequency jump band.” It protects oper-ators from speeds that might excite the vibration isolator’s or building structure’s natural resonance.
6. Resiliently mount the nearest 50 feet of pipe or conduit serving vibrating equipment, such as an air‐handling unit. Use slack flexible conduit to make a full 360‐degree loop connecting electrical services to vibrating equipment. Use flexible pipe connections to vibrating equip-ment such as pumps.
7. Use floating floors and resiliently hung ceilings with multiple layers of gypsum board where noise‐sensitive spaces sit immediately below vibrating equipment. The floor structure should be stiff and deflect less than 1
3‐inch due to the combination of the dead loads and equipment loads.
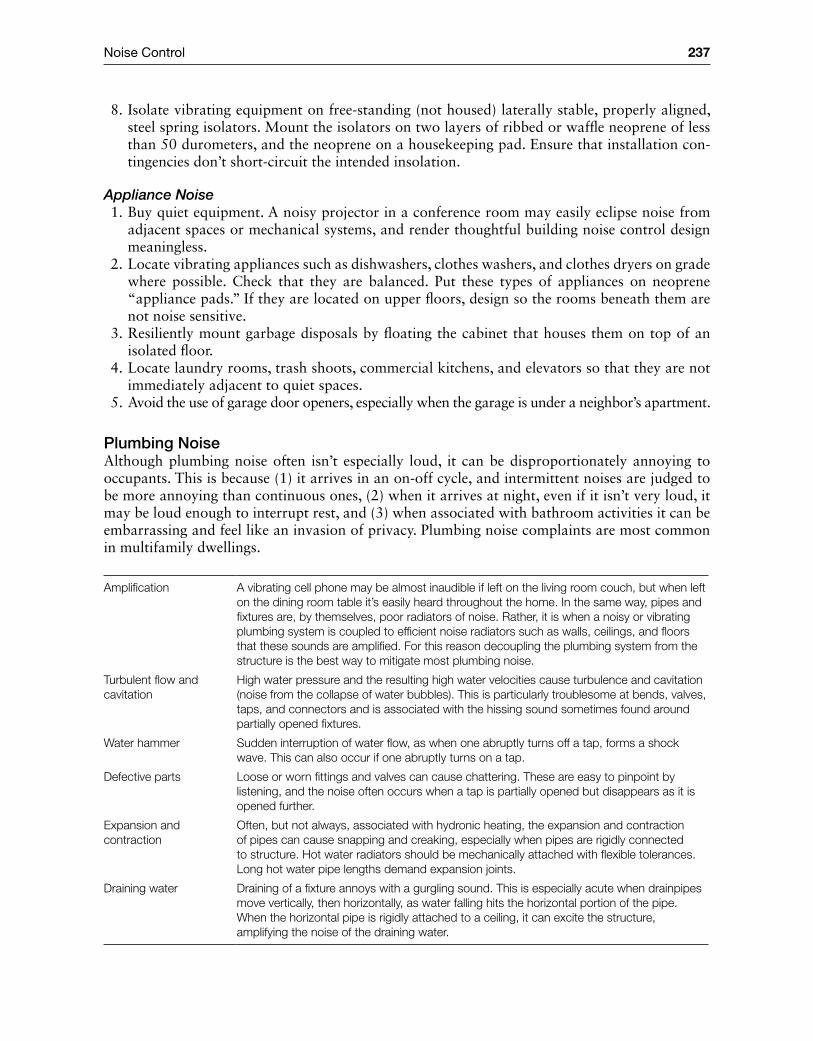
Noise Control 237
8. Isolate vibrating equipment on free‐standing (not housed) laterally stable, properly aligned, steel spring isolators. Mount the isolators on two layers of ribbed or waffle neoprene of less than 50 durometers, and the neoprene on a housekeeping pad. Ensure that installation con-tingencies don’t short‐circuit the intended insolation.
Appliance Noise 1. Buy quiet equipment. A noisy projector in a conference room may easily eclipse noise from
adjacent spaces or mechanical systems, and render thoughtful building noise control design meaningless.
2. Locate vibrating appliances such as dishwashers, clothes washers, and clothes dryers on grade where possible. Check that they are balanced. Put these types of appliances on neoprene “appliance pads.” If they are located on upper floors, design so the rooms beneath them are not noise sensitive.
3. Resiliently mount garbage disposals by floating the cabinet that houses them on top of an isolated floor.
4. Locate laundry rooms, trash shoots, commercial kitchens, and elevators so that they are not immediately adjacent to quiet spaces.
5. Avoid the use of garage door openers, especially when the garage is under a neighbor’s apartment.
Plumbing NoiseAlthough plumbing noise often isn’t especially loud, it can be disproportionately annoying to occupants. This is because (1) it arrives in an on‐off cycle, and intermittent noises are judged to be more annoying than continuous ones, (2) when it arrives at night, even if it isn’t very loud, it may be loud enough to interrupt rest, and (3) when associated with bathroom activities it can be embarrassing and feel like an invasion of privacy. Plumbing noise complaints are most common in multifamily dwellings.
Amplification A vibrating cell phone may be almost inaudible if left on the living room couch, but when left on the dining room table it’s easily heard throughout the home. In the same way, pipes and fixtures are, by themselves, poor radiators of noise. Rather, it is when a noisy or vibrating plumbing system is coupled to efficient noise radiators such as walls, ceilings, and floors that these sounds are amplified. For this reason decoupling the plumbing system from the structure is the best way to mitigate most plumbing noise.
Turbulent flow and cavitation
High water pressure and the resulting high water velocities cause turbulence and cavitation (noise from the collapse of water bubbles). This is particularly troublesome at bends, valves, taps, and connectors and is associated with the hissing sound sometimes found around partially opened fixtures.
Water hammer Sudden interruption of water flow, as when one abruptly turns off a tap, forms a shock wave. This can also occur if one abruptly turns on a tap.
Defective parts Loose or worn fittings and valves can cause chattering. These are easy to pinpoint by listening, and the noise often occurs when a tap is partially opened but disappears as it is opened further.
Expansion and contraction
Often, but not always, associated with hydronic heating, the expansion and contraction of pipes can cause snapping and creaking, especially when pipes are rigidly connected to structure. Hot water radiators should be mechanically attached with flexible tolerances. Long hot water pipe lengths demand expansion joints.
Draining water Draining of a fixture annoys with a gurgling sound. This is especially acute when drainpipes move vertically, then horizontally, as water falling hits the horizontal portion of the pipe. When the horizontal pipe is rigidly attached to a ceiling, it can excite the structure, amplifying the noise of the draining water.
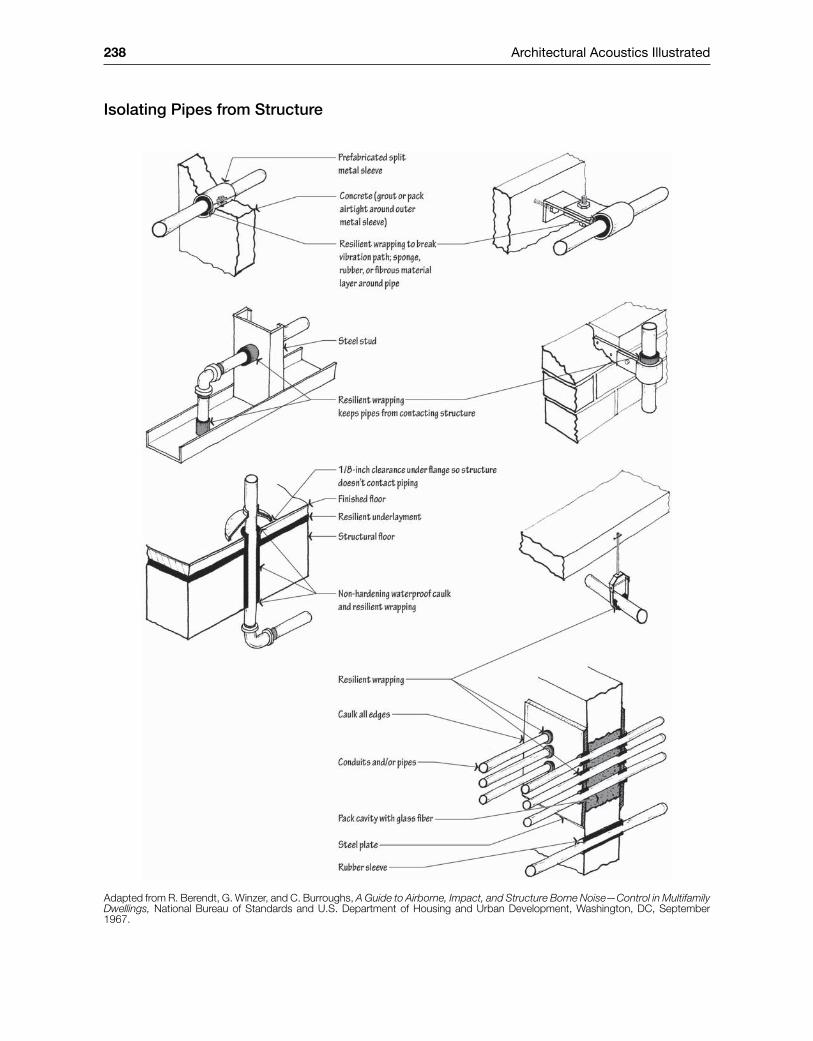
238 Architectural Acoustics Illustrated
Isolating Pipes from Structure
Adapted from R. Berendt, G. Winzer, and C. Burroughs, A Guide to Airborne, Impact, and Structure Borne Noise—Control in Multifamily Dwellings, National Bureau of Standards and U.S. Department of Housing and Urban Development, Washington, DC, September 1967.
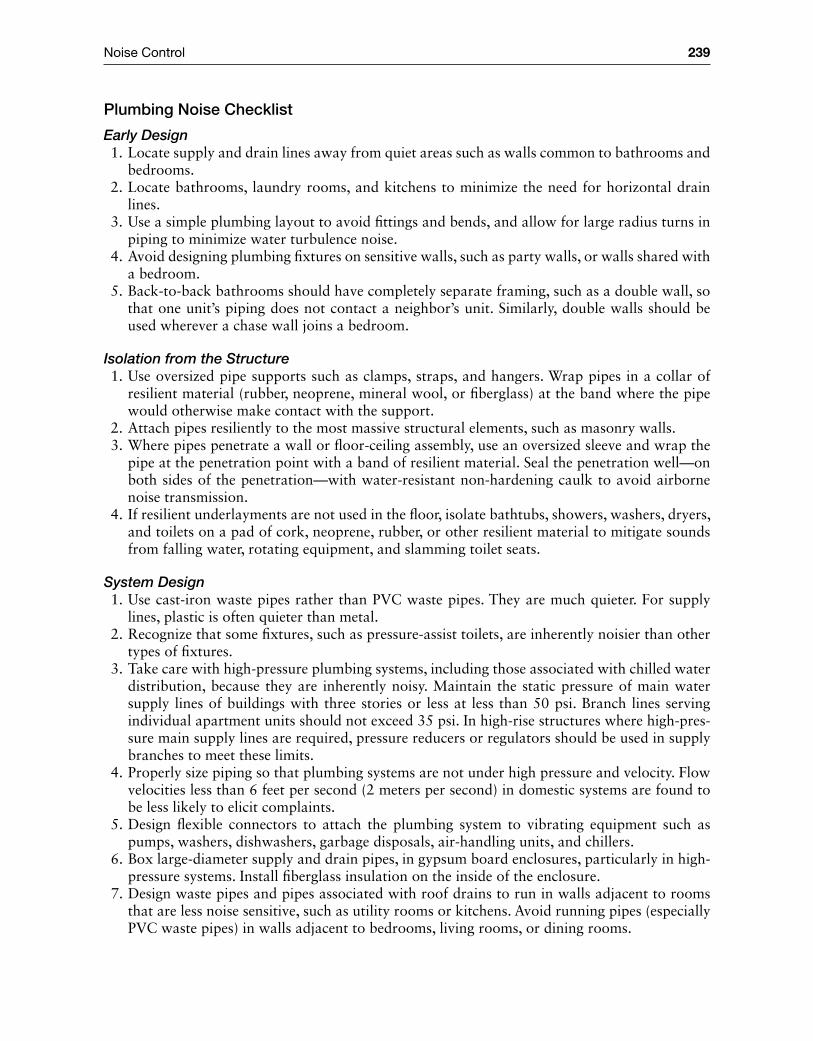
Noise Control 239
Plumbing Noise Checklist
Early Design 1. Locate supply and drain lines away from quiet areas such as walls common to bathrooms and
bedrooms. 2. Locate bathrooms, laundry rooms, and kitchens to minimize the need for horizontal drain
lines. 3. Use a simple plumbing layout to avoid fittings and bends, and allow for large radius turns in
piping to minimize water turbulence noise. 4. Avoid designing plumbing fixtures on sensitive walls, such as party walls, or walls shared with
a bedroom. 5. Back‐to‐back bathrooms should have completely separate framing, such as a double wall, so
that one unit’s piping does not contact a neighbor’s unit. Similarly, double walls should be used wherever a chase wall joins a bedroom.
Isolation from the Structure 1. Use oversized pipe supports such as clamps, straps, and hangers. Wrap pipes in a collar of
resilient material (rubber, neoprene, mineral wool, or fiberglass) at the band where the pipe would otherwise make contact with the support.
2. Attach pipes resiliently to the most massive structural elements, such as masonry walls. 3. Where pipes penetrate a wall or floor‐ceiling assembly, use an oversized sleeve and wrap the
pipe at the penetration point with a band of resilient material. Seal the penetration well—on both sides of the penetration—with water‐resistant non‐hardening caulk to avoid airborne noise transmission.
4. If resilient underlayments are not used in the floor, isolate bathtubs, showers, washers, dryers, and toilets on a pad of cork, neoprene, rubber, or other resilient material to mitigate sounds from falling water, rotating equipment, and slamming toilet seats.
System Design 1. Use cast‐iron waste pipes rather than PVC waste pipes. They are much quieter. For supply
lines, plastic is often quieter than metal. 2. Recognize that some fixtures, such as pressure‐assist toilets, are inherently noisier than other
types of fixtures. 3. Take care with high‐pressure plumbing systems, including those associated with chilled water
distribution, because they are inherently noisy. Maintain the static pressure of main water supply lines of buildings with three stories or less at less than 50 psi. Branch lines serving individual apartment units should not exceed 35 psi. In high‐rise structures where high‐pres-sure main supply lines are required, pressure reducers or regulators should be used in supply branches to meet these limits.
4. Properly size piping so that plumbing systems are not under high pressure and velocity. Flow velocities less than 6 feet per second (2 meters per second) in domestic systems are found to be less likely to elicit complaints.
5. Design flexible connectors to attach the plumbing system to vibrating equipment such as pumps, washers, dishwashers, garbage disposals, air‐handling units, and chillers.
6. Box large‐diameter supply and drain pipes, in gypsum board enclosures, particularly in high‐pressure systems. Install fiberglass insulation on the inside of the enclosure.
7. Design waste pipes and pipes associated with roof drains to run in walls adjacent to rooms that are less noise sensitive, such as utility rooms or kitchens. Avoid running pipes (especially PVC waste pipes) in walls adjacent to bedrooms, living rooms, or dining rooms.
240 Architectural Acoustics Illustrated
ReferencesAcoustics Australia, April 2012 (Entire publication dedicated to wind turbine noise).American National Standards Institute and the Acoustical Society of America. 2008. ANSI/ASA S12.2
Criteria for Evaluating Room Noise.American National Standards Institute. 2002. ANSI S12.60 Acoustical Performance Criteria, Design
Requirements, and Guidelines for Schools.American Society of Heating, Refrigerating and Air‐Conditioning Engineers (ASHRAE). 2011. Heating,
Ventilating, and Air‐Conditioning Handbook—HVAC Applications, p. 48.14.ASTM. 2004. E 1007: Standard Test Method for Field Measurement of Tapping Machine Impact Sound
Transmission Through Floor‐Ceiling Assemblies and Associated Support Structures.ASTM. 2005. E 336: Standard Test Method of Measurement of Airborne Sound Attenuation between
Rooms in Buildings.Babisch, W. “Road Traffic Noise and Cardiovascular Risk.” Noise and Health 10, 2008.Beck, J. “The Optimal Office.” The Atlantic, April 2014.Berendt, R., G. Winzer, and C. Burroughs. A Guide to Airborne, Impact, and Structure Borne Noise—
Control in Multifamily Dwellings. National Bureau of Standards and U.S. Department of Housing and Urban Development, Washington, DC, September 1967.
Berry, B. and I. Flindell. 2009. “Estimating Dose‐Response Relationships Between Noise Exposure and Human Health in the UK.” Technical Report 2009‐02 for the UK Department for Environmental Food and Rural Affairs.
Blazier, W. and R. DuPree. “Investigation of Low‐Frequency Footfall Noise in Wood‐frame Multifamily Building Construction.” Journal of the Acoustical Society of America, September 1994.
Bradley, J. S. and J. A. Birta. “Laboratory Measurements of the Sound Insulation of Building Façade Elements.” National Research Council Canada IRC Internal Report IR‐818, October 2000.
Brennan, A. et al. “Traditional Versus Open Office Design.” Environment and Behavior, May 2002.Burge, P. and E. Thalheimer. “Five Myths of Construction Noise.” Journal of Sound and Vibration,
December 2012.Cavanaugh, W. et al. (ed.). 2010. Architectural Acoustics, 2nd ed. John Wiley & Sons. Hoboken, NJ, pp.
93–99.Dupree, R. “Catalog of STC and IIC Ratings for Wall and Floor/Ceiling Assemblies with TL and ISPL Data
Plots.” Report from the California Department of Health Services, Local Environmental Health Services Branch Office of Noise Control, September 1981.
Egan, M. D. 2007. Architectural Acoustics. J. Ross Publishing. Plantation, FL.Evans, G. W. and D. Johnson. “Stress and Open‐Office Noise.” Journal of Applied Psychology,
October 2000.Fidell, S. et al. “A First‐Principles Model for Estimating the Prevalence of Annoyance with Aircraft Noise
Exposure.” Journal of the Acoustical Society of America, August 2011.Firesheets, N. and E. Ryherd. “Aircraft Noise Reduction for Typical Home Construction Types,” Internoise,
August 2012.Haapakangas, A. et al. “Effects of Five Speech Masking Sounds on Performance and Acoustics Satisfaction.
Implications for Open‐Plan Offices.” Acta Acoustica united with Acoustica, Vol. 97, 2011.Haapakangas, A. et al. “Perceived Acoustic Environment, Work Performance, and Well‐being Survey Results
from Finnish Offices.” 9th International Congress on Noise as a Public Health Problem (ICBEN), 2008.Halliwell, R. E., T. R. T. Nightingale, A. C. C. Warnock, and J. A. Birta. “Gypsum Board Walls: Transmission
Loss Data.” National Research Council Canada IRC Internal Report IR‐761, March 1998.Jaramillo, A. and M. Ermann. “Linking HVAC Type and Student Achievement.” Internoise, August 2012.Jones, R. S. Noise and Vibration Control in Buildings. McGraw‐Hill, 1984.Kim, M. J. and J. H. An. “Effect of Slit‐Shaped Apertures on Sound Insulation Performance of Building
Elements.” Noise Control Engineering Journal, September 2009.Kinetics Noise Control, Pac International, and Pliteq resilient clip sound transmission data.Long, M. “The Acoustics of Floors in Condominiums.” Acoustics Today, January 2007.Long, M. 2006. Architectural Acoustics. Elsevier. New York, NY.

Noise Control 241
Loverde, J. and W. Dong. “Quantitative Comparisons of Resilient Channel Design and Installation in Single Wood Stud Walls.” Proceedings of the 20th International Congress on Acoustics, August 2010.
Maa, D. Y. “Potential of Microperforated Panel Absorber.” Journal of the Acoustical Society of America, November 1998.
Mehta, M. et al., 1998 Architectural Acoustics. Merrill Prentice Hall, pp. 116, 176.Monsanto Co. 1986. “Acoustical Glazing Design Guide,” Saflex Interlayer.National Academy of Engineering. 2010. Technology for a Quieter America. The National Academies
Press, pp. 11–29.Nightingale, T. R. T. and J. D. Quirt. “Effect of Electrical Outlet Boxes on Sound Insulation of a Cavity
Wall.” Journal of the Acoustical Society of America, July 1998.Noise Pollution Clearing House. EPA Document Collection, http://www.nonoise.org/epa/.Owens‐Corning Fiberglas Corp. Noise Control Manual. November, 1984.Park, H. K. et, al. “Evaluating Airborne Sound Insulation in Terms of Speech Intelligibility.” Journal of the
Acoustical Society of America, March 2008.Pedersen, E. et al. “Response to Noise from Modern Wind Farms in The Netherlands.” Journal of the
Acoustical Society of America, August 2009.Quirt, J. D., A. C. C Warnock, and J. A. Birta. “Gypsum Board Walls: Sound Transmission Results.” National
Research Council Canada IRC Internal Report IR‐693, October 1995.Roller, H. S. 1985. Design Data for Acousticians. United States Gypsum Co..Salter, C. et al. “Case Studies of a Method for Predicting Speech Privacy in the Contemporary Workplace.”
Center for the Built Environment, UC Berkeley, January 2003.Schafer, M. 2005. A Practical Guide to Noise and Vibration Control for HVAC Systems, 2nd ed. ASHRAE.Schomer, P. “On Normalizing DNL to Provide Better Correlation with Response.” Sound and Vibration,
December 2002.Selander, J. et al. “Long‐Term Exposure to Road Traffic Noise and Myocardial Infarction.” Epidemiology,
March 2009.Siebein, G. W. and R. Lilkendey. “Acoustical Case Studies of HVAC Systems in Schools.” ASHRAE Journal,
May 2004.Siebein, G. W. et al. “Ten Ways to Provide a High‐Quality Acoustical Environment in Schools.” Journal of
Language, Speech, and Hearing Services in Schools, October 2000.Sundstrom, E. et al. “Privacy at Work: Architectural Correlates of Job Satisfaction and Job Performance.”
Academy of Management Journal, March 1980.Timmerman, N. “Wind Turbine Noise.” Acoustics Today, July 2013.Uris, A. et al. “The Influence of Slits on Sound Transmission Through a Lightweight Partition.” Applied
Acoustics, April 2004.U.S. Census Bureau. American Housing Survey for the United States: 2005. August 2006, p. 64.Warnock, A. C. C. “Field Sound Transmission Loss Measurements.” National Research Council Canada
Building Research Note 232, June 1985.Warnock, A. C. C. and J. A. Birta. “Detailed Report for Consortium on Fire Resistance and Sound Insula-
tion of Floors: Sound Transmission and Impact Insulation Data in 13 Octave Bands.” National Research
Council Canada IRC Internal Report IR‐811, July 2000.

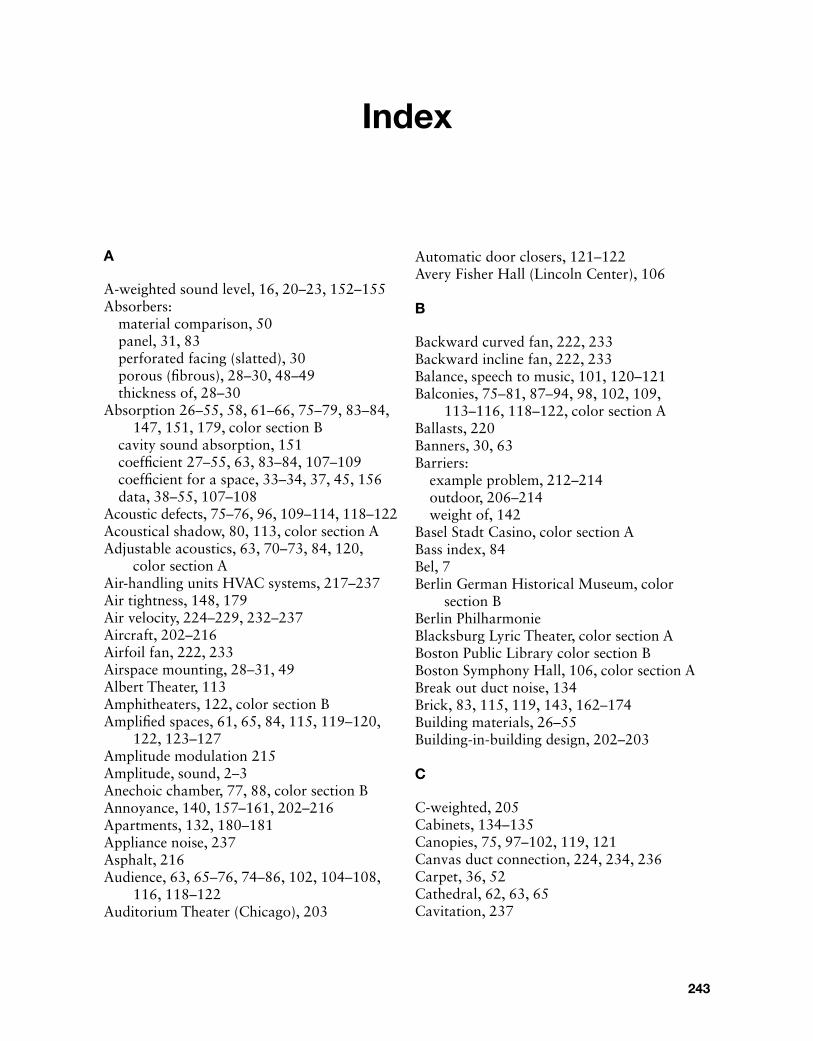
243
Index
A
A-weighted sound level, 16, 20–23, 152–155Absorbers:
material comparison, 50panel, 31, 83perforated facing (slatted), 30porous (fibrous), 28–30, 48–49thickness of, 28–30
Absorption 26–55, 58, 61–66, 75–79, 83–84, 147, 151, 179, color section B
cavity sound absorption, 151coefficient 27–55, 63, 83–84, 107–109coefficient for a space, 33–34, 37, 45, 156data, 38–55, 107–108
Acoustic defects, 75–76, 96, 109–114, 118–122Acoustical shadow, 80, 113, color section AAdjustable acoustics, 63, 70–73, 84, 120,
color section AAir-handling units HVAC systems, 217–237Air tightness, 148, 179Air velocity, 224–229, 232–237Aircraft, 202–216Airfoil fan, 222, 233Airspace mounting, 28–31, 49Albert Theater, 113Amphitheaters, 122, color section BAmplified spaces, 61, 65, 84, 115, 119–120,
122, 123–127Amplitude modulation 215Amplitude, sound, 2–3Anechoic chamber, 77, 88, color section BAnnoyance, 140, 157–161, 202–216Apartments, 132, 180–181Appliance noise, 237Asphalt, 216Audience, 63, 65–76, 74–86, 102, 104–108,
116, 118–122Auditorium Theater (Chicago), 203
Automatic door closers, 121–122Avery Fisher Hall (Lincoln Center), 106
B
Backward curved fan, 222, 233Backward incline fan, 222, 233Balance, speech to music, 101, 120–121Balconies, 75–81, 87–94, 98, 102, 109,
113–116, 118–122, color section ABallasts, 220Banners, 30, 63Barriers:
example problem, 212–214outdoor, 206–214weight of, 142
Basel Stadt Casino, color section A Bass index, 84Bel, 7Berlin German Historical Museum, color
section BBerlin Philharmonie Blacksburg Lyric Theater, color section ABoston Public Library color section BBoston Symphony Hall, 106, color section ABreak out duct noise, 134Brick, 83, 115, 119, 143, 162–174Building materials, 26–55Building-in-building design, 202–203
C
C-weighted, 205Cabinets, 134–135Canopies, 75, 97–102, 119, 121Canvas duct connection, 224, 234, 236Carpet, 36, 52Cathedral, 62, 63, 65Cavitation, 237
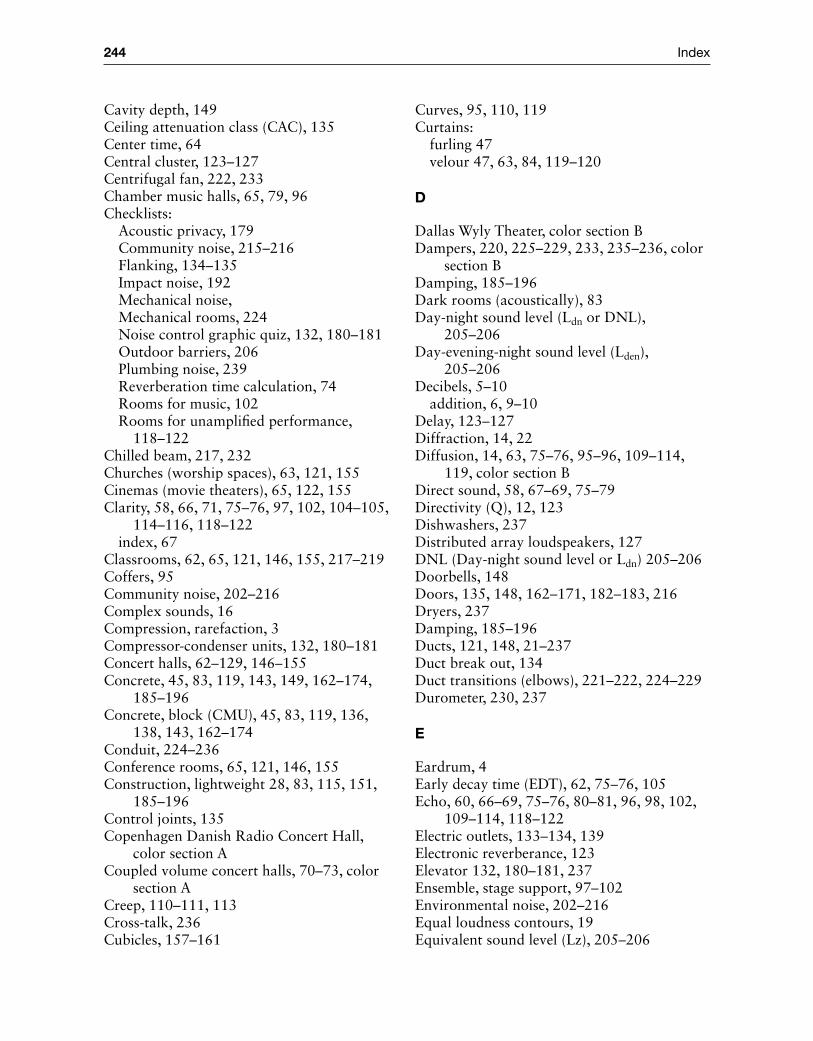
244 Index
Cavity depth, 149Ceiling attenuation class (CAC), 135Center time, 64Central cluster, 123–127Centrifugal fan, 222, 233Chamber music halls, 65, 79, 96Checklists:
Acoustic privacy, 179Community noise, 215–216Flanking, 134–135Impact noise, 192Mechanical noise, Mechanical rooms, 224Noise control graphic quiz, 132, 180–181Outdoor barriers, 206Plumbing noise, 239Reverberation time calculation, 74Rooms for music, 102Rooms for unamplified performance,
118–122Chilled beam, 217, 232Churches (worship spaces), 63, 121, 155Cinemas (movie theaters), 65, 122, 155Clarity, 58, 66, 71, 75–76, 97, 102, 104–105,
114–116, 118–122index, 67
Classrooms, 62, 65, 121, 146, 155, 217–219Coffers, 95Community noise, 202–216Complex sounds, 16Compression, rarefaction, 3Compressor-condenser units, 132, 180–181Concert halls, 62–129, 146–155Concrete, 45, 83, 119, 143, 149, 162–174,
185–196Concrete, block (CMU), 45, 83, 119, 136,
138, 143, 162–174Conduit, 224–236Conference rooms, 65, 121, 146, 155Construction, lightweight 28, 83, 115, 151,
185–196Control joints, 135Copenhagen Danish Radio Concert Hall,
color section ACoupled volume concert halls, 70–73, color
section ACreep, 110–111, 113Cross-talk, 236Cubicles, 157–161
Curves, 95, 110, 119 Curtains:
furling 47velour 47, 63, 84, 119–120
D
Dallas Wyly Theater, color section BDampers, 220, 225–229, 233, 235–236, color
section BDamping, 185–196Dark rooms (acoustically), 83Day-night sound level (Ldn or DNL),
205–206Day-evening-night sound level (Lden),
205–206Decibels, 5–10
addition, 6, 9–10Delay, 123–127Diffraction, 14, 22Diffusion, 14, 63, 75–76, 95–96, 109–114,
119, color section BDirect sound, 58, 67–69, 75–79Directivity (Q), 12, 123Dishwashers, 237Distributed array loudspeakers, 127DNL (Day-night sound level or Ldn) 205–206Doorbells, 148Doors, 135, 148, 162–171, 182–183, 216Dryers, 237Damping, 185–196Ducts, 121, 148, 21–237Duct break out, 134Duct transitions (elbows), 221–222, 224–229Durometer, 230, 237
E
Eardrum, 4Early decay time (EDT), 62, 75–76, 105Echo, 60, 66–69, 75–76, 80–81, 96, 98, 102,
109–114, 118–122Electric outlets, 133–134, 139Electronic reverberance, 123Elevator 132, 180–181, 237Ensemble, stage support, 97–102Environmental noise, 202–216Equal loudness contours, 19Equivalent sound level (Lz), 205–206
Index 245
Excessive loudness, 111, 113, color section BExpansion of pipes, 237Eyring formula 64
F
Fan coil units, 217–237Fan-shaped concert halls, 85, 90, 94, 102, 121Feedback, 123–124Field impact insulation class (FIIC), 191Flanking, 133–140, 142, 148, 150, 178,
185–196, 210–214, 224Flexible pipe connections, 239Flexible ducts, 221Floating floors, 185–196, 198, 236Floor deflection, 185–196, 236Floors, 152, 185–196Flush mounting, 28–31Flutter echo, 96, 109, 111, color section BFly tower, 120Focusing, 96, 110–113Fogg Art Museum (Harvard) 60–62Footfall, 152, 185–196Free field sound decay, 6–12, 34, 77–78Frequency:
center 17–18fundamental 15–16
G
Garage door openers, 237Geothermal heat pumps, 216Glass, 162–174, 184, 216, color section BGrazing angle propagation, 83Grilles (diffusers/registers), 224–229Gypsum board, 83, 115, 136–139, 142–143,
149, 162–174, color section BGypsum concrete, 185–196
H
Haas effect, 58–59, 66Harmonics, 13–16Helmholtz resonators, 32Hearing loss, 14, 19, 152Hertz 13–22History of concert halls, 63, 77, 114–116,
color section AHistory of room acoustics, 114–116
Housekeeping pad, 224, 237HVAC systems, 217–237
self-balancing, 235Hydronic HVAC system, 217, 232
I
Image shift, 96Impact snubbers, 192Impact insulation class (IIC), 152, 185–196Impact noise, 152, 185–196Impact sound pressure level, 190–191Impedance mismatch, 31, 83Impulse response, 58–60, 64, 71–73, 109–113,
color section AIncident sound, 21Inertia block, 224Infrasound, 215Internally lined duct, 221–223, 234, color
section BIntimacy (initial time delay gap, ITDG),
94–95, 104, 118–122
J
Just-noticeable difference (JND), 7, 28, 84, 90
L
L90, L10, Lmax, 205–206Ldn (day-night sound level or DNL), 205–206Lz (equivalent sound level), 205–206Laboratories, 146, 155, 223Lateral reflections, 80–81, 85–94, 102–104,
118–122Lighting, 120Lecture rooms, 65, 121, 155Localization, 123–127Logarithms, 7Loudness, 6, 58, 63, 66, 75–81, 83–84, 87,
97–98, 101, 103–105, 114–116, 118–122, color section A
Loudspeaker, 4coverage, 128
Low-frequency sound, 22, 27–28, 60, 63, 65–67, 75–76, 83–84, 96, 102–106, 112–114,
141, 143, 153, 185–196, 202–237Lucerne KKL, color section A
246 Index
M
Map of venues, 117Masking, 123, 157–161Mass, 148–149, 151, 179, 186Materials:
asphalt, 216carpet, 36, 52concrete, 45, 83, 119, 143, 149, 162–174,
185–196concrete, block (CMU), 45, 83, 119, 136,
138, 143, 162–174glass, 162–174, 184, 216, color section Bgypsum concrete, 185–196gypsum board, 83, 115, 136–139, 142–143,
149, 162–174, color section Bmasonry (brick, stone), 83, 115, 119, 143,
162–174metal, 162–174plaster, 83, 119wood, 83, 119, 149, 162–174
Mean free path, 58–62Measuring sound level, 8Mechanical equipment noise, 22, 115, 121,
132, 135, 143, 146, 154, 180–181, 202, 205, 217–237
Mechanical rooms, 224, 233Membrane construction, 54 Metal, 162–174Microperforated absorber, 30, color section BMineral wool 151Mixing, sound, 124Mixing boxes (fan-powered), 233Molecules, 2–3, 15Monitors (stage monitors) 98Multifamily housing (apartments), 146, 155,
185–196, 202–216Multipurpose auditoriums, 65, 115, 120,
155, 223Multitasking, 159Music, 60–129Musical instruments, 13–16, 19, 63
N
Nara Centennial Hall, color section BNeoprene isolation pads, 230, 237, color
section BNight clubs, 65, 122, 152
Noise:animal, 154, 205appliance, 237background, 73, 115, 118–122, 152–161,
202–239community (outdoor), 202–216, 237control, 122, 131–239exposure forecast (NEF), 205–206impact (floors), 152, 185–196isolation, 122, 132–239masking, 123, 157–161mechanical equipment, 22, 115, 121, 132,
135, 143, 146, 154, 180–181, 202, 205, 217–237
noise criteria (NC), 152 –155, 217–219, 223, 229, 235, color section B
noise criteria maximum values, 155noise reduction coefficient (NRC), 36–55,
107–108plumbing, 132, 180–181, 237–239noise reduction (NR), 144–145,
147–151,175–177transportation, 22, 122, 184, 202–216vibration, 229–239zoning, 202–216
Nouvel, Jean, color section A
O
Occupant satisfaction, 158Octave bands, 16–20Offices, 62, 146, 155, 157–161, 179Omnidirectional point sound source, 8, 12Opera houses, 65, 79–80, 96, 101, 120, 155Orchestra pits, 101Oscillating membrane, 2Outdoor-indoor transmission class (OITC),
144–145, 184, 205Outdoor noise, 202–216
P
Parametric design, color section BPartial-height partitions, 133, 135, 143Penetrations (duct, pipe, conduit), 133–135,
140, 148Performance space:
balconies, 75–81, 87–94, 98, 102, 109, 113–116, 118–122, color section A

Index 247
canopy, 75, 119, 121coupled volume concert halls, 70–73, color
section Afan shaped concert halls, 85, 90, 94,
102, 121fly tower, 120history of concert halls, 63, 77, 114–116,
color section Alighting, 120rear wall problem, 75–76, 109, 119reversed fan shaped concert halls, 86shoebox concert halls, 78, 85, 90, 94, 118,
color section Aterraced concert halls, 86, 90, color
section APews, 107Phase cancellation (resonance), 83–84, 119Phreaking, 13Plaster, 83, 119Plumbing, 132, 180–181, 237–239Plenums, 235Poetry Foundation, color section BPolycarbonate, color section BPrecedence effect, 58–59, 66Psycho-acoustics, 140, 157–161, 202–216Pumps, 22, 115, 121, 132, 135, 143, 146, 154,
180–181, 202, 205, 217–237Pure tones, 16Pyramids, 95
Q
Q (directivity), 12, 123
R
Rapid speech transmission index (RASTI), 156–161
Rear wall problem, 75–76, 109, 119Recording studios, 65, 122, 146, 205, 223Reflections, 26–27, 58, 61–127
early arriving reflections, 62, 66–69, 75–76, 85–86, 94–95, 97–105, 118–122, 155–156, color section B
Resilient channel and resilient clips, 135, 138, 150, 185–201, color section B
Resilient Pipe Hanger, 224Resilient underlayments, 185–196, color
section B
Resonance, 22, 83, 112–113, 122Restaurants, 155, 223Reverberance, 58–66, 71–76, 83–84, 87,
94, 97–98, 102–106, 111, 114–116, 118–122, 156, color section A
optimal reverberation times, 65–67, 75–76, 118–122
reverberation time formula (Sabine formula) 61–64
reverberation time problem example color section A
Reversed fan shaped concert halls, 86Risers, 97, 100Roofs, 216Rooftop mechanical equipment, 230, 232, 234Room:
constant, 33, 61–62, 76–79, 147, 175–177effects, 147,175–177room criteria (RC), 152room noise criteria (balance noise criteria,
NCB) 152shaping, 66–69, 75–129, color section Bvolume, 58, 61, 65, 74, 76–79
Rooms for:African drums, 63amphitheaters, 122, color section Barena rock (stadium) 63Bach, 63, 114ballet theater, color section Bbaroque music, 63, 65Beethoven, 65cathedral, 62, 63, 65chamber music, 65, 79, 96chanting, 63, 65, 114chorus, 65, 100churches (worship spaces), 63, 121, 155cinemas (movie theaters), 65, 122, 155classical music, 62–65classrooms, 62, 65, 121, 146, 155, 217–219concert halls, 62–129, 146–155conference rooms, 65, 121, 146, 155gymnasiums, 146high school auditorium, 65, 101jazz, 63kitchens, 146, 155, 223, 237laboratories, 146, 155, 223lecture rooms, 65, 121, 155multifamily housing (apartments), 146, 155,
185–196, 202–216

248 Index
multipurpose auditorium, 65, 115, 120, 155, 223
night clubs, 65, 122, 152offices, 62, 146, 155, 157–161, 179opera, 65, 79–80, 96, 101, 120, 155organ, 63, 65recording studios, 65, 122, 146, 205, 223restaurants, 155, 223romantic classical music, 63, 65string quartets, 65Tchaikovsky, 63, 65theaters, 62, 65, 101, 120, 155
Running music, 62
S
Sabine, Wallace, 60–64, color section ASabins, 33–35, 147Sanders Theater, 60–62Seat dip effect, 105Seats (audience), 63, 65–76, 74–86, 102,
104–108, 116, 118–122Shoebox concert halls, 78, 85, 90, 94, 118,
color section ASightlines, 66, 75–76, 82, 102, 118–119Silencers, 221–224, 234Single-number metrics, 20, 36Sones, 233Sound:
a-weighted sound level, 16, 20–23, 152–155
absorption, 26–55, 58, 61–66, 75–79, 83–84, 147, 151, 179, color section B
airborne, 140–148, 192, 205, color section Blevel data, 23level, 2–10low frequency, 22,27–28, 60,63, 65–67,
75–76, 83–84, 96, 102–106, 112–114, 141, 143, 153, 185–196, 202–237
speed of, 14spreading, 4, 8, 204strength, 77–79system design, 123–127 wave, 2wavelength, 14–15, 83–84
Sound transmission: sound transmission class (STC), 141transmission, 26
transmission loss data (STC data/TL data), 162–174
transmission loss example calculation, 175–177
STC maximum values, 146STC measuring, 144–145
Source-path-receiver, 4–5, 58Spatial impression, 80–81, 85–94, 102–104,
118–122Specular reflections, 95–96Speech, 19, 27, 60–65, 75–76, 84, 154
intelligibility, 58, 118–122, 152–157, 217–237
isolation, 142privacy, 146, 157–161, 179–183speech transmission index (STI), 156–161
Spring hangers, 185–196, 199–200, 231, 236Stage floors, 83, 97–102Stages, 83, 97–102Stage lifts, 101Stall region, 233Static deflection, 230Static pressure, 224–229, 233–234Stone, 83, 115, 119, 143, 162–174Stiffness, 84, 185–196, 230Structural breaks, 229–237Structural discontinuity, 148, 150–151, 179,
197–198Studs:
double, 137, 150metal, 151, 162–174, 198staggered, 137, 150 spacing, 137wall construction (gypsum board), 83, 115,
136–139, 142–143, 149, 162–174, color section B
Symmetry, 87
T
T20, 62T30, 62Take-offs, duct, 224–229Tapping machine, 190–191, color section BTerraced concert halls, 86, 90, color section ATheaters, 62, 65, 101, 120, 155Theater planning, 97–102Threshold of hearing, 4, 6, 13, 19, 153Threshold of pain, 5
Rooms for (continued )
Index 249
Three-phase motors, 234Transformers, 220Turbulence, 225–237, color section BTurning vanes, 226–229Throw, 127Timbre (tone coloration), 96, 98, 113–114Transmission loss, 162–174Transportation
noise, 22, 122, 184, 202–216Trash chute, 132, 180–181, 237Travel limit stop, 231Tuning forks, 16
U
Unamplified spaces, 61, 65, 75–76, 84, 115, 155–156
V
Vestibules (sound lock), 119–120, 179–182, 232
Vibration, 229–239Volume resonators, 32Viscoelastic glue, 150, color section BVowels (consonants), 19
W
Warmth, 75–76, 83–84, 87, 102–106, color section A
Washers, 237Water hammer, 237Wavelength, 14–15, 83–84Weighted impact sound reduction index, 191Whispering galleries, 110–111, 113Wind turbines, 205–206, 214–215Windows, 162–174, 184, 216, color section BWood, 83, 119, 149, 162–174
Z
Zoning for noise, 202–216
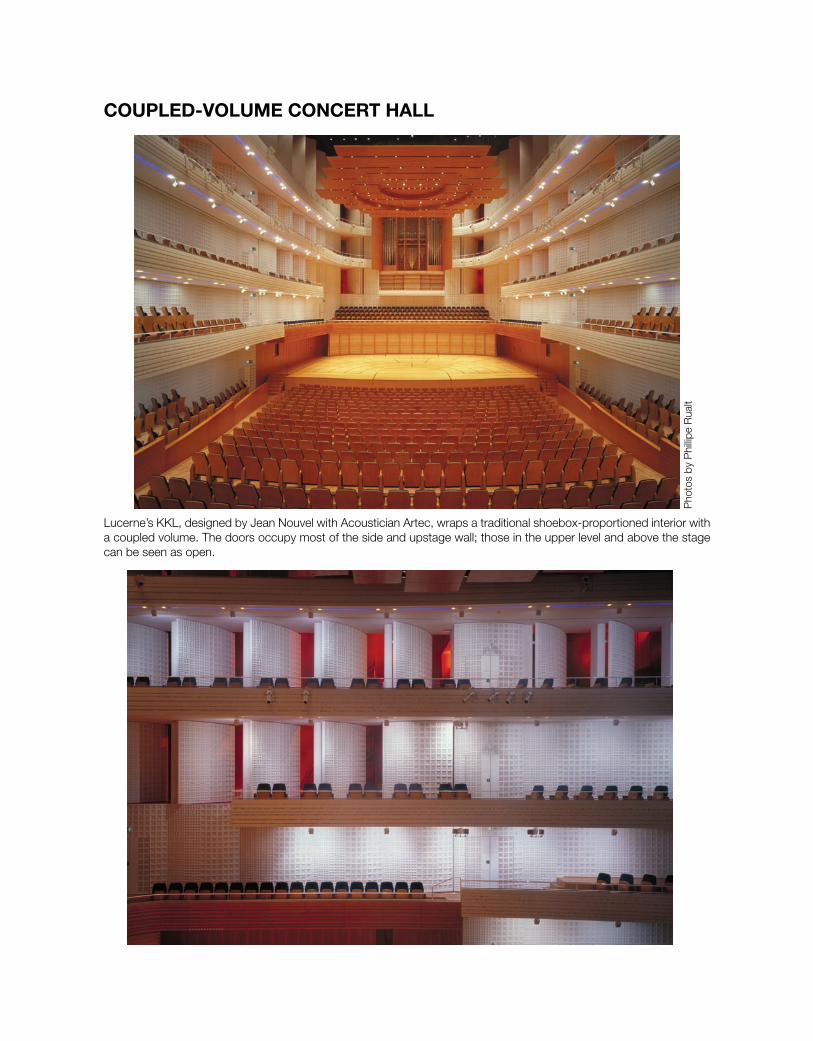
Coupled‐Volume ConCert Hall
Pho
tos
by P
hillip
e R
ualt
Lucerne’s KKL, designed by Jean Nouvel with Acoustician Artec, wraps a traditional shoebox‐proportioned interior with a coupled volume. The doors occupy most of the side and upstage wall; those in the upper level and above the stage can be seen as open.
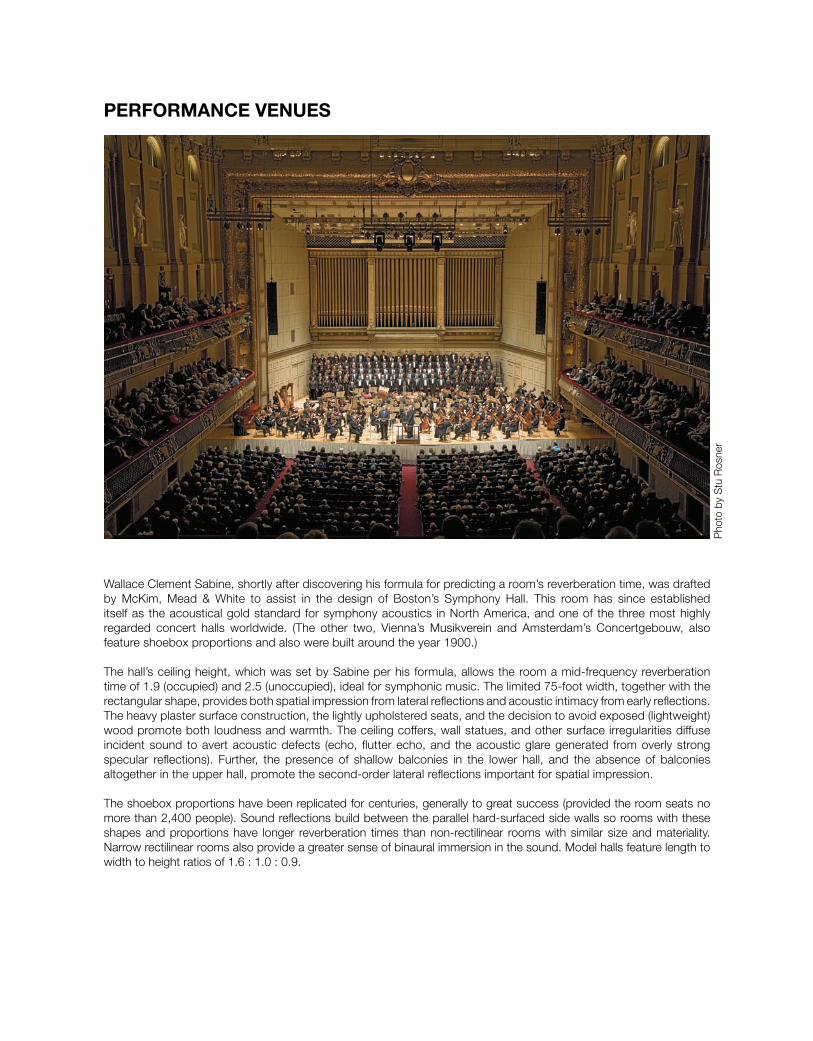
performanCe Venues
Pho
to b
y S
tu R
osne
r
Wallace Clement Sabine, shortly after discovering his formula for predicting a room’s reverberation time, was drafted by McKim, Mead & White to assist in the design of Boston’s Symphony Hall. This room has since established itself as the acoustical gold standard for symphony acoustics in North America, and one of the three most highly regarded concert halls worldwide. (The other two, Vienna’s Musikverein and Amsterdam’s Concertgebouw, also feature shoebox proportions and also were built around the year 1900.)
The hall’s ceiling height, which was set by Sabine per his formula, allows the room a mid‐frequency reverberation time of 1.9 (occupied) and 2.5 (unoccupied), ideal for symphonic music. The limited 75‐foot width, together with the rectangular shape, provides both spatial impression from lateral reflections and acoustic intimacy from early reflections. The heavy plaster surface construction, the lightly upholstered seats, and the decision to avoid exposed (lightweight) wood promote both loudness and warmth. The ceiling coffers, wall statues, and other surface irregularities diffuse incident sound to avert acoustic defects (echo, flutter echo, and the acoustic glare generated from overly strong specular reflections). Further, the presence of shallow balconies in the lower hall, and the absence of balconies altogether in the upper hall, promote the second‐order lateral reflections important for spatial impression.
The shoebox proportions have been replicated for centuries, generally to great success (provided the room seats no more than 2,400 people). Sound reflections build between the parallel hard‐surfaced side walls so rooms with these shapes and proportions have longer reverberation times than non‐rectilinear rooms with similar size and materiality. Narrow rectilinear rooms also provide a greater sense of binaural immersion in the sound. Model halls feature length to width to height ratios of 1.6 : 1.0 : 0.9.
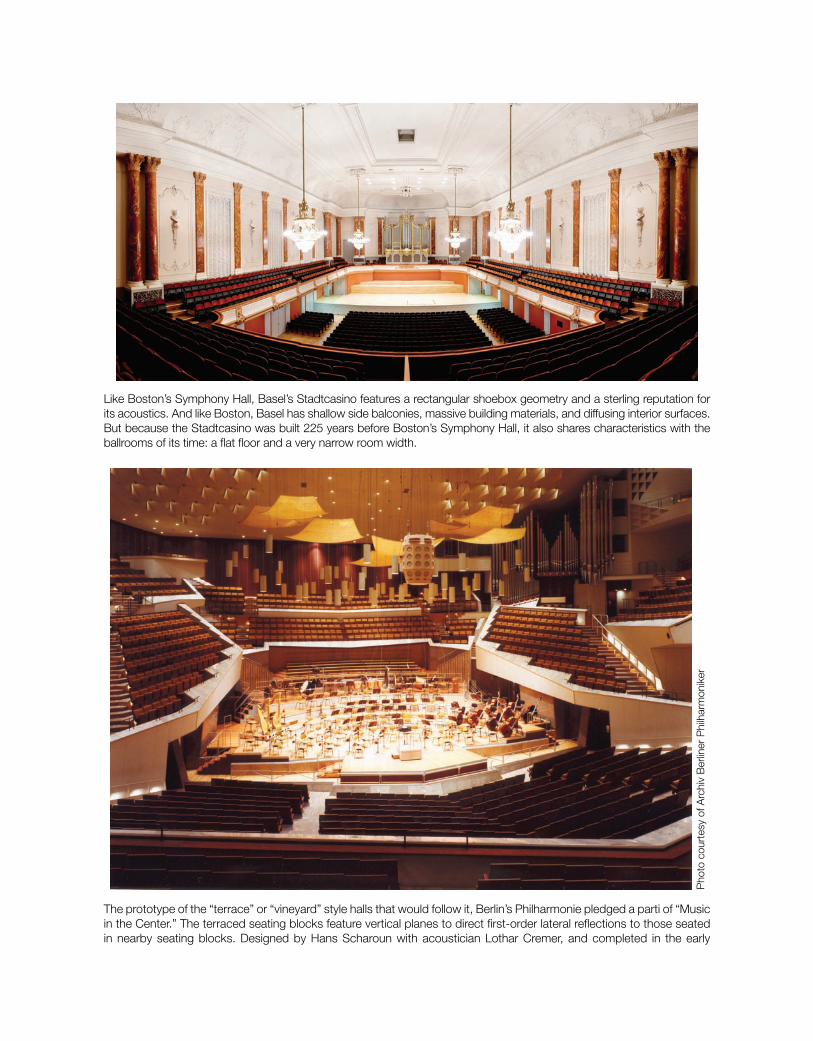
Like Boston’s Symphony Hall, Basel’s Stadtcasino features a rectangular shoebox geometry and a sterling reputation for its acoustics. And like Boston, Basel has shallow side balconies, massive building materials, and diffusing interior surfaces. But because the Stadtcasino was built 225 years before Boston’s Symphony Hall, it also shares characteristics with the ballrooms of its time: a flat floor and a very narrow room width.
Pho
to c
ourt
esy
of A
rchi
v B
erlin
er P
hilh
arm
onik
er
The prototype of the “terrace” or “vineyard” style halls that would follow it, Berlin’s Philharmonie pledged a parti of “Music in the Center.” The terraced seating blocks feature vertical planes to direct first‐order lateral reflections to those seated in nearby seating blocks. Designed by Hans Scharoun with acoustician Lothar Cremer, and completed in the early
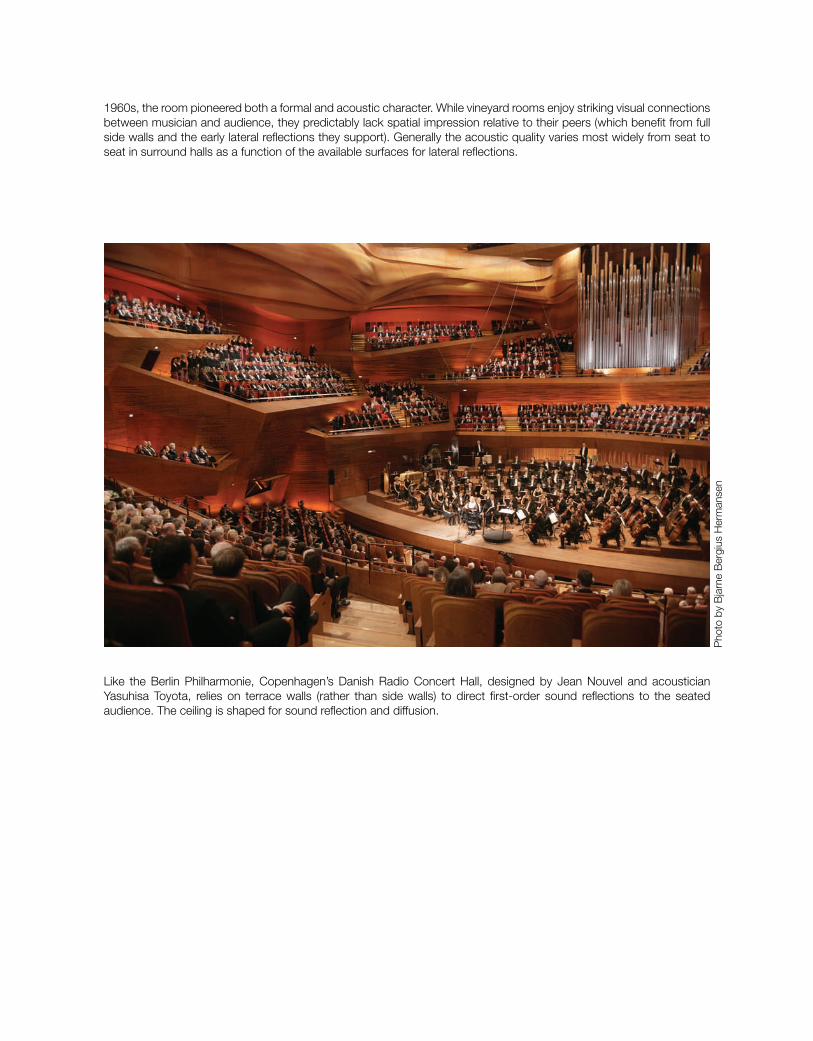
1960s, the room pioneered both a formal and acoustic character. While vineyard rooms enjoy striking visual connections between musician and audience, they predictably lack spatial impression relative to their peers (which benefit from full side walls and the early lateral reflections they support). Generally the acoustic quality varies most widely from seat to seat in surround halls as a function of the available surfaces for lateral reflections.
Pho
to b
y B
jarn
e B
ergi
us H
erm
anse
n
Like the Berlin Philharmonie, Copenhagen’s Danish Radio Concert Hall, designed by Jean Nouvel and acoustician Yasuhisa Toyota, relies on terrace walls (rather than side walls) to direct first‐order sound reflections to the seated audience. The ceiling is shaped for sound reflection and diffusion.
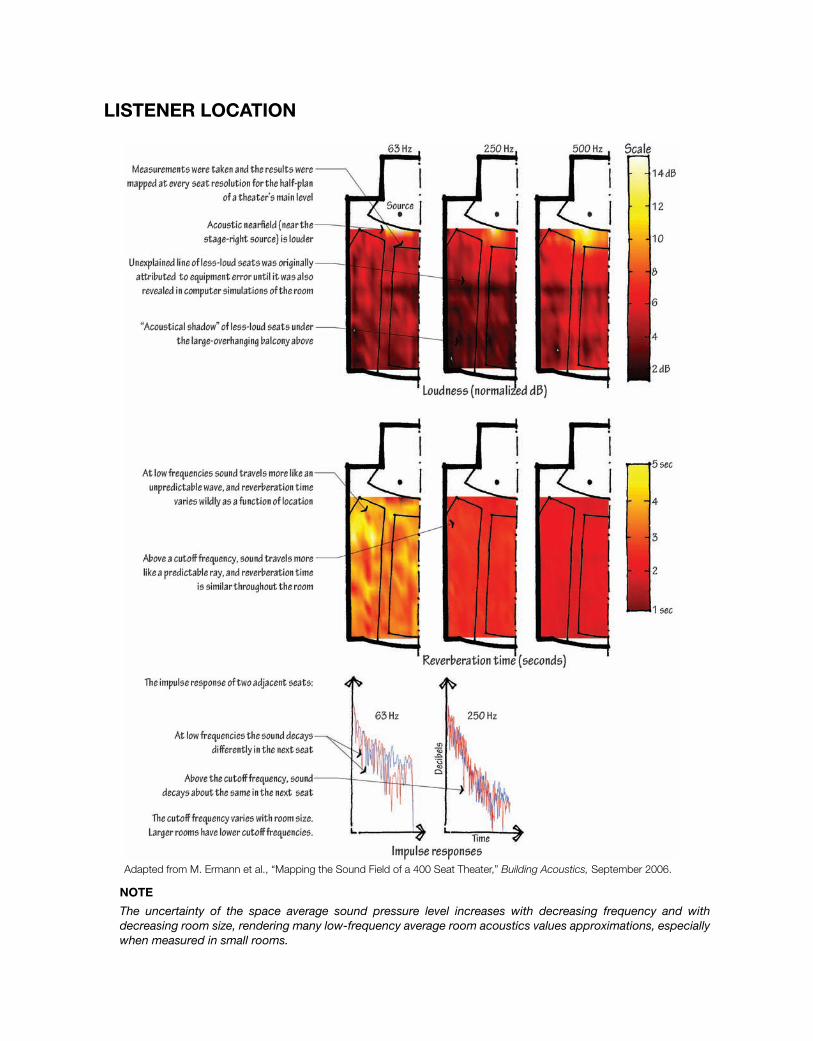
listener loCation
Adapted from M. Ermann et al., “Mapping the Sound Field of a 400 Seat Theater,” Building Acoustics, September 2006.
note
The uncertainty of the space average sound pressure level increases with decreasing frequency and with decreasing room size, rendering many low‐frequency average room acoustics values approximations, especially when measured in small rooms.
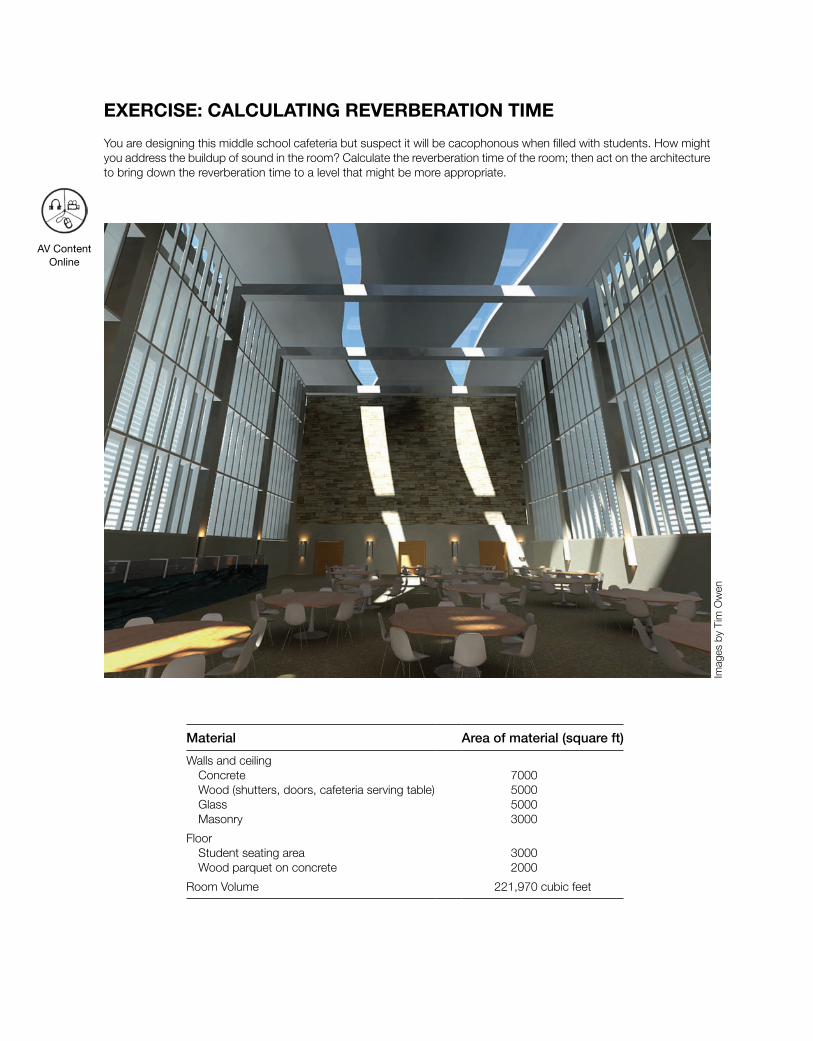
Material Area of material (square ft)
Walls and ceiling Concrete Wood (shutters, doors, cafeteria serving table) Glass Masonry
7000500050003000
Floor Student seating area Wood parquet on concrete
30002000
Room Volume 221,970 cubic feet
exerCise: CalCulating reVerberation time
You are designing this middle school cafeteria but suspect it will be cacophonous when filled with students. How might you address the buildup of sound in the room? Calculate the reverberation time of the room; then act on the architecture to bring down the reverberation time to a level that might be more appropriate.
Imag
es b
y Ti
m O
wen
AV Content Online
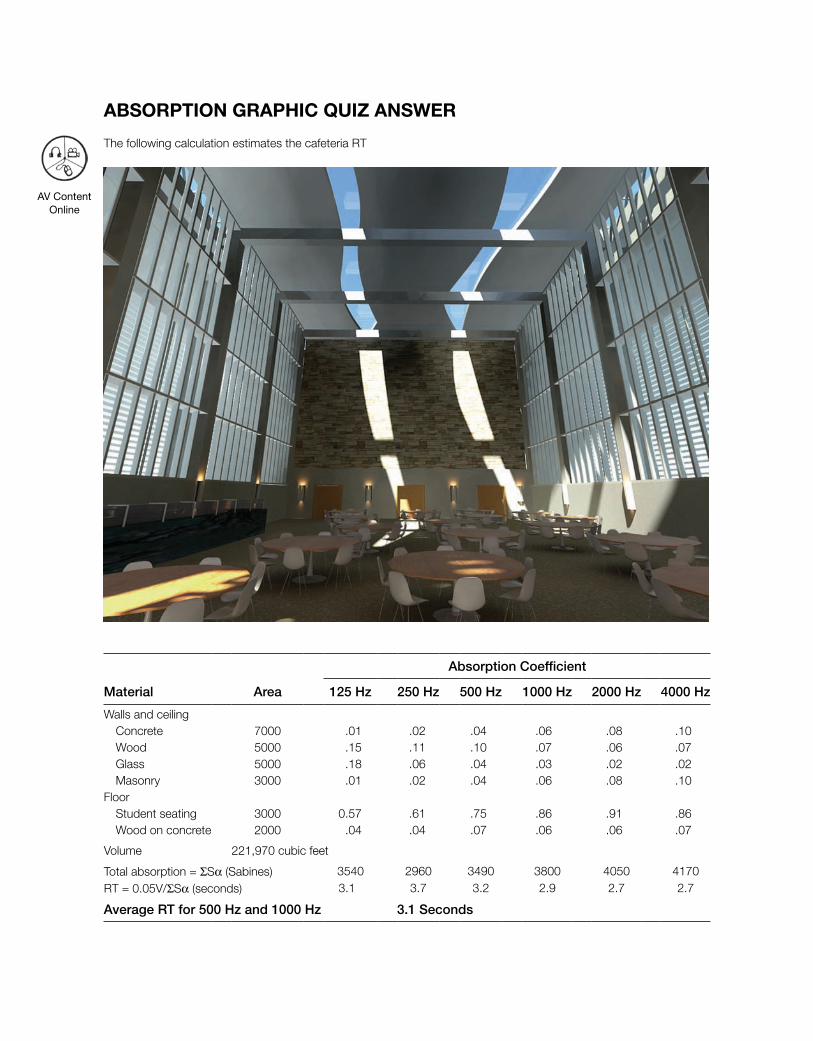
absorption grapHiC Quiz answer
The following calculation estimates the cafeteria RT
Material Area
Absorption Coefficient
125 Hz 250 Hz 500 Hz 1000 Hz 2000 Hz 4000 Hz
Walls and ceiling Concrete 7000 .01 .02 .04 .06 .08 .10 Wood 5000 .15 .11 .10 .07 .06 .07 Glass 5000 .18 .06 .04 .03 .02 .02 Masonry 3000 .01 .02 .04 .06 .08 .10Floor Student seating 3000 0.57 .61 .75 .86 .91 .86 Wood on concrete 2000 .04 .04 .07 .06 .06 .07
Volume 221,970 cubic feet
Total absorption = ΣSα (Sabines) 3540 2960 3490 3800 4050 4170RT = 0.05V/ΣSα (seconds) 3.1 3.7 3.2 2.9 2.7 2.7
Average RT for 500 Hz and 1000 Hz 3.1 Seconds
AV Content Online

The altered design in the next rendering adds sound‐absorbing banners on the ceiling and the opaque walls, addressing the excess reverberation buildup. The following calculation cuts mid‐frequency RT from 3.1 seconds to 1.5 seconds and audibly bolsters speech intelligibility while reducing background noise from other nearby conversations.
Material Area
Absorption Coefficient
125 Hz 250 Hz 500 Hz 1000 Hz 2000 Hz 4000 Hz
Walls and ceiling Banners 7000 .14 .35 .55 .72 .70 .65 Concrete 2000 .01 .02 .04 .06 .08 .10 Wood 5000 .15 .11 .10 .07 .06 .07 Glass 4000 .18 .06 .04 .03 .02 .02 Masonry 1000 .01 .02 .04 .06 .08 .10Floor Student seating 3000 0.57 .61 .75 .86 .91 .86 Wood on concrete 2000 .04 .04 .07 .06 .06 .07
Volume 221,970 cubic feet
Total absorption = ΣSα (Sabines) 4270 5210 7020 8390 8370 8000RT = 0.05V/ΣSα (seconds) 2.6 2.1 1.6 1.3 1.3 1.4
Average RT for 500 Hz and 1000 Hz 1.5 Seconds
AV Content Online
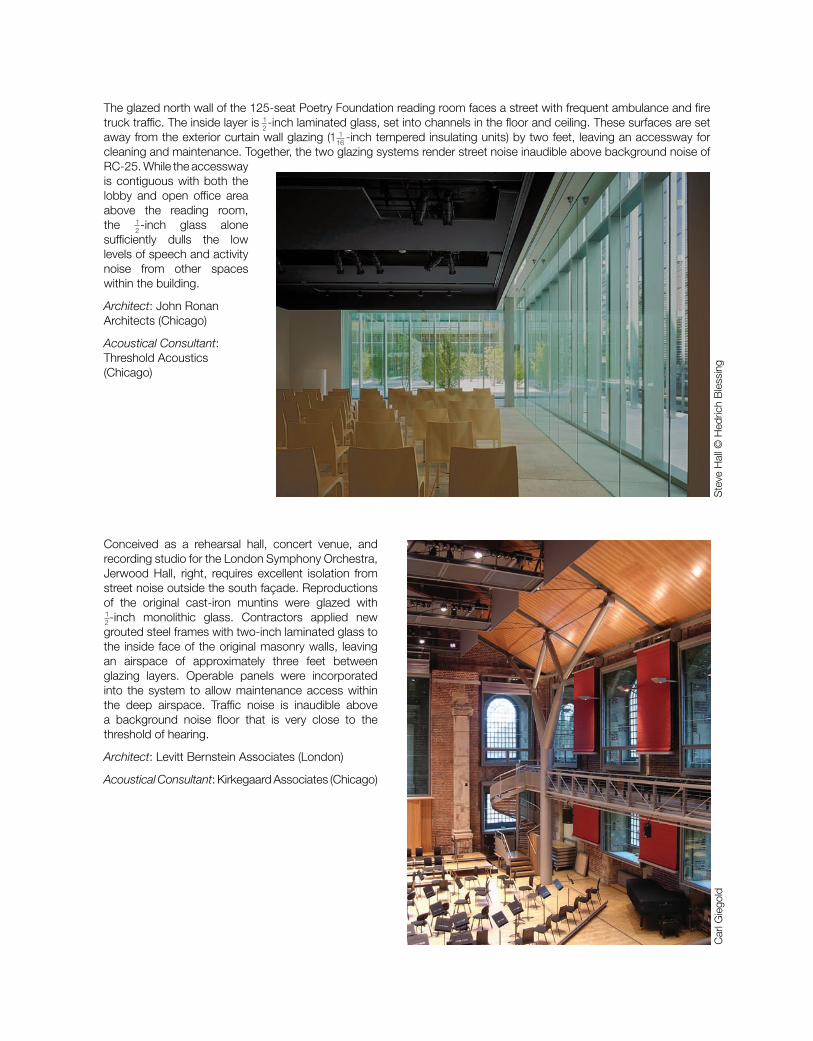
The glazed north wall of the 125‐seat Poetry Foundation reading room faces a street with frequent ambulance and fire truck traffic. The inside layer is 1
2‐inch laminated glass, set into channels in the floor and ceiling. These surfaces are set away from the exterior curtain wall glazing (1 1
16 ‐inch tempered insulating units) by two feet, leaving an accessway for cleaning and maintenance. Together, the two glazing systems render street noise inaudible above background noise of RC‐25. While the accessway is contiguous with both the lobby and open office area above the reading room, the 1
2‐inch glass alone sufficiently dulls the low levels of speech and activity noise from other spaces within the building.
Architect: John Ronan Architects (Chicago)
Acoustical Consultant: Threshold Acoustics (Chicago)
Ste
ve H
all ©
Hed
rich
Ble
ssin
gC
arl G
iego
ld
Conceived as a rehearsal hall, concert venue, and recording studio for the London Symphony Orchestra, Jerwood Hall, right, requires excellent isolation from street noise outside the south façade. Reproductions of the original cast‐iron muntins were glazed with 12‐inch monolithic glass. Contractors applied new grouted steel frames with two‐inch laminated glass to the inside face of the original masonry walls, leaving an airspace of approximately three feet between glazing layers. Operable panels were incorporated into the system to allow maintenance access within the deep airspace. Traffic noise is inaudible above a background noise floor that is very close to the threshold of hearing.
Architect: Levitt Bernstein Associates (London)
Acoustical Consultant: Kirkegaard Associates (Chicago)
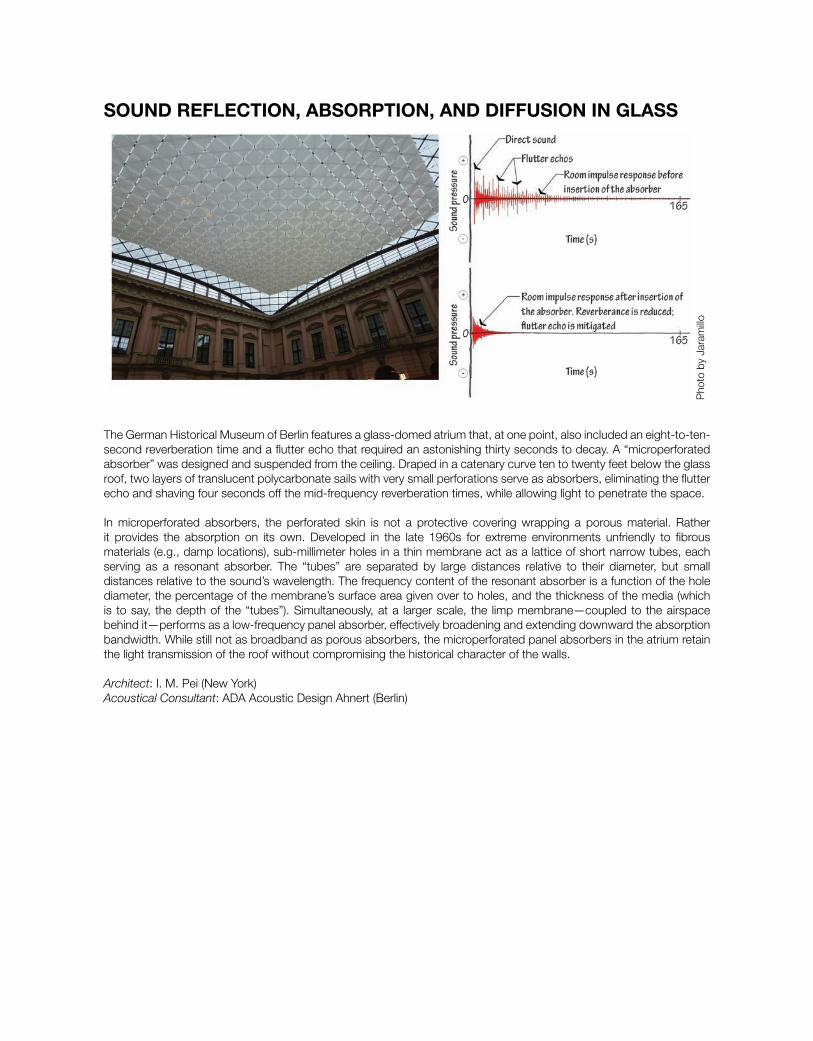
Sound Reflection, AbSoRption, And diffuSion in GlASS
Pho
to b
y Ja
ram
illo
The German Historical Museum of Berlin features a glass‐domed atrium that, at one point, also included an eight‐to‐ten‐second reverberation time and a flutter echo that required an astonishing thirty seconds to decay. A “microperforated absorber” was designed and suspended from the ceiling. Draped in a catenary curve ten to twenty feet below the glass roof, two layers of translucent polycarbonate sails with very small perforations serve as absorbers, eliminating the flutter echo and shaving four seconds off the mid‐frequency reverberation times, while allowing light to penetrate the space.
In microperforated absorbers, the perforated skin is not a protective covering wrapping a porous material. Rather it provides the absorption on its own. Developed in the late 1960s for extreme environments unfriendly to fibrous materials (e.g., damp locations), sub‐millimeter holes in a thin membrane act as a lattice of short narrow tubes, each serving as a resonant absorber. The “tubes” are separated by large distances relative to their diameter, but small distances relative to the sound’s wavelength. The frequency content of the resonant absorber is a function of the hole diameter, the percentage of the membrane’s surface area given over to holes, and the thickness of the media (which is to say, the depth of the “tubes”). Simultaneously, at a larger scale, the limp membrane—coupled to the airspace behind it—performs as a low‐frequency panel absorber, effectively broadening and extending downward the absorption bandwidth. While still not as broadband as porous absorbers, the microperforated panel absorbers in the atrium retain the light transmission of the roof without compromising the historical character of the walls.
Architect: I. M. Pei (New York)Acoustical Consultant: ADA Acoustic Design Ahnert (Berlin)
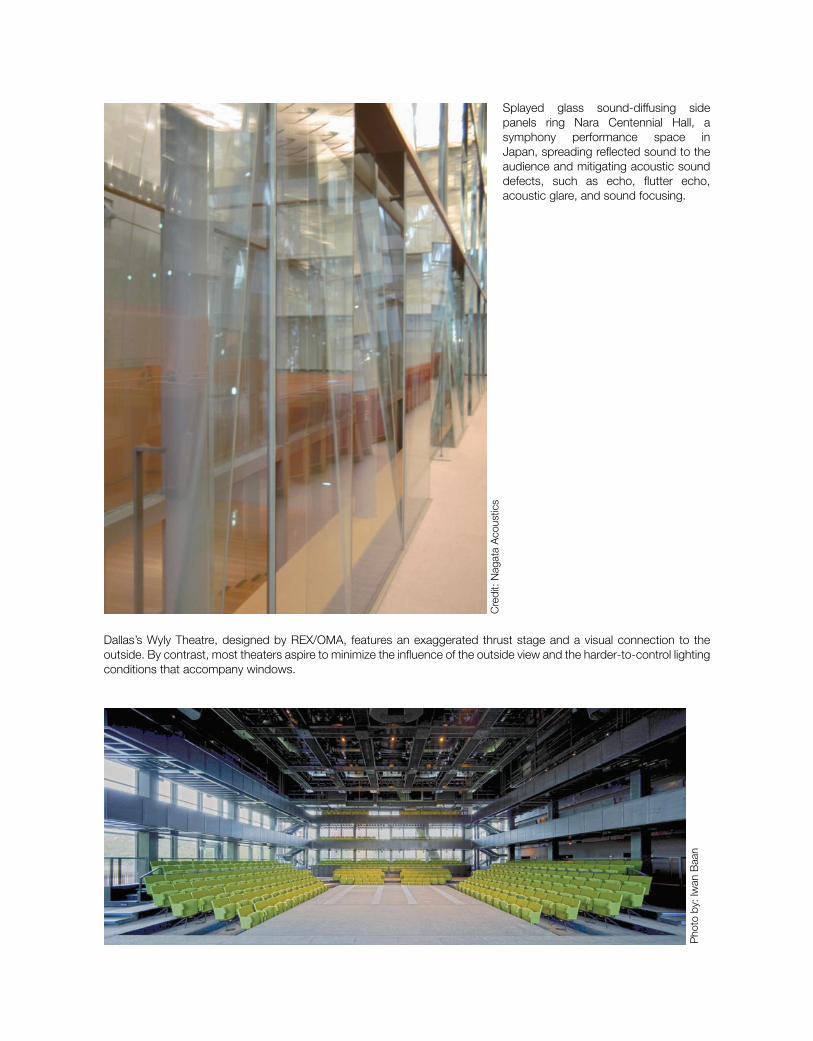
Splayed glass sound‐diffusing side panels ring Nara Centennial Hall, a symphony performance space in Japan, spreading reflected sound to the audience and mitigating acoustic sound defects, such as echo, flutter echo, acoustic glare, and sound focusing.
Cre
dit:
Nag
ata
Aco
ustic
s
Pho
to b
y: Iw
an B
aan
Dallas’s Wyly Theatre, designed by REX/OMA, features an exaggerated thrust stage and a visual connection to the outside. By contrast, most theaters aspire to minimize the influence of the outside view and the harder‐to‐control lighting conditions that accompany windows.

exceSSive loudneSS
Erm
ann
To quiet noisy library reading rooms, designers have long followed the path of physics, allowing sufficient absorption to limit reverberation time and deaden reflected sound. The Boston Public Library Reading Room takes the opposite stance, a deliciously counterintuitive approach deferring to psychoacoustics. The cavernous room volume and hard surfaces amplify talking (and even footsteps), so visitors, hyper‐conscious of the noise they are contributing to the space, take extra caution to hush themselves. On the day this photograph was taken, the room was nearly full but pin‐drop quiet. The click of the camera sounded much too loud and seemed to linger, embarrassing the photographer because some readers turned to see the source of the annoyance.
Imag
e an
d st
udy
by S
ky K
im
MAppinG MechAnicAl SySteM noiSe
This image depicts a noise criteria (NC) map of a single floor of a four‐story university building. Most of the floor area is dedicated to open‐plan architecture design studios. The mechanical system was on, and there was no occupant activity noise. Learning spaces should have background noise levels less than NC‐35. White spaces indicate rooms we could not access.
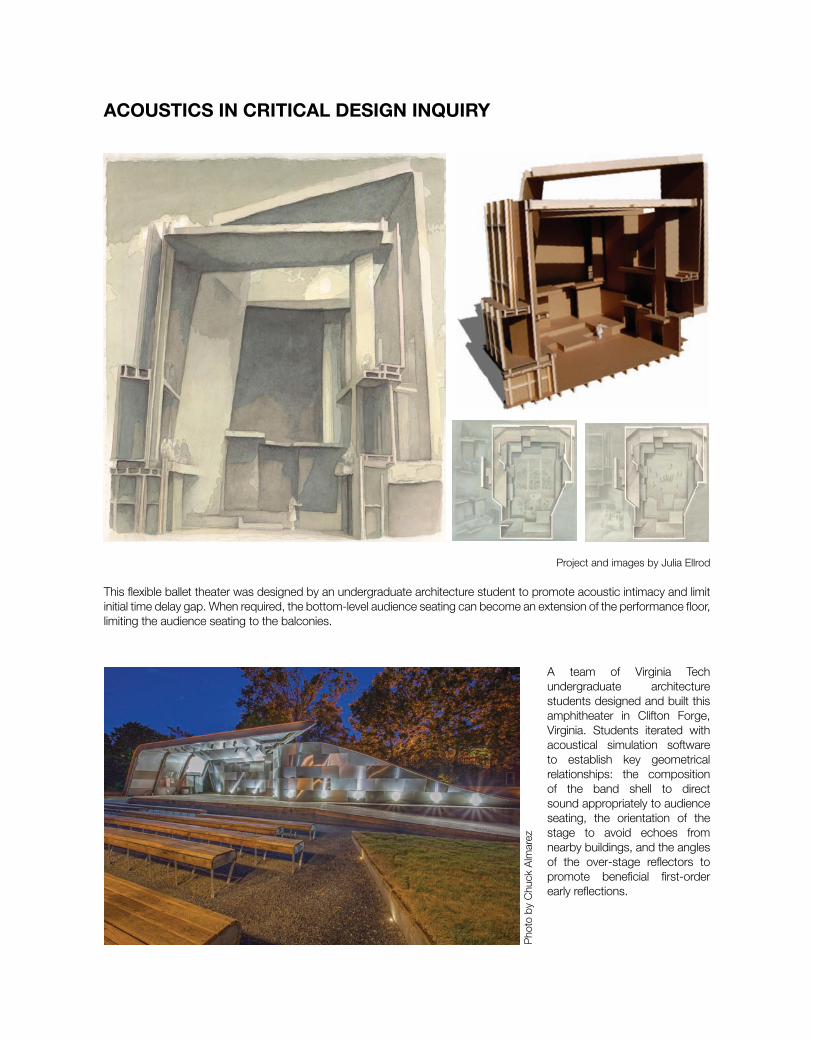
Project and images by Julia Ellrod
This flexible ballet theater was designed by an undergraduate architecture student to promote acoustic intimacy and limit initial time delay gap. When required, the bottom‐level audience seating can become an extension of the performance floor, limiting the audience seating to the balconies.
AcouSticS in cRiticAl deSiGn inquiRy
Pho
to b
y C
huck
Alm
arez
A team of Virginia Tech undergraduate architecture students designed and built this amphitheater in Clifton Forge, Virginia. Students iterated with acoustical simulation software to establish key geometrical relationships: the composition of the band shell to direct sound appropriately to audience seating, the orientation of the stage to avoid echoes from nearby buildings, and the angles of the over‐stage reflectors to promote beneficial first‐order early reflections.
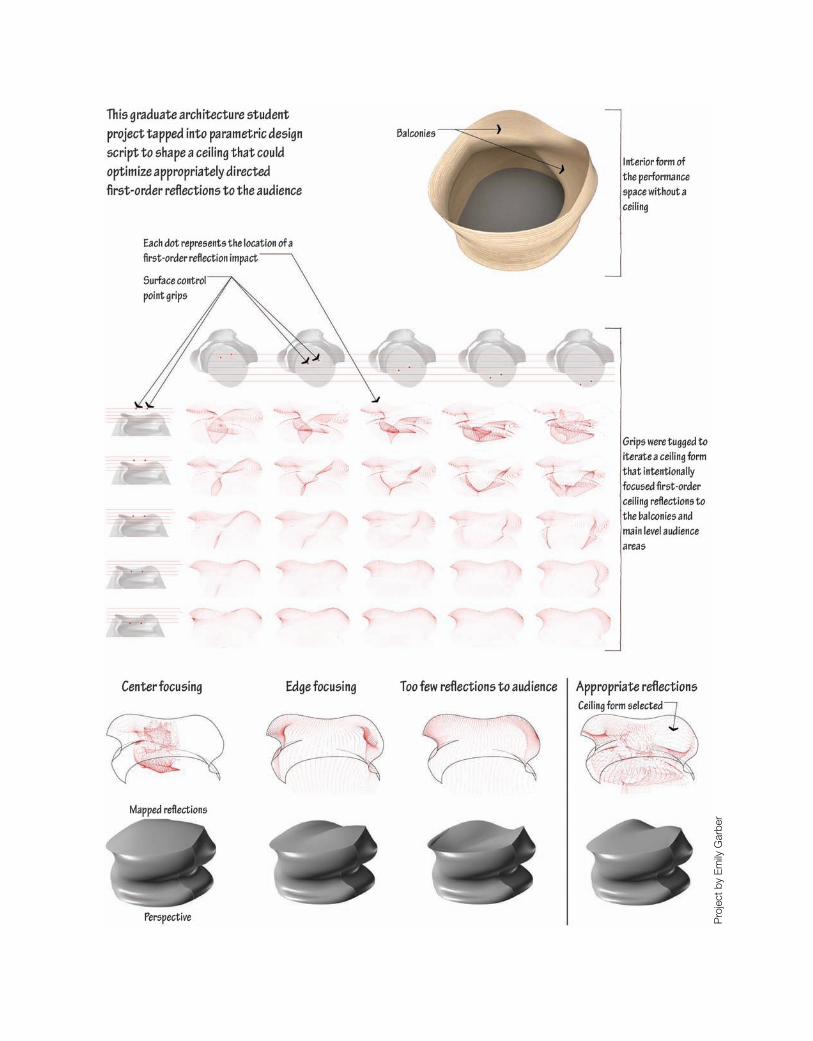
Pro
ject
by
Em
ily G
arbe
r
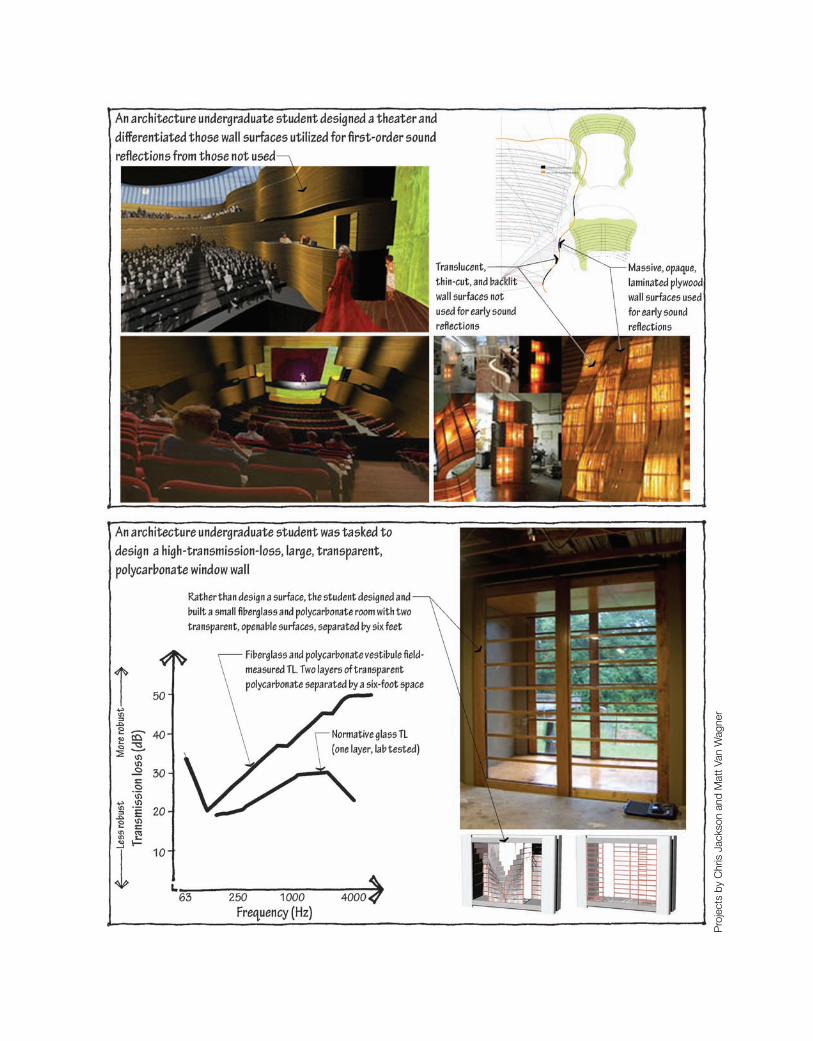
Pro
ject
s by
Chr
is J
acks
on a
nd M
att V
an W
agne
r
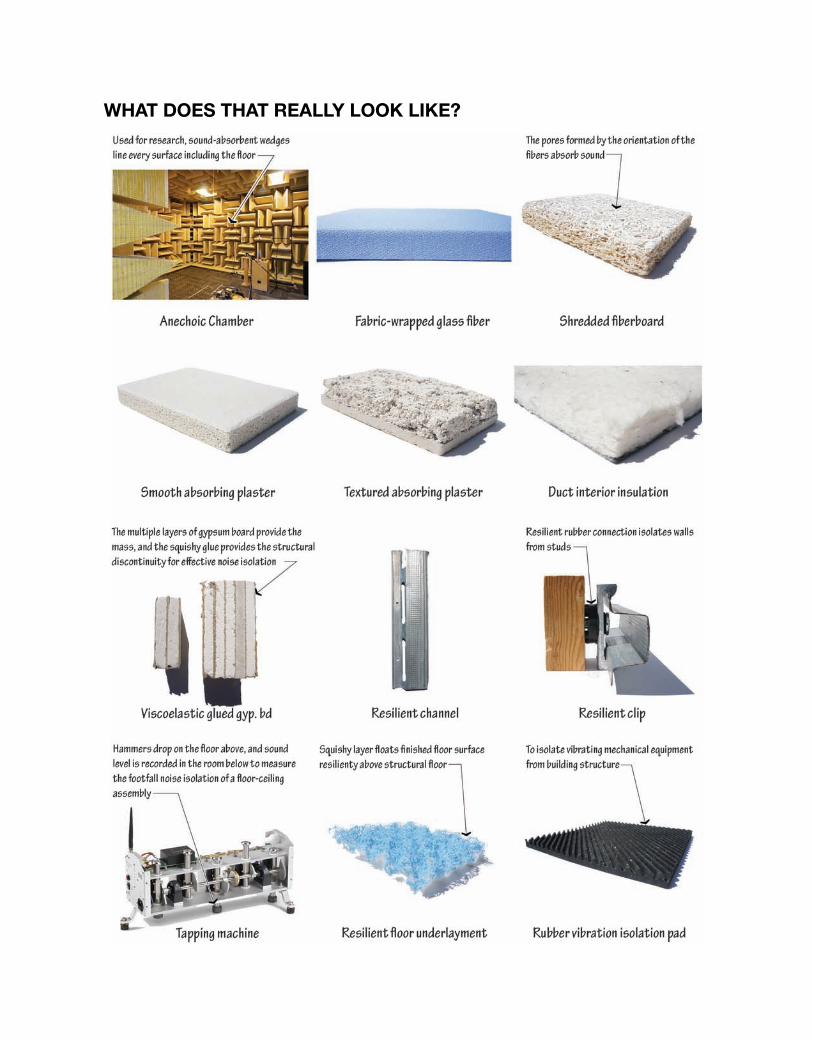
WhAt doeS thAt ReAlly look like?

WILEY END USER LICENSEAGREEMENT
Go to www.wiley.com/go/eula to access Wiley’s ebookEULA.