
eMaintenance - DiVA-Portal
122
eMaintenance Trends in technologies & methodologies, challenges, possibilities and applications May 14-15th, 2019 Stockholm, Sweden Proceedings of the 5 th international workshop and congress on eMaintenace 1
-
Upload
khangminh22 -
Category
Documents
-
view
4 -
download
0
Transcript of eMaintenance - DiVA-Portal

eMaintenance Trends in technologies & methodologies, challenges, possibilities and applications
May 14-15th, 2019
Stockholm, Sweden
Proceedings
of the 5th
international
workshop and
congress on
eMaintenace
1

Decision-maker Decision date Reg no. Unit Comments Page
Double-click for name YYYY-MM-DD LTU-XX-XXXX Double-click for unit Double-click for comments 2 of 2
ISBN: 978-91-7790-475-5 (pdf) Available at http://ltu.diva-portal.org
SE-971 87 Luleå, Sweden Phone +46 920 49 10 00
www.ltu.se
2

Honorary Chair
Prof. Uday Kumar Lulea University of Technology
Conference Chair
Prof. Ramin Karim Lulea University of Technology
Scientific Committee
Prof. Alireza Ahmadi Lulea University of TechnologyProf. Javad Barabady Tromso UniversityProf. Raj Bkn Rao COMADEM InternationalDr. Olov Candell Saab TechnologiesAssoc. Prof. Miguel Castano Arranz Lulea University of TechnologyProf. Gopi Chattopadhyay Federation UniversityProf. Jose Torres Farhina University of CoimbraProf. Diego Galar Lulea University of TechnologyAdj. Prof. Kai Goebel PARCProf. Katja Gutsche University Ruhr WestProf. Stephan Heyns University of PretoriaProf. Benoit Iung University of LorraineDr. Erkki Jantunen VTTProf. Mirka Kans Linneaus UniversityProf. Ramin Karim Lulea University of TechnologyProf. Uday Kumar Lulea University of TechnologyProf. Jay Lee University of CincinnatiProf. Marco Macchi Politico di MilanoProf. Tore Markeset University of StavangerProf. Antonio J. Marques Cardoso University of Beira InteriorProf. David Mba De Montfort UniversityProf. Anita Mirijamdotter Linnea UniversityProf. Rakesh Mishra Huddersfield UniversityProf. Aditya Parida Lulea University of TechnologyDr. Seppo Saari Lapland UASAdj. Prof. Abhinav Saxena General ElectricProf. Jyoti Sinha University of ManchesterProf. Peter Soderholm Swedish Transport AdministrationAssoc. Prof. Phillip Tretten Lulea University of TechnologyProf. Berna Ulutas Eskisehir Osmangazi UniversityProf. Lihui Wang KTH
3

Organization Committee
Assoc. Prof. Miguel Castano Arranz Lulea University of TechnologyCecilia Glover Lulea University of TechnologyVeronica Jagare Lulea University of TechnologyAlexandra Lund Cipolla Lulea University of Technology
Editorial Committee
Assoc. Prof. Miguel Castano Arranz Lulea University of TechnologyProf. Ramin Karim Lulea University of Technology
4
Author Index
Ahmadi, Alireza 63Asber, Johnny 104Asim, Taimoor 16, 33
Baker, Paul 33Bergquist, Bjarne 9
Castano Arranz, Miguel 108, 109Castano, Miguel 57Chattopadhyay, Gopinath 74, 81Chowdhury, Soumitra 95Chundhoo, Vickram 81
Droll, Carsten 51
Famurewa, Stephen 110Farinha, Jose Torres 57Fonseca, Inacio 57
Granstrom, Rikard 43Gutsche, Katja 51
Haddadzade, Mohammad 63Haftor, Darek 95
Illankoon, Prasanna 88
Juntti, Ulla 1Jagare, Veronica 1
Kaesemann, Felix 51Kans, Mirka 68Karim, Ramin 1, 20, 28, 109Kauppila, Osmo 9Khajehei, Hamid 63Koristka, Kevin 51Kour, Ravdeep 20, 28Kumar, Uday 74
Lundkvist, Peder 43
5

Mishra, Rakesh 16, 33
Najeh, Taoufik 37Nissen, Arne 63, 110
Olsson. Ella 111
Parida, Aditya 74, 81Pashkevich, Natallia 95
Rantatalo, Matti 37
Singh, Sarbjeet 28, 88Soleimanmeigouni, Iman 63Soderholm, Peter 9, 43
Thaduri, Adithya 20Thiery, Florian 37Tomas, Diogo 57Tretten, Phillip 28, 88
Ubbi, Kuldip 16, 33
Vanhatalo, Erik 9
Zala, Karina 33
6

Keyword Index
Artificial Intelligence 108Artificial Neural Network 63Asset Management (AM) 74
Business Intelligence 110
Capital Investments (CI) 74Centrifugal Compressor 33Challenges and Opportunities in the Digital Era 68Clustering 37CMMS 57Computational Fluid Dynamics (CFD) 16, 33Continuous Dependability Improvement 43Cross-organization Maintenance 1Cyber Kill Chain 20cyber-attack 20Cybersecurity 28
Data Analysis and Visualisation 110Data Cleaning 9Data Governance 1Data management 9Data preparation 9Dataset Augmentation 109Deasurement Wagon Data 9Decision Support 88, 110Deep Learning 109Degradation 63Design Approach 51Design of Experiments 43Digital Twin 104Digitalization 43, 68, 95Dynamic Maintenance Programme 43Asset Management by eMaintenance (EAM) 57eMaintenance 1, 57, 108, 104 109
Fault Detection 37Feature Engineering 108Flight Maintenance 88
Genetic Algorithms 37
7

Human-machine Interaction 88
Industry 4.0 68, 104Information Application 51Interoperability 57Interview Study in Maintenance 68IT-productivity 95
Logistics 95
Maintenance 1Maintenance Decision Support 1Maintenance Device 16Maintenance Support 51Maturity Level Indicator 28Mixed Reality 51
Open Software Architecture for CBM (OSA-CBM) 57Overall Equipment Effectiveness 81
Performance Monitoring and Improvement 110Pipe Bends 16Prediction 63Pressure Drop 16Principal Component Analysis (PCA) 63
Q-criteria 16
Railway 1, 28Railway Defender’s Kill Chain 20Railway Infrastructure 43Railway System 20Railway Turnout 110Reliability Centred Maintenance 81Remote Performance Monitoring (RPM) 74Risk Analysis 43Risk Based Inspections (RBI) 74Risk Based Maintenance 81Road Freight Transportation 95Rolling Element Bearing 37
Self-developed Maintenance Teams 104Self-developed Products 104Swedish Maintenance Ecosystem 43, 68
Total Productive Maintenance 81
8

Track Geometry 63Transfer Learning 109Turbocharger 33
Unsupervised Learning 37
Vibration Analysis 37Volute 33
Workforce 28
9
Table of Contents
Full papers (peer reviewed)
Governance of digital data sharing in a cross-organisational railwaymaintenance context 1Veronica Jagare, Ulla Juntti and Ramin Karim . . . . . . . . . . . . .
Cleansing Railway Track Measurement Data for Better Mainte-nance Decisions 9Bjarne Bergquist, Peter Soderholm, Osmo Kauppila and Erik Vanhatalo
Effects of a Freely Moving Maintenance Device on the Hydrody-namic Characteristics of Pipe Bends 16Taimoor Asim, Rakesh Mishra and Kuldip Ubbi . . . . . . . . . . . .
Railway Defender Kill Chain for Cybersecurity 20Ravdeep Kour, Adithya Thaduri and Ramin Karim . . . . . . . . . . .
Cybersecurity Workforce in Railway: A Case study 28Ravdeep Kour, Phillip Tretten, Ramin Karim and Sarbjeet Singh . . .
Comparison of operational effectiveness of a turbocharger volute 33Karina Zala, Taimoor Asim, Paul Baker, Kuldip Ubbi and Rakesh
Mishra . . . . . . . . . . . . . . . . . . . . . . . . . . . . . . . . .
Evaluation of clustering algorithms and feature selection for bear-ing fault detection in pulp and paper machines 37Florian Thiery, Matti Rantatalo and Taoufik Najeh . . . . . . . . . . .
Systematic dependability improvements by implementation of newtechnologies and regulations in railway infrastructure mainte-nance 43Rikard Granstrom, Peter Soderholm and Peder Lundkvist . . . . . . .
Mixed Reality within Maintenance Support Services – a user-centered design approach 51Carsten Droll, Katja Gutsche, Kevin Koristka and Felix Kaesemann .
Online Sensor and Industrial Systems Connecting Approach – AGlobal Review 57Diogo Tomas, Jose Torres Farinha, Inacio Fonseca and Miguel Castano
Arranz . . . . . . . . . . . . . . . . . . . . . . . . . . . . . . . . .
10
Application of principal component analysis and artificial neuralnetwork in prediction of track geometry degradation 63Hamid Khajehei, Alireza Ahmadi, Iman Soleimanmeigouni, Moham-
mad Haddadzade and Arne Nissen . . . . . . . . . . . . . . . . .
Maintenance in the digital era - an interview study of challengesand opportunities within the Swedish maintenance ecosystem 68Mirka Kans . . . . . . . . . . . . . . . . . . . . . . . . . . . . . . . . .
Remote asset management for reducing life cycle costs (LCC),risks and enhancing asset performance 74Gopinath Chattopadhyay, Aditya Parida and Uday Kumar . . . . . .
Productivity improvement though OEE measurement: A TPMcase study for meat processing plant in Australia 81Vickram Chundhoo, Gopinath Chattopadhyay and Aditya Parida . . .
Decision Support System for Flight Maintenance Technicians: Is-sues and Challenges 88Prasanna Illankoon, Phillip Tretten and Sarbjeet Singh . . . . . . . .
IT-productivity in the Operations and Maintenance of Road FreightTransportation and Logistics: Insights from the Past Decades 95Natallia Pashkevich, Soumitra Chowdhury and Darek Haftor . . . . .
Papers in poster presentation (no peer reviewed)
Data Connectivity Challenges In E-Maintenance 104Johnny Asber,Miguel Castano Arranz . . . . . . . . . . . . . . . . . .
Abstracts
Feature Extraction for eMaintenance of Runestones 108Miguel Castano Arranz . . . . . . . . . . . . . . . . . . . . . . . . . .
Recent advances in Convolutional Neural Networks and open op-portunities in eMainteance 109Miguel Castano Arranz and Ramin Karim . . . . . . . . . . . . . . . .
Implementation of business intelligence tool for railway turnoutperformance monitoring and improvement 110Stephen Famurewa and Arne Nissen . . . . . . . . . . . . . . . . . . .
Enterprise Modeling for Dynamic Matching of Tactical Needs andAircraft Maintenance Capabilities 111Ella Olsson . . . . . . . . . . . . . . . . . . . . . . . . . . . . . . . . .
11

Governance of digital data sharing in a cross-
organisational railway maintenance contextVeronica Jägare
Luleå University of Technology 971 87 Luleå
Sweden +46-0920 49 1629
Ulla Juntti Omicold AB
Maskinvägen 22 972 54 Luleå
+46-705 26 5035
Ramin Karim Luleå University of Technology
971 87 Luleå Sweden
+46-920 49 2344
ABSTRACT
The purpose of this paper is to study and explore the essential
aspects of data governance in eMaintenance that need to be
considered such as data sharing and data ownership in a cross-
organisational railway maintenance context. Furthermore, the
paper develops and provides an approach to strategies and
guidelines, which can be used to govern digital data sharing.
To fulfil this purpose, case studies of several projects where
sharing of data between stakeholders in order to develop
maintenance decision support, was selected as a research strategy
and supported by a literature study. Empirical data were collected
through interviews, workshops, document studies, and
observations. An approach was developed and validated using a
case study.
The proposed approach supports the understanding and
establishing strategies and guidelines for data governance in a
cross-organisational railway context. This can be considered as
one of the enablers for information logistics for maintenance
purposes where the approach can be used as a support tool in
order to facilitate the development of maintenance decision
support within the railway industry.
Keywords
Data governance, cross-organisation, maintenance, maintenance
decision support, railway, eMaintenance.
1. INTRODUCTION Organisations maintaining railway infrastructure require routine
monitoring and inspection of track condition [1]. Existing sensor
technology can replace manual measurements in many cases. The
sensor data can be used for e.g detection, localisation and cause
identification of anomalies. Coupled with advanced analytical
capability based on Artificial Intelligence (AI), deep learning,
machine learning, sensor systems can provide maintenance
stakeholders with valuable insights into the health of the railway
system, including infrastructure and the rolling stock.
In the railway industry, large amounts of condition monitoring
data is being stored, but most of the information never finds its
way to the maintenance decision process [2].
Useful information for prognostics is often never used and hence
the development of the predictive capability has been on a more
moderate level [3]. This allows for the increased possibilities of
analysing big data sets and develop diagnostic and prognostic
approach for the railway industry [4]-[7].
Various types of data is needed in order to enable context- and
condition-based maintenance. The stakeholders have different
requirements for collecting data for maintenance decision support.
The infrastructure manager needs information about how the track
is operated in terms of amount of trains and axles, train speed and
actual axle load, vehicle characteristics, but also data about asset
condition and the degradation rate. The traffic operator needs
condition monitoring information, e.g. trend data for wheel
degradation. The maintenance contractor need data on asset
condition, amount of traffic, type of vehicles, amount of train
kilometres and the supplier wants to know where the
asset/component is installed, how it is used and what kind of
failures that has occurred [8].
The ePilot is a development and implementation project aimed at
improving railway maintenance [9]. The objective of the project is
to test and implement eMaintenance solutions and support the
development of decision support to enable context- and condition-
based maintenance. eMaintenance is considered to be the
integration of all necessary ICT-based tools for the optimisation
of costs and improvement of productivity through utilisation of
web services [10]. The project is based on industry collaboration
between infrastructure managers, operators, maintenance
entrepreneurs, maintenance workshops, suppliers, innovators and
Luleå Railway Research Center (JVTC) at Luleå University of
Technology. ePilot provides a collaboration platform for testing
innovations and development of new solutions for maintenance
decision support. The solutions are based on needs and
requirements from various stakeholders in order to enable and
transform the maintenance of the Swedish fragmented rail
industry to an integrated digitalised system. Additional project
objectives are to; create an industry-wide process-oriented
approach and create an industry-wide service-oriented IT
infrastructure that provides decision support based on condition
data.
In the ePilot, a platform for decision making in maintenance has
been developed which provides a cloud based, one-stop-shop for
data collection and analysis, which aids research projects and
maintenance practices.
The platform called Testbed Railway, includes: 1) A process for
gathering information about remaining useful life, dynamic
maintenance program, performance measurements, maintenance
support and planning; 2) Services, such as, wheel query, force 1
data analysis, context adaption and data fusion; 3) Data collected
from mobile sensors and way-side monitoring equipment; 4)
Measurement data of track quality, failure statistics and inspection
data.
During the course of the project, a number of challenges related to
data sharing between stakeholders have been identified, which led
to uncertainty among the parties regarding data collection and
ownership. It has also emerged that there is no common
nomenclature to describe different types of data in the flow from
data to decision to use in a cross-organisational project where data
sharing is necessary.
This paper aims is to answer the research question; which
essential aspects of governance need to be considered regarding
data sharing between cross-organisational stakeholders in a
railway maintenance context?
The goal is to identify aspects to consider in guidelines for
common rules for cross-organisational data sharing in
collaboration projects. Consequences for deviations from agreed
guidelines will be discussed. The proposed approach explains
governance aspects for cross-organisational data sharing between
stakeholders in a railway maintenance context, a prerequisite for
enabling predictive and prescriptive maintenance.
This paper contributes to a more effective collaboration that
enables the implementation of innovations that requires data from
several stakeholders, by identifying aspects to consider agreed and
common guidelines for digitalised railway maintenance in
collaboration projects.
2. LITTERATURE REVIEW Lotfi [11] defines information sharing as “distributing useful
information for systems, people or organisational units” and states
that organisations must answer four questions to get the desired
value from information sharing; when to share, with whom, how
to share and what to share. Data Governance means “the exercise
of decision-making and authority for data-related matters.” More
specifically, Data Governance is “a system of decision rights and
accountabilities for information-related processes, executed
according to agreed-upon models which describe who can take
what actions with what information, and when, under what
circumstances, using what methods.” [12] Organisations need to
move from informal governance to formal data governance when
certain situations e.g. the organisation gets so large that traditional
management is not able to address data-related cross-functional
activities and regulation, compliance, or contractual requirements
call for formal data governance.
The EU 2011 white paper ‘Roadmap to a single European
transport area’ [13] identifies a number of required initiatives that
will depend on greater data exchange, such as smart ticketing and
integrated management of freight corridors. The white paper also
identifies integrated information systems and interoperability as
key areas for future innovation. The effective exchange and
integration of data is, however, a significant challenge. The
Swedish government's strategy for a digital collaborative
administration [14] from 2012 describes the government's
objectives for efforts to strengthen the ability of government
authorities to interact digitally with governance-common IT
issues. The strategy is built around three goals - easier, more
transparent and efficient - and nine sub-goals, for example, a more
open management that supports innovation and participation, and
makes it easier to find and use open data. The Swedish framework
for digital collaboration [15] is based on the new version of the
EIF (European Interoperability Framework). By developing,
based on common principles, we can more easily exchange
information with each other and reuse solutions and in the long
run it becomes more cost-effective. The framework is developed
by eSam in a broad collaboration to be able to be used by the
entire public sector and concerns the entire organisation, i.e.
architecture, law, security, activities etc. The framework consists
of 13 principles and 41 recommendations. The recommendations
provide guidance from different perspectives on digitisation (law,
digital meeting, business, information and data, technology,
security and integrity, governance and management). Data-driven
innovation means that public authorities provides the right
conditions for the business community to be able to carry out
innovative and value-creating work, based on digital information
and digital services from the public sector. Data-driven innovation
requires that public actors make information and data available,
open APIs for external parties, as well as regulations and
algorithms. The increased access to information creates new
opportunities to, with current and qualitative information as a
basis, create new insights and make the right decisions. Analysis
and decision support provides better conditions for organisations
to understand their activities, and corporate actions and needs.
Information is a basic building block in an organisation, in the
same way as employees, premises and equipment.
Railway networks comprise a large number of information
systems, many of which are implemented by different stakeholders
according to different design requirements, and in different ways.
Owing to the safety-critical nature of these systems, data is rarely
shared across boundaries, and the potential for re-use of
information is lost. Tutcher et.al. [16] examine the aspects of data
re-use likely to benefit the industry, and describes a railway
condition monitoring ontology that is being designed in
conjunction with several industrial stakeholders to improve
operational efficiency. In the rail industry, the exchange of data
across system and organisational boundaries is an essential step in
the delivery of advances such as intelligent infrastructure, real-
time capacity management and greater interoperability between
stakeholders. The industry, however, faces a serious challenge in
the form of siloed, legacy ICT systems based around different
technologies and data formats. Golightly et.al [17] presents an
evidence-based top-down map of the diverse range of scenarios in
which wider data exchange, facilitated by a common data
framework, could provide value to the industry. Golightly
describes in a scenario analysis barriers such as: 1) Commercial
sensitivity and value: In the absence of knowing exactly what data
was worth or whether it really was sensitive, an organisation is
likely to adopt the most conservative case and restrict access; 2)
Data ownership: clarification as to whom owned the data in
certain circumstances. 3) IT competence: Getting data to the right
people at the right time was only part of the solution. Whether
people could understand that data and embrace it was another
matter; 4) Data exchange is impeded (technically and in business
case) by the structure of the industry; 5) Requires government
direction; 6) Lack of flexibility on the part of stakeholders; 7)
Requires contractual agreement; 8) Fragmentation within the rail
industry; and 9) Data not available or in enough detail. The study
by Backmyr et.al [18] explores the current barriers to effective 2
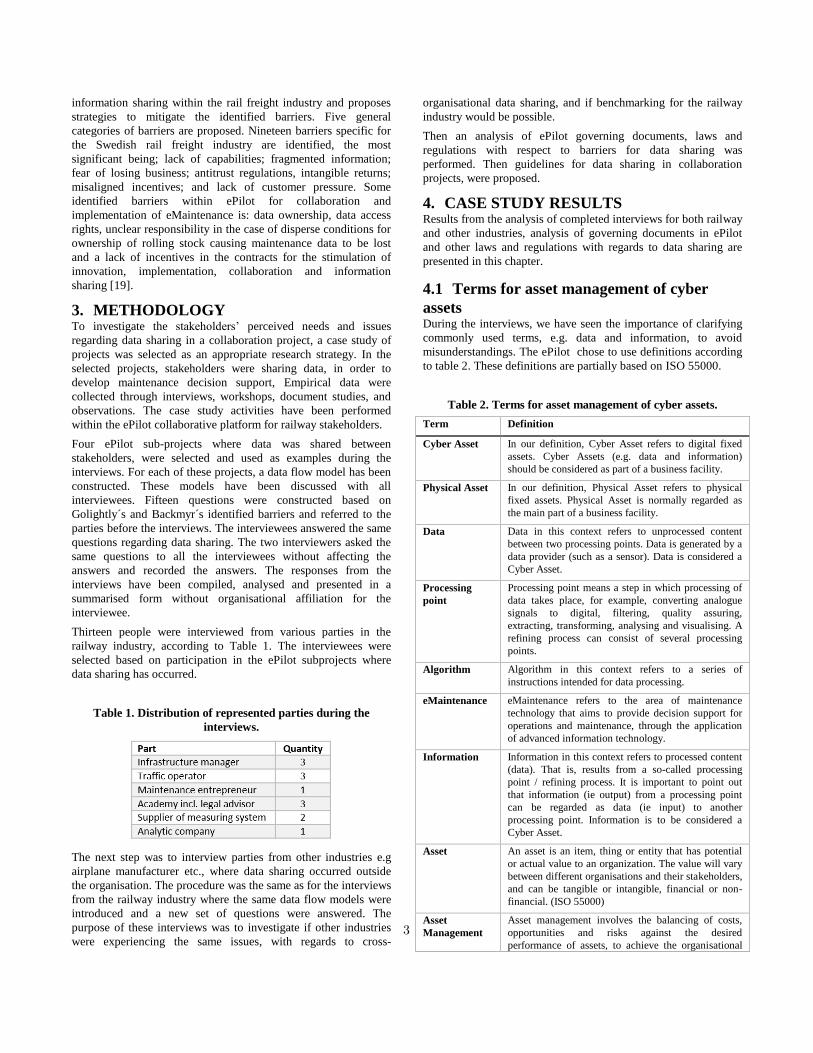
information sharing within the rail freight industry and proposes
strategies to mitigate the identified barriers. Five general
categories of barriers are proposed. Nineteen barriers specific for
the Swedish rail freight industry are identified, the most
significant being; lack of capabilities; fragmented information;
fear of losing business; antitrust regulations, intangible returns;
misaligned incentives; and lack of customer pressure. Some
identified barriers within ePilot for collaboration and
implementation of eMaintenance is: data ownership, data access
rights, unclear responsibility in the case of disperse conditions for
ownership of rolling stock causing maintenance data to be lost
and a lack of incentives in the contracts for the stimulation of
innovation, implementation, collaboration and information
sharing [19].
3. METHODOLOGY To investigate the stakeholders’ perceived needs and issues
regarding data sharing in a collaboration project, a case study of
projects was selected as an appropriate research strategy. In the
selected projects, stakeholders were sharing data, in order to
develop maintenance decision support, Empirical data were
collected through interviews, workshops, document studies, and
observations. The case study activities have been performed
within the ePilot collaborative platform for railway stakeholders.
Four ePilot sub-projects where data was shared between
stakeholders, were selected and used as examples during the
interviews. For each of these projects, a data flow model has been
constructed. These models have been discussed with all
interviewees. Fifteen questions were constructed based on
Golightly´s and Backmyr´s identified barriers and referred to the
parties before the interviews. The interviewees answered the same
questions regarding data sharing. The two interviewers asked the
same questions to all the interviewees without affecting the
answers and recorded the answers. The responses from the
interviews have been compiled, analysed and presented in a
summarised form without organisational affiliation for the
interviewee.
Thirteen people were interviewed from various parties in the
railway industry, according to Table 1. The interviewees were
selected based on participation in the ePilot subprojects where
data sharing has occurred.
Table 1. Distribution of represented parties during the
interviews.
The next step was to interview parties from other industries e.g
airplane manufacturer etc., where data sharing occurred outside
the organisation. The procedure was the same as for the interviews
from the railway industry where the same data flow models were
introduced and a new set of questions were answered. The
purpose of these interviews was to investigate if other industries
were experiencing the same issues, with regards to cross-
organisational data sharing, and if benchmarking for the railway
industry would be possible.
Then an analysis of ePilot governing documents, laws and
regulations with respect to barriers for data sharing was
performed. Then guidelines for data sharing in collaboration
projects, were proposed.
4. CASE STUDY RESULTS Results from the analysis of completed interviews for both railway
and other industries, analysis of governing documents in ePilot
and other laws and regulations with regards to data sharing are
presented in this chapter.
4.1 Terms for asset management of cyber
assets During the interviews, we have seen the importance of clarifying
commonly used terms, e.g. data and information, to avoid
misunderstandings. The ePilot chose to use definitions according
to table 2. These definitions are partially based on ISO 55000.
Table 2. Terms for asset management of cyber assets.
Term Definition
Cyber Asset In our definition, Cyber Asset refers to digital fixed
assets. Cyber Assets (e.g. data and information)
should be considered as part of a business facility.
Physical Asset In our definition, Physical Asset refers to physical
fixed assets. Physical Asset is normally regarded as
the main part of a business facility.
Data Data in this context refers to unprocessed content
between two processing points. Data is generated by a
data provider (such as a sensor). Data is considered a
Cyber Asset.
Processing
point
Processing point means a step in which processing of
data takes place, for example, converting analogue
signals to digital, filtering, quality assuring,
extracting, transforming, analysing and visualising. A
refining process can consist of several processing
points.
Algorithm Algorithm in this context refers to a series of
instructions intended for data processing.
eMaintenance eMaintenance refers to the area of maintenance
technology that aims to provide decision support for
operations and maintenance, through the application
of advanced information technology.
Information Information in this context refers to processed content
(data). That is, results from a so-called processing
point / refining process. It is important to point out
that information (ie output) from a processing point
can be regarded as data (ie input) to another
processing point. Information is to be considered a
Cyber Asset.
Asset An asset is an item, thing or entity that has potential
or actual value to an organization. The value will vary
between different organisations and their stakeholders,
and can be tangible or intangible, financial or non-
financial. (ISO 55000)
Asset
Management
Asset management involves the balancing of costs,
opportunities and risks against the desired
performance of assets, to achieve the organisational
3
objectives. The balancing might need to be considered
over different timeframes. Asset management enables
an organisation to examine the need for, and
performance of, assets and asset systems at different
levels. Additionally, it enables the application of
analytical approaches towards managing an asset over
the different stages of its lifecycle. (ISO 55000)
Asset owner
(Cyber Asset
and Physical
Asset)
Asset owner refers to the organisation / party that has
the right of decision over the management of an asset
throughout its life cycle.
Asset User
(Cyber Asset
and Physical
Asset)
Asset user refers to the organisation / party that has
the right to use an asset (cyber or physical) during the
entire contract period and according to agreed terms.
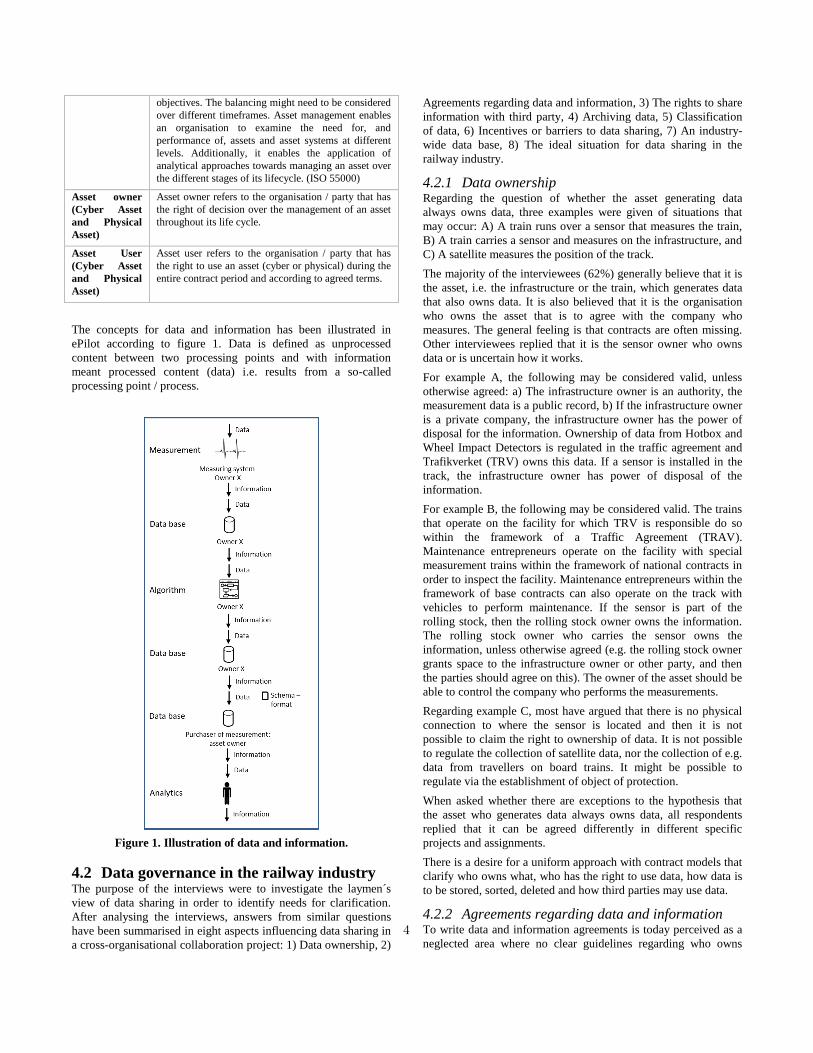
The concepts for data and information has been illustrated in
ePilot according to figure 1. Data is defined as unprocessed
content between two processing points and with information
meant processed content (data) i.e. results from a so-called
processing point / process.
Figure 1. Illustration of data and information.
4.2 Data governance in the railway industry The purpose of the interviews were to investigate the laymen´s
view of data sharing in order to identify needs for clarification.
After analysing the interviews, answers from similar questions
have been summarised in eight aspects influencing data sharing in
a cross-organisational collaboration project: 1) Data ownership, 2)
Agreements regarding data and information, 3) The rights to share
information with third party, 4) Archiving data, 5) Classification
of data, 6) Incentives or barriers to data sharing, 7) An industry-
wide data base, 8) The ideal situation for data sharing in the
railway industry.
4.2.1 Data ownership Regarding the question of whether the asset generating data
always owns data, three examples were given of situations that
may occur: A) A train runs over a sensor that measures the train,
B) A train carries a sensor and measures on the infrastructure, and
C) A satellite measures the position of the track.
The majority of the interviewees (62%) generally believe that it is
the asset, i.e. the infrastructure or the train, which generates data
that also owns data. It is also believed that it is the organisation
who owns the asset that is to agree with the company who
measures. The general feeling is that contracts are often missing.
Other interviewees replied that it is the sensor owner who owns
data or is uncertain how it works.
For example A, the following may be considered valid, unless
otherwise agreed: a) The infrastructure owner is an authority, the
measurement data is a public record, b) If the infrastructure owner
is a private company, the infrastructure owner has the power of
disposal for the information. Ownership of data from Hotbox and
Wheel Impact Detectors is regulated in the traffic agreement and
Trafikverket (TRV) owns this data. If a sensor is installed in the
track, the infrastructure owner has power of disposal of the
information.
For example B, the following may be considered valid. The trains
that operate on the facility for which TRV is responsible do so
within the framework of a Traffic Agreement (TRAV).
Maintenance entrepreneurs operate on the facility with special
measurement trains within the framework of national contracts in
order to inspect the facility. Maintenance entrepreneurs within the
framework of base contracts can also operate on the track with
vehicles to perform maintenance. If the sensor is part of the
rolling stock, then the rolling stock owner owns the information.
The rolling stock owner who carries the sensor owns the
information, unless otherwise agreed (e.g. the rolling stock owner
grants space to the infrastructure owner or other party, and then
the parties should agree on this). The owner of the asset should be
able to control the company who performs the measurements.
Regarding example C, most have argued that there is no physical
connection to where the sensor is located and then it is not
possible to claim the right to ownership of data. It is not possible
to regulate the collection of satellite data, nor the collection of e.g.
data from travellers on board trains. It might be possible to
regulate via the establishment of object of protection.
When asked whether there are exceptions to the hypothesis that
the asset who generates data always owns data, all respondents
replied that it can be agreed differently in different specific
projects and assignments.
There is a desire for a uniform approach with contract models that
clarify who owns what, who has the right to use data, how data is
to be stored, sorted, deleted and how third parties may use data.
4.2.2 Agreements regarding data and information To write data and information agreements is today perceived as a
neglected area where no clear guidelines regarding who owns 4

what, exists e.g. when applying new sensors. An agreement has to
be made regarding what to measure, how data is to be extracted,
during what time and power of disposal after the project ends.
Data and information must also be defined, and degree of detail
for delivered data. The interviewees experience that regulations
do not keep up with the rapid development.
Today, measurements are performed according to maintenance
instructions, traffic agreements, rental contracts, and utilisation
agreements. But if you want to use a new sensor, the uncertainty
becomes greater. Generally, you do not make an agreement
regarding data, only information. The information can sometimes
be delivered as pdf-files, and can be difficult to refine. The
maintenance entrepreneur has more data from the measuring train
than what is delivered according to agreement, and the remaining
data is considered to be owned by the maintenance entrepreneur.
Interviewees expressed a desire for better quality from detectors
with clearer organisation and management especially with regard
to maintenance and calibration. Regulations for retrieving data
from the infrastructure owner or rolling stock owner should be
regulated in the railway network description, according to one
interviewee. Then other agreements can control the details. The
exception is when detectors are on private tracks. Then you have
to agree directly with the owner of the track to gain access to the
data.
For the question if an agreement is needed in order to record data
about the rolling stock who run over sensors, the answers were
disperse, where eight respondents answered yes, three responded
no and two do not know.
Seven interviewees believe that for future measurement test sites,
a general agreement, guidelines and policy should be established.
For measuring equipment of a more operative nature, such as
measuring stations, extra agreements may be needed.
4.2.3 Rights to share information with third party The majority of the interviewees respond that the information
owner can pass the information on to a third party for analysis
unless otherwise agreed. An example of this is the measuring train
that delivers data to TRV according to agreements, which can
then sell / share without asking the maintenance entrepreneur for
permission. The relationship between supplier and customer
should be based on a transaction and transfer of right of disposal
or right to ownership.
4.2.4 Archiving data Research data must be stored for a long time so that other
researchers can follow in the first researcher's track.
Responsibility for the readability of the format is not with the
researcher but with the authority. Otherwise, reference is made to
the Archives Act, the Product Liability Act, the Public
Procurement Act and the Secrecy Act, but also that this should be
regulated in agreements.
One interviewee believes that data could be classified with a
sustainability date. One point of view is that there should be no
time limit since you can build analyses and see trends for a long
time afterwards. However, there is a risk of reusing and
interpreting secondary data in order to look at something with a
different purpose.
Regarding maintenance contracts, it is important that data is
stored for at least eight years in order to be able to assess how the
condition has changed, but also to be able to describe conditions
as a function of time in future procurements.
4.2.5 Classification of data Configuration of the facility, the daily graph and water supply are
examples of classified data. Security classified data are things that
endanger the security of the nation. There are also data that are
considered confidential, e.g. competitive information. Data could
be classified as open, competitive, or classified by security, and be
protected by information security agreements. One interviewee
replied that condition data should be used for the railway system's
best in mind and has difficulty seeing how it can be used from a
competitive point of view.
4.2.6 Incentives or barriers to data sharing Incentives that could stimulate data sharing are; sharing data to
get better analysis services, better quality of the railways,
extensive decision-making data, data for continued research, less
operational disturbances, knowledge to build better systems and
better condition control.
Barriers can be commercial i.e. regulations and competition,
measuring in a process that is exposed to competition; immaturity
i.e. uncertainty causes fear of sharing data, security issues are not
clear; and the quality of data is insufficient.
4.2.7 An industry-wide data base Organisations should internally produce a goal and a regulatory
framework for sharing data. The owner of the asset decides on the
data series. The mechanism for sharing can be industry-wide
(protocol, technology). One suggestion from interviewees is that
the industry could form a separate company that manages a
common data base. Some believe that TRV should own this data
base, while others say that there is a risk that TRV has a special
interest in track. Such a future data base must also be compatible
with other railway administrations. The governing authority for
the data base should be a non-commercial party. The various
proposals for governing authorities were 1) Infrastructure owner
(TRV) 2) The Association of Swedish Train Operating Companies
(ASTOC) 3) The Swedish Transport Agency 4) the European
Railway Agency (ERA).
4.2.8 The ideal situation for data sharing in the
railway industry The interviewees represented a wide spectrum from those who
believe this is a matter between the parties that make agreements,
to those who see a sector-wide data base where an authority sets
up rules for data sharing and that work across national borders.
Some interviewees commented that transparency for condition
data should increase since trains are crossing borders and a
European detector network with common concepts, systems and
standards could be considered. One interviewee suggested a
combination of cloud and edge infrastructure. Everything should
be in a cloud, but data should be downloadable near the user. A
data sharing authority is needed that sets regulations for how to
share, how to connect, who can provide and retrieve data. The
cloud should be outside any of the organisations that have special
interest in the industry. The Swedish Transport Agency has been
proposed by many interviewees as a suitable authority to set up
and govern the regulations for Swedish data sharing. Service
Level Agreements (SLAs) for detectors should be established 5

since decision support systems built upon detector data and
depends on continuity of deliveries and quality assurance of data.
4.3 Data governance in other industries The interviewees described a daily exchange of data outside the
organisation where a partnership exists with end customers and
distributors. One interviewee replied that there is a long tradition
of sharing data with a maintenance provider where design data,
maintenance data and operating data are available. Data is a
commodity of great value. It should not only be operational data,
but also, for example, discrete events.
Comments to be highlighted from the interview:
By linking meaningful information and reliability to
how the system feels, you see a causal connection if
everything is clearly documented in e.g. maintenance
system. In order for time series data to be relevant,
interpretation how things are done, by whom and
according to which instructions must be possible.
There must be a structure and hierarchy, according to
standard. If one cannot derive information from a
component, the information is useless.
Data is considered valid as long as it is quality assured.
As long as the product exists, it should be relevant to
maintain data, i.e. throughout the whole life cycle.
Everything must be regulated in agreements.
Agreements with customers, subcontractors, suppliers
who deliver services. Moving and managing data is
governed by agreements. Agreements have three
dimensions: process (temporal, business, operation),
structure (local, computer system) and content
(information flow, value flow).
There are more standards for cyber security. Large
multinational customers come with their own
requirements that one must meet. The area is in constant
development. One respondent replies that there are
regulations when the authorities require this. Validity is
important i.e. no one can enter and change data.
4.4 ePilot governing documents Collaboration in the ePilot is regulated in a number of governing
documents, which has been analysed concerning data sharing
between stakeholders.
The JVTC membership agreement is the foundation for the
collaboration within ePilot that regulates e.g. Foreground, Right
to background and Confidentiality. Project partners can enter
information or material of a confidential nature within the
framework of a project. Each project partner therefore undertakes
necessary measures in the processing of confidential information,
which can reasonably be required in order to maintain the
confidentiality during the time the project is in progress, and a
maximum of three years thereafter. A project party who considers
information or material submitted to be considered confidential
shall mark this with "Confidential information". The members are
aware that JVTC is a Center of Excellence at LTU, which means
that the public access applies to public documents, unless the
information can be classified as confidential according to the rules
of the secrecy law.
The ePilot project specification is a governing document stating
the common agreed goal, collaboration and deliverables for each
project within the ePilot. This document is used as a basis for
negotiation between the parties during the initiation of the project.
Information regarding regulation of data sharing between parties
in the template was missing, resulting in some disagreements later
during the course of the project. Therefore information regarding
ownership of data, rights of disposal, distribution to third part,
archiving and deletion has been added.
The ePilot project agreement establishes the arrangement between
the parties during the contract period. The project specification is
an appendix to the agreement. This document does not contain
any regulations for data sharing.
eMaintenanceLAB (eMLAB) store and deliver data for research
within eMaintenance. Data is collected from sources from various
parties in the maintenance industry. Data is only intended for use
in education and research. Internal and external agreements
regulate the use of data from eMLAB. Contracts and regulations
must contain things such as: ownership and use rights, data
security, storage, deletion, confidentiality, etc.
4.5 Other laws and regulations Other laws and regulations containing information regarding data
sharing in the railway industry have been identified and analysed.
Laws that affect whether data may be disclosed are: the Public
Access and Secrecy Act (in principle only commercial agreements
that can be invoked with regard to the confidentiality of data
omission) and the Security Protection Act (constitution relating to
socially critical activities, the nation's security and terrorism).
A public record is any document, printed or electronic, that is
stored by an authority, and has been submitted to it from outside
or has been drawn up within the authority. Documents that are so-
called work material does not generally become official.
The Railway Act contains the basis for Swedish rail traffic
legislation. In the Railways Ordinance (2004: 526) and the
Ordinance (1990: 1165) on safety at the subway and tramway, the
Government has further developed the rules from the laws and
granted the Swedish Transport Agency the right to issue
regulations to detail the area. The Swedish Transport Agency's
regulations are published in the Swedish Railway Agency's
statutory collection (JvSFS). The Railway Act does not include
any text related to definition or ownership of digital assets such as
data or information.
TRV measures, via detectors, to achieve traffic safety and avoid
damage to the facility, as described in the Railway Network
description (JNB) (with reference to regulations, e.g. TDOK
2014: 0689 BVF 592.11 - Detectors. Management of alarms from
in stationary detectors and measures after detected damage during
manual inspection”).
4.6 A generalised data sharing model A generalised data sharing model that can describe data sharing
for a sub-project in the ePilot is shown in Figure 2. The asset
owner writes an agreement with a measurement company about
performing measurements on the asset. Measurements are
performed which are placed in the measurement company
database after being processed in an algorithm. The information is
transferred to the asset owner who has ordered the measurement.
Data can then be forwarded to a company that analyses data. An
6
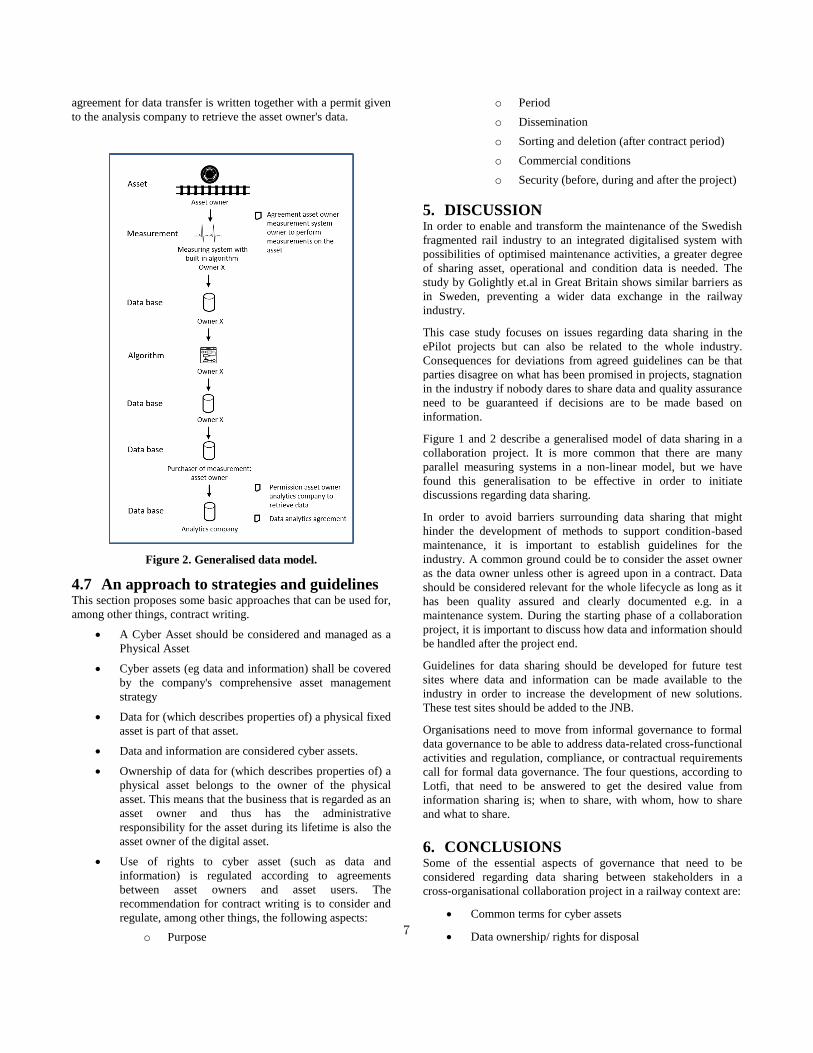
agreement for data transfer is written together with a permit given
to the analysis company to retrieve the asset owner's data.
Figure 2. Generalised data model.
4.7 An approach to strategies and guidelines This section proposes some basic approaches that can be used for,
among other things, contract writing.
A Cyber Asset should be considered and managed as a
Physical Asset
Cyber assets (eg data and information) shall be covered
by the company's comprehensive asset management
strategy
Data for (which describes properties of) a physical fixed
asset is part of that asset.
Data and information are considered cyber assets.
Ownership of data for (which describes properties of) a
physical asset belongs to the owner of the physical
asset. This means that the business that is regarded as an
asset owner and thus has the administrative
responsibility for the asset during its lifetime is also the
asset owner of the digital asset.
Use of rights to cyber asset (such as data and
information) is regulated according to agreements
between asset owners and asset users. The
recommendation for contract writing is to consider and
regulate, among other things, the following aspects:
o Purpose
o Period
o Dissemination
o Sorting and deletion (after contract period)
o Commercial conditions
o Security (before, during and after the project)
5. DISCUSSION In order to enable and transform the maintenance of the Swedish
fragmented rail industry to an integrated digitalised system with
possibilities of optimised maintenance activities, a greater degree
of sharing asset, operational and condition data is needed. The
study by Golightly et.al in Great Britain shows similar barriers as
in Sweden, preventing a wider data exchange in the railway
industry.
This case study focuses on issues regarding data sharing in the
ePilot projects but can also be related to the whole industry.
Consequences for deviations from agreed guidelines can be that
parties disagree on what has been promised in projects, stagnation
in the industry if nobody dares to share data and quality assurance
need to be guaranteed if decisions are to be made based on
information.
Figure 1 and 2 describe a generalised model of data sharing in a
collaboration project. It is more common that there are many
parallel measuring systems in a non-linear model, but we have
found this generalisation to be effective in order to initiate
discussions regarding data sharing.
In order to avoid barriers surrounding data sharing that might
hinder the development of methods to support condition-based
maintenance, it is important to establish guidelines for the
industry. A common ground could be to consider the asset owner
as the data owner unless other is agreed upon in a contract. Data
should be considered relevant for the whole lifecycle as long as it
has been quality assured and clearly documented e.g. in a
maintenance system. During the starting phase of a collaboration
project, it is important to discuss how data and information should
be handled after the project end.
Guidelines for data sharing should be developed for future test
sites where data and information can be made available to the
industry in order to increase the development of new solutions.
These test sites should be added to the JNB.
Organisations need to move from informal governance to formal
data governance to be able to address data-related cross-functional
activities and regulation, compliance, or contractual requirements
call for formal data governance. The four questions, according to
Lotfi, that need to be answered to get the desired value from
information sharing is; when to share, with whom, how to share
and what to share.
6. CONCLUSIONS Some of the essential aspects of governance that need to be
considered regarding data sharing between stakeholders in a
cross-organisational collaboration project in a railway context are:
Common terms for cyber assets
Data ownership/ rights for disposal 7
Agreements/contracts/tendering
Classification of data
The uncertainties regarding data sharing in the railway industry
leads to slower development since cross-organisational
maintenance data is needed for development. ePilot is a useful
platform and toolbox where the industry can test and verify
solutions and clarify issues that might occur when sharing data.
The interviews show the need for clarification and agreements that
are needed.
The proposed approach supports the understanding and
establishing strategies and guidelines for governance in a cross-
organisational railway maintenance context. This can be
considered as one of the enablers for information logistics for
maintenance purposes where the approach can be used as a
support tool in order to facilitate the development of maintenance
decision support within the railway industry.
7. RECOMMENDATIONS To further test the usefulness of the proposed approach, a larger
scale case study should be performed. This can involve additional
stakeholders or a study of data governance in other countries in a
railway context.
8. ACKNOWLEDGMENTS Our thanks to sponsors of eMaintenance2019 for their intellectual
and financial support. We would like to also thank Trafikverket
(the Swedish Transportation Administration) for their financial
support of this project, as well as all the participating railway
organisations and companies.
9. REFERENCES [1] Kumar, S., Espling, U., & Kumar, U. (2008). ”Holistic
procedure for rail maintenance in Sweden”. Proceedings of
the Institution of Mechanical Engineers, Part F: Journal of Rail
and Rapid Transit, 222(4), 331–344.
[2] Asplund, M., Lin, J., & Rantatalo, M. (2016). “Assessment of
the data quality of wayside wheel profile measurements”. In-
ternational Journal of COMADEM, Vol.19, nr 3, sid 19–25.
[3] Galar, D., Palo, M., Van Horenbeek, A. & Pintelon, L. (2012).
“Integration of disparate data sources to perform mainte-
nance prognosis and optimal decision making”. Insight - Non-
Destructive Testing and Condition Monitoring, Volume 54,
Number 8, August 2012, pp. 440-445(6).
[4] Bergquist, B., & Söderholm, P. (2015). “Data analysis for con-
ditionbased railway infrastructure maintenance”. Quality and
Reliability Engineering International, 31(5), 773-781.
[5] Bergquist, B., & Söderholm, P. (2016a). ”Measurement System
Analysis of Railway Track Geometry Data using Secondary
Data”. In eMaintenance 2016: 15/06/2016-16/06/2016.
[6] Bergquist, B., & Söderholm, P. (2016b). ”Measurement Sys-
tems Analysis of Railway Measurement Cars”. In International
Conference on the Interface between Statistics and
Engineering: 20/06/2016-23/06/2016.
[7] Bergquist, B., & Söderholm, P. (2017). “Improved Condition
Assessment through Statistical Analyses: Case Study of
Railway Track”. Luleå University of Technology.
[8] Juntti, U., Karim, R., Larsson, L. (2014). ”Implementation of
eMaintenance concept within the Swedish railway.” Presented
at the International Congress on Condition Monitoring and
Diagnostic Engineering Management : Implications of life
cycle analysis in asset and maintenance 16/09/2014 -
18/09/2014.
[9] Karim, R. & Jägare, V. (2017). ePilot : Slutrapport : ett
samverkansprojekt inom järnväg. Luleå.
[10] Kajko-Mattsson, M., Karim, R. and Mirjamsdotter, A. (2011).
“Essential Components of e-Maintenance”, International
Journal of Performability Engineering, Vol. 7, No. 6,
November 2011, pp. 515-517K.
[11] Lotfi, Z., Mukhtar, M., Sahran, S. and Zadeh, A. T. (2013)
“Information Sharing in Supply Chain Management”,
Procedia Technology. Elsevier B.V., 11(Iceei), pp. 298–304.
[12] The Data Governance Institute. www.datagovernance.com
[13] European Commission. (2011). “Roadmap to a single
European transport area—towards a competitive and
resource-efficient transport system”. White paper on transport,
Luxembourg: Publications Office of the European Union.
[14] ”Med medborgaren i centrum – regeringens strategi för en
digital samverkande statsförvaltning”, dnr N2012/06402/ITP.
[15] ”Svenskt ramverk för digital samverkan 1.2.”
www.esamverka.se.
[16] Tutcher, J., Roberts, C., & Easton, J. M. (2011). “Integrating
railway maintenance data: Development of a semantic data
model to support condition monitoring data from multiple
sources.” Paper presented at the KEOD 2011 - Proceedings of
the International Conference on Knowledge Engineering and
Ontology Development, 442-444.
[17] Golightly, D., Easton, J. M., Roberts, C., & Sharples, S.
(2013). “Applications, value and barriers of common data
frameworks in the rail industry of Great Britain”. Proceedings
of the Institution of Mechanical Engineers, Part F: Journal of
Rail and Rapid Transit, 227(6), 693-703.
[18] Backmyr, H. and Gjörup, N. (2017). “Information Sharing in
the Swedish Rail Freight Industry - Barriers and Mitigation
Strategies”. Masters Thesis. Lund University.
[19] Jägare, V., Juntti, U., & Karim, R. (2015). ”Implementation of
eMaintenance concept on the Iron Ore Line in Sweden.”
Presented at the International Heavy Haul Association: The
11th International Heavy Haul Association Conference will be
held 21 - 24 June 2015 in Perth 21/06/2015 - 24/06/2015.
8

Cleaning of Railway Track Measurement Data for Better Maintenance Decisions
Bjarne Bergquist Quality Technology Luleå University of
Technology, Luleå, Sweden Phone: +46 920 49 2137
Peter Söderholm Trafikverket and Quality
Technology Luleå University of
Technology, Luleå, Sweden
Phone: +46 10 123 81 67
Osmo Kauppila Industrial Engineering and
Management University of Oulu, Finland Phone +358 40 825 7692
Erik Vanhatalo Quality Technology Luleå University of
Technology, Luleå, Sweden Phone: +46 49 1720
ABSTRACT Data of sufficient quality, quantity and validity constitute a sometimes overlooked basis for eMaintenance. Missing data, heterogeneous data types, calibration problems, or non-standard distributions are common issues of operation and maintenance data. Railway track geometry data used for maintenance planning exhibit all the above issues. They also have unique features stemming from their collection by measurement cars running along the railway network. As the track is a linear asset, measured geometry data need to be precisely located to be useful. However, since the sensors on the measurement car are moving along the track, the observations’ geographical sampling positions come with uncertainty. Another issue is that different seasons and other time restrictions (e.g. related to the timetable) prohibit regular sampling. Hence, prognostics related to remaining useful life (RUL) are challenging since most forecasting methods require a fixed sampling frequency.
This paper discusses methods for data cleaning, data condensation and data extraction from large datasets collected by measurement cars. We discuss missing data replacement, dealing with autocorrelation or cross-correlation, and consequences of not fulfilling methodological pre-conditions such as estimating probabilities of failures using data that do not follow the assumed distributions or data that are dependent. We also discuss outlier detection, dealing with data coming from multiple distributions, of unknown calibrations and other issues seen in railway track geometry data. We also discuss the consequences of not addressing or mishandling quality issues of such data.
Keywords Track geometry, big data, railway, data quality, diagnostics, prognostics, maintenance, Sweden.
1. INTRODUCTION The amount of asset condition data, as well as its availability for both practitioners and scientists, continues to grow. The eMaintenance concept has grown along, helping to solve hitherto unsolvable maintenance problems. The rapid increase in collected asset condition data is due to new possibilities made available by digitisation and accelerated technological development.
However, data do not serve a particular purpose in itself. Data need to be put into a context-dependent purpose, and issues such as the required levels of detail and aggregation depend on that purpose [1]. Quality data need to be “fit for purpose” [2]. As this fit depends heavily on the context, there is no single set of agreed dimensions for data quality. Accuracy, completeness, consistency and timeliness form one of the most frequently used sets [3].
The massive data streams come with associated challenges, e.g., in the management of big data due to its inherent properties: volume, variety, velocity, veracity, and value. For example, pre-processing activities to convert field data into a format compatible with the intended data analysis may consume the most analysis time. Issues such as missing data, heterogeneous data types, calibration problems, or non-normality often surface when analysts try to turn datasets related to operations and maintenance of technical systems into the desired format. Additionally, railway track geometry data, which we analyse in this paper, have unique features stemming from their collection method. Since the sensors on the measurement car are moving along the track, there is uncertainty in the geographical sampling position of the observations. The sampling intervals are affected by seasonal and other restrictions, and the irregular sampling intervals can be problematic in condition forecasting for maintenance purposes, see, e.g. Bergquist and Söderholm [4, 5].
In this paper, we study how railway geometry data can be processed to make them fit for prediction and maintenance planning. We investigate data cleaning, aggregation and extraction of information. Issues that we address include missing data, auto- and cross-correlation and the data not meeting requirements such as distributional and independence assumptions, as well as their consequences. We also investigate outlier detection, handling data from multiple distributions, calibration issues. Finally, we discuss the implications of not addressing data quality issues of track geometry data. Data and examples in this paper are based on measurements obtained on track section 119, which is part of the Swedish Iron ore line, and it connects the cities of Boden and Luleå by 35 kilometres of track.
9

2. RAILWAY TRACK DATA Track measurement cars record the railway track measurement data that we will discuss in this paper, that is, measurement trains and trollies that regularly travel along the Swedish railway network to measure characteristics of different parts of the infrastructure. Both trollies and measurement trains measure several geometrical properties of the track, substructure and catenary system. These measurements can be used to analyse deviations from the designated geometry. The measurement train (IMV 200) consists of an engine and a measurement car. The measurement car obtains measurements through accelerometers mounted in the car body and linear variable differential transformers to relate the position of the car body to the axles. Each 5 cm of the track length is measured, but these data are post-processed into observations taken 25 cm apart before they are uploaded to the database. Track geometry measurements include track gauge, cross-level/cant, twist, and vertical and side alignment of the two rails. The gauge measure is the distance between the rails, the cross-level/cant is a measure of the designed height difference between the rails. Curves normally have a designed cross-level difference so that trains lean inwards to compensate for the centrifugal effects. Any difference between the designed cross-level and the measured is a twist fault, and this fault is defined based on different measurement lengths, (e.g., mm/6m track). The vertical or side alignment of each rail is its position vertically or horizontally compared to the designed position, see also [6]
3. DATA BINNING The supplier regularly uploads measurement data from the measurement cars to the decision support system Optram [7]. The Optram system allows data exports for further analyses through comma separated files (.csv). One full run of the measurement train for track section 119 equates a .csv file with a size of around 330 MB. For some purposes require such high-resolution data. For many other purposes, such large datasets may become too bulky, such as when several measurement occasions are to be combined. There are also other reasons, elaborated later in the paper, to replace the 25 cm observations with other measures by binning the data into representative summary statistics. We have binned the data into 200 m track segments. In practice, this means replacing 800 observations of the 25 cm resolution (or 4 000 of the original 5 cm observations) by summary statistics for each measurement and segment. Examples of summary statistics include the maximum value or the standard deviation of a particular property within the track segment. The binning was performed in the Microsoft Power BI Desktop® software. Some summary statistics such as the average will also improve later analyses since the distribution of the average will be closer to the normal distribution due to the central limit theorem. The paper will, without loss of generality, from this point use the binned data for 200 m track segments. Any faults and peculiarities found in the binned data would be valid also for the original observations. However, in some cases, the binning procedure will hide outliers and other problems visible in the 25 or 5 cm data.
4. DATA OVERVIEW Probably the best first step in finding data peculiarities and outliers, real or not, is to plot the data. Many analysis software allows for plotting several variables in a matrix of bivariate scatterplots. Such a matrix plot is useful since strange patterns as
well as the correlation between variables become apparent and may not be evident in univariate plots. Bivariate plots produced one-by-one will time-consuming to produce if the data-set includes many variables. Figure 1 shows a matrix of bivariate scatter-plots of the largest obtained measurements of the variables in each segment. The software we use for all plots in this paper is JMP® version 14.1.0. The variables that are plotted in Figure 1 appear in the following order (the maximum values of): Twist (6m base), Twist (3m base), Side shortwave amplitude (right rail), Side shortwave amplitude (left rail), Height shortwave amplitude (right rail), Height shortwave amplitude (left rail), and Gauge. These data were obtained from 103 passes of the measurement cars on track section 119 between April in 2007 and February 2019.
Figure 1. Matrix of scatter plots of maximum values on the seven variables.
Many methods for multivariate data, base the calculations on the assumption that the data follow a multivariate normal distribution. Such ideal data would display point swarms in the bi-variate scatter plots that are either circular or oval along a diagonal. An oval shape would indicate a positive or negative correlation between the two variables and a circular shape would indicate weak or no correlation. Patterns deviating from this expected behaviour indicate issues that the analyst should handle or at least consider the consequences of, before further analyses. One peculiarity in Figure 1 (e.g. first and second row) is that the data seem to separate into two groups for the twist variables. Figure 2 presents one of these bivariate scatterplots between the two twist measures for increased readability (row 2, column 1 in Figure 1). Note that the observations are maximum twist errors obtained for a 200 m segment. Any zero values would be an indication of measurement problems, and likewise, a negative value would indicate negative twist readings for a full 200 segment, which is not realistic as twist needs to sum to zero over a point defect or else there will be a constant lean of the track after the defect. A series of positive ones must thus follow a series of negative
10

readings. Data cleaning therefore started by removal of ‘strange’ twist measurement observations before proceeding to further analyses.
Figure 2 shows that the 3 m twist maximum also seems to be split into two groups. The raw data for the 3 m twist maximum thus contained data from two distributions. Further analysis revealed that measurements of the measurement car for two dates (passages) had an average a hundred times lower than the remaining 101 indicating some measurement issue. Since these erroneous data made up only a small portion of the data, all zero values or lower on the 6 m twist maximum observations, and all 3 m twist maximum observations lower than 20 mm/m were removed from further analyses.
Figure 2. Bi-variate scatterplot between the maximum of the 6 m twist [mm/m] and the 3 m twist [mm/m]. Depending on the analysis software, the analysis to be done at the later stage, and the wealth of data, the analyst may select to keep or delete the observation. If the analyst chooses to keep the observation, with just deleting the faulty variable measurements, the other variables’ measurements may still be valid and strengthen analyses where those variables are important. Some software and analyses do not tolerate incomplete datasets, while others perform well if the missing observations are not systematic or too many. Some of these use data imputation methods. Again, imputation methods still require caution and cannot reconstruct cases where there is a systematic structure to the missing data, or when there are too few remaining observations.
5. DISTRIBUTIONAL PROPERTIES It is also good practice to study the variables in a univariate plot that reveals information about their distributions, such as a histogram. Data are never ideally normally distributed, which is a common assumption for many analysis methods in later stages. Often, the normal distribution describes the data reasonably well; other times some properly chosen transformation can make the transformed align better with the normal distribution. Without such transformations, inference based on a normal probability assumption, for instance, estimating the probability that a track segment would have a maximum twist above a certain limit, would be unreliable.
For example, the appearance of the histogram in Figure 3 with a long right tail suggests that a lognormal distribution would be similar and could approximate to the observed distribution. The lognormal distribution is reasonable, given that the shortwave has a natural zero limit. A log transformation often improves the maximum and the standard deviation, but the analyst is always well advised to study the transformed data. Outliers may, for instance, become more clear after a transformation, so we recommend revisiting univariate and matrix plots as in Figure 1 after transformations to identify and remove potential additional ‘bad’ observations. The variable in Figure 3 has undergone a log transformation, and Figure 4 shows the transformed data. The transformed data shows a few suspected outliers to the left that need more careful inspection, but the transformation did prove useful in making the variable more normally distributed.
Figure 3. Histogram of the maximum amplitude of the shortwave of the height of the right rail [mm].
Figure 4. Histogram of log-transformed maximum amplitude of the shortwave of the height of the right rail. The red curve shows the curve fitting of a theoretical normal distribution.
The log transformation belongs to a set of standard variance stabilising transformations. It is often the case that there is a multiplicative relation between the expected average value of a property and its variance. When the variable variation connects multiplicatively to the the average, that connection will induce analysis problems if not addressed. For multiplicative relations, the log transformation is a standard transformation, converting the multiplicative relation to an additive one. There are other standard transformations too. The standard deviation is χ2 distributed, with a long right tail, and the log transformation will make the distribution of the variable closer to the normal. Other standard transformations include the square root for Poisson distributed data or the sine for binomially distributed data.
11

Box and Cox [8] suggested finding an appropriate power transformation by empirical testing. However, we do not recommend using the ‘best’ power transformation that the Box-Cox test produces without further consideration. Plotting of the data may, for instance, reveal that the reasons for the best fit were outliers or data stemming from multiple populations such as in Figure 2. Standard variance stabilising transformations are found in [9].
6. OUTLIER DETECTION Outliers may lead to faulty conclusions if they are erroneous, but may also reveal relevant information. One should, therefore, not remove them carelessly. Figure 5 shows observations and quarterly averages of the segment max of the 6 m twist variable. Two consecutive observations have generated zero variance readings due to a fault of the measurement train. The figure also shows a model that tries to fit the data for prediction purposes, along with a 95% prediction interval and a three sigma upper prediction limit. The model includes some tolerance toward noisy input data, but the model is designed to restart if conditions have improved considerably. Such improvements are not natural but would be the results of maintenance actions. The model was also
made robust versus outliers in that unreasonable condition decline was not allowed. The standard deviation may be more substantial for some measurements during spring thaw or autumn frost heave, but the variation amplitudes will shrink when that period has passed. The model, therefore, had a maximum tolerated increase rate of the standard deviation for automatic outlier removal due to frost.
As illustrated in Figure 5, the effect on the model of the two outliers in combination with the model’s maximum tolerated increase rate of the standard deviation can be detrimental for the results. The model, based on the average of quarterly measurements, tries to restart due to the outliers, but the limit for the maximum tolerated standard deviation increase keeps the model from adjusting back to the real data. In this case, removal of zero standard deviation values would be a simple solution, but other outliers, for instance, due to instability due to frost heave or thaw will also need handling or a model that is programmed to disregard strange measurements obtained from such times. A difficulty for an automated model solution there is that frost depends on geography and altitude among other things.
lo
Figure 5. Observations (o) and quarter averages (+) of the standard deviation of the 6 m twist variable for one segment.
7. FAULT LOCALISATION The coordination of fault diagnosis (i.e. fault detection, fault localisation and cause identification) at different maintenance echelons, in time, and space is central for eMaintenance. The result of an erroneous fault diagnosis on single maintenance echelons can be false alarms or undetected faults, while insufficient coordination of different maintenance echelons can lead to No Fault Found events. One example is when dealing with linear assets and combining the use of different measurement methods for fault diagnosis, e.g. measurement trains that
identifies a failure that later on should be corrected by maintenance personnel that use manual inspection. Maintenance personnel may need to wait for a passing train to pinpoint the issues if, for instance, the fault localisation requires that the track is loaded to be visible. A precise geographical localisation is, therefore, essential from the standpoint of knowing where to locate track failures when faults are not evident from visual inspections by the maintenance crew.
The quality of performed fault diagnostics, on single or multiple maintenance echelons, at different occasions in time will also
12
determine the power of fault prognostics. The time dimension of the data is crucial to establish causal relationships between measurements and maintenance actions. Both time and position are crucial for following deterioration progress over time and make predictions, e.g. regarding the remaining useful life.
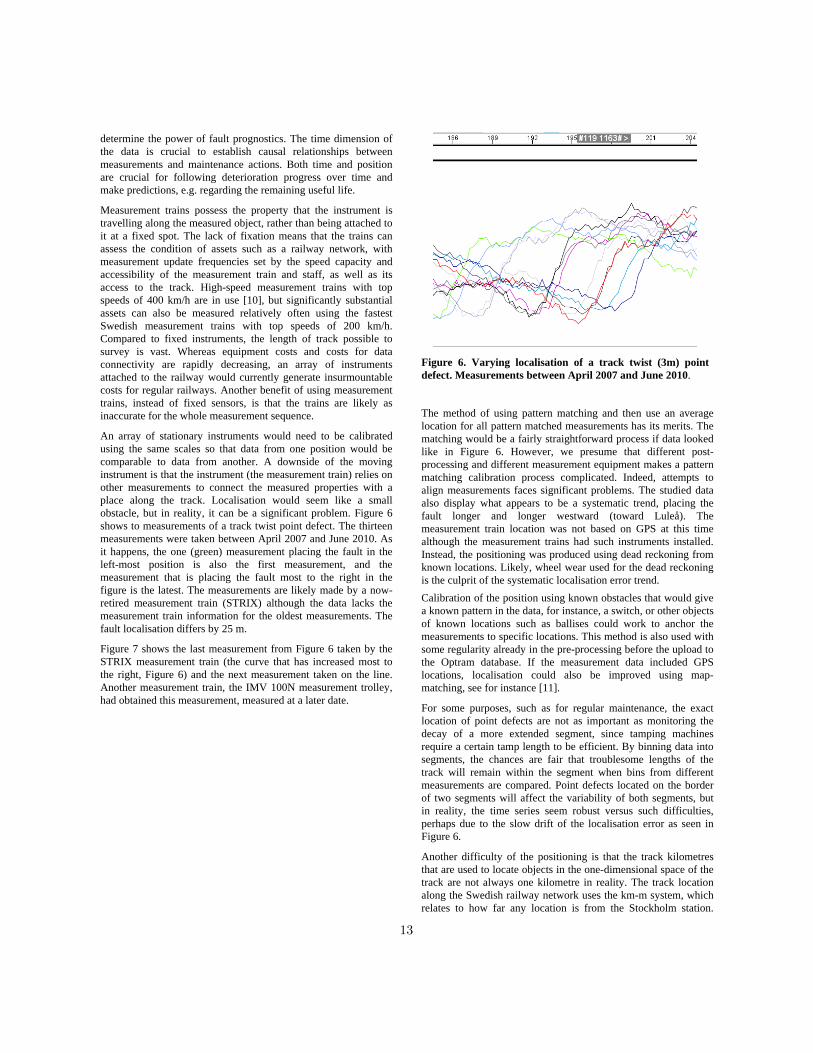
Measurement trains possess the property that the instrument is travelling along the measured object, rather than being attached to it at a fixed spot. The lack of fixation means that the trains can assess the condition of assets such as a railway network, with measurement update frequencies set by the speed capacity and accessibility of the measurement train and staff, as well as its access to the track. High-speed measurement trains with top speeds of 400 km/h are in use [10], but significantly substantial assets can also be measured relatively often using the fastest Swedish measurement trains with top speeds of 200 km/h. Compared to fixed instruments, the length of track possible to survey is vast. Whereas equipment costs and costs for data connectivity are rapidly decreasing, an array of instruments attached to the railway would currently generate insurmountable costs for regular railways. Another benefit of using measurement trains, instead of fixed sensors, is that the trains are likely as inaccurate for the whole measurement sequence.
An array of stationary instruments would need to be calibrated using the same scales so that data from one position would be comparable to data from another. A downside of the moving instrument is that the instrument (the measurement train) relies on other measurements to connect the measured properties with a place along the track. Localisation would seem like a small obstacle, but in reality, it can be a significant problem. Figure 6 shows to measurements of a track twist point defect. The thirteen measurements were taken between April 2007 and June 2010. As it happens, the one (green) measurement placing the fault in the left-most position is also the first measurement, and the measurement that is placing the fault most to the right in the figure is the latest. The measurements are likely made by a now-retired measurement train (STRIX) although the data lacks the measurement train information for the oldest measurements. The fault localisation differs by 25 m.
Figure 7 shows the last measurement from Figure 6 taken by the STRIX measurement train (the curve that has increased most to the right, Figure 6) and the next measurement taken on the line. Another measurement train, the IMV 100N measurement trolley, had obtained this measurement, measured at a later date.
Figure 6. Varying localisation of a track twist (3m) point defect. Measurements between April 2007 and June 2010.
The method of using pattern matching and then use an average location for all pattern matched measurements has its merits. The matching would be a fairly straightforward process if data looked like in Figure 6. However, we presume that different post-processing and different measurement equipment makes a pattern matching calibration process complicated. Indeed, attempts to align measurements faces significant problems. The studied data also display what appears to be a systematic trend, placing the fault longer and longer westward (toward Luleå). The measurement train location was not based on GPS at this time although the measurement trains had such instruments installed. Instead, the positioning was produced using dead reckoning from known locations. Likely, wheel wear used for the dead reckoning is the culprit of the systematic localisation error trend.
Calibration of the position using known obstacles that would give a known pattern in the data, for instance, a switch, or other objects of known locations such as ballises could work to anchor the measurements to specific locations. This method is also used with some regularity already in the pre-processing before the upload to the Optram database. If the measurement data included GPS locations, localisation could also be improved using map-matching, see for instance [11].
For some purposes, such as for regular maintenance, the exact location of point defects are not as important as monitoring the decay of a more extended segment, since tamping machines require a certain tamp length to be efficient. By binning data into segments, the chances are fair that troublesome lengths of the track will remain within the segment when bins from different measurements are compared. Point defects located on the border of two segments will affect the variability of both segments, but in reality, the time series seem robust versus such difficulties, perhaps due to the slow drift of the localisation error as seen in Figure 6.
Another difficulty of the positioning is that the track kilometres that are used to locate objects in the one-dimensional space of the track are not always one kilometre in reality. The track location along the Swedish railway network uses the km-m system, which relates to how far any location is from the Stockholm station.
13
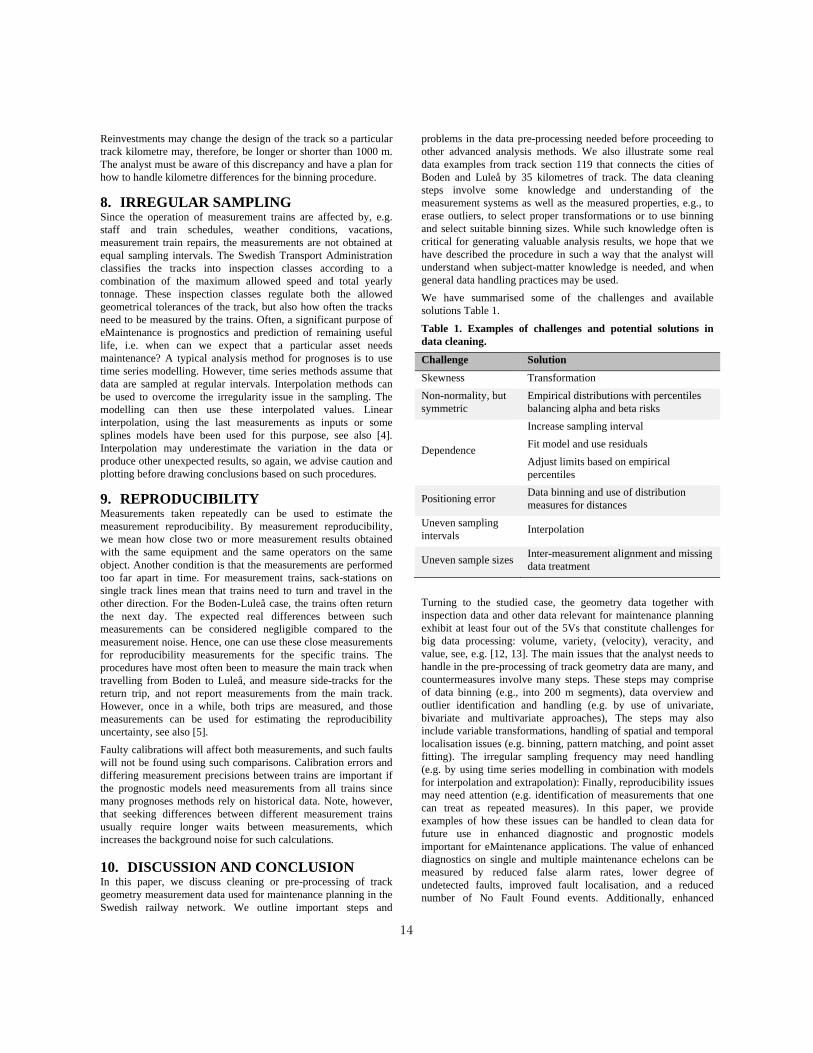
Reinvestments may change the design of the track so a particular track kilometre may, therefore, be longer or shorter than 1000 m. The analyst must be aware of this discrepancy and have a plan for how to handle kilometre differences for the binning procedure.
8. IRREGULAR SAMPLING Since the operation of measurement trains are affected by, e.g. staff and train schedules, weather conditions, vacations, measurement train repairs, the measurements are not obtained at equal sampling intervals. The Swedish Transport Administration classifies the tracks into inspection classes according to a combination of the maximum allowed speed and total yearly tonnage. These inspection classes regulate both the allowed geometrical tolerances of the track, but also how often the tracks need to be measured by the trains. Often, a significant purpose of eMaintenance is prognostics and prediction of remaining useful life, i.e. when can we expect that a particular asset needs maintenance? A typical analysis method for prognoses is to use time series modelling. However, time series methods assume that data are sampled at regular intervals. Interpolation methods can be used to overcome the irregularity issue in the sampling. The modelling can then use these interpolated values. Linear interpolation, using the last measurements as inputs or some splines models have been used for this purpose, see also [4]. Interpolation may underestimate the variation in the data or produce other unexpected results, so again, we advise caution and plotting before drawing conclusions based on such procedures.
9. REPRODUCIBILITY Measurements taken repeatedly can be used to estimate the measurement reproducibility. By measurement reproducibility, we mean how close two or more measurement results obtained with the same equipment and the same operators on the same object. Another condition is that the measurements are performed too far apart in time. For measurement trains, sack-stations on single track lines mean that trains need to turn and travel in the other direction. For the Boden-Luleå case, the trains often return the next day. The expected real differences between such measurements can be considered negligible compared to the measurement noise. Hence, one can use these close measurements for reproducibility measurements for the specific trains. The procedures have most often been to measure the main track when travelling from Boden to Luleå, and measure side-tracks for the return trip, and not report measurements from the main track. However, once in a while, both trips are measured, and those measurements can be used for estimating the reproducibility uncertainty, see also [5].
Faulty calibrations will affect both measurements, and such faults will not be found using such comparisons. Calibration errors and differing measurement precisions between trains are important if the prognostic models need measurements from all trains since many prognoses methods rely on historical data. Note, however, that seeking differences between different measurement trains usually require longer waits between measurements, which increases the background noise for such calculations.
10. DISCUSSION AND CONCLUSION In this paper, we discuss cleaning or pre-processing of track geometry measurement data used for maintenance planning in the Swedish railway network. We outline important steps and
problems in the data pre-processing needed before proceeding to other advanced analysis methods. We also illustrate some real data examples from track section 119 that connects the cities of Boden and Luleå by 35 kilometres of track. The data cleaning steps involve some knowledge and understanding of the measurement systems as well as the measured properties, e.g., to erase outliers, to select proper transformations or to use binning and select suitable binning sizes. While such knowledge often is critical for generating valuable analysis results, we hope that we have described the procedure in such a way that the analyst will understand when subject-matter knowledge is needed, and when general data handling practices may be used.
We have summarised some of the challenges and available solutions Table 1.
Table 1. Examples of challenges and potential solutions in data cleaning.
Challenge Solution
Skewness Transformation
Non-normality, but symmetric
Empirical distributions with percentiles balancing alpha and beta risks
Dependence
Increase sampling interval
Fit model and use residuals
Adjust limits based on empirical percentiles
Positioning error Data binning and use of distribution measures for distances
Uneven sampling intervals
Interpolation
Uneven sample sizes Inter-measurement alignment and missing data treatment
Turning to the studied case, the geometry data together with inspection data and other data relevant for maintenance planning exhibit at least four out of the 5Vs that constitute challenges for big data processing: volume, variety, (velocity), veracity, and value, see, e.g. [12, 13]. The main issues that the analyst needs to handle in the pre-processing of track geometry data are many, and countermeasures involve many steps. These steps may comprise of data binning (e.g., into 200 m segments), data overview and outlier identification and handling (e.g. by use of univariate, bivariate and multivariate approaches), The steps may also include variable transformations, handling of spatial and temporal localisation issues (e.g. binning, pattern matching, and point asset fitting). The irregular sampling frequency may need handling (e.g. by using time series modelling in combination with models for interpolation and extrapolation): Finally, reproducibility issues may need attention (e.g. identification of measurements that one can treat as repeated measures). In this paper, we provide examples of how these issues can be handled to clean data for future use in enhanced diagnostic and prognostic models important for eMaintenance applications. The value of enhanced diagnostics on single and multiple maintenance echelons can be measured by reduced false alarm rates, lower degree of undetected faults, improved fault localisation, and a reduced number of No Fault Found events. Additionally, enhanced
14

prognostics provides improved remaining useful life estimation valuable in maintenance planning.
ACKNOWLEDGEMENTS We would extend our thanks to Trafikverket (the Swedish transport administration) and Vinnova (the Swedish Innovation Agency) for financial support for the study.
11. REFERENCES [1] Gustavsson, M. & Jonsson, P. (2008). Perceived quality deficiencies of demand information and their consequences. International Journal of Logistics: Research and Applications, 11(4), 295-312.
[2] Otto, B., Hüner, K.M. & Österle, H. (2011). Toward a Functional Reference for Master Data Quality Management. Information Systems and e-Business Management, 10, 395-425.
[3] Batini, C., Cappiello, C., Francalanci, C. & Maurino, A. 2009. Methodologies for Data Quality Assessment and Improvement. ACM Computing Surveys, 41 (3).
[4] Bergquist, B. & Söderholm, P. (2016). Predictive Modelling for Estimation of Railway Track Degradation, edited by Kumar, U. Ahmadi, A., Verma, A.K., Varde, P. in “Current Trends in Reliability, Availability, Maintainability and Safety”, Springer International Publishing AG, Cham., 331-347.
[5] Bergquist, B. & Söderholm, P. (2016). Measurement System Analysis of Railway Track Geometry Data using Secondary Data Analyses. eMaintenance 2016. Luleå. June 14-16.
[6] Trafikverket (2019). https://www.trafikverket.se/tjanster/system-och-verktyg/forvaltning-och-underhall/Periodisk-matning/Spar-och-kontaktledningsmatningar/Koll-pa-sparet-i-200-kmtim/ On-line, access date May 3, 2019. (In Swedish).
[7] Smith, A. (2016). Optram Analysis and Forecasting: A Bentley White Paper. Accessed on-line 2019-02-22 on https://www.bentley.com/
[8] Box, G. E., & Cox, D. R. (1964). An analysis of transformations. Journal of the Royal Statistical Society: Series B (Methodological), 26(2), 211-243.
[9] Box, G. E., Hunter, W. G., & Hunter, J. S. (1978). Statistics for Experimenters. John Wiley & Sons, New York, NY.
[10] Nielsen, J., Berggren, E., Lölgen, T., & Müller, R. (2013). Overview of methods for measurement of track irregularities. RIVAS Railway Induced Vibration Abatement Solutions Collaborative Project.
[11] Känsälä, K., Rantala, S., Kauppila, O. & Leviäkangas, P. (2018). Acceleration sensor technology for rail track asset condition monitoring. Proceedings of the Institution of Civil Engineers - Management, Procurement and Law, 171(1), 32-40.
[12] Chen, J., Chen, Y., Du, X., Li, C., Lu, J., Zhao, S., & Zhou, X. (2013). Big data challenge: a data management perspective. Frontiers of Computer Science, 7(2), 157-164.
[13] Demchenko, Y., De Laat, C., & Membrey, P. (2014). Defining architecture components of the Big Data Ecosystem. In “2014 International Conference on Collaboration Technologies and Systems (CTS)”, IEEE, 104 - 112.
15
Effects of a Freely Moving Maintenance Device on the
Hydrodynamic Characteristics of Pipe Bends Taimoor Asim
School of Engineering Robert Gordon University
Aberdeen, UK
Rakesh Mishra School of Computing & Engineering
University of Huddersfield Huddersfield, UK
Kuldip Ubbi School of Computing & Engineering
University of Huddersfield Huddersfield, UK
ABSTRACT
Regular inspection and maintenance of oil and gas pipelines is
crucial for safe and cost effective operation of oil and gas
industry. Various techniques are practised globally for this
purpose. One such technique is to insert a maintenance device
within the pipeline that can monitor and record various
parameters of interest, such corrosion etc., for in-situ inspection
and repair of the pipeline. The shape of maintenance device is
conventionally rectangular and it houses different sensors to
monitor pipeline condition. The maintenance device are thus
hollow and can propagate freely within the pipeline. Extensive
research has been carried out on the use and effects of such
maintenance devices in straight pipes, however, published
literature regarding their use in pipe bends is severely limited. In
the present study, an advanced numerical approach has been used
to investigate the effects of the presence of a maintenance device
on the flow structure and hydrodynamic characteristics of
hydraulic pipe bends used within oil and gas sector. A novel
methodology has been used, and verified, to predict the velocity
of the maintenance device within pipe bends. It has been observed
that after the maintenance device is inserted in a pipe bend, the
flow structure within the bend changes significantly. The flow
within the bend has been noticed to become highly non-uniform,
with the generation of considerable amount of secondary flows.
This leads to substantial increase in the pressure drop across the
bends. This information can be integrated in the pipeline design
for better accuracy.
Keywords
Computational Fluid Dynamics (CFD), Pipe Bends, Maintenance
Device, Q-criteria, Pressure Drop.
1. INTRODUCTION Bends are an integral part of any pipeline network. Due to severe
flow velocity gradients present within pipe bends, their
maintenance often becomes more important than straight pipes. A
conventional maintenance device is essentially a hollow
rectangular body in which the sensors are installed for in-situ
condition monitoring. Vlasak and Myska [1]-[2] were probably
amongst the initial researchers who experimentally investigated
the effects of maintenance devices on the hydrodynamic
characteristics of hydraulic pipe bends. They analysed the
maintenance devices in pipe bends of various radii of curvature
(R/r=2 and 5). They reported that as the average flow velocity
(Vav) increases, the velocity of the maintenance device (Vc) also
increases, however, this increase in maintenance device’s velocity
is non-linear. At lower flow velocities, this increase is quite
substantial while at higher flow velocities, this increase becomes
more gradual. The ratio of maintenance device-to-flow velocities
(Vc/Vav) is termed as Holdup velocity (H). It has been reported
that H can attain a maximum value of 120% of Vav. As the study
was purely experimental, the authors were unable to record and
analyse the flow structure within the pipe bends.
Asim et al [3]-[7] have extensively reported the effects of the
presence of maintenance devices in hydraulic pipelines. The
maintenance devices investigated were of various shapes;
spherical, cylindrical, rectangular etc. As these studies were
mostly numerical, the flow structure within pipe bends has been
reported to some extent, mostly qualitative. The authors have
shown that the shape factor of the maintenance device is an
important factor as far as the hydrodynamic characterisation of the
pipe bends is concerned. These studies however lack detailed flow
diagnostics within the bends, for example, it has been reported in
various studies [8]-[9] that the presence of maintenance devices
offer more resistance to the flow, and thus, secondary flows
become dominant in pipe bends. Analyses regarding the formation
and strength of the secondary flows within hydraulic pipe bends
have not been reported by Asim et al [3]-[7].
More recently, Abushaala [10] has reported that the flow structure
become highly non-uniform once a maintenance device in injected
within a pipe bend. First order velocity based analyses have been
presented by the author indicating that the flow velocity becomes
considerably higher in the gap regions between the maintenance
device and the bend wall. This is particularly interesting as H has
been recorded to be more than 1. This aspect of the study needs
detailed investigation in order to ascertain the role of secondary
flows in the hydrodynamic characterisation of pipe bends. Hence,
in the present study, a numerical approach, similar to Abushaala
[10] has been adopted to analyse the effects of a conventional
(rectangular) maintenance device on the flow structure within
hydraulic pipe bends. An important point to note here is that
Abushaala [10] used a simplistic approach to calculate the
velocity of the maintenance device, while in the present study, a
novel technique has been used, and verified, for this purpose.
2. NUMERICAL METHODOLOGY A commercial Computational Fluid Dynamics (CFD) based
solver, Ansys 18.1, has been used to carry out the numerical work
presented in this study. The geometry of the pipe bend has three
separate sections i.e. inlet pipe, test section and outlet pipe. This
has been purposefully done because it takes about 50D length of
the pipe for the flow to become fully developed, D being the
diameter of the pipeline. Thus, 50D long inlet and 10D long outlet
sections have been numerically modelled, while the test section
has an equivalent length of 1m, as shown in figure 1. Two 16
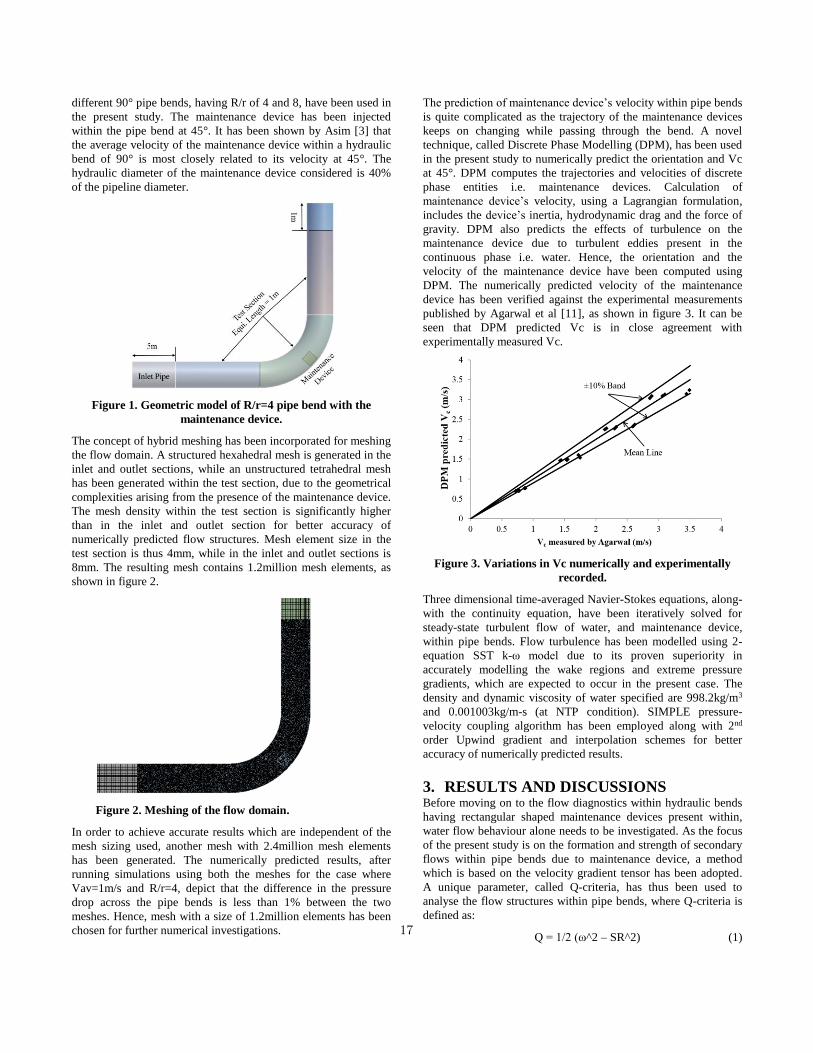
different 90° pipe bends, having R/r of 4 and 8, have been used in
the present study. The maintenance device has been injected
within the pipe bend at 45°. It has been shown by Asim [3] that
the average velocity of the maintenance device within a hydraulic
bend of 90° is most closely related to its velocity at 45°. The
hydraulic diameter of the maintenance device considered is 40%
of the pipeline diameter.
Figure 1. Geometric model of R/r=4 pipe bend with the
maintenance device.
The concept of hybrid meshing has been incorporated for meshing
the flow domain. A structured hexahedral mesh is generated in the
inlet and outlet sections, while an unstructured tetrahedral mesh
has been generated within the test section, due to the geometrical
complexities arising from the presence of the maintenance device.
The mesh density within the test section is significantly higher
than in the inlet and outlet section for better accuracy of
numerically predicted flow structures. Mesh element size in the
test section is thus 4mm, while in the inlet and outlet sections is
8mm. The resulting mesh contains 1.2million mesh elements, as
shown in figure 2.
Figure 2. Meshing of the flow domain.
In order to achieve accurate results which are independent of the
mesh sizing used, another mesh with 2.4million mesh elements
has been generated. The numerically predicted results, after
running simulations using both the meshes for the case where
Vav=1m/s and R/r=4, depict that the difference in the pressure
drop across the pipe bends is less than 1% between the two
meshes. Hence, mesh with a size of 1.2million elements has been
chosen for further numerical investigations.
The prediction of maintenance device’s velocity within pipe bends
is quite complicated as the trajectory of the maintenance devices
keeps on changing while passing through the bend. A novel
technique, called Discrete Phase Modelling (DPM), has been used
in the present study to numerically predict the orientation and Vc
at 45°. DPM computes the trajectories and velocities of discrete
phase entities i.e. maintenance devices. Calculation of
maintenance device’s velocity, using a Lagrangian formulation,
includes the device’s inertia, hydrodynamic drag and the force of
gravity. DPM also predicts the effects of turbulence on the
maintenance device due to turbulent eddies present in the
continuous phase i.e. water. Hence, the orientation and the
velocity of the maintenance device have been computed using
DPM. The numerically predicted velocity of the maintenance
device has been verified against the experimental measurements
published by Agarwal et al [11], as shown in figure 3. It can be
seen that DPM predicted Vc is in close agreement with
experimentally measured Vc.
Figure 3. Variations in Vc numerically and experimentally
recorded.
Three dimensional time-averaged Navier-Stokes equations, along-
with the continuity equation, have been iteratively solved for
steady-state turbulent flow of water, and maintenance device,
within pipe bends. Flow turbulence has been modelled using 2-
equation SST k-ω model due to its proven superiority in
accurately modelling the wake regions and extreme pressure
gradients, which are expected to occur in the present case. The
density and dynamic viscosity of water specified are 998.2kg/m3
and 0.001003kg/m-s (at NTP condition). SIMPLE pressure-
velocity coupling algorithm has been employed along with 2nd
order Upwind gradient and interpolation schemes for better
accuracy of numerically predicted results.
3. RESULTS AND DISCUSSIONS Before moving on to the flow diagnostics within hydraulic bends
having rectangular shaped maintenance devices present within,
water flow behaviour alone needs to be investigated. As the focus
of the present study is on the formation and strength of secondary
flows within pipe bends due to maintenance device, a method
which is based on the velocity gradient tensor has been adopted.
A unique parameter, called Q-criteria, has thus been used to
analyse the flow structures within pipe bends, where Q-criteria is
defined as:
Q = 1/2 (ω^2 – SR^2) (1) 17
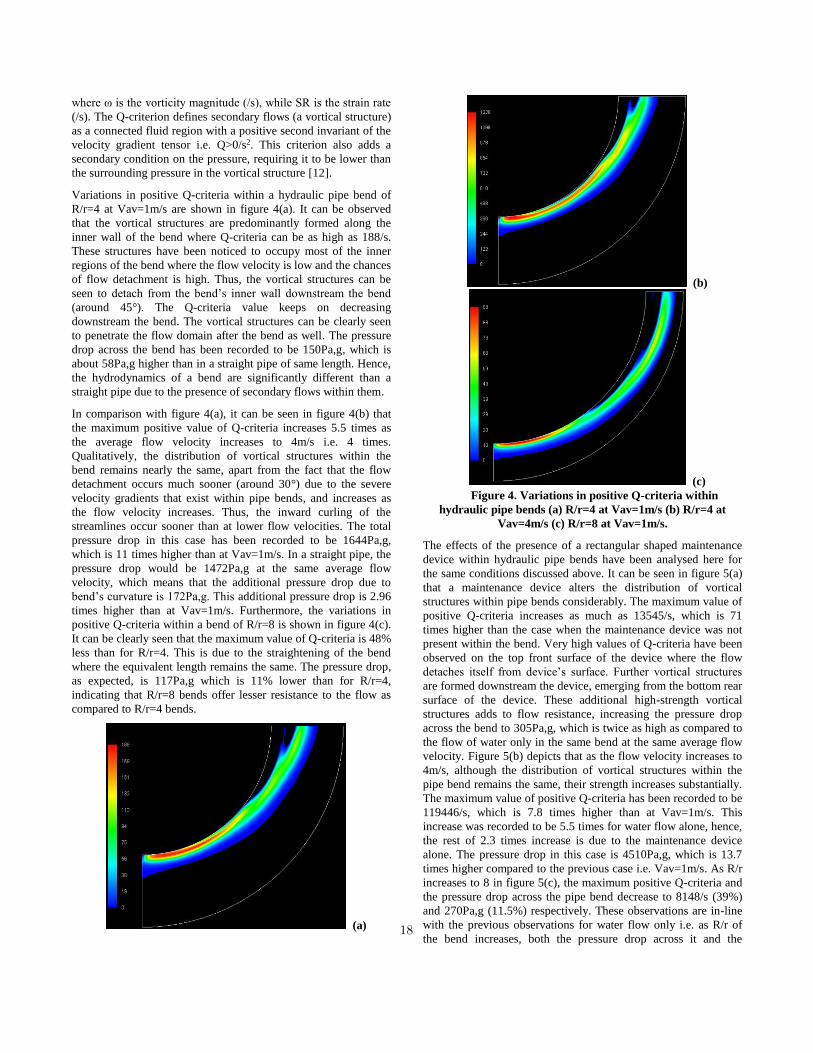
where ω is the vorticity magnitude (/s), while SR is the strain rate
(/s). The Q-criterion defines secondary flows (a vortical structure)
as a connected fluid region with a positive second invariant of the
velocity gradient tensor i.e. Q>0/s2. This criterion also adds a
secondary condition on the pressure, requiring it to be lower than
the surrounding pressure in the vortical structure [12].
Variations in positive Q-criteria within a hydraulic pipe bend of
R/r=4 at Vav=1m/s are shown in figure 4(a). It can be observed
that the vortical structures are predominantly formed along the
inner wall of the bend where Q-criteria can be as high as 188/s.
These structures have been noticed to occupy most of the inner
regions of the bend where the flow velocity is low and the chances
of flow detachment is high. Thus, the vortical structures can be
seen to detach from the bend’s inner wall downstream the bend
(around 45°). The Q-criteria value keeps on decreasing
downstream the bend. The vortical structures can be clearly seen
to penetrate the flow domain after the bend as well. The pressure
drop across the bend has been recorded to be 150Pa,g, which is
about 58Pa,g higher than in a straight pipe of same length. Hence,
the hydrodynamics of a bend are significantly different than a
straight pipe due to the presence of secondary flows within them.
In comparison with figure 4(a), it can be seen in figure 4(b) that
the maximum positive value of Q-criteria increases 5.5 times as
the average flow velocity increases to 4m/s i.e. 4 times.
Qualitatively, the distribution of vortical structures within the
bend remains nearly the same, apart from the fact that the flow
detachment occurs much sooner (around 30°) due to the severe
velocity gradients that exist within pipe bends, and increases as
the flow velocity increases. Thus, the inward curling of the
streamlines occur sooner than at lower flow velocities. The total
pressure drop in this case has been recorded to be 1644Pa,g,
which is 11 times higher than at Vav=1m/s. In a straight pipe, the
pressure drop would be 1472Pa,g at the same average flow
velocity, which means that the additional pressure drop due to
bend’s curvature is 172Pa,g. This additional pressure drop is 2.96
times higher than at Vav=1m/s. Furthermore, the variations in
positive Q-criteria within a bend of R/r=8 is shown in figure 4(c).
It can be clearly seen that the maximum value of Q-criteria is 48%
less than for R/r=4. This is due to the straightening of the bend
where the equivalent length remains the same. The pressure drop,
as expected, is 117Pa,g which is 11% lower than for R/r=4,
indicating that R/r=8 bends offer lesser resistance to the flow as
compared to R/r=4 bends.
(a)
(b)
(c)
Figure 4. Variations in positive Q-criteria within
hydraulic pipe bends (a) R/r=4 at Vav=1m/s (b) R/r=4 at
Vav=4m/s (c) R/r=8 at Vav=1m/s.
The effects of the presence of a rectangular shaped maintenance
device within hydraulic pipe bends have been analysed here for
the same conditions discussed above. It can be seen in figure 5(a)
that a maintenance device alters the distribution of vortical
structures within pipe bends considerably. The maximum value of
positive Q-criteria increases as much as 13545/s, which is 71
times higher than the case when the maintenance device was not
present within the bend. Very high values of Q-criteria have been
observed on the top front surface of the device where the flow
detaches itself from device’s surface. Further vortical structures
are formed downstream the device, emerging from the bottom rear
surface of the device. These additional high-strength vortical
structures adds to flow resistance, increasing the pressure drop
across the bend to 305Pa,g, which is twice as high as compared to
the flow of water only in the same bend at the same average flow
velocity. Figure 5(b) depicts that as the flow velocity increases to
4m/s, although the distribution of vortical structures within the
pipe bend remains the same, their strength increases substantially.
The maximum value of positive Q-criteria has been recorded to be
119446/s, which is 7.8 times higher than at Vav=1m/s. This
increase was recorded to be 5.5 times for water flow alone, hence,
the rest of 2.3 times increase is due to the maintenance device
alone. The pressure drop in this case is 4510Pa,g, which is 13.7
times higher compared to the previous case i.e. Vav=1m/s. As R/r
increases to 8 in figure 5(c), the maximum positive Q-criteria and
the pressure drop across the pipe bend decrease to 8148/s (39%)
and 270Pa,g (11.5%) respectively. These observations are in-line
with the previous observations for water flow only i.e. as R/r of
the bend increases, both the pressure drop across it and the 18
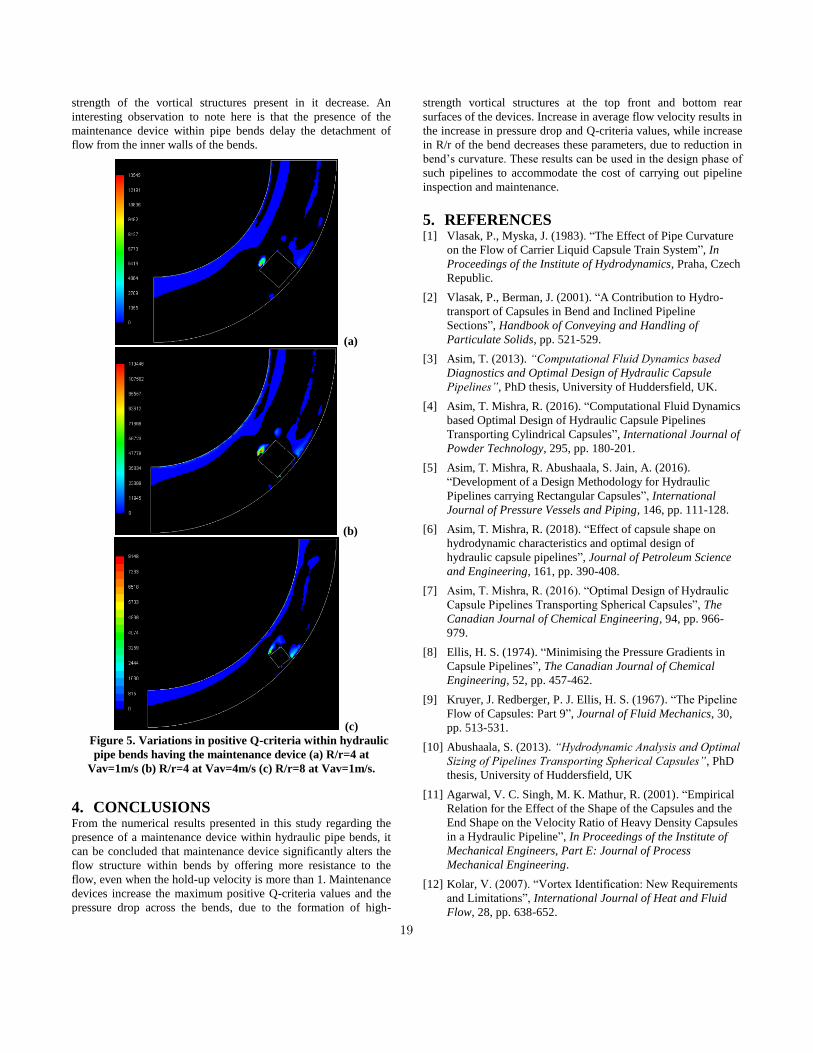
strength of the vortical structures present in it decrease. An
interesting observation to note here is that the presence of the
maintenance device within pipe bends delay the detachment of
flow from the inner walls of the bends.
(a)
(b)
(c)
Figure 5. Variations in positive Q-criteria within hydraulic
pipe bends having the maintenance device (a) R/r=4 at
Vav=1m/s (b) R/r=4 at Vav=4m/s (c) R/r=8 at Vav=1m/s.
4. CONCLUSIONS From the numerical results presented in this study regarding the
presence of a maintenance device within hydraulic pipe bends, it
can be concluded that maintenance device significantly alters the
flow structure within bends by offering more resistance to the
flow, even when the hold-up velocity is more than 1. Maintenance
devices increase the maximum positive Q-criteria values and the
pressure drop across the bends, due to the formation of high-
strength vortical structures at the top front and bottom rear
surfaces of the devices. Increase in average flow velocity results in
the increase in pressure drop and Q-criteria values, while increase
in R/r of the bend decreases these parameters, due to reduction in
bend’s curvature. These results can be used in the design phase of
such pipelines to accommodate the cost of carrying out pipeline
inspection and maintenance.
5. REFERENCES [1] Vlasak, P., Myska, J. (1983). “The Effect of Pipe Curvature
on the Flow of Carrier Liquid Capsule Train System”, In
Proceedings of the Institute of Hydrodynamics, Praha, Czech
Republic.
[2] Vlasak, P., Berman, J. (2001). “A Contribution to Hydro-
transport of Capsules in Bend and Inclined Pipeline
Sections”, Handbook of Conveying and Handling of
Particulate Solids, pp. 521-529.
[3] Asim, T. (2013). “Computational Fluid Dynamics based
Diagnostics and Optimal Design of Hydraulic Capsule
Pipelines”, PhD thesis, University of Huddersfield, UK.
[4] Asim, T. Mishra, R. (2016). “Computational Fluid Dynamics
based Optimal Design of Hydraulic Capsule Pipelines
Transporting Cylindrical Capsules”, International Journal of
Powder Technology, 295, pp. 180-201.
[5] Asim, T. Mishra, R. Abushaala, S. Jain, A. (2016).
“Development of a Design Methodology for Hydraulic
Pipelines carrying Rectangular Capsules”, International
Journal of Pressure Vessels and Piping, 146, pp. 111-128.
[6] Asim, T. Mishra, R. (2018). “Effect of capsule shape on
hydrodynamic characteristics and optimal design of
hydraulic capsule pipelines”, Journal of Petroleum Science
and Engineering, 161, pp. 390-408.
[7] Asim, T. Mishra, R. (2016). “Optimal Design of Hydraulic
Capsule Pipelines Transporting Spherical Capsules”, The
Canadian Journal of Chemical Engineering, 94, pp. 966-
979.
[8] Ellis, H. S. (1974). “Minimising the Pressure Gradients in
Capsule Pipelines”, The Canadian Journal of Chemical
Engineering, 52, pp. 457-462.
[9] Kruyer, J. Redberger, P. J. Ellis, H. S. (1967). “The Pipeline
Flow of Capsules: Part 9”, Journal of Fluid Mechanics, 30,
pp. 513-531.
[10] Abushaala, S. (2013). “Hydrodynamic Analysis and Optimal
Sizing of Pipelines Transporting Spherical Capsules”, PhD
thesis, University of Huddersfield, UK
[11] Agarwal, V. C. Singh, M. K. Mathur, R. (2001). “Empirical
Relation for the Effect of the Shape of the Capsules and the
End Shape on the Velocity Ratio of Heavy Density Capsules
in a Hydraulic Pipeline”, In Proceedings of the Institute of
Mechanical Engineers, Part E: Journal of Process
Mechanical Engineering.
[12] Kolar, V. (2007). “Vortex Identification: New Requirements
and Limitations”, International Journal of Heat and Fluid
Flow, 28, pp. 638-652.
19
Railway Defender Kill Chain for Cybersecurity
Ravdeep Kour
Division of Operation and Maintenance Engineering,
Luleå University of Technology, 97187, Lulea, Sweden
+46-722541267 [email protected]
Adithya Thaduri Division of Operation and Maintenance Engineering,
Luleå University of Technology, 97187, Lulea, Sweden
Ramin Karim
Division of Operation and Maintenance Engineering,
Luleå University of Technology, 97187, Lulea, Sweden
ABSTRACT The railway is one of the most important infrastructures and its security is as important as other critical infrastructures. Due to the increase in cyber-attacks, there is an increasing trend in the field of cybersecurity. The history of cyber incidents suggested that the railway needs immediate security measures or defensive controls for forthcoming advanced persistent threats (APT). Cyber Kill Chain (CKC) is one of the most widely used models for the identification, detection, and prevention of advanced persistent threats. CKC model was introduced by Lockheed Martin that consists of seven stages as Reconnaissance, Weaponize, Delivery, Exploitation, Installation, Command & Control, and Act on Objective. Breaking the chain as early as possible in the CKC model will help the defender to stop adversary’s malicious actions. As the railway is adapting digital technologies and, therefore, there is a risk that adversary can penetrate into the system following the steps of CKC. The objective of this research is to reduce the risk cyber-attacks by proposing Railway Defender Kill Chain (RDKC) that provides security controls at each phase of Cyber Kill Chain to predict, prevent, detect and respond to cyber threats.
Keywords Cyber kill chain, railway, cyber-attack, Railway Defender kill chain.
1. INTRODUCTION Railway system is one of the complex systems and its convergence with Information Technology (IT) and Operational Technology (OT) has brought significant benefits in reliability, maintainability, operational efficiency, capacity as well as improvements in passenger experience. On the one hand, Europian Union and Shift2Rail programs [1] have proposed to include Information and Communication Technology (ICT) in transportation because they expect potential benefits. On the other hand, digitization in railway is also bringing vulnerabilities towards cyber threats. This concern is not theoretical as many railway organizations, which rely on digital infrastructures, have experienced cybersecurity attacks and authors have provided statistics of these cyber-attacks [2]. The escalation in the implementation of IoT (Internet-of-Things) technologies in machine condition monitoring and predictive maintenance is an excellent innovation, but at the same time, it is a security problem. To add value to business, smart sensors collect condition
monitoring and predictive maintenance data for use in machine learning algorithms. The volume of data generated is huge, creating a significant number of entry points for hackers to steal, corrupt, delete or even modify those data. The main challenges we are facing today are APT (Advanced Persistent Threats), phishing, ransomware, and DDoS (Distributed Senial of Services). NIST defines APT as “An adversary that possesses sophisticated levels of expertise and significant resources which allow it to create opportunities to achieve its objectives by using multiple attack vectors (e.g., cyber, physical, and deception). These objectives typically include establishing and extending footholds within the information technology infrastructure of the targeted organizations for purposes of exfiltrating information, undermining or impeding critical aspects of a mission, program, or organization; or positioning itself to carry out these objectives in the future. The advanced persistent threat:
(i) pursues its objectives repeatedly over an extended period of time;
(ii) adapts to defenders’ efforts to resist it; and (iii) is determined to maintain the level of interaction needed
to execute its objectives” [3]
Therefore, it is essential that railway organizations must move towards security analytics and automation to improve and prevent security breaches and to quickly predict, prevent, detect, and respond to cyber-threats. CKC is one of the most widely used frameworks to detect cyber-attack based on the kill chain tactic of the US military’s F2T2EA (find, fix, track, target, engage and assess) [4]. Researchers are performing analysis of cyber-attacks based on this model and one of the examples is an analysis of cyber-attack on Ukrainian Power Grid [5]. Based on the analysis results, the author presented several mitigation ideas based on publicly available information on ICS (Industrial Control System) incidents in Ukraine. Other researchers in finance and energy sector are also using the cyber kill chain model to detect cyber threats early in its stages [6-7]. CKC model consists of a seven-stage attack path and it is very important to break this path or chain at any stage using defensive controls instead of focusing on defending the organization’s perimeter alone. It is always beneficial to break the chain as early as possible. The advantage of CKC is that the defender has seven opportunities to break the chain. Therefore, just the right mitigation strategy during the initial stage of CKC can break the chain to stop adversary’s malicious actions.
20

RDKC will provide security controls at each stage of the CKC and these defensive controls will help the railway organizations to identify, detect, prevent and predict cyber-attacks. RDKC will use cybersecurity controls, technologies, standards, and defenses that will mitigate security risks that can be characterized in terms of threats that could cause harm to railway assets. RDKC will use a course of action (CoA) matrix provided by Hutchins et al. [8] with an additional course of actions i.e. Prevent, Response, and Recover beside the CKC phases. These course of actions are described as defender actions that determine how to detect, deny, disrupt, degrade, deceive, destroy, prevent, respond, and recover the effectiveness of the adversary events along with the kill chain phases [8]. Thus, understanding each phase of the chain will help the incident responder to identify courses of actions required in RDKC defensive controls. There are no previous works on implementing the cyber kill chain model in Railways at the time of writing. Hence, the objective of this research is to reduce cyber-attacks by predicting, preventing, and detecting them early in the Cyber Kill Chain by applying Railway Defender kill Chain.
2. CYBERSECURITY LANDSCAPE The evolving landscape in cybersecurity from both offense and defense sides show that it has travelled through the age of protection towards the age of prediction and resilience (figure 1).
• Age of Protection: From the early 1990s, the main cybersecurity challenges were viruses, worms, open networks, and systems with insecure configurations. The defense solution available were antiviruses, firewalls, and secure configuration guidelines to ensure that the systems were protected. This phase is called the protection phase and the security focus is vulnerability management.
Figure 1. Evolving landscape in cybersecurity
• Age of Detection: After ten years in 2000's, the main cybersecurity challenges were client-side attacks that exploits vulnerability in web browser, messaging, or streaming applications, automated probes and scans, and too many alerts and locks to review. The defense solutions were SIEM (security information and event management) and IDS (intrusion detection systems). This phase is called detection phase and the security focus is on threat management.
• Age of Response: Currently, we are in 2010's and the main challenges we are facing today are APT (Advanced Persistent Threats), phishing, ransomware, DDoS (Distributed Senial of Services), and botnet. Thus, it is advisable to set up a strong cybersecurity strategy and employ cybersecurity professionals to secure networks and devices against unwanted
infiltration. The defense solutions available are EDR (Endpoint Detection and Response) and IDAM (Identity Access Management). This phase is called the Response phase and the security focus is on risk management.
• Age of Prediction and Resilience: The availability of more advanced and high-quality tools assists attacker to launch automated threats. The attacker is rapidly adapting new techniques and strategies to circumvent new security measures and evade the detection. Authors like, Bahnsen et al. [9] are using simulation to describe how the attackers are using artificial intelligence (AI) to enhance the effectiveness of their phishing attacks. Therefore, there is a need to shift towards the age of prediction and resilience that has the ability to predict and recover quickly from adversities with security solutions like threat intelligence, user behavior analytics, network behavior analytics, end-point analytics, deep packet inspection (DPI), pattern log, self-learning and self-healing capabilities, cloud-based back-ups, and disaster recovery services.
The worldwide statistics show that the most dominant type of cyber-attack is a malware attack. The unknown figures of cyber-attacks are also increasing year-by-year, which are not showing their motives behind the attacks. The attacker is adapting new techniques and strategies to circumvent new security measures and evade the detection. Targeted attacks like APTs are also increasing day-by-day. As the railway is also being digitalized so all these threats, can occur in this system also. Henceforth, there is a need for a resilient system, which can countermeasure malware and automated- advanced cyber threats that can occur in the railway.
3. CYBER KILL CHAIN MODEL To detect cyber incidents within a system, Cyber Kill Chain (CKC) is one of the most widely used frameworks for the identification, detection, and prevention of advanced persistent threats (APT) [10-11]. Some of the researchers have proposed methodologies to detect cyber threats early in the stages of CKC [12-13]. The cyber kill chain is too focused on malware-based intrusion and APTs [14] and, therefore, can be applied in the railway to propose a Railway Defender kill chain, which will be more resilient and proactive in nature. RDKC will provide defensive controls at each phase of the CKC and, therefore, APTs and other malware can be reduced by implementing this proposed framework. An initial CKC model was developed by Lockheed Martin [15]. The seven stages of this model are:
• Reconnaissance: The first stage of the model is the planning stage of the cyber-attack. This stage is one of the most difficult stages to detect from a security monitoring perspective. Adversary searches and gathers information about the target through social sites, conferences, blogs, mailing lists and other network tracing tools. The collected information is useful in the later stages to deliver payload (the actual intended message that performs malicious action) to the target system. In the context of SUCCESS (Energy) Horizon-2020 project [16], authors like Simonov et al. [6] have used CKC Model for the early detection of
21

Reconnaissance activities by using Artificial Intelligence pattern matching methods.
• Weaponize: The second stage of the model is the operation preparation stage. Weaponize stage involves the coupling a remote access Trojan (RAT) with an exploit into a deliverable payload, typically by means of an automated tool (weaponizer) [8].
• Delivery: The third stage of the model is the operation launch stage where the weapon is transmitted to the targeted environment. At this stage, an organization can implement technology as a mitigating control [13].
• Exploitation: At this stage, exploit is triggered to silently install/execute the delivered payload. Usually, the most frequent exploits are operating system, network and application/software level vulnerabilities [17].
• Installation: This stage involves the installation of back door remote access trojans (RAT) and maintains persistence inside the targeted environment.
• Command & Control (C2): After the successful installation of backdoor, the adversary tries to open a two-way communication channel to enable the attacker to control the targeted environment remotely. Once the C2 channel establishes, the adversary has “hands on the keyboard” access inside the targeted environment [8].
• Act on Objective: This is the last stage of the model where adversary achieves the desired attack goals. These goals can be loss of confidentiality, integrity or availability of the assets.
4. RESULTS AND DISCUSSIONS 4.1 Railway Defender Kill Chain Railway Defender Kill Chain (RDKC) shown in figure 2 describes a logic that a defender must follow to stop cyber-attacks by breaking chain at any point. RDKC consists of RDKC matrix, defense-in-depth security, and cybersecurity standards and technologies to be followed to minimize the risk of cyber threats.
Figure 2. Railway Defender kill chain
4.1.1 RDKC Matrix The main objective of the defender is to stop cyber-attack at the initial stage of the CKC by applying security policies or security controls provided in table 1 which are mapped to the six tactics defined by Department of Defense [18] along with new tactics (Predict, Prevent, and Response and Recover). Cells in the matrix can be viewed as characterizing the types of effect a given defensive control could have on a Cyber Kill Chain phase. For example, Reconnaissance-Deny cell is at the intersection of the Deny tactic and the Reconnaissance phase of CKC; means at reconnaissance phase to deny cyber incidents one must follow the defensive strategies provided in Reconnaissance-Deny cell. Therefore, cells in the matrix can be viewed as characterizing the types of effect a given defensive control could have on a CKC phase. One of the advantages of RDKC matrix is that it provides maximum defensive controls at one place to follow quickly. Therefore, by implementing right defensive control from each cell of the matrix will help the railway organizations to reduce the risk of cyber-attacks. The future work of this research will also calculate the probabilities of penetration with varying defensive controls. Consider an example where a threat agent breaches railway SCADA system (Supervisory Control and Data Acquisition Systems) and causes the SCADA system to issue an invalid command to the railway maintenance team. Since railway systems may react differently to invalid commands, the railway system experiences immediate service shut down. The impact of this attack can be-
- Denial of service attack - Devices are remotely shut down, affecting train service - Reconfigure instructions, data or code leading to more destructive
costly attacks - In extreme case, the train accident
Thus, choosing appropriate defensive controls from the RDKC Matrix can defend the system from the above-mentioned threats. Following defensive controls can be chosen from the RDKC Matrix for the above-mentioned example to reduce the cyber threats.
- Provide cybersecurity training to SCADA system operators in railway (Exploitation-Prevent Cell).
- Use Role-Based Access Control (RBAC) in the utility’s SCADA system (Delivery-Prevent Cell)
- Intrusion Detection Systems (IDS) will provide for a more robust SCADA system (Delivery-Detect Cell)
- Authenticate railway users accessing the SCADA system (Installation-Prevent Cell)
- Check message integrity for messages issued by the SCADA system (Delivery-Degrade Cell and Installation-Detect Cell)
- Use of advanced technologies that have the capability to monitor and detect irregular cyber activity within the railway network (Reconnaissance-Detect Cell; Delivery-Detect Cell; Exploitation-Detect Cell)
Therefore, RDKC Matrix will help in providing all-in-one defensive controls at one place to be chosen quickly to reduce the risk of cyber-threats in railway. 22
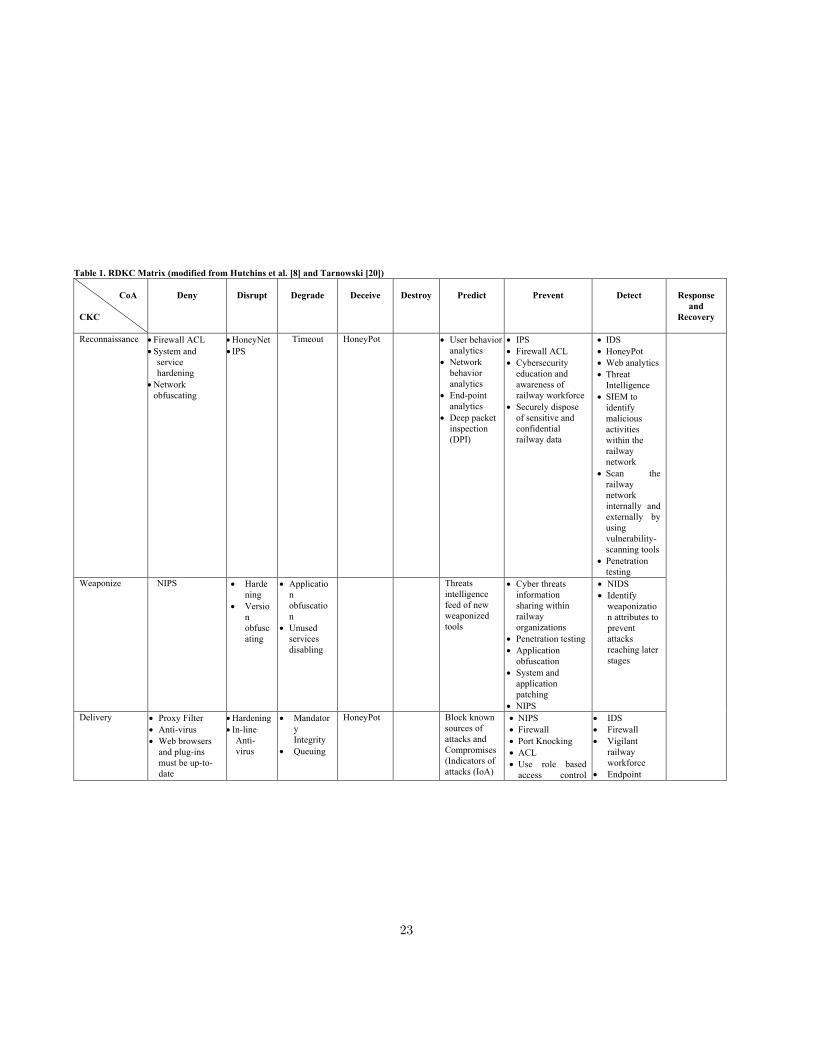
Table 1. RDKC Matrix (modified from Hutchins et al. [8] and Tarnowski [20]) CoA CKC
Deny
Disrupt
Degrade
Deceive
Destroy
Predict
Prevent
Detect
Response
and Recovery
Reconnaissance
• Firewall ACL • System and
service hardening
• Network obfuscating
• HoneyNet • IPS
Timeout HoneyPot • User behavior analytics
• Network behavior analytics
• End-point analytics
• Deep packet inspection (DPI)
• IPS • Firewall ACL • Cybersecurity
education and awareness of railway workforce
• Securely dispose of sensitive and confidential railway data
• IDS • HoneyPot • Web analytics • Threat
Intelligence • SIEM to
identify malicious activities within the railway network
• Scan the railway network internally and externally by using vulnerability-scanning tools
• Penetration testing
Weaponize
NIPS • Hardening
• Version obfuscating
• Application obfuscation
• Unused services disabling
Threats intelligence feed of new weaponized tools
• Cyber threats information sharing within railway organizations
• Penetration testing • Application
obfuscation • System and
application patching
• NIPS
• NIDS • Identify
weaponization attributes to prevent attacks reaching later stages
Delivery
• Proxy Filter • Anti-virus • Web browsers
and plug-ins must be up-to-date
• Hardening • In-line
Anti-virus
• Mandatory Integrity
• Queuing
HoneyPot
Block known sources of attacks and Compromises (Indicators of attacks (IoA)
• NIPS • Firewall • Port Knocking • ACL • Use role based
access control
• IDS • Firewall • Vigilant
railway workforce
• Endpoint
23

and Indicators of compromise (IoC))
(RBAC) to limit who has access to the railway enterprise network, SCADA system (Supervisory Control and Data Acquisition Systems) or ETCS (European Train Control System) system
• Network traffic disable
Malware Protection
• Setup alerts to notify railway IT-Staff of blocked attempts to keep track of their frequency
Exploitation
• Patching • Use dedicated
anti ransomware utility/ blocker
• Hardening • DEP
• Configuration auto-rollback
• Remove remote administration capabilities from web platforms
HoneyPot
Correlate flows and block malicious behavior of devices
• User awareness training
• Secure coding training for web developers
• Local sandbox • System and
application updates
• Security toolkits • Turn operating
System update ON
• HIDS • Endpoint
Malware Protection
• Proactive penetration testing for application and operating system vulnerabilities
• Isolate infected systems from the network
• Web Blocker
• Data loss prevention (DLP) technology
• Continuity of Operations Plan
• Disaster Recovery Operations Plan
• Forensic
Installation • EDR • Multi-factor
authentication • Authenticate
users so that physical access to the railway asset(s) does not automatically grant logical access
• Remove hardcoded credentials on railway computerized maintenance management
• Hardening • Anti-
Virus
• Configuration auto-rollback
• HoneyPot • DNS
redirect
EDR
Automatic isolation of infected devices to prevent the horizontal spread
• Cybersecurity education and awareness of railway workforce • HIPS • App Whitelisting • Multi-Factor
Authentication (MFA)
• HIDS • IP Sonar • Integrity
check • Configuration
check
24
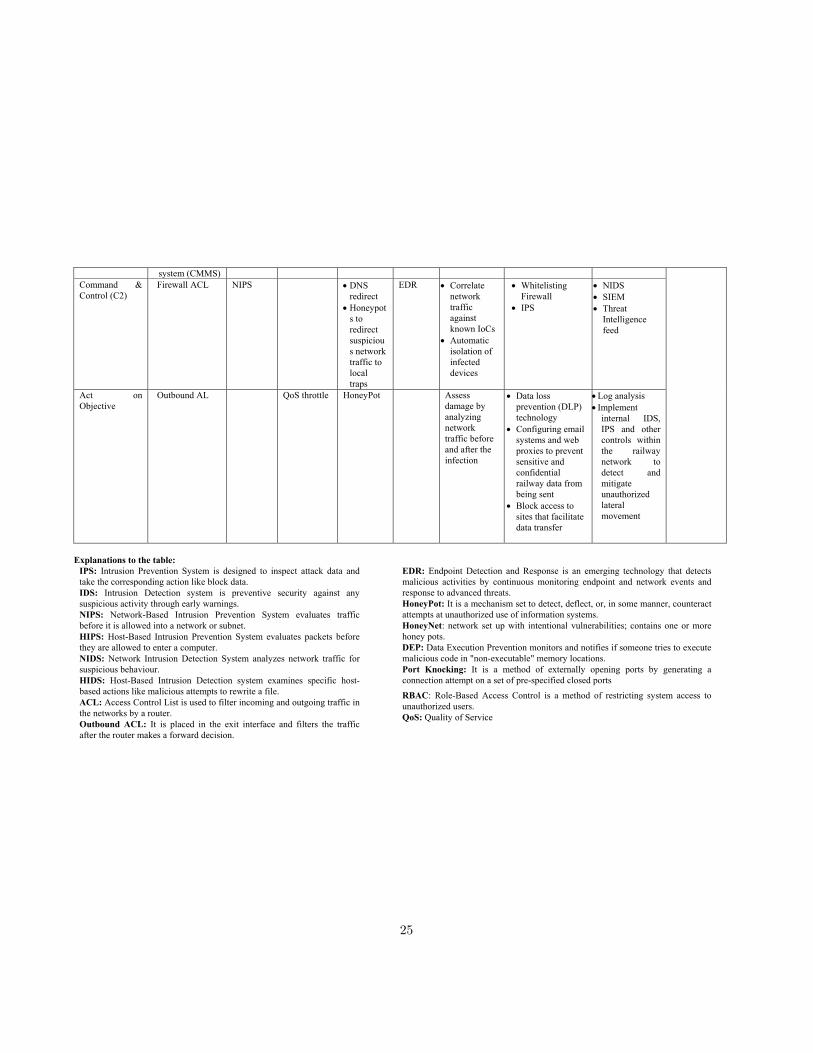
system (CMMS) Command & Control (C2)
Firewall ACL
NIPS • DNS redirect
• Honeypots to redirect suspicious network traffic to local traps
EDR • Correlate network traffic against known IoCs
• Automatic isolation of infected devices
• Whitelisting Firewall
• IPS
• NIDS • SIEM • Threat
Intelligence feed
Act on Objective
Outbound AL QoS throttle HoneyPot
Assess damage by analyzing network traffic before and after the infection
• Data loss prevention (DLP) technology
• Configuring email systems and web proxies to prevent sensitive and confidential railway data from being sent
• Block access to sites that facilitate data transfer
• Log analysis • Implement
internal IDS, IPS and other controls within the railway network to detect and mitigate unauthorized lateral movement
Explanations to the table:
IPS: Intrusion Prevention System is designed to inspect attack data and take the corresponding action like block data. IDS: Intrusion Detection system is preventive security against any suspicious activity through early warnings. NIPS: Network-Based Intrusion Prevention System evaluates traffic before it is allowed into a network or subnet. HIPS: Host-Based Intrusion Prevention System evaluates packets before they are allowed to enter a computer. NIDS: Network Intrusion Detection System analyzes network traffic for suspicious behaviour. HIDS: Host-Based Intrusion Detection system examines specific host-based actions like malicious attempts to rewrite a file. ACL: Access Control List is used to filter incoming and outgoing traffic in the networks by a router. Outbound ACL: It is placed in the exit interface and filters the traffic after the router makes a forward decision.
EDR: Endpoint Detection and Response is an emerging technology that detects malicious activities by continuous monitoring endpoint and network events and response to advanced threats. HoneyPot: It is a mechanism set to detect, deflect, or, in some manner, counteract attempts at unauthorized use of information systems. HoneyNet: network set up with intentional vulnerabilities; contains one or more honey pots. DEP: Data Execution Prevention monitors and notifies if someone tries to execute malicious code in "non-executable" memory locations. Port Knocking: It is a method of externally opening ports by generating a connection attempt on a set of pre-specified closed ports RBAC: Role-Based Access Control is a method of restricting system access to unauthorized users. QoS: Quality of Service
25
4.1.2 Defense-in-Depth Security Defense-in-Depth (DiD) is a cybersecurity approach with multi-layered defensive mechanisms in order to protect valuable data and information. If one defensive mechanism fails, another starts immediately to prevent an attack. The purpose of the defense-in-depth approach is to defend a system against any particular attack using several independent methods. These multi-layered defensive mechanisms do not provide perfect security but can strengthen and complicates cyber security level. Therefore, railway organizations need to develop more complete and complex proactive defensive mechanisms along with the prediction, prevention and, detection of cyber-attacks using proposed RDKC.
4.1.3 Cybersecurity standards and Technologies Many activities related to cybersecurity in railway are on-going like Cybersecurity in the RAILway (CYRAIL) project, a Shift2Rail sub-project [1]. Thales' [19] is also supporting the Shift2Rail program of the European Commission by participating in the development of CERTs (Computer Emergency Response Teams). In addition to these ongoing activities, railway organizations must follow private sector resources for sharing cybersecurity information like NIST Computer Security Resource Center (CSRC), Industrial Control Systems-Computer Emergency Response Teams (ICS-CERT), U.S. Computer Emergency Readiness Team (US-CERT), The Public Transportation Information Sharing and Analysis Center (PT-ISAC), and Center for Internet Security, Inc. (CIS®). To defend against cyber threats, it is very essential to predict, prevent, and detect cyber-attacks earlier in the CKC that will further reduce the amount of remediation that needs to be performed by security professionals. It has been observed that the delivery stage is the most important stage where an organization can implement prevention technology as a mitigating control to block the malicious payload from entering the networks. In addition to prevention of cyber-attacks, detection of these attacks is also very significant to further analyze whether there has been a breach. Thus, along with the prevention and detection of cyber-attacks, RDKC provides a way to move towards a proactive defensive mechanism with layered preventative and detective technologies.
5. CONCLUSIONS Cyber-attacks are increasing in many sectors, including finance, health, grid, government, transportation, etc. With the digitization of the railway, its vulnerability towards cyber-attacks is increasing and, therefore, suggesting the need to focus on cybersecurity. This research is focused on cyber kill chain and proposed a Railway Defender kill Chain (RDKC) that provides security controls at each phase of Cyber Kill Chain to predict, prevent, detect and respond to cyber threats. The outcome of the research is RDKC with a matrix which contains all-in-one defensive technologies along with new tactics (Predict, Prevent, and Response and Recover. Thus, this research suggests the most appropriate technologies and defensive controls that can be used at each stage of the CKC to reduce the risk of cyber-attacks. The choice of defensive controls can be improved based on the future trend of the cyber-attacks. Therefore, selecting the most appropriate technologies and controls is a learning process i.e. learning from experience.
6. REFERENCES [1] Shift2Rail. Cybersecurity in the railway sector,
https://shift2rail.org/project/cyrail/ (accessed 23 September 2018).
[2] Kour, R., Aljumaili, M., Karim, R., & Tretten, P. (2019). eMaintenance in railways: Issues and challenges in cybersecurity. Proceedings of the Institution of Mechanical Engineers, Part F: Journal of Rail and Rapid Transit, 0954409718822915.
[3] Force, J. T., & Initiative, T. (2013). Security and privacy controls for federal information systems and organizations. NIST Special Publication, 800(53), 8-13.
[4] Martin, L. Cyber Kill Chain®. Available at https://www.lockheedmartin.com/en-us/capabilities/cyber/cyber-kill-chain.html . Accessed on 12-01-2019.
[5] Case, D. U. (2016). Analysis of the cyber attack on the Ukrainian power grid. Electricity Information Sharing and Analysis Center (E-ISAC).
[6] Simonov, M., Bertone, F., Goga, K., & Terzo, O. (2018, July). Cyber Kill Chain Defender for Smart Meters. In Conference on Complex, Intelligent, and Software Intensive Systems (pp. 386-397). Springer, Cham.
[7] Kiwia, D., Dehghantanha, A., Choo, K. K. R., & Slaughter, J. (2018). A cyber kill chain based taxonomy of banking Trojans for evolutionary computational intelligence. Journal of computational science, 27, 394-409.
[8] Hutchins, E. M., Cloppert, M. J., & Amin, R. M. (2011). Intelligence-driven computer network defense informed by analysis of adversary campaigns and intrusion kill chains. Leading Issues in Information Warfare & Security Research, 1(1), 80.
[9] Bahnsen, A. C., Torroledo, I., Camacho, D., & Villegas, S. (2018). DeepPhish: Simulating Malicious AI. In 2018 APWG Symposium on Electronic Crime Research (eCrime) (pp. 1-8).
[10] Wen, S., Rao, Y., & Yan, H. (2018, March). Information Protecting against APT Based on the Study of Cyber Kill Chain with Weighted Bayesian Classification with Correction Factor. In Proceedings of the 7th International Conference on Informatics, Environment, Energy and Applications (pp. 231-235). ACM.
[11] Garba, F.A., Junaidu, S.B., Ahmad, I., Tekanyi, M.S. (2018). Proposed Framework for Effective Detection and Prediction of Advanced Persistent Threats Based on the Cyber Kill Chain.
[12] Herwono, I., & El-Moussa, F. A. (2018). Automated Detection of the Early Stages of Cyber Kill Chain. In ICISSP (pp. 182-189).
[13] Velazquez, C. (2015). Detecting and preventing attacks earlier in the kill chain. SANS Institute Infosec Reading Room, 1-21.
[14] Ayrour, Y., Raji, A., & Nassar, M. (2018). Modelling cyber-attacks: a survey study. Network Security, 2018(3), 13-19.
[15] Cloppert, M. (2009). Security Intelligence: Attacking the Cyber Kill Chain. SANS Computer Forensics.
26

[16] Success. European Unions Horizon 2020 research and innovation programme under grant agreement No 700416, available at https://success-energy.eu/ (accessed 24 April 2019).
[17] Yadav, T., and Rao, A.M. (2015). Technical aspects of cyber kill chain. In International Symposium on Security in Computing and Communication (pp. 438-452). Springer, Cham.
[18] Department of Defense. (2014) JP 3-13 Information Operations.
[19] Thales. Railway Digitalization: Cybersecurity, https://www.thalesgroup.com/en/spain/magazine/railway-digitalization-cybersecurity (accessed 23 September 2018).
[20] Tarnowski, I. (2017). How to use cyber kill chain model to build cybersecurity? Wroclaw Centre for Networking and Supercomputing, Wroclaw University of Science and Technology, Poland, 2017, available at https://tnc17.geant.org/getfile/3513 (accessed 12 Feb 2018).
27

Cybersecurity Workforce in Railway: A Case Study Ravdeep Kour
Division of Operation and Maintenance Engineering,
Luleå University of Technology,
97187, Lulea, Sweden +46-722541267
Phillip Tretten
Division of Operation and Maintenance Engineering,
Luleå University of Technology,
97187, Lulea, Sweden +46-705664940 [email protected]
Ramin Karim
Division of Operation and Maintenance Engineering,
Luleå University of Technology,
97187, Lulea, Sweden +46-725413833
Sarbjeet Singh
Division of Operation and Maintenance Engineering,
Luleå University of Technology,
97187, Lulea, Sweden +46-724545472
ABSTRACT Railway will continue to adapt new digital solutions which are necessary and vulnerable to cyber threats. The history of cyber-attacks on critical infrastructures including railway suggests that there is a need for cybersecurity awareness. Both for employees and the general public. The very first step in cyber hygiene is cybersecurity training and awareness for the workforce. A well-educated workforce plays a vital role in building more cyber resiliency across the organization's operation and maintenance. The objective of this research is to evaluate the cybersecurity maturity level for workforce management in three railway organizations. The results show that there is a cybersecurity workforce gap and there is a need to eliminate this gap by enhancing cybersecurity workforce culture. Henceforth, this gap can be improved by developing cybersecurity culture, including cybersecurity training and awareness and by following recommendations provided in this paper.
Keywords Railway, cybersecurity, workforce, maturity level indicators.
1. INTRODUCTION Cybersecurity challenges are growing daily in all the sectors and the greatest challenge is to educate the workforce on how to deal with the cybersecurity threats [1], [2]. A key is understanding the Human Factors opportunities in their role in the process of information security [3]. As railway in particular to eMaintenance is adapting new digital technologies and, therefore, it becomes a challenge to improve the expertise of the existing workforce and appoint workers with the suitable level of cybersecurity education, experience and training. Therefore, the lack of cybersecurity education among the workforce is creating a more severe challenge, where the impacts and consequences are incredible. Thus, for the workforce management, railway organizations must establish and maintain procedures, plans and controls to create cybersecurity culture within the organization, like cybersecurity training and awareness programs. Workforce management is to “establish and maintain plans, procedures, technologies and controls to create a culture of cybersecurity” [4].
In general, there is low cybersecurity awareness in the transportation sector [5]. The lack of cybersecurity knowledge creates an even more severe challenge now with the onset of IoT
(Internet of Things) and other smart devices. These will expose organizations and individuals to new threats where the impact and consequences can be catastrophic. Therefore, it is critical to ensure that the workforce of railway organizations using Information and Communications Technology (ICT) based maintenance are vigilant, fully aware of newly advanced cyber-threats and trained to follow cybersecurity practices at all times. In addition to this, system vulnerabilities can be used to steal or alter railway data for taking control of the system or disrupting railway operations and maintenance. This risk can be minimized by regular follow-up on reported threats and vulnerabilities, installation of security patches or upgrades for closing the security gaps left open by system vulnerabilities and by using more advanced and proactive cybersecurity standards. Therefore, it is very important to identify, prioritize and address threats and vulnerabilities using security analytics and automation. Overall, it is the human user who is responsible for all these stated activities. Therefore, cybersecurity training and awareness is very important as other activities in the railway organization. Researchers have ignored human operators' response behavior in earlier cybersecurity research [6], [7] due to their interest in examining which security requirements would be usefully satisfied in engineering tools. Human factors are a major concern during cyber-attack as it exposes the railway workforce to great uncertainty. Although initial signs of system failure might be unclear when technical malfunctions occur, human operators can normally apply procedures to solve the associated technical problems or call for technical support. Categorical request for technical support from operators for technical support can increase the reaction time during a cyber-attack which results in ill-informed decisions causing a major cybersecurity incident. During a possible system failure, railway workforce can anticipate not only its own course of action but also the railway system behavior, which makes the operator rely on the fact that they will receive an alert during the event of malfunctioning/failure. In contrast, during cyber-attack, the human operator does not know whether the signs/alerts are trustworthy or clear alert that a railway system is under a cyber-attack. In case of emergency, the human factors follow the standard operating procedure, but in case of cyber-attack, it is hard to say whether the problem is solvable with the procedures or it can cause another problem right afterwards. If human operators automatically follow standard procedures, potential invaders may exploit the operators'
28

knowledge in order to manipulate the behavior of the railroad's workforce. It is pertinent to mention that handling railway cyber-attacks, which are likely characterized by unclear signs lacking clear reaction options, becomes very difficult for human operators. Therefore, it becomes very essential to evaluate the cybersecurity maturity level of the railway workforce before some adverse incident happens. The objective of this research is to evaluate the cybersecurity capabilities of workforce management in railway organizations. The structure of this paper is as follows: the introduction is followed by a list of cybersecurity incidents due to human negligence in the railway sector. In continuation, the research methodology is described, followed by results and discussions. Finally, conclusions are listed.
2. CYBER INCIDENTS IN RAILWAY DUE TO WORKFORCE NEGLIGENCE Over the last years, cybersecurity incidents related to railways have increased. Previous work of this research shows that hacker’s targeted rail companies in the UK, Germany, US, Poland, South Korea, China, Denmark, and Sweden [8]. Some of the examples of cyber incidents in the railway are due to human error, e.g.; in 2013, NMBS, national railway company of Belgium, faced an accidental cybersecurity incident where data belonging to customers in Belgium, France, UK and thousands of Commission and Parliament employees were made openly avaliable [8]. According to securityaffairs [9], the Chinese national train reservation system was targeted by an insider attack in 2014 where personal data of customers was stolen. In addition to this, a data breach in the Swedish Transport Agency due to careless of an employee led to the leak of the private data about every vehicle owner [10]. Clearly, these cyber incidents show that there is a need to educate the workforce of railway organization so that disaster does not happen in the future.
3. RESEARCH METHODOLOGY To conduct this study, Cybersecurity Capability Maturity Model (C2M2) [4] has been adapted, which is focused on cybersecurity. This model is to be implemented in conjunction with the National Institute for Standards and Technology (NIST) framework [4]. C2M2 Model is very simple in the form of the questionnaire which uses four Maturity Indicator Levels, (MILs) 0–3. This research study has introduced new level MIL4 with advanced security analytics practices. Therefore, a questionnaire based on this model with some newly advanced security practices was sent to the railway organizations to evaluate the cybersecurity maturity level of railway workforce management. Figure 1 shows various steps followed in the research methodology. Primary data, in the form of a questionnaire, are sent to various railway organizations but only three have responded. Online mode has been used to get responses from these organizations. Sharing this data is really a challenging job for railway organizations. The organizations have the perception that by sharing cybersecurity data, there are chances of attacks in the future. However, if more other railway organizations share their cybersecurity workforce management data, there will be more room to identify gaps for improvements. Therefore, there is a need to communicate and unite to tackle the problem of cybersecurity, which is one of the biggest challenges to the critical infrastructures and the railway is one of those.
1Data Collection
2Evaluate Current
Cybersecurity Status
3Analyze Identified
Gaps
4Communicate Results
Figure 1. Research Methodology.
The cybersecurity workforce management maturity levels within railway organizations have been evaluated by the railway system architecture, along with information and operational security staff, dedicated security staff and high-level group of persons. After conducting an evaluation of the cybersecurity capabilities, the data was analyzed by using Cybersecurity Capability Maturity Model toolkit. Analyzed results are presented by using colored pie charts, which illustrate results for workforce management along with attained maturity levels. More comprehensive results along with the detailed gap summary are with the authors for data confidentiality. The assessed results are communicated to the corresponding railway organizations to set goals and priorities for improvement in a cybersecurity program. These communicated results include identified cybersecurity gaps in their current cybersecurity program.
4. RESULTS AND DISCUSSIONS In this research study, C2M2 model with a particular focus on Workforce Management domain has been adapted and modified in railway.
4.1 Workforce Maturity Levels within Railway Organizations This research study evaluated the maturity level of cybersecurity capabilities of railway workforce to identify gaps in their current cybersecurity program. Pie charts in figures 2-4 shows objectives of workforce management for railway 1, railway 2 and railway 3 respectively along with the level of implementation of their practices (i.e., Fully Implemented, Largely Implemented, Partially Implemented, and Not Implemented). Each of this objective is explained in C2M2 [4]. The pie charts use color-coding to specify the answers. Dark green signifies an answer of “fully implemented” and light green is “largely implemented”; these are positive answers for attaining a MIL level [4]. Light red is “partially implemented” and dark red is “not implemented”; these are negative answers [4]. For railway 1 to railway 3, there are five objectives of workforce management and within each objective, there is a number of practices. For example, for the first objective “Assign Cybersecurity Responsibilities” of railway 1, there are total ten practices: six are “largely implemented”, one is “partially implemented” and three are “not implemented”, that prevent it to attain higher maturity level. In figures 2-4, when we sum-up all the practices in the center of pie-chart (e.g., 10+9+12+6+9=46), we get total number of practices requied to attain MIL4 for workforce Management. The attainted maturity level results are presented in figure 5 and figure 6. All the detailed evaluated gaps have been sent to respective railway organizations and these 29
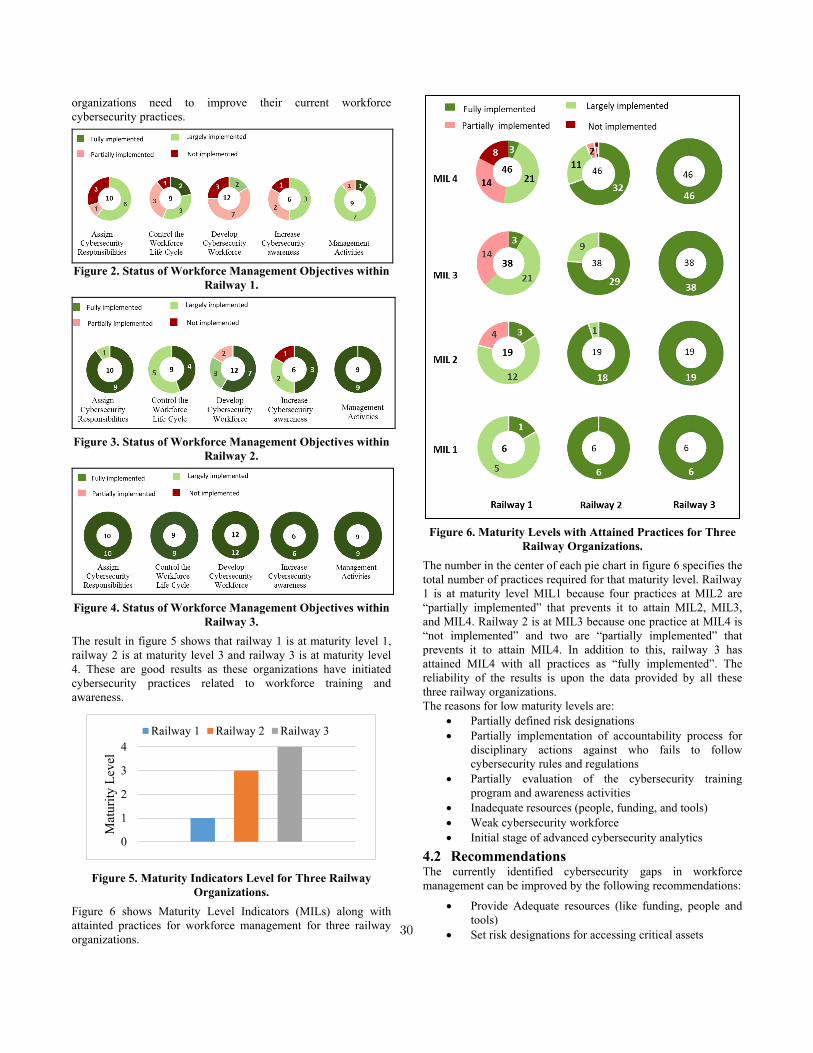
organizations need to improve their current workforce cybersecurity practices.
Figure 2. Status of Workforce Management Objectives within Railway 1.
Figure 3. Status of Workforce Management Objectives within
Railway 2.
Figure 4. Status of Workforce Management Objectives within
Railway 3. The result in figure 5 shows that railway 1 is at maturity level 1, railway 2 is at maturity level 3 and railway 3 is at maturity level 4. These are good results as these organizations have initiated cybersecurity practices related to workforce training and awareness.
0
1
2
3
4
Mat
urity
Lev
el
Railway 1 Railway 2 Railway 3
Figure 5. Maturity Indicators Level for Three Railway
Organizations. Figure 6 shows Maturity Level Indicators (MILs) along with attainted practices for workforce management for three railway organizations.
Figure 6. Maturity Levels with Attained Practices for Three
Railway Organizations. The number in the center of each pie chart in figure 6 specifies the total number of practices required for that maturity level. Railway 1 is at maturity level MIL1 because four practices at MIL2 are “partially implemented” that prevents it to attain MIL2, MIL3, and MIL4. Railway 2 is at MIL3 because one practice at MIL4 is “not implemented” and two are “partially implemented” that prevents it to attain MIL4. In addition to this, railway 3 has attained MIL4 with all practices as “fully implemented”. The reliability of the results is upon the data provided by all these three railway organizations. The reasons for low maturity levels are:
• Partially defined risk designations • Partially implementation of accountability process for
disciplinary actions against who fails to follow cybersecurity rules and regulations
• Partially evaluation of the cybersecurity training program and awareness activities
• Inadequate resources (people, funding, and tools) • Weak cybersecurity workforce • Initial stage of advanced cybersecurity analytics
4.2 Recommendations The currently identified cybersecurity gaps in workforce management can be improved by the following recommendations:
• Provide Adequate resources (like funding, people and tools)
• Set risk designations for accessing critical assets 30

• Develop cybersecurity culture, including cybersecurity training and awareness (also include predictive analytics and threat intelligence programs to handle future threats)
• Align the training programs to support cybersecurity workforce management objectives
• Evaluate the training program for further improvements • Provide continuous cybersecurity education and
professional development opportunities to the workforces with cybersecurity responsibilities
• Apply disciplinary action who fails to follow cybersecurity rules and regulations
In addition to the recommendations mentioned above, some of the literature also recommends improving some of these gaps, such as:
• NIST SP 800-53 (Rev. 4) [11] • Rail Cyber Security Guidance to Industry [12] • NIST SP 800-12 (Rev. 1) [13] • Minimum Cyber Security Standard [14] • Cybersecurity Workforce Framework [15] • Cybersecurity workforce development [16] • Cybersecurity Workforce Development and the
Protection of Critical Infrastructure [17] • A Strategy for a Cybersecurity Culture [18] • Building a stronger cybersecurity workforce [19] • The Future Cybersecurity Workforce [20] • Cybersecurity for the Nation: Workforce Development
[21] • Novel approach for cybersecurity workforce
development [22]
5. CONCLUSIONS The railway is adapting ICT-based technologies, making it vulnerable to cyber-attacks and suggesting the need to focus on educating its workforce. Cybersecurity workforce gap continues to grow putting these organizations at risk. This research assessed the cybersecurity maturity capabilities of the workforce of three railway organizations and found that only one organisation is considered ready for cybersecurity risks. For the other two railway organizations, it has been concluded that at least they have started cybersecurity program and have crossed the maturity level 1 i.e. MIL1. In addition to this, the identified weaknesses in the existing cybersecurity workforce management are partially evaluation of the cybersecurity training program and awareness activities, inadequate resources and initial stage of advanced cybersecurity analytics. These identified gaps can be improved by developing cybersecurity culture within the railway organizations and by following standards and suggested recommendations.
6. REFERENCES [1] Wells, L. J., Camelio, J. A., Williams, C. B., & White, J.
(2014). Cyber-physical security challenges in manufacturing systems. Manufacturing Letters, 2(2), 74-77.
[2] Gontar, P., Homans, H., Rostalski, M., Behrend, J., Dehais, F., & Bengler, K. (2018). Are pilots prepared for a cyber-attack? A human factors approach to the experimental evaluation of pilots' behavior. Journal of Air Transport Management, 69, 26-37.
[3] Fahey, R (2013). Human factors in information security management systems.
[4] C2M2 V1.1. (2014). Department of Energy.: Cybersecurity Capability Maturity Model: Version 1.1. Technical report, Department of Homeland Security.
[5] Bloomfield, R., Bendele, M., Bishop, P., Stroud, R., & Tonks, S. (2016, June). The risk assessment of ERTMS-based railway systems from a cyber security perspective: Methodology and lessons learned. In International Conference on Reliability, Safety, and Security of Railway Systems (pp. 3-19). Springer, Cham.
[6] Mancuso, V. F., Christensen, J. C., Cowley, J., Finomore, V., Gonzalez, C., & Knott, B. (2014, September). Human factors in cyber warfare II: Emerging perspectives. In Proceedings of the Human Factors and Ergonomics Society Annual Meeting(Vol. 58, No. 1, pp. 415-418). Sage CA: Los Angeles, CA: SAGE Publications.
[7] Proctor, R. W., & Chen, J. (2015). The role of human factors/ergonomics in the science of security: decision making and action selection in cyberspace. Human factors, 57(5), 721-727.
[8] Kour, R., Aljumaili, M., Karim, R., & Tretten, P. (2019). eMaintenance in railways: Issues and challenges in cybersecurity. Proceedings of the Institution of Mechanical Engineers, Part F: Journal of Rail and Rapid Transit, 0954409718822915.
[9] Paganini, P. (2014). The transportation industry is increasingly being targeted by hackers. Security affairs. Available at: https://securityaffairs.co/wordpress/48870/cyber-crime/transportation-industry-cybersecurity.html: accessed 23 September 2018.
[10] The Local. Swedish authority handed over 'keys to the Kingdom' in IT security slip-up. Available at: https://www.thelocal.se/20170717/swedish-authority-handed-over-keys-to-the-kingdom-in-it-security-slip-up: accessed 23 September 2018.
[11] Force, J. T., & Initiative, T. (2013). Security and privacy controls for federal information systems and organizations. NIST Special Publication, 800(53), 8-13.
[12] Rail Cyber Security Guidance to Industry. (2016). Department for transport. Rail Safety and Standards Board. Available at: https://www.rssb.co.uk/Library/improving-industry-performance/2016-02-cyber-security-rail-cyber-security-guidance-to-industry.pdf : accessed 25 September 2018.
[13] Nieles, M., Dempsey, K., & Pillitteri, V. (2017). An Introduction to Information Security (No. NIST Special Publication (SP) 800-12 Rev. 1 (Draft)). National Institute of Standards and Technology.
[14] Minimum Cyber Security Standard. Version 1.0. (2018). Available at: https://assets.publishing.service.gov.uk/government/uploads/system/uploads/attachment_data/file/719067/25062018_Minimum_Cyber_Security_Standard_gov.uk__3_.pdf : accessed 25 September 2018.
[15] Kohnke, A., Shoemaker, D., & Sigler, K. (2016). A Guide to the National Initiative for Cybersecurity Education (NICE) Cybersecurity Workforce Framework (2.0). Auerbach Publications.
[16] Janeja, V. P., Seaman, C., Kephart, K., Gangopadhyay, A., & Everhart, A. (2016, September). Cybersecurity workforce development: A peer mentoring approach. In 2016 IEEE
31
Conference on Intelligence and Security Informatics (ISI) (pp. 267-272). IEEE.
[17] Chapman, M.,A. (2017). Cybersecurity Workforce Development and the Protection of Critical Infrastructure. University of Hawaii Pearl City United States.
[18] Gcaza, N., & Von Solms, R. (2017). A strategy for a cybersecurity culture: A South African perspective. The Electronic Journal of Information Systems in Developing Countries, 80(1), 1-17.
[19] CSX. CYBERSECURITY NEXUS™. 2018. Building a stronger cybersecurity workforce, available at https://cybersecurity.isaca.org/csx-nexus: accessed 29 September 2018.
[20] Dawson, J., & Thomson, R. (2018). The future cybersecurity workforce: Going beyond technical skills for successful cyber performance. Frontiers in psychology, 9.
[21] Dill, K. J. (2018). Cybersecurity for the Nation: Workforce Development. The Cyber Defense Review, 3(2), 55-64.
[22] Sharevski, F., Trowbridge, A., & Westbrook, J. (2018, March). Novel approach for cybersecurity workforce development: A course in secure design. In 2018 IEEE Integrated STEM Education Conference (ISEC) (pp. 175-180). IEEE.
32
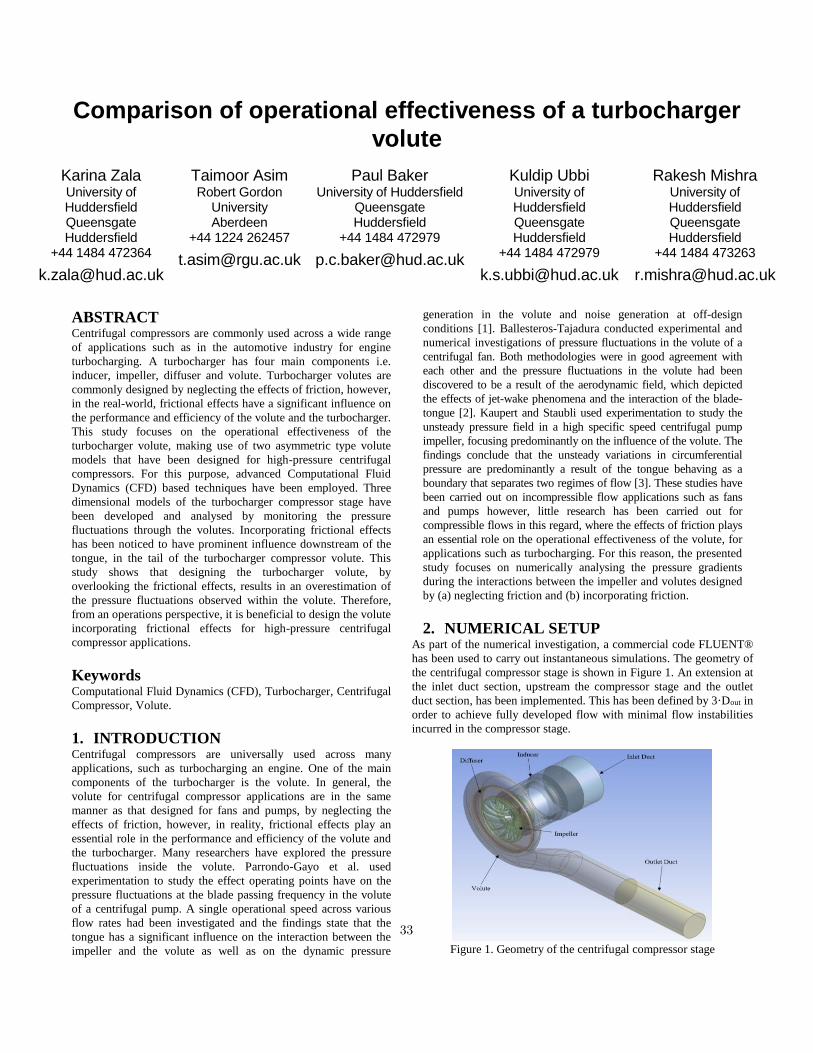
Comparison of operational effectiveness of a turbocharger
volute
ABSTRACT
Centrifugal compressors are commonly used across a wide range
of applications such as in the automotive industry for engine
turbocharging. A turbocharger has four main components i.e.
inducer, impeller, diffuser and volute. Turbocharger volutes are
commonly designed by neglecting the effects of friction, however,
in the real-world, frictional effects have a significant influence on
the performance and efficiency of the volute and the turbocharger.
This study focuses on the operational effectiveness of the
turbocharger volute, making use of two asymmetric type volute
models that have been designed for high-pressure centrifugal
compressors. For this purpose, advanced Computational Fluid
Dynamics (CFD) based techniques have been employed. Three
dimensional models of the turbocharger compressor stage have
been developed and analysed by monitoring the pressure
fluctuations through the volutes. Incorporating frictional effects
has been noticed to have prominent influence downstream of the
tongue, in the tail of the turbocharger compressor volute. This
study shows that designing the turbocharger volute, by
overlooking the frictional effects, results in an overestimation of
the pressure fluctuations observed within the volute. Therefore,
from an operations perspective, it is beneficial to design the volute
incorporating frictional effects for high-pressure centrifugal
compressor applications.
Keywords
Computational Fluid Dynamics (CFD), Turbocharger, Centrifugal
Compressor, Volute.
1. INTRODUCTION Centrifugal compressors are universally used across many
applications, such as turbocharging an engine. One of the main
components of the turbocharger is the volute. In general, the
volute for centrifugal compressor applications are in the same
manner as that designed for fans and pumps, by neglecting the
effects of friction, however, in reality, frictional effects play an
essential role in the performance and efficiency of the volute and
the turbocharger. Many researchers have explored the pressure
fluctuations inside the volute. Parrondo-Gayo et al. used
experimentation to study the effect operating points have on the
pressure fluctuations at the blade passing frequency in the volute
of a centrifugal pump. A single operational speed across various
flow rates had been investigated and the findings state that the
tongue has a significant influence on the interaction between the
impeller and the volute as well as on the dynamic pressure
generation in the volute and noise generation at off-design
conditions [1]. Ballesteros-Tajadura conducted experimental and
numerical investigations of pressure fluctuations in the volute of a
centrifugal fan. Both methodologies were in good agreement with
each other and the pressure fluctuations in the volute had been
discovered to be a result of the aerodynamic field, which depicted
the effects of jet-wake phenomena and the interaction of the blade-
tongue [2]. Kaupert and Staubli used experimentation to study the
unsteady pressure field in a high specific speed centrifugal pump
impeller, focusing predominantly on the influence of the volute. The
findings conclude that the unsteady variations in circumferential
pressure are predominantly a result of the tongue behaving as a
boundary that separates two regimes of flow [3]. These studies have
been carried out on incompressible flow applications such as fans
and pumps however, little research has been carried out for
compressible flows in this regard, where the effects of friction plays
an essential role on the operational effectiveness of the volute, for
applications such as turbocharging. For this reason, the presented
study focuses on numerically analysing the pressure gradients
during the interactions between the impeller and volutes designed
by (a) neglecting friction and (b) incorporating friction.
2. NUMERICAL SETUP As part of the numerical investigation, a commercial code FLUENT®
has been used to carry out instantaneous simulations. The geometry of
the centrifugal compressor stage is shown in Figure 1. An extension at
the inlet duct section, upstream the compressor stage and the outlet
duct section, has been implemented. This has been defined by 3·Dout in
order to achieve fully developed flow with minimal flow instabilities
incurred in the compressor stage.
Figure 1. Geometry of the centrifugal compressor stage
Karina Zala University of Huddersfield Queensgate Huddersfield
+44 1484 472364
Taimoor Asim Robert Gordon
University Aberdeen
+44 1224 262457
Paul Baker University of Huddersfield
Queensgate Huddersfield
+44 1484 472979
Kuldip Ubbi University of Huddersfield Queensgate Huddersfield
+44 1484 472979
Rakesh Mishra University of Huddersfield Queensgate Huddersfield
+44 1484 473263
33
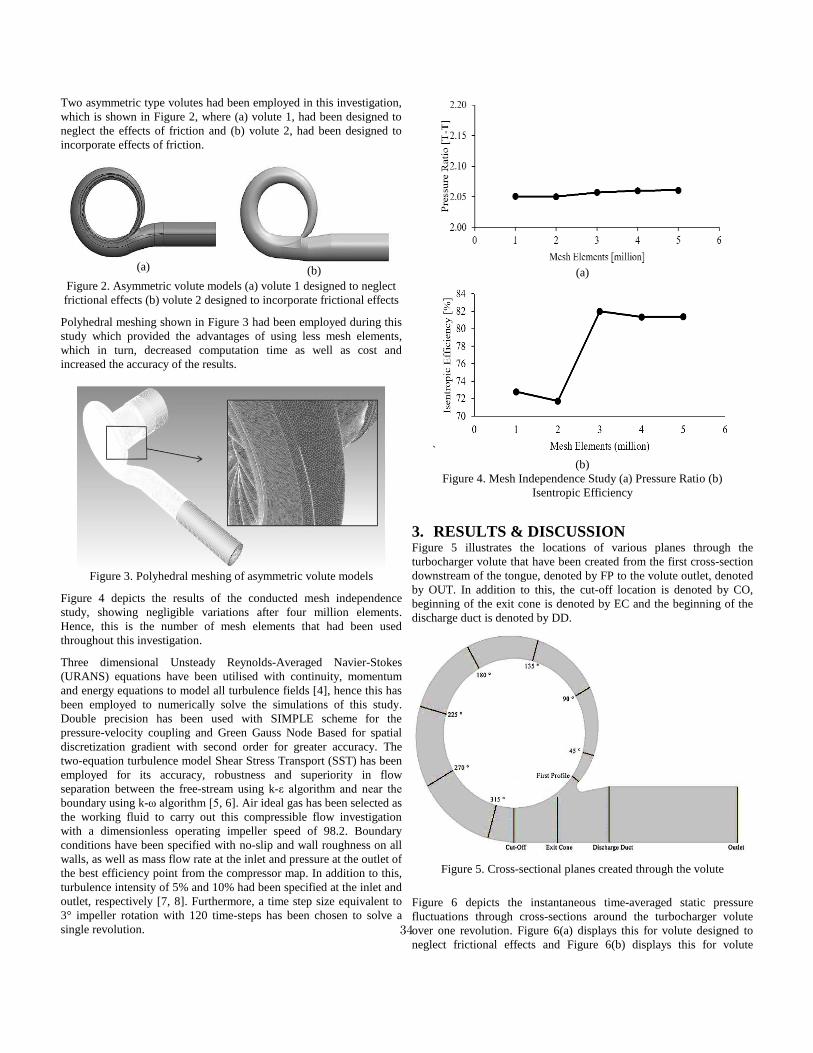
Two asymmetric type volutes had been employed in this investigation,
which is shown in Figure 2, where (a) volute 1, had been designed to
neglect the effects of friction and (b) volute 2, had been designed to
incorporate effects of friction.
(a)
(b)
Figure 2. Asymmetric volute models (a) volute 1 designed to neglect
frictional effects (b) volute 2 designed to incorporate frictional effects
Polyhedral meshing shown in Figure 3 had been employed during this
study which provided the advantages of using less mesh elements,
which in turn, decreased computation time as well as cost and
increased the accuracy of the results.
Figure 3. Polyhedral meshing of asymmetric volute models
Figure 4 depicts the results of the conducted mesh independence
study, showing negligible variations after four million elements.
Hence, this is the number of mesh elements that had been used
throughout this investigation.
Three dimensional Unsteady Reynolds-Averaged Navier-Stokes
(URANS) equations have been utilised with continuity, momentum
and energy equations to model all turbulence fields [4], hence this has
been employed to numerically solve the simulations of this study.
Double precision has been used with SIMPLE scheme for the
pressure-velocity coupling and Green Gauss Node Based for spatial
discretization gradient with second order for greater accuracy. The
two-equation turbulence model Shear Stress Transport (SST) has been
employed for its accuracy, robustness and superiority in flow
separation between the free-stream using k-ε algorithm and near the
boundary using k-ω algorithm [5, 6]. Air ideal gas has been selected as
the working fluid to carry out this compressible flow investigation
with a dimensionless operating impeller speed of 98.2. Boundary
conditions have been specified with no-slip and wall roughness on all
walls, as well as mass flow rate at the inlet and pressure at the outlet of
the best efficiency point from the compressor map. In addition to this,
turbulence intensity of 5% and 10% had been specified at the inlet and
outlet, respectively [7, 8]. Furthermore, a time step size equivalent to
3° impeller rotation with 120 time-steps has been chosen to solve a
single revolution.
(a)
`
(b)
Figure 4. Mesh Independence Study (a) Pressure Ratio (b)
Isentropic Efficiency
3. RESULTS & DISCUSSION Figure 5 illustrates the locations of various planes through the
turbocharger volute that have been created from the first cross-section
downstream of the tongue, denoted by FP to the volute outlet, denoted
by OUT. In addition to this, the cut-off location is denoted by CO,
beginning of the exit cone is denoted by EC and the beginning of the
discharge duct is denoted by DD.
Figure 5. Cross-sectional planes created through the volute
Figure 6 depicts the instantaneous time-averaged static pressure
fluctuations through cross-sections around the turbocharger volute
over one revolution. Figure 6(a) displays this for volute designed to
neglect frictional effects and Figure 6(b) displays this for volute
34
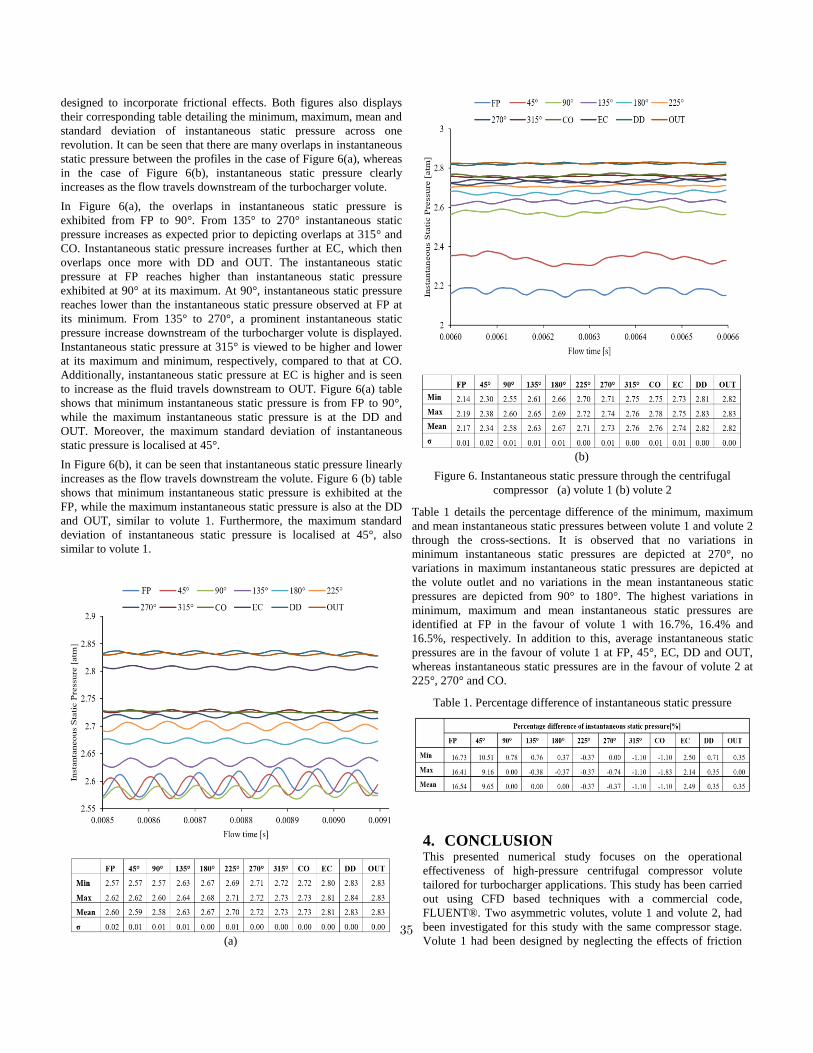
designed to incorporate frictional effects. Both figures also displays
their corresponding table detailing the minimum, maximum, mean and
standard deviation of instantaneous static pressure across one
revolution. It can be seen that there are many overlaps in instantaneous
static pressure between the profiles in the case of Figure 6(a), whereas
in the case of Figure 6(b), instantaneous static pressure clearly
increases as the flow travels downstream of the turbocharger volute.
In Figure 6(a), the overlaps in instantaneous static pressure is
exhibited from FP to 90°. From 135° to 270° instantaneous static
pressure increases as expected prior to depicting overlaps at 315° and
CO. Instantaneous static pressure increases further at EC, which then
overlaps once more with DD and OUT. The instantaneous static
pressure at FP reaches higher than instantaneous static pressure
exhibited at 90° at its maximum. At 90°, instantaneous static pressure
reaches lower than the instantaneous static pressure observed at FP at
its minimum. From 135° to 270°, a prominent instantaneous static
pressure increase downstream of the turbocharger volute is displayed.
Instantaneous static pressure at 315° is viewed to be higher and lower
at its maximum and minimum, respectively, compared to that at CO.
Additionally, instantaneous static pressure at EC is higher and is seen
to increase as the fluid travels downstream to OUT. Figure 6(a) table
shows that minimum instantaneous static pressure is from FP to 90°,
while the maximum instantaneous static pressure is at the DD and
OUT. Moreover, the maximum standard deviation of instantaneous
static pressure is localised at 45°.
In Figure 6(b), it can be seen that instantaneous static pressure linearly
increases as the flow travels downstream the volute. Figure 6 (b) table
shows that minimum instantaneous static pressure is exhibited at the
FP, while the maximum instantaneous static pressure is also at the DD
and OUT, similar to volute 1. Furthermore, the maximum standard
deviation of instantaneous static pressure is localised at 45°, also
similar to volute 1.
(a)
(b)
Figure 6. Instantaneous static pressure through the centrifugal
compressor (a) volute 1 (b) volute 2
Table 1 details the percentage difference of the minimum, maximum
and mean instantaneous static pressures between volute 1 and volute 2
through the cross-sections. It is observed that no variations in
minimum instantaneous static pressures are depicted at 270°, no
variations in maximum instantaneous static pressures are depicted at
the volute outlet and no variations in the mean instantaneous static
pressures are depicted from 90° to 180°. The highest variations in
minimum, maximum and mean instantaneous static pressures are
identified at FP in the favour of volute 1 with 16.7%, 16.4% and
16.5%, respectively. In addition to this, average instantaneous static
pressures are in the favour of volute 1 at FP, 45°, EC, DD and OUT,
whereas instantaneous static pressures are in the favour of volute 2 at
225°, 270° and CO.
Table 1. Percentage difference of instantaneous static pressure
4. CONCLUSION This presented numerical study focuses on the operational
effectiveness of high-pressure centrifugal compressor volute
tailored for turbocharger applications. This study has been carried
out using CFD based techniques with a commercial code,
FLUENT®. Two asymmetric volutes, volute 1 and volute 2, had
been investigated for this study with the same compressor stage.
Volute 1 had been designed by neglecting the effects of friction 35

and volute 2 had been designed by incorporating the effects of
friction. The higher the pressure through the volute, the more
effective the operation of the volute is. It can be seen that
instantaneous static pressure fluctuations through volute 1 is
highest in the first profile, followed by that at 45° and the exit
cone in comparison with volute 2. This suggests that the influence
of friction plays a key role in the operational effectiveness and
therefore designing a volute to neglect the frictional effects for
high-pressure centrifugal compressor means the operational
effectiveness is overestimated. Future work recommendations are
to investigate how velocity magnitude and temperature behaves
with respect to the operational effectiveness of the volute
specifically designed for turbocharging applications.
NOMENCLATURE Dout Diameter at the outlet
FP First Profile
EC Exit Cone
DD Discharge Duct
OUT Volute Outlet
REFERENCES [1] Parrondo-Gayo, J. L., Gonzalez-Perez, J., & Fernandez-
Francos, J. (2002). The effect of the operating point on the
pressure fluctuations at the blade passage frequency in the
volute of a centrifugal pump. Journal of fluids engineering,
124(3), 784-790.
[2] Ballesteros-Tajadura, R., Velarde-Suárez, S., Hurtado-Cruz, J.
P., & Santolaria-Morros, C. (2006). Numerical calculation of
pressure fluctuations in the volute of a centrifugal fan. Journal
of Fluids Engineering, 128(2), 359-369.
[3] Kaupert, K. A., & Staubli, T. (1999). The unsteady pressure
field in a high specific speed centrifugal pump impeller—part
I: influence of the volute. Journal of Fluids
Engineering, 121(3), 621-626.
[4] Sharma, S., Broatch, A., García-Tíscar, J., Allport, J. M., &
Nickson, A. K. (2017). Acoustic characteristics of a ported
shroud turbocompressor operating at design conditions.
International Journal of Engine Research,
1468087418814635.
[5] Mojaddam, M., Benisi, A. H., & Movahhedi, M. R. (2012,
June). Investigation on effect of centrifugal compressor volute
cross-section shape on performance and flow field. In ASME
Turbo Expo 2012: Turbine Technical Conference and
Exposition (pp. 871-880). American Society of Mechanical
Engineers.
[6] Sendanayake, I., Asim, T., & Mishra, R. (2017). Development
of novel vehicle design modelling functions for quantifying
vehicles’ shapes. International Journal of Research, Science,
Technology & Management, 7(2), 26-31.
[7] ANSYS, I., ANSYS FLUENT User's Manual Release 15.0, I.
ANSYS, Editor. 2011: U.S.A.
[8] Samale, A. and J.E. Pacheco. Volute CFD modeling evaluation
for centrifugal compressors. in ASME Turbo Expo 2014:
Turbine Technical Conference and Exposition. 2014.
American Society of Mechanical Engineers.
36
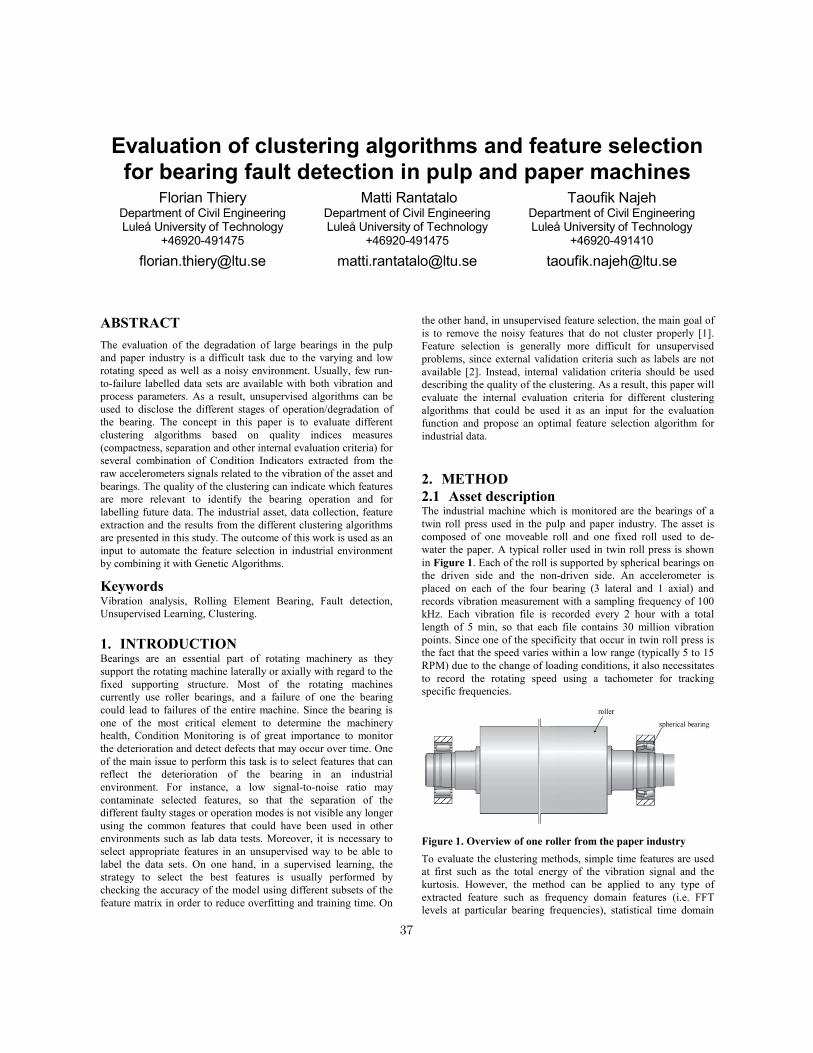
Evaluation of clustering algorithms and feature selection for bearing fault detection in pulp and paper machines
Florian Thiery Department of Civil Engineering Luleå University of Technology
+46920-491475
Matti Rantatalo Department of Civil Engineering Luleå University of Technology
+46920-491475
Taoufik Najeh Department of Civil Engineering Luleå University of Technology
+46920-491410
ABSTRACT
The evaluation of the degradation of large bearings in the pulp and paper industry is a difficult task due to the varying and low rotating speed as well as a noisy environment. Usually, few run-to-failure labelled data sets are available with both vibration and process parameters. As a result, unsupervised algorithms can be used to disclose the different stages of operation/degradation of the bearing. The concept in this paper is to evaluate different clustering algorithms based on quality indices measures (compactness, separation and other internal evaluation criteria) for several combination of Condition Indicators extracted from the raw accelerometers signals related to the vibration of the asset and bearings. The quality of the clustering can indicate which features are more relevant to identify the bearing operation and for labelling future data. The industrial asset, data collection, feature extraction and the results from the different clustering algorithms are presented in this study. The outcome of this work is used as an input to automate the feature selection in industrial environment by combining it with Genetic Algorithms.
Keywords Vibration analysis, Rolling Element Bearing, Fault detection, Unsupervised Learning, Clustering.
1. INTRODUCTION Bearings are an essential part of rotating machinery as they support the rotating machine laterally or axially with regard to the fixed supporting structure. Most of the rotating machines currently use roller bearings, and a failure of one the bearing could lead to failures of the entire machine. Since the bearing is one of the most critical element to determine the machinery health, Condition Monitoring is of great importance to monitor the deterioration and detect defects that may occur over time. One of the main issue to perform this task is to select features that can reflect the deterioration of the bearing in an industrial environment. For instance, a low signal-to-noise ratio may contaminate selected features, so that the separation of the different faulty stages or operation modes is not visible any longer using the common features that could have been used in other environments such as lab data tests. Moreover, it is necessary to select appropriate features in an unsupervised way to be able to label the data sets. On one hand, in a supervised learning, the strategy to select the best features is usually performed by checking the accuracy of the model using different subsets of the feature matrix in order to reduce overfitting and training time. On
the other hand, in unsupervised feature selection, the main goal of is to remove the noisy features that do not cluster properly [1]. Feature selection is generally more difficult for unsupervised problems, since external validation criteria such as labels are not available [2]. Instead, internal validation criteria should be used describing the quality of the clustering. As a result, this paper will evaluate the internal evaluation criteria for different clustering algorithms that could be used it as an input for the evaluation function and propose an optimal feature selection algorithm for industrial data.
2. METHOD 2.1 Asset description The industrial machine which is monitored are the bearings of a twin roll press used in the pulp and paper industry. The asset is composed of one moveable roll and one fixed roll used to de-water the paper. A typical roller used in twin roll press is shown in Figure 1. Each of the roll is supported by spherical bearings on the driven side and the non-driven side. An accelerometer is placed on each of the four bearing (3 lateral and 1 axial) and records vibration measurement with a sampling frequency of 100 kHz. Each vibration file is recorded every 2 hour with a total length of 5 min, so that each file contains 30 million vibration points. Since one of the specificity that occur in twin roll press is the fact that the speed varies within a low range (typically 5 to 15 RPM) due to the change of loading conditions, it also necessitates to record the rotating speed using a tachometer for tracking specific frequencies.
Figure 1. Overview of one roller from the paper industry
To evaluate the clustering methods, simple time features are used at first such as the total energy of the vibration signal and the kurtosis. However, the method can be applied to any type of extracted feature such as frequency domain features (i.e. FFT levels at particular bearing frequencies), statistical time domain
37
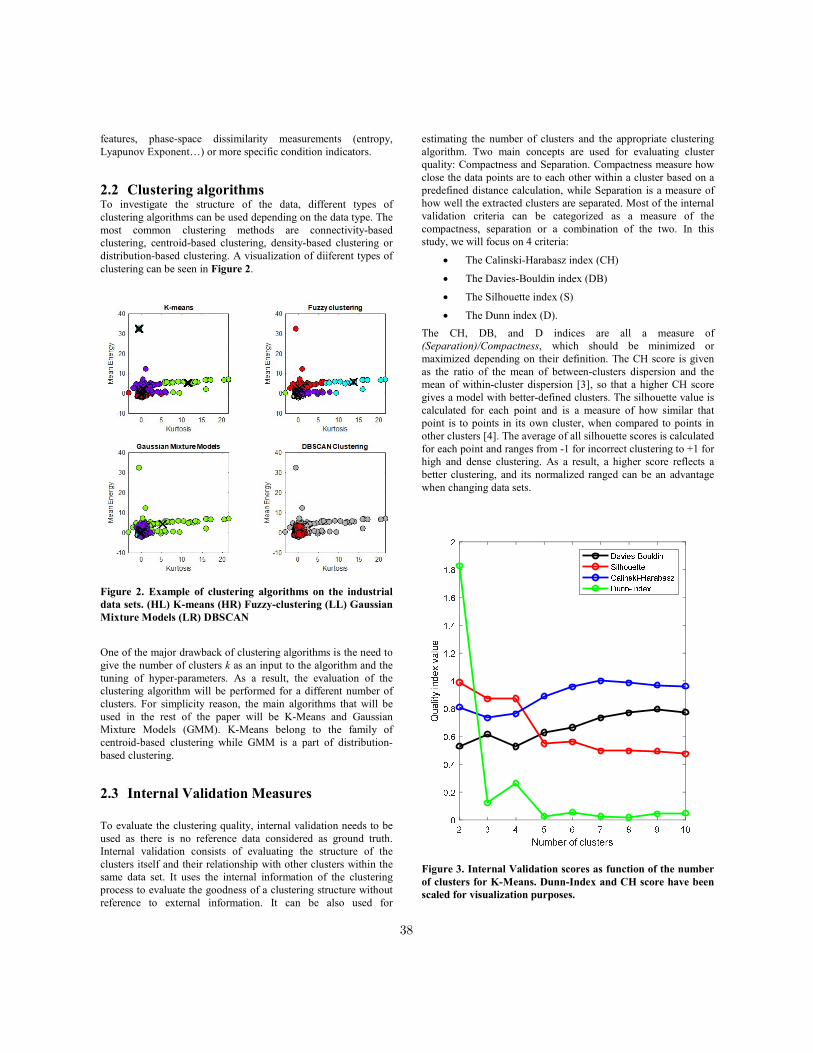
features, phase-space dissimilarity measurements (entropy, Lyapunov Exponent…) or more specific condition indicators.
2.2 Clustering algorithms To investigate the structure of the data, different types of clustering algorithms can be used depending on the data type. The most common clustering methods are connectivity-based clustering, centroid-based clustering, density-based clustering or distribution-based clustering. A visualization of diiferent types of clustering can be seen in Figure 2.
Figure 2. Example of clustering algorithms on the industrial data sets. (HL) K-means (HR) Fuzzy-clustering (LL) Gaussian Mixture Models (LR) DBSCAN
One of the major drawback of clustering algorithms is the need to give the number of clusters k as an input to the algorithm and the tuning of hyper-parameters. As a result, the evaluation of the clustering algorithm will be performed for a different number of clusters. For simplicity reason, the main algorithms that will be used in the rest of the paper will be K-Means and Gaussian Mixture Models (GMM). K-Means belong to the family of centroid-based clustering while GMM is a part of distribution-based clustering.
2.3 Internal Validation Measures
To evaluate the clustering quality, internal validation needs to be used as there is no reference data considered as ground truth. Internal validation consists of evaluating the structure of the clusters itself and their relationship with other clusters within the same data set. It uses the internal information of the clustering process to evaluate the goodness of a clustering structure without reference to external information. It can be also used for
estimating the number of clusters and the appropriate clustering algorithm. Two main concepts are used for evaluating cluster quality: Compactness and Separation. Compactness measure how close the data points are to each other within a cluster based on a predefined distance calculation, while Separation is a measure of how well the extracted clusters are separated. Most of the internal validation criteria can be categorized as a measure of the compactness, separation or a combination of the two. In this study, we will focus on 4 criteria:
The Calinski-Harabasz index (CH)
The Davies-Bouldin index (DB)
The Silhouette index (S)
The Dunn index (D).
The CH, DB, and D indices are all a measure of (Separation)/Compactness, which should be minimized or maximized depending on their definition. The CH score is given as the ratio of the mean of between-clusters dispersion and the mean of within-cluster dispersion [3], so that a higher CH score gives a model with better-defined clusters. The silhouette value is calculated for each point and is a measure of how similar that point is to points in its own cluster, when compared to points in other clusters [4]. The average of all silhouette scores is calculated for each point and ranges from -1 for incorrect clustering to +1 for high and dense clustering. As a result, a higher score reflects a better clustering, and its normalized ranged can be an advantage when changing data sets.
Figure 3. Internal Validation scores as function of the number of clusters for K-Means. Dunn-Index and CH score have been scaled for visualization purposes.
38
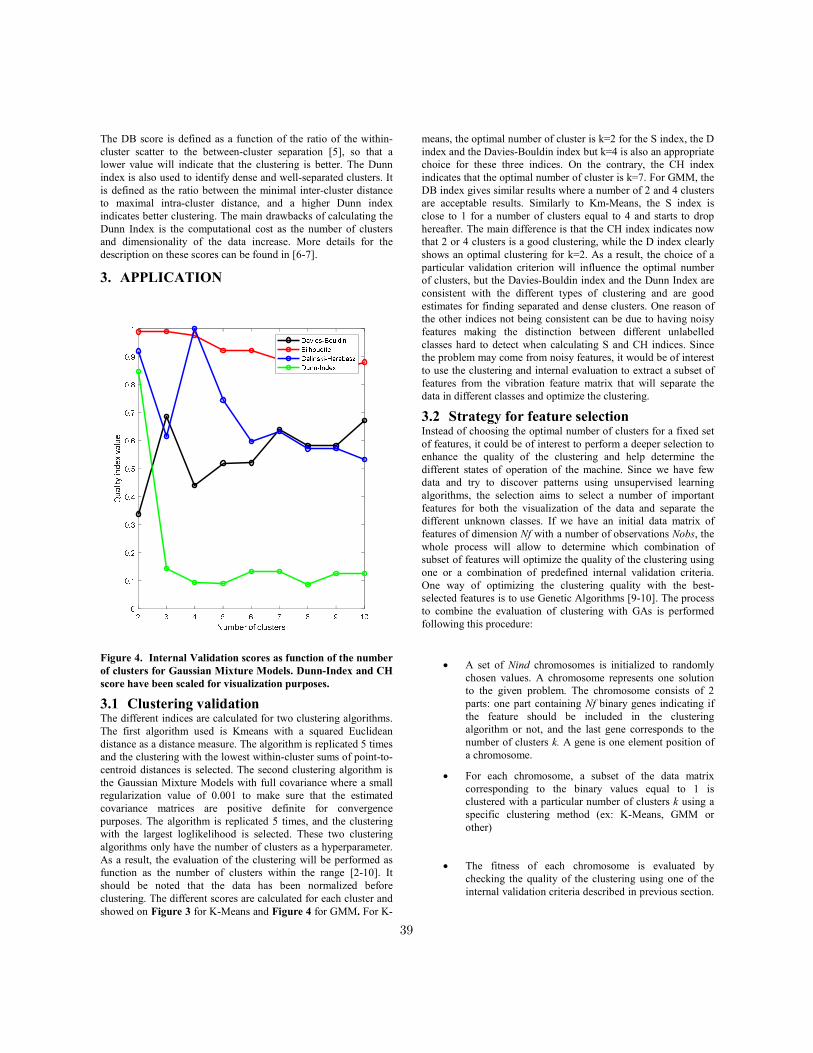
The DB score is defined as a function of the ratio of the within-cluster scatter to the between-cluster separation [5], so that a lower value will indicate that the clustering is better. The Dunn index is also used to identify dense and well-separated clusters. It is defined as the ratio between the minimal inter-cluster distance to maximal intra-cluster distance, and a higher Dunn index indicates better clustering. The main drawbacks of calculating the Dunn Index is the computational cost as the number of clusters and dimensionality of the data increase. More details for the description on these scores can be found in [6-7].
3. APPLICATION
Figure 4. Internal Validation scores as function of the number of clusters for Gaussian Mixture Models. Dunn-Index and CH score have been scaled for visualization purposes.
3.1 Clustering validation The different indices are calculated for two clustering algorithms. The first algorithm used is Kmeans with a squared Euclidean distance as a distance measure. The algorithm is replicated 5 times and the clustering with the lowest within-cluster sums of point-to-centroid distances is selected. The second clustering algorithm is the Gaussian Mixture Models with full covariance where a small regularization value of 0.001 to make sure that the estimated covariance matrices are positive definite for convergence purposes. The algorithm is replicated 5 times, and the clustering with the largest loglikelihood is selected. These two clustering algorithms only have the number of clusters as a hyperparameter. As a result, the evaluation of the clustering will be performed as function as the number of clusters within the range [2-10]. It should be noted that the data has been normalized before clustering. The different scores are calculated for each cluster and showed on Figure 3 for K-Means and Figure 4 for GMM. For K-
means, the optimal number of cluster is k=2 for the S index, the D index and the Davies-Bouldin index but k=4 is also an appropriate choice for these three indices. On the contrary, the CH index indicates that the optimal number of cluster is k=7. For GMM, the DB index gives similar results where a number of 2 and 4 clusters are acceptable results. Similarly to Km-Means, the S index is close to 1 for a number of clusters equal to 4 and starts to drop hereafter. The main difference is that the CH index indicates now that 2 or 4 clusters is a good clustering, while the D index clearly shows an optimal clustering for k=2. As a result, the choice of a particular validation criterion will influence the optimal number of clusters, but the Davies-Bouldin index and the Dunn Index are consistent with the different types of clustering and are good estimates for finding separated and dense clusters. One reason of the other indices not being consistent can be due to having noisy features making the distinction between different unlabelled classes hard to detect when calculating S and CH indices. Since the problem may come from noisy features, it would be of interest to use the clustering and internal evaluation to extract a subset of features from the vibration feature matrix that will separate the data in different classes and optimize the clustering.
3.2 Strategy for feature selection Instead of choosing the optimal number of clusters for a fixed set of features, it could be of interest to perform a deeper selection to enhance the quality of the clustering and help determine the different states of operation of the machine. Since we have few data and try to discover patterns using unsupervised learning algorithms, the selection aims to select a number of important features for both the visualization of the data and separate the different unknown classes. If we have an initial data matrix of features of dimension Nf with a number of observations Nobs, the whole process will allow to determine which combination of subset of features will optimize the quality of the clustering using one or a combination of predefined internal validation criteria. One way of optimizing the clustering quality with the best-selected features is to use Genetic Algorithms [9-10]. The process to combine the evaluation of clustering with GAs is performed following this procedure:
A set of Nind chromosomes is initialized to randomly chosen values. A chromosome represents one solution to the given problem. The chromosome consists of 2 parts: one part containing Nf binary genes indicating if the feature should be included in the clustering algorithm or not, and the last gene corresponds to the number of clusters k. A gene is one element position of a chromosome.
For each chromosome, a subset of the data matrix corresponding to the binary values equal to 1 is clustered with a particular number of clusters k using a specific clustering method (ex: K-Means, GMM or other)
The fitness of each chromosome is evaluated by checking the quality of the clustering using one of the internal validation criteria described in previous section.
39
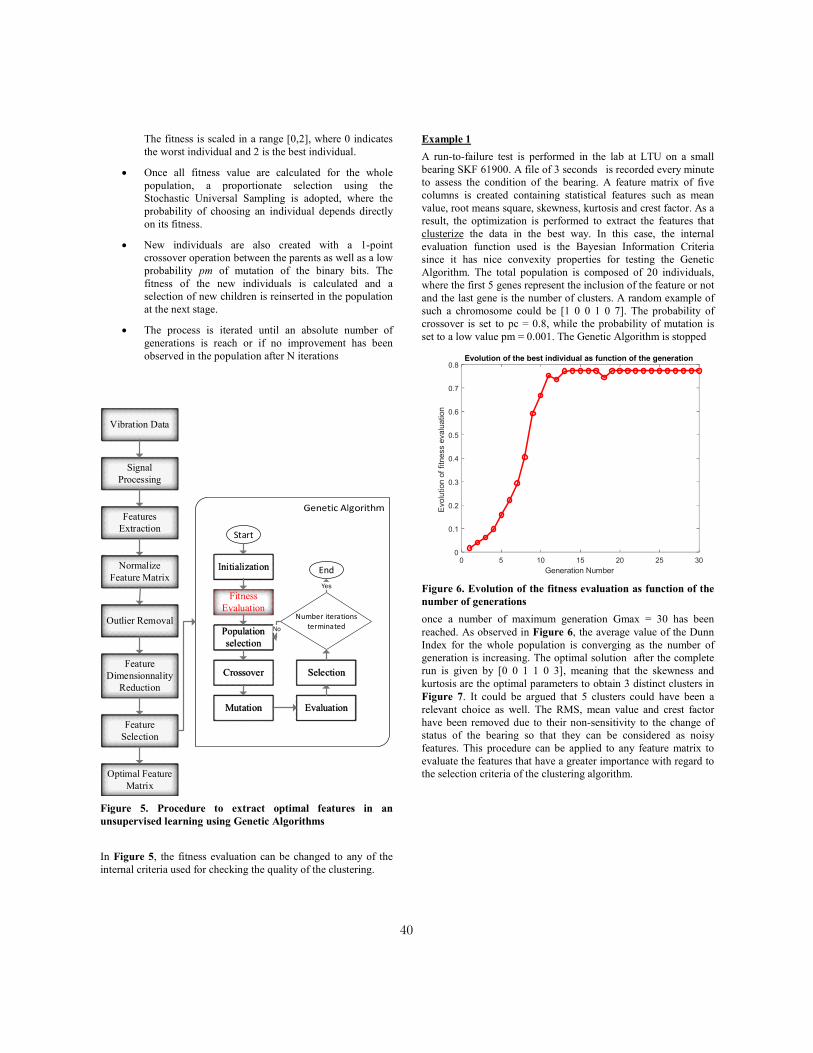
The fitness is scaled in a range [0,2], where 0 indicates the worst individual and 2 is the best individual.
Once all fitness value are calculated for the whole population, a proportionate selection using the Stochastic Universal Sampling is adopted, where the probability of choosing an individual depends directly on its fitness.
New individuals are also created with a 1-point crossover operation between the parents as well as a low probability pm of mutation of the binary bits. The fitness of the new individuals is calculated and a selection of new children is reinserted in the population at the next stage.
The process is iterated until an absolute number of generations is reach or if no improvement has been observed in the population after N iterations
Vibration Data
Features Extraction
Normalize Feature Matrix
Signal Processing
Outlier Removal
Feature Dimensionnality
Reduction
Feature Selection
Initialization
Start
Fitness Evaluation
Population selection
Crossover
Mutation Evaluation
Selection
Number iterationsterminated
End
No
Yes
Optimal Feature Matrix
Figure 5. Procedure to extract optimal features in an unsupervised learning using Genetic Algorithms
In Figure 5, the fitness evaluation can be changed to any of the internal criteria used for checking the quality of the clustering.
Example 1
A run-to-failure test is performed in the lab at LTU on a small bearing SKF 61900. A file of 3 seconds is recorded every minute to assess the condition of the bearing. A feature matrix of five columns is created containing statistical features such as mean value, root means square, skewness, kurtosis and crest factor. As a result, the optimization is performed to extract the features that clusterize the data in the best way. In this case, the internal evaluation function used is the Bayesian Information Criteria since it has nice convexity properties for testing the Genetic Algorithm. The total population is composed of 20 individuals, where the first 5 genes represent the inclusion of the feature or not and the last gene is the number of clusters. A random example of such a chromosome could be [1 0 0 1 0 7]. The probability of crossover is set to pc = 0.8, while the probability of mutation is set to a low value pm = 0.001. The Genetic Algorithm is stopped
0 5 10 15 20 25 30
Generation Number
0
0.1
0.2
0.3
0.4
0.5
0.6
0.7
0.8
Evo
lutio
n of
fitn
ess
eval
uatio
n
Evolution of the best individual as function of the generation
Figure 6. Evolution of the fitness evaluation as function of the number of generations
once a number of maximum generation Gmax = 30 has been reached. As observed in Figure 6, the average value of the Dunn Index for the whole population is converging as the number of generation is increasing. The optimal solution after the complete run is given by [0 0 1 1 0 3], meaning that the skewness and kurtosis are the optimal parameters to obtain 3 distinct clusters in Figure 7. It could be argued that 5 clusters could have been a relevant choice as well. The RMS, mean value and crest factor have been removed due to their non-sensitivity to the change of status of the bearing so that they can be considered as noisy features. This procedure can be applied to any feature matrix to evaluate the features that have a greater importance with regard to the selection criteria of the clustering algorithm.
40
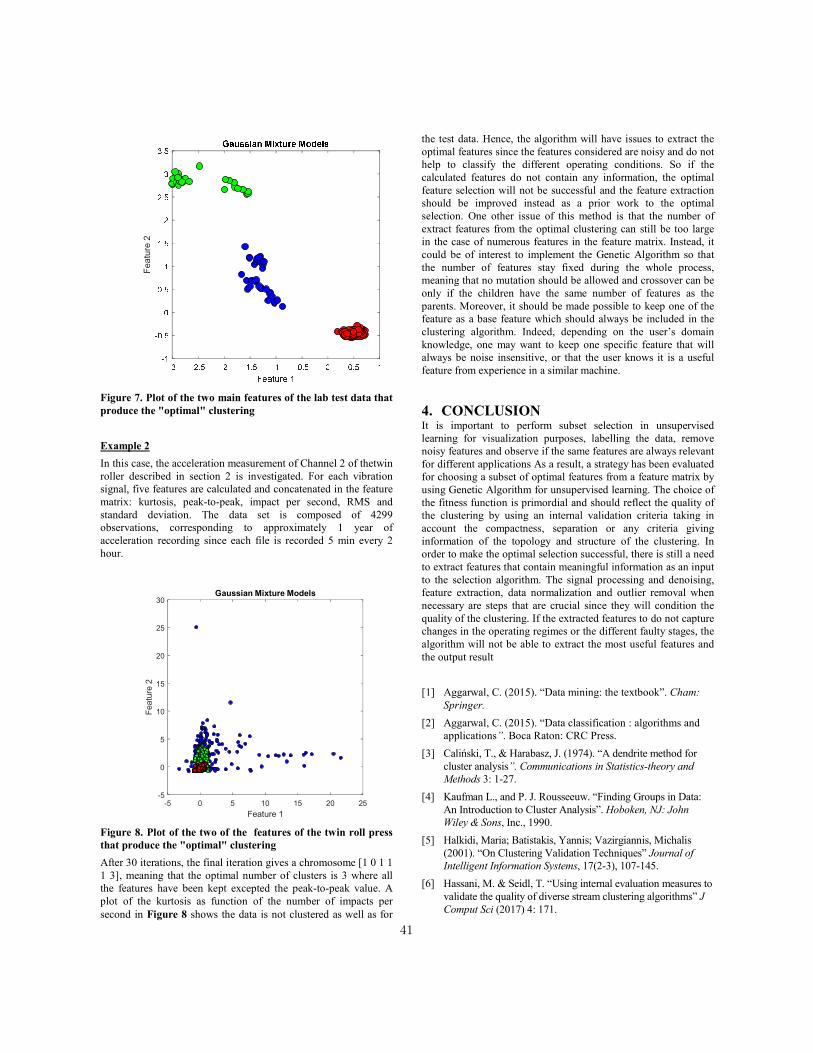
Fe
atu
re 2
Figure 7. Plot of the two main features of the lab test data that produce the "optimal" clustering
Example 2
In this case, the acceleration measurement of Channel 2 of thetwin roller described in section 2 is investigated. For each vibration signal, five features are calculated and concatenated in the feature matrix: kurtosis, peak-to-peak, impact per second, RMS and standard deviation. The data set is composed of 4299 observations, corresponding to approximately 1 year of acceleration recording since each file is recorded 5 min every 2 hour.
-5 0 5 10 15 20 25
Feature 1
-5
0
5
10
15
20
25
30
Fea
ture
2
Gaussian Mixture Models
Figure 8. Plot of the two of the features of the twin roll press that produce the "optimal" clustering
After 30 iterations, the final iteration gives a chromosome [1 0 1 1 1 3], meaning that the optimal number of clusters is 3 where all the features have been kept excepted the peak-to-peak value. A plot of the kurtosis as function of the number of impacts per second in Figure 8 shows the data is not clustered as well as for
the test data. Hence, the algorithm will have issues to extract the optimal features since the features considered are noisy and do not help to classify the different operating conditions. So if the calculated features do not contain any information, the optimal feature selection will not be successful and the feature extraction should be improved instead as a prior work to the optimal selection. One other issue of this method is that the number of extract features from the optimal clustering can still be too large in the case of numerous features in the feature matrix. Instead, it could be of interest to implement the Genetic Algorithm so that the number of features stay fixed during the whole process, meaning that no mutation should be allowed and crossover can be only if the children have the same number of features as the parents. Moreover, it should be made possible to keep one of the feature as a base feature which should always be included in the clustering algorithm. Indeed, depending on the user’s domain knowledge, one may want to keep one specific feature that will always be noise insensitive, or that the user knows it is a useful feature from experience in a similar machine.
4. CONCLUSION It is important to perform subset selection in unsupervised learning for visualization purposes, labelling the data, remove noisy features and observe if the same features are always relevant for different applications As a result, a strategy has been evaluated for choosing a subset of optimal features from a feature matrix by using Genetic Algorithm for unsupervised learning. The choice of the fitness function is primordial and should reflect the quality of the clustering by using an internal validation criteria taking in account the compactness, separation or any criteria giving information of the topology and structure of the clustering. In order to make the optimal selection successful, there is still a need to extract features that contain meaningful information as an input to the selection algorithm. The signal processing and denoising, feature extraction, data normalization and outlier removal when necessary are steps that are crucial since they will condition the quality of the clustering. If the extracted features to do not capture changes in the operating regimes or the different faulty stages, the algorithm will not be able to extract the most useful features and the output result
[1] Aggarwal, C. (2015). “Data mining: the textbook”. Cham: Springer.
[2] Aggarwal, C. (2015). “Data classification : algorithms and applications”. Boca Raton: CRC Press.
[3] Caliński, T., & Harabasz, J. (1974). “A dendrite method for cluster analysis”. Communications in Statistics-theory and Methods 3: 1-27.
[4] Kaufman L., and P. J. Rousseeuw. “Finding Groups in Data: An Introduction to Cluster Analysis”. Hoboken, NJ: John Wiley & Sons, Inc., 1990.
[5] Halkidi, Maria; Batistakis, Yannis; Vazirgiannis, Michalis (2001). “On Clustering Validation Techniques” Journal of Intelligent Information Systems, 17(2-3), 107-145.
[6] Hassani, M. & Seidl, T. “Using internal evaluation measures to validate the quality of diverse stream clustering algorithms” J Comput Sci (2017) 4: 171.
41

[7] Y. Liu, Z. Li, H. Xiong, X. Gao and J. Wu, "Understanding of Internal Clustering Validation Measures," 2010 IEEE International Conference on Data Mining, Sydney, NSW, 2010, pp. 911-916.
[8] Sivanandam, S. & Deepa, S. (2007). Introduction to genetic algorithms. Berlin New York: Springer.
[9] Goldberg, D. (1989). “Genetic algorithms in search, optimization, and machine learning.” Reading, Mass: Addison-Wesley Publishing Company.
42
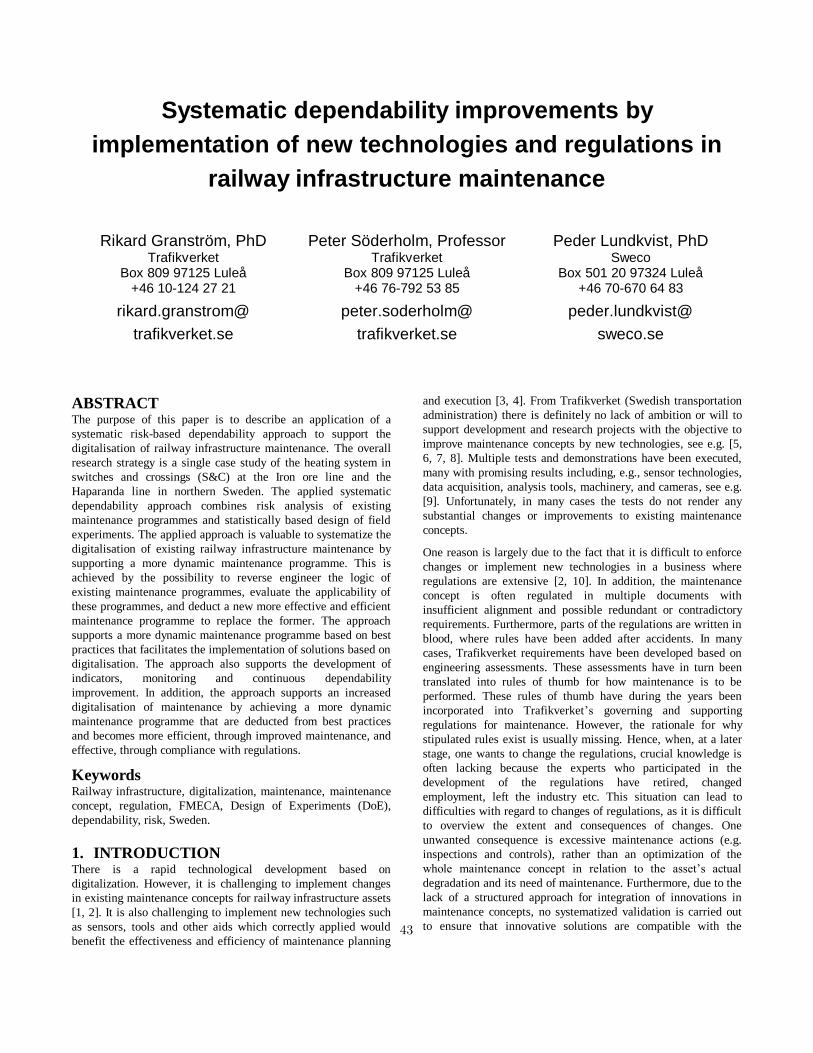
Systematic dependability improvements by
implementation of new technologies and regulations in
railway infrastructure maintenance
Rikard Granström, PhD
Trafikverket Box 809 97125 Luleå
+46 10-124 27 21
rikard.granstrom@
trafikverket.se
Peter Söderholm, Professor Trafikverket
Box 809 97125 Luleå +46 76-792 53 85
peter.soderholm@
trafikverket.se
Peder Lundkvist, PhD Sweco
Box 501 20 97324 Luleå +46 70-670 64 83
peder.lundkvist@
sweco.se
ABSTRACT
The purpose of this paper is to describe an application of a
systematic risk-based dependability approach to support the
digitalisation of railway infrastructure maintenance. The overall
research strategy is a single case study of the heating system in
switches and crossings (S&C) at the Iron ore line and the
Haparanda line in northern Sweden. The applied systematic
dependability approach combines risk analysis of existing
maintenance programmes and statistically based design of field
experiments. The applied approach is valuable to systematize the
digitalisation of existing railway infrastructure maintenance by
supporting a more dynamic maintenance programme. This is
achieved by the possibility to reverse engineer the logic of
existing maintenance programmes, evaluate the applicability of
these programmes, and deduct a new more effective and efficient
maintenance programme to replace the former. The approach
supports a more dynamic maintenance programme based on best
practices that facilitates the implementation of solutions based on
digitalisation. The approach also supports the development of
indicators, monitoring and continuous dependability
improvement. In addition, the approach supports an increased
digitalisation of maintenance by achieving a more dynamic
maintenance programme that are deducted from best practices
and becomes more efficient, through improved maintenance, and
effective, through compliance with regulations.
Keywords
Railway infrastructure, digitalization, maintenance, maintenance
concept, regulation, FMECA, Design of Experiments (DoE),
dependability, risk, Sweden.
1. INTRODUCTION There is a rapid technological development based on
digitalization. However, it is challenging to implement changes
in existing maintenance concepts for railway infrastructure assets
[1, 2]. It is also challenging to implement new technologies such
as sensors, tools and other aids which correctly applied would
benefit the effectiveness and efficiency of maintenance planning
and execution [3, 4]. From Trafikverket (Swedish transportation
administration) there is definitely no lack of ambition or will to
support development and research projects with the objective to
improve maintenance concepts by new technologies, see e.g. [5,
6, 7, 8]. Multiple tests and demonstrations have been executed,
many with promising results including, e.g., sensor technologies,
data acquisition, analysis tools, machinery, and cameras, see e.g.
[9]. Unfortunately, in many cases the tests do not render any
substantial changes or improvements to existing maintenance
concepts.
One reason is largely due to the fact that it is difficult to enforce
changes or implement new technologies in a business where
regulations are extensive [2, 10]. In addition, the maintenance
concept is often regulated in multiple documents with
insufficient alignment and possible redundant or contradictory
requirements. Furthermore, parts of the regulations are written in
blood, where rules have been added after accidents. In many
cases, Trafikverket requirements have been developed based on
engineering assessments. These assessments have in turn been
translated into rules of thumb for how maintenance is to be
performed. These rules of thumb have during the years been
incorporated into Trafikverket’s governing and supporting
regulations for maintenance. However, the rationale for why
stipulated rules exist is usually missing. Hence, when, at a later
stage, one wants to change the regulations, crucial knowledge is
often lacking because the experts who participated in the
development of the regulations have retired, changed
employment, left the industry etc. This situation can lead to
difficulties with regard to changes of regulations, as it is difficult
to overview the extent and consequences of changes. One
unwanted consequence is excessive maintenance actions (e.g.
inspections and controls), rather than an optimization of the
whole maintenance concept in relation to the asset’s actual
degradation and its need of maintenance. Furthermore, due to the
lack of a structured approach for integration of innovations in
maintenance concepts, no systematized validation is carried out
to ensure that innovative solutions are compatible with the 43
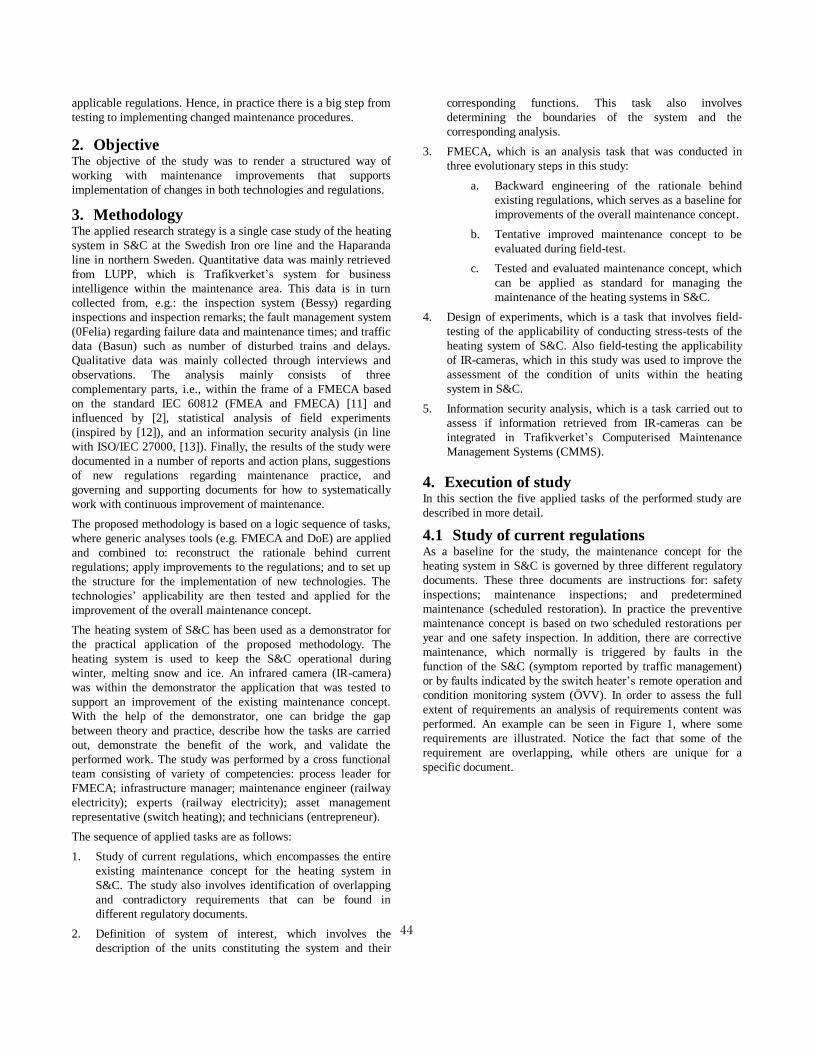
applicable regulations. Hence, in practice there is a big step from
testing to implementing changed maintenance procedures.
2. Objective The objective of the study was to render a structured way of
working with maintenance improvements that supports
implementation of changes in both technologies and regulations.
3. Methodology The applied research strategy is a single case study of the heating
system in S&C at the Swedish Iron ore line and the Haparanda
line in northern Sweden. Quantitative data was mainly retrieved
from LUPP, which is Trafikverket’s system for business
intelligence within the maintenance area. This data is in turn
collected from, e.g.: the inspection system (Bessy) regarding
inspections and inspection remarks; the fault management system
(0Felia) regarding failure data and maintenance times; and traffic
data (Basun) such as number of disturbed trains and delays.
Qualitative data was mainly collected through interviews and
observations. The analysis mainly consists of three
complementary parts, i.e., within the frame of a FMECA based
on the standard IEC 60812 (FMEA and FMECA) [11] and
influenced by [2], statistical analysis of field experiments
(inspired by [12]), and an information security analysis (in line
with ISO/IEC 27000, [13]). Finally, the results of the study were
documented in a number of reports and action plans, suggestions
of new regulations regarding maintenance practice, and
governing and supporting documents for how to systematically
work with continuous improvement of maintenance.
The proposed methodology is based on a logic sequence of tasks,
where generic analyses tools (e.g. FMECA and DoE) are applied
and combined to: reconstruct the rationale behind current
regulations; apply improvements to the regulations; and to set up
the structure for the implementation of new technologies. The
technologies’ applicability are then tested and applied for the
improvement of the overall maintenance concept.
The heating system of S&C has been used as a demonstrator for
the practical application of the proposed methodology. The
heating system is used to keep the S&C operational during
winter, melting snow and ice. An infrared camera (IR-camera)
was within the demonstrator the application that was tested to
support an improvement of the existing maintenance concept.
With the help of the demonstrator, one can bridge the gap
between theory and practice, describe how the tasks are carried
out, demonstrate the benefit of the work, and validate the
performed work. The study was performed by a cross functional
team consisting of variety of competencies: process leader for
FMECA; infrastructure manager; maintenance engineer (railway
electricity); experts (railway electricity); asset management
representative (switch heating); and technicians (entrepreneur).
The sequence of applied tasks are as follows:
1. Study of current regulations, which encompasses the entire
existing maintenance concept for the heating system in
S&C. The study also involves identification of overlapping
and contradictory requirements that can be found in
different regulatory documents.
2. Definition of system of interest, which involves the
description of the units constituting the system and their
corresponding functions. This task also involves
determining the boundaries of the system and the
corresponding analysis.
3. FMECA, which is an analysis task that was conducted in
three evolutionary steps in this study:
a. Backward engineering of the rationale behind
existing regulations, which serves as a baseline for
improvements of the overall maintenance concept.
b. Tentative improved maintenance concept to be
evaluated during field-test.
c. Tested and evaluated maintenance concept, which
can be applied as standard for managing the
maintenance of the heating systems in S&C.
4. Design of experiments, which is a task that involves field-
testing of the applicability of conducting stress-tests of the
heating system of S&C. Also field-testing the applicability
of IR-cameras, which in this study was used to improve the
assessment of the condition of units within the heating
system in S&C.
5. Information security analysis, which is a task carried out to
assess if information retrieved from IR-cameras can be
integrated in Trafikverket’s Computerised Maintenance
Management Systems (CMMS).
4. Execution of study In this section the five applied tasks of the performed study are
described in more detail.
4.1 Study of current regulations As a baseline for the study, the maintenance concept for the
heating system in S&C is governed by three different regulatory
documents. These three documents are instructions for: safety
inspections; maintenance inspections; and predetermined
maintenance (scheduled restoration). In practice the preventive
maintenance concept is based on two scheduled restorations per
year and one safety inspection. In addition, there are corrective
maintenance, which normally is triggered by faults in the
function of the S&C (symptom reported by traffic management)
or by faults indicated by the switch heater’s remote operation and
condition monitoring system (ÖVV). In order to assess the full
extent of requirements an analysis of requirements content was
performed. An example can be seen in Figure 1, where some
requirements are illustrated. Notice the fact that some of the
requirement are overlapping, while others are unique for a
specific document.
44
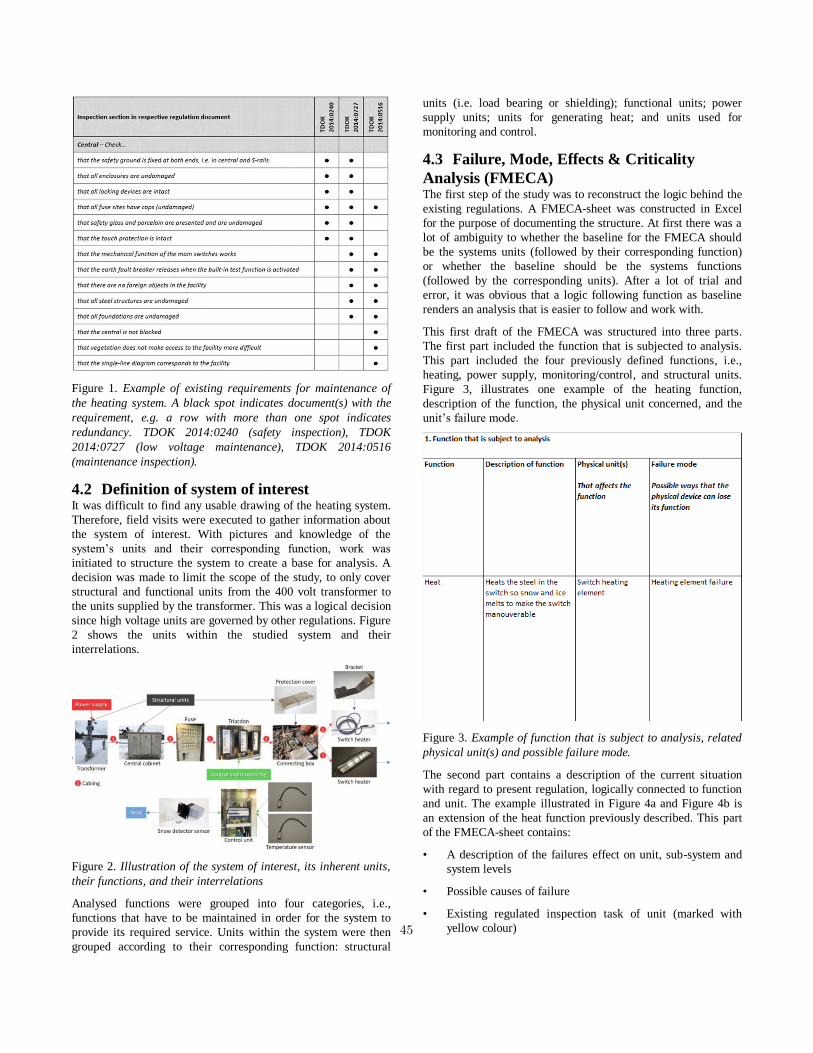
Figure 1. Example of existing requirements for maintenance of
the heating system. A black spot indicates document(s) with the
requirement, e.g. a row with more than one spot indicates
redundancy. TDOK 2014:0240 (safety inspection), TDOK
2014:0727 (low voltage maintenance), TDOK 2014:0516
(maintenance inspection).
4.2 Definition of system of interest It was difficult to find any usable drawing of the heating system.
Therefore, field visits were executed to gather information about
the system of interest. With pictures and knowledge of the
system’s units and their corresponding function, work was
initiated to structure the system to create a base for analysis. A
decision was made to limit the scope of the study, to only cover
structural and functional units from the 400 volt transformer to
the units supplied by the transformer. This was a logical decision
since high voltage units are governed by other regulations. Figure
2 shows the units within the studied system and their
interrelations.
Figure 2. Illustration of the system of interest, its inherent units,
their functions, and their interrelations
Analysed functions were grouped into four categories, i.e.,
functions that have to be maintained in order for the system to
provide its required service. Units within the system were then
grouped according to their corresponding function: structural
units (i.e. load bearing or shielding); functional units; power
supply units; units for generating heat; and units used for
monitoring and control.
4.3 Failure, Mode, Effects & Criticality
Analysis (FMECA) The first step of the study was to reconstruct the logic behind the
existing regulations. A FMECA-sheet was constructed in Excel
for the purpose of documenting the structure. At first there was a
lot of ambiguity to whether the baseline for the FMECA should
be the systems units (followed by their corresponding function)
or whether the baseline should be the systems functions
(followed by the corresponding units). After a lot of trial and
error, it was obvious that a logic following function as baseline
renders an analysis that is easier to follow and work with.
This first draft of the FMECA was structured into three parts.
The first part included the function that is subjected to analysis.
This part included the four previously defined functions, i.e.,
heating, power supply, monitoring/control, and structural units.
Figure 3, illustrates one example of the heating function,
description of the function, the physical unit concerned, and the
unit’s failure mode.
Figure 3. Example of function that is subject to analysis, related
physical unit(s) and possible failure mode.
The second part contains a description of the current situation
with regard to present regulation, logically connected to function
and unit. The example illustrated in Figure 4a and Figure 4b is
an extension of the heat function previously described. This part
of the FMECA-sheet contains:
• A description of the failures effect on unit, sub-system and
system levels
• Possible causes of failure
• Existing regulated inspection task of unit (marked with
yellow colour) 45
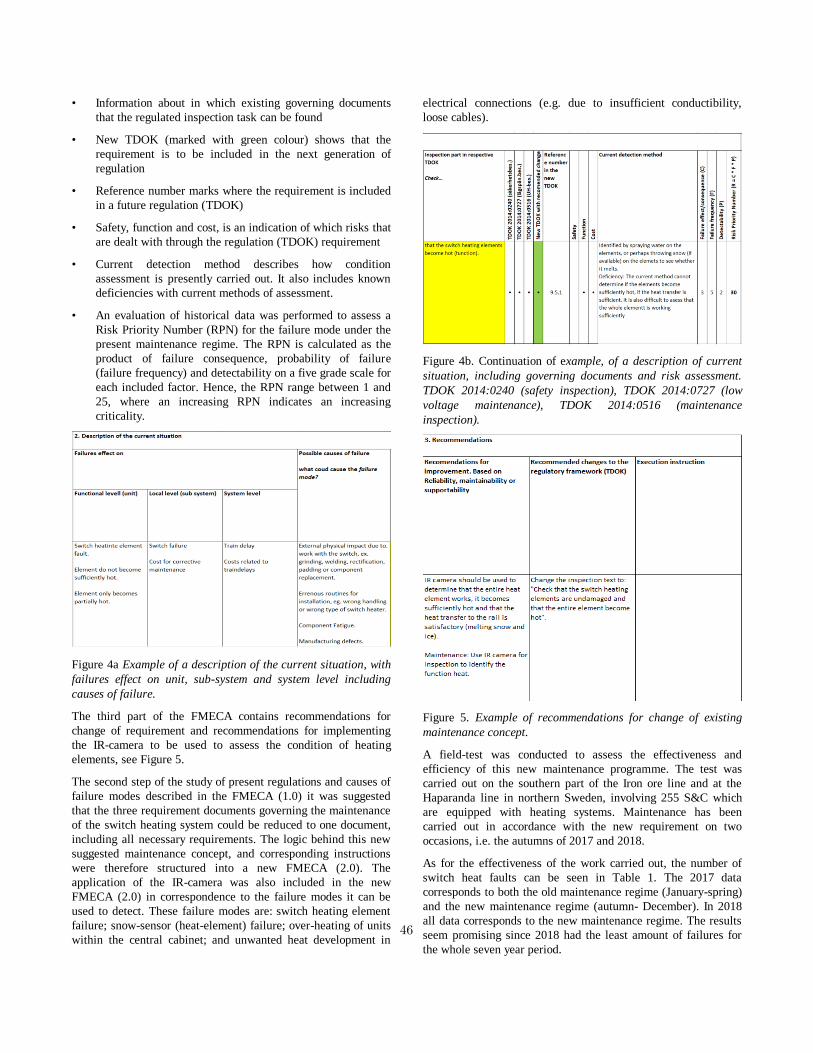
• Information about in which existing governing documents
that the regulated inspection task can be found
• New TDOK (marked with green colour) shows that the
requirement is to be included in the next generation of
regulation
• Reference number marks where the requirement is included
in a future regulation (TDOK)
• Safety, function and cost, is an indication of which risks that
are dealt with through the regulation (TDOK) requirement
• Current detection method describes how condition
assessment is presently carried out. It also includes known
deficiencies with current methods of assessment.
• An evaluation of historical data was performed to assess a
Risk Priority Number (RPN) for the failure mode under the
present maintenance regime. The RPN is calculated as the
product of failure consequence, probability of failure
(failure frequency) and detectability on a five grade scale for
each included factor. Hence, the RPN range between 1 and
25, where an increasing RPN indicates an increasing
criticality.
Figure 4a Example of a description of the current situation, with
failures effect on unit, sub-system and system level including
causes of failure.
The third part of the FMECA contains recommendations for
change of requirement and recommendations for implementing
the IR-camera to be used to assess the condition of heating
elements, see Figure 5.
The second step of the study of present regulations and causes of
failure modes described in the FMECA (1.0) it was suggested
that the three requirement documents governing the maintenance
of the switch heating system could be reduced to one document,
including all necessary requirements. The logic behind this new
suggested maintenance concept, and corresponding instructions
were therefore structured into a new FMECA (2.0). The
application of the IR-camera was also included in the new
FMECA (2.0) in correspondence to the failure modes it can be
used to detect. These failure modes are: switch heating element
failure; snow-sensor (heat-element) failure; over-heating of units
within the central cabinet; and unwanted heat development in
electrical connections (e.g. due to insufficient conductibility,
loose cables).
Figure 4b. Continuation of example, of a description of current
situation, including governing documents and risk assessment.
TDOK 2014:0240 (safety inspection), TDOK 2014:0727 (low
voltage maintenance), TDOK 2014:0516 (maintenance
inspection).
Figure 5. Example of recommendations for change of existing
maintenance concept.
A field-test was conducted to assess the effectiveness and
efficiency of this new maintenance programme. The test was
carried out on the southern part of the Iron ore line and at the
Haparanda line in northern Sweden, involving 255 S&C which
are equipped with heating systems. Maintenance has been
carried out in accordance with the new requirement on two
occasions, i.e. the autumns of 2017 and 2018.
As for the effectiveness of the work carried out, the number of
switch heat faults can be seen in Table 1. The 2017 data
corresponds to both the old maintenance regime (January-spring)
and the new maintenance regime (autumn- December). In 2018
all data corresponds to the new maintenance regime. The results
seem promising since 2018 had the least amount of failures for
the whole seven year period.
46
Table 1, Number of switch heating faults during the period 2012-
2018, data retrieved from 0Felia (Trafikverket’s fault
management system).
During the field-test it was obvious that using the IR-camera is a
much more effective way of assessing the condition of heating
elements than spraying water or throwing snow on the elements.
Figure 6a shows IR-camera pictures taken during the field-test.
Before the test it was a common belief that the heating elements
were either functioning or not. However, the IR-pictures showed
that it is common that heating elements are only partially
functioning, see Figure 6b.
Figure 6a. IR-camera picture taken during field-test, which
shows section with heating element fault.
Figure 6b. IR-camera picture that shows heating element where
only 50% of the element is generating a sufficient amount of
heat.
The third step of the FMECA included an collection of the
experiences from the field-test in order to incorporate them into
the structure. Hence, a fourth part was added to the FMECA-
sheet (see Figure 7) to support management of CMMS to define
which data that is to be registered after maintenance execution,
and to support the maintenance technician with decision support
for assessing failure modes.
Figure 7. Example of FMECA headline 4 - information
management.
4.4 Design of Experiments (DoE) During the FMECA, it was suggested that faults could be
introduced before the scheduled restoration of the system was
executed in the autumn. The idea was that if one could exercise
the ÖVV system (turn on and off the switch heating) a number of
times, faults (of components that are at the end of their lifespan)
should be manifested. In this way it would be possible to correct
more faults during the scheduled restauration and avoid that the
faults would occur later in the season.
In order to determine whether applying pre-stress to the system
has the intended effect, a controlled experiment was planned to
test and validate the procedure. The test was performed during
two consecutive autumns.
The result of the performed experiments was that with the
selected approach it is not possible to use pre-stress to provoke
faults to occur. Hence, it was not valuable to change the current
maintenance practice in this way. Besides the achieved
knowledge, the most important result from these experiments is
the principles for how to perform experiments in an operational
environment and to statistically validate the effect of investigated
changes. These are important experiences that Trafikverket can
benefit from in the future, when other experiments are to be
performed to test and validate the effect of different types of
maintenance practice.
4.5 Information security analysis An information security analysis based on ISO/IEC 27000 was
conducted to assess operational and technical requirements on
the information retrieved from IR-cameras, e.g. to indicate how
to integrate it with Trafikverket’s existing CMMS. The
performed information security analysis consists of five major
parts as described below.
One part is the context and information analysis, which includes
an identification of the information that is included in the IR-
camera (e.g. IR-images that displays the heat distribution in
heating elements) and the factors that affect the requirements on
the information. This is the foundation for definition of the
operational information security requirements.
A second part is the requirement analysis and risk identification,
where the operational requirements on confidentiality,
47

availability, correctness and traceability of information in the IR-
camera is defined. Risks related to management of the
information are identified to clarify threats and weaknesses so
that preventive and corrective measures can be planned. The
requirements shall be used as foundation for Service Level
Agreements (SLA).
Another part is the assessment of the status of requirements
according to the internal regulations for information security,
where a checklist is used to identify relevant requirements that
the one responsible for the management of the IR-camera has to
consider.
A fourth part of the information analysis is an action plan that
summarizes all identified necessary activities, with dates and
responsible persons allocated.
The fifth, and last part, is information for contingency planning,
which shall be used in the dialog between the one responsible for
the management of the IR-camera and those that are its users,
e.g. regarding availability requirements and maximal tolerable
downtime for the IR-camera.
In summary, the information security analysis showed that
pictures from the IR-camera do not pose any unwanted threats.
Hence, data from an IR-camera can be incorporated in
Trafikverket’s existing CMMS as long as the results of the
information security analysis are addressed.
5. Results and discussion In the performed case study, it has been shown that the applied
methodology is applicable to derive the logic of existing
regulations regarding maintenance. This is valuable for the
organization responsible for making changes in maintenance
practice and related regulations. It is also valuable for those who
are to execute maintenance in line with the regulations, but also
those who are to educate and train personnel (e.g., surveyors,
technicians, and maintenance engineers) in how the regulations
should be applied. Since all material concerning the regulations
is documented and structured at the same place, the teacher can
use the FMECA-sheet as a basis for explaining to the students
the underlying logic behind the regulation, which contributes to
an increased system understanding. Hence, traceability between
regulations and the FMECA-sheet is an important component.
We hope that the FMECA-material can be applied in many
contexts in order to broaden the technical expertise within the
railway sector.
It has also been shown that the methodology is applicable to
derive more efficient maintenance concepts. In this study three
different regulations for switch heating maintenance has been
reduced to one. From this follows that the previous maintenance
regime with maintenance execution at three different occasions
(two scheduled restorations and one safety inspection) has been
reduced to one occasion (scheduled restoration). This follows
logically from the derivation of possible causes of failures from
the required functions of the system. The system should be
functional during the winter and should therefore be in an
operational state in the late autumn. During the winter most of
the systems are cowered by snow and ice, which limits the
amount of maintenance actions that can be practically executed
on the S&C. It is neither appropriate from a work environment
point of view to perform more work in the S&C than absolutely
necessary during the winter. In addition, performing switch
heating maintenance during spring or summer is probably a
waste of time and money. The reason is that during spring,
summer, and early autumn many other maintenance tasks are
performed in the S&C, e.g. components are replaced, grinding is
executed, and track is aligned. These maintenance tasks can in
many cases damage the heating system and introduce faults in-
between earlier maintenance and operation of the system. Hence,
the proposed overall maintenance programme for the switch
heating systems can be divided into four parts:
1. In the autumn, before scheduled restoration of the switch
heating system, the heat is turned on by remote operation of
the ÖVV system. Alarms retrieved by the ÖVV system are
used as work orders for technicians that are to perform the
scheduled restoration.
2. Execution of scheduled restoration of the switch heating
system, in accordance with requirements derived from the
FMECA. Incorporating the use of IR-camera for assessment
of asset function.
3. Optional extra assessment of the heat elements function,
using IR-camera. Preferably executed before Christmas or
other holiday when passenger-traffic becomes extensive and
disturbances are highly unwanted.
4. Corrective maintenance during the remaining part of the
year when failure occurs.
The field-test indicates that the new maintenance concept,
including IR-camera, is effective. After the first winter of
applying the proposed concept, the number of faults is at its
lowest level for seven years. There is also a positive economic
impact by the new maintenance concept. From the study we can
conclude that significant savings can be achieved. With an
estimated cost of 600,000 SEK per contract for reduced
scheduled restoration and eliminated safety inspection, the
maintenance concepts renders an estimated (based on 35
maintenance contracts in Sweden) national annual saving for
Trafikverket corresponds to approximately 20 million SEK per
year. With Trafikverket’s population of approximately 7,200
S&C equipped with heating systems, this would mean a saving
of about 2,800 SEK per S&C and year.
The IR-camera has contributed to a valuable quality increase
regarding the assessment of the condition of units (e.g. detection
of partially faulty heating elements). The inspections can be
executed in a more efficient manner, and the working
environment can be improved since the condition assessment
requires less work. Due to the systematic approach used in this
study the IR-camera can easily be implemented in the
maintenance concept for the switch heating system. Hence, the
methodology is applicable for implementing innovations.
Another strength of the proposed methodology is that it
integrates risk management from multiple perspectives. One
perspective is dependability management with a focus on the
technical system (railway infrastructure items) and its support
system (maintenance resources), where FMECA (in line with
IEC 60812, [11]) is applied and easily can be integrated with
other dependability standards within the IEC 60300-series (e.g.
48
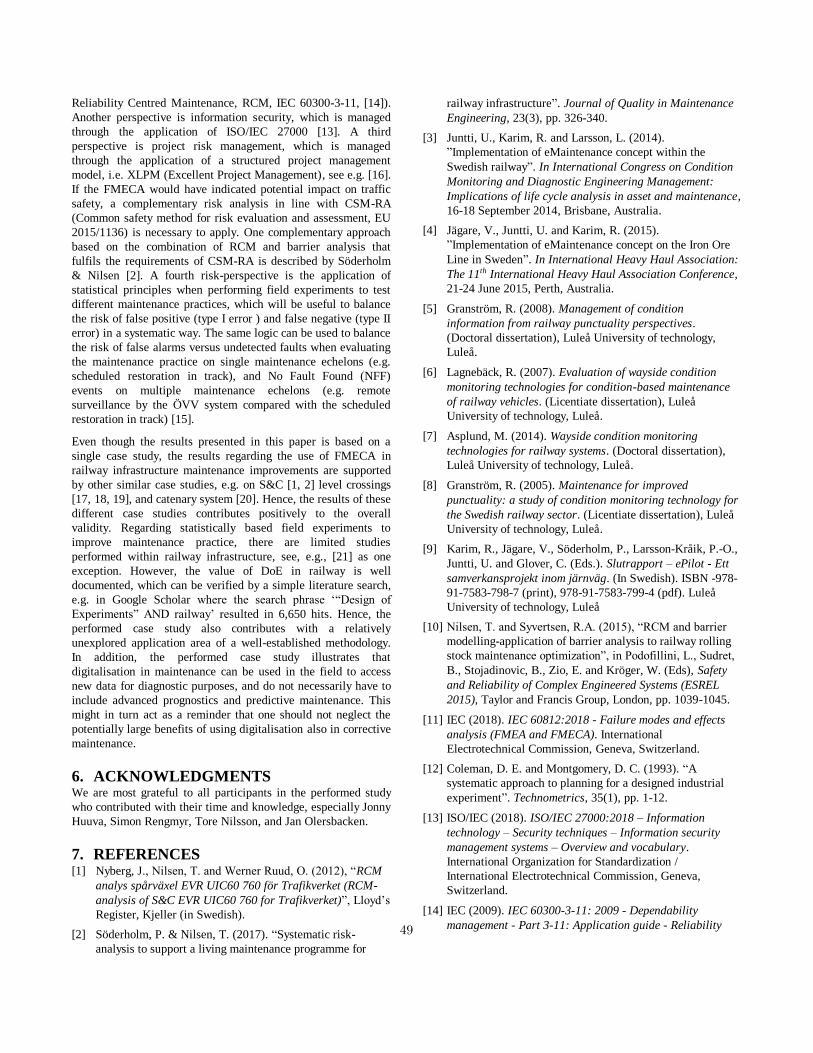
Reliability Centred Maintenance, RCM, IEC 60300-3-11, [14]).
Another perspective is information security, which is managed
through the application of ISO/IEC 27000 [13]. A third
perspective is project risk management, which is managed
through the application of a structured project management
model, i.e. XLPM (Excellent Project Management), see e.g. [16].
If the FMECA would have indicated potential impact on traffic
safety, a complementary risk analysis in line with CSM-RA
(Common safety method for risk evaluation and assessment, EU
2015/1136) is necessary to apply. One complementary approach
based on the combination of RCM and barrier analysis that
fulfils the requirements of CSM-RA is described by Söderholm
& Nilsen [2]. A fourth risk-perspective is the application of
statistical principles when performing field experiments to test
different maintenance practices, which will be useful to balance
the risk of false positive (type I error ) and false negative (type II
error) in a systematic way. The same logic can be used to balance
the risk of false alarms versus undetected faults when evaluating
the maintenance practice on single maintenance echelons (e.g.
scheduled restoration in track), and No Fault Found (NFF)
events on multiple maintenance echelons (e.g. remote
surveillance by the ÖVV system compared with the scheduled
restoration in track) [15].
Even though the results presented in this paper is based on a
single case study, the results regarding the use of FMECA in
railway infrastructure maintenance improvements are supported
by other similar case studies, e.g. on S&C [1, 2] level crossings
[17, 18, 19], and catenary system [20]. Hence, the results of these
different case studies contributes positively to the overall
validity. Regarding statistically based field experiments to
improve maintenance practice, there are limited studies
performed within railway infrastructure, see, e.g., [21] as one
exception. However, the value of DoE in railway is well
documented, which can be verified by a simple literature search,
e.g. in Google Scholar where the search phrase ‘“Design of
Experiments” AND railway’ resulted in 6,650 hits. Hence, the
performed case study also contributes with a relatively
unexplored application area of a well-established methodology.
In addition, the performed case study illustrates that
digitalisation in maintenance can be used in the field to access
new data for diagnostic purposes, and do not necessarily have to
include advanced prognostics and predictive maintenance. This
might in turn act as a reminder that one should not neglect the
potentially large benefits of using digitalisation also in corrective
maintenance.
6. ACKNOWLEDGMENTS We are most grateful to all participants in the performed study
who contributed with their time and knowledge, especially Jonny
Huuva, Simon Rengmyr, Tore Nilsson, and Jan Olersbacken.
7. REFERENCES [1] Nyberg, J., Nilsen, T. and Werner Ruud, O. (2012), “RCM
analys spårväxel EVR UIC60 760 för Trafikverket (RCM-
analysis of S&C EVR UIC60 760 for Trafikverket)”, Lloyd’s
Register, Kjeller (in Swedish).
[2] Söderholm, P. & Nilsen, T. (2017). “Systematic risk-
analysis to support a living maintenance programme for
railway infrastructure”. Journal of Quality in Maintenance
Engineering, 23(3), pp. 326-340.
[3] Juntti, U., Karim, R. and Larsson, L. (2014).
”Implementation of eMaintenance concept within the
Swedish railway”. In International Congress on Condition
Monitoring and Diagnostic Engineering Management:
Implications of life cycle analysis in asset and maintenance,
16-18 September 2014, Brisbane, Australia.
[4] Jägare, V., Juntti, U. and Karim, R. (2015).
”Implementation of eMaintenance concept on the Iron Ore
Line in Sweden”. In International Heavy Haul Association:
The 11th International Heavy Haul Association Conference,
21-24 June 2015, Perth, Australia.
[5] Granström, R. (2008). Management of condition
information from railway punctuality perspectives.
(Doctoral dissertation), Luleå University of technology,
Luleå.
[6] Lagnebäck, R. (2007). Evaluation of wayside condition
monitoring technologies for condition-based maintenance
of railway vehicles. (Licentiate dissertation), Luleå
University of technology, Luleå.
[7] Asplund, M. (2014). Wayside condition monitoring
technologies for railway systems. (Doctoral dissertation),
Luleå University of technology, Luleå.
[8] Granström, R. (2005). Maintenance for improved
punctuality: a study of condition monitoring technology for
the Swedish railway sector. (Licentiate dissertation), Luleå
University of technology, Luleå.
[9] Karim, R., Jägare, V., Söderholm, P., Larsson-Kråik, P.-O.,
Juntti, U. and Glover, C. (Eds.). Slutrapport – ePilot - Ett
samverkansprojekt inom järnväg. (In Swedish). ISBN -978-
91-7583-798-7 (print), 978-91-7583-799-4 (pdf). Luleå
University of technology, Luleå
[10] Nilsen, T. and Syvertsen, R.A. (2015), “RCM and barrier
modelling-application of barrier analysis to railway rolling
stock maintenance optimization”, in Podofillini, L., Sudret,
B., Stojadinovic, B., Zio, E. and Kröger, W. (Eds), Safety
and Reliability of Complex Engineered Systems (ESREL
2015), Taylor and Francis Group, London, pp. 1039-1045.
[11] IEC (2018). IEC 60812:2018 - Failure modes and effects
analysis (FMEA and FMECA). International
Electrotechnical Commission, Geneva, Switzerland.
[12] Coleman, D. E. and Montgomery, D. C. (1993). “A
systematic approach to planning for a designed industrial
experiment”. Technometrics, 35(1), pp. 1-12.
[13] ISO/IEC (2018). ISO/IEC 27000:2018 – Information
technology – Security techniques – Information security
management systems – Overview and vocabulary.
International Organization for Standardization /
International Electrotechnical Commission, Geneva,
Switzerland.
[14] IEC (2009). IEC 60300-3-11: 2009 - Dependability
management - Part 3-11: Application guide - Reliability 49

centred maintenance. International Electrotechnical
Commission, Geneva, Switzerland.
[15] Granström, R. and Söderholm, P. (2009). “Condition
monitoring of railway wheels and no fault found problems”.
International Journal of COMADEM, 12(2), pp. 46-53.
[16] Semcon (2019). XLPM: vår egen projektmetodik. (In
Swedish). Available at: https://semcon.com/sv/vad-vi-
gor/project-excellence/projektmetodik/, accessed: 25 April
2019.
[17] Granström, R. (2009). DoU utredning av Banverkets
vägskyddsanläggningar. (In Swedish). Technical Report,
Vectura, Luleå.
[18] Trafikverket (2009). Underhållsbehovsanalys - Beslutsstöd
för driftsäkerhetshöjning vägskyddsanläggningar. (In
Swedish). BVMall 1802 Underhållsbehovsanalys-
Beslutsunderlag för underhållsåtgärd, Trafikverket, Luleå.
[19] Granström, R. (2012). Halvårsutvärdering förstärkt
underhåll vägskyddsanläggningar BDL 524. (In Swedish).
Report, Vectura, Luleå.
[20] Granström, R. (2008). A system and stakeholder approach
for the identification of condition information: a case study
for the Swedish railway. Proceedings of the Institution of
Mechanical Engineers, Part F: Journal of Rail and Rapid
Transit, 222(4), 399-412.
[21] Cornish, A., Gebretsadik, E. K. and Smith, R. (2012). Field
experimental studies of railway switches and crossings. In
First International Conference (RAILWAYS 2012), Las
Palmas de Gran Canaria, Spain 18-20 April 2012.
50
Mixed Reality within Maintenance Support Services – a user-centred design approach
Carsten Droll
Furtwangen University Robert-Gerwig-Platz 1
78120 Furtwangen, Germany
+49(0)7723 920-2131
Katja Gutsche Furtwangen University Robert-Gerwig-Platz 1
78120 Furtwangen, Germany
+49(0)7723 920-2150
Kevin Koristka Furtwangen University Robert-Gerwig-Platz 1
78120 Furtwangen, Germany
Felix Kaesemann Furtwangen University Robert-Gerwig-Platz 1
78120 Furtwangen, Germany
felix-
ABSTRACT The variety of assets to be maintained increases continuously, in the industrial as well as the consumer business. In addition, due to a lack of experts, maintenance has sometimes to be carried out by untrained manpower. Mixed Reality can be an appropriate way to address these challenges. This fairly new technique allows an interactive way of presenting maintenance information along the service procedure [1]. This paper sums up the results of a design project for maintenance support for professional chainsaws with the help of Mixed Reality. First, it defines necessary steps for a user-centred solution. Following this design approach, the step-by-step results will be outlined, challenges within the realisation will be discussed and the experiences of first users presented. A general approach of the design of MR-usage within maintenance support services will be given.
Keywords maintenance support, Mixed Reality, information application development, user experience.
1. INTRODUCTION Maintenance is mandatory to realise a long-lasting use of assets, no matter if it is consumer or industrial equipment. On the other hand, the diversity of the asset in operation makes it increasingly difficult to find maintenance technicians capable of fulfilling maintenance tasks by heart. To carry out the repair and maintenance tasks, documents with instructional support need to be provided to the technicians. This is true to an even greater extend when equipment owners instead of maintenance specialists shall be able to fulfil maintenance tasks. Equipment manufacturers are asked to deliver maintenance guidelines to empower maintenance specialists and/or equipment users to perform necessary maintenance tasks properly and quickly likewise. New technologies like Mixed Reality seems to be a good alternative to the well-established but rather laborious printed handbooks [2].
The here discussed alternative for communicating maintenance instructions results from the practical case of maintaining and repairing professional chainsaws by service technicians. Yet, the underlying company provides its products globally which results in noticeable regional differences regarding the level of training, a
service technician has. Further, the technicians perform the service either stationary on a shop floor or mobile on the site of the customer. Substituting conventional handbooks, the use of Mixed Reality needs to facilitate the work of technicians in order to be adopted by them. This is what makes the user-centred design approach necessary. The actual concept clearly lies its focus on usability and ease of use allowing a quick service fulfilment [3].
2. MIXED REALITY Extended realities take many forms while their manifestations have different levels of maturity. With the field of Virtual Reality being considerably accessed and even anchored in the consumer industry already, other forms such as Augmented Reality appear to be less assimilated. The Mixed Reality lies somewhere in between those and is less established than Virtual Reality, which is why a short discussion of its meaning sets the frame for this paper. With the actual Reality, the Augmented Reality and the Virtual Reality being associated with each other, it becomes clear that the differentiation of realities arises from the level of virtual content being displayed to a user by any device. Consequently, the Mixed Reality is the link between Virtual and actual Reality. [4] Having this said, Mixed Reality is no graduation but a category holding any form of hybrid between Virtual and actual Reality. This might either be the Augmented Reality where virtual content is inserted into the real world or the more exotic form of Augmented Virtually where real objects are put into a virtual environment. [5] It is due to the different ways of presenting instructions to the service technicians as well as the possible future developments for the introduced concept, which makes implementing Mixed Reality in the area of maintenance reasonable.
3. DEVELOPMENT PROCESS In accordance with the waterfall model [6], the development of the app took place in five phases: 1. Definition 2. Conception 3. System Design 4. Iterative development and testing 5. Finalisation 51
Due to the prototypical character of the project no deployment takes place. The waterfall model was an obvious choice because the framework conditions and objectives were fixed in the context of the university project. The organizational complexity of the project with four employees was also low, which made it possible to proceed with minimal bureaucracy. Nevertheless, there were iteration loops within the individual phases and especially during development. Feedback, which led to iteration loops, was given especially in weekly regular meetings with the clients and in the context of later explained tests. At the beginning of the definition phase the goal was formulated and the scope was defined, together with the identified stakeholders. The problem was examined and the available resources described. The result of the phase were clearly formulated specifications and a defined task. Next, at the beginning of the conception phase, the current state of the art was researched, and preliminary investigations carried out. At the same time, three different solution concepts were developed (see 3.2.1). During the system design the concept was detailed and the software architectures for frontend and backend were defined. Based on the system design, the application was finally developed and tested iteratively. In the finalisation phase, the MR app was prepared for handover. This means that unneeded program parts were deleted, the app was finally tested and minor bugs were eliminated. Furthermore, the documentation was completed.
3.1 Definition The goal of the MR maintenance support solution is to translate maintenance information into a smart device-based application, which makes the maintenance process easier and faster. The focus lies on untrained service technicians. Therefore, professional maintenance staff with a low level of experience is the supposed user of the outlined MR solution. To determine the requirements, interviews were conducted with the target group and with those responsible for technical documentation and training at the facility of the chainsaw manufacturer. The elicitation of requirements was organized as semi-structured interviews. Those type of interviews have a fix questionnaire but the dialog is not bound to the questions. [7] This way, additional and unforeseen insights are not excluded and most certainly lead to overlaps in the requirements elicitation, which allows setting first focal points for the realization. In addition to this measure, the technical knowledge, resources, work processes and working environment in the target group's workshops were examined during a field study.
3.1.1 Manufacturer requirements The chainsaw manufacturer and intended application provider defined the goal as developing a MR application for a freely selectable service case with the following requirements:
• it must be possible to integrate the application into the existing IT-environment of the company,
• the application is intended to provide added value for specialist dealers and trainers,
• the technical possibilities and the existing infrastructure of the specialist dealers and trainers must be taken into account,
• the application must be language neutral. Language neutrality is important, as the manufacturer sells its devices globally and therefore wants to prevent high translation and adaptation costs wherever possible. The language neutrality makes the global scalability of the software very easy.
3.1.2 Findings of the field study – User requirements Several repair shops were visited for the field study. The service technicians were interviewed on site and observed in their working environment and usual business practices. The interviews dealt on the one hand with everyday working life including the current state of the art for repairs and on the other hand with the potential use of MR. During the field study, findings on common problems, repair procedures, workshop equipment, customers and the behaviour, wishes and working methods of the users were collected. From this, essential findings and decisions for the conceptual design of the application could be derived. The target group was also asked for their opinion on the proposed concepts described in Chapter 3.2. The main findings were:
• The target group is very pragmatic and focuses on the repair time. Therefore, the solution for integration and initialization should take very little time.
• The target group currently has little or no experience with MR. Therefore, the solution must be easy-to-learn and intuitive.
• The use of MR glasses is inconceivable for the target group.
• The solution has to be hands-free. • A wifi-connection is normally available in a workshop.
However, this cannot be assumed continuously. • Experienced service technicians carry out repairs on the
basis of their knowledge and usually do not refer back to the documentation. New devices are the exception. Accordingly, the service case processed with the MR application should either target inexperienced or unskilled workers or refer to new or particularly complex scenarios so that the MR application offers added value.
• The price plays an important role for the decision maker of the specialist workshop in the purchase of MR support. The willingness to purchase expensive hardware is rather low.
3.2 Conception Due to different technical possibilities, more than one concept was considered in the preparatory phase of realization. Devices such as the Microsoft HoloLens, monocular smart glasses as more compact device or any smartphone are able to provide MR content to a user. On the other hand, there are different methodical possibilities of supporting a service technician in his work. Pre-generated instructions can be projected into the user’s vision or simply displayed on a screen near the user. In contrast to that remote service would enable to multiply first level support by trained personal on untrained technicians in the field.
52
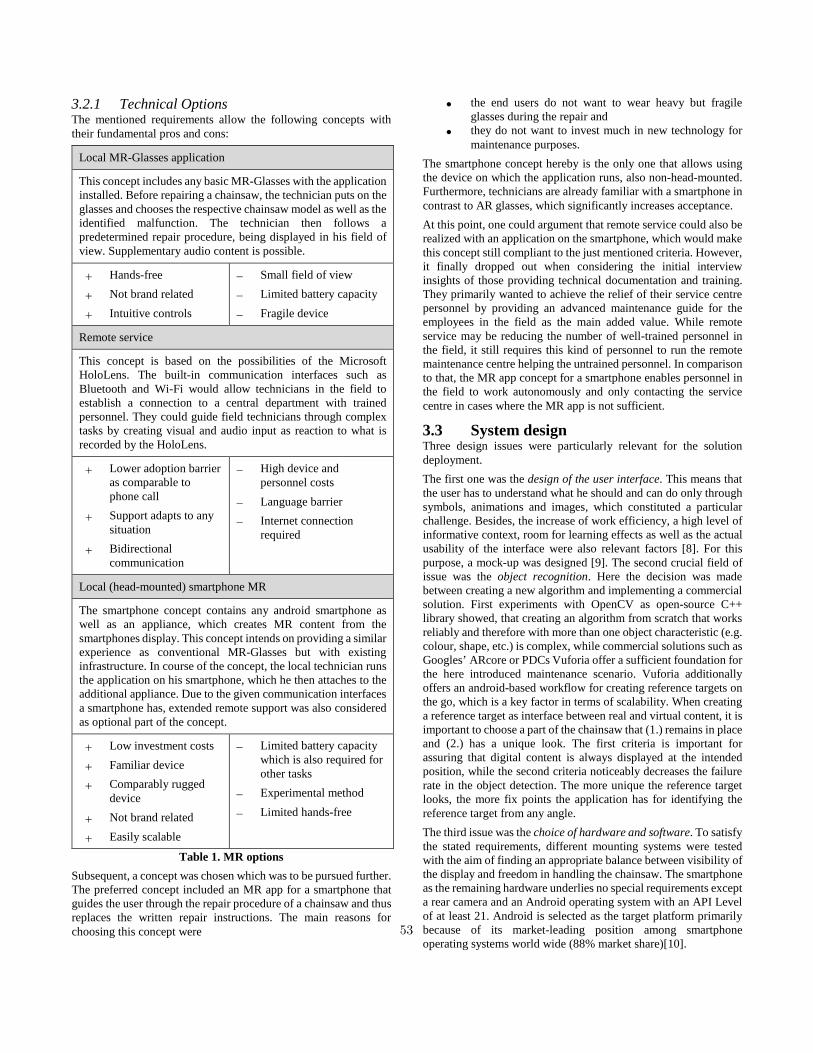
3.2.1 Technical Options The mentioned requirements allow the following concepts with their fundamental pros and cons:
Local MR-Glasses application
This concept includes any basic MR-Glasses with the application installed. Before repairing a chainsaw, the technician puts on the glasses and chooses the respective chainsaw model as well as the identified malfunction. The technician then follows a predetermined repair procedure, being displayed in his field of view. Supplementary audio content is possible.
+ Hands-free
+ Not brand related
+ Intuitive controls
− Small field of view
− Limited battery capacity
− Fragile device
Remote service
This concept is based on the possibilities of the Microsoft HoloLens. The built-in communication interfaces such as Bluetooth and Wi-Fi would allow technicians in the field to establish a connection to a central department with trained personnel. They could guide field technicians through complex tasks by creating visual and audio input as reaction to what is recorded by the HoloLens.
+ Lower adoption barrier as comparable to phone call
+ Support adapts to any situation
+ Bidirectional communication
− High device and personnel costs
− Language barrier
− Internet connection required
Local (head-mounted) smartphone MR
The smartphone concept contains any android smartphone as well as an appliance, which creates MR content from the smartphones display. This concept intends on providing a similar experience as conventional MR-Glasses but with existing infrastructure. In course of the concept, the local technician runs the application on his smartphone, which he then attaches to the additional appliance. Due to the given communication interfaces a smartphone has, extended remote support was also considered as optional part of the concept.
+ Low investment costs
+ Familiar device
+ Comparably rugged device
+ Not brand related
+ Easily scalable
− Limited battery capacity which is also required for other tasks
− Experimental method
− Limited hands-free
Table 1. MR options Subsequent, a concept was chosen which was to be pursued further. The preferred concept included an MR app for a smartphone that guides the user through the repair procedure of a chainsaw and thus replaces the written repair instructions. The main reasons for choosing this concept were
• the end users do not want to wear heavy but fragile glasses during the repair and
• they do not want to invest much in new technology for maintenance purposes.
The smartphone concept hereby is the only one that allows using the device on which the application runs, also non-head-mounted. Furthermore, technicians are already familiar with a smartphone in contrast to AR glasses, which significantly increases acceptance. At this point, one could argument that remote service could also be realized with an application on the smartphone, which would make this concept still compliant to the just mentioned criteria. However, it finally dropped out when considering the initial interview insights of those providing technical documentation and training. They primarily wanted to achieve the relief of their service centre personnel by providing an advanced maintenance guide for the employees in the field as the main added value. While remote service may be reducing the number of well-trained personnel in the field, it still requires this kind of personnel to run the remote maintenance centre helping the untrained personnel. In comparison to that, the MR app concept for a smartphone enables personnel in the field to work autonomously and only contacting the service centre in cases where the MR app is not sufficient.
3.3 System design Three design issues were particularly relevant for the solution deployment. The first one was the design of the user interface. This means that the user has to understand what he should and can do only through symbols, animations and images, which constituted a particular challenge. Besides, the increase of work efficiency, a high level of informative context, room for learning effects as well as the actual usability of the interface were also relevant factors [8]. For this purpose, a mock-up was designed [9]. The second crucial field of issue was the object recognition. Here the decision was made between creating a new algorithm and implementing a commercial solution. First experiments with OpenCV as open-source C++ library showed, that creating an algorithm from scratch that works reliably and therefore with more than one object characteristic (e.g. colour, shape, etc.) is complex, while commercial solutions such as Googles’ ARcore or PDCs Vuforia offer a sufficient foundation for the here introduced maintenance scenario. Vuforia additionally offers an android-based workflow for creating reference targets on the go, which is a key factor in terms of scalability. When creating a reference target as interface between real and virtual content, it is important to choose a part of the chainsaw that (1.) remains in place and (2.) has a unique look. The first criteria is important for assuring that digital content is always displayed at the intended position, while the second criteria noticeably decreases the failure rate in the object detection. The more unique the reference target looks, the more fix points the application has for identifying the reference target from any angle. The third issue was the choice of hardware and software. To satisfy the stated requirements, different mounting systems were tested with the aim of finding an appropriate balance between visibility of the display and freedom in handling the chainsaw. The smartphone as the remaining hardware underlies no special requirements except a rear camera and an Android operating system with an API Level of at least 21. Android is selected as the target platform primarily because of its market-leading position among smartphone operating systems world wide (88% market share)[10].
53
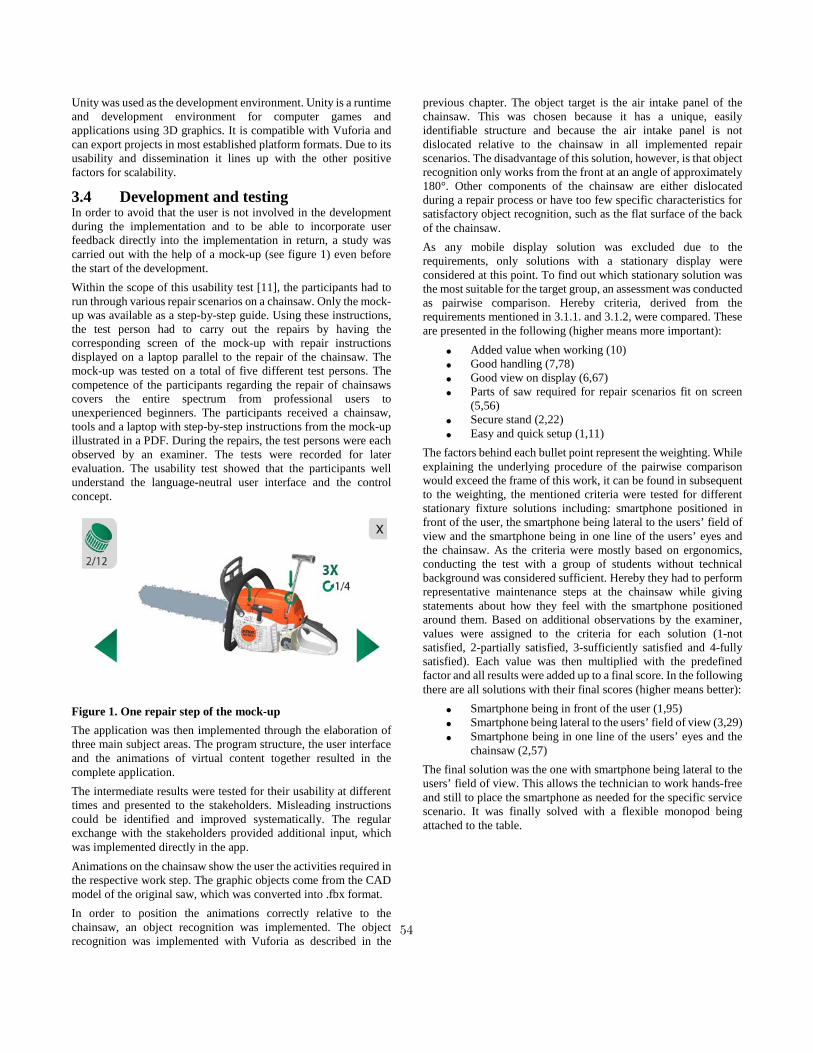
Unity was used as the development environment. Unity is a runtime and development environment for computer games and applications using 3D graphics. It is compatible with Vuforia and can export projects in most established platform formats. Due to its usability and dissemination it lines up with the other positive factors for scalability.
3.4 Development and testing In order to avoid that the user is not involved in the development during the implementation and to be able to incorporate user feedback directly into the implementation in return, a study was carried out with the help of a mock-up (see figure 1) even before the start of the development. Within the scope of this usability test [11], the participants had to run through various repair scenarios on a chainsaw. Only the mock-up was available as a step-by-step guide. Using these instructions, the test person had to carry out the repairs by having the corresponding screen of the mock-up with repair instructions displayed on a laptop parallel to the repair of the chainsaw. The mock-up was tested on a total of five different test persons. The competence of the participants regarding the repair of chainsaws covers the entire spectrum from professional users to unexperienced beginners. The participants received a chainsaw, tools and a laptop with step-by-step instructions from the mock-up illustrated in a PDF. During the repairs, the test persons were each observed by an examiner. The tests were recorded for later evaluation. The usability test showed that the participants well understand the language-neutral user interface and the control concept.
Figure 1. One repair step of the mock-up The application was then implemented through the elaboration of three main subject areas. The program structure, the user interface and the animations of virtual content together resulted in the complete application. The intermediate results were tested for their usability at different times and presented to the stakeholders. Misleading instructions could be identified and improved systematically. The regular exchange with the stakeholders provided additional input, which was implemented directly in the app. Animations on the chainsaw show the user the activities required in the respective work step. The graphic objects come from the CAD model of the original saw, which was converted into .fbx format. In order to position the animations correctly relative to the chainsaw, an object recognition was implemented. The object recognition was implemented with Vuforia as described in the
previous chapter. The object target is the air intake panel of the chainsaw. This was chosen because it has a unique, easily identifiable structure and because the air intake panel is not dislocated relative to the chainsaw in all implemented repair scenarios. The disadvantage of this solution, however, is that object recognition only works from the front at an angle of approximately 180°. Other components of the chainsaw are either dislocated during a repair process or have too few specific characteristics for satisfactory object recognition, such as the flat surface of the back of the chainsaw. As any mobile display solution was excluded due to the requirements, only solutions with a stationary display were considered at this point. To find out which stationary solution was the most suitable for the target group, an assessment was conducted as pairwise comparison. Hereby criteria, derived from the requirements mentioned in 3.1.1. and 3.1.2, were compared. These are presented in the following (higher means more important):
• Added value when working (10) • Good handling (7,78) • Good view on display (6,67) • Parts of saw required for repair scenarios fit on screen
(5,56) • Secure stand (2,22) • Easy and quick setup (1,11)
The factors behind each bullet point represent the weighting. While explaining the underlying procedure of the pairwise comparison would exceed the frame of this work, it can be found in subsequent to the weighting, the mentioned criteria were tested for different stationary fixture solutions including: smartphone positioned in front of the user, the smartphone being lateral to the users’ field of view and the smartphone being in one line of the users’ eyes and the chainsaw. As the criteria were mostly based on ergonomics, conducting the test with a group of students without technical background was considered sufficient. Hereby they had to perform representative maintenance steps at the chainsaw while giving statements about how they feel with the smartphone positioned around them. Based on additional observations by the examiner, values were assigned to the criteria for each solution (1-not satisfied, 2-partially satisfied, 3-sufficiently satisfied and 4-fully satisfied). Each value was then multiplied with the predefined factor and all results were added up to a final score. In the following there are all solutions with their final scores (higher means better):
• Smartphone being in front of the user (1,95) • Smartphone being lateral to the users’ field of view (3,29) • Smartphone being in one line of the users’ eyes and the
chainsaw (2,57) The final solution was the one with smartphone being lateral to the users’ field of view. This allows the technician to work hands-free and still to place the smartphone as needed for the specific service scenario. It was finally solved with a flexible monopod being attached to the table.
54
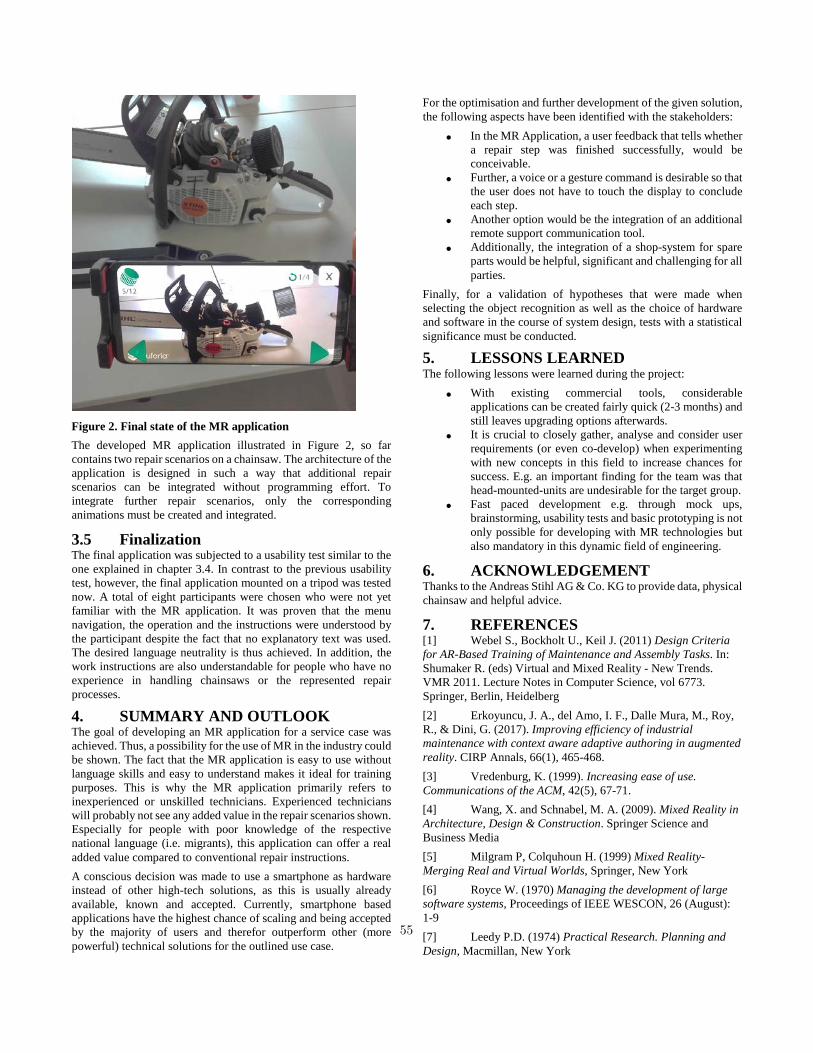
Figure 2. Final state of the MR application The developed MR application illustrated in Figure 2, so far contains two repair scenarios on a chainsaw. The architecture of the application is designed in such a way that additional repair scenarios can be integrated without programming effort. To integrate further repair scenarios, only the corresponding animations must be created and integrated.
3.5 Finalization The final application was subjected to a usability test similar to the one explained in chapter 3.4. In contrast to the previous usability test, however, the final application mounted on a tripod was tested now. A total of eight participants were chosen who were not yet familiar with the MR application. It was proven that the menu navigation, the operation and the instructions were understood by the participant despite the fact that no explanatory text was used. The desired language neutrality is thus achieved. In addition, the work instructions are also understandable for people who have no experience in handling chainsaws or the represented repair processes.
4. SUMMARY AND OUTLOOK The goal of developing an MR application for a service case was achieved. Thus, a possibility for the use of MR in the industry could be shown. The fact that the MR application is easy to use without language skills and easy to understand makes it ideal for training purposes. This is why the MR application primarily refers to inexperienced or unskilled technicians. Experienced technicians will probably not see any added value in the repair scenarios shown. Especially for people with poor knowledge of the respective national language (i.e. migrants), this application can offer a real added value compared to conventional repair instructions. A conscious decision was made to use a smartphone as hardware instead of other high-tech solutions, as this is usually already available, known and accepted. Currently, smartphone based applications have the highest chance of scaling and being accepted by the majority of users and therefor outperform other (more powerful) technical solutions for the outlined use case.
For the optimisation and further development of the given solution, the following aspects have been identified with the stakeholders:
• In the MR Application, a user feedback that tells whether a repair step was finished successfully, would be conceivable.
• Further, a voice or a gesture command is desirable so that the user does not have to touch the display to conclude each step.
• Another option would be the integration of an additional remote support communication tool.
• Additionally, the integration of a shop-system for spare parts would be helpful, significant and challenging for all parties.
Finally, for a validation of hypotheses that were made when selecting the object recognition as well as the choice of hardware and software in the course of system design, tests with a statistical significance must be conducted.
5. LESSONS LEARNED The following lessons were learned during the project:
• With existing commercial tools, considerable applications can be created fairly quick (2-3 months) and still leaves upgrading options afterwards.
• It is crucial to closely gather, analyse and consider user requirements (or even co-develop) when experimenting with new concepts in this field to increase chances for success. E.g. an important finding for the team was that head-mounted-units are undesirable for the target group.
• Fast paced development e.g. through mock ups, brainstorming, usability tests and basic prototyping is not only possible for developing with MR technologies but also mandatory in this dynamic field of engineering.
6. ACKNOWLEDGEMENT Thanks to the Andreas Stihl AG & Co. KG to provide data, physical chainsaw and helpful advice.
7. REFERENCES [1] Webel S., Bockholt U., Keil J. (2011) Design Criteria for AR-Based Training of Maintenance and Assembly Tasks. In: Shumaker R. (eds) Virtual and Mixed Reality - New Trends. VMR 2011. Lecture Notes in Computer Science, vol 6773. Springer, Berlin, Heidelberg [2] Erkoyuncu, J. A., del Amo, I. F., Dalle Mura, M., Roy, R., & Dini, G. (2017). Improving efficiency of industrial maintenance with context aware adaptive authoring in augmented reality. CIRP Annals, 66(1), 465-468. [3] Vredenburg, K. (1999). Increasing ease of use. Communications of the ACM, 42(5), 67-71. [4] Wang, X. and Schnabel, M. A. (2009). Mixed Reality in Architecture, Design & Construction. Springer Science and Business Media [5] Milgram P, Colquhoun H. (1999) Mixed Reality-Merging Real and Virtual Worlds, Springer, New York [6] Royce W. (1970) Managing the development of large software systems, Proceedings of IEEE WESCON, 26 (August): 1-9 [7] Leedy P.D. (1974) Practical Research. Planning and Design, Macmillan, New York
55

[8] Fiorentino, M., Uva, A. E., Gattullo, M., Debernardis, S., & Monno, G. (2014). Augmented reality on large screen for interactive maintenance instructions. Computers in Industry, 65(2), 270-278. [9] Virzi, R. A., Sokolov, J. L., & Karis, D. (1996, April). Usability problem identification using both low-and high-fidelity prototypes. In Proceedings of the SIGCHI Conference on Human Factors in Computing Systems (pp. 236-243). ACM. [10] Gartner. (2019). Global market share held by the leading smartphone operating systems in sales to end users from
1st quarter 2009 to 2nd quarter 2018. In Statista - The Statistics Portal. Retrieved May 4, 2019, from https://www.statista.com/ statistics/266136/global-market-share-held-by-smartphone-operating-systems/. [11] Jakob Nielsen and Rolf Molich. (1990). Heuristic evaluation of user interfaces. In Proceedings of the SIGCHI Conference on Human Factors in Computing Systems (CHI '90), Jane Carrasco Chew and John Whiteside (Eds.). ACM, New York, NY, USA, 249-256.
56

Online Sensor and Industrial Systems Connecting Approach – A Global Review
Diogo Tomás
Division of Operation, Maintenance and
Acoustics Luleå University of
Technology Luleå, Sweden
José Torres Farinha
Centre for Mechanical Engineering, Materials and
Processes Coimbra University & Coimbra Institute of
Engineering, Coimbra, Portugal
Inácio Fonseca
Centre for Mechanical Engineering, Materials
and Processes Coimbra University & Coimbra Institute of
Engineering Coimbra, Portugal
Miguel Castaño
Division of Operation, Maintenance and
Acoustics Luleå University of
Technology Luleå, Sweden
ABSTRACT
The aim of this paper is to create a state-of-the-art review of the
existing standards of open-source communications protocols which
enables eMaintenance solutions in the industry. This review
includes the explanation of Open O&M (Open Operations &
Maintenance) that creates bridges between MIMOSA (Machinery
Information Management Open Systems Alliance), the OPC
Foundation (Open Protocol Communication), and the ISA SP95
(Instrumentation Systems and Automation Society's, SP95
Committee), in order to manage the problem under discussion. The
understanding of the actual state-of-the-art reveals needs for further
advancements of technologies and information standards for the
exchange of Open O&M data and linked context. Furthermore, in
order to be an active player in the industry, it is strategic to simplify
the management and integration of enterprise information
resources in a cooperating mode.
Keywords
eMaintenance, CMMS, EAM, Interoperability, OSA-CBM
1. INTRODUCTION
The 4th industrial revolution is characterized by boosted
digitalization, big data and subsequently, by the IIoT (Industrial
Internet of Things) and the IoS (Internet of Services). Such
technological advances bring new opportunities which are
transforming maintenance methodologies. The new eMaintenance
concept was created to reflect the new efficiency requirements,
where data is essential to ensure effective planning and decision-
making. In this context, data presentation is of paramount relevance
in order to support maintenance decisions. Data presentation is
perceived as an essential component of transferring knowledge.
Often, the understanding that the audience has on a dataset is
limited to the presentation provided with the authors, which use
graphic tools such as bars and line graphs [1]. Data presentation
relies upon adequate and standardized data transition between all
maintenance actors, such as sensors, assets and staff. Such data
transition between actors demands a high level of integration and
interoperability.
Interoperability can be defined as the ability of equipment, devices,
sensors and people to be connected and communicate each other by
the IoT (Internet of Things) or the IoP (Internet of People) [2]. Both
academia and industry have been investing large efforts in solutions
for data transition based in open protocols. Enterprises will benefit
from a seamless integration of open-source communication
protocols which connect maintenance actors.
The competitiveness of modern industries increased significantly
in the past decades with market globalization. However, the
accessibility of customers to a larger set of providers increased
consumer demands [3]. Such market demands translate into
increased requirements for productivity, availability, safety and
product quality. In this context, maintenance is gaining importance
due to an enabler for increased competitiveness [4].
Maintenance technologies have evolved in parallel, resulting in
different approaches such as CBM (Condition Based Maintenance)
[5]. Each technology has pros and cons which have to be weighted
for its application on a specific industry context [6]. CBM is based
on three steps: data acquisition; data processing; and maintenance
decision making [7]. The first step, which is data acquisition, is
receiving a large boost favoured by Industry 4.0 and implemented
through CMMS (Computerized Maintenance Management
Systems), ICT (Information and Communication Technologies) [8]
and WSNs (Wireless Sensor Networks) [9]. In order to scale up to
the large availability of data, new solutions are needed in the steps
of data processing [10] and maintenance decision making through
e.g., decision support systems [11].
This paper focuses on reviewing the existing systems and protocols
for data acquisition and information management, with respect to
interoperability features. This paper is structured as follows:
Section 2 introduces the target problem, which is the
interoperability among maintenance information systems; Section
3 discusses the open communication protocols which can be used
to ensure communication between maintenance actors; Section 4
discusses the OSA-EAI (Open Systems Architecture for Enterprise
Application Integration) and OSA-CBM (Open Systems
Architecture for Condition Based Maintenance) standard
architectures focused on the assets management and assets health
assessment, respectively; Section 5 discusses the wireless standards
communication and technologies; Section 6 discusses, the OSA-
EAI protocol with the OPC (Open Platform Communications),
focusing on the physical assets management. Also briefly discusses
the real-life communication problems; Section 7 presents the
conclusions; Section 8 presents the acknowledgements. 57
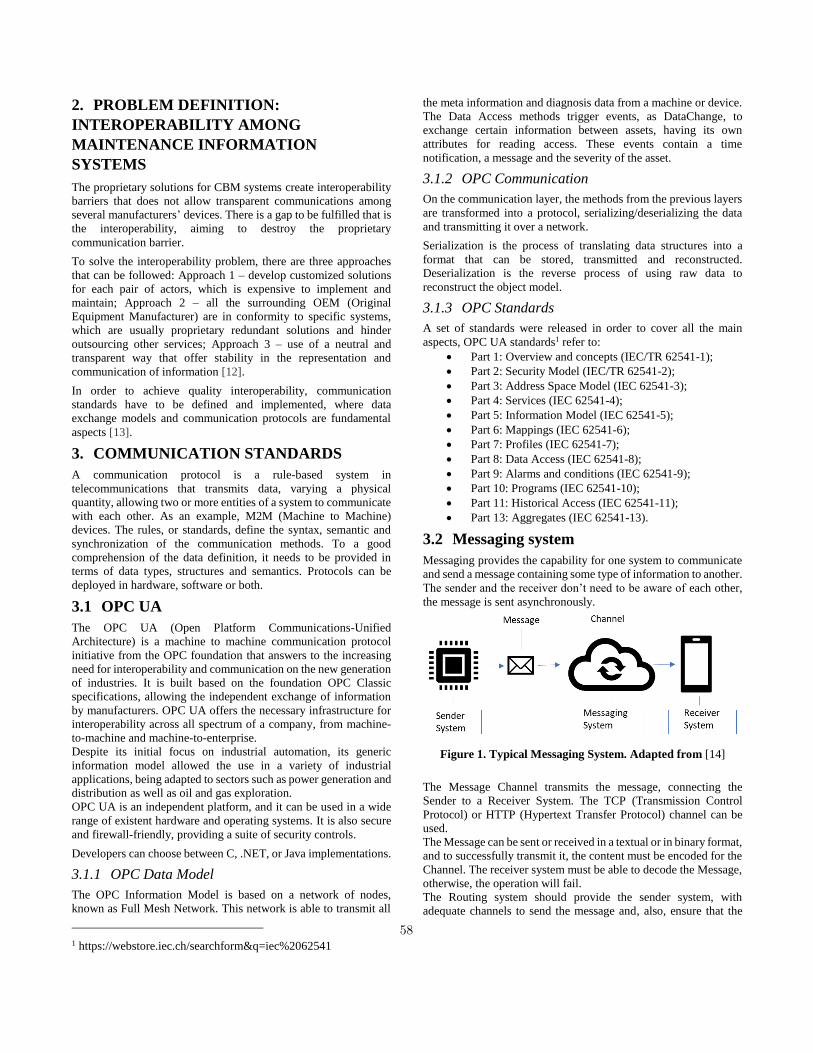
2. PROBLEM DEFINITION:
INTEROPERABILITY AMONG
MAINTENANCE INFORMATION
SYSTEMS
The proprietary solutions for CBM systems create interoperability
barriers that does not allow transparent communications among
several manufacturers’ devices. There is a gap to be fulfilled that is
the interoperability, aiming to destroy the proprietary
communication barrier.
To solve the interoperability problem, there are three approaches
that can be followed: Approach 1 – develop customized solutions
for each pair of actors, which is expensive to implement and
maintain; Approach 2 – all the surrounding OEM (Original
Equipment Manufacturer) are in conformity to specific systems,
which are usually proprietary redundant solutions and hinder
outsourcing other services; Approach 3 – use of a neutral and
transparent way that offer stability in the representation and
communication of information [12].
In order to achieve quality interoperability, communication
standards have to be defined and implemented, where data
exchange models and communication protocols are fundamental
aspects [13].
3. COMMUNICATION STANDARDS
A communication protocol is a rule-based system in
telecommunications that transmits data, varying a physical
quantity, allowing two or more entities of a system to communicate
with each other. As an example, M2M (Machine to Machine)
devices. The rules, or standards, define the syntax, semantic and
synchronization of the communication methods. To a good
comprehension of the data definition, it needs to be provided in
terms of data types, structures and semantics. Protocols can be
deployed in hardware, software or both.
3.1 OPC UA
The OPC UA (Open Platform Communications-Unified
Architecture) is a machine to machine communication protocol
initiative from the OPC foundation that answers to the increasing
need for interoperability and communication on the new generation
of industries. It is built based on the foundation OPC Classic
specifications, allowing the independent exchange of information
by manufacturers. OPC UA offers the necessary infrastructure for
interoperability across all spectrum of a company, from machine-
to-machine and machine-to-enterprise.
Despite its initial focus on industrial automation, its generic
information model allowed the use in a variety of industrial
applications, being adapted to sectors such as power generation and
distribution as well as oil and gas exploration.
OPC UA is an independent platform, and it can be used in a wide
range of existent hardware and operating systems. It is also secure
and firewall-friendly, providing a suite of security controls.
Developers can choose between C, .NET, or Java implementations.
3.1.1 OPC Data Model
The OPC Information Model is based on a network of nodes,
known as Full Mesh Network. This network is able to transmit all
1 https://webstore.iec.ch/searchform&q=iec%2062541
the meta information and diagnosis data from a machine or device.
The Data Access methods trigger events, as DataChange, to
exchange certain information between assets, having its own
attributes for reading access. These events contain a time
notification, a message and the severity of the asset.
3.1.2 OPC Communication
On the communication layer, the methods from the previous layers
are transformed into a protocol, serializing/deserializing the data
and transmitting it over a network.
Serialization is the process of translating data structures into a
format that can be stored, transmitted and reconstructed.
Deserialization is the reverse process of using raw data to
reconstruct the object model.
3.1.3 OPC Standards
A set of standards were released in order to cover all the main
aspects, OPC UA standards1 refer to:
• Part 1: Overview and concepts (IEC/TR 62541-1);
• Part 2: Security Model (IEC/TR 62541-2);
• Part 3: Address Space Model (IEC 62541-3);
• Part 4: Services (IEC 62541-4);
• Part 5: Information Model (IEC 62541-5);
• Part 6: Mappings (IEC 62541-6);
• Part 7: Profiles (IEC 62541-7);
• Part 8: Data Access (IEC 62541-8);
• Part 9: Alarms and conditions (IEC 62541-9);
• Part 10: Programs (IEC 62541-10);
• Part 11: Historical Access (IEC 62541-11);
• Part 13: Aggregates (IEC 62541-13).
3.2 Messaging system
Messaging provides the capability for one system to communicate
and send a message containing some type of information to another.
The sender and the receiver don’t need to be aware of each other,
the message is sent asynchronously.
Figure 1. Typical Messaging System. Adapted from [14]
The Message Channel transmits the message, connecting the
Sender to a Receiver System. The TCP (Transmission Control
Protocol) or HTTP (Hypertext Transfer Protocol) channel can be
used.
The Message can be sent or received in a textual or in binary format,
and to successfully transmit it, the content must be encoded for the
Channel. The receiver system must be able to decode the Message,
otherwise, the operation will fail.
The Routing system should provide the sender system, with
adequate channels to send the message and, also, ensure that the
58
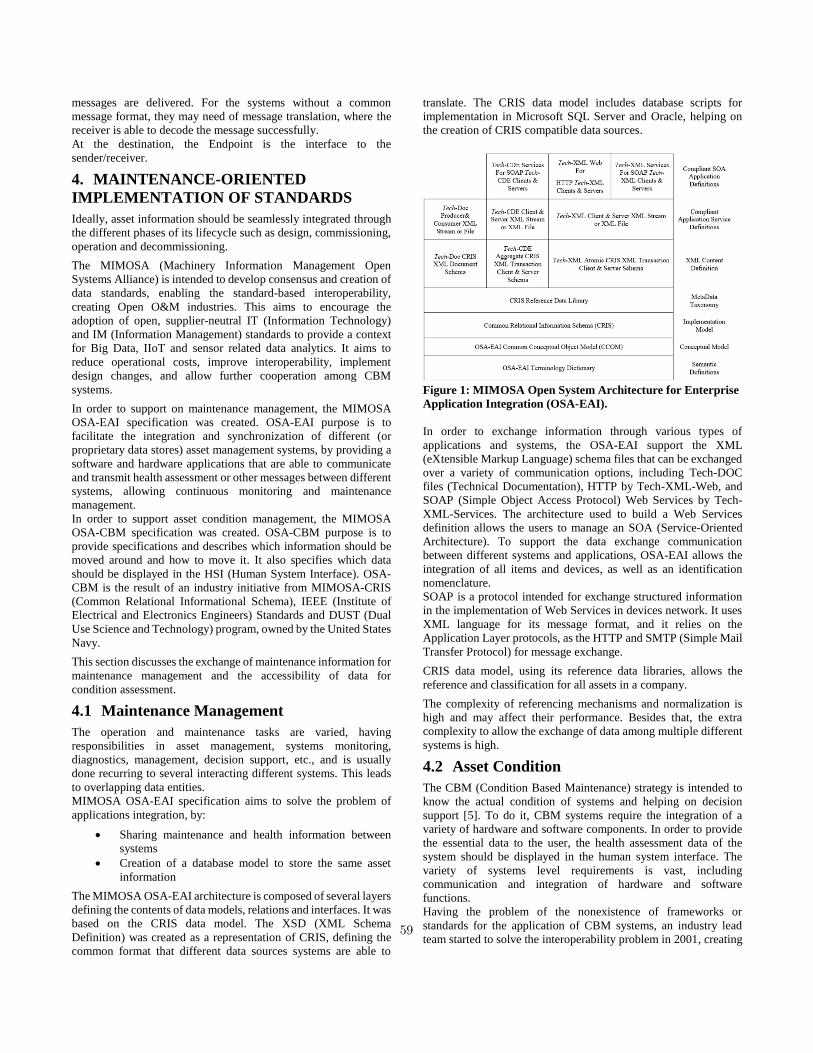
messages are delivered. For the systems without a common
message format, they may need of message translation, where the
receiver is able to decode the message successfully.
At the destination, the Endpoint is the interface to the
sender/receiver.
4. MAINTENANCE-ORIENTED
IMPLEMENTATION OF STANDARDS
Ideally, asset information should be seamlessly integrated through
the different phases of its lifecycle such as design, commissioning,
operation and decommissioning.
The MIMOSA (Machinery Information Management Open
Systems Alliance) is intended to develop consensus and creation of
data standards, enabling the standard-based interoperability,
creating Open O&M industries. This aims to encourage the
adoption of open, supplier-neutral IT (Information Technology)
and IM (Information Management) standards to provide a context
for Big Data, IIoT and sensor related data analytics. It aims to
reduce operational costs, improve interoperability, implement
design changes, and allow further cooperation among CBM
systems.
In order to support on maintenance management, the MIMOSA
OSA-EAI specification was created. OSA-EAI purpose is to
facilitate the integration and synchronization of different (or
proprietary data stores) asset management systems, by providing a
software and hardware applications that are able to communicate
and transmit health assessment or other messages between different
systems, allowing continuous monitoring and maintenance
management.
In order to support asset condition management, the MIMOSA
OSA-CBM specification was created. OSA-CBM purpose is to
provide specifications and describes which information should be
moved around and how to move it. It also specifies which data
should be displayed in the HSI (Human System Interface). OSA-
CBM is the result of an industry initiative from MIMOSA-CRIS
(Common Relational Informational Schema), IEEE (Institute of
Electrical and Electronics Engineers) Standards and DUST (Dual
Use Science and Technology) program, owned by the United States
Navy.
This section discusses the exchange of maintenance information for
maintenance management and the accessibility of data for
condition assessment.
4.1 Maintenance Management
The operation and maintenance tasks are varied, having
responsibilities in asset management, systems monitoring,
diagnostics, management, decision support, etc., and is usually
done recurring to several interacting different systems. This leads
to overlapping data entities.
MIMOSA OSA-EAI specification aims to solve the problem of
applications integration, by:
• Sharing maintenance and health information between
systems
• Creation of a database model to store the same asset
information
The MIMOSA OSA-EAI architecture is composed of several layers
defining the contents of data models, relations and interfaces. It was
based on the CRIS data model. The XSD (XML Schema
Definition) was created as a representation of CRIS, defining the
common format that different data sources systems are able to
translate. The CRIS data model includes database scripts for
implementation in Microsoft SQL Server and Oracle, helping on
the creation of CRIS compatible data sources.
Figure 1: MIMOSA Open System Architecture for Enterprise
Application Integration (OSA-EAI).
In order to exchange information through various types of
applications and systems, the OSA-EAI support the XML
(eXtensible Markup Language) schema files that can be exchanged
over a variety of communication options, including Tech-DOC
files (Technical Documentation), HTTP by Tech-XML-Web, and
SOAP (Simple Object Access Protocol) Web Services by Tech-
XML-Services. The architecture used to build a Web Services
definition allows the users to manage an SOA (Service-Oriented
Architecture). To support the data exchange communication
between different systems and applications, OSA-EAI allows the
integration of all items and devices, as well as an identification
nomenclature.
SOAP is a protocol intended for exchange structured information
in the implementation of Web Services in devices network. It uses
XML language for its message format, and it relies on the
Application Layer protocols, as the HTTP and SMTP (Simple Mail
Transfer Protocol) for message exchange.
CRIS data model, using its reference data libraries, allows the
reference and classification for all assets in a company.
The complexity of referencing mechanisms and normalization is
high and may affect their performance. Besides that, the extra
complexity to allow the exchange of data among multiple different
systems is high.
4.2 Asset Condition
The CBM (Condition Based Maintenance) strategy is intended to
know the actual condition of systems and helping on decision
support [5]. To do it, CBM systems require the integration of a
variety of hardware and software components. In order to provide
the essential data to the user, the health assessment data of the
system should be displayed in the human system interface. The
variety of systems level requirements is vast, including
communication and integration of hardware and software
functions.
Having the problem of the nonexistence of frameworks or
standards for the application of CBM systems, an industry lead
team started to solve the interoperability problem in 2001, creating 59
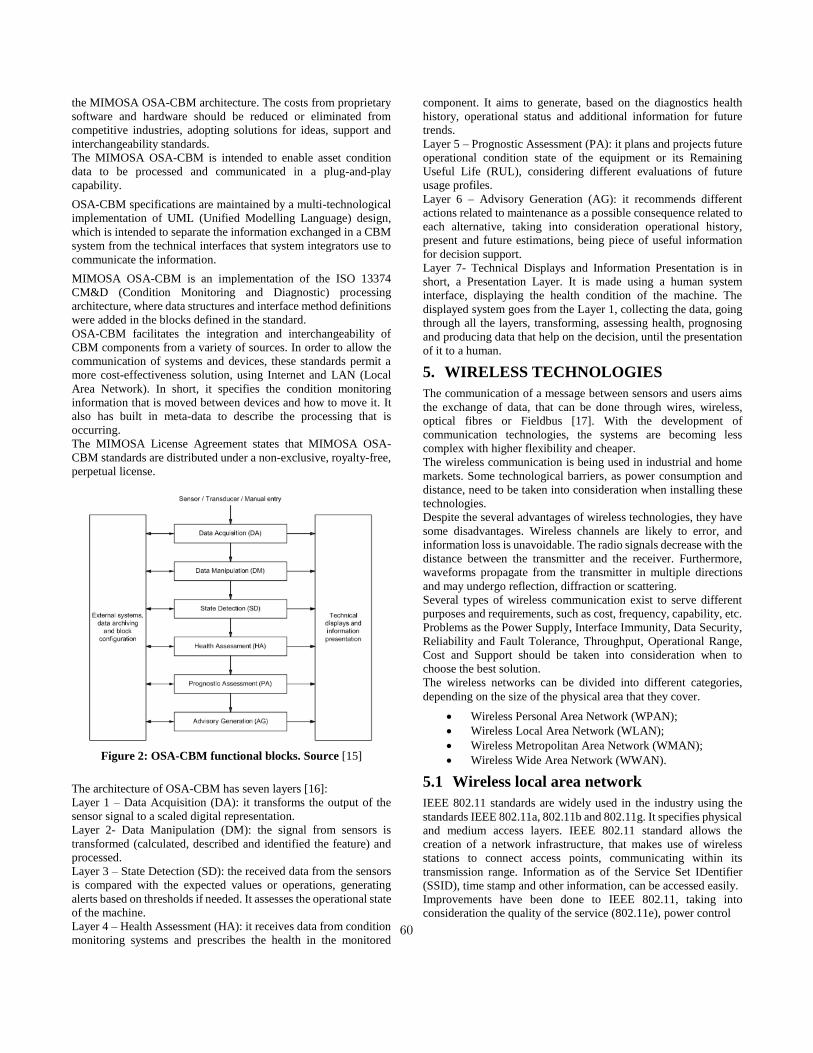
the MIMOSA OSA-CBM architecture. The costs from proprietary
software and hardware should be reduced or eliminated from
competitive industries, adopting solutions for ideas, support and
interchangeability standards.
The MIMOSA OSA-CBM is intended to enable asset condition
data to be processed and communicated in a plug-and-play
capability.
OSA-CBM specifications are maintained by a multi-technological
implementation of UML (Unified Modelling Language) design,
which is intended to separate the information exchanged in a CBM
system from the technical interfaces that system integrators use to
communicate the information.
MIMOSA OSA-CBM is an implementation of the ISO 13374
CM&D (Condition Monitoring and Diagnostic) processing
architecture, where data structures and interface method definitions
were added in the blocks defined in the standard.
OSA-CBM facilitates the integration and interchangeability of
CBM components from a variety of sources. In order to allow the
communication of systems and devices, these standards permit a
more cost-effectiveness solution, using Internet and LAN (Local
Area Network). In short, it specifies the condition monitoring
information that is moved between devices and how to move it. It
also has built in meta-data to describe the processing that is
occurring.
The MIMOSA License Agreement states that MIMOSA OSA-
CBM standards are distributed under a non-exclusive, royalty-free,
perpetual license.
Figure 2: OSA-CBM functional blocks. Source [15]
The architecture of OSA-CBM has seven layers [16]:
Layer 1 – Data Acquisition (DA): it transforms the output of the
sensor signal to a scaled digital representation.
Layer 2- Data Manipulation (DM): the signal from sensors is
transformed (calculated, described and identified the feature) and
processed.
Layer 3 – State Detection (SD): the received data from the sensors
is compared with the expected values or operations, generating
alerts based on thresholds if needed. It assesses the operational state
of the machine.
Layer 4 – Health Assessment (HA): it receives data from condition
monitoring systems and prescribes the health in the monitored
component. It aims to generate, based on the diagnostics health
history, operational status and additional information for future
trends.
Layer 5 – Prognostic Assessment (PA): it plans and projects future
operational condition state of the equipment or its Remaining
Useful Life (RUL), considering different evaluations of future
usage profiles.
Layer 6 – Advisory Generation (AG): it recommends different
actions related to maintenance as a possible consequence related to
each alternative, taking into consideration operational history,
present and future estimations, being piece of useful information
for decision support.
Layer 7- Technical Displays and Information Presentation is in
short, a Presentation Layer. It is made using a human system
interface, displaying the health condition of the machine. The
displayed system goes from the Layer 1, collecting the data, going
through all the layers, transforming, assessing health, prognosing
and producing data that help on the decision, until the presentation
of it to a human.
5. WIRELESS TECHNOLOGIES
The communication of a message between sensors and users aims
the exchange of data, that can be done through wires, wireless,
optical fibres or Fieldbus [17]. With the development of
communication technologies, the systems are becoming less
complex with higher flexibility and cheaper.
The wireless communication is being used in industrial and home
markets. Some technological barriers, as power consumption and
distance, need to be taken into consideration when installing these
technologies.
Despite the several advantages of wireless technologies, they have
some disadvantages. Wireless channels are likely to error, and
information loss is unavoidable. The radio signals decrease with the
distance between the transmitter and the receiver. Furthermore,
waveforms propagate from the transmitter in multiple directions
and may undergo reflection, diffraction or scattering.
Several types of wireless communication exist to serve different
purposes and requirements, such as cost, frequency, capability, etc.
Problems as the Power Supply, Interface Immunity, Data Security,
Reliability and Fault Tolerance, Throughput, Operational Range,
Cost and Support should be taken into consideration when to
choose the best solution.
The wireless networks can be divided into different categories,
depending on the size of the physical area that they cover.
• Wireless Personal Area Network (WPAN);
• Wireless Local Area Network (WLAN);
• Wireless Metropolitan Area Network (WMAN);
• Wireless Wide Area Network (WWAN).
5.1 Wireless local area network
IEEE 802.11 standards are widely used in the industry using the
standards IEEE 802.11a, 802.11b and 802.11g. It specifies physical
and medium access layers. IEEE 802.11 standard allows the
creation of a network infrastructure, that makes use of wireless
stations to connect access points, communicating within its
transmission range. Information as of the Service Set IDentifier
(SSID), time stamp and other information, can be accessed easily.
Improvements have been done to IEEE 802.11, taking into
consideration the quality of the service (802.11e), power control
60

(802.11h), mesh networking (802.11s), roaming (802.11r), external
interworking (802.11u), vehicular (802.11p) and throughput
(802.11n).
The IEEE 802.11a is a standard used on the physical layers using
the 5 GHz frequency band and offering rates from 1 Mbps to 54
Mbps [18].
The IEEE 802.11b standard is mainly indoor range (up to 30m at
11 Mbit/s up to 90m at 1Mbit/s). It uses 2.4 GHz ISM2 frequency
band and supports different data rates. The eight available data rates
are, 6, 9, 12, 18, 24, 36, 48 and 54 Mbps. Its transmission range can
be calculated depending on its modulation technique and the data
rate that is used. Its performance is related to the distance to the
access point. Higher the distance, less the performance [19].
5.2 Bluetooth Technology
Developed by an industry group called Bluetooth Special Interest
Group (SIG), Bluetooth is a WPAN standard, derived from the
IEEE 802.15.1 stack. It was originally designed to eliminate cables
between small devices. Bluetooth was designed to focus on the low
energy consumption, with a small size and lightweight device,
exchanging data between Bluetooth capable devices inside a certain
range. It operates in the 2.4 GHz ISM band, which is globally
available for license-free use. It also has good immunity against
other sources of interference in the 2.4-GHz band. Using a simple
modulation technique, it has a data rate of 1 Mbps and using more
complex modulation techniques, it can optionally archive 2 and 3
Mbps. The transmission range is usually 10 to 100m, depending on
the power of Bluetooth devices.
As disadvantage, its limited short distance communication makes
an inappropriate technology for Wireless Sensing Network (WSN)
[20].
5.3 ZigBee
Developed by the ZigBee alliance, this wireless standard defines a
ZigBee stack with network and application layers above the IEEE
802.15.4 stack, offering both physical and Medium Access Control
(MAC) layers. The ZigBee is intended for low data rate wireless
solutions with minimum complexity, having a low power
consumption. As the main advantage, compared to Bluetooth,
ZigBee supports a higher number of nodes (using 64-bit address
space) within a star, mesh and cluster tree networks. The ZigBee is
intended to short range communication (around 10m with data rate
of 250 Kbps) due to its excellent energy consumption on physical
and MAC layers.
5.4 UWB Technology (IEEE 802.15.3)
The UWB (Ultra-WideBand) technology allows the short-range
connection, optimizing the wireless data exchange communication
between devices. The high-speed connection is the main advantage
of UWB, delivering high speed connection of 480Mbps. Its
frequency range varies from 3.1 to 10.6 GHz, having the best
immunity to interferences, compared to other wireless
technologies. This immunity performance is due to the use of
spread-spectrum modulation techniques. The required power
consumption by UWB on portable devices is low, making a good
technology for certain areas.
As a disadvantage, UWB has limited range (up to 10 meters)
compared with Wi-Fi technologies. [21]
6. DISCUSSION
6.1 Communication Standards Comparing OSA-EAI (for asset management) protocol with the
OPC, it becomes clear that it is necessary a message protocol to
standardize the interface between systems on the factory floor and
EAM (Enterprise Asset Management) systems. The OPC
standardizes the interface among all different devices on the factory
floor, allowing the access of data in real time. In order the EAM
systems are able to do the same, there is a message protocol, in case
of, for example, the automatic creation of Working Orders, to audit
the performed work and work history. Each EAM supplier has its
own database implementation, so, the main interest was mainly
focusing on the message layer, rather than in an additional storage
layer. The service specification from the Web Tech-XML XSD and
Tech-XML-Services makes the message layer difficult for
integration. Furthermore, the present solutions can leverage the
web-services communication based on Tech-XML to link not only
the EAM systems but also to improve the CRIS database to
standard reports. The suppliers are now frequently creating
monitoring tools and reliability reports based on CRIS database,
making easier the connection of EAM proprietary systems to report
elaboration.
Nowadays, the EAM systems have some compliance with these
protocols, which are stated below:
• The main EAM systems available on the market are SAP,
Maximo DataStream and Indus. This system has MIMOSA
based adapters, allowing the compatibility of the EAM
systems with MIMOSA protocol. With the connectivity of all
EAM system, online monitoring becomes possible, giving
enterprises a full control of the asset operational condition.
The interoperability of systems allows the enterprise to do
internal benchmarking, once the data is fully integrated in one
system.
• However, the connection of the EAM systems with the
MIMOSA/OPC protocols is done by proprietary drivers,
which do not guarantee the compatibility among different
EAM systems. In addition, no devices were found to allow the
integration of sensors and IoT devices with transparent
communication with EAM systems. This aspect emphasises
the importance to solve it, developing a device that creates the
interface between IoT sensors and EAM systems, allowing
condition monitoring.
6.2 Open challenges CBM system’s suppliers verified that the integration on different
interfaces was not possible among different systems, so they started
to develop proprietary interfaces. This way, when a company buys
some CBM system product, it needs to be sure that it supports the
system already installed on the factory floor. Besides that, when it
receives new updates, the interfaces may be not compatible with
the product, making the client dependent on the supplier. There is
a lack of open standardized solutions targeting interoperability in
enterprise’s CBM systems.
Two alternatives to develop such solutions could be to develop a
customized set of interfaces for each application or to create a
standard bridge for data exchange. The latter will provide
enterprises with more flexibility to adapt the software for their own
challenges, assuming that the suppliers agree to follow with the
same standard bridge.
61

We suggest that such bridge would follow the Open O&M,
MIMOSA, OPC Foundation and the ISA SP95 commission.
MIMOSA provides asset management related with information
standards, ISA provides automation standards and the OPC
Foundation provides data acquisition and communication
standards.
7. CONCLUSIONS This paper presents a state-of-the-art review of the existing
standards and technologies of open-source communications
protocols and systems, which enables eMaintenance solutions in
the industry. In the context of a global industry, the monitoring of
equipment’s condition, production, overall performance and
quality is fundamental. It is just possible, with the implementation
of an integrated and interoperable monitoring system, to allow the
communications among all equipment and facilities. The
proprietary systems of communication are being a threating for all
the maintenance actors, creating an interoperability barrier. This
barrier can be overcome, based on the discussion, through the
implementation of open communication protocols and systems.
The interoperability problem is having a lot of allocated efforts by
both academia and the industry to solve it. The reason is that the
interoperability is essential for both operations and maintenance,
and it plays an essential role in effective decision making. These
tools and solutions enhance the effectiveness of the maintenance
subject in the enterprise context.
8. ACKNOWLEDGEMENTS The authors of this paper would like to thank all the reviewers for
their insightful and relevant comments on this paper.
REFERENCES
[1] T. L. Weissgerber, N. M. Milic, S. J. Winham, and V. D.
Garovic, “Beyond Bar and Line Graphs : Time for a New
Data Presentation Paradigm,” pp. 1–10, 2015.
[2] J. M. T. Farinha, Asset Maintenance Engineering
Methodologies. 2018.
[3] T. Han and B. S. Yang, “Development of an e-
maintenance system integrating advanced techniques,”
Comput. Ind., vol. 57, no. 6, pp. 569–580, 2006.
[4] B. Al-najjar and I. Alsyouf, “Selecting the most efficient
maintenance approach using fuzzy multiple criteria
decision making,” vol. 84, pp. 85–100, 2003.
[5] G. Waeyenbergh and L. Pintelon, “A framework for
maintenance concept development,” vol. 77, no. April
2000, pp. 2001–2003, 2002.
[6] G. Waeyenbergh and L. Pintelon, “Maintenance concept
development : A case study,” vol. 89, pp. 395–405, 2004.
[7] A. K. S. Jardine, D. Lin, and D. Banjevic, “A review on
machinery diagnostics and prognostics implementing
condition-based maintenance,” pp. 1483–1510, 2006.
[8] O. Candell, R. Karim, and P. Söderholm, “eMaintenance-
Information logistics for maintenance support,” Robot.
Comput. Integr. Manuf., vol. 25, no. 6, pp. 937–944, 2009.
[9] C. From, “A survey on the IETF protocol suite for the
internet of things: Standards, challenges, and
Opportunities,” no. December, pp. 91–98, 2013.
[10] R. Karim, “A service-oriented approach to e-maintenance
of complex technical systems,” Luleå University of
Technology, 2008.
[11] J. P. Shim, M. Warkentin, J. F. Courtney, and D. J. Power,
“Past , present , and future of decision support
technology,” vol. 33, pp. 111–126, 2002.
[12] A. B. G.- Hernando, J.-F. Martínez-Ortega, J.-M. López-
Navarro, A. Prayati, and L. R. López, Problem Solving for
Wireless Sensor Networks. 2008.
[13] M. Kajko-Mattsson, R. Karim, and A. Mirijamdotter,
“Fundamentals of the eMaintenance Concept,” 1St Int.
Work. Congr. eMaintenance, pp. 22–24, 2010.
[14] E. Brockfeld, J. C. Groos, R. Ebendt, C. Rahmig, L.
Schubert, and M. Scholz, “Intelligent Innovative Smart
Maintenance of Assets by integrated Technologies,” p.
133, 2017.
[15] ISO, “ISO 13374-1:2003 Condition monitoring and
diagnostics of machines -- Data processing,
communication and presentation -- Part 1: General
guidelines,” 2003.
[16] M. Thurston and M. Lebold, “Standards Developments for
Condition-Based Maintenance Systems,” 2001.
[17] S. Mekid, “Further Structural Intelligence for Sensors
Cluster Technology in Manufacturing,” pp. 557–577,
2006.
[18] IEEE, “IEEE 802.11a-1999 - IEEE Standard for
Telecommunications and Information Exchange Between
Systems - LAN/MAN Specific Requirements - Part 11:
Wireless Medium Access Control (MAC) and physical
layer (PHY) specifications: High Speed Physical Layer in
the 5 G,” 1999.
[19] IEEE, “IEEE 802.11b-1999 - IEEE Standard for
Information Technology - Telecommunications and
information exchange between systems - Local and
Metropolitan networks - Specific requirements - Part 11:
Wireless LAN Medium Access Control (MAC) and
Physical Layer (PH,” 1999.
[20] T. Cooklev, Wireless Communication Standards - A Study
of IEEE 802.11, 802.15, and 802.16. Standards
Information Network, IEEE Press.
[21] IEEE, “IEEE 802.15.3-2016 - IEEE Standard for High
Data Rate Wireless Multi-Media Networks,” 2016.
62

Application of principal component analysis and artificial neural network in prediction of track geometry
degradation Hamid Khajehei
Division of Operation and Maintenance Engineering
Luleå University of Technology SE-97187 Luleå, Sweden
+46(0)920 493687
Mohammad Haddadzade
Division of Operation and Maintenance Engineering
Luleå University of Technology SE-97187 Luleå, Sweden
+46(0)920 493902
Alireza Ahmadi Division of Operation and Maintenance Engineering
Luleå University of Technology SE-97187 Luleå, Sweden
+46(0)920 493047
Arne Nissen
Trafikverket Luleå, Sweden
+46(0)010 1239391
Iman Soleimanmeigouni Division of Operation and Maintenance Engineering
Luleå University of Technology SE-97187 Luleå, Sweden
+46(0)920 493258
ABSTRACT Railway track geometry subjects to degradation with age and usage
and highly affects track functionality. An accurate prediction of
track geometry degradation is essential to enhance the performance
of maintenance planning and scheduling. In this study, artificial
neural network is used to predict track geometry degradation rate.
The data of five lines from Swedish railway network are used to
develop the model. Standard deviation of longitudinal level is used
as quality indicator for track geometry degradation. For all track
sections, a set of features which may contribute in track geometry
degradation are collected. Principal component analysis method is
used to reduce the dimension of the features to facilitate the training
of the ANN model. Then, the new principal features considered as
inputs to ANN model. The results indicate that the proposed
method can be used to predict track geometry degradation along the
track line.
Keywords
Artificial neural network, principal component analysis, track
geometry, degradation, prediction.
1. INTRODUCTION Track geometry is a key aspect of railway construction and
characterize the track condition [1]. A good track geometry quality
provides a comfort ride for passengers and prevents the track from
wearing too quickly [2]. When a geometry failure occurs, the
consequences can be significant, including economic loss,
operation interruption, damage to the railway asset and
environment, and possible loss of human lives. Therefore, there is
a need to employ proper models to predict track geometry
degradation, which facilitate and enhance the capability of making
effective decisions for maintenance planning.
Prediction of track geometry degradation is a complex task as
many factors such as traffic, structural factors, environmental
factors, and maintenance history contribute differently in
degradation of track geometry [3]. In order to accurately forecast
the future state of track geometry degradation, it is imperative to
consider the effect of the mentioned influencing factors on track
geometry degradation. Once the features (influencing factors) of
track sections along with the measurement data recorded by
inspection cars are available, it would be possible to use a data
driven model to predict track geometry degradation for each track
section [4]. ANN is a powerful data driven model which can be
used for prediction of track geometry degradation. In order to
facilitate the training of the ANN model, principal component
analysis (PCA) are widely used to reduce the dimensionality of the
ANN input variables. PCA map the dimension of the primarily
input parameters into a new space with less dimension. In the field
of railway track maintenance, ANNs have been recently used as
data analytic methods because of their capability in handling huge
amount of data, learn from data, and their generalization ability [5].
For example, [6] used ANN to forecast track geometry degradation
rate using a set of factors. Based on the achieved results, the author
mention that ANN can be used for prediction of track geometry
degradation. [7] applied ANN to determine a correlation between
track geometry defects and track structural problems. The authors
developed a set of models by considering standard deviation of
gauge, longitudinal level, alignment, and twist as ANN input and
rail, sleeper, ballast, and fastening defects as ANN output. Finally,
the authors stated that by having recorded measurement data, it
would be possible to efficiently predict track structural conditions.
In [4], ANN and support vector regression (SVR) were used to
predict track geometry degradation by considering a set of
influencing factors. The authors used standard deviation of
longitudinal level as track quality indicator (TQI). In this work,
63

structure type, curvature, velocity, MGT, TQI value after tamping
or ballast renewal, and number of tamping interventions are inputs
to ANN model and the TQI value is the output of ANN. [8] used
ANN to predict gauge widening in tram track by focusing on the
track curves.
The aim of this study is to predict track geometry degradation
rate of standard deviation of longitudinal level using PCA and
ANN. Standard deviation of longitudinal level, maintenance
history, and asset information for five lines in Swedish railway
network were collected for this purpose. PCA method was used to
reduce the dimensionality of the input parameters. The new
components (parameters) extracted from PCA was used to build the
ANN model. A set of ANN models with different number of
neurons in hidden layer were developed and the ANN model with
the best performance was determined by means of coefficient of
determination and mean square error. The developed model by
PCA-ANN can be used for the purpose of track maintenance
planning by predicting the track geometry degradation over a track
line.
The reminder of this paper is organised as follow. Section 2
presents principal component analysis. Section 3 explains the
structure and artificial neural network and the link between PCA
and ANN. The dataset used to develop PCA-ANN model is
explained in section 4. Section 5 gives information regarding the
set of potential input parameters to PCA-ANN. Section 6 presents
the results of PCA and ANN models. Finally, section 7 provides the
conclusion.
2. PRINCIPAL COMPONENT ANALYSIS Principal component analysis (PCA) is well-known technique for
dimension reduction and feature extraction. In this technique, the
aim is to reduce the dimension of the existing data into a lower
dimension space such that the new dimension contains as mush
variation as possible in the data [9]. PCA is useful to avoid the
redundancy due to high dimensional data [10]. The pseudocode for
implementing PCA is provided in Table 1. Many researchers have
been used this technique in the literature. For instance, [11]
assessed the applicability of PCA and ANN in the prediction of
stock prices on Tehran stock exchange. [10] combined PCA and
ANN to effectively predict agricultural energy flows. In the field of
railway, more recently, [9] took advantage of PCA technique to
determine the most important (principal component) track
geometry parameters taken from inspection car and use them as a
track geometry indicator. In this study, the PCA is applied to the
existing raw data to reduce the dimensionality and the new
extracted data from PCA are used to build the ANN model.
Table 1. PCA pseudocode
Algorithm: PCA pseudocode
1: Input a D dimensional raw data set (X) and the new
dimensionality (k)
2: Normalize raw data set
𝑋𝑛𝑜𝑟𝑚 = (𝑋𝑖 −min(𝑋𝑖)) (max(𝑋𝑖) − min(𝑋𝑖))⁄
3: Compute the covariance matrix
𝐶𝑜𝑣(𝑋𝑛𝑜𝑟𝑚) = (𝑋𝑛𝑜𝑟𝑚 × 𝑋𝑛𝑜𝑟𝑚𝑇 ) 𝑁⁄
4: Compute eigenvectors (a matrix of D*D) and their
corresponding eigenvalues (λ)
5: Sort the eigenvalues in descending order
6: Normalize eigenvalues 𝜆𝑖 ∑ 𝜆𝑖𝐷𝑖=1⁄
7: Select kth columns of eigenvalues (W)
8: Compute the input data in the new space
𝑦 = 𝑊𝑇 × 𝑋𝑛𝑜𝑟𝑚
3. ARTIFICIAL NEURAL NETWORK Artificial Neural Network (ANN) consists of simple elements
which operate in parallel and these elements are inspired by
biological neurons systems [12]. The structure of ANNs are usually
constructed of three parts including input layer of neurons, one or
several hidden layers, and output layer of neurons. Figure 1 shows
the link between PCA and ANN models. In the figure, the raw input
data are normalized and imported to PCA model for the purpose of
dimensionality reduction. Then, the new data set with less number
of dimensions compared to original data are used for building the
ANN model. In figure 1, the ANN model consists of an input layer
with j neurons, one hidden layer with i neurons and an output layer.
The first layer (input layer) receives the information from the
environment. The inputs (PCj) multiplied by adjustable connection
weights (wi,j). Then, the weighted inputs summed and a bias (bi) is
added to them. The results which is called net (ni) pass through an
activation function (f) to make the output. The output of each layer
(si) becomes the input to the next layer and this process continue to
reach to last layer which is output layer. This process is presented
in equations (1) and (2).
𝑛𝑖 = Σ𝑤𝑖,𝑗 × 𝑃𝐶𝑗 + 𝑏𝑖 (1)
𝑠𝑖 = 𝑓(𝑛𝑖) (2)
There are different activation functions that are selected based on
the bounds of the output values and their characteristics. The most
common functions are step function for binary values, linear
function for continuous un-bounded values, sigmoid function and
tan-sigmoid function. The neurons of the last layer, output layer,
predict values and compare the output and the target and resulted
errors are used to update the network weights and biases.
ANN uses a learning rule to find optimal connection weights which
are able to map input to output with minimum possible error [13].
Levenberg-Marquardt (LM) algorithm is one of the well-known
learning methods which widely used to determine optimal
connection weights [4]. In this study, LM algorithm is used to train
the ANN model. In addition, there are several ways to assess the
performance of ANN model such as mean-squared error, sum of
squared error, average absolute error, coefficient of determination,
and average absolute percentage error. In this study, coefficient of
determination (R2) and mean-squared error (MSE) are used to
evaluate the performance of the developed ANN model.
𝑅2 = 1 −∑ (𝑚𝑖−𝑝𝑖)
2𝑖
∑ (𝑚𝑖−��)2𝑖
(3)
𝑀𝑆𝐸 =∑ (𝑚𝑖−𝑝𝑖)
2𝑖
𝑁
(4)
64
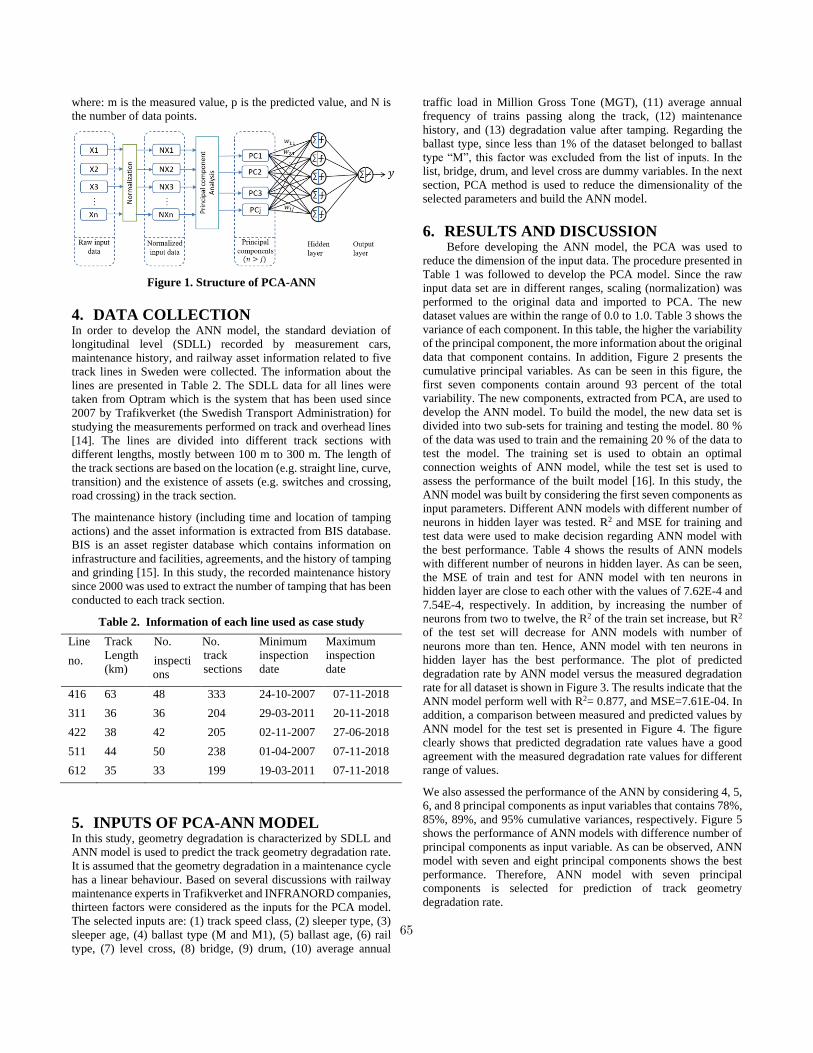
where: m is the measured value, p is the predicted value, and N is
the number of data points.
Figure 1. Structure of PCA-ANN
4. DATA COLLECTION In order to develop the ANN model, the standard deviation of
longitudinal level (SDLL) recorded by measurement cars,
maintenance history, and railway asset information related to five
track lines in Sweden were collected. The information about the
lines are presented in Table 2. The SDLL data for all lines were
taken from Optram which is the system that has been used since
2007 by Trafikverket (the Swedish Transport Administration) for
studying the measurements performed on track and overhead lines
[14]. The lines are divided into different track sections with
different lengths, mostly between 100 m to 300 m. The length of
the track sections are based on the location (e.g. straight line, curve,
transition) and the existence of assets (e.g. switches and crossing,
road crossing) in the track section.
The maintenance history (including time and location of tamping
actions) and the asset information is extracted from BIS database.
BIS is an asset register database which contains information on
infrastructure and facilities, agreements, and the history of tamping
and grinding [15]. In this study, the recorded maintenance history
since 2000 was used to extract the number of tamping that has been
conducted to each track section.
Table 2. Information of each line used as case study
Line
no.
Track
Length
(km)
No.
inspecti
ons
No.
track
sections
Minimum
inspection
date
Maximum
inspection
date
416 63 48 333 24-10-2007 07-11-2018
311 36 36 204 29-03-2011 20-11-2018
422 38 42 205 02-11-2007 27-06-2018
511 44 50 238 01-04-2007 07-11-2018
612 35 33 199 19-03-2011 07-11-2018
5. INPUTS OF PCA-ANN MODEL In this study, geometry degradation is characterized by SDLL and
ANN model is used to predict the track geometry degradation rate.
It is assumed that the geometry degradation in a maintenance cycle
has a linear behaviour. Based on several discussions with railway
maintenance experts in Trafikverket and INFRANORD companies,
thirteen factors were considered as the inputs for the PCA model.
The selected inputs are: (1) track speed class, (2) sleeper type, (3)
sleeper age, (4) ballast type (M and M1), (5) ballast age, (6) rail
type, (7) level cross, (8) bridge, (9) drum, (10) average annual
traffic load in Million Gross Tone (MGT), (11) average annual
frequency of trains passing along the track, (12) maintenance
history, and (13) degradation value after tamping. Regarding the
ballast type, since less than 1% of the dataset belonged to ballast
type “M”, this factor was excluded from the list of inputs. In the
list, bridge, drum, and level cross are dummy variables. In the next
section, PCA method is used to reduce the dimensionality of the
selected parameters and build the ANN model.
6. RESULTS AND DISCUSSION Before developing the ANN model, the PCA was used to
reduce the dimension of the input data. The procedure presented in
Table 1 was followed to develop the PCA model. Since the raw
input data set are in different ranges, scaling (normalization) was
performed to the original data and imported to PCA. The new
dataset values are within the range of 0.0 to 1.0. Table 3 shows the
variance of each component. In this table, the higher the variability
of the principal component, the more information about the original
data that component contains. In addition, Figure 2 presents the
cumulative principal variables. As can be seen in this figure, the
first seven components contain around 93 percent of the total
variability. The new components, extracted from PCA, are used to
develop the ANN model. To build the model, the new data set is
divided into two sub-sets for training and testing the model. 80 %
of the data was used to train and the remaining 20 % of the data to
test the model. The training set is used to obtain an optimal
connection weights of ANN model, while the test set is used to
assess the performance of the built model [16]. In this study, the
ANN model was built by considering the first seven components as
input parameters. Different ANN models with different number of
neurons in hidden layer was tested. R2 and MSE for training and
test data were used to make decision regarding ANN model with
the best performance. Table 4 shows the results of ANN models
with different number of neurons in hidden layer. As can be seen,
the MSE of train and test for ANN model with ten neurons in
hidden layer are close to each other with the values of 7.62E-4 and
7.54E-4, respectively. In addition, by increasing the number of
neurons from two to twelve, the R2 of the train set increase, but R2
of the test set will decrease for ANN models with number of
neurons more than ten. Hence, ANN model with ten neurons in
hidden layer has the best performance. The plot of predicted
degradation rate by ANN model versus the measured degradation
rate for all dataset is shown in Figure 3. The results indicate that the
ANN model perform well with R2= 0.877, and MSE=7.61E-04. In
addition, a comparison between measured and predicted values by
ANN model for the test set is presented in Figure 4. The figure
clearly shows that predicted degradation rate values have a good
agreement with the measured degradation rate values for different
range of values.
We also assessed the performance of the ANN by considering 4, 5,
6, and 8 principal components as input variables that contains 78%,
85%, 89%, and 95% cumulative variances, respectively. Figure 5
shows the performance of ANN models with difference number of
principal components as input variable. As can be observed, ANN
model with seven and eight principal components shows the best
performance. Therefore, ANN model with seven principal
components is selected for prediction of track geometry
degradation rate.
65
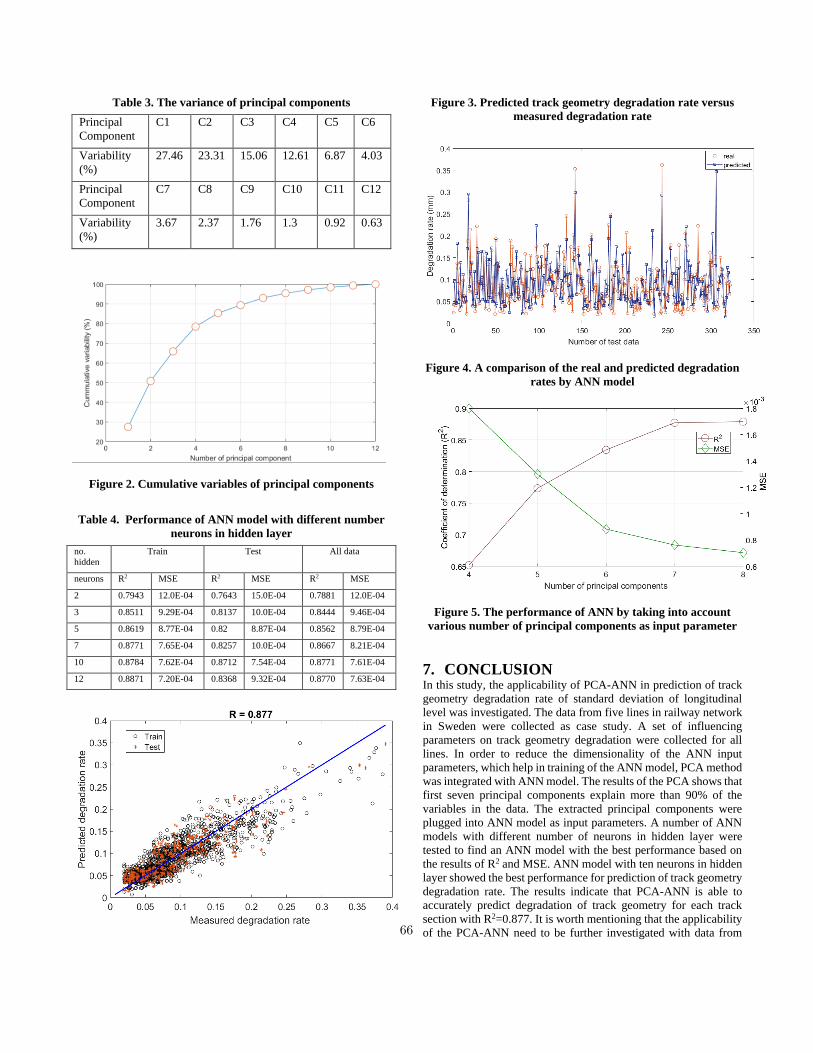
Table 3. The variance of principal components
Principal
Component
C1 C2 C3 C4 C5 C6
Variability
(%)
27.46 23.31 15.06 12.61 6.87 4.03
Principal
Component
C7 C8 C9 C10 C11 C12
Variability
(%)
3.67 2.37 1.76 1.3 0.92 0.63
Figure 2. Cumulative variables of principal components
Table 4. Performance of ANN model with different number
neurons in hidden layer
no.
hidden
Train Test All data
neurons R2 MSE R2 MSE R2 MSE
2 0.7943 12.0E-04 0.7643 15.0E-04 0.7881 12.0E-04
3 0.8511 9.29E-04 0.8137 10.0E-04 0.8444 9.46E-04
5 0.8619 8.77E-04 0.82 8.87E-04 0.8562 8.79E-04
7 0.8771 7.65E-04 0.8257 10.0E-04 0.8667 8.21E-04
10 0.8784 7.62E-04 0.8712 7.54E-04 0.8771 7.61E-04
12 0.8871 7.20E-04 0.8368 9.32E-04 0.8770 7.63E-04
Figure 3. Predicted track geometry degradation rate versus
measured degradation rate
Figure 4. A comparison of the real and predicted degradation
rates by ANN model
Figure 5. The performance of ANN by taking into account
various number of principal components as input parameter
7. CONCLUSION In this study, the applicability of PCA-ANN in prediction of track
geometry degradation rate of standard deviation of longitudinal
level was investigated. The data from five lines in railway network
in Sweden were collected as case study. A set of influencing
parameters on track geometry degradation were collected for all
lines. In order to reduce the dimensionality of the ANN input
parameters, which help in training of the ANN model, PCA method
was integrated with ANN model. The results of the PCA shows that
first seven principal components explain more than 90% of the
variables in the data. The extracted principal components were
plugged into ANN model as input parameters. A number of ANN
models with different number of neurons in hidden layer were
tested to find an ANN model with the best performance based on
the results of R2 and MSE. ANN model with ten neurons in hidden
layer showed the best performance for prediction of track geometry
degradation rate. The results indicate that PCA-ANN is able to
accurately predict degradation of track geometry for each track
section with R2=0.877. It is worth mentioning that the applicability
of the PCA-ANN need to be further investigated with data from 66
other line sections and by considering more influencing factors on
track geometry degradation.
8. ACKNOWLEDGMENTS The authors would like to thank Trefikverket, Luleå Railway
Research Center (JVTC), and simtrack project for their technical
and financial support provided during this project.
9. REFERENCES
[1] C. Esveld, Modern railway track, MRT-productions
Zaltbommel, The Netherlands, 2001.
[2] Trafikverket, "Annual Report," 2017.
[3] I. Soleimanmeigouni, A. Ahmadi and U. Kumar, "Track
geometry degradation and maintenance modelling: A review,"
Proc.Inst.Mech.Eng.Pt.F: J.Rail Rapid Transit, pp.
0954409716657849 2016.
[4] J.S. Lee, S.H. Hwang, I.Y. Choi and I.K. Kim, "Prediction of
track deterioration using maintenance data and machine learning
schemes," Journal of Transportation Engineering, Part A:
Systems, vol. 144, no. 9, pp. 04018045 2018.
[5] M.G. Karlaftis and E.I. Vlahogianni, "Statistical methods
versus neural networks in transportation research: Differences,
similarities and some insights," Transportation Research Part C:
Emerging Technologies, vol. 19, no. 3, pp. 387-399 2011.
[6] H. Guler, "Prediction of railway track geometry deterioration
using artificial neural networks: A case study for turkish state
railways," Structure and Infrastructure Engineering, vol. 10, no.
5, pp. 614-626 2014.
[7] J. Sadeghi and H. Askarinejad, "Application of neural
networks in evaluation of railway track quality condition,"
Journal of mechanical science and technology, vol. 26, no. 1, pp.
113-122 2012.
[8] S. Moridpour, E. Mazloumi and R. Hesami, "Application of
artificial neural networks in predicting the degradation of tram
tracks using maintenance data," in Applied Big Data Analytics in
Operations Management, Anonymous : IGI Global, 2017, pp. 30-
54.
[9] A. Lasisi and N. Attoh-Okine, "Principal components analysis
and track quality index: A machine learning approach,"
Transportation Research Part C: Emerging Technologies, vol. 91,
pp. 230-248 2018.
[10] A. Nikkhah, A. Rohani, K.A. Rosentrater, M. El Haj Assad
and S. Ghnimi, "Integration of principal component analysis and
artificial neural networks to more effectively predict agricultural
energy flows," Environmental Progress & Sustainable Energy
2019.
[11] J. Zahedi and M.M. Rounaghi, "Application of artificial
neural network models and principal component analysis method
in predicting stock prices on tehran stock exchange," Physica A:
Statistical Mechanics and its Applications, vol. 438, pp. 178-187
2015.
[12] H. Demuth and M. Beale, "Neural network toolbox for use
with {MATLAB}-user\'s guide," 2004.
[13] M.A. Shahin, "State-of-the-art review of some artificial
intelligence applications in pile foundations," Geoscience
Frontiers, vol. 7, no. 1, pp. 33-44 2016.
[14] I. Soleimanmeigouni, X. Xiao, A. Ahmadi, M. Xie, A.
Nissen and U. Kumar, "Modelling the evolution of ballasted
railway track geometry by a two-level piecewise model,"
Structure and Infrastructure Engineering, vol. 14, no. 1, pp. 33-45
2018.
[15] I.A. Khouy, P. Larsson-Kråik, A. Nissen, U. Juntti and H.
Schunnesson, "Optimisation of track geometry inspection
interval," Proc.Inst.Mech.Eng.Pt.F: J.Rail Rapid Transit, vol.
228, no. 5, pp. 546-556 2014.
[16] F.P. Nejad and M.B. Jaksa, "Load-settlement behavior
modeling of single piles using artificial neural networks and CPT
data," Comput.Geotech., vol. 89, pp. 9-21 2017.
67

Maintenance in the digital era - an interview study of challenges and opportunities within the Swedish
maintenance ecosystem Mirka Kans
Linnaeus University Department of Mechanical Engineering
Luckligs plats 1, 35195 Växjö +46 470708488
ABSTRACT Industry 4.0 refers to a fourth generation of industrial activity as a result of the fourth industrial revolution characterized by smart systems and Internet-based solutions. It is foreseen as a great changer of industry with respect to how production is defined and performed. Manufacturing systems will become more modular and more efficient, and control of both the manufacturing process and the devices will become autonomous. The latter directly affects the maintenance and its management. For better understanding the challenges faced in maintenance when entering Industry 4.0, and for enabling a smooth digital development, an interview study was performed with representatives within the maintenance ecosystem. The aim of the study was to get a broad view on maintenance in the digital era in form of applicable technologies, challenges as well as opportunities from various Swedish actors, such as system providers, computerized maintenance management suppliers, researchers, and educators. The findings suggest that the main challenges do not lie in technology, but in factors such as strategic planning, culture and lack of competence.
Today, great potential exists for achieving effective maintenance through digital solutions; sensors and process data are the cornerstone of both long-term and short-term planning, and for detecting and preventing malfunctions. Even though, maintenance today is planned mainly based on calendar time, and sensor data are hard to utilize efficiently for the planning or improvement of maintenance. Amongst possible reasons are difficulties to identify suitable digital solutions that lead to more efficient maintenance management, and to find effective ways to improve maintenance plans by analysing existing data. A roadmap for the transformation is required for facilitating the digital development in maintenance, including a structured approach, methods and tools for the digital transformation, as well as the collaboration between different stakeholders in the maintenance ecosystem.
Keywords Digitalization in maintenance; Industry 4.0; Interview study; Challenges and opportunities; Swedish maintenance ecosystem.
1. INTRODUCTION Over the centuries, the industry has developed continuously, and today businesses face many challenges; markets become more mobile and innovation cycles become shorter, and energy and resource efficiency will be an increasingly important part of competitiveness. A fourth industrial revolution is approaching that
addresses these challenges through the development of intelligent and integrated production units [1]. Sanders et al. [2] perceive Industry 4.0 as an enabler for successful implementation of lean manufacturing principles. Manufacturing systems will become more efficient, achieve higher modularity, and have autonomous control of both the manufacturing process and the devices. The new smart, machines and products, and the combination of new Internet technologies and the new digitization of factories, is the beginning of the new revolution [3]. Maintenance 4.0 is a subset of industry 4.0 with emphasis on the efficient and automatic management of maintenance through automatic data collection, analysis, visualization, and decision making [4]. Digitalization of maintenance started already in the 1980s [5], and the term condition-based maintenance, which could be seen as a data-driven and knowledge-based maintenance strategy, was coined several decades ago [6]. Since then, maintenance has undergone a digital development, but could still be seen as relatively immature [7], especially compared with other business processes.
The main purpose of this paper is to understand the opportunities as well as challenges faced in maintenance when entering Industry 4.0, in order to enable a smooth digital development. For reaching the purpose, an interview survey was conducted aiming at creating a broad view on maintenance in the digital era from various Swedish actors, such as system providers, computerized maintenance management suppliers, researchers, and educators. In section 2 the term Industry 4.0 is introduced. Section 3 presents the study setup and section 4 the main results. The results are discussed in section 5 and general conclusions as well as areas of future research are given.
2. DIGITALISATION OF INDUSTRY AND INDUSTRY 4.0 Industry 4.0 refers to a fourth generation of industrial activity as a result of the fourth industrial revolution characterized by smart systems and Internet-based solutions [3]. The fourth revolution could be seen as the “internetisation” of production. The basis of Industry 4.0 is the availability of data and information in real time as everything forms a large network where physical objects are interconnected and represented as describing Industry 4.0 are Internet of Things, Artificial Intelligence, and Cyber-Physical Systems.
• Internet of Things (IoT) is a collection of several kinds of techniques such as industrial automation, robotics, life cycle management, and IT security [8]. With the development of Internet, the interaction between humans and objects as well
68

as objects to objects is subject to increase, which requires a new mind-set about how we understand the world around us [9]. IoT is described by IoT Sweden, a strategic innovation program similar to Industrie 4.0, as a collective term for the communities we live in where objects are fitted with sensors and processors, which opens for these objects to be able to perceive the world and communicate and interact with the rest of society [10]. Furthermore, IoT enables the collection of large amounts of data, which often refers to the "Big Data". With the help of data and sensors increased possibilities to reduce the wastage and losses emerge in various fields such as manufacturing. In the manufacturing industry, IoT gives opportunities for improved maintenance [4]. Instead of components run until they break, you can advantageously use a system to monitor a machine's components using sensors, identify deviations at an early stage and have a longer time to be able to take action before it affects the machine or the finished product [9].
• Artificial intelligence (AI) is commonly understood as intelligence of the computer system by the development of computational agents [11]. The purpose of AI is to mimic the brain's ability to draw conclusions, plan, solve problems, understand natural language, and self-learning. This is enabled by technologies such as machine learning, deep learning, statistics and visualisation [12-14]. Machine learning is the use of mathematical or statistical methods for pattern recognition in big data sets. An advanced form of machine learning using neural network methods is denoted deep learning. The application areas in industry are wide, from automated planning and scheduling to self-adapting and self-maintaining machinery. Applications where humans have to interact with the computers could also be seen, such as
• Cyber-physical systems (CPS) connect smart machines, production systems and storage systems for the exchange of information completely independently, and are seen as a convergence between the physical and virtual world [8]. With the help of the inbuilt intelligence the systems have the ability to make decisions and take the necessary measures in case of any problems. Mostermand and Zander [15] describe CPS as a number of systems linked together to function as one larger system. The total system is connected as a network but shares the physical world, such as hardware, with a variety of communication systems that interact in the physical world. CPS contain, according to [16], a number of different areas such as embedded systems, production and logistics, meanwhile Internet services collect data from sensors of physical processes. These are linked via digital networks. In addition to the technical architecture, Platform Industry 4.0 view CPS as a socio-technical system that covers both man and technology.
Other technologies that are found within the Industry 4.0 concept are for instance Visualisation, Radio frequency identification, Virtual reality, Augmented reality, and Knowledge sharing systems [4]. Visualisation is the representation of large amount of qualitative as well as quantitative data in a form that is recognised and understood by a human (it reinforces human cognition). Virtual and augmented reality are real time applications where information from the physical world with is mixed with
information from the software. Eye tracking is a type of artificial vision system and monitors the user’s eye movement, i.e. what the user looks at [17], and is thus an advanced monitoring method, but where the behaviour of the technical is tracked rather than the machine condition.
3. STUDY DESCRIPTION 3.1 Study setup The interview study was carried out during the major bi-annual Nordic maintenance fare held in Gothenburg in 2018. The fare is the largest maintenance related event in Northern Europe consisting of over 300 exhibitors and 11 000 visitors, and attracts companies, practitioners as well as researchers. The interviews, which lasted about 30 minutes each, were based on four predetermined and open-ended questions:
1. Which technology do you view as the most important today for developing maintenance, and within which area (planning, preparation, execution, follow-up, improvement of maintenance)?
2. Which technology has made its breakthrough in five years’ time, and which area has developed most?
3. Which are the biggest digital challenges in maintenance?
4. How can the digital development best be facilitated?
The participants were free to give other comments upon the subject as well.
3.2 Participants In total 14 participants were interviewed representing 14 unique actors in the maintenance ecosystem, mainly from the supplier side. The term business ecosystem denotes actors involved in a specific value generating process [18]. In addition, the ecosystem could also include other stakeholders that could influence the value creation, such as competitors, companies producing substitutes, standardisation organisations, trade organisations, educators, public authorities, and customer groups. Table 1 lists the participants based on actor type and specialisation.
Table 1. Study participants Actor type Specialisation 1 University/higher
education Engineering education and research
2 University/higher education
Engineering education and research
3 Trade organisation Education and certification 4 Supplier Education and standards 5 Supplier Education and consulting
services 6 Supplier Computerised Maintenance
Management Systems 7 Supplier Computerised Maintenance
Management Systems 8 Supplier Computerised Maintenance
Management Systems 9 Supplier Engineering Plant Data Systems
69

and Computerised Maintenance Management Systems
10 Supplier Maintenance services 11 Supplier Safety services 12 Supplier IT consulting services 13 Supplier Sealing products and services 14 Supplier Lubricant
4. RESULTS The results are presented in the same order as the questions. 4.1 comprises results from questions one and two, 4.2 results from question three, and 4.3 results from question four. The numbering in Table 1 is used identifying respective participant.
4.1 Digital technologies in maintenance The digital technologies that are important for the development of maintenance, as mentioned by the participants, are listed in Table 2. Wide set of technologies are mentioned, but some are more frequently mentioned: sensor technology, machine learning and visualisation are mentioned by several participants. Digitalisation affects all areas of maintenance management, according to the participants. Many view digitalisation as a means to move towards condition based or predictive maintenance. Especially planning is enabled by digital solutions, but also follow-up and improvement of maintenance.
Table 2. Most important technologies for the development of maintenance
Technology Area 1 Machine learning All areas 2 Artificial Intelligence (AI) - 3 Production technology and
maintenance technology are integrated; integrated maintenance and automation.
-
4 Reading of equipment data, Productivity follow-up, Visualisation
Follow-up
5 Data collection “where it happens”, in real time and mobile. Sensors for enabling long-term planning. Ability to report where you are. Information as a valuable asset for making better decisions.
All areas except Preparation
6 Computerised Maintenance Management Systems (CMMS)
All areas
7 CMMS that communicates with machines, enabling condition based maintenance
Planning
8 Production follow-up Follow-up 9 Sensors and Internet of Things (IoT)
for capturing and transporting measures. Continuous measurement of condition. Planning engine as a “black box”.
All areas
10 Eye Tracking and similar in order to be able to conduct daily tasks without changing behaviour
Execution
11 Compilation of risk analyses through Improvement
visualisation (for the customer) 12 Predictive maintenance, i.e. sensor
technology, machine learning, data analysis.
Planning, Improvement
13 3D scanning for planning, preparation and creation of spare parts
Planning, Preparation
14 Condition monitoring and condition based maintenance of lubricants
Planning, Execution
Three main application areas could be seen:
1) Collection of data: The ability to collect data from the production, from the machines and directly where maintenance is conducted, as well as being able to transport the data through the internet, is required. The ability to collect real time data from the production and machines is the basis for advanced analysis of the data. The integration of different systems is also mentioned – while production and maintenance use to be treated in separate systems, it is obvious that the main data come from the same sources, i.e. production. The possibility to represent products (and production) digitally through 3D scanning is also mentioned.
2) Maintenance planning: Advanced planning engines, using machine learning or other artificial intelligence solutions for analysing the large data sets retrieved from production, will enable the transformation of maintenance planning from calendar based to predictive and condition based maintenance.
3) Follow-up and continuous improvement: The integration of maintenance and production is clearly visible in the interview answers; the main area of follow-up mentioned is production. The ability to analyse large sets of data and present the results in an understandable way for internal as well as external actors is important. This is enabled by for instance machine learning and visualisation.
In addition, eye tracking and 3D scanning are technologies that could be used in maintenance, according to participants 10 and 13. Eye tracking could be used for the purpose of guidance during maintenance execution, or for learning purposes. Having access to product dimensions in the computer by the means of 3D scanning enables 3D printing of the object [19]. This could for instance enable the creation of spare parts on demand.
Looking into a near future, the study participants foresee some interesting technological breakthroughs, see Table 3. Maintenance is clearly utilising the Industry 4.0 concept in five years’ time, according to the participants. Sensor data are regularly collected and transported through the internet. Machine learning, deep learning, digital twins, and visualisation are used for analysing huge data sets. These technologies enables condition based and predictive maintenance planning. Planning and follow-up of not only maintenance, but also the whole plant, is made in a mobile setting remotely and the execution of maintenance is supported by mobile devices and advanced AR applications. The maintenance technicians are monitored and guided from a remote monitoring central. Key concepts are mobility, but also safety, as everything
70
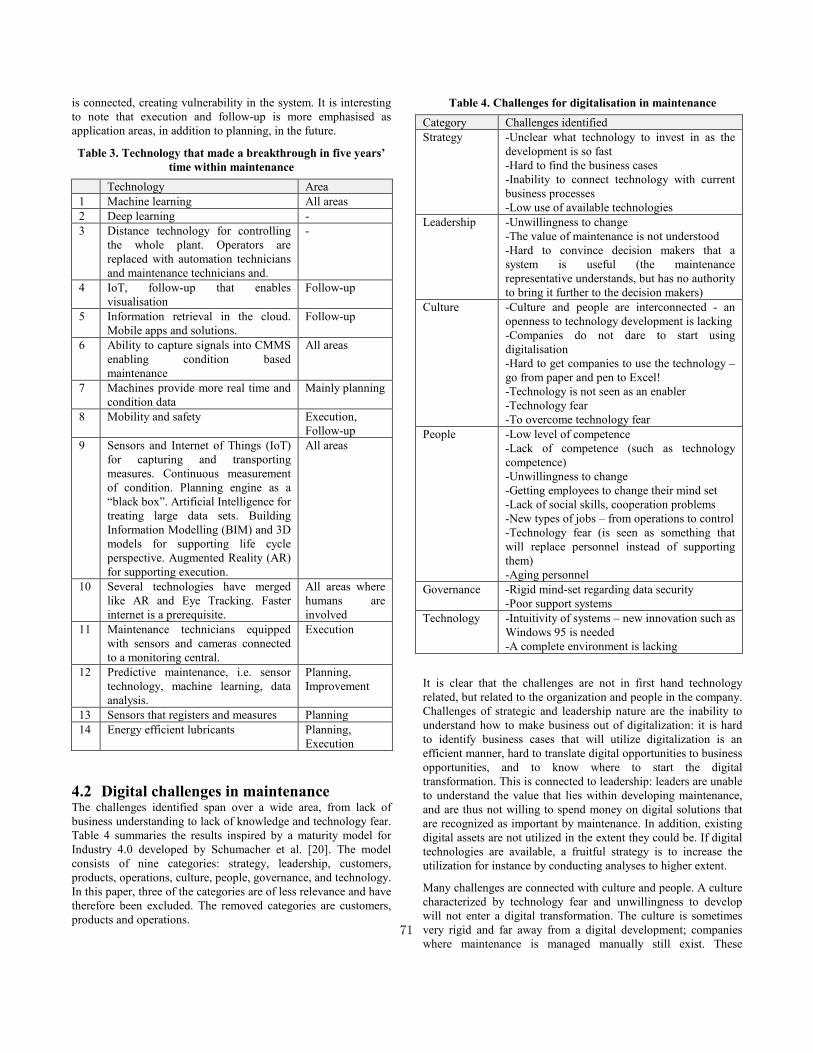
is connected, creating vulnerability in the system. It is interesting to note that execution and follow-up is more emphasised as application areas, in addition to planning, in the future.
Table 3. Technology that made a breakthrough in five years’ time within maintenance
Technology Area 1 Machine learning All areas 2 Deep learning - 3 Distance technology for controlling
the whole plant. Operators are replaced with automation technicians and maintenance technicians and.
-
4 IoT, follow-up that enables visualisation
Follow-up
5 Information retrieval in the cloud. Mobile apps and solutions.
Follow-up
6 Ability to capture signals into CMMS enabling condition based maintenance
All areas
7 Machines provide more real time and condition data
Mainly planning
8 Mobility and safety Execution, Follow-up
9 Sensors and Internet of Things (IoT) for capturing and transporting measures. Continuous measurement of condition. Planning engine as a “black box”. Artificial Intelligence for treating large data sets. Building Information Modelling (BIM) and 3D models for supporting life cycle perspective. Augmented Reality (AR) for supporting execution.
All areas
10 Several technologies have merged like AR and Eye Tracking. Faster internet is a prerequisite.
All areas where humans are involved
11 Maintenance technicians equipped with sensors and cameras connected to a monitoring central.
Execution
12 Predictive maintenance, i.e. sensor technology, machine learning, data analysis.
Planning, Improvement
13 Sensors that registers and measures Planning 14 Energy efficient lubricants Planning,
Execution
4.2 Digital challenges in maintenance The challenges identified span over a wide area, from lack of business understanding to lack of knowledge and technology fear. Table 4 summaries the results inspired by a maturity model for Industry 4.0 developed by Schumacher et al. [20]. The model consists of nine categories: strategy, leadership, customers, products, operations, culture, people, governance, and technology. In this paper, three of the categories are of less relevance and have therefore been excluded. The removed categories are customers, products and operations.
Table 4. Challenges for digitalisation in maintenance Category Challenges identified Strategy -Unclear what technology to invest in as the
development is so fast -Hard to find the business cases -Inability to connect technology with current business processes -Low use of available technologies
Leadership -Unwillingness to change -The value of maintenance is not understood -Hard to convince decision makers that a system is useful (the maintenance representative understands, but has no authority to bring it further to the decision makers)
Culture -Culture and people are interconnected - an openness to technology development is lacking -Companies do not dare to start using digitalisation -Hard to get companies to use the technology – go from paper and pen to Excel! -Technology is not seen as an enabler -Technology fear -To overcome technology fear
People -Low level of competence -Lack of competence (such as technology competence) -Unwillingness to change -Getting employees to change their mind set -Lack of social skills, cooperation problems -New types of jobs – from operations to control -Technology fear (is seen as something that will replace personnel instead of supporting them) -Aging personnel
Governance -Rigid mind-set regarding data security -Poor support systems
Technology -Intuitivity of systems – new innovation such as Windows 95 is needed -A complete environment is lacking
It is clear that the challenges are not in first hand technology related, but related to the organization and people in the company. Challenges of strategic and leadership nature are the inability to understand how to make business out of digitalization: it is hard to identify business cases that will utilize digitalization is an efficient manner, hard to translate digital opportunities to business opportunities, and to know where to start the digital transformation. This is connected to leadership: leaders are unable to understand the value that lies within developing maintenance, and are thus not willing to spend money on digital solutions that are recognized as important by maintenance. In addition, existing digital assets are not utilized in the extent they could be. If digital technologies are available, a fruitful strategy is to increase the utilization for instance by conducting analyses to higher extent.
Many challenges are connected with culture and people. A culture characterized by technology fear and unwillingness to develop will not enter a digital transformation. The culture is sometimes very rigid and far away from a digital development; companies where maintenance is managed manually still exist. These
71
companies naturally have a longer journey than companies where for instance CMMS’s already are in use. Competence is also a problem. Low level of formal as well as real competence, for instance within digital technologies, and high age of personnel, affects the possibilities to implement digital solutions. It is also recognized that social skills and cooperation will become more important in the future. Unwillingness to change and technology fear adds to the problematic situation.
A set of challenges are connected with technology and the governance of technology. The technical solutions are hard to understand, not intuitive enough. They are not highly integrated either; a complete digital environment is lacking. The more advanced and integrated technology, the higher demand on suitable information technology support and data security measures. These two areas were seen as current challenges by two study participants.
4.3 Facilitating the digital transformation A number of ways to facilitate the digital transformation were mentioned by the study participants. Companies should work on improving the culture and leadership, one participant mentioned. This is directly connected with the major challenges identified in the previous sub section. Letting go and just taking the first step is another suggestion, for instance by feeding data into existing systems. Companies should also let the young people in; they want to be challenged and have interesting problems to solve, and such are found in the maintenance area. Suppliers could help by becoming better in informing about available systems and solutions, and to develop solutions that are compatible in various environments. Suppliers could also present good business cases to gain increased interest from the companies. When implementing new solutions the old system and the new system could run in parallel as a way to show that the new solution is working, i.e. to apply an implementation strategy that allows personnel to get used to the new solution. Trade organisations and standardisation bodies have an important role in developing new standards and for visualise the importance of maintenance and its impact on total economy. One way to do this is to develop maintenance related key performance indicators for different industry branches.
Educators have an important role in attracting young people to maintenance related education. The education programs at high school and university level should be revised, according to one participant. He suggests combining electrical and industrial engineering programs at high school level, and standardisation of education programs and courses on all levels. Researchers should focus on real life problems and help the industry in defining and solving problems. Companies and suppliers, but also trade organisations, educators and researchers, should work together in visualise and clarify existing solutions; if one is approached by these solutions, the fear might decrease. The importance of collaboration between different actors in order to facilitate the digitalisation is recognised as a means to increase knowledge and understanding. For reaching this, sharing data, experiences and knowledge is essential. One example of shared data could be sensor data generated by a school or university that is open for everyone to download and analyse. Finally, raising the status of maintenance is mentioned by one participant. This could also be viewed as a shared responsibility.
5. DISCUSSION AND CONCLUSIONS The study participants depicted a near future where Industry 4.0 has become a reality in maintenance – advanced data capture, transfer, processing, analysis and utilization describes the future of maintenance. By depicting the future, a current state-of-the-art in maintenance management could also be derived as perceived by the participants; maintenance is planned mainly based on calendar time, and where sensor data are hard to utilize efficiently for the planning or improvement of maintenance. This picture corresponds well with the findings in [21] where it was concluded that functionality gaps in CMMS mainly were found for follow-up and improvement activities. It is not an impossible future that is perceived by the study participants; the technological development is fast, and internet of things is applied in various areas today, from manufacturing and transport to houses and even refrigerators. The main challenges are not technology, but in organizational preparedness, according to the study results.
It is important to take advantage of existing technology and accumulate the existing knowledge to optimize the entire flow, but also to not lose any experience [22]. Jacobsen and Thorsvik [23] highlight the importance of the employee's intellectual capital, representing up to 80 per cent of total resources in the modern organization. It is therefore important that the personnel is prepared for the future and develops in parallel with technology. Instead of waiting for changes to happen, companies should begin the transition as early as possible in order to become part of the evolution. Change management is the process of understanding why changes have to be made, and how, and has impact on individual, organisational as well as cultural level [24]. Focus must be set on understanding the benefits in digitalization and approaching fear with pointing out the positive effects for the organization as well as for the individual worker. IT governance strategies [7] and digitalization strategies are means to reach such a change. The cultural aspect also describes the general culture within the branch, especially as the study participants represents suppliers that meet large amount of companies. It is hard to be the first out testing new technological solutions. However, it is also recognized that the ones that dares to move fast in a business transformation also can gain competitive advantages. Therefore, developing a clear business case and having the financial possibility to move towards Industry 4.0 could definitely pay off. In order to do so, the view of maintenance has to change – from a necessary cost to business opportunity [18]. A roadmap for the transformation is also required for facilitating the digital development in maintenance, including a structured approach, methods and tools for the digital transformation. Such support could be found for instance in [5] and [18], but these are mainly conceptual, and more research is needed within the area, especially in form of case studies.
Digital solutions are seen by many as hard to learn and manage, which adds on to the problem with low level of competence and aging personnel. This was recognized already 2011 [25], and still we are waiting for a major global breakthrough, maybe in the form of intuitive and user friendly mobile applications. User friendly systems might overcome some of the competence related challenges, but not all. Education and training will be an important area of development also in the future, with own challenges such as low interest to study maintenance related 72
courses and programs, and lack of competent teachers within the area [26].
In conclusion, the study shows the necessity to involve all actors in the maintenance ecosystem for reaching Industry 4.0. There is no single responsible driving the digital development within maintenance. Instead, it is everyone’s responsibility, from researchers and regulators to the individual companies and their suppliers. Cooperation and collaboration will most likely become increasingly important, for instance in the form of joint innovation projects. This study is of preliminary, inductive nature, with limited possibilities to draw general conclusions – the results have to be understood, and are valid, within the context. Although, the results could be used as basis when designing a larger questionnaire survey regarding digitalisation in maintenance, which could lead to deepened understanding of the current situation as well as future developments of maintenance in the digital era.
6. REFERENCES [1] Weyer S., Schmitt M., Ohmer M. and Gorecky D. (2015).
“Towards Industry 4.0 - Standardization as the crucial challenge for highly modular, multi-vendor production systems”, IFAC PapersOnLine, 48, pp. 579-84.
[2] Sanders, A., Elangeswaran, C. and Wulfsberg, J. (2016). “Industry 4.0 Functions as Enablers for Lean Manufacturing”, Journal of Industrial Engineering and Management, 9(3), pp. 811-833.
[3] Lasi, H., Fettke, P., Kemper, H-G., Feld T., and Hoffmann, M. (2014). “Industry 4.0”, Business & Information Systems Engineering, 6, pp. 239-242.
[4] Kans, M., Galar, D., Thaduri, A. (2016). “Maintenance 4.0 in Railway Transportation Industry”, Proceedings of the 10th World Congress on Engineering Asset Management, pp. 317-331.
[5] Kans, M., Campos, J., Salonen, A. and Bengtsson, M. (2017). “The Thinking Industry: An approach for Gaining Highest Advantage of Digitalisation within Maintenance”, Journal of Maintenance Engineering, 2, pp. 147-158.
[6] Bengtsson, M. (2008). “Supporting Implementation of Condition Based Maintenance: Highlighting the Interplay between Technical Constituents and Human and Organizational Factors”, International Journal of Technology and Human Interaction, 4(1), pp.49-75.
[7] Kans, M. (2018). “IT governance from the operational perspective: a study of IT governance strategies applied within maintenance management”, International Journal of Services Technology and Management, 24, pp. 263-288.
[8] Posada, J, Toro, C, Barandiaran, I, Oyarzun, D, Stricker, D, de Amicis, R, Pinto, E, Eisert, P, Dollner, J, and Vallarino, I (2015). “Visual Computing as a Key Enabling Technology for Industrie 4.0 and Industrial Internet”, IEEE Computer Graphics And Applications, 35(2), pp. 26-40.
[9] Pye, A. (2014), “THE INTERNET OF THINGS connecting the unconnected”, Engineering & Technology, 9(11), pp. 64-70.
[10] IoT Sweden, (2016). Om IoT, http://iotsverige.se/internet-things-2/.
[11] Tecuci, G. (2012). “Artificial intelligence”, WIREs Compute Statistical, 4, pp. 168–180.
[12] Moret-Bonillo, V. (2018). “Emerging technologies in artificial intelligence: quantum rule-based systems”, Progress in Artificial Intelligence, 7(2), pp.155–166.
[13] O'Leary, D.E. (2013). “Artificial Intelligence and Big Data”, IEEE Intelligent Systems, 28(2), pp.96–99.
[14] Juuso E.K. (2018). “Smart Adaptive Big Data Analysis with Advanced Deep Learning”, Open Engineering, 8(1), pp.403–416.
[15] Mosterman, P, and Zander, J. (2016). “Industry 4.0 as a Cyber-Physical System study”, Software & Systems Modeling, 15(1), pp. 17-29.
[16] Platform Industrie 4.0 (2016), What is Industrie 4.0?, https://www.plattformi40.de/PI40/Navigation/EN/Industrie40/WhatIsIndustrie40/what-is-industrie40.html.
[17] Bharath, A.A. and Petrou, M. (2008). Next generation artificial vision systems reverse engineering the human visual system, Norwood, MA, London, Artech House.
[18] Kans, M. and Ingwald, A. (2016). “A framework for business model development for reaching service management 4.0”, Journal of Maintenance Engineering, 1, pp. 398-407.
[19] Hausman, K.K. and Horne, R. (2014). 3d printing for dummies, John Wiley & Sons, Incorporation.
[20] Schumacher, A., Erol, S. and Sihn, W. (2016). “A Maturity Model for Assessing Industry 4.0 Readiness and Maturity of Manufacturing Enterprises”, Procedia CIRP, 52, 161-166.
[21] Kans, M., and Ingwald, A. (2012). “Functionality Gaps in IT Systems for Maintenance Management”, International Journal of COMADEM, 15, pp. 38-50.
[22] VDMA (2016), Guideline Industrie 4.0 Guiding principles for the implementation of Industrie 4.0 in small and medium sized businesses, https://www.plattform-i40.de/PI40/Navigation/EN/Home/home.html.
[23] Jacobsen, D, I, and Thorsvik, J, (2008). Hur moderna organisationer fungerar, Lund, Studentlitteratur AB.
[24] May G. and Stahl B. (2017). “The significance of organizational change management for sustainable competitiveness in manufacturing: exploring the firm archetypes”, International Journal of Production Research, 55(15), pp. 4450-4465.
[25] Ingwald, A. and Kans, M. (2011). “Managers’ Attitudes towards IT Support: a Study on How Maintenance Management IT Support is Apprehended in Swedish Industry”, 24th international congress on Condition Monitoring and Diagnostics Engineering Management, pp. 1597-1607.
[26] Kans, M. and Metso, L. (2018). “Maintenance education in engineering programs on bachelor and master level: evidence from Finland and Sweden”, The 13th World Congress On Engineering Asset Management, Stavanger, Norway September 24-26, 2018.
73
Remote asset management for reducing life cycle costs (LCC), risks and enhancing asset performance
G. Chattopadhyay School of Science, Engineering and Information Technology, Federation University, Churchill, VIC, Australia
3842. +61402467737
A. Parida Division of Operation and Maintenance Engineering
Luleå University of Technology, Sweden
U Kumar Division of Operation and Maintenance Engineering
Luleå University of Technology, Sweden
ABSTRACT Remote asset management are faced with additional challenges in
monitoring conditions, coordinating logistics for maintenance
crew, transport and spare parts for maintenance delivery and asset
replacements. Recent trends in technologies, remote performance
monitoring and risk-based decision making in Capital
Expenditure (CAPEX) and Operations and Maintenance
Expenditure (OPEX) decisions for asset management are being
embraced by asset intensive industries around the world, where
critical assets are located in geographically distributed remote
areas or difficult to inspect and maintain locations. Industries are
also pushing boundaries by reducing crew size, deferring capital
expenditure and overhauling and decision making in inspection
and in some cases relaxing Original Equipment Manufacturers
(OEM) recommended maintenance schedules. This paper
discusses some of the issues and challenges with remote asset
management. Illustrative example from heavy haul rail is used to
explain reduction in Life Cycle Costs (LCC) and further
enhancing operational performance.
Keywords Asset Management (AM), Remote Performance Monitoring
(RPM), Risk Based Inspections (RBI), Capital Investments (CI).
1. INTRODUCTION Risk management of assets in remote locations under the
competitive global business scenario, looks into issues like;
reducing costs, increasing realisation of value from assets and
enhancing performance by failure free operating environment.
Operation and maintenance cost can be up to 60 – 80 % of asset’s
life-cycle cost [1]. Stakeholders have been demanding more value
from assets while regulatory requirements are putting greater
emphasis on asset performance and safety.
Requirements of ISO 55001 is emerging as a central point for
balancing costs, risk and desired performance for all major asset
intensive industries [2]. Assets in 2008-09 were worth $63.9
trillion for the 500 top companies in the world and an estimated
investment rate is $13 trillion per year. The total asset investment
is expected to reach $101.7 trillion by 2020 and $145.4 trillion by
2025 [3].
Tighter capital and harsher penalties for catastrophic
consequences of failures are becoming predominate at an ever-
increasing rate. Failure in Esso Longford Gas plant in Australia in
1998 caused two deaths and injured eight people. It led the state
of Victoria without gas for 20 days. Main reason was the failure
of a pressure vessel after a heat exchanger in the gas refining
process broke down. Esso was fined $2 million (AUD) and forced
to pay $32.5 million (AUD) in damages to affected parties. This
incident caused an estimated loss of $1.3 billion (AUD) to the
economy [4, 5]. A boiler explosion in 2017 at a coal-fired power
plant in Uttar Pradesh, India killed at least 16 people and injured
80 [6]. The derailment of a fully-laden iron ore train has inflicted
a heavy financial blow on BHP, with the incident contributing to
a $US600 million hit to the miner's productivity [7]. There are
thousands of similar cases around the world which emphasizes a
need for risk-based approach to asset management decisions in
general and continual monitoring using remote monitoring
technologies for distributed assets and infrastructure located in
remote places in particular. Failure to do so can lead to:
downtime and disruption of services
injury or death of personnel, users and wider
communities
production and service loss (revenue lost and
compensation)
equipment damage (not only the failed component, but
other components in the systems which may be affected
due to interrelated failures)
damage to the environment (penalties, clean-ups and
compensations)
brand damage or loss of reputation (market share loss or
class action); and
cost of lost/ damaged or leaked material and
contaminations (reduced yield and product recalls) and
many others.
Railways, water, energy and mining sector have been addressing
these issues in recent times for tackling the access problems and
challenges of distance for inspection and maintenance, assuring
reliability, availability, maintainability and safety of and services
out of assets located and/ or operated in remote locations.
74
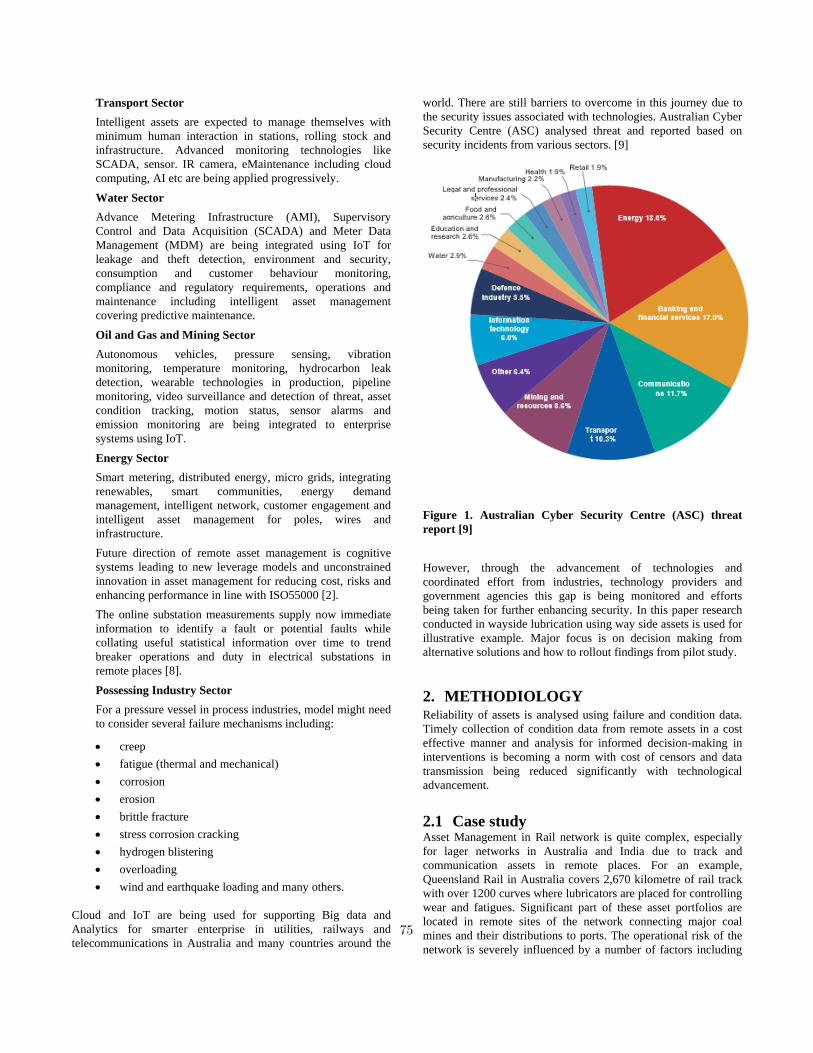
Transport Sector
Intelligent assets are expected to manage themselves with
minimum human interaction in stations, rolling stock and
infrastructure. Advanced monitoring technologies like
SCADA, sensor. IR camera, eMaintenance including cloud
computing, AI etc are being applied progressively.
Water Sector
Advance Metering Infrastructure (AMI), Supervisory
Control and Data Acquisition (SCADA) and Meter Data
Management (MDM) are being integrated using IoT for
leakage and theft detection, environment and security,
consumption and customer behaviour monitoring,
compliance and regulatory requirements, operations and
maintenance including intelligent asset management
covering predictive maintenance.
Oil and Gas and Mining Sector
Autonomous vehicles, pressure sensing, vibration
monitoring, temperature monitoring, hydrocarbon leak
detection, wearable technologies in production, pipeline
monitoring, video surveillance and detection of threat, asset
condition tracking, motion status, sensor alarms and
emission monitoring are being integrated to enterprise
systems using IoT.
Energy Sector
Smart metering, distributed energy, micro grids, integrating
renewables, smart communities, energy demand
management, intelligent network, customer engagement and
intelligent asset management for poles, wires and
infrastructure.
Future direction of remote asset management is cognitive
systems leading to new leverage models and unconstrained
innovation in asset management for reducing cost, risks and
enhancing performance in line with ISO55000 [2].
The online substation measurements supply now immediate
information to identify a fault or potential faults while
collating useful statistical information over time to trend
breaker operations and duty in electrical substations in
remote places [8].
Possessing Industry Sector
For a pressure vessel in process industries, model might need
to consider several failure mechanisms including:
creep
fatigue (thermal and mechanical)
corrosion
erosion
brittle fracture
stress corrosion cracking
hydrogen blistering
overloading
wind and earthquake loading and many others.
Cloud and IoT are being used for supporting Big data and
Analytics for smarter enterprise in utilities, railways and
telecommunications in Australia and many countries around the
world. There are still barriers to overcome in this journey due to
the security issues associated with technologies. Australian Cyber
Security Centre (ASC) analysed threat and reported based on
security incidents from various sectors. [9]
Figure 1. Australian Cyber Security Centre (ASC) threat
report [9]
However, through the advancement of technologies and
coordinated effort from industries, technology providers and
government agencies this gap is being monitored and efforts
being taken for further enhancing security. In this paper research
conducted in wayside lubrication using way side assets is used for
illustrative example. Major focus is on decision making from
alternative solutions and how to rollout findings from pilot study.
2. METHODIOLOGY Reliability of assets is analysed using failure and condition data.
Timely collection of condition data from remote assets in a cost
effective manner and analysis for informed decision-making in
interventions is becoming a norm with cost of censors and data
transmission being reduced significantly with technological
advancement.
2.1 Case study Asset Management in Rail network is quite complex, especially
for lager networks in Australia and India due to track and
communication assets in remote places. For an example,
Queensland Rail in Australia covers 2,670 kilometre of rail track
with over 1200 curves where lubricators are placed for controlling
wear and fatigues. Significant part of these asset portfolios are
located in remote sites of the network connecting major coal
mines and their distributions to ports. The operational risk of the
network is severely influenced by a number of factors including
75
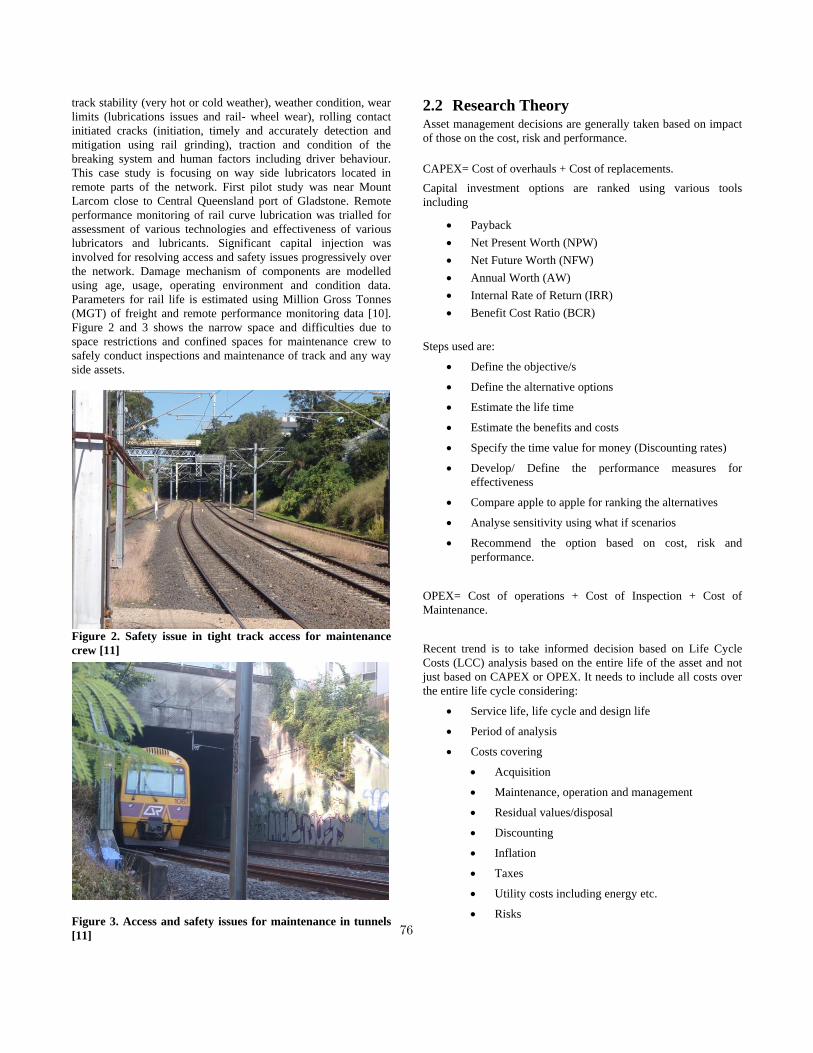
track stability (very hot or cold weather), weather condition, wear
limits (lubrications issues and rail- wheel wear), rolling contact
initiated cracks (initiation, timely and accurately detection and
mitigation using rail grinding), traction and condition of the
breaking system and human factors including driver behaviour.
This case study is focusing on way side lubricators located in
remote parts of the network. First pilot study was near Mount
Larcom close to Central Queensland port of Gladstone. Remote
performance monitoring of rail curve lubrication was trialled for
assessment of various technologies and effectiveness of various
lubricators and lubricants. Significant capital injection was
involved for resolving access and safety issues progressively over
the network. Damage mechanism of components are modelled
using age, usage, operating environment and condition data.
Parameters for rail life is estimated using Million Gross Tonnes
(MGT) of freight and remote performance monitoring data [10].
Figure 2 and 3 shows the narrow space and difficulties due to
space restrictions and confined spaces for maintenance crew to
safely conduct inspections and maintenance of track and any way
side assets.
Figure 2. Safety issue in tight track access for maintenance
crew [11]
Figure 3. Access and safety issues for maintenance in tunnels
[11]
2.2 Research Theory Asset management decisions are generally taken based on impact
of those on the cost, risk and performance.
CAPEX= Cost of overhauls + Cost of replacements.
Capital investment options are ranked using various tools
including
Payback
Net Present Worth (NPW)
Net Future Worth (NFW)
Annual Worth (AW)
Internal Rate of Return (IRR)
Benefit Cost Ratio (BCR)
Steps used are:
Define the objective/s
Define the alternative options
Estimate the life time
Estimate the benefits and costs
Specify the time value for money (Discounting rates)
Develop/ Define the performance measures for
effectiveness
Compare apple to apple for ranking the alternatives
Analyse sensitivity using what if scenarios
Recommend the option based on cost, risk and
performance.
OPEX= Cost of operations + Cost of Inspection + Cost of
Maintenance.
Recent trend is to take informed decision based on Life Cycle
Costs (LCC) analysis based on the entire life of the asset and not
just based on CAPEX or OPEX. It needs to include all costs over
the entire life cycle considering:
Service life, life cycle and design life
Period of analysis
Costs covering
Acquisition
Maintenance, operation and management
Residual values/disposal
Discounting
Inflation
Taxes
Utility costs including energy etc.
Risks
76
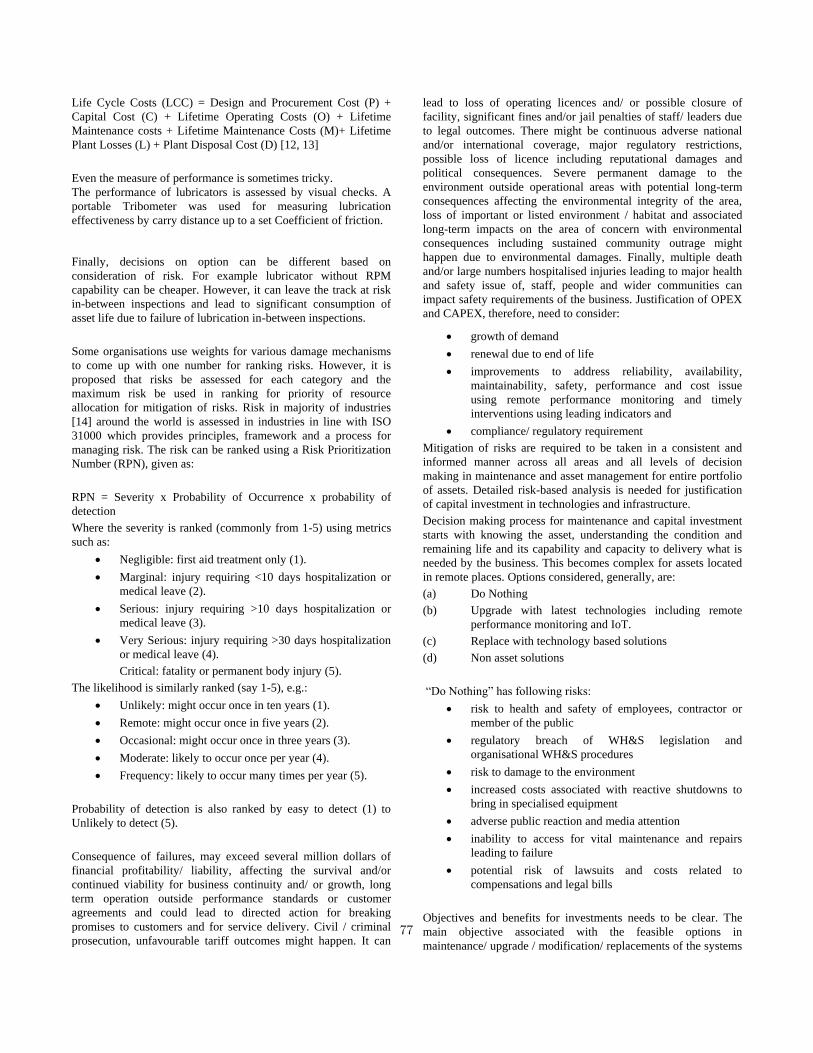
Life Cycle Costs (LCC) = Design and Procurement Cost (P) +
Capital Cost (C) + Lifetime Operating Costs (O) + Lifetime
Maintenance costs + Lifetime Maintenance Costs (M)+ Lifetime
Plant Losses (L) + Plant Disposal Cost (D) [12, 13]
Even the measure of performance is sometimes tricky.
The performance of lubricators is assessed by visual checks. A
portable Tribometer was used for measuring lubrication
effectiveness by carry distance up to a set Coefficient of friction.
Finally, decisions on option can be different based on
consideration of risk. For example lubricator without RPM
capability can be cheaper. However, it can leave the track at risk
in-between inspections and lead to significant consumption of
asset life due to failure of lubrication in-between inspections.
Some organisations use weights for various damage mechanisms
to come up with one number for ranking risks. However, it is
proposed that risks be assessed for each category and the
maximum risk be used in ranking for priority of resource
allocation for mitigation of risks. Risk in majority of industries
[14] around the world is assessed in industries in line with ISO
31000 which provides principles, framework and a process for
managing risk. The risk can be ranked using a Risk Prioritization
Number (RPN), given as:
RPN = Severity x Probability of Occurrence x probability of
detection
Where the severity is ranked (commonly from 1-5) using metrics
such as:
Negligible: first aid treatment only (1).
Marginal: injury requiring <10 days hospitalization or
medical leave (2).
Serious: injury requiring >10 days hospitalization or
medical leave (3).
Very Serious: injury requiring >30 days hospitalization
or medical leave (4).
Critical: fatality or permanent body injury (5).
The likelihood is similarly ranked (say 1-5), e.g.:
Unlikely: might occur once in ten years (1).
Remote: might occur once in five years (2).
Occasional: might occur once in three years (3).
Moderate: likely to occur once per year (4).
Frequency: likely to occur many times per year (5).
Probability of detection is also ranked by easy to detect (1) to
Unlikely to detect (5).
Consequence of failures, may exceed several million dollars of
financial profitability/ liability, affecting the survival and/or
continued viability for business continuity and/ or growth, long
term operation outside performance standards or customer
agreements and could lead to directed action for breaking
promises to customers and for service delivery. Civil / criminal
prosecution, unfavourable tariff outcomes might happen. It can
lead to loss of operating licences and/ or possible closure of
facility, significant fines and/or jail penalties of staff/ leaders due
to legal outcomes. There might be continuous adverse national
and/or international coverage, major regulatory restrictions,
possible loss of licence including reputational damages and
political consequences. Severe permanent damage to the
environment outside operational areas with potential long-term
consequences affecting the environmental integrity of the area,
loss of important or listed environment / habitat and associated
long-term impacts on the area of concern with environmental
consequences including sustained community outrage might
happen due to environmental damages. Finally, multiple death
and/or large numbers hospitalised injuries leading to major health
and safety issue of, staff, people and wider communities can
impact safety requirements of the business. Justification of OPEX
and CAPEX, therefore, need to consider:
growth of demand
renewal due to end of life
improvements to address reliability, availability,
maintainability, safety, performance and cost issue
using remote performance monitoring and timely
interventions using leading indicators and
compliance/ regulatory requirement
Mitigation of risks are required to be taken in a consistent and
informed manner across all areas and all levels of decision
making in maintenance and asset management for entire portfolio
of assets. Detailed risk-based analysis is needed for justification
of capital investment in technologies and infrastructure.
Decision making process for maintenance and capital investment
starts with knowing the asset, understanding the condition and
remaining life and its capability and capacity to delivery what is
needed by the business. This becomes complex for assets located
in remote places. Options considered, generally, are:
(a) Do Nothing
(b) Upgrade with latest technologies including remote
performance monitoring and IoT.
(c) Replace with technology based solutions
(d) Non asset solutions
“Do Nothing” has following risks:
risk to health and safety of employees, contractor or
member of the public
regulatory breach of WH&S legislation and
organisational WH&S procedures
risk to damage to the environment
increased costs associated with reactive shutdowns to
bring in specialised equipment
adverse public reaction and media attention
inability to access for vital maintenance and repairs
leading to failure
potential risk of lawsuits and costs related to
compensations and legal bills
Objectives and benefits for investments needs to be clear. The
main objective associated with the feasible options in
maintenance/ upgrade / modification/ replacements of the systems
77
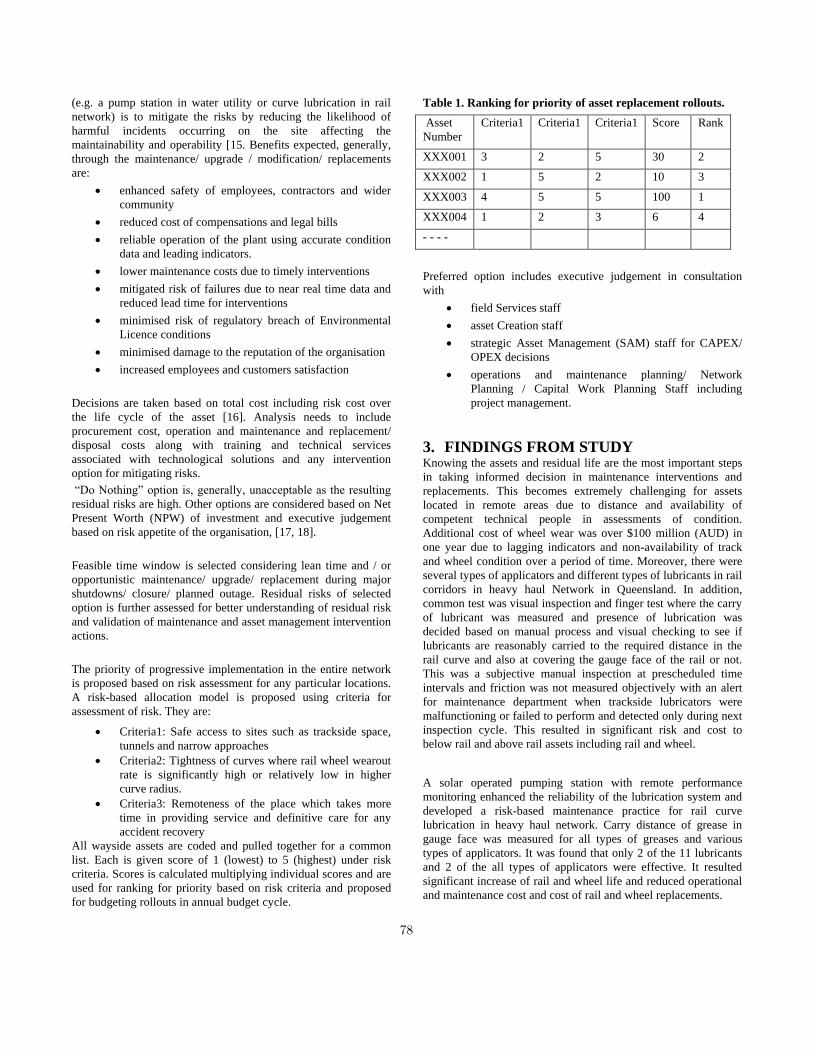
(e.g. a pump station in water utility or curve lubrication in rail
network) is to mitigate the risks by reducing the likelihood of
harmful incidents occurring on the site affecting the
maintainability and operability [15. Benefits expected, generally,
through the maintenance/ upgrade / modification/ replacements
are:
enhanced safety of employees, contractors and wider
community
reduced cost of compensations and legal bills
reliable operation of the plant using accurate condition
data and leading indicators.
lower maintenance costs due to timely interventions
mitigated risk of failures due to near real time data and
reduced lead time for interventions
minimised risk of regulatory breach of Environmental
Licence conditions
minimised damage to the reputation of the organisation
increased employees and customers satisfaction
Decisions are taken based on total cost including risk cost over
the life cycle of the asset [16]. Analysis needs to include
procurement cost, operation and maintenance and replacement/
disposal costs along with training and technical services
associated with technological solutions and any intervention
option for mitigating risks.
“Do Nothing” option is, generally, unacceptable as the resulting
residual risks are high. Other options are considered based on Net
Present Worth (NPW) of investment and executive judgement
based on risk appetite of the organisation, [17, 18].
Feasible time window is selected considering lean time and / or
opportunistic maintenance/ upgrade/ replacement during major
shutdowns/ closure/ planned outage. Residual risks of selected
option is further assessed for better understanding of residual risk
and validation of maintenance and asset management intervention
actions.
The priority of progressive implementation in the entire network
is proposed based on risk assessment for any particular locations.
A risk-based allocation model is proposed using criteria for
assessment of risk. They are:
Criteria1: Safe access to sites such as trackside space,
tunnels and narrow approaches
Criteria2: Tightness of curves where rail wheel wearout
rate is significantly high or relatively low in higher
curve radius.
Criteria3: Remoteness of the place which takes more
time in providing service and definitive care for any
accident recovery
All wayside assets are coded and pulled together for a common
list. Each is given score of 1 (lowest) to 5 (highest) under risk
criteria. Scores is calculated multiplying individual scores and are
used for ranking for priority based on risk criteria and proposed
for budgeting rollouts in annual budget cycle.
Table 1. Ranking for priority of asset replacement rollouts.
Asset
Number
Criteria1 Criteria1 Criteria1 Score Rank
XXX001 3 2 5 30 2
XXX002 1 5 2 10 3
XXX003 4 5 5 100 1
XXX004 1 2 3 6 4
- - - -
Preferred option includes executive judgement in consultation
with
field Services staff
asset Creation staff
strategic Asset Management (SAM) staff for CAPEX/
OPEX decisions
operations and maintenance planning/ Network
Planning / Capital Work Planning Staff including
project management.
3. FINDINGS FROM STUDY Knowing the assets and residual life are the most important steps
in taking informed decision in maintenance interventions and
replacements. This becomes extremely challenging for assets
located in remote areas due to distance and availability of
competent technical people in assessments of condition.
Additional cost of wheel wear was over $100 million (AUD) in
one year due to lagging indicators and non-availability of track
and wheel condition over a period of time. Moreover, there were
several types of applicators and different types of lubricants in rail
corridors in heavy haul Network in Queensland. In addition,
common test was visual inspection and finger test where the carry
of lubricant was measured and presence of lubrication was
decided based on manual process and visual checking to see if
lubricants are reasonably carried to the required distance in the
rail curve and also at covering the gauge face of the rail or not.
This was a subjective manual inspection at prescheduled time
intervals and friction was not measured objectively with an alert
for maintenance department when trackside lubricators were
malfunctioning or failed to perform and detected only during next
inspection cycle. This resulted in significant risk and cost to
below rail and above rail assets including rail and wheel.
A solar operated pumping station with remote performance
monitoring enhanced the reliability of the lubrication system and
developed a risk-based maintenance practice for rail curve
lubrication in heavy haul network. Carry distance of grease in
gauge face was measured for all types of greases and various
types of applicators. It was found that only 2 of the 11 lubricants
and 2 of the all types of applicators were effective. It resulted
significant increase of rail and wheel life and reduced operational
and maintenance cost and cost of rail and wheel replacements.
78
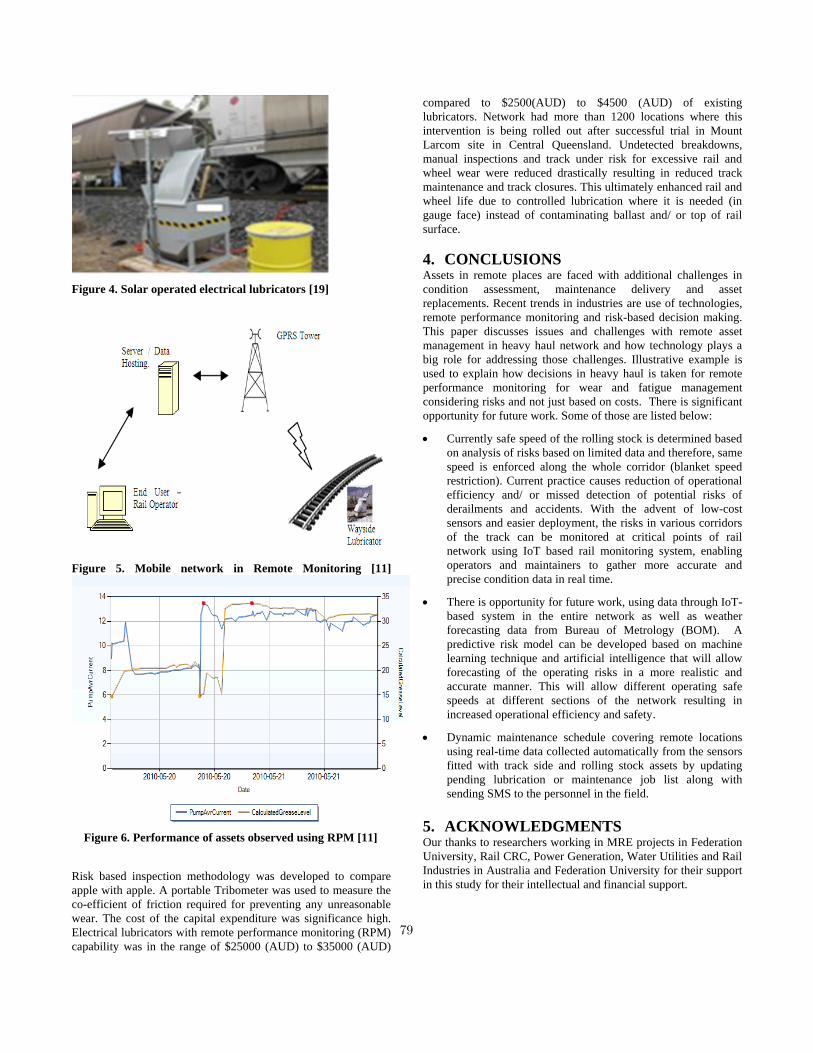
Figure 4. Solar operated electrical lubricators [19]
Figure 5. Mobile network in Remote Monitoring [11]
Figure 6. Performance of assets observed using RPM [11]
Risk based inspection methodology was developed to compare
apple with apple. A portable Tribometer was used to measure the
co-efficient of friction required for preventing any unreasonable
wear. The cost of the capital expenditure was significance high.
Electrical lubricators with remote performance monitoring (RPM)
capability was in the range of $25000 (AUD) to $35000 (AUD)
compared to $2500(AUD) to $4500 (AUD) of existing
lubricators. Network had more than 1200 locations where this
intervention is being rolled out after successful trial in Mount
Larcom site in Central Queensland. Undetected breakdowns,
manual inspections and track under risk for excessive rail and
wheel wear were reduced drastically resulting in reduced track
maintenance and track closures. This ultimately enhanced rail and
wheel life due to controlled lubrication where it is needed (in
gauge face) instead of contaminating ballast and/ or top of rail
surface.
4. CONCLUSIONS Assets in remote places are faced with additional challenges in
condition assessment, maintenance delivery and asset
replacements. Recent trends in industries are use of technologies,
remote performance monitoring and risk-based decision making.
This paper discusses issues and challenges with remote asset
management in heavy haul network and how technology plays a
big role for addressing those challenges. Illustrative example is
used to explain how decisions in heavy haul is taken for remote
performance monitoring for wear and fatigue management
considering risks and not just based on costs. There is significant
opportunity for future work. Some of those are listed below:
Currently safe speed of the rolling stock is determined based
on analysis of risks based on limited data and therefore, same
speed is enforced along the whole corridor (blanket speed
restriction). Current practice causes reduction of operational
efficiency and/ or missed detection of potential risks of
derailments and accidents. With the advent of low-cost
sensors and easier deployment, the risks in various corridors
of the track can be monitored at critical points of rail
network using IoT based rail monitoring system, enabling
operators and maintainers to gather more accurate and
precise condition data in real time.
There is opportunity for future work, using data through IoT-
based system in the entire network as well as weather
forecasting data from Bureau of Metrology (BOM). A
predictive risk model can be developed based on machine
learning technique and artificial intelligence that will allow
forecasting of the operating risks in a more realistic and
accurate manner. This will allow different operating safe
speeds at different sections of the network resulting in
increased operational efficiency and safety.
Dynamic maintenance schedule covering remote locations
using real-time data collected automatically from the sensors
fitted with track side and rolling stock assets by updating
pending lubrication or maintenance job list along with
sending SMS to the personnel in the field.
5. ACKNOWLEDGMENTS Our thanks to researchers working in MRE projects in Federation
University, Rail CRC, Power Generation, Water Utilities and Rail
Industries in Australia and Federation University for their support
in this study for their intellectual and financial support.
79

6. REFERENCES [1] Ellis, Byron. (2007). Life Cycle Cost. The Jethro Project.
[2] International Organisation for Standardisation (2014), ISO
55000:2014 Asset management - Overview, principles and
terminology, Geneva: International Organisation for
Standardisation.
[3] www.pwc.com/assetmanagement, Asset & Wealth
Management Revolution: Embracing Exponential Change
[4] Coroner blames Esso for Longford disaster, L. Gooch, The
Age, (November 15, 2002),
https://www.theage.com.au/articles/2002/11/15/1037080898
920.html.
[5] Dawson, D. M. and Brooks, B. J (1999), The Esso Longford
Gas Plant Accident - Report of the Longford Royal
Commission, Parliament of Victoria.
[6] http://www.dw.com/en/india-boiler-blast-at-power-plant-kills-
several-workers-injures-scores/a-41197829, accessed March
2018.
[7] https://www.abc.net.au/news/2019-01-22/iron-ore-train-
derailment-inflicts-heavy-financial-blow-on-bhp/10737426
[8] Courtney, D., Littler, T., & Livie, J. (2017). Smart Asset
Management using Online Monitoring. Proceedings of Centre
International de Recherche sur l'Environnement et le
Développement (CIRED), 24th International Conference &
Exhibition on Electricity Distribution, 12-15 June 2017,
Glasgow, 436-440.
[9] Australian Cyber Security Centre (ASC)
https://www.cyber.gov.au/publications/acsc-threat-report-
2016.
[10] Chattopadhyay, G., Kumar, S. (2009) ‘Parameter Estimation
for Rail Degradation Model’, International Journal of
Performability Engineering, Vol. 5, No. 2, pp. 119-130
[11] Desai, A, Chattopadhyay, G & Howie, A (2010), ‘Remote
Condition Monitoring and Control of Wayside Rail
Lubricators’, e-Maintenance, Lulea, Sweden, Jun 22-24, 161-
165.
[12] ISO 15686-5:2017: Buildings and constructed assets —
Service life planning — Part 5: Life-cycle costing
[13] Davis Langdon Management Consulting report for European
Commission (2007), Towards a common European
methodology for Life Cycle Costing (LCC) – Literature
Review.
[14] International Organisation for Standardisation (2018), ISO
31000:2018, Risk management, Geneva: International
Organisation for Standardisation.
[15] Parida, A., and Chattopadhyay, G., (2007) “Development of a
multi-criteria hierarchical framework for maintenance
performance measurement (MPM).,” Journal of Quality in
Maintenance Engineering, vol. 13, no. 3, pp. 241-258.
[16] Wang, W. and Zhang, W. (2014), “Cost modelling in
maintenance strategy optimisation for infrastructure assets with
limited data,” Reliability Engineering and System Safety, vol.
130, pp. 33-41
[17] Atrens, A.., Eccleston, J. A. and. Murthy, D. N. P. (2002),
“Strategic maintenance management.,” Journal of Quality in
Maintenance Engineering, vol. 8, no. 4, pp. 287-305.
[18] Kumar, U., Norrbin, P., Parida, A. and Stenstrom, C., (2016),
“Preventative and corrective maintenance - cost comparison
and cost benefit analysis,” Structure and Infrastructure
Engineering, vol. 12, no. 5, pp. 603-617.
[19] Chattopadhyay, G, Gyas Uddin, M, and Howie, A, Title:
Curve Lubrication – Final Report (2014), CRC for Rail
Innovation, Project : Curve Lubrication No.: R3.110,
www.railcrc.net.au/object/PDF/get/.../id/r3110_combined_fina
l_reports_updated
80
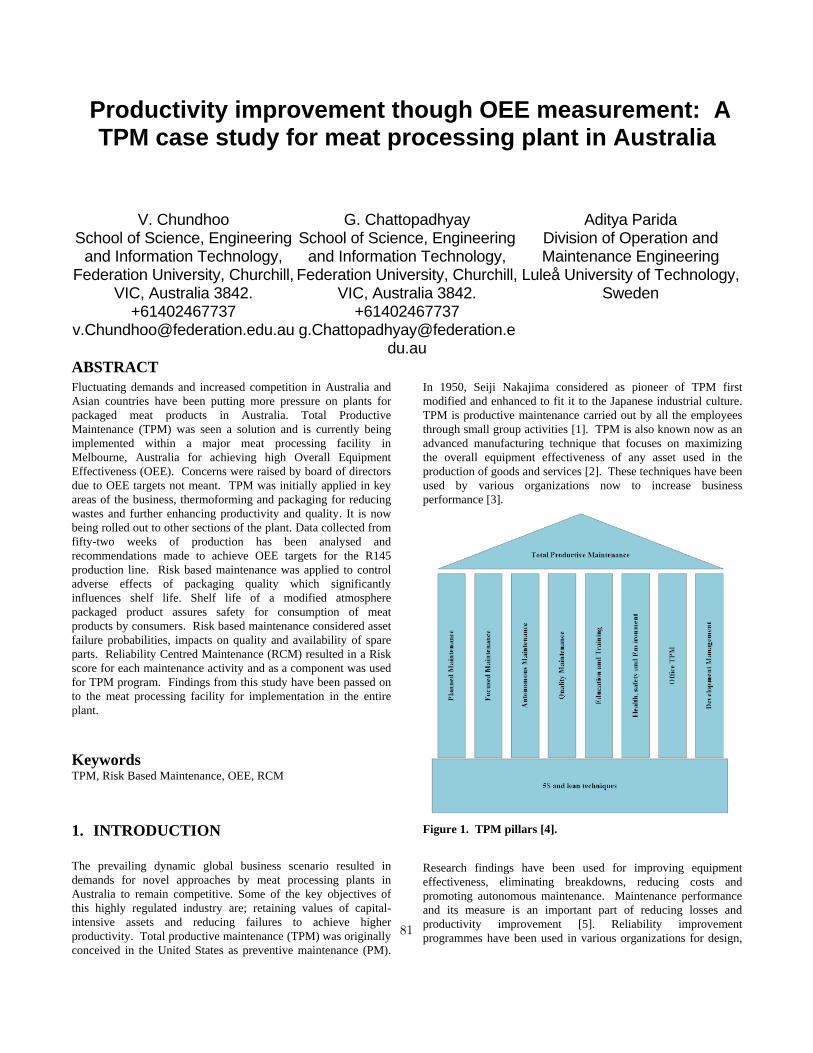
Productivity improvement though OEE measurement: A TPM case study for meat processing plant in Australia
V. Chundhoo School of Science, Engineering
and Information Technology, Federation University, Churchill,
VIC, Australia 3842. +61402467737
G. Chattopadhyay School of Science, Engineering
and Information Technology, Federation University, Churchill,
VIC, Australia 3842. +61402467737
Aditya Parida Division of Operation and Maintenance Engineering
Luleå University of Technology, Sweden
ABSTRACT
Fluctuating demands and increased competition in Australia and
Asian countries have been putting more pressure on plants for
packaged meat products in Australia. Total Productive
Maintenance (TPM) was seen a solution and is currently being
implemented within a major meat processing facility in
Melbourne, Australia for achieving high Overall Equipment
Effectiveness (OEE). Concerns were raised by board of directors
due to OEE targets not meant. TPM was initially applied in key
areas of the business, thermoforming and packaging for reducing
wastes and further enhancing productivity and quality. It is now
being rolled out to other sections of the plant. Data collected from
fifty-two weeks of production has been analysed and
recommendations made to achieve OEE targets for the R145
production line. Risk based maintenance was applied to control
adverse effects of packaging quality which significantly
influences shelf life. Shelf life of a modified atmosphere
packaged product assures safety for consumption of meat
products by consumers. Risk based maintenance considered asset
failure probabilities, impacts on quality and availability of spare
parts. Reliability Centred Maintenance (RCM) resulted in a Risk
score for each maintenance activity and as a component was used
for TPM program. Findings from this study have been passed on
to the meat processing facility for implementation in the entire
plant.
Keywords TPM, Risk Based Maintenance, OEE, RCM
1. INTRODUCTION
The prevailing dynamic global business scenario resulted in
demands for novel approaches by meat processing plants in
Australia to remain competitive. Some of the key objectives of
this highly regulated industry are; retaining values of capital-
intensive assets and reducing failures to achieve higher
productivity. Total productive maintenance (TPM) was originally
conceived in the United States as preventive maintenance (PM).
In 1950, Seiji Nakajima considered as pioneer of TPM first
modified and enhanced to fit it to the Japanese industrial culture.
TPM is productive maintenance carried out by all the employees
through small group activities [1]. TPM is also known now as an
advanced manufacturing technique that focuses on maximizing
the overall equipment effectiveness of any asset used in the
production of goods and services [2]. These techniques have been
used by various organizations now to increase business
performance [3].
Figure 1. TPM pillars [4].
Research findings have been used for improving equipment
effectiveness, eliminating breakdowns, reducing costs and
promoting autonomous maintenance. Maintenance performance
and its measure is an important part of reducing losses and
productivity improvement [5]. Reliability improvement
programmes have been used in various organizations for design, 81
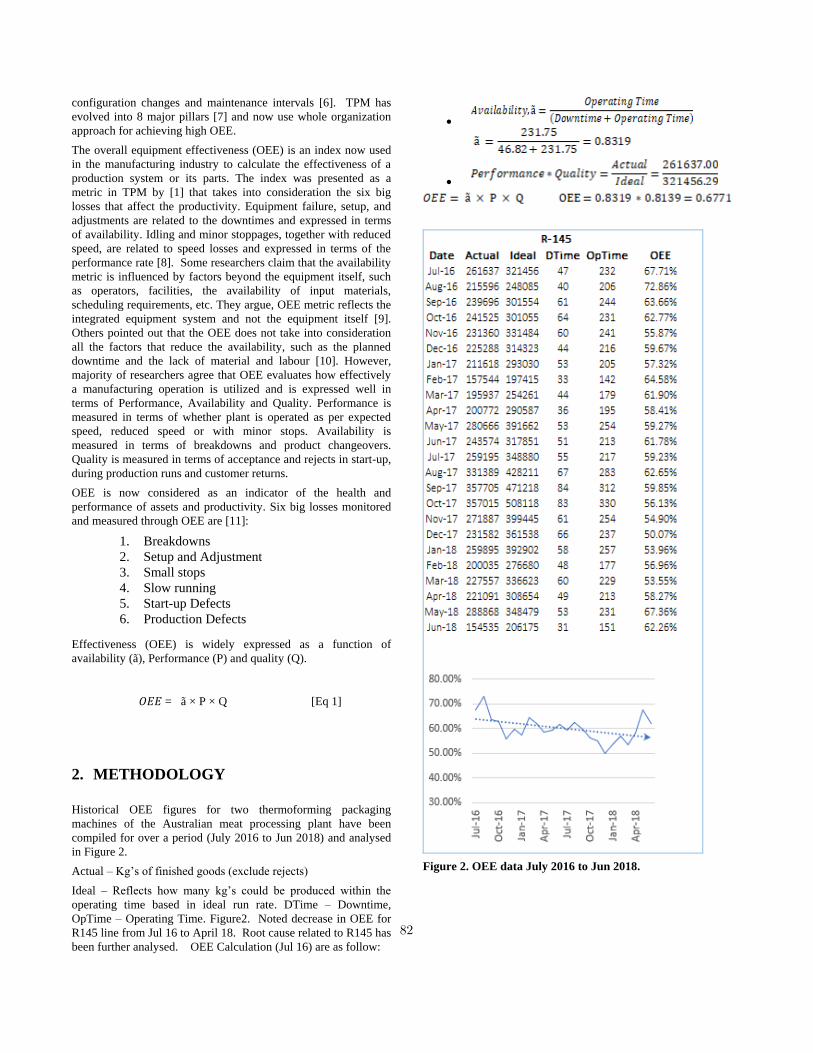
configuration changes and maintenance intervals [6]. TPM has
evolved into 8 major pillars [7] and now use whole organization
approach for achieving high OEE.
The overall equipment effectiveness (OEE) is an index now used
in the manufacturing industry to calculate the effectiveness of a
production system or its parts. The index was presented as a
metric in TPM by [1] that takes into consideration the six big
losses that affect the productivity. Equipment failure, setup, and
adjustments are related to the downtimes and expressed in terms
of availability. Idling and minor stoppages, together with reduced
speed, are related to speed losses and expressed in terms of the
performance rate [8]. Some researchers claim that the availability
metric is influenced by factors beyond the equipment itself, such
as operators, facilities, the availability of input materials,
scheduling requirements, etc. They argue, OEE metric reflects the
integrated equipment system and not the equipment itself [9].
Others pointed out that the OEE does not take into consideration
all the factors that reduce the availability, such as the planned
downtime and the lack of material and labour [10]. However,
majority of researchers agree that OEE evaluates how effectively
a manufacturing operation is utilized and is expressed well in
terms of Performance, Availability and Quality. Performance is
measured in terms of whether plant is operated as per expected
speed, reduced speed or with minor stops. Availability is
measured in terms of breakdowns and product changeovers.
Quality is measured in terms of acceptance and rejects in start-up,
during production runs and customer returns.
OEE is now considered as an indicator of the health and
performance of assets and productivity. Six big losses monitored
and measured through OEE are [11]:
1. Breakdowns
2. Setup and Adjustment
3. Small stops
4. Slow running
5. Start-up Defects
6. Production Defects
Effectiveness (OEE) is widely expressed as a function of
availability (ã), Performance (P) and quality (Q).
𝑂𝐸𝐸 = ã × P × Q [Eq 1]
2. METHODOLOGY
Historical OEE figures for two thermoforming packaging
machines of the Australian meat processing plant have been
compiled for over a period (July 2016 to Jun 2018) and analysed
in Figure 2.
Actual – Kg’s of finished goods (exclude rejects)
Ideal – Reflects how many kg’s could be produced within the
operating time based in ideal run rate. DTime – Downtime,
OpTime – Operating Time. Figure2. Noted decrease in OEE for
R145 line from Jul 16 to April 18. Root cause related to R145 has
been further analysed. OEE Calculation (Jul 16) are as follow:
Figure 2. OEE data July 2016 to Jun 2018.
82
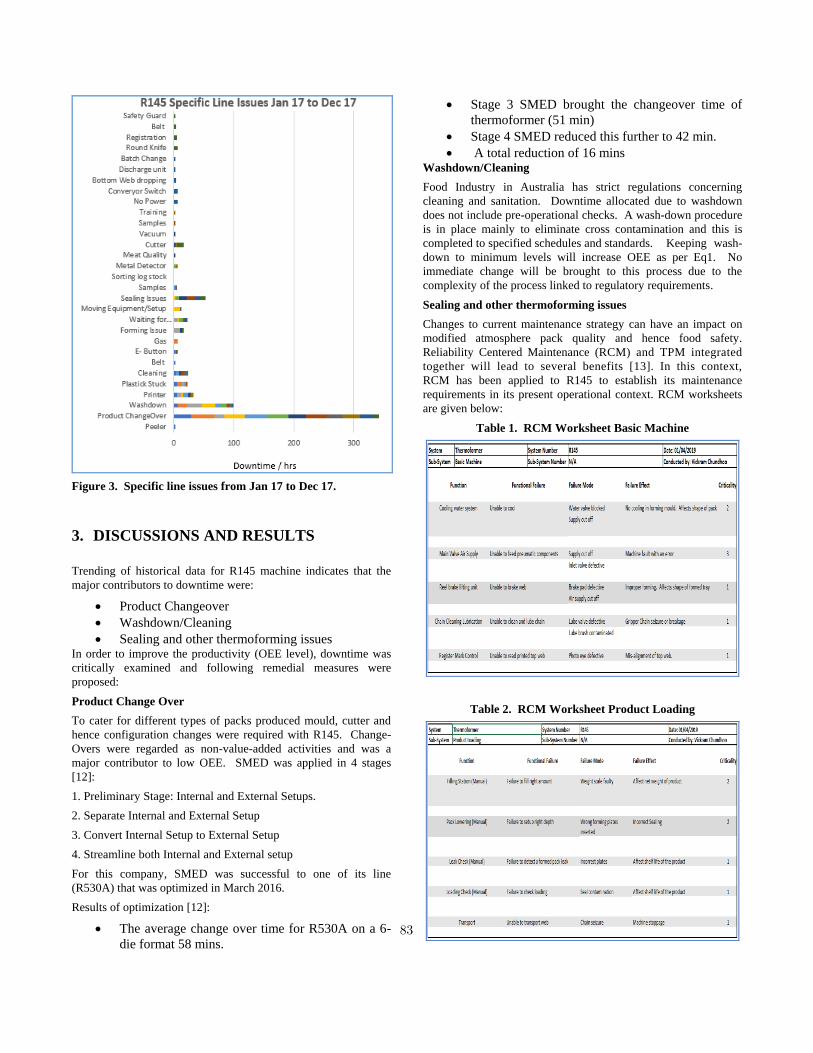
Figure 3. Specific line issues from Jan 17 to Dec 17.
3. DISCUSSIONS AND RESULTS
Trending of historical data for R145 machine indicates that the
major contributors to downtime were:
Product Changeover
Washdown/Cleaning
Sealing and other thermoforming issues In order to improve the productivity (OEE level), downtime was
critically examined and following remedial measures were
proposed:
Product Change Over
To cater for different types of packs produced mould, cutter and
hence configuration changes were required with R145. Change-
Overs were regarded as non-value-added activities and was a
major contributor to low OEE. SMED was applied in 4 stages
[12]:
1. Preliminary Stage: Internal and External Setups.
2. Separate Internal and External Setup
3. Convert Internal Setup to External Setup
4. Streamline both Internal and External setup
For this company, SMED was successful to one of its line
(R530A) that was optimized in March 2016.
Results of optimization [12]:
The average change over time for R530A on a 6-
die format 58 mins.
Stage 3 SMED brought the changeover time of
thermoformer (51 min)
Stage 4 SMED reduced this further to 42 min.
A total reduction of 16 mins Washdown/Cleaning
Food Industry in Australia has strict regulations concerning
cleaning and sanitation. Downtime allocated due to washdown
does not include pre-operational checks. A wash-down procedure
is in place mainly to eliminate cross contamination and this is
completed to specified schedules and standards. Keeping wash-
down to minimum levels will increase OEE as per Eq1. No
immediate change will be brought to this process due to the
complexity of the process linked to regulatory requirements.
Sealing and other thermoforming issues
Changes to current maintenance strategy can have an impact on
modified atmosphere pack quality and hence food safety.
Reliability Centered Maintenance (RCM) and TPM integrated
together will lead to several benefits [13]. In this context,
RCM has been applied to R145 to establish its maintenance
requirements in its present operational context. RCM worksheets
are given below:
Table 1. RCM Worksheet Basic Machine
Table 2. RCM Worksheet Product Loading
83

Table 3. RCM Worksheet Forming Station
Table 4. RCM Worksheet Sealing Station
Table 5. RCM Worksheet Sealing/Printing
Table 6. RCM worksheet cutting station
Criticality matrix is referenced from [14]. A qualitative approach
has been adopted as per criticality matrix and failure which fall in
criticality value 3 and beyond was not subjected to the RCM
decision. The RCM logic is developed based on task allocation
and a flowchart is created [14]. The maintenance options from the
RCM logic was broken down into two sections namely; proactive
task and default actions.
Table 7. Result of RCM logic decision
Before a specific task is selected, it was checked that it should
reduce the consequences of the associated failure mode to an
extent which is approved by the business. Two issues which were
considered are: Age of asset against probability of failure and
what happens once a failure occurs? As per the RCM worksheets,
failed items such as sealing gaskets, valve seats and O-ring which
are subjected to direct contact with the product, environment, gas
and cooling water were recommended for replacements on a 6
monthly basis as specified by OEM. Other items such as sealing
dies, forming plates were monitored for deterioration. The aim
was to generate the best return by implementation of a total
productive maintenance and condition monitoring program as per
Table 8.
84
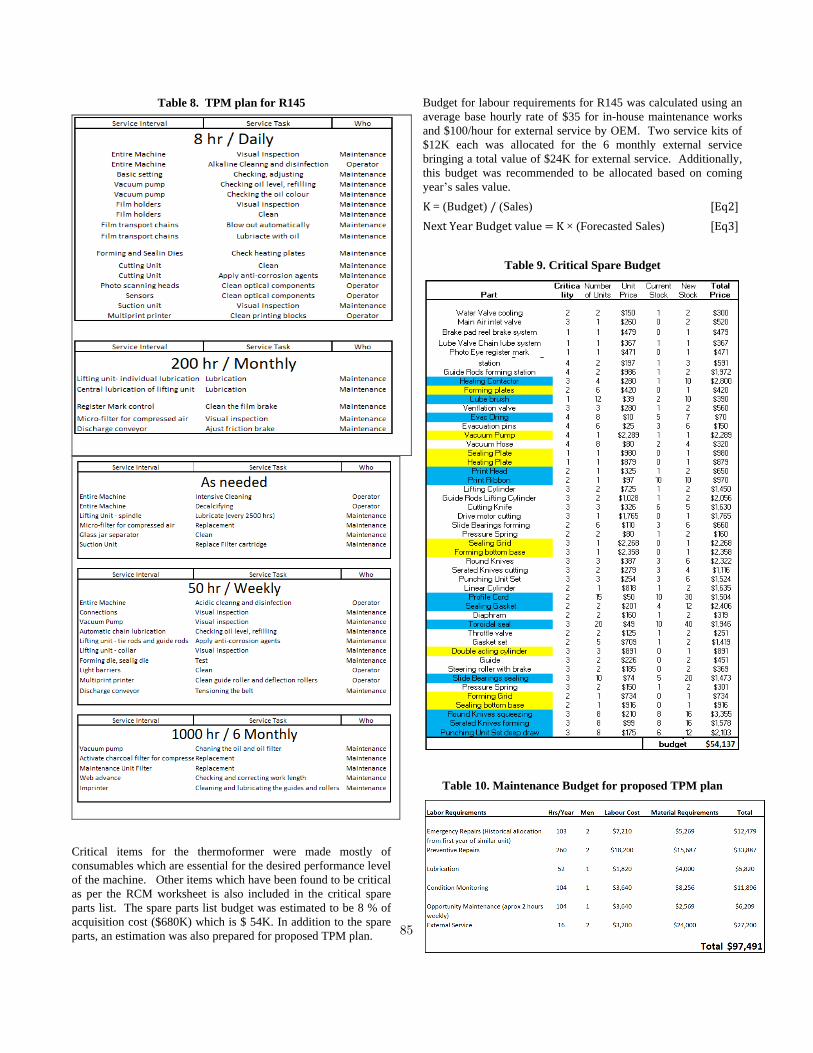
Table 8. TPM plan for R145
Critical items for the thermoformer were made mostly of
consumables which are essential for the desired performance level
of the machine. Other items which have been found to be critical
as per the RCM worksheet is also included in the critical spare
parts list. The spare parts list budget was estimated to be 8 % of
acquisition cost ($680K) which is $ 54K. In addition to the spare
parts, an estimation was also prepared for proposed TPM plan.
Budget for labour requirements for R145 was calculated using an
average base hourly rate of $35 for in-house maintenance works
and $100/hour for external service by OEM. Two service kits of
$12K each was allocated for the 6 monthly external service
bringing a total value of $24K for external service. Additionally,
this budget was recommended to be allocated based on coming
year’s sales value.
K = (Budget) / (Sales) [Eq2]
Next Year Budget value = K × (Forecasted Sales) [Eq3]
Table 9. Critical Spare Budget
Table 10. Maintenance Budget for proposed TPM plan
85
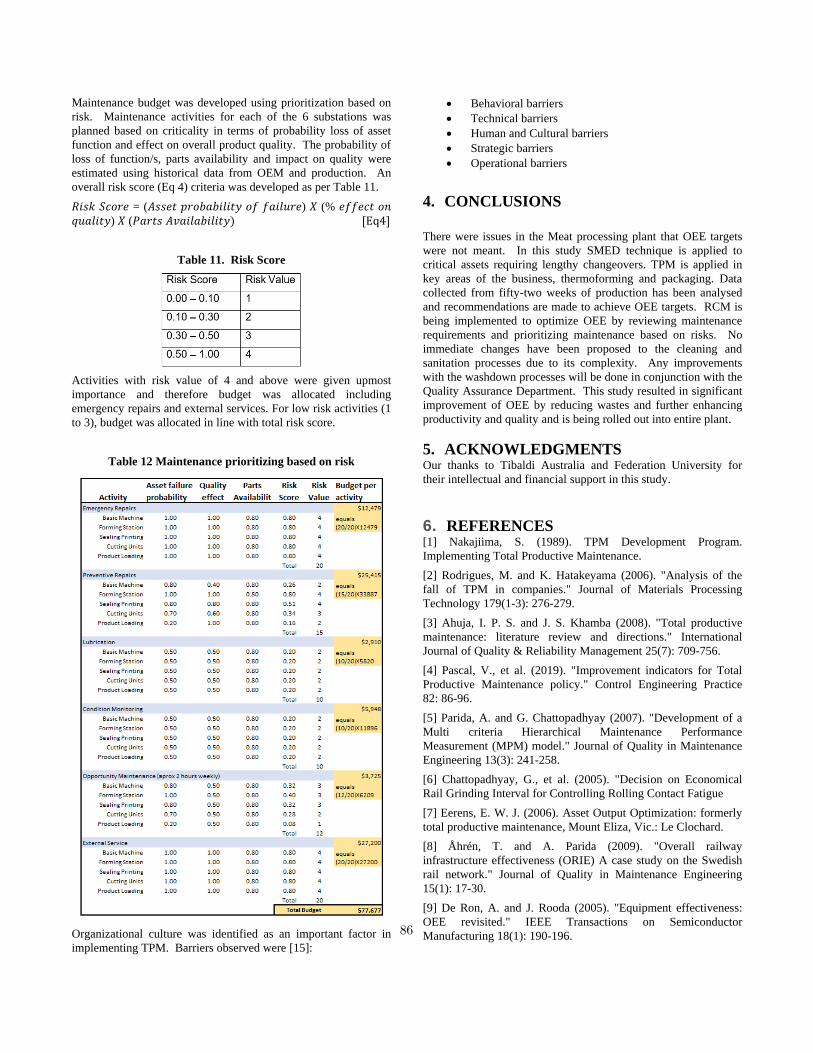
Maintenance budget was developed using prioritization based on
risk. Maintenance activities for each of the 6 substations was
planned based on criticality in terms of probability loss of asset
function and effect on overall product quality. The probability of
loss of function/s, parts availability and impact on quality were
estimated using historical data from OEM and production. An
overall risk score (Eq 4) criteria was developed as per Table 11.
𝑅𝑖𝑠𝑘 𝑆𝑐𝑜𝑟𝑒 = (𝐴𝑠𝑠𝑒𝑡 𝑝𝑟𝑜𝑏𝑎𝑏𝑖𝑙𝑖𝑡𝑦 𝑜𝑓 𝑓𝑎𝑖𝑙𝑢𝑟𝑒) 𝑋 (% 𝑒𝑓𝑓𝑒𝑐𝑡 𝑜𝑛
𝑞𝑢𝑎𝑙𝑖𝑡𝑦) 𝑋 (𝑃𝑎𝑟𝑡𝑠 𝐴𝑣𝑎𝑖𝑙𝑎𝑏𝑖𝑙𝑖𝑡𝑦) [Eq4]
Table 11. Risk Score
Activities with risk value of 4 and above were given upmost
importance and therefore budget was allocated including
emergency repairs and external services. For low risk activities (1
to 3), budget was allocated in line with total risk score.
Table 12 Maintenance prioritizing based on risk
Organizational culture was identified as an important factor in
implementing TPM. Barriers observed were [15]:
Behavioral barriers
Technical barriers
Human and Cultural barriers
Strategic barriers
Operational barriers
4. CONCLUSIONS
There were issues in the Meat processing plant that OEE targets
were not meant. In this study SMED technique is applied to
critical assets requiring lengthy changeovers. TPM is applied in
key areas of the business, thermoforming and packaging. Data
collected from fifty-two weeks of production has been analysed
and recommendations are made to achieve OEE targets. RCM is
being implemented to optimize OEE by reviewing maintenance
requirements and prioritizing maintenance based on risks. No
immediate changes have been proposed to the cleaning and
sanitation processes due to its complexity. Any improvements
with the washdown processes will be done in conjunction with the
Quality Assurance Department. This study resulted in significant
improvement of OEE by reducing wastes and further enhancing
productivity and quality and is being rolled out into entire plant.
5. ACKNOWLEDGMENTS Our thanks to Tibaldi Australia and Federation University for
their intellectual and financial support in this study.
6. REFERENCES [1] Nakajiima, S. (1989). TPM Development Program.
Implementing Total Productive Maintenance.
[2] Rodrigues, M. and K. Hatakeyama (2006). "Analysis of the
fall of TPM in companies." Journal of Materials Processing
Technology 179(1-3): 276-279.
[3] Ahuja, I. P. S. and J. S. Khamba (2008). "Total productive
maintenance: literature review and directions." International
Journal of Quality & Reliability Management 25(7): 709-756.
[4] Pascal, V., et al. (2019). "Improvement indicators for Total
Productive Maintenance policy." Control Engineering Practice
82: 86-96.
[5] Parida, A. and G. Chattopadhyay (2007). "Development of a
Multi criteria Hierarchical Maintenance Performance
Measurement (MPM) model." Journal of Quality in Maintenance
Engineering 13(3): 241-258.
[6] Chattopadhyay, G., et al. (2005). "Decision on Economical
Rail Grinding Interval for Controlling Rolling Contact Fatigue
[7] Eerens, E. W. J. (2006). Asset Output Optimization: formerly
total productive maintenance, Mount Eliza, Vic.: Le Clochard.
[8] Åhrén, T. and A. Parida (2009). "Overall railway
infrastructure effectiveness (ORIE) A case study on the Swedish
rail network." Journal of Quality in Maintenance Engineering
15(1): 17-30.
[9] De Ron, A. and J. Rooda (2005). "Equipment effectiveness:
OEE revisited." IEEE Transactions on Semiconductor
Manufacturing 18(1): 190-196. 86

[10] Ljungberg, Õ. (1998). "Measurement of overall equipment
effectiveness as a basis for TPM activities." International Journal
of Operations & Production Management 18(5): 495-507.
[11] Agustiady, T. K. and E. A. Cudney (2018). "Total productive
maintenance." Total Quality Management & Business Excellence:
1-8.
[12] Chundhoo, V., et al. (2017). OEE improvement of
thermoforming machines through application of TPM at tibaldi
australasia. 2017 IEEE International Conference on Industrial
Engineering and Engineering Management (IEEM).
[13] Braglia, M., et al. (2019). "A novel operational approach to
equipment maintenance: TPM and RCM jointly at work." Journal
of Quality in Maintenance Engineering.
[14] AS IEC 60300.3.11 - 2011 . “Dependability Management
Part3.11 Application guide - Reliability Centred Maintenance”
[15] Attri. R, et al. (2014). "A graph theoretic approach to
evaluate the intensity of barriers in the implementation of total
productive maintenance (TPM)." International Journal of
Production Research.
87

Decision Support System for Flight Maintenance
Technicians: Issues and Challenges Prasanna Illankoon
Luleå University of Technology
971 87 Luleå Sweden
0046761383996
Phillip Tretten Luleå University of Technology
971 87 Luleå Sweden
0046705664940
Sarbjeet Singh Luleå University of Technology
971 87 Luleå Sweden
0046724545472
ABSTRACT
In this article, we summarize the key insights into the fast-rising
areas in decision support and integration of flight maintenance
information. The study elaborates the need and challenges of
decision support for flight maintenance technicians. The major
focus is on the decision support that allows maintenance
technicians as end users to interact and get a better understanding
of the systems (flights) they are dealing with.
Keywords
Decision support, fight maintenance, Situation Awareness
1. INTRODUCTION Aviation sector corresponds with many complex systems, even a
smallest malfunction of system can be sufficient to put the
passengers’ lives in danger. Aircraft maintenance plays an
important role in aviation safety [1], reliability of the
transportation systems [2], life cycle cost of an aircraft [3], and
airline business [4]. At present, there are three major challenging
trends in civil aviation maintenance: Internet of Things (IoT)
(driving condition-based maintenance), Prescriptive (not just
predictive maintenance), and the shortage of maintenance
technicians [5]. Decision support system has become crucial in
modern flight maintenance as it allows relationships, associations
and connections within information and enables better decisions.
A better decision support system for flight maintenance
comprises of information acquisition and processing, aircraft
maintenance technical support, material management,
maintenance management and maintenance event evaluation [6]
besides maintenance planning and strategic level decisions as
well. The efficiency and quality of maintenance decision support
system is augmented by modern communication technology, fault
diagnosis technology and modern control technology. Despite the
support rendered by the modern decision support systems,
aviation maintenance continually subjects to unique challenges.
These challenges are due to various factors such as technicians
perform tasks with limited time, with minimal feedback, with
difficult ambient conditions [7], [8] and at difficult physical
positions within restricted spaces [9-10]. Tedious maintenance
manuals can mislead the technicians resulting in maintenance
error [11] and contributes the main cause of human error in
maintenance [12]. Technological advancement in aviation has
brought maintenance complexity in systems and subsystems,
which thereby enhances the challenge for maintenance technicians
to adapt to new technology [13-14]. Federal Aviation
Administration identifies, human error is the most common of all
accident themes and exists in one form or another on nearly all
accidents [15]. These reports also show that assumptions those are
essential for safety determinations for many aspect of the airplane,
can cause catastrophic outcome, if the part, human, or feature
does not perform as assumed. These difficulties faced by
technicians stress the needs for studying about the present
challenges and solutions available for decision support in aircraft
maintenance.
2. BACKGROUND In order to understand the nature of maintenance decision errors
those causing flight accidents, we should first know the type of
contributing factors. Then, we need to understand how the
decision support systems connect with these error contributing
factors.
2.1 Human Factors and Errors in Flight
Maintenance Human Factors Analysis and Classification-Maintenance
Extension [16] method helps analysing flight accidents due to
maintenance errors, and the factors those contribute to them.
Number of studies explores these factors in the flight maintenance
domain.
A review of 15 selected maintenance mishaps [13] from
National Transportation Safety Board (NTSB) elaborates that
management conditions, technicians’ acts, technicians’
conditions and working conditions were contributing to
100%, 87%, 73% and 67% of the cases respectively.
Inadequate procedures, documentation and communication
accounted for majority of the errors due to technicians’
conditions.
About, 1,016 aircraft mishaps were examined [18] using the
information from the Maintenance Error Information
Management System and found that inadequate supervision
(80%), Judgement errors (55%), attention and memory
(50%), inadequate process (35%), inadequate
communication (20%) as the major causes.
In a comprehensive aviation maintenance tasks analysis
followed by detailed root cause analysis of 58 maintenance-
related helicopter safety occurrences, attention, memory and 88

judgement errors were found as the main causes of
occurrences [19]
Above findings point out that the errors related to attention,
memory, judgment and decision-making have been prevalent over
the years. Attention failures associate with many skill-based
maintenance errors such as the breakdown in visual scan patterns,
task fixation, the inadvertent activation of controls, and the
improper procedural follow-up. Attention failures commonly
occur during highly automatized behaviour. In contrast, memory
failures often appear as omitted items in a checklist, place losing,
or forgotten intentions [16]. These findings claim an inquiry on
weaknesses of conventional decision support systems.
2.2 Issues: Conventional Decision Support In aviation industry, the job task cards are still dominating [20]
and maintenance technicians have to follow task card and
maintain technical logs regarding the maintenance work.
Information coming from the work orders and documents, those
signed by hand authorises to perform specific actions. Moreover,
use of whiteboard is another means of spreading the information
[21]. Databases are used for storing the information, which is later
used by maintenance technicians. The maintenance personnel take
notes and pictures of the work be conducted to communicate to
other technicians and work shifts, and keep records of unusual
situations. While these documents have been in use for long time
in the aviation industry, these carry number of issues.
Mainly, how easy to locate, and comprehend the instructions
and illustrations is a question. 45% of an Aircraft
Maintenance Technicians shift is spent on finding and
reading instructional procedures for job tasks [22].
Secondly, the durability of paper base material is a question
with respective to high mobility requirements and those
being subjecting to harsh work environments.
Thirdly, ensuring mostly updated information through
printed paper material has been a prevailing problem. The
updating process of maintenance manuals is too cumbersome
due to need for tracing all paperwork, different staff signing
documents, information that is sent and forth to the
manufacturer to verify and correct errors, etc.
Fourthly, although it provides to add maintenance notes to
the printed manuals, the majority of the notes and pictures
end up being used only on the individual technicians
workbook and does not contribute to the general knowledge
of the area.
Finally, how strong these media of information in providing
feedback of the actions, remains as a main question.
3. CHALLENGES: DECISION SUPPORT
SYSTEM In this section, we discuss and categorise the challenges faced by
emerging decision support for flight maintenance technicians.
Technologies for decision support comprise of three basic
components; data, models, knowledge, and user interface [23].
Our scope within the decision support focuses the allowance for
maintenance technician as the end user to interact and get a better
understanding of the system. Therefore, we exclude in-depth
assessment about methods of data management from this study.
3.1 Common challenges in decision support Number of studies address the challenges unique to certain
domains in realizing decision support. Karacapilidis [24] finds
three major challenges for future decision support systems and
suggests integration of intelligent tools in future, to overcome
them.
First challenge refers to accommodating groups to augment
the effectiveness of decisions. Recommendations are made to
remove communication impediments, provide techniques for
structuring decision analysis while systematically directing
towards pattern, timing, or content.
Secondly, knowledge-based decision-making views that
decisions should consider procedural knowledge that is
reflected though action commitment. Challenges here are the
realization of tacit knowledge and enabling the decision
making process to produce new knowledge which can justify
or challenge an alternative through evaluation. Previous
studies [25] stress exploration of opportunities for
collaborating human implicit knowledge and intelligent
maintenance systems.
Thirdly, providing customized solutions that adapt to the
decision maker’s profile was identified as a challenge. This
needs taking into account one’s preferences, abilities,
experience, collaboration mode, as well as aspects related to
technical specifications of one’s platform.
3.2 Challenges unique to flight maintenance Recent studies [26] using interviews, observations and workshop
reveal series of expectations of flight maintenance technician from
the decision support systems. These are very specific tactical level
expectations of the users; those would be useful in developing
decision support system. Some are briefly presented below:
Less warnings and cautions, use them when critical only
Having graphics in combination with text
List of only special tools with clear specification about what
tools to use
Highlight specific information clearly, rather than taking
away necessary information
Provide directly go into the spare part catalogue
Applying native language to the manuals. Liang [7] also
points this out.
Take away unnecessary information and give more freedom
to the technician
3.3 Need for context driven information In addition to the requirements regarding the understanding of
elementary perceptual-cognitive tasks and consideration of
dynamics of information [27], the information retrieval itself casts
challenges for decision support. In order to ensure the usefulness
of the decision support, the users should able to receive context-
aware information about the system status and work instructions.
A system is context aware if it uses context to provide relevant
information and / or services to the user, where relevancy depends
on the user’s task [28]. In other words, such systems capture
various types of information and events from the physical world
and present the information to the members of workgroups. The
foundation for the development of context driven information
89
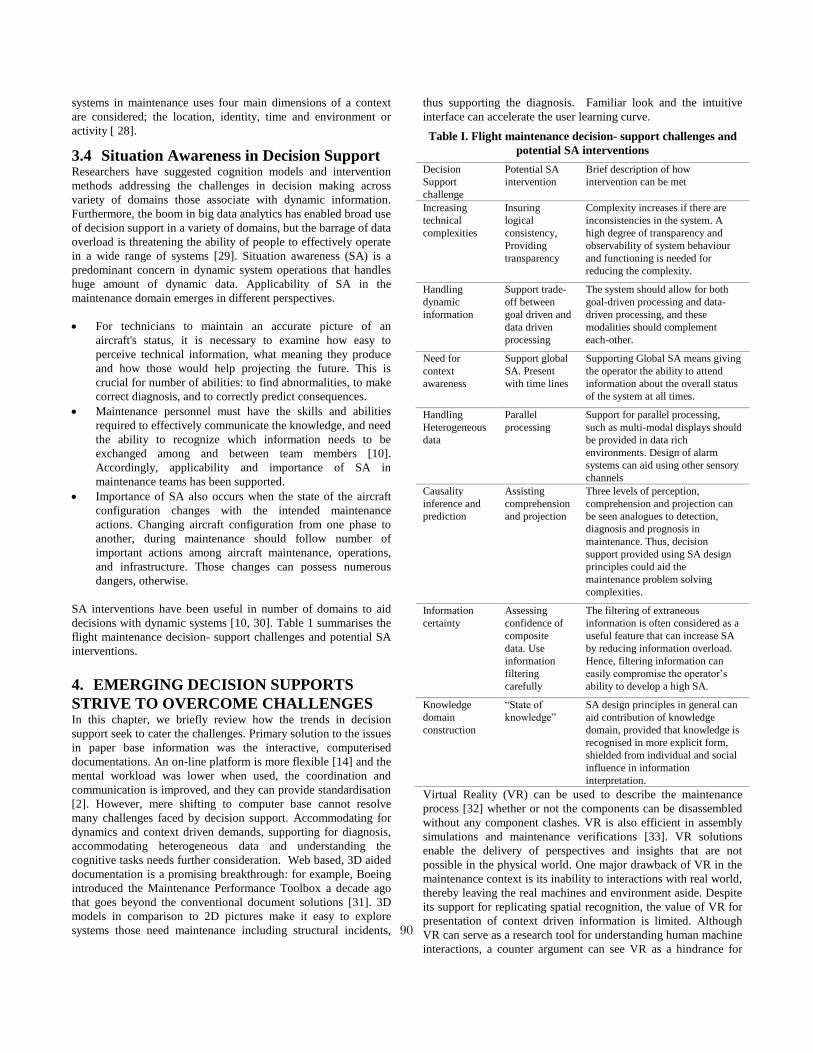
systems in maintenance uses four main dimensions of a context
are considered; the location, identity, time and environment or
activity [ 28].
3.4 Situation Awareness in Decision Support Researchers have suggested cognition models and intervention
methods addressing the challenges in decision making across
variety of domains those associate with dynamic information.
Furthermore, the boom in big data analytics has enabled broad use
of decision support in a variety of domains, but the barrage of data
overload is threatening the ability of people to effectively operate
in a wide range of systems [29]. Situation awareness (SA) is a
predominant concern in dynamic system operations that handles
huge amount of dynamic data. Applicability of SA in the
maintenance domain emerges in different perspectives.
For technicians to maintain an accurate picture of an
aircraft's status, it is necessary to examine how easy to
perceive technical information, what meaning they produce
and how those would help projecting the future. This is
crucial for number of abilities: to find abnormalities, to make
correct diagnosis, and to correctly predict consequences.
Maintenance personnel must have the skills and abilities
required to effectively communicate the knowledge, and need
the ability to recognize which information needs to be
exchanged among and between team members [10].
Accordingly, applicability and importance of SA in
maintenance teams has been supported.
Importance of SA also occurs when the state of the aircraft
configuration changes with the intended maintenance
actions. Changing aircraft configuration from one phase to
another, during maintenance should follow number of
important actions among aircraft maintenance, operations,
and infrastructure. Those changes can possess numerous
dangers, otherwise.
SA interventions have been useful in number of domains to aid
decisions with dynamic systems [10, 30]. Table 1 summarises the
flight maintenance decision- support challenges and potential SA
interventions.
4. EMERGING DECISION SUPPORTS
STRIVE TO OVERCOME CHALLENGES In this chapter, we briefly review how the trends in decision
support seek to cater the challenges. Primary solution to the issues
in paper base information was the interactive, computerised
documentations. An on-line platform is more flexible [14] and the
mental workload was lower when used, the coordination and
communication is improved, and they can provide standardisation
[2]. However, mere shifting to computer base cannot resolve
many challenges faced by decision support. Accommodating for
dynamics and context driven demands, supporting for diagnosis,
accommodating heterogeneous data and understanding the
cognitive tasks needs further consideration. Web based, 3D aided
documentation is a promising breakthrough: for example, Boeing
introduced the Maintenance Performance Toolbox a decade ago
that goes beyond the conventional document solutions [31]. 3D
models in comparison to 2D pictures make it easy to explore
systems those need maintenance including structural incidents,
thus supporting the diagnosis. Familiar look and the intuitive
interface can accelerate the user learning curve.
Table I. Flight maintenance decision- support challenges and
potential SA interventions
Decision
Support
challenge
Potential SA
intervention
Brief description of how
intervention can be met
Increasing
technical
complexities
Insuring
logical
consistency,
Providing
transparency
Complexity increases if there are
inconsistencies in the system. A
high degree of transparency and
observability of system behaviour
and functioning is needed for
reducing the complexity.
Handling
dynamic
information
Support trade-
off between
goal driven and
data driven
processing
The system should allow for both
goal-driven processing and data-
driven processing, and these
modalities should complement
each-other.
Need for
context
awareness
Support global
SA. Present
with time lines
Supporting Global SA means giving
the operator the ability to attend
information about the overall status
of the system at all times.
Handling
Heterogeneous
data
Parallel
processing
Support for parallel processing,
such as multi-modal displays should
be provided in data rich
environments. Design of alarm
systems can aid using other sensory
channels
Causality
inference and
prediction
Assisting
comprehension
and projection
Three levels of perception,
comprehension and projection can
be seen analogues to detection,
diagnosis and prognosis in
maintenance. Thus, decision
support provided using SA design
principles could aid the
maintenance problem solving
complexities.
Information
certainty
Assessing
confidence of
composite
data. Use
information
filtering
carefully
The filtering of extraneous
information is often considered as a
useful feature that can increase SA
by reducing information overload.
Hence, filtering information can
easily compromise the operator’s
ability to develop a high SA.
Knowledge
domain
construction
“State of
knowledge”
SA design principles in general can
aid contribution of knowledge
domain, provided that knowledge is
recognised in more explicit form,
shielded from individual and social
influence in information
interpretation.
Virtual Reality (VR) can be used to describe the maintenance
process [32] whether or not the components can be disassembled
without any component clashes. VR is also efficient in assembly
simulations and maintenance verifications [33]. VR solutions
enable the delivery of perspectives and insights that are not
possible in the physical world. One major drawback of VR in the
maintenance context is its inability to interactions with real world,
thereby leaving the real machines and environment aside. Despite
its support for replicating spatial recognition, the value of VR for
presentation of context driven information is limited. Although
VR can serve as a research tool for understanding human machine
interactions, a counter argument can see VR as a hindrance for
90
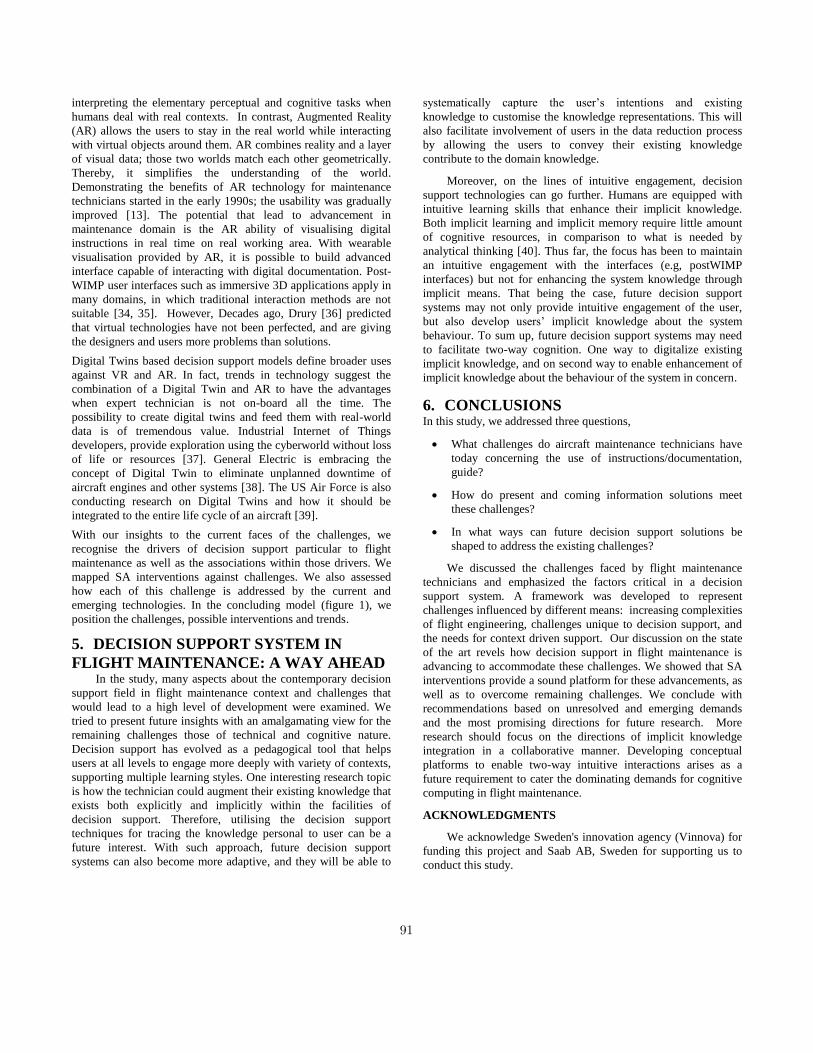
interpreting the elementary perceptual and cognitive tasks when
humans deal with real contexts. In contrast, Augmented Reality
(AR) allows the users to stay in the real world while interacting
with virtual objects around them. AR combines reality and a layer
of visual data; those two worlds match each other geometrically.
Thereby, it simplifies the understanding of the world.
Demonstrating the benefits of AR technology for maintenance
technicians started in the early 1990s; the usability was gradually
improved [13]. The potential that lead to advancement in
maintenance domain is the AR ability of visualising digital
instructions in real time on real working area. With wearable
visualisation provided by AR, it is possible to build advanced
interface capable of interacting with digital documentation. Post-
WIMP user interfaces such as immersive 3D applications apply in
many domains, in which traditional interaction methods are not
suitable [34, 35]. However, Decades ago, Drury [36] predicted
that virtual technologies have not been perfected, and are giving
the designers and users more problems than solutions.
Digital Twins based decision support models define broader uses
against VR and AR. In fact, trends in technology suggest the
combination of a Digital Twin and AR to have the advantages
when expert technician is not on-board all the time. The
possibility to create digital twins and feed them with real-world
data is of tremendous value. Industrial Internet of Things
developers, provide exploration using the cyberworld without loss
of life or resources [37]. General Electric is embracing the
concept of Digital Twin to eliminate unplanned downtime of
aircraft engines and other systems [38]. The US Air Force is also
conducting research on Digital Twins and how it should be
integrated to the entire life cycle of an aircraft [39].
With our insights to the current faces of the challenges, we
recognise the drivers of decision support particular to flight
maintenance as well as the associations within those drivers. We
mapped SA interventions against challenges. We also assessed
how each of this challenge is addressed by the current and
emerging technologies. In the concluding model (figure 1), we
position the challenges, possible interventions and trends.
5. DECISION SUPPORT SYSTEM IN
FLIGHT MAINTENANCE: A WAY AHEAD In the study, many aspects about the contemporary decision
support field in flight maintenance context and challenges that
would lead to a high level of development were examined. We
tried to present future insights with an amalgamating view for the
remaining challenges those of technical and cognitive nature.
Decision support has evolved as a pedagogical tool that helps
users at all levels to engage more deeply with variety of contexts,
supporting multiple learning styles. One interesting research topic
is how the technician could augment their existing knowledge that
exists both explicitly and implicitly within the facilities of
decision support. Therefore, utilising the decision support
techniques for tracing the knowledge personal to user can be a
future interest. With such approach, future decision support
systems can also become more adaptive, and they will be able to
systematically capture the user’s intentions and existing
knowledge to customise the knowledge representations. This will
also facilitate involvement of users in the data reduction process
by allowing the users to convey their existing knowledge
contribute to the domain knowledge.
Moreover, on the lines of intuitive engagement, decision
support technologies can go further. Humans are equipped with
intuitive learning skills that enhance their implicit knowledge.
Both implicit learning and implicit memory require little amount
of cognitive resources, in comparison to what is needed by
analytical thinking [40]. Thus far, the focus has been to maintain
an intuitive engagement with the interfaces (e.g, postWIMP
interfaces) but not for enhancing the system knowledge through
implicit means. That being the case, future decision support
systems may not only provide intuitive engagement of the user,
but also develop users’ implicit knowledge about the system
behaviour. To sum up, future decision support systems may need
to facilitate two-way cognition. One way to digitalize existing
implicit knowledge, and on second way to enable enhancement of
implicit knowledge about the behaviour of the system in concern.
6. CONCLUSIONS In this study, we addressed three questions,
What challenges do aircraft maintenance technicians have
today concerning the use of instructions/documentation,
guide?
How do present and coming information solutions meet
these challenges?
In what ways can future decision support solutions be
shaped to address the existing challenges?
We discussed the challenges faced by flight maintenance
technicians and emphasized the factors critical in a decision
support system. A framework was developed to represent
challenges influenced by different means: increasing complexities
of flight engineering, challenges unique to decision support, and
the needs for context driven support. Our discussion on the state
of the art revels how decision support in flight maintenance is
advancing to accommodate these challenges. We showed that SA
interventions provide a sound platform for these advancements, as
well as to overcome remaining challenges. We conclude with
recommendations based on unresolved and emerging demands
and the most promising directions for future research. More
research should focus on the directions of implicit knowledge
integration in a collaborative manner. Developing conceptual
platforms to enable two-way intuitive interactions arises as a
future requirement to cater the dominating demands for cognitive
computing in flight maintenance.
ACKNOWLEDGMENTS
We acknowledge Sweden's innovation agency (Vinnova) for
funding this project and Saab AB, Sweden for supporting us to
conduct this study.
91
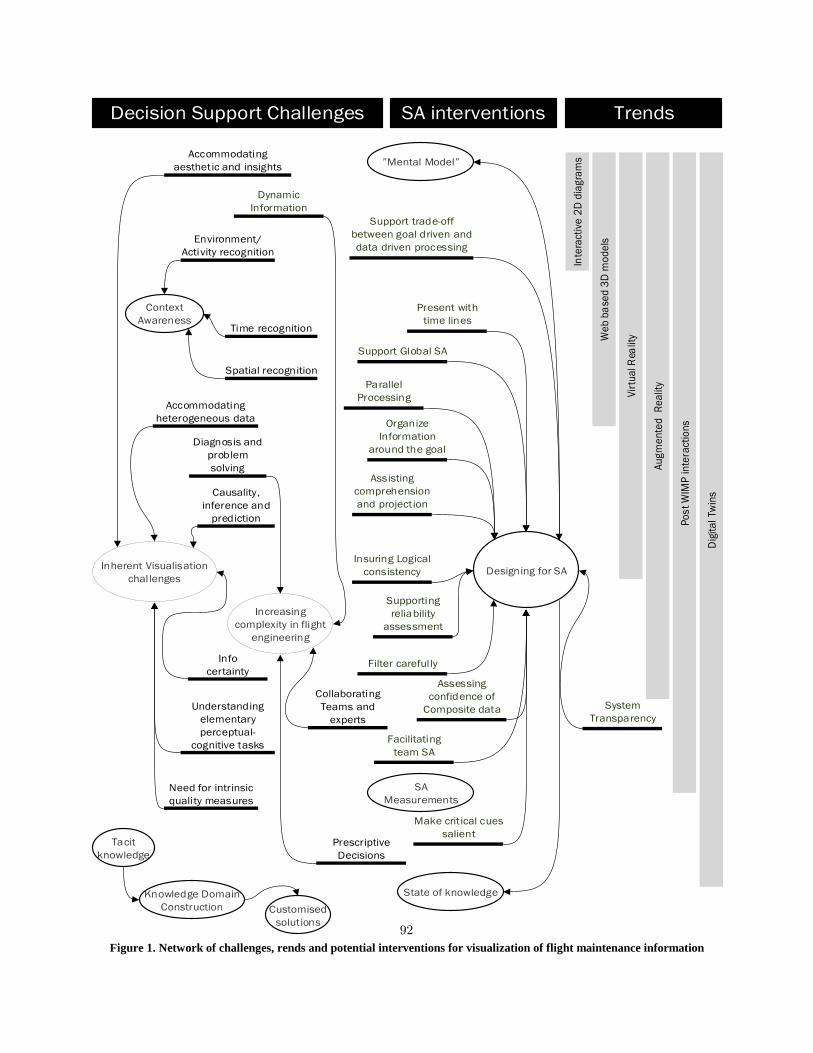
Dynamic
Information
Diagnosis and
problem
solving
Organize
Information
around the goal
Assisting
comprehension
and projection
Parallel
Processing
Understanding
elementary
perceptual-
cognitive tasks
Supporting
reliability
assessment
Insuring Logical
consistency
System
Transparency
Accommodating
aesthetic and insights
Causality,
inference and
prediction
Accommodating
heterogeneous data
Collaborating
Teams and
experts
Filter carefully
Increasing
complexity in flight
engineering
Inherent Visualisation
challenges
Decision Support Challenges SA interventions
Assessing
confidence of
Composite data
Facilitating
team SA
Prescriptive
Decisions
Spatial recognition
Time recognition
Environment/
Activity recognition
Context
Awareness
Info
certainty
Designing for SAIn
tera
ctiv
e 2
D d
iag
ram
s
We
b b
ase
d 3
D m
od
els
Vir
tua
l Rea
lity
Au
gm
en
ted
R
ea
lity
Po
st
WIM
P i
nte
ract
ion
s
Dig
ita
l Tw
ins
Need for intrinsic
quality measures
SA
Measurements
Present with
time lines
�Mental Model�
State of knowledge
Trends
Knowledge Domain
Construction
Tacit
knowledge
Customised
solutions
Support trade-off
between goal driven and
data driven processing
Support Global SA
Make critical cues
salient
Figure 1. Network of challenges, rends and potential interventions for visualization of flight maintenance information
92
7. REFERENCES [1] Usanmaz, O. (2011). Training of the maintenance personnel to
prevent failures in aircraft systems. Engineering Failure
Analysis, 18(7), pp.1683-1688. doi:
10.1016/j.engfailanal.2011.02.010
[2] Kraus, D. C., Gramopadhye, A. K. (2001). Effect of team
training on aircraft maintenance technicians: computer-based
training versos instructor-based training. International Journal
of Industrial Ergonomics, 27(3), pp.141-157. doi:
10.1016/S0169-8141(00)00044-5
[3] Cusano, C., Napoletano, P. (2017). Visual recognition of
aircraft mechanical parts for smart maintenance. Comput. Ind.
86, pp.26–33
[4] Papakostas, N., Papachatzakis, P., Xanthakis, V., Mourtzis,
D., Chryssolouris, G. (2010). An approach to operational
aircraft maintenance planning. Decision Support Systems 48,
pp.604-612
[5] MRO (2017). Three Trends Taking Off in Civil Aviation
MRO in 2017. Available at: http://www.mro-
network.com/maintenance-repair-overhaul/three-trends-
taking-civil-aviation-mro-2017
[6] Zhang, P., Zhao, S.W., Tan, B., Yu, L.M., Hua, K.Q.,
(2011). Applications of Decision Support System in Aviation
Maintenance, Efficient Decision Support Systems - Practice
and Challenges in Multidisciplinary Domains, Intech Open,
DOI: 10.5772/20742.
[7] Liang, G.F., Lin, J.T., Hwang, S.L., Wang, M.Y. E.,
Patterson, P. (2010). Preventing human errors in aviation
maintenance using an on-line maintenance assistance
platform. International Journal of Industrial Ergonomics,
(40), 356-367. doi:10.1016/j.ergon.2010.01.001
[8] Dhillon, B. S., Liu, Y. (2006). Human error in maintenance:
a review. Journal of Quality in Maintenance Engineering,
12(1), pp.21-36. doi: 10.1108/1355251061065410
[9] Latorella, K., Prabhu, P. (2000). A review of human error in
aviation maintenance and inspection. International Journal of
Industrial Ergonomics, 26(2), pp.133-161.
doi:10.1016/S0169-8141(99)00063-3
[10] Endsley, M. R., Robertson, M. M. (2000). Situation
awareness in aircraft maintenance teams. Industrial Journal
of Industrial Ergonomics, 26(2), pp.301-325. doi:
10.1016/S0169-8141(99)00073-6
[11] Chang, Y.H., Wang, Y.C. (2010). Significant human risk
factors in aircraft maintenance technicians. Safety Science,
48(1), pp. 54-62. doi: 10.1016/j.ssci.2009.05.004
[12] Webel, S., Bockholt, U., Engelke, T., Gavish, N., Olbrich,
M., Preusche, C. (2012). An augmented reality training
platform for assembly and maintenance skills. Robotics and
Autonomous Systems, 61, pp398-403. doi:
10.1016/j.robot.2012.09.013
[13] Zhu, J., Ong, S. K., Nee, A. Y. C. (2012). An authorable
context-aware augmented reality system to assist the
maintenance technicians. The International Journal of
Advanced Manufacturing Technology, 66(9), pp.1699-1714.
doi: 10.1007/s00170-012-4451-2
[14] Liang, G.F., Lin, J.T., Hwang, S.L., Wang, M.Y. E.,
Patterson, P. (2010). Preventing human errors in aviation
maintenance using an on-line maintenance assistance
platform. International Journal of Industrial Ergonomics,
(40), pp.356-367. doi:10.1016/j.ergon.2010.01.001
[15] FAA (Federal Aviation Administration) (2009), A Historical
Perspective 1903-2008. Available at
https://www.faa.gov/about/history/historical_perspective/
[16] Shappell,S.A., Wiegmann, D.A. (2001). Applying reason: the
human factors analysis and classification system (HFACS),
Human Factors and Aerospace Safety
[17] Schmidt, J., Lawson, D., Figlock, R. (2003). Human factors
analysis and classification system maintenance extension
(HFACS-Me), review of select NTSB maintenance mishaps, an
update.
http://www.faa.gov/about/initiatives/maintenance_hf/library/do
cuments/media/hfacs/ntsb_hfacs-me_updated_study_report.pdf
[18] Krulak, D.C. (2004). Human factors in maintenance: impact on
aircraft mishap frequency and severity. Aviat Space Environ
Med. (75), pp.429-432
[19] Rashid, H.S., Place, S., Braithwaite, G. (2010). Helicopter
maintenance error analysis: beyond the third order of the
HFACS-ME. Int J Indus Ergon 40(6), pp.636–647
[20] Pourcho, J.B. (2014). Augmented Reality Application Utility
For Aviation Maintenance Work Instruction. Open Access
Theses. https://docs.lib.purdue.edu
[21] Tretten P., Normark C.J. (2015). Human factors issues in
aircraft maintenance activities: a holistic approach. In D. de
Waard, MORE (Eds.) Proceedings of the Human Factors and
Ergonomics Society Europe Chapter 2014 Annual Conference.
ISSN 2333-4959 (online). Available at: http://hfeseurope.org
[22] Neumann U., Majoros, A. (1998). Cognitive, performance, and
systems issues for augmented reality applications in
manufacturing and maintenance. Proceedings of the IEEE
Virtual Reality Annual International Symposium
[23] Mora, M., Forgionne, G., Gupta, J., Cervantes, F., Gelman, O.
(2003). A Framework to Assess Intelligent Decision-Making
Support Systems. In: Palade V, Howlett RJ, Jain L (eds.)
Knowledge-Based Intelligent Information and Engineering
Systems -Proceedings of the 7th Int. Conf. on Knowledge-
Based Intelligent Information and Engineering Systems (KES
2003), Oxford, UK. Springer, Berlin, Lecture Notes in AI
2774, pp.59-65.
[24] Karacapilidis N. (2006). Intelligent Decision-Making Support
Systems SE-20, An overview of future challenges of decision
support technologies, London: Springer
[25] Illankoon P., Tretten P., Kumar U. (2018) Identifying
Significance of Human Cognition in Future Maintenance
Operations. In: Karwowski W., Ahram T. (eds) Intelligent
Human Systems Integration. IHSI 2018. Advances in
Intelligent Systems and Computing, vol 722. Springer, Cham
[26] Nilsson, A.K. (2016). Designing an interface for aircraft
maintenance and the possibilities of augmented reality : An
iterative user-centered design process (Dissertation). Available
at:http://urn.kb.se/resolve?urn=urn:nbn:se:ltu:diva-50087 93
[27] Chen, C. (2005). Top 10 unsolved information visualization
problems," in IEEE Computer Graphics and Applications, vol.
25, no. 4, pp. 12-16,. doi: 10.1109/MCG.2005.91
[28] Dey, A. (2001). Understanding and using context Personal and
Ubiquitous Computing, 5 (1) (2001), pp. 4-7.
[29] Endsley, M. R. (1995). Toward a theory of situation awareness
in dynamic systems. Human Factors, 37, pp.32–64.
[30] Endsley, M.R., Jones, D.G. (2011). Designing for situation
awareness: An approach to user-centered design. CRC Press.
[31] Douglas,R. (2007). Maintenance Performance Toolbox, Aero
Quarterly, qtr_01, 2007, Available
at:boeing.com/commercial/aeromagazine
[32] Dong, Z., Le, K., Chuan, L. (2013). A virtual reality-based
maintenance time measurement methology for complex
products. Assembly Automation, 33(3), pp.221-230.doi:
10.1108/AA-12-2013-048
[33] Gomes de Sá, A., Zachmann, G. (1999). Virtual reality as a
tool for verification of assembly and maintenance processes.
Computer & Graphics, 23(1999), pp.389-403.
doi:10.1016/S0097-8493(99)00047-3
[34] Chase, M.W. (2010). A Look Beyond the Window, Retrieved
from http://www.meta-earth.com/2010/01/05/a-look-beyond-
the-window/
[35] Jo, J., L’Yi, S., Lee, B., Seo, J, (2017). TouchPivot: Blending
WIMP & Post-WIMP Interfaces for Data Exploration on
Tablet Devices, CHI '17 Proceedings of the 2017 CHI
Conference on Human Factors in Computing Systems,
Colorado, USA
[36] Drury, C. G., Patel, S. C., Prabhu P. V. (2000). Relative
advantage of portable computer-based workcards for aircraft
inspection. International Journal of Industrial Ergonomics,
26(2), pp.163-176. doi: 10.1016/S0169-8141(99)00064-5
[37] Gutierrez. C., Khizhniak., A. (2017). Digital Twins for
Aerospace: Better Fleet Reliability and Performance, Available
at: https://www.altoros.com/blog/digital-twins-for-aerospace-
better-fleet-reliability-and-performance/
[38] Warwick, G., (2015). GE Advances Analytical Maintenance
With Digital Twins, Oct 19, 2015 ,Aviation Week & Space
Technology, available at: http://aviationweek.com/optimizing-
engines-through-lifecycle/ge-advances-analytical-maintenance-
digital-twins
[39] Gutierrez. C., Khizhniak., A. (2017). Digital Twins for
Aerospace: Better Fleet Reliability and Performance, Accessed
at: https://www.altoros.com/blog/digital-twins-for-aerospace-
better-fleet-reliability-and-performance/
[40] Deroost, N., Vandenbossche, J., Zeischka, P., Coomans, D.,
and Soetens, E. (2012). Cognitive control: a role for implicit
learning? J. Exp. Psychol. Learn. Mem. Cogn. 38, pp.1243–
1258.
94
IT-productivity in the Operations and Maintenance of Road
Freight Transportation and Logistics: Insights from the
Past Decades Natallia Pashkevich
Södertorn University Alfred Nobels Allé 7
141 89 Huddige, Sweden Telephone number: +46760540692
Soumitra Chowdhury Linnaeus University Universitetsplatsen 1
351 95 Växjö, Sweden Telephone number: +46470708820
Darek Haftor Uppsala University & Linnaeus University Kyrkogårdsgatan 10
753 13 Uppsala, Sweden Telephone number: +46706561380
ABSTRACT
Although IT is playing a significant role in road freight
transportation and logistics, there exists a lack of comprehensive
knowledge of IT and productivity in the area. This paper presents
a review of the research on IT-productivity in the operations and
maintenance of road freight transportation and logistics as well as
proposes directions for future research. We have conducted the
review in both academic and non-academic sources. Based on 26
papers, we have structured the review in three levels: industry
level, firm level, and individual level. A number of insights have
been made, which characterize the current state of knowledge.
Several insights call for further research. We have found that there
is a diversity in the terminologies when referring to the positive
impact of IT on fuel efficiency for road freight transportation and
logistics. Our findings suggest that there is a lack of
methodological diversity while understanding the effect of IT on
load efficiency in transportation. The existing field experiments
can be characterized by two phase design, small sample size and
short time for the intervention phase. There is a lack of
conceptualization of complementarities when the existing studies
show the importance of incentives and training with the
introduction of a new digital technology in relation to
productivity. This paper is a first attempt to synthesize relevant
research on IT-productivity in the operations and maintenance in
road freight transportation and logistics.
Keywords
IT-productivity, digitalization, road freight transportation,
logistics
1. INTRODUCTION Digitalization has essentially affected organizations and
individuals [1]. Current information technology (IT) and new
digital environments such as mobile and service platforms, cloud
computing, social media enable new combinations of resources,
communication channels, products and services, digital business
models as well as changes in the creation of value. These new
advancements in technologies and current changes raise many
questions open to researchers as well as organizations in terms of
understanding the process of value creation and economics of IT.
Freight transportation and logistics is a crucial component of
economic growth and employment [2], [3]. Specifically, road
freight transportation and logistics covers a significant share
(more than 60%) of all surface freight transportation [4]. Current
studies demonstrate that this industry has undergone a significant
development in terms of activities and employment. The demand
for road freight transport and logistics services continuously
grows [5], [6].
Modern digital technologies provide significant support for
transport and logistics operations. They are perceived as an
enabler of cost reduction, efficiency increase, customer service
improvement and competitive advantage enhancement [7]. Yet, in
general, the transport and logistics industry belongs to the group
of lagging industries in digitization, particularly in the EU
countries [3], [8]. Some studies also report that the uptake of
recent technological advances in relation to productivity has been
considerably slow in road freight transportation and logistics [1]-
[3]. It was explained by a “hidden IT impact” that cannot be
captured by aggregated data of IT investments in the database [9].
These uncertainties lay a foundation to understand how current
studies investigate the relationship between IT and productivity in
road freight transportation and logistics.
Our aim with the present study, thus, to offer a review of the
literature on the topic of IT-productivity relationships in the
operations and maintenance of road freight transportations and
logistics. IT-productivity can be defined as the efficiency gains
enabled by the use of information technologies [1]. We classify
studies based on three levels of analysis: industry level, firm level
and individual level. The paper contributes by advancing the
understanding of IT-productivity with a particular focus on road
freight transport and logistics as well as by proposing directions
for future research.
2. REVIEW METHOD This review is based on the literature related to IT-productivity in
the operations and maintenance in road freight transportation and
logistics. Papers that took into account the sustainability
perspective were also taken into account.
Articles published in international peer-reviewed journals,
conference proceedings and reports published by the European
Commission were considered. The articles were published in
95
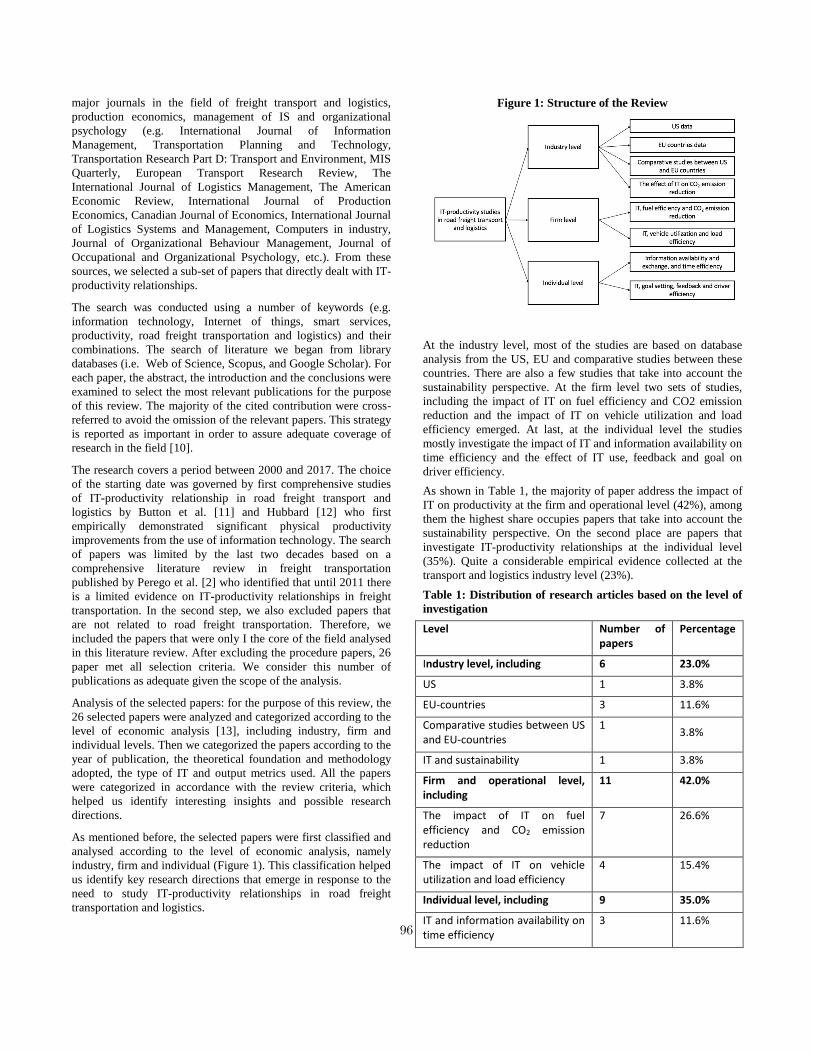
major journals in the field of freight transport and logistics,
production economics, management of IS and organizational
psychology (e.g. International Journal of Information
Management, Transportation Planning and Technology,
Transportation Research Part D: Transport and Environment, MIS
Quarterly, European Transport Research Review, The
International Journal of Logistics Management, The American
Economic Review, International Journal of Production
Economics, Canadian Journal of Economics, International Journal
of Logistics Systems and Management, Computers in industry,
Journal of Organizational Behaviour Management, Journal of
Occupational and Organizational Psychology, etc.). From these
sources, we selected a sub-set of papers that directly dealt with IT-
productivity relationships.
The search was conducted using a number of keywords (e.g.
information technology, Internet of things, smart services,
productivity, road freight transportation and logistics) and their
combinations. The search of literature we began from library
databases (i.e. Web of Science, Scopus, and Google Scholar). For
each paper, the abstract, the introduction and the conclusions were
examined to select the most relevant publications for the purpose
of this review. The majority of the cited contribution were cross-
referred to avoid the omission of the relevant papers. This strategy
is reported as important in order to assure adequate coverage of
research in the field [10].
The research covers a period between 2000 and 2017. The choice
of the starting date was governed by first comprehensive studies
of IT-productivity relationship in road freight transport and
logistics by Button et al. [11] and Hubbard [12] who first
empirically demonstrated significant physical productivity
improvements from the use of information technology. The search
of papers was limited by the last two decades based on a
comprehensive literature review in freight transportation
published by Perego et al. [2] who identified that until 2011 there
is a limited evidence on IT-productivity relationships in freight
transportation. In the second step, we also excluded papers that
are not related to road freight transportation. Therefore, we
included the papers that were only I the core of the field analysed
in this literature review. After excluding the procedure papers, 26
paper met all selection criteria. We consider this number of
publications as adequate given the scope of the analysis.
Analysis of the selected papers: for the purpose of this review, the
26 selected papers were analyzed and categorized according to the
level of economic analysis [13], including industry, firm and
individual levels. Then we categorized the papers according to the
year of publication, the theoretical foundation and methodology
adopted, the type of IT and output metrics used. All the papers
were categorized in accordance with the review criteria, which
helped us identify interesting insights and possible research
directions.
As mentioned before, the selected papers were first classified and
analysed according to the level of economic analysis, namely
industry, firm and individual (Figure 1). This classification helped
us identify key research directions that emerge in response to the
need to study IT-productivity relationships in road freight
transportation and logistics.
Figure 1: Structure of the Review
At the industry level, most of the studies are based on database
analysis from the US, EU and comparative studies between these
countries. There are also a few studies that take into account the
sustainability perspective. At the firm level two sets of studies,
including the impact of IT on fuel efficiency and CO2 emission
reduction and the impact of IT on vehicle utilization and load
efficiency emerged. At last, at the individual level the studies
mostly investigate the impact of IT and information availability on
time efficiency and the effect of IT use, feedback and goal on
driver efficiency.
As shown in Table 1, the majority of paper address the impact of
IT on productivity at the firm and operational level (42%), among
them the highest share occupies papers that take into account the
sustainability perspective. On the second place are papers that
investigate IT-productivity relationships at the individual level
(35%). Quite a considerable empirical evidence collected at the
transport and logistics industry level (23%).
Table 1: Distribution of research articles based on the level of
investigation
Level Number of papers
Percentage
Industry level, including 6 23.0%
US 1 3.8%
EU-countries 3 11.6%
Comparative studies between US and EU-countries
1 3.8%
IT and sustainability 1 3.8%
Firm and operational level, including
11 42.0%
The impact of IT on fuel efficiency and CO2 emission reduction
7 26.6%
The impact of IT on vehicle utilization and load efficiency
4 15.4%
Individual level, including 9 35.0%
IT and information availability on time efficiency
3 11.6% 96
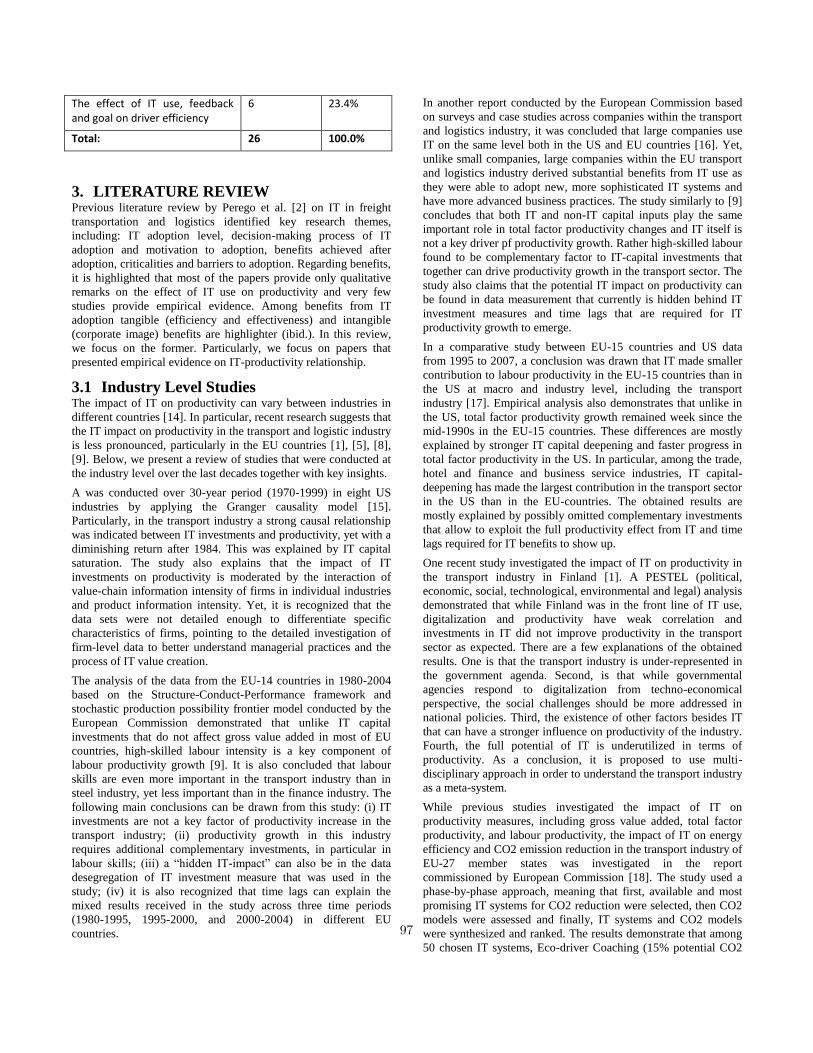
The effect of IT use, feedback and goal on driver efficiency
6 23.4%
Total: 26 100.0%
3. LITERATURE REVIEW Previous literature review by Perego et al. [2] on IT in freight
transportation and logistics identified key research themes,
including: IT adoption level, decision-making process of IT
adoption and motivation to adoption, benefits achieved after
adoption, criticalities and barriers to adoption. Regarding benefits,
it is highlighted that most of the papers provide only qualitative
remarks on the effect of IT use on productivity and very few
studies provide empirical evidence. Among benefits from IT
adoption tangible (efficiency and effectiveness) and intangible
(corporate image) benefits are highlighter (ibid.). In this review,
we focus on the former. Particularly, we focus on papers that
presented empirical evidence on IT-productivity relationship.
3.1 Industry Level Studies The impact of IT on productivity can vary between industries in
different countries [14]. In particular, recent research suggests that
the IT impact on productivity in the transport and logistic industry
is less pronounced, particularly in the EU countries [1], [5], [8],
[9]. Below, we present a review of studies that were conducted at
the industry level over the last decades together with key insights.
A was conducted over 30-year period (1970-1999) in eight US
industries by applying the Granger causality model [15].
Particularly, in the transport industry a strong causal relationship
was indicated between IT investments and productivity, yet with a
diminishing return after 1984. This was explained by IT capital
saturation. The study also explains that the impact of IT
investments on productivity is moderated by the interaction of
value-chain information intensity of firms in individual industries
and product information intensity. Yet, it is recognized that the
data sets were not detailed enough to differentiate specific
characteristics of firms, pointing to the detailed investigation of
firm-level data to better understand managerial practices and the
process of IT value creation.
The analysis of the data from the EU-14 countries in 1980-2004
based on the Structure-Conduct-Performance framework and
stochastic production possibility frontier model conducted by the
European Commission demonstrated that unlike IT capital
investments that do not affect gross value added in most of EU
countries, high-skilled labour intensity is a key component of
labour productivity growth [9]. It is also concluded that labour
skills are even more important in the transport industry than in
steel industry, yet less important than in the finance industry. The
following main conclusions can be drawn from this study: (i) IT
investments are not a key factor of productivity increase in the
transport industry; (ii) productivity growth in this industry
requires additional complementary investments, in particular in
labour skills; (iii) a “hidden IT-impact” can also be in the data
desegregation of IT investment measure that was used in the
study; (iv) it is also recognized that time lags can explain the
mixed results received in the study across three time periods
(1980-1995, 1995-2000, and 2000-2004) in different EU
countries.
In another report conducted by the European Commission based
on surveys and case studies across companies within the transport
and logistics industry, it was concluded that large companies use
IT on the same level both in the US and EU countries [16]. Yet,
unlike small companies, large companies within the EU transport
and logistics industry derived substantial benefits from IT use as
they were able to adopt new, more sophisticated IT systems and
have more advanced business practices. The study similarly to [9]
concludes that both IT and non-IT capital inputs play the same
important role in total factor productivity changes and IT itself is
not a key driver pf productivity growth. Rather high-skilled labour
found to be complementary factor to IT-capital investments that
together can drive productivity growth in the transport sector. The
study also claims that the potential IT impact on productivity can
be found in data measurement that currently is hidden behind IT
investment measures and time lags that are required for IT
productivity growth to emerge.
In a comparative study between EU-15 countries and US data
from 1995 to 2007, a conclusion was drawn that IT made smaller
contribution to labour productivity in the EU-15 countries than in
the US at macro and industry level, including the transport
industry [17]. Empirical analysis also demonstrates that unlike in
the US, total factor productivity growth remained week since the
mid-1990s in the EU-15 countries. These differences are mostly
explained by stronger IT capital deepening and faster progress in
total factor productivity in the US. In particular, among the trade,
hotel and finance and business service industries, IT capital-
deepening has made the largest contribution in the transport sector
in the US than in the EU-countries. The obtained results are
mostly explained by possibly omitted complementary investments
that allow to exploit the full productivity effect from IT and time
lags required for IT benefits to show up.
One recent study investigated the impact of IT on productivity in
the transport industry in Finland [1]. A PESTEL (political,
economic, social, technological, environmental and legal) analysis
demonstrated that while Finland was in the front line of IT use,
digitalization and productivity have weak correlation and
investments in IT did not improve productivity in the transport
sector as expected. There are a few explanations of the obtained
results. One is that the transport industry is under-represented in
the government agenda. Second, is that while governmental
agencies respond to digitalization from techno-economical
perspective, the social challenges should be more addressed in
national policies. Third, the existence of other factors besides IT
that can have a stronger influence on productivity of the industry.
Fourth, the full potential of IT is underutilized in terms of
productivity. As a conclusion, it is proposed to use multi-
disciplinary approach in order to understand the transport industry
as a meta-system.
While previous studies investigated the impact of IT on
productivity measures, including gross value added, total factor
productivity, and labour productivity, the impact of IT on energy
efficiency and CO2 emission reduction in the transport industry of
EU-27 member states was investigated in the report
commissioned by European Commission [18]. The study used a
phase-by-phase approach, meaning that first, available and most
promising IT systems for CO2 reduction were selected, then CO2
models were assessed and finally, IT systems and CO2 models
were synthesized and ranked. The results demonstrate that among
50 chosen IT systems, Eco-driver Coaching (15% potential CO2
97
effect) and Eco-driver Assistance (10% potential CO2 effect) are
shown to be the most important IT systems for CO2 emission
reduction.
An industry-level analysis were done both from the US and EU
countries together with surveys, case studies, observations and
documents. Regarded jointly, the following key insights can be
synthesized from the aforementioned industry-level studies.
Insight 1: In the US, the effect of IT on productivity in the
transport and logistics industry is more visible than in Europe due
to higher IT-capital deepening and advanced managerial practices.
Insight 2: Most of the industry-level studies recognize
mismeasurement hypothesis of the productivity paradox existence
[19], meaning that IT investment as a measure can hide actual IT
impact, pointing to a more detailed conceptualization of IT. They
also acknowledge time lag hypothesis of the productivity paradox
existence, meaning that productivity gains from IT use require
time to show up (ibid.).
Insight 3: Most of the industry-level studies highlight the
importance of other factor that can affect IT-productivity
relations, including firm size and complementarities for
productive IT use [20]. Particularly, investments in labour skills
are shown to be complementary to investments in IT.
Insight 4: Most of the industry-level studies call for the detailed
investigation of firm-level data to better understand managerial
practices of productive IT use.
Overall, the role of IT for productivity improvement in road
freight transportation and logistics is well recognized [6].
Moreover, there is evidence that many transport companies
heavily invest in new IT [3]. However, our literature review in the
transport and logistics industry demonstrates that uptake of IT
advances in the EU countries has been considerably slow in
comparison to the US. These results support previous studies at
the level of different industries that concluded that the effect of IT
on productivity in Europe is less visible than in the US [21]. The
discussion among the main productivity paradox hypotheses’
existence, including mismeasurement and time lag [19] highlight
the complexity of this research topic. The empirical findings also
highlight that large transport companies use IT on the same level
both in the US and EU countries [16], yet productivity gains
differ between these countries, meaning that productivity can be
affected by the way IT are used. Therefore, in the next section we
review studies at the firm level within the transport and logistics
industry to highlight key insights from this level of economic
analysis.
3.2 Firm and operational level studies The first stream of studies explores how the use of IT can increase
fuel efficiency and reduce CO2 emission. The second stream
investigates how the use of IT can improve capacity utilization
and occupancy rate. Although some studies are oriented towards
one of the streams, they also recognize that transport efficiency is
simultaneously linked to the reduction of environmentally
negative effects [22], [23]. Below, we review both streams of
research in more detail.
3.2.1 IT, fuel efficiency and CO2 emission reduction At the industry level, the European Commission has recently
conducted a study on the impact of IT on energy efficiency in
road transport [18], which showed that Advanced Driver
Assistance Systems, including Eco-driver Coaching and Eco-
driver Assistance have the greatest potential in reduction of
energy consumption and CO2 emission. The main shortcomings
of the study were noticed by Wang et al. [24] who concluded that
the study is generic in its nature with a focus on general transport
IT system rather than freight specific IT systems. Yet, freight
transportation is one of the main contributors to CO2 emission in
transportation [25].
In a literature review on IT for logistics and freight transportation
conducted by Perego et al. [2] only one study has been mentioned
potential environmental benefits from IT use [11]. Yet, by
conducting literature review in green logistics McKinnon [25]
also highlighted that using telematics and Computerised Vehicle
Routing and Scheduling can help organizations to define the most
fuel-efficient route and therefore improve fuel efficiency. At the
firm level, over the last decades, there exist a number of studies
that provide some empirical evidence on the impact of freight
specific IT system on fuel efficiency and CO2 emission reduction.
An overview of these studies is provided below.
In one of the studies 79 German trucking companies were
surveyed about the impact of using telematics and computer-aided
disposition system on fuel efficiency [26]. In general, the study
demonstrated that 2.4% of the driven kilometres were reduced due
to planning of operations through improved information and thus
reduced fuel consumption. Another survey showed that the
introduction of IT-based scheduling systems or a telematics
application for data communication, positioning and navigation
led to distinct CO2 reduction [27]. Thus, both studies
demonstrated that available telematics IT systems and IT-based
scheduling systems have a great potential in increasing fuel
efficiency and CO2 emission reduction.
Besides, Baumgartner et al [23] also surveyed experts from 10
road freight transport companies 10 leading software and
hardware manufacturers to understand how available IT systems
can be improved to positively affect the utilization of trucks and
CO2 efficiency. From trucking companies point of view, it is
concluded that the introduction of semi-automated route
optimization computerized routing and scheduling system, on-
board monitoring computers, monitoring loading space utilization
of vehicles positively affect fuel efficiency. However, experts
from trucking companies claim that on-board monitoring data
have to be simplified so that to not overwhelm operators.
In one of the recent studies Wang et al. [24] conducted a multiple
case study among three leading retailers in the UK to understand
the role of IT in CO2 emission reduction. ITs in freight
transportation were classified in four levels, including vehicle and
load, company, supply chain, and network (multiple supply
chains) levels. In general, the results demonstrate ITs have a direct
impact on mileage savings and, therefore, to reduction of CO2
emission through accurate and auditable data. In particular, the
study demonstrated that IT mostly contribute to improved energy
efficiency at vehicle level, better scheduling at company level and
collaborative transport arrangements at supply chain and network
levels. It is also shown that electronic exchange with suppliers
also brought considerable miles of savings.
98
In another recent study investigated how a smart phone freight
application software service (Apps) affect CO2 emission
reduction in road freight transport with a particular focus on
Chinese market [28]. The study demonstrated that freight apps
based on mobile Internet through a mechanism that match the
consignor’s demand and the carrier’s supply provide the efficient
way to find right truck and organize the delivery process that
decrease empty travel distances and thus improve average vehicle
loaded, fuel efficiency and CO2 emission reduction.
Summarizing the aforementioned studies, important research has
been done on the effect of IT on fuel efficiency and CO2 emission
reduction in road freight transportation. These studies show that
the role of IT in environmental stability has received special
attention among researchers over the last decades. Although
several authors use the term IT [23], [24], [27], [28], there is a
diversity in terms of conceptualization adopted. Some, for
example Leonardi and Baumgartner [27] conceptualise IT as IT-
based scheduling systems with telematics application for data
communication, positioning and navigation, while other use
intention to continuously use bypass system [29] or a smart phone
freight application software service [28]. Therefore, in respect to
terminologies used to conceptualize IT construct the following
insight can be made:
Insight 5: Current studies are characterized by diversity in the use
of terminologies when referring to IT and investigating the impact
of IT on fuel efficiency. While the studies provide unique
evidence on how IT can affect fuel efficiency and CO2 emission
reduction, this diversity in conceptualization makes the results
difficult to compare.
Therefore, more replicative studies could provide us with
supporting or contradictory evidence regarding the impact of
particular IT on fuel efficiency and CO2 emission reduction.
Earlier studies mostly relied on survey technique in data
collection [23], [26], [27]. Recently, studies try to address the
impact of IT on environmental sustainability based on case studies
[24], [28] meaning that the investigated phenomenon is complex
and require in-depth investigation. Moreover, it was mentioned
that limited financial resources are the main reason for not using
advanced IT systems for fuel consumption and CO2 emission
reduction [24]. Therefore, the next insight can be formulated as
follows:
Insight 6: More empirical evidence is required, particularly from
case studies to understand how exactly the use of current IT can
affect fuel efficiency and CO2 emission reduction.
3.2.2 IT, vehicle utilization and load efficiency The academic literature pays particular attention to the use of IT
and improvement of the fleet in terms of capacity utilization,
occupancy rate and empty running [12], [22], [30]. These studies
are mostly driven by the need to understand how to deploy
available assets (particularly IT) as efficiently as possible. In
general, surveys conducted over the last decades demonstrate that
advanced IT systems and applications in road freight
transportation have positive and significant effect on load
efficiency, yet some insights from the reviewed studies lay a
foundation for future research agenda.
The first study that found significant productivity improvement
from IT use was work by Hubbard [12] who examined the effect
of advanced on-board computers that provided real-time
information on a truck’s location and load status on capacity
utilization of trucks in the US. The results of the survey
demonstrate that advanced on-board computers have increased
capacity utilization (truck’s annual number of loaded miles driven
with cargo on board) among adopting trucks by 13% and thus
increased the industry’s overall capacity utilization rate by 3%.
In another study, a qualitative survey has been conducted among
49 UK general haulage operators (Davies et al., 2007). The results
demonstrate that available IT applications for road freight
companies, including vehicle routing and scheduling, financial
and contact management, vehicle tracking and tracing, telematics,
and internet applications significantly reduced empty running and,
thus positively affected general haulage of freight transport
companies.
The work by Barla, et al. [30] reported that quite a significant
number of trucks are travelling on major Canadian highways
empty or not fully loaded. By using quite an extensive data set,
the study concluded that the use of Electronic Vehicle
Management System increased load factor on backhaul trips by 16
percentage points and energy efficiency by about 5%. These
results are similar to the study by Hubbard (2003) showing that IT
use in trucks improves the number of loaded kilometres driven
and the load factor.
The study by Kapros et al. [31] investigated the impact of fleet
and freight management applications on the average occupancy
rate of vehicles among 98 haulage companies, including
producers, commercial companies and forwarders/third party
logistics providers. The results of the survey show that IT use
increase the average occupancy rate of vehicles by 5.2 % and
therefore have positive affect on load factor and fleet productivity.
Thus, the results of this study are in line with previous empirical
evidence that IT use has positive and significant impact on load
factor and logistics efficiency.
Therefore, there is now quite well-developed micro-evidence that
IT use is likely to affect load efficiency positively in
transportation. However, all studies mostly applied survey
technique for data collect which has been previously criticized for
respondent bias and low confidence in the results [32]. Moreover,
time lags after IT implementation are often reported for
productivity benefits to emerge [12], [33]. Thus, both longitudinal
studies can bring new evidence on how IT use can affect vehicle
utilization and load efficiency.
Insight 7: The reviewed studies applied survey methodology to
understand the effect of IT on load efficiency in transportation.
Longitudinal field studies can bring new insights in real data and
realized benefits from IT use.
Moreover, the surveys reported above highlight that besides IT,
there are other not less important factors that may affect
productivity in transportation such as incentives [12] and new
ways of working [22], yet do not provide detailed insights into
them. At the same time, road freight transportation is an important
sector in developing countries [34]. Thus, evidence about these
factors and best practices is required and can be particularly
beneficial for developing countries.
Insight 8: In contrast to the industry level studies, most of studies
demonstrate positive relationships between IT use and load
efficiency at micro level. Yet, these studies recognize that beside
IT other factors and organizational practices can have particular 99

effect on IT-enabled productivity and, thus, deserve special
attention.
To the best of our knowledge there is only one study that reported
that effective use of IT requires the implementation of a range of
complementary factors in the transportation company [35].
Particularly, the study emphasizes that productivity success comes
from a set of interdependent driving forces, which are linked to
organizational factors such as the culture and structure of the
company, and also to the formulation of a strategy of excellence.
General IT-productivity literature also demonstrates that currently
there is a noticeable shift towards complementarities of productive
IT use [20]. Thus, this research area is of growing importance and
thus present a promising avenue for future research.
3.3 Individual Level Studies Over the last decade, a number of studies began to focus on
individual IT-enabled productivity in freight transport and
logistics. These studies approach this level of investigation in
different empirical settings and with different methodologies.
Over the last decades, experimenters in organization psychology
conducted a number of studies to investigate the impact of
wireless technology on individual productivity of warehouse
workers, including forklift drivers [36]-[39]. These studies
consider technology as a mean of delivering immediate feedback
and providing proximal goals on individual productivity and
quality. Technological advances were represented by wireless
hand-held technology [36], voice headset [37], [38] or vehicle
mounted computers [39]-[41]. These wireless technologies
allowed employees to receive immediate feedback and proximal
goals auditory or visually. In general, the aforementioned studies
demonstrate that ergonomic functionality of current technologies
as well as technology-based feedback can play an important role
for productivity of drivers. Below, these studies are reviewed in
detail.
In a study by Goomas and Ludwig [36], drivers operating a stock
truck received wireless handheld computers with instructions of
how to perform work and how much time a unit of work should
take to complete. Once a unit of work has been performed, an
actual time was displayed on the screen. As a results of
management tactics of proximal goals, immediate performance
feedback, and contingent rewards in conjunction with handheld
wireless technology increased productivity of drivers operating a
stock truck by 24% compared to the baseline. Proximal goals and
immediate feedback added contingencies to a pre-existing
performance-based incentive program (financial incentives and
disincentives) and therefore increased productivity.
In another study, the impact of a wireless voice-interaction
technology (a voice assisted selecting tool) on individual
productivity of fork-lift drivers compared to previously used
handheld scanning technology and the paper-based method
(baseline) was investigated [37]. In general, productivity
(departmental average units = total units selected/total hours the
department was active for the day) increased by 17% compared to
previous handheld scanning technology and the baseline
condition. However, the implementation of voice technology was
associated with an initial decrease in productivity due to the
training, yet the learning curve was smooth (1 day). Selection
accuracy remained the same for voice and handheld technology,
yet was significantly higher in comparison to the paper-based
method. Therefore, the study demonstrates that ergonomic
functionality, particularly verbal interface compared to manual
can play an important role for productivity improvement. Yet, the
trade-off between productivity and accuracy deserves special
attention from researchers and practitioners.
A wireless voice-interaction technology was implemented to
reduce a number of incidents and misspicks of fork-lift drivers in
a foodservice distributor [38]. In general, the results demonstrate
that a voice-interaction technology decreased the number of
selection errors by 62% compared to the paper selection system.
Immediate feedback by voice made a greater impact on employees
with initial low level of performance. For example, error rates
among the lowest performers dropped from 10.17 per 1000 cases
to 2.04 per 1000 cases after the implementation of a wireless
voice-interaction technology.
The impact of visual-directed employee aid on wireless vehicle-
mounted computers on individual productivity of fork-lift drivers
was investigated in a study by Ludwig and Goomas [39]. In the
first intervention phase of the experiment, when proximal goal
times and immediate performance feedback on wireless vehicle-
mounted computers were available, productivity of fork-lift
drivers did not increase significantly. In the second intervention
phase, when managers announced that new engineering labour
standards (standard time versus actual time) being linked to
disciplinary measures will be introduced, productivity of forklift
drivers was improved by 2.14 pallets per hour. Thus, the study
demonstrates that the introduction on technology that provide
immediate feedback and proximal goals has to be introduced
together with new engineering labour standards that take into
account working conditions in order to increase individual
productivity. Therefore, complementarities are recognized being
important in relation to technology use for productivity increase.
The impact of wireless vehicle-mounted computers that included
auditory and visual feedback and data delivery on individual
productivity of fork-lift drivers in comparison to the visual
inspection procedure in distribution centres was investigated [40].
In general, the results of the experiment demonstrate that the
intervention decreased error percent by 97% and therefore
enabled much more accurate work. Yet, some pallets were loaded
out of sequence that was not anticipated by the experimenter. This
was explained that some workers occasionally skipped the
intervention when were in a hurry to finish their shifts. As a
solution, it was proposed to use incentives where employees
would be rewarded for using the intervention.
In a study by Goomas [41], the warehouse management system
was interfaced with the light system and computerized visual
feedback in the form of flashing lights was provided for order
selectors. In comparison, to paper pick lists of storage location
and quantity ordered, computerized visual feedback increased
departmental average units by 21.8% and decreased line errors by
94%. This experiment is a trivial example of how technologies
can be better that the use of paper in conducting work large
industrial settings. Yet, while the experiment demonstrated that
flashing lights can positively affect productivity, the costs
associated with flashing light deployment caused the intervention
being abandoned.
In general, the studies reviewed above demonstrate that current
technology as a mean of delivering immediate feedback and
providing proximal goals on individual productivity and quality
100

can be important for individual productivity in industrial settings.
Besides, drivers, operation a stock truck and forklifts, the results
also demonstrate that wireless technology, which allowed
immediate auditory and visual feedback, can increase audit
productivity by nearly 89% [40]. Yet, two important insights from
this literature can be fundamental for future research:
Insight 9: Field experiments are mostly characterized by two-
phase design, small sample size and short time of the intervention
phase.
Future research can take into account shortcomings of previous
studies and address them in the future research. First, most of the
studies have had two-phase experimental design [38], [40], [41]
that does not permit to systematically asses the treatment
condition and should be supported by more powerful
experimental design. Second, most of the experiments are
characterized by small sample size, including 23 participants in a
study by Ludwig and Goomas [37], 12 participants in a study by
Ludwig and Goomas [39] and 16 participants in a study by
Goomas [41] that can threaten generalizability of the obtained
results. Third, the studies were conducted during relatively short
period of time, for example 6 weeks of baseline and 8 weeks of
the intervention phase [38], or 5 weeks of baseline and 10 week of
the intervention phase [41]. This limitation could be addressed by
longitudinal field experiments to demonstrate the impact of
technologies on individual productivity of warehouse workers.
Insight 10: Some studies recognize the importance of incentives
and training together with the introduction of a new digital
technology in relation to productivity, yet do not conceptualize
them as complementarities.
While some studies recognize the importance of incentives and
training that can together with the use of more advanced
technologies positive affect individual productivity [37]-[41],
complementarity theory [42] as such is not applied to investigate
their impact. This theoretical foundation can further be explored
in field experiments that are proposed to be a feasible empirical
test to study them [20].
Overall, the reviewed studies show that ergonomic functionality
of technologies, data delivery and performance monitoring can
play an important role in relation to individual productivity and
quality in distribution centres and warehouses. Yet, most of them
adopt quite trivial comparison between paper-based and
technology-based work and show the importance of the latest.
While industrial settings are characterised widely by the use of
electronic tools and technologies, more studies are required to
demonstrate how exactly these technologies can be used to make
workers more productive. As a future research direction, we
propose to shift research attention to complementarities of
productive IT use with the use of longitudinal experimental
studies. This might bring not only individual productivity
increase, but also affect speed control, fuel cost, workflow, and
business results in general.
4. Discussion and Conclusions This paper is the first attempt to synthesize research in the area of
IT-productivity in the operations and maintenance in road freight
transport and logistics. Our literature review revealed that even
though the impact of IT on productivity is one of the key concern
both for automotive manufacturers and their customers, very
limited evidence is collected in academic literature about this
phenomenon. Twenty-six papers were identified and reviewed
that address this topic explicitly.
Although the relationship between IT and productivity is an
important topic in general, our literature review showed that in
road freight transport and logistics there is a limited empirical
evidence about this area in particular. We were able to collect and
allocate studies based on three economic levels, including
industry, firm and individual. At industry level, the identified
studies demonstrate that in contrast to the US, in the EU-countries
it was difficult to find a positive relationship between IT and
productivity. Therefore, future research could address this gap and
explore this relationship among EU-member countries in detail.
Particularly, successful practices from leading countries could be
adopted by other countries with the aim to increase productivity
from IT.
Another issue that has emerged from our literature review is about
the concept of IT. For example, at the industry level, most of the
studies measure this concept as investments in IT capital. At the
firm and individual level the concept of IT is also often black-
boxed. Often the pre and post IT implementation scenarios are
used. Quite often the reviewed studies also provide taxonomy of
IT applications used in freight transportation and position the
studies based on one or a number of applications used. Yet, there
is still no accumulation of knowledge base, for example, on one
particular application. More research is required on the use of the
concept of IT in road freight transportation to make the concept
less ambiguous and fuzzy.
Our review revealed that at the firm and operational level survey
is the mostly used methodological approach to collect data.
Recently, in-depth multiple case study approach has been applied
to investigate the impact of IT on productivity in road freight
transport companies. This type of studies in its infancy, yet is a
promising research direction to collect unique empirical evidence.
This methodological approach also becomes more popular at the
individual level of analysis. The main limitation of the survey
approach is that it provides evidence of potential productivity
benefits from IT use and very rare real benefits. Our literature
review, in general, demonstrates that there is a lack of evidence on
realized productivity benefits. Thus, future research could address
this gap by conducting longitudinal field experimental studies to
provide control over empirical settings and at the same time to
collect essential data over a long-time period.
General economic literature demonstrates that the use of IT in a
productive way requires certain organizational and managerial
changes. The literature in road freight transportation and logistics
is silent about these changes. There is only one study that
emphasizes the importance of organizational factors in the
transportation company, including its culture, strategy and
structure in relation to IT use in a more productive way [35].
Thus, very little is known about factors and the context that
complement IT use and thus affect productivity positively. This
can be a promising research direction at the firm and individual
levels of investigation, since little evidence exists about IT
complementary factors and also factors that prevent productive IT
use.
Therefore, our paper presents the following contributions. First,
we offer valuable insights to academia as there has been a lack of
a comprehensive and up-to-date overview of IT-productivity with
a particular focus on operations and maintenance in road freight
101

transportation and logistics. Second, our analysis of studies at
different economic levels will allow researchers to explore further
how emerging technologies can be used in a more productive way.
Third, our analysis of previous studies on IT-productivity
relationships demonstrate that researcher mostly tried to test
already established theories, yet new IT-enabled services require
another theoretical and empirical approach, which is less explored
nowadays. Finally, our research is also beneficial to practitioners
from automotive, hardware and software manufacturing and
transport industries providing recommendations and guidance for
the management of existing and emerging technologies.
This study has also potential limitations that should be noted.
First, although we made an attempt to be all-inclusive, some
papers were omitted from the review. Nonetheless, this literature
review offers a presentation of important research in IT-
productivity relationships in the operations and maintenance in
transport and logistics. The review method adopted based on
industry, firm and individual level of economy is particularly
significant as it provides knowledge on all three levels that is in
line with general IT-productivity relationship studies.
5. REFERENCES [1] Brynjolfsson, E., & Brown, P. (2005). VII pillars of IT
productivity. Optimize, 4(5), 26-35.
[2] Perego, A., Perotti, S., & Mangiaracina, R. (2011). ICT for
logistics and freight transportation: a literature review and
research agenda. International Journal of Physical
Distribution & Logistics Management, 41(5), 457-483.
[3] Harris, I., Wang, Y., & Wang, H. (2015). ICT in multimodal
transport and technological trends: Unleashing potential for
the future. International Journal of Production
Economics, 159, 88-103.
[4] Alam, A., Besselink, B., Turri, V., Martensson, J., &
Johansson, K. H. (2015). Heavy-duty vehicle platooning for
sustainable freight transportation: A cooperative method to
enhance safety and efficiency. IEEE Control Systems, 35(6),
34-56.
[5] Nguyen, H. O. (2013). Critical factors in e-business adoption:
Evidence from Australian transport and logistics companies.
International Journal of Production Economics, 146(1), 300-
312.
[6] Evangelista, P. (2014). Environmental sustainability practices
in the transport and logistics service industry: An exploratory
case study investigation. Research in Transportation Business
& Management, 12, 63-72.
[7] Evangelista, P. and Sweeney, E. (2014) ‘Information and
communication technology adoption in the Italian road freight
haulage industry’, Int. J. Logistics Systems and Management,
Vol. 19, No. 3, pp.261–282.
[8] Friedrich, R., Gröne, F., Koster, A., & Le Merle, M. (2011).
Measuring industry digitization: Leaders and laggards in the
digital economy. Booz & Co., December, 13.
[9] EC (2008). ICT and e-Business Impact in the Transport and
Logistics Services Industry. EC study report No. 05/2008.
[10] Mangiaracina, R., Perego, A., Salvadori, G., & Tumino, A.
(2017). A comprehensive view of intelligent transport
systems for urban smart mobility. International Journal of
Logistics Research and Applications, 20(1), 39-52.
[11] Button, K., Doyle, E., & Stough, R. (2001). Intelligent
transport systems in commercial fleet management: a study
of short term economic benefits. Transportation Planning
and Technology, 24(2), 155-170.
[12] Hubbard, T. N. (2003). Information, decisions, and
productivity: On-board computers and capacity utilization in
trucking. The American Economic Review, 93(4), 1328-
1353.
[13] Biagi, F. (2013). ICT and Productivity: A Review of the
Literature. JRC Institute for Prospective Technological
Studies, Digital Economy Working Paper, 9.
[14] Arvanitis, S., & Loukis, E. N. (2009). Information and
communication technologies, human capital, workplace
organization and labor productivity: A comparative study
based on firm-level data for Greece and Switzerland.
Information Economics and Policy, 21(1), 43-61.
[15] Hu, Q. and Quan, J. (2005). Evaluating the impact of IT
investments on productivity: a causal analysis at industry
level. International Journal of Information
Management, 25(1), 39-53.
[16] e-Business Watch, 2008. The European e-Business Report -
The Impact of ICT and e-Business on Firms, Sectors and the
Economy, 6th Synthesis Report of the Sectoral e-Business
Watch, DG Enterprise & Industry, European Commission.
[17] Strauss, H., & Samkharadze, B. (2011). ICT capital and
productivity growth. EIB Papers Volume 16, Luxembourg,
2011. No 2.
[18] Klunder, G.A. , K., Mak, J., Wilmink, I.R., Schirokoff,
A., Sihvola, N., Holmén, C., Berger, A., de Lange,
R., Roeterdink, W. and Kosmatopoulos, E. (2009), “Impact
of information and communication technologies on energy
efficiency in road transport”, a report commissioned by
European Commission, Delft, available
at: http://ec.europa.eu/information_society/activities/esafety/
doc/studies/energy/energy_eff_study_final.pdf.
[19] Brynjolfsson, E., 1993. The productivity paradox of
information technology. Communications of the
ACM, 36(12), pp.66-77.
[20] Brynjolfsson, E. and Milgrom, P., 2013. Complementarity in
organizations. The handbook of organizational economics,
pp.11-55.Cardona, M., Kretschmer, T., & Strobel, T. (2013).
ICT and productivity: conclusions from the empirical
literature. Information Economics and Policy, 25(3), 109-
125
[21] Cardona, M., Kretschmer, T., & Strobel, T. (2013). ICT and
productivity: conclusions from the empirical
literature. Information Economics and Policy, 25(3), 109-
125.
[22] Davies I., Mason R. and Lalwani C. (2006). Assessing the
impact of ICT on UK general haulage companies‟,
International Journal of Production Economics, 106, 12-27
[23] Baumgartner, M., Léonardi, J., & Krusch, O. (2008).
Improving computerized routing and scheduling and vehicle 102
telematics: a qualitative survey. Transportation Research
Part D: Transport and Environment, 13(6), 377-382.
[24] Wang, Y., Sanchez Rodrigues, V., & Evans, L. (2015). The
use of ICT in road freight transport for CO2 reduction–an
exploratory study of UK’s grocery retail industry. The
International Journal of Logistics Management, 26(1), 2-29.
[25] McKinnon, A.C. (2010), “Environmental sustainability: a
new priority for logistics managers”, in McKinnon,
A.C., Cullinane, S., Browne, M. and Whiteing,
A. (Eds), Green Logistics – Improving the Environmental
Sustainability of Logistics, Kogan Page, London, pp. 3-22.
[26] Baumgartner, M., Leonardi, J. (2004). Optimierte
Disposition und Telematik steigern Effizienz im deutschen
SGV, Internationales Verkehrswesen 56 (5),197–201.
[27] Leonardi, J. & Baumgartner, M. (2004). CO2 efficiency in
road freight transportation: status quo, measures and
potential, Transportation Research Part D: Transport and
Environment 9 (6), 451–464.
[28] Li, Y. and Yu, Y., 2017. The use of freight apps in road
freight transport for CO 2 reduction. European Transport
Research Review, 9(3), p.36.
[29] Marett, K., Otondo, R. F., & Taylor, G. S. (2013). Assessing
the Effects of Benefits and Institutional Influences on the
Continued Use of Environmentally Munificent Bypass
Systems in Long-Haul Trucking. MIS Quarterly, 37(4),
1301–1312.
[30] Barla, P., Bolduc, D., Boucher, N. and Watters, J., 2010.
Information technology and efficiency in trucking. Canadian
Journal of Economics/Revue canadienne
d'économique, 43(1), pp.254-279.
[31] Karpos, S., Polydoropoulou, A., & Antonopoulou, M.
(2010). Impact of Information and Communication
Technologies on Freight Transport and Logistics.
In Proceedings of the 12th World Conference of Transport
Research (WCTR), Lisbon, Portugal, Ιούλιος.
[32] Podsakoff, P. M., MacKenzie, S. B., Lee, J. Y., & Podsakoff,
N. P. (2003). Common method biases in behavioral research:
A critical review of the literature and recommended
remedies. Journal of Applied Psychology, 88(5), 879.
[33] Castellani, D., Piva, M., Schubert, T., & Vivarelli, M.
(2016). R&D and Productivity in the US and the EU:
Sectoral Specificities and Differences in the Crisis. Papers in
Innovation Studies, 15.
[34] Timilsina, G. R., & Shrestha, A. (2009). Transport sector CO
2 emissions growth in Asia: underlying factors and policy
options. Energy Policy, 37(11), 4523-4539.
[35] Hughes, A., & Morton, M. S. S. (2005). ICT and
productivity growth-the paradox resolved?.
[36] Goomas, D. T., & Ludwig, T. D. (2007). Enhancing
incentive programs with proximal goals and immediate
feedback: Engineered labor standards and technology
enhancements in stocker replenishment. Journal of
Organizational Behavior Management, 27(1), 33–68.
[37] Ludwig, T. D., & Goomas, D. T. (2007). Performance,
accuracy, data delivery, and feedback methods in order
selection: A comparison of voice, handheld and paper
technologies. Journal of Organizational Behavior
Management, 27(1), 69–107.
[38] Berger, S. M., & Ludwig, T. D. (2007). Voice assisted
technology providing immediate feedback to reduce
employee errors. Journal of Organizational Behavior
Management, 27(1), 1–31.
[39] Ludwig, T. D. & Goomas, D. T. (2009). Real-time
performance monitoring, goal- setting, and feedback for
forklift drivers in a distribution center. Journal of
Occupational and Organizational Psychology, 82, 391–403.
[40] Goomas, D. T. (2012). The impact of wireless technology on
order selection audits at an auto-parts distribution center.
Journal of Organizational Behavior Management, 32, 131–
139.
[41] Goomas, D. T. (2013) The Effects of Computerized Visual
Feedback Using Flashing Lights on Order Selection in Large
Industrial Settings: Productivity, Accuracy, and Cost
Justifications, Journal of Organizational Behavior
Management, 33:3, 209-220.
[42] Milgrom, P. and Roberts, J., 1995. Complementarities and fit
strategy, structure, and organizational change in
manufacturing. Journal of accounting and economics, 19(2-
3), pp.179-208
103

Data connectivity challenges for eMaintenance-oriented Digital Twins *
* paper associated to poster presentation, not peer-reviewed
Johnny Asber [email protected]
Miguel Castaño Arranz eMaintenance group
Div. of Operation and Maintenance Luleå University of Technology
ABSTRACT This paper discusses challenges which need to be addressed by the
maintenance community such as availability of Big Data
solutions, data connectivity and efficient enterprise
communications. Addressing such challenges will increase
enterprise revenue due to improved availability and reliability.
Keywords E-Maintenance, Industry 4.0, Digital twin, Self-developed products, Self-developed maintenance teams, A whole set of wisdom
1. INTRODUCTION The current Industry revolution Industry 4.0 is characterized by a
high level of digitalization and access to information. Pervasive
computing and data are transformative technologies which are
shaping the future industry. In this context the concept of
eMaintenance raises as important, where the traditional “run to
failure” approaches are gradually being substituted by predictive
maintenance.
This digital transformation leads to improved connectivity within
enterprises, where facilities and employees are able
to communicate across different layers of the organization. It is
paramount to grab this opportunity given by Industry 4.0 and
transform maintenance solutions in order to achieve e.g. increased
useful life of the assets and performance in terms of Reliability,
Availability, Maintainability and Safety (RAMS).
An emerging technology to be discussed in this paper is the
Digital Twin, which is currently at the peak of Gartner Hype
Cycle and therefore holds large expectations from industry
stakeholders.
This paper is structured as follows. Section 2 defines
eMaintenance technologies and discuss the current Industry
revolution, which triggered the digitalization and enabling
environment for E-Maintenance. Section 3 discusses data
connectivity challenges in industry. Section 4 discusses
advantages of Digital Twins for maintenance purposes. Section 5
discusses data connectivity challenges in particular relation to
digital twins. Finally, Conclusions are given in Section 6.
2. Background
2.1 Industry 4.0 The first three industrial revolutions where the result of
mechanisation, electricity and IT respectively (see [1]), whilst the
current Industrial Revolution 4.0 results from boosted
digitalization.
The current Industrial Revolution Industry 4.0 is a vision
sponsored by the German government in relation to advanced
manufacturing (see [2]). Industry 4.0 is characterized by the
introduction in the manufacturing environment of: Internet of
Things (IoT), Cyber Physical Systems (CPS), Information and
Communication Technology (ICT), Enterprise Architecture (EA)
and Enterprise Integration (EI) (see [3]).
An industry composed by interconnected machines which learn
from each other and make correct decisions is envisioned in
Industry 4.0. As stated in [4]: “New technologies, especially
information technology and information techniques, organization
and logistics are implemented in modern business a system, which
has led to new ways of production, new ways of doing business
and better service activities in the sphere of industrial
production.” Any smart factory consists of the following major
parts to ensure its performance machine sensors, machine to
machine connections, factory connection to back office and
factory to factory connection.
2.2 eMaintenance The term eMaintenance has appeared in the early of 2000. This
new term was a result of the emerged e-technologies. These
technologies have imposed “a new way of thinking” about
maintenance, considering openness, integration and collaboration
with other services of the e-enterprise (see [5]).
Many are the emerging technologies from which eMaintenance
benefits, such as cloud computing, Data and Information Fusion,
Cyber physical systems, Artificial Intelligence, Industrial Internet
of Things (IoT), Databases, Computerized Maintenance
Management System (CMMS), Digital Twins, Prognostics and
Health Management (PHM), Information and Communication
Technologies (ICT), Condition Monitoring and Digitalization in
Industry 4.0 (see [4]).
It is worth to mention also that the concept of E-Maintenance has
built its progression based upon many existed maintenance
concepts, such as RCM (reliability-centered maintenance), TPM
(total productive maintenance), BCM (business-centered
104
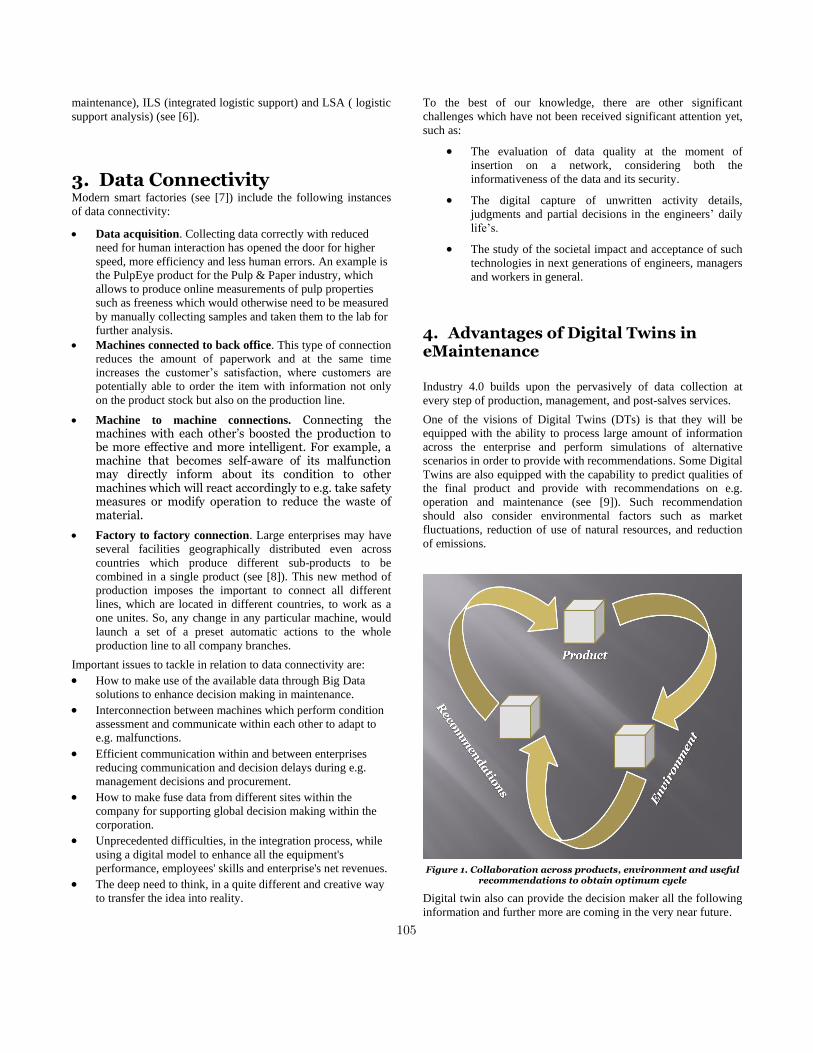
maintenance), ILS (integrated logistic support) and LSA ( logistic
support analysis) (see [6]).
3. Data Connectivity Modern smart factories (see [7]) include the following instances
of data connectivity:
• Data acquisition. Collecting data correctly with reduced
need for human interaction has opened the door for higher
speed, more efficiency and less human errors. An example is
the PulpEye product for the Pulp & Paper industry, which
allows to produce online measurements of pulp properties
such as freeness which would otherwise need to be measured
by manually collecting samples and taken them to the lab for
further analysis.
• Machines connected to back office. This type of connection
reduces the amount of paperwork and at the same time
increases the customer’s satisfaction, where customers are
potentially able to order the item with information not only
on the product stock but also on the production line.
• Machine to machine connections. Connecting the machines with each other’s boosted the production to be more effective and more intelligent. For example, a machine that becomes self-aware of its malfunction may directly inform about its condition to other machines which will react accordingly to e.g. take safety measures or modify operation to reduce the waste of material.
• Factory to factory connection. Large enterprises may have
several facilities geographically distributed even across
countries which produce different sub-products to be
combined in a single product (see [8]). This new method of
production imposes the important to connect all different
lines, which are located in different countries, to work as a
one unites. So, any change in any particular machine, would
launch a set of a preset automatic actions to the whole
production line to all company branches.
Important issues to tackle in relation to data connectivity are:
• How to make use of the available data through Big Data
solutions to enhance decision making in maintenance.
• Interconnection between machines which perform condition
assessment and communicate within each other to adapt to
e.g. malfunctions.
• Efficient communication within and between enterprises
reducing communication and decision delays during e.g.
management decisions and procurement.
• How to make fuse data from different sites within the
company for supporting global decision making within the
corporation.
• Unprecedented difficulties, in the integration process, while
using a digital model to enhance all the equipment's
performance, employees' skills and enterprise's net revenues.
• The deep need to think, in a quite different and creative way
to transfer the idea into reality.
To the best of our knowledge, there are other significant
challenges which have not been received significant attention yet,
such as:
• The evaluation of data quality at the moment of
insertion on a network, considering both the
informativeness of the data and its security.
• The digital capture of unwritten activity details,
judgments and partial decisions in the engineers’ daily
life’s.
• The study of the societal impact and acceptance of such
technologies in next generations of engineers, managers
and workers in general.
4. Advantages of Digital Twins in eMaintenance
Industry 4.0 builds upon the pervasively of data collection at
every step of production, management, and post-salves services.
One of the visions of Digital Twins (DTs) is that they will be
equipped with the ability to process large amount of information
across the enterprise and perform simulations of alternative
scenarios in order to provide with recommendations. Some Digital
Twins are also equipped with the capability to predict qualities of
the final product and provide with recommendations on e.g.
operation and maintenance (see [9]). Such recommendation
should also consider environmental factors such as market
fluctuations, reduction of use of natural resources, and reduction
of emissions.
Figure 1. Collaboration across products, environment and useful recommendations to obtain optimum cycle
Digital twin also can provide the decision maker all the following
information and further more are coming in the very near future.
105
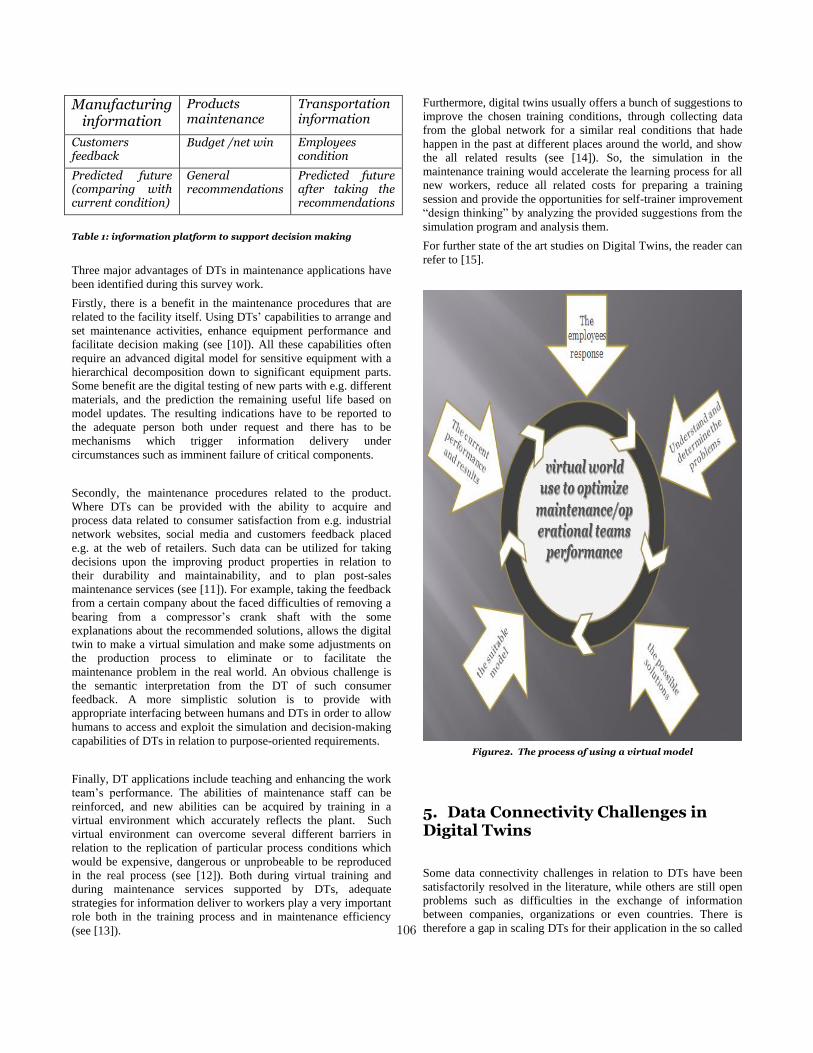
Manufacturing information
Products maintenance
Transportation information
Customers feedback
Budget /net win Employees condition
Predicted future (comparing with current condition)
General recommendations
Predicted future after taking the recommendations
Table 1: information platform to support decision making
Three major advantages of DTs in maintenance applications have
been identified during this survey work.
Firstly, there is a benefit in the maintenance procedures that are
related to the facility itself. Using DTs’ capabilities to arrange and
set maintenance activities, enhance equipment performance and
facilitate decision making (see [10]). All these capabilities often
require an advanced digital model for sensitive equipment with a
hierarchical decomposition down to significant equipment parts.
Some benefit are the digital testing of new parts with e.g. different
materials, and the prediction the remaining useful life based on
model updates. The resulting indications have to be reported to
the adequate person both under request and there has to be
mechanisms which trigger information delivery under
circumstances such as imminent failure of critical components.
Secondly, the maintenance procedures related to the product.
Where DTs can be provided with the ability to acquire and
process data related to consumer satisfaction from e.g. industrial
network websites, social media and customers feedback placed
e.g. at the web of retailers. Such data can be utilized for taking
decisions upon the improving product properties in relation to
their durability and maintainability, and to plan post-sales
maintenance services (see [11]). For example, taking the feedback
from a certain company about the faced difficulties of removing a
bearing from a compressor’s crank shaft with the some
explanations about the recommended solutions, allows the digital
twin to make a virtual simulation and make some adjustments on
the production process to eliminate or to facilitate the
maintenance problem in the real world. An obvious challenge is
the semantic interpretation from the DT of such consumer
feedback. A more simplistic solution is to provide with
appropriate interfacing between humans and DTs in order to allow
humans to access and exploit the simulation and decision-making
capabilities of DTs in relation to purpose-oriented requirements.
Finally, DT applications include teaching and enhancing the work
team’s performance. The abilities of maintenance staff can be
reinforced, and new abilities can be acquired by training in a
virtual environment which accurately reflects the plant. Such
virtual environment can overcome several different barriers in
relation to the replication of particular process conditions which
would be expensive, dangerous or unprobeable to be reproduced
in the real process (see [12]). Both during virtual training and
during maintenance services supported by DTs, adequate
strategies for information deliver to workers play a very important
role both in the training process and in maintenance efficiency
(see [13]).
Furthermore, digital twins usually offers a bunch of suggestions to
improve the chosen training conditions, through collecting data
from the global network for a similar real conditions that hade
happen in the past at different places around the world, and show
the all related results (see [14]). So, the simulation in the
maintenance training would accelerate the learning process for all
new workers, reduce all related costs for preparing a training
session and provide the opportunities for self-trainer improvement
“design thinking” by analyzing the provided suggestions from the
simulation program and analysis them.
For further state of the art studies on Digital Twins, the reader can
refer to [15].
Figure2. The process of using a virtual model
5. Data Connectivity Challenges in Digital Twins
Some data connectivity challenges in relation to DTs have been
satisfactorily resolved in the literature, while others are still open
problems such as difficulties in the exchange of information
between companies, organizations or even countries. There is
therefore a gap in scaling DTs for their application in the so called 106
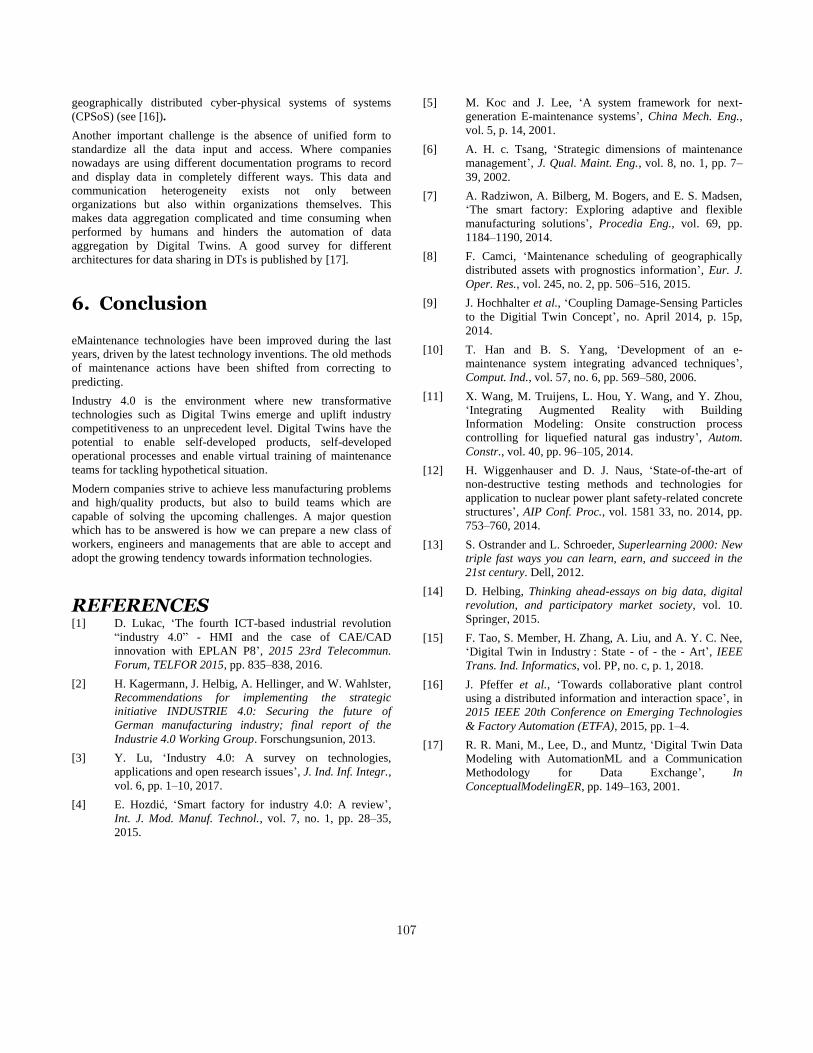
geographically distributed cyber-physical systems of systems
(CPSoS) (see [16]).
Another important challenge is the absence of unified form to
standardize all the data input and access. Where companies
nowadays are using different documentation programs to record
and display data in completely different ways. This data and
communication heterogeneity exists not only between
organizations but also within organizations themselves. This
makes data aggregation complicated and time consuming when
performed by humans and hinders the automation of data
aggregation by Digital Twins. A good survey for different
architectures for data sharing in DTs is published by [17].
6. Conclusion
eMaintenance technologies have been improved during the last
years, driven by the latest technology inventions. The old methods
of maintenance actions have been shifted from correcting to
predicting.
Industry 4.0 is the environment where new transformative
technologies such as Digital Twins emerge and uplift industry
competitiveness to an unprecedent level. Digital Twins have the
potential to enable self-developed products, self-developed
operational processes and enable virtual training of maintenance
teams for tackling hypothetical situation.
Modern companies strive to achieve less manufacturing problems
and high/quality products, but also to build teams which are
capable of solving the upcoming challenges. A major question
which has to be answered is how we can prepare a new class of
workers, engineers and managements that are able to accept and
adopt the growing tendency towards information technologies.
REFERENCES [1] D. Lukac, ‘The fourth ICT-based industrial revolution
“industry 4.0” - HMI and the case of CAE/CAD
innovation with EPLAN P8’, 2015 23rd Telecommun.
Forum, TELFOR 2015, pp. 835–838, 2016.
[2] H. Kagermann, J. Helbig, A. Hellinger, and W. Wahlster,
Recommendations for implementing the strategic
initiative INDUSTRIE 4.0: Securing the future of
German manufacturing industry; final report of the
Industrie 4.0 Working Group. Forschungsunion, 2013.
[3] Y. Lu, ‘Industry 4.0: A survey on technologies,
applications and open research issues’, J. Ind. Inf. Integr.,
vol. 6, pp. 1–10, 2017.
[4] E. Hozdić, ‘Smart factory for industry 4.0: A review’,
Int. J. Mod. Manuf. Technol., vol. 7, no. 1, pp. 28–35,
2015.
[5] M. Koc and J. Lee, ‘A system framework for next-
generation E-maintenance systems’, China Mech. Eng.,
vol. 5, p. 14, 2001.
[6] A. H. c. Tsang, ‘Strategic dimensions of maintenance
management’, J. Qual. Maint. Eng., vol. 8, no. 1, pp. 7–
39, 2002.
[7] A. Radziwon, A. Bilberg, M. Bogers, and E. S. Madsen,
‘The smart factory: Exploring adaptive and flexible
manufacturing solutions’, Procedia Eng., vol. 69, pp.
1184–1190, 2014.
[8] F. Camci, ‘Maintenance scheduling of geographically
distributed assets with prognostics information’, Eur. J.
Oper. Res., vol. 245, no. 2, pp. 506–516, 2015.
[9] J. Hochhalter et al., ‘Coupling Damage-Sensing Particles
to the Digitial Twin Concept’, no. April 2014, p. 15p,
2014.
[10] T. Han and B. S. Yang, ‘Development of an e-
maintenance system integrating advanced techniques’,
Comput. Ind., vol. 57, no. 6, pp. 569–580, 2006.
[11] X. Wang, M. Truijens, L. Hou, Y. Wang, and Y. Zhou,
‘Integrating Augmented Reality with Building
Information Modeling: Onsite construction process
controlling for liquefied natural gas industry’, Autom.
Constr., vol. 40, pp. 96–105, 2014.
[12] H. Wiggenhauser and D. J. Naus, ‘State-of-the-art of
non-destructive testing methods and technologies for
application to nuclear power plant safety-related concrete
structures’, AIP Conf. Proc., vol. 1581 33, no. 2014, pp.
753–760, 2014.
[13] S. Ostrander and L. Schroeder, Superlearning 2000: New
triple fast ways you can learn, earn, and succeed in the
21st century. Dell, 2012.
[14] D. Helbing, Thinking ahead-essays on big data, digital
revolution, and participatory market society, vol. 10.
Springer, 2015.
[15] F. Tao, S. Member, H. Zhang, A. Liu, and A. Y. C. Nee,
‘Digital Twin in Industry : State - of - the - Art’, IEEE
Trans. Ind. Informatics, vol. PP, no. c, p. 1, 2018.
[16] J. Pfeffer et al., ‘Towards collaborative plant control
using a distributed information and interaction space’, in
2015 IEEE 20th Conference on Emerging Technologies
& Factory Automation (ETFA), 2015, pp. 1–4.
[17] R. R. Mani, M., Lee, D., and Muntz, ‘Digital Twin Data
Modeling with AutomationML and a Communication
Methodology for Data Exchange’, In
ConceptualModelingER, pp. 149–163, 2001.
107
Feature Extraction for eMaintenance of Runestones*
* Extended Abstract
Miguel Castaño Arranz eMaintenance Group
Division of Operation, Maintenance and Acoustics
Luleå University of Technology [email protected]
ABSTRACT
Runestones are popularly associated with the Scandinavian
culture of the Viking period (750-1050). More than 4000 Swedish
runic inscriptions are still preserved and form an important part of
the Swedish heritage as well as the main source of study of the
Swedish language before the Middle ages. Runestones were often
erected at ancient crossroads as public memorials for the dead or
commemoration of important events. Most of the preserved
runestones are still in their original place. This means that
runestones are often disperse and occasionally at remote locations
far from roads.
The maintenance of runestones is governed by the standard SS-
EN 15898: 2011, which includes definitions for care,
conservation, maintenance, cleaning, restoration and
reconstruction. Preventive measures avoid growth which may
damage permanently the inscriptions such as moss, lichen and
algae. Therefore, contaminants such as soil, dust, leaves or bird
droppings must be cleaned regularly. The surroundings of the
stone must be maintained to remove water ponds or trees and
shrubs which grow too close. Maintenance plans include
corrective and restoration measures such as cleaning with
adequate chemicals and painting the carvings.
The vision in this paper is to boost digitalization of the Swedish
runestones by crowdsourcing information (such as images)
through a social network app. Such information would allow
maintenance contractors to receive updated images of runestones
and their surroundings in order to plan maintenance actions.
The acquisition of image datasets will allow the training of
Artificial Intelligences to e.g.: I) prescribe maintenance actions
(e.g. repainting of the carvings), ii) enhance the visibility of
degraded runestones through Augmented Reality, iii) use
Extended Reality to create a virtual reconstruction of fragmented
runestones.
Within the context of this vision, this paper focuses on the
exploration of computer vision algorithms to extract features from
runestone images such as the pattern of their carvings.
108

Recent Advances in Convolutional Neural Networks and Open Opportunities in eMaintenance *
* Extended Abstract
Miguel Castaño Arranz eMaintenance Group
Division of Operation, Maintenance and Acoustics
Luleå University of Technology [email protected]
Ramin Karim eMaintenance Group
Division of Operation, Maintenance and Acoustics
Luleå University of Technology [email protected]
ABSTRACT
Deep learning is currently at the peak of Gartner Hype
Cycle, meaning that there are large expectations from
industry stakeholders. These expectations are not
unjustified, since digitalization (pervasive sensing) and
distributed computing enables leaps which transform the AI
paradigm on a biannual basis.
Some important recent leaps are: I) crowdsourcing
information from platforms such as the Amazon
Mechanical Turk, ii) collection of Large Scale Databases
such as ImageNet (2009), iii) introduction of open
challenges such as the ImageNet Large-Scale Visual
Recognition Challenge (since 2010), since many recent
innovations have been achieved by participants in such
challenges, iii) successful large-scale networks such as
AlexNet (2012), which convinced the scientific community
to place a focus on deep learning, iv) larger explainability
of Convolutional Neural Networks (2014) and therefore
increased acceptance by practitioners, v) distributing
training of a network across separate computers allowing to
train the deepest networks in weeks or months where it
could have potentially taken years, vi) introduction of
network architectures which allow efficient training of
deeper networks which would otherwise have led to
increasing classification errors together with the increase of
depth due to the vanishing gradient problem (e.g. Inception
Network (2014) or Residual Networks (RestNets) (2016)).
This paper explores how these advances in deep
learning open new possibilities for application to
maintenance in relation to scarcity of measurements such
as: i) the ability to transfer learning between AIs and across
disciplines, like the retraining of AlexNet for inspecting
bridges ii) using similarity metrics to train certain AIs with
just one or few samples of each class (one shot learning),
iii) dataset augmentation, iv) automated feature learning as
opposed to the traditional feature engineering.
Illustration of discovering features through feature learning and transfer learning
109
Analysis Method and Tool for Effective Railway Turnout Maintenance*
* Extended Abstract
Stephen Mayowa Famurewa Division of Operation, Maintenance
and Acoustics Luleå University of Technology
Arne Nissen Trafikverket
Luleå, Sweden +46(0)010 1239391
ABSTRACT
The railway turnout is an essential sub-system in a railway
system, used to increase the degree of freedom of the system by
diverting traffic along different tracks. However, it is a critical
component which needs effective and adequate maintenance
efforts to keep it dependable, safe, affordable and sustainable. For
example, in Sweden, there are over 15 000 turnouts (more than
100 distinct types) on the entire railway networks out of which
Trafikverket is responsible for over 11 000. These turnouts
contribute between 15% and 20% to the annual total infrastructure
failure frequency and train delays on the network. Also, from the
railway economy viewpoints, turnout is a cost driving component
as it contributes between 8% and 15% to the annual maintenance
and renewal cost on the Swedish network. The above-mentioned
challenges require an enhanced strategy and tool to facilitate
turnout performance monitoring and improvement. This article
presents the development and implementation of a business
intelligence tool for studying the health and performance of
turnouts to support maintenance decisions. The quantitative
research method used in this paper includes the following
activities: secondary data collection from existing databases, data
processing, statistical data analysis and visualisation. The core of
the paper is development of a visualisation tool in Microsoft
power BI. The implication of this development is enhancement of
maintenance decisions at different organisational levels and for
different stakeholders. This will give useful information to
support operational decisions for regular maintenance by track
engineers or maintenance service provider and daily operations by
train operating centres. Further, the tool can also support tactical
decisions for item renewal, regulations review and strategic
decisions for replacement of the entire system. In future, this tool
can be extended to include, inspection remarks and the output of
advanced maintenance analytics with condition monitoring data.
110

Enterprise Modeling for Dynamic Matching of Tactical Needs and Aircraft
Maintenance Capabilities1
Ella Olsson
Saab AB
The increasingly dynamic context of future military air operations raises new needs for
maintenance and logistic systems to more rapidly respond to changes in operational needs,
with retained resource efficiency. This paper describes the problem from a holistic perspective
by means of an enterprise modeling approach that approaches the problem from three
perspectives, namely 1) a top-down approach that models the dynamics of maintenance
operations in a tactical air operations context as well as static high-level concept of ingoing
entities and organization, 2) a middle-out approach that models the maintenance systems and
services, and 3) a bottom-up approach that focuses on maintenance and operations of aircraft
landing gears components.
The top-down approach can be related to selected DoDAF operational views, starting with a
high-level operational concept description view (OV-1) of an air and maintenance operations
scenario capturing basic air and maintenance scenario entities and their high level relations.
This is accompanied with a high level maintenance organizational relationship chart (OV-4)
loosely based on Swedish regulations for air operations, followed by an operational node
connectivity description (OV-2) capturing operational nodes. The high level dynamics of
maintenance operations (OV-5) describes the maintenance operations that are normally
conducted in the course of achieving a tactical air mission.
The middle-out approach starts in the “middle” of an air operations maintenance context, pin-
pointing the systems, units and services that realize the operational viewpoints described
above. In this work we have identified a set of service and system views related to UAF and
DoDAF namely the SV-1 and SOV-1 and their corresponding SV-4 and SOV-4. These
viewpoints captures the systems and service taxonomies and their functions respectively. This
modelling is loosely based on the Swedish regulations for air operations and the Regulation
for the Swedish Air Base System. These layers will also accommodate decision support
services based on big data stored from air and maintenance operations. A study of how to
integrate machine learning for maintenance task to unit matching has been performed as a
feasibility study.
The bottom-up approach is based on an in-depth study of a set of Gripen landing gear
components and their relationship to tactical air operations. This approach will model the
landing gear as a part of an aircraft Digital Twin that performs real-time simulations and
condition assessment of the landing gear components during air operations as well as
monitoring maintenance operations where service and pert replacement are performed on the
components This approach is feasibility study of how to adopt and integrated the digital twin
concept in an overall air and maintenance operations context.
1 Extended Abstract
111