Creditor-Focused Corporate Governance: Evidence from Mergers and Acquisitions in Japan
Upload
khangminh22Category
view
0download
0
BACHELOR THESIS MERGERS & ACQUISITIONS
A T R E N D Y F A D O R S U S T A I N A B L E V A L U E C R E A T I O N ?
L I N N Æ U S U N I V E R S I T Y S C H O O L O F B U S I N E S S A N D E C O N O M I C S
Å s a D e v i n e
V i k t o r i j a K o l o n a i t y t e
Anna Lena Bischoff – 870109 30th of May 2011
Linn Sällström – 810125
Jesco A. Danylow – 880417

II | P a g e
I . ABSTRACT
Today, companies need to constantly expand their business to stay ahead of the severe
competition. As competition grows more intense, it makes sense to join forces or simply
acquire the rival to provide the most diverse service and to reach even the last customer.
But is it really only about the need for efficiency to merge and acquire competitors? Are
managers and investors right about their hope, that every new acquisition or merger offers
more control over the market? Or are they themselves pushed into these promising expec-
tations?
This research focuses on how social behavior influences value creation in mergers and
acquisitions. Throughout history, waves have been observed that reflect the excessive hype
for perennial need of growth. Growth by acquisitions and mergers is seen as key element to
create value by investors and managers. However, reality looks different. This research
focuses on a two step approach by first describing underlying social catalysts that amplify
the trend towards value creation in mergers and acquisitions. Secondly, to verify the inves-
tigation of social behavior, the results are matched to a financial approach to detect wheth-
er the transaction price justifies the current value and possible synergies or whether value
is destroyed.
A case study was conducted of Boss Media AB, a software company situated in the online
gaming industry, which experienced several mergers and acquisitions since their founda-
tions and was eventually acquired itself. The company provided an interview and further
information on their involvement with mergers and acquisitions.
The research showed that mergers and acquisitions continue to increase in number and
value, leading to the amplitude of each wave being higher than the previous one. This also
means that more value is destroyed. It is illustrated that managers being determined to have
bet on the right horse, are often more influenced by social behavior and trends than they
think they are. Blinded by the overestimation of their own abilities, and prosperous short-
term profits, managers overvalue their investment choices. Hence, the research implies that
managers destroy shareholder value even though they initially intended to create it.
III | P a g e
I I . TABLE OF CONTENTS
I. Abstract ....................................................................................................................... II
II. Table of Contents ...................................................................................................... III
III. Table of Figures .................................................................................................... VI
IV. Table of Abbreveations ..................................................................................... VIII
1. Introduction .................................................................................................................. 1
1.1. Background ...................................................................................................................... 1
1.2. Problem discussion .......................................................................................................... 2
1.3. Research question ............................................................................................................ 3
1.4. Purpose ............................................................................................................................. 4
1.5. Delimitation ...................................................................................................................... 4
2. Theoretical Framework ............................................................................................... 5
2.1. Theory on Mergers & Acquisitions ................................................................................ 5
2.1.1. Mergers .......................................................................................................................... 5
Horizontal Mergers ............................................................................................................................... 6
Vertical Mergers ................................................................................................................................... 6
Conglomerate Mergers ......................................................................................................................... 7
2.1.2. Acquisitions ................................................................................................................... 7
Hostile Acquisitions .............................................................................................................................. 8 Friendly Acquisitions ............................................................................................................................ 8
2.2. Trends in Mergers & Acquisitions ................................................................................. 8
2.2.1. Mergers & Acquisitions as a Trend in history ............................................................... 9
The first M&A wave .............................................................................................................................. 9
The second M&A wave ....................................................................................................................... 10
The third M&A wave ........................................................................................................................... 10
The fourth M&A wave ......................................................................................................................... 11
The fifth M&A wave ............................................................................................................................ 11
Recent and current trends ................................................................................................................... 12
2.2.2. Behavioral Catalysts in Mergers & Acquisitions ........................................................ 12
Hubris ................................................................................................................................................. 12 Managerialism .................................................................................................................................... 13
Herding ............................................................................................................................................... 14

IV | P a g e
2.3. Value creation in Mergers & Acquisitions .................................................................. 15
2.3.1. The discounted cash flow model ................................................................................. 16
3. Methodology ............................................................................................................... 21
3.1. Research design .............................................................................................................. 21
3.1.1. Sample ......................................................................................................................... 21
3.2. Data collection ................................................................................................................ 22
3.2.1. Realization ................................................................................................................... 22
Interviews ............................................................................................................................................ 22
Statistical ascertainment ..................................................................................................................... 23
3.2.2. Operationalization ....................................................................................................... 24
3.3. Research quality ............................................................................................................. 27
3.3.1. Validity ........................................................................................................................ 27
3.3.2. Reliability .................................................................................................................... 27
3.3.3. Source criticism ........................................................................................................... 28
Literature ............................................................................................................................................ 28
Interviews ............................................................................................................................................ 28
Statistical Ascertainment .................................................................................................................... 29
4. Empirical investigation ............................................................................................. 30
4.1. The Case Study – Boss Media AB ................................................................................ 30
4.1.1. Industry background - the online gaming industry ...................................................... 30
4.1.2. Company background - Boss Media AB ..................................................................... 31
4.2. Revelations from the empirical data ............................................................................ 32
4.2.1. Revelations from the interviews and statistical ascertainment .................................... 32
M&As .................................................................................................................................................. 32
Hubris ................................................................................................................................................. 33
Managerialism .................................................................................................................................... 33
Herding ............................................................................................................................................... 34
Value creation in M&As ..................................................................................................................... 34
Value estimation of M&As .................................................................................................................. 35
Overpricing ......................................................................................................................................... 36
5. Analysis ....................................................................................................................... 38
5.1. Mergers & Acquisitions - a trend caused by social behavior? .................................. 38
5.2. Mergers & Acquisitions – sustainable value creation? .............................................. 43
5.2.1. Evaluating Boss Media AB - the discounted cash flow model ................................... 43
Step I - entering historical data .......................................................................................................... 43

V | P a g e
Step II – deriving net working capital ................................................................................................. 45
Step III - projecting future data .......................................................................................................... 46 Step IV - calculating free cash flows ................................................................................................... 48
Step V - estimating the WACC ............................................................................................................ 50
Step VI - estimating PV, determining valuation and terminal value .................................................. 54
Step VII - determining equity value .................................................................................................... 56
Step VIII - sensitivity analysis ............................................................................................................. 58
5.2.2. Results from the evaluation of Boss Media AB .......................................................... 60
6. Conclusion .................................................................................................................. 62
6.1. Summary of the results .................................................................................................. 62
6.2. Limitations ...................................................................................................................... 64
7. Reflections .................................................................................................................. 65
7.1. Reflections of Mergers & Acquisitions as trigger for trends and value creation .... 65
7.2. Suggestions for future research .................................................................................... 66
V. Bibliography ............................................................................................................... 68
VI. Appendix ................................................................................................................. 75
A. Operationalization .............................................................................................................. 76
B. Empirical investigation – interviews ................................................................................ 77
B.I. Competitors of Boss Media AB .................................................................................. 77
B.II. E-mail interview with Andreas Löfstrand ................................................................... 78
B.III. Interview guideline ...................................................................................................... 79
B.IV. Interview with Andreas Löfstrand ............................................................................... 81
C. Empirical investigation – statistical ascertainment ......................................................... 98
C.I. Annual report Boss Media AB 2006 (excerpt) ............................................................ 98
C.II. Annual report Boss Media AB 2007 (excerpt) .......................................................... 100
C.III. Annual report Boss Media AB, 2007, increase in short-term debt ........................... 101
C.IV. Risk-free interest rate 2007 in accordance to Swedish government bonds ............... 102
C.V. Beta ............................................................................................................................ 103
D. Glossary ............................................................................................................................. 108

VI | P a g e
I I I . TABLE OF FIGURES
Figure 1: Announced Mergers & Acquisitions Worldwide, 1985-2010 (IMAA, 2011) ....... 9
Figure 2: The synergetic value effects of M&As (Damodaran, 2002) ................................ 15
Figure 3: The discounted cash flow model (Brealy, Myers, & Allen, 2008, p. 103) .......... 17
Figure 4: Discounted cash flow model considering growth after year n (Gaughan, 2007, p.
536) ...................................................................................................................................... 18
Figure 5: WACC (not considering taxes) (Berk & DeMarzo, 2007, p. 439) ....................... 19
Figure 6: Capital asset pricing model (Berk & DeMarzo, 2007, p. 310) ............................. 19
Figure 7: WACC with marginal corporate tax rate (Berk & DeMarzo, 2007, p. 577) ........ 20
Figure 8: Discounted cash flow model at the weighted average cost of capital (Brealy,
Myers, & Allen, 2008, p. 535) ............................................................................................. 20
Figure 9: Share price development of Boss Media AB 01-2008 to 03-2008 (Euroinvestor
A/S, 2008) ............................................................................................................................ 37
Figure 10: Announced Mergers & Acquisitions IT consulting and services, 1988-2010
(IMAA, 2011) ...................................................................................................................... 42
Figure 11: Computation of historical data of Boss Media AB 2004-2007 .......................... 44
Figure 12: NWC computation of Boss Media AB 2004-2007 ............................................ 46
Figure 13: Actual period and forecasted period computation of Boss Media AB EBIT to
sales, 2004-2012 .................................................................................................................. 48
Figure 14: NWC of actual and forecasted period of Boss Media AB 2004-2012 ............... 49
Figure 15: Actual period and forecasted period computation of Boss Media AB EBIT to
CF, 2004-2012 ..................................................................................................................... 50
Figure 16: WACC considering the marginal corporate tax rate (Berk & DeMarzo, 2007, p.
577) ...................................................................................................................................... 50
Figure 17: WACC computation of Boss Media AB 2007-12-31 ........................................ 52
Figure 18: PV of Boss Media ABs FCF in 2008 ................................................................. 54
Figure 19: PV of Boss Media AB’s FCF in 2008 using a mid-year convention ................. 55
Figure 20: PV of Boss Media AB 2004-2012 ..................................................................... 55
Figure 21: GDP growth rate Europe and US, 2004 to 2007 (Bureau of Economic Analysis,
Departement of Commerce, 2011), (European Commission, eurostat, 2011). .................... 56
Figure 22: Terminal value of Boss Media AB 2007-12-31 ................................................. 56
Figure 23: Enterprise value and implied multiples of Boss ................................................. 57
Figure 24: Sensitivity analysis of Boss Media AB 2007-12-31 .......................................... 59

VII | P a g e
Figure 25: Answers to the research questions ..................................................................... 62
Figure 26: Operationalization .............................................................................................. 76
Figure 27: Competitors of Boss Media AB (Boss Media AB, 2007, pp. 28-29) ................. 77
Figure 28: Announced Mergers & Acquisitions Worldwide, 1985-2010 (IMAA, 2011) ... 94
Figure 29: Announced Mergers & Acquisitions IT consulting and services, 1988-2010
(IMAA, 2011) ...................................................................................................................... 94
Figure 30: Financial data group review of Boss Media AB from 2002 to 2006 (Boss Media
AB, 2007, pp. 93-94) ........................................................................................................... 99
Figure 31: Financial data group review of Boss Media AB from 2003 to 2007 (Boss Media
AB, 2008, pp. 68-69) ......................................................................................................... 101
Figure 32: Note 21, other receivables and liabilities (Boss Media AB, 2008, p. 59) ........ 101
Figure 33: Risk-free interest rate 2007 in accordance to Swedish government bonds
(Sveriges Riksbank, 2011) ................................................................................................. 102
Figure 34: Computation of Boss Media AB’s unlevered Beta (Damodaran A. , The Data
Page, 2011), (Damodaran A. , Betas by Sector, 2011) ...................................................... 107

VIII | P a g e
IV . TABLE OF ABBREVEATIONS
B2B – business-to-business
B2C – business-to-customer
CAGR – compound annual growth rate
Capex – capital expenditures
CF – cash flow
D – market value of debt
DCF – discounted cash flow model
E – market value of equity
E(!!) – expected return of the market
E(!!) – expected return on investment
EBIT – earnings before interest tax
EBITDA – earnings before interest tax, depreciation and amortization
EPS – earnings per share
FCF – free cash flow
g – growth rate
JV – joint venture
LBO – leveraged buyout
M&A – mergers and acquisitions
n – years
NWC – net working capital
PV – present value
r – discount rate
SEK – Svensk Kronor (Swedish Crowns)
US – United States of America
USD – US Dollar
WACC – weighted average cost of capital
β – sensitivity of the company’s return to the market
τ – marginal corporate tax rate
1 | P a g e
1 . INTRODUCTION
The research’s focus is the field of Mergers and Acquisitions (M&As) and the underlying
enthusiasm of investors towards them. More precisely, the issue of M&As being a business
concept for sustainable value creation is weighted up against them being reoccurring
trends, triggered by social behavior.
In the introductory chapter, the background and its surrounding controversy of M&As is
introduced. Next delimitations, the theoretical and empirical boundaries set by researchers
to meet the scope of their work, are portrayed (Bryman & Bell, 2007). Finally, the prob-
lem discussion transits to the research question and purpose.
1.1. BACKGROUND
Warren Buffet (1982) once said that acquirers perceive themselves as princesses who can
turn toads into princes with their kiss. Acquirers pay horrendously overpriced premiums,
believing they will break the enchanted prince’s spell.
“We’ve observed many kisses but very few miracles.” (Hayward & Hambrick, 1997, p.
103)
Throughout history there have been waves of M&A activity. M&As have become an im-
portant tool for the reallocation of resources and for executing corporate strategies (Koller
et al., McKinsey & Company, 2010). Particularly, most companies will be able to reach a
certain level of growth by using their own resources, but no further. However, increasing
competition forces companies to rethink their motives for investments. Companies will
then have to decide whether they either invest fresh money into the company or sell it at a
reasonable price. Another solution, which has become more and more appealing to manag-
ers, is to merge with another company and thus ally in the battle of competitive advantage.
Using the principle “if you cannot beat them, join them” (Auerbach, 1988, p. 321), stagnat-
ing companies often find an efficient solution in joining forces with other players on the
market or in complementary industries.
However, this recent boom of M&A activity started to decline in 2008 after three impres-
sive years and plunged to a historic low in 2009 in combination with the financial crisis

2 | P a g e
(Bloomberg Finance L.P., 2010). After the dot-com bubble burst in the beginning of the
21st century and the real-estate bubble during the financial crisis of 2007 to 2010, investors
and shareholders have become cautious of what the next miscalculated craze will be. Are
M&A’s just as much an overvalued mania as these previous economic downturns? Will
they lead to the destruction of value? M&A waves and their steady raise seem to have an
underlying pattern in the occurrence of trends. The question is whether the exponential
explosion of M&As is only driven by rational implications such as value enhancement, or
also by social behavior demonstrating power display and status. M&A has become an in-
flationary term.
If a company does not participate in the M&A game, it will be considered an outsider.
Showing competitors the ability to buy them up has become a wealth- and thus power dis-
play (Cartwright, Cartwright, & Cooper, 2000). Hence, M&As represent much more than
rational management decisions to add value, they display status and supremacy (Hayward
& Hambrick, 1997).
Recently there have been discussions about the overvaluation of M&A investments caused
by managerial behavior (Malmendier & Tate, 2008), (Hartley, 2011). This leads to a call
for more rationality on the management’s behalf and governmental regulation to protect
shareholders. There is a need for accurate measurement of the value of M&As to make
successful decisions and avoid uncertainty.
1.2. PROBLEM DISCUSSION
M&As, the combination of workforce of two companies, is nothing new. M&As have tak-
en place for centuries and will not disappear as long as willing buyers and sellers cede to
exist in a market. Still the latest M&A explosion leaves questions of exaggeration and irra-
tionality open. What causes the enthusiasm and excessive participation in M&A? Brealy,
Myers and Allen (2008) criticize the lack of research in regards to the causes of M&A
waves and their formation. They claim this to be one of the most important economic top-
ics, which is still unresolved. M&As have been studied in waves and their correlation with
economic up and downturns. Still their emergence has not been researched very much
apart from that. Economic influences such as market shocks were considered to be influ-
encing M&A activity (Mitchell & Mulherin, 1996). Nevertheless, behavioral or social as-
pects as triggers for M&A waves have long been neglected or only been researched in
fragments. Researchers such as Harford (2005) argue that M&A activity has its roots not

3 | P a g e
only in economic influences, but also in behavioral patterns. The theoretical application
has not been emphasized until recently. There is little evidence on a variety of behavioral
patterns combined to be causing trends in M&A. Therefore, the first part of this research
concentrates on the not yet fully explored landscape of combined behavioral catalysts to
have an influence on M&A waves.
One of these behavioral catalysts is discussed by Malmendier and Tate (2008), who claim
top management to act out of overconfidence and pride. Thus, the price investors have to
pay for target companies are usually higher than their actual value would be. Overvaluation
triggered by the management’s behavior has grave impacts on the company’s profits and
the shareholder value. The motivation to undergo a merger or an acquisition has been in
the critique over the last couple of years (Hartley, 2011). The discussion surrounded the
question of how sustainable M&As are and whether they are a legitimate way to create
growth (Hartley, 2011).
To prevent the shareholders from value destruction and keep their best interest, measures
were developed by researchers such as Brealy, Myers and Allen (2008) to calculate the
accurate price for an investment. Yet, there is not the one right equation to solve this prob-
lem. Each merger and each acquisition differs and needs special adjustment. Due to high
complexity of evaluation models, often models are applied that do not capture all risks or
are manipulable. In its second part, this research picks up on the most common model, the
discounted cash flow (DCF) model1 to appropriately measure an M&A investment.
1.3. RESEARCH QUESTION
Based on the problem discussion, the research question is determined to uncover the man-
agement’s fondness for M&As. It is questioned whether M&A serve as rational investment
decision to create value or as a phenomenon solely triggered by social behavior.
Is social behavior a trend catalyst that destroys value?
Is the price of an acquisition an indicator for value creation?
These questions need to be jointly considered when trying to answer the objective of this
research - Mergers and Acquisitions, a trendy fad or sustainable value creation?
1 Discounted cash flow model (DCF) – used to value an asset by its present value, which is estimated by discounting cash flows with an accurate discount rate.
4 | P a g e
1.4. PURPOSE
The purpose of this research addresses the very nature of M&As and its underlying enthu-
siasm. Especially the issues of M&As as a sustainable, value creating tool will be elaborat-
ed considering the price set for an M&A investment and thus resulting over- or underval-
uation. Influences besides value creation such as behavioral catalysts will be discussed to
cause M&A waves. Moreover, this research is intended to explore whether M&As are
reoccurring trends triggered by social behavior and create a clarion call for action.
1.5. DELIMITATION
Delimitations serve to empirically and theoretically narrow down the field of interest to
answer a specific research question. Theoretically the research is split into two main as-
pects, the choice of models to explain behavioral catalysts of trends in M&A and the
choice of models on estimating the value of M&A targets. Behavioral influences are stud-
ied as activators for increased M&A activity, whereas value creation through M&As is
evaluated calculative, allowing insight on inadequate valuations in M&A activities.
Empirically, the research was conducted via a qualitative case study of one company, using
interviews and statistical ascertainment.

5 | P a g e
2 . THEORETICAL FRAM EW ORK
An introduction to the field of M&A is offered by distinguishing the term merger from the
term acquisition, which also includes the description of the most common M&A designs.
Thereafter, historical as well as recent trends in the movements of M&A are highlighted.
The further design of this research is split into two parts: the detection of behavioral trend
catalysts and models of value determination. Among the various models portrayed that
influence trends, behavioral theories were chosen as the main model connected to social
phenomena as trend activators. For the value assessment within a company, the DCF was
selected. Additionally, a comparison to the share price was supplemental used.
2.1. THEORY ON MERGERS & ACQUISITIONS
The corresponding literature does not agree on a homogenous definition of the field of
M&A. Researchers are discordant in terms of defining mergers in combination with acqui-
sitions. The term merger is often used as a general expression for all kinds of economic
transactions that form a new entity. Classifying the terms and models which occur in
M&As is a necessity to create one clear foundation for the audience in opposition to vary-
ing models used in literature.
The generic term mergers can be categorized into subordinate concepts: mergers, acquisi-
tions or takeovers and many more designs2 (Weston, Mitchell, & Mulherin, 2004). Howev-
er, the majority of researchers describe all kinds of mergers to have similar design features,
except for acquisitions (Hubbard, 1999). Thus, this research follows the common idea to
treat the expression merger and the term acquisition as two separate approaches. Contrari-
ly, the majority of literature uses the verb “to merge” for both mergers and acquisitions,
thus the given terminology is adopted in this research.
2.1.1. MERGERS
According to Hubbard (1999), mergers are partners of equivalent size and influence. The
effort lies in creating a new cooperation in which both parties have the same rights, co-
determination and negotiate their decisions towards the amalgamation of both companies
(Weston, Mitchell, & Mulherin, 2004). Regarding prerequisite, structure and purpose,
2 For further explanations on additional designs refer to Weston, Mitchell, & Mulherin, 2004

6 | P a g e
mergers can be further divided into vertical and horizontal mergers (Borghese & Borgese,
2002).
Horizontal Mergers
Horizontal mergers occur when two or more companies have their origin in similar indus-
tries. Through horizontal mergers these companies join forces to strengthen market posi-
tions (Weston, Mitchell, & Mulherin, 2004). Firms selling a similar product range, having
a similar structure or catering to similar markets are called horizontal mergers
(Sudarsanam, 2003).
The purpose of horizontal mergers is “to gain market share at the expense of competitors.”
(Sudarsanam, 2003, p. 98). Moreover, economies of scale3 (Bain, 1959), workforce reduc-
tion (Jensen, 1984), market power (Scherer, 1980) and decreasing excess capacities
(Sudarsanam, 2003) are considerable reasons. Combining the production plants enables the
merged companies to increase their production capacities. Costs can be reduced by sharing
one administrative structure. Hence, workforce can be diminished, which contributes to
further cost reduction. With a certain size comes the ability to penetrate market share and
eliminate competitors. Size also enlarges the number of customers and increases sales,
which leads to lower excess capacities. Jensen (1993) identifies demand reduction, techno-
logical change, governmental regulations, fewer entry barriers and globalization as causes
for horizontal mergers.
Vertical Mergers
Vertical mergers occur in industries where companies are operating at different stages, but
seek to combine their production or value chains4 (DePamphilis, 2003). This is usually
executed by the merger of a company with another company further up or down the value
chain, they both share (Borghese & Borgese, 2002). Upstream mergers are less common
than downstream mergers, as the companies further down the value chain need to be in a
strong bargaining position (Sudarsanam, 2003). However, if suppliers are specialized in
certain products or services that require a superior expertise, they gain dominance in the
negotiation process (Williamson, 1975).
3 Economies of scale – cost advantages a business receives by expanding their current production in goods and services (quantitative). 4 Value Chain – chain of value creating activities within a company.

7 | P a g e
The purpose of vertical mergers is to gain control and reduce costs throughout interlinked
processes in which more than one party is involved (Weston, Mitchell, & Mulherin, 2004).
Other reasons are to cut back on transaction costs (Williamson, 1975), to have immediate
access to resources (Pfeffer, 1972), the avoidance of uncertainty and asymmetric infor-
mation as well as the minimization of contractile costs (Sudarsanam, 2003).
Conglomerate Mergers
Conglomerate mergers describe the merger of two companies which are originally operat-
ing in different industries and seek to diversify their risk (Weston & Mansinghka, 1971).
Weston and Mansinghka (1971) describe the motivation of conglomerate mergers as “di-
versifying defensively to avoid sales and profit instability, adverse growth, developments,
adverse competitive shifts, technological obsolescence, and increased uncertainties with
their industries.” (Weston & Mansinghka, 1971, p. 928).
2.1.2. ACQUISITIONS
According to DePamphilis (2003) acquisitions can be defined as the possession of a con-
trolling interest in another company, a legal subsidiary or selected assets. The term is inter-
changeably used in relation to takeovers (Weston, Mitchell, & Mulherin, 2004). The buyer
usually pays the takeover in cash (Sherman & Hart, 2006). The securities of the acquired
company or assets, which are of value to the acquirer, can also serve as form of compensa-
tion to the seller (Sherman & Hart, 2006). This is called an asset purchase, where the ac-
quired firm or target company becomes a part of the buyer (Sherman & Hart, 2006). Asset
purchases are done for financial reasons, as the buyer expects the asset’s value to outper-
form the price paid for the takeover.
The acquisition can also be completed as a stock purchase (Sherman & Hart, 2006). In
such a case, the acquired company often continues to exist as a legal subsidiary of the ac-
quirer (DePamphilis, 2003). It does not necessarily include the acquisition of a whole
company, but separate parts of it (Miller, 2008). If the seller is a public company, a stock
purchase is usually done by a tender offer5 for the assets or stocks of the seller, which re-
sult in a hostile acquisition (Weston, Mitchell, & Mulherin, 2004). Besides hostile acquisi-
tions another acquisition structure exists, friendly acquisitions.
5 Tender offer – public offer to buy shareholders' shares at a premium to the market price.

8 | P a g e
Hostile Acquisitions
A hostile acquisition is the attempt to buy a company despite the target’s retentions (Bragg,
2009). This is especially convenient if the target company is a publicly held organization
as the acquirer can offer to buy shares directly from the shareholders (DePamphilis, 2003).
The management and the board of directors of a company can thus be bypassed, which is
called a tender offer (Weston, Mitchell, & Mulherin, 2004). Hostile takeovers may attract
other bidders and as a consequence, the final purchasing price can accelerate
(DePamphilis, 2003). Schwert (2000) claims, that hostile takeover are less successful than
friendly acquisitions. The shares of the acquired company perform less favorably than the
whole market especially when taking into account that the price paid for was presumably
too high (Picot, 2002).
Friendly Acquisitions
Friendly acquisitions are negotiated takeovers and usually encounter a lower acquisition
price than hostile takeovers (Weston, Mitchell, & Mulherin, 2004). Usually a standstill
agreement is settled to avoid the potential acquirer from further investments in the stock of
the target (DePamphilis, 2003). This is done to prevent aggressive takeover tactics by the
acquirer during the negotiation stage. Friendly acquisitions have become increasingly pop-
ular since the 1990s as they are less conflicted and offer a higher potential for success
(DePamphilis, 2003). Mørck, Schleifer and Vishny (1988) claim friendly takeovers to be
more successful than hostile acquisitions due to better post merger integration.
2.2. TRENDS IN MERGERS & ACQUISITIONS
Bergstöm and Vredin (2002) admit that there is no such thing as the ultimate definition of a
trend. Trends come and go in waves, just as M&A waves do. These waves follow different
patterns, which are industry and time specific. “The essence of a mania is that its pace be-
comes so frenetic that people stop thinking clearly, and it only ends up when some ele-
ments of economic reality disrupts the fantasy and brings the mania to an end.” (Perkins &
Perkins, 1999, p. 221). M&A activity has increased with each M&A wave being of higher
value and numbers, as Figure 1 shows. Additionally, effects influencing the overall econ-
omy encourage an atmosphere for M&A activity (Mitchell & Mulherin, 1996). The follow-
ing part describes trends in M&As, starting with the observation of historical M&A waves,
followed by behavioral trend catalysts.

9 | P a g e
2.2.1. MERGERS & ACQUISITIONS AS A TREND IN HISTORY
M&A activity has occurred during different timeframes and each decade reflects a certain
type of a merger or acquisition (Weston, Mitchell, & Mulherin, 2004). Each M&A wave
relates to the appearances of certain economic dynamics (DePamphilis, 2003). Mergers or
acquisitions usually emerge as the restructuring of resources as a cause of economic unbal-
ance or technological innovations (Borghese & Borgese, 2002). It has been noticed that
M&A activities especially occur when the economy is thriving and experiences outstand-
ing growth (Weston, Mitchell, & Mulherin, 2004). Figure 1 displays this assumption by
comparing the Nasdaq Composite Indice6, as benchmark for the economic climate, with
M&A activity from 1985 to 2010. It not only confirms the assumption of M&A activity
during economic booms, but also shows a steady increase in the number and value of deals
closed during peaks. Mitchell and Mulherin (1996) furthermore state that such a concentra-
tion of M&A activity agglomerates in specific industries.
Figure 1: Announced Mergers & Acquisitions Worldwide, 1985-2010 (IMAA, 2011)
The first M&A wave
From the late 1890’s to the early 1900’s a first wave of M&A activity emerged (Borghese
& Borgese, 2002). This wave consisted mainly of horizontal mergers where large compa-
nies ingested smaller ones (Weston, Mitchell, & Mulherin, 2004). It mirrors the industrial
6 Nasdaq Composite Indice – 3000 components, mainly technological companies and growth companies, only U.S situated companies.
0
1.000
2.000
3.000
4.000
5.000
6.000
7.000
0
5.000
10.000
15.000
20.000
25.000
30.000
35.000
40.000
45.000
50.000
1985
1986
1987
1988
1989
1990
1991
1992
1993
1994
1995
1996
1997
1998
1999
2000
2001
2002
2003
2004
2005
2006
2007
2008
2009
2010
number of transactions
Nasdaq Composite Indice
value of transactions (in 100 million US Dollar)

10 | P a g e
revolution, which led to the aim for companies to improve their economies of scale
(Kleinert & Klodt, 2002). Due to this fact, Stigler (1950) depicted the first wave as merg-
ing for monopoly7. The decline of the first M&A wave was triggered by an economic re-
cession in 1903 (Weston, Mitchell, & Mulherin, 2004). Moreover, governmental re-
strictions, prohibiting monopolies finally took its toll (Borghese & Borgese, 2002).
The second M&A wave
The second wave of outstanding M&A activity took place from the mid 1910’s to the late
1920’s and was triggered by the post World War I economic boom (Borghese & Borgese,
2002). Due to harsh headwinds in regards to antitrust regulations, companies started to
explore vertical mergers (Sudarsanam, 2003). The second wave was characterized as merg-
ing for oligopoly8 (Stigler, 1950). The wave came to an end as a consequence of the stock
market crash in 1929, also known as Black Thursday9, and the following depression
(DePamphilis, 2003).
The third M&A wave
The third wave lasted from the mid to late 1960’s and was characterized as conglomerate
merger activity (Weston, Mitchell, & Mulherin, 2004). These mergers were mostly unre-
lated and targeted growth through diversification, caused by restrictions on horizontal and
vertical mergers (Sudarsanam, 2003), (Borghese & Borgese, 2002). Consequently, the
third wave resulted in a strategic shift in competition towards peripheral areas of interest
(Weston, Mitchell, & Mulherin, 2004). The stock market became of great interest, but did
often not represent the correct value of a company, which resulted into overpricing
(Borghese & Borgese, 2002). The oil crisis10 and following inflation, which caused an ad-
ditional economic slowdown, stimulated the end of the wave (Sudarsanam, 2003).
7 Monopoly – a high amount of control a company has over a market segment’s specific product or service with high entry barriers to that market. 8 Oligopoly – the dominance of a small number of sellers in a market and the influence by each other to agree on decisions and by controlling the market. 9 Black Thursday, 1929 – most value-destructive Stock market crash in US history on the 24th October 1929, which leads to a 12 year depression. 10 Oil crisis – political and economic crisis in the beginning and end 1970’s due to oil shortages by reducing oil productions.
11 | P a g e
The fourth M&A wave
In the 1980’s the fourth M&A wave surfaced (Borghese & Borgese, 2002). Weston et al.
(2004) interpreted the wave as the decade of greed. Escalating hostile takeovers and the
divestures of previously acquired unrelated conglomerates were characteristic for this peri-
od (DePamphilis, 2003). Hence, acquired companies were split into separate entities and
sold in parts after the takeover (Shleifer & Vishny, 1991). The emergence of financial in-
novations, like leveraged buyouts (LBO)11, increased the possibility to finance such hostile
takeovers (Sudarsanam, 2003). The main source to finance takeovers dried up when legis-
lative restrictions were placed on the junk bond market12 and the biggest vendor of LBOs,
Drexel Burnham13, filed for bankruptcy (DePamphilis, 2003). The consequences of the
financial innovations of the 1980s resonated in the early 1990s when a vast amount of
companies went bankrupt due to the inadequately high costs of interest rates (Borghese &
Borgese, 2002).
The fifth M&A wave
The fifth wave of M&A activity occurred during the 1990s and lasted well over ten years
(Borghese & Borgese, 2002). Kleinert and Klodt (2002) characterize this period as the
wave of globalization and deregulation. The stock market maintained its bull market14
trend as new investment banks settled into the junk bond market and interest rates re-
mained low (Weston, Mitchell, & Mulherin, 2004). Climbing stock prices resulted in the
use of stock options15 and shareholder value as a way to align a company’s strategies
(Sudarsanam, 2003). Rivalry was intensified, fuelled by technologic inventions such as the
internet (DePamphilis, 2003). Deregulations during the fifth wave created opportunities to
privatize former national monopolies (Kleinert & Klodt, 2002). The decline of the fifth
11 Leveraged buyouts (LBOs) – acquisition of a company financed primarily by debt in order to create lev-erage. 12 Junk bond market – market of high yield bonds with high default risk, rated below investment grade when issued and thus paying a high coupon to make up for the additional risk of investors. 13 Drexel Burnham – one of the largest Wall Street investment banks, which mainly operated in financing M&A business by the use of junk bonds. It faced bankruptcy in 1990s, which lead to a sharp decline in the junk bond market and resulted in an economical downturn. 14 Bull market – increasing investments due to anticipated rises in stock prices. It describes upward trends and usually occurs in recovering economies. 15 Stock option – an advantage (given) to sell or buy a stock, but it is not obligatory.
12 | P a g e
wave was mainly triggered by the burst of the dot-com bubble16 on the turn of the 20th cen-
tury and the following economic downturn (Weston, Mitchell, & Mulherin, 2004).
Recent and current trends
Sherman and Hart (2006) refer to the most recent and sixth wave as the wave of the mega
deals. The sixth wave started in the early 2000s and lasted for the following five years.
2006 was the year of record M&A activity (Brealy, Myers, & Allen, 2008). Characteristics
for this wave were the emergence of private equity financing17 and foreign direct investors
as well as the search for true synergies across the globe (Marks & Mirvis, 2010).
The interrelation of M&A activity and economic up- or downturns is a recurrent theme in
the history of merger waves.
2.2.2. BEHAVIORAL CATALYSTS IN MERGERS & ACQUISITIONS
Researches such as Harford (2005) claim M&A waves not only to be a result of economic
biases, but just as much of behavioral influences. As a result of managerial behavior, fads
develop, last for some time and vanish again (Sahlin & Wedlin, 2010). Shleifer and Vishny
(2003) as well as Rhodes-Kropf and Viswanathan (2004) developed models showing the
impact of managerial behavior as underlying reason for M&A waves.
Hubris
The selfish behavior of management and its impacts on acquisitions has been assessed by
Roll (1986). Roll (1986) claims that overpriced premiums paid in an acquisition process
result from the overestimation of increase in value. He argues that value does not accumu-
late in M&As due to hubris. This overestimation is triggered by the management’s arro-
gance and belief that they are entitled to make the best decisions and therefore destroy val-
ue (Seth, Son, & Pettit, 2000). Roll (1986), who was the first to classify management’s
behavior in the context of M&A activities, refers to it as hubris.
Markets and management are expected to behave rational and thrive for their equilibrium
(Peters, 2005). Rational decision making provided, acquisitions are supposed to result in an
increase of value for the buyer (Roll, 1986). However, an imbalanced market reflects up on
the irrational behavior of management and does not add value to an M&A investment
16 Dot-com bubble – climaxed in 2000, speculative bubble in IT-segment, with a lot of price misevaluations. 17 Private equity – institutional and recognized investors that make investments directly into private compa-nies and offer big amounts of money for a long period of time.

13 | P a g e
(Hayward & Hambrick, 1997). An example of overvaluation is the occurrence of bidding
wars in acquisition, resulting in prices beyond realistic dimensions (Borghese & Borgese,
2002). Managers risk being excluded, if they disobey market’s rules (Peters, 2005). Man-
agers infected by hubris will not retreat from the bid unless they face serious personal
harms (Roll, 1986). They will not consider the best interest of the company any longer, but
thrive for self-fulfillment (Hayward & Hambrick, 1997). Especially retreating from a bid
shows weakness and implies the lack of resources to acquire the target (Roll, 1986).
Overvalued bids are more likely to be accepted during economic peaks as managers easily
overestimate synergetic effects (Rhodes-Kropf & Viswanathan, 2004). They accept inter-
nal overpricing as a reason of asymmetrical information, assuming the company is under-
valued externally (Malmendier & Tate, 2008).
Managerialism
Anticipated, rational behavior also reflects in managerialism, which is very similar to hu-
bris, but puts an emphasize on the managers behavior to accumulate personal benefits at
the expenses of their employers and shareholders (Seth, Son, & Pettit, 2000). This means
that managers would rather increase the size of a company to gain power than consider
possible low downs (Buckley & Ghauri, 2002). Borghese and Borgese (2002) rank the
unhealthy pride of managers very high in the catalogue of motives to undergo M&As,
which they consider very immoral. Managers truly believe to act in the best interest for
their company even though they are knowingly disregarding shareholders interests and are
destroying value (Malmendier & Tate, 2008). The reason for M&A waves to mostly occur
in economic upturns is due to the increase of cash flows18, which lead to a decrease in fi-
nancial constraints and thus makes it more likely for managers to get away scot-free
(Harford, 2005). Behavioral patterns can become widely accepted if they seem to structure
social behavior and benefit the participant (Peters, 2005). Another differentiation of mana-
gerialism to hubris is the management’s conscious state of their unethical actions
(Gaughan, 2007).
18 Cash Flow (CF) - the cash in- and outflows of a business over a fixed period of time. It can be computed directly by adding up the cash flows from operating, financing and investing activities or indirectly derived from earnings.

14 | P a g e
Herding
According to Sudarsanam (2003), within an industry competitors are orientating itself on
one another and the moves they make. This triggers domino effects with close and similar-
ly adopted strategies amongst opponents. Some industries are more prone to imitation than
others (Sahlin & Wedlin, 2010).
Depending on the timing of the implementation of a certain strategy, the success or failure
of a company is often determined (Sudarsanam, 2003). In regards to the point of execution
of a new strategy, there can be found so called first movers19 or “me-too” runners20
(Sudarsanam, 2003). The “me-too” behavior is also described as herd behavior or herding.
That behavior can be defined as identical, collective behavior of individuals without them
exchanging information (Johnson, Jefferies, & Hui, 2003). Johnson et al. (2003) claim
herding to be unconscious or irrational even though individuals perceive their behavior as
rational. However, herding is triggered by an underlying coordination mechanism
(Devenow & Welch, 1996). Sahlin and Wedlin (2010) describe imitation as guide for
trends, following certain ideas, models or practices. Imitation consists not only of self iden-
tification, but also of recognition as it shapes identities (Sahlin & Wedlin, 2010). If a man-
gers lacks trust in their own decision making abilities, imitation is carried out rationally. If
other manager’s behavior is unconsciously copied, Devenow and Welch (1996) speak of
non-rational imitation. Rational herding appears in cascades, which leads to exponential
imitation (Bikhchandani, Hirshleifer, & Welch, 1992).
The most explicit example of correlating herding behavior is the culture towards mistakes.
If an individual and many others make the same mistakes, the mistake will not be detected
as the individual’s fault (Bikhchandani, Hirshleifer, & Welch, 1992). An idea becomes
justifiable and valid as being essential when key actors embrace them (Sahlin & Wedlin,
2010).This uniformity can even lead to following others in their decision albeit an individ-
ual has the information that such a decision is fatal. Furthermore, Devenow and Welch
(1996) state that the importance of information is measured by its popularity. If others ac-
quire information, than it is perceived as important and a crowd of people seems not be
wrong. These examples prove the unconsciousness of herding. Individuals are expected to
act rationally on behalf of their knowledge, still they blindly follow the crowd (Johnson,
19 First mover – individuals that take the initial first move on a market. 20 Me-too runner – follows the first mover. Fears to miss out on the current trend, but does not really have an idea on the reasons for the underlying momentum.

15 | P a g e
Jefferies, & Hui, 2003). Devenow and Welch (1996) consider herding as one of the major
impacts of creating merger waves and consider this cluster behavior as evidence for trends
and manias.
Herding and hubris have one thing in common: their irrationality and lack of conscious-
ness. Managers are considered to reasonably reflect on the economic value of an invest-
ment without self-interest or influences by others and accurately evaluate the investment’s
appeal to the company (Seth, Son, & Pettit, 2000).
2.3. VALUE CREATION IN MERGERS & ACQUISITIONS
The motives to undergo M&A are usually the creation of value within the company. Value
is created by synergetic effects, which are complicated to measure, because the outcome of
multiple scenarios must be estimated (Bradley, Desai, & Kim, 1988). Therefore, an acqui-
sition is often overpriced and does not correspond to the value of the target company
(Borghese & Borgese, 2002). This makes it necessary to correctly evaluate the target com-
pany by using a model that suits the characteristics of the assets being evaluated
(Damodaran, 2002). Bradley et al. (1988), point out that synergies should provide a mutual
financial gain or an increase in market power.
According to Damodaran (2002), the value of a synergy can be described by the greater
value of the two merging companies combined in contrast to their lower value apart as
Figure 2 shows. However, the synergy hypothesis describes an ideal scenario.
! !" > ! ! + ! !
Where V(AB) = value of A and B combined, V(A) = value of firm A, operating independently, V(B) = value of firm B, operating independently.
Figure 2: The synergetic value effects of M&As (Damodaran, 2002)
The choice of valuation method depends on the different perceptions of value of the tar-
get’s value to the acquirer (Koller et al., McKinsey & Company, 2010). Young start-up
companies are more difficult to evaluate than companies in a mature environment
(Damodaran A. , 2002). Evaluation results are highly biased by economic predictions made
to compute the model (ibid.). Market efficiency assumes that investors are on the lookout
for over or under evaluation to create a profit from the deviation (ibid.). However, market

16 | P a g e
inefficiency implies that mistakes will be corrected eventually (ibid.). Studies have shown
that some market segments are more prone to inefficiency than others.
2.3.1. THE DISCOUNTED CASH FLOW MODEL
The DCF21 is commonly used to estimate a firm’s worth (Barker, 2001). Damodaran
(2002) states that most valuation models build up on the DCF and it is said to have a high
level of objectivity. Contrarily to market approaches, the DCF considers a company’s in-
trinsic value. Market approaches can be heavily influenced by market fluctuations
(Rosenbaum & Pearl, 2009).
The ability to generate cash flows (CFs) reflects the capability of a company to create
shareholder value. Shareholders frequently seek for investments that reliably earn them a
steady return in the long-run, as CFs are driven by long-term development and returns on a
firms investments and earnings (Koller et al., McKinsey & Company, 2010). Kaplan and
Ruback (1995) affirm the DCF to be superior to other evaluation methods like for example
comparables.
The DCF model is used to estimate a company’s value by discounting a company's future
free cash flows (FCF)22 to their present value (PV)23 (Gaughan, 2007). Hence, the entity's
value is estimated in regards to future earnings discounted to its current market price
(ibid.), representing the intrinsic value of a company (Damodaran, 2002). The valuation
approach computes the company’s equity as value of its operations less its market value of
debt (Koller et al., McKinsey & Company, 2010). The value of operations is reflected in
future FCFs. These describe the amount of money that a company can payout to share-
holders after it covered for all investments essential for the company to grow like invest-
ments in the working capital24 and other capital assets (Brealy, Myers, & Allen, 2008). In
other words, the FCF is the difference of cash in- and outflows available to shareholders
(DePamphilis, 2003). When valuating business in the context of M&As, the DCF model
embraces future revenue increases or cost reductions that can be anticipated in such special
situations (Brealy, Myers, & Allen, 2008).
21 For further explanations on the principles of the DCF and its origin, refer to (Brealy, Myers, & Allen, 2008). 22 Free Cash Flow (FCF) – cash flow that is possible to distribute to their securities holders. 23 Present Value (PV) – the value of an investment at present. 24 Working Capital – current assets of a company less current liabilities.
17 | P a g e
The selection of an accurate discount rate25 r, chosen to discount the future FCFs to their
current value has a grave impact on the PVs result. The discount rate corresponds to the
company’s risk. The higher the risk of an investment is projected, the higher the discount
rate (Gaughan, 2007). The risk is measured relative to a risk-free investment in federal
treasury bills with a maturity up to ten years (ibid.).
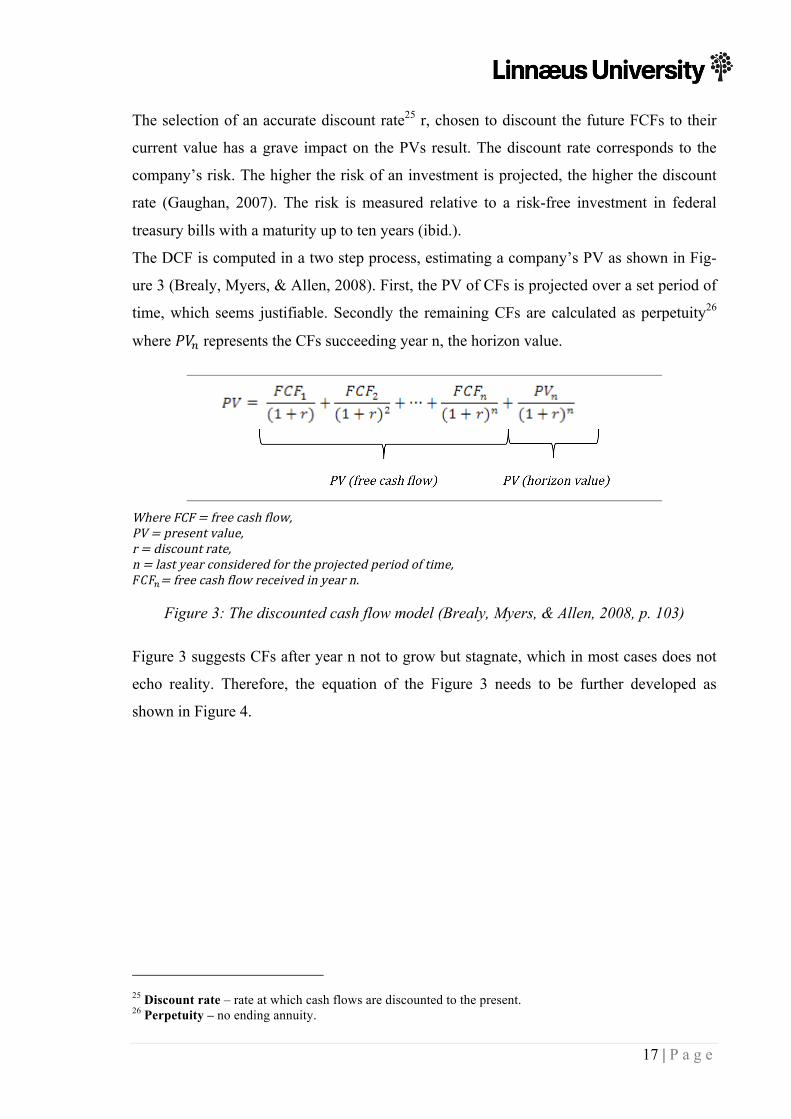
The DCF is computed in a two step process, estimating a company’s PV as shown in Fig-
ure 3 (Brealy, Myers, & Allen, 2008). First, the PV of CFs is projected over a set period of
time, which seems justifiable. Secondly the remaining CFs are calculated as perpetuity26
where !"! represents the CFs succeeding year n, the horizon value.
Where FCF = free cash flow, PV = present value, r = discount rate, n = last year considered for the projected period of time, !"!!= free cash flow received in year n.
Figure 3: The discounted cash flow model (Brealy, Myers, & Allen, 2008, p. 103)
Figure 3 suggests CFs after year n not to grow but stagnate, which in most cases does not
echo reality. Therefore, the equation of the Figure 3 needs to be further developed as
shown in Figure 4.
25 Discount rate – rate at which cash flows are discounted to the present. 26 Perpetuity – no ending annuity.

18 | P a g e
Where FCF = free cash flow, PV = present value, r = discount rate, n = last year considered for the projected period of time, !"!!= free cash flow received in year n, g = growth rate after year n.
Figure 4: Discounted cash flow model considering growth after year n (Gaughan, 2007, p.
536)
The future FCF of year n, the horizon value, is multiplied by the growth rate g, which dis-
plays the estimated growth of future FCFs (Gaughan, 2007). This future FCF is perpetual
as displayed in Figure 4 above the second curly bracket. This part of the equation serves to
explain the perpetuity in more detail. To estimate the perpetuity of FCFs after year n, a two
step process is applied. The FCF of the year n+1 is projected by multiplying year n’s FCF
by the growth rate (1+g). Next, the value of the conclusion is divided by the cost of capi-
tal27 to compute the PV of year n+1 and from then on (Gaughan, 2007). This result pre-
sents the PV at the start of year n+1. Afterwards, computing the PV in year 0 of all future
FCFs for year n+1 and thereafter, the PV of year n+1 is divided by (1+ !)! (ibid.). The
final result is the perpetuity, which combined with the FCFs of the previous years to n,
equals the PV and thus the total shareholder value of the evaluated company.
As mentioned earlier, the determination of an adequate discount rate is vital as it represents
the risk of the reviewed company. The CFs, shown in Figure 4, need to be adjusted for the
underlying capital structure to fairly address the expected returns. Therefore, thought has
been given to the capital structure of equity and debt which contributes to a company’s
value determination (Berk & DeMarzo, 2007). FCFs reflect a company's earnings plus
noncash charges less investments in working capital or fixed assets (Koller et al., McKin-
27 Cost of capital – determined by the minimum return shareholders expect from taking a specific investment risk.
19 | P a g e
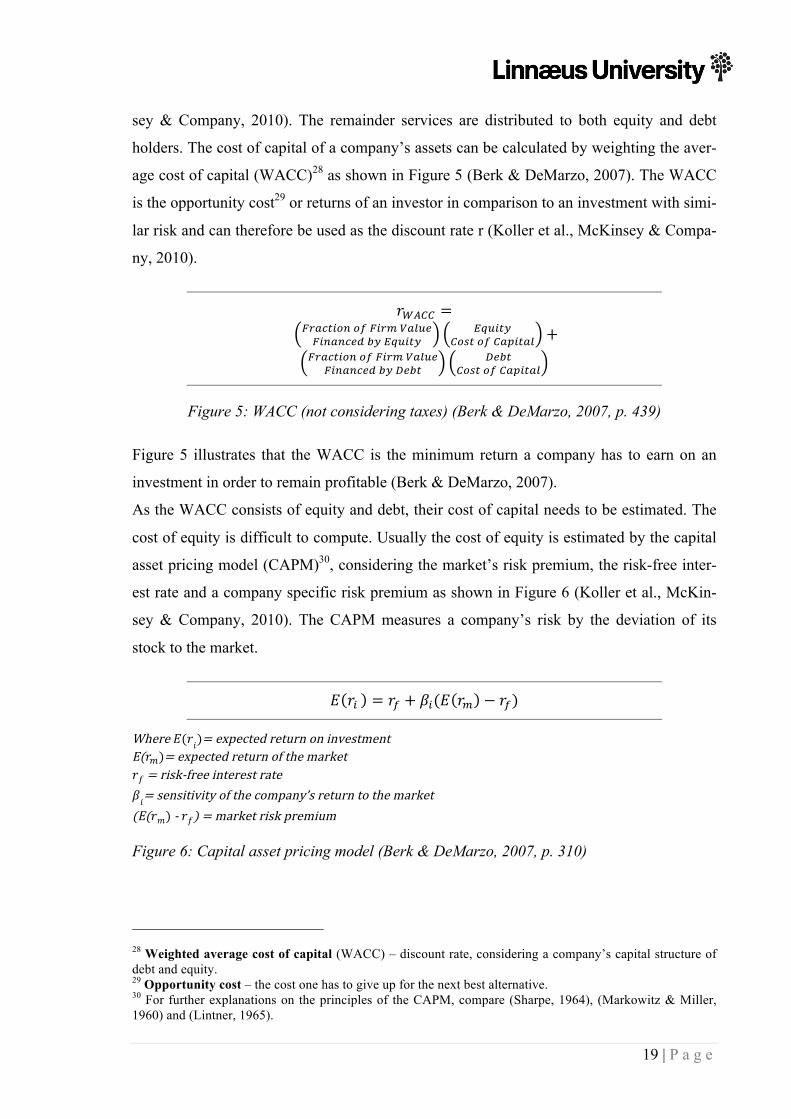
sey & Company, 2010). The remainder services are distributed to both equity and debt
holders. The cost of capital of a company’s assets can be calculated by weighting the aver-
age cost of capital (WACC)28 as shown in Figure 5 (Berk & DeMarzo, 2007). The WACC
is the opportunity cost29 or returns of an investor in comparison to an investment with simi-
lar risk and can therefore be used as the discount rate r (Koller et al., McKinsey & Compa-
ny, 2010).
!!"## = !"#$%&'( !" !"#$ !"#$%!"#$#%&' !" !"#$%&
!"#$%&!"#$ !" !"#$%"& +
!"#$%&'( !" !"#$ !"#$%!"#$#%&' !" !"#$
!"#$!"#$ !" !"#$%"&
Figure 5: WACC (not considering taxes) (Berk & DeMarzo, 2007, p. 439)
Figure 5 illustrates that the WACC is the minimum return a company has to earn on an
investment in order to remain profitable (Berk & DeMarzo, 2007).
As the WACC consists of equity and debt, their cost of capital needs to be estimated. The
cost of equity is difficult to compute. Usually the cost of equity is estimated by the capital
asset pricing model (CAPM)30, considering the market’s risk premium, the risk-free inter-
est rate and a company specific risk premium as shown in Figure 6 (Koller et al., McKin-
sey & Company, 2010). The CAPM measures a company’s risk by the deviation of its
stock to the market.
! !! = !! + !!(! !! − !!)
Where !(!!)= expected return on investment E(!!)= expected return of the market !! = risk-‐free interest rate !!= sensitivity of the company’s return to the market (E(!!) -‐ !!) = market risk premium
Figure 6: Capital asset pricing model (Berk & DeMarzo, 2007, p. 310)
28 Weighted average cost of capital (WACC) – discount rate, considering a company’s capital structure of debt and equity. 29 Opportunity cost – the cost one has to give up for the next best alternative. 30 For further explanations on the principles of the CAPM, compare (Sharpe, 1964), (Markowitz & Miller, 1960) and (Lintner, 1965).
20 | P a g e
The risk-free interest rate is set by referring to government bonds as they are default free
(Pratt & Grabowski, 2008). The market risk premium, respectively equity risk premium, is
the additional, higher return of an investment over the market (ibid.). It can be retrieved
historically (Damodaran A. , 2002). An approach, which further develops the CAPM has
found wide acceptance, the Fama-French three factor model. It will not be elaborated in
this research due to time restrictions.
The cost of debt represents the interest paid by a company on its debt. Since interest ex-
penses are tax deductible, tax reduction need to be taken into consideration as well.
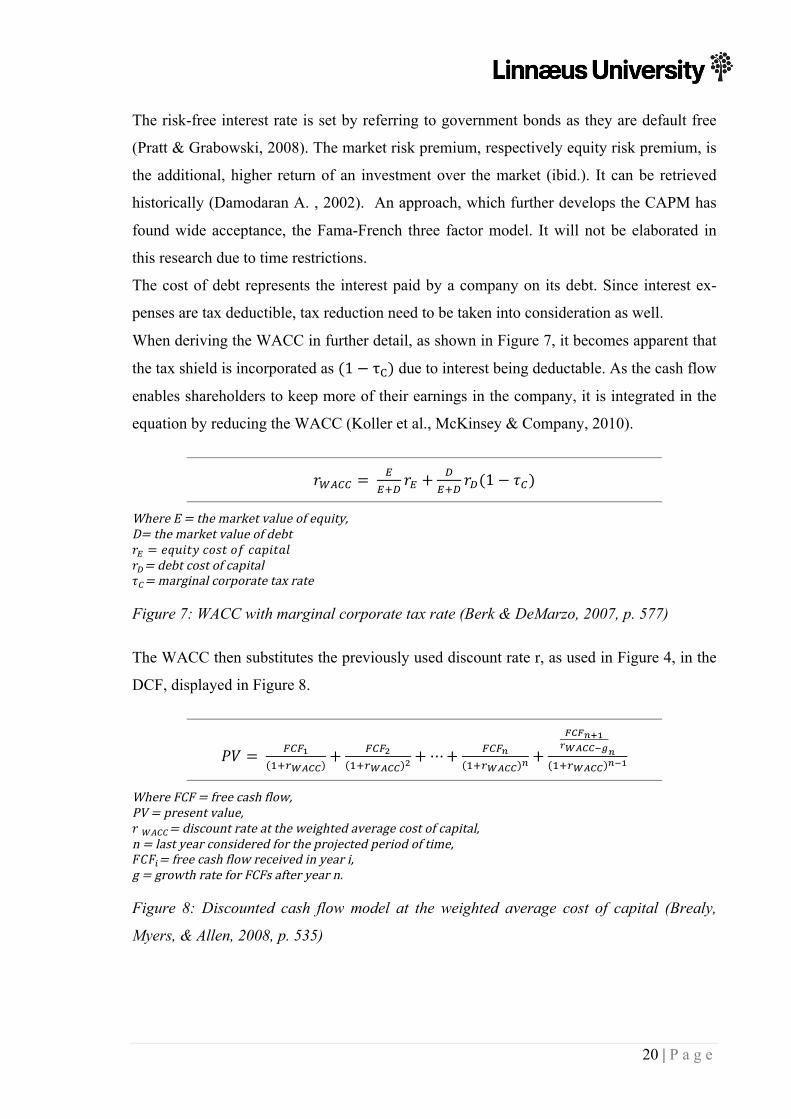
When deriving the WACC in further detail, as shown in Figure 7, it becomes apparent that
the tax shield is incorporated as (1− τ!) due to interest being deductable. As the cash flow
enables shareholders to keep more of their earnings in the company, it is integrated in the
equation by reducing the WACC (Koller et al., McKinsey & Company, 2010).
!!"## = !
!!!!! +
!!!!
!!(1− !!)
Where E = the market value of equity, D= the market value of debt !! = !"#$%& !"#$ !" !"#$%"& !!= debt cost of capital !!= marginal corporate tax rate
Figure 7: WACC with marginal corporate tax rate (Berk & DeMarzo, 2007, p. 577)
The WACC then substitutes the previously used discount rate r, as used in Figure 4, in the
DCF, displayed in Figure 8.
!" = !"!!!!!!"##
+ !"!!!!!!"## ! +⋯+ !"!!
!!!!"## ! +!"!!!!!!"##!!!!!!!"## !!!
Where FCF = free cash flow, PV = present value, ! !"##= discount rate at the weighted average cost of capital, n = last year considered for the projected period of time, !"!!= free cash flow received in year i, g = growth rate for FCFs after year n.
Figure 8: Discounted cash flow model at the weighted average cost of capital (Brealy,
Myers, & Allen, 2008, p. 535)
21 | P a g e
3 . M ETHODOLOGY
Research methodology can either be conducted qualitatively or quantitatively in respects
of research design and structure. The quantitative approach accentuates the quantification
of data collected and the application of natural science laws, whereas qualitative ap-
proaches are focused on the description (Bryman & Bell, 2007).
3.1. RESEARCH DESIGN
This study was conducted as case study, being tied to one organization, Boss Media AB.
The case study was executed using a qualitative approach. The qualitative approach was
accomplished by a case study to get a better and more intense insight on the topic of
M&As in accordance to Bryman and Bell (2007). Moreover, is a case study defined as
being of descriptive, more social nature (ibid.). Looking up on a contemporary case study
and including historical background information, fits with the proposed definition of a
qualitative approach by Bryman and Bell (2007). The qualitative approach was also chosen
as it suggests interpretivism over numerical evaluation. Even though the case study evalu-
ates annual reports, they are interpreted in regards to the case study’s objective’s roadmap.
Additionally, captures a case study a comprehensive and more emotional picture than a
survey could. The authenticity of the case study is of great concern due to the social aspect
of behavioral patterns beneath trends.
The first part of the research was conducted by an interview. However, the outlooks from
annual reports of Boss Media AB were considered as well. For a better insight on emerging
trends, statistics provided by institutions on M&As were taken into consideration as well.
The second part of the research, the assessment of value creation through calculations, was
mainly conducted through the annual reports of Boss Media AB from 2006 to 2007, illus-
trating data from 2002 to 2007. In addition, findings from interviews with Boss Media AB
were utilized as well as the annual report of GTECH Corporation from 2008. Additionally,
statistical surveys available from international and national institutions such as Statistics
Sweden, Sveriges Riksbank and KPMG International were used. Thus, the research was
carried out with a balanced mixture of interviews and data ascertainment.
3.1.1. SAMPLE
The case study’s object is a growing small size company, Boss Media AB, situated as a
B2B supplier in the gaming software industry. The sample was chosen due to the young
22 | P a g e
age of the online gaming industry and its rapid growth. Industries with high growth poten-
tial tend to be very competitive due to the fast moving pace of the market and thus trigger
strong M&A activity. The company was furthermore selected due to its representativeness
of an industry with very high M&A activity (Löfstrand, 2011). Additionally, obtained Boss
Media AB four companies from its foundation in 1996 to nowadays and was eventually
acquired itself in 2008 (Löfstrand, 2011).
As time frame of observation were the years from 2004 to 2007 chosen, as Boss Media AB
did not continue to exist as Aktiebolag31 after 2007, which would have made it very diffi-
cult to access information like annual reports. Additionally, the time frame of the observa-
tion was set to a maximum of four years as the average duration of employees is 2,7 years
(Boss Media AB, 2008). Four years seem reasonable, as there can still be employees found
who have experienced such a long time period, but have not yet left the company.
3.2. DATA COLLECTION
The data for this case study was collected by performing an interview as well as by statisti-
cal ascertainment from annual reports and institutional surveys. The interview’s structure
and realization started with the search for a representative interviewee, the deduction of
semi-structured questions and finally the interview. The compilation of data from the an-
nual reports was based on the information required to compute the DCF as described in
chapter 2.3.1.
3.2.1. REALIZATION
The realization describes how the data collection was implemented and carried out.
To get a variety of empirical materials, the interview was conducted with Andreas Löf-
strand, who holds the highest position at Boss Media AB in Sweden. Furthermore, annual
reports of Boss Media AB served to fill in financial data as well as institutional statistics.
Interviews
The interviews consisted of one major interview, which was semi-structured according to
Bryman and Bell (2007). Semi-structured interviews imply a selected portfolio of ques-
tions, which leave enough room to adjust them while interviewing. Therefore an interview
31 Aktiebolag – Similar to a joint stock company with no personal liabilities of the owners.
23 | P a g e
guide was used for the main interview, which can be found in appendix I.B.III. However,
this guide does not reflect all questions asked during the interviews as questions were
changed and adapted during the course of the conversation. These additional questions
made it possible to pick up on spontaneous ideas and remarks by the interviewee. Moreo-
ver, provide semi-structured interviews the option to further explain or deepen topics of
interest as more questions or ideas can come up during the course of the interview, but still
keep the interview focused enough to receive valid answers.
The major interview was held with Andreas Löfstrand, who is in charge of Boss Media
AB’s operations in Sweden. The interview lasted for approximately 60 minutes and was
held on the 29th of April 2011 at the office of Boss Media AB in Växjö. The complete in-
terview can be recapped in appendix I.B.IV. Before holding the main interview, an e-mail
interview was performed on the 21st of April 2011 in advance. Questions were sent out to
Andreas Löfstrand to give him the opportunity to prepare for the interview and pick up
information needed. Appendix I.B.II shows the e-mail interview with Andreas Löfstrand
from the 21st of April 2011, including his answers. This first interview with Boss Media
AB was used to further develop and deepen the following main interview.
The interview was recorded to ensure no loss of data. The interviewer’s roles were separat-
ed. One of the three attendants posed the interview questions whereas the other two people
took notes. This division was chosen to avoid confusion on the behalf of the interviewee
with one clear contact person.
Statistical ascertainment
The annual reports of Boss Media AB from the years of 2006 to 2007 were directly re-
trieved from Boss Media AB and investigated in regards to the collection of data for the
DCF described in chapter 2.3.1.
Relevant information from the annual reports of Boss Media AB, especially the balance
sheets and income statements, were taken and transferred in an excel sheet to affirm opti-
mal processing and transparency. These data can be retraced in appendix I.C.I and I.C.II.
From there ratios and financial evaluations were derived as shown in Figure 11 to Figure
22. To be able to calculate the DCF, additional data was needed. Thus, information such as
interest rates and market risk premiums were provided by Statistics Sweden, Sveriges
Riksbank and KPMG International. To allow further insights in the acquisition process of

24 | P a g e
Boss Media AB by GTECH Corporation, the annual report of Lottomatica Group32 from
2008 as well as press releases by GTECH Corporation were consulted.
3.2.2. OPERATIONALIZATION
The operationalization helps to connect theory and empirical investigation by ensuring that
only relevant data is collected, implied by the theory. An overview of the operationaliza-
tion can be found in appendix I.A.
As M&A is a very broad and inexact expression, the term was precisely defined in chapter
2.1. Merged companies work together equally in a new found corporation. A merger can
be split into horizontal, vertical and conglomerate mergers (Borghese & Borgese, 2002).
Horizontal mergers occur in similar industries, structures or product ranges (Sudarsanam,
2003), whereas vertical mergers aim to increase the benefits of value chains (DePamphilis,
2003). Conglomerate mergers seek to diversify risk (Weston & Mansinghka, 1971).
An acquisition is the controlling interest in another company (DePamphilis, 2003). Acqui-
sitions can be distinguished into hostile and friendly acquisitions. Both differ significantly.
Hostile acquisitions describe the purchase of a target without their agreement (Bragg,
2009), whereas friendly acquisitions are negotiated (Weston, Mitchell, & Mulherin, 2004).
Due to different structures and purposes of M&A designs it is essential to be able to speci-
fy where Boss Media AB fits in. Moreover, the M&A design provides reasons for the
transaction’s success or failure. Thus, the initial questions posted, related to the chosen
M&A design by Boss Media AB, including definitions of mergers and acquisitions in the
interview guide to help the interviewee to choose correctly. To assure the fit of the theoret-
ical background with the case study’s object and the most precise answers by the inter-
viewee as well as the desired purpose, the two main approaches in M&A, mergers and ac-
quisitions were dealt with.
A further question to deepen the previous one was asked. The interviewee had to decide
which design Boss Media AB followed and whether Boss Media AB underwent a friendly
or hostile acquisition. To identify advantages and disadvantages in these designs, the inter-
viewee was asked to elaborate the decision for the one design over the other.
To be able to answer the research question, the field of M&A needed to be narrowed down
even further. During the evaluation of theory, it became evident that there is a missing link 32 Lottomatica Group – the world’s largest lottery operator. Holding company of GTECH Corporation.
25 | P a g e
in research about the underlying patterns of trends in M&A. Literature does not agree on a
clear definition of a trend. Hence, historical M&A waves were explored because their
movement made it possible to observe up- and downward trends in M&A activity.
Each M&A wave refers to a specific type of M&A (Weston, Mitchell, & Mulherin, 2004).
Therefore, patterns could be detected which are causing M&A waves. The M&A waves
are closely correlated to economic up- and down turns (DePamphilis, 2003). Consequently
the timing of when Boss Media AB merged was insightful. Showing Figure 28 and Figure
29 to the interviewee and having him point out the date of merging and the correct industry
did help to compare the date of the acquisition with the economic climate during that peri-
od. As Boss Media AB did not merge during an economic upturn it was asked how much
Boss Media AB was influenced by the recessions during the date of merging. These time
frames were important to find out whether Boss Media AB was following a general trend,
a trend specific to the online gaming industry or no trend at all. Being aware of the point in
time when Boss Media AB merged, it was interest to find out about characteristics of the
wave, like synergetic effects or foreign investments, and whether they are applicable to
Boss Media AB and GTECH Corporation. Synergies create sustainable growth, which rep-
resents another aspect, the research wants to find out about. Thus, it was asked what syner-
getic effects Boss Media AB expected from the acquisitions and why they expected them
especially from targets abroad.
Throughout history technological development triggered growth and M&As. The internet
created a new field of businesses which is not as much regulated as mature industries. Due
to the young age and high competition of the online gaming industry there is a lot of M&A
activity. Löfstrand was hence asked to elaborate his thoughts on the increase of M&A ac-
tivity in the online gaming industry.
To find reasons that cause M&A waves, there was a need to look at the topic more closely
by discovering underlying triggers of M&A waves. As shown in chapter 2.2.2, researchers
found out that not only economic factors influence M&A waves, but just as much behav-
ioral ones. Therefore, herding, hubris and managerialism were chosen for further investi-
gating behavioral causes for M&A waves.
Herding is the imitation of other people’s behavior (Sahlin & Wedlin, 2010). To affirm or
disprove, that M&As are influenced by behavior, it was asked whether Boss Media AB
considers itself as a first mover or if they could see patterns of herding in the online gam-
ing industry. Additionally, the reasons for GTECH Corporations decision to acquire were
26 | P a g e
conducted. This was necessary to find out about whether Boss Media AB set a trend in the
industry and whether they caused a domino effect.
Roll (1986) was the first to talk about the hubris hypothesis, which means that managers
overestimate their judgment. One way to find out about hubris in general is to look at ef-
fects on companies during a crisis, since managers with hubris are willing to pay more for
an investment. The share price of Boss Media AB was observed before, during and after
the announcement of their acquisition by GTECH Corporation to find out about acquirer’s
willingness to pay.
The interviewee was asked to describe Boss Media ABs impact by the two most recent
crises. Additionally, the topic of overpricing in the IT sector was dealt with.
Managerialism means that managers knowingly avoid shareholders interest, but act in their
own best interest (Seth, Son, & Pettit, 2000). The management’s decision leads the way for
the future of a company. Therefore, managerial behavior considerably influences future
successes or failures in an M&A decisions. Thus, it was vital to know who made the deci-
sion at Boss Media AB and GTECH Corporation to undergo an acquisition in regards to
hubris behavior. Moreover, was determined whether the interviewee considers M&As in
the gaming industry as a way to display power.
To answer whether M&A activity really creates sustainable value, it seemed logical to re-
flect on the topic from a different angle as well. One way to find out about an investment
being valuable and thus inadequately priced is by calculating it by acknowledged models.
Synergetic effects which create value in a company are difficult to measure. Therefore, the
DCF, the most commonly used model to estimate an entity’s value in practice (Barker,
2001), (Brealy, Myers, & Allen, 2008), was applied on Boss Media AB to derive its in-
vestment value. It was decided to use an approach that considers intrinsic value and future
growth to create as much insight as possible. A market approach was added to validate the
results. Moreover, Boss Media AB was asked how they evaluate investments, which mod-
els they rely on and which assumptions are made prior to an acquisition. Elofsson and
Wiklund (2007) explain in their interview in the annual report of 2006, the importance of
using the DCF in combination with multiples to measure an investment.
To estimate the enterprise value of Boss Media AB and possible correlating over- or under
pricing, the DCF was derived. Therefore, PVs of FCFs and the PV of the terminal value
were identified. The PV can only be estimated when discounted at an accurate discount
rate, the WACC. The WACC is computed by considering Boss Media ABs capital struc-

27 | P a g e
ture. Boss Media ABs debt and equity are weighted. The cost of equity is made up of the
market’s risk-free interest rate, market premium, beta and a size premium, where as cost of
debt is calculated by the cost of interest of credit institutions.
The PV of the terminal value considers FCFs after the last year of the projection period as
perpetuity. Hence, a growth rate needs to be applied to the FCF of last year of the projec-
tion period.
To verify the findings from the calculation of Boss Media, the price per share is compared
to the actual price paid by GTECH Corporation as well as sensitivity analyses were con-
ducted to create awareness for biases.
3.3. RESEARCH QUALITY
The research quality serves to critically reflect up on the information collected for this re-
search. Therefore, the research quality considers literature, interviews, the annual reports
of Boss Media AB and GTECH Corporation as well as institutional statistics in regards to
validity, reliability and credibility (Bryman & Bell, 2007).
3.3.1. VALIDITY
Validity ensures that only relevant data, contributing to the research’s objective is collect-
ed. It furthermore warrants the replicability for future studies (ibid.).
Due to a well executed operationalization, an interview guide was derived that contributed
to answering the research question. Narrowing down the interview questions as much as
possible helped to measure the intended variables. Therefore, the influences of underlying
patterns in social behavior and value creation became apparent in the M&A activity of
Boss Media AB.
In the DCF to calculate Boss Media AB’s value, the variables needed are fixed. Thus, no
unnecessary data was collected.
3.3.2. RELIABILITY
Reliability reflects the trustworthiness of sources to guard biases (Bryman & Bell, 2007).
The theoretical part showed the complexity of the M&A field. Therefore, it was important
to reflect on the topic from different angles and thus apply interviews as well as statistical
ascertainment and not rely on only one research approach.
Narrowing down the topic of M&As made it possible to ask for follow up questions and
ensured the ability to replicate the research. Even though the interviews were conducted
28 | P a g e
semi-structured, the interview guide could be reused and the results would be similar. Ad-
ditionally, the annual reports are highly reliable as they are based on accounting laws and
standards.
3.3.3. SOURCE CRITICISM
Literature
The literature used consists of academic articles and textbooks with both primary as well as
secondary sources. Primary sources are sources issued by the creator of an idea or concept,
whereas secondary sources interpret and develop the original thought further. However,
primary sources were preferred due to their higher reliability. Primary sources were used in
chapter 0, describing the foundation of models. Thus, the original source was reviewed in
order to find the author who first presented the models idea for an unbiased impression.
Even though it was attempted to only use literature which is not older than ten years, some
primary and historic sources required to use literature older than that. Therefore, based on
the primary sources, secondary literature which further developed the original problem was
used to highlight current issues and an up-to-date view on the research’s objective to en-
sure reliability. Moreover, standard literature by experts of their fields, such as Brealy,
Myers, Allen, is considered more reliable than works from unknown researchers (Bryman
& Bell, 2007). Literary sources were compared in regards to alikeness as credibility is
much higher when independent sources enclose the same information or conclusions
(ibid.).
Interviews
Interviews need to be looked at very carefully as they are seldom objective. Narratives are
less reliable than relicts and the quality and answer of an interview question depends very
much on how it was posed in the first place. To assure unbiased answers of the interview-
ees, questions were posted openly and the opportunity for anonymous interviews was giv-
en. However, it needs to be considered that the interviewee has the best interest for its
company and is very unlikely to reveal displeasing information. As the interviewee Andre-
as Löfstrand has a highly ranked position it becomes even more unlikely for him to deliver
unpleasant answers not to jeopardize his job. Therefore, some questions were placed with a
negation to avoid biased tendencies.
The closeness of the interviewee’s to the M&A activities of Boss Media AB, were of great
concern as the employment period at Boss Media AB is 2,7 years by average (Boss Media
29 | P a g e
AB, 2008). This made it difficult to find staff that experienced the acquisitions in 2008, but
have since not left Boss Media AB. It was ensured that the interviewees experienced the
M&A activities of Boss Media AB.
Statistical Ascertainment
The statistical material used consisted of the annual reports of Boss Media AB from 2006
to 2007, offering data from 2002 to 2007. As they are approved and processed according to
accounting standards as well as Swedish and international accounting law, they are highly
credible. Nevertheless, valuation options grant rights, but not obligations to present finan-
cial statements in a favorable light. It also needs to be taken into consideration that finan-
cial statements are the one major communication tool with investors and thus try to empha-
sis positive aspects of a company. In need for beneficial financing terms, a fruitless fiscal
year might be concealed by glorious future projections. Therefore, it is helpful to have
more than one annual report of a company for comparison.
Additionally, national statistics by Statistics Sweden and Sveriges Riksbank were added to
ensure the highest possible credibility when calculating the enterprise value of Boss Media
AB. For further business valuation related data, an international study by KPMG Interna-
tional on the cost of capital were consulted. These studies are highly transparent and easily
to follow as they candid their methods and are subject to a large sample size. Each study
was compared among each other to confirm their results.
For more detailed information about the transaction process of Boss Media AB by GTECH
Corporation, annual reports and press releases of 2008 were taken into account. The annual
report and press releases of Lottomatica Group and GTECH Corporation were mainly used
to back up interview information on the acquisition in regards to share price developments.

30 | P a g e
4 . EM PIRICAL INVESTIGATION
This research was conducted by an interview as well as the collection of statistical ascer-
tainment of annual reports. Both sources of main empirical material were provided by one
company, Boss Media AB. Additionally, data from institutional organizations was collect-
ed as well as the annual report of GTECH Corporation.
4.1. THE CASE STUDY – BOSS MEDIA AB
The case study focuses on one company, Boss Media AB. Before the company itself is
explained, the industry, the company operates in is described.
4.1.1. INDUSTRY BACKGROUND - THE ONLINE GAMING INDUSTRY
Online gaming is one of the fastest growing markets in the gaming industry (Axelsson,
2011). The first companies started to operate in the mid 1990s. Even though it is a relative-
ly new market, five to 13 percent of the total gaming market belongs to online gaming
(Boss Media AB, 2007). The annual growth of the online gaming market is estimated with
22 percent over the time period from 2003 to 2008 of which online poker is the fastest
growing market with an estimated growth of 43 percent a year (Boss Media AB, 2007).
This is mainly due to a growing social acceptance of online gaming (Boss Media AB,
2008). Boss Media ABs market share was approximately four percent in 2006 (Boss Media
AB, 2007).
Due to its young age there are only few participants in the online gaming industry. It is
expected that 100 companies are competing in the market, few of them offering the prod-
uct breadth Boss Media AB can contribute (Löfstrand, 2011). Serious competitors are
CryptoLogic and Microgaming as well as Playtech33 from Sweden (Boss Media AB,
2007).
However, the online gaming industry is very complex and inscrutable due to its partly
semi-legality which puts it in a grey market spot (Löfstrand, 2011). Nevertheless, state-
33 Compare appendix I.B.I for an overview of Boss Media ABs competitors.
31 | P a g e
supervised monopolies such as Svenska Spel34 are considered to be legal whereas compa-
nies such as PokerStars35 are black respectively illegal.
4.1.2. COMPANY BACKGROUND - BOSS MEDIA AB
Boss Media AB is a world leading software developer and supplier for the online gaming
industry in business-to-business (B2B) with operators being the largest group of customers.
Boss Media AB offers operational services and systems, licenses for gaming networks and
online gaming products such as poker or bingo (Boss Media AB, 2007). An emphasize is
put on offering software as a service (SAAS) as by now the service has outperformed the
revenues on software by 5 million Euros (Löfstrand, 2011). The company was founded in
1996 in Växjö, Sweden (Axelsson, 2011). Shortly after its foundation, on the 24th June
1999, Boss Media AB was listed on the OMX Nordic Exchange36 list in the Small Cap/IT37
segment (Boss Media AB, 2007). Core operations are executed from the company’s head
office in Växjö. Smaller sales offices exist in Canada, the UK, Curacao, Malta as well as
Sweden due to tax and representative reasons (Löfstrand, 2011).
Boss Media AB is active in the global market, but focuses mainly on Europe (Boss Media
AB, 2007). 96 percent of Boss Media ABs turnover is generated outside Sweden.
This was different in the company’s beginnings when it served business-to-customer
(B2C) relations. Boss Media ABs big break was in 1998, when an online casino was suc-
cessfully launched which then led to financial attention and support by investors. The busi-
ness strategy was changed to B2B when Boss Media AB realized that it would increase
their profits and reduce competition and cannibalization by taking that step. From there on
Boss Media diversified its software range from casinos to poker, bingo and developed
backup services as well as payment systems for the online gaming market place.
In 2008 Boss Media AB acquired Dynamic Idea, a software developer, but was eventually
acquired itself by GTECH Corporation38, which was bought by Lottomatica Group
(Axelsson, 2011). GTECH Corporation is a world leading, US company, situated in the
34 Svenska Spel – the largest, state owned gaming company in Sweden. 35 PokerStars – a popular, online poker gaming platform, which has recently been banned by the US authori-ties. 36 OMX Nordic Exchange – Aktiebolaget Optionsmäklarna/Helsinki Stock Exchange covering the stock exchange of Denmark, Sweden, Finland, Iceland, Lithuania, Latvia, Estonia, Armenia and Norway. 37 Small Cap/IT – company with small market capitalization in the IT sector. 38 GTECH Corporation – one of the leading gaming providers worldwide, situated in the US, subsidiary of Lottomatica Group, but acting independently.

32 | P a g e
traditional lottery sector. By acquiring a well established online gaming market leader, they
were opting for the new online market (Axelsson, 2011).
4.2. REVELATIONS FROM THE EMPIRICAL DATA
The findings from the collection of empirical data are presented. Outcomes of the major
and minor interviews as well as from the statistical ascertainment of annual reports and
institutional studies are aligned according to the topic of interest.
4.2.1. REVELATIONS FROM THE INTERVIEWS AND STATISTICAL ASCERTAINMENT
The main interviewee, Andreas Löfstrand, has started his career at Boss Media in 2005 as
an accountant and worked his way up to the top (Löfstrand, 2011). Today Löfstrand is re-
sponsible for the Swedish operations and for the finance functions. He is also a member of
the board. During his time at Boss Media AB he relocated several times throughout Europe
and the US.
Additionally, the annual reports of Boss Media AB were collected from 2006 to 2007, pro-
jecting a period from 2002 to 2007, to ensure the interview’s credibility in regards to the
transaction process. The annual report of Lottomatica Group from 2008 was taken into
consideration for further information. Statistical studies were provided by institutions such
as Statistics Sweden, Sveriges Riksbank and KPMG International.
M&As
Löfstrand (2011) confirms that the number of M&A activity in the online gaming industry
is outstanding due to high competition. The market is unpredictable with extreme ampli-
tudes (Lottomatica S.p.A., 2009). The online gaming industry is said to have high poten-
tials for the realization of economies of scale due to constant fixed expenses (Boss Media
AB, 2007). As competition steadily increases, M&As become necessary for a small com-
pany, to maintain their market share (Löfstrand, 2011).
However, Löfstrand states that another popular possibility to survive in the industry is to
form cooperations with other companies, such as joint ventures (JV)39. As size matters in
the online gaming industry, companies are constantly on the outlook for probable targets.
GTECH Corporation acquired six companies in 2006, trying to enlarge their geographical
39 Joint Venture (JV) – business partnership between two companies, sharing technology and know-how, originally both stay independent.

33 | P a g e
footprint (Lottomatica S.p.A., 2009). The company tries to acquire and grow responsibly
(ibid.). 2006 was a year of outstanding expansion for GTECH Corporation, growing by
diversifying their product portfolio in new markets (ibid.) Boss Media AB is very careful
when sharing their expertise or software as well. Löfstrand (2011) claims this choice of
caution to be one of the key success drivers of Boss Media AB. From 2002 to 2008, Boss
Media AB acquired four companies, of which the largest takeover was in 2008. The target
was exclusively searched for across the globe to perfectly complement Boss Media AB’s
portfolio. It furthermore shows not only awareness of competition, but solvency. Further
prerequisites were the acquisition price, product portfolio and whether there is an interest
in the target by competitors.
Löfstrand (2011) points out that Boss Media AB is approximately contacted three to four
times a week concerning M&A requests. However, he thinks that the industry will slow
down in their M&A activity as there will be fewer, but larger companies dominating the
field.
Hubris
Löfstrand (2011) describes how mistakes will not get detected as easily in a fast moving
industry than in a mature industry. As competitors move hurriedly in M&A mistakes are
quickly carried out, but disappear under vast amount of deals. M&A decisions have been
made by the board of directors at Boss Media AB before its acquisition by GTECH Corpo-
ration. Managers and the CEO prepared the takeover, though. Nowadays these decisions
are made higher up in the group hierarchy of GTECH Corporation, without consulting
Boss Media AB directly. In 2008 the shareholders of GTECH Corporation authorized the
Board of Directors to determine purchase price boundaries and hand the responsibility to
them (Lottomatica S.p.A., 2009).
In the first quarter of 2008 GTECH Corporation was not only acquiring Boss Media AB,
but two more companies, operating in the online gaming industry (Lottomatica S.p.A.,
2009). Even though GTECH Corporation had to borrow the whole acquisition price for
Boss Media AB, they were eager to increase the corporation’s size (Löfstrand, 2011).
Managerialism
GTECH Corporation buying Boss Media AB in the middle of the financial crisis can be
perceived as power display according to Löfstrand (2011). GTECH Corporation showed
that even though many companies were struggling, that they were still thriving. “That is

34 | P a g e
true, they showed the market – yes we have power and we can act even in a[n] [economic]
down turn.” (Löfstrand, 2011). The power display becomes especially apparent, as
GTECH Corporation borrowed all of the money needed to acquire Boss Media AB
(Löfstrand, 2011). Additionally, the pace and number of acquisitions, taking over three
companies in less than three months, was a sign of GTECH Corporation’s superiority to
the market.
When deciding to do an acquisition the controlling interest in the target company is of
great concern to Boss Media AB and the main reason to undergo an acquisition. Having
the power over the target, makes decision making processes faster and leaner, executing
the choice instead of negotiating it.
Löfstrand (2011) admits that shareholders suffered big losses of their share prices after the
dot-com bubble burst. Nevertheless, the integrity of Boss Media AB was not threatened.
Herding
According to Löfstrand (2011), people have a tendency to herd, which is very well dis-
played in the online gaming industry. If a company develops an innovative product with
high demand, competitors are forced to decide whether they want to maintain their current
product portfolio or adapt to the customer’s demand, following the company, which inno-
vated the product. Still, the risk of being the first mover in a market is high and costly. On
the other hand, companies can benefit from being the first one in the market and outdis-
tance competitors. Löfstrand (2011) claims Boss Media AB to have been one of the first
companies that established itself in the online gaming market and thus set trends for com-
panies to follow. Löfstrand (2011) furthermore states mistakes to be made quicker in a fast
moving business environment due to time pressure by competitors. GTECH Corporation
was forced to explore new markets and enter the online sphere to remain competitive
(ibid.).
Value creation in M&As
Boss Media AB’s aim for 2008 to 2010 is to grow faster, doubling revenues, but maintain-
ing the identical profitability at the same time (Boss Media AB, 2008). To achieve this, the
primary key in value creation at Boss Media AB is to look at controllable, organic growth.
Nevertheless Boss Media AB conveys interest in possible acquisition targets (Löfstrand,
2011).

35 | P a g e
Thus, Boss Media AB wants to increase the return on shareholder equity and Earnings per
share (EPS)40 to make the company more attractive for future shareholders according to
Löfstrand (2011). This should be achieved by an enhanced effort in technological devel-
opments, the increase of efficiency and profitability as well as cost reduction. As 70 per-
cent of online games are developed by the operators themselves, there is potential of cost
reduction by outsourcing41 the development to suppliers like Boss Media AB.
Boss Media AB acquired four companies since its foundation in 1996 to 2008. Boss Media
AB acquired a casino supplier, Dynamite Idea. The reason for the takeover was to add val-
ue to already existing product ranges and increasing competitive advantage. This acquisi-
tion was a one-man-business, which simplified communication and agreement and lead to
a friendly acquisition.
Löfstrand (2011) claims that Boss Media AB could have grown three to four times its size,
but was acquired in February 2008 by GTECH Corporation. The takeover created new
opportunities for Boss Media AB to grow in new markets, in which GTECH Corporation
was already well established. GTECH Corporation made a public offer directly to the
shareholders of Boss Media AB, offering a premium higher than the market price (GTECH
Corporation, 2008).
In 2006, Boss Media AB divested the company Jadestone Group AB, which developed
mobile phone gaming, in order to stay profitable (Boss Media AB, 2007). Boss Media AB
did not see prosperity due to the lack of one uniform platform to operate mobile phones
from. Mobile phone games need to be adapted to differing operating systems such as Iph-
one, Android or Windows (Löfstrand, 2011).
Value estimation of M&As
Value of potential targets is estimated by key figures. Löfstrand (2011) admits that it is
difficult to assess the value of a small, non-stock market listed company. Hence, custom-
ers, product portfolios, retained earnings, the financial position at present and predictions
of future returns by future FCFs need to be considered to reason an investment proposal.
Prospective forecasts are not completely valid or need to consider that the targets opera-
40 Earnings per share (EPS) – net profit or loss divided by the amount of share in a company’s stock. 41 Outsourcing – to contract out a business function to another company in order to gain cost- and expertise advantages.
36 | P a g e
tions will be adapted to the acquirer’s strategy. Additionally, a DCF analysis is conducted
to incorporate the future FCFs and the possible changes in the target company.
Many more factors play an important role when assessing the value of a company. A com-
bination of factors, dependent and independent of the company, need to be considered as
well. Influences such as the market’s risk-free interest rate, inflation and tax affect the val-
ue of a target. Risk-free interest rates incorporate inflation and industry specific growth.
According to KPMG International (2011), European companies estimate the risk-free in-
terest rate by referring to government bonds with a maturity up to ten years. Government
bonds, issued by Sveriges Riksbank42 with a maturity up to ten years provide a risk-free
interest rate of 4,17 percent (cf. appendix I.C.IV). The average Swedish corporate tax rate
was 28 percent throughout the years 2004 to 2007 (KMPG International, 2006, p. 5),
(KPMG International, 2007, p. 21), (KMPG International, 2008, p. 16) and adjusted to a
lower rate in 2009 (KPMG International, 2009).
Löfstrand (2011) also points out that a sensitivity analysis would add to the reliability of
the DCF, estimating a best and worst-case scenario of future developments.
Overpricing
The acquisition price of Boss Media AB was set at SEK 25,00 by GTECH Corporation,
which is almost twice the price, the market anticipated for Boss Media AB in the beginning
of 2008. Boss Media ABs market value on the 31st of December 2007 reached SEK 807,5
million, resulting from the multiplication of outstanding shares of 57.065.000 by Boss Me-
dia ABs stock price of SEK 14,15.
When GTECH Corporation acquired Boss Media AB, a generous premium was paid to
Boss Media AB’s shareholders. The stock market price of Boss Media AB was SEK 15,10
before the announcement of its acquisition as shown in Figure 9 (GTECH Corporation,
2008). Nevertheless, GTECH Corporation made its first offer to buy Boss Media AB’s
shares for SEK 19,00 per share on the 1st of February (GTECH Corporation, 2008). Shortly
after the offer, the share price increased to SEK 19,40 and GTECH Corporation raised their
offer to SEK 25,00 on the 13th of February (GTECH Corporation, 2008). Löfstrand (2011)
considers the reason for a high acquisition premium to be prosperous future performances
of Boss Media AB due to an expanded customer base.
42 Sveriges Riksbank – Central bank of Sweden
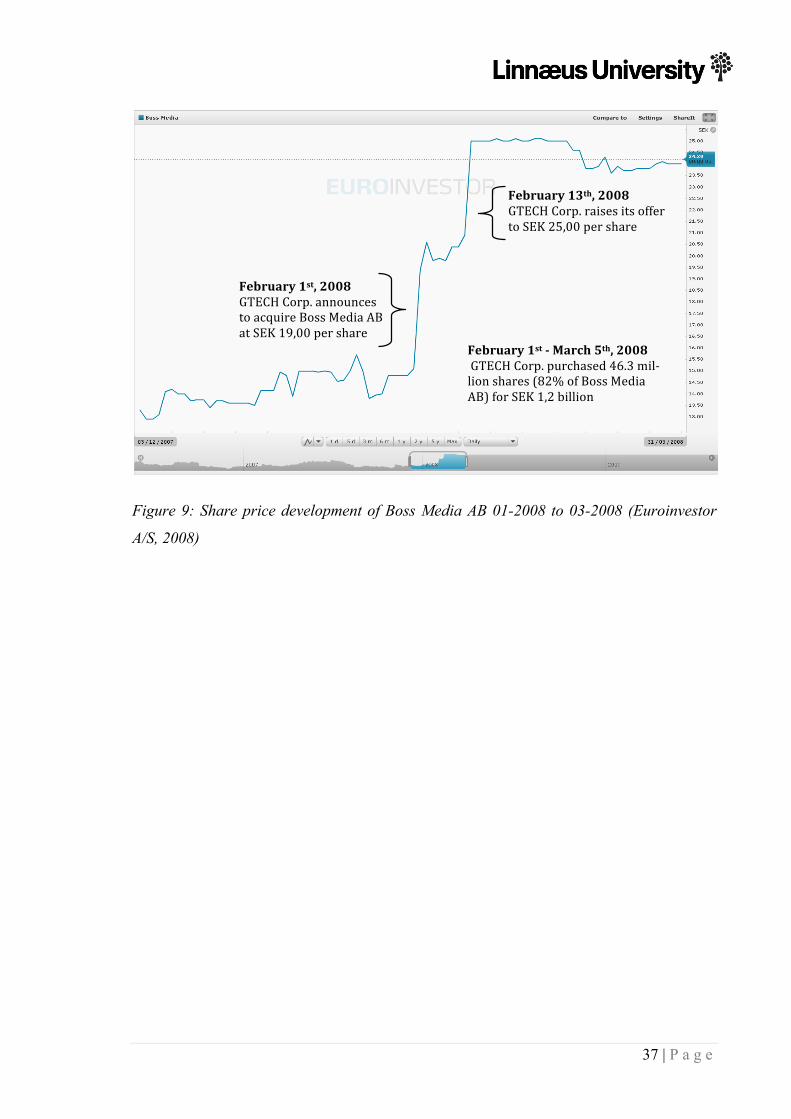
37 | P a g e
Figure 9: Share price development of Boss Media AB 01-2008 to 03-2008 (Euroinvestor
A/S, 2008)
February 1st -‐ March 5th, 2008 GTECH Corp. purchased 46.3 mil-‐lion shares (82% of Boss Media AB) for SEK 1,2 billion
February 1st, 2008 GTECH Corp. announces to acquire Boss Media AB at SEK 19,00 per share
February 13th, 2008 GTECH Corp. raises its offer to SEK 25,00 per share

38 | P a g e
5 . ANALYSIS
This chapter interprets and analyzes the empirical findings by previously, theoretically
elaborated means. The application focuses on whether M&As are trends caused by social
behavior or M&As as value creating tool. First of all the impact of social behavior at
GTECH Corporation and Boss Media AB on M&A decisions is presented. Followed by a
separate investigation of the value estimated for Boss Media AB. The results of both analy-
sis in regards to value creation or destruction is discussed. Finally, the concluding results
are illustrated.
5.1. MERGERS & ACQUISITIONS - A TREND CAUSED BY SOCIAL BEHAVIOR?
In 2008, when the financial crisis hit rock bottom, GTECH Corporation and Boss Media
AB set out to enlarge their product range. Despite economic slowdowns both companies
expanded.
M&A waves are correlated to the economic climate, moving in waves. Even though M&A
activity is especially high during economic peaks, economic slumps can set off waves. In
economically difficult times, companies are acquired at low prices, which can help the
acquirer to emerge stronger from the crisis. The M&A waves described in chapter 2.2.1
showed that a wave’s decline was mostly caused by economic downturns. They also
showed that every end is a new beginning. The decline of M&A waves after a crisis are
just as much their revival. In an economic baisse43, prices for companies drop and make
M&As more accessible to companies backed by a stable financial position and put targets
in weaker bargaining positions.
Boss Media AB was acquired in 2008 at the verge of a new M&A wave. The wave of
megadeals was just about to come to an end. Still, GTECH Corporation set out to buy three
companies during the first quarter of 2008, increasing its size enormously.
To be able to find targets, complementing their own business model and providing access
to a broader customer base, as a US company, GTECH Corporation expanded to Europe to
grow beyond their current boundaries. GTECH Corporation only offered traditional gam-
ing and felt pressured by technological inventions such as the internet to react to market to
43 Baisse – period of declining stock prices, bear market.
39 | P a g e
raising demand of online applications (Löfstrand, 2011). They did not want to fall behind
on the emerging online gaming market and catch up with competitors (Löfstrand, 2011).
With the reputable expertise in Boss Media AB in this industry, GTECH Corporation has
selected them as suitable match in their due diligence process.
Theory illustrated that there are several different M&A designs. Hostile acquisitions are
non-negotiated takeovers often initiated by a tender offer (Bragg, 2009). GTECH Corpora-
tion made a public cash offer for Boss Media AB on the 1st of February 2008 bypassing the
management (Lottomatica S.p.A., 2009), Figure 9. One way to perform a hostile takeover
is by stock purchases as explained in chapter 2.1.2. GTECH Corporation took over 94 per-
cent of Boss Media ABs shares gaining a controlling interest in the company in a very
short amount of time (Lottomatica S.p.A., 2009). Furthermore, offered GTECH Corpora-
tion the shareholders of Boss Media AB more money than the market was, making the of-
fer more tempting for them. Hostile acquisitions can be executed quickly, buying a great
portion of shares from their holders immediately. GTECH Corporation performed the ac-
quisition within one month taking control over 94 percent of Boss Media ABs shares (Boss
Media AB, 2008).
Shortly before the takeover, Boss Media AB had set out to expand their company size as
well. Boss Media wanted to broaden their product portfolio and increase economies of
scale with a perfect fit (Löfstrand, 2011). A company, situated just like Boss Media AB in
the gaming industry, seemed promising. According to Sudarsanam (2003), horizontal mer-
gers occur when companies try to gain a competitive advantage. Boss Media ABs choice
was fuelled by synergetic effects, they hoped to gain from Dynamite Idea. The time limit
to develop gaming software did not keep up with the markets changes in demand for them.
Hence, it was easier for Boss Media to skip the software development and to buy a finished
product to reduce the time to market. This not only increased synergetic effects, but also
reduced costs. Boss Media ABs choice of a horizontal merger, lead to a competitive ad-
vantage against competitors with a less diversified product portfolio. Still, this did not keep
them from being taken over by GTECH Corporation a couple of month later.
If managers overestimate their own decision making abilities, they will cause harm to
shareholders by neglecting their long-term interest. Roll (1986) refers to this behavior as
hubris. The management is expected to behave rationally and make sound decisions
(Peters, 2005). However, market irregularities are a sign of the management’s irrational
40 | P a g e
behavior (Hayward & Hambrick, 1997). GTECH Corporation offered to pay a higher ac-
quisition premium to Boss Media AB than the market provided (GTECH Corporation,
2008) and was not willing to step down when the market adjusted to the initial offer
(GTECH Corporation, 2008). GTECH Corporations desire for Boss Media ABs expertise
was so high, that they raised the acquisition price once again and borrowed all the money
needed for the acquisition (Löfstrand, 2011). However, Löfstrand (2011) also argues that
creditworthiness implies a company’s financial stability since borrowers demand securities
to back up the loan in case of default. Additionally, overpricing is more common during
economic peaks (Rhodes-Kropf & Viswanathan, 2004). Boss Media was acquired during
an economic slump, making the likelihood of overvaluation smaller.
Boss Media AB was conscious about the overall market perception and its own role in the
time of the acquisition. Naturally, as a seller the shareholders wanted the price to be as
high as possible. Rationally acting, they did not allow the economic downturn rule over
their own opinion. Therefore, they did not immediately hand over their shares, but de-
manded a higher price.
This example of overvaluation and the unwillingness to retreat from the bid manifests in
hubris. An example where hubris is especially distinct is bidding wars in the acquisition
process. Managers do not retreat from a bid in fear of losing their face and continue to push
the target’s price up. This overvaluation does not reflect the real price of the investment
any more. However, it is perceived as if the too high price is correct by others. They there-
fore assume the investment to be very valuable and a wise decision. Investors will follow
to invest in similar projects, unknowingly paying a much higher price, because they be-
lieve the company is adequately priced opposed to recognizing its true worth. This leads to
investors imitating each other over and over again, as seen in herding. Hence, hubris leads
to herding, which causes trends as illustrated by the M&A activities of both Boss Media
AB (as trendsetter in herding) and GTECH Corporation (overestimating potential gains).
Managerialism is the increase of personal benefits at the cost of the shareholders (Seth,
Son, & Pettit, 2000). This form of self-aggrandizement shows in a drastic increase of man-
agement scope, that the executive seizes control of. In 2008 GTECH Corporation bought
Boss Media AB as well as some of their former competitors (Lottomatica S.p.A., 2009).
GTECH Corporation acquired so many companies, that they became the world leading
41 | P a g e
operator of online lottery transaction processing systems (Lottomatica S.p.A., 2009). Not
only did GTECH Corporation acquire them during a financial crisis, but they also took a
huge loan to be able to carry out the acquisition. The willingness to undergo the acquisi-
tions and grow quickly at any cost is a way to display power and superiority to competi-
tors. Löfstrand (2011) says “they showed the market - yes we have power and we can act
even in a downturn.”. If the expectations in Boss Media ABs synergetic effects are not
met, GTECH Corporation will lose money in the long run. Previous events like the burst of
the dot-com bubble have shown that it is not the management that suffers from unhealthy
decisions, but shareholders (Löfstrand, 2011).
Wanting the controlling interest in a company, instead of working together equally is an-
other aspect where managerialism becomes apparent. In an acquisition this can be one of
the main reasons to acquire instead of merging (Löfstrand, 2011). GTECH Corporation has
bought Boss Media AB in a hostile acquisition and showed more interest in claim their
power than considering sustainable growth.
Managerialism is an additional example where herding as the activator of M&A waves can
be retraced. The cash flow from 2007 to 2008 increased eight times its size, offering more
cash to the managers to operate with (Lottomatica S.p.A., 2009). Managerialism implies
that managers act on their own behalf, not being interested in the best interest of the com-
pany. Thus, having more cash to operate with really means to them, that they have more
money to spend on their own interest. This is further fuelled by decreasing financial con-
straints leaving more freedom to managers how to spend the company’s money. If the
manager's self interest is concealed well enough to convince the company’s board of direc-
tors and authorities, they get away with it. If the managerial behavior is witnessed by other
managers, they will copy the immoral actions to gain an advantage for themselves. The
longing to be better off than others creates herding, which then sets off a trend.
Herding, the imitation of behavior, occurring in large groups, leads to the creation of
trends. Participants in the online gaming industry are monitoring competitors closely
(Löfstrand, 2011). The orientation on one another within an industry leads to the imitation
of behavior and decisions. According to Harford (2005), the emergence of M&A waves is
highly influenced by social behavior, either by copying mechanisms or by overestimation
and greed. Boss Media AB started early to expand their product portfolio from one single
product to a range of products fulfilling customer needs. Soon competitors followed in
their footsteps, imitating their strategy of product diversification (Löfstrand, 2011). As the

42 | P a g e
online gaming industry is relatively small and not yet fully developed, companies are inse-
cure about their strategy to survive in a changing environment. If a concept is perceived as
successful, it gets copied in hope to get a slice of the success as well. Being one step ahead
of their competition, Boss Media AB set a trend and triggered a domino effect. That com-
petitors followed in vast numbers proves the existence of herding in the online gaming
industry. Herding is more prone in fast moving, young businesses where there is fewer
experience of market movements. Additionally, M&A waves are more distinct in certain
industries (Mitchell & Mulherin, 1996). The combination of enhanced herding and in-
creased M&A activities in the online gaming industry adds up to extreme M&A waves.
Comparing Figure 1 and Figure 10 it is visible that the amplitude is higher in the industry
Boss Media AB operates in, which Löfstrand (2011) confirmed.
Figure 10: Announced Mergers & Acquisitions IT consulting and services, 1988-2010
(IMAA, 2011)
Due to the high intensity and fast moving pace of the gaming industry, decisions need to be
made quickly to stay ahead of the game. This leads to not properly thought through choices
and a higher rate of mistakes (Bikhchandani, Hirshleifer, & Welch, 1992).
Looking at hubris, managerialism and herding showed that this case demonstrated that
hubris and managerialism essentially lead to herding. Herding is the catalyst of trends,
which causes M&A waves to emerge.
0
200
400
600
800
1.000
1.200
1.400
0
5.000
10.000
15.000
20.000
25.000
30.000
1988
1989
1990
1991
1992
1993
1994
1995
1996
1997
1998
1999
2000
2001
2002
2003
2004
2005
2006
2007
2008
2009
2010
number of transactions
Nasdaq Composite Indice
value of transactions (in 100 million US Dollar)

43 | P a g e
5.2. MERGERS & ACQUISITIONS – SUSTAINABLE VALUE CREATION?
The DCF is used to asses Boss Media ABs value. To reflect the value from different an-
gles, multiples are taken into consideration as well. These models were chosen since Boss
Media AB uses the DCF itself to estimate enterprise value (Löfstrand, 2011). Furthermore,
agrees the literature on the DCF’s common use and its high objectivity (Barker, 2001),
(Brealy, Myers, & Allen, 2008). Its superiority in comparison to other valuation methods is
backed by Kaplan and Ruback (Kaplan & Ruback, 1995). Berk and DeMarzo (2007) state
that the combination of a market multiple and an investment evaluation method like the
DCF provide the most reliable result possible.
5.2.1. EVALUATING BOSS MEDIA AB - THE DISCOUNTED CASH FLOW MODEL
The DCF is one of the most widely used models to estimate the value of a company (Bark-
er, 2001). The model is based on discounting FCFs to PV as described in chapter 2.3.1
(Gaughan, 2007). For the estimation of Boss Media ABs enterprise value, the valuation
date was set to the 31st of December 2007 in accordance with Boss Media ABs fiscal year.
This valuation date seems reasonable as negotiations about the closing price took place
prior to the actual acquisition date of Boss Media AB by GTECH Corporation in February
2008.
First of all, the financial data from the annual reports of Boss Media AB was transferred to
an excel sheet to enable an easier calculation. The historical data, taken from the annual
reports of 2006 and 2007 of Boss Media AB is used to forecast reasonable future projec-
tions and thus lays the foundation of applying the DCF model. According to Rosenbaum
and Pearl (2009), the projected time period usually anticipates five years. Consequently,
2008 to 2012 were forecasted using financial data from 2004 to 2007. Deriving the value
of Boss Media AB is broken down into an eight step approach ensuring transparency and
comprehensibility.
Step I - entering historical data
As shown in Figure 11, the historical data from 2004 to 2007 was filled in first, starting
with entering the historic sales of Boss Media AB. Next the growth factor of annual sales
was derived, measuring the annual growth of sales for each year from 2004 to 2007 at Boss
Media AB. The factor was calculated from 2005 to 2007 as the sales of a current year are
compared to sales of the previous fiscal year. Due to the limited time frame of this re-
search, only the years 2004 to 2007 were considered, neglecting the sales data of 2003.
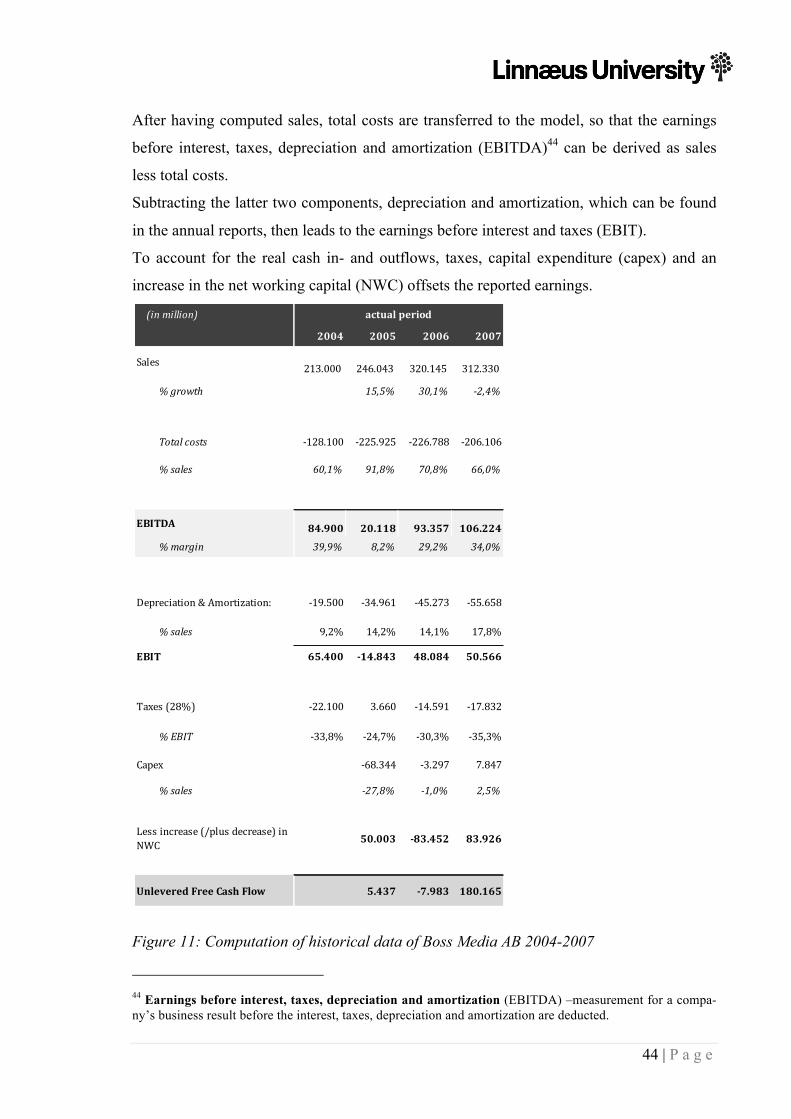
44 | P a g e
After having computed sales, total costs are transferred to the model, so that the earnings
before interest, taxes, depreciation and amortization (EBITDA)44 can be derived as sales
less total costs.
Subtracting the latter two components, depreciation and amortization, which can be found
in the annual reports, then leads to the earnings before interest and taxes (EBIT).
To account for the real cash in- and outflows, taxes, capital expenditure (capex) and an
increase in the net working capital (NWC) offsets the reported earnings.
Figure 11: Computation of historical data of Boss Media AB 2004-2007
44 Earnings before interest, taxes, depreciation and amortization (EBITDA) –measurement for a compa-ny’s business result before the interest, taxes, depreciation and amortization are deducted.
(in million)
2004 2005 2006 2007
Sales 213.000 246.043 320.145 312.330
% growth 15,5% 30,1% -‐2,4%
Total costs -‐128.100 -‐225.925 -‐226.788 -‐206.106
% sales 60,1% 91,8% 70,8% 66,0%
EBITDA 84.900 20.118 93.357 106.224
% margin 39,9% 8,2% 29,2% 34,0%
Depreciation & Amortization: -‐19.500 -‐34.961 -‐45.273 -‐55.658
% sales 9,2% 14,2% 14,1% 17,8%
EBIT 65.400 -‐14.843 48.084 50.566
Taxes (28%) -‐22.100 3.660 -‐14.591 -‐17.832
% EBIT -‐33,8% -‐24,7% -‐30,3% -‐35,3%
Capex -‐68.344 -‐3.297 7.847
% sales -‐27,8% -‐1,0% 2,5%
Less increase (/plus decrease) in NWC 50.003 -‐83.452 83.926
Unlevered Free Cash Flow 5.437 -‐7.983 180.165
actual period

45 | P a g e
The corporate tax can also be taken from the annual reports and reflects the actual pay-
ments in the respective years. The income statement reveals that the tax rate's average is
slightly above 30 percent of sales, but also reveals a tax refund in 2005, which can proba-
bly be attributed to the overall loss in that particular year. Studies on corporate tax in Swe-
den were assessed for the same period from 2005 to 2008 and lead to a mean of 28 percent
(KMPG International, 2006, p. 5), (KPMG International, 2007, p. 21), (KMPG Interna-
tional, 2008, p. 16). As the tax rate is forecasted to not rise but slightly drop about the next
five years, the research continues to apply the 28 percent of the statistically ascertained
data to equal out the slightly higher historical percentage of Boss Media AB with the ex-
pectation of decreasing taxes.
Capex, which represents the amount annually spent on investments, is derived as the dif-
ference of tangible and intangible assets in year n and tangible and intangible assets in year
n+1 (Rosenbaum & Pearl, 2009). Usually, capex is only estimated by the difference in tan-
gible assets (Rosenbaum & Pearl, 2009). Nevertheless, intangible assets were included in
the valuation of Boss Media AB since their major assets are software developments, li-
censes and patents, which cannot be physically measured and make up for the most part of
assets. This leads to the computation of CFs.
Step II – deriving net working capital
Accounts receivable, inventory as well as prepaid expenses and other assets from 2004 to
2007 are retrieved from the balance sheet (cf. I.C.I, I.C.II) and inserted into the calculation.
This data adds up to total current assets as shown in Figure 12.

46 | P a g e
Figure 12: NWC computation of Boss Media AB 2004-2007
As displayed in Figure 12, the same procedure is applied for the total current liabilities,
consisting of accounts payable, accrued liabilities and other current liabilities by offsetting
the current assets by subtracting the current liabilities results in the NWC. Again, the pro-
portion of all its components has been compared to the sales figure of the corresponding
year to derive future current assets and liabilities for valuation purposes.
Step III - projecting future data
The forecasted data for 2008 to 2012 heavily impacts the final value of Boss Media AB.
Thus, forecasts need to be measured carefully. Projections are based on historical data to
come up with a reasonable equity value, but not limited to it.
Following the order of the first two steps, sales are forecasted first as shown in. Therefore,
the compound annual growth rate (CAGR) is derived out of sales from 2004 to 2007. The
growth rate of sales helps to calculate the CAGR, which originates by weighting the sales
growth from 2004 to 2007. The sale's annual growth rate varies between -2,4 and 30,1 per-
cent, implying a CAGR of 13,6 percent. The CAGR is then used to project the sale's future
(in million)
Net Working Capital 2004 2005 2006 2007
Account receivables 146.700 24.014 22.724 31.016
Inventory 900 2.720 2.720 0
Prepaid expenses and other 104.500 212.002 341.307 90.492
Total Current Assets 252.100 238.736 366.751 124.228
% sales 118,4% 97,0% 114,6% 39,8%
Account payable 16.161 10.271 9.015
Accrued Liabilities 24.563 22.198 28.090
Other Current Liabilities 110.415 163.233
Total Current Liabilities -‐114.500 -‐151.139 -‐195.702 -‐37.105
% sales 53,8% 61,4% 61,1% 11,9%
Net Working Capital 137.600 87.597 171.049 87.123
% sales 65% 36% 53% 28%
-‐50.003 83.452 -‐83.926
actual period

47 | P a g e
development. Sales for 2008 to 2012 are derived by multiplying the preceding sales num-
bers with the computed CAGR.
Next, future EBITDAs are computed to project total costs until 2012 as shown in Figure
13. To estimate these total costs, the ratio of sales compared to the corresponding EBITDA
is calculated. This percentage illustrates the growth or decline of Boss Media ABs profit
margin. The average profit margins from 2004 to 2007 projects the profit margin for the
following five years, to be set at 27,8 percent. This correlates to Boss Medias AB's annual
report of 2007, which states to aim for a profit margin of 15 to 30 percent. This ratio lies in
the upper end of Boss Media AB's targeted profit margin but seems to be easily achievable
counting 2005 as an outlier in this analyzed series. 28 percent are also chosen as the previ-
ous years show a tendency towards a 30 percent profit margin ranging from 29,2 to 39,9
percent from 2004 to 2007.
The margin set at 28 percent is then used to estimate the EBITDA of 2008 to 2012, multi-
plying the profit margin with forecasted sales for these years.
Having computed the data for EBITDA and sales allows calculating projected total costs as
the difference of the former two values.
After having derived future sales, total costs and EBITDAs, depreciation and amortization
were taken into account. Depreciation and amortization were set in relation to sales. The
average of 13,8 percent, derived from the historical data from 2004 to 2007, was used for
the projection period. Again, subtracting depreciation and amortization from EBITDA pro-
vides the EBIT.

48 | P a g e
Figure 13: Actual period and forecasted period computation of Boss Media AB EBIT to
sales, 2004-2012
Step IV - calculating free cash flows
As stated earlier, Boss Media AB's average tax rate has been slightly above the corporate
tax retrieved from statistically ascertained sources. As the tax rate is assumed to drop in the
next years (KPMG International, 2009), it is estimated that Boss Media AB reaches the
level of the last years, namely 28 percent.
Estimating the future capex, Boss Media AB's annual expenditure is considered from 2007
on. The relation of capex to sales from the past is therefore carried forward in form of its
mean of -8,8 percent.
The total current assets for the years from 2007 on are projected by referring back to the
total current assets of 2004 to 2007 in the same way it has been done with capex before.
The same steps are taken when forecasting total current liabilities for 2008 to 2012: An
average ratio of the historic data is used, which, multiplied by sales, equals the projected
total current liabilities. Similar to the calculation before 2008, the NWC is also computed
by subtracting the current liabilities form the current assets of each forecasted period as
illustrated in Figure 14.
(in million) CAGR
2004 2005 2006 2007 (04-‐07) 2008 2009 2010 2011 2012
Sales 213.000 246.043 320.145 312.330 14% 354.834 403.122 457.981 520.306 591.113
% growth 15,5% 30,1% -‐2,4%13,6% 13,6% 13,6% 13,6% 13,6%
Total costs -‐128.100 -‐225.925 -‐226.788 -‐206.106 -‐255.480 -‐290.248 -‐329.747 -‐374.621 -‐425.601
% sales 60,1% 91,8% 70,8% 66,0% 72,0% 72,0% 72,0% 72,0% 72,0%
EBITDA 84.900 20.118 93.357 106.224 8% 99.353 112.874 128.235 145.686 165.512
% margin 39,9% 8,2% 29,2% 34,0% 28,0% 28,0% 28,0% 28,0% 28,0%
Depreciation & Amortization: -‐19.500 -‐34.961 -‐45.273 -‐55.658 -‐49.079 -‐55.758 -‐63.346 -‐71.966 -‐81.760
% sales 9,2% 14,2% 14,1% 17,8% 13,8% 13,8% 13,8% 13,8% 13,8%
EBIT 65.400 -‐14.843 48.084 50.566 -‐8% 50.275 57.116 64.889 73.720 83.752
actual period forecasted period

49 | P a g e
Figure 14: NWC of actual and forecasted period of Boss Media AB 2004-2012
Finally, the FCFs are calculated by subtracting taxes from EBITDA, adding capex and
subtracting increases in (respectively adding decreases in) NWC as illustrated in Figure 15.
Since Boss Media AB is a growing company, it acquires more NWC every year that
weighs on the free cash flow. According to Rosenbaum and Pearl (2009) this is considered
to be normal in growing businesses. However, quite the opposite - constant negative NWC
- would pay out for companies with stable business and constant cash inflows. In some
cases companies receive their money earlier from their customers (current assets) than they
have to balance their invoices to their suppliers (current liabilities).
(in million)
Net Working Capital 2004 2005 2006 2007 2008 2009 2010 2011 2012
Account receivables 146.700 24.014 22.724 31.016
Inventory 900 2.720 2.720 0
Prepaid expenses and other 104.500 212.002 341.307 90.492
Total Current Assets 252.100 238.736 366.751 124.228 327.972 372.605 423.311 480.918 546.365
% sales 118,4% 97,0% 114,6% 39,8% 92,4% 92,4% 92,4% 92,4% 92,4%
Account payable 16.161 10.271 9.015
Accrued Liabilities 24.563 22.198 28.090
Other Current Liabilities 110.415 163.233
Total Current Liabilities -‐114.500 -‐151.139 -‐195.702 -‐37.105 -‐166.943 -‐189.662 -‐215.472 -‐244.795 -‐278.108
% sales 53,8% 61,4% 61,1% 11,9% 47,0% 47,0% 47,0% 47,0% 47,0%
Net Working Capital 137.600 87.597 171.049 87.123 161.029 182.943 207.839 236.123 268.257
% sales 65% 36% 53% 28% 45% 45% 45% 45% 45%
-‐50.003 83.452 -‐83.926 73.906 21.914 24.896 28.284 32.133
actual period forecasted period

50 | P a g e
Figure 15: Actual period and forecasted period computation of Boss Media AB EBIT to
CF, 2004-2012
Step V - estimating the WACC
The next step is the calculation of an accurate WACC as shown in Figure 17. The WACC
measures the amount of expected return of the shareholders, based on the risk they are tak-
ing. The risk rate reflects both the share of equity and debt holders as well as the required
compensation rate for employing their capital. As described in chapter 2.3.1, the WACC
can be computed by adding the weighted cost of equity and the weighted cost of debt as
shown in Figure 16.
!!"## = !
!!!!! +
!!!!
!!(1− !!)
Where E = the market value of equity, D= the market value of debt !! = !"#$%& !"#$ !" !"#$%"& !!= debt cost of capital !!= marginal corporate tax rate
Figure 16: WACC considering the marginal corporate tax rate (Berk & DeMarzo, 2007, p.
577)
After having collected the needed data, the cost of equity can be calculated by adding the
risk-free interest rate to the market risk premium multiplied by beta and Boss Media ABs
size premium.
To reflect a reasonable underlying capital structure, it is important to take into account the
market value of both equity and debt (Jennergren, 2008). Just like evaluating the previous
(in million) CAGR
2004 2005 2006 2007 (04-‐07) 2008 2009 2010 2011 2012
EBIT 65.400 -‐14.843 48.084 50.566 -‐8% 50.275 57.116 64.889 73.720 83.752
Taxes (28%) -‐22.100 3.660 -‐14.591 -‐17.832 -‐14.077 -‐15.993 -‐18.169 -‐20.642 -‐23.451
% EBIT -‐33,8% -‐24,7% -‐30,3% -‐35,3% -‐28,0% -‐28,0% -‐28,0% -‐28,0% -‐28,0%
Capex -‐68.344 -‐3.297 7.847 -‐31.101 -‐35.333 -‐40.142 -‐45.604 -‐51.810
% sales -‐27,8% -‐1,0% 2,5% -‐8,8% -‐8,8% -‐8,8% -‐8,8% -‐8,8%
Less increase (/plus decrease) in NWC 50.003 -‐83.452 83.926 -‐73.906 -‐21.914 -‐24.896 -‐28.284 -‐32.133
Unlevered Free Cash Flow 5.437 -‐7.983 180.165 -‐19.731 39.634 45.028 51.156 58.117
actual period forecasted period

51 | P a g e
key figures, Boss Media AB's capital structure is examined for the end of 2007 as this rep-
resents the most recent data that was available prior to the acquisition.
The balance sheet first reveals an almost even relation between equity and liabilities. How-
ever, the book value of equity can differ from the perceived value on the market. Boss Me-
dia AB's shares were trading at SEK 14,15 on 31st December 2007 (cf. Figure 9). Scaling
the single values up to the entire company, the share price of the valuation date is multi-
plied by the outstanding shares of 57.065.000 resulting in a total market value of equity of
SEK 807,5 million.
In approach to assess the market value of debt, it can be noticed that, only about nine per-
cent of the liabilities consist of non-publicly traded long-term debt. Taking a closer look at
the short-term debt shows that the lion's share is made up of payments against licensee
holders (cf. appendix I.C.III). Software business in mind, these licenses could mean rights
to use certain up-stream systems, programming software or additional services like inter-
faces to additional services, like the online payment service PayPal. Assuming
Boss Media AB to be a solvent debtor to their suppliers, it can be expected that Boss Me-
dia AB regularly pays for these fees, which are categorized as short-term debt. Therefore,
these liabilities are regulated B2B contracts, generally not influenced by market opinions
and do not bear any interest. Hence, there's no need to adjust the debt to market value.
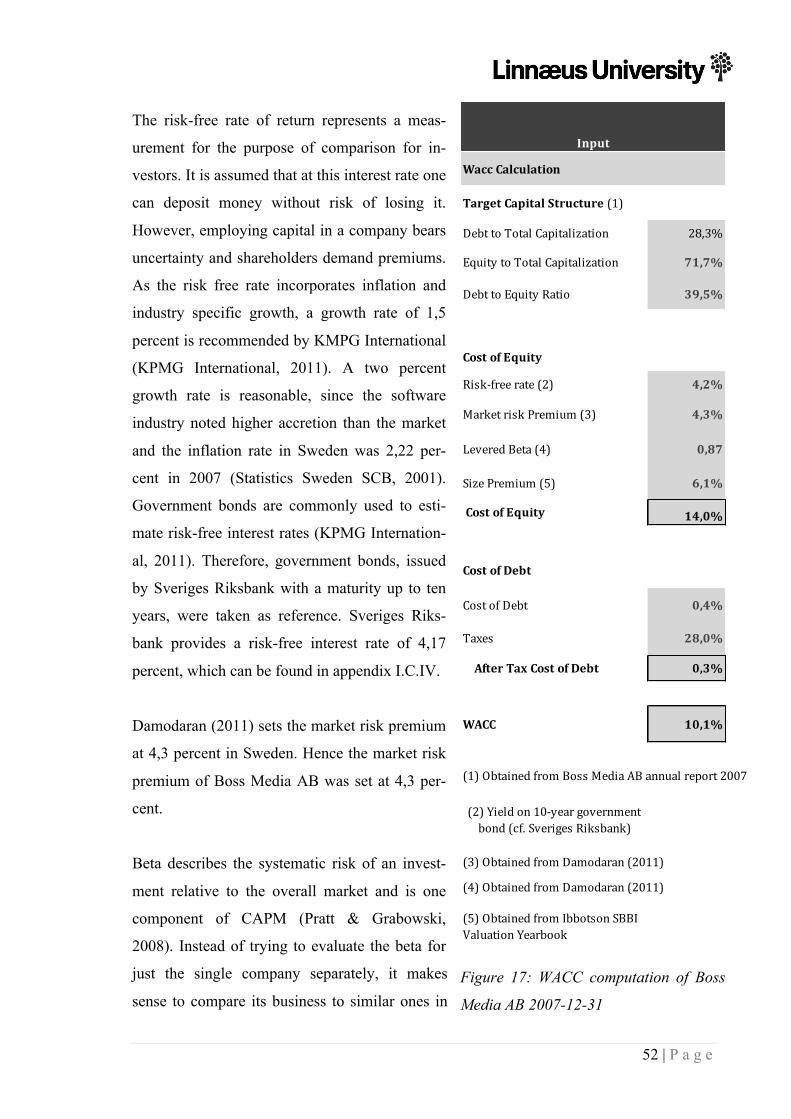
52 | P a g e
Wacc Calculation
Target Capital Structure (1)
Debt to Total Capitalization 28,3%
Equity to Total Capitalization 71,7%
Debt to Equity Ratio 39,5%
Cost of Equity
Risk-‐free rate (2) 4,2%
Market risk Premium (3) 4,3%
Levered Beta (4) 0,87
Size Premium (5) 6,1%
Cost of Equity 14,0%
Cost of Debt
Cost of Debt 0,4%
Taxes 28,0%
After Tax Cost of Debt 0,3%
WACC 10,1%
(1) Obtained from Boss Media AB annual report 2007
(3) Obtained from Damodaran (2011)
(4) Obtained from Damodaran (2011)
(5) Obtained from Ibbotson SBBI Valuation Yearbook
(2) Yield on 10-‐year government bond (cf. Sveriges Riksbank)
Input
The risk-free rate of return represents a meas-
urement for the purpose of comparison for in-
vestors. It is assumed that at this interest rate one
can deposit money without risk of losing it.
However, employing capital in a company bears
uncertainty and shareholders demand premiums.
As the risk free rate incorporates inflation and
industry specific growth, a growth rate of 1,5
percent is recommended by KMPG International
(KPMG International, 2011). A two percent
growth rate is reasonable, since the software
industry noted higher accretion than the market
and the inflation rate in Sweden was 2,22 per-
cent in 2007 (Statistics Sweden SCB, 2001).
Government bonds are commonly used to esti-
mate risk-free interest rates (KPMG Internation-
al, 2011). Therefore, government bonds, issued
by Sveriges Riksbank with a maturity up to ten
years, were taken as reference. Sveriges Riks-
bank provides a risk-free interest rate of 4,17
percent, which can be found in appendix I.C.IV.
Damodaran (2011) sets the market risk premium
at 4,3 percent in Sweden. Hence the market risk
premium of Boss Media AB was set at 4,3 per-
cent.
Beta describes the systematic risk of an invest-
ment relative to the overall market and is one
component of CAPM (Pratt & Grabowski,
2008). Instead of trying to evaluate the beta for
just the single company separately, it makes
sense to compare its business to similar ones in Figure 17: WACC computation of Boss
Media AB 2007-12-31
53 | P a g e
the same industry, called peer group. Löfstrand (2011) described Boss Media AB to be
operating in the software industry. He also states, that the company's main markets are the
US and Europe, which matches the indication of the annual report stating that more than 96
percent in sales are generated outside of Sweden (Löfstrand, 2011). As Boss Media AB
lists several competitors that also operate in North America and as it was eventually ac-
quired by a US company itself, it makes sense to compare their business to firms that have
also been active in the field of software in 2007 in the same target markets. Damodaran
(2011) collects extensive historical data in both of the markets mentioned (ibid.). The pa-
rameters for this analysis are therefore limitations with regard to a specific business (com-
puter software/services and gaming software), the region (Europe and USA) and the time
frame (2007). Taking the mean of the collected data leads to an unlevered beta of 1,11 for
Europe and 0,77 for the United States, which can be recapped in appendix I.C.V. Thus
strong deviations of different companies were eliminated. With an assumed weighting of
3(Europe):7(US), reflecting Boss Media ABs target market penetration, the assessment
results in an overall beta of 0,87 for Boss Media AB. The beta compares to the lower end
of an overall range from 0,82 to 1,02 of the European market of another representative
study and can therefore be seen as justifiable (KPMG International, 2011).
As mentioned earlier, Boss Media AB belongs to the small cap section of the market with a
market cap of SEK 807 million. Size premiums are measured in deciles, where the 1st dec-
ile represents the largest companies on a market and the 10th decile the smallest ones. With
a market cap below USD 263 million45, Boss Media AB’s size premium is referenced to
the 10th decile, which implies a size premium of 6,1 percent (Grabowski, 2011).
Cost of debt is derived from the interest paid on interest bearing long term debt. In case of
Boss Media AB, the long term debt makes up for 8,3 percent of overall debt, which con-
sists solely of corporate tax liabilities. Contrarily, most of Boss Media AB’s short-term
debt is composed of liabilities to licensees and thus can be assumed to be non-interest bear-
ing (cf. appendix I.C.III). According to Wiggins (1999), evaluating companies that hold
non-interest bearing short term debt, it must be both excluded from the WACC as well as
from cash flows. The detailed exclusion of changes from non-interest bearing short term
debt in cash flows exceeds the scope of this research. For reasons of simplification, all
short term liabilities are eliminated in the cost of debt, assuming that only long-term debt
45 SEK 1.486.738.807at the 31st of December 2007.

54 | P a g e
bears interest charges. Consequently, its interest rate on debt is only paid to a small frac-
tion of the total debt. Therefore, the rate for the cost of debt is adjusted to 8,3 percent (frac-
tion of long term capital) of 5,0 percent interest (Löfstrand, 2011). Therefore, the calculat-
ed interest rate appears noticeably cheap, but is projected on the total debt of which a great
share of 92,7 percent is non-interest bearing.
Corporate taxes are estimated to remain the same with 28 percent as recommended by
KPMG International (KMPG International, 2008).
The after tax cost of debt of 0,4 percent is made up of the cost of debt, multiplied by after
tax cost of debt. Interest charges lower the taxable income, resulting in a so-called tax
shield. To come up with the after cost of debt, the assumptive future tax rate is applied to
28 percent.
Step VI - estimating PV, determining valuation and terminal value
The PV employs the idea of time value of money, since “A dollar today is worth more than
a dollar tomorrow.” (Brealy, Myers, & Allen, 2008, p. 14). The current dollar can be in-
vested and is thus increasing in value. In the DCF, future FCFs and the terminal value after
five years are discounted to their PV by Boss Media ABs WACC of 10,1 percent as illus-
trated in Figure 20.
The PV is computed by multiplying each future FCF with its according discount factor.
Figure 18 shows the calculation of Boss Media AB’s FCF to PV in 2008.
!"! =!"!!
(1+ !!"##)!
!"!""# = 58.117
(1+ 0,10)! = 36.086
Where FCF = free cash flow, PV = present value, !!"## = discount rate, n = last year considered for the projected period of time, !"!!= free cash flow received in year n.
Figure 18: PV of Boss Media ABs FCF in 2008
Given a 10,1 percent WACC, the FCF of SEK 58.117 would be worth SEK 36.086 at the
end of the last projected year as illustrated in Figure 18. However, Rosenbaum and Pearl
(2009) suggest using a mid-year discount convention as CFs are usually not obtained at the
end of a fiscal year. Thus, n is halved. Figure 19 shows the implications for the DCF, when

55 | P a g e
computing PV with n-0,5 instead of n. More accurately measured, the PV of the FCF of
2008 is now worth SEK 37.647. However, the terminal value as described in section 2.3.1
covers the period after the more detailed forecast horizon of five years. This perpetuity is
therefore discounted at exactly the beginning of the period from where constant perpetual
growth is assumed.
!"! =!"!!
(1+ !!"##)!!!,!
!"!""# = 58.117
(1+ 0,10)!!!,! = 37.647
Where FCF = free cash flow, PV = present value, !!"## = discount rate, n = last year considered for the projected period of time, !"!!= free cash flow received in year n.
Figure 19: PV of Boss Media AB’s FCF in 2008 using a mid-year convention
Figure 20: PV of Boss Media AB 2004-2012
As described in chapter 2.3.1, the terminal value is computed perpetual. This means that
the value after 2012 is calculated as perpetuity at Boss Media AB.
When estimating the perpetuity growth rate, the gross domestic product (GDP) growth rate
of the company’s major revenue generating market is used as a reference (Koller et al.,
McKinsey & Company, 2010). As discussed before, the underlying growth rate represents
a theoretically everlasting growth of the company. Even though Boss Media AB has expe-
rienced outstanding growth, the growth cannot exceed the economy’s in the long run
(Damodaran A. , 2002). Boss Media AB has its main operations in the US and in Europe.
Therefore, the GDP growth rate of Europe and the US is considered for the estimation of
(in million) CAGR
2004 2005 2006 2007 (04-‐07) 2008 2009 2010 2011 2012
Unlevered Free Cash Flow 5.437 -‐7.983 180.165 -‐19.731 39.634 45.028 51.156 58.117
WACC 10,1%
Discount Period 0,5 1,5 2,5 3,5 4,5
Discount Factor 0,95 0,87 0,79 0,71 0,65
Present value of free cash flow -‐18.801 34.294 35.377 36.494 37.647
actual period forecasted period

56 | P a g e
the perpetuity growth rate. Figure 21 shows the development of the GDP growth rate from
2004 to 2007. 2004 2005 2006 2007 04-‐07
EU 2,5% 2,0% 3,2% 3,0% 2,675% 3,075%
US 3,1% 4,4% 3,2% 3,2% 3,475%
Figure 21: GDP growth rate Europe and US, 2004 to 2007 (Bureau of Economic Analysis,
Departement of Commerce, 2011), (European Commission, eurostat, 2011).
Consequently, an average GDP growth rate of 3,08 percent for both markets combined is
used when computing the perpetuity growth rate for the terminal value.
The perpetual terminal value is then calculated by multiplying the CF of 2012 by the per-
petuity growth rate, divided by the WACC, adjusted by the growth rate. This leads to a
terminal value of SEK 849.733 million as shown in Figure 22.
Figure 22: Terminal value of Boss Media AB 2007-12-31
Step VII - determining equity value
Each FCF from 2008 to 2012 and the terminal value are discounted to present by using the
WACC for each period, to add up to Boss Media AB’s enterprise value, illustrated in Fig-
ure 22.
After the future cash flows and terminal value are discounted to their present equivalent,
these two components are combined in one enterprise value. It represents the value of the
entire company as it takes into account the cash flow to both holders of equity and debt
(Koller et al., McKinsey & Company, 2010).
Terminal Value
Terminal Year Free Cash Flow 58.117
Perpetuity Growth Rate 3,1%
Terminal Year EBITDA 165.512
Terminal Value 849.733
Implied Exit Multiple 5,7x
Discount Period 5,0
Discount Factor 0,6
Present Value of Terminal Value524.507
% of Enterprise Value 81%

57 | P a g e
Enterprise value
Present value of Free Cash Flow
125.010
Terminal Value 849.733
Discount Factor 0,62
Present Value of Terminal Value
524.507
% of Enterprise Value
81%
Enterprise value 649.518
Less: Total debt 319.100
Plus: Cash and Cash Equi.
492.600
Net Debt -‐173.500
Implied Equity Value 823.018
Outstanding shares 57.065
Implied share price 14,42
Implied multiples
Enterprise Value 649.518
SALES 2008 354.834
EBITDA 2008 99.353
Implied EV/SALES 1,8x
Implied EV/EBITDA 6,5x
Output
In case the evaluated firm is acquired, the buyer takes
over the equity from the former owner to seize control
over the enterprise as a whole. As Boss Media AB is not
completely equity-financed as mentioned in computing
the WACC, the new shareholder is responsible for cover-
ing the expenses from liabilities. Simultaneously, the ac-
quirer also gets hold of existing capital that could be used
to make up for the outstanding debt (Koller et al., McKin-
sey & Company, 2010), (Rosenbaum & Pearl, 2009).
Therefore, Boss Media AB's cash and cash equivalents of
SEK 492,6 million is netted against the total debt of SEK
319,1 million. Acquiring Boss Media AB at the 31st De-
cember 2007 would result in SEK 173,5 million excess
readily available funds after all debt holders are paid off.
This additional cash raises the company's value compared
to the predicted future cash flows and leads to the implied
equity value of SEK 823.018 million.
As of the end of 2007, 57.065.000 stocks are outstanding
(Boss Media AB, 2008). Each stock represents a fraction
of ownership in the company which needs to be bought
from its current holder when acquiring the firm. After
calculating the present value of the projected free cash
flows, adjusted by the company's net debt, the calculation
at hand provides a reasonable approach to estimate the
future benefits to equity holders of the company as a
whole. To calculate how the entire implied equity value
compares to a single stock, the result of the DCF is divid-
ed by the total number of outstanding stocks. The result-
ing implied share price amounts to SEK 14,42.
To compute the estimated share price of Boss Media AB’s
shares, the company’s value is divided by the number of
outstanding shares. Boss Media AB had 57.065.000 circu-
Figure 23: Enterprise value
and implied multiples of Boss
Media AB 2007-12-31

58 | P a g e
lating shares. Additionally, to the outstanding shares of 57.065.000, the board of directors
decided to introduce a warrants46 program on the May 4th 2006 (Boss Media AB, 2007).
Two million subscription warrants were issued, which enables the holder to convert them
at a price of SEK 29,20 until December 31st 2009. Once exercised the warrant transfers to
common stock and consequently demands cost of equity (Arzac, 2008). However, as the
share price has since not reached SEK 29,20, holders were not willing to use their call op-
tion. Warrants and their possible cost of equity are not taken into account in this research.
Hence, the price per share is projected with SEK 14,42 per share, sown in Figure 23.
Step VIII - sensitivity analysis
As mentioned throughout the whole valuation discussion, especially the calculation of the
WACC and the growth rate of the terminal value provide room for discretionary powers.
Therefore, a sensitivity analysis, illustrated in Figure 24, as recommended by Löfstrand
(2011) is conducted to devote attention to the deviation of the most influential parameters
and their impact on the calculation’s results. Figure 24 reveals the impact of the perpetual
growth rate, WACC and annual sales growth on the share price.
46 Warrant – a right to buy stocks for an agreed price at a later date.

59 | P a g e
Figure 24: Sensitivity analysis of Boss Media AB 2007-12-31
Boss Media ABs operations are influenced by a number of factors. These consist mainly of
political and legal factors regarding regulations on internet gaming. Further factors are
technological developments and financial risks (Boss Media AB, 2007). These risks vary
greatly among different countries and bear uncertainty. Europe is considered to pass fur-
ther restrictions, which the US already implemented in 2006, prohibiting online gaming.
Therefore, Boss Media AB concentrates on state owned online gaming operators as cus-
tomers.
Technological developments are necessary to keep up with the pace of the online gaming
industry, but bear risk of either being taken over by competitors or making poor technolog-
ical investment choices.
The perpetual growth is estimated to be 3,1 percent. If it is lower however, the share price
will fall. Depending of the correctness of the WACC, the share price is further influenced.
If the WACC is adjusted by one percent, the share price will either rise by approximately
SEK 1,8 or fall by SEK 1,3. In the best possible case with high perpetual growth and a low
WACC, the share price would amount to SEK 23,08. The worst case with a perpetual
growth of 2,1 percent and a high WACC, the share price diminishes to SEK 10,94. The
14 2,1% 2,6% 3,1% 3,6% 4,1%
8,1% 17,00 18,11 19,44 21,06 23,08
9,1% 14,83 15,60 16,51 17,58 18,86
10,1% 13,20 13,77 14,42 15,17 16,05
11,1% 11,94 12,37 12,86 13,41 14,03
12,1% 10,94 11,27 11,64 12,06 12,53
14 12,6% 13,1% 13,6% 14,1% 14,6%
26,0% 12,64 12,63 12,62 12,61 12,59
27,0% 13,50 13,51 13,52 13,53 13,53
28,0% 14,37 14,40 14,42 14,44 14,47
29,0% 15,23 15,28 15,32 15,36 15,40
30,0% 16,10 16,16 16,22 16,28 16,34
Sensitivity Analysis
perpetuity growth %
WACC
Annual sales growth %
EBITDA %

60 | P a g e
difference of best and worst case scenario show a smaller loss in the worst case than gain
in the best case scenario. Losing only SEK 3,48 (SEK 14,42 less SEK 10,94), but gaining
SEK 8,66 (SEK 23,08 less SEK 14,42).
The annual sales growth is estimated with 13,6 percent. The adjustment of 0,5 percent
growth results in SEK 0,01 difference in the share price. The annual sales growth rate is
therefore not as influential as the perpetual growth rate. The worst case scenario shows a
share price of SEK 12,59 and the best case a share price of SEK 16,34. The range of these
parameters does not differ as much as the previous one due to their lower impact on the
equity value. It needs to be further noted, that both increase and loss in the share price are
occurring even though sales are increasing.
5.2.2. RESULTS FROM THE EVALUATION OF BOSS MEDIA AB
Differences between the share price and other valuation models occur for many reasons. A
full appreciation of these deviations exceed the scope of this work, but might include be-
havioral approaches such as the role of emotions as mentioned in chapter 2.2.2 versus pure
number- and chart-based calculations. Nevertheless, the results of this kind of income ap-
proach can be verified by comparing it to other models, for examples to ones that are mar-
ket-based. The presented DCF shows multiples weighting the enterprise value against sales
(1,8x) and EBITDA (6,5x). The advantage of calculating these multiples lies in the sim-
plicity of verifying a company’s value. The ratios can easily be compared to the competi-
tor’s multiple, taken from publicly available information in their annual reports. This mar-
ket-based approach provides a first estimation of whether the numbers of the evaluated
company are more favorable than its peer group. However, a further analysis is needed to
eliminate non-operating one-time effects and to count in non-financial data, such as the
management of the firm and the market it operates in.
Initiating an acquisition imposes the interesting question of how the acquirer values the
target and the expected synergies. As the end of fiscal year 2007 was chosen as a starting
point for the DCF valuation, it also closely corresponds to the actual day of the first offer
of GTECH Corporation for Boss Media AB.
At the 1st February 2008, the acquirer tenders its first offer in an attempt to take over Boss
Media AB. Their official press release (GTECH Corporation, 2008) states that the target
makes a perfect fit for their desired growth strategy. One of the synergy effects, which
their CEO at that time points out, is that GTECH Corporation can offer Boss Media AB's
products and services to their existing customers on a global scale. Seeking to combine
61 | P a g e
their strengths the acquirer offers to pay SEK 19,00 in cash per outstanding share which
compares to share price of SEK 15,10 on 31st January 2008. This situation confirms two
findings: First, market- and income-based valuations can vary in M&A transactions, espe-
cially in cases of expected synergies. Secondly, a price of SEK 19,00 draws near to the
SEK 14,42 per share of this research when considering benefits from synergies. The offer
price of GTECH Corporation therefore suggests that the assumptions of this research are
reasonably chosen and go along with a conservative offer of their acquirer. The timing
difference of two months between the research's valuation date and the first offer price can
be neglected due to its relatively short time frame. Furthermore, also the share price has
not significantly changed from 31st December 2007 (SEK 14,15) to 31st January 2008
(SEK 15,10). However, as previously shown in Figure 9, the market immediately reacts to
the prospect of a "sure deal" of SEK 19,00 and closes at SEK 19,40 on 1st February 2008.
In a second announcement on 13th February 2008, GTECH Corporation raises its offer to
SEK 25,00 per share, describing the outlook of acquiring a "competitive supplier in an ex-
pensive industry" (GTECH Corporation, 2008) as a promising move. Comparing it to the
initial offer of SEK 19,00 respectively to the calculated equity value of SEK 14,42, it can
be assumed that GTECH Corporation now moved closer to their real expected value. Pos-
sibly, synergy and restructuring effects are counted in more precisely, thus leading to a
premium of SEK 10,58 (SEK 25,00 offer minus SEK 14,42 equity value) as a gain for
shareholders. Also, Löfstrand (2011) illustrates that the acquisition is expected to pay off
for GTECH Corporation, as it is assumed that the acquisition is entirely financed by debt
(for GTECH Corporation). This LBO must withstand the risk of default of the expected
cash flows from Boss Media AB that can be assumed to be needed to meet the correspond-
ing debt obligation. Therefore, a steadily recurring return on investment of more than five
percent of interest on debt capital is required to meet the expectations (Löfstrand, 2011).
The complete deal is carried out from 1st February 2008 to 3rd March 2008 when 46,3 mil-
lion shares are acquired by a JV mainly owned by GTECH Corporation (Lottomatica
S.p.A., 2009). This recent acquisition increased their share of the company by about 82
percent to a total of approximately 94 percent, so that the new parent was able to seize con-
trol over the voting rights. Again, prior to the initial settlement of the deal, the stock price
increased to SEK 25,00 on the 13th February 2008, reflecting the final offer for the out-
standing shares of Boss Media AB (cf. Figure 9).

62 | P a g e
6 . CONCLUSION
The conclusion offers answers to the initial research question, meeting the purpose of the
research. Finally research limitations are elaborated.
6.1. SUMMARY OF THE RESULTS
The research was directed by the question, Mergers and Acquisitions, a trendy fad or sus-
tainable value creation, which was further divided into sub-questions for comprehensive
reasons. The sub question should consequently help to answer the initial question.
Is social behavior a trend catalyst that destroys value?
Is the price of an acquisition an indicator for value creation or destruction?
The answers of the sub-questions are presented in Figure 25.
Question Answer
Is social behavior a trend catalyst that destroys
value?
Yes, behavior such as hubris, managerialism and herding is causing trends, which lead to M&A waves. Hubris is triggering overvaluation in the decision for investments. Overestimation leads to the per-‐ception of too high prices to presumably reflect the true value, which then triggers imitation of the investment choice, which resonates in herd-‐ing. Managerialism leads to self-‐fulfillment at the cost of the company. Once it gets detected that there will be no consequences, others follow in taking advantage of their position and feel safe in the phenomenon of herding. Consequently, herding is the behavioral source of M&A waves.
Is the price of an acquisition an indicator for val-‐
ue creation?
No, researchers jointly agree on value destruction through M&As. But consciously estimating the advantages of an M&A investment creates value for shareholders.
Mergers and Acquisitions, a trendy fad or sus-‐
tainable value creation?
M&As occur as trends and only create sustainable value when deliberately executed.
Figure 25: Answers to the research questions
As described earlier, there is high evidence for M&A waves being caused by behavior.
Especially herding has a severe impact on the development of waves.

63 | P a g e
Hubris and managerialism are activators of herding. Social behavior such as hubris and
managerialism, lead to increased herding. Those social behaviors feed each other and thus
create M&A trends. As Perkins and Perkins (1999) noted, people stop thinking clearly dur-
ing a trend and blindly follow the masses. This hysterical behavior causes waves. The in-
vestor’s blinders can only be taken off by economic disturbances. M&A waves usually
decline due to an economic crisis, forcing investors to rethink their decisions thoroughly.
Investments are made for reasons of arbitrage. Thus, an investment is only made if bought
at a lower price than it can be resold. The market sets a price on an investment, which can
be confirmed or rejected by calculations. However, this does not include intangible assets
like employee expertise, licensees or patents. The case of Boss Media AB shows that a
higher price can be reasonable when the company holds intangible assets, which are of
high value to the acquirer. GTECH Corporation originally set out to acquire Boss Media
AB at a price of SEK 19,00, which seems reasonable when accounting for synergetic ef-
fects. Another factor can be restructuring effects as pointed out by Löfstrand (2011). An
acquirer assumes to adjust the targets operations to their means and will not maintain the
original structure. For example cost reductions, which cannot be accurately accounted, can
influence the future value of company.
GTECH Corporation originally set out to acquire Boss Media AB in an economic slump to
beat down its price, but ended paying just as much as they would have before the economic
downturn. GTECH Corporation paid a premium of SEK 10,58, which accelerated the ac-
quisition price to almost twice its value of a standalone DCF analysis (cf. Figure 9). It is
questionable whether this step can be called rational. One cause can be fear of not being
able to keep up with competitors that have faster “gone online” and therefore making
quick, overhasty decisions. As Löfstrand (2011) explained, GTECH Corporation felt pres-
sured to step in the online gaming market. Evidence for this assumption can be found in
the short acquisition time of less than two month. Further influences on GTECH Corpora-
tion, turning from rational choice to impulsive actions can be witnessed in their willingness
to take the risk to borrow the money needed to carry out the acquisition. Also interest-
bearing debt needs to be repaid on a regular basis, which implies an additional risk when
taking first steps at a hyped, and therefore volatile, market.
Finally, this research confirms the results of previous studies. M&As do not create value,
however, this research points out that value creation is possible, when M&As are executed
thoroughly. It can be said, that GTECH Corporation did intend to act rationally and sound
64 | P a g e
in acquiring Boss Media AB originally by using the general economic downturn, but was
biased by social behavior and trend influences, that these influences out powered their
original intentions. Thus, GTECH Corporation did not create value after all.
6.2. LIMITATIONS
Limitations are boundaries, not set by the researchers, but by external factors. These re-
strictions occur during the process of the research. The limitations will be discussed in re-
gards to the research object, information access and technical restrictions.
During the research process, after having chosen Boss Media AB as a case study objective
due to their high M&A involvement, it turned out that no public information of the target
of Boss Media AB were available. Therefore the focus was shifted to analyzing the process
of Boss Media AB being the target of an acquisition with more information at hand the
research could be performed more accurately.
Nevertheless, the access to certain information was limited. To be able to perform a thor-
ough evaluation of an M&A target with the required information, it was necessary to con-
duct the study with a publicly traded company. Furthermore, was the choice of a research
object limited to an industry with high M&A activities. Therefore, the research was limited
to the acquisition of Boss Media AB by GTECH, not considering Boss Media ABs M&A
targets such as Dynamite Idea.
The aim to detect value creation or destruction through investigating correct pricing be-
came a long part of this research due to technical restrictions.

65 | P a g e
7 . REFLECTIONS
The objective of this research is to create awareness for value over or underestimation in
M&As. It is hoped that the research contributes to the management’s wakefulness when
making investment decisions in regards to M&As on the one hand. On the other hand, re-
searchers might find this study helpful for further investigations about causes for fads and
value creation in investment activities. Therefore, reflections are made theoretically as
well as practically. Behavioral catalysts for trends in M&A activity are discussed theoreti-
cally, reflecting on its contribution to research. Then it is critically reflected which impacts
this study could imply for practitioners such as managers, investors and shareholders. Fi-
nally, suggestions for further research investigations are offered.
7.1. REFLECTIONS OF MERGERS & ACQUISITIONS AS TRIGGER FOR TRENDS AND VALUE CREATION
Even though the motives for a merger or an acquisition seem to be the panacea for all
growth problems a company can possibly face, it is never guaranteed. Unfortunately, the
decision to undergo M&As has far reaching consequences. Even a seemingly waterproof
M&A can fail which induces a lot of problems in all companies involved and will have
severe impacts on earnings as well as share prices. The difficulties that are already imma-
nent in M&A activities are multiplied by inadequate social behavior and overpricing.
Trends and their influences on value creation in M&As are closely interlinked, that they
can hardly be looked at separately. Investment decisions are made based on the idea to
enhance the value of a company. However, no one is resistant to market movements such
as trends. Trends cannot be influenced as the behavior of participants in the market is un-
controllable. The active decision for an M&A investment can therefore be highly biased by
trends. Overvaluation and overpaying of M&A investments is an example where the origi-
nal intention to cater to the best interest of a company is overcome by trendy influences.
Even calculating the value of a company is defeated by the seductive influences of trends.
Asymmetrical information and manipulated inputs abrogate rational decision making.
When trends come to a sudden end and have severe economic impacts, investors are forced
to revaluate their choices. Constraints on access to cash lead to the companies putting
money aside instead of spending it. Investment decisions will be made more carefully and
value creating, being less trend dependent. However, being too cautious and penny-
pinching easily leads to undervaluation, setting off a trend again. The circuit starts with

66 | P a g e
companies not being able to withdraw from market influences. The fear of being acquired
by a first-mover pressures companies to act quickly.
Transferring the theoretical implications to practice, shareholders and companies would
gain from the awareness of behavioral factors influencing their decision making capabili-
ties. Ideally, managers would make rational, thought through decisions based on correct
information. In an efficient market information is equally accessible to everyone. Based on
the correct information over- and undervaluation would not exist. The focus would be on
creating true, long-term value through synergies. Investors think rationally, remaining un-
affected by trends.
Being able to create true synergies and value through an M&A is possible if executed care-
fully, but not very likely. Still, many unsuccessful M&As are performed in the hope of
finding the one, perfect fit. One can say that Warren Buffet (1982) was right. There are
many toads that do not turn into princes and the real princes are difficult to find.
7.2. SUGGESTIONS FOR FUTURE RESEARCH
During the course of this research many undeveloped topics were introduced, but could not
be investigated in more detail due to time and scope restrictions of this research.
After the analysis it became apparent that the managers behavior is highly biased and caus-
es damage to companies and their shareholders instead of creating value. Some researchers
even claim there to be no valuation creation at all in M&As (Hayward & Hambrick, 1997),
(Roll, 1986), (Seth, Son, & Pettit, 2000). Taking this research one step further, it would be
interesting to study which methods can be applied to prevent value destruction and trend
dependency. Possibly incentives can be created that lead to more rational and long-term
thinking. One example could be bonuses of top managers that award the work of one year,
but not beyond that time period and thus cause short-term thinking. The impact of in-
creased legal restrictions could be studied as well.
Questionable would be if external parties could price companies more accurately, by ap-
plying models that reflect more accurately on reality. As Barker (2001), Brealy, Myers and
Allen (2007) as well as Koller et al. (2010) explain, the commonly used models are already
highly reliable, yet they cannot cover every aspect of uncertainty. Taking on measures,
which are less susceptible to manipulation, when calculating the entities value, could lower
67 | P a g e
the likelihood of speculation. Moreover it could be of interest to study whether a third par-
ty would evaluate a company more objectively if not being paid by the management in-
volved in the M&A process. An example for this could be fairness opinions. Fairness opin-
ions evaluate the financial appropriateness of transactions prices and are generally per-
formed by investment banks, advisors or auditing firms. The board of directors can use
advisor’s recommendation in justifying their decision towards shareholders, preventing
detrimental behavioral influences.
Behavioral catalysts were only studied in respect to hubris (Roll, 1986), managerialism
(Seth, Son, & Pettit, 2000) and herding (Sahlin & Wedlin, 2010). However, taking further
influential behaviors into account, could uncover whether the ones looked at are exceptions
or representative of catalysts for trends.
Moreover, applying the findings from this research to other industries could unfold wheth-
er this is a phenomena only prone to specific industries or whether hubris, managerialism
and herding as well as value creation or destruction are a general, social problem. Not only
the scope of markets and forms of social behavior can be further assessed but also the vari-
ous specialties in M&A transactions.
Looking more closely at the online gaming software industry, the research could be en-
hanced by adding the structures and implications of cross border mergers since the industry
is operating globally.
Recapping the suggestions for future research, it is clear that this research does not cover
all aspects or reflects a complete picture. Thus, this research can be seen as stepping stone
for future investigations on the topic of value creation and trend setting in M&As.

68 | P a g e
V. BIBLIOGRAPHY
Amihud, Y., & Lev, B. (1981). Risk Reduction as a Managerial Motive for Conglomerate
Mergers. The Bell Journal of Economics , Vol. 12 (issue 2), pp. 605-617.
Arzac, E. R. (2008). Valuation for Mergers, Buyouts, and Restructuring. Hoboken: John
Wiley & Sons Inc.
Auerbach, A. J. (1988). Corporate Takeovers: Causes and Consequences. Chicago: The
University of Chicago Press.
Axelsson, K. (2011, 02 - 03). Boss Media växer i Växjö. Retrieved 04 - 13, 2011, from
Smålandsposten: http://smp.se/nyheter/vaxjo/article2267111.ece
Bain, J. S. (1959). Industrial Organization. New York: Wiley & Sons.
Barker, R. (2001). Determining Value, Valuation Models and Financial Statements.
Harlow: Pearson Education Ltd.
Bergström, V., & Vredin, A. (2002). Measuring and interpreting business cycles. Oxford:
Oxford University Press.
Berk, J., & DeMarzo, P. (2007). Corporate Finance. Boston: Perason Eductaion Inc.
Bershire Hathaway Inc. (1982, 02 - 26). Chairman's Letter 1981, Annual Report 1981.
Retrieved 05 - 08, 2011, from http://www.berkshirehathaway.com/letters/1981.html
Bikhchandani, S., Hirshleifer, D., & Welch, I. (1992). A Theory of Fads, Fashion, Custom,
and Cultural Change as Informational Cascades. The Journal of Political Economy , Vol.
100 (issue 2), pp. 992-1026.
Bloomberg Finance L.P. (2010). 2011 M&A Outlook. (U. Nandram, M. Trindade, I.
Adewuya, & C. Chuang, Eds.)
Borghese, R. J., & Borgese, P. F. (2002). M & A from Planning to Integration, Executing
Acquisitions and Increasing Shareholder Value. New York: McGraw-Hill.
Boss Media AB. (2007). Annual Report 06. Växjö.
Boss Media AB. (2008). Årsredovisning 2007. Växjö.
Bradley, M., Desai, A., & Kim, E. H. (1988). Synergistic Gains from Corporate
Acquisitions and their Division between the Stockholders of Target and Acquiring Firms.
Journal of Financial Economics , Vol. 21, pp. 3-40.
Bragg, S. M. (2009). Mergers & Acquisitions: A Condensed Practitioner's Guide .
Hoboken: John Wiley & Sons Inc.
Brealy, R. A., Myers, S. C., & Allen, F. (2008). Priciples of Corporate Finance. New
York: McGraw-Hill.
69 | P a g e
Bryman, A., & Bell, E. (2007). Business Research Methods. Oxford: Oxford University
Press.
Buckley, P. J., & Ghauri, P. (2002). International Mergers and Acquisitions: A Reader.
London: Thomson.
Bureau of Economic Analysis, Departement of Commerce. (2011, 04 - 28). Table 1.7.1.
Percent Change from Preceding Period in Real Gross Domestic Product, Real Gross
National Product, and Real Net National Product. Retrieved 05 - 20, 2011, from
http://www.bea.gov/iTable/iTable.cfm?ReqID=9&step=1
Cartwright, S., Cartwright, S., & Cooper, C. L. (2000). Managing mergers, acquisitions,
and strategic alliances: integrating people and cultures. Oxford: Butterworth-Heinemann.
Damodaran, A. (2011, 01). Betas by Sector. Retrieved 05 - 22, 2011, from
http://pages.stern.nyu.edu/~adamodar/New_Home_Page/datafile/Betas.html
Damodaran, A. (2002). Investment valuation tools and techniques for determining the
value of any asset. New York: John Wiley & Sons.
Damodaran, A. (2011, 01). The Data Page. Retrieved 05 - 22, 2011, from
http://pages.stern.nyu.edu/~adamodar/New_Home_Page/data.html
DePamphilis, D. M. (2003). Mergers, Acquisitions and other Restructuring Activities, an
integrated approach to Process,Tools, Cases, and Solutions. San Diego: Academic Press.
Devenow, A., & Welch, I. (1996). Rational herding in financial economics. European
Economic Review , Vol. 40, pp. 603-615.
Dimson, E., Marsh, P., & Staunton, M. (2002, 09 -). Global Evidence on the Equity Risk
Premium. Journal of Applied Corporate Finance .
Duchin, R., & Schmidt, B. (2010, 12 -). Riding the Merger Wave. Working Paper .
Elofsson, J., & Wiklund, A. (2007). Boss Media from the analyst's perspective, Interview
with the analysts Jonas Elofsson (Kaupthing Bank) and Anders Wiklund (Evli Bank). 10-
11. (B. M. AB, Editor) Växjö.
Euroinvestor A/S. (2008, 12 - 31). Boss Media stock overview. Retrieved 05 - 20, 2011,
from http://www.euroinvestor.co.uk/stock/overview.aspx?id=77481
European Central Bank. (2011, 04 - 12). Retrieved 05 - 08, 2011, from Interest rate
statistics (2004 EU Member States & ACCBs:
http://sdw.ecb.europa.eu/browse.do?node=SEARCHRESULTS&sk=IRS.M.BG.L.L40.CI.
0000.BGN.N.Z&sk=IRS.M.CZ.L.L40.CI.0000.CZK.N.Z&sk=IRS.M.DK.L.L40.CI.0000.
DKK.N.Z&sk=IRS.M.LV.L.L40.CI.0000.LVL.N.Z&sk=IRS.M.LT.L.L40.CI.0000.LTL.N
.Z&sk=IRS.M.HU.L.L40.CI.0000.HUF.N

70 | P a g e
European Commission, eurostat. (2011, 03 - 11). Real GDP growth rate, Growth rate of
GDP volume - percentage change on previous year. Retrieved 05 - 20, 2011, from
http://epp.eurostat.ec.europa.eu/tgm/table.do?tab=table&plugin=1&language=en&pcode=t
sieb020
Gaughan, P. A. (2007). Mergers, Acquisitions, and Corporate Restructurings. Hoboken:
John Wiley & Sons Inc.
Grabowski, R. (2011). Risk Premia Over Time Report: 2011, Estimates for 1926 - 2010.
Chicago: Duff & Phelps LLC.
GTECH Corporation. (2008, 02 - 13). Lottomatica subsidiary GTECH Corporation, and
Medströms AB increase public cash offer to SEK 25 per share for Boss Media AB.
Retrieved 05 - 20, 2011, from Press releases 2008:
http://www.gtech.com/news/2008news/0213.asp
GTECH Corporation. (2008, 02 - 01). Lottomatica subsidiary, GTECH Corporation, and
Medströms AB recommend public all cash offer of SEK 19 per share in Boss Media AB.
Retrieved 05 - 20, 2011, from Press releases 2008:
http://www.gtech.com/news/2008news/0201.asp
Harford, J. (2005, 01 -). What drives merger waves? Journal of Financial Economics , Vol.
77, pp. 529–560.
Hartley, R. F. (2011). Management Mistakes and Successes . Hoboken: John Wiley & Sons
Inc.
Hayward, M. L., & Hambrick, D. C. (1997). Explaining the Premiums Paid for Large
Acquisitions: Evidence of CEO Hubris. Administrative Science Quarterly, , issue 1, pp.
103-127.
Healy, P., Palepu, K., & Ruback, R. (1992, 04 -). Does Corporate Performance Improve
after Mergers? Journal of Financial Economics , Vol. 31 (issue 2), pp. 135-175.
Hubbard, N. (1999). Acquisitions, Strategy and Implementation. London: Macmillan Press
Ltd.
Ibbotson Associates; Morningstar. (2011). Ibbotson SBBI Valuation Yearbook, Market
Results for Stocks, Bonds, Bills, and Inflation 1926-2010. Chicago.
IMAA. (2011). Thomson Financial, Institute of Mergers, Acquisitions and Alliances
(IMAA). Retrieved 04 - 14, 2011, from Statistics: http://www.imaa-institute.org/statistics-
mergers-acquisitions.html#TopMergersAcquisitions_Worldwide
Jennergren, L. P. (2008, 09 -). A Tutorial on the Discounted Cash Flow. SSE/EFI Working
Paper Series in Business Administration No. 1998:1 .
71 | P a g e
Jensen, M. C. (1984, 11/12 -). Takeovers: Folklore and Science. Harvard Business Review
, Vol. 62 (Issue 6), pp. 109-121.
Jensen, M. C. (07 - 1993). The modern industrial revolution, exit and the failure of
international control systems. Journal of Finance , Vol. 48 (Issue 3), S. 831-880.
Johnson, N. F., Jefferies, P., & Hui, P. M. (2003). Financial market complexity , what
physics can tell us about market behaviour. Oxford: Oxford University Press.
Kaplan, S. N., & Ruback, R. S. (1995, 09 -). The Valuation of Cash Flow Forecasts: An
Empirical Analysis. The Journal of Finance , Vol. 50 (issue 4), pp. 1059-1093.
Kleinert, J., & Klodt, H. (2002, 01 -). Causes and Consequences of Merger Waves. (K. I.
Economics, Ed.) Kiel Working Paper No. 1092 , 1092.
KMPG International. (2008). KPMG’s Corporate and Indirect Tax Rate Survey 2008.
KMPG International. (2006). KPMG’s Corporate Tax Rate Survey 2006.
Koller, T., Goedhart, M., Wessels, D., McKinsey & Company. (2010). Valuation,
measuring and managing the value of companies. Hoboken: John Wiley & Sons Inc.
KPMG International. (2011). Cost of Capital and Impairment Test Study 2010: Managing
expectations, Empirircal Survey of European Companies. Corporate Finance, Düsseldorf.
KPMG International. (2009). KPMG’s Corporate and Indirect Tax Rate Survey 2009.
KPMG International. (2007). KPMG's Corporate and Indirect Tax Survey 2007.
KPMG LLP. (2008). Doing Deals in Tough Times, Best Practices of Leading M&A Teams.
Transaction Services, Advisory.
Lintner, L. (1965). The Valuation of Risk Assets and the Selection of Risky Investments in
Stock Portfolios and Capital Budget. Review of Economics and Statistics , Vol. 47, pp. 13-
37.
Löfstrand, A. (2011, 04 - 28). Interview Boss Media AB. (L. Sällström, A. L. Bischoff, &
J. A. Daynlow, Interviewers)
Lottomatica S.p.A. (2009). Responsibly Driving Global Gaming, Annual Report 2008.
Rome.
Malmendier, U., & Tate, G. (2008, 04 -). Who makes acquisitions? CEO overconfidence
and. Journal of Financial Economics , Vol. 89, pp. 20– 43.
Markowitz, H. M., & Miller, M. H. (1960). Portfolio Selection: Efficient Diversification of
Investments. Journal of Business , Vol. 33 (issue 4), pp. 391-393.
Marks, M. L., & Mirvis, P. H. (2010). Joining Forces: Making One Plus One Equal Three
in Mergers, Acquisitions and Alliances. San Francisco: Jossey-Bass.
72 | P a g e
Miller, E. L. (2008). Mergers and acquisitions: a step-by-step legal and practical guide .
Hoboken: John Wiley & Sons Inc.
Mitchell, M. L., & Mulherin, J. H. (1996, 06 -). The Impact of Industry Shocks on
Takeover and Restructuring Activitiy. Journal of Financial Economics , issue 2, pp. 193-
229.
Mørck, R., Schleifer, A., & Vishny, R. W. (1988). Characteristics of Targets of Hostile and
Friendly Takeovers. In A. J. Auerbach, Coprorate Takeovers: Causes and Consequences
(pp. 69-129). Chicago: The University of Chicago Press.
Perkins, A. B., & Perkins, M. C. (1999). The Internet bubble: inside the overvalued world
of high-tech stocks--and what you need to know to avoid the coming shakeout. New York :
HaperCollins Publishers Inc.
Peters, B. G. (2005). Instituitional Theory in Political Science, the "New Instituionalism".
London: continuum.
Pfeffer, J. (1972, 09 -). Merger as a Response to Organizational Interdependence.
Administrative Science Quarterly , Vol 17 (issue 3), pp. 382-394.
Picot, G. (2002). Handbook of nternational Mergers and Acquisitions. Hampshire:
Palgrave Macmillan.
Pike, R., & Neale, B. (2006). Corporate Finance and Investment, Decision & Strategy.
Harlow: Pearson Education Ltd. .
Pratt, S. P., & Grabowski, R. J. (2008). Cost of capital: applications and examples.
Hoboken: John Wiley & Sons Inc.
Rhodes-Kropf, M., & Viswanathan, S. (2004, 12 -). Market Valuation and Merger Waves.
The Journal of Finance , Vol. 59 (issue 6), pp. 2685-2718.
Roll, R. (1986, 04 -). The Hubris Hypothesis of Corporate Takeovers. The Journal of
Business , Vol. 59 (issue 2), pp. 197-216.
Rosenbaum, J., & Pearl, J. (2009). Investment banking: valuation, leveraged buyouts, and
mergers & acquisitions . Hoboken: John Wiley & Sons.
Sahlin, K., & Wedlin, L. (2010). Circulating Ideas: Imitation, Translation and Editing. In
R. Greenwood, C. Oliver, K. Sahlin, & R. Suddaby (Eds.), The SAGE Handbook of
organizational instituionalism (pp. 218-242). London: Sage Publications Ltd.
Scherer, F. M. (1980). Industrial Market Structure and Economic Performance. Chicago:
Rand McNally.
Schwert, G. W. (2000, 12 -). Hostility in Takeovers:. Journal of Finance , Vol. 55 (issue
6), pp. 2599-2640.

73 | P a g e
Seth, A., Son, K. P., & Pettit, R. (2000). Synergy, Managerialism or Hubris? An Empirical
Examination of Motives for Foreign. Journal of International Business Studies , Vol. 31
(issue 3), pp. 387-405.
Sharpe, W. F. (1964). Capital asset prices: A theory of market equilibrium under
conditions of risk . Journal of Finance , Vol. 19 (issue 3), pp. 425-442.
Sherman, A. J., & Hart, M. A. (2006). Mergers and Acquisitions from A to Z. New York:
Amacom.
Shiller, R. J. (1989). Market Volatility. Cambridge: Massachusetts Institute of Technology.
Shleifer, A., & Vishny, R. W. (2003). Stock market driven acquisitions. Journal of
Financial Economics , Vol. 70, pp. 295–311.
Shleifer, A., & Vishny, R. W. (1991). Takeovers in the '60s and the '80s: Evidence and
implications'. Journal of Strategic Management , Vol. 12 (issue S2), pp. 51-59.
Statistics Sweden SCB. (2001, 04 - 12). Consumer Price Index, annual rates, percent
(Inflation rate). Retrieved 05 - 06, 2011, from
http://www.scb.se/Pages/TableAndChart____115818.aspx
Stigler, G. J. (1950, 05 -). Monoploy and Oligopoly by Merger. The Amercian Economic
Review , Vol. 40 (Issue 2), pp. 23-34.
Sudarsanam, S. (2003). Creating Value from Mergers and Acquisition. Harlow: Pearson
Education Limited.
Sudarsanam, S. (1995). The Essence of Mergers and Acquisitions. Hertfordshire: Prentice
Hall Europe.
Sveriges Riksbank. (2011, 05 - 20). Swedish Market Rates, Government Bonds. Retrieved
05 - 20, 2011, from http://www.riksbank.com/templates/stat.aspx?id=17188
Wall Street Journal. (2011, 04 - 22). A Sampled History of The NASDAQ Composite Index,
From 1971 to The Present, Including the Most Recent, Week-Ending Close Value.
Retrieved 05 - 06, 2011, from http://www.nyse.tv/nasdaq-composite-history.htm
Weston, J. F., & Mansinghka, S. K. (1971, 09 -). Tests of the Efficiency Performance of
Conglomerate Firms. The Journal of Finance , Vol. 26 (issue 4), pp. 919-936.
Weston, J. F., Mitchell, M. L., & Mulherin, J. H. (2004). Takeovers, Restructuring, and
Corporate Governance. Upper Saddle River: Perason Education Inc.
Wiggins, C. D. (1999). Matching Cash Flows and Discount Rates in Discounted Cash
Flow Appraisals. Business Valuation Review , pp. 26-35.

74 | P a g e
Williamson, O. E. (1975, 09 -). Markets and Hierarchies: Analysis and Antitrust
Implications, A Study in the Economics of Internal Organizations. The Economic Journal ,
Vol. 86 (issue 343), pp. 619-621.

75 | P a g e
VI. APPENDIX
Figure 26: Operationalization .............................................................................................. 76
Figure 27: Competitors of Boss Media AB (Boss Media AB, 2007, pp. 28-29) ................. 77
Figure 28: Announced Mergers & Acquisitions Worldwide, 1985-2010 (IMAA, 2011) ... 94
Figure 29: Announced Mergers & Acquisitions IT consulting and services, 1988-2010
(IMAA, 2011) ...................................................................................................................... 94
Figure 30: Financial data group review of Boss Media AB from 2002 to 2006 (Boss Media
AB, 2007, pp. 93-94) ........................................................................................................... 99
Figure 31: Financial data group review of Boss Media AB from 2003 to 2007 (Boss Media
AB, 2008, pp. 68-69) ......................................................................................................... 101
Figure 32: Note 21, other receivables and liabilities (Boss Media AB, 2008, p. 59) ........ 101
Figure 33: Risk-free interest rate 2007 in accordance to Swedish government bonds
(Sveriges Riksbank, 2011) ................................................................................................. 102
Figure 34: Computation of Boss Media AB’s unlevered Beta (Damodaran A. , The Data
Page, 2011), (Damodaran A. , Betas by Sector, 2011) ...................................................... 107
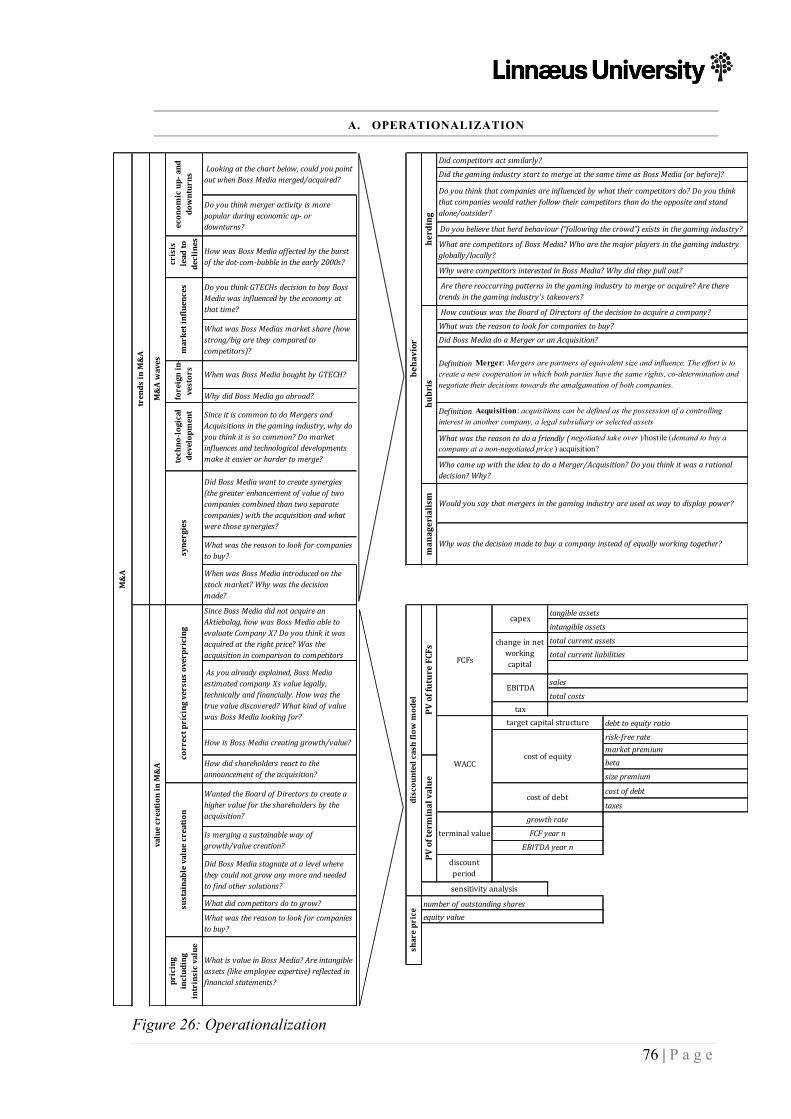
76 | P a g e
Why did Boss Media go abroad?
taxdebt to equity ratio
risk-‐free ratemarket premiumbeta
size premium
cost of debt
taxes
What did competitors do to grow? number of outstanding sharesequity value
share price
sensitivity analysis
discounted cash flow model
value creation in M&A How did shareholders react to the
announcement of the acquisition?
Since Boss Media did not acquire an Aktiebolag, how was Boss Media able to evaluate Company X? Do you think it was acquired at the right price? Was the acquisition in comparison to competitors
As you already explained, Boss Media estimated company Xs value legally, technically and financially. How was the true value discovered? What kind of value was Boss Media looking for?
correct pricing versus overpricing
How is Boss Media creating growth/value?
Wanted the Board of Directors to create a higher value for the shareholders by the acquisition?
Is merging a sustainable way of growth/value creation?
Did Boss Media stagnate at a level where they could not grow any more and needed to find other solutions?
What was the reason to look for companies to buy?
target capital structure
What is value in Boss Media? Are intangible assets (like employee expertise) reflected in financial statements?
sustainable value creation
pricing
including
intrinsic value
Are there reoccurring patterns in the gaming industry to merge or acquire? Are there trends in the gaming industry’s takeovers?
hubris
behavior
When was Boss Media introduced on the stock market? Why was the decision made?
What was the reason to look for companies to buy?
Did Boss Media want to create synergies (the greater enhancement of value of two companies combined than two separate companies) with the acquisition and what were those synergies?
Since it is common to do Mergers and Acquisitions in the gaming industry, why do you think it is so common? Do market influences and technological developments make it easier or harder to merge?
managerialism
Why were competitors interested in Boss Media? Why did they pull out?
How cautious was the Board of Directors of the decision to acquire a company?
Do you think merger activity is more popular during economic up-‐ or downturns?
herding
Would you say that mergers in the gaming industry are used as way to display power?
Did competitors act similarly?
When was Boss Media bought by GTECH?
crisis
lead to
declines
market influences
foreign in-‐
vestors
techno-‐logical
developm
ent
synergies
M&A
trends in M&A
M&A waves
Do you think that companies are influenced by what their competitors do? Do you think that companies would rather follow their competitors than do the opposite and stand alone/outsider?
Who came up with the idea to do a Merger/Acquisition? Do you think it was a rational decision? Why?
What was the reason to do a friendly ( negotiated take over )/hostile (demand to buy a company at a non-negotiated price ) acquisition?
Why was the decision made to buy a company instead of equally working together?
Definition Acquisition: acquisitions can be defined as the possession of a controlling interest in another company, a legal subsidiary or selected assets
What are competitors of Boss Media? Who are the major players in the gaming industry globally/locally?
What was Boss Medias market share (how strong/big are they compared to competitors)?
econom
ic up-‐ and
downturns
How was Boss Media affected by the burst of the dot-‐com-‐bubble in the early 2000s?
Do you think GTECHs decision to buy Boss Media was influenced by the economy at that time?
Looking at the chart below, could you point out when Boss Media merged/acquired?
Did the gaming industry start to merge at the same time as Boss Media (or before)?
Do you believe that herd behaviour (“following the crowd”) exists in the gaming industry?
WACCcost of equity
cost of debt
tangible assets
intangible assets
total current assets
total current liabilities
sales
total costs
terminal valueEBITDA year n
Did Boss Media do a Merger or an Acquisition?
What was the reason to look for companies to buy?
discount period
PV of future FCFs
PV of terminal value
EBITDA
FCFs
FCF year n
growth rate
change in net working capital
capex
Definition Merger: Mergers are partners of equivalent size and influence. The effort is to create a new cooperation in which both parties have the same rights, co-determination and negotiate their decisions towards the amalgamation of both companies.
A. OPERATIONALIZATION
Figure 26: Operationalization

77 | P a g e
company nam
ecountry
established
casinopoker
betting
Boss Media
Sweden
1996
public
XX
XX
XLevel 1 com
petitor
CryptoLogic
Canada
1995
public
XX
XX
Playtech
British Virgin Islands
1999
public
XX
XX
XX
Micorgam
ing
Isle of M
an1994
private
XX
XX
XX
XLevel 2 com
petitors
Betsson/Net Entertainment
Sweden
1996
public
XX
Chartwell Technology Inc.
Canada
1995
public
XX
XX
Nyx Interactive
Sweden
2006
private
XX
XX
EGET
Finald
1999
private
XX
XX
XX
XBw
inAustria
1997
public
XX
PartyGam
ing
Gibraltar
1997
public
XX
XX
Parlay Entertainm
ent
Canada
1996
public
XX
XVirtue Fusion Interactive GamingUK
1998
private
XX
XLevel 3 com
petitors
Finsoft
UK1995
private
XX
XX
Orbis Technology
UK1996
private
XX
XX
XX
XX
Cyberview Technology
UK1995
private
XX
XX
Interactive Gaming System
sArgentina
1997
private
XX
XX
XX
Openlot Systems
Netherlands
2000
private
XX
XX
public
private
mobile
phone
interactive gaming
machines
product category
channels
lottery &
number gam
esskill
games
PC
internet
B. EMPIRICAL INVESTIGATION – INTERVIEWS
B.I. COMPETITORS OF BOSS MEDIA AB
Figu
re 2
7: C
ompe
titor
s of B
oss M
edia
AB
(Bos
s Med
ia A
B, 2
007,
pp.
28-
29)
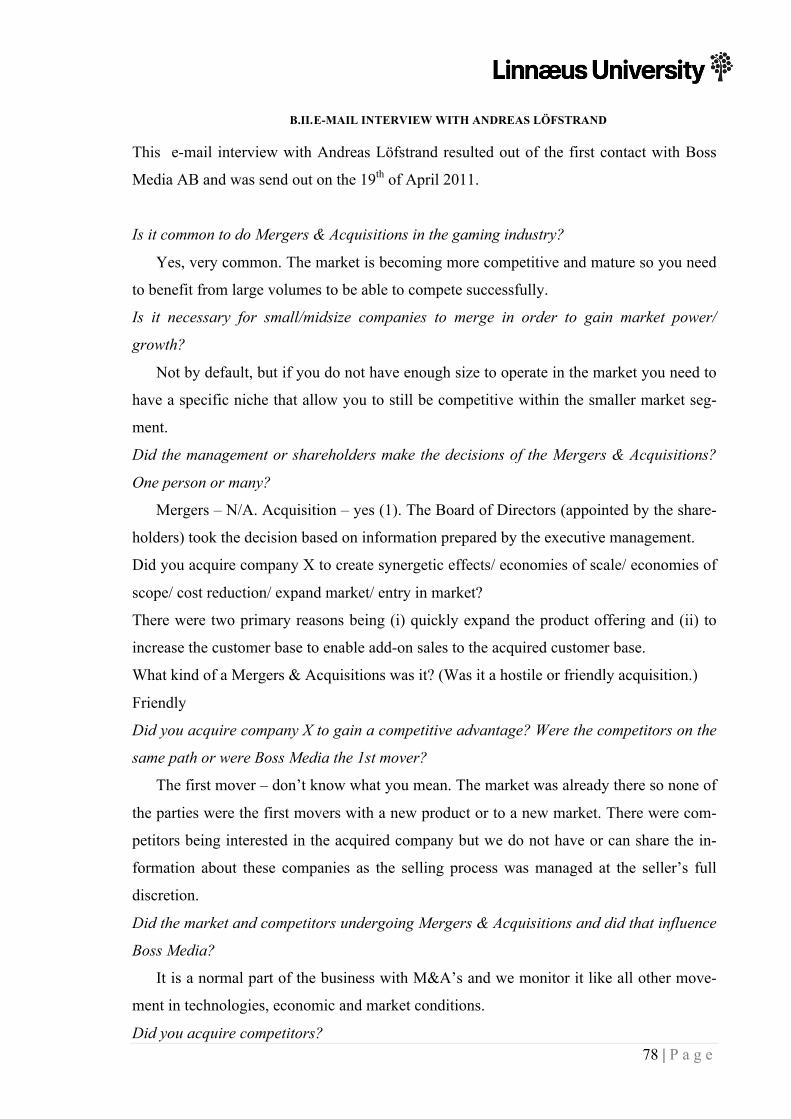
78 | P a g e
B.II. E-MAIL INTERVIEW WITH ANDREAS LÖFSTRAND
This e-mail interview with Andreas Löfstrand resulted out of the first contact with Boss
Media AB and was send out on the 19th of April 2011.
Is it common to do Mergers & Acquisitions in the gaming industry?
Yes, very common. The market is becoming more competitive and mature so you need
to benefit from large volumes to be able to compete successfully.
Is it necessary for small/midsize companies to merge in order to gain market power/
growth?
Not by default, but if you do not have enough size to operate in the market you need to
have a specific niche that allow you to still be competitive within the smaller market seg-
ment.
Did the management or shareholders make the decisions of the Mergers & Acquisitions?
One person or many?
Mergers – N/A. Acquisition – yes (1). The Board of Directors (appointed by the share-
holders) took the decision based on information prepared by the executive management.
Did you acquire company X to create synergetic effects/ economies of scale/ economies of
scope/ cost reduction/ expand market/ entry in market?
There were two primary reasons being (i) quickly expand the product offering and (ii) to
increase the customer base to enable add-on sales to the acquired customer base.
What kind of a Mergers & Acquisitions was it? (Was it a hostile or friendly acquisition.)
Friendly
Did you acquire company X to gain a competitive advantage? Were the competitors on the
same path or were Boss Media the 1st mover?
The first mover – don’t know what you mean. The market was already there so none of
the parties were the first movers with a new product or to a new market. There were com-
petitors being interested in the acquired company but we do not have or can share the in-
formation about these companies as the selling process was managed at the seller’s full
discretion.
Did the market and competitors undergoing Mergers & Acquisitions and did that influence
Boss Media?
It is a normal part of the business with M&A’s and we monitor it like all other move-
ment in technologies, economic and market conditions.
Did you acquire competitors?

79 | P a g e
No
How did you evaluate the company you bought?
Technically, legally and financially by due diligence.
How did it come that you were bought by GTECH?
N/A – we do not have any such information. But one reason was a large drop in the
share price but the underlying reasons are not known by the company.
Was the decision of Boss Media to be bought (friendly) or the decision was made by
GTECH (hostile)?
As we are not operating in the same market it must be considered a friendly takeover.
What were your expectations of the 1st acquisition and later on when Boss Media was be-
ing bought? Which of the expectations came true and which of them did not?
Yes and no. it has both generated the expected return but not to the monetary amounts
we had hoped. But the acquired company itself has not been managed in accordance with
the acquisition plan due to time constraints and reprioritization in the strategic direction of
the group after the GTECH takeover.
What happened to the stock price when the acquisition of company x was announced/ for
the stock price in Boss Medias and to the company X s stock price?
The acquired company was not listed so there was no publicly traded stock that could
change in value. At the time the acquisition of Company X was known to the market, there
was already a public tender from GTECH on the shares in Boss Media so it did not change
at all.
Would you do the 1st Mergers & Acquisitions again? What would you do different?
We always look for strategic opportunities and each new transaction has so many de-
pendencies and variables so it is not possible to set a uniform process for how we would
act as the next acquisition will be different.
Did you have help for the acquisition? Consultants or other actors?
Yes, external lawyers that drafted the SPA.
B.III. INTERVIEW GUIDELINE
·∙ When and by whom was Boss Media founded? Are the founders still working at
Boss Media?
·∙ What industry is Boss Media in? What was Boss Medias market share (how
strong/big are they compared to competitors)?

80 | P a g e
·∙ When was Boss Media introduced on the stock market? Why was the decision to go
on the stock market made?
·∙ What is Boss Medias vision/mission?
·∙ Can you describe the structure of Boss Media? What were the changes in Boss Me-
dias structure from its foundation till nowadays?
·∙ What are the core competences of Boss Media?
·∙ What are competitors of Boss Media? Who are the major players in the gaming in-
dustry globally/locally?
·∙ Can you explain what your position is at Boss Media?
·∙ How long have you been in the company?
·∙ When was Boss Media bought by GTECH?
·∙ What was Boss Medias strategy before GTECH?
·∙ How was Boss Media affected by the burst of the dot-com bubble in the early
2000s?
·∙ Do you think merger activity is more popular during economic up- or downturns?
·∙ How is Boss Media creating growth/value?
·∙ Did Boss Media stagnate at a level where they could not grow anymore and needed
to find other solutions?
·∙ What was the reason to look for companies to buy?
·∙ How did you find company X?
·∙ Why did Boss Media go abroad?
·∙ Why was the decision made to buy a company instead of equally working together?
·∙ Did Boss Media do a Merger or an Acquisition?
·∙ (Definition Merger: Mergers are partners of equivalent size and influence. The ef-
fort is to create a new cooperation in which both parties have the same rights, co-
determination and negotiate their decisions towards the amalgamation of both
companies.
·∙ Definition Acquisition: acquisitions can be defined as the possession of a control-
ling interest in another company, a legal subsidiary or selected assets)
·∙ What was the reason to do a friendly (negotiated take over)/hostile (demand to buy
a company at a non-negotiated price) acquisition?

81 | P a g e
·∙ What was the reason to merge vertically (were companies are operating at different
stages, but want to combine their production or value chains)/horizontally (compa-
nies operating in the same industry/similar product range)?
·∙ What were the motive/ strategy behind the Merger/Acquisition?
·∙ Did competitors act similarly?
·∙ Why did Boss Media choose this specific company?
·∙ Why were competitors interested in company X? Why did they pull out?
·∙ Since Boss Media did not acquire an Aktiebolag, how was Boss Media able to
evaluate Company X? Do you think it was acquired at the right price? Was the ac-
quisition in comparison to competitors doing mergers in the industry at a similar
level?
·∙ As you already explained, Boss Media estimated company Xs value legally, techni-
cally and financially. How was the true value discovered? What kind of value was
Boss Media looking for?
·∙ What did Boss Media hope to get out of this deal?
·∙ What was the general feeling of the industry towards Mergers and Acquisitions?
What did competitors do to grow? Did the gaming industry start to merge at the
same time as Boss Media (or before)?
·∙ Since it is common to do Mergers and Acquisitions in the gaming industry, why do
you think it is so common? Do market influences and technological developments
make it easier or harder to merge?
·∙ Are there reoccurring patterns in the gaming industry to merge or acquire? Are
there trends in the gaming industry’s takeovers?
·∙ Do you think that companies are influenced by what their competitors do? Do you
think that companies would rather follow their competitors than do the opposite and
stand alone/outsider?
·∙ Do you believe that herd behavior (“following the crowd”) exists in the gaming in-
dustry?
·∙ Looking at the chart below, could you point out when Boss Media
merged/acquired?
B.IV. INTERVIEW WITH ANDREAS LÖFSTRAND
The complete recorded interview from the 29th of April 2011 with Andreas Löfstrand, the
CFO of Boss Media AB is displayed in the following.

82 | P a g e
We would like to know more of the background of Boss Media.
Here is the annual report. But since we are not public anymore, we do not make it ra-
ther large – we only make it quite minimum. In this document you can read a lot about the
company and the business we are in and also get an overview of the history and the major
milestones that we have in the corporate business. And if you search for it online, you will
probably find the English one.
And this will answer a lot of the questions that we had in the beginning.
Yes! If we start from the top, the company was founded in 1996 and was listed on the
stock exchange in 1999. It was actually a quite short time before it was on a public trading
place. The founders are not working here. They worked here until 2004 and they had a
board position for another year but then they moved to Florida.
And the industry is quite complex. It is a white industry and a grey industry that is semi-
legal. Maybe you have seen the news about the PokerStars and Pokertilt being closed
down and confiscated by the FBI. That is the grey market. We have the white market,
which is Svenska Spel and Danske Spel in Denmark and you have state monopolies, which
is our primary market. So it is difficult to say what the industry is, because the industry is
gaming, but then you have a lot of services. And it is when you do software you cannot run
software without all the services. You need to have services and backup software and peo-
ple monitoring the service 24/7. So you need to have a lot of supporting systems and a lot
of tools that surrounds the software. I think that you have read about SAAS Software as a
service in this industry but the software is just a small part of it. But it is actually the ser-
vice that is the part of the offering.
You help them so that it really works.
Yes, because we are not doing Microsoft. We are not downloading the software on a
disc or an USB stick or whatever and give it to the customers. We buy service for 5 million
Euros, we install it and we are running it. We do everything for them, that is this business.
So it is more B2 B or more B2C?
We only do B2B.
Has that always been the mission or vision?

83 | P a g e
In the beginning when the company was formed it was initially B2C. And in 1998, I
think it was, we launched a casino or develop a casino and launched it and it was a success.
We got a lot of players and a lot of publicity because we are the first one with online casi-
nos. So what happened was that some wealthy people in the US came to us and asked – we
want to do the same. And we did not have a thought that we would act as B2B supplier.
We were only thinking as a B2C supplier. So when they came with a big chunk of money,
we could not say no. And then it came a second and a third one and a fourth one and we
saw, that over time this was much more value generating than our B2C leg. So then over
time we saw that B2B is good. And in 2005 we sold off our B2C brands. Because the
problem with having both B2B and B2C is, when you have B2C, you are actually compet-
ing with the same players outside as our B2B customers so we were actually competing
with our B2B customers. It is kind of a difficult situation if you want to increase prices and
then we spend the money on competing with our customers. So it was difficult so survive
in that environment. Since we were competing with our customers we had to choose – ei-
ther we go B2B or we go B2C.
Can you describe a bit the structure at Boss Media? Which companies are in Boss Media?
Because for us it is quite hard to understand how all the companies are coming together?
As the parent company it is the Boss Media AB that has it’s headquarter here. I think
we have in total nine sub features. One in Canada, one in the UK, one in Curacao and four
in Malta and two other Swedish companies. So it is a rather complex structure. In order to
do business in other countries you need to have a local presence. We have that for example
in Canada. We need to have people employed in Canada. We could employ them trough a
Swedish company, but from a tax perspective we have a philosophy when we do long-term
business, we launch a local company. But the main business or core stays in the Swedish
companies.
What kind of competitors do you have?
We have some. The industry is kind of niched. Boss Media is doing poker, bingo, casi-
nos, backup systems, payments, more or less everything except sports betting. We have
competitors in Playtech and Microgaming who are doing all products as well. But then we
have a lot of competitors that are niched against poker. An example is PokerStars. Virtue
Fusion is a big bingo supplier. Bettson/Net Entertainment are doing casino games. We
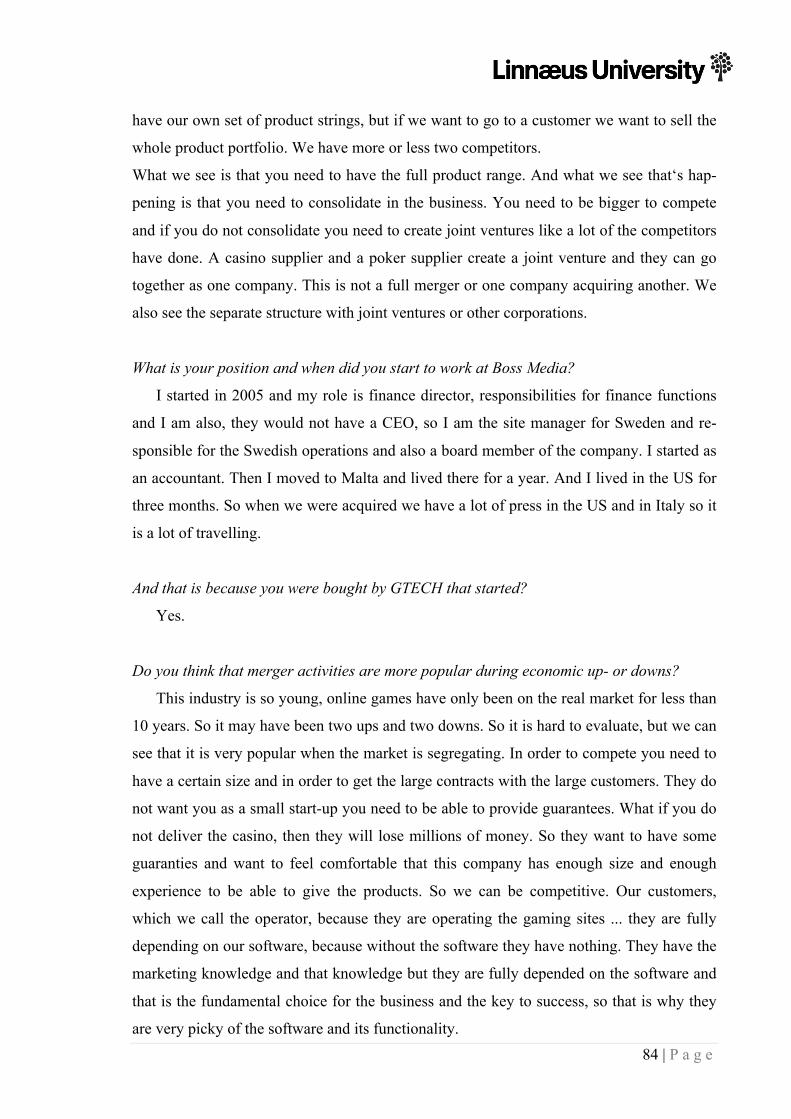
84 | P a g e
have our own set of product strings, but if we want to go to a customer we want to sell the
whole product portfolio. We have more or less two competitors.
What we see is that you need to have the full product range. And what we see that‘s hap-
pening is that you need to consolidate in the business. You need to be bigger to compete
and if you do not consolidate you need to create joint ventures like a lot of the competitors
have done. A casino supplier and a poker supplier create a joint venture and they can go
together as one company. This is not a full merger or one company acquiring another. We
also see the separate structure with joint ventures or other corporations.
What is your position and when did you start to work at Boss Media?
I started in 2005 and my role is finance director, responsibilities for finance functions
and I am also, they would not have a CEO, so I am the site manager for Sweden and re-
sponsible for the Swedish operations and also a board member of the company. I started as
an accountant. Then I moved to Malta and lived there for a year. And I lived in the US for
three months. So when we were acquired we have a lot of press in the US and in Italy so it
is a lot of travelling.
And that is because you were bought by GTECH that started?
Yes.
Do you think that merger activities are more popular during economic up- or downs?
This industry is so young, online games have only been on the real market for less than
10 years. So it may have been two ups and two downs. So it is hard to evaluate, but we can
see that it is very popular when the market is segregating. In order to compete you need to
have a certain size and in order to get the large contracts with the large customers. They do
not want you as a small start-up you need to be able to provide guarantees. What if you do
not deliver the casino, then they will lose millions of money. So they want to have some
guaranties and want to feel comfortable that this company has enough size and enough
experience to be able to give the products. So we can be competitive. Our customers,
which we call the operator, because they are operating the gaming sites ... they are fully
depending on our software, because without the software they have nothing. They have the
marketing knowledge and that knowledge but they are fully depended on the software and
that is the fundamental choice for the business and the key to success, so that is why they
are very picky of the software and its functionality.

85 | P a g e
Have you created value or growth in Boss Media trough acquisitions?
Organic growth is the primary key. But moving into new areas more quickly we are
constantly looking into potential acquisitions or other corporations with other companies.
But organic growth is what we can control.
In order to get successful, is one way to acquire?
Yes, but that is the second or the third option. You never know the price or if the com-
petitors go for the same companies. We cannot put our hands in the future, we are trying to
manage by what we can control. There maybe will be good opportunities down the road
and then we will take it, but that is just our strategy.
Do you think that it was at a certain level when Boss Media could not grow by itself that
the next option was to acquire or get acquired? That it reached a certain level and how
far it could go and then it needed to take a different strategy or a different direction?
Yes, but I think Boss Media could have grown two, three or four times its size when it
was acquired so that is not the limitation. When we were acquired by GTECH for example,
GTECH had a lot of customers in different country’s so that opened up a lot of new oppor-
tunities for us, because we can take the relationships that are existing and we can go to
them and say – you are already buying this of GTECH, can you buy this, because Boss
Media is part of the GTECH family, so now you can buy this product as well. It makes it
easier and it creates a wider selection of existing customers, because it is always easier to
sell something to someone that you already know than to go to a nonexistent customer.
When you can go to an existing customer to say – hey, why don’t you want to do bingo
online?
How did Boss Media find the companies that they wanted to acquire? How did GTECH
find Boss Media? Is Boss Media well known?
The industry is very large. If we look at the companies, we discussed and the compa-
ny’s sizes and who is charging B2B suppliers, you can probably count them on two hands.
So it is not a huge market and then you probably have 100 of smaller companies that are
doing some casino games and that are doing some sports betting games, but they are very
niched. But if you look at the larger companies that have real structure that is very few. So
everyone knows everyone in this business. There is a lot of inbreeding. The companies that

86 | P a g e
we have acquired have been started by one person and it is only one person that has sold it.
So it is very emotional and personal for that person they have been living with this compa-
ny for ten or fifteen years so it has become a part of them. So what has happened usually
is, that they appoint an advisor and the advisor is calling numbers of companies that can be
interested in buying this company and provides the prospect at high level, that this is the
company, the financial results and this is the customer and the product offering – are you
interested? We probably have companies that call us three, four times a week saying that
we have companies for sale, you need to be very selective and usually we do not spend too
much time on them.
How many companies did Boss Media acquire round about?
Not that many. Maybe three, four.
It was one more specific we wanted to look at.
Yes, it was one more in recent time and I have only been heavily involved in that one.
The other one is more in the mid of 2000, 2002, 2003 the acquisition in 2008 is the large
one.
Was someone calling you up or were you looking for one?
We were looking into this business and we knew this company from before and we
were discussing corporations in various forms. So we already had the contact between the
companies. So when he wanted to sell, he knew that he liked our products, so he told the
advisors that – I know that these companies might be interested and then probably the ad-
visor added a few more companies to the list and searched through the market.
You went abroad with this company?
Yes.
Why? Could you see that this was adding value to Boss Media?
Yes, because it was exactly what we were looking for, it was extending our products in
a way that we were looking for.
Was it a competitor to Boss Media?
It was not a really a competitor, because they really did not have the same direction of
the business, but they could be a small competitor in very small areas. Together we can
bundle their product together with ours and we can provide everything.

87 | P a g e
What were the advantages for Boss Media to do an acquisition instead of for example a
Joint venture?
That we can control everything. Joint venture is more common when you have two
companies that do not want to be acquired or they do not have the money. Usually they do
not have the money. Because if you talk about two rather large companies we talk about
100 of million Euros. So they need to get loans or maybe they do not get any loans. Then
they usually create these joint ventures, they agree on a numbers of how they should run
this joint venture and sort the limitation and they can control everything but it is a way of
new business that you would not meet otherwise.
Was it a friendly or a hostile acquisition?
A very friendly one. They wanted to sell and we wanted to buy, everything is about
money then.
Did competitors act similarly? Or did you experience that competitors during that time
tried to broaden their portfolios? Or that they were trying to acquire companies? And was
it so, that the ones with poker tried to acquire poker or did they try to go into other fields?
I think it is both, what we acquired was a casino supplier in games and we already had
games. In order to increase our product offering we were actually acquiring something that
we already had. But with this addition we would add a much more competitive product. So
instead of hiring for two years, we could buy it and get it the next day and we get the
skilled people and a new customer base. That is something that you need in order to con-
sider, what customers do they have. If you want to buy someone, do they have some cus-
tomers that we see value in, if they have some very important customers, if we hire people
and we start do develop the games our selves then we are not going to acquire a customer
base. So that is also value in doing an acquisition. That we are getting new customers, that
we can try to sell new things to.
So you get a bigger market share by acquiring other companies?
Yes, but what is more important, is that it opens up a lot more potential for selling
more products and services.
Were these expectations met to get a wider customer base to expand in a new market?
88 | P a g e
Yes it was met initially, but over time. This takes time, one of them has a competitor in
poker supplying. They might be committed to stay in the contract over three years time so
we are not in a position to sell our poker products for three years. But when the contract
expires then we will be there and try to persuade them to move over to us as a poker sup-
plier. So it is also legal limitations. So we cannot do everything at once but overtime. It
will create a lot of more options for us to actually have a very bold price picture and a good
product so that we can get the new business.
How transparent would you say are the prices in the merging or acquisitions process in
the gaming industry? Do companies know for how much companies are sold off? Or is the
price range differing a lot, because not a lot of people know about it?
I mean it is no public information actually. You can see how much GTECH paid for us,
because that is public information because we were on the stock exchange so everything is
public. But for these companies you do not buy them for the current pocket you buy them
for future pockets. So what you look at is what do they have. What products, customers do
they have or do they have any retained earnings and what is the financial position today.
And then with that information you look forward and say "what can we do with this com-
pany?". What do we think is a reasonable return if we sent an X amount of money? So if
you look at buyers, they usually have some ratios, price-earnings ratio or price-equity rati-
os. But if you buy a rather small company it is not really valid. It is probably valid of
someone in the stock exchange, for a large established company, but it is not for a small
one. But it is not valid if you buy one of these smaller companies. You are not going to
continue to run them like they have been run in the past. Because you are going to make
some major changes, because you are going to integrate them in our product and maybe
squish them a bit.
How do you estimate their growth then? Do you look at growth rates? Do you compare
them to the market?
It is kind of difficult to look into the future to generate future cash flows, but you need
to deal with it. Yes at first you do some assumptions. We expect five percent annual
growth and we expect to add the numbers of customers, but you always do a sensitivity
analysis. What if our revenues are 20 percent up or 20 percent down or 15 percent up or
15 percent down, so that you can see what are the risks so usually if are 20 percent down
you want have margin. If it is ten or 15 percent, it should not be negative, it should not be

89 | P a g e
red numbers… but 15 percent is good and you should be able to have so that as usually
what you do, because you need to look at the future, the past and the financial performance
can be of some interest, but you need to spend a lot of time on the analysis and the poten-
tial of this company in the new group.
Can you see that there are trends in takeovers? You said before that many companies are
doing M&As. Do you believe that M&A activity is going up and that acquisition will con-
tinue to exist in the online gaming industry?
Yes, that is going to continue. But I do not think it is going to be at the same pace, be-
cause it is not so many new start-ups in the business. Because it is not so easy to get in it is
easier when it is a new market. Then you can have a niche and have two new games that
could get in, but today in the market it is much more difficult.
Do you think that the gaming market will change a lot so that M&A activity will go up
again? Or do you think that it will continue to exist more or less like it is right now?
I think that it will become fewer and larger. We are going to see some consolidation.
We have seen now one of the largest ones, PartyGaming and Bwin, two multibillion com-
panies that merged. Boss Media made a strategic alliance with CryptoLogic.
We have read about herding, that if one company starts a trend, the others follow. Can you
see that this is a pattern in this industry, since this industry is quite new?
I mean definitely, if you are doing poker only, you can see that your competitors are
delivering poker, casino, and bingo. Then you are going to have a bad competitive position
so either you need to do something or you are taking a big chance of risk in the future,
when you are just going for one product So if you see that competitors are preparing to
approach for a bigger market you are aware of, you probably need to act.
When herding occurs it can be hard to see the mistakes. Can you some mistakes that were
made?
Yes, it is the right direction, but the difficulty is that if you see that competitors are do-
ing mergers in the market or acquisitions in the market it is easy to say "oh we need to do
something. We would need to do something tomorrow." So that is the first thing that you
can see on the market. So you need to do sound decision and you need to evaluate it over
time. Competitors want you to take the first decision because you are going to sit with the

90 | P a g e
pain and you are going to continue to pay money for it. It is difficult. You are afraid of
losing you competitive position, so you go and buy someone. It might not be the best one,
but it was an easy thing to do.
Is that something that is decided on a managerial level or have you been pushed from the
shareholders, or is it the CEOs decision?
Historically it was the board of directors that were the ones that was taking this deci-
sions, but the managers and the CEOs are preparing it and present it to the board of direc-
tors. But now that we are in the Lottomatica Group, it is decided higher up in the GTECH
family.
Was Boss Media one of the first companies in this industry as a software developer to offer
such a vide portfolio? Did a lot of other see that this was a success and therefore fol-
lowed? Or were there already a lot of these kinds of companies in the market?
Yes, we were one of the first ones. We did not have all the products in the beginning.
We started with casino and a few years later we started with bingo and then a few years
later we started with poker. So we have seen the pattern that we do not want to be fully
depended on the casino, because we saw that our customers want bingo so we started with
bingo and then they wanted poker and then we started with poker. We could have acquired
a poker developer or created a joint venture, but we felt that this was a strategic product,
strategic investment, that we need to have control over. So therefore we made the decision.
So that was your reason?
Yes, we felt that we must have poker and if we cannot find anything on the market,
then we have to do it ourselves. And when we do it ourselves then we know from day one
that when we started that it takes one year and a half to actually develop the products. So
if we take a decision in January, we know that the summer next year we are going to be
able to offer the product. If we had acquired a company in January we probably had deliv-
ered to our customers in March or April. So it is a much longer lead time in doing it our-
selves.
And that was just locally here in Sweden and not globally? Or did you see that there is a
customer base all over the world?

91 | P a g e
I mean we have 96 percent turnovers outside Sweden, so we have four percent turno-
vers here in Sweden. So we are very little depended on Sweden from a revenue perspec-
tive, but we have the product development in Sweden. But from a customer perspective
most of them are abroad. The only customer we have in Sweden is Svenska Spel.
Was Boss Media affected by the dot-com bubble? Or was the online gaming industry not so
much affected from that?
Our shareholders were the ones that were most affected. They lost a lot of money. No,
we were not directly affected. The main issue for us at that time was to find people, be-
cause it was an abuse of overpaid salaries. You went to one company and then you went to
another company after three months and then you could double the salary and then on to
the next one again. Especially in Stockholm. So it was a bit difficult to retain people. After
the burst it was very easy to find people. Then people got laid off and they did not have a
job to go to.
So did this show how overpriced everything was? And did it not show the real value and
that is why the salaries sky-rocked and then fell back to normal?
Yes, the companies did not do any profits. They lost money, but their share prices went
up because of the future expectations like we discussed. They looked for the future and
they said, "It is a so bright future." So if you would have made a sensitivity analysis, you
could have seen the risks as well. That was probably the main driver that could allow them
to get these salaries because the future was so good. We can pay money now because the
future is so good. But if you delete the future and make it more realistic then they would
have seen that they could not pay, they did not have the ability to pay.
Was the gaming industry affected by the last financial crises?
No, not really. It just draws up this acquisition process, because the strong one like
GTECH acquired us. Our share price went down with 50 percent, so we were kind of a
cheap acquisition.
How did shareholders react to that, to the acquisition?
They had an option to say yes or no. They could have said that the price that GTECH
was offering was too bad. But GTECH added a premium on almost 100 percent. So the
stock price was SEK 13,00 and they offered SEK 25,00. So if shareholders had sold it on

92 | P a g e
the market, they would have received 13,00 SEK but GTECH offered 25,00 SEK. So most
of them said yes. If you look back, our share was worth between SEK 30,00 and SEK
40,00 and now you would get SEK 25,00. So if you bought them in that period you still
lost money. If the option was SEK 13,00, SEK 25,00 is much better.
GTECH acquired Boss Media in the financial crises?
Yes.
We have talked about that this can be a kind of a fad and that it can be a power display,
showing that you have money in crises.
Yes, but I think they borrowed 100 percent. Still they had enough power to be able to
borrow that amount of money. If they were not in a good financial position, the bank
would not have granted that. But other companies do not know about these bank loans.
So that is true they show the market – yes we have power and we can act even in a down
turn. They also acquired Finsoft, one of the competitors of Boss Media.
Could we go back to the structure again? You talked about four different companies, which
are specialised and now are all under Boss Media AB's roof. Were they acquired over a
short time or over a long time?
Three of them were acquired before my time and that is really not something that I can
comment on. One of them was acquired in 2008. So yes it was over time. So what I mean
is that that company is still trading in its old name but it is also sold under our name so we
are keeping the old name of the company because we felt that it is a value in the brand and
it had a quite bold customer base. But over time we are trying to phase it out and into the
Boss Media brand or the acquisition to the GTECH brand. We do not want to do a short
time period of companies disappearing on the market, because then it might be a new com-
pany or this might look strange. So we want to phase out and then maybe say that company
X is a Boss Media company so then you can get a reference of that company it is a Boss
Media company and then over time you can make Boss Media bigger and company X
smaller. In five years you can probably delete company X. So that is how you keep the
value. When you spend money on an acquisition some of this money is attributed to the
brand itself and the value it has on the market.
What are the significant changes in Boss Media since this acquisition?

93 | P a g e
Nothing because the main thing was an UK company. So instead of hiring ten people,
we have an UK company that is doing this. So we need to integrate their products into us.
We were quite keen on investigating on how the parties could work and how the compa-
nies could work so it fits into our organization. We did not have a lot of impact. We want-
ed to have a smooth integration. So we were almost clear that this company fits well with
us and should not have a large impact on us.
Were there things in the acquisition that you expected to have an impact and in the end
turned out to be very easy?
What we were afraid of was that any of the customers did not like that company X was
now owned by Boss Media. Sometimes you have in the contracts that you have the right to
cancel the contract, if there is a change in the ownership. They expected them to change
some customers, because of changed ownership, but it did not really happen. We spoke
actually to the two largest customers and discussed "We are planning to acquire this com-
pany X and it is going to impact your relationship to this company." And they said "If you
do not change the prices, it will not have any impact.".
Were both acquisitions in 2008?
Yes.
We were not so sure what industry Boss Media AB is in. Whether Boss Media AB fits in the
software industry or IT consulting and services industry. What do you suggest according to
these figures?

94 | P a g e
Figure 28: Announced Mergers & Acquisitions Worldwide, 1985-2010 (IMAA, 2011)
Figure 29: Announced Mergers & Acquisitions IT consulting and services, 1988-2010
(IMAA, 2011)
Usually we are in the IT industry.
Because we can see that M&A activities are still quite high in 2008.
Yes it goes up in 2007.
Are we allowed to use the company name that you acquired or should we say company X?
0
1.000
2.000
3.000
4.000
5.000
6.000
7.000
0
5.000
10.000
15.000
20.000
25.000
30.000
35.000
40.000
45.000
50.000
1985
1986
1987
1988
1989
1990
1991
1992
1993
1994
1995
1996
1997
1998
1999
2000
2001
2002
2003
2004
2005
2006
2007
2008
2009
2010
number of transactions
Nasdaq Composite Indice
value of transactions (in 100 million US Dollar)
0
200
400
600
800
1.000
1.200
1.400
0
5.000
10.000
15.000
20.000
25.000
30.000
1988
1989
1990
1991
1992
1993
1994
1995
1996
1997
1998
1999
2000
2001
2002
2003
2004
2005
2006
2007
2008
2009
2010
number of transactions
Nasdaq Composite Indice
value of transactions (in 100 million US Dollar)

95 | P a g e
I think it is public information already. The company’s name is Dynamite Idea, it was
acquired under our time on the stock market.
So if we find information about it then it is ok to use the name otherwise we use company?
Just search for Boss Media and then you will find something
What was the intention to go on to the stock market and to leave it? Was Boss Media
forced to leave because of GTECH?
Yes. You need to have certain distribution of shares you cannot have one owner with a
certain percentage. If there is no trading, there is no reason. The GTECH family is already
listed on the stock exchange market in Milan because GTECH is owned by Lottomatica,
which is an Italian company that is already listed on the Italian stock exchange.
We believe that you have answered all our questions, but do you have something to add
that you believe is missing?
In GTECHs case they felt that they needed to acquire. They felt that they did not have
so many online products. GTECHs business is the hardware and the physical machines that
you can see on ferries and Las Vegas. They are doing more of those kinds of games. And
they felt that the Internet might not be a trend, it might be permanent. They felt that they
might need products for the online space. That was when the recession came. They felt that
now the prices dropped on companies, it might be a good time to invest in the market.
When our stock price dropped and they added a premium from SEK 13,00 to SEK 25,00,
they were paying the same price as it was a year back. We did the same profits, the price is
just about the expectation that are in the corporation and in the future expectations that the
market is expecting from us. We did not go down so much. GTECH saw that if we in-
creased the expectations, they could pay more.
So the demand for the software actually increased instead of dropping in this crisis?
I mean we did not do better than the other years and we did not do worse. We were
more or less inline. There were bad current performances. GTECH was seeing risks in the
market and they were seeing that maybe we were not able to deliver or have the integrity.
They did what you normally do, a discounted cash flow analysis. To see the present value
and whether it was lower than market value. We would become the main supplier in 32
states in the US and if gaming deregulates and would be allowed in the US, GTECH was

96 | P a g e
hoping to get 32 contracts in the US. Those will be paid off in a year since they paid 1.7
billion SEK. That is a lot of money, especially if you borrowed everything.
Then they wanted you really bad.
Yes, if you calculate an interest of 5 percent, GTECH's debt is about SEK 80 million a
year.
And doing that in the financial crises in the US.
They made some assumptions that the US will open up gaming restrictions and we
have a lot of potential. What happens if the US will not open up is that GTECH probably
overpaid, however, they have businesses outside the US with Lottomattica. That was one
of the assumptions that they made. The US government needed money at that time and it
needed to deregulate, so that it can collect money.
Where is the biggest market on the online gaming in the world?
Europe is the number one market and America is the second most important market. Asia
is far behind, but they have a lot of gaming machines so only the online space is behind.
So that would be a potential market?
Yes, it is growing fast and Eastern Europe is growing fast. But one limitation is credit
cards. The problem is that they use cash and you cannot put cash into the computer.
Through the Internet more and more people will be connected. They will have the ability to
pay someday.
Are you doing mobile games to?
Yes, it is more of that now. The problem with mobile phones is that there is no single
platform. If you do a game, you need to do ten versions of the game. One should fit with
Iphone and one for Windows mobiles and one for Android and Blackberry. But the indus-
try is discussing if they should create some common interface, even if you have the same
operating system you still can develop the same game.
So you need to work closely together with the mobile phone industry?
Yes, they have specifications on how things work. There are different icons in win-
dows mobile. In three different versions it can be three different requirements on the dif-
ferent games. So one thing, that you usually say that you support Android or Iphone or
Windows phones are too small, so we do not care about them now.

97 | P a g e
I think that we have the answer on all our questions.
If you have more questions, you can always e-mail me.
Can we use you name or do you want to be anonymous?
You can use my name.
Thank you for taking the time for us and thank you for all the help!

98 | P a g e
C. EMPIRICAL INVESTIGATION – STATISTICAL ASCERTAINMENT
C.I. ANNUAL REPORT BOSS MEDIA AB 2006 (EXCERPT)
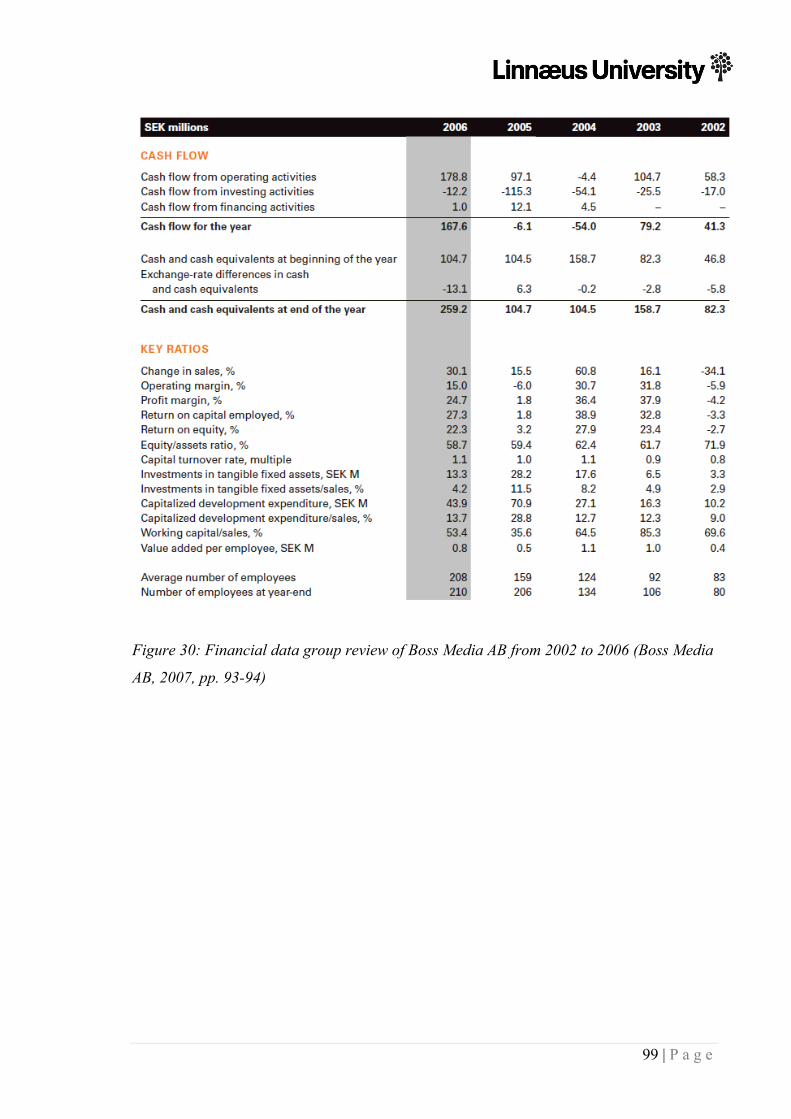
99 | P a g e
Figure 30: Financial data group review of Boss Media AB from 2002 to 2006 (Boss Media
AB, 2007, pp. 93-94)

100 | P a g e
C.II. ANNUAL REPORT BOSS MEDIA AB 2007 (EXCERPT)

101 | P a g e
Figure 31: Financial data group review of Boss Media AB from 2003 to 2007 (Boss Media
AB, 2008, pp. 68-69)
C.III. ANNUAL REPORT BOSS MEDIA AB, 2007, INCREASE IN SHORT-TERM DEBT
Figure 32: Note 21, other receivables and liabilities (Boss Media AB, 2008, p. 59)

102 | P a g e
C.IV. RISK-FREE INTEREST RATE 2007 IN ACCORDANCE TO SWEDISH GOVERNMENT BONDS
Sw
edis
h Gov
ernm
ent
Bond
sSIM
PLE
RESULT
: 01
/01/
2007
- 1
2/31
/200
7S
we
dis
h G
ov
ern
me
nt
Bo
nd
sSE
GVB
2Y
SE G
VB 5
YSE
GVB
7Y
SE G
VB 1
0Y
Pe
rio
dAv
erag
eM
inM
axU
ltim
oAv
erag
eM
inM
axU
ltim
oAv
erag
eM
inM
axU
ltim
oAv
erag
eM
inM
axU
ltim
o20
07 J
anua
ry3,
7823
3,69
3,9
3,87
3,90
613,
784,
054,
025
3,90
483,
774,
054,
025
3,90
233,
764,
054,
035
2007
Feb
ruar
y3,
7265
3,64
3,86
3,64
3,90
953,
795
4,01
53,
795
3,91
683,
84,
015
3,8
3,92
653,
794,
025
3,79
2007
Mar
ch3,
683
3,60
53,
783,
783,
8125
3,74
3,95
3,95
3,81
253,
743,
953,
953,
7939
3,72
53,
933,
9320
07 A
pril
3,88
113,
773,
983,
964,
0726
3,93
54,
165
4,14
4,06
743,
935
4,15
54,
134,
0434
3,91
54,
115
4,09
2007
May
3,99
53,
935
4,05
54,
025
4,20
14,
094,
314,
314,
1907
4,08
4,3
4,3
4,15
294,
035
4,27
4,27
2007
Jun
e4,
1011
4,02
54,
214,
214,
4345
4,34
54,
545
4,49
54,
4389
4,32
54,
555
4,49
4,43
954,
295
4,55
4,48
2007
Jul
y4,
3736
4,19
54,
455
4,32
4,46
844,
315
4,57
54,
365
4,46
344,
295
4,58
4,35
4,44
954,
254,
585
4,31
2007
Aug
ust
4,17
413,
955
4,34
54,
134,
2435
4,06
4,4
4,21
4,24
594,
085
4,39
54,
215
4,24
84,
154,
355
4,21
520
07 S
epte
mbe
r4,
0768
3,99
4,13
4,1
4,17
454,
025
4,28
4,25
4,19
24,
044,
314,
275
4,21
64,
055
4,35
4,31
520
07 O
ctob
er4,
1757
4,09
4,32
4,19
4,28
094,
205
4,44
4,25
54,
2976
4,21
54,
454,
265
4,31
434,
225
4,44
54,
265
2007
Nov
embe
r4,
0416
3,91
54,
175
3,97
54,
1275
4,01
24,
236
4,06
34,
1617
4,06
44,
245
4,12
14,
2154
4,14
74,
264,
193
2007
Dec
embe
r4,
1204
3,93
54,
242
4,13
4,18
963,
995
4,31
64,
214,
2345
4,07
4,35
24,
254,
3082
4,14
54,
414
4,34
54,16749167
Fo
otn
ote
SE
GV
B 2
Y (
01
/0
7/
19
87
- )
Sw
edis
h Gov
ernm
ent
Bond
, m
atur
ity
2 ye
ars
Sou
rce:
Tho
mso
n Re
uter
s
SE
GV
B 5
Y (
01
/0
2/
19
85
- )
Sw
edis
h Gov
ernm
ent
Bond
, m
atur
ity
5 ye
ars
Sou
rce:
Tho
mso
n Re
uter
s
SE
GV
B 7
Y (
01
/0
2/
19
87
- )
Sw
edis
h Gov
ernm
ent
Bond
, m
atur
ity
7 ye
ars
Sou
rce:
Tho
mso
n Re
uter
s
SE
GV
B 1
0Y
(0
1/
02
/1
98
7 -
)
Sw
edis
h Gov
ernm
ent
Bond
, m
atur
ity
10 y
ears
Sou
rce:
Tho
mso
n Re
uter
s
Figu
re 3
3: R
isk-
free
inte
rest
rate
200
7 in
acc
orda
nce
to S
wed
ish
gove
rnm
ent b
onds
(Sve
rige
s Rik
sban
k, 2
011)

103 | P a g e
C.V. BETA
Company -‐ softwareLevered Beta
Debt/ Equity
Marginal Tax Rate
Unlevered Beta
365 MEDIA GROUP* 0,49 3,18% 37,00% 0,47951252888 HOLDINGS* -‐-‐ 0,00% 23,60% -‐-‐ASKNET AG* -‐-‐ 0,00% -‐-‐ -‐-‐BET-‐AT-‐HOME.COM* 0,03 0,00% 40,60% 0,03193033BETTING PROMOTIO* -‐-‐ 0,39% 5,60% -‐-‐BETEX GROUP PLC* -‐-‐ 11,43% 26,50% -‐-‐BWIN INTERACTIVE* 1,76 0,00% -‐-‐ -‐-‐FLUXX AG* 1,09 5,22% -‐-‐ -‐-‐GAMING VC HLDGS* -‐-‐ 0,00% 27,30% -‐-‐IG GROUP HOLDING* -‐-‐ 0,01% 24,10% -‐-‐MAMUT ASA* 0,74 0,00% 0,00% 0,74020319NOCOM AB-‐B SHS* 1,93 5,87% 26,80% 1,85219655ORC SOFTWARE AB* 0,80 0,00% 50,00% 0,79535559USU SOFTWARE AG* 0,04 0,00% -‐-‐ -‐-‐PARTYGAMING PLC* -‐-‐ 0,13% 3,00% -‐-‐SPORTINGBET PLC* 2,14 0,00% 31,10% 2,140783741mage Software Inc 0,25 400,00% 0,00% 0,05Acorn Factor Inc. 0,6 1,44% 0,00% 0,59145907ActiveCore Technologies Inc 0,95 106,25% 0,00% 0,46060606ActivIdentity Corp 0,85 0,00% 0,00% 0,85Actuate Corporation 1,85 0,00% 16,91% 1,85Acxiom Corp. 1,1 23,65% 38,54% 0,96041326Adept Technology Inc 0,85 0,47% 12,52% 0,84655151Adobe Systems 1,2 0,00% 25,10% 1,2Advanced Oxygen Technologies 1,55 160,00% 0,00% 0,59615385Advant-‐E Corporation 0,45 0,00% 36,84% 0,45Advent Software 1,45 0,00% 2,79% 1,45Aftersoft Group Inc 0,65 2,20% 0,00% 0,63603819Aladdin Knowledge 0,95 0,00% 12,47% 0,95Alanco Technologies Inc. 0,8 7,05% 0,00% 0,74730539Alternate Energy Corp 0,8 13,64% 0,00% 0,704Altiris Inc. 1,1 0,42% 54,61% 1,09789908Amedia Networks Inc 1,8 4,55% 0,00% 1,72173913Amer. Software 'A' 0,7 0,00% 37,90% 0,7AMICAS Inc 1 0,00% 0,00% 1Analysts Int'l 0,85 10,62% 0,00% 0,7684261Analytical Surveys 1,25 0,00% 0,00% 1,25Ansoft Corp 1 0,00% 17,61% 1ANSYS Inc. 1,2 0,00% 30,44% 1,2ANTs software Inc 0,9 0,00% 0,00% 0,9Applix Inc 0,6 0,00% 5,98% 0,6Artificial Life Inc 0,35 1,13% 0,00% 0,34609665ASA INTL LTD 0,6 60,71% 0,00% 0,37333333Ascendant Solutions Inc 0,65 113,33% 25,13% 0,35163139Aspyra Inc 0,3 6,19% 0,00% 0,28252427Astea Intl Inc 0,75 0,00% 0,38% 0,75Auto Data Network Inc 0,6 8,94% 15,00% 0,55761146Auto Graphics Inc 0,1 0,00% 0,00% 0,1Autodesk Inc. 1,05 0,00% 19,20% 1,05Automatic Data Proc. 0,9 0,27% 38,47% 0,89848589Autonomy Corporation 1,15 13,68% 31,03% 1,05083564Avatech Solutions Inc 0,7 8,12% 0,00% 0,64741784Aware Inc Mass 1,2 0,00% 0,00% 1,2AXS-‐One Inc 1 0,00% 0,00% 1Blackbaud Inc 1 0,00% 28,61% 1Blackboard Inc. 0,95 0,00% 0,00% 0,95BMC Software 1,35 0,00% 10,94% 1,35Borland Software 1,35 0,00% 60,00% 1,35Bottomline Technologies Inc 0,95 0,00% 0,00% 0,95
Comparable Companies Unlevered Beta

104 | P a g e
BPO Management Services Inc 1,05 12,12% 0,00% 0,93648649BrightStar Information Tech. 0,35 23,81% 0,00% 0,28269231Brilliant Digital Entertain 1,05 440,00% 0,00% 0,19444444Broadcaster Inc 0,65 2,38% 0,00% 0,63486612BroadVision Inc. 1,5 38,56% 0,00% 1,08255659BVR Systems 1998 Ltd 0,35 6,04% 33,15% 0,33640763CACI Int'l 1 21,09% 36,21% 0,88141822Callidus Software Inc 1 0,00% 0,00% 1CallWave Inc 1 0,00% 60,00% 1CAM Commerce Solutions Inc 0,6 0,00% 36,80% 0,6Cape Systems Group Inc 1,2 590,91% 0,00% 0,17368421Carreker Corp. 1,4 0,00% 17,20% 1,4Castelle 1,2 0,00% 40,55% 1,2CCI Group Inc 0,5 238,71% 0,00% 0,14761905CDSI Hldgs Inc 0,45 0,00% 0,00% 0,45Cellular Tech. Serv. 0,7 0,00% 0,00% 0,7Certicom Corp 1,25 0,00% 0,00% 1,25CGI Group Inc. 1 35,58% 32,51% 0,80635927Check Point Software 1,3 0,00% 17,15% 1,3CIBER Inc. 1,2 51,76% 36,00% 0,90142053Cimetrix Inc 0,8 7,29% 0,00% 0,74563107Citrix Sys. 1,4 0,63% 21,27% 1,39311776Claxson Interactive Group Inc 1,25 39,69% 15,68% 0,93656698ClearStory Systems Inc 0,65 200,00% 0,00% 0,21666667ClickSoftware Technologies 1,15 0,00% 0,00% 1,15Cogent Inc 1,1 0,00% 22,78% 1,1Cognizant Technology 1,15 0,00% 16,95% 1,15Cognos Inc. 1,3 0,00% 19,20% 1,3Com-‐Guard.com Inc. 0,85 500,00% 0,00% 0,14166667Computer Horizons 0,95 0,00% 0,00% 0,95Computer Modelling Grp. Inc. 0,35 0,00% 37,77% 0,35Computer Sciences 1,1 15,33% 30,40% 0,99396308Computer Task Group 0,85 24,24% 31,82% 0,72945351Compuware Corp. 1,4 0,00% 25,33% 1,4Contintl Info Sys Corp New 0,75 0,00% 0,00% 0,75Convera Corp 0,7 2,01% 0,00% 0,68617694Cordia Corp 0,9 3,92% 0,00% 0,86603774Corio Inc 0,8 0,50% 0,00% 0,79600887CorVu Corp 0,7 11,19% 0,00% 0,6295302Covansys Corp. 1,2 0,00% 23,28% 1,2Cover-‐All Tech Inc 0,5 18,42% 0,00% 0,42222222CSP Inc. 0,55 0,00% 40,17% 0,55CT Holdings Inc 0,7 50,00% 0,00% 0,46666667CTI Group Holdings Inc 0,45 0,00% 0,00% 0,45Daleen Technologies Inc 0,3 0,00% 0,00% 0,3Datastream Sys Inc 0,85 0,00% 34,38% 0,85Datawatch Corp 0,85 0,00% 0,00% 0,85Dendrite Int'l 0,8 0,64% 41,70% 0,79703402Descartes Sys Group Inc 1,3 0,00% 0,00% 1,3Digimarc Corp 1,1 0,00% 0,00% 1,1Digital Fusion Inc 0,85 23,38% 0,00% 0,68891129Dimensional Visions Inc 0,7 35,29% 0,00% 0,5173913Direct Insite Corp 0,65 44,19% 0,00% 0,45080645Diversinet Corp. 0,05 5,71% 0,00% 0,0472973DocuCorp Intl 0,75 5,22% 37,27% 0,72620591Document Sciences Corp 0,45 0,00% 60,00% 0,45Dynamics Research Corp. 0,6 28,35% 40,50% 0,51339957Dyntek Inc 0,8 28,21% 0,00% 0,624eGames Inc 0,9 0,00% 0,00% 0,9Electrncs For Imging 1,1 15,84% 0,00% 0,94959836eLoyalty Corp 0,65 0,00% 0,00% 0,65EmergenSys Corp 0,15 66,67% 0,00% 0,09Emtec Inc. 0,1 29,61% 51,23% 0,08738364enherent Corp 0,45 253,33% 0,00% 0,12735849Entrada Networks Inc 0,7 1050,00% 0,00% 0,06086957

105 | P a g e
eNucleus Inc 0,25 52,63% 0,00% 0,1637931EPIQ Sys Inc 0,6 52,75% 39,93% 0,45561366Eternal Technologies Group 0,45 1,49% 3,45% 0,44360742Euronet Worldwide Inc. 1 31,83% 34,11% 0,82665311Evolution Petroleum Corp 0,8 0,00% 0,00% 0,8Fair Isaac 0,95 15,53% 30,68% 0,85767921Findex.Com Inc 0,25 0,00% 0,00% 0,25Firstwave Technologies Inc 0,9 0,00% 0,00% 0,9FlexiInternational Sftwre Inc 0,85 36,00% 0,00% 0,625Fonix Corp Del 1,1 71,91% 0,00% 0,63986928Formula Systems (1985) Ltd 0,85 111,59% 52,09% 0,55387203Franklin Electr Publ 0,55 0,00% 4,37% 0,55Fundtech Ltd. 0,75 0,00% 21,19% 0,75GATEWAY INDS INC 0,2 0,00% 0,00% 0,2Gensym Corp 0,85 4,41% 0,00% 0,81408451Goldleaf Financial Solutions 0,7 80,54% 36,79% 0,46385115Gse Sys Inc 0,7 3,34% 0,00% 0,67734977Guideline Inc 0,5 20,38% 30,21% 0,43773052Halifax Corp. 0,8 100,00% 0,00% 0,4Henry (Jack) & Assoc. 1,2 0,00% 35,80% 1,2Hyperdynamics Corp 0,85 1,84% 0,00% 0,83467087Hyperion Solutions Corp 1,4 0,00% 36,13% 1,4iGate Corp. 0,9 0,00% 1,55% 0,9ImageWare Systems Inc 0,85 0,00% 0,00% 0,85Information Analysis Inc. 0,45 0,00% 0,68% 0,45Inforte Corp 0,95 0,00% 39,60% 0,95Infosys Techn. ADR 1,15 0,00% 11,11% 1,15Inksure Technologies Inc 0,45 11,61% 0,00% 0,40319343Innuity Inc. 0,6 66,36% 0,00% 0,36065574Insightful Corp 1 0,00% 1,74% 1Insignia Solutions Inc 0,95 8,33% 0,00% 0,87692308Integral Systems 0,75 0,00% 36,47% 0,75Intelligroup Inc 0,9 7,50% 0,00% 0,83717277Interactive Intelligence Inc 0,9 0,00% 11,17% 0,9Intuit Inc. 0,95 0,15% 38,23% 0,94914847Iona Tech PLC ADR 1,45 0,00% 60,00% 1,45Island Pacific Inc 1,15 28,09% 0,00% 0,89780702ITA Holdings Inc 1,25 560,00% 0,00% 0,18939394iVoice Inc 1 441,67% 0,00% 0,18461538Jacada Ltd. 1 0,00% 0,00% 1Kanbay Int'l Inc 0,85 0,00% 25,56% 0,85Lawson Software Inc 0,9 0,56% 42,32% 0,89708202Level 8 Sys Inc 0,95 564,29% 0,00% 0,14301075LifeStyle Innovations Inc. 0,2 733,33% 0,00% 0,024LivePerson Inc 0,55 0,00% 20,98% 0,55Logility Inc 1 0,00% 0,00% 1Magic Software Enterprises 0,7 5,98% 0,00% 0,66051282Magnitude Information 0,2 3,51% 0,00% 0,19322034MakeMusic Inc. 0,7 0,00% 0,00% 0,7Manatron Inc. 0,6 10,87% 0,00% 0,54117647ManTech Int'l 'A' 0,95 3,37% 39,20% 0,93094454MapInfo Corp. 1,15 5,06% 34,09% 1,11288422McAfee Inc. 1,6 0,00% 20,85% 1,6MedicSight Inc 0,5 0,00% 0,00% 0,5Mergence Corporation 0,6 0,00% 0,00% 0,6Merilus Inc 0,6 0,00% 0,00% 0,6Microlog Corp. 0,95 57,14% 0,00% 0,60454545Microsoft Corp. 1 0,00% 31,01% 1MicroStrategy Inc 2,15 0,00% 34,05% 2,15Migo Software Inc 1,2 0,00% 0,00% 1,2MIND C.T.I. Ltd 0,9 0,00% 2,30% 0,9Mobius Mgmt Sys 1,1 0,00% 29,13% 1,1Moldflow Corp. 0,9 0,00% 40,86% 0,9MSC.Software 1,25 16,37% 53,73% 1,16199285Multi Solutions Inc 0,7 16,67% 0,00% 0,6Navarre Corp 0,9 55,44% 0,00% 0,57899867Navtech Inc. 0,4 5,38% 0,00% 0,37956204NeoMedia Technologies 0,65 7,63% 0,00% 0,60390071NEON Systems Inc. 0,9 0,00% 0,00% 0,9Neoware Inc 1,2 0,00% 36,09% 1,2Nestor Inc. 0,85 31,14% 0,00% 0,64815303NetManage Inc 0,95 0,00% 0,00% 0,95Netsmart Technologies 0,95 2,64% 42,16% 0,9357041NetSol Technologies Inc 0,9 21,89% 0,00% 0,73838028Network Equip. Tech. 1 17,02% 0,00% 0,85453475NewMarket Technology Inc 0,6 12,05% 7,60% 0,53987438Notify Technology Corp. 0,65 0,00% 0,00% 0,65Novell Inc. 1,35 26,74% 26,63% 1,12859786OCG Technology Inc 0,4 0,00% 0,00% 0,4OCTuS Inc 0,45 10,00% 0,00% 0,40909091Omtool Ltd 0,95 0,00% 0,00% 0,95One Voice Technologies Inc 1,05 5,77% 0,00% 0,99272727OPTi Inc. 0,45 0,00% 0,00% 0,45Optio Software Inc 0,8 0,00% 5,97% 0,8Oracle Corp. 1,05 6,61% 29,67% 1,00336099Pace Health Mgmt Sys Inc 0,35 0,00% 0,00% 0,35Paychex Inc. 1,15 0,00% 31,10% 1,15Peerless Systems 1,05 0,00% 0,67% 1,05Pegasystems Inc 1,05 0,06% 0,00% 1,04941341Perot Systems Corp. 1,05 3,90% 38,34% 1,02536727Pervasive Software 0,7 0,00% 0,00% 0,7Phoenix Technologies 1,8 0,00% 0,00% 1,8Pinnacle Data Systems 0,85 62,84% 38,32% 0,61256175Pomeroy IT Solutions 0,9 15,69% 23,80% 0,80387394Progress Software 0,95 0,19% 27,51% 0,94868157Prologic Mgmt Sys Inc 0,5 200,00% 0,00% 0,16666667PubliCARD Inc 0,7 3950,00% 0,00% 0,01728395PurchaseSoft Inc 1,8 200,00% 0,00% 0,6Quality Systems 0,85 0,00% 38,51% 0,85Quest Software Inc 1,5 0,00% 42,30% 1,5Radcom Ltd 1,3 0,00% 0,00% 1,3Raining Data Corp 0,9 33,78% 0,00% 0,67276736Rainmaker Systems Inc 0,7 5,28% 0,00% 0,66490925Red Hat Inc. 1 12,99% 2,84% 0,88793546Robocom Systems Int'l Inc 0,85 0,00% 0,00% 0,85Sand Technology Inc 1,25 0,00% 0,00% 1,25SAP AG 1,35 0,01% 35,27% 1,34989344Sapiens Int'l Corp. 0,8 168,75% 0,00% 0,29767442SecureLogic Corp. 0,8 0,00% 0,00% 0,8Sento Corp 1,05 43,16% 0,00% 0,73345588Sequiam Corp. 1,15 35,48% 0,00% 0,84880952Sharp Holding Corp 0,8 325,00% 0,00% 0,18823529Shelron Group Inc 0,35 0,00% 0,00% 0,35Signalife Inc 1,95 0,00% 0,00% 1,95Simulations Plus Inc 0,55 0,00% 23,96% 0,55SiVault Systems Inc. 1,25 283,33% 0,00% 0,32608696Smith Micro Software 1,3 0,00% 2,15% 1,3SofTech Inc 0,5 1350,00% 0,00% 0,03448276Sona Mobile Holdings Corp 0,7 0,00% 0,00% 0,7Sonic Foundry Inc. 0,9 0,07% 0,00% 0,89940318SourcingLink.net Inc 1,15 0,00% 0,00% 1,15SPECTRUM SIGNAL PROCESS 0,9 0,00% 0,00% 0,9Spescom Software Inc 0,75 23,33% 0,00% 0,60810811SPSS Inc. 0,9 0,57% 40,78% 0,89699637SRA Int'l Inc. 0,8 0,00% 38,22% 0,8Strativation Inc 0,3 25,00% 0,00% 0,24Sure Trace Security Corp 1,25 37,50% 0,00% 0,90909091Sybase Inc. 1 20,36% 37,40% 0,88695304Sykes Enterprises 1 0,00% 19,57% 1Symantec Corp. 0,95 2,56% 42,58% 0,93623782Synopsys Inc. 1,1 0,00% 31,28% 1,1TALX Corp 0,9 12,57% 40,78% 0,83765666Technology Solutions 0,8 0,00% 0,00% 0,8TechTeam Global Inc. 0,65 9,61% 30,81% 0,6094677Tectonic Network Inc. 0,5 10,95% 0,00% 0,45067265Teknowledge Corp New 0,95 0,00% 0,00% 0,95TenFold Corporation 0,6 4,03% 0,00% 0,57677419TeraForce Technology Corp 0,7 615,38% 0,00% 0,09784946Tiger Telematics Inc 0,65 116,67% 0,00% 0,3Time America Inc 0,35 72,88% 0,00% 0,20245098Timeline Inc 0,5 0,00% 0,00% 0,5Touchstone Software Corp. 0,95 5,66% 0,00% 0,89910714Tribeworks Inc 0,75 0,86% 0,00% 0,74358974Trident Microsystems 1,45 0,00% 0,00% 1,45Trintech Group PLC 0,4 0,30% 0,00% 0,39881129Tripos Inc 1,1 217,14% 0,00% 0,34684685TSR INC 0,6 0,00% 38,93% 0,6Ultimate Software Group Inc 0,75 0,62% 0,00% 0,74538826Unify Corp 0,85 0,00% 0,00% 0,85United Systems Tech Inc 0,75 0,00% 0,00% 0,75Unitronix Corp 1,2 125,00% 0,00% 0,53333333Univercell Holdings Inc 0,75 0,00% 0,00% 0,75VA Software Corporation 1,95 0,00% 0,00% 1,95Vasco Data Security Intl Inc 0,85 0,73% 33,20% 0,8458959Velocity Express Corp 1,7 86,25% 0,00% 0,91275168
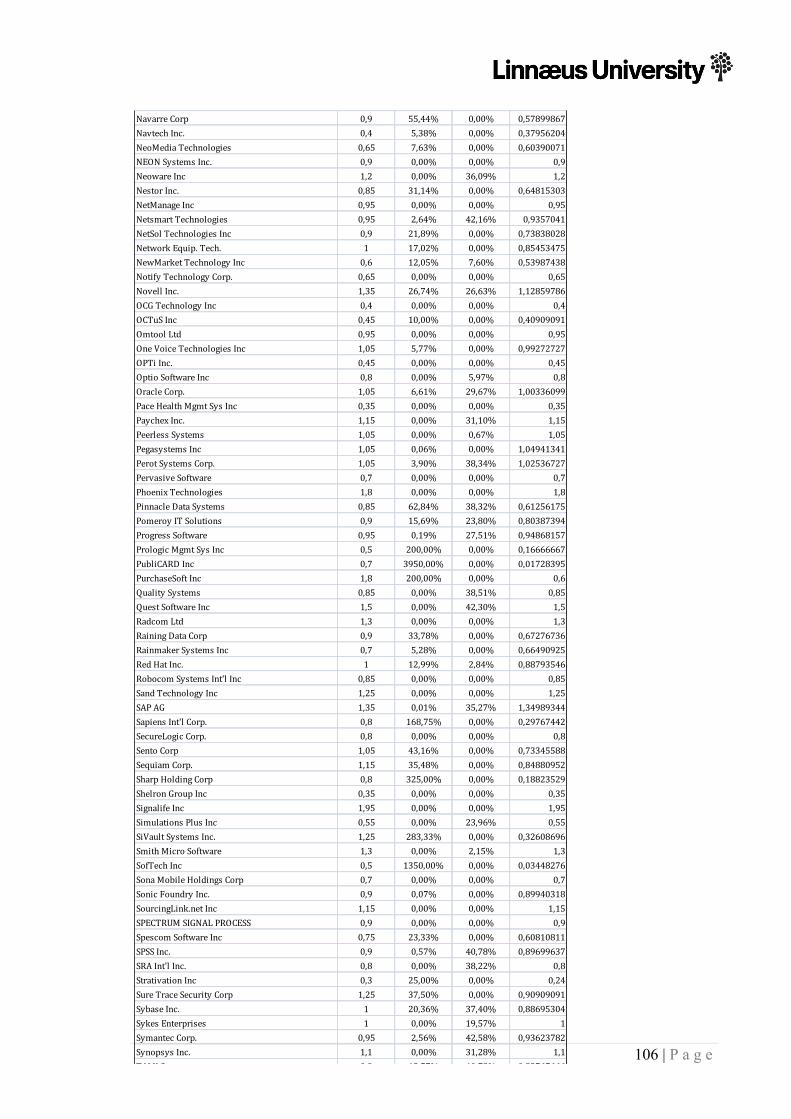
106 | P a g e
Navarre Corp 0,9 55,44% 0,00% 0,57899867Navtech Inc. 0,4 5,38% 0,00% 0,37956204NeoMedia Technologies 0,65 7,63% 0,00% 0,60390071NEON Systems Inc. 0,9 0,00% 0,00% 0,9Neoware Inc 1,2 0,00% 36,09% 1,2Nestor Inc. 0,85 31,14% 0,00% 0,64815303NetManage Inc 0,95 0,00% 0,00% 0,95Netsmart Technologies 0,95 2,64% 42,16% 0,9357041NetSol Technologies Inc 0,9 21,89% 0,00% 0,73838028Network Equip. Tech. 1 17,02% 0,00% 0,85453475NewMarket Technology Inc 0,6 12,05% 7,60% 0,53987438Notify Technology Corp. 0,65 0,00% 0,00% 0,65Novell Inc. 1,35 26,74% 26,63% 1,12859786OCG Technology Inc 0,4 0,00% 0,00% 0,4OCTuS Inc 0,45 10,00% 0,00% 0,40909091Omtool Ltd 0,95 0,00% 0,00% 0,95One Voice Technologies Inc 1,05 5,77% 0,00% 0,99272727OPTi Inc. 0,45 0,00% 0,00% 0,45Optio Software Inc 0,8 0,00% 5,97% 0,8Oracle Corp. 1,05 6,61% 29,67% 1,00336099Pace Health Mgmt Sys Inc 0,35 0,00% 0,00% 0,35Paychex Inc. 1,15 0,00% 31,10% 1,15Peerless Systems 1,05 0,00% 0,67% 1,05Pegasystems Inc 1,05 0,06% 0,00% 1,04941341Perot Systems Corp. 1,05 3,90% 38,34% 1,02536727Pervasive Software 0,7 0,00% 0,00% 0,7Phoenix Technologies 1,8 0,00% 0,00% 1,8Pinnacle Data Systems 0,85 62,84% 38,32% 0,61256175Pomeroy IT Solutions 0,9 15,69% 23,80% 0,80387394Progress Software 0,95 0,19% 27,51% 0,94868157Prologic Mgmt Sys Inc 0,5 200,00% 0,00% 0,16666667PubliCARD Inc 0,7 3950,00% 0,00% 0,01728395PurchaseSoft Inc 1,8 200,00% 0,00% 0,6Quality Systems 0,85 0,00% 38,51% 0,85Quest Software Inc 1,5 0,00% 42,30% 1,5Radcom Ltd 1,3 0,00% 0,00% 1,3Raining Data Corp 0,9 33,78% 0,00% 0,67276736Rainmaker Systems Inc 0,7 5,28% 0,00% 0,66490925Red Hat Inc. 1 12,99% 2,84% 0,88793546Robocom Systems Int'l Inc 0,85 0,00% 0,00% 0,85Sand Technology Inc 1,25 0,00% 0,00% 1,25SAP AG 1,35 0,01% 35,27% 1,34989344Sapiens Int'l Corp. 0,8 168,75% 0,00% 0,29767442SecureLogic Corp. 0,8 0,00% 0,00% 0,8Sento Corp 1,05 43,16% 0,00% 0,73345588Sequiam Corp. 1,15 35,48% 0,00% 0,84880952Sharp Holding Corp 0,8 325,00% 0,00% 0,18823529Shelron Group Inc 0,35 0,00% 0,00% 0,35Signalife Inc 1,95 0,00% 0,00% 1,95Simulations Plus Inc 0,55 0,00% 23,96% 0,55SiVault Systems Inc. 1,25 283,33% 0,00% 0,32608696Smith Micro Software 1,3 0,00% 2,15% 1,3SofTech Inc 0,5 1350,00% 0,00% 0,03448276Sona Mobile Holdings Corp 0,7 0,00% 0,00% 0,7Sonic Foundry Inc. 0,9 0,07% 0,00% 0,89940318SourcingLink.net Inc 1,15 0,00% 0,00% 1,15SPECTRUM SIGNAL PROCESS 0,9 0,00% 0,00% 0,9Spescom Software Inc 0,75 23,33% 0,00% 0,60810811SPSS Inc. 0,9 0,57% 40,78% 0,89699637SRA Int'l Inc. 0,8 0,00% 38,22% 0,8Strativation Inc 0,3 25,00% 0,00% 0,24Sure Trace Security Corp 1,25 37,50% 0,00% 0,90909091Sybase Inc. 1 20,36% 37,40% 0,88695304Sykes Enterprises 1 0,00% 19,57% 1Symantec Corp. 0,95 2,56% 42,58% 0,93623782Synopsys Inc. 1,1 0,00% 31,28% 1,1TALX Corp 0,9 12,57% 40,78% 0,83765666Technology Solutions 0,8 0,00% 0,00% 0,8TechTeam Global Inc. 0,65 9,61% 30,81% 0,6094677Tectonic Network Inc. 0,5 10,95% 0,00% 0,45067265Teknowledge Corp New 0,95 0,00% 0,00% 0,95TenFold Corporation 0,6 4,03% 0,00% 0,57677419TeraForce Technology Corp 0,7 615,38% 0,00% 0,09784946Tiger Telematics Inc 0,65 116,67% 0,00% 0,3Time America Inc 0,35 72,88% 0,00% 0,20245098Timeline Inc 0,5 0,00% 0,00% 0,5Touchstone Software Corp. 0,95 5,66% 0,00% 0,89910714Tribeworks Inc 0,75 0,86% 0,00% 0,74358974Trident Microsystems 1,45 0,00% 0,00% 1,45Trintech Group PLC 0,4 0,30% 0,00% 0,39881129Tripos Inc 1,1 217,14% 0,00% 0,34684685TSR INC 0,6 0,00% 38,93% 0,6Ultimate Software Group Inc 0,75 0,62% 0,00% 0,74538826Unify Corp 0,85 0,00% 0,00% 0,85United Systems Tech Inc 0,75 0,00% 0,00% 0,75Unitronix Corp 1,2 125,00% 0,00% 0,53333333Univercell Holdings Inc 0,75 0,00% 0,00% 0,75VA Software Corporation 1,95 0,00% 0,00% 1,95Vasco Data Security Intl Inc 0,85 0,73% 33,20% 0,8458959Velocity Express Corp 1,7 86,25% 0,00% 0,91275168Verint Systems 0,8 0,22% 8,53% 0,7983707Vertical Communications Inc 0,45 29,79% 0,00% 0,34672131View Systems Inc 1 2,17% 0,00% 0,9787234ViewCast.com Inc 0,7 75,74% 0,00% 0,39832636Visiphor Corp. 0,55 14,29% 0,00% 0,48125Vodavi Technology Inc 0,7 0,00% 37,88% 0,7Voice Mobility International I 0,25 57,96% 0,00% 0,15826613V-‐One Corp 0,8 300,00% 0,00% 0,2WidePoint Corporation 2,55 0,00% 0,00% 2,55Zanett Inc 0,35 33,43% 0,00% 0,26231102Z-‐Axis Corporation 0,95 33,33% 0,00% 0,7125Zeros & Ones Inc 0,8 8,87% 0,00% 0,73481481Zi Corp 1,2 0,32% 0,00% 1,19621849Median Europe 0,94 0,0% 0,80Mean Europe 1,07 1,6% 1,11Median US 0,85 0,6% 0,78Mean US 0,93 60,7% 0,77
Mean combined (20% Europe, 80% US) 0,87

107 | P a g e
Figure 34: Computation of Boss Media AB’s unlevered Beta (Damodaran A. , The Data
Page, 2011), (Damodaran A. , Betas by Sector, 2011)
Synopsys Inc. 1,1 0,00% 31,28% 1,1TALX Corp 0,9 12,57% 40,78% 0,83765666Technology Solutions 0,8 0,00% 0,00% 0,8TechTeam Global Inc. 0,65 9,61% 30,81% 0,6094677Tectonic Network Inc. 0,5 10,95% 0,00% 0,45067265Teknowledge Corp New 0,95 0,00% 0,00% 0,95TenFold Corporation 0,6 4,03% 0,00% 0,57677419TeraForce Technology Corp 0,7 615,38% 0,00% 0,09784946Tiger Telematics Inc 0,65 116,67% 0,00% 0,3Time America Inc 0,35 72,88% 0,00% 0,20245098Timeline Inc 0,5 0,00% 0,00% 0,5Touchstone Software Corp. 0,95 5,66% 0,00% 0,89910714Tribeworks Inc 0,75 0,86% 0,00% 0,74358974Trident Microsystems 1,45 0,00% 0,00% 1,45Trintech Group PLC 0,4 0,30% 0,00% 0,39881129Tripos Inc 1,1 217,14% 0,00% 0,34684685TSR INC 0,6 0,00% 38,93% 0,6Ultimate Software Group Inc 0,75 0,62% 0,00% 0,74538826Unify Corp 0,85 0,00% 0,00% 0,85United Systems Tech Inc 0,75 0,00% 0,00% 0,75Unitronix Corp 1,2 125,00% 0,00% 0,53333333Univercell Holdings Inc 0,75 0,00% 0,00% 0,75VA Software Corporation 1,95 0,00% 0,00% 1,95Vasco Data Security Intl Inc 0,85 0,73% 33,20% 0,8458959Velocity Express Corp 1,7 86,25% 0,00% 0,91275168Verint Systems 0,8 0,22% 8,53% 0,7983707Vertical Communications Inc 0,45 29,79% 0,00% 0,34672131View Systems Inc 1 2,17% 0,00% 0,9787234ViewCast.com Inc 0,7 75,74% 0,00% 0,39832636Visiphor Corp. 0,55 14,29% 0,00% 0,48125Vodavi Technology Inc 0,7 0,00% 37,88% 0,7Voice Mobility International I 0,25 57,96% 0,00% 0,15826613V-‐One Corp 0,8 300,00% 0,00% 0,2WidePoint Corporation 2,55 0,00% 0,00% 2,55Zanett Inc 0,35 33,43% 0,00% 0,26231102Z-‐Axis Corporation 0,95 33,33% 0,00% 0,7125Zeros & Ones Inc 0,8 8,87% 0,00% 0,73481481Zi Corp 1,2 0,32% 0,00% 1,19621849Median Europe 0,94 0,0% 0,80Mean Europe 1,07 1,6% 1,11Median US 0,85 0,6% 0,78Mean US 0,93 60,7% 0,77
Mean combined (30% Europe, 70% US) 0,87

108 | P a g e
D. GLOSSARY
(Acquisition) Premium – difference between the acquisition price and market price prior
to the acquisition.
Arbitrage – generating profits from price differences.
Baisse – period of declining stock prices, bear market.
Bear market – decreasing investment prices accompanied by general pessimism.
Black Thursday, 1929 – most value-destructive Stock market crash in US history on the
24th October 1929, which leads to a 12 year depression.
Bull market – increasing investments due to anticipated rises in stock prices. It describes
upward trends and usually occurs in recovering economies.
Cash Flow (CF) - the cash in- and outflows of a business over a fixed period of time. It
can be computed directly by adding up the cash flows from operating, financing and in-
vesting activities or indirectly derived from earnings.
Cost of capital - determined by the minimum return shareholders expect from taking a
specific investment risk. à WACC
Discount rate – rate at which cash flows are discounted to the present.
Discounted Cash Flow Method (DCF) – used to value an asset by its à present value,
which is estimated by discounting cash flows with an accurate discount rate. à discount
rate, WACC.
Dot-com bubble –climaxed in 2000, speculative bubble in IT-segment, with a lot of price
misevaluations.
Drexel Burnham – one of the largest Wall Street investment banks, which mainly operat-
ed in financing M&A business by the use of junk bonds. It faced bankruptcy in 1990s,
which lead to a sharp decline in the junk bond market and resulted in an economical down-
turn. à junk bond market
Earnings before interest, taxes, depreciation and amortization (EBITDA) –
measurement for a company’s business result before the interest, taxes, depreciation and
amortization are deducted. Earnings per share (EPS) – net profit or loss divided by the amount of share in a compa-
ny’s stock.
Economies of scale – cost advantages a business receives by expanding their current pro-
duction in goods and services (quantitative).
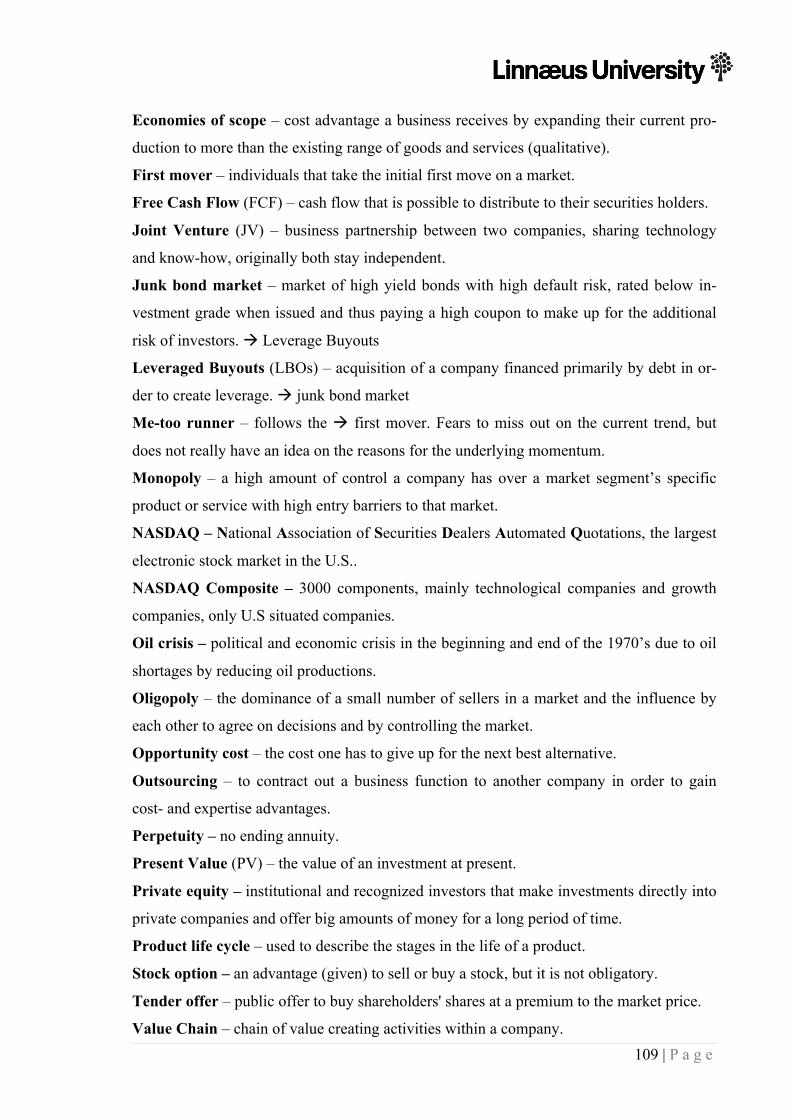
109 | P a g e
Economies of scope – cost advantage a business receives by expanding their current pro-
duction to more than the existing range of goods and services (qualitative).
First mover – individuals that take the initial first move on a market.
Free Cash Flow (FCF) – cash flow that is possible to distribute to their securities holders.
Joint Venture (JV) – business partnership between two companies, sharing technology
and know-how, originally both stay independent.
Junk bond market – market of high yield bonds with high default risk, rated below in-
vestment grade when issued and thus paying a high coupon to make up for the additional
risk of investors. à Leverage Buyouts
Leveraged Buyouts (LBOs) – acquisition of a company financed primarily by debt in or-
der to create leverage. à junk bond market
Me-too runner – follows the à first mover. Fears to miss out on the current trend, but
does not really have an idea on the reasons for the underlying momentum.
Monopoly – a high amount of control a company has over a market segment’s specific
product or service with high entry barriers to that market.
NASDAQ – National Association of Securities Dealers Automated Quotations, the largest
electronic stock market in the U.S..
NASDAQ Composite – 3000 components, mainly technological companies and growth
companies, only U.S situated companies.
Oil crisis – political and economic crisis in the beginning and end of the 1970’s due to oil
shortages by reducing oil productions.
Oligopoly – the dominance of a small number of sellers in a market and the influence by
each other to agree on decisions and by controlling the market.
Opportunity cost – the cost one has to give up for the next best alternative.
Outsourcing – to contract out a business function to another company in order to gain
cost- and expertise advantages.
Perpetuity – no ending annuity.
Present Value (PV) – the value of an investment at present.
Private equity – institutional and recognized investors that make investments directly into
private companies and offer big amounts of money for a long period of time.
Product life cycle – used to describe the stages in the life of a product.
Stock option – an advantage (given) to sell or buy a stock, but it is not obligatory.
Tender offer – public offer to buy shareholders' shares at a premium to the market price.
Value Chain – chain of value creating activities within a company.

110 | P a g e
Warrant – a right to buy stocks for an agreed price at a later date.
Weighted average cost of capital (WACC) – discount rate, considering a company’s
capital structure of debt and equity. à discount rate
Working Capital – current assets of a com
Copyright © 2022 FDOKUMEN