
FULLTEXT01.pdf - DiVA-Portal
100
1 Table of content 1. Introduction ................................................................................................................. 7 2. Background .................................................................................................................. 9 3. Literature Review .................................................................................................... 11 3.1. Gasification process........................................................................................ 11 3.2. Tar formation and destruction ................................................................... 14 3.3. Feedstock type and contaminations ........................................................ 16 3.4. Fixed and fluidised bed gasifiers ............................................................... 17 3.5. Fuel gas cleaning and utilisation ............................................................... 20 3.6. High Temperature Air/steam Gasification (HTAG) ............................. 23 4. Objectives................................................................................................................... 27 5. Experimental Facility.............................................................................................. 28 5.1. Updraft fixed bed gasifier ............................................................................ 30 5.2. Feed gas preheating....................................................................................... 32 5.3. Measuring equipment .................................................................................... 33 6. Methodology .............................................................................................................. 37 6.1. Feedstock ........................................................................................................... 37 6.2. Experimental procedure ............................................................................... 39 7. Raw Data Evaluation .............................................................................................. 43 7.1. Calculation procedure .................................................................................... 43 7.2. Error evaluation ............................................................................................... 48 8. Mathematical Modeling ......................................................................................... 49 8.1. Drying .................................................................................................................. 49 8.2. Pyrolysis .............................................................................................................. 50 8.3. Gas-phase combustion.................................................................................. 51 8.4. Char combustion.............................................................................................. 52 8.5. Transport equations for gas and solid phases ..................................... 53 8.6. Solving the mathematical equations and boundary conditions .... 55 9. Results and Discussion.......................................................................................... 57 9.1. Gasification process........................................................................................ 58 9.2. Effect of feed gas temperature .................................................................. 61 9.3. Effect of steam ................................................................................................. 72 9.4. Effect of feed gas volume flow rate ......................................................... 82 9.5. Effect of feedstock size and type .............................................................. 85 9.6. Tar evolution ..................................................................................................... 88 10. Conclusions ................................................................................................................ 92 11. References ................................................................................................................. 95
-
Upload
khangminh22 -
Category
Documents
-
view
0 -
download
0
Transcript of FULLTEXT01.pdf - DiVA-Portal
1
Table of content 1. Introduction ................................................................................................................. 7 2. Background.................................................................................................................. 9 3. Literature Review .................................................................................................... 11
3.1. Gasification process........................................................................................ 11 3.2. Tar formation and destruction ................................................................... 14 3.3. Feedstock type and contaminations ........................................................ 16 3.4. Fixed and fluidised bed gasifiers ............................................................... 17 3.5. Fuel gas cleaning and utilisation ............................................................... 20 3.6. High Temperature Air/steam Gasification (HTAG) ............................. 23
4. Objectives................................................................................................................... 27 5. Experimental Facility.............................................................................................. 28
5.1. Updraft fixed bed gasifier ............................................................................ 30 5.2. Feed gas preheating....................................................................................... 32 5.3. Measuring equipment .................................................................................... 33
6. Methodology .............................................................................................................. 37 6.1. Feedstock ........................................................................................................... 37 6.2. Experimental procedure ............................................................................... 39
7. Raw Data Evaluation .............................................................................................. 43 7.1. Calculation procedure .................................................................................... 43 7.2. Error evaluation ............................................................................................... 48
8. Mathematical Modeling ......................................................................................... 49 8.1. Drying .................................................................................................................. 49 8.2. Pyrolysis .............................................................................................................. 50 8.3. Gas-phase combustion.................................................................................. 51 8.4. Char combustion.............................................................................................. 52 8.5. Transport equations for gas and solid phases ..................................... 53 8.6. Solving the mathematical equations and boundary conditions .... 55
9. Results and Discussion.......................................................................................... 57 9.1. Gasification process........................................................................................ 58 9.2. Effect of feed gas temperature .................................................................. 61 9.3. Effect of steam ................................................................................................. 72 9.4. Effect of feed gas volume flow rate ......................................................... 82 9.5. Effect of feedstock size and type .............................................................. 85 9.6. Tar evolution ..................................................................................................... 88
10. Conclusions................................................................................................................ 92 11. References ................................................................................................................. 95
2
List of Figures Figure 1. Co-current gasifier (downdraft gasification, left) and counter current gasifier (updraft
gasification) [64]. .................................................................................................................... 18 Figure 2. Principles of fluidized bed gasifiers [64] ..................................................................................... 18 Figure 3. High Temperature Air/Steam Gasification test facilities............................................................. 30 Figure 4. Side view of the updraft gasifier ................................................................................................. 31 Figure 5. Concept of Highly Preheated Gas Generator, [14] ..................................................................... 32 Figure 6. Photograph of wood pellets 12 mm. .......................................................................................... 37 Figure 7. Photograph of wood chips. ........................................................................................................ 37 Figure 8. Photograph Bark. ....................................................................................................................... 37 Figure 9. Photograph of Charcoal. ............................................................................................................ 37 Figure 10. Changes of the fuel gas composition (H2, CO, CO2, CH4, yx HC , O2), LHV, gasifier bed
temperature (Tb1) and the exiting fuel gas temperature (Tog1), versus gasification process time. Feed gas conditions: 50 Nm3/h of air preheated to 350oC (Case 1 as indicated in Table 9, is for gasification of 20 kg of wood pellets 12 mm). ................................................................... 59
Figure 11. Comparison of predicted and experimental gasification process in case of feed gas temperature equal to 350 oC, flow of feed gas equal to 50 Nm3/h, diameter of wood pellets equal to 12 mm, and mass of wood pellet equal to 20 kg......................................................... 60
Figure 12. Changes of the dry fuel gas composition (H2, CO, CO2, CH4, yx HC , O2), LHV, gasifier bed temperature (Tb1) and the fuel gas (Tog1) temperatures versus gasification process time. Feed gas conditions: 50 Nm3/h of air preheated to 830oC. (Case 8, as indicated in Table 9, is for gasification of 20 kg of wood pellets 12 mm). ......................................................................... 62
Figure 13. Changes of mass flow rates of main chemical species (CO, CO2, yx HC , CO2) versus time during gasification of wood pellets 12 mm. Feed gas conditions: 50 Nm3/h of air preheated to 350oC. (Case 1 as indicated in Table 9, is for gasification of wood pellets 12 mm)............... 63
Figure 14. Changes of mass flow rate of main reactants (CO, CO2, yx HC , CO2) versus gasification process time. Feed gas conditions: 50 m3/h of air preheated to 830oC (Case 8, as indicated on Table 9, is for gasification of 20 kg of wood pellets 12 mm)............................................... 64
Figure 15. Influence of feed gas (air at 50 Nm3/h) temperature on the mass flow rate and on the lower heating value of dry fuel gas during the fixed bed gasification of wood pellets 12 mm. Mass of charge 20 kg. ...................................................................................................................... 65
Figure 16. Influence of temperature of the feed gas on the average values of LHV and composition of dry fuel gas. Average values taken from Phase II for gasification of 20 kg of wood pellets 12 mm. ........................................................................................................................................ 66
Figure 17. Influence of temperature of feed gas (80 Nm3/h of air) on the average values of LHV and dry fuel gas composition. Average values taken from Phase II for gasification of 20 kg of wood pellets 8 mm. .......................................................................................................................... 67
Figure 18. Influence of feed gas (50 Nm3/h of air) temperature on the temperature of fuel bed (Tb1) and of the exiting fuel gas (Tog1), during gasification of 20 kg of wood pellets 12 mm. ................... 69
Figure 19. Influence of feed gas temperature on the composition of the fuel gas (average values, dry vol. %) taken from gasification stage of 20 kg of wood pellets with 12 mm diameter. .................... 71
Figure 20. Changes of the dry fuel gas composition (H2, CO, CO2, CH4, yx HC ), LHV, gasifier bed temperature (Tb1) and the fuel gas temperature (Tog1) versus gasification process time. Feed gas conditions: 56 Nm3/h of a mixture of air (17%) and steam (83 %) preheated to 900oC. (Case 12 as indicated on Table 9, is for gasification of 20 kg of wood pellets 12 mm). ............ 72
3
Figure 21. Changes of the molar fraction of H2 of the fuel gas for various gasification processes (Cases 8, 9, 10 and 11, as indicated on Table 9 - Gasification of 20 kg of wood pellets 12 mm). ............ 75
Figure 22. Changes of the molar fraction of CO2 of the fuel gas for various gasification processes (Cases 8, 9, 10 and 11, as indicated on Table 9, is for gasification of 20 kg of wood pellets 12 mm). .. 76
Figure 23. Changes of mass flow rates of main reactants (CO, CO2, yx HC , CO2-FeG-D) versus time. Feed gas conditions: 56 Nm3/h of the mixture of air (17%) and steam (83 %) preheated to 900oC. (Case 12 as indicated on Table 9, is for gasification of 20 kg of wood pellets 12 mm). . 77
Figure 24. Changes of the mass flow rate and LHV of the fuel gas for various gasification processes (Cases 9, 10, 11 and 12, as indicated on Table 9, is for gasification of 20 kg of wood pellets 12 mm). .................................................................................................................................. 78
Figure 25 Changes of process temperature for various wood pellets gasification processes (Cases 9, 11 and 12, as indicated on Table 9, are for gasification of 20 kg of wood pellets 12 mm). ............ 79
Figure 26. Influence of molar fraction of steam on the average values of composition and lower heating value of the fuel gas taken at the average value during gasification of 20 kg of wood pellets 12 mm. ........................................................................................................................ 80
Figure 27. Influence of volume flow rate of the feed gas on the composition of fuel gas and LHV taken at the average value - Gasification of 20 kg of wood pellets 12 mm......................................... 82
Figure 28. Predicted influence of feed gas flow rate on gasification profile (CO/CO2) of 20 kg of wood pellets 12 mm diameter, and 530oC feed gas temperature ........................................................ 85
Figure 29. Influence of the size of biomass on the gasification process predicted using parameters: 50 Nm3/h of air preheated up to 830 oC and 20 kg of wood pellets with following diameters: (a) 6 mm (b) 19 mm. ............................................................................................................... 86
Figure 30. Profiles of tar evolution (known fractions) during gasification of wood pellets 8 mm, with 80 Nm3/h of air as feed gas preheated up to 790oC. .................................................................... 89
Figure 31. Profiles of tar evolution (unknown fractions) during gasification of wood pellets 8 mm, with 80 Nm3/h of air as feed gas preheated up to 790oC................................................................. 90
4
List of Tables Table 1. Maturation scheme for tars, [42]................................................................................................ 15 Table 2. Fuel gas contaminants ............................................................................................................... 16 Table 3. Required values of the gas quality for the use in gas turbines, [80] ............................................... 21 Table 4. Required values of the gas quality for the use in gas engines, [32] ................................................ 21 Table 5. List of thermocouple type used ................................................................................................. 33 Table 6. Overview of the sensors for the flue gas analysis ......................................................................... 34 Table 7. Tar compounds determined via solid phase adsorption technique (SPA) ..................................... 35 Table 8. Proximate and elementary analysis of feedstock (in dry basis)...................................................... 38 Table 9. Operating conditions on the updraft fixed bed gasification of wood pellets................................. 40 Table 10. Summary of results of gasification: gasification process temperature (Tb1, Tog1), LHV, molar
fraction of nitrogen, molar ratios, maximum mass flow rate, cold gasification efficiency, maximum specific fuel gas production rate during gasification of wood pellets (12, 8 and 6 mm) – influence of feed gas temperature. ............................................................................... 68
Table 11. Summary of results of gasification: gasification process temperature (Tb1, Tog1), LHV, molar fraction of nitrogen, molar ratios, maximum mass flow rate, cold gasification efficiency, maximum specific fuel gas production rate during gasification of wood pellets – influence of steam in the feed gas. .............................................................................................................. 81
Table 12. Summary of results of gasification: gasification process temperature (Tb1, Tog1), LHV, molar fraction of nitrogen, molar ratios, maximum mass flow rate, cold gasification efficiency, maximum specific fuel gas production rate during gasification of wood pellets 12 mm – influence of feed gas volume flow rate. ................................................................................... 84
Table 13. Comparison of the wood pellets (8 mm and 6 mm) for gasification with volume flow rate of air of 80 Nm3/h preheated at low and high temperature – Influence of size diameter. ............ 87
5
Nomenclature Physical symbol Meaning (unit) A cross section area of the gasifier (m2) AE pre-exponent factor (s-1) Av pre-exponent factor in devolatilisation rate (s-1) Awg pre-exponent factor in water gas shif reaction (s-1) Bmix empirical constant
fuelCr
molar fraction of fuel
2OCr
molar fraction of oxygen
gwC ,
r molar fraction of moisture in the air flow
swC ,
r molar fraction of moisture at the solid surface
Db particle mixing coefficient due to random movements of particles in the bed Dig dispersion fraction Eb black-body radiation EE activation energy (J kmol-1) Ev activation energy in devolatilisation rate (J J kmol-1) Ewg activation energy in water gas shift reaction (J kmol-1) g mass fraction (-) gr gravity Hb Solid-phase enthalpy (kJ kg-1) Hev evaporation heat of the solid material (Jkg-1) Hg gas enthalpy (kJkg-1) hs convective mass transfer coefficient between solid and gas (Wm-2K-1)
'sh convective heat transfer coefficient between the solid and gas (W/m-2 K)
Iy+, Iy
-, Iz+, Iz Radiation intensities
Ka surface area of solid particles ka Absiorption coefficient kv rate constant of devolatilisation (s-1) kkin chemical kinetics rate constant kdif diffusion rate constant ks scattering coefficients LHV low heating value (MJNm-3) M molar mass (kg kmol-1) m mass (kg) m& mass flow rate (kg h-1) p pressure (Pa) pg gas pressure (Pa) pO2 oxygen partial pressure (Pa) Q energy (W m-3)
Qbh heat transfer between gas and particles, and heat generation due to heterogeneous combustion (W m-3)
Qe heat loss/gain (W m-3) Qa heat absorved by the solids (W m-3) Q& heat flux (kW) qr Radiative heat flux (W m-3) R gas universal constant (J m-1 K-1) Rkin kinetic rates
6
Rmix ixing-rate of gaseous phase in the bed (kg m-3s) Rv release rate of volatiles from the solid Rwg kinetic rate of water gas shift reaction S Stoichiometric coefficients in reactions Sib Source term
Sm,j source terms accounting for mass changes due to evaporation, devolatilisation and combustion
T temperature (oC)
gur Superficial gas velocity (m s-1) Tg gas temperature (K) Tenv environmental temperature (K) Ts solid temperature t Time instant (s) Yib mass fractions of particle compositions (moisture, volatile, fixed carbon and ash ) x molar fraction (-) Greek symbols ε specific gas production rate (kg m-2 h) εs system emissivity η efficiency, yield (%) λb effective thermal conductivity of the solid bed (W m-1 K-1) λg thermal dispersion coefficient (W m-1 K-1) Ω energy of feed gas in fuel gas (%) ρg gas density Φ variable σb Boltzamann radiation constant, 5.86x10⁻⁸ (Wm-2K-4) σr normal stress tensor within the bed τ time (minutes) τr Sheart stress tensor within the bed υ remaining volatile in solid at time t
∞υ ultimate yield of volatile Yig mass fraction Subscripts b Bed CH4 methane CO carbon monoxide CO2 carbon dioxide
yx HC Higher hydrocarbons D dry gas FG fuel gas FG_D dry fuel gas FeG feed gas H2 hydrogen N2 nitrogen O2 oxygen og off gas WF waste fuel, feedstock
7
1. Introduction
Global energy consumption in recent years has continued to increase primarily as a result of
rapid industrialisation and improvement in the standard of living [1]. This increased energy
consumption has led to increased emissions of carbon dioxide and nitrogen oxide into
environment. In December 1997, the Kyoto Protocol was held on Global Climate Changes as the
Third Conference of Parties (COP3) to the United Nations Framework Convention. At this
conference it was stipulated that developed countries should reduce their total emissions of
greenhouse gases by at least 5% from the level of 1990 between the years 2008 and 2012. It has
become an important responsibility for all developed countries to endeavour to achieve both
environmental preservation and industrial growth by developing efficient and environmentally
friendly energy utilisation technologies, which harmonise with the conservation of resources and
energy saving [1]. One of the ways to reduce carbon dioxide emission is use of biomass.
Biomass could be a major renewable energy source in the twenty-first century; it already
supplies 15 percent of world energy for human use [2]. Biomass, defined as any renewable source
of fixed carbon, it could play a substantial role in a more diverse and sustainable energy mix.
Biomass may be defined as. The term is generally used to describe plant material such as wood,
wood residues, agricultural crops and their residues. Industrial and municipal wastes are often also
considered as biomass due to their high percentages of food waste and fibre [3].
Biomass can be converted to liquid fuels, gas fuels, chemicals and materials, and used
directly for heat. Crops grown for food, feed, fiber, chemicals, and crops grown specifically for
energy can supply renewable resources for energy production and provide biomass that can offset
the use of fossil fuels [2]. Technologies based on direct combustion are under development and
are expected to be able to achieve conversion efficiencies above 40 percent.
More advanced technologies, based on combining gasification with fuel cells or micro-
turbine in combined cycles, could achieve efficiencies approaching 57 percent [2]. Gasification of
biomass has also several advantages over its direct combustion. One is convenience – one of the
resultant gases, methane, can be treated in a similar way as natural gas, and used for the same
purposes. Another advantage of gasification is that it produces a fuel that has had many impurities
removed and will therefore cause fewer pollution problems when burnt. And, under suitable
circumstances, it can produce synthesis gas, a mixture of carbon monoxide and hydrogen. This can

8
be used to make almost any hydrocarbon (eg, methane and methanol) which can then be
substituted for fossil fuels. But also hydrogen itself is a potential fuel of the future. It is a common
understanding that hydrogen will one day perform the role that oil and petroleum perform today –
but without the pollution [4].
Biomass has also the potential to accelerate the realisation of hydrogen as a major fuel of the
future. Since biomass is renewable and consumes atmospheric CO2 during growth, it can have a
small net CO2 impact compared to fossil fuels. However, hydrogen from biomass has major
challenges. There are no completed technology demonstrations. The yield of hydrogen is low from
biomass since the hydrogen content in biomass is low to begin with (approximately 6% versus
25% for methane) and the energy content is low due to the 40% oxygen content of biomass. Since
over half of the hydrogen from biomass comes from spitting water in the steam reforming
reaction, the energy content of the feedstock is an inherent limitation of the process [5].
Biomass gasification for distributed, small-scale power generation has been experienced
worldwide [6,7]. Electricity generation is considered the most lucrative opportunity for commercial
exploitation of biomass, by virtue of the high value of electricity [3, 8,33]. The basic principles of
gasification have been under study and development since the early nineteenth century [9], and
during the Second World War nearly a million biomass gasifier-powered vehicles were used in
Europe [10]. Interest in biomass gasification was revived during the “energy crisis” of the 1970s
and slumped again with the subsequent decline of oil prices in the 1980s. The World Bank (1989)
estimated that only 1000 - 3000 gasifiers have been installed globally, mostly small charcoal
gasifiers in South America [10].
This work concerns the new process suitable for biomass and wastes gasification in order to
produce fuel gas which can be used for example for small-scale production of electricity.
9
2. Background
Biomass can be treated in a number of different ways to provide gas fuels. In general such
methods are divided into biological and thermal. The biological conversion processes are
hydrolysis, fermentation and anaerobic digestion. The main thermal conversion processes are
combustion, gasification, pyrolysis and liquefaction. Direct combustion provides heat, for example
for steam production and hence electricity generation. Gasification provides a fuel gas that can be
combusted, generating heat, or used in an engine or turbine for electricity generation. The
produced fuel gas can be also further processed towards methanol or towards liquid hydrocarbons
as for example by Fisher-Tropsch synthesis [11,12].
Air gasification, produces calorific value gas (4-7 MJ/Nm3) suitable for boiler, engine and
turbine operation but not for pipeline transportation due to its low energy density. Oxygen
gasification produces a medium calorific value gas (10-18 MJ/Nm3) suitable for limited pipeline
distribution and as synthesis gas for conversion, for example, to methanol and gasoline. Such a gas
can also be produced by steam gasification. Gasification with air is the most widely used
technology since there is not the cost or hazard of oxygen production and usage, nor the
complexity and cost of multiple reactors [7].
Medium calorific value gas from steam gasification, or from oxygen gasification, is better
suited to synthesis of transport fuels and commodity chemicals due to the absence of diluent
nitrogen, which would pass through unchanged, but reduce process efficiency and increase costs.
The exception is ammonia synthesis when the nitrogen content derived from air gasification can
be utilised in the ammonia synthesis process. In electricity generation, there is no evidence that the
benefits of producing higher heating value gas for example with oxygen gasification justify the cost
of providing and using oxygen, which explains the lower level of interest in oxygen gasification.
Recognising that energy and environmental issues have become of prime concern, it was a
matter of great urgency to deal with environmental preservation on a global scale and over longer
time duration that Research and Development carried out in Japan under leadership of Tanaka
[13] had resulted in designing a technology on High Temperature Air Combustion (HiTAC) of gas
and liquid fuels. Under these circumstances, combustion technology utilizing preheated air in
excess of 1000oC has drawn increased attention in many applications areas. This technology
enables one to contribute greatly to the simultaneous reduction of carbon dioxide and oxides of
10
nitrogen emissions. This HiTAC has achieved approximately 30% reduction in energy (and hence
also carbon dioxide emission) and 25% reduction in the physical size of facilities as compared with
conventional type furnace. Furthermore, HiTAC technology has demonstrated extremely low
levels of emissions of nitric oxide, which are far below the present regulatory standards [1].
Particularly progress in the area of High Temperature Air Combustion and on designing of highly
efficient regenerative air and steam preheaters [14,15] made this development faster. This progress
has created the possibility to begin a systematic research in Japan and Sweden on gasification
processes with high temperature air and steam called High Temperature Air/Steam Gasification
(HTAG), research from which the present work is based on.
Although biomass gasification technologies have been successfully demonstrated at large-
scale and several demonstration projects are in operation or at an advanced stage of construction,
they are still relatively expensive compared to fossil based energy and thus face economic and
other non-technical barriers [16]. Thus the innovation in practically all demonstration projects
under implementation lies not only in the technical aspects of the various processes but also in the
integration of the gasification technologies in existing or newly developed systems where it can be
demonstrated that the overall system offers better prospects for economic development [17].
Current development on biomass gasification technologies has shown that for large-scale
applications the preferred and most reliable system is the circulating fluidised bed gasifier while for
the small-scale applications the fixed bed gasifiers are the most extensively studied. Therefore, in
this work the new process of biomass gasification with use of highly preheated air and steam in a
updraft fixed bed gasifier was studied.
11
3. Literature Review
3.1. Gasification process
Biomass gasification is the conversion of an organically derived, carbonaceous feedstock into
a gaseous product, a fuel gas, consisting primarily of hydrogen (H2) and carbon monoxide (CO),
with lesser amounts of carbon dioxide (CO2), water (H2O), methane (CH4), higher hydrocarbons,
and nitrogen (N2). Factors that affect the performance of the gasification reactor system are:
equivalence ratio (ER), gasification temperature and heating rate, kind of gasifying agent, pressure,
residence time, feedstock properties and catalyst or bed additives.
The gasification process is carried out at elevated temperatures, 500-1400oC, and
atmospheric or elevated pressures. The oxidant used can be air [15,18-23], steam [24-27], carbon
dioxide [28-30], pure oxygen [31] or a mixture of these gases [12,32-35]. Some literature [12] gives
some range of calorific value depending on the gasifying agent used. Air-based gasifiers (or
mixture of air and steam) typically produce a fuel gas containing a relatively high concentration of
nitrogen with a calorific value between 4 and 6 MJ/m3. Oxygen and steam-based gasifiers produce
a product gas containing a relatively high concentration of hydrogen and CO with a calorific value
between 12 and 18 MJ/m3. Using hydrogen and hydrogenation, high calorific value (40 MJ/Nm3)
it could be obtained. Low calorific value gas is used directly in combustion or in an engine, while
medium/high calorific value gases can be utilized as feedstock for subsequent conversion into
basic chemicals, principally methane and methanol.
Gasification invariably results in the formation of three major classes of products: (1) a
mixture of gases (H2, CO, CO2, CH4 and N2); (2) tar; and (3) solid residues. Pyrolysis is the first
step by which decomposition of the biomass feedstock by heat takes place. This step is
endothermic and produces 75 to 90% volatile materials in the form of gases and liquid. The
remaining non-volatile material, containing high carbon content, is referred to as char [36]. For
temperatures exceeding 550oC, the char yield for biomass gasification remains almost invariable,
whereas the gas yield increases and the tar yield decreases with increasing temperature. The volatile
hydrocarbons and char are subsequently converted to fuel gas (in the second step, gasification). A
few of the major reactions involved during gasification are listed below [36]:

12
Exothermic Reactions:
Combustion OHCOOcharvolatilesbiomass 222)/( +↔+ (Eq. 1)
Partial Oxidation OHCOOcharvolatilesbiomass 22)/( +↔+ (Eq. 2)
Methanation OHCHHcharvolatilesbiomass 242)/( +↔+ (Eq. 3)
Water-Gas Shift 222 HCOOHCO +↔+ (Eq. 4)
CO Methanation OHCHHCO 2423 +↔+ (Eq. 5)
Endothermic Reactions:
Steam-Carbon reaction 22)/( HCOOHcharvolatilesbiomass +↔+ (Eq. 6)
Boudouard reaction COCOcharvolatilesbiomass 2)/( 2 ↔+ (Eq. 7)
The reaction equation (6) represents the steam reforming reaction of tars
( xCOHyxOxHCxHy ++↔+ 22 )2/( ) which contributes to increment in the content of H2 and
CO. The higher production of hydrogen during steam gasification can be attributed by the
following chemical reactions:
COHOHCH +↔+ 224 3 (Eq. 8)
COHOHHC 242 2242 +↔+ (Eq. 9)
222 COHOHCO +↔+ (Eq. 10)
COHOHC +↔+ 22 (Eq. 11)
Dry reforming of tars also occurs during gasification and it could be represented by the
following reaction:
xCOHyxCOCxHy 2)2/( 22 +↔+ (Eq. 12)
Other main chemical reactions other than the Boudouard reaction (7), when CO2 is used as
gasifying medium are listed below:
13
COHCOCH 24 224 +↔+ (Eq. 13)
COHCOHC 422 2242 +↔+ (Eq. 14)
COOHHCO +↔+ 222 (Eq. 15)
Of the factors affecting the performance of the gasification, the effect of equivalence ratio
on the gas composition, caloric value and the gas production rate has been studied by several
researchers [18-23]. For instance, the equivalence ratio (ER) for the gasifier in general is found to
be in the range 0.27 – 0.43, which is within the range for ideal and theoretical gasication (0.19 –
0.43). Investigation carried out in a downdraft gasifier using furniture wood and wood chips has
shown that the caloric value of the producer gas increases with equivalence ratio initially, attains a
peak and then decreases with the increase in equivalence ratio [18]. In this study, it was also
observed that complete conversion of carbon to gaseous fuel has not taken place even for the
optimum equivalence ratio. Similarly, the LHV was found to reduce with ER in studying
gasification of sawdust and mixture of sawdust and plastic waste conducted in a pressurized
fluidised-bed gasifier [19]. The compositions of chemical species in the fuel gas, depending on the
equivalent ratio (0.29-0.37), the feedstocks, and the gasification temperatures in the range 800-
900oC, differed for the various experiments conducted. The increase of molar fractions of species
in the fuel gas with ER was also reported in this study [19]. Overall, the nitrogen from the air is
not involved in any gasification but does dilute the fuel gas. The dilution effect of the nitrogen is
dependent on the fuel/air input ratio.
The steam gasification product is more or less free from N2 and more than 50% H2 in the
product gas could be obtained. Some authors [37] reported steam gasification and the effect of
steam/biomass ratio (SB) on the gasification products. These researchers observed an increase in
H2 (as high as 60%) and CO2 (from 10 to 30%) contents, a sharp decrease in CO (from 35 to
10%) content, a slight decrease in CH4 content and relatively no change of C2-fractions (C2H2;
C2H4; C2H6) when the SB ratio was increased from 0.5 to 2.5. In spite of sharp reduction in tar
(8% yield at 0.5 SB decreased to almost nil at 2.5) there was a sharp decrease in the lower heating
value that was attributed by the decrease in CO.
The use of CO2 as gasifying medium is promising because of its presence in the gasification
atmosphere. Tar reduction is also enhanced by dry reforming reactions of CO2, which is a
gasification product. For example, it has been seen that a mixture of steam–CO2 gives highest
14
degree of carbonization for pyrolysis and gasification of biomass in a horizontal rotating reactor
[34]. These authors also mentioned that a steam–CO2 mixture produced the highest activity char,
which resulted in high ash content.
3.2. Tar formation and destruction
In biomass gasification, the gas can contain significant amounts of tars which can be
eliminated by thermal cracking (high-temperature gasification) or by the use of a catalyst (catalytic
gasification). High- and low-temperature gasification processes can be distinguished, the
demarcation being around 700-750 °C [38].
An increase in the gasification temperature causes an increase in the gaseous product yield
and a decrease in the tar yield. Despite this lower tar content, the remaining tars must be
eliminated in order to be able to use the gas obtained. These tars are mainly polyaromatic
hydrocarbons (PAH), which are difficult to convert, and the relative proportion of PAH increases
with the gasification temperature [38]. Tar is undesirable because of various problems associated
with condensation, formation of tar aerosols and polymerization to form more complex
structures, which cause problems in the process equipment as well as the engines and turbines
used in application of the fuel gas [39,40]. However, the minimum allowable limit for tar is highly
dependent on the kind of process and the end user application, as given in some examples later in
this chapter.
Tars can be classified into four categories [41]: primary products, secondary products, alkyl
tertiary products, and condensed tertiary products. Primary products comprise relatively simple
organic compounds derived from cellulose, hemicellulose, and lignin. Secondary products are
characterized as phenolics, which are alcohols with the hydroxyl group bonded directly to an
aromatic (benzene) ring, or as olefins, which are hydrocarbons with carbon–carbon double bonds.
Alkyl tertiary products consist mainly of methyl derivatives of aromatics. Condensed tertiary
products include benzene, napthalene, acenaphthylene, anthracene, phenathrene, and pyrene.
Aromatic compounds contain a benzene ring (six carbon atoms alternately single- and double-
bonded), stable molecular structure. The types of tars produced are a function of both the time
and temperature over which reaction occurs, sometimes known as “reaction severity” [41]. Higher
temperatures and longer residence times correspond to a higher reaction severity. As reaction
severity increases, the tars produced are more likely to be secondary and tertiary products. Primary
15
and tertiary tars are mutually exclusive, indicating that primary tars are destroyed before the
formation of tertiary products [41]. The presence of both primary and tertiary products indicates
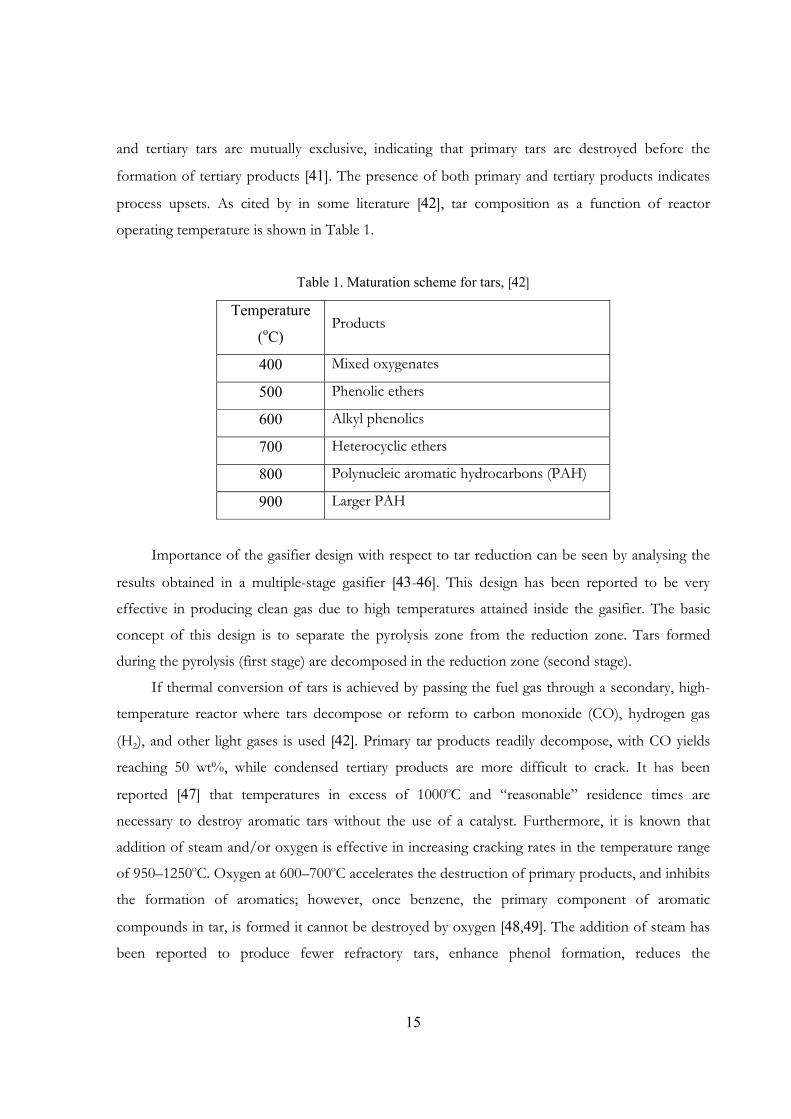
process upsets. As cited by in some literature [42], tar composition as a function of reactor
operating temperature is shown in Table 1.
Table 1. Maturation scheme for tars, [42]
Temperature
(oC) Products
400 Mixed oxygenates
500 Phenolic ethers
600 Alkyl phenolics
700 Heterocyclic ethers
800 Polynucleic aromatic hydrocarbons (PAH)
900 Larger PAH
Importance of the gasifier design with respect to tar reduction can be seen by analysing the
results obtained in a multiple-stage gasifier [43-46]. This design has been reported to be very
effective in producing clean gas due to high temperatures attained inside the gasifier. The basic
concept of this design is to separate the pyrolysis zone from the reduction zone. Tars formed
during the pyrolysis (first stage) are decomposed in the reduction zone (second stage).
If thermal conversion of tars is achieved by passing the fuel gas through a secondary, high-
temperature reactor where tars decompose or reform to carbon monoxide (CO), hydrogen gas
(H2), and other light gases is used [42]. Primary tar products readily decompose, with CO yields
reaching 50 wt%, while condensed tertiary products are more difficult to crack. It has been
reported [47] that temperatures in excess of 1000oC and “reasonable” residence times are
necessary to destroy aromatic tars without the use of a catalyst. Furthermore, it is known that
addition of steam and/or oxygen is effective in increasing cracking rates in the temperature range
of 950–1250oC. Oxygen at 600–700oC accelerates the destruction of primary products, and inhibits
the formation of aromatics; however, once benzene, the primary component of aromatic
compounds in tar, is formed it cannot be destroyed by oxygen [48,49]. The addition of steam has
been reported to produce fewer refractory tars, enhance phenol formation, reduces the
16
concentration of other oxygenates, have only a small effect on the conversion of aromatics, and
produce tars that are easier to reform catalytically [42].
3.3. Feedstock type and contaminations
Influence of the biomass properties on gasification has been analysed in several works
[4,22,23,27,50-54]. The three largest components of biomass sources are cellulose (40-60%wt),
hemicellulose (20-40%wt), and lignin (10-25%wt) [4]. Despite their wide range of possible sources,
biomass feedstocks are remarkably uniform in many of their fuel properties, compared with
competing feedstocks such as coal or petroleum. A summary of biomass characteristics
comparatively to fossil fuels are given in literature [51].
The composition of the biomass material has consequences for the capacity and nature of
the gas cleaning, the composition of the ashes, the composition of the waste water stream from
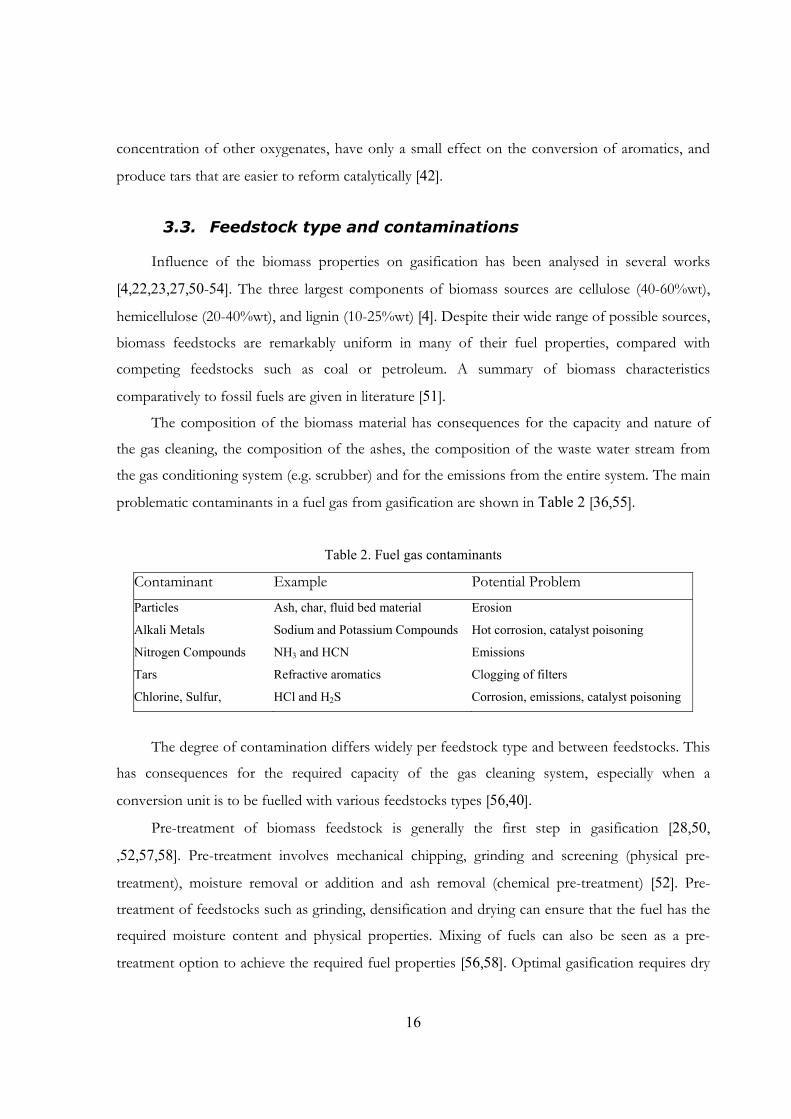
the gas conditioning system (e.g. scrubber) and for the emissions from the entire system. The main
problematic contaminants in a fuel gas from gasification are shown in Table 2 [36,55].
Table 2. Fuel gas contaminants
Contaminant Example Potential Problem
Particles Ash, char, fluid bed material Erosion
Alkali Metals Sodium and Potassium Compounds Hot corrosion, catalyst poisoning
Nitrogen Compounds NH3 and HCN Emissions
Tars Refractive aromatics Clogging of filters
Chlorine, Sulfur, HCl and H2S Corrosion, emissions, catalyst poisoning
The degree of contamination differs widely per feedstock type and between feedstocks. This
has consequences for the required capacity of the gas cleaning system, especially when a
conversion unit is to be fuelled with various feedstocks types [56,40].
Pre-treatment of biomass feedstock is generally the first step in gasification [28,50,
,52,57,58]. Pre-treatment involves mechanical chipping, grinding and screening (physical pre-
treatment), moisture removal or addition and ash removal (chemical pre-treatment) [52]. Pre-
treatment of feedstocks such as grinding, densification and drying can ensure that the fuel has the
required moisture content and physical properties. Mixing of fuels can also be seen as a pre-
treatment option to achieve the required fuel properties [56,58]. Optimal gasification requires dry
17
fuels of uniform size, with moisture content no higher than 15 percent to 20 percent [4]. The
wood fuel moisture content is a critical factor in determining the most effective type of fixed bed
gasifier. For wood with moisture contents up to 35wt% (wet basis) a two stage gasifier is required,
for moisture contents between 35wt% and 40wt% (wet basis) a single stage gasifier is most
suitable. Although wood with moisture contents above 40wt% can be gasified the resultant
reduction in gas calorific value renders the process unattractive [59].
Physical properties of the feedstock, such as size, moisture and ash content have been
analysed by studying two feedstock type, rice straw and saw dust in a pyrolysis process [52]. The
study shows relative increase of gas yield as the particle size of the biomass feed is smaller. The
small particle with very close approximation of spherical shape was found to be favourable to gas
yield. Moisture addition to the biomass particles causes a small increase in gas yield. On the
contrary, moisture removal results in a slight decrease, and also, ash removal yields the same result.
The feedstock type effect was studied in this work by using same operating conditions with
respect to gasifir type, feed gas type and feed gas temperature in gasifying wood pellets with three
sizes (12 mm, 8 mm, 6 mm), charcoal, bark and wood chips. These are the most used biomass
fuels used for combined heat and power (CHP) generation in district heating systems [60-62].
3.4. Fixed and fluidised bed gasifiers
There are many types of gasifiers with varying schemes for both reactor design and reaction
media. The most common types are counter- and co-current fixed bed, bubbling and fluidised
beds, [16,63]. The processes can work either at atmospheric pressure, or be pressurised.
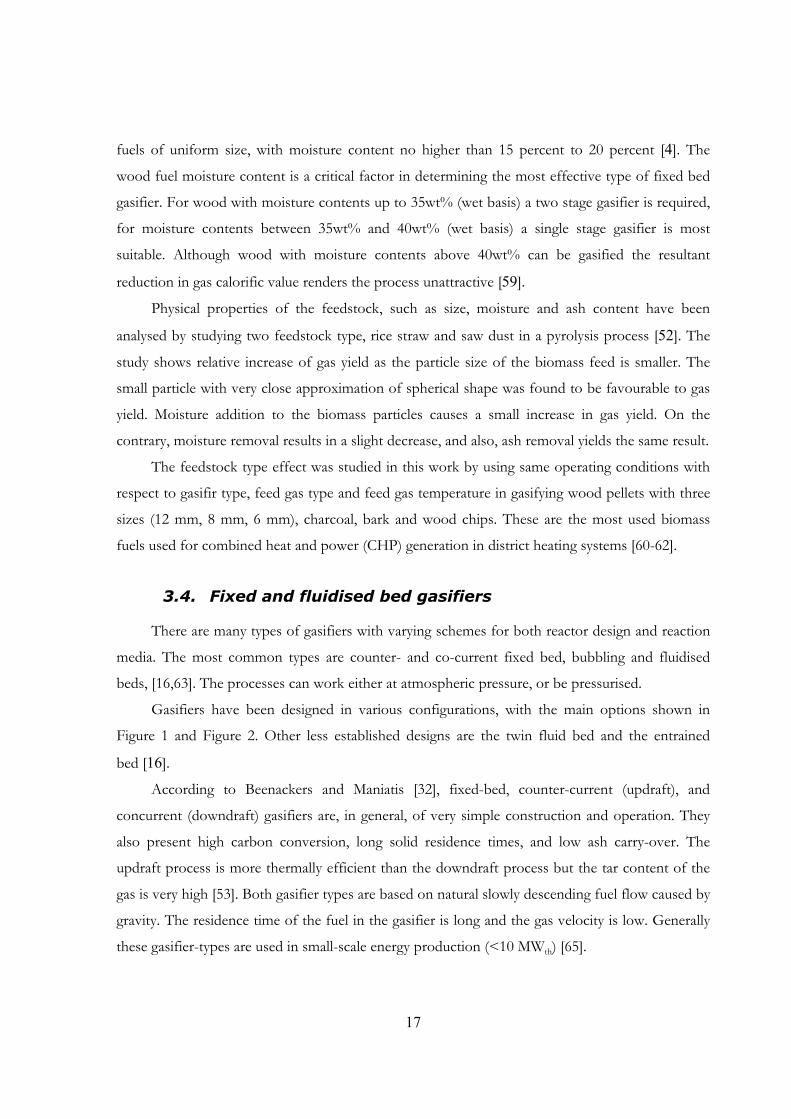
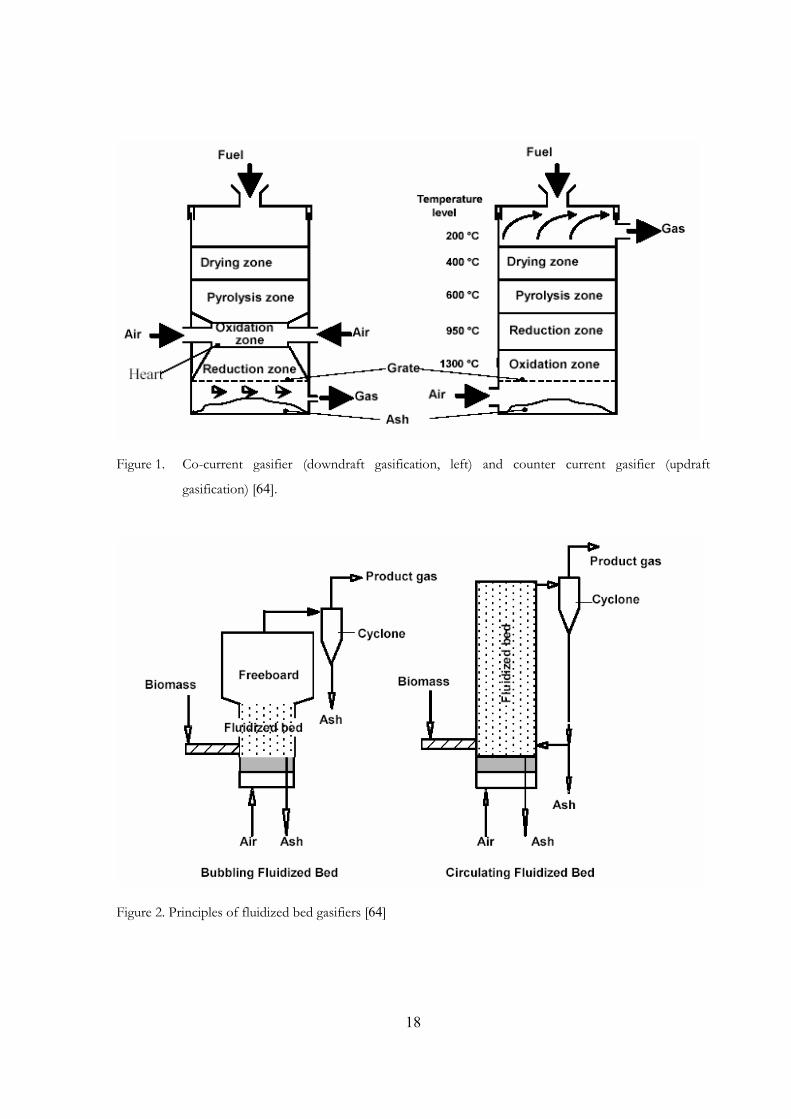
Gasifiers have been designed in various configurations, with the main options shown in
Figure 1 and Figure 2. Other less established designs are the twin fluid bed and the entrained
bed [16].
According to Beenackers and Maniatis [32], fixed-bed, counter-current (updraft), and
concurrent (downdraft) gasifiers are, in general, of very simple construction and operation. They
also present high carbon conversion, long solid residence times, and low ash carry-over. The
updraft process is more thermally efficient than the downdraft process but the tar content of the
gas is very high [53]. Both gasifier types are based on natural slowly descending fuel flow caused by
gravity. The residence time of the fuel in the gasifier is long and the gas velocity is low. Generally
these gasifier-types are used in small-scale energy production (<10 MWth) [65].
18
Figure 1. Co-current gasifier (downdraft gasification, left) and counter current gasifier (updraft
gasification) [64].
Figure 2. Principles of fluidized bed gasifiers [64]
19
In an updraft (or counter-current) gasifier, the biomass fuel enters the top of the reaction
chamber while feed gas (steam, air, oxygen or a mixture of oxidisers) enters from below a grate.
The fuel flows downward, and up-flowing hot gases pyrolyses it. Some of the resulting charcoal
residue falls to the grate, where it burns, producing heat and giving off carbon dioxide (CO2) and
water vapour (H2O). The CO2 and H2O react with other charcoal particles, producing carbon
monoxide (CO) and hydrogen (H2) gases. The gases exit from the top of the chamber. Ashes fall
through the grate.
As the products of drying and pyrolysis zones are directly drawn into the product gas
without secondary decomposition reactions, the product gas of an updraft gasifier contains an
abundance of oils and tars. In addition, the product gas temperature is low (with biomass fuels 80-
300oC). Bottom ash is usually completely oxidised and does not contain significant amounts of
unburnt carbon. Usually, the dust content of the product gas is rather low due to low gas velocities
and due to “filtering effects” of the drying and pyrolysis zones. Some examples of commercial of
updraft gasifier are given in the literature [59,65,66].
The updraft design is relatively simple and can handle biomass fuels with high ash and
moisture content. However, the fuel gas contains 10 percent to 20 percent volatile oils (tar),
making the gas unsuitable for use in engines or gas turbines. Recently, VTT Energy and Condens
Oy reported a new type of fixed-bed gasifier which is based on forced feedstock flow and
consequently allows the use of low-bulk-density fibrous biomass residues. This gasifier,
demonstrated in a 500 kWth pilot plant at VTT is a combination of the updraft and co-current
gasification technologies [65].
Successful operation of a downdraft (or co-current) gasifier requires drying the biomass fuel
to a moisture content of less than 20 percent. Fuel and gasifying agent enter the top of the
reaction chamber. Down flowing fuel particles ignite, burning intensely and leaving a charcoal
residue. The charcoal (which is about 5 to 15 percent of the original fuel mass) then reacts with the
combustion gases, producing CO and H2 gases. These gases flow down and exit from the chamber
below a grate. The fuel gas leaving the gasifier is at a high temperature (around 700°C).
Combustion ash falls through the grate [16]. The advantage of downdraft design is the fact that
the pyrolysis products have to flow co-currently through the hot combustion and gasification
zones, were most of tars are decomposed and oxidises. Thus, the product gas of an ideal down
draft gasifier can after simple filtration and cooling be used in an internal combustion engine [65].

20
Examples of the published application of this technology are given in the literature consulted
[65,67,68].
Fluidised bed reactors are known to have rapid heat transfer resulting in high conversion
rates. Consequently they have high volumetric capacities, flexibility with regard to feed rate and
composition and easy control of temperature [63]. According to the literature many biomass
gasification processes have been developed commercially [16,69], but only the fluid bed
configurations are being considered in applications that generate over 1 MWe [70,71]. Fluid bed
gasifiers are available from a number of manufacturers in thermal capacities ranging from 2.5 to
150 MWth for operation at atmospheric (bubling and circulating bed) or elevated pressures
(pressurised bed) [65,69,72]. Ideally, the process produces only a non-condensable gas and an ash
residue. In reality, incomplete gasification of char and the pyrolysis tars will produce a gas
containing varying levels of the contaminants such as particulate, tars, alkali metals, fuel-bound
nitrogen compounds and an ash residue containing some char. The composition of the gas and
the level of contamination vary with the feedstock, reactor type and operating parameters, and
typical gas characteristics as shown in the literature [16].
3.5. Fuel gas cleaning and utilisation
Fuel gas contains mainly carbon monoxide, hydrogen, water vapour, carbon dioxide, tar
vapour and ash particles (nitrogen content as well, depending on the gasifier agent). Gasification
produces a low calorific value or medium-calorific value gas, depending on the process used. Fuel
gas contains 70 percent to 80 percent of the energy originally present in the biomass feedstock.
The gas can be burned directly for space heat or drying [69,72,73], or it can be burned in a boiler
to produce steam [69,72-75]. Medium-calorific value fuel gas can be converted into methanol, a
liquid fuel [10,76]. Electric power generation is possible by combining a gasifier with a gas turbine
or gas engine [65, 69,72-75,77-79], or fuel cell [76]. At the scale of electrical production suited to
biomass, conversion processes involving gasification have the potential of producing higher fuel to
electrical power efficiencies over those employing direct combustion and steam cycle technology.
The clean gas is suitable for use in an internal combustion engine, gas turbine or other
application requiring a high-quality gas. Typical values to be achieved for the use in gas turbines
are listed in Table 3 [80]. Among these, turbocharged engines make a higher demand on the gas
quality. Table 4 shows the required values for gas engines [32]. In order to avoid fouling and
deposits in the engine, the gas should be to a large degree tar- and dust-free. Furthermore, the
21
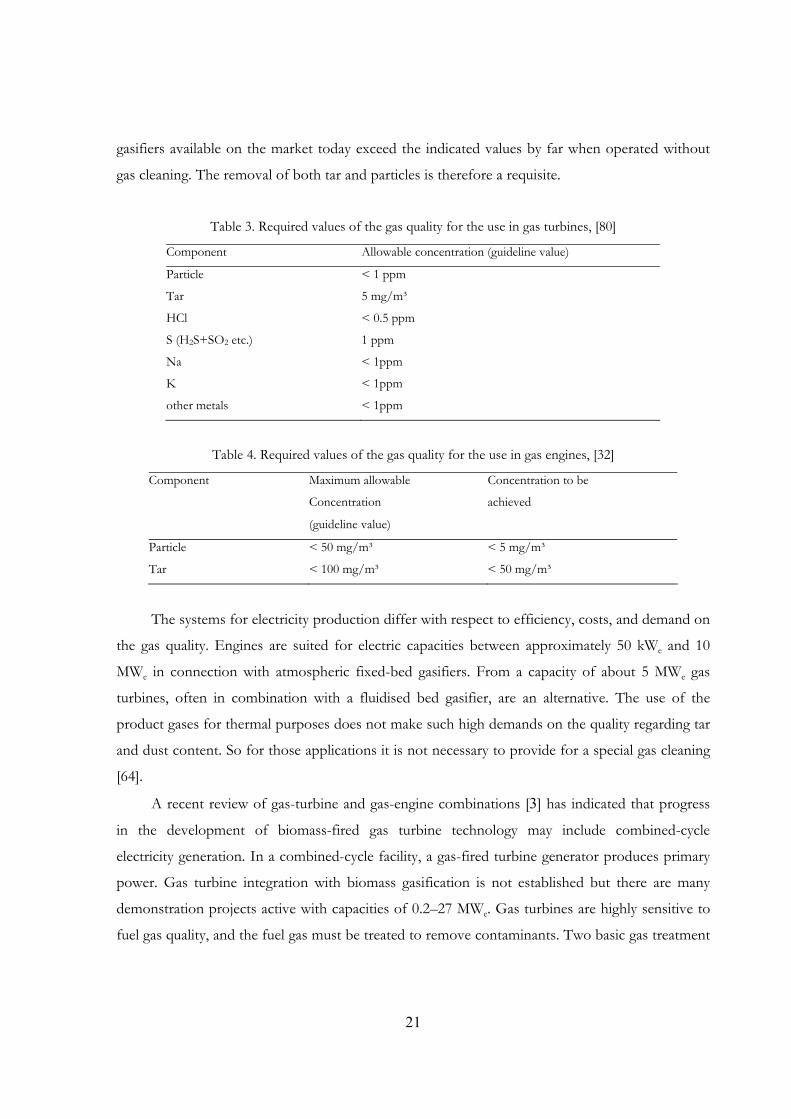
gasifiers available on the market today exceed the indicated values by far when operated without
gas cleaning. The removal of both tar and particles is therefore a requisite.
Table 3. Required values of the gas quality for the use in gas turbines, [80]
Component Allowable concentration (guideline value)
Particle < 1 ppm
Tar 5 mg/m³
HCl < 0.5 ppm
S (H2S+SO2 etc.) 1 ppm
Na < 1ppm
K < 1ppm
other metals < 1ppm
Table 4. Required values of the gas quality for the use in gas engines, [32]
Component Maximum allowable Concentration to be
Concentration achieved
(guideline value)
Particle < 50 mg/m³ < 5 mg/m³
Tar < 100 mg/m³ < 50 mg/m³
The systems for electricity production differ with respect to efficiency, costs, and demand on
the gas quality. Engines are suited for electric capacities between approximately 50 kWe and 10
MWe in connection with atmospheric fixed-bed gasifiers. From a capacity of about 5 MWe gas
turbines, often in combination with a fluidised bed gasifier, are an alternative. The use of the
product gases for thermal purposes does not make such high demands on the quality regarding tar
and dust content. So for those applications it is not necessary to provide for a special gas cleaning
[64].
A recent review of gas-turbine and gas-engine combinations [3] has indicated that progress
in the development of biomass-fired gas turbine technology may include combined-cycle
electricity generation. In a combined-cycle facility, a gas-fired turbine generator produces primary
power. Gas turbine integration with biomass gasification is not established but there are many
demonstration projects active with capacities of 0.2–27 MWe. Gas turbines are highly sensitive to
fuel gas quality, and the fuel gas must be treated to remove contaminants. Two basic gas treatment
22
methods have been proposed [81]: hot gas filtration and wet gas scrubbing. Filters and gas-
scrubbers remove tars and particulate matter from fuel gas [65,69,72,73,75,77].
The operation of diesel and spark-ignition (SI) engines using a variety of low heating value
gases is an established practice [69,72,73,77]. Both dual fuel diesel and spark ignition engines for
operation using low heating value gases may be regarded as fully developed, although integration
of a biomass gasifier and engine is not fully established [3]. A summary of much recent study
about the utilisation of biomass fuel gas from gasifiers for obtaining mechanical energy in a SI
engine is presented in the literature [82].
Use of fuel gas in a fuel cell requires reforming clean gas into hydrogen ions and carbon
monoxide. The most active common fuel for use in fuel cells is hydrogen, since it has an oxidation
rate of about four orders of magnitude greater than that of simple partially oxidised one-carbon
compounds, which themselves have the same oxidation advantage over saturated hydrocarbons
under the same conditions [76]. Fuel cells produce electricity and thermal energy from hydrogen
through an electrochemical conversion process. Example of techno-economic assessments of
systems that integrate biomass gasification with fuel cell modules (molten carbonate or phosphoric
acid) for electricity generation has been reported elsewhere [76]. The system of gasification
integrated with fuel cells comprises a low pressure oxygen (LPO) wood gasifier, a wood drying
stage, cold gas-cleaning, (shifter, where necessary) integrated with a fuel cell.
Hydrogen can be produced from the thermochemical gasification of many biomass
feedstocks, such as municipal solid waste, agricultural or forest wastes or wood chips from short
rotation forestry plantations. The synthesis gas coming from an oxygen-blown gasifier will contain
methane and carbon monoxide in addition to the hydrogen. In general, the fuel cell electrolytes
cannot use the syngas directly; it must receive the appropriate pre-treatment. This pre-treatment
can involve adding steam at high temperature to the syngas to convert the methane to carbon
monoxide and hydrogen in a process known as steam reforming. Steam can also react with the
carbon monoxide to form hydrogen (and carbon dioxide) in the shift conversion reaction. Carbon
dioxide (and sulphur compounds, if present) can be removed at a later stage, if necessary [76].
23
3.6. High Temperature Air/steam Gasification (HTAG)
In this section, some examples are given to illustrate the impact of the gasifying agent
temperature on the gasifier bed temperature, and subsequently on the fuel gas quality and
distribution.
To produce a relatively clean gas by increased gasification temperature, several temperature
ranges are reported in the literature. Gasification temperature not only affects the amount of tar
formed, but also the composition of tar by influencing the chemical reactions involved in the
whole gasification network. At gasification temperatures greater than 1200o-1300oC, little higher
hydrocarbons or tar is formed, and H2 and CO production is maximised without requiring a
further conversion step [36].
It should be noted that this temeparture range (1200o-1300oC) is the one obtained through
energy generated by partial combustion of feedstock and/or through indirectly heating the reactor.
The most common case is to use cold air/steam as feed gas gasification process. As referred
above, high temperature in this case is that above the demarcation given in the literature as being
about 700-750oC [38]. This demarcation is related to the operating temperature, or equivalently,
according to the physical state in which the majority of the inorganic and organic chemicals in the
feedstock leave the gasifier. This operating temperature has direct effect on the heating rates of the
feedstocks which greatly determines the fuel gas quality and product distribution of the
gasification process. Usually, high temperature gasification is achieved either performing
improvements on the reactor design [43-46], which could also include the heat recovering from
the exhaust gas to preheat combustion air, or with the aid of gasyfing material such as gas or steam
using elevated temperatures [1]. Because the sensible heat of air has positive impact on the
gasification temperature, with resulting rapid devolatitisation process used to enhance the volitile
yields from the the feedstock while improving gasification efficiency. Air preheated to 1000oC and
higher, has since recently being used to convert coal and different kinds of waste-derived fuels into
synthetic fuel gas and value-added byproducts [1, 15].
Some demonstrated and commercialized gasifiers have been operating in gasification
temperatures less than 1000oC with cold or slightly preheated gasifying agent [36,72,73,77,83]. The
Tampella BFB gasifier has been operated at temperatures approaching this range (950oC). In
Switzerland, a commercial 200 kWe Pyroforce downdraft gasifier with a Jenabacher engine which
was reportedly to be commissioned in the middle of year 2000 was previously tested with wood
24
demolition. It operates with high temperature (1200-1300oC at the oxidation zone) and a dry gas
clean up system [73].
Commercial applications of gasification technogies has been assisted by an extensive
research and development activities carried out primarly to improve conversion efficiencies,
maximising the fuel gas production through the understanding of the mechanisms and techniques
for tar formation and destruction. During sawdust gasification in a fixed bed gasifier [84] it has
been observed that the total number of detectable tar species decreased with increasing gasifier
bed temperature. Oxygen-containing compounds such as phenol, cresol and benzofuran exist in
significant quantities only at temperature below 800oC. The same study [84] also confirmed that
higher gasifier bed temperature favours the formation of fewer aromatic tar species without
substituent groups such as benzene, naphthalene, phenanthrene, etc. Destruction of these
aromatic hydrocarbons occurs only at temperatures above 850oC. Experiments of birch wood
were performed in a pressurised fluidised bed carrying out oxygen-supported gasification [85].
During this experiment it was observed almost complete reduction of phenol content, a 50%
decrease in toluene content, but a considerable increase in benzene (from 14 to 24 mg/l) and in
naphthalene contents (from 2 to 8 mg/l), when the temperature was raised from 700oC to 900oC.
By changing the bed temperature of the bubbling fluidised bed from 700oC to 850oC [23] it was
observed an increase in H2 content from 5 to 10 vol%, CO content from 12 to 18 vol%, slight
decrease in CO2 content from 16 to 13 vol% and almost no change in the amount of CH4 and
C2H2. This study [23] observed a drastic decrease in tar content (about 74% less); the tar amounts
being 19 g/Nm3 at 700oC and 5 g/Nm3 at 800oC. By increasing gasification temperature in an
atmospheric fluidised bed gasifier from 750 to 950oC holding all other conditions constant (ER =
0.18, SB = 1.4), H2 concentration increased from 31 to 45% (vol, based on dry inert-free gas) [86].
It is also possible to decrease the amount of tar to a considerably lower value by increasing the
freeboard temperature in case of fluidised-bed gasifiers [23,87].
Besides tar, temperature also influences the formation of NH3. The level of this chemical
specie in the product gas largely depends on the thermochemical reactions occurring in the gasifier
and these reactions are directly related with temperature. From experiments performed using a
bench-scale, indirectly heated, fluidised-bed gasifier, with O2 as feed gas and argon (Ar) as tracer
gas [88], it was reported almost 58% decrease in NH3 content when the temperature was raised
from 700oC to 900oC for sawdust gasification. Over the same temperature range, NO and HCN
were also detected, but at a much lower level than NH3. For leucaena gasification, an 80%
25
decrease in NH3 content is reported when the gasifier temperature was increased from 750oC to
900oC. Increases in molecular nitrogen were observed in the product gas which is basically due to
the thermochemical conversion of NH3 [88].
Steam gasification is endothermic and hence sometimes requires complex design for heat
supply in the process. Use of some amount of oxygen in the gasifying medium can provide the
necessary heat for gasification and then the gasifier works as an auto-thermal reactor. In view of
that, many researchers used steam–oxygen mixtures for biomass gasification. Similar to the
equivalence ratio used in biomass gasification with air, a dimensionless gasifiyng ratio (GR) is
defined as the ratio (H2O+O2)/biomass. It has been reported that for low GR values in fluidised
bed gasifier produces light tars which can be easily destroyed using catalyst [89]. Furthermore, this
study reports the results of gasification of biomass with GR range of 0.7 to 1.60, H2O/O2 ratio in
the range 2.0 to 3.0 (mol/mol) and gasifier bed temperature ranging from 625oC to 860oC. The
study shows that tar conversion increases with temperature in this process.
The previous discussion suggests that to achieve a high carbon conversion of the biomass
and low tar content in the resultant product gas, a high operating temperature (above 800oC) in the
gasifier bed is preferred. Furthermore, the consensus seems to be that temperatures in excess of
1000oC, at reasonable residence times, are necessary to destroy the refractory unsubstituted
aromatics, without a catalyst.
If the purpose is to maximise the yield of gaseous products resulting from biomass
gasification, a high temperature, high heating rate, required gas/char residence time process would
be preferred [15]. In the modelling study performed with air it was found that the positive impact
on the gasifier bed temperature and efficiency of gasification of wood is attained with preheating
air [90]. This modelling also showed improvement on the composition of fuel gas with consequent
significant increase of its lower heating value. High temperature gasification technology relies on
the high temperature preheated air technology recently developed [1]. Preheated air was first used
as the gasifying agent in gasifying coal and wastes, since it was already available in the high
temperature combustion system [14,15]. Analysis and tests have demonstrated that high
temperature air gasification has many merits of its own. Many other applications for this advanced
gasification technology have since been identified, from large-scale utility power generation
systems to smaller-scale waste-to-energy operations [15,91-93, see also Suplement I through V].
Several papers have been devoted to the effect of catalysts, gasification temperature and
gasification method (primary and secondary) on the fuel gas quality and the mutual influence of
26
feed gas type and feedstock type. Comparatively little has been published regarding the influence
of preheated single feed gas (air) and preheated mixture of air and steam on the product
distribution during thermal processing. This work deals with the new process in which the feed gas
is preheated outside the gasifier, before being supplied to the gasification reactor. The process is
called High Temperature Air/steam Gasification (HTAG).
27
4. Objectives
General objective of this work is to increase knowledge on a new advanced process of
biomass gasification using highly preheated air and steam.
Specific objectives are to:
• study experimentally a newely designed system consisting of an updraft fixed bed gasifier
supplied with highly preheated air and steam,
• develop tools for mathematical model simulations of this designed system,
• generate information for designing and construction of an updraft continuous gasifier.
These objectives are realized by analysisng the influence of the following input parameters in
the updraft fised bed batch type gasifier:
• feed gas (air or mixture of air and steam) temperature,
• air/steam ratio,
• feed gas volume flow rate,
• type of biomass feedstock,
• biomass feedstock particle size
on the main output parameters which characterise performance of the updraft fixed bed batch
type gasifier. The main output parameters are listed as follows:
• fuel gas composition,
• fuel gas calorific value,
• fuel gas mass flow rate,
• cold gasification efficiency,
• specific fuel gas production rate,
• tar composition.
28
5. Experimental Facility
The experimental facility in this work was developed from early design [94,95]. The new
design feature is presented in the following description.
Batch type, counter-current (updraft) fixed bed gasifier
Fixed-bed gasifier, is a vertical cylindrical reactor, which consists of three sections: a wind
box, the feedstock (fixed bed) section and the third section, where mainly gas reaction take
part before are ducted out of the gasifier.
Afterburning combustion chamber
• The gasifier is close coupled to the afterburning combustion chamber (shortly called
afterburner) to burn completely the produced fuel gas. The afterburner has one inlet for
the fuel gas from the gasifier and one outlet for the flue gas. The afterburner is equipped
with a pilot burner and set of additional air nozzles to heat up the unit prior to the
introduction of the raw fuel gas and to assure complete combustion of the fuel gas
produced. At the outlet of the afterburner, the flue gas duct is equipped with 8 nozzles
automatically activated to supply cold water in order to cool down the hot gases prior to
the be discharged to atmosphere.
• Flue gas fan placed at the outlet of the afterburner covers pressure losses. In this way also
the pressure inside the gasifier is controlled.
Feed gas supply system
• Air blower supplying air into heaters and into the gasifier. There were used two preheaters:
electrical and highly preheated air unit. In all cases the air supply to the gasifier is provided
by fans and is automatically controlled to maintain the operating pressure at the gasifier
outlet.
29
• Electrical heater to preheat air in the lower range of temperatures that is up to 600oC is
connected to a first air supplier system.
• Highly preheated air generator (steam and air enthalpy intensifier) designed to preheat air
or steam or a mixture of both in the higher temperature range that is up to 1300oC [14].
Air supplied to the high temperature preheater (steam and air enthalpy intensifier) made
the second supplier system.
• The third air line was used to supply secondary air to the combustion chamber.
• The fourth air supplier system was used to supply air to the safety burner located in the
combustion chamber
• Finally, the electrical steam boiler was used to produce slightly preheated steam (180oC, 2.5
bar). The boiler is equipped with a water preparation unit.
Measuring equipment
• Temperature measurement was realised by use of different thermocouple types.
• Micro Gas Chromatograph (GC) configured with four independently controlled modules
to measure the fuel gas composition [96].
• Set of flow meters and pressure regulators to control flow rate of air and steam.
• Tar sampling was achieved by SPA method [97].
Data acquisition
Data acquisition system basically made up by a Keithley Multimeter 2701 equipped with
two Multiplexes 7708. Each Multiplexer has 40 channels, which can measure voltage,
resistance or current. That makes easy to connect the multimeter with thermocouples,
30
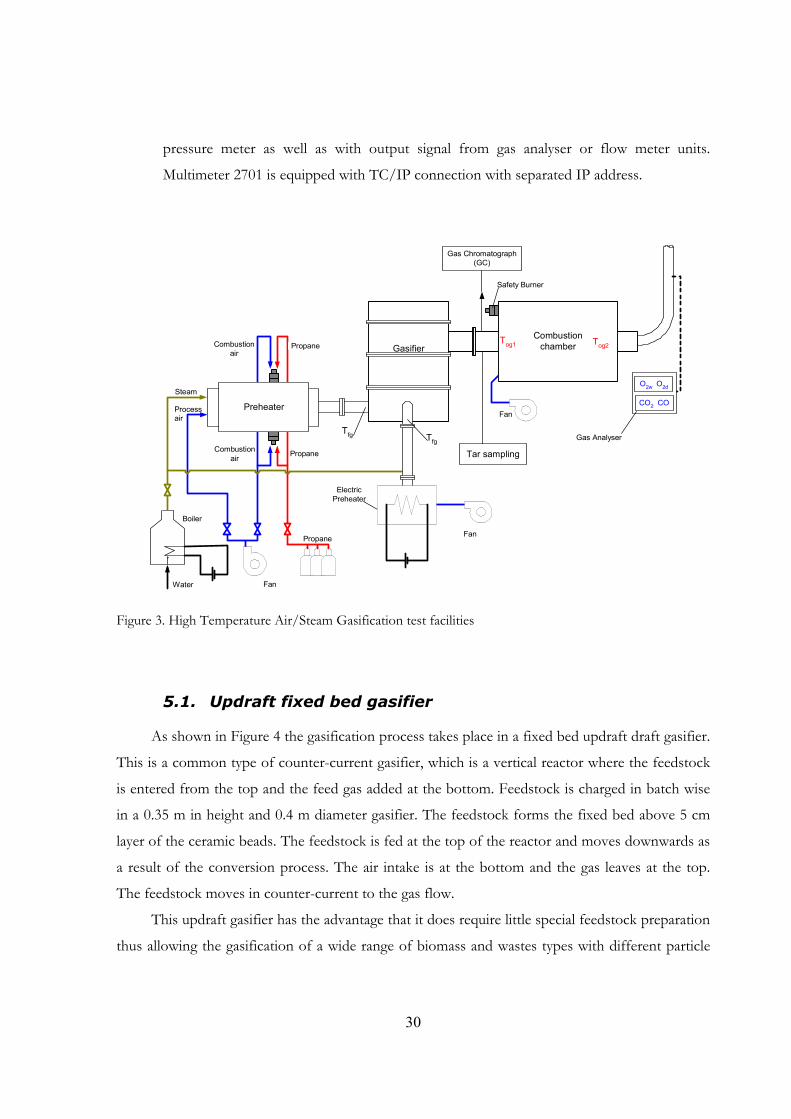
pressure meter as well as with output signal from gas analyser or flow meter units.
Multimeter 2701 is equipped with TC/IP connection with separated IP address.
Preheater
Combustionchamber
Tog1 Tog2
CO2 CO
O2w O2d
Processair
Steam
ElectricPreheater
Safety Burner
Boiler
Propane
Fan
Combustionair
Fan
Fan
Propane
Propane
Gas Chromatograph(GC)
Gas AnalyserCombustion
air
Gasifier
Water
Tar sampling
Tfg Tfg
Figure 3. High Temperature Air/Steam Gasification test facilities
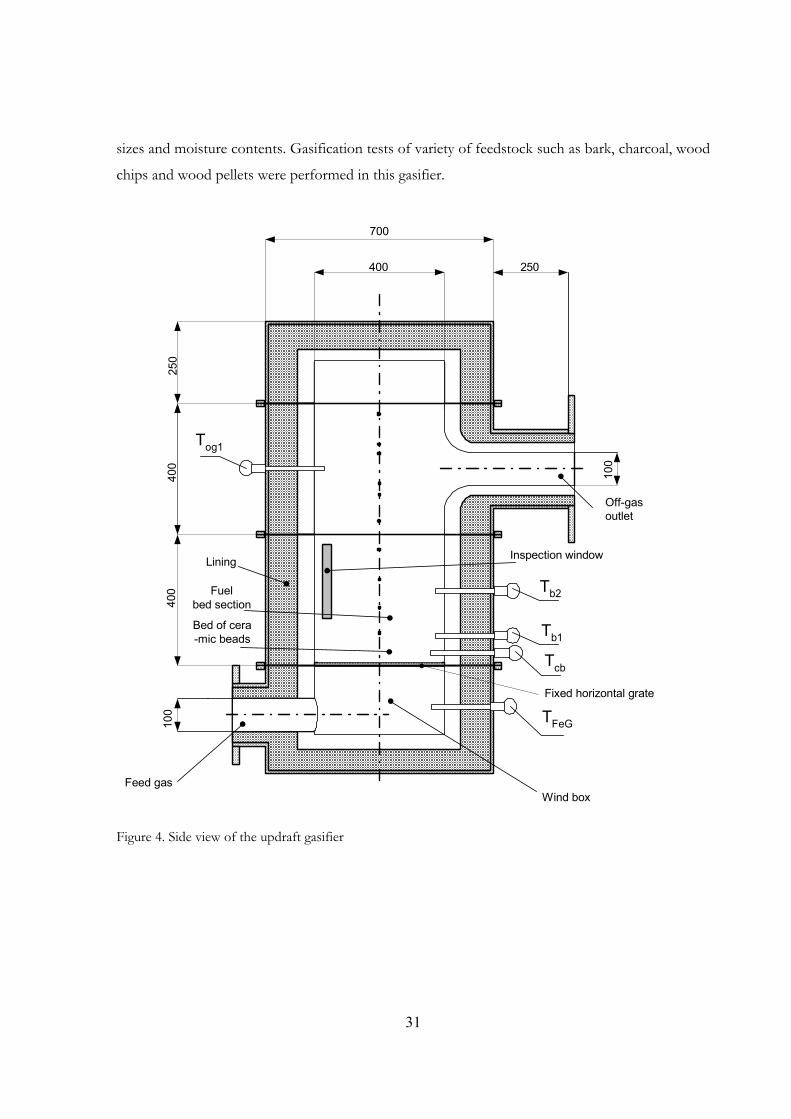
5.1. Updraft fixed bed gasifier
As shown in Figure 4 the gasification process takes place in a fixed bed updraft draft gasifier.
This is a common type of counter-current gasifier, which is a vertical reactor where the feedstock
is entered from the top and the feed gas added at the bottom. Feedstock is charged in batch wise
in a 0.35 m in height and 0.4 m diameter gasifier. The feedstock forms the fixed bed above 5 cm
layer of the ceramic beads. The feedstock is fed at the top of the reactor and moves downwards as
a result of the conversion process. The air intake is at the bottom and the gas leaves at the top.
The feedstock moves in counter-current to the gas flow.
This updraft gasifier has the advantage that it does require little special feedstock preparation
thus allowing the gasification of a wide range of biomass and wastes types with different particle
31
sizes and moisture contents. Gasification tests of variety of feedstock such as bark, charcoal, wood
chips and wood pellets were performed in this gasifier.
Bed of cera-mic beads
400
700
100
250
250
400
400
100
Wind boxFeed gas
Off-gasoutlet
Inspection window
Fixed horizontal grate
Fuelbed section
Lining
TFeG
Tb1
Tb2
Tcb
Tog1
Figure 4. Side view of the updraft gasifier
32
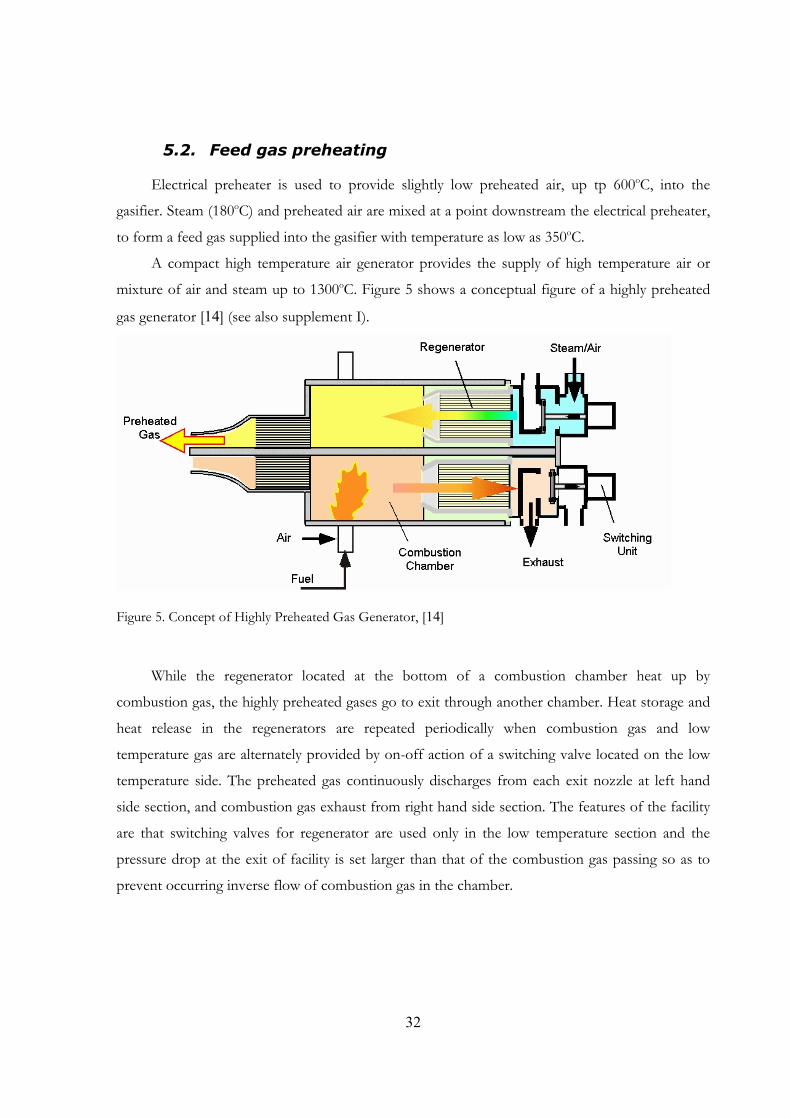
5.2. Feed gas preheating
Electrical preheater is used to provide slightly low preheated air, up tp 600oC, into the
gasifier. Steam (180oC) and preheated air are mixed at a point downstream the electrical preheater,
to form a feed gas supplied into the gasifier with temperature as low as 350oC.
A compact high temperature air generator provides the supply of high temperature air or
mixture of air and steam up to 1300oC. Figure 5 shows a conceptual figure of a highly preheated
gas generator [14] (see also supplement I).
Figure 5. Concept of Highly Preheated Gas Generator, [14]
While the regenerator located at the bottom of a combustion chamber heat up by
combustion gas, the highly preheated gases go to exit through another chamber. Heat storage and
heat release in the regenerators are repeated periodically when combustion gas and low
temperature gas are alternately provided by on-off action of a switching valve located on the low
temperature side. The preheated gas continuously discharges from each exit nozzle at left hand
side section, and combustion gas exhaust from right hand side section. The features of the facility
are that switching valves for regenerator are used only in the low temperature section and the
pressure drop at the exit of facility is set larger than that of the combustion gas passing so as to
prevent occurring inverse flow of combustion gas in the chamber.
33
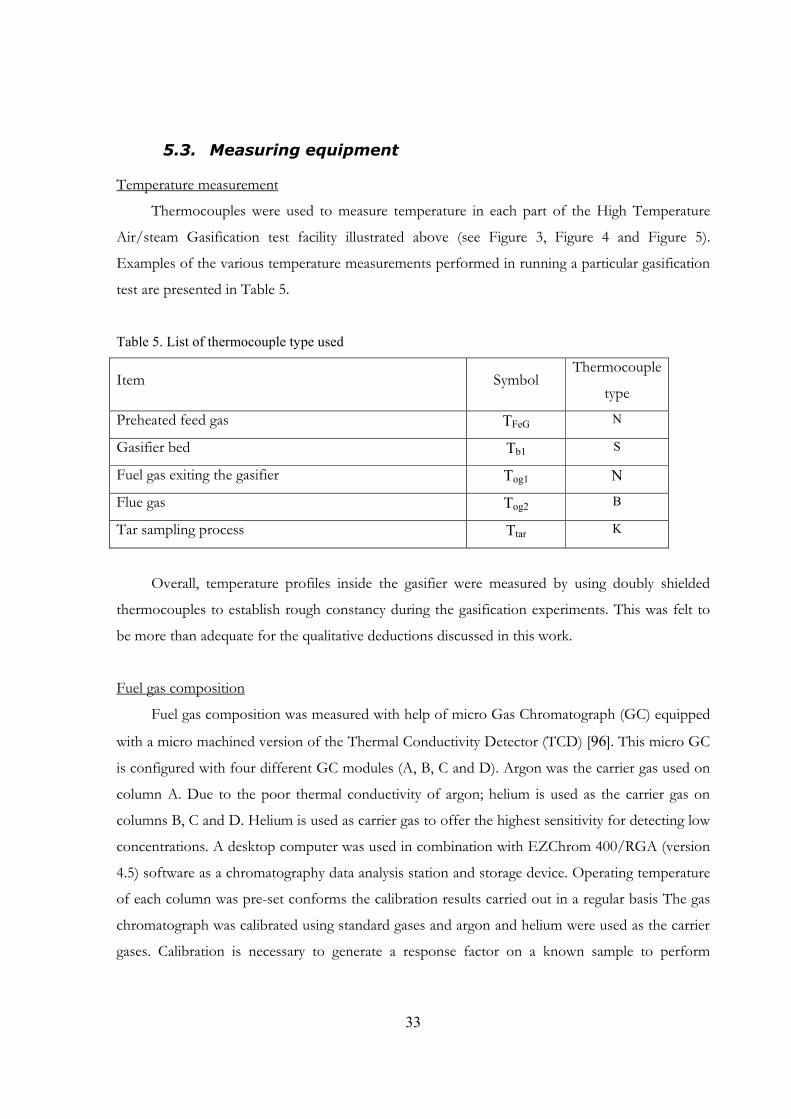
5.3. Measuring equipment
Temperature measurement
Thermocouples were used to measure temperature in each part of the High Temperature
Air/steam Gasification test facility illustrated above (see Figure 3, Figure 4 and Figure 5).
Examples of the various temperature measurements performed in running a particular gasification
test are presented in Table 5.
Table 5. List of thermocouple type used
Item Symbol Thermocouple
type
Preheated feed gas TFeG N
Gasifier bed Tb1 S
Fuel gas exiting the gasifier Tog1 N
Flue gas Tog2 B
Tar sampling process Ttar K
Overall, temperature profiles inside the gasifier were measured by using doubly shielded
thermocouples to establish rough constancy during the gasification experiments. This was felt to
be more than adequate for the qualitative deductions discussed in this work.
Fuel gas composition
Fuel gas composition was measured with help of micro Gas Chromatograph (GC) equipped
with a micro machined version of the Thermal Conductivity Detector (TCD) [96]. This micro GC
is configured with four different GC modules (A, B, C and D). Argon was the carrier gas used on
column A. Due to the poor thermal conductivity of argon; helium is used as the carrier gas on
columns B, C and D. Helium is used as carrier gas to offer the highest sensitivity for detecting low
concentrations. A desktop computer was used in combination with EZChrom 400/RGA (version
4.5) software as a chromatography data analysis station and storage device. Operating temperature
of each column was pre-set conforms the calibration results carried out in a regular basis The gas
chromatograph was calibrated using standard gases and argon and helium were used as the carrier
gases. Calibration is necessary to generate a response factor on a known sample to perform
34
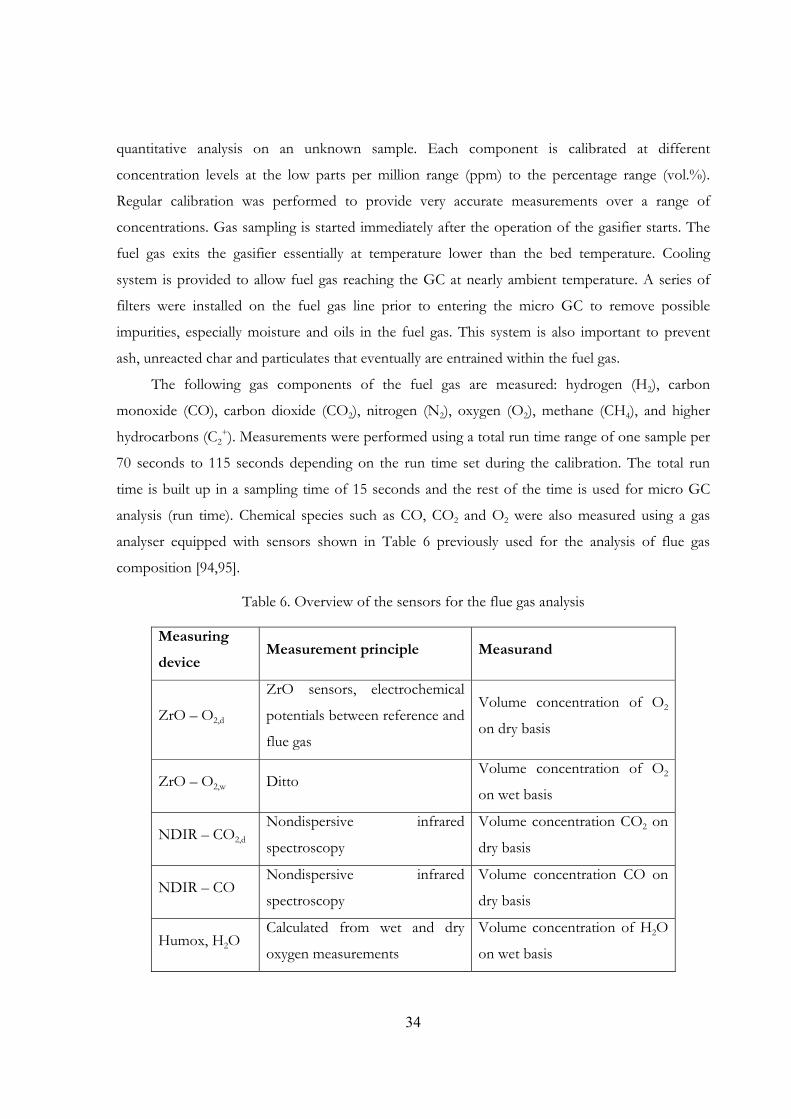
quantitative analysis on an unknown sample. Each component is calibrated at different
concentration levels at the low parts per million range (ppm) to the percentage range (vol.%).
Regular calibration was performed to provide very accurate measurements over a range of
concentrations. Gas sampling is started immediately after the operation of the gasifier starts. The
fuel gas exits the gasifier essentially at temperature lower than the bed temperature. Cooling
system is provided to allow fuel gas reaching the GC at nearly ambient temperature. A series of
filters were installed on the fuel gas line prior to entering the micro GC to remove possible
impurities, especially moisture and oils in the fuel gas. This system is also important to prevent
ash, unreacted char and particulates that eventually are entrained within the fuel gas.
The following gas components of the fuel gas are measured: hydrogen (H2), carbon
monoxide (CO), carbon dioxide (CO2), nitrogen (N2), oxygen (O2), methane (CH4), and higher
hydrocarbons (C2+). Measurements were performed using a total run time range of one sample per
70 seconds to 115 seconds depending on the run time set during the calibration. The total run
time is built up in a sampling time of 15 seconds and the rest of the time is used for micro GC
analysis (run time). Chemical species such as CO, CO2 and O2 were also measured using a gas
analyser equipped with sensors shown in Table 6 previously used for the analysis of flue gas
composition [94,95].
Table 6. Overview of the sensors for the flue gas analysis
Measuring
device Measurement principle Measurand
ZrO – O2,d
ZrO sensors, electrochemical
potentials between reference and
flue gas
Volume concentration of O2
on dry basis
ZrO – O2,w Ditto Volume concentration of O2
on wet basis
NDIR – CO2,d Nondispersive infrared
spectroscopy
Volume concentration CO2 on
dry basis
NDIR – CO Nondispersive infrared
spectroscopy
Volume concentration CO on
dry basis
Humox, H2O Calculated from wet and dry
oxygen measurements
Volume concentration of H2O
on wet basis

35
Tar sampling and analysis
A number of different sampling and analysis methods have been used by manufacturers and
other workers in gasification field to determine the level of particulates and organic contaminants
in the fuel gas. In this work, sampling and analysis of tars was achieved, using the solid-phase
adsorption (SPA) method. This method is suitable for intermittent trapping of tar compounds
ranging from benzene to coronene prevailing in product gases from thermal decomposition of
biomass at 700-1000oC [85, 97, 98]. The detected and quantified constituents of the wood pellets
tar studied in this work are listed in Table 7.
Table 7. Tar compounds determined via solid phase adsorption technique (SPA)
Neutral fraction Polar fraction
Benzene
Toluene
m-/p-Xylene
o-Xylene
Indane
Indene
Naphtalene
2-Methylnaphtalene
1-Methylnaphtalene
Biphenyl
Acenaphtene
Acenaphtylene
Fluorene
Phenanthene
Anthracene
Flouranthrene
Pyrene
Unknown neutral fraction
Phenol
o-Cresol
m-Cresol
p-Cresol
2,4-Xylenol
o-Ethylphenol
2,5-/3,5-Xylenol
2,6-Xylenol
2,3-Xylenol
3,4-Xylenol
Unknown polar fraction
The SPA method used to determine chemical compounds in biomass tars allows providing
laboratory analysis protocol in two fractions, polar fraction and neutral fraction, being in the later
one that benzene is reported. For better illustration of the changes in the distribution of tar
36
constituents in the biomass feedstocks, the classification of chemical compounds in biomass tar
suggested in the literature [41] is also used in discussing the tar evolution.
Briefly, the SPA sampling set-up consists of a sorbent tube connected to a syringe needle
and a 100 ml gas tight syringe (plastic). Samples were collected via a glass tee fitted with a septum
and connected to the exhaust pipe by means of two pieces of silicone tubing. To prevent
condensation of target analytes, the tee was maintained at 250-300oC during the entire sampling
period. A 100 ml sample was withdrawn from the exhaust via the septum in about 1 min by
pulling the syringe at an even pace. The sorbent tube was then sealed at both ends with stoppers
to prevent contamination and analytes loss prior to analysis. The analysis starts with the tar vapour
trapped on to a solid sorbet being desorbed with two different effluents, which makes it possible
to separate the tar component into an aromatic and a phenolic fraction. The final analyses are
made with a gas chromatograph equipped with a flame ionisation detector. Nearly every two
minutes during the experiments a new tar sample was taken. In an attempt to correlate tar amount
and gas composition, this sampling time was set to coincide with sampling time of the microGC.
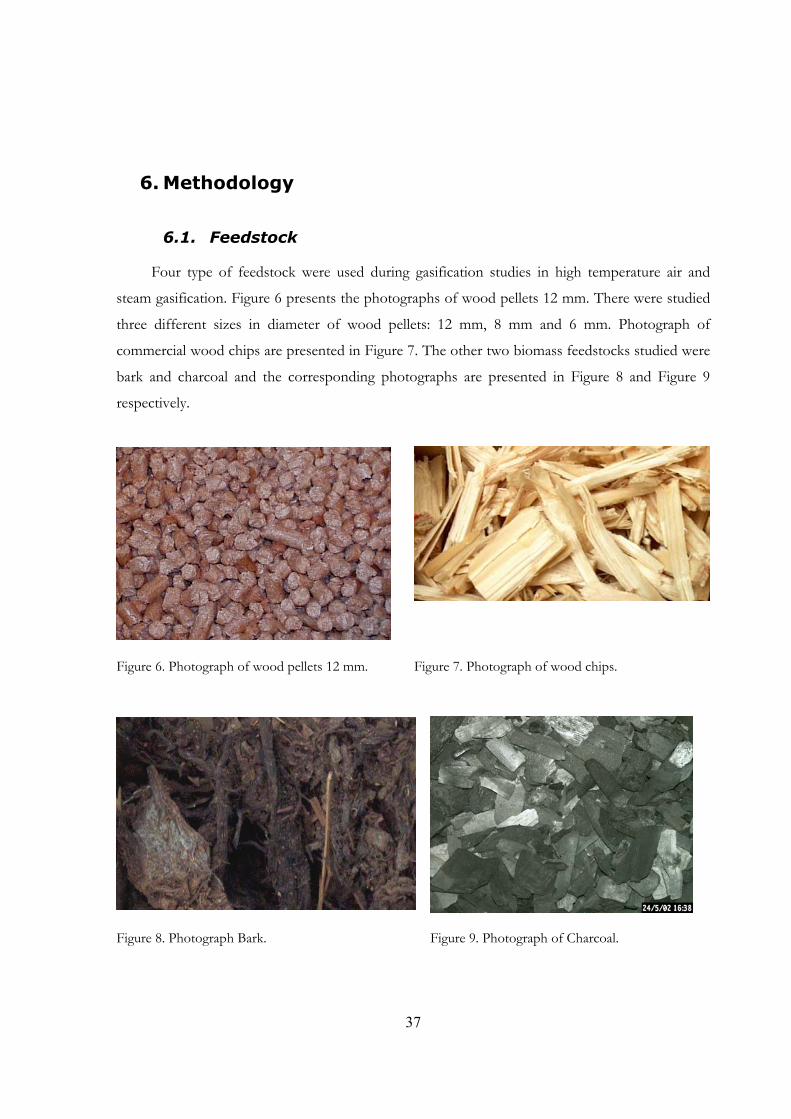
37
6. Methodology
6.1. Feedstock
Four type of feedstock were used during gasification studies in high temperature air and
steam gasification. Figure 6 presents the photographs of wood pellets 12 mm. There were studied
three different sizes in diameter of wood pellets: 12 mm, 8 mm and 6 mm. Photograph of
commercial wood chips are presented in Figure 7. The other two biomass feedstocks studied were
bark and charcoal and the corresponding photographs are presented in Figure 8 and Figure 9
respectively.
Figure 6. Photograph of wood pellets 12 mm. Figure 7. Photograph of wood chips.
Figure 8. Photograph Bark. Figure 9. Photograph of Charcoal.
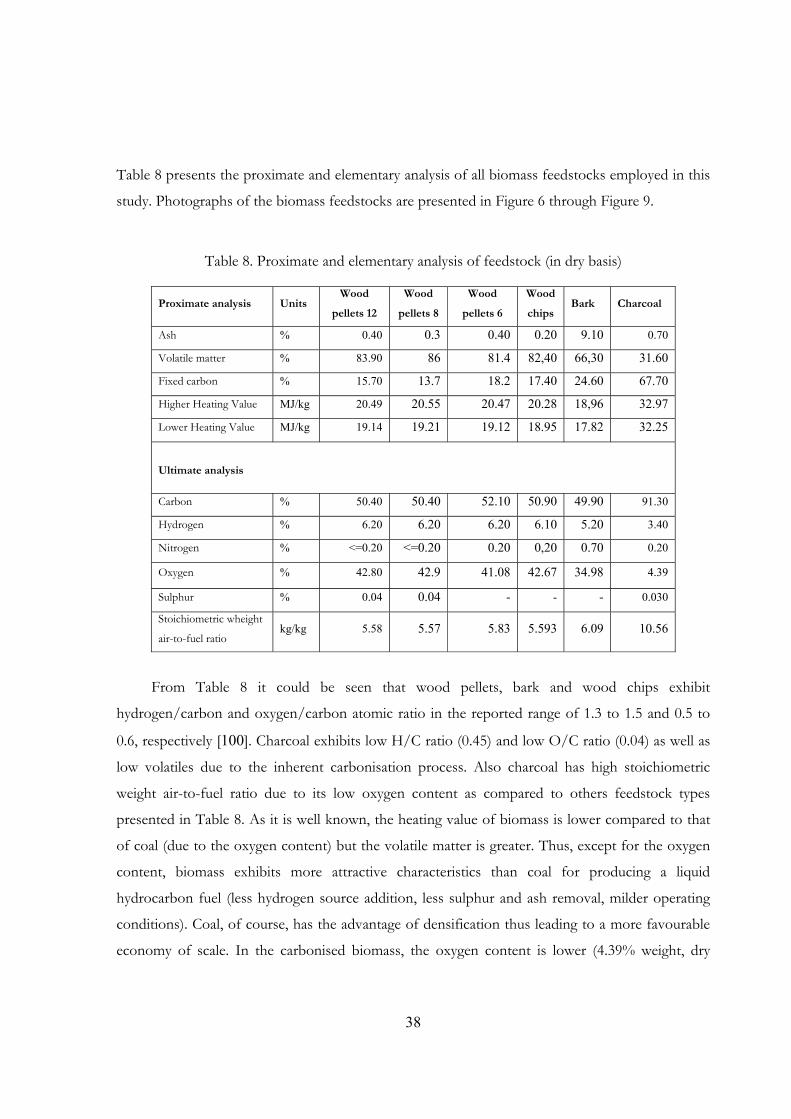
38
Table 8 presents the proximate and elementary analysis of all biomass feedstocks employed in this
study. Photographs of the biomass feedstocks are presented in Figure 6 through Figure 9.
Table 8. Proximate and elementary analysis of feedstock (in dry basis)
Proximate analysis Units Wood
pellets 12
Wood
pellets 8
Wood
pellets 6
Wood
chips Bark Charcoal
Ash % 0.40 0.3 0.40 0.20 9.10 0.70
Volatile matter % 83.90 86 81.4 82,40 66,30 31.60
Fixed carbon % 15.70 13.7 18.2 17.40 24.60 67.70
Higher Heating Value MJ/kg 20.49 20.55 20.47 20.28 18,96 32.97
Lower Heating Value MJ/kg 19.14 19.21 19.12 18.95 17.82 32.25
Ultimate analysis
Carbon % 50.40 50.40 52.10 50.90 49.90 91.30
Hydrogen % 6.20 6.20 6.20 6.10 5.20 3.40
Nitrogen % <=0.20 <=0.20 0.20 0,20 0.70 0.20
Oxygen % 42.80 42.9 41.08 42.67 34.98 4.39
Sulphur % 0.04 0.04 - - - 0.030
Stoichiometric wheight
air-to-fuel ratio kg/kg 5.58 5.57 5.83 5.593 6.09 10.56
From Table 8 it could be seen that wood pellets, bark and wood chips exhibit
hydrogen/carbon and oxygen/carbon atomic ratio in the reported range of 1.3 to 1.5 and 0.5 to
0.6, respectively [100]. Charcoal exhibits low H/C ratio (0.45) and low O/C ratio (0.04) as well as
low volatiles due to the inherent carbonisation process. Also charcoal has high stoichiometric
weight air-to-fuel ratio due to its low oxygen content as compared to others feedstock types
presented in Table 8. As it is well known, the heating value of biomass is lower compared to that
of coal (due to the oxygen content) but the volatile matter is greater. Thus, except for the oxygen
content, biomass exhibits more attractive characteristics than coal for producing a liquid
hydrocarbon fuel (less hydrogen source addition, less sulphur and ash removal, milder operating
conditions). Coal, of course, has the advantage of densification thus leading to a more favourable
economy of scale. In the carbonised biomass, the oxygen content is lower (4.39% weight, dry

39
basis, versus 42-45% pellets/wood chips and 35% bark). Consequently the lower heating value is
also higher (33 MJ/kg versus 20 MJ/kg for wood pellets/wood chips and 17.8 MJ/kg for bark).
Its volatile matter content is lower (31.6% weight), followed by that of the bark (66.3%). The later
exhibits the highest content of inorganic material (9.1% weight), nitrogen content (0.7% weight)
and the lowest lower heating value (17.82 MJ/kg). The characteristics of wood pellets 12 mm, 10
mm and 8 mm are very similar, while the carbon content is higher for wood pellets 6 mm and
lower for wood chips and bark. Charcoal, obviously exhibits the highest carbon content (91.3%
weight) of all biomass feedstock studied.
6.2. Experimental procedure
Numerous initial experiments were performed to set up the operating conditions for the
high air and steam gasification (HTAG) experiments. The main operating parameters studied in
this part of the work were preheating temperature, mass of charge and volume flow rate of the
feed gas. The second part of study was carried out with low and high temperature air and steam
gasification. The HTAG experiments constituted the major part of experimental work conducted
in this research study. All experiments were carried out in the same updraft fixed bed gasifier.
Start-up of the gasifier includes all operations required until a steady state, whereby the pre-
set feed gas temperature is stable. Pre-weighed batches of feedstock are loaded into the bed
material. The mass of charge is indicated in Table 9, and depending on the feedstock used, is
chosen so that the initial height of the bed was about 0.35 m. Mass of charge depended of the
feedstock: 20 kg for wood pellets (for all sizes like 6 mm, 8 mm and 12 mm), 6 kg for charcoal
[99], 5 kg for bark [99] and 7 kg for wood chips [99].
Data recording of measured parameters such as temperatures and on-line gas sampling and
analysis by micro gas chromatograph, was initiated before the loading procedure, while tar
sampling was carried out just after closing the gasifier.
The feedstock type has influence on the experiments particularly on determining appropriate
ignition criteria [101,102]. In this work feed gas was preheated and thus the inlet feed gas
temperature could exceed the ignition temperature. Preheating of feed gas favoured higher heat
flux inside the gasifier as a result of lengthy inner wall gasifier warm up prior to the feedstock
loading procedure.
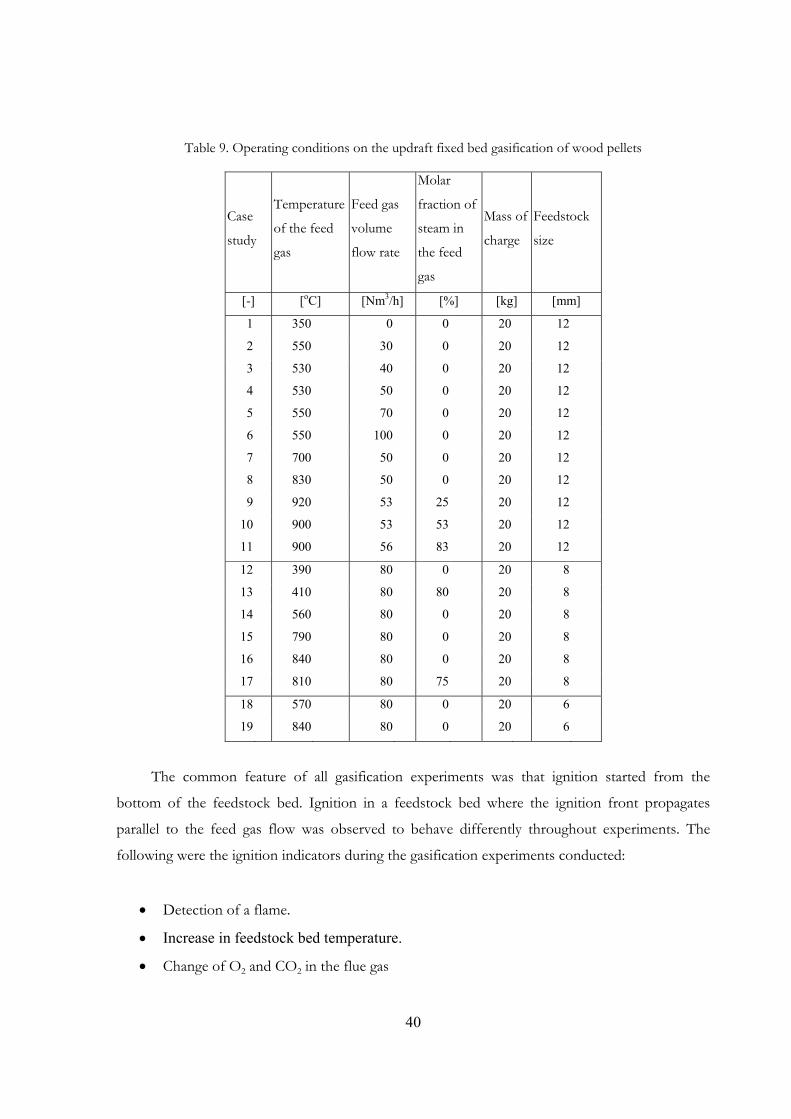
40
Table 9. Operating conditions on the updraft fixed bed gasification of wood pellets
Case
study
Temperature
of the feed
gas
Feed gas
volume
flow rate
Molar
fraction of
steam in
the feed
gas
Mass of
charge
Feedstock
size
[-] [oC] [Nm3/h] [%] [kg] [mm]
1 350 0 0 20 12
2 550 30 0 20 12
3 530 40 0 20 12
4 530 50 0 20 12
5 550 70 0 20 12
6 550 100 0 20 12
7 700 50 0 20 12
8 830 50 0 20 12
9 920 53 25 20 12
10 900 53 53 20 12
11 900 56 83 20 12
12 390 80 0 20 8
13 410 80 80 20 8
14 560 80 0 20 8
15 790 80 0 20 8
16 840 80 0 20 8
17 810 80 75 20 8
18 570 80 0 20 6
19 840 80 0 20 6
The common feature of all gasification experiments was that ignition started from the
bottom of the feedstock bed. Ignition in a feedstock bed where the ignition front propagates
parallel to the feed gas flow was observed to behave differently throughout experiments. The
following were the ignition indicators during the gasification experiments conducted:
• Detection of a flame.
• Increase in feedstock bed temperature.
• Change of O2 and CO2 in the flue gas
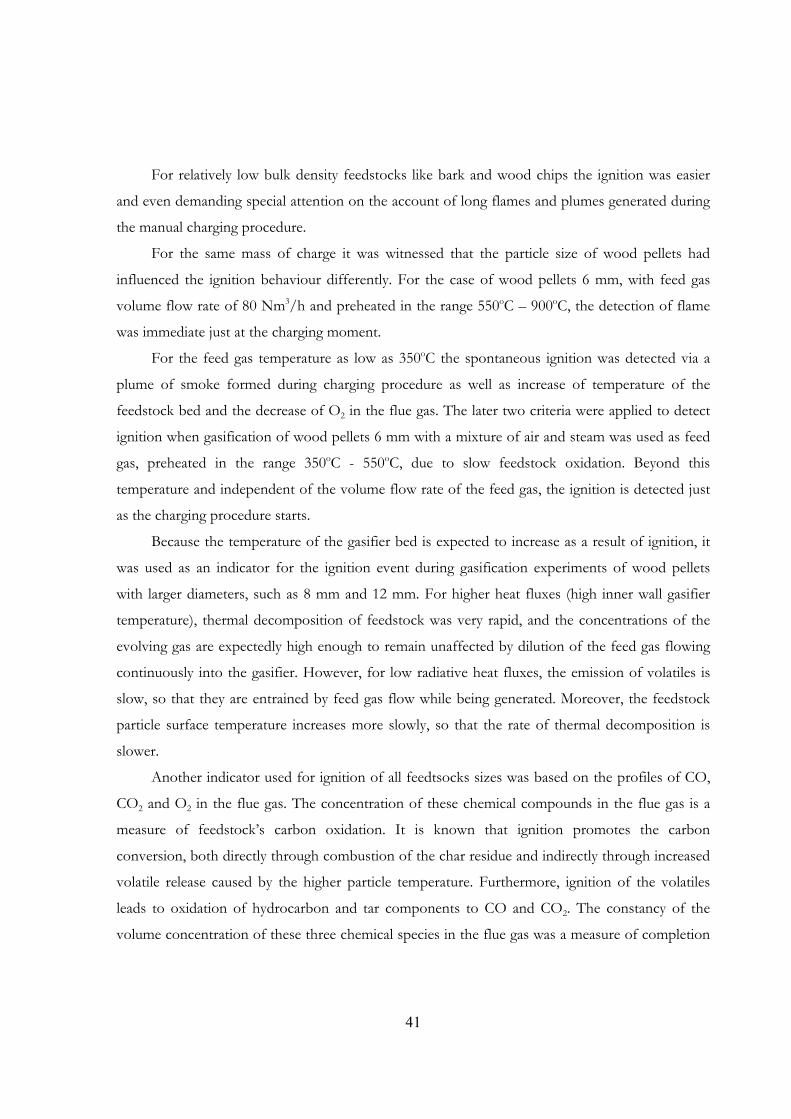
41
For relatively low bulk density feedstocks like bark and wood chips the ignition was easier
and even demanding special attention on the account of long flames and plumes generated during
the manual charging procedure.
For the same mass of charge it was witnessed that the particle size of wood pellets had
influenced the ignition behaviour differently. For the case of wood pellets 6 mm, with feed gas
volume flow rate of 80 Nm3/h and preheated in the range 550oC – 900oC, the detection of flame
was immediate just at the charging moment.
For the feed gas temperature as low as 350oC the spontaneous ignition was detected via a
plume of smoke formed during charging procedure as well as increase of temperature of the
feedstock bed and the decrease of O2 in the flue gas. The later two criteria were applied to detect
ignition when gasification of wood pellets 6 mm with a mixture of air and steam was used as feed
gas, preheated in the range 350oC - 550oC, due to slow feedstock oxidation. Beyond this
temperature and independent of the volume flow rate of the feed gas, the ignition is detected just
as the charging procedure starts.
Because the temperature of the gasifier bed is expected to increase as a result of ignition, it
was used as an indicator for the ignition event during gasification experiments of wood pellets
with larger diameters, such as 8 mm and 12 mm. For higher heat fluxes (high inner wall gasifier
temperature), thermal decomposition of feedstock was very rapid, and the concentrations of the
evolving gas are expectedly high enough to remain unaffected by dilution of the feed gas flowing
continuously into the gasifier. However, for low radiative heat fluxes, the emission of volatiles is
slow, so that they are entrained by feed gas flow while being generated. Moreover, the feedstock
particle surface temperature increases more slowly, so that the rate of thermal decomposition is
slower.
Another indicator used for ignition of all feedtsocks sizes was based on the profiles of CO,
CO2 and O2 in the flue gas. The concentration of these chemical compounds in the flue gas is a
measure of feedstock’s carbon oxidation. It is known that ignition promotes the carbon
conversion, both directly through combustion of the char residue and indirectly through increased
volatile release caused by the higher particle temperature. Furthermore, ignition of the volatiles
leads to oxidation of hydrocarbon and tar components to CO and CO2. The constancy of the
volume concentration of these three chemical species in the flue gas was a measure of completion
42
of the combustion of the remaining charcoal inside the gasifier and thus experiment considered
completed.
Shutdown procedure includes all the actions to safely seal the gasifier. Steam boiler, heat up
process of the feed gas preheater are stopped in an orderly sequence with the 150 kW safety
burner on the afterburner remaining on using a propane gas until no combustible gas is produced.
Shut down of all fans is the last procedure following cooling of feed gas preheater and of the
gasifier. After the reactor cooled down, the top section of the gasifier was opened so that all ash
was carefully removed followed by visual observation and recording by photo camera.
43
7. Raw Data Evaluation
7.1. Calculation procedure
Based on measured flow rates, mass of charge, temperatures, fuel gas composition and tar
composition, as well as on the the following factors that determine the performance of the gasifier
were calculated:
- Mass flow rates of species and fuel gas, m& [kg/h]
- Cold gasification efficiency, η.
- Specific gas production rate, εMAX, [kg/m2h]
- Gas yield, [-]
- Lower Heating Value of fuel gas, LHV, [MJ/Nm3]
Calculation of Fuel Gas Flow Rate
Fuel gas flow rate is one important parameter, which describes gasification process and is
used to describe other parameters like mass flow of the fuel gas species. Information about mass
flow of each species is required to make mass balance and energy balance of gasifier. With the
absence of equipment to measure directly the fuel gas flow rate, it was decided to perform
calutations based on the nitrogen balance. The mass balance of nitrogen for the gasifier is given by
equation (Eq. 16). The mass flow rate of nitrogen in the dry fuel gas DFGNm __2& is equal to the sum
of mass flow rate of nitrogen in the feed gas DFeGNm __2& and mass flow rate of nitrogen from
biomass WFNm _2& .
WFNDFeGNDFGN mmm _2__2__2 &&& += (Eq. 16)
Wood pellets has a mass fraction of nitrogen less than 0.2% therefore it is possible to
assume 0_2 ≈WFNm& , which reduces equation (Eq. 16) to equation (Eq. 17)
DFeGNDFGN mm __2__2 && = (Eq. 17)

44
Nitrogen mass flow rate in dry fuel gas is given by equation (Eq. 18) where DFGNg __2 is
mass fraction of nitrogen in dry fuel gas, calculated as DFG
NDFGNDFGN M
Mxg
_
2__2__2 = . Average
molar mass of dry fuel gas is calculated from equation (Eq. 19) where N is number of all species.
( )∑=
=N
iiDFGiDFG MxM
1___ (Eq. 18)
Molar fraction of nitrogen in dry fuel gas DFGNx __2 is measured via GC than is possible to
solve mass flow rate of nitrogen in dry fuel gas.
DFGDFGNDFGN mgm ___2__2 && = (Eq. 19)
Finally mass flow of fuel gas is given by equation (Eq. 20)
DFGN
DFeGNDFG g
mm
__2
__2_
&& = (Eq. 20)
Species Mass Flow Rate
Mass flow rate of each species DFGim __& in dry fuel gas DFGm _& is given by equation (Eq. 21).
DFGDFGiDFGi mgm _____ && = (Eq. 21)
where DFGig __ is mass fraction of species in dry fuel gas.
Carbon Mass Flow Rate
Mass flow rate of carbon in dry fuel gas, taken from biomass, DFGWFCm ___& , can be given by
equation (Eq. 22). This is difference of mass flow rate of carbon in dry fuel gas DFGCm __& and
mass flow of carbon in dry feed gas DFeGCm __&
DFeGCDFGCDFGWFC mmm _______ &&& −= (Eq. 22)
Mass flow rate of carbon in dry fuel gas can be directly calculated from equation (Eq. 23).
45
∑=
=N
i i
DFGiiCDFGC M
mcMm
1
____
&& (Eq. 23)
Where iC is number of atoms of carbon in molecule for example for CH4 this factor is
14 =CHC , if species do not contain carbon like nitrogen this factor is equal 0.
Mass flow of carbon in feed gas is defined by equation (Eq. 24) and it is equal to mass flow of
carbon dioxide in feed gas.
2_2__
CO
CDFeGCODFeGC M
Mmgm =& (Eq. 24)
Total mass flow of carbon from waste fuel is sum of carbon, which is in the dry fuel gas and
rest that is tar, soot and other species, which are in normal pressure and temperature (Eq. 25).
RESTWFCDFGWFCWFC mmm ______ &&& += (Eq. 25)
It is very difficult to measure on line the mass flow rate of tar, soot and other species, which
include carbon but do not exist in fuel gas. It is possible to integrate mass flow rate as function of
time. Then the mass calculate as following:
ττττ dmdmmE
B
E
B
t
tDFeGC
t
tDFGCDFGWFC ∫∫ −= )()( _______ && (Eq. 26)
On the other hand, total mass of carbon in biomass is given from total mass of biomass and
mass fraction of carbon in biomass. Therefore it is possible to describe the mass of carbon, which
build tar, soot and species. This is written by the following equation
DFGWFCWFCRESTWFC mmm ______ −= (Eq. 27)
Definition of yield better describes the process, as this factor is independent of the initial
total mass of biomass, as following,
WFC
DFGWFCTCSC m
m
_
___/ =η (Eq. 28)
Oxygen Mass Flow Rate
Mass flow rate of oxygen in dry fuel gas, which is taken from biomass, FGWFOm __& can be
given by equation (Eq. 29). This is difference of mass flow rate of oxygen in dry fuel gas DFGOm __&
and mass flow of oxygen in dry feed gas DFeGOm __&
46
DFeGODFGOFGWFO mmm ______ &&& −= (Eq. 29)
Mass flow rate of oxygen in dry fuel gas can be directly calculated from equation (Eq. 30).
∑=
=N
i i
DFGiiODFGO M
mOMm
1
____
&& (Eq. 30)
Where iO is number of atoms of oxygen in molecule for example for CO this factor is
1=COC , if species do not contain oxygen like nitrogen this factor is equal 0.
Mass flow of atomic oxygen in feed gas is defined by equation (Eq. 31) and it is equal to mass flow
of oxygen in feed gas.
2_2__
O
ODFeGODFeGO M
Mmgm =& (Eq. 31)
Finally total mass of atomic oxygen in fuel gas from waste fuel is written by equation (Eq.
32)
ττττ dmdmmE
B
E
B
t
tDFeGO
t
tDFGODFGWFO ∫∫ −= )()( _______ && (Eq. 32)
Similarly, carbon balance factor for atomic oxygen is defined by equations (Eq. 33)
WFO
DFGWFOTOSO m
m
_
___/ =η (Eq. 33)
Hydrogen Mass Flow Rate
As for oxygen factor, atomic hydrogen factor is written by equation (Eq. 34). Calculation of
mass flow rate of hydrogen in dry fuel gas followed the same procedure like in carbon and oxygen
calculation.
WFH
DFGWFHTHSH m
m
_
___/ =η (Eq. 34)
Total Mass of Waste Fuel in the Dry Fuel Gas
Summation of atomic mass of carbon, oxygen and hydrogen in the dry fuel gas gives
information about the total mass conversion factor, which is defined as follows:
WFHWFOWFC
DFGWFHDFGWFODFGWFCTMSM mmm
mmm
___
_________/ ++
++=η (Eq. 35)
47
Fuel gas consists of nitrogen, oxygen, hydrogen, carbon monoxide, carbon dioxide and
hydrocarbons. Therefore the total mass of carbon, oxygen and hydrogen can be calculated from
difference between mass flow rate of the dry fuel gas and the mass flow rate of the dry feed gas.
ττττ dmdmmE
B
E
B
t
tDFeG
t
tDFGDFGWF ∫∫ −= )()( ____ && (Eq. 36)
Thus, the total mass conversion factor can be expressed as follows:
WFHWFOWFC
DFGWFTMTSMT mmm
m
___
__/ ++
=η (Eq. 37)
Cold Gasification Efficiency
Total energy of fuel gas can be calculated from equation (Eq. 38)
τττ dLCVmQE
B
t
tDFGDFG )()(__ ∫= & (Eq. 38)
Total energy of biomass waste can be calculated as follows:
WFWFWF LCVmQ = (Eq. 39)
The ratio between chemical enthalpy of the fuel gas and the feedstock gives information
about efficiency of the conversion from the solid feedstock into the fuel gas. Then the cold
gasification efficiency is defined as follows:
WF
DFGCGE Q
Q _=η (Eq. 40)
Specific gas Production Rate
Gasification rate is defined by equation (Eq. 41) i.e., maximum flow rate of dry fuel gas
)(,_ MAXDFGm& divided by cross section of the gasifier A .
Am MAXDFG
MAX)(,_&
=ε (Eq. 41)
Energy of Feed Gas in Fuel Gas
Energy of feed gas in fuel gas MIMω is defined as ratio between constant energy of feed gas
during the run and maximum energy of fuel gas )(,_ MAXDFGQ& .

48
)(,_
_
MAXDFG
DFeGMIN Q
Q&
&=ω (Eq. 42)
7.2. Error evaluation
Results presented in this work are function of one or more measured quantities perfomed in
each single experiemnt. The accuracy of all measuring devices is normally indicated by the
supplier. For the case of differential pressure sensors, the accuracy comes as an individual
calibration report. In general the maximum deviation is indicated, which may have a systematic
character. Because measured values are used in the computation of new values, the Kline-
McClintock [103] method of determining the uncertainty of computed values was used in this
work. It was assumed that uncertainty is analogous to statistical variance, and then the procedure
similar to combining variances could be used.
If ,...),,( zyxff = , then the maximum uncertainty could be computed as given by Eq. 43.
...+∆+∆+∆=∆ zdzdfy
dydfx
dxdff (Eq. 43)
In general the error propagation law for f, a function of x, y, z,… is given in Eq. 44, which is
the method of computing uncertainties applied for single experiment [103,104] and it is based on a
first order Taylor series approximation of the equation used to compute values. In other words, it
gives independent errors sum quadratic:
...)( 22
22
22
2 +∆
∂∂
+∆
∂∂
+∆
∂∂
=∆ zzfy
yfx
xff (Eq. 44)
The two types of uncertainties could be presented as absolute error or relative error.
Absolute errors have the same dimension as the measured quantity, while relative errors are given
as a fraction of the measured quantity, or as a percentage. A relative error is a dimensionless
number. The maximum uncertainty of the factors of the performance of the gasifier was estimated
to be in the range of 12-18%, but the overall uncertainty was around 5%. The accuracy of
measurements was less than 3%.
49
8. Mathematical Modeling
This work develops an unsteady state model of the HTAG of biomass fuels gasification
process. Heat and mass transfer across the bed are coupled with moisture evaporation, biomass
pyrolysis, char combustion and gasification, gas-phases reactions, and particularly the effect of the
mixing between the volatiles and feed gas on the volatiles consumption is taken into account.
Simulations were performed for the biomass gasification processes using high temperature air in a
fixed bed gasifier. The sensitivity of the process parameters, including the preheating air
temperature, flow rate, and the particle sizes of biomass, are examined.
Feedstock bed is considered as a packed bed is an assembly of individual particles and
consisting of a solid phase (the particles) and of a gas phase (gases flowing through the gaps
between the particles). To account with the complexity of the biomass gasification process,
simplifications were made in modelling a whole bed of such particles. The developed model
describes a reactor consisting in an unsteady state updraft gasifier using high temperature
air/steam as oxidizer. The reactor is charged with biomass fuel that can be considered to consist
of four components: moisture, volatile matter, fixed carbon (char) and ash. During the gasification
process, the moisture and volatiles are removed from the solid matter by drying, pyrolysis and char
fractions are produced by gasification. Mathematical models for each of these processes in the
present model are described as follows.
The model presented in this work is an extension of the FLIC model [105] further
developed elsewhere [106] for a biomass combustion at an incinerator bed. It has therefore been
modified for high temperature air/steam biomass gasification in the updraft fixed bed gasifier
studied.
8.1. Drying
Moisture can be driven out by the mass exchange between the wet solids and hot air coming
through the bed bottom. Over-bed radiation also heats up the waste solids and the moisture is
released as evaporation proceeds. The rate of moisture released from solids can be calculated as:
( )gvswsaev CChKR ,, −= when Ts < 100°C (Eq. 45a)
50
or
ev
aev H
QR = when Ts = 100°C (Eq. 45b)
where Ka is the surface area of solid particles, hs the convective mass transfer coefficient between
solid and gas, swC , is the molar fraction of moisture at the solid surface, gwC , is the molar
fraction of moisture in the air flow, Ts is the solid temperature, Qa is the heat absorbed by the
solids, and Hev is the evaporation heat of the solid material. The heat absorbed (Qa) includes both
convection and radiation heat transfer which is expressed as
( ) ( )( )44'sevbssgsaa TTTThKQ −+−= σε (Eq. 46)
where hs’ represents the convective heat transfer coefficient between solid and gas, Tg is the gas
temperature, εs is the system emissivity, σb the Boltzmann radiation constant, and Tenv
environmental temperature. The heat and mass transfer coefficients are calculated from the
literature [107].
8.2. Pyrolysis
The pyrolysis is especially important in updraft gasification because its products merely join
those of gasification. The volatilisation of the biomass fuel is assumed to give rise to volatile
species and char.
( ) CharetcOCOHCOHCVolatileBiomass yx +→ .,,,,, 222 (Eq. 47)
In this work, the suggested one-step global model [108] is used due to its simplicity. It
has been further suggested that the release rate of volatiles from the solid is proportional to the
remaining volatiles in the solid and the temperature,
( )vvkR vv −= ∞ (Eq. 48)
51
where,
−=
s
vvv RT
EAk exp (Eq. 49)
where υ∞ denotes the ultimate yield of volatile matter at a specified heating rate and ambient
temperature, and υ the remaining volatile matter at time t; Ev and R are the activation energy
and gas universal constant, respectively. Av is pre-exponent factor rate.
8.3. Gas-phase combustion
Gaseous fuels released from the pyrolysis process have first to mix with the surrounding
gasification agent before chemical reaction can occur. Obviously the burning of the volatile gases
is limited not only by the reaction kinetics but also by the mixing-rate of the gaseous fuel with the
air. In this model, the actual reaction rates of volatiles species are taken as the minimum of the
kinetic rates Rkin and their mixing rates with the oxygen Rmix:
R=Min[Rkin, Rmix] (Eq. 50)
In this simulation, the gas phase reactions for biomass are assumed to be as following:
CxHy + (x/2 + y/4) O2 → xCO + y/2 H2O (Eq. 51)
CyH2y+2 + yH2O ↔ yCO + (2y+1)H2 (Eq. 52)
CO + ½ O2 → CO2 (Eq. 53)
H2 + ½ O2 → H2O (Eq. 54)
CO +H2O→ CO2+ H2 (Eq. 55)
Literature data were used for the temperature-dependent burning rates or kinetic rates (Rkin)
of species CxHy [109] for (Eq. 51), CO [108] for (Eq. 53), H2 [110] for (Eq. 54).
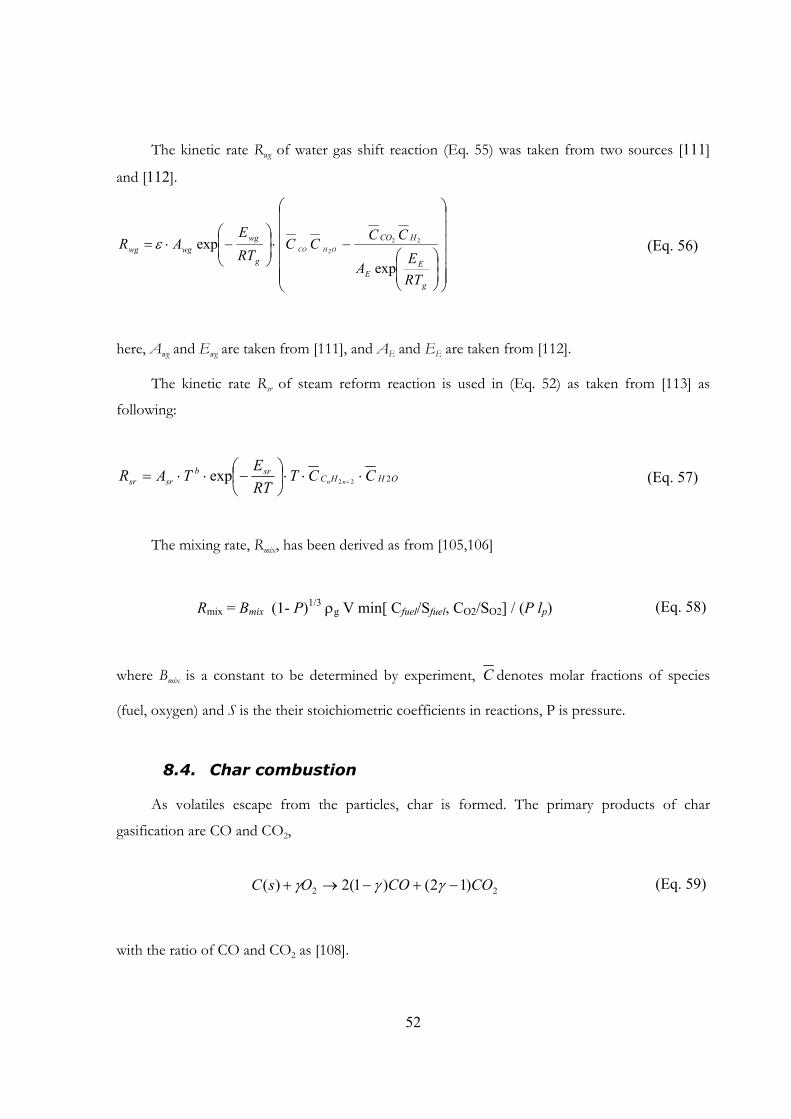
52
The kinetic rate Rwg of water gas shift reaction (Eq. 55) was taken from two sources [111]
and [112].
−⋅
−⋅=
g
EE
HCO
g
wgwgwg
RTE
A
CCCCRTE
AR OHCO
exp
exp 22
2ε (Eq. 56)
here, Awg and Ewg are taken from [111], and AE and EE are taken from [112].
The kinetic rate Rsr of steam reform reaction is used in (Eq. 52) as taken from [113] as
following:
OHHCsrb
srsr CCTRTE
TAR nn 222exp ⋅⋅⋅
−⋅⋅= + (Eq. 57)
The mixing rate, Rmix, has been derived as from [105,106]
Rmix = Bmix (1- P)1/3 ρg V min[ Cfuel/Sfuel, CO2/SO2] / (P lp) (Eq. 58)
where Bmix is a constant to be determined by experiment, C denotes molar fractions of species
(fuel, oxygen) and S is the their stoichiometric coefficients in reactions, P is pressure.
8.4. Char combustion
As volatiles escape from the particles, char is formed. The primary products of char
gasification are CO and CO2,
22 )12()1(2)( COCOOsC −+−→+ γγγ (Eq. 59)
with the ratio of CO and CO2 as [108].
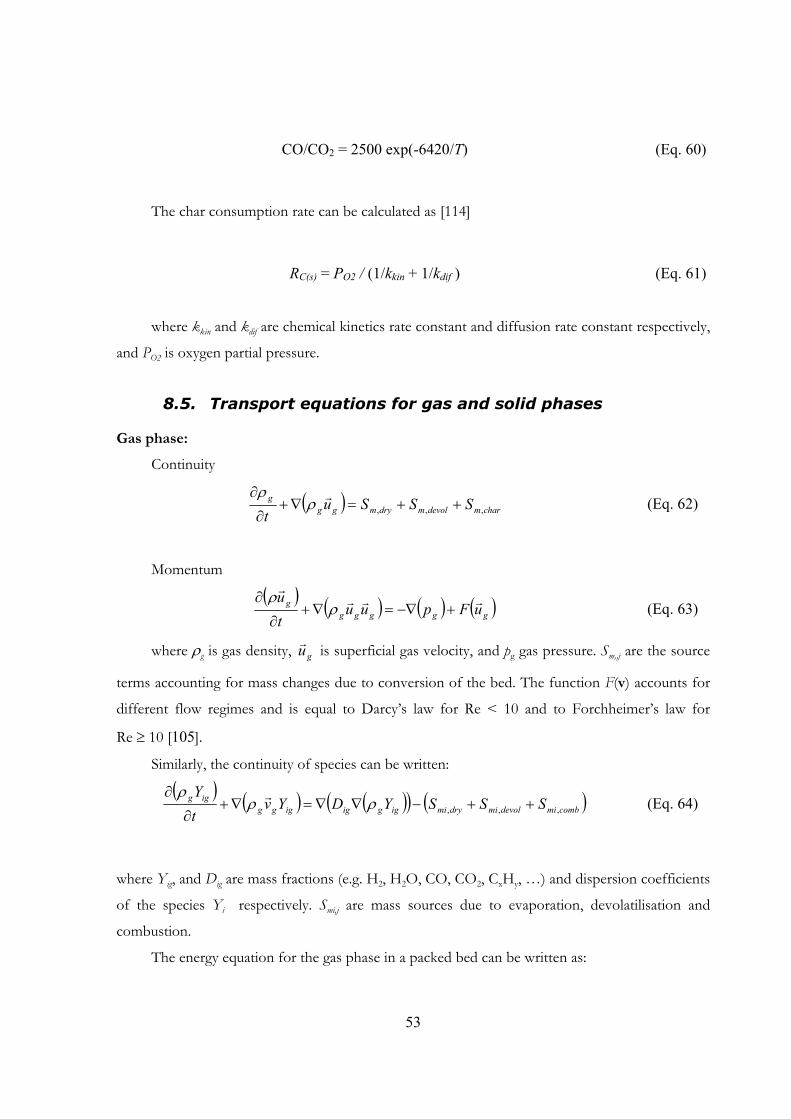
53
CO/CO2 = 2500 exp(-6420/T) (Eq. 60)
The char consumption rate can be calculated as [114]
RC(s) = PO2 / (1/kkin + 1/kdif ) (Eq. 61)
where kkin and kdif are chemical kinetics rate constant and diffusion rate constant respectively,
and PO2 is oxygen partial pressure.
8.5. Transport equations for gas and solid phases
Gas phase:
Continuity
( ) charmdevolmdrymggg SSSu
t ,,, ++=∇+∂
∂ rρρ
(Eq. 62)
Momentum
( ) ( ) ( ) ( )gggggg uFpuu
tu rrrr
+−∇=∇+∂
∂ρ
ρ (Eq. 63)
where ρg is gas density, gur is superficial gas velocity, and pg gas pressure. Sm,,j are the source
terms accounting for mass changes due to conversion of the bed. The function F(v) accounts for
different flow regimes and is equal to Darcy’s law for Re < 10 and to Forchheimer’s law for
Re ≥ 10 [105].
Similarly, the continuity of species can be written:
( ) ( ) ( )( ) ( )combmidevolmidrymiiggigigggigg SSSYDYv
tY
,,, ++−∇∇=∇+∂
∂ρρ
ρ r (Eq. 64)
where Yig, and Dig are mass fractions (e.g. H2, H2O, CO, CO2, CxHy, …) and dispersion coefficients
of the species Yi respectively. Smi,j are mass sources due to evaporation, devolatilisation and
combustion.
The energy equation for the gas phase in a packed bed can be written as:
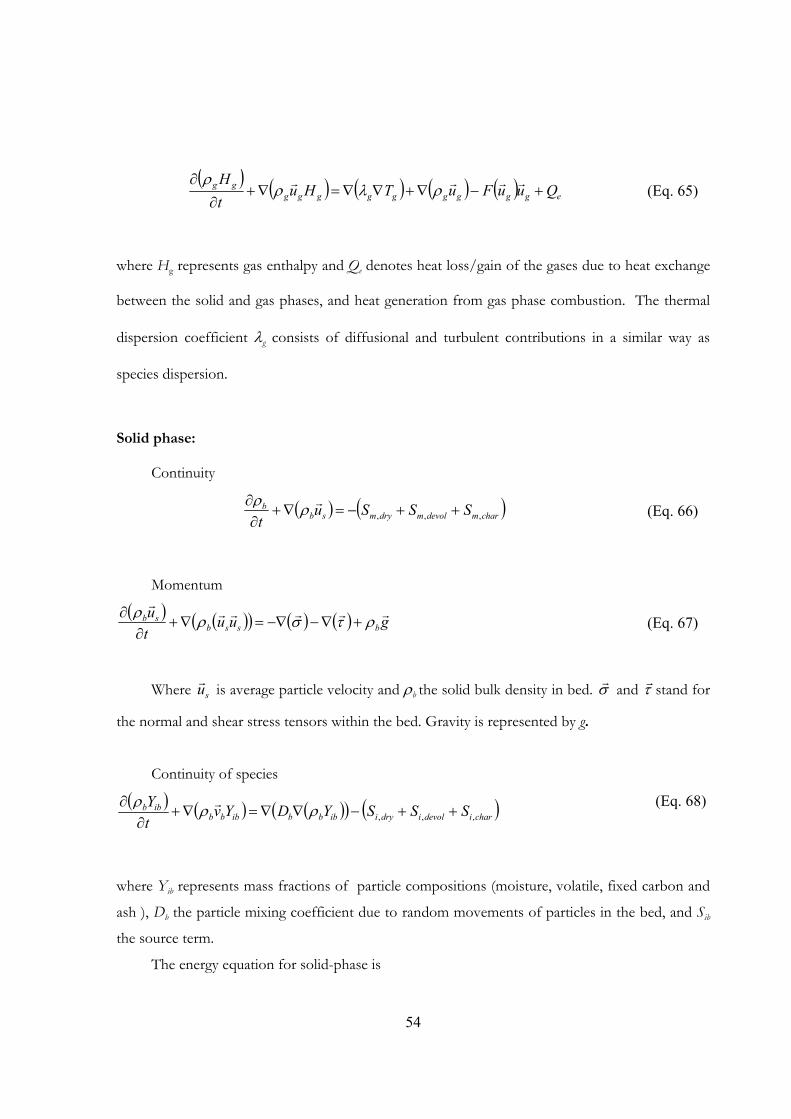
54
( ) ( ) ( ) ( ) ( ) eggggggggggg QuuFuTHu
tH
+−∇+∇∇=∇+∂
∂ rrrr ρλρρ
(Eq. 65)
where Hg represents gas enthalpy and Qe denotes heat loss/gain of the gases due to heat exchange
between the solid and gas phases, and heat generation from gas phase combustion. The thermal
dispersion coefficient λg consists of diffusional and turbulent contributions in a similar way as
species dispersion.
Solid phase:
Continuity
( ) ( )charmdevolmdrymsbb SSSu
t ,,, ++−=∇+∂∂ rρρ (Eq. 66)
Momentum
( ) ( )( ) ( ) ( ) guutu
bssbsb rrrrrr
ρτσρρ+∇−−∇=∇+
∂∂ (Eq. 67)
Where sur is average particle velocity and ρb the solid bulk density in bed. σr and τr stand for
the normal and shear stress tensors within the bed. Gravity is represented by g.
Continuity of species
( ) ( ) ( )( ) ( )charidevolidryiibbbibbbibb SSSYDYv
tY
,,, ++−∇∇=∇+∂
∂ ρρρ r (Eq. 68)
where Yib represents mass fractions of particle compositions (moisture, volatile, fixed carbon and
ash ), Db the particle mixing coefficient due to random movements of particles in the bed, and Sib
the source term.
The energy equation for solid-phase is
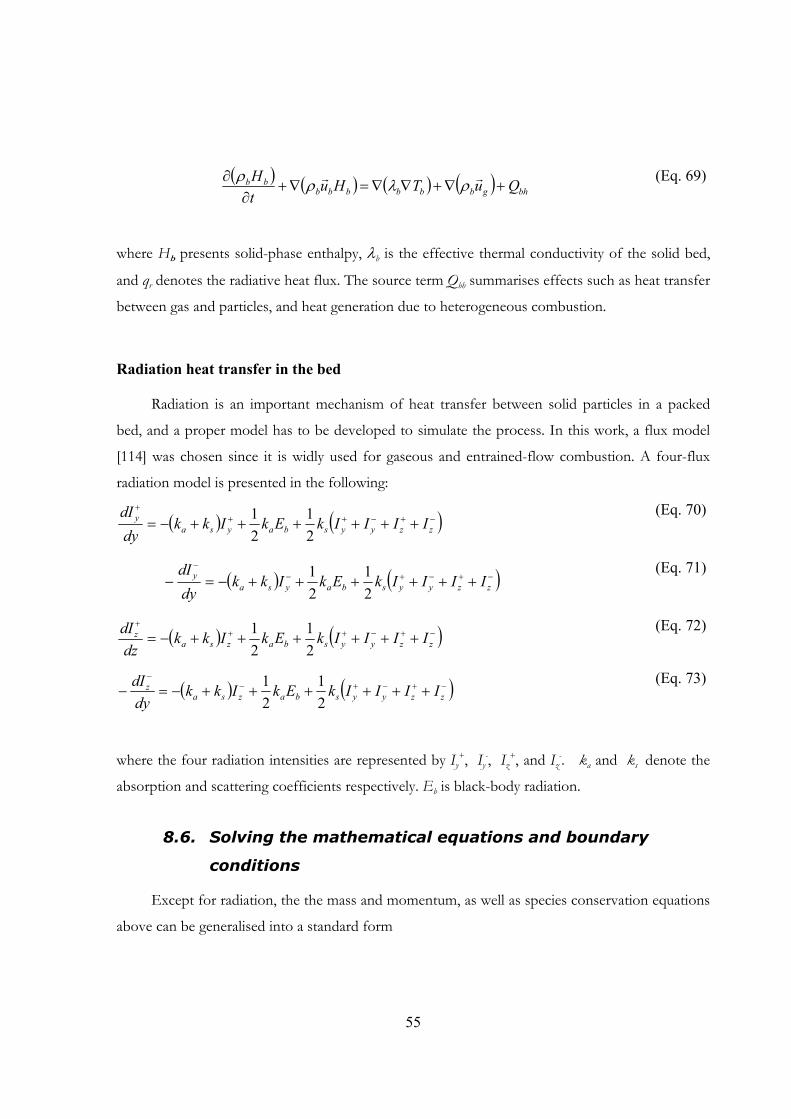
55
( ) ( ) ( ) ( ) bhgbbbbbbbb QuTHu
tH
+∇+∇∇=∇+∂
∂ rr ρλρρ (Eq. 69)
where Hb presents solid-phase enthalpy, λb is the effective thermal conductivity of the solid bed,
and qr denotes the radiative heat flux. The source term Qbh summarises effects such as heat transfer
between gas and particles, and heat generation due to heterogeneous combustion.
Radiation heat transfer in the bed
Radiation is an important mechanism of heat transfer between solid particles in a packed
bed, and a proper model has to be developed to simulate the process. In this work, a flux model
[114] was chosen since it is widly used for gaseous and entrained-flow combustion. A four-flux
radiation model is presented in the following:
( ) ( )−+−+++
++++++−= zzyysbaysay IIIIkEkIkk
dydI
21
21
(Eq. 70)
( ) ( )−+−+−−
++++++−=− zzyysbaysay IIIIkEkIkk
dydI
21
21
(Eq. 71)
( ) ( )−+−+++
++++++−= zzyysbazsaz IIIIkEkIkk
dzdI
21
21
(Eq. 72)
( ) ( )−+−+−−
++++++−=− zzyysbazsaz IIIIkEkIkk
dydI
21
21
(Eq. 73)
where the four radiation intensities are represented by Iy+, Iy
-, Iz+, and Iz
-. ka and ks denote the
absorption and scattering coefficients respectively. Eb is black-body radiation.
8.6. Solving the mathematical equations and boundary
conditions
Except for radiation, the the mass and momentum, as well as species conservation equations
above can be generalised into a standard form

56
( ) ( ) ( ) Φ+Φ∇∇=Φ∇+∂Φ∂ Qut
λρρ r (Eq. 74)
where ρ represents density, ur velocities, Φ the parameter to be solved, λ is transport coefficient,
and QΦ the source term. The calculated geometrical domain of the bed is divided into a number
of small cells and Eq. 74 discretised over individual computational cell and solved numerically
using the well known SIMPLE algorithm [115]. Additionally, the radiation equations are solved
using the four-order Runge-Kutta method [116].
The volume change of bed during the whole gasification process is modelled based on the
step change method [105]. It counts from the initial biomass to drying, pyrolysis, and gasifying.
The details of mathematical model and its physical representation for the volume of waste can be
found in [105].
A computer code (FLIC) [105] has been used to solve the above equations. The feedstock
used for the present investigation was wood pellets with the fllowing composition (ultimate
analysis – dry weight basis) of C, 50.4%; H, 6.2%; O, 42.8%; S, 0.04%. Other properties (in dry
weight basis) were ash, 0.4%; total moisture, 8.22%; fixed C, 15.7%; volatiles, 83.9%; lower heating
value (LHV), 17.1 MJ/kg. The parameters studied have temperatures of the air varying from 623
K to 1273 K, flow rates of air changing from 30 Nm3/h to 100 Nm3/h, and the size of the
feedstock varying from 6-19 mm. The biomass is assumed to be ignited by the hot air.
The computational domain included the whole gasifier with 750 mm of the height. The bed
height is 347.1 mm, and the area of the bottom is 0.1256 m2. Preheated air was assumed to feed
directly under the grate and with a uniform profile. The fuel gas was assumed to leave from the
gasifier top. A grid containing 200 point in the bed-height was used. The time step is 1 second and
the gasification time of the biomass was resolved by 4800 time steps. The computational grid was
adapted in each time step to the height of the gasifier. Temperature and velocity of the feed gases
are given, and the profiles of these parameters are assumed as uniform. It would be noteworthy
that all hydrocarbons are included in CmHn for the predicted cases.

57
9. Results and Discussion
The aim of this work is to characterise the gasification process of biomass feedstock with
use of high temperature feed gas (air and mixture of air and steam) in the updraft fixed bed batch
type gasifier. The discussion is based on the analysis of results obtained experimentally and
mathematically. The focus is on the influence of process parameters like feed gas temperature,
feed gas composition (air or mixture of air and steam), feed gas volume flow rate, and feedstock
size on fuel gas quality. Composition of dry fuel gas, lower heating value, mass flow rate, cold
gasification efficiency, specific gas production rate, and chemical compounds of tar in the fuel gas
are the parameters characterising the quality of the fuel gas produced.
Experimental results obtained in gasifying wood pellets differencing in diameter (12 mm, 8
mm and 6 mm) are presented and analysed in this chapter. Discussion of the results takes into
consideration the simplified chemistry of gasification process presented in chapter 3, devoted to
the literature review. The results for a particular feedstock size are analysed and compared with
other, and possible explanations are given for the role of process parameters during gasification.
In the present study the behaviour of molar fraction of fuel gas components, H2, CO, CO2,
N2, O2, CH4 and higher hydrocarbons ( yx HC ; x>1; here x = m, y = n, therefore nm HC =
yx HC ) are thought to be useful products in analysing gasification experiments and simulations
conducted. This is because the fuel gas quality determines the extent of its application, either by
direct applying it for heat and/or power generation (with gas engines, gas turbines or fuel cells), or
further by converting the synthesis gas (H2 + CO) to liquid fuels. Therefore, the formation of
these chemical species is compared under various gasifier conditions. However, the use of biomass
fuels for energy source through the gasification is challenging because of the formation of tar
during the gasification process. Thus tar evolution is analysed with view of characterisation of the
fuel gas quality produced.
Although, discussion in this work concentrate mainly on the same feedstock type (wood
pellets), by analysing the influence of its particle size, the discussion also takes into account the
results on charcoal, wood chips and bark whose results where published on the scope of this
work [99].
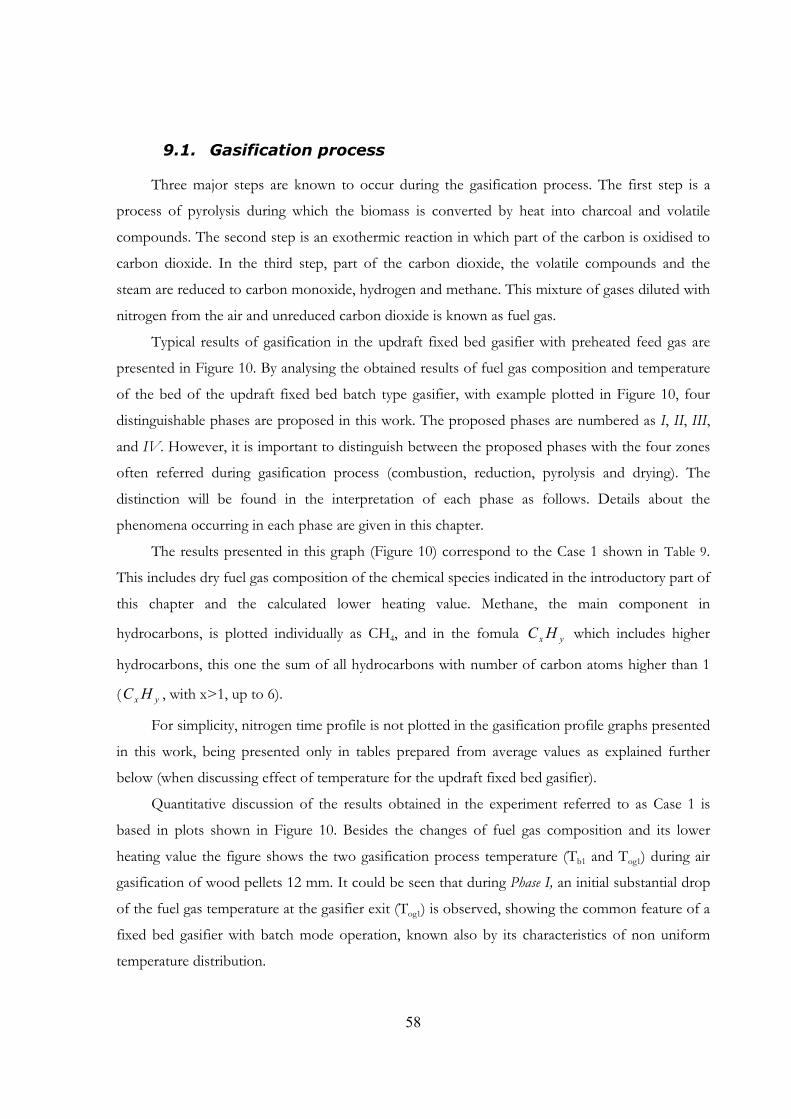
58
9.1. Gasification process
Three major steps are known to occur during the gasification process. The first step is a
process of pyrolysis during which the biomass is converted by heat into charcoal and volatile
compounds. The second step is an exothermic reaction in which part of the carbon is oxidised to
carbon dioxide. In the third step, part of the carbon dioxide, the volatile compounds and the
steam are reduced to carbon monoxide, hydrogen and methane. This mixture of gases diluted with
nitrogen from the air and unreduced carbon dioxide is known as fuel gas.
Typical results of gasification in the updraft fixed bed gasifier with preheated feed gas are
presented in Figure 10. By analysing the obtained results of fuel gas composition and temperature
of the bed of the updraft fixed bed batch type gasifier, with example plotted in Figure 10, four
distinguishable phases are proposed in this work. The proposed phases are numbered as I, II, III,
and IV. However, it is important to distinguish between the proposed phases with the four zones
often referred during gasification process (combustion, reduction, pyrolysis and drying). The
distinction will be found in the interpretation of each phase as follows. Details about the
phenomena occurring in each phase are given in this chapter.
The results presented in this graph (Figure 10) correspond to the Case 1 shown in Table 9.
This includes dry fuel gas composition of the chemical species indicated in the introductory part of
this chapter and the calculated lower heating value. Methane, the main component in
hydrocarbons, is plotted individually as CH4, and in the fomula yx HC which includes higher
hydrocarbons, this one the sum of all hydrocarbons with number of carbon atoms higher than 1
( yx HC , with x>1, up to 6).
For simplicity, nitrogen time profile is not plotted in the gasification profile graphs presented
in this work, being presented only in tables prepared from average values as explained further
below (when discussing effect of temperature for the updraft fixed bed gasifier).
Quantitative discussion of the results obtained in the experiment referred to as Case 1 is
based in plots shown in Figure 10. Besides the changes of fuel gas composition and its lower
heating value the figure shows the two gasification process temperature (Tb1 and Tog1) during air
gasification of wood pellets 12 mm. It could be seen that during Phase I, an initial substantial drop
of the fuel gas temperature at the gasifier exit (Tog1) is observed, showing the common feature of a
fixed bed gasifier with batch mode operation, known also by its characteristics of non uniform
temperature distribution.
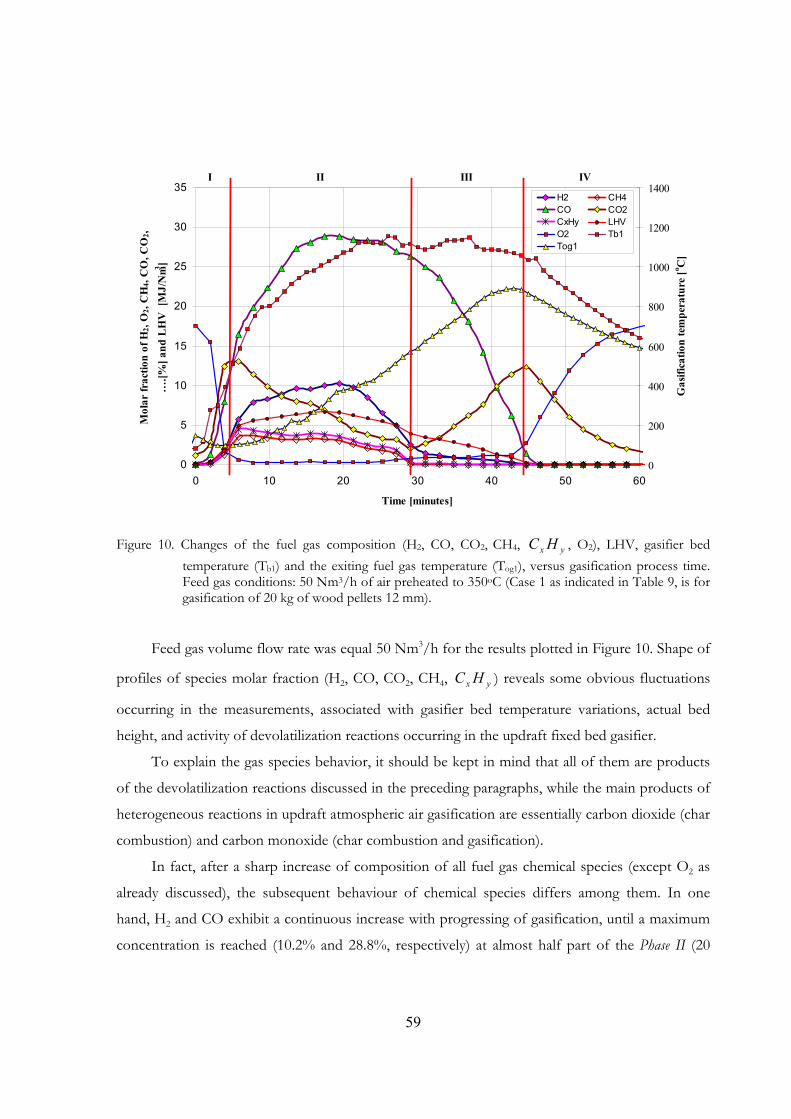
59
0
5
10
15
20
25
30
35
0 10 20 30 40 50 60
Time [minutes]
Mol
ar fr
actio
n of
H2,
O2,
CH
4, C
O, C
O2,
….[%
] and
LH
V [
MJ/
Nm3 ]
0
200
400
600
800
1000
1200
1400
Gas
ifica
tion
tem
pera
ture
[o C]
H2 CH4CO CO2CxHy LHVO2 Tb1Tog1
I II III IV
Figure 10. Changes of the fuel gas composition (H2, CO, CO2, CH4, yx HC , O2), LHV, gasifier bed temperature (Tb1) and the exiting fuel gas temperature (Tog1), versus gasification process time. Feed gas conditions: 50 Nm3/h of air preheated to 350oC (Case 1 as indicated in Table 9, is for gasification of 20 kg of wood pellets 12 mm).
Feed gas volume flow rate was equal 50 Nm3/h for the results plotted in Figure 10. Shape of
profiles of species molar fraction (H2, CO, CO2, CH4, yx HC ) reveals some obvious fluctuations
occurring in the measurements, associated with gasifier bed temperature variations, actual bed
height, and activity of devolatilization reactions occurring in the updraft fixed bed gasifier.
To explain the gas species behavior, it should be kept in mind that all of them are products
of the devolatilization reactions discussed in the preceding paragraphs, while the main products of
heterogeneous reactions in updraft atmospheric air gasification are essentially carbon dioxide (char
combustion) and carbon monoxide (char combustion and gasification).
In fact, after a sharp increase of composition of all fuel gas chemical species (except O2 as
already discussed), the subsequent behaviour of chemical species differs among them. In one
hand, H2 and CO exhibit a continuous increase with progressing of gasification, until a maximum
concentration is reached (10.2% and 28.8%, respectively) at almost half part of the Phase II (20
60
minutes in Figure 10), after which an obvious decrease is observed as a response of the continuous
consumption of the feedstock in the gasifier. This behaviour was also predicted by the
mathematical model developed in this work (Figure 11).
0
10
20
30
40
50
0 20 40 60 80time [min]
Dry
com
posi
tion
of p
rodu
ct g
as [%
] Predicted CO Measured COPredicted H2 Measured H2Predicted CmHn Measured CmHn
Figure 11. Comparison of predicted and experimental gasification process in case of feed gas temperature equal to 350 oC, flow of feed gas equal to 50 Nm3/h, diameter of wood pellets equal to 12 mm, and mass of wood pellet equal to 20 kg.
Both Figure 10 and Figure 11 were ploted for the same conditions parameters: feed gas with
temperature of 350oC and volume flow rate of 50 Nm3/h and 20 kg of wood pellets 12 mm. It
should be mentioned that the observed increase of molar fractions of CO and H2 are also a result
of the thermal cracking reactions of hydrocarbons. The subsequent decrease of molar fraction of
H2 is more pronounced due to the fact that the O2 fed with feed gas increases, thus more H2 is
burnt. Figure 10 further shows that methane and higher hydrocarbons reach the maximum (3.63%
and 0.85%, respectively) just after nearly 5 minutes of the gasification run, subsequently decrasing
with gasification time until are completely consumed at the end of Phase II. This opposite trends
between the two permanent gases (H2 and CO) and organic chemical compounds reveals the
effectivness of the thermal cracking because Tb1 is increasing during Phase II. The average LHV in
this phase is about 5.6 MJ/Nm3, slightly above the range of the reported LHV in conventional
updraft fixed bed air blown gasification (3.7 – 5.1 MJ/Nm3) [21,47,83,117].
61
At about 30 minutes of the process, CO is still the most abundant chemical species, and its
decreasing coincides with the increasing trend of CO2 and some amount of O2 appears in the fuel
gas. It is at this point that the gasifier bed temperature exhibits the first decrease trend, however
high enough to allow the Boudouard reaction with resulting formation of CO, although in
progressively low amounts with consequent reduction of the LHV. The increasing rate of molar
fraction of CO2 suggests combustion of charcoal ending at about 45 minutes of the total run time
when its formation starts decreasing until preheated air becomes the most abundant gas inside the
gasifier.
9.2. Effect of feed gas temperature
The behaviours of chemical species on the dry fuel gas evolution during the updraft fixed
bed gasification of wood pellets with highly preheated air (830oC) are qualitatively similar to that of
gasification with air preheated at 350oC, but the faster pyrolysis rates of feedstock promoted by
high temperature feed gas gives rise to improvment in fuel gas composition with clear change on
the profile of LHV (Figure 12). On one hand, the prompt devolatilisation of biomass particles
causes large amounts of pyrolysis gas to be released in a relatively short time with peaks in the
carbon dioxide, methane, and hydrogen molar fractions coming earlier and at higher values than in
the case of low preheated feed gas (Figure 10). The corresponding maximum molar fractions are
13.1% H2, 17.4% CO2, 3.9% CH4 and 2.9% yx HC (x>1). The higher hydrocarbons are clearly
formed in larger quantities at highly preheated feed gas confirming the statement that at gasifier
bed temperatures as higher as 1000oC, more hydrocarbons with higher molecular weight are
formed [20,41,45,47,98]. The time profile of carbon monoxide is, on the other hand, more regular
because it is for a large part determined by the gasification reactions whose evolution is more
influenced by the temperature increase in the gasifier. Great part of Phase II occurs with gasifier
bed temperature above 1000oC, temperature usually reported [41,45,47-49,90,98] as favouring the
production not only of CO, mainly by Boudouard reaction, but also high production of H2.
The resulting LHV (7.3 MJ/m3) in the run with preheated feed gas at 830oC is well above the
reported one in conventional low temperature updraft fixed bed gasifier and even higher than the
reported for air blown downdraft gasifier (4.6 – 5.6 MJ/Nm3) or circulating fluidised bed (3.6 – 5.9
MJ/Nm3) [117]. The cold gasification efficiency is improved from 36.1% up to 45.2% and the
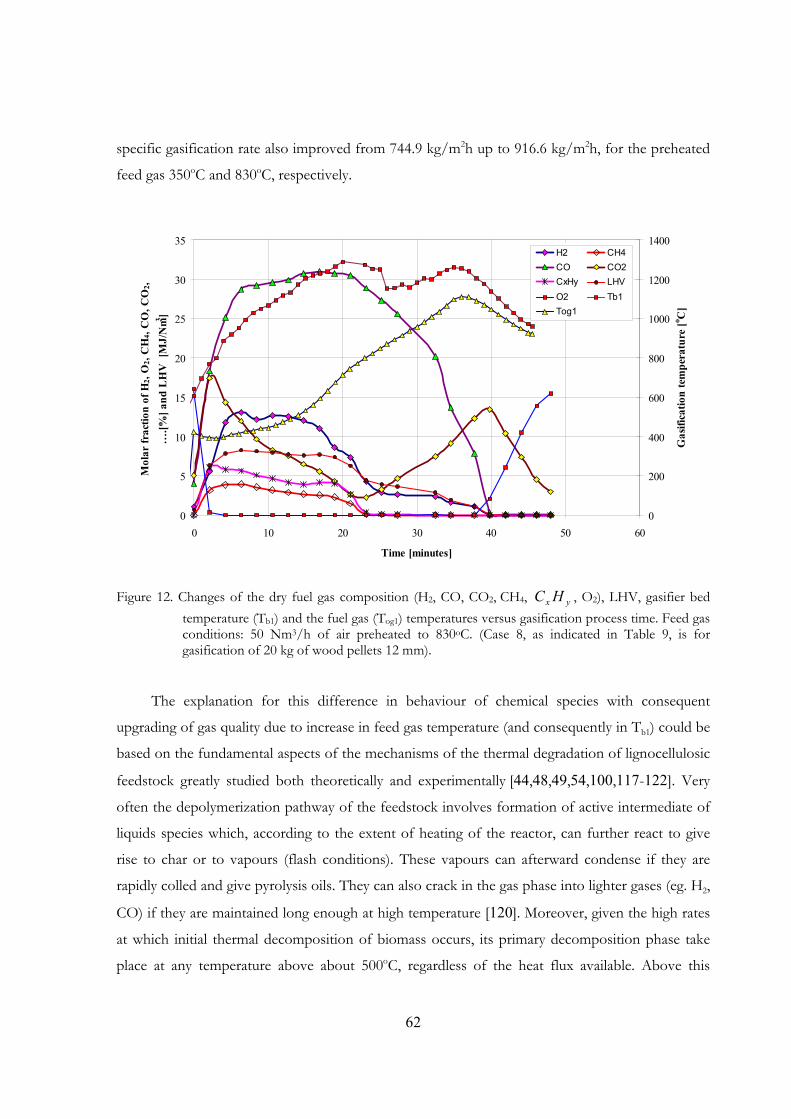
62
specific gasification rate also improved from 744.9 kg/m2h up to 916.6 kg/m2h, for the preheated
feed gas 350oC and 830oC, respectively.
0
5
10
15
20
25
30
35
0 10 20 30 40 50 60
Time [minutes]
Mol
ar fr
actio
n of
H2,
O2,
CH
4, C
O, C
O2,
….[%
] and
LH
V [
MJ/
Nm3 ]
0
200
400
600
800
1000
1200
1400
Gas
ifica
tion
tem
pera
ture
[o C]
H2 CH4CO CO2CxHy LHVO2 Tb1Tog1
Figure 12. Changes of the dry fuel gas composition (H2, CO, CO2, CH4, yx HC , O2), LHV, gasifier bed temperature (Tb1) and the fuel gas (Tog1) temperatures versus gasification process time. Feed gas conditions: 50 Nm3/h of air preheated to 830oC. (Case 8, as indicated in Table 9, is for gasification of 20 kg of wood pellets 12 mm).
The explanation for this difference in behaviour of chemical species with consequent
upgrading of gas quality due to increase in feed gas temperature (and consequently in Tb1) could be
based on the fundamental aspects of the mechanisms of the thermal degradation of lignocellulosic
feedstock greatly studied both theoretically and experimentally [44,48,49,54,100,117-122]. Very
often the depolymerization pathway of the feedstock involves formation of active intermediate of
liquids species which, according to the extent of heating of the reactor, can further react to give
rise to char or to vapours (flash conditions). These vapours can afterward condense if they are
rapidly colled and give pyrolysis oils. They can also crack in the gas phase into lighter gases (eg. H2,
CO) if they are maintained long enough at high temperature [120]. Moreover, given the high rates
at which initial thermal decomposition of biomass occurs, its primary decomposition phase take
place at any temperature above about 500oC, regardless of the heat flux available. Above this
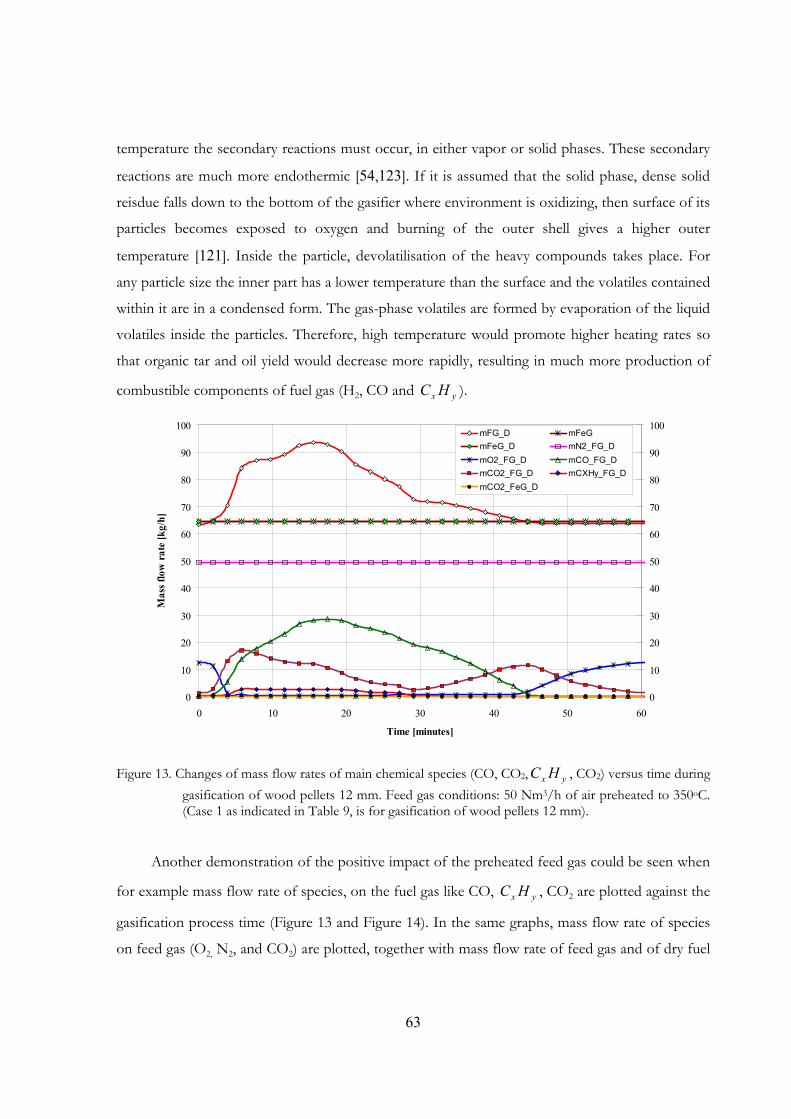
63
temperature the secondary reactions must occur, in either vapor or solid phases. These secondary
reactions are much more endothermic [54,123]. If it is assumed that the solid phase, dense solid
reisdue falls down to the bottom of the gasifier where environment is oxidizing, then surface of its
particles becomes exposed to oxygen and burning of the outer shell gives a higher outer
temperature [121]. Inside the particle, devolatilisation of the heavy compounds takes place. For
any particle size the inner part has a lower temperature than the surface and the volatiles contained
within it are in a condensed form. The gas-phase volatiles are formed by evaporation of the liquid
volatiles inside the particles. Therefore, high temperature would promote higher heating rates so
that organic tar and oil yield would decrease more rapidly, resulting in much more production of
combustible components of fuel gas (H2, CO and yx HC ).
0
10
20
30
40
50
60
70
80
90
100
0 10 20 30 40 50 60
Time [minutes]
Mas
s flo
w r
ate
[kg/
h]
0
10
20
30
40
50
60
70
80
90
100mFG_D mFeGmFeG_D mN2_FG_DmO2_FG_D mCO_FG_DmCO2_FG_D mCXHy_FG_DmCO2_FeG_D
Figure 13. Changes of mass flow rates of main chemical species (CO, CO2, yx HC , CO2) versus time during gasification of wood pellets 12 mm. Feed gas conditions: 50 Nm3/h of air preheated to 350oC. (Case 1 as indicated in Table 9, is for gasification of wood pellets 12 mm).
Another demonstration of the positive impact of the preheated feed gas could be seen when
for example mass flow rate of species, on the fuel gas like CO, yx HC , CO2 are plotted against the
gasification process time (Figure 13 and Figure 14). In the same graphs, mass flow rate of species
on feed gas (O2, N2, and CO2) are plotted, together with mass flow rate of feed gas and of dry fuel
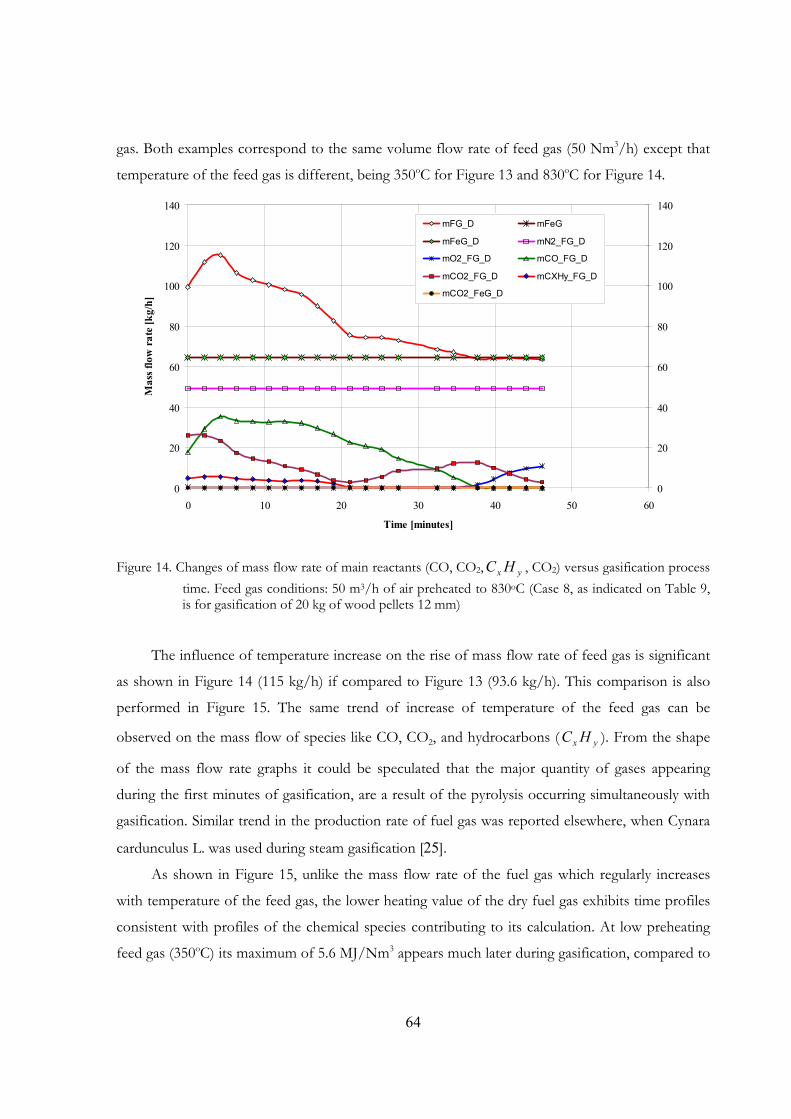
64
gas. Both examples correspond to the same volume flow rate of feed gas (50 Nm3/h) except that
temperature of the feed gas is different, being 350oC for Figure 13 and 830oC for Figure 14.
0
20
40
60
80
100
120
140
0 10 20 30 40 50 60
Time [minutes]
Mas
s flo
w r
ate
[kg/
h]
0
20
40
60
80
100
120
140mFG_D mFeG
mFeG_D mN2_FG_D
mO2_FG_D mCO_FG_D
mCO2_FG_D mCXHy_FG_D
mCO2_FeG_D
Figure 14. Changes of mass flow rate of main reactants (CO, CO2, yx HC , CO2) versus gasification process time. Feed gas conditions: 50 m3/h of air preheated to 830oC (Case 8, as indicated on Table 9, is for gasification of 20 kg of wood pellets 12 mm)
The influence of temperature increase on the rise of mass flow rate of feed gas is significant
as shown in Figure 14 (115 kg/h) if compared to Figure 13 (93.6 kg/h). This comparison is also
performed in Figure 15. The same trend of increase of temperature of the feed gas can be
observed on the mass flow of species like CO, CO2, and hydrocarbons ( yx HC ). From the shape
of the mass flow rate graphs it could be speculated that the major quantity of gases appearing
during the first minutes of gasification, are a result of the pyrolysis occurring simultaneously with
gasification. Similar trend in the production rate of fuel gas was reported elsewhere, when Cynara
cardunculus L. was used during steam gasification [25].
As shown in Figure 15, unlike the mass flow rate of the fuel gas which regularly increases
with temperature of the feed gas, the lower heating value of the dry fuel gas exhibits time profiles
consistent with profiles of the chemical species contributing to its calculation. At low preheating
feed gas (350oC) its maximum of 5.6 MJ/Nm3 appears much later during gasification, compared to
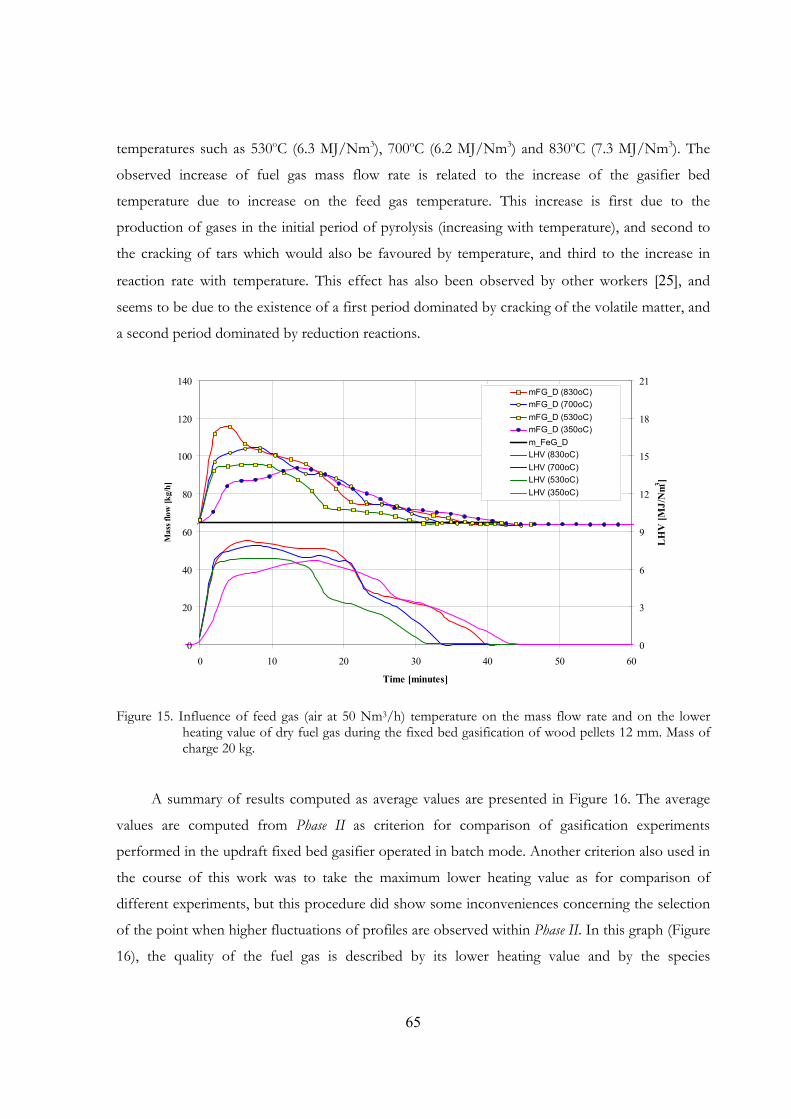
65
temperatures such as 530oC (6.3 MJ/Nm3), 700oC (6.2 MJ/Nm3) and 830oC (7.3 MJ/Nm3). The
observed increase of fuel gas mass flow rate is related to the increase of the gasifier bed
temperature due to increase on the feed gas temperature. This increase is first due to the
production of gases in the initial period of pyrolysis (increasing with temperature), and second to
the cracking of tars which would also be favoured by temperature, and third to the increase in
reaction rate with temperature. This effect has also been observed by other workers [25], and
seems to be due to the existence of a first period dominated by cracking of the volatile matter, and
a second period dominated by reduction reactions.
0
20
40
60
80
100
120
140
0 10 20 30 40 50 60
Time [minutes]
Mas
s flo
w [k
g/h]
0
3
6
9
12
15
18
21
LH
V [M
J/N
m3 ]
mFG_D (830oC)mFG_D (700oC)mFG_D (530oC)mFG_D (350oC)m_FeG_DLHV (830oC)LHV (700oC)LHV (530oC)LHV (350oC)
Figure 15. Influence of feed gas (air at 50 Nm3/h) temperature on the mass flow rate and on the lower heating value of dry fuel gas during the fixed bed gasification of wood pellets 12 mm. Mass of charge 20 kg.
A summary of results computed as average values are presented in Figure 16. The average
values are computed from Phase II as criterion for comparison of gasification experiments
performed in the updraft fixed bed gasifier operated in batch mode. Another criterion also used in
the course of this work was to take the maximum lower heating value as for comparison of
different experiments, but this procedure did show some inconveniences concerning the selection
of the point when higher fluctuations of profiles are observed within Phase II. In this graph (Figure
16), the quality of the fuel gas is described by its lower heating value and by the species
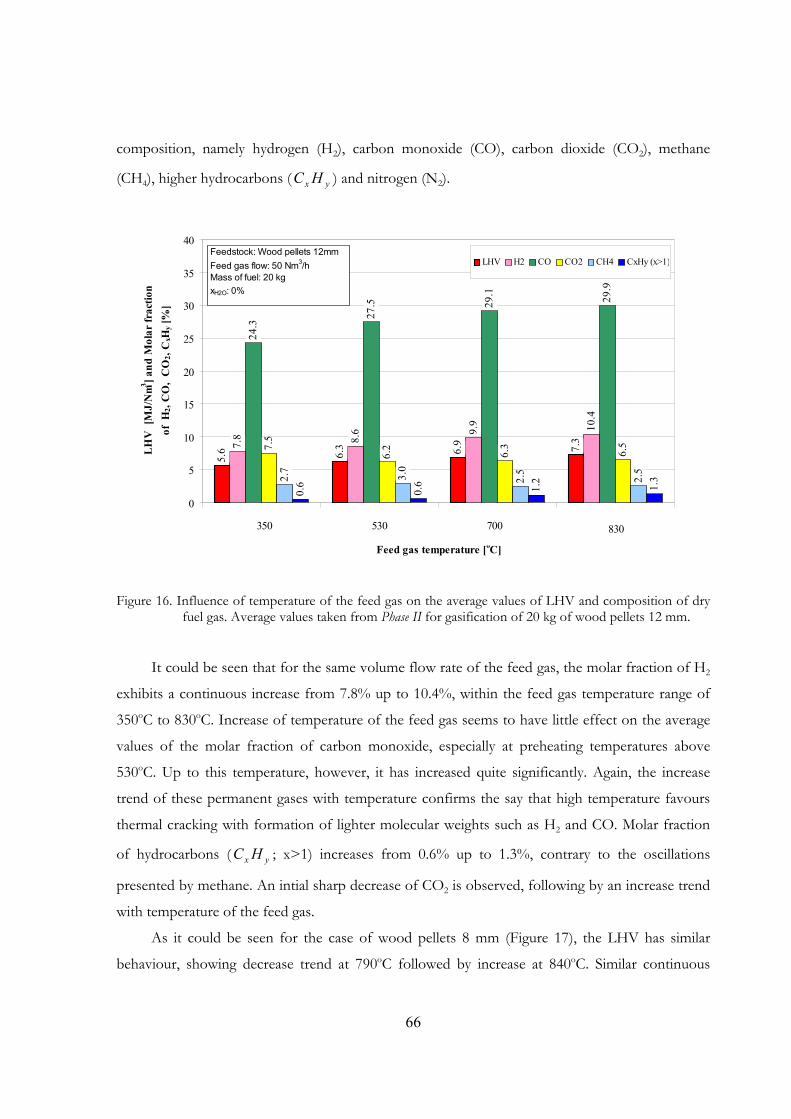
66
composition, namely hydrogen (H2), carbon monoxide (CO), carbon dioxide (CO2), methane
(CH4), higher hydrocarbons ( yx HC ) and nitrogen (N2).
5.
6 7.37.8 8.6 10
.4
24.3
27.5 29
.1 29.9
7.5
6.2
6.3
6.5
2.7
3.0
2.5
2.5
0.6
0.6 1.2
1.3
6.9
6.3
9.9
0
5
10
15
20
25
30
35
40
9 5 10 11
Feed gas temperature [oC]
LH
V [
MJ/
Nm3 ] a
nd M
olar
frac
tion
of H
2, C
O,
CO
2, C
xHy [
%]
LHV H2 CO CO2 CH4 CxHy (x>1)Feedstock: Wood pellets 12mmFeed gas flow: 50 Nm3/hMass of fuel: 20 kgxH2O: 0%
350 530 830700
Figure 16. Influence of temperature of the feed gas on the average values of LHV and composition of dry fuel gas. Average values taken from Phase II for gasification of 20 kg of wood pellets 12 mm.
It could be seen that for the same volume flow rate of the feed gas, the molar fraction of H2
exhibits a continuous increase from 7.8% up to 10.4%, within the feed gas temperature range of
350oC to 830oC. Increase of temperature of the feed gas seems to have little effect on the average
values of the molar fraction of carbon monoxide, especially at preheating temperatures above
530oC. Up to this temperature, however, it has increased quite significantly. Again, the increase
trend of these permanent gases with temperature confirms the say that high temperature favours
thermal cracking with formation of lighter molecular weights such as H2 and CO. Molar fraction
of hydrocarbons ( yx HC ; x>1) increases from 0.6% up to 1.3%, contrary to the oscillations
presented by methane. An intial sharp decrease of CO2 is observed, following by an increase trend
with temperature of the feed gas.
As it could be seen for the case of wood pellets 8 mm (Figure 17), the LHV has similar
behaviour, showing decrease trend at 790oC followed by increase at 840oC. Similar continuous

67
increase trend of hydrogen is seen also in this case reaching 11.7% at high feed gas preheat
temperature. The fluctuation on the molar fraction of CH4 and, in this case also of the CO is
shown. Molar fraction of CO2, however, shows a steady decrease trend with temperature. 4.
7
7.68.
8 9.3
11.7
17.0
26.7
22.4
27.7
12.5
10.6
9.7
9.8
1.5
3.6
2.1 2.
9
1.1 1.4 2.1
1.9
6.87.1
11.6
0
5
10
15
20
25
30
35
Feed gas temperature [oC]
LH
V [
MJ/
Nm3 ] a
nd M
olar
frac
tion
of H
2, C
O,
CO
2, C
xHy [
%]
LHV H2 CO CO2 CH4 CxHy (x>1)Wood Pellets 8 mm: 80 Nm3/h, xH20=0%
790 840390 560
Figure 17. Influence of temperature of feed gas (80 Nm3/h of air) on the average values of LHV and dry fuel gas composition. Average values taken from Phase II for gasification of 20 kg of wood pellets 8 mm.
Higher calorific values obtained for the case of wood pellets 12 mm, compared to that of
wood pellets 8 mm are seen to be due to higher molar fraction of CO and that of CH4 formed in
gasifying wood pellets 12 mm. Although molar fraction of H2 and higher hydrocarbons ( yx HC ;
x>1) are higher in the case of wood pellets 8 mm.
Supportive data for the above discussion could be seen in Table 10 where molar ratios of
chemical species are presented. For example, during gasification of wood pellets 12 mm, the
increase in temperature of the feed gas from 350oC to 830oC gives rise to an increase of H2 and
CO compared to CO2. The most pronounced effect could be seen on the increase of H2 which is
shown by the H2/CO ratio increasing from 0.32 up to 0.35, and equally increase on the H2/CO2
ratio from 1.04 up to 1.60. The comparison between molar fraction of CO and of CO2 gives a
clear indication of the most favourable conditions for the Boudouard reactions to occur at high

68
feed gas temperatures. The ratio CO/CO2 sharply increases from 3.22 at 350oC up to 4.45 at
530oC, then reaches values of 4.58 at temperatures of preheated air of 830oC.
Table 10. Summary of results of gasification: gasification process temperature (Tb1, Tog1), LHV, molar fraction of nitrogen, molar ratios, maximum mass flow rate, cold gasification efficiency, maximum specific fuel gas production rate during gasification of wood pellets (12, 8 and 6 mm) – influence of feed gas temperature.
Case
number [-] 1 4 7 8 12 14 15 16 18 19
Temperature
of the feed
gas
[oC] 350 530 700 830 390 560 790 840 570 840
Wood
pellets size
(diameter)
[mm] 12 12 12 12 8 8 8 8 6 6
Tb1 [oC] 894 773 957 1 074 570 741 914 1 027 564 1 015
Tog1 [oC] 265 176 387 509 317 340 605 606 360 583
LHV [MJ/Nm3] 5.6 6.3 6.2 7.3 4.7 7.1 6.8 7.6 6.9 6.9
N2 [%] 55.9 52.8 45.2 48.7 58.4 47.7 51.4 45.4 48.5 50.1
H2/CO [-] 0.32 0.31 0.34 0.35 0.52 0.35 0.52 0.42 0.32 0.39
H2/CO2 [-] 1.04 1.39 1.56 1.6 0.71 0.88 1.19 1.19 1.03 1.03
CO/CO2 [-] 3.22 4.45 4.59 4.58 1.36 2.52 2.31 2.82 3.23 2.64
m& FG_DMAX [kg/h] 93.6 95.4 104.3 115.2 129.5 128.8 177.6 184.8 176.1 178.7
ηCGE [%] 36.1 28.7 45 45.2 28.2 33.3 58.3 59.5 83.2 59.7
εMAX [kg/m2h] 744.9 759.5 829.8 916.6 1030.4 1025 1413 1470.3 1400.9 1421.9
Similar increase trends were also observed when gasification of other two sizes of wood
pellets (8 mm and 6 mm) was carried with low and highly preheated feed gas, as shown in Table
10.
An interesting reduction of N2 is also shown in Table 10. Nitrogen is one of the gases that
are fed into the gasifier and is becoming one of the gasification products. During the experiment
with air as feed gas, it was observed that the concentration of this gas went down, while fuel gas
components like H2, CO were increasing (see also Figure 16 and Figure 17) when the temperatures
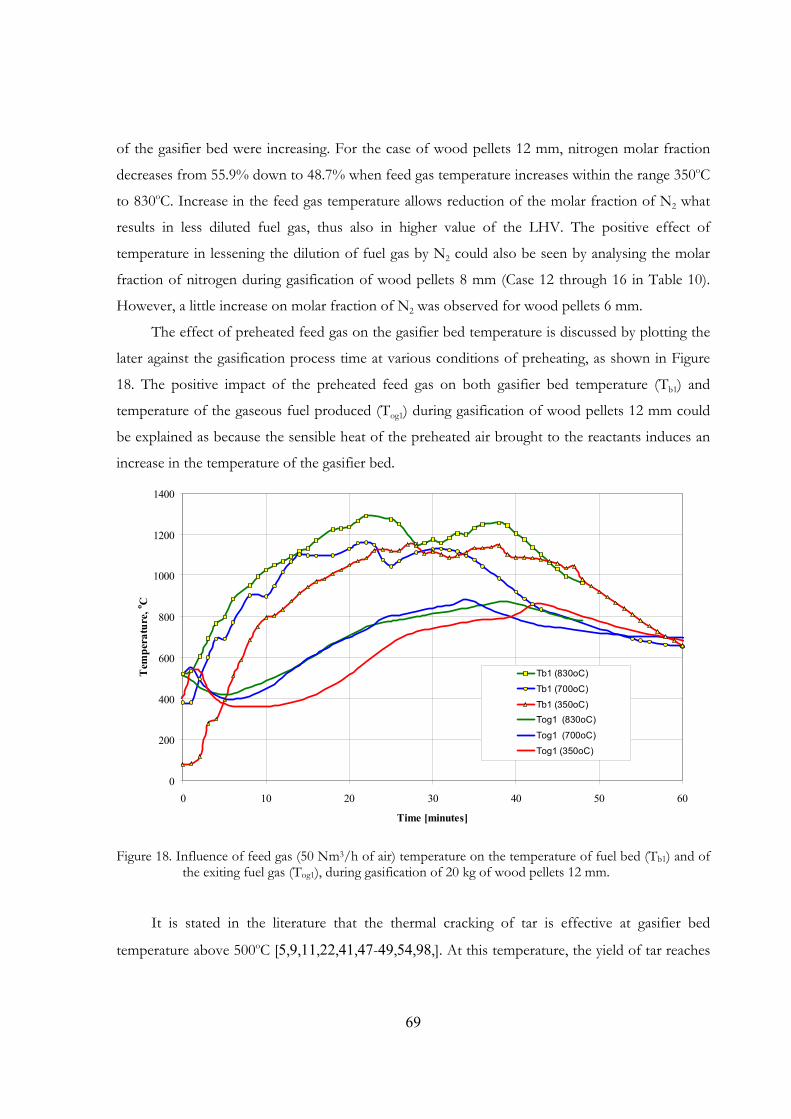
69
of the gasifier bed were increasing. For the case of wood pellets 12 mm, nitrogen molar fraction
decreases from 55.9% down to 48.7% when feed gas temperature increases within the range 350oC
to 830oC. Increase in the feed gas temperature allows reduction of the molar fraction of N2 what
results in less diluted fuel gas, thus also in higher value of the LHV. The positive effect of
temperature in lessening the dilution of fuel gas by N2 could also be seen by analysing the molar
fraction of nitrogen during gasification of wood pellets 8 mm (Case 12 through 16 in Table 10).
However, a little increase on molar fraction of N2 was observed for wood pellets 6 mm.
The effect of preheated feed gas on the gasifier bed temperature is discussed by plotting the
later against the gasification process time at various conditions of preheating, as shown in Figure
18. The positive impact of the preheated feed gas on both gasifier bed temperature (Tb1) and
temperature of the gaseous fuel produced (Tog1) during gasification of wood pellets 12 mm could
be explained as because the sensible heat of the preheated air brought to the reactants induces an
increase in the temperature of the gasifier bed.
0
200
400
600
800
1000
1200
1400
0 10 20 30 40 50 60
Time [minutes]
Tem
pera
ture
, o C
Tb1 (830oC)
Tb1 (700oC)
Tb1 (350oC)Tog1 (830oC)
Tog1 (700oC)
Tog1 (350oC)
Figure 18. Influence of feed gas (50 Nm3/h of air) temperature on the temperature of fuel bed (Tb1) and of the exiting fuel gas (Tog1), during gasification of 20 kg of wood pellets 12 mm.
It is stated in the literature that the thermal cracking of tar is effective at gasifier bed
temperature above 500oC [5,9,11,22,41,47-49,54,98,]. At this temperature, the yield of tar reaches
70
a maximum value. Temperature of the fuel gas lower than 400oC is attained in the start-up period
of gasification when low temperature of the feed gas is used (350oC). This could lead to formation
of tars because of cooling effect of the hot gases flowing up. Using high temperature of the feed
gas, however, would help an improved start-up procedure eliminating extra tar production during
the start-up period. Figure 18 shows that when high temperature of feed gas of 830oC is used, the
gases mainly produced in the pyrolysis/drying zone are heated to fairly above 400oC in the initial
stage of the gasification run and progressively heated up to temperatures above 500oC.
Increase in the gasifier bed temperature allows increasing the heating rate in the gasifier. The
high temperature feed gas promotes rapid heat up of the feedstock to a high temperature, and
stabilization of the volatiles evolved from the feedstock particles. When there is sufficient sensible
heat in the feed gas, the most abundant products in Phase II are CO, H2, CH4, CO2 and traces of
higher hydrocarbons as also described elsewhere [90].
One reason why this occurs is that preheated air increases the heating rate of the descending
feedstock in the updraft fixed gasifier under consideration in this work. The volatile yield from the
feedstock particles is greatly enhanced under these conditions. The highly preheated feed gas
intimately mixes with hot gases and results in further partial oxidation of the raw fuel gas. It could
be expected that this partial oxidation and rise in temperature could result in the high molecular
weight organic aerosols breaking down into low molecular weight fuel gases and stable aromatic
compounds [15]. This phenomenon, in particular is discussed later in ths work (Section devoted
for tar evolution). Duration time of overall process is shorter with increase of the feed gas
temperature. Phase II is nearly 5 minutes shorter in case of highly preheated feed gas (830oC). The
sharp drop of oxygen, as plotted in Figure 12 reveals that it reacts completely in the oxidation
zone.
The discussion above shows that the first stage (Phase I) is essentially due to combustion and
devolatilisation. Successively, associated with the progressive heating of the bed, the enlargement
of the reaction zone and the formation of a char layer, char gasification reactions also become
active. Therefore, in the Phase II, carbon dioxide is consumed by the gasification reactions, with a
corresponding increase in the concentration of carbon monoxide and in the heating value of the
gas. A positive contribution for the increase in the gas-heating value also comes from methane,
hydrogen and higher hydrocarbons, indicating that the devolatilisation region becomes thicker
and/or the average reaction temperature increases. However, the variations in CH4 and higher
hydrocarbons are smaller as compared to hydrogen, carbon monoxide and carbon dioxide.

71
Predicted and experimental data for gasification in the updraft fixed-bed gasifier operated in
batch mode are presented in Figure 19. It gives the molar fraction average values of the major fuel
gas species (CO, H2, CmHn = yx HC ) produced at different feed gas temperature. The agreements
between predicted and experimental results can be considered reasonable, in spite of lower molar
fraction of CO predicted and higher molar fraction of H2 and yx HC = CmHn. From Figure 19 it
could be also seen that for the same volume flow rate of the feed gas, the predicted CO molar
fraction exhibits a continuous increase from 20.1% (vol.) up to 26.3% (vol.) within the feed gas
temperature range of 350oC to 830oC. However, the increasing rate becomes almost unchangeable
especially at preheating temperatures above 530oC.
The predicted H2 molar fraction increases from 6.6% up to 12.7% (vol.) when feed gas
temperature changes from 350oC to 830oC. In other words, increase of temperature of the feed gas
leads to an increase in the molar fraction of H2 as well. However, increasing further the
temperature of the feed gas above 530oC seems not impacting the production of main gas species.
0
10
20
30
40
50
300 500 700 900 1100Temperature of Air [oC]
Fuel
Spe
cies
in P
rodu
ced
Gas
[mol
%] Predicted CO Measured CO
Predicted H2 Measured H2Predicted CmHn Measured CmHn
Figure 19. Influence of feed gas temperature on the composition of the fuel gas (average values, dry vol. %) taken from gasification stage of 20 kg of wood pellets with 12 mm diameter.

72
The possible reason is that the ignition temperature of the wood pellets used is at the range
of 350oC and 530oC. This also implies that if the feed gas temperature is higher than the feedstock’
ignition temperature, the gasification process has a strong effect, namely higher compositions of
the fuel gases, thus higher fuel gas LHV.
9.3. Effect of steam
Profiles of updraft fixed bed gasification of wood pellets 12 mm with addition of steam in
the feed gas are plotted in Figure 20. As for the air gasification also in this case all four phases of
the process are easy to distinguish. However, time duration of the process is much longer as a
result of decreased gasification rate. The patterns of the profiles are consistent with an updraft
fixed bed gasifier, and very much influenced by continuous addition of the feed gas containing
higher molar fraction of steam.
0
5
10
15
20
25
30
35
0 10 20 30 40 50 60 70 80
Time [minutes]
Mol
ar fr
actio
n of
H2,
O2,
CH
4, C
O, C
O2,
….[%
] and
LH
V [
MJ/
Nm3 ]
0
200
400
600
800
1000
1200
1400
Gas
ifica
tion
tem
pera
ture
[o C]
H2 CH4CO CO2CxHy LHVO2 Tb1Tog1
Figure 20. Changes of the dry fuel gas composition (H2, CO, CO2, CH4, yx HC ), LHV, gasifier bed temperature (Tb1) and the fuel gas temperature (Tog1) versus gasification process time. Feed gas conditions: 56 Nm3/h of a mixture of air (17%) and steam (83 %) preheated to 900oC. (Case 12 as indicated on Table 9, is for gasification of 20 kg of wood pellets 12 mm).

73
When the feed gas is composed of preheated air and steam, the steam controls the
gasification temperature. As already discussed, after the drying and devolatilisation, the solid
residue reacts mainly with steam, but also some carbon dioxide and hydrogen participate in the
reactions. The endothermic reactions produce carbon monoxide and hydrogen. The slightly
exothermic reaction of hydrogen with carbon produces methane. Differentiation between the
“gasification” and the “combustion zone” where defined above as based on the presence or
absence of free oxygen. Combustible gases such as carbon monoxide or hydrogen may react with
oxygen. The exothermic combustion reactions provide the necessary energy for the endothermic
gasification reactions and drying. When steam is added to air to form the feed gas, devolatilisation
products are released in the region of relatively low temperature and lack of free oxygen. Thus,
tars, oils, and heavier hydrocarbon gases are neither cracked nor oxidised, but added to the
product gas. To overcome this, higher heating rates conditions are achieved by high temperature
preheated feed gas and with excessive amount of steam provided into the gasifier.
It has been reported that for steam inlet temperature lower than 1200ºC, a very large fraction
of excess steam is required to supply the necessary heat [124]. These authors concluded that in the
steam-only gasification processes the heat required for the endothermic gasification reactions is
supplied solely by the sensible heat in very high temperature superheated steam flame
(1727oC) [124].
Patterns of fuel gas composition obtained by gasification of wood pellets 12 mm with use of
a mixture of air and steam (83%) as feed gas preheated to 900oC are plotted in Figure 20. The
significant and expected impact on the gas composition and on the gasification temperature is
displayed in this figure. The higher formation of H2 attained may be demonstrating that the steam-
biomass reaction rates may be enhanced relative to the competing reactions by increasing the
reactive agent steam in the feed gas. In fact, as the molar fraction of steam in the feed gas rose
from 0% (Figure 12) up to 83% (Figure 20), the average molar fraction of H2 significantly
increased from about 10.4% up to nearly 18.3%. Primary water-gas reaction (C + H2O ⇔ CO +
H2) and water-gas shift reaction (CO + H2O ⇔ CO2 + H2) are considered to predominantly occur
within Phase II because they are mainly favoured by addition of steam in the feed gas. They are
therefore, expected to be responsible for the higher H2 molar fractions. Additionally, the influence
of temperature of the feed gas can also be seen on the increase of the gasifer bed temperature,
which in turn influences on the amount of molar fraction of H2 in the fuel gas composition. The
increase of the H2 content with Tb1 is well understood because when Tb1 is increased, the rate of
74
the biomass and tar cracking and reforming reactions also increases, and such cracking and
reforming reactions produce H2.
However, this temperature is seen to be low for Boudouard reaction and, due to the
competing effect of the chemical reactions such as gas-shift and water-gas shift reaction reactions,
caused by the addition of steam in the feed gas, the resulting molar fraction of CO is low
compared to the case of gasification with only air as feed gas. This could be clearly seen by
comparing (Figure 12 and Figure 20).
Much pronounced effect of the steam is also seen when comparing profiles of CO2 during
air gasification and gasification with mixture of air and steam in an updraft fixed bed gasifier. In
either case, at the beginning of the process, combustion process takes part favouring the first
maximum initial peak of molar fraction of CO2 as shown in Figure 12 and Figure 20. In air
gasification, however, molar fraction of CO2 subsequently decreases to a value lower than 4% at
the expense of production of CO due to Boudouard reaction (C + CO2 ↔ 2CO), which is mainly
favoured by high gasifier bed temperature (Tb1 > 1000oC). The second peak of CO2 is markedly
observed only in Figure 12, occurring at the end of Phase II, and also indicated by the end of
production of CO, and when only combustion start to take place in the gasifier. However, from
the results of gasification with mixture of air and steam, only the initial peak of CO2 could be
observed, after which CO2 profile exhibits a plateau throughout (Phase II). This plateau comes at
the gasifier bed temperature of about 750oC. As discussed in the preceding paragraph, the
relatively low temperature may probably be due to the combined effects of the exothermic water-
gas shift reaction (CO + H2O ↔ CO2 + H2) with two endothermic primary and secondary water-
gas reaction. The homogeneous water-gas shift reaction is purely a gaseous reaction, which takes
place in the presence of undecomposed steam [48,49]. Since taking place in the reactor bed, the
two endothermic reactions, which produce hydrogen gas, uses the heat, which is produced by the
exothermic reactions, and therefore, the temperature of the feedstock bed decreases to about
750oC. On the contrary, when an exothermic reaction also producing hydrogen gas happens in the
reactor bed, then its temperature would increase due to the heat generated. These two reactions
(exothermic and endothermic) are known to be net endothermic thus implying that supplemental
heat must be supplied to carry the reaction to completion [119].
To further highlight the effect of the feed gas composition (air or mixture of air and steam)
on the hydrogen amounts in the fuel gas produced in the updraft fixed bed gasifier, time evolution
of molar fraction of H2 is particularly displayed in Figure 21. It clearly shows that the higher the
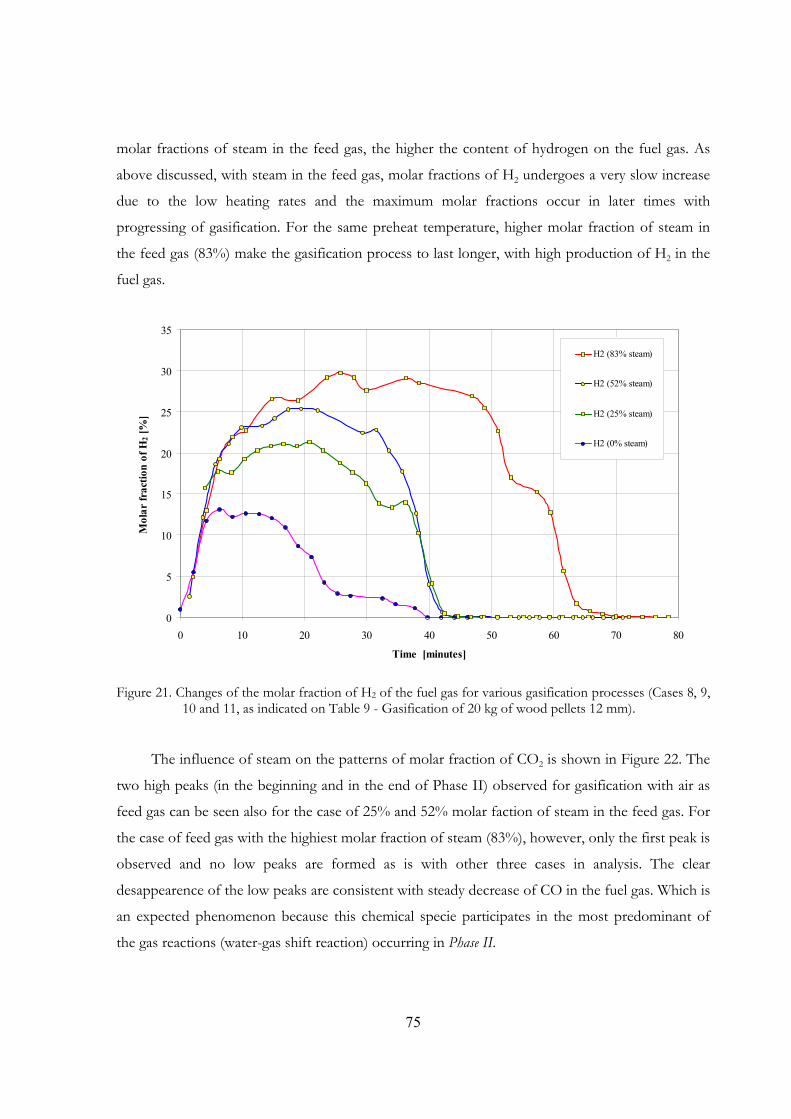
75
molar fractions of steam in the feed gas, the higher the content of hydrogen on the fuel gas. As
above discussed, with steam in the feed gas, molar fractions of H2 undergoes a very slow increase
due to the low heating rates and the maximum molar fractions occur in later times with
progressing of gasification. For the same preheat temperature, higher molar fraction of steam in
the feed gas (83%) make the gasification process to last longer, with high production of H2 in the
fuel gas.
0
5
10
15
20
25
30
35
0 10 20 30 40 50 60 70 80
Time [minutes]
Mol
ar fr
actio
n of
H2 [
%]
H2 (83% steam)
H2 (52% steam)
H2 (25% steam)
H2 (0% steam)
Figure 21. Changes of the molar fraction of H2 of the fuel gas for various gasification processes (Cases 8, 9, 10 and 11, as indicated on Table 9 - Gasification of 20 kg of wood pellets 12 mm).
The influence of steam on the patterns of molar fraction of CO2 is shown in Figure 22. The
two high peaks (in the beginning and in the end of Phase II) observed for gasification with air as
feed gas can be seen also for the case of 25% and 52% molar faction of steam in the feed gas. For
the case of feed gas with the highiest molar fraction of steam (83%), however, only the first peak is
observed and no low peaks are formed as is with other three cases in analysis. The clear
desappearence of the low peaks are consistent with steady decrease of CO in the fuel gas. Which is
an expected phenomenon because this chemical specie participates in the most predominant of
the gas reactions (water-gas shift reaction) occurring in Phase II.
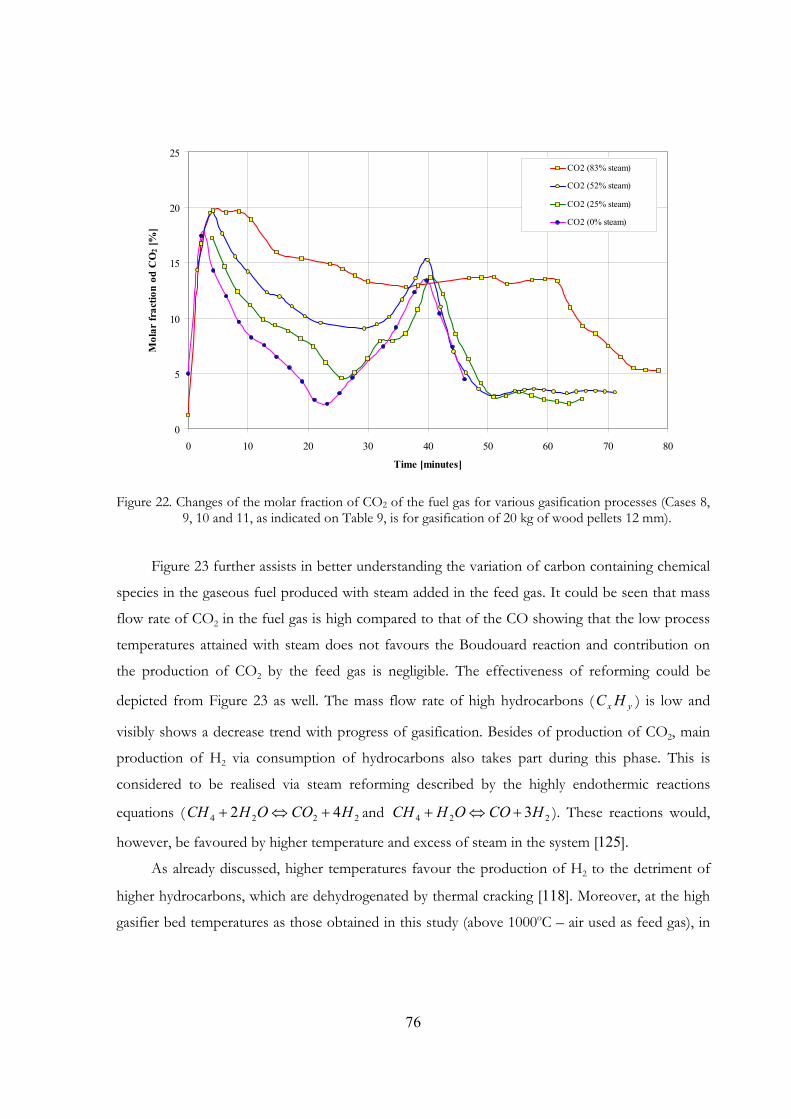
76
0
5
10
15
20
25
0 10 20 30 40 50 60 70 80
Time [minutes]
Mol
ar fr
actio
n od
CO
2 [%
]CO2 (83% steam)
CO2 (52% steam)
CO2 (25% steam)
CO2 (0% steam)
Figure 22. Changes of the molar fraction of CO2 of the fuel gas for various gasification processes (Cases 8, 9, 10 and 11, as indicated on Table 9, is for gasification of 20 kg of wood pellets 12 mm).
Figure 23 further assists in better understanding the variation of carbon containing chemical
species in the gaseous fuel produced with steam added in the feed gas. It could be seen that mass
flow rate of CO2 in the fuel gas is high compared to that of the CO showing that the low process
temperatures attained with steam does not favours the Boudouard reaction and contribution on
the production of CO2 by the feed gas is negligible. The effectiveness of reforming could be
depicted from Figure 23 as well. The mass flow rate of high hydrocarbons ( yx HC ) is low and
visibly shows a decrease trend with progress of gasification. Besides of production of CO2, main
production of H2 via consumption of hydrocarbons also takes part during this phase. This is
considered to be realised via steam reforming described by the highly endothermic reactions
equations ( 2224 42 HCOOHCH +⇔+ and 224 3HCOOHCH +⇔+ ). These reactions would,
however, be favoured by higher temperature and excess of steam in the system [125].
As already discussed, higher temperatures favour the production of H2 to the detriment of
higher hydrocarbons, which are dehydrogenated by thermal cracking [118]. Moreover, at the high
gasifier bed temperatures as those obtained in this study (above 1000oC – air used as feed gas), in
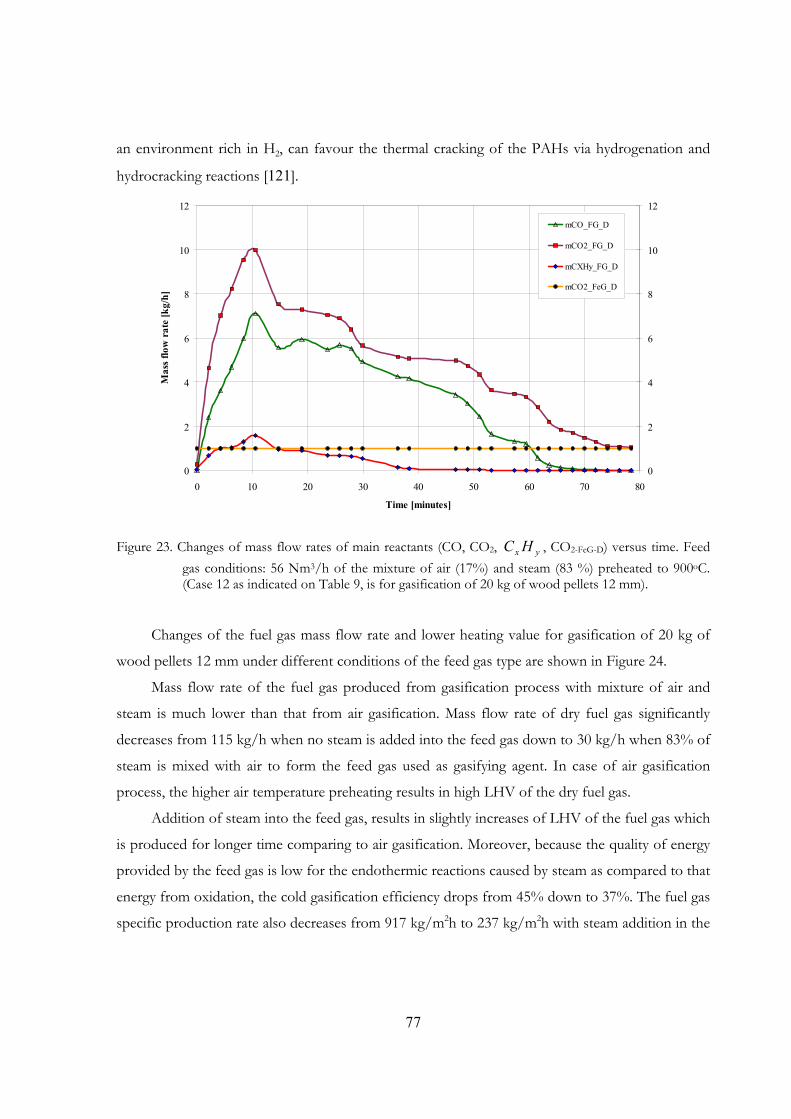
77
an environment rich in H2, can favour the thermal cracking of the PAHs via hydrogenation and
hydrocracking reactions [121].
0
2
4
6
8
10
12
0 10 20 30 40 50 60 70 80
Time [minutes]
Mas
s flo
w r
ate
[kg/
h]
0
2
4
6
8
10
12
mCO_FG_D
mCO2_FG_D
mCXHy_FG_D
mCO2_FeG_D
Figure 23. Changes of mass flow rates of main reactants (CO, CO2, yx HC , CO2-FeG-D) versus time. Feed gas conditions: 56 Nm3/h of the mixture of air (17%) and steam (83 %) preheated to 900oC. (Case 12 as indicated on Table 9, is for gasification of 20 kg of wood pellets 12 mm).
Changes of the fuel gas mass flow rate and lower heating value for gasification of 20 kg of
wood pellets 12 mm under different conditions of the feed gas type are shown in Figure 24.
Mass flow rate of the fuel gas produced from gasification process with mixture of air and
steam is much lower than that from air gasification. Mass flow rate of dry fuel gas significantly
decreases from 115 kg/h when no steam is added into the feed gas down to 30 kg/h when 83% of
steam is mixed with air to form the feed gas used as gasifying agent. In case of air gasification
process, the higher air temperature preheating results in high LHV of the dry fuel gas.
Addition of steam into the feed gas, results in slightly increases of LHV of the fuel gas which
is produced for longer time comparing to air gasification. Moreover, because the quality of energy
provided by the feed gas is low for the endothermic reactions caused by steam as compared to that
energy from oxidation, the cold gasification efficiency drops from 45% down to 37%. The fuel gas
specific production rate also decreases from 917 kg/m2h to 237 kg/m2h with steam addition in the

78
feed gas. To overcome the problem of energy for the endothermic reaction, very high temperature
superheated steam flame (1727oC) has been used to effectively perform reforming [124].
0
20
40
60
80
100
120
140
0 10 20 30 40 50 60 70 80
Time [minutes]
Mas
s flo
w [k
g/h]
0
5
10
15
20
25
30
35
LH
V [M
J/N
m3 ]
mFG_D (0% steam)mFG_D (25% steam)
mFG_D (52% steam)mFG_D (83% steam)
LHV (0% steam)LHV (25% steam)LHV (52% steam)
LHV (83% steam)
Figure 24. Changes of the mass flow rate and LHV of the fuel gas for various gasification processes (Cases 9, 10, 11 and 12, as indicated on Table 9, is for gasification of 20 kg of wood pellets 12 mm).
The process temperature response to the change of the feed gas conditions with respect to
molar fraction of steam and preheating temperature is presented in Figure 25. The results ploted in
this graph showed that the use of steam in the feed gas significantyly decreases the process
temperature (Tb1 and Tog1). The gasifier bed temperature (Tb1) goes up to about 1300oC when feed
gas (only air) is preheated to 830oC. This is considered to be due to the fact that the sensible heat
of the preheated air brought to the reactants induces an increase in the temperature of the fuel
bed. However, this temperature does decrease to about 830oC and 750oC when molar fraction of
steam is increased up to 52% and 83%, respectively.

79
0
200
400
600
800
1000
1200
1400
0 10 20 30 40 50 60 70 80
Time [minutes]
Tem
pera
ture
, o C
Tb1 (0% steam)
Tb1 (52% steam)
Tb1 (83% steam)Tog1 (0% steam)
Tog1 (52% steam)
Tog1 (83% steam)
Figure 25 Changes of process temperature for various wood pellets gasification processes (Cases 9, 11 and 12, as indicated on Table 9, are for gasification of 20 kg of wood pellets 12 mm).
The influence of steam on performance of the gasification process is further summarised by
graphically comparing LHV and fuel gas composition as displayed in Figure 26 (average values as
taken from Phase II). There is a difference in the molar fractions of gases generated as well as in
the energy contents of the gas mixtures that form the fuel gas. Again, the most pronounced
difference is that of the molar fraction of H2 and CO in the gaseous fuel. It is well known that
high gasifier bed temperature (Tb1>1000oC) such as that shown for the case air as feed gas favours
the endothermic Boudouard reaction [90,126], and as shown in this work, this explains the high
molar fraction of CO obtained when only air is used compared to the gasification with mixture of
air and steam. However, this level of temperature is not attained when steam is used in the feed
gas due to the above discussed effect of water-gas shift reaction.
It should be added that the water gas shift reaction determines to a large extent the final gas
composition [25,27,39,58]. The equilibrium constant (Kw) can be written as [ ] [ ][ ] [ ]OHCO
HCOKw2
22
××
= .
In practice, the equilibrium composition of the gas will only be reached in cases where the reaction
rate and the time for reaction are sufficient. Below 700°C the water gas shift becomes so slow -

80
without a catalyst- that the equilibrium is said to be “frozen” [39]. The gas composition then
remains unchanged.It has been concluded that only at temperatures above about 700oC does the
water-shift reaction determine the gas composition [25,27,58].
7.
3 7.6
10.4
20.0
24.9
29.9
29.4
23.8
18.4
6.5 8.
7
12.4
16.2
2.5
2.5 2.7
2.8
1.3
1.0
1.2
1.1
8.2
8.2
23.2
0
5
10
15
20
25
30
35
40
11 14 12 13Molar fraction of steam in feed gas [%]
LH
V [
MJ/
Nm3 ] a
nd M
olar
frac
tion
of H
2, C
O,
CO
2, C
xHy [
%]
LHV H2 CO CO2 CH4 CxHy (x>1)Feedstock: Wood pellets 12mmFeed gas flow: 50-55 Nm3/hMass of fuel: 20 kgxH2O: 830-920oC
0 25 52 83
Figure 26. Influence of molar fraction of steam on the average values of composition and lower heating value of the fuel gas taken at the average value during gasification of 20 kg of wood pellets 12 mm.
Expectedly, and with the reasons extensively discussed above, significant increase of H2 is
observed from 10.4% up to 20.0%, when the molar fraction of steam increases from 0% up to
25% (Figure 26). Beyond 25%, molar fraction of H2 steadly increases up to 24.9% corresponding
to 83% of steam in the feed gas. In contrary, for the same range of molar fraction of steam (25% -
83%), the molar fraction of CO exhibits a steady decrease trend from 29.4% down to 18.4%.
Steady increase on the molar fraction of CO2 is also shown in Figure 26, ranging from 6.5% up to
16.2%, within the range 0% - 83% of steam in the feed gas. Molar fraction of CH4 seems not be
affected by steam in the interval 0% - 25%, but then shows an increase trend (2.5% - 2.8%) on the
interval of molar fraction of steam of 25% - 83%. Hydrocarbons also show little variation with
steam.
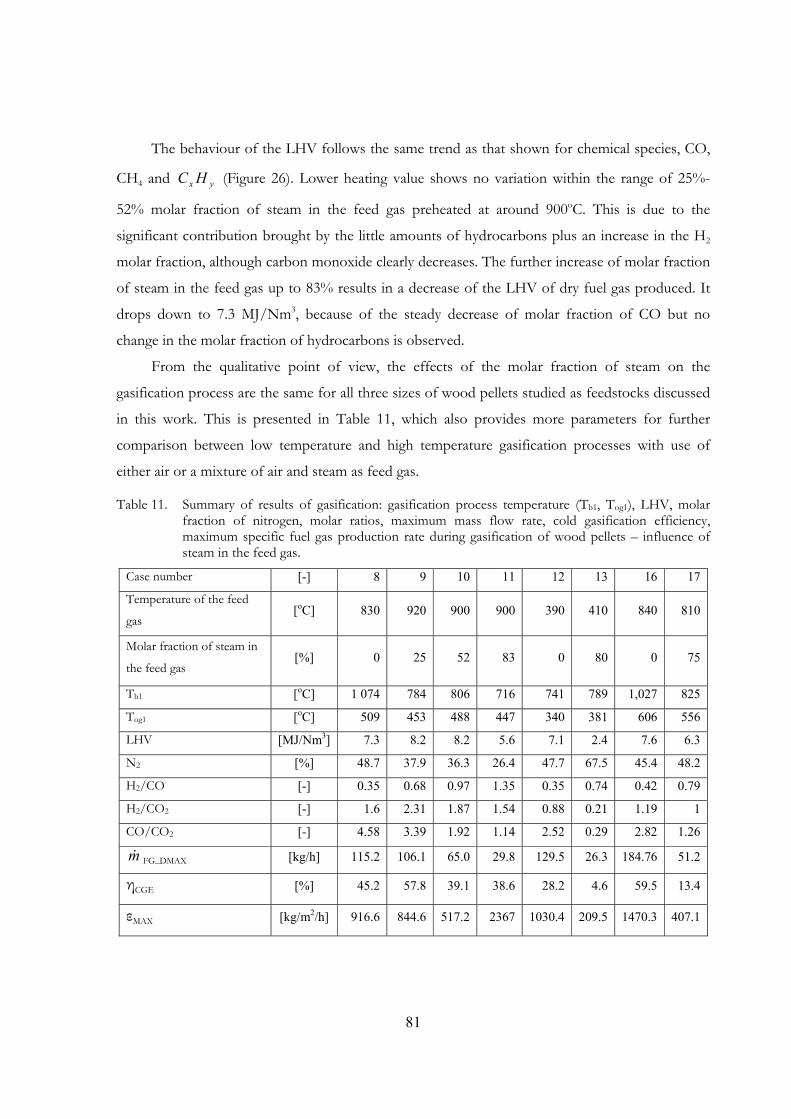
81
The behaviour of the LHV follows the same trend as that shown for chemical species, CO,
CH4 and yx HC (Figure 26). Lower heating value shows no variation within the range of 25%-
52% molar fraction of steam in the feed gas preheated at around 900oC. This is due to the
significant contribution brought by the little amounts of hydrocarbons plus an increase in the H2
molar fraction, although carbon monoxide clearly decreases. The further increase of molar fraction
of steam in the feed gas up to 83% results in a decrease of the LHV of dry fuel gas produced. It
drops down to 7.3 MJ/Nm3, because of the steady decrease of molar fraction of CO but no
change in the molar fraction of hydrocarbons is observed.
From the qualitative point of view, the effects of the molar fraction of steam on the
gasification process are the same for all three sizes of wood pellets studied as feedstocks discussed
in this work. This is presented in Table 11, which also provides more parameters for further
comparison between low temperature and high temperature gasification processes with use of
either air or a mixture of air and steam as feed gas.
Table 11. Summary of results of gasification: gasification process temperature (Tb1, Tog1), LHV, molar fraction of nitrogen, molar ratios, maximum mass flow rate, cold gasification efficiency, maximum specific fuel gas production rate during gasification of wood pellets – influence of steam in the feed gas.
Case number [-] 8 9 10 11 12 13 16 17
Temperature of the feed
gas [oC] 830 920 900 900 390 410 840 810
Molar fraction of steam in
the feed gas [%] 0 25 52 83 0 80 0 75
Tb1 [oC] 1 074 784 806 716 741 789 1,027 825
Tog1 [oC] 509 453 488 447 340 381 606 556
LHV [MJ/Nm3] 7.3 8.2 8.2 5.6 7.1 2.4 7.6 6.3
N2 [%] 48.7 37.9 36.3 26.4 47.7 67.5 45.4 48.2
H2/CO [-] 0.35 0.68 0.97 1.35 0.35 0.74 0.42 0.79
H2/CO2 [-] 1.6 2.31 1.87 1.54 0.88 0.21 1.19 1
CO/CO2 [-] 4.58 3.39 1.92 1.14 2.52 0.29 2.82 1.26
m& FG_DMAX [kg/h] 115.2 106.1 65.0 29.8 129.5 26.3 184.76 51.2
ηCGE [%] 45.2 57.8 39.1 38.6 28.2 4.6 59.5 13.4
εMAX [kg/m2/h] 916.6 844.6 517.2 2367 1030.4 209.5 1470.3 407.1

82
As for the case with wood pellets 12 mm, steam in the feed gas causes decreases in the mass
flow rate, cold gasification and specific gasification production rate for wood pellets 8 mm and 6
mm as well (Table 11). The most significant decrease of these three parameters could be seen on
the case of 80 Nm3/h of feed gas (with 80% of steam) preheated at low temperature, 410oC.
Overall results with this low preheat temperature just confirms that higher temperatures would be
beneficial in providing required heat to perform the endothermic steam reforming.
9.4. Effect of feed gas volume flow rate
The composition of the fuel gas and the corresponding lower heating value at average values
taken from Phase II, as functions of the air volume flow rate preheated at 530oC, for the case of
gasification of wood pellets (12 mm), are reported in Figure 27. This figure shows that the quantity
of air supplied to the gasifier control the quantity of gas generated and consequently the
gasification rate (see Table 12). These trends were also observed in other works [59] when biomass
gasification in a commercial updraft fixed bed gasifier with use of air and steam as feed gas was
carried out.
5.7 6.
9
6.98.
7
8.7 9.0
8.3
21.6
26.2 27
.5 28.6 29
.5
9.5
7.6
6.2
6.1
4.8
3.2
3.3
3.0
2.8
2.3
0.6
0.6
0.6 1.3 1.5
6.36.3 8.
6
0
5
10
15
20
25
30
35
40
7 6 5 17 18
Flow of feed gas [Nm3/h]
LH
V [
MJ/
Nm3 ] a
nd M
olar
frac
tion
of H
2, C
O,
CO
2, C
xHy [
%]
LHV H2 CO
CO2 CH4 CxHy (x>1)
Feedstock: Wood pellets 12mmTemperature: 530oCMass of fuel: 20 kgxH2O: 0%
50 70 1004030
Figure 27. Influence of volume flow rate of the feed gas on the composition of fuel gas and LHV taken at the average value - Gasification of 20 kg of wood pellets 12 mm.
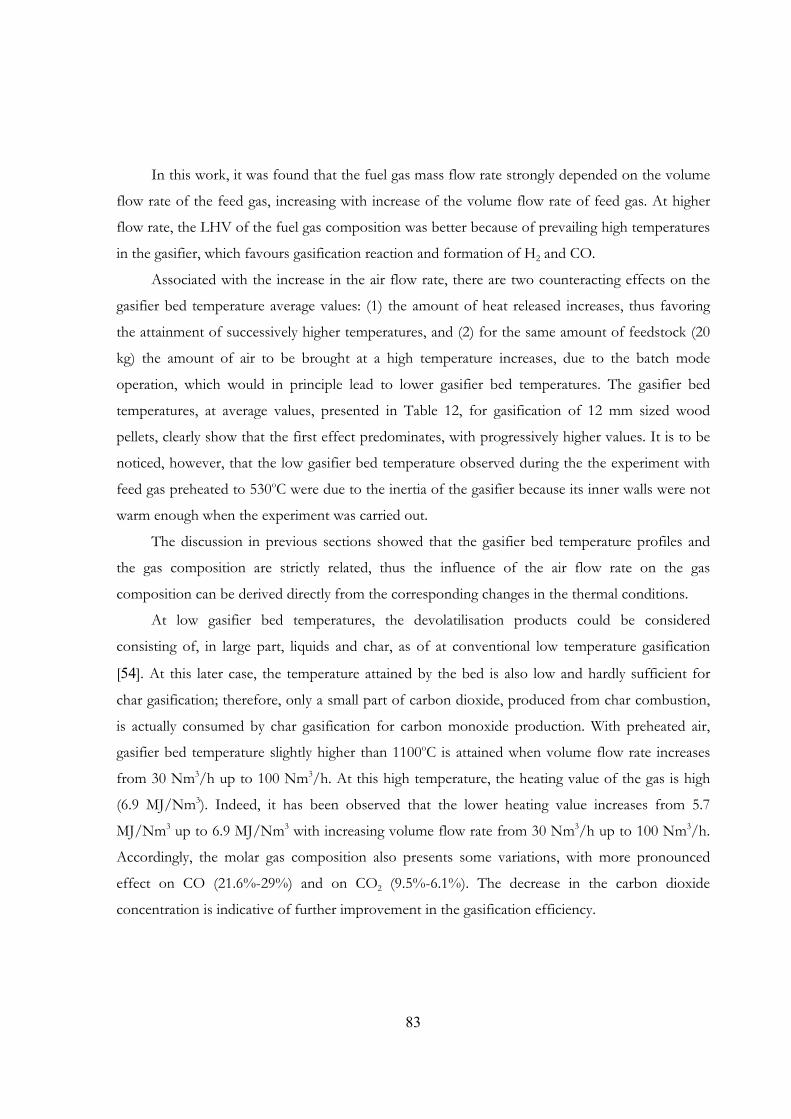
83
In this work, it was found that the fuel gas mass flow rate strongly depended on the volume
flow rate of the feed gas, increasing with increase of the volume flow rate of feed gas. At higher
flow rate, the LHV of the fuel gas composition was better because of prevailing high temperatures
in the gasifier, which favours gasification reaction and formation of H2 and CO.
Associated with the increase in the air flow rate, there are two counteracting effects on the
gasifier bed temperature average values: (1) the amount of heat released increases, thus favoring
the attainment of successively higher temperatures, and (2) for the same amount of feedstock (20
kg) the amount of air to be brought at a high temperature increases, due to the batch mode
operation, which would in principle lead to lower gasifier bed temperatures. The gasifier bed
temperatures, at average values, presented in Table 12, for gasification of 12 mm sized wood
pellets, clearly show that the first effect predominates, with progressively higher values. It is to be
noticed, however, that the low gasifier bed temperature observed during the the experiment with
feed gas preheated to 530oC were due to the inertia of the gasifier because its inner walls were not
warm enough when the experiment was carried out.
The discussion in previous sections showed that the gasifier bed temperature profiles and
the gas composition are strictly related, thus the influence of the air flow rate on the gas
composition can be derived directly from the corresponding changes in the thermal conditions.
At low gasifier bed temperatures, the devolatilisation products could be considered
consisting of, in large part, liquids and char, as of at conventional low temperature gasification
[54]. At this later case, the temperature attained by the bed is also low and hardly sufficient for
char gasification; therefore, only a small part of carbon dioxide, produced from char combustion,
is actually consumed by char gasification for carbon monoxide production. With preheated air,
gasifier bed temperature slightly higher than 1100oC is attained when volume flow rate increases
from 30 Nm3/h up to 100 Nm3/h. At this high temperature, the heating value of the gas is high
(6.9 MJ/Nm3). Indeed, it has been observed that the lower heating value increases from 5.7
MJ/Nm3 up to 6.9 MJ/Nm3 with increasing volume flow rate from 30 Nm3/h up to 100 Nm3/h.
Accordingly, the molar gas composition also presents some variations, with more pronounced
effect on CO (21.6%-29%) and on CO2 (9.5%-6.1%). The decrease in the carbon dioxide
concentration is indicative of further improvement in the gasification efficiency.
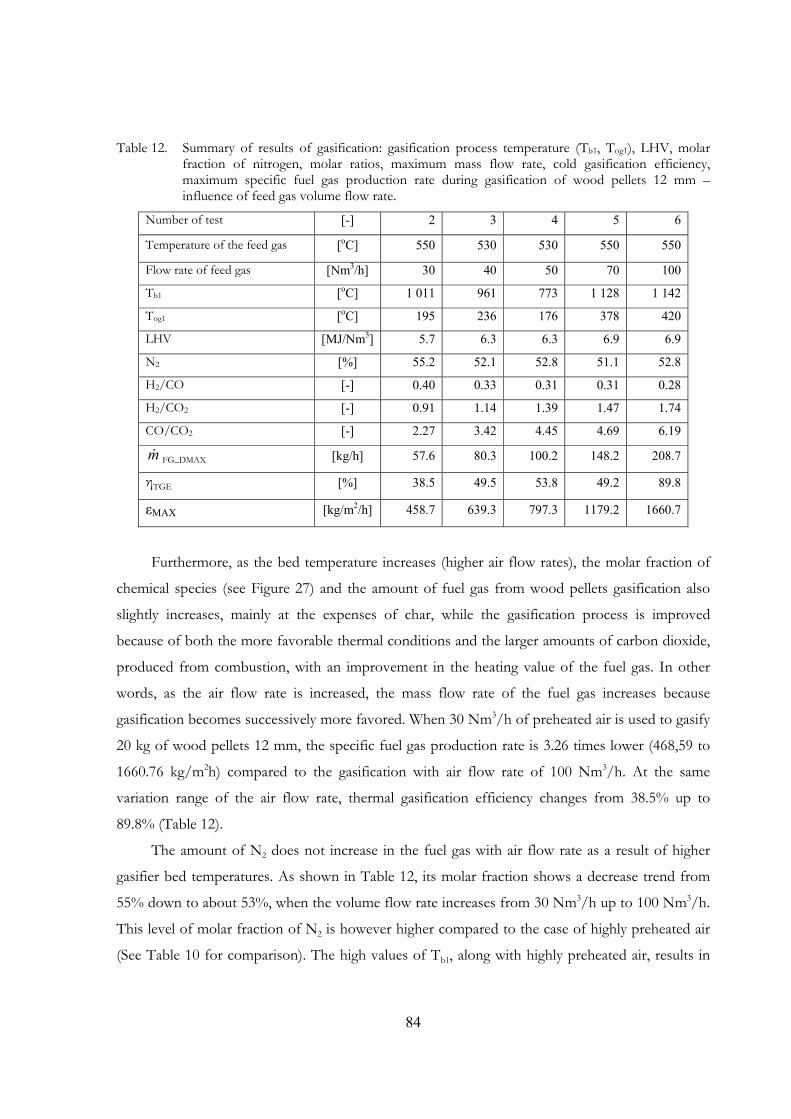
84
Table 12. Summary of results of gasification: gasification process temperature (Tb1, Tog1), LHV, molar fraction of nitrogen, molar ratios, maximum mass flow rate, cold gasification efficiency, maximum specific fuel gas production rate during gasification of wood pellets 12 mm – influence of feed gas volume flow rate.
Number of test [-] 2 3 4 5 6
Temperature of the feed gas [oC] 550 530 530 550 550
Flow rate of feed gas [Nm3/h] 30 40 50 70 100
Tb1 [oC] 1 011 961 773 1 128 1 142
Tog1 [oC] 195 236 176 378 420
LHV [MJ/Nm3] 5.7 6.3 6.3 6.9 6.9
N2 [%] 55.2 52.1 52.8 51.1 52.8
H2/CO [-] 0.40 0.33 0.31 0.31 0.28
H2/CO2 [-] 0.91 1.14 1.39 1.47 1.74
CO/CO2 [-] 2.27 3.42 4.45 4.69 6.19
m& FG_DMAX [kg/h] 57.6 80.3 100.2 148.2 208.7
ηTGE [%] 38.5 49.5 53.8 49.2 89.8
εMAX [kg/m2/h] 458.7 639.3 797.3 1179.2 1660.7
Furthermore, as the bed temperature increases (higher air flow rates), the molar fraction of
chemical species (see Figure 27) and the amount of fuel gas from wood pellets gasification also
slightly increases, mainly at the expenses of char, while the gasification process is improved
because of both the more favorable thermal conditions and the larger amounts of carbon dioxide,
produced from combustion, with an improvement in the heating value of the fuel gas. In other
words, as the air flow rate is increased, the mass flow rate of the fuel gas increases because
gasification becomes successively more favored. When 30 Nm3/h of preheated air is used to gasify
20 kg of wood pellets 12 mm, the specific fuel gas production rate is 3.26 times lower (468,59 to
1660.76 kg/m2h) compared to the gasification with air flow rate of 100 Nm3/h. At the same
variation range of the air flow rate, thermal gasification efficiency changes from 38.5% up to
89.8% (Table 12).
The amount of N2 does not increase in the fuel gas with air flow rate as a result of higher
gasifier bed temperatures. As shown in Table 12, its molar fraction shows a decrease trend from
55% down to about 53%, when the volume flow rate increases from 30 Nm3/h up to 100 Nm3/h.
This level of molar fraction of N2 is however higher compared to the case of highly preheated air
(See Table 10 for comparison). The high values of Tb1, along with highly preheated air, results in
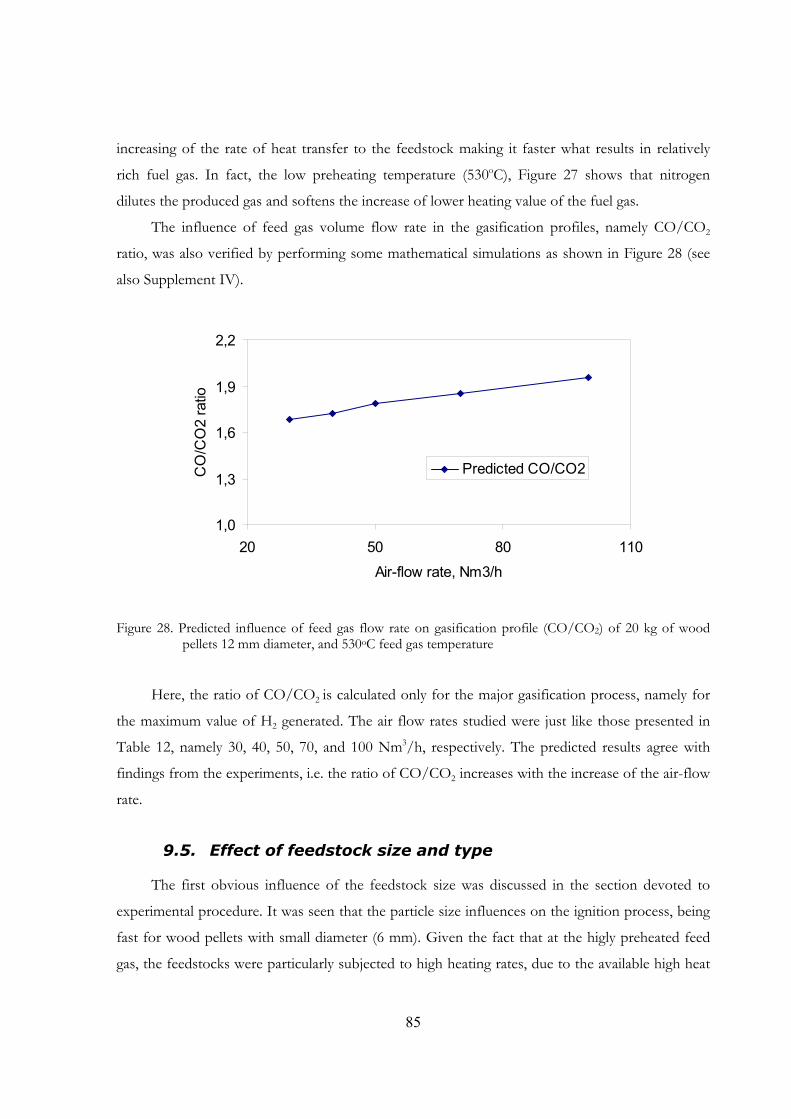
85
increasing of the rate of heat transfer to the feedstock making it faster what results in relatively
rich fuel gas. In fact, the low preheating temperature (530oC), Figure 27 shows that nitrogen
dilutes the produced gas and softens the increase of lower heating value of the fuel gas.
The influence of feed gas volume flow rate in the gasification profiles, namely CO/CO2
ratio, was also verified by performing some mathematical simulations as shown in Figure 28 (see
also Supplement IV).
1,0
1,3
1,6
1,9
2,2
20 50 80 110
Air-flow rate, Nm3/h
CO
/CO
2 ra
tio
Predicted CO/CO2
Figure 28. Predicted influence of feed gas flow rate on gasification profile (CO/CO2) of 20 kg of wood pellets 12 mm diameter, and 530oC feed gas temperature
Here, the ratio of CO/CO2 is calculated only for the major gasification process, namely for
the maximum value of H2 generated. The air flow rates studied were just like those presented in
Table 12, namely 30, 40, 50, 70, and 100 Nm3/h, respectively. The predicted results agree with
findings from the experiments, i.e. the ratio of CO/CO2 increases with the increase of the air-flow
rate.
9.5. Effect of feedstock size and type
The first obvious influence of the feedstock size was discussed in the section devoted to
experimental procedure. It was seen that the particle size influences on the ignition process, being
fast for wood pellets with small diameter (6 mm). Given the fact that at the higly preheated feed
gas, the feedstocks were particularly subjected to high heating rates, due to the available high heat

86
flux inside the gasifier, faster heat up occurred with smaller particles diameter (6 mm) because of
its the higher surface/mass ratio as reported in the literature [54].
This behaviour was also predicted using mathematical model described in this work. As
shown in Figure 29 gasification process of wood pellets with 6 mm diameter was finished at the
time equal to 1780 s while process time larger than 3600 s for the size of feedstock equals to
19 mm .
0
10
20
30
0 20 40 60
Time, [min]
Dry
Com
posi
tion
[mol
%]
CmHnCOH2O2CO2
0
10
20
30
0 20 40 60
Time, [min]
Dry
Com
posi
tion
[mol
%]
CmHn CO
H2 O2
CO2
(a) (b) Figure 29. Influence of the size of biomass on the gasification process predicted using parameters:
50 Nm3/h of air preheated up to 830 oC and 20 kg of wood pellets with following diameters: (a) 6 mm (b) 19 mm.
Although changes in porosity can lead to the opposite tendency, i.e., a drop in reactivity with
decreasing particle size [127], it is generally assumed, however, that an increase in particle size
causes greater temperature gradients inside the particle so that at a given time the core temperature
is lower than that at the surface [128].
As stated in the literature [58], there is dependence between the product gas composition
and the hydrogen-to-oxygen ratio in the feedstock: higher H2/CO gas yields could be obtained
with feedstock having a higher H/O ratio. However, the H/O ratio of all wood pellets studied
have similar H/O molar ratio (0.14). The following comparison was realized between the two sizes
of wood pellets (8 mm and 6 mm) because the gasification conditions were similar. High particle
size diameter did yield higher H2/CO ratio, as shown in Table 13. Slight differences could be seen
in the H/C molar ratios resulting in equally slight differences in the H2/CO ratio. Furthermore,
calorific value of wood pellets 6 mm shows no change when changing the temperature of feed gas
87
from 570oC to 840oC. This phenomenon is associated with the decrease of molar fraction of CO
and no variation of CH4 in both low and higher feed gas temperature.
Table 13. Comparison of the wood pellets (8 mm and 6 mm) for gasification with volume flow rate of air of 80 Nm3/h preheated at low and high temperature – Influence of size diameter.
Number of test [-] 14 18 16 19
Temperature of the feed gas [oC] 560 570 840 840
Wood pellets size (diameter) [mm] 8 6 8 6
H/C [-] 1.72 1.65 1.72 1.65
H/O [-] 0.14 0.15 0.14 0.15
O/C [-] 0.76 0.7 0.76 0.7
LHV [MJ/Nm3] 7.1 6.9 7.6 6.9
H2 [%] 9.3 9.3 11.7 10
CH4 [%] 3.6 2.4 2.9 2.4
CO [%] 26.7 29 27.7 25.4
CO2 [%] 10.6 9 9.8 9.6
H2/CO [-] 0.35 0.32 0.42 0.39
H2/CO2 [-] 0.88 1.03 1.19 1.03
CO/CO2 [-] 2.52 3.23 2.82 2.64
It is known that the fuel size affects the pressure drop across the gasifier and power that
must be supplied to draw the air and gas through gasifier. Large pressure drops will lead to
reduction of the gas load in a gasifier, resulting in low temperature and tar production. Excessively
large sizes of particles give rise to reduced reactivity of fuel, causing start-up problems and poor
gas quality. Pressure drop was monitored via U-tube pressure manometer and it was noticed no
variation with any size of the feedstock studied.
As for the feedstock type it concerns, the main conclusion to be made is that of the
difference on the mass of charge causing rapid ignition and with gasification experiment lasting
very short period of time for the low bulk density biomass feedstock such as bark and wood chips.
Although with low mass of charge, the duration of experiment with charcoal and the evolution of
the properties characterising the gasifier were similar to for the case of gasification of wood pellets.

88
9.6. Tar evolution
The literature does not provide any uniform definition of the term "tar species". Commonly,
all aromatic hydrocarbons are grouped together under this term. According to this definition,
benzene is one of the tar species as well. So far no well developed and standardised measurement
method exists for tars in biomass fuel gases, and different sampling and analysis methods are
currently being used [129]. Under the European Union Energy project EEN5-1999-00507 (Tar
protocol) a Guideline for tar measurement ("the Guideline") was developed in order to remove
this obstacle [129]. The Guideline aims at measurement of both gravimetric tars as well as
individual organic compounds. The measurement principle is based on the discontinuous sampling
of a gas stream containing particles and condensable organic compounds. The "Tar Guideline"
activities continue now in a new European Union project, the "Tar measurement Standard, which
aims at the standardization of this sampling and analysis method at CEN (Comité Européen de
Normalisation) [129].
The effect of low and high gasifier bed temperature on the tar evolution is discussed in this
study based on experiments performed with low and highly preheated feed gas. For the case of
updraft fixed bed gasifier, the effect of steam is studied by adding steam into air and progressively
preheating the mixture up to 410oC.
Attempt is made to compare the extent of tar destruction at high temperature air and steam
gasification using updraft fixed bed and updraft continuous gasifier.
At this point, it is worth to recall that updraft gasifiers operating at low gasification
temperature are useful for producing gases to be burned at exit temperature, but the high tar level
makes them difficult to clean for other purposes [47]. Through forced convection, the gas heated
by oxidation in a bottom zone rises and transfers heat to the fuel. The gas leaves the gasifier with a
relatively low temperature, which indicates a high gasification efficiency of this process. The
drawback of it results from volatile matter, produced in the pyrolysis zone, which is carried in the
rising gas stream. In consequence, the raw gas of counter-current gasifiers contains a considerable
amount of tar compounds [64]. This work, however, shows the capability of the highly preheated
feed gas in tar destruction.
An example of plots of all known chemical compounds of biomass tars detected with SPA
method as neutral and polar fractions is shown in Figure 30. From this figure it is evident that
apart from benzene, toluene is the most abundant constituent followed by phenol, naphthalene,
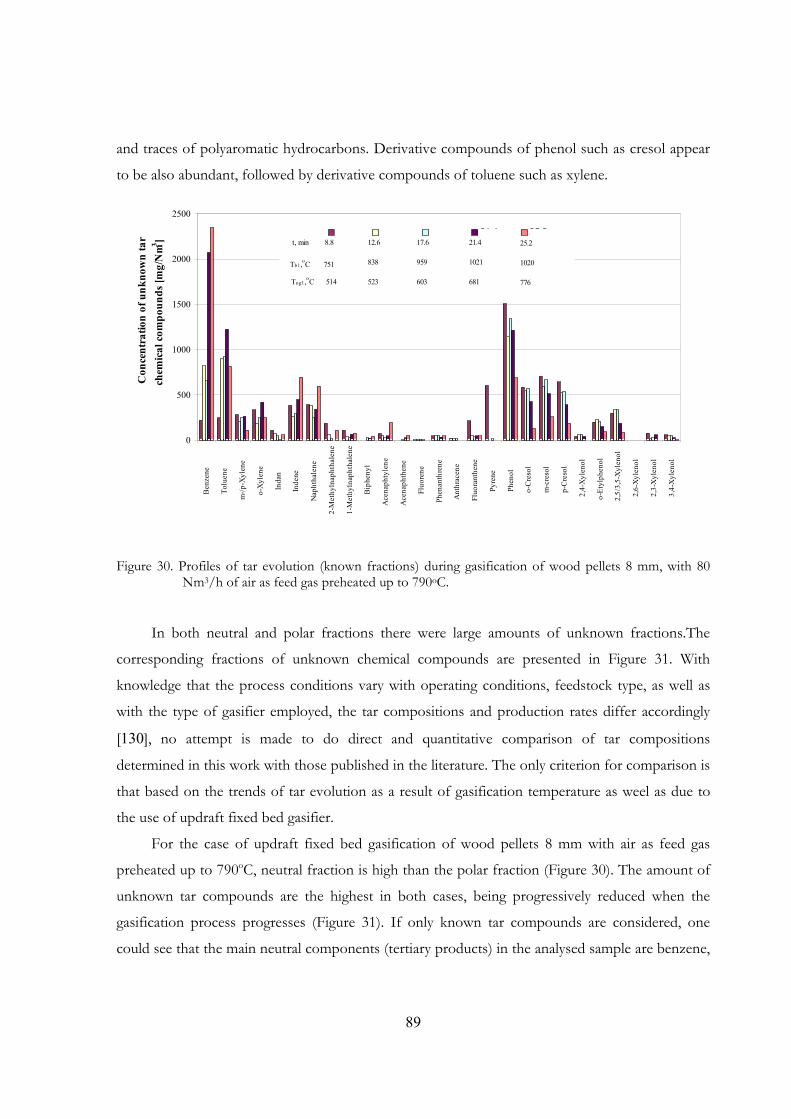
89
and traces of polyaromatic hydrocarbons. Derivative compounds of phenol such as cresol appear
to be also abundant, followed by derivative compounds of toluene such as xylene.
0
500
1000
1500
2000
2500B
enze
ne
Tolu
ene
m-/p
-Xyl
ene
o-X
ylen
e
Inda
n
Inde
ne
Nap
htha
lene
2-M
ethy
lnap
htha
lene
1-M
ethy
lnap
htha
lene
Bip
heny
l
Ace
naph
tyle
ne
Ace
naph
then
e
Fluo
rene
Phen
anth
rene
Ant
hrac
ene
Fluo
rant
hene
Pyre
ne
Phen
ol
o-C
reso
l
m-c
reso
l
p-C
reso
l
2,4-
Xyl
enol
o-Et
ylph
enol
2,5/
3,5-
Xyl
enol
2,6-
Xyl
enol
2,3-
Xyl
enol
3,4-
Xyl
enol
Con
cent
ratio
n of
unk
now
n ta
rch
emic
al c
ompo
unds
[mg/
Nm3 ]
8.8 12.6 17.6 21.4 25.2 t, min 8.8
Tb1,oC 751
12.6
838
523
17.6
959
603
21.4
1021
681
25.2
1020
776Tog1,oC 514
Figure 30. Profiles of tar evolution (known fractions) during gasification of wood pellets 8 mm, with 80 Nm3/h of air as feed gas preheated up to 790oC.
In both neutral and polar fractions there were large amounts of unknown fractions.The
corresponding fractions of unknown chemical compounds are presented in Figure 31. With
knowledge that the process conditions vary with operating conditions, feedstock type, as well as
with the type of gasifier employed, the tar compositions and production rates differ accordingly
[130], no attempt is made to do direct and quantitative comparison of tar compositions
determined in this work with those published in the literature. The only criterion for comparison is
that based on the trends of tar evolution as a result of gasification temperature as weel as due to
the use of updraft fixed bed gasifier.
For the case of updraft fixed bed gasification of wood pellets 8 mm with air as feed gas
preheated up to 790oC, neutral fraction is high than the polar fraction (Figure 30). The amount of
unknown tar compounds are the highest in both cases, being progressively reduced when the
gasification process progresses (Figure 31). If only known tar compounds are considered, one
could see that the main neutral components (tertiary products) in the analysed sample are benzene,
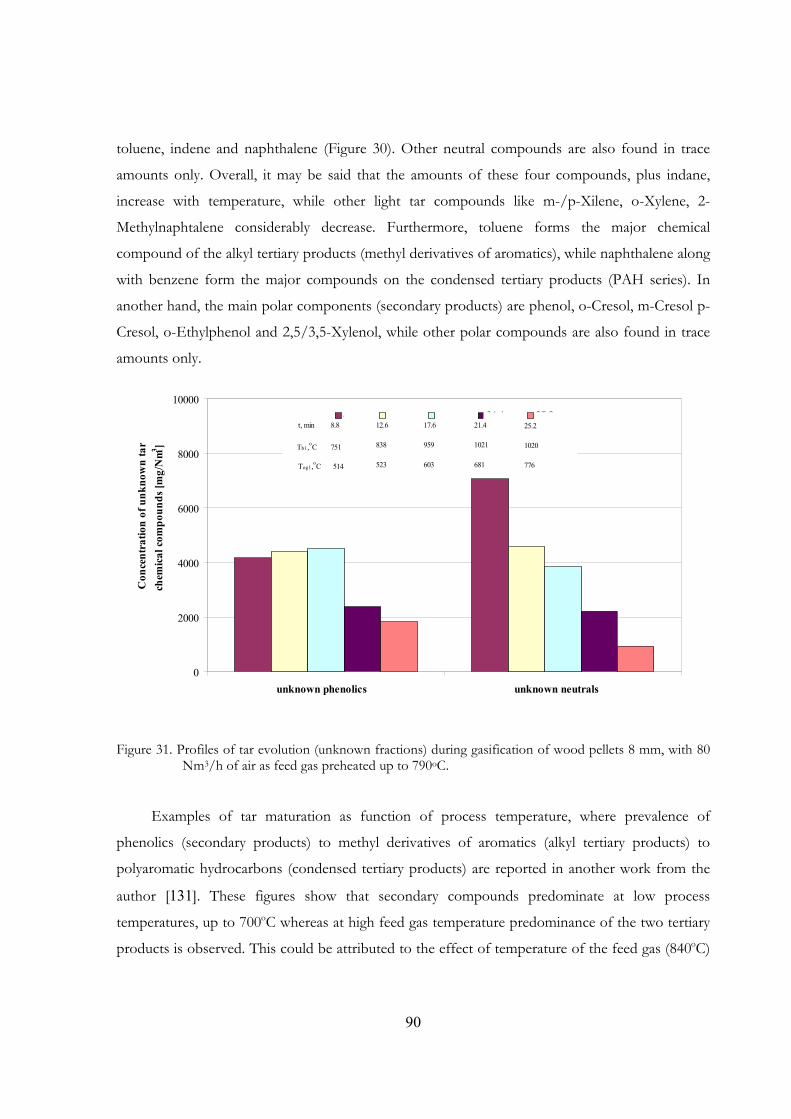
90
toluene, indene and naphthalene (Figure 30). Other neutral compounds are also found in trace
amounts only. Overall, it may be said that the amounts of these four compounds, plus indane,
increase with temperature, while other light tar compounds like m-/p-Xilene, o-Xylene, 2-
Methylnaphtalene considerably decrease. Furthermore, toluene forms the major chemical
compound of the alkyl tertiary products (methyl derivatives of aromatics), while naphthalene along
with benzene form the major compounds on the condensed tertiary products (PAH series). In
another hand, the main polar components (secondary products) are phenol, o-Cresol, m-Cresol p-
Cresol, o-Ethylphenol and 2,5/3,5-Xylenol, while other polar compounds are also found in trace
amounts only.
0
2000
4000
6000
8000
10000
unknown phenolics unknown neutrals
Con
cent
ratio
n of
unk
now
n ta
rch
emic
al c
ompo
unds
[mg/
Nm3 ]
8.8 12.6 17.6 21.4 25.2 t, min 8.8
Tb1,oC 751
12.6
838
523
17.6
959
603
21.4
1021
681
25.2
1020
776Tog1,oC 514
Figure 31. Profiles of tar evolution (unknown fractions) during gasification of wood pellets 8 mm, with 80 Nm3/h of air as feed gas preheated up to 790oC.
Examples of tar maturation as function of process temperature, where prevalence of
phenolics (secondary products) to methyl derivatives of aromatics (alkyl tertiary products) to
polyaromatic hydrocarbons (condensed tertiary products) are reported in another work from the
author [131]. These figures show that secondary compounds predominate at low process
temperatures, up to 700oC whereas at high feed gas temperature predominance of the two tertiary
products is observed. This could be attributed to the effect of temperature of the feed gas (840oC)
91
which induces heat to the bed providing conditions favouring reaction severity with consequent
cracking of phenolics.
The amount of primary tar converted to gases increases markedly with increased
temperature, as previously shown in Figure 17. According to literature, at temperatures above
500°C the primary tar will crack into low molecular gases, such as methane, ethane and hydrogen
[18]. Thus a high gas production observed in this work was achieved at high gasification
temperatures (900°C and above).
Comparing gasification cases 14 (560oC), 15 (790oC) and 16 (840oC) it could be seen that
with increasing process temperatures, the tar content shows a drastic drop. If the results displayed
in the Figures shown in the previous work [131] are compared to that on Figure 17 it could be
seen that increasing temperature promotes the formation of gaseous products at the expense
of tar.
92
10. Conclusions
The focus of this work was on the influence of process parameters like feed gas temperature,
feed gas volume flow rate, feed gas composition (air or mixture of air and steam), feedstock
particle size and feedstock type on fuel gas quality and distribution, during gasification of biomass
on high temperature air and steam in an updraft fixed bed gasifier. This was studied, based on the
fuel gas produced with respect to: composition, lower heating value, cold gasification efficiency,
mass flow rate, specific gasification rate and tar composition. The results obtained allow drawing
the following major conclusions:
1. Experiments conducted in the updraft fixed bed batch type gasifier with use of high
temperature air and steam as feed gas have shown that the feedstock type and composition
has influence on the performance of the gaisfier. Although all feedstocks have shown
similar behaviour with respect to improved quality of the fuel produced, the batch mode
operation of the gasifier did conditioned the mass of charge, being lower for low bulk
density biomass fuels and for charcoal. Owing to its composition, gasification of charcoal,
however, did yield fuel gas with similar magnitude of quality as was with wood pellets.
2. Preheating of air used as feed gas provided conditions for the temperature of the gasifier
bed to be kept above 1000oC (with spots of approx. 1300oC) with resulting creation of
higher heating rates, that favoured fuel gas produced having high molar fractions of H2,
CO and CH4, but also noticeable quantities of higher hydrocarbons, particularly increasing
with the temperature.
3. An increase of the feed gas temperature reduces production of tars and increases calorific
value of the fuel gas produced, cold gasification efficiency and specific gas production rate.
4. The average lower heating value of the fuel gas produced with wood pellets is in the range
4.7 MJ/Nm3 to 7.6 MJ/Nm3. The highest value obtained with increasing temperature of
the feed gas (7.6 MJ/Nm3) is notably higher than those obtained in more conventional air
blown gasification processes. It has been noticed that LHV of fuel gas produced in
93
gasifying low bulk density feedstock like bark and wood chips was as low as for
conventional air blown gasification of biomass.
5. An increase in the feed gas temperature allows the fuel gas to be less diluted by nitrogen
and therefore the higher calorific value fuel gas. The percentage of N2 would depend on
the temperature in the gasifier and on the feedstock type. For the conditions of
experiments used in this work, nitrogen decreases with temperature.
6. An increase of steam fraction in relation to the high temperature air in the feed gas
decreases the temperature of the gasification but increases molar fraction of H2 while
decreasing that of CO. The effects originated by the steam are greater than in the case of
the low temperature air gasification process. It has been noticed that preheating of air and
steam requires an additional energy, which has to be supplied to enhance thermal cracking
and reforming.
7. At maximum molar fraction of steam in the feed gas (83%), the decrease of the gasifier
bed temperature results in decreased heating rate with consequent decrease in LHV, mass
flow rate of fuel gas, cold gasification efficiency and specific gas production rate.
8. Globally, gasification of feedstocks with mixture of air and steam has clearly shown that
the H2 and CO2 contents in the fuel gas increase and the CO content decrease, as a result
of shift reaction. It was seen that the water-gas shift reaction is more favoured by highly
preheated feed gas temperature.
9. Thermal cracking of biomass tar compounds requires feed gas temperature above 850oC in
order to induce process temperature above 1000oC. Tar amount shows a decrease trend
with feed gas temperature, and its composition is also influenced with high temperature
with higher molecular weight organic compounds, of the class of neutral fractions (mainly
tertiary products), prevailing in the fuel gas. The high amounts of H2 and CO has shown
the potential of the preheated feed gas on promoting thermal cracking in a one step
updraft fixed batch type gasifier.
94
10. Increase of volume flow rate has shown quick heat release, thus favoring the attainment of
successively higher gasifier bed temperature, with consequent fast production of high
molar fraction of combustible products, particularly H2 and CO.
11. A mathematical model has been formulated for predicting all the main chemical and
physical processes taking place during the fixed-bed gasification of biomass fuels with high
temperature air. It was seen that this model was able to give good agreements of the fuel
gas’ species profiles and their maximum values with that obtained experimentally.
12. This work provided important information that led to designing and construction of an
updraft continuous gasifier at the same laboratory premises from the Royal Institute of
Technology. First trial of experiments was performed and results did show promising
trends on the gasification profile. For instance, carbon monoxide/hydrogen ratio for
gasification with preheated air reaches as high values as 2.0-2.2 while for gasification with
mixture of air and steam it may be found within the range of 0.8-1.3.
95
11. References
[ 1] Tsuji H, Gupta AK, Hasegawa T, Katsuki M, Kishimoto K, Morita M. High Temperature Air Combustion: From Energy Conservation to Pollution reduction, CRC Press. 2002
[ 2] Benson SM, Chandler W, Edmonds J, Houghton J, Levine M, Bates L, Chum H, Dooley J, Grether D, Logan J, Wiltsee G, Wright L. (1999) Assessment of basic research needs for greenhouse gas control technologies. Office of Energy Research, Department of Energy.
[ 3] Bridgwater AV, Toft AJ, Brammer JG. (2002) A techno-economic comparison of power production by biomass fast pyrolysis with gasification and combustion Renewable and Sustainable Energy Reviews, 6, 181-248.
[ 4] http://www.energy.state.or.us/biomass/Tech.htm [ 5] Milne TA, Elam CC, Evans RJ. (2002) Hydrogen from biomass - state of the art and research challenges.
IEA/H2/TR-02/001. National Renewable Energy Laboratory Golden, CO USA. [ 6] Groeneveld MJ and Westerterp (1980) Social and economic aspects of the introduction of gasification
technology in rural areas of developing countries (tanzania). in thermal conversion of solid wastes and biomass. Jones JL and Radding SB, Editors, ACS Symposium Series 130; American Chemical Society; Washington, D.C., 705-719.
[ 7] Bridgwater AV, Beenackers AACM, Sipila K, Zhenhong Y, Chuangzhi W, Li S. An Assessment of the possibilities for transfer of european biomass gasification technology to china. http://www0.gastechnology.org/pub/iea/IEA-EU-China.pdf
[ 8] Elliott P. Biomass energy overview in the context of brazilian biomass-power demonstration. Bioresource Technol 1993;46:13–22.
[ 9] Reed TB (1985) Principles and technology of biomass gasification (Chapter 3). Adv. In Solar Energy- an Annual review of R&D, Vol 2., Ed. KW Böer and J. Duffie, Plennum Press (NY).
[ 10] http://energy.saving.nu/biomass/processes.shtml [ 11] Spitzer J. (1999) Thermal gasification of biomass – a synopsis prepared by task 20, IEA Bioenergy Annual
Report. [ 12] McKendry P. (2002) Energy production from biomass (part 3): gasification technologies. Bioresource
Technology, 83, 55-63. [ 13] Tanaka R. (1995) New progress of energy saving technology toward the 21st century; Frontier of
combustion & heat transfer technology, In: 11th IFRF Members Conference, 10-12th May. [ 14] Mochida S, Hasegawa T. (2001) Development of highly preheated turbulent –jet generator, 3rd
International Symposium on Advanced Energy Conversion Systems and Related Technologies, RAN2001, Nagoya, Japan, December 15-17.
[ 15] Pian CCP, (2001) Yoshikawa K. Development of a high-temperature air-blown gasification system. Bioresource Technology, 79, 231-241.
[ 16] Bridgwater AV (2003) Renewable fuels and chemicals by thermal processing of biomass. Chemical Engineering Journal 91, 87–102.
[ 17] Maniatis K, Millich E. (1998) Energy from biomass and waste. Biomass and Bioenergy, Vol. 15, No. 3, 195-200.
[ 18] Zainal ZA, Rifau A, Quadir GA, Seetharamu KN. (2002) Experimental investigation of a downdraft biomass gasifier. Biomass and Bioenergy, 23:283–289.
[ 19] Wang W, Padban N, Ye Z, Olofsson G, Andersson A, Bjerle I. (2000) Catalytic hot gas cleaning of fuel gas from an air-blown pressurized fluidized-bed gasifier. Industrial and Engineering Chemistry Research, 39(11): 4075-4081.
[ 20] Padban N., Wang W., Ye Z. Bjerle I., Odenbrand I. (2000) Tar formation in pressurized fluidized bed air gasification of woody biomass. Energy & Fuels, 14, 603-611.
[ 21] De Bari I, Barisano D, Cardinale M, Matera D, Nanna F, and Viggiano D. (2000) Air gasification of biomass in a downdraft fixed bed: a comparative study of the inorganic and organic products distribution. Energy & Fuels; 14, 889-898.
96
[ 22] Blasi CD, Signorelli G, and Portoricco G. (1999) Countercurrent fixed-bed gasification of biomass at laboratory scale. Industrial Engineering Chemistry Research, 38, 2571-2581.
[ 23] Narvaéz I, Orío A, Aznar MP, Corella J. (1996) Biomass gasification with air in an atmospheric bubbling fluidized bed. Effect of six operational variables on the quality of the produced raw gas. Industrial and Engineering Chemistry Research, 35: 2110-2120.
[ 24] Coll R., Salvadó J, Farriol X, Montane D. (2001) Steam reforming model compounds of biomass gasification tars: conversion at different operating conditions and tendency towards coke formation. Fuel Processing Technology, 74, 19–31.
[ 25] Encinar JM, González JF, González J. (2002) Steam gasification of Cynara cardunculus L.: influence of variables. Fuel Processing Technology, 75, 27-43.
[ 26] Schuster, G., Loffler, G., Weigl, K., and Hofbauer, H. (2001) Biomass steam gasification - an extensive parametric modeling study. Bioresource Technology, 77, 71-79.
[ 27] Herguido, J., Corella, J., González-Saiz, J. (1992) Steam gasification of lignocellulosic residues in a fluidised bed at small pilot scale. Effect of the type of feedstock. Industrial and Engineering Chemistry Research, 31, 1274-1282.
[ 28] Marquez_Montesinos F, Cordero T, Rodriguez-Mirasol J, Rodríguez JJ. (2002). CO2 and Steam Gasification of a Grapefruit Skin Char. Fuel 81, 423-429.
[ 29] Encinar JM, Beltrán FJ, Ramiro A, González JF. (1998) Pyrolysis/gasification of agricultural residues by carbon dioxide in the presence of different additives: influence of variables. Fuel Processing Technology 55, 219-233.
[ 30] Struis RPW, von Scala C, Stucki S, Prins R. (2002) Gasification reactivity of charcoal with CO2. Part II: Metal catalysis as a function of conversion. Chemical Engineering Science, 57:3593-3602.
[ 31] Doctor RD, Molburg JC, Thimmapuram PR. (1997) Oxygen-blown gasification combined cycle: carbon dioxide recovery, transport, and disposal. Energy Conservation Management, 38, S575-S580.
[ 32] Beenackers A and K Maniatis, Gasification technologies for heat and power from biomass, Proceedings of the conference: 5th European Bioenergy Conference, 1996.
[ 33] Bridgwater AV. The technical and economic feasibility of biomass gasification for power generation. Fuel 1995;74:631.
[ 34] Minkova V, Marinov SP, Zanzi R, Bjornbom E. Budinova T, Stefanova M, Lakov L. (2000). Thermochemical Treatment Of Biomass In A Flow Of Steam Or In A Mixture Of Steam And Carbon Dioxide. Fuel Processing Technology, 62, 45–52.
[ 35] Bhat A, Bheemarasetti RJV, Rao TR. (2001) Kinetics of rice husk char gasification. Energy Conversion and Management, 42, 2061-2069.
[ 36] Ciferano JP and Marano JJ. (2002) Benchmarking biomass gasification technologies for fuels, chemicals and hydrogen production. U.S. Department of Energy. National Energy Technology Laboratory.
[ 37] Herguido J, Corella J, González-Saiz J. (1992) Steam gasification of lignocellulosic residues in a fluidised bed at a small pilot scale. Effect of the type of feedstock. Industrial and Engineering Chemistry Research, 31, 1274–1282.
[ 38] García L, Salvador ML, Arauzo J, Bilbao R. (1999) Catalytic gasification of pine sawdust. Effect of catalyst weight/biomass flow rate and steam/biomass ratios on gas production and composition. Energy & Fuels, 13, 851-859.
[ 39] http://www.btgworld.com/technologies/gasification.html#fixed-bed. [ 40] Stevens DJ. (2001) Hot gas conditioning: Recent progress with larger-scale biomass gasification systems.
Update and summary of recent progress. National Renewable Energy Laboratory, NREL/SR-510-29952, Subcontractor report. August.
[ 41] Evans RJ, Milne T. (1987) Molecular characterization of the pyrolysis of biomass. 1. Fundamentals. Energy and Fuels, 1,123–38.
[ 42] Cummer, K. R. and Brown, R. C. (2002) Ancillary equipment for biomass gasification. Biomass and Bioenergy, 23, 113-128.
[ 43] Bui T, Loof R, Bhattacharya SC. (1994) Multi-stage reactor for thermal gasification of wood. Energy, 19(4), 397–404.
[ 44] Bhattacharya SC, Siddique AHMR, Pham HL. (1999) A study on wood gasification for low-tar gas

97
production. Energy, 24:285–96. [ 45] Brandt P, Larsen E, Henriksen U. (2000) High tar reduction in a two-stage gasifier. Energy and Fuels, 14,
816–819. [ 46] Hindsgaul C, Schramm J, Gratz L, Henriksen U, Bentzen JD. (2000) Physical and chemical
characterization o particles in producer gas from wood chips. Bioresource Technology 73, 147-155. [ 47] Milne TA, Abatzoglou N, Evans, RJ. Biomass gasifier ‘tars’: their nature, formation, and conversion.
NREL/TP-570-25357, Golden, CO, 1998. [ 48] Midilli, A., Dogru, M., Howarth, C. R., and Ayhan, T. (2001) Hydrogen production from hazelnut shell by
applying air-blown downdraft gasification technique. International Journal of Hydrogen Energy, 26, 29-37.[ 49] Midilli, A., Dogru, M., Akay, G., Howarth, C. R. (2002) Hydrogen production from hazelnut shell by
applying air-blown downdraft gasification technique. Int. J. of Hydrogen Energy, 27, 1035-1041. [ 50] van der Drift A, van Doorn J, Vermeulen JW. (2001,). Ten Residual Fuels for Circulating Fluidized bed
Gasification. Biomass Bioenergy 20, 45-56. [ 51] Scurlock J, (2000) Bioenergy Feedstock Characteristics. (see website:
http://bioenergy.ornl.gov/papers/misc/biochar_factsheet.html). [ 52] Chen G, Andries J, Luo Z, Spliethoff H. (2003) Biomass pyrolysis/gasification for product gas production:
the overall investigation of parametric effects. Energy Conversion and Management, 44, 1875–1884. [ 53] Blasi CD, Signorelli G, and Portoricco G. Countercurrent fixed-bed gasification of biomass at laboratory
scale. Industrial and Engineering Chemistry Research, 1999, 38, 2571-2581. [ 54] Scott DS; Piskorz J; Bergougnou MA; Graham R, Overend RP. (1998) The role of temperature in the fast
pyrolysis of cellulose and wood. Industrial. Engineering Chemistry Research 27, 8-15 [ 55] Hansen CH. (1998) Physical and Chemical Characterisation of Particles in Producer Gas. Master Thesis,
Technical University of Denmark, Department of Energy Engineering. Second Edition. ET-EP 98-12. July.[ 56] Faaij A, van Doorn J, Curvers T, Waldheim L, Olsson E, van Wijk A, Daey_Ouwens C. (1997).
Characteristics and Availability of Biomass Waste and Residues in the Netherlands for Gasification. Biomass and Bionergy, 12(4), 225-240.
[ 57] Demirbaş A. (2002). Gaseous products from biomass by pyrolysis and gasification: effects of catalyst on hydrogen yield. Energy Conversion and Management 43 (2002) 897–909.
[ 58] Prasad BVRK, Kuester JL (1988) Process Analysis of a Dual Fluidized Bed Biomass Gasification System. Industrial and Engineering Chemistry Research, 27, 304-310.
[ 59] McLellan R, (2000) Design of a 2.5 MWe biomass gasification power generation module, ETSU Report B/T1/00569/REP, AEA, Harwell, UK.
[ 60] Wahlund B, Yan J, Westermark M. (2002) A total energy system of fuel upgrading by drying biomass feedstock for cogeneration: a case study of Skelleftea bioenergy combine. Biomass and Bioenergy 23, 271–281.
[ 61] Hansson PA, Dahlinb B, Blingec M. (2003) Air emissions from the fuel supply system of a Swedish CHP plant and the effects of stricter emission regulations. Biomass and Bioenergy 24, 59–68.
[ 62] Sundberg G, Henning D. (2002) Investments in combined heat and power plants: influence of fuel price on cost minimised operation. Energy Conversion and Management, 43, 639–650.
[ 63] Czernik S, Koeberle PG, Jollez P, Biolodeau JF, Chronet E. (1995) Gasification of residual biomass via the Biosyn fluidised Bed Technology. In Advances in Thermochemical Biomass Conversion, Bridgwater AV, editor. Blackie Academic & professional, Vol 1, 423-437.
[ 64] Spliethoff H (2001) Status of biomass gasification for power production. IFRF Combustion Journal. Article 200109, November.
[ 65] VTT (2002). Review of Finnish Biomass gasification Technologies OPET Report 4, Finland. See website: http://www0.gastechnology.org/pub/iea/OPET_Report4_gasification.pdf.
[ 66] See website http://www.volund.dk/rd2.html [ 67] Fluidyne. See “Fluidyne Special Project.pdf” downloadable from web-site:
http://www.fluidynenz.250x.com/anniversary.htm. [ 68] The System Johansson Gasifier, see web-site:
http://www.eskomenterprises.co.za/Casestudies/TSIcases/systemjohansson.htm.
98
[ 69] Robson A, PyNe newsletter No. 11, pp 1-2, June 2001, ISSN 1470-3521 [Aston University, UK]. [ 70] McLellan R, PyNe Newsletter No. 10, pp 12, December 2000, ISSN 1470-3521 [Aston University,
Birmingham UK]. [ 71] See website: http://www.ensyn.com/rtp.htm. [ 72] Kwant KW, (2001). Status of Gasification in Countries Participating in the IEA Bioenergy Gasification
Activity. Novem, Netherlands, March. [ 73] Babu SP (2002). Thermal gasification of biomass. An overview of activities within the countries
participating in task 20, June. [ 74] Demirbaş A. (2003) Sustainable cofiring of biomass with coal. Energy Conversion and Management, 44,
1465-1479. [ 75] Willeboer, W. (1998) The Amer demolition wood gasification project. Biomass and Bioenergy, 15(3), 245-
249. [ 76] McIlveen-Wright DR, Williams BC, McMullan JT (2000) Wood gasification integrated with fuel cells.
Renewable Energy, 19, 223-228. [ 77] Brammer JG, Bridgwater AV. (2002). The Influence Of Feedstock Drying on the Performance and
Economics of a Biomass Gasier–Engine CHP System. Biomass and Bioenergy, 22, 271–281. [ 78] Ståhl, K, Neergaard M. (1998). IGCC Power Plant for Biomass Utilisation, Värnamo, Sweden. Biomass
and Bioenergy, 15(3), 205-211. [ 79] Pitcher K, Hilton B, Lundberg H. (1998). The Arbre Project: Progress Achieved. Biomass and Bioenergy
15(3), 213-218. [ 80] Bridgwater AV, Evans GD, “An assessment of thermochemical conversion systems for processing biomass
and refuse”, Energy Technology Support Unit (ETSU) on behalf of the Department of Trade, ETSU B/T1/00207/REP, 1993.
[ 81] Kurkela E, Ståhlberg P, Laatikainen J, Simell P. (1993) Development of simplified IGCC processes for biofuels—supporting gasification research at VTT. Bioresource Technol, 46(1–2):37–48.
[ 82] Lapuerta M, Hernández JJ, Tinaut VF, Horrilo A. (2001) Thermochemical behaviour of Producer Gas From gasification of Lignocellulosic Biomass in SI Engines. Society of Automotive Engineers, Inc. 2001-01-3586.
[ 83] Bridgwater AV (2001). Thermal Conversion Of Biomass And Waste: The Status. See website: http://www.icheme.org/literature/conferences/gasi/Gasification%20Conf%20Papers/Session%202%20presentation-Bridgewater.pdf.
[ 84] Kinoshita CM, Wang Y, Zhou J. (1994) Tar formation under different biomass gasification conditions. Journal of Analytical and Applied Pyrolysis, 29:169–81
[ 85] Brage C, Yu Q, Chen G, Krister Sjöstrom (2000) Tar evolution profiles obtained from gasification of biomass and coal. Biomass and Bioenergy 18, 87-91.
[ 86] Turn, S., Kinoshita, C., Zhang, Z., Ishimura, D., and Zhou, J. (1998) An experimental investigation of hydrogen production from biomass gasification. Int. J. Hydrogen Energy, 23, 641-648.
[ 87] Gil J, Caballero MA, Martín JA, Aznar MP, Corella J. (1999) Biomass Gasification With Air In Fluidized Bed: Effect Of In-Bed Use Of Dolomite Under Different Operation Conditions. Industrial and Engineering Chemistry Research, 38, 4226–4235.
[ 88] Zhou J, Masutani SM, Ishimura DM, Turn SQ, Kinoshita CM. (2000) Release Of Fuel-Bound Nitrogen During Biomass Gasification. Industrial and Engineering Chemistry Research, 39, 626–634.
[ 89] Aznar MP, Caballero MA, Gil J, Martn JA, Corella J. (1998) Commercial steam reforming catalysts to improve biomass gasification with steam-oxygen mixtures. 2. Catalytic tar removal. Industrial and Engineering Chemistry Research, 37, 2668–2680.
[ 90] Mathieu, P. and Dubuisson, R. (2002) Performance analysis of a biomass gasifier. Energy Conversion and Management, 43, 1291-1299.
[ 91] Kato Y, Yoshikawa K. (2002) High temperature air gasification of wood-based biomass by a pebble bed slagging gasifier 5th International Symposium on High Temperature Air Combustion and Gasification, October 28-30, 2002, Yokohama, Japan.
[ 92] Ishii T, Yoshitaka E, Kiga T, Yoshikawa K, Sugiyama S, Kato K. (2002) Gasification of coal and wood at the demonstration plant of meet system, MEET II. 5th International Symposium on High Temperature Air
99
Combustion and Gasification, October 28-30, 2002, Yokohama, Japan. [ 93] Young L, Pian CCP. (2003) High-temperature, air-blown gasification of dairy-farm wastes for energy
production. Energy, 28, 655–672. [ 94] Friberg R., A new measurement method to analyse the thermochemical conversion of solid fuels, PhD
thesis, Energy and Furnace Technology, KTH, August 2000, ISBN:91-7170-599-6. [ 95] Friberg R, Blasiak W, (2002) Measurements of mass flux and stoichiometry of conversion gas from three
different wood fuels as function of volume flux of primary air in packed-bed combustion. Biomass and Bioenergy, 23, 189–208.
[ 96] Klingenberg TH, J, Breithaupt PP. Combustion process analysis by micro gas chromatograph measurement techniques, 2001 International Gas Research Conference; Amsterdam, November 5-8 2001.
[ 97] Brage C, Yu Q, Chen G and Sjöstrom K. (1997) Use of amino phase adsorbent for biomass tar sampling and separation. Fuel, 76(2), 137-142.
[ 98] Brage C, Yu Q, Chen G, Krister Sjöstrom (2000) Tar evolution profiles obtained from gasification of biomass and coal. Biomass and Bioenergy, 18, 87-91.
[ 99] Blasiak W, Szewczyk D., Lucas C., and Mochida S., (2002) Gasification of Biomass wastes with high temperature air and steam, Proceedings of 21st International Conferences on incineration and thermal treatment technologies, May 13-17, 2002, New Orleans, Louisiana, USA.
[ 100] Dong Y (1998) Biomass reactivity in gasification by the hynol process. Energy & Fuels, 12, 479-484. [ 101] Grotkjaer T, Dam-Johansen K, Jensen AD, Glarborg P., (2003) An experimental study of biomass
ignition. Fuel 82, 825–833. [ 102] Bilbao R, Mastral JF, Aldea ME, Ceamanos J. (2001) Experimental and theoretical study of ignition and
smoldering of wood including convective effects. Combustion and Flame, 126:1363-1372. [ 103] Kline SJ, McClintock FA (1953) Describing uncertainties in single-sample experiments. Mechanical
Engineering, 75(1), 3-8. [ 104] Moffat RJ. (1982) Contributions to the theory of single-sample uncertainty analysis.
Journal of Fluids Engineering, 104, 250-261, June. [ 105] FLIC program Sheffield University, (2003), http://www.shef.ac.uk/~suwic/index.html [ 106] Goh Y R, Siddal R, Nasserzadeh V, Swithenbank J et al, (1998) Mathematical Modelling of the Waste
Incinerator Burning Bed, Journal of Institute of Energy, Vol 71, No. 487, 1998, pp 110 – 118. [ 107] Wakao, N. and Kaguei, S.,(1982) Heat and Mass Transfer in Packed Beds, Gorden & Breach Science
Publishers, 1982. [ 108] Howard J B, William G C and Fine, D H, (1973) Kinetics of carbon monoxide oxidation in postflame
gases, 14th Symposium (International) on Combustion, The Combustion Institute, pp.975-986, 1973. [ 109] Siminski, V J, Wright, F J, Edelman, R B, Economos, C and Fortune, O F, (1972) Research on methods
of improving the combustion characteristics of liquid hydrocarbon fuels, AFAPL TR 72-74, Vols. I and II, Air Force Aeropropulsion Laboratory, Wright Patterson Air Force Base, OH, 1972.
[ 110] Hautman AN, Dryer FL, Schlug KP, Glassman I., (1981) A multiple-step overall kinetic mechanism for the oxidation of hydrocarbons, Combustion Science and Technology, vol.25, pp.219.
[ 111] Biba, V., Macak, J., Klose, E., Malecha, J., (1978). Mathematical Model for the Gasification of Coal Under Pressure. Industrial & Engineering Chemical Process Design and Development ,17, 92.
[ 112] Yoon, H., Wei, J., Denn, M.M., (1978). A Model for Moving Bed Coal Gasification Reactors. A.I.Ch.E. Journal, 24, 885.
[ 113] Jones, W.P., Lindstedt R.P., (1988). Global Reaction Schemes for Hydrocarbon Combustion. Combustion and Flame, 73, 233.
[ 114] Smoot, L. D and Pratt, D.T, (1979) Pulverized-coal Combustion and Gasification, Plenum Press, 1979. [ 115] Patankar, S V, (1980) Numerical Heat Transfer and Fluid Flow, Hemisphere. [ 116] Bajpai, AC, Claus. [ 117] Hasler, P. and Nussbaumer Th. (1999) Gas cleaning for IC engine applications from fixed bed biomass
gasification. Biomass and Bioenergy, 16, 385-395. [ 118] Fagbemi, L., Khezami, L., and Capart, R. (2001) Pyrolysis products from different biomasses: application
to the thermal cracking of tar. Applied Energy, 69, 293–306.
100
[ 119] Turn, S., Kinoshita, C., Zhang, Z., Ishimura, D., and Zhou, J. (1998) An experimental investigation of hydrogen production from biomass gasification. Int. J. Hydrogen Energy, 23, 641-648.
[ 120] Lédé J. (2000) The Cyclone: A Multifunctional Reactor for the Fast Pyrolysis of Biomass. Industrial Engineering and Chemistry Research, 39, 893-903.
[ 121] Padban N, Wang W, Ye Z, Bjerle I, Odenbrand I. (2000) Tar formation in pressurized fluidized bed air gasification of woody biomass. Energy & Fuels, 14, 603-611.
[ 122] Zanzi R, Sjöstrom K, Björnbom E. (1996) Rapid high-temperature pyrolysis of biomass in a free-fall reactor. Fuel, 75(5), 545-550.
[ 123] Bridgwater AV. (1999) Principles and practice of biomass fast pyrolysis processes for liquids. Journal of Analytical Applied Pyrolysis, 51, 3–22.
[ 124] Lewis FM, Swithenbank J, Hoecke DA,Russell NV, Shabangu SV, High temperature, steam-only gasification and steam reforming with ultra-superheated steam 5th International Symposium on High Temperature Air Combustion and Gasification, October 28-30, Yokohama, Japan, 2002.
[ 125] Dutton G. (2002) Hydrogen energy technology. Tyndall Working Paper No. 17. Tyndall Centre for Climate Change Research. Energy Research Unit (ERU). CLRC Rutherford Appleton Laboratory. (see website www.tyndall.ac.uk/research/theme2/update_posters/july2002/it1_26.pdf. Section: Hydorgen production, p5).
[ 126] Encinar JM, González JF, Rodríguez JJ, Ramiro MJ. (2001) Catalysed and uncatalysed steam gasification of eucalyptus char: influence of variables and kinetic study. Fuel, 80, 2025-2036.
[ 127] Revankar VVS, Gokarn AN, Doraiswamy LK (1987) Studies in catalytic steam gasification of petroleum coke with special reference to the effect of particle size. Industrial and Engineering Chmestry Research, 26(5), 1018-1025.
[ 128] Beaumontt O, Schwob Y. (1984) Influence of physical and chemical parameters on wood pyrolysis. Indutsrial and Engineering Chemitsry Process Design and Development, 23, 637-641
[ 129] See web site http://www.tarweb.net/. [ 130] Yu Q, Brage C, Chen G, Sjoström K. (1997) Temperature Impact On The Formation Of Tar From
Biomass Pyrolysis In A Free-Fall Reactor. Journal of Analytical and Applied Pyrolysis, 40–41, 481–489. [ 131] Blasiak W., Kalisz S., Szewczyk D., Carlos L., Abeyweera R., High Temperature Air/steam Gasification
of Biomass and Wastes – STAGE 2, ISRN KTH/MSE--03/61--SE+ENERGY/TR, Royal Institute of Technology (KTH), Division of Heat and Furnace Technology, Stockholm, Sweden; November – 2003.