FULLTEXT01.pdf - DiVA Portal
8
Ocean Engineering 205 (2020) 107287 Available online 6 April 2020 0029-8018/© 2020 The Authors. Published by Elsevier Ltd. This is an open access article under the CC BY license (http://creativecommons.org/licenses/by/4.0/). Numerical analysis of an Uppsala University WEC deployment by a barge for different sea states Maria Angeliki Chatzigiannakou a, * , Tatiana Potapenko a , Boel Ekergård b , Irina Temiz a a Dept. of Electrical Engineering, Uppsala University, Uppsala, Sweden b Dept. of Industrial Economics, Electrical and Mechanical Engineering, University West, Sweden A R T I C L E INFO Keywords: Wave energy converter Offshore operations Hydrodynamic analysis Slack sling criterion Hoisting system failure Offshore deployment ABSTRACT Wave energy converters (WECs) have been deployed onshore, nearshore, and offshore to convert ocean wave movement into electricity. The exploitation of renewable energy sources has restrictions; in the case of wave energy, high installation, maintenance, and decommissioning costs have limited their commercial use. Moreover, these offshore operations can be compromised by safety issues. This paper draws attention to offshore operation safety of a WEC developed by Uppsala University. Specifically, this paper investigates what sea states are suitable for the safe deployment of a WEC from a barge. This study follows recommendations in DNV-RP-H103 for analysis of offshore operations, namely lifting through the wave zone. ANSYS Aqwa is used to find hydrodynamic forces acting on a typical barge, using frequency domain analysis. Based on these hydrodynamic simulation results and methodology given in DNV-RP-H103, tables are created to show the sea states that would allow for the safe installation of a WEC using a typical barge. Considered sea states have significant wave heights varying between 0 m and 3 m and the wave zero crossing periods varying between 3 s and 13 s. The WEC submersions are considered between 0 m and 7 m, i.e. when the WEC is in the air until it is fully submerged. 1. Introduction Wave energy is a challenging field as it involves high forces and low speeds. These issues require proposing new and effective technology to absorb the abundant energy of ocean waves. Today, many designs of wave energy converters (WECs) exist, but most are still at an early stage of development (Bahaj, 2011) (Mueller and Wallace, 2008). Some of these WEC designs include point absorbers, which are characterized by their small size relative to the wavelength. Over 50% of proposed WEC designs use point absorbers (Rusu and Onea, 2018). Such devices can be installed in arrays to increase the power production; however, the deployment and maintenance of each device in an open sea are time consuming and require expensive offshore operations. As noted in (IRENA, 2014), improvements in the next generation of WECs could reduce the costs of power take-off by 22%, installation by 18%, operation and maintenance by 17%, foundation and mooring by 6%, and grid connection by 5%. This work aims to identify the sea states that pose a risk of failure of the crane’s hoisting system while deploying an Uppsala University (UU) WEC from a barge. The WEC developed at UU uses a point absorber buoy with a direct drive linear generator power take-off. That is, the buoy absorbs wave energy while floating on the water surface and the linear generator is mounted on a concrete foun- dation placed on the seabed. A translator, the moving part inside of the linear generator, is connected by a guiding rope to the buoy. Voltage is induced in the stator windings due to the motion of the translator relative to the stator. This design uses few moving parts to simplify the mechanical system with the aim to reduce maintenance costs in a highly challenging sea environment (Lejerskog et al., 2015) (Lejerskog et al., 2009). WECs need to be deployed and operational in energetic seas. More- over, the offshore installation of the generator is associated with risks and high costs. Initially, the WECs developed at UU (Chatzigiannakou et al., 2017) (Parwal et al., 2015) were designed to operate in moderate sea states. For example, the most frequent significant wave height at Lysekil (Sweden’s west coast) is no more than 1 m. Compared to Lysekil, the waves at the Wave Hub of the North Sea (UK) are higher with longer zero crossing periods (Smith et al., 2012). The UU WEC is a scalable device that can be adjusted for many wave climates. Several studies have discussed the deployment and maintenance procedure of UU WECs and the related risks are discussed in (Chatzigiannakou et al., 2017) (Leijon * Corresponding author. E-mail addresses: [email protected] (M.A. Chatzigiannakou), [email protected] (T. Potapenko), [email protected] (B. Ekergård), [email protected] (I. Temiz). Contents lists available at ScienceDirect Ocean Engineering journal homepage: www.elsevier.com/locate/oceaneng https://doi.org/10.1016/j.oceaneng.2020.107287 Received 9 May 2019; Received in revised form 20 March 2020; Accepted 22 March 2020
-
Upload
khangminh22 -
Category
Documents
-
view
10 -
download
0
Transcript of FULLTEXT01.pdf - DiVA Portal

Ocean Engineering 205 (2020) 107287
Available online 6 April 20200029-8018/© 2020 The Authors. Published by Elsevier Ltd. This is an open access article under the CC BY license (http://creativecommons.org/licenses/by/4.0/).
Numerical analysis of an Uppsala University WEC deployment by a barge for different sea states
Maria Angeliki Chatzigiannakou a,*, Tatiana Potapenko a, Boel Ekergård b, Irina Temiz a
a Dept. of Electrical Engineering, Uppsala University, Uppsala, Sweden b Dept. of Industrial Economics, Electrical and Mechanical Engineering, University West, Sweden
A R T I C L E I N F O
Keywords: Wave energy converter Offshore operations Hydrodynamic analysis Slack sling criterion Hoisting system failure Offshore deployment
A B S T R A C T
Wave energy converters (WECs) have been deployed onshore, nearshore, and offshore to convert ocean wave movement into electricity. The exploitation of renewable energy sources has restrictions; in the case of wave energy, high installation, maintenance, and decommissioning costs have limited their commercial use. Moreover, these offshore operations can be compromised by safety issues. This paper draws attention to offshore operation safety of a WEC developed by Uppsala University. Specifically, this paper investigates what sea states are suitable for the safe deployment of a WEC from a barge. This study follows recommendations in DNV-RP-H103 for analysis of offshore operations, namely lifting through the wave zone. ANSYS Aqwa is used to find hydrodynamic forces acting on a typical barge, using frequency domain analysis. Based on these hydrodynamic simulation results and methodology given in DNV-RP-H103, tables are created to show the sea states that would allow for the safe installation of a WEC using a typical barge. Considered sea states have significant wave heights varying between 0 m and 3 m and the wave zero crossing periods varying between 3 s and 13 s. The WEC submersions are considered between 0 m and 7 m, i.e. when the WEC is in the air until it is fully submerged.
1. Introduction
Wave energy is a challenging field as it involves high forces and low speeds. These issues require proposing new and effective technology to absorb the abundant energy of ocean waves. Today, many designs of wave energy converters (WECs) exist, but most are still at an early stage of development (Bahaj, 2011) (Mueller and Wallace, 2008). Some of these WEC designs include point absorbers, which are characterized by their small size relative to the wavelength. Over 50% of proposed WEC designs use point absorbers (Rusu and Onea, 2018). Such devices can be installed in arrays to increase the power production; however, the deployment and maintenance of each device in an open sea are time consuming and require expensive offshore operations.
As noted in (IRENA, 2014), improvements in the next generation of WECs could reduce the costs of power take-off by 22%, installation by 18%, operation and maintenance by 17%, foundation and mooring by 6%, and grid connection by 5%. This work aims to identify the sea states that pose a risk of failure of the crane’s hoisting system while deploying an Uppsala University (UU) WEC from a barge. The WEC developed at UU uses a point absorber buoy with a direct drive linear generator power
take-off. That is, the buoy absorbs wave energy while floating on the water surface and the linear generator is mounted on a concrete foun-dation placed on the seabed. A translator, the moving part inside of the linear generator, is connected by a guiding rope to the buoy. Voltage is induced in the stator windings due to the motion of the translator relative to the stator. This design uses few moving parts to simplify the mechanical system with the aim to reduce maintenance costs in a highly challenging sea environment (Lejerskog et al., 2015) (Lejerskog et al., 2009).
WECs need to be deployed and operational in energetic seas. More-over, the offshore installation of the generator is associated with risks and high costs. Initially, the WECs developed at UU (Chatzigiannakou et al., 2017) (Parwal et al., 2015) were designed to operate in moderate sea states. For example, the most frequent significant wave height at Lysekil (Sweden’s west coast) is no more than 1 m. Compared to Lysekil, the waves at the Wave Hub of the North Sea (UK) are higher with longer zero crossing periods (Smith et al., 2012). The UU WEC is a scalable device that can be adjusted for many wave climates. Several studies have discussed the deployment and maintenance procedure of UU WECs and the related risks are discussed in (Chatzigiannakou et al., 2017) (Leijon
* Corresponding author. E-mail addresses: [email protected] (M.A. Chatzigiannakou), [email protected] (T. Potapenko), [email protected]
(B. Ekergård), [email protected] (I. Temiz).
Contents lists available at ScienceDirect
Ocean Engineering
journal homepage: www.elsevier.com/locate/oceaneng
https://doi.org/10.1016/j.oceaneng.2020.107287 Received 9 May 2019; Received in revised form 20 March 2020; Accepted 22 March 2020
Ocean Engineering 205 (2020) 107287
2
et al., 2008) (Remouit et al., 2018). The type of deployment vessel will affect the operational weather
window. Typically, barges are used for offshore tasks because they have large decks and high cargo capacities. However, barges can only operate in mild wave conditions (i.e., when sea states are calm). Moreover, barges do not have a propulsion system, so they are transported by a tugboat, an arrangement that restricts their maneuverability, requiring more time to position. However, these disadvantages are balanced by the availability and relatively low rental cost of barges. This study fo-cuses on the readily available and relatively inexpensive to rent Svitzer Ark barge.
This study increases the knowledge about safe, marginal, and dangerous sea states for the deployment of the multibody system (the WEC and the barge) interaction. That is, conditions for critical opera-tions need to be identified as all safety regulations must be satisfied throughout the operation (IMO, 2010). The behavior of the vessel involved in offshore operations can be estimated by calculating forces and response amplitude operators (RAOs) for different sea states. Different degrees of freedom must be evaluated to model real conditions of a multi-body system. Hydrodynamic forces, namely excitation and radiation forces, acting on the vessel during the deployment of a WEC are calculated using the potential flow theory. Numerical analysis is commonly used to predict the dynamics of offshore structures (IMO, 2010) (Peng et al., 2015). Fluid flow around a structure can be deter-mined using the Laplace equation if the boundary conditions, initial conditions, and a fine mesh for computation to discretize the domain are applied.
2. Background and method
2.1. Input
2.1.1. General input We applied the simplified method of lifting through the wave zone to
the barge assuming it is fixed at one point and the hydrodynamic impact of the WEC’s submersion is negligible. Previous experiences reveal that barges can be firmly moored using four-point mooring where the mooring anchor for each of the four moorings is placed 200 m from the vessel (Chatzigiannakou et al., 2017). The coefficient and distance input for these calculations is shown in Table 1.
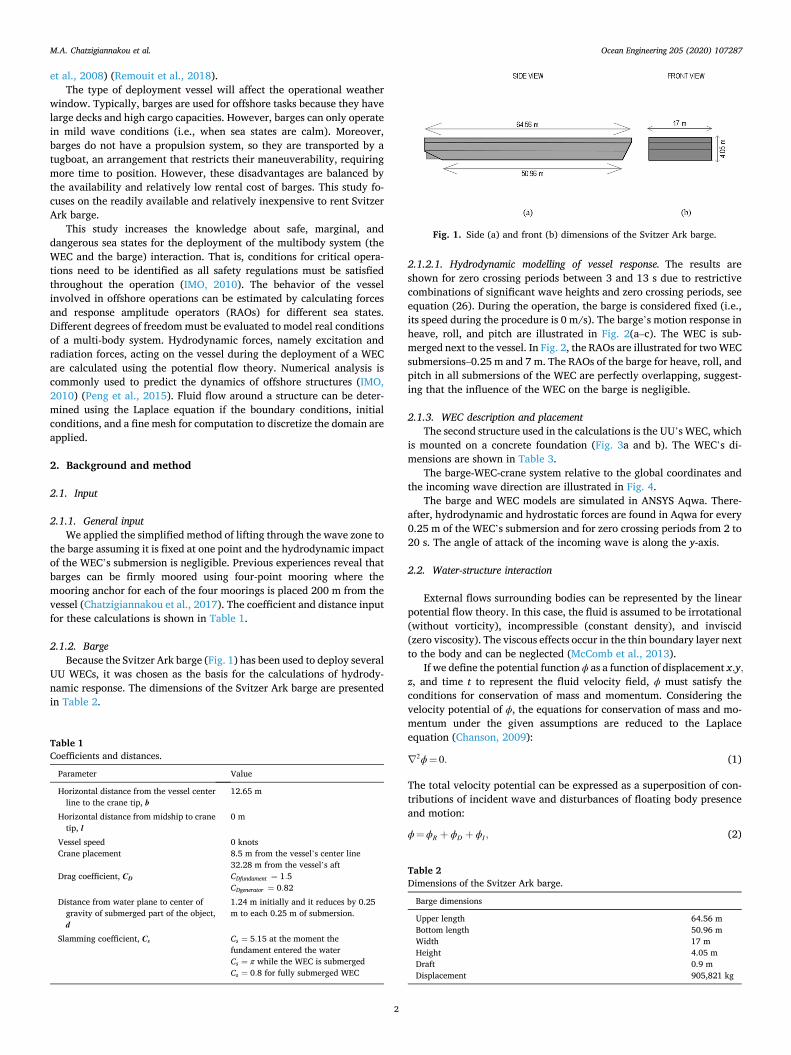
2.1.2. Barge Because the Svitzer Ark barge (Fig. 1) has been used to deploy several
UU WECs, it was chosen as the basis for the calculations of hydrody-namic response. The dimensions of the Svitzer Ark barge are presented in Table 2.
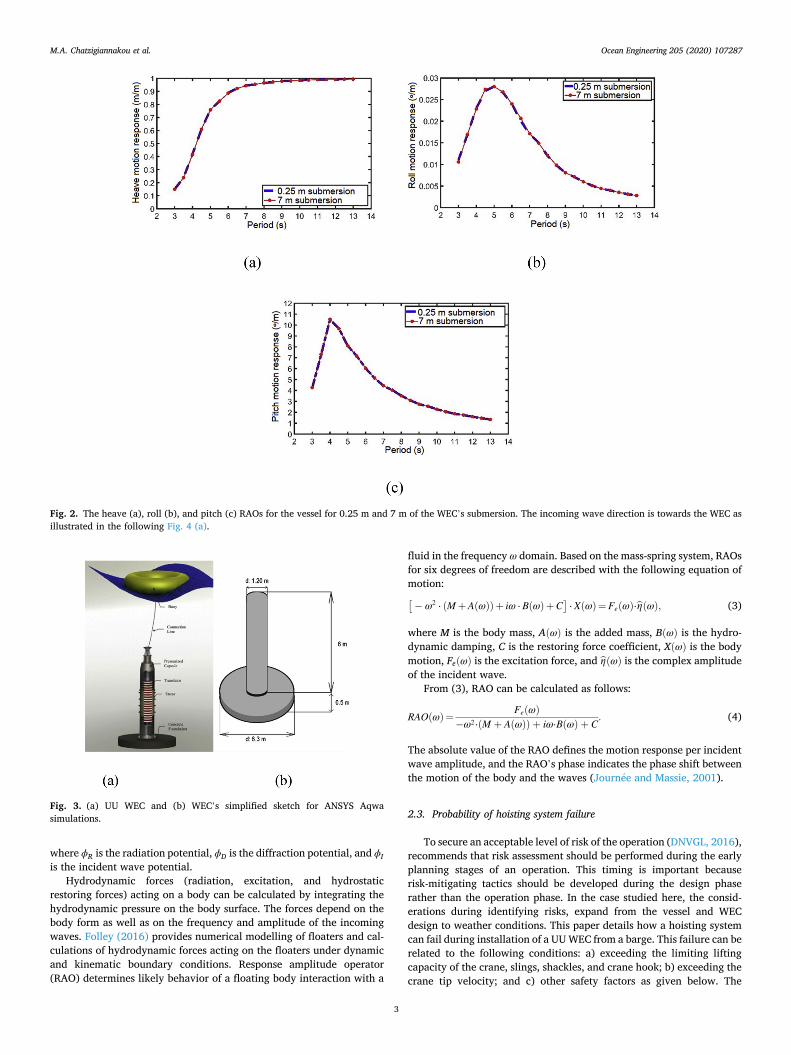
2.1.2.1. Hydrodynamic modelling of vessel response. The results are shown for zero crossing periods between 3 and 13 s due to restrictive combinations of significant wave heights and zero crossing periods, see equation (26). During the operation, the barge is considered fixed (i.e., its speed during the procedure is 0 m/s). The barge’s motion response in heave, roll, and pitch are illustrated in Fig. 2(a–c). The WEC is sub-merged next to the vessel. In Fig. 2, the RAOs are illustrated for two WEC submersions–0.25 m and 7 m. The RAOs of the barge for heave, roll, and pitch in all submersions of the WEC are perfectly overlapping, suggest-ing that the influence of the WEC on the barge is negligible.
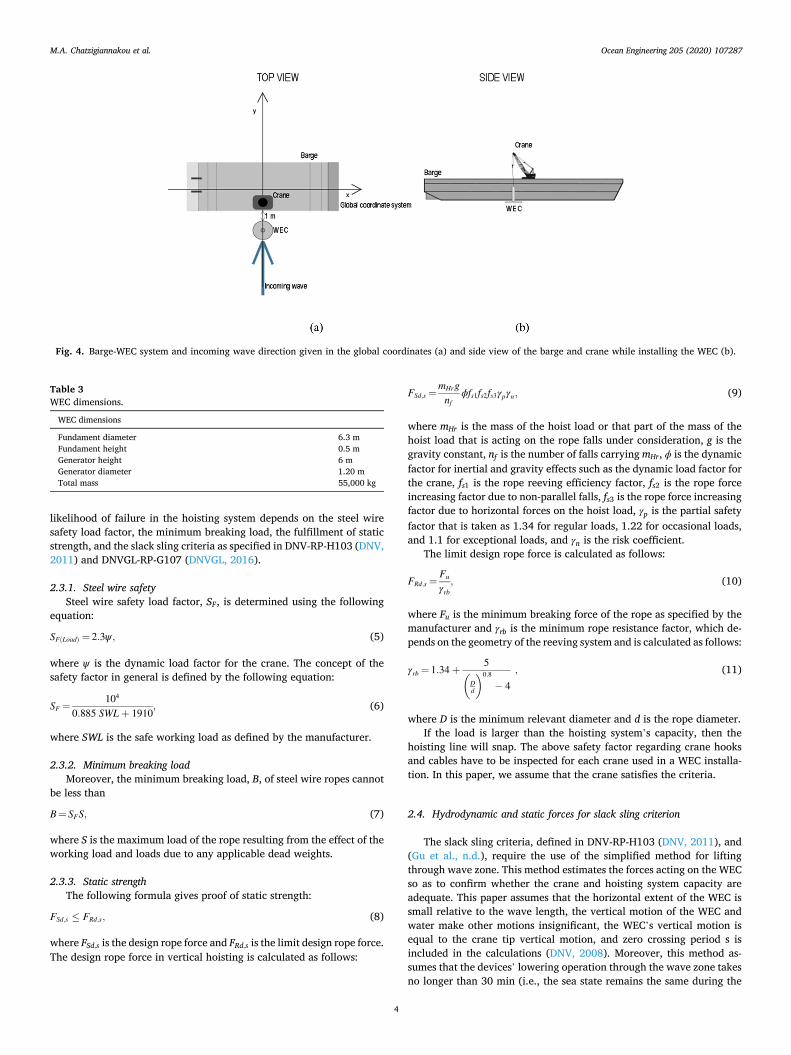
2.1.3. WEC description and placement The second structure used in the calculations is the UU’s WEC, which
is mounted on a concrete foundation (Fig. 3a and b). The WEC’s di-mensions are shown in Table 3.
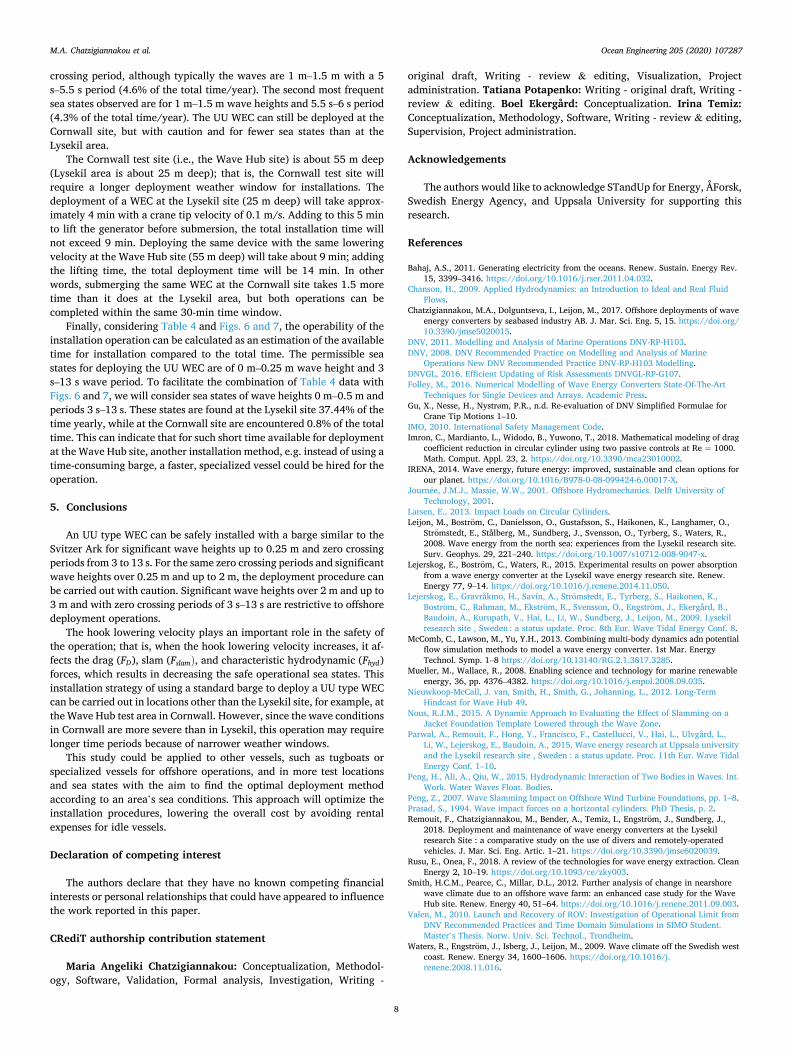
The barge-WEC-crane system relative to the global coordinates and the incoming wave direction are illustrated in Fig. 4.
The barge and WEC models are simulated in ANSYS Aqwa. There-after, hydrodynamic and hydrostatic forces are found in Aqwa for every 0.25 m of the WEC’s submersion and for zero crossing periods from 2 to 20 s. The angle of attack of the incoming wave is along the y-axis.
2.2. Water-structure interaction
External flows surrounding bodies can be represented by the linear potential flow theory. In this case, the fluid is assumed to be irrotational (without vorticity), incompressible (constant density), and inviscid (zero viscosity). The viscous effects occur in the thin boundary layer next to the body and can be neglected (McComb et al., 2013).
If we define the potential function ϕ as a function of displacement x;y;z, and time t to represent the fluid velocity field, ϕ must satisfy the conditions for conservation of mass and momentum. Considering the velocity potential of ϕ, the equations for conservation of mass and mo-mentum under the given assumptions are reduced to the Laplace equation (Chanson, 2009):
r2ϕ¼ 0: (1)
The total velocity potential can be expressed as a superposition of con-tributions of incident wave and disturbances of floating body presence and motion:
ϕ¼ϕR þ ϕD þ ϕI ; (2)
Table 1 Coefficients and distances.
Parameter Value
Horizontal distance from the vessel center line to the crane tip, b
12.65 m
Horizontal distance from midship to crane tip, l
0 m
Vessel speed 0 knots Crane placement 8.5 m from the vessel’s center line
32.28 m from the vessel’s aft Drag coefficient, CD CDfundament ¼ 1:5
CDgenerator ¼ 0:82 Distance from water plane to center of
gravity of submerged part of the object, d
1.24 m initially and it reduces by 0.25 m to each 0.25 m of submersion.
Slamming coefficient, Cs Cs ¼ 5:15 at the moment the fundament entered the water Cs ¼ π while the WEC is submerged Cs ¼ 0:8 for fully submerged WEC
Fig. 1. Side (a) and front (b) dimensions of the Svitzer Ark barge.
Table 2 Dimensions of the Svitzer Ark barge.
Barge dimensions
Upper length 64.56 m Bottom length 50.96 m Width 17 m Height 4.05 m Draft 0.9 m Displacement 905,821 kg
M.A. Chatzigiannakou et al.
Ocean Engineering 205 (2020) 107287
3
where ϕR is the radiation potential, ϕD is the diffraction potential, and ϕI is the incident wave potential.
Hydrodynamic forces (radiation, excitation, and hydrostatic restoring forces) acting on a body can be calculated by integrating the hydrodynamic pressure on the body surface. The forces depend on the body form as well as on the frequency and amplitude of the incoming waves. Folley (2016) provides numerical modelling of floaters and cal-culations of hydrodynamic forces acting on the floaters under dynamic and kinematic boundary conditions. Response amplitude operator (RAO) determines likely behavior of a floating body interaction with a
fluid in the frequency ω domain. Based on the mass-spring system, RAOs for six degrees of freedom are described with the following equation of motion: �� ω2 ⋅ ðMþAðωÞÞþ iω ⋅ BðωÞþC
�⋅ XðωÞ¼FeðωÞ⋅bηðωÞ; (3)
where M is the body mass, AðωÞ is the added mass, BðωÞ is the hydro-dynamic damping, C is the restoring force coefficient, XðωÞ is the body motion, FeðωÞ is the excitation force, and bηðωÞ is the complex amplitude of the incident wave.
From (3), RAO can be calculated as follows:
RAOðωÞ¼ FeðωÞ� ω2⋅ðM þ AðωÞÞ þ iω⋅BðωÞ þ C
: (4)
The absolute value of the RAO defines the motion response per incident wave amplitude, and the RAO’s phase indicates the phase shift between the motion of the body and the waves (Journ�ee and Massie, 2001).
2.3. Probability of hoisting system failure
To secure an acceptable level of risk of the operation (DNVGL, 2016), recommends that risk assessment should be performed during the early planning stages of an operation. This timing is important because risk-mitigating tactics should be developed during the design phase rather than the operation phase. In the case studied here, the consid-erations during identifying risks, expand from the vessel and WEC design to weather conditions. This paper details how a hoisting system can fail during installation of a UU WEC from a barge. This failure can be related to the following conditions: a) exceeding the limiting lifting capacity of the crane, slings, shackles, and crane hook; b) exceeding the crane tip velocity; and c) other safety factors as given below. The
Fig. 2. The heave (a), roll (b), and pitch (c) RAOs for the vessel for 0.25 m and 7 m of the WEC’s submersion. The incoming wave direction is towards the WEC as illustrated in the following Fig. 4 (a).
Fig. 3. (a) UU WEC and (b) WEC’s simplified sketch for ANSYS Aqwa simulations.
M.A. Chatzigiannakou et al.
Ocean Engineering 205 (2020) 107287
4
likelihood of failure in the hoisting system depends on the steel wire safety load factor, the minimum breaking load, the fulfillment of static strength, and the slack sling criteria as specified in DNV-RP-H103 (DNV, 2011) and DNVGL-RP-G107 (DNVGL, 2016).
2.3.1. Steel wire safety Steel wire safety load factor, SF, is determined using the following
equation:
SFðLoadÞ ¼ 2:3ψ ; (5)
where ψ is the dynamic load factor for the crane. The concept of the safety factor in general is defined by the following equation:
SF ¼104
0:885 SWLþ 1910; (6)
where SWL is the safe working load as defined by the manufacturer.
2.3.2. Minimum breaking load Moreover, the minimum breaking load, B, of steel wire ropes cannot
be less than
B¼ SFS; (7)
where S is the maximum load of the rope resulting from the effect of the working load and loads due to any applicable dead weights.
2.3.3. Static strength The following formula gives proof of static strength:
FSd;s � FRd;s; (8)
where FSd;s is the design rope force and FRd;s is the limit design rope force. The design rope force in vertical hoisting is calculated as follows:
FSd;s¼mHrg
nfϕfs1fs2fs3γpγn; (9)
where mHr is the mass of the hoist load or that part of the mass of the hoist load that is acting on the rope falls under consideration, g is the gravity constant, nf is the number of falls carrying mHr, ϕ is the dynamic factor for inertial and gravity effects such as the dynamic load factor for the crane, fs1 is the rope reeving efficiency factor, fs2 is the rope force increasing factor due to non-parallel falls, fs3 is the rope force increasing factor due to horizontal forces on the hoist load, γp is the partial safety factor that is taken as 1.34 for regular loads, 1.22 for occasional loads, and 1.1 for exceptional loads, and γn is the risk coefficient.
The limit design rope force is calculated as follows:
FRd;s¼Fu
γrb; (10)
where Fu is the minimum breaking force of the rope as specified by the manufacturer and γrb is the minimum rope resistance factor, which de-pends on the geometry of the reeving system and is calculated as follows:
γrb¼ 1:34þ5
�Dd
�0:8
� 4; (11)
where D is the minimum relevant diameter and d is the rope diameter. If the load is larger than the hoisting system’s capacity, then the
hoisting line will snap. The above safety factor regarding crane hooks and cables have to be inspected for each crane used in a WEC installa-tion. In this paper, we assume that the crane satisfies the criteria.
2.4. Hydrodynamic and static forces for slack sling criterion
The slack sling criteria, defined in DNV-RP-H103 (DNV, 2011), and (Gu et al., n.d.), require the use of the simplified method for lifting through wave zone. This method estimates the forces acting on the WEC so as to confirm whether the crane and hoisting system capacity are adequate. This paper assumes that the horizontal extent of the WEC is small relative to the wave length, the vertical motion of the WEC and water make other motions insignificant, the WEC’s vertical motion is equal to the crane tip vertical motion, and zero crossing period s is included in the calculations (DNV, 2008). Moreover, this method as-sumes that the devices’ lowering operation through the wave zone takes no longer than 30 min (i.e., the sea state remains the same during the
Fig. 4. Barge-WEC system and incoming wave direction given in the global coordinates (a) and side view of the barge and crane while installing the WEC (b).
Table 3 WEC dimensions.
WEC dimensions
Fundament diameter 6.3 m Fundament height 0.5 m Generator height 6 m Generator diameter 1.20 m Total mass 55,000 kg
M.A. Chatzigiannakou et al.

Ocean Engineering 205 (2020) 107287
5
offshore operation). According to (DNV, 2011), Ftotal is “the characteristic total force on
an object lowered through water surface”, Fstatic is the WEC static weight, and Fhyd is the characteristic hydrodynamic force on an object when lowered through a water surface. Therefore, the hydrodynamic and static forces are calculated as follows:
Ftotal¼Fstatic þ Fhyd and (12)
Fstatic ¼Mg � ρVg; (13)
where M is the mass of a WEC in air, g is gravitational acceleration, ρ is the density of sea water, and V is the volume of displaced water by the WEC during different time instants when passing through the water surface. Fhyd is calculated as follows:
Fhyd ¼
ffiffiffiffiffiffiffiffiffiffiffiffiffiffiffiffiffiffiffiffiffiffiffiffiffiffiffiffiffiffiffiffiffiffiffiffiffiffiffi
ðFD þ FslamÞ2þ F2
M
q
(14)
where FD is the characteristic hydrodynamic drag force on the WEC, Fslam is the characteristic slamming impact force on the part of the WEC that penetrate the water surface, and FM is the characteristic hydrodynamic mass force on the WEC (DNV, 2011). FD is calculated by:
FD ¼ 0:5 ρCDAPV2r ; (15)
where CD is the drag coefficient in oscillatory flow of the submerged part of object (Imron et al., 2018), (Valen, 2010), (Nous, 2015), AP is the area of the submerged part of object projected on a horizontal plane, and Vr is the characteristic vertical relative velocity between the object and water particles. Vr is calculated as follows:
Vr ¼Vc þ
ffiffiffiffiffiffiffiffiffiffiffiffiffiffiffiffiffiffi
V2ct þ V2
w
q
; (16)
where Vc is the hook lowering velocity, Vct is the characteristic single amplitude vertical velocity of the crane tip, and Vw is the characteristic vertical water particle velocity. Vct is calculated as follows:
Vct ¼ 2π
ffiffiffiffiffiffiffiffiffiffiffiffiffiffiffiffiffiffiffiffiffiffiffiffiffiffiffiffiffiffiffiffiffiffiffiffiffiffiffiffiffiffiffiffiffiffiffiffiffiffiffiffiffiffiffiffiffiffiffiffiffiffiffiffiffiffiffiffiffiffiffi�
η3
T3
�2
þ
�b sin η4
T4
�2
þ
�l sin η5
T5
�2s
; (17)
where η3 is the characteristic single amplitude heave motion of vessel, η4 is the characteristic single amplitude roll angle of vessel, η5 is the characteristic single amplitude pitch angle of vessel, T3 is the heave natural period, T4 is the roll natural period, T5 is the pitch natural period, b is the horizontal distance from the vessel center line to the crane tip, l is the horizontal distance from midship to crane tip. Vw is calculated as follows:
Vw ¼ 0:30ffiffiffiffiffiffiffiffiffiffiπgHs
pe�
0:35dHs ; (18)
where Hs is the significant wave height, and d is the distance from water plane to center of gravity of submerged part of the object. The formula for FM is calculated as follows:
FM ¼
ffiffiffiffiffiffiffiffiffiffiffiffiffiffiffiffiffiffiffiffiffiffiffiffiffiffiffiffiffiffiffiffiffiffiffiffiffiffiffiffiffiffiffiffiffiffiffiffiffiffiffiffiffiffiffiffiffiffiffiffiffiffiffiffiffiffiffi
½ðM þ A33Þact�2þ ½ðρV þ A33Þaw�
2q
; (19)
where A33 is the heave added mass of the WEC, act is the characteristic single amplitude vertical acceleration of crane tip calculated as in equation (21), and aw is the characteristic vertical water particle ac-celeration, taken from (22). act and aw are calculated as follows:
act ¼ 4π2
ffiffiffiffiffiffiffiffiffiffiffiffiffiffiffiffiffiffiffiffiffiffiffiffiffiffiffiffiffiffiffiffiffiffiffiffiffiffiffiffiffiffiffiffiffiffiffiffiffiffiffiffiffiffiffiffiffiffiffiffiffiffiffiffiffiffiffiffiffiffiffiffi�η3
T23
�2
þ
�b sin η4
T24
�2
þ
�l sin η5
T25
�2s
and (20)
aw¼ 0:10πge�0:35d
Hs : (21)
Fslam, is calculated as follows:
Fslam¼ 0:5 ρCsAref V2r ; (22)
where Cs is the slamming coefficient (Prasad, 1994), (Larsen, 2013), (Peng, 2007), and Aref is the reference area.
2.4.1. Slack sling criterion The slack sling criterion denotes that a) snap forces should be avoi-
ded as much as possible by using the weather criteria adjustment, b) snap forces in slings or the hoist line could appear when the hydrody-namic force exceeds the static weight of the object, and c) the slack sling criteria should be fulfilled to ensure that snap loads are avoided in slings and the hoist line. This criteria indicate that the slack sling threshold is calculated as follows:
Fhyd � 0:9Fstatic� min; (23)
where Fstatic� min is the weight before flooding, which requires a weight reduction as specified by the weight inaccuracy factor (DNV, 2008). If the criteria are not fulfilled, the operation should not be carried out.
3. Results
3.1. Interaction between barge, WEC, and waves
The Ftotal, Fstatic, Fhyd, Fslam, and 0:9Fstatic amplitudes of the vessel are plotted in accordance to the WEC’s submersion (from 0 to 7 m of full submersion) for 8 s zero crossing periods, significant wave height of 0.25 m and 1.75 m, and the initial calculations with Vc ¼ 0.1 m/s (Fig. 5).
For a significant wave height 0.25 m, the slack sling criteria are met as evident by the fact that 0:9Fstatic is greater than the Fhyd (Fig. 5). Before 5.5 m submersion, the installation operation entails stability risks for a significant wave height 1.75 m (Fig. 5b). The same analysis is carried out for all other sea states.
3.2. Risk assessment of deployment for a hook lowering velocity of 0.1 m/ s
According to the slack sling criteria (DNV, 2011) (DNVGL, 2016), the applicable ranges of the significant wave heights are calculated using the following formula:
8:9
ffiffiffiffiffiffiHsg
s
�Tz � 13: (24)
The barge and WEC simulation for this study is illustrated below in Table 4.
The UU WEC can be safely installed using barges similar to the Svitzer Ark for sea states of 0 m and 0.25 m significant wave height and 3 s–13 s zero crossing period. For significant wave heights greater than 0.25 m and up to 2 m and respective zero crossing periods of 3 s–13 s, the operation enters an area where installation can be dangerous and therefore should be carried out cautiously. Finally, for the same zero crossing periods and significant wave heights of 2–3 m, the installation should be aborted as the risk for failure is significant.
4. Discussion
One of the limiting factors of the calculations, is that although all the forces presented in the standard (DNV, 2011) and used in the paper are time-dependent, only their maxima over each sea state, i.e. 30-min largest values, are calculated and compared.
Following the calculations, the table that indicates the permissible and restrictive installation sea states (significant wave height, Hs , cor-responding to zero crossing period, Tz) for the barge, WEC, and depth circumstances is set up according to the slack sling criteria. Table 4
M.A. Chatzigiannakou et al.

Ocean Engineering 205 (2020) 107287
6
depicts the safe, cautionary, and dangerous wave conditions in accor-dance to the fulfillment of the slack sling criteria. We studied the impact of different hook lowering velocities on the restrictive operational sea states.
4.1. Impact of the hook velocity
Below, we investigate how the hook velocity affects the sea states when installation is permitted. The results for when Vc equals 0.25 m/s, 0.5 m/s, and 0.6 m/s are shown in Tables 5–7, respectively.
Table 4 (Vc ¼ 0.1 m/s) and Table 5 (0.25 m/s) do not differ considerably; however, compared to Table 4, Table 5 has a slightly larger restrictive area of operation (“no” and “caution”) between sig-nificant wave height 2 m and zero crossing period from 4.5 to 13 s and significant wave height 1.75 m for zero crossing periods of 4 s–13 s.
Table 6 (Vc ¼ 0.5 m/s) compared to Table 4 (Vc ¼ 0.1 m/s), is sub-stantially altered, showing a permissible area for the operational wave weather window for 0 m of significant wave height for zero crossing periods of 3 s–13 s, a cautionary area for significant wave heights 0.25 m –1 m for the same zero crossing periods, and prohibited area for sig-nificant wave height of 1.25 m–3 m and zero crossing periods of 3.5 s–13 s. Table 7 (Vc equal to 0.6 m/s) indicates no permissible operations (i.e., no green areas or “ok” areas), but Table 7 does indicate a caution zone for 0 m–0.75 m significant wave height and zero crossing periods of 3 s–13 s, and the prohibitive zone (i.e., red areas or “no” areas) is expanded for 1 m–3 m significant wave height for 3 s–13 s zero crossing periods. In other words, while the operation for Vc ¼ 0.25 m/s can be carried out similarly as for Vc ¼ 0.1 m/s, when the hook lowering ve-locity is 0.5 m/s, the operational windows are decreased significantly. A speed of Vc ¼ 0.6 m/s should be avoided since there is no permissible
Fig. 5. Forces Ftotal, Fstatic, Fhyd, Fslam, and 0:9Fstatic of the barge while installing the WEC for 8 s zero crossing period and a significant wave height of 0.25 m (a) and 1.75 m (b).
Table 4 Representation of the permitted and restrictive significant wave height amplitudes for each zero crossing period for Vc ¼ 0.1 m/s.
Table 5 Representation of the permitted and restrictive significant wave height amplitudes for each zero crossing period for Vc ¼ 0.25 m/s.
M.A. Chatzigiannakou et al.

Ocean Engineering 205 (2020) 107287
7
wave zone for the operation.
4.2. Impact of the wave climate
Fig. 6 shows the sea states (in hours) as a function of significant wave height and zero crossing period at Lysekil, where the UU WECs are deployed, usually using a barge similar to the Svitzer Ark.
The sea states observed in the area have periods of 2–12 s and sig-nificant wave height from 0 m to 4 m. The prevailing significant wave height is 0.5 m–1 m with a 3 s–4 s zero crossing period (for about 1154 h/year), followed by 0 m–0.5 m significant wave height and zero crossing period of 2 s–3 s (about 1004 h/year). According to the
calculations of this study, for Vc ¼ 0.1 m/s the UU WEC’s installation can be carried out safely or with caution for the most frequently occurring wave conditions, scenarios that potentially provide enough time for installation.
Fig. 7, presents the percentages of the sea states occurrence as a function of significant wave height and zero crossing period of the Wave Hub test site at the north coast of Cornwall.
The Cornwall site is characterized by higher significant wave heights and zero crossing periods than the Lysekil area. The Wave Hub site has sea states of 0 m–6.5 m significant wave height and 2 s–11.5 s zero
Table 6 Representation of the permitted and restrictive significant wave height amplitudes for each zero crossing period for Vc ¼ 0.5 m/s.
Table 7 Representation of the permitted and restrictive significant wave height amplitudes for each zero crossing period for Vc ¼ 0.6 m/s.
Fig. 6. Scatter diagram of the wave climate of Lysekil test site obtained from wave data collected between 1997 and 2004 (Waters et al., 2009).
Fig. 7. Scatter diagram of the sea states occurrence frequency at the Wave Hub test area (Nieuwkoop-McCall et al., 2012).
M.A. Chatzigiannakou et al.
Ocean Engineering 205 (2020) 107287
8
crossing period, although typically the waves are 1 m–1.5 m with a 5 s–5.5 s period (4.6% of the total time/year). The second most frequent sea states observed are for 1 m–1.5 m wave heights and 5.5 s–6 s period (4.3% of the total time/year). The UU WEC can still be deployed at the Cornwall site, but with caution and for fewer sea states than at the Lysekil area.
The Cornwall test site (i.e., the Wave Hub site) is about 55 m deep (Lysekil area is about 25 m deep); that is, the Cornwall test site will require a longer deployment weather window for installations. The deployment of a WEC at the Lysekil site (25 m deep) will take approx-imately 4 min with a crane tip velocity of 0.1 m/s. Adding to this 5 min to lift the generator before submersion, the total installation time will not exceed 9 min. Deploying the same device with the same lowering velocity at the Wave Hub site (55 m deep) will take about 9 min; adding the lifting time, the total deployment time will be 14 min. In other words, submerging the same WEC at the Cornwall site takes 1.5 more time than it does at the Lysekil area, but both operations can be completed within the same 30-min time window.
Finally, considering Table 4 and Figs. 6 and 7, the operability of the installation operation can be calculated as an estimation of the available time for installation compared to the total time. The permissible sea states for deploying the UU WEC are of 0 m–0.25 m wave height and 3 s–13 s wave period. To facilitate the combination of Table 4 data with Figs. 6 and 7, we will consider sea states of wave heights 0 m–0.5 m and periods 3 s–13 s. These states are found at the Lysekil site 37.44% of the time yearly, while at the Cornwall site are encountered 0.8% of the total time. This can indicate that for such short time available for deployment at the Wave Hub site, another installation method, e.g. instead of using a time-consuming barge, a faster, specialized vessel could be hired for the operation.
5. Conclusions
An UU type WEC can be safely installed with a barge similar to the Svitzer Ark for significant wave heights up to 0.25 m and zero crossing periods from 3 to 13 s. For the same zero crossing periods and significant wave heights over 0.25 m and up to 2 m, the deployment procedure can be carried out with caution. Significant wave heights over 2 m and up to 3 m and with zero crossing periods of 3 s–13 s are restrictive to offshore deployment operations.
The hook lowering velocity plays an important role in the safety of the operation; that is, when the hook lowering velocity increases, it af-fects the drag (FD), slam (FslamÞ, and characteristic hydrodynamic (Fhyd) forces, which results in decreasing the safe operational sea states. This installation strategy of using a standard barge to deploy a UU type WEC can be carried out in locations other than the Lysekil site, for example, at the Wave Hub test area in Cornwall. However, since the wave conditions in Cornwall are more severe than in Lysekil, this operation may require longer time periods because of narrower weather windows.
This study could be applied to other vessels, such as tugboats or specialized vessels for offshore operations, and in more test locations and sea states with the aim to find the optimal deployment method according to an area’s sea conditions. This approach will optimize the installation procedures, lowering the overall cost by avoiding rental expenses for idle vessels.
Declaration of competing interest
The authors declare that they have no known competing financial interests or personal relationships that could have appeared to influence the work reported in this paper.
CRediT authorship contribution statement
Maria Angeliki Chatzigiannakou: Conceptualization, Methodol-ogy, Software, Validation, Formal analysis, Investigation, Writing -
original draft, Writing - review & editing, Visualization, Project administration. Tatiana Potapenko: Writing - original draft, Writing - review & editing. Boel Ekergård: Conceptualization. Irina Temiz: Conceptualization, Methodology, Software, Writing - review & editing, Supervision, Project administration.
Acknowledgements
The authors would like to acknowledge STandUp for Energy, ÅForsk, Swedish Energy Agency, and Uppsala University for supporting this research.
References
Bahaj, A.S., 2011. Generating electricity from the oceans. Renew. Sustain. Energy Rev. 15, 3399–3416. https://doi.org/10.1016/j.rser.2011.04.032.
Chanson, H., 2009. Applied Hydrodynamics: an Introduction to Ideal and Real Fluid Flows.
Chatzigiannakou, M.A., Dolguntseva, I., Leijon, M., 2017. Offshore deployments of wave energy converters by seabased industry AB. J. Mar. Sci. Eng. 5, 15. https://doi.org/ 10.3390/jmse5020015.
DNV, 2011. Modelling and Analysis of Marine Operations DNV-RP-H103. DNV, 2008. DNV Recommended Practice on Modelling and Analysis of Marine
Operations New DNV Recommended Practice DNV-RP-H103 Modelling. DNVGL, 2016. Efficient Updating of Risk Assessments DNVGL-RP-G107. Folley, M., 2016. Numerical Modelling of Wave Energy Converters State-Of-The-Art
Techniques for Single Devices and Arrays. Academic Press. Gu, X., Nesse, H., Nystrøm, P.R., n.d. Re-evaluation of DNV Simplified Formulae for
Crane Tip Motions 1–10. IMO, 2010. International Safety Management Code. Imron, C., Mardianto, L., Widodo, B., Yuwono, T., 2018. Mathematical modeling of drag
coefficient reduction in circular cylinder using two passive controls at Re ¼ 1000. Math. Comput. Appl. 23, 2. https://doi.org/10.3390/mca23010002.
IRENA, 2014. Wave energy, future energy: improved, sustainable and clean options for our planet. https://doi.org/10.1016/B978-0-08-099424-6.00017-X.
Journ�ee, J.M.J., Massie, W.W., 2001. Offshore Hydromechanics. Delft University of Technology, 2001.
Larsen, E., 2013. Impact Loads on Circular Cylinders. Leijon, M., Bostr€om, C., Danielsson, O., Gustafsson, S., Haikonen, K., Langhamer, O.,
Str€omstedt, E., Stålberg, M., Sundberg, J., Svensson, O., Tyrberg, S., Waters, R., 2008. Wave energy from the north sea: experiences from the Lysekil research site. Surv. Geophys. 29, 221–240. https://doi.org/10.1007/s10712-008-9047-x.
Lejerskog, E., Bostr€om, C., Waters, R., 2015. Experimental results on power absorption from a wave energy converter at the Lysekil wave energy research site. Renew. Energy 77, 9–14. https://doi.org/10.1016/j.renene.2014.11.050.
Lejerskog, E., Gravråkmo, H., Savin, A., Str€omstedt, E., Tyrberg, S., Haikonen, K., Bostr€om, C., Rahman, M., Ekstr€om, R., Svensson, O., Engstr€om, J., Ekergård, B., Baudoin, A., Kurupath, V., Hai, L., Li, W., Sundberg, J., Leijon, M., 2009. Lysekil research site , Sweden : a status update. Proc. 8th Eur. Wave Tidal Energy Conf. 8.
McComb, C., Lawson, M., Yu, Y.H., 2013. Combining multi-body dynamics adn potential flow simulation methods to model a wave energy converter. 1st Mar. Energy Technol. Symp. 1–8 https://doi.org/10.13140/RG.2.1.3817.3285.
Mueller, M., Wallace, R., 2008. Enabling science and technology for marine renewable energy, 36, pp. 4376–4382. https://doi.org/10.1016/j.enpol.2008.09.035.
Nieuwkoop-McCall, J. van, Smith, H., Smith, G., Johanning, L., 2012. Long-Term Hindcast for Wave Hub 49.
Nous, R.J.M., 2015. A Dynamic Approach to Evaluating the Effect of Slamming on a Jacket Foundation Template Lowered through the Wave Zone.
Parwal, A., Remouit, F., Hong, Y., Francisco, F., Castellucci, V., Hai, L., Ulvgård, L., Li, W., Lejerskog, E., Baudoin, A., 2015. Wave energy research at Uppsala university and the Lysekil research site , Sweden : a status update. Proc. 11th Eur. Wave Tidal Energy Conf. 1–10.
Peng, H., Ali, A., Qiu, W., 2015. Hydrodynamic Interaction of Two Bodies in Waves. Int. Work. Water Waves Float. Bodies.
Peng, Z., 2007. Wave Slamming Impact on Offshore Wind Turbine Foundations, pp. 1–8. Prasad, S., 1994. Wave impact forces on a horizontal cylinders. PhD Thesis, p. 2. Remouit, F., Chatzigiannakou, M., Bender, A., Temiz, I., Engstr€om, J., Sundberg, J.,
2018. Deployment and maintenance of wave energy converters at the Lysekil research Site : a comparative study on the use of divers and remotely-operated vehicles. J. Mar. Sci. Eng. Artic. 1–21. https://doi.org/10.3390/jmse6020039.
Rusu, E., Onea, F., 2018. A review of the technologies for wave energy extraction. Clean Energy 2, 10–19. https://doi.org/10.1093/ce/zky003.
Smith, H.C.M., Pearce, C., Millar, D.L., 2012. Further analysis of change in nearshore wave climate due to an offshore wave farm: an enhanced case study for the Wave Hub site. Renew. Energy 40, 51–64. https://doi.org/10.1016/j.renene.2011.09.003.
Valen, M., 2010. Launch and Recovery of ROV: Investigation of Operational Limit from DNV Recommended Practices and Time Domain Simulations in SIMO Student. Master’s Thesis. Norw. Univ. Sci. Technol., Trondheim.
Waters, R., Engstr€om, J., Isberg, J., Leijon, M., 2009. Wave climate off the Swedish west coast. Renew. Energy 34, 1600–1606. https://doi.org/10.1016/j. renene.2008.11.016.
M.A. Chatzigiannakou et al.