Impact of Roadside Drying on Delivered Costs for - MDPI
19
Article Impact of Roadside Drying on Delivered Costs for Eucalyptus globulus Logging Residue and Whole Trees Supplying a Hypothetical Energy Plant in Western Australia Using a Linear-Programming Model Martin Strandgard 1,2, * , Mohammad Sadegh Taskhiri 1 , Mauricio Acuna 2 and Paul Turner 1 Citation: Strandgard, M.; Taskhiri, M.S.; Acuna, M.; Turner, P. Impact of Roadside Drying on Delivered Costs for Eucalyptus globulus Logging Residue and Whole Trees Supplying a Hypothetical Energy Plant in Western Australia Using a Linear-Programming Model. Forests 2021, 12, 455. https:// doi.org/10.3390/f12040455 Academic Editor: Gianni Picchi Received: 24 February 2021 Accepted: 1 April 2021 Published: 9 April 2021 Publisher’s Note: MDPI stays neutral with regard to jurisdictional claims in published maps and institutional affil- iations. Copyright: © 2021 by the authors. Licensee MDPI, Basel, Switzerland. This article is an open access article distributed under the terms and conditions of the Creative Commons Attribution (CC BY) license (https:// creativecommons.org/licenses/by/ 4.0/). 1 ARC Centre for Forest Value, eLogistics Research Group (eLRG), Discipline of ICT, College of Science and Engineering, University of Tasmania, Hobart, TAS 7001, Australia; [email protected] (M.S.T.); [email protected] (P.T.) 2 Forest Industries Research Centre, University of the Sunshine Coast, Locked Bag 4, Maroochydore, QLD 4558, Australia; [email protected] * Correspondence: [email protected] Abstract: Australia’s large potential forest bioenergy resource is considerably underutilised, due largely to its high delivered costs. Drying forest biomass at the roadside can potentially reduce its delivered cost through weight reduction and increased net calorific value. There has been little research on the impact of roadside drying for Australian conditions and plantation species. This study compared delivered costs for three forest biomass types—Eucalyptus globulus plantation whole trees and logging residue (LR)-disaggregated (LR conventional) or aggregated (LR fuel-adapted)—and three roadside storage scenarios—no storage, ≤two-month storage and optimal storage—to supply a hypothetical thermal power plant in south-west Western Australia. The study was performed using a tactical linear programming tool (MCPlan). Roadside storage reduced delivered costs, with optimal storage (storage for up to 14 months) producing the lowest costs. Delivered costs were inversely related to forest biomass spatial density due to transport cost reductions. Whole trees, which had the highest spatial density, stored under the optimal storage scenario had the lowest delivered costs (AUD 7.89/MWh) while LR conventional, with the lowest spatial density, had the highest delivered costs when delivered without storage (AUD 15.51/MWh). For both LR types, two-month storage achieved ~60% of the savings from the optimal storage scenario but only 23% of the savings for whole trees. The findings suggested that roadside drying and high forest biomass spatial density are critical to reducing forest biomass delivered costs. Keywords: bioenergy; forest biomass; feedstock types; transport cost; mathematical optimisation; supply chain 1. Introduction Worldwide interest has increased in the use of bioenergy, such as forest biomass (FB) (trees, logs, logging residue (LR), bark and stumps [1]), to reduce greenhouse gas emis- sions [2] and dependence on imported fuels [3]. Major FB sources include unutilised tree parts/trees remaining after harvest, extraction and processing of commercial roundwood, trees rendered non-commercial through damage by insects, disease, fire or windthrow, and short-rotation dedicated energy plantations. Industrial use of forest bioenergy is well- developed in the northern hemisphere [4] but is comparatively under-utilised elsewhere. Australia, for example, has a large potential forest bioenergy resource [5] but currently supplies <2% of its energy needs from FB [6]. A major impediment to the expanded use of forest bioenergy is its high cost relative to other energy sources [7]. High FB supply chain costs, particularly for transport and Forests 2021, 12, 455. https://doi.org/10.3390/f12040455 https://www.mdpi.com/journal/forests
-
Upload
khangminh22 -
Category
Documents
-
view
4 -
download
0
Transcript of Impact of Roadside Drying on Delivered Costs for - MDPI

Article
Impact of Roadside Drying on Delivered Costs forEucalyptus globulus Logging Residue and Whole TreesSupplying a Hypothetical Energy Plant in WesternAustralia Using a Linear-Programming Model
Martin Strandgard 1,2,* , Mohammad Sadegh Taskhiri 1 , Mauricio Acuna 2 and Paul Turner 1
�����������������
Citation: Strandgard, M.; Taskhiri,
M.S.; Acuna, M.; Turner, P. Impact of
Roadside Drying on Delivered Costs
for Eucalyptus globulus Logging
Residue and Whole Trees Supplying a
Hypothetical Energy Plant in Western
Australia Using a Linear-Programming
Model. Forests 2021, 12, 455. https://
doi.org/10.3390/f12040455
Academic Editor: Gianni Picchi
Received: 24 February 2021
Accepted: 1 April 2021
Published: 9 April 2021
Publisher’s Note: MDPI stays neutral
with regard to jurisdictional claims in
published maps and institutional affil-
iations.
Copyright: © 2021 by the authors.
Licensee MDPI, Basel, Switzerland.
This article is an open access article
distributed under the terms and
conditions of the Creative Commons
Attribution (CC BY) license (https://
creativecommons.org/licenses/by/
4.0/).
1 ARC Centre for Forest Value, eLogistics Research Group (eLRG), Discipline of ICT,College of Science and Engineering, University of Tasmania, Hobart, TAS 7001, Australia;[email protected] (M.S.T.); [email protected] (P.T.)
2 Forest Industries Research Centre, University of the Sunshine Coast, Locked Bag 4,Maroochydore, QLD 4558, Australia; [email protected]
* Correspondence: [email protected]
Abstract: Australia’s large potential forest bioenergy resource is considerably underutilised, duelargely to its high delivered costs. Drying forest biomass at the roadside can potentially reduceits delivered cost through weight reduction and increased net calorific value. There has been littleresearch on the impact of roadside drying for Australian conditions and plantation species. This studycompared delivered costs for three forest biomass types—Eucalyptus globulus plantation whole treesand logging residue (LR)-disaggregated (LR conventional) or aggregated (LR fuel-adapted)—andthree roadside storage scenarios—no storage, ≤two-month storage and optimal storage—to supply ahypothetical thermal power plant in south-west Western Australia. The study was performed usinga tactical linear programming tool (MCPlan). Roadside storage reduced delivered costs, with optimalstorage (storage for up to 14 months) producing the lowest costs. Delivered costs were inverselyrelated to forest biomass spatial density due to transport cost reductions. Whole trees, which hadthe highest spatial density, stored under the optimal storage scenario had the lowest delivered costs(AUD 7.89/MWh) while LR conventional, with the lowest spatial density, had the highest deliveredcosts when delivered without storage (AUD 15.51/MWh). For both LR types, two-month storageachieved ~60% of the savings from the optimal storage scenario but only 23% of the savings forwhole trees. The findings suggested that roadside drying and high forest biomass spatial density arecritical to reducing forest biomass delivered costs.
Keywords: bioenergy; forest biomass; feedstock types; transport cost; mathematical optimisation;supply chain
1. Introduction
Worldwide interest has increased in the use of bioenergy, such as forest biomass (FB)(trees, logs, logging residue (LR), bark and stumps [1]), to reduce greenhouse gas emis-sions [2] and dependence on imported fuels [3]. Major FB sources include unutilised treeparts/trees remaining after harvest, extraction and processing of commercial roundwood,trees rendered non-commercial through damage by insects, disease, fire or windthrow,and short-rotation dedicated energy plantations. Industrial use of forest bioenergy is well-developed in the northern hemisphere [4] but is comparatively under-utilised elsewhere.Australia, for example, has a large potential forest bioenergy resource [5] but currentlysupplies <2% of its energy needs from FB [6].
A major impediment to the expanded use of forest bioenergy is its high cost relativeto other energy sources [7]. High FB supply chain costs, particularly for transport and
Forests 2021, 12, 455. https://doi.org/10.3390/f12040455 https://www.mdpi.com/journal/forests

Forests 2021, 12, 455 2 of 19
comminution [8], primarily result from its high moisture content (MC), low energy, bulkand spatial densities and high spatial and temporal variability in quantity [9,10].
Primary FB transport costs can be reduced through logging residue aggregation usingfuel-adapted harvesting [11] or roadside processing [12]; however, soil contamination canoccur where whole trees are skidded to roadside [13]. Natural drying of FB infield or atroadside can be a cost-effective means to reduce secondary transport costs through weightreduction and increased net calorific value [14–16]. Natural drying can also increase FBvalue, where delivered MC is a component of pricing, and reduce road maintenance coststhrough reduced truck trips [17]. Where FB is used for bioenergy in Australia, it is eithercomminuted and transported with minimal storage time or, where there is recognition ofthe value of natural drying, stored at roadside for a fixed length of time (typically one totwo months), prior to comminution and secondary transport.
The emerging Australian bioenergy industry has focussed on plantation LR as themajor potential FB resource (>7,000,000 t/year potentially available [18]). Major com-mercial plantation species in Australia include Pinus spp. (predominantly P. radiata) forsawlogs and pulplogs and Eucalyptus globulus and E. nitens for export woodchips, withapproximately 1,000,000 ha of Pinus and 900,000 ha of Eucalyptus plantations. Australianplantations are harvested using either cut-to-length at the stump or whole tree processingat roadside harvest systems. Other potential bioenergy sources under consideration inAustralia include failed or underperforming short-rotation eucalypt plantation trees [19],thinned trees without an alternative market [20] or FB from mechanical fuel reductiontreatments [21]. Diverting wood waste from landfill is another potential bioenergy source,though contamination and heterogeneity of the resource can increase recovery costs [22,23].
A broad analysis of FB supply chain costs, including harvest, transport, storage andprocessing costs and material losses, is required to assess its commercial viability as abioenergy source and to compare delivered costs of potential FB sources. This is partic-ularly relevant to natural drying, which involves a trade-off between gains from dryingagainst storage costs [24], increased comminution costs [25], material losses [26] and FBdeterioration [27]. Research aimed at reducing FB supply chain costs has led to the devel-opment of numerous mathematical models and tools in recent decades, predominantlytargeted at strategic and tactical planning levels [16]. Strategic planning defines a broadoverview of a business’s direction, including long-term harvest levels and facility sizeand location. Tactical planning identifies areas to be harvested over a one-to-five-yearperiod. Few published FB supply chain tools have considered the impact of infield orroadside drying on costs and returns and even fewer have used models to estimate naturaldrying rates [16]. As FB is typically also stored at the power plant (and/or at intermediatelocations), consideration may also be made in an FB supply chain tool of MC changes fromnatural drying at these locations.
The objective of this paper was to compare the impact of roadside drying on thedelivered costs of chipped Eucalyptus globulus whole trees and LR obtained from either aconventional CTL harvest system or a fuel-adapted harvest system. The comparison wasconducted using a tactical-level linear-programming model to compare delivered costsfor each FB type supplying a hypothetical thermal power plant in south-west WesternAustralia under three storage scenarios: no storage, two months of storage and the optimalstorage duration to minimise delivered costs.
2. Materials and Methods2.1. Study Description
The system under study includes harvest, primary and secondary transport andchipping of E. globulus LR or whole trees to supply a hypothetical 10 MWe thermal powerplant located in south-west Western Australia to produce electricity. Moving grate andfluidised bed boilers of this capacity are able to accept FB with a wide range of MCvalues [28]. The region has over 200,000 ha of E. globulus plantations managed on a10–15 year rotation to produce export woodchips [29]. The hypothetical power plant

Forests 2021, 12, 455 3 of 19
would require 20,000–25,000 MWh of energy input per month, supplied using E. globulusLR (branches, stem tops and bark) or whole trees (aboveground biomass without thestump). Monthly energy requirements reflect seasonal variations in electricity demand inWestern Australia [30].
The availability of LR from individual plantations in the study area is dependent ona number of factors, including company policies and attitudes regarding LR retention,current site preparation practices (LR removal can considerably reduce site preparationcosts [31] and whether the current rotation is the final rotation (for underperformingplantations or areas leased from farmers). As there have been no published studies on theavailability of E. globulus plantation LR in the studied region, a conservative estimate of LRfrom approximately one-third of the annual E. globulus plantation harvest was assumedto be available in the study (395,000 m3). Six supply regions were set up for the study,representing regions with a one-way transport distance of 25 km, 50 km, 75 km, 100 km,125 km and 150 km. The wood availability in each supply region (25,000 m3, 30,000 m3,45,000 m3, 60,000 m3, 90,000 m3, 145,000 m3) broadly matches that available from plantationareas surrounding the city of Albany in south-west Western Australia. The maximumone-way transport distance of 150 km was based on a study in the same area as the currentstudy [32].
2.2. Forest Biomass Supply Chains
Three E. globulus FB supply chains were modelled:
• Whole trees;• LR conventional: LR scattered over harvester path during harvest (Figure 1a);• LR fuel-adapted: LR piled alongside logs during harvest (Figure 1b).
Figure 1. Log and logging residue (LR) post-harvest arrangements (a) LR conventional; (b) LRfuel-adapted [11].
Whole trees were felled and bunched with a feller–buncher and transported to road-side by grapple skidders. LR was harvested in an integrated double-pass operation [33]with a harvester/processor and unmodified forwarder.

Forests 2021, 12, 455 4 of 19
The yields for each FB type are shown in Table 1. As the whole trees scenario includesthe stem and most of the foliage and branches, it had a considerably higher yield than theLR types. The LR fuel-adapted scenario was able to extract considerably more of the LRthan the LR conventional scenario as the LR is piled during processing of the trees to logs.It should also be noted that the LR includes bark, which can have a yield equivalent to 10%of the stemwood mass [34].
Table 1. Model parameters for Forest Biomass (FB) types.
Parameter Units Logging Residue Whole Trees
Basic density (0% Moisture Content (MC)weight/solid volume) 1
kg/m3 450 500
Bulk density (chips) (0% MC weight/bulk volume) 2 kg/m3 189 210
Bulk volume (m3) to solid volume (m3) ratio 2.38 2.38
Solid content 2 0.42 0.42
Proportion of FB extracted 2 * % Conventional: 40 95Fuel-adapted: 70
FB yield 2 m3/ha Conventional: 45 250Fuel-adapted: 84
Delivered MC range % No storage MC at harvest MC at harvestTwo months ≤48 ≤48Optimum 3 ≤35 ≤35
Material loss rate 4 %/month 1.0 1.0
Harvest age 5 years 10 10
Energy content @ 0% MC GJ/t 19.0 6 19.0 7
One-way distance km 25–150 5 25–150 5
Interest rate 5 %/month 0.5 0.5
Harvest and transport to roadside 8 $/t - 6.00
Transport to roadside 8 $/t Conventional 13.00 -Fuel-adapted 9.40 -
Transport rate 9 $/t-km 25 km 0.20 0.2050 km 0.15 0.1575 km 0.15 0.15
100 km 0.14 0.14125 km 0.13 0.13150 km 0.12 0.12
Chipping cost 10 $/t MC > 50% 9.5 9.5MC 36–50% 9.7 9.7MC ≤ 35% 10.0 10.0
* Proportion of LR refers to the total LR produced. Proportion of whole trees refers to the total aboveground biomass, excluding the stump.1. Based on published figures [35] and unpublished research. 2. Based on unpublished research. 3. Based on the ISO 17225 standard fornon-industrial chipped material (Grade A2). 4. As there are no published eucalypt LR loss rates, a typical figure for coniferous LR was used.5. Typical values for Australian E. globulus plantations. 6. From Núñez-Regueira, Proupín-Castiñeiras and Rodríguez-Añón [35]. 7. FromMateos and Ormaetxea [36]. 8. From Strandgard, et al. [37] and Strandgard and Mitchell [11]. 9. Cost of secondary transport by semi-trailer.Published and industry sources. 10. Based on Acuna et al. [16] and unpublished sources.
For the three modelled supply chains, FB was chipped at roadside directly into trucksprior to secondary transport. LR harvest costs were set to zero as they were assumed to beincluded in roundwood harvest costs. The studied FB supply chains were modelled fromthe tree at time of harvest to delivery of chips at the power plant. Year-round access tostored FB is available as the majority of E. globulus plantations in the region were establishedon ex-pasture sites with little slope, close to major roads. Modelled FB supply chains werecompared in terms of their delivered cost.
Forests 2021, 12, 455 5 of 19
Three storage scenarios were studied: no storage (NS), up to two-month storage atroadside (TM) and storage at roadside for the optimal period of time (OS). FB was notstored infield prior to storage at roadside. Model parameters for each FB type and scenarioare listed in Table 1. Modelled FB supply chain activities were harvest, primary transport,storage, chipping and secondary transport.
Six-axle semi-trailers were used for secondary chip transport for all scenarios. Semi-trailers are widely used in Australia to transport logs and chips as they can access roadsthat are inaccessible to larger trucks due to mass limits and road conditions [38]. Based onAustralian forest haulage company data and manufacturer specifications, semi-trailer loadcapacity for transporting chips was set as 26.5 t and 75 m3.
The study assumed that there were no limitations for truck numbers and chipping andunloading capacities and no delays along the supply chain, and no intermediate storagewas required. MC was expressed on a wet basis. Whole tree stands were not re-established.
2.3. Drying Curves
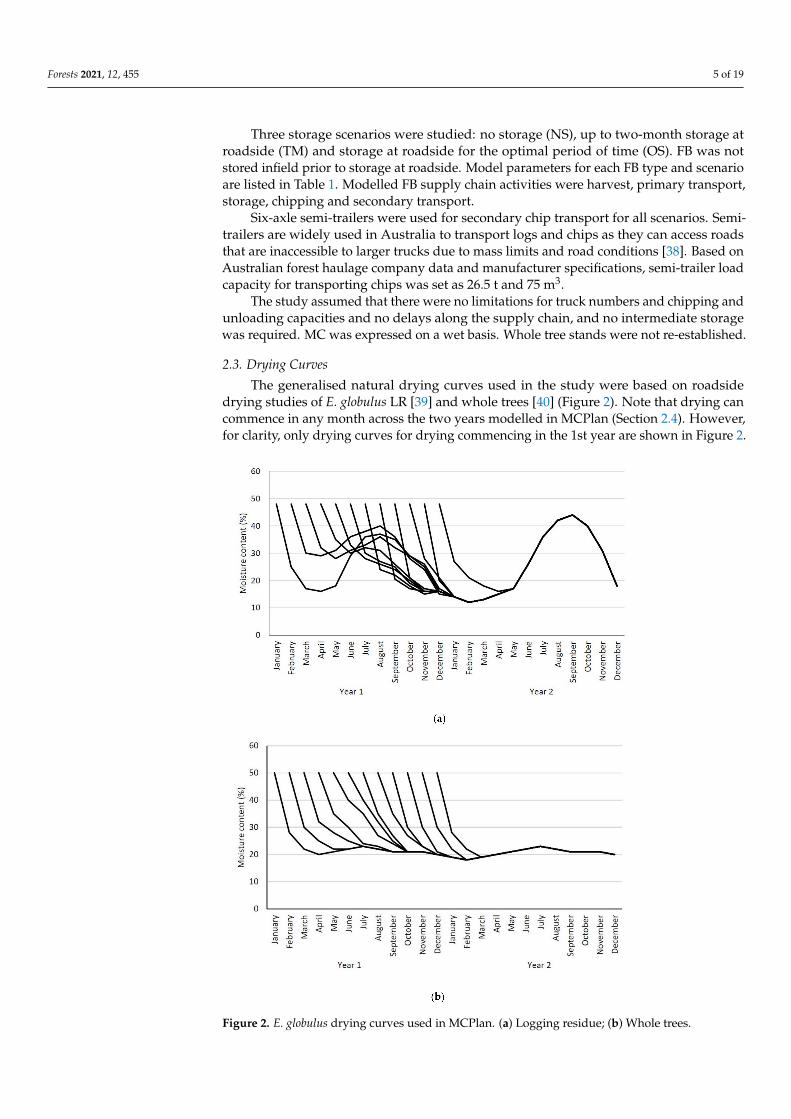
The generalised natural drying curves used in the study were based on roadsidedrying studies of E. globulus LR [39] and whole trees [40] (Figure 2). Note that drying cancommence in any month across the two years modelled in MCPlan (Section 2.4). However,for clarity, only drying curves for drying commencing in the 1st year are shown in Figure 2.
Figure 2. E. globulus drying curves used in MCPlan. (a) Logging residue; (b) Whole trees.

Forests 2021, 12, 455 6 of 19
2.4. Optimisation Model
MCPlan is a linear programming model developed to optimise timber and biomasssupply chains [41,42]. The model is implemented with Visual Basic™ macros and solvedwith the What’s best™ solver add-in for MS Excel™. The objective function minimises totalsupply chain costs (delivered costs).
MCPlan has a two-year planning horizon divided into monthly steps. Trees can beharvested in any month over the two-year period but only delivered to the power plant inthe second year.
In MCPlan, LR is produced as a by-product of log production. For the current study,the energy content and costs associated with logs in MCPlan were set to zero so that MCPlandetermined the optimal least-cost solution solely on the basis of delivering the quantity ofFB chips required to meet monthly energy requirements for each storage scenario. Wholetrees were modelled as LR in MCPlan, as LR is chipped at roadside whereas logs arechipped at the power plant.
Sets, parameters and variables used in the mathematical model implemented inMCPlan are listed in Table 2.
Table 2. Sets, parameters and variables used in the MCPlan model formulation.
Term Definition
Sets
i, j Periods, i ∈ I = {1, . . . , 24}, j ∈ J = {13, . . . , 24}
s Supply areas, s ∈ S
Parameters
BFs Biomass factor—ratio between solid volume of LR and solid volume oflogs produced in each supply area s
LVFLR Loose volume factor—loose volume of chips produced from 1 m3 solid of LR
LVFRW Loose volume factor—loose volume of chips produced from 1 m3 solid of logs
SCRWs Solid volume of logs available in supply area s (m3 s)
EDj Energy demand of energy plant in period j (energy unit, MWh)
ECLRij
Energy content of chips produced in period j from LR stacked at theroadside from period i (energy unit per loose volume of chips, e.g.,
MWh/m3 L)
ECRWij
Energy content of chips produced at static chipmill in period j from logsstacked at the roadside from period i (energy unit per loose volume of
chips, e.g., MWh/m3 L)
MCRWij Moisture content of logs stacked at the roadside from period i to period j (%)
MCLRij Moisture content of LR stacked at the roadside from period i to period j (%)
MinMCRW,MinMCLR
Minimum moisture content of logs and LR delivered to energy plant,respectively (%)
MaxMCRW,MaxMCLR
Maximum moisture content of logs and LR delivered to energy plant,respectively (%)
CTRWijs, CTLRijs
Transport cost for logs and chips from LR stacked at the roadside in supplyarea s and period i and delivered to the energy plant in period j,
respectively ($/m3 s for logs and $/m3 L for chips from LR)
CHRWis, CHLRisHarvest and primary transport cost for logs and LR produced in period i
and supply area s ($/m3 s)
CDRWij, CDLRijDrying cost for logs and LR stacked at the roadside from period i to period
j ($/m3 s)
CCHRWij, CCHLRijChipping cost for logs and LR stacked at the roadside from period i to
period j ($/m3 s for logs and $/m3 L for LR)

Forests 2021, 12, 455 7 of 19
Table 2. Cont.
Term Definition
Variables
XijsDecision variable. Solid volume of logs harvested in period i, and dried at
the roadside until period j in supply area s (m3 s)
YijsDecision variable. Solid volume of LR collected in period i, and dried at the
roadside until period j in supply area s (m3 s)
X’ijsXijs × LVFRW Loose volume of chips produced from logs harvested inperiod i, and dried at the roadside until period j in supply area s (m3 L)
Y’ijsYijs × LVFLR Loose volume of chips produced from LR collected in period
i, and dried at the roadside until period j in supply area s (m3 L)
The objective function is presented in Equation (1) and the constraints are listed inEquations (2)–(8). The objective function minimises total supply chain costs (deliveredcosts) including the following components:
• harvesting and primary transport of logs and FB to roadside;• drying of logs and FB at roadside;• secondary transport of logs and FB chips.
The objective function (Equation (1)) assumptions were:
1. Collection and transport of logs and FB to roadside occur at the time of harvest; thiscost varies by supply area and depends on the MC of logs and FB;
2. Drying cost only depends on the length of storage of logs and FB at the roadside;3. Chipping cost depends on the MC of logs and FB. The assumption is that chipping of
materials with a reduced MC increases blade tear-out, increasing their maintenanceand replacement costs [25].
Min = ∑i
∑j
∑s
Xijs ×(CTRWijs + CHRWis + CDRWij + CCHRWij
)+ ∑
i∑j
∑s
Yijs ×(CHLRis + CDLRij + CCHLRij
)+ ∑
i∑j
∑s
Y′ ijs × CTLRijs(1)
Equation (2) ensures that the availability of solid volume logs in each supply area isnot exceeded.
∑i
∑j
Xijs ≤ SCRWs ∀s ∈ S (2)
Equation (3) ensures that, for any period, the solid volume of FB collected does notexceed its availability. The latter is determined by the solid volume of logs harvested in aperiod and the biomass factor in the supply area.
∑j
Xijs × BFs ≥ ∑j
Yijs ∀i ∈ I, s ∈ S (3)
Equation (4) ensures that the demand for energy at the energy plant is met ineach period.
∑i
∑s
(X′ ijs × ECRWij
)+ ∑
i∑
s
(Y′ ijs × ECLRij
)≥ EDj ∀j ∈ J (4)
Equations (5) and (6) ensure that the logs and FB chips are delivered within theuser-specified MC range to the energy plant.

Forests 2021, 12, 455 8 of 19
∑i
∑s
Xijs ×MinMCRW ≤ ∑i
∑s
Xijs × MCRWij ≤ ∑i
∑s
Xijs × MaxMCRW ∀j ∈ J (5)
∑i
∑s
Y′ ijs ×MinMCLR ≤ ∑i
∑s
Y′ ijs × MCLRij ≤ ∑i
∑s
Y′ ijs × MaxMCLR ∀j ∈ J (6)
Equation (7) allows the maximum length of storage to be set.
∑j>i
Xijs = 0 ∀ i ∈ I, s ∈ S (7)
Equation (8) establishes the non-negativity of decision variable Xijs.
Xijs ≥ 0, ∀ i ∈ I, j ∈ J, s ∈ S (8)
2.5. Sensitivity Analysis
Sensitivity analyses were performed on harvest and primary transport costs, storagelosses and MC.
Harvest/primary transport costs can vary based on factors including tree and equip-ment characteristics, operator experience and site conditions. Based on published values,harvest/primary transport costs were varied by +/−10%.
Published monthly storage losses for LR and whole trees varied between 0.1% and4% depending on various factors including species, pile size and season and length ofstorage [43–46]. To examine the sensitivity of delivered costs to storage losses, loss valuesof 0.1% and 2% were evaluated.
The effect of whole tree and LR MC on delivered costs was examined by modifyingMC by ±5%. MC changes were absolute rather than relative, e.g., an MC of 40% reducedby 5% would be 35%. Changes in MC of >5% produced infeasible solutions from theMCPlan optimiser.
3. Results3.1. Storage Scenarios
Delivered costs were highest for the NS scenario for all FB types and lowest for theOS scenario (Figure 3). The cost components with the greatest reductions between the NSscenario and the other two scenarios were secondary transport and chipping. Deliveredcost reductions for the TM and OS scenarios compared with the NS scenario were, for eachFB type: TM scenario 17%, 18% and 5% (LR conventional, LR fuel-adapted and wholetrees, respectively); OS scenario 29%, 30% and 22% (LR conventional, LR fuel-adaptedand whole trees, respectively). Storage costs were <1.5% of delivered costs for the TM andOS scenarios.
Differences in delivered costs between FB types within a scenario mainly resultedfrom differences in their primary and secondary transport costs. Within each scenario, costreductions between FB types (compared with LR conventional) ranged from 16% to 18%for LR fuel adapted and 27% to 36% for whole trees.

Forests 2021, 12, 455 9 of 19
Figure 3. Delivered costs for the LR conventional, LR fuel-adapted and whole tree FB types for theNo Storage (NS), up to Two Months storage (TM) and Optimum Storage (OS) scenarios.
3.2. Truck Capacity Utilisation
All FB types used 100% of the truck weight capacity for the NS scenario and 100% ofthe truck volumetric capacity for the OS scenario (Figure 4). For the TM scenario, the twoLR FB types used 100% of the volumetric capacity whereas the whole trees used 100% ofthe weight capacity.
Figure 4. Truck weight and volume utilisation for each FB/harvest system and scenario as a percent-age of maximum weight and volume capacities.
3.3. Transport Distance
The mean transport distance weighted by tonnes of chips for each FB type was101–110 km for LR conventional, 81–89 km for LR fuel-adapted and 51–53 km for wholetrees. For each FB type, the mean weighted transport distance was greatest for the NSscenario and lowest for the OS scenario.

Forests 2021, 12, 455 10 of 19
3.4. Moisture Content
Mean FB MC weighted by chip volume for the NS scenario was at the maximumvalue (48%) across all transport distances and FB types in the study. For the TM scenario,mean FB MC was at the maximum value for transport distances of 25 km and 50 kmfor the LR fuel adapted and whole trees FB types and for 25 km, 50 km and 75 km forthe LR conventional FB type (Figure 5). For all three studied FB types, the mean FB MCthen declined with increasing secondary transport distance. For the OS scenario, MC wasless than the maximum value for a transport distance of 25 km and then declined withincreasing transport distance.
Figure 5. Mean MC (%) weighted by chip volume (m3) against transport distance (km) for the (a) TMscenario, and (b) OS scenario.
The maximum secondary transport distance for each FB type across all scenarios was:LR conventional 150 km, LR fuel adapted 125 km and whole trees 75 km. This reflected themean weighted transport distances.
3.5. Storage Duration
For the OS scenario, over 70% of the FB was stored for periods ≤6 months, with theremainder being stored for various periods of time up to 14 months (LR) or 12 months

Forests 2021, 12, 455 11 of 19
(Whole trees) (Figure 6). For the TM scenario, the majority of the LR FB was stored forone month, whereas for the whole trees, the majority was transported directly to thepower plant.
Figure 6. Volume stored and storage duration of LR conventional, LR fuel-adapted and whole treesduring the 2-year planning horizon. (a) LR conventional; (b) LR fuel-adapted; (c) Whole trees.

Forests 2021, 12, 455 12 of 19
3.6. Sensitivity Analysis3.6.1. Harvest/Primary Transport Costs
In all cases, changing harvest/primary transport costs by ±10% changed deliveredcosts in proportion to the percentage of delivered costs that consisted of harvest/primarytransport costs. For example, harvest/primary transport costs were 40% of LR conven-tional delivered cost for the TM scenario. A 10% increase or decrease in LR conventionalharvest/primary transport costs increased or decreased delivered costs by 4%, respectively.Maximum delivered cost changes were ±4.7% for LR conventional in the OS scenario. Allother delivered cost changes were ±4.1% or less.
3.6.2. Storage Losses
For the TM scenario, changes in monthly storage loss values did not change thedelivered costs for any FB type. For the OS scenario, reducing storage losses to 0.1%per month reduced delivered costs between −3.9% and −2.1%, while increasing storagelosses to 2% per month increased delivered costs between 1.4% and 1.8% (Figure 7). Forall FB types, the greatest cost changes resulting from changes to storage losses were inharvest/primary transport and chipping costs.
Figure 7. Cost changes for each FB supply chain activity when monthly storage losses were changedto 0.1% or 2%. (a) LR conventional; (b) LR adaptive; (c) Whole trees.

Forests 2021, 12, 455 13 of 19
3.6.3. Moisture Content
For the two LR types, increasing MC by 5% increased delivered costs by approximately5% for the OS scenario and 4% for the TM scenario (Table 3). Decreasing MC by 5%decreased delivered costs by approximately 4% for the OS scenario and 3.5% for theTM scenario.
Table 3. Delivered cost changes for each FB type and scenario in response to increasing or decreasingMC by 5% (percentage delivered cost change shown in brackets).
Delivered Cost ($/MWh) (% Change)
Scenario FB Type 5% MC Decrease 5% MC Increase
OS LR conventional 10.81 (−4.0) 11.78 (4.7)LR fuel-adapted 8.84 (−4.3) 9.69 (5.0)
Whole trees 7.43 (−5.8) 8.39 (6.4)
TM LR conventional 12.52 (−3.3) 13.46 (3.9)LR fuel-adapted 10.38 (−3.5) 11.21 (4.2)
Whole trees 8.71 (−8.2) 9.70 (2.2)
For whole trees, increasing MC by 5% increased delivered costs by approximately 6%for the OS scenario and 2% for the TM scenario. Decreasing MC by 5% decreased deliveredcosts by approximately 6% for the OS scenario and 8% for the TM scenario.
4. Discussion
Comparisons between the study results and published delivered FB cost figures werecomplicated by the plethora of harvest, extraction, processing and transport systems andmachines used in previous studies, combined with variations in cost assumptions, transportdistances, FB properties, drying rates and length of storage. However, the delivered costsreported by Hall et al. [47] for P. radiata LR stored for six months at roadside prior tochipping and secondary transport (~AUD 7.90–9.80/MWh) and by Greene et al. [48] forwhole P. taeda trees stored for 4 or 8 weeks at roadside prior to chipping and secondarytransport (~AUD 15.10–17.20/MWh) suggested that FB delivered costs in the current studywere reasonable.
For all three scenarios, the study found that FB types in order from highest to lowestdelivered costs were LR conventional, LR fuel-adapted and whole trees. The major factorsfound to influence delivered FB costs were roadside drying and FB yield per hectare.Roadside drying reduced delivered FB costs for the TM scenario by 5% to 18% and forthe OS scenario by 22% to 30%, due largely to reductions in transport and chipping costs,resulting from a reduction in FB MC decreasing FB weight and increasing its net calorificvalue. FB MC decreased with increasing transport distance as the savings from reduced FBweight were greater. Storage costs were greatest for the OS scenario but constituted <1.5%of delivered costs.
The study considered FB MC only in terms of its effect on delivered costs. Low MC FBalso has a number of advantages for the end user as it increases boiler efficiency and reducesthe size of the storage area and unloading and infeed facilities [49], though undercoverstorage may be required to maintain the low delivered MC values. It also reduces the needfor supplemental drying prior to additional processing such as torrefaction [50] and woodpellet production [51].
Delivered costs for each FB type were strongly related to the yield of FB extractedper hectare for all scenarios, and the corresponding impact on mean transport distance,supporting the findings of Allen et al. [52] and Singh et al. [53]. Whole trees had thehighest yield of FB extracted per hectare and hence the lowest mean transport distanceand delivered costs, whereas LR conventional had the lowest FB yield per hectare andhence the highest transport distance and delivered costs. The importance of high biomassyield per hectare to lowering delivered costs suggested that overall delivered fuel costs for

Forests 2021, 12, 455 14 of 19
the hypothetical power plant could be reduced by investigating other regional biomasssources, as has been explored by a number of researchers, e.g., [54,55]. Potential additionalbiomass sources in the studied region include P. radiata plantations [56] and agriculturalby-products [57]. The disadvantage of multiple biomass sources is the increase in supplychain complexity, particularly when including highly seasonal agricultural biomass [58].Lower delivered costs resulting from increased biomass yield per hectare would increasethe potential size of a power plant, enabling economies of scale to be achieved [59]. Aregion with a lower spatial biomass density may be better suited to the use of a mobileplant to produce high-energy-density biofuels and hence reduce transport costs [60].
A high yield of FB extracted per hectare is associated with the removal of nutrientsand organic matter, which can reduce the growth of subsequent rotations [61,62]. However,there are few guidelines and little consensus concerning minimum LR retention levelsrequired to maintain tree growth rates [63]. Australian forest management guidelines referto maintenance of long-term site sustainability without specific reference to LR retention,e.g., [64]. As whole tree removal maximises site biomass extraction, it has the greatestimpact on site fertility as almost all aboveground tree biomass is removed from the site [65].The impact of retaining 60% (LR conventional) or 30% (LR fuel-adapted) of the LR on sitefertility is unknown and would depend on the nutrient status of the leaf litter and themineral soil. Leaves and needles contain the highest proportion of FB nutrients [66,67].Scandinavian studies have reported that most needles fall off coniferous LR drying on-siteor at roadside, reducing the export of nutrients contained in FB [26,68]. However, there areno equivalent Australian studies of physical losses from stored eucalypt FB.
The high delivered costs for LR conventional were related to its high cost for collectionand primary transport and the low proportion of LR extracted per hectare. LR collectionand transport was modelled in this study with unmodified log forwarders, which have beenfound to commonly transport LR load weights less than half their rated weight capacity [11].LR primary transport costs could be reduced through the use of modified forwarders toincrease forwarder bunk volumetric capacity, which can increase the utilisation of weightcapacity to 65–80% [69]. Use of asymmetric forwarder grapples may also reduce LRcollection and transport costs as they have been found to increase LR loading and unloadingspeed by over 10% compared with a conventional residue grapple [70]. However, thesensitivity analysis suggested that reducing LR conventional harvest/primary transportcosts by 10% would only reduce its delivered costs by 4.7%. In addition, forwarderproductivity gains from modifications to load capacity and grapple type were evaluatedwith coniferous LR and would need to be tested with eucalypt LR.
FB storage losses and drying rates can vary depending on a number of factors, includ-ing the size of FB components [71] and piles [72], the proportions of various components(needles/leaves, branches, bark, wood) and the storage conditions [73]. Increased monthlystorage losses increased the quantity of FB required and hence increased harvest, primarytransport and chipping costs, with decreasing storage losses having the opposite effect.However, delivered costs changes suggested that they were relatively insensitive to storagelosses within the tested range. MC changes tested had a larger effect on delivered costs,though the effect was still relatively small for the two LR types (delivered cost changesbetween −4% and 5%) and whole trees for the OS scenario (±6%). For whole trees for theTM scenario, increasing MC by 5% had little effect on delivered costs because most of thewhole trees were delivered directly to the power plant. In contrast, reducing MC by 5%reduced delivered costs by 8% as it became cost-effective to store more of the whole treesat roadside due to the greater cost reductions from increased MC losses.
While the OS scenario had the lowest delivered FB costs, it is likely to be the mostcomplex to implement operationally due to the requirement to manage roadside stocksover broad spatial and temporal ranges. This complexity suggested that an operationalmanagement system would be required to manage roadside FB storage optimally. Theadditional expense of implementing and running an FB storage management system wouldcause some forest companies utilising LR for bioenergy to forgo the additional cost reduc-

Forests 2021, 12, 455 15 of 19
tions from the OS scenario in favour of the relatively easier to manage TM storage scenario,which, for LR, was found to gain approximately 60% of the OS scenario cost reductions.Based on historical trends in the adoption of new research findings and information tech-nology, larger forest companies would be more likely to adopt optimised FB roadsidemanagement systems [74,75]. Development and implementation of an operational DSS tooptimally manage roadside FB stocks will be discussed in a subsequent paper.
The current study had several limitations: whole tree stands were assumed to notbe re-established and hence did not incur re-establishment costs; costs of replenishingnutrients lost from FB removal were not included, and plantation harvesting was scheduledto meet the power plant energy commitments. While a proportion of the annual E. globulusharvested stands in Western Australia is currently not re-established due to poor growth orland leasing arrangements, this would not be a sufficient supply of whole trees to supply apower plant over the long term. Alternative whole tree resources which would not incurre-establishment costs include: radiata pine first thinning trees [76], wilding plantationtrees [77] and mechanised fuel reduction [21].
As LR from E. globulus plantations in the study area is a by-product of pulplogproduction, it is unlikely that LR production would match power plant demand in anoperational implementation. LR storage at roadside and at the power plant (which typicallyhave twenty to thirty days’ supply of chipped FB stored onsite [78]) would provide a levelof buffering for the TM and OS scenarios. Operational implementation of the NS scenariomay need additional storage area at an intermediate depot or at the power plant to bettermatch FB supply and demand. Intermediate storage has not previously been consideredfor Australian forest biomass supply chains as the hypothesised demand for FB is relativelyconsistent over a year compared with northern hemisphere supply chains, which have alarge peak in FB demand in winter to meet heating needs [79]. As intermediate storagecan increase FB delivered costs by 10–20% [52], further studies would be required toexamine the potential need for intermediate storage and the cost implications in theAustralian context.
Further studies could consider the overall economics of the hypothetical power plantin the current study under the study conditions or with consideration of additional biomasssources. The economic case would be enhanced through simultaneous use of waste heatfrom electricity production in forced drying of stored FB to increase boiler efficiency [80] orin industrial processes (combined heat and power (CHP)) [81], which can increase powerplant efficiency by 35–40% [82], and by the increased reliability of the regional electricitysupply and delayed upgrades of transmission line capacity.
5. Conclusions
The study used a tactical linear programming tool (MCPlan) to compare the impact ofroadside drying on the delivered costs of E. globulus chips produced from LR obtained froma conventional CTL harvest system, LR obtained from a fuel-adapted harvest system andwhole trees felled and transported to roadside to supply a hypothetical 10 MWe thermalpower plant in Western Australia.
The study found that, for the tested scenarios and biomass types, FB delivered costscould be greatly reduced by roadside drying (cost reductions ≤ 30%) and by increasing FBspatial density (cost reductions ≤ 36%). Whereas the highest gains from roadside dryingwere obtained from the OS scenario, for LR, approximately 60% of the OS scenario costreductions were obtained using the simplistic strategy of storing LR at roadside for upto two months (the TM scenario). However, for whole trees, the TM scenario was a poorstrategy, only obtaining 23% of the cost reductions of the OS scenario. The complexityinvolved in managing FB under the OS scenario suggested that a management systemwould be required to implement this strategy operationally.
The substantial cost reductions obtained in the study through increasing spatial FBdensity suggested that the operators of the power plant should consider pursuing biomasssupplies from a range of potential sources from the region surrounding the power plant.
Forests 2021, 12, 455 16 of 19
For the hypothetical power plant in the study, this could include P. radiata plantations andagricultural biomass sources. Additional biomass supplies are particularly important whenwhole E. globulus trees are to be used for bioenergy, as only relatively small quantities ofwhole trees are likely to be available.
Use of forwarders modified to improve LR transport productivity may reduce FBdelivered costs, though the study findings suggested that, unless the primary transportcost savings were substantial, the impact on delivered costs would likely be small.
FB removal for bioenergy also removes potential nutrient sources for the next plan-tation rotation. Further work is required to determine guidelines for minimum retainedquantities of LR to maintain site productivity.
Author Contributions: Conceptualisation, M.S.; methodology, M.S.; software, M.A.; validation, M.A.;formal analysis, M.S.; investigation, M.S.; resources, M.S., M.A., P.T. and M.S.T.; data curation, M.S.;writing—original draft preparation, M.S.; writing—review and editing, M.S., M.S.T., P.T. and M.A.;visualisation, M.S.; supervision, P.T. and M.S.T.; project administration, P.T.; funding acquisition, P.T.All authors have read and agreed to the published version of the manuscript.
Funding: This research received no external funding.
Institutional Review Board Statement: Not applicable.
Informed Consent Statement: Not applicable.
Data Availability Statement: The data used in the study are published in this paper or are fromsources noted in the paper.
Acknowledgments: The authors would like to thank the ARC Centre for Forest Value, based at theUniversity of Tasmania, for their support.
Conflicts of Interest: The authors declare no conflict of interest.
References1. Rothe, A.; Moroni, M.; Neyland, M.; Wilnhammer, M. Current and potential use of forest biomass for energy in Tasmania. Biomass
Bioenergy 2015, 80, 162–172. [CrossRef]2. Repo, A.; Känkänen, R.; Tuovinen, J.-P.; Antikainen, R.; Tuomi, M.; Vanhala, P.; Liski, J. Forest bioenergy climate impact can be
improved by allocating forest residue removal. GCB Bioenergy 2012, 4, 202–212. [CrossRef]3. Björheden, R. Drivers behind the development of forest energy in Sweden. Biomass Bioenergy 2006, 30, 289–295. [CrossRef]4. International Renewable Energy Agency. Biomass for Power Generation; International Renewable Energy Agency: Abu Dhabi,
United Arab Emirates, 2012.5. Stucley, C.; Schuck, S.; Sims, R.; Bland, J.; Marino, B.; Borowitzka, M.; Abadi, A.; Bartle, J.; Giles, R.; Thomas, Q. Bioenergy in
Australia: Status and Opportunities; Bioenergy Australia: St Leonards, NSW, Australia, 2012.6. Department of the Environment and Energy. Australian Energy Update 2017; Commonwealth of Australia: Canberra,
Australia, 2017.7. Caputo, A.C.; Palumbo, M.; Pelagagge, P.M.; Scacchia, F. Economics of biomass energy utilization in combustion and gasification
plants: Effects of logistic variables. Biomass Bioenergy 2005, 28, 35–51. [CrossRef]8. Kühmaier, M.; Erber, G. Research trends in European forest fuel supply chains: A review of the last ten years (2007–2016)–part
two: Comminution, transport & logistics. Croat. J. For. Eng. 2018, 39, 139–152.9. Ralevic, P.; Ryans, M.; Cormier, D. Assessing forest biomass for bioenergy: Operational challenges and cost considerations.
For. Chron. 2010, 86, 43–50. [CrossRef]10. Richardson, J.; Björheden, R.; Hakkila, P.; Lowe, A.T.; Smith, C.T. (Eds.) Bioenergy from Sustainable Forestry: Guiding Principles and
Practice; Kluwer Academic Publishers: Dordrecht, The Netherlands, 2002.11. Strandgard, M.; Mitchell, R. Comparison of cost, productivity and residue yield of cut-to-length and fuel-adapted harvesting in a
Pinus radiata D.Don final harvest in Western Australia. N. Z. J. For. Sci. 2019, 49. [CrossRef]12. Adebayo, A.B.; Han, H.-S.; Johnson, L. Productivity and cost of cut-to-length and whole-tree harvesting in a mixed-conifer stand.
For. Prod. J. 2007, 57, 59.13. Ackerman, P.; Talbot, B.; Dahlin, B. Biomass Harvesting and Logistics. In Bioenergy from Wood: Sustainable Production in the Tropics;
Seifert, T., Ed.; Springer: Dordrecht, The Netherlands, 2014; pp. 109–135. [CrossRef]14. Röser, D.; Mola-Yudego, B.; Sikanen, L.; Prinz, R.; Gritten, D.; Emer, B.; Väätäinen, K.; Erkkilä, A. Natural drying treatments
during seasonal storage of wood for bioenergy in different European locations. Biomass Bioenergy 2011, 35, 4238–4247. [CrossRef]15. Erber, G.; Kanzian, C.; Stampfer, K. Modelling natural drying of European beech (Fagus sylvatica L.) logs for energy based on
meteorological data. Scand. J. For. Res. 2016, 31, 294–301. [CrossRef]

Forests 2021, 12, 455 17 of 19
16. Strandgard, M.; Turner, P.; Mirowski, L.; Acuna, M. Potential application of overseas forest biomass supply chain experience toreduce costs in emerging Australian forest biomass supply chains—A literature review. Aust. For. 2019, 1–9. [CrossRef]
17. Zamora-Cristales, R.; Sessions, J.; Marrs, G. Economic implications of grinding, transporting, and pretreating fresh versus agedforest residues for biofuel production. Can. J. For. Res. 2017, 47, 269–276. [CrossRef]
18. Lock, P.; Whittle, L. Future Opportunities for Using Forest and Sawmill Residues in Australia; ABARES: Canberra, Australia, 2018.19. Ghaffariyan, M.R.; Brown, M.; Acuna, M.; Sessions, J.; Kuehmaier, M.; Wiedemann, J. Biomass harvesting in Eucalyptus
plantations in Western Australia. South. For. 2011, 73, 149–154. [CrossRef]20. Fung, P.Y.H.; Kirschbaum, M.U.F.; Raison, R.J.; Stucley, C. The potential for bioenergy production from Australian forests, its
contribution to national greenhouse targets and recent developments in conversion processes. Biomass Bioenergy 2002, 22, 223–236.[CrossRef]
21. Ximenes, F.; Stephens, M.; Brown, M.; Law, B.; Mylek, M.; Schirmer, J.; Sullivan, A.; McGuffog, T. Mechanical fuel load reductionin Australia: A potential tool for bushfire mitigation. Aust. For. 2017, 80, 88–98. [CrossRef]
22. Taylor, J.; Warnken, M. Wood Recovery and Recycling: A Source Book for Australia; Project No: PNA017-0708; Forests and WoodProducts Australia: Melbourne, Australia, 2008; p. 45.
23. Taskhiri, M.S.; Jeswani, H.; Geldermann, J.; Azapagic, A. Optimising cascaded utilisation of wood resources considering economicand environmental aspects. Comput. Chem. Eng. 2019, 124, 302–316. [CrossRef]
24. Acuna, M.; Anttila, P.; Sikanen, L.; Prinz, R.; Asikainen, A. Predicting and controlling moisture content to optimise forest biomasslogistics. Croat. J. For. Eng. 2012, 33, 225–238.
25. Asikainen, A.; Kuitto, P.-J. Cost factors in wood fuel procurement. N. Z. J. For. Sci. 2000, 30, 79–87.26. Nilsson, B.; Nilsson, D.; Thörnqvist, T. Distributions and losses of logging residues at clear-felled areas during extraction for
bioenergy: Comparing dried- and fresh-stacked method. Forests 2015, 6, 4212–4227. [CrossRef]27. Whittaker, C.; Macalpine, W.; Yates, N.E.; Shield, I. Dry matter losses and methane emissions during wood chip storage: The
impact on full life cycle greenhouse gas savings of short rotation coppice willow for heat. BioEnergy Res. 2016, 9, 820–835.[CrossRef]
28. Striugas, N.; Vorotinskiene, L.; Paulauskas, R.; Navakas, R.; Džiugys, A.; Narbutas, L. Estimating the fuel moisture content tocontrol the reciprocating grate furnace firing wet woody biomass. Energy Convers. Manag. 2017, 149, 937–949. [CrossRef]
29. Downham, R.; Gavran, M. Australian Plantation Statistics 2020 Update; ABARES: Canberra, Australia, 2020.30. ACIL Allen Consulting. Peak Demand and Energy Forecasts; Australian Energy Market Operator: Melbourne, Australia, 2017; p. 111.31. Strandgard, M.; Béland, M. Economics of forest biomass for bioenergy: Potential site preparation savings from coarse woody
harvesting residue removal in a short-rotation Eucalyptus globulus (Labill.) plantation. Silva Balc. 2021, 22, 45–55. [CrossRef]32. Acuna, M.; Mirowski, L.; Ghaffariyan, M.R.; Brown, M. Optimising transport efficiency and costs in Australian wood chipping
operations. Biomass Bioenergy 2012, 46, 291–300. [CrossRef]33. Pottie, M.; Guimier, D. Harvesting and Transport of Logging Residuals and Residues; FERIC Special Report SR-33; Forest Engineering
Research Institute of Canada: Pointe-Claire, QC, Canada, 1986; p. 100.34. Paul, K.; Polglase, P.; Snowdon, P.; Theiveyanathan, T.; Raison, J.; Grove, T.; Rance, S. Calibration and uncertainty analysis of a
carbon accounting model to stem wood density and partitioning of biomass for Eucalyptus globulus and Pinus radiata. New For.2006, 31, 513–533. [CrossRef]
35. Núñez-Regueira, L.; Proupín-Castiñeiras, J.; Rodríguez-Añón, J.A. Energy evaluation of forest residues originated from Eucalyptusglobulus Labill in Galicia. Bioresour. Technol. 2002, 82, 5–13. [CrossRef]
36. Mateos, E.; Ormaetxea, L. Sustainable Renewable Energy by Means of Using Residual Forest Biomass. Energies 2019, 12, 13.[CrossRef]
37. Strandgard, M.; Mitchell, R.; Wiedemann, J. Comparison of Productivity, Cost and Chip Quality of Four Balanced HarvestSystems Operating in a Eucalyptus globulus Plantation in Western Australia. Croat. J. For. Eng. 2019, 40, 39–48.
38. Acuna, M.; Sessions, J.; Zamora, R.; Boston, K.; Brown, M.; Ghaffariyan, M.R. Methods to manage and optimize forest biomasssupply chains: A review. Curr. For. Rep. 2019, 5, 124–141. [CrossRef]
39. Ghaffariyan, M.R.; Acuna, M.; Brown, M. Analysing the effect of five operational factors on forest residue supply chain costs: Acase study in Western Australia. Biomass Bioenergy 2013, 59, 486–493. [CrossRef]
40. Strandgard, M.; Mitchell, R.; Acuna, M.; Ghaffariyan, M.; Brown, M. Control and Manage the Moisture Content of Logsand Biomass to Maximise Benefits along the Wood Supply Chain. Forest and Wood Products Australia (FWPA): Melbourne,Australia, 2020.
41. Acuna, M. Timber and biomass transport optimization: A review of planning issues, solution techniques and Decision SupportTools. Croat. J. For. Eng. 2017, 38, 279–290.
42. Strandgard, M.; Acuna, M.; Turner, P.; Mirowski, L. Use of modelling to compare the impact of roadside drying of Pinus radiataD.Don logs and logging residues on delivered costs using high capacity trucks in Australia. Biomass Bioenergy 2021, 147, 106000.[CrossRef]
43. Thörnqvist, T. Drying and storage of forest residues for energy production. Biomass 1985, 7, 125–134. [CrossRef]44. Filbakk, T.; Høibø, O.; Dibdiakova, J.; Nurmi, J. Modelling moisture content and dry matter loss during storage of logging
residues for energy. Scand. J. For. Res. 2011, 26, 267–277. [CrossRef]

Forests 2021, 12, 455 18 of 19
45. Pecenka, R.; Lenz, H.; Hering, T. Options for Optimizing the Drying Process and Reducing Dry Matter Losses in Whole-TreeStorage of Poplar from Short-Rotation Coppices in Germany. Forests 2020, 11, 374. [CrossRef]
46. Belbo, H.; Talbot, B. System analysis of ten supply chains for whole tree chips. Forests 2014, 5, 2084–2105. [CrossRef]47. Hall, P.; Gigler, J.K.; Sims, R.E.H. Delivery systems of forest arisings for energy production in New Zealand. Biomass Bioenergy
2001, 21, 391–399. [CrossRef]48. Greene, W.D.; Cutshall, J.B.; Dukes, C.C.; Baker, S.A. Improving Woody Biomass Feedstock Logistics by Reducing Ash and
Moisture Content. BioEnergy Res. 2014, 7, 816–823. [CrossRef]49. Sessions, J.; Tuers, K.; Boston, K.; Zamora, R.; Anderson, R. Pricing forest biomass for power generation. West. J. Appl. For. 2013,
28, 51–56. [CrossRef]50. Batidzirai, B.; van der Hilst, F.; Meerman, H.; Junginger, M.H.; Faaij, A.P. Optimization potential of biomass supply chains with
torrefaction technology. Biofuels Bioprod. Biorefin. 2014, 8, 253–282. [CrossRef]51. Lehtikangas, P. Quality properties of pelletised sawdust, logging residues and bark. Biomass Bioenergy 2001, 20, 351–360.
[CrossRef]52. Allen, J.; Browne, M.; Hunter, A.; Boyd, J.; Palmer, H. Logistics management and costs of biomass fuel supply. Int. J. Phys. Distrib.
Logis. Manag. 1998, 28, 463–477. [CrossRef]53. Singh, J.; Panesar, B.S.; Sharma, S.K. A mathematical model for transporting the biomass to biomass based power plant. Biomass
Bioenergy 2010, 34, 483–488. [CrossRef]54. Mol, R.; Jogems, M.; Van Beek, P.; Gigler, J. Simulation and optimization of the logistics of biomass fuel collection. NJAS Wagening.
J. Life Sci. 1997, 45, 217–228. [CrossRef]55. Rodriguez, L.C.; May, B.; Herr, A.; O’Connell, D. Biomass assessment and small scale biomass fired electricity generation in the
Green Triangle, Australia. Biomass Bioenergy 2011, 35, 2589–2599. [CrossRef]56. Ghaffariyan, M.R.; Spinelli, R.; Magagnotti, N.; Brown, M. Integrated harvesting for conventional log and energy wood
assortments: A case study in a pine plantation in Western Australia. South. For. 2015, 77, 249–254. [CrossRef]57. Brooksbank, K.; Lever, M.; Paterson, H.; Weybury, M. Biomass Scoping Study: Opportunities for Agriculture in Western Australia;
Department of Agriculture and Food: Perth, WA, Australian, 2014.58. Rentizelas, A.A.; Tolis, A.J.; Tatsiopoulos, I.P. Logistics issues of biomass: The storage problem and the multi-biomass supply
chain. Renew. Sustain. Energy Rev. 2009, 13, 887–894. [CrossRef]59. Gan, J. Supply of biomass, bioenergy, and carbon mitigation: Method and application. Energy Policy 2007, 35, 6003–6009.
[CrossRef]60. Berry, M.D.; Sessions, J. The economics of biomass logistics and conversion facility mobility: An Oregon case study. Appl. Eng.
Agric. 2018, 34, 57–72. [CrossRef]61. O’Connell, A.; Grove, T.; Mendham, D.; Corbeels, M.; McMurtrie, R.; Shammas, K.; Rance, S. Impacts of inter-rotation site
management on nutrient stores and fluxes and growth of eucalypt plantations in southwestern Australia. In Site Management andProductivity in Tropical Plantation Forests, Congo and China; Center for International Forestry Research: Bogor Barat, Indonesia,2004; p. 77.
62. Chen, C.R.; Xu, Z.H. Soil carbon and nitrogen pools and microbial properties in a 6-year-old slash pine plantation of subtropicalAustralia: Impacts of harvest residue management. For. Ecol. Manag. 2005, 206, 237–247. [CrossRef]
63. Abbas, D.; Current, D.; Phillips, M.; Rossman, R.; Hoganson, H.; Brooks, K.N. Guidelines for harvesting forest biomass for energy:A synthesis of environmental considerations. Biomass Bioenergy 2011, 35, 4538–4546. [CrossRef]
64. Anonymous. Code of Practice for Timber Production 2014; Department of Environment and Primary Industries: Melbourne,VIC, Australia, 2014.
65. Achat, D.L.; Fortin, M.; Landmann, G.; Ringeval, B.; Augusto, L. Forest soil carbon is threatened by intensive biomass harvesting.Sci. Rep. 2015, 5, 15991. [CrossRef] [PubMed]
66. Shammas, K.; O’Connell, A.M.; Grove, T.S.; McMurtrie, R.; Damon, P.; Rance, S.J. Contribution of decomposing harvest residuesto nutrient cycling in a second rotation Eucalyptus globulus plantation in south-western Australia. Biol. Fertil. Soils 2003,38, 228–235. [CrossRef]
67. Nilsson, D.; Nilsson, B.; Thörnqvist, T.; Bergh, J. Amount of nutrients extracted and left behind at a clear-felled area using thefresh-stacked and dried-stacked methods of logging residue extraction. Scand. J. For. Res. 2018, 33, 437–445. [CrossRef]
68. Nurmi, J. The storage of logging residue for fuel. Biomass Bioenergy 1999, 17. [CrossRef]69. Brunberg, T.; Eliasson, L. Productivity Standards for Forwarding of Logging Residues; Skogforsk: Uppsala, Sweden, 2011.70. Eliasson, L.; Nordén, B. A New Grapple with Potential to Increase Productivity; Skogforsk: Uppsala, Sweden, 2010.71. Visser, R.; Berkett, H.; Spinelli, R. Determining the effect of storage conditions on the natural drying of radiata pine logs for
energy use. N. Z. J. For. Sci. 2014, 44, 3. [CrossRef]72. Lin, Y.; Pan, F. Effect of in-woods storage of unprocessed logging residue on biomass feedstock quality. For. Prod. J. 2013,
63, 119–124. [CrossRef]73. Kofman, P.D.; Kent, T. Harvesting and Processing Forest Biomass for Energy Production in Ireland: The Forest Energy 2006 Programme;
Coford: Dublin, Ireland, 2007.74. Stanturf, J.A.; Kellison, R.C.; Broerman, F.; Jones, S.B. Innovation and forest industry: Domesticating the pine forests of the
southern United States, 1920–1999. For. Policy Econ. 2003, 5, 407–419. [CrossRef]

Forests 2021, 12, 455 19 of 19
75. Hewitt, R.; Sowlati, T.; Paradi, J.C. Information Technology Adoption in US and Canadian Forest Products Industries. For. Prod. J.2011, 61, 161–169. [CrossRef]
76. Ghaffariyan, M.R.; Sessions, J.; Brown, M. Roadside chipping in a first thinning operation for radiata pine in South Australia.Croat. J. For. Eng. 2013, 34, 91–101.
77. Calviño-Cancela, M.; van Etten, E.J.B. Invasive potential of Eucalyptus globulus and Pinus radiata into native eucalypt forests inWestern Australia. For. Ecol. Manag. 2018, 424, 246–258. [CrossRef]
78. Janze, P. Biomass Storage Pile Basics. Available online: http://www.advancedbiomass.com/2011/11/biomass-storage-pile-basics/ (accessed on 22 September 2020).
79. Fernandez-Lacruz, R.; Eriksson, A.; Bergström, D. Simulation-Based Cost Analysis of Industrial Supply of Chips from LoggingResidues and Small-Diameter Trees. Forests 2020, 11, 1. [CrossRef]
80. Roos, C.J. Biomass Drying and Dewatering for Clean Heat & Power; Northwest CHP Application Center Olympia: Washington, DC,USA, 2008.
81. Malico, I.; Pereira, R.N.; Gonçalves, A.C.; Sousa, A.M. Current status and future perspectives for energy production from solidbiomass in the European industry. Renew. Sustain. Energy Rev. 2019, 112, 960–977. [CrossRef]
82. Shabani, N.; Akhtari, S.; Sowlati, T. Value chain optimization of forest biomass for bioenergy production: A review. Renew.Sustain. Energy Rev. 2013, 23, 299–311. [CrossRef]