Estimating Risk and Excessive Risk-Taking in Colombia’s Commercial Banks
33
Desarrollo y Sociedad ISSN: 0120-3584 [email protected] Universidad de Los Andes Colombia Ramos Toro, Diego Estimating Risk and Excessive Risk-Taking in Colombia's Commercial Banks Desarrollo y Sociedad, núm. 70, 2012, pp. 187-218 Universidad de Los Andes Bogotá, Colombia Available in: http://www.redalyc.org/articulo.oa?id=169125379006 How to cite Complete issue More information about this article Journal's homepage in redalyc.org Scientific Information System Network of Scientific Journals from Latin America, the Caribbean, Spain and Portugal Non-profit academic project, developed under the open access initiative
-
Upload
independent -
Category
Documents
-
view
1 -
download
0
Transcript of Estimating Risk and Excessive Risk-Taking in Colombia’s Commercial Banks

Desarrollo y Sociedad
ISSN: 0120-3584
Universidad de Los Andes
Colombia
Ramos Toro, Diego
Estimating Risk and Excessive Risk-Taking in Colombia's Commercial Banks
Desarrollo y Sociedad, núm. 70, 2012, pp. 187-218
Universidad de Los Andes
Bogotá, Colombia
Available in: http://www.redalyc.org/articulo.oa?id=169125379006
How to cite
Complete issue
More information about this article
Journal's homepage in redalyc.org
Scientific Information System
Network of Scientific Journals from Latin America, the Caribbean, Spain and Portugal
Non-profit academic project, developed under the open access initiative

187
Estimating Risk and Excessive Risk-Taking in Colombia’s Commercial Banks
Estimando el riesgo y el exceso de riesgo tomado por los bancos comerciales colombianos
Diego Ramos Toro*
Abstract
The document estimates the risk embraced by Colombian commercial banks, and establishes a measurement of excessive risk-taking that is consistent with such estimation. The construction of the excessive-risk measurement follows the basic efficient-portfolio framework, in which the variance of an aggregate portfolio is minimized subject to an observed return. Return and risk-taking in Colombia’s banking industry appear to decrease between December 2007 and May 2011. In spite of this, the excess-risk exhibits an upward trend, and denotes an increasing suboptimality when considered as a proportion of the observed risk. Hence, a reduction in the risk embraced by Colombian banks paradoxically coincides with an increase in their instability.
Key words: Financial stability, risk attitudes, risk, excessive risk-taking, bank.
jel classification: E44, G11, G21.
* Universidad de los Andes, Bogotá, Colombia. E-mail: [email protected]. I would like to thank Marc Hofstetter, Catherine Rodriguez, and an anonymous referee for their valuable comments and suggestions. I would also like to thank Büllent Aybar and Juan Pablo Uribe for their advice and aide with methodological issues.
Este artículo fue recibido el 31 de enero de 2012; modificado el 23 de agosto de 2012 y, finalmente, aceptado el 26 de octubre de 2012.
Revista Desarrollo y Sociedad
70II semestre 2012

Estimating Risk and Excessive Risk-Taking in Colombia’s Commercial Banks 188
ResumenEl artículo estima el riesgo tomado por la banca comercial colombiana y establece una medida de toma excesiva de riesgo que es consistente con tal estimación. La construcción de la toma excesiva de riesgo sigue el modelo del portafolio eficiente, según el cual la varianza de un portafolio agregado es minimizada sujeta a un retorno observado. El retorno y el riesgo tomado por la banca colombiana exhiben una tendencia decreciente entre diciembre de 2007 y mayo de 2011. Pese a esto, la toma excesiva de riesgo exhibe una tendencia creciente y denota una creciente suboptimalidad cuando se con-sidera como proporción del riesgo observado. Por tanto, una reducción en el riesgo tomado por los bancos colombianos paradójicamente coincide con un aumento en su inestabilidad.
Palabras clave: estabilidad financiera, actitudes de riesgo, riesgo, toma exce-siva de riesgo, banco.
Casificación jel: E44, G11, G21.
Introduction
The financial stability of an economy is crucial for its performance and sus-tainability. The events of the recent financial crisis provide a clear example of the consequences that may arise from an unstable financial sector. A prime element of this stability is the performance and sustainability of the banking industry. Demirgüç-Kunt, Detragiache and Gupta (2006) demonstrate that a banking crisis is accompanied by a decline of 2-4% in the output’s growth. Furthermore, such crises may have long-term consequences on the perfor-mance of an economy. According to Abiad et al. (2009), a banking crisis may imply that an economy -in spite of recuperating its pre-crisis growth- may not rebound to its pre-crisis trend. The banking industry’s sustainability is directly related to the extent to which the banks embrace risk. Following Bustamante and Favilukis (2010), the easing of lending standards and the decline in loan denial rates were at the core of the roots of the subprime crises. Dell’Ariccia, Deniz and Laeven (2008) show that prior to the financial crisis the rates of credit repayment were lower precisely in the areas that had larger increases in number and volume of loans. This indicates that the genesis and outbreak of the recent financial crises was associated with a deterioration of financial stability, and with the worsening of banking risk-taking.

Diego Ramos Toro 189
Following the basic premise established by Markowitz (1952), there is an indis-soluble relationship between risk and return, for an agent is obliged to take on risk whenever her goal is to obtain a level of return greater than that of the risk free asset. If an industry takes on more risk than what is required in order to obtain certain return, then there is an excessive-risk taking in such indus-try. The mentioned evidence regarding banking crises points to the relevance of knowing and assessing the extent to which commercial banks embrace risk. Moreover, it is of prime importance to determine whether such industry is incurring in excessive-risk taking, and to calculate such magnitude.
This paper utilizes a measurement proposed by Podpiera and Weill (2010) in which risk-taking is measured as the variance of an aggregate portfolio of the banking industry. The construction of the excessive-risk measurement follows the basic efficient-portfolio framework, in which the variance of the mentioned portfolio is minimized subject to an observed return. The document thus intro-duces the first quantification of the excess-risk embraced by Colombian com-mercial banks. Risk-taking in Colombia’s banking industry appears to decrease between December 2007 and May 2011. In spite of this, excess-risk exhibits a clear upward trend. This implies that, although the risk embraced by banks has decreased in the near past, such tendency coincides with an increasing suboptimality of Colombian banks.
The remaining of the document is structured as follows: Section I delves into the concept of risk-taking and excessive risk-taking, and reviews the common procedures used to measure such concepts for the banking industry. Section II explains in detail the framework and methodology upon which this docu-ment will measure risk-taking and excessive risk-taking. Section III examines the database that will be used in order to obtain such estimations. Section IV presents the main results and its implications. Section V discusses potential explanations for the observed results. Section VI concludes and points to fur-ther research avenues.
I. Risk and Excessive Risk-Taking
A discussion and a definition of the concept of risk are prerequisites to an adequate assessment of the exercise that will be performed in this article. This document follows the definition given by Ackert and Deaves (2009), according

Estimating Risk and Excessive Risk-Taking in Colombia’s Commercial Banks 190
to which a risk-attitude is the predisposition of an agent to choose between alternatives with equal expected return, but different variability. A risk-neu-tral agent would be indifferent between the alternatives as long as they offer equal expected return. Analogously, a risk-averse agent would prefer a pros-pect with less variable outcomes, while a risk-seeking agent would prefer the prospect with more variable outcomes. Hence, when an agent takes a deci-sion regarding risk, she is assumed to know1 the probabilistic distribution of the outcomes to which she is exposed.
Theoretical approaches to agents’ risk attitudes in an economy have taken into consideration the different degrees of aversion towards risk. Within the neoclassical framework of economics there are two different interpretations regarding agents’ attitudes towards risk. According to the expected utility the-ory, the rationality of agents implies that they decide upon the sole criterion of maximizing their expected wealth, disregarding the variability of the prospect that they select (Von Neumann and Morgenstern, 1947). The expected utility framework thus assumes that the economies are constituted by risk-neutral agents. The second neoclassical interpretation of risk assumes that agents are risk-averse, reason for why they demand a compensation for embracing risk (Ackert and Deaves, 2009). This implies a positive relationship between risk-taking and return (Ackert and Deaves, 2009). An explanation for the risk-attitude of agents that competes with the traditional approach is Kahneman and Tversky’s prospect theory. According to such interpretation, agents do not consider outcomes in terms of wealth magnitudes –as neoclassical interpreta-tion would suggest- but rather as gains or losses. In such fashion, an agent’s risk-taking attitude is endogenous, for it depends on whether the agent con-siders herself on the domains of gains or on the domains of losses (Kahne-man and Tversky, 1979).
The concept of excess risk-taking goes hand in hand with that of risk-taking, with one further crucial assumption: the existence of an optimal level for such concept in the economy (Agur and Demertzis, 2010). This implies that if banks –on the aggregate level- embrace risk to an extent above the optimal level, the banking system as a whole could benefit from less risk-taking with-
1 Or at least to think that she knows. This establishes a stark difference with the concept of decision under uncertainty, which occurs when agents have no information about the prospects outcomes and/or probabilistic distribution (Ackert and Deaves, 2009).

Diego Ramos Toro 191
out sacrificing its levels of profitability. Although several authors recognize the existence of excess risk-taking, there is a gap in the literature in terms of explaining the determinants of such element. Furthermore, the empirical con-nection between these two elements remains unexplored. The main reason for the referred absence is the absenteeism of a comprehensive measurement of excessive risk-taking that is consistent with an estimation of risk-taking. The following section proceeds in such direction.
The body of literature that analyzes the determinants of banks’ risk-taking uses several techniques in order to estimate such element. The most frequently used is a Z-score consistent with the Basel II environment. Such score estimates a bank’s likelihood of becoming financially distressed, using several financial coefficients such as the return-on-assets, its dispersion, along with equity-to-total-assets ratio (Altman, 2002). This measurement of risk-taking is given at an observation level, shedding a coefficient for each bank. Another popular technique to assess a bank’s level of risk, particularly on a practical level, is the non-performing-loans ratio. Given that a non-performing loan is defined as the loan for which the debtor has a delay of up to 90 days in making her scheduled payments, this ratio denotes the percentage of low quality borrowers to which a bank is exposed. An alternative way of determining a bank’s expo-sure to risk could be a ratio of liquid-to-total-assets. This estimation would be consistent with the basic bank-run set-up of Diamond and Dybvig (1983), in which a bank is obliged to forego potential financial returns given its need to have liquid loans that enables it to face an early liquidation. Hence, a high liquid-to-total-assets ratio would denote a low level of risk embraced by the bank, given the danger of a costly early liquidation. The referred estimations, however, do not assess the crucial element of optimal risk. By foregoing such element, there is an impediment to evaluate excessive (suboptimal) risk, and to examine the empirical determinants of such suboptimality, along with an empirical scrutiny of the relationship between risk and financial (economi-cal) performance.
II. Measuring Risk and Excessive Risk-Taking
In order to evaluate the risk embedded in the assets of a bank and to exam-ine the optimality of such risk, Podpiera and Weill (2010) propose a method-ology in which an aggregate portfolio for the banking industry is generated.

Estimating Risk and Excessive Risk-Taking in Colombia’s Commercial Banks 192
In order to generate an aggregate portfolio the authors divide the assets into the types of loans granted by the banks in a determinate period. If the types of loans in the industry are denoted by i, then the aggregate share of the loan i in the period t is given by
i t
total value of loans i in period ttotal value of loan, =
ss in period t (1)
The Podpiera-Weil framework assumes that the actual return earned by a bank for a given loan is equivalent to the rate it charges. This assumption is prob-lematic, for the rates charged by banks deviate from actual returns earned by them. This is proved by the fact that there are loans for which the lenders receive no payment from their debtors. The fact that lenders are aware of this potential loss prior to any disbursement implies that the appropriate ex-ante returns used to calculate effective risk-taking must incorporate the portion of loans that are not repaid by borrowers. In such fashion, the measure of return that will be used henceforth is given by
R r i n t i n t i n t, , , , , ,= ( ) (2)
Where ri n t, , is the rate charged at period t for the loan i issued by bank n, and
i n t, , is a yearly-based discount given by
write offs past due loanstotal loans grantedi n t, ,
= − +
1
i n t, ,
(3)
In such discount, the write offs correspond to the total write offs acknowl-edged by the bank during the year corresponding to month t, whilst the past due loans correspond to the total value of loans during that same year that were not repaid in the stipulated period. Analogously, the total loans granted correspond to the total value of the loans granted by the bank n during the year corresponding to month t.
The reason for why the discount is set on a yearly basis is best explained by the procedure through which a bank accepts a write off. The decision to accept such loss is an accounting -rather than financial- choice, for it is when a bank decides to change an unpaid loan from an expected income to an accepted loss

Diego Ramos Toro 193
in the profit-and-loss statement. Hence, the financial decision upon which a loan is issued comes several months prior to the accounting decision to rec-ognize an unpaid loan as a write off. Setting the discount on a monthly basis would thus augment the volatility in a given month without any consistency with the risk-return choice taken within the bank for such month. Addition-ally, a monthly measure of such variable could result in erroneous rates of discount, for if several unpaid loans that were granted in different months are accepted as write-offs in the same month, equation (3) could assume a negative value. Such erratic result would imply a negative return, leading to a erroneous conclusions regarding the financial decisions taken by the bank in such period. On the contrary, calculating a yearly discount avoids adding unfair variability to the return, whilst approaching more accurately to the actual ex-ante decision through which a bank calculates the average return they will receive for the loans they grant.
The aggregate return for the loan i would be given by the simple average of the returns earned by banks for each loan category:
g
Rni t
n i n t,
, ,=∑ (4)
where n is the total number of banks in the sample. Therefore, the return of the aggregate portfolio would be given by G gt i i t i t= ∑ , ,
(5)
The risk embraced by the banking sector in period t is given by the volatility of the loans issued by the banks: t i j i t j t i j t= ∑ ∑ , , , , (6)
where j -as i - denotes the set of loan-types granted by Colombia’s com-mercial banks, and i j, is the covariance between the loan categories i and j –which in turn would equal to the variance of loan i whenever i equals j –.

Estimating Risk and Excessive Risk-Taking in Colombia’s Commercial Banks 194
A calculation of the optimal level of risk-taking is achieved by conjugating the referred elements with those proposed by Markowitz (1952) in his effi-cient-portfolio theory. Assuming that agents in the economy are risk-averse, the optimal level of risk-taking would be the minimal risk required to obtain the observed return, i.e.
min
. .,
, , , ,
i t i ji t j t i j t
ii i t
s tg G
∑ ∑
∑
= (7)
Given a solution of t* to the referred optimization problem, the excessive risk
embraced by the banking industry in period t would be given by
e t t t = − *
(8)
III. The Database
The information on Colombian banking industry can be obtained from the Superintendencia Financiera (Superfinanciera for short), Colombia’s public entity in charge of the supervision and inspection of the financial institu-tions operating in such economy. The records kept by Superfinanciera contain monthly information regarding the value of each type of loan for all the banks, along with the monthly rates charged for each type of loan. Additionally, it contains end-of-the-year information regarding the total value of loans, the past due loans, and the write offs corresponding to every year. The informa-tion is categorized according to four groups of loans: commercial, consump-tion, microcredit, and real estate. The commercial loans correspond to those granted to firms with the purpose of acquiring machinery, transporting equip-ment, computational equipment, and to firms that need liquidity for their basic working capital. The consumption loans correspond to the credit granted to individuals who pursue to acquire equipment, cars, furniture, among others. Real estate loans refer to those that were granted with the purpose of acquir-ing and/or creating housing. These types of loans are divided into those that are of prime social interest –for low income economical groups-, and those that are not. Finally, the microcredit loans correspond to those loans granted to illiquid entrepreneurs who wish to start a business or who currently own
Diego Ramos Toro 195
a small-starting business. The data is available on a monthly basis between December 2007 and May 2011, which implies a total of 42 months. Before December 2007 the needed data is given only for December of each year, starting from December 2002.
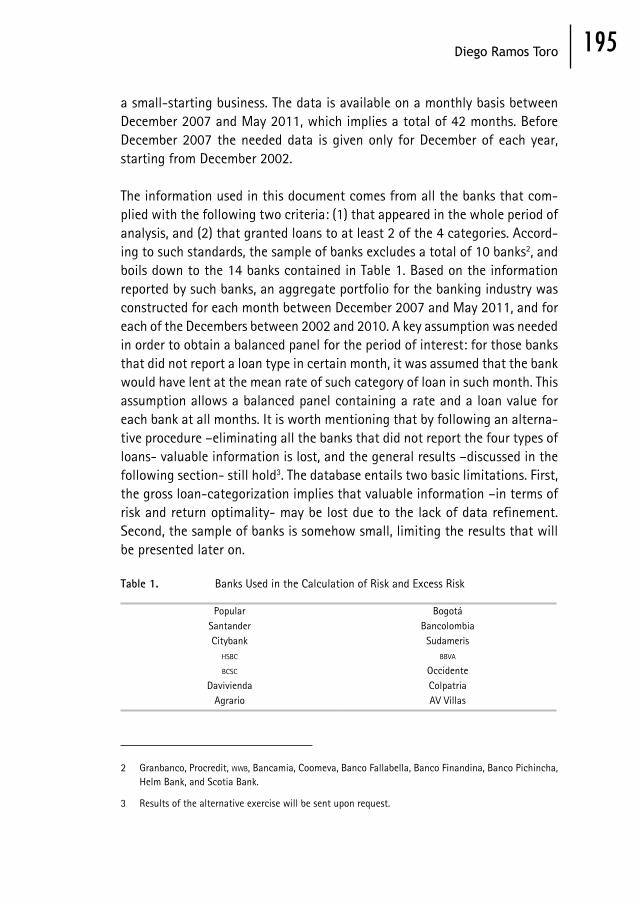
The information used in this document comes from all the banks that com-plied with the following two criteria: (1) that appeared in the whole period of analysis, and (2) that granted loans to at least 2 of the 4 categories. Accord-ing to such standards, the sample of banks excludes a total of 10 banks2, and boils down to the 14 banks contained in Table 1. Based on the information reported by such banks, an aggregate portfolio for the banking industry was constructed for each month between December 2007 and May 2011, and for each of the Decembers between 2002 and 2010. A key assumption was needed in order to obtain a balanced panel for the period of interest: for those banks that did not report a loan type in certain month, it was assumed that the bank would have lent at the mean rate of such category of loan in such month. This assumption allows a balanced panel containing a rate and a loan value for each bank at all months. It is worth mentioning that by following an alterna-tive procedure –eliminating all the banks that did not report the four types of loans- valuable information is lost, and the general results –discussed in the following section- still hold3. The database entails two basic limitations. First, the gross loan-categorization implies that valuable information –in terms of risk and return optimality- may be lost due to the lack of data refinement. Second, the sample of banks is somehow small, limiting the results that will be presented later on.
Table 1. Banks Used in the Calculation of Risk and Excess Risk
Popular BogotáSantander BancolombiaCitybank Sudameris
hsbc bbva
bcsc OccidenteDavivienda Colpatria
Agrario AV Villas
2 Granbanco, Procredit, wwb, Bancamia, Coomeva, Banco Fallabella, Banco Finandina, Banco Pichincha, Helm Bank, and Scotia Bank.
3 Results of the alternative exercise will be sent upon request.

Estimating Risk and Excessive Risk-Taking in Colombia’s Commercial Banks 196
Table 2. Summary Statistics of Loan Shares Relative to Total Loans Granted
Micro Commercial Consumption Real Estate
Min 1.8% 59.1% 27.2% 7.4%
Max 2.5% 62.5% 30.4% 9.1%
Mean 2.2% 60.7% 28.6% 8.5%
Median 2.3% 60.6% 28.4% 8.6%
Std. 0.2% 1.0% 0.8% 0.4%
Before delving into the calculations, it is worth examining the general trends contained in the information. Figure 1 illustrates the behavior of the share of each loan category throughout the analyzed period, whereas Figure 2 eluci-dates the behavior of the average return of each category.
Figure 1. Corresponding Share of each Category of Loan Relative to the Total Value of Loans Granted
When examining Figure 2 one notices that the microcredit receives the higher return throughout the period, which —following the basic Stiglitz and Weiss (1981) setup— implies that such loan entails the highest ex ante risk compensa-tion. This is true regardless of Colombian financial regulation, which stipulates a ceiling for the rates charged for microcredit loans (the ceiling is nowadays near 45.9%, which is way above the maximum rate of 30% charged in the

Diego Ramos Toro 197
period under scrutiny). Contrarily, the real estate loans are associated with the lowest return, a result that may derive from Colombian financial regula-tion which stipulates that the rates charged for such credit category must be the lowest. The earned returns for these types of loans are somehow stable, whereas the earned returns for consumption and commercial credit vary sig-nificantly throughout the analyzed period. This may be in part explained by Colombian financial regulation, which impedes the microcredit rate to rise above a certain level, and ensures that the real state rate is the lowest of the rates. As illustrated by Figure 2, there is a considerate decline in the returns earned for the commercial and credit categories of loans. These assertions are supported by the information shown in Table 3: the dispersion between the minimum and the maximum earned returns for commercial and consumption credits are well above the dispersion exhibited by microcredit and real estate. Analogously, the standard deviation of microcredit and real estate is lower than the standard deviation of consumption and commercial credit.
Figure 2. Loan Return for each Category of Loan
Although there is a notable variation in the earned returns, Figure 1 illustrates how the shares of such loans exhibit almost no variability. The majority of credit is always allocated on commercial loans, followed by a significant allo-cation on consumption loans. As shown in table 2, allocations on real estate and microcredit are much less significant, with a maximum of 9.11% and 2.5%

Estimating Risk and Excessive Risk-Taking in Colombia’s Commercial Banks 198
respectively allocated to such loans. This implies a lack of dynamism and a reduced reconfiguration of the portfolio selection with respect to the returns achieved by the assets. An estimation and analysis of the effects of such lack of dynamism may be achieved by calculating the excessive risk and subopti-mality of the aggregate portfolio of Colombian commercial banks.
Table 3. Summary Statistics of Returns Earned for each Category of Loan
Micro Commercial Consumption Real Estate
Min 21% 11% 14% 12%
Max 26% 21% 22% 15%
Mean 24% 16% 19% 13%
Median 24% 15% 19% 13%
Std. 1% 4% 3% 1%
IV. Results
Table 4 contains all the results derived from the exercise performed at a monthly basis between December 2007 and May 2011. The analysis and interpretations of these results are contained in the following subsections.
Table 4. Results
Year Month ReturnObserved
Risk
ObservedRisk (BaseDec 2007)
NonPerformingLoans Ratio
Optimal Risk
Excess Risk
Excess Risk(as a share
of Obs.Risk)
2007 Dec 0.206 0.034 100% 0.032 0.013 0.021 63
2008 Jan 0.207 0.035 103% 0.034 0.019 0.015 44
2008 Feb 0.208 0.033 99% 0.035 0.022 0.011 34
2008 Mar 0.206 0.033 99% 0.037 0.022 0.011 34
2008 Apr 0.212 0.033 100% 0.038 0.022 0.011 34
2008 May 0.208 0.033 99% 0.039 0.020 0.013 39
2008 Jun 0.206 0.034 102% 0.037 0.021 0.014 40
2008 Jul 0.207 0.034 101% 0.037 0.020 0.014 40
2008 Aug 0.208 0.034 103% 0.039 0.021 0.013 38
2008 Sept 0.207 0.032 96% 0.039 0.020 0.013 39
2008 Oct 0.199 0.032 95% 0.038 0.017 0.015 46
2008 Nov 0.209 0.033 99% 0.041 0.017 0.016 48
(Continued)

Diego Ramos Toro 199
Table 4. Results
Year Month ReturnObserved
Risk
ObservedRisk (BaseDec 2007)
NonPerformingLoans Ratio
Optimal Risk
Excess Risk
Excess Risk(as a share
of Obs.Risk)
2008 Dec 0.204 0.031 93% 0.038 0.024 0.007 22
2009 Jan 0.204 0.026 77% 0.041 0.017 0.009 33
2009 Feb 0.196 0.029 88% 0.042 0.016 0.014 47
2009 Mar 0.197 0.031 92% 0.043 0.014 0.017 55
2009 Apr 0.184 0.035 103% 0.044 0.012 0.023 65
2009 May 0.172 0.032 97% 0.044 0.011 0.021 66
2009 Jun 0.169 0.035 105% 0.043 0.012 0.023 66
2009 Jul 0.158 0.033 98% 0.043 0.010 0.023 70
2009 Aug 0.158 0.032 96% 0.045 0.009 0.023 71
2009 Sept 0.152 0.032 95% 0.043 0.009 0.023 71
2009 Oct 0.149 0.032 96% 0.043 0.008 0.024 74
2009 Nov 0.151 0.035 105% 0.043 0.008 0.027 78
2009 Dec 0.142 0.035 106% 0.039 0.009 0.027 75
2010 Jan 0.145 0.036 107% 0.041 0.008 0.028 78
2010 Feb 0.138 0.032 96% 0.042 0.007 0.025 78
2010 Mar 0.141 0.028 83% 0.043 0.007 0.021 76
2010 Apr 0.138 0.028 85% 0.042 0.006 0.022 79
2010 May 0.136 0.030 88% 0.040 0.008 0.022 74
2010 Jun 0.128 0.026 78% 0.037 0.006 0.020 76
2010 Jul 0.131 0.026 78% 0.037 0.007 0.019 73
2010 Aug 0.128 0.025 73% 0.036 0.007 0.018 72
2010 Sept 0.125 0.026 77% 0.033 0.007 0.019 71
2010 Oct 0.126 0.024 71% 0.032 0.007 0.017 70
2010 Nov 0.126 0.024 72% 0.031 0.007 0.017 71
2010 Dec 0.121 0.027 79% 0.027 0.007 0.019 72
2011 Jan 0.139 0.025 73% 0.029 0.008 0.017 68
2011 Feb 0.141 0.026 77% 0.029 0.009 0.016 64
2011 Mar 0.142 0.029 87% 0.029 0.009 0.020 67
2011 Apr 0.151 0.034 103% 0.029 0.012 0.022 65
2011 May 0.151 0.032 95% 0.027 0.013 0.019 58

Estimating Risk and Excessive Risk-Taking in Colombia’s Commercial Banks 200
A. Returns
Consistent with the tendencies exhibited in Figure 2, the aggregate return of the banking industry is characterized by its declining tendency between December 2007 and May 2011. This follows from the fact that the returns for commercial and consumption loans declined steadily. This, combined with the fact that those two categories of loans represent the majority of the aggregate portfolio, implies that the earned returns fell significantly from its 2007 levels of nearly 21% to a 15% level in May 2011, as illustrated by figure 3.
Figure 3. Return Earned by Colombia's Banking Industry
0.250
0.200
0.150
0.000
Return
Months Between December 2007 and May 2011
Dec
Jan
Feb
Mar Apr
May Jun Jul
Aug
Sept Oct
Nov
Dec
Jan
Feb
Mar Apr
May Jun Jul
Aug
Sept Oct
Nov
Dec
Jan
Feb
Mar Apr
May Jun Jul
Aug
Sept Oct
Nov
Dec
Jan
Feb
Mar Apr
May
0.100
0.050
y = -0.0024x + 0.2193R = 0.82732
B. Risk-taking
The calculation of equation (6) yields the observed risk taking for Colombia’s banking industry for each of the months of the period under scrutiny. The results are in terms of standard deviations, which represent the volatility to which the aggregate return of the industry is exposed. In other words, such number is a statistical measurement denoting how far off could the return lie from the mean return of the banking industry. If two portfolios have equal expected return, but one of these has a greater standard deviation than the other, then it holds that such return could have been potentially lower or higher, implying a greater risk of such bank’s assets. An increase (decrease) in the standard deviation thus implies an augment (decline) of the risk embraced

Diego Ramos Toro 201
by the industry. Figure 4 exhibits the risk-taking trend for the banking industry in Colombia. Such figure shows that, in spite of the sharp increase in the last months, the risk-taking is characterized by a downward trend, which implies that banks reduced the risk embraced by them in the analyzed period. One can corroborate this by observing the percent-change of risk-taking. Figure 5 shows that, with respect to the first month under scrutiny, the observed risk-taking is always smaller than that of the initial month, exhibiting a decline of nearly 30% in some of the months (such as October 2010). Again, in spite of the sharp increase in the last months, risk-taking rarely rises to its original level of December 2007, which is a clear indication of the declining trend of risk-taking in the period under scrutiny. It is important to note, however, that this general trend cannot be extrapolated to the near future, for the risk-increase observed in the last months may imply a reversal in the tendency.
Figure 4. Equation 6. Risk Taking (In Standard Deviations)
0.040
0.035
0.030
0.000
Stan
dard
Devia
tions
Months between December 2007 and May 2011
Dec
Jan
Feb
Mar Apr
May Jun Jul
Aug
Sept Oct
Nov
Dec
Jan
Feb
Mar Apr
May Jun Jul
Aug
Sept Oct
Nov
Dec
Jan
Feb
Mar Apr
May Jun Jul
Aug
Sept Oct
Nov
Dec
Jan
Feb
Mar Apr
May
0.020
0.010y = -0.0002x + 0.0346
R = 0.3422
0.025
0.015
0.005
An important exercise is to compare the measure of risk-taking performed in this document with other possible measures for the banking industry as a whole. Table 4 contains the monthly non-performing-loans ratio for the bank-ing industry, and Figure 6 depicts the tendency of such alternative measure of risk. Although the general declining tendency holds —and although the fitted values exhibit an equal decline in risk per period of month— it is clear that there is not a perfect relationship between these two measures of risk. This can be easily identified by noting that in the last months the portfolio-mea-sure of risk yields an increase in risk, while the non-performing loans ratio

Estimating Risk and Excessive Risk-Taking in Colombia’s Commercial Banks 202
yields a risk-decline. Furthermore, an observed correlation of 0.40 between the two measures of risk implies that, although they tend to move in equal directions, the two measures of risk may result in contradictory results for some particular months.
Figure 6. Non Performing Loans Ratio
Months between December 2007 and May 2011
0.040
0.035
0.030
0.000
Ratio
Dec
Jan
Feb
Mar Apr
May Jun Jul
Aug
Sept Oct
Nov
Dec
Jan
Feb
Mar Apr
May Jun Jul
Aug
Sept Oct
Nov
Dec
Jan
Feb
Mar Apr
May Jun Jul
Aug
Sept Oct
Nov
Dec
Jan
Feb
Mar Apr
May
0.020
0.010
y = -0.0002x + 0.0413R = 0.16082
0.025
0.015
0.005
0.045
0.050
Figure 5. Equation 6. Risk Taking (As a Percentage of Risk-Taking in December 2007)
Months between December 2007 and May 2011
120%
0%
Percentage
Dec
Jan
Feb
Mar Apr
May Jun Jul
Aug
Sept Oct
Nov
Dec
Jan
Feb
Mar Apr
May Jun Jul
Aug
Sept Oct
Nov
Dec
Jan
Feb
Mar Apr
May Jun Jul
Aug
Sept Oct
Nov
Dec
Jan
Feb
Mar Apr
May
60%
20%
40%
100%
80%

Diego Ramos Toro 203
C. Excessive Risk Taking
The data of excessive risk-taking comes from the calculation of equation (8) at a monthly basis. This implies that, as with risk, the measure of excess risk is given in standard deviations. An excess risk of x implies that the industry incurred in x additional standard deviations than what it needed in order to obtain the observed return. In other words, the industry could have exhibited x less levels of volatility in order to obtain the same return r in period t, if it had allocated its portfolio in an optimal manner. Figure 7 depicts the observed tendency for the excess-risk measured in standard deviations. The general con-clusion is that there is a clear upward trend, implying that Colombian banking industry increasingly embraced unnecessary risk between December of 2007 and May of 2011. However, it could be the case that the excess-risk exhibits some degree of seasonality (Figure 8 depicts a polynomial tendency of sixth degree with an R2 of 0.77). Alas, the limited dataset impedes a deeper scru-tiny into such matter, for a more extended dataset would be needed in order to assess if such series is an arma, and –should it be- of its order.
Figure 7. Equation 8. Excessive Risk-Taking in Standard Deviations
0.020
0.000
Stan
dard
Devia
tions
Months between December 2007 and May 2011
Dec
Jan
Feb
Mar Apr
May Jun Jul
Aug
Sept Oct
Nov
Dec
Jan
Feb
Mar Apr
May Jun Jul
Aug
Sept Oct
Nov
Dec
Jan
Feb
Mar Apr
May Jun Jul
Aug
Sept Oct
Nov
Dec
Jan
Feb
Mar Apr
May
0.010
y = 0.0002x + 0.0141R = 0.21552
0.015
0.005
0.025
0.030
R = 0.77012
An alternative reading of this result sheds light to other important features contained in the measure of excess-risk. Figure 8 illustrates how much of the total risk-taking does the excess-risk represent. If the excess risk corresponds

Estimating Risk and Excessive Risk-Taking in Colombia’s Commercial Banks 204
to y% of the observed risk, then it is the case that the banking industry -in optimality- could have attained the same return by reducing its risk-exposure by y%. This alternative reading of the data thus leads to a result regarding the level of suboptimality. Figure 8 shows an increasing tendency of suboptimal-ity regarding risk-taking decisions. Although this measure also exhibits some form of seasonality, the fact that a linear fit yields an increase of 0.97% per month with an R2 of 0.52 implies that in the period under scrutiny the bank-ing industry experienced a rise in the risk suboptimality. This increase could be related with the financial stability of the banking industry, for an increasing margin of suboptimality implies ineffectiveness regarding the banks’ financial allocations and decisions.
Figure 8. Equation 8. Excessive Risk Taking (As a Percentage of Observed Risk Taking)
0
Percentage
Months between December 2007 and May 2011
Dec
Jan
Feb
Mar Apr
May Jun Jul
Aug
Sept Oct
Nov
Dec
Jan
Feb
Mar Apr
May Jun Jul
Aug
Sept Oct
Nov
Dec
Jan
Feb
Mar Apr
May Jun Jul
Aug
Sept Oct
Nov
Dec
Jan
Feb
Mar Apr
May
y = 0.9655x + 38.935R = 0.51962
10
20
30
40
50
60
70
80
90
The results depicted in Figures 7 and 8 are consistent with the findings of other authors such as Morales (2011), who constructs and index of financial insta-bility for Colombian banking industry by using different financial indicators, and finds that such index increases in the period 2007-2009. The percentage increase of suboptimality responds to the fact that, although observed risk exhibits a downward trend, the ´optimal risk´ (i.e., the minimum risk required to attain the observed level of return) exhibits a faster decline. As mentioned earlier, this may derive from the fact that the shares of each category of loan remain somehow static through time, while the average return for some of these categories do vary widely. Accordingly, the lack of adjustments in the

Diego Ramos Toro 205
portfolio to assess this changing scenario may lead to an increasing subop-timality.
The analyses performed in this and the previous subsection point to a crucial result: a reduction in the observed risk-taking may have no real effect on the stability and optimality of the banking industry. It may very well be the case that a decrease in risk occurs while there is an increase in excessive risk and in its share relative to the observed risk. This result thus contradicts the general intuition portrayed in the analysis of some authors who implicitly assume a direct relation between risk-taking and financial instability; a banking system may be reducing the level of risk it takes while augmenting its instability by exhibiting an increased deviation from portfolio optimality.
D. Yearly December Results
Although an extended set of results covering several years would be desirable, the results of this document are limited by the available dataset in the Super-financiera. However, as mentioned previously, the data available at Superfi-nanciera contains the needed information for each December between 2002 and 2010. Although this is not the same as an extended dataset, it allows for comparable yearly results. The general results are contained in Table 5.
Table 5. Results for each December between 2002 and 2010
Year ReturnObserved
Risk
ObservedRisk (BaseDec 2002)
OptimalRisk
Excess-RiskExcess-Risk
(as a Share of Obs. Risk)
2002 0.181 0.040 100% 0.016 0.024 60
2003 0.182 0.041 103% 0.016 0.025 61
2004 0.191 0.044 110% 0.011 0.034 76
2005 0.175 0.036 90% 0.007 0.029 80
2006 0.157 0.024 61% 0.006 0.019 77
2007 0.206 0.034 84% 0.013 0.021 63
2008 0.204 0.031 78% 0.024 0.007 22
2009 0.142 0.035 88% 0.009 0.027 75
2010 0.121 0.027 66% 0.007 0.019 72
Figure 9 shows that the banking industry exhibits a downward trend in risk taking from 2002 to 2010, with the important exception of the years of inter-

Estimating Risk and Excessive Risk-Taking in Colombia’s Commercial Banks 206
national financial turmoil (2007-2009) which correspond to an upsurge of risk-taking. Figure 10 shows that the level of excess-risk (measured in standard deviations) experiences a decline, with the sole exception of 2009. Although the excess risk –i.e., the additional amount of risk that was taken due to assets allocations- declines, its share with respect to the observed risk tend to hold near 65% through time, with the important exception of 2008.
Figure 9. Risk Taking (in Standard Deviations) of Each December Between 2002 and 2010
0.020
0.000
Stan
dard
Devia
tions
Year
0.010
0.015
0.005
0.025
0.030
0.040
0.035
0.045
0.050
2002 2003 2004 2005 2006 2007 2008 2009 2010
Figure 10. Excessive Risk Taking (in Standard Deviations) of each December between 2002 and 2010
0.020
0.000
Stan
dard
Devia
tions
Year
0.010
0.015
0.005
0.025
0.030
0.040
0.035
2002 2003 2004 2005 2006 2007 2008 2009 2010

Diego Ramos Toro 207
V. Understanding Risk-Taking and its Relationship with Excess-Risk
Explanations of the reasons behind the degree of risk embraced by commer-cial banks have been made from different perspectives. Among the factors cited as the elements that mainly drive the risk-taking attitude in such indus-try one finds monetary policy, leverage, corporate governance and regulation, the degree of competition in the industry, and prospect theory. The following subsections explore the mechanisms through which these variables may affect risk-taking, and analyze the tendencies followed by such variables in Colom-bian financial system between December of 2007 and May of 2011.
A. Monetary Policy
There is a general consensus that a monetary easing is related to an increase in banks’ risk taking (Nicoló, Dell’ariccia, Laeven and Valencia, 2010). Particu-larly, the nowadays popular thesis that blames monetary policy for the recent financial crisis implicitly assumes that this relationship is true. This, given that it is grounded on the idea that the extended period of low interest rates gave an incentive to financial institutions to embrace more risk, in detriment of financial (and economical) sustainability (Nicoló et al. 2010). The most com-monly cited mechanisms through which monetary policy affects risk-taking is captured by the yield-search theory. Following Rajan (2005), whenever there is a prolonged period of low interest rates, banks are unable to meet their long term obligations by possessing safe assets. This, in turn, implies that banks are compelled to search for a higher yield by acquiring riskier assets, which in turn leads to a higher aggregate level of risk-taking in banking industry. Another commonly cited mechanism through which monetary policy is related to bank risk-taking is referred to as “The Greenspan (or Bernanke) put”. Accord-ing to the proponents of such increasingly popular mechanism, a low policy rate would generate the perverse expectations that central banks will always strongly react -by easing monetary policy- to adverse economic prospects (Nicoló et al., 2010). This, in turn, would incentivize a higher degree of risk-taking from banking industry.
There is ample theoretical and empirical research supporting an inverse relationship between monetary policy and risk-taking. Investigating Boliv-ian banking system, Ioannidou, Ongena and Peydro (2009) demonstrate that

Estimating Risk and Excessive Risk-Taking in Colombia’s Commercial Banks 208
lower short-term rates –prime instrument of monetary authorities- imply an increase of credit to borrowers of lower quality. Analogously, Jiménez et al. (2008) arrive at a similar conclusion by examining Spanish banking system. Dell’Ariccia, Laeven and Marquez (2010) use data from the U.S. terms of Busi-ness Lending Survey to show a negative relation between short rates and the augmentation of risky loans.
The pointed evidence contradicts the relationship between monetary policy and risk-taking that could arise via adverse selection and moral hazard. These mechanisms suggest that an increase of short term rates would lead to an increase of commercial bank’s risk-taking, given the upsurge of credit risk. This theoretical mechanism ignores the fact that commercial banks incur in credit rationing and in a tightening of lending standards when exposed to adverse selection and moral hazard. Banks thus avoid an increase of risk-taking derived from a potential augment of credit risk by limiting the credits granted, and by ensuring a higher quality of borrowers.
Colombian monetary policy between December of 2007 and May of 2011 was a period of strong response from the monetary authorities towards the international financial crisis. Particularly, a period of sustained decline in the nominal rates, combined with a lagged decline in inflation levels resulted in a sharp decrease of real interest rates. Figure 11 shows the trend followed by Colombian real interest rates in such period. It is notable how the rate follows
Figure 11. Colombian Monetary Policy (Central Bank´s Real Interest Rates)
0.040
Real
InterestRa
te
Months between December 2007 and May 2011
Dec
Jan
Feb
Mar Apr
May Jun Jul
Aug
Sept Oct
Nov
Dec
Jan
Feb
Mar Apr
May Jun Jul
Aug
Sept Oct
Nov
Dec
Jan
Feb
Mar Apr
May Jun Jul
Aug
Sept Oct
Nov
Dec
Jan
Feb
Mar Apr
May
0.010
0.030
(0.010)
0.050
0.020
-
(0.020)

Diego Ramos Toro 209
a dramatic decline during 2008, reaching its minimum level in June 2009 and stabilizing around the zero-level thereafter. Such tendency, according to the evidence about financial stability from other parts of the world, would imply an increase in the levels of risk and excess risk. If such relationship were to hold for Colombian case, then the short and medium term monetary stimuli to the economy would have come at the price of increasing financial instability.
B. Leverage
Leverage may present a dual effect on banks’ risk-taking, depending on the interaction of this and other variables. The commonly cited effect of leverage is known as risk-shifting. According to Bustamante and Favilukis (2010), when a bank’s leverage ratio increases it has greater incentives to conform a riskier portfolio given its limited liability. In such scenarios the bank’s payoff resem-bles that of a call-option, which increases in value whenever the outcomes are more volatile. Given the mentioned incentive, this implies a positive relation-ship between leverage and bank risk-taking via a riskier composition of a bank’s assets. Considering leverage in the context of an eased monetary policy, how-ever, sheds the converse result. Following Dell’Ariccia et al. (2010) and Nicoló et al (2010), a poorly capitalized (highly levered) bank experiences a decrease in the cost of its liabilities whenever an economy’s short term rates decrease4. This implies that, everything else equal, the bank’s profits will increase, gen-erating an incentive to reduce the risk embedded in its portfolio.
The debt ratio –that is, the total value of the banking system’s debt relative to the total value of the system’s assets- serves as an accurate measure of the amount of leverage embraced by an industry. Figure 12 illustrates the leverage-dynamic followed by Colombian banking industry according to such ratio.
Such figure denotes a trend of slight increase in the observed leverage between December of 2007 and May 2011. The impact of such dynamic is not clear; according to the cited discussion this tendency could imply either an increase or a decrease in financial instability.
4 This could also be seen as a determinant of a potential positive relation between bank risk-taking and an eased monetary policy, which would imply an opposing force to the mechanisms cited above.

Estimating Risk and Excessive Risk-Taking in Colombia’s Commercial Banks 210
Figure 12. Leverage. Debt Ratio Exhibited by Colombian Banking Industry
0.18
0.00
Debt
Ratio
Months between December 2007 and May 2011
Dec
Jan
Feb
Mar Apr
May Jun Jul
Aug
Sept Oct
Nov
Dec
Jan
Feb
Mar Apr
May Jun Jul
Aug
Sept Oct
Nov
Dec
Jan
Feb
Mar Apr
May Jun Jul
Aug
Sept Oct
Nov
Dec
Jan
Feb
Mar Apr
May
0.02
0.160.140.120.100.080.060.040.02
C. Market Concentration
As with leverage, there is no univocal relationship between competition and the degree of risk taking in banking industry. Following Keeley (1990), a high degree of competition in the industry is associated to higher levels of risk-taking given the erosion of the bank’s franchise value -that is, the value of the bank above and beyond its tangible assets-. Given this erosion, banks have an incentive to take on more risk in its assets in order to attain a higher level of return, thus maintaining its profitability levels. An opposing theory, however, argues that an increase of competition could lead to a decreasing degree of risk-taking whenever there are informational asymmetries at work. This, given that –everything else equal- an industry with concentrated market power can lead to higher rates charged to borrowers, which could derive in an augmentation of credit risk via moral hazard and adverse selection (Boyd and Nicoló, 2005). However, the same argument used against a positive relation-ship between monetary policy and risk-taking could serve against this mech-anism; there is no evident reason for why banks in a less competitive industry with informational asymmetries would not incur in credit rationing and in a tightening of lending standards in order to avoid taking on more risk for the higher rates that it charges.
Although the argument for an inverse relationship between market concentra-tion and risk-taking sounds less compelling than the argument supporting a

Diego Ramos Toro 211
positive relationship, there is empirical evidence supporting both views. Using a dataset of Spanish banking system and after controlling for several macro-economic conditions and bank characteristics, Jiménez and López (2007) find that there is evidence of a negative relationship between market concentration and bank risk. On the contrary Boyd, Nicoló and Jalal (2006) examine a panel of 2700 banks from 134 countries and a cross section of small banks operat-ing on only one market within the U.S to conclude, using several measures of risk-taking, that there is a positive relationship between market concentra-tion and bank risk-taking. Martínez-Miera and Repullo (2008) integrate both frameworks by asserting that there is a nonlinear relation between competi-tion and bank risk-taking, which allows competition to increase risk-taking in some domains and to decrease it in others. Both mechanisms seem thusly to be working, and the observed correlation of market power and risk taking depends on the specification of the model and the used dataset.
The level of concentration of Colombian banking industry can be captured by the Herfindahl-Hirscham index. Figure 13 shows that such concentration fol-lows no clear trend in the period under scrutiny, but rather a slight season-ality. In spite of its fluctuating nature, the fact that the index remains above 1000 and below 1800 throughout the analyzed period implies that Colom-bian banking system was moderately concentrated between 2007 and 2011 (Morales, 2011).
Figure 13. Market Concentration. The Herfindahl-Hirscham Index for Colombian Banking Industry
1080
990
Herfi
ndah
l-Hirs
chman
Inde
x
Months between December 2007 and May 2011
Dec
Jan
Feb
Mar Apr
May Jun Jul
Aug
Sept Oct
Nov
Dec
Jan
Feb
Mar Apr
May Jun Jul
Aug
Sept Oct
Nov
Dec
Jan
Feb
Mar Apr
May Jun Jul
Aug
Sept Oct
Nov
Dec
Jan
Feb
Mar Apr
May
1090
107010601050
10401030102010101000

Estimating Risk and Excessive Risk-Taking in Colombia’s Commercial Banks 212
D. Other Mechanisms: Corporate Governance and Prospect Theory
It is worth mentioning that there are two other known mechanisms that may explain the level of risk-taking and, potentially, the level of excess-risk and forewent return: Corporate governance and prospect theory. Laeven and Levine (2008) analyze the impact that corporate governance may have on bank risk-taking. Examining a database constituted of 300 banks from 48 different countries, the authors analyze the impact that ownership structure, cash-flow, capital requirements and supervisory oversight of banks have on the degree of risk-taking. They arrive at the conclusion that the confluence of large owner-ship and significant free cash-flow leads to an increase in risk-taking, whereas capital requirements and the existence of supervisory oversight seem to have an insignificant effect. This finding is consistent with the free cash-flow prob-lem pointed by the corporate finance literature, where excess cash can lead to suboptimal financial decision-making (Shefrin, 2007).
Few attempts have been made to explain the degree of bank risk-taking from a behavioral approach. Studying a sample of 894 commercial banks in the emerg-ing economies for the period 1996-2001, Godlewski (2004) intends to scruti-nize such relationship. Following the above explained Khaneman and Tversky’s framework, the author examines the effect that point-referencing –that is, the risk attitude adopted by the bank depending on whether it considers itself on the psychological domains of losses or the domain of gains- has on the degree of risk-taking in banks. Godlewski establishes several measures that could serve as benchmarks upon which the banks’ managements base their risk-taking decisions. Observing past return-on-equity (roe), return-on-assets (roa), and equity-to-total-assets rates –among others- as benchmarks, the author finds evidence that banks embrace more risk when below past-performance of the mentioned benchmarks. This way, if a bank’s roe is below prior measurements of roe, such bank is more likely to embrace more risk than it did before. Such evidence is hard to reconcile with the traditional neoclassical approach to risk-taking attitudes, and points to the importance of further research exam-ining the impact of behavioral aspects on a bank’s risk-taking. The methodol-ogy presented thus far bears an important limitation in this aspect. The fact that it assumes a risk-averse attitude for the industry implies that the possible behavioral explanations pointed by Godlewski cannot be tested.

Diego Ramos Toro 213
E. Understanding Risk and Excess-Risk
A first step towards understanding the relationship between the variables con-structed hereby would be to assess the manner in which classical variables influence risk, excess-risk, and return. The idea would be to perform a cointe-gration test to determine whether the series are stationary or not, and to mod-ify them accordingly in order to attain such stationarity. Such methodology, unfortunately, is unattainable in this document due to the few observations available in the used dataset. In spite of such limitation, Table 6 contains the results of the following regression:
x MP MC L U tt t t t t t= + + + + + + (9)
Where Xt is the variable of interest in period t –i.e. risk, return, excessive risk, and excessive risk as a share of observed risk-, MPtcorresponds to the real inter-est rate of the Central Bank, MCt is the Herfindahl-Hirschman index of mar-ket concentration, Lt is the debt-to-total-assets ratio, Ut is the unemployment rate in period t, and t is a time-variable. As mentioned in prior subsections, MPt MCt and Lt are pointed in the literature as determinants of risk-taking. On the other hand Ut serves as a proxy variable for the pace of the economic activity (which may affect the variables), and t is included as a variable that captures the tendency and that partially solves the problem derived from the fact that a cointegration test is not attainable for the analyzed dataset. If the regression were to yield a positive value of , the evidence would suggest a relationship between monetary stimulus and financial instability in Colombia. The value of would point to the mechanism that is more likely to act in the Colombian case between that proposed by Keely (1990) and that proposed by Boyd and Nicoló (2005). Finally, the parameter would also point to whether leverage increases financial instability as proposed by Bustamante and Favi-lukis (2010), or if instead it leads to an increase in stability as proposed by Dell’Ariccia et al. (2010) and Nicoló et al. (2010).
The results of the regressions are exhibited in Table 6. Such table shows that the time-tendencies followed by return and risk between December 2007 and May 2011 are significant. As expected, the rate of return has a strong posi-tive relation with both the degree of market concentration and the central bank’s real interest rate. When measured either as standard deviations or as a share of the observed risk, excess risk exhibits a strong negative relation

Estimating Risk and Excessive Risk-Taking in Colombia’s Commercial Banks 214
with monetary policy as well. This implies that the monetary ease experienced between 2008 and 2011 in Colombia could have derived in an augmentation of financial instability. Although not significant, both measures of excess risk show a negative relation with the amount of leverage in the industry, sug-gesting that the inverse mechanism between financial stability and leverage proposed by Dell’Ariccia et al. (2010) and Nicoló et al. (2010) could hold in the Colombian case. In spite of the fact that these regressions corroborate to some extent the expected mechanisms, it is important to stress their limita-tions: they show no causality –merely a relationship between the variables- and they are subject to the stationarity problem, along with some omitted variable-problems. The fact that some of the explicative variables show no level of significance could come from problems associated with the econo-metric specification, along with the fact that there is a limited dataset that impedes further econometric refinement.
Table 6. Equation 9. Regressions' Results
Variables (1) Return (2) Risk(3) Excess
Risk (In Std)(4) Excess Risk(As a Share)
Real Interest Rate 0.461* -0.0704 -0.285*** -731.7***
(0.268) (0.0755) (0.0849) (208.4)
Debt Ratio 0.230 0,00091 -0.0426 -107.9
(0.169) (0.0478) (0.0537) (132.0)
Herfindahl-HirschmanIndex
0.00038** 0.00 0.00 -0.169
(0.000157) (4.42e-05) (4.97e-05) (0.122)
t -0.00199*** -0.000271** -9.52e-05 0.221
(0.00047) (0.00013) (0.00015) (0.362)
u 0.156 -0.0111 -0.0313 -112.3
(0.176) (0.0496) (0.0557) (136.9)
Constant -0.248 0.0822* 0.102* 269.0**
(0.161) (0.0455) (0.0512) (125.6)
Observations 42 42 42 42
R-squared 0.905 0.397 0.613 0.772
Standard errors in parentheses
*** p < 0.01, ** p < 0.05, * p < 0.1

Diego Ramos Toro 215
VI. Concluding Remarks
Using a database provided by Superfinanciera and a methodology devel-oped by Podpiera and Weill (2010), the document calculates risk-taking and excessive risk-taking for Colombia’s commercial banks. Based on the portfo-lio theory developed by Markowitz (1952) and on a dataset available for each month between December 2007 and May 2011, this methodology yields an aggregate coefficient in standard deviations for both concepts. Although the measure of excess-risk allows for an interpretation of the suboptimality of the banking system, such calculation rests upon a risk-averseness assumption. The general results are: (i) risk and return have shown a general declining ten-dency (ii) excess-risk (measured in standard deviations) fluctuates over time, and that it follows an increasing tendency, and (iii) excess-risk denotes an increasing suboptimality of the banking industry when interpreted as a share of the observed risk. These findings are consistent with (i) a study performed by Standard & Poor’s and cited in Portafolio (“Indicadores de Solidez Mejo-ran en Bancos del País”, published the 27th of September, 2011), a Colombian financial Newspaper, which asserts that risk in Colombian commercial banks has declined in the near past, and (ii) the results of Morales (2011), who finds an increasing instability in Colombian banking system in the same period of time. Hence, a decrease in risk-taking does not necessarily coincide with an improvement in the financial stability of the banking system.
It is the goal of future research to construct an extended dataset that enables econometric refinement, and that allows a deeper scrutiny of the relation-ship between the variables hereby constructed and other variables. Further-more, it is important to reproduce the calculations of risk and excessive-risk taking performed in this document for other financial economies, in order to enable a cross-country study. Such studies would allow for a deeper under-standing of the concept of risk-taking and excessive-risk taking, along with their relationship.
References
ABIAT, A., BALAKRISHNAN, R., BROOKS, P. K., LEIGH, D. y TYTELL, I. (2009). 1. What’s the damage? Medium-term output dynamics after banking crises (Working Paper 09/245). imf.

Estimating Risk and Excessive Risk-Taking in Colombia’s Commercial Banks 216
ACKERT, L. F. y DEAVES, R. (2009). 2. Behavioral finance: Psychology, deci-sion-making, and markets. South-Western Cengage Learning, Mason.
AGUR, I. y DEMERTZIS, M. (2010). Monetary policy and excessive bank 3. risk taking (Working Paper 271). Ducth Central Bank.
ALTMAN, E. I. (2002). 4. Revisiting credit scoring models in a basel II Envi-ronment. Prepared for “Credit Rating: Methodologies, Rationale, and Default Risk”. Londres, Risk Books.
BOYD, J. H. y DE NICOLÓ, G. (2005). “The theory of bank risk taking and 5. competition revisited”, Journal of Finance, 60:1329-1343.
BOYD, J. H., DE NICOLÓ, G. y AL JALAL, A. (2006). Bank risk taking and 6. competition revisited: New theory and new evidence (Working Paper 06/297). imf.
BUSTAMANTE, M. C. y FAVILUKIS, J. (2010). 7. Advanced corporate finance. Londres, London School of Economics and Political Science.
DELL’ARICCIA, G., LAEVEN, L. y MARQUEZ, R. (2010). Monetary policy, 8. leverage, and bank risk taking (Working Paper 10/276). imf.
DELL’ARICCIA, G., DENIZ, I. y LAEVEN, L. (2008). Credit booms and lending 9. standards: Evidence from the subprime mortgage market (Working Paper 08/106). imf.
DEMIRGÜÇ-KUNT, A., DETRAGIACHE, E. y GUPTA, P. (2006). “Inside the 10. crisis: An empirical analysis of banking system in distress”, Journal of International Money and Finance, 25:702-718.
DIAMOND, D. W. y 11. DYBVIG, P. H. (1983). “Bank runs, deposit insurance, and liquidity”, Journal of Political Economy, 91(3):401-419.
GODLEWSKI, C. (2004). 12. Bank risk-taking in a prospect theory framework: Empirical investigation in the emerging markets’ case. Strasbourg, Université Robert Schuman -Institut d’Etudes Politiques.

Diego Ramos Toro 217
IOANNIDU, V., ONGENA, S. y PEYDRO, J. L. (2009). Monetary policy, risk- 13. taking and pricing: Evidence from a quasi-natural experiment (Working Paper 2009-31). Tilburg University-Center for Economic Research.
JIMÉNEZ, G. y LÓPEZ, J. A. (2007). Does competition impact bank risk-14. taking? (Working Paper 2007-23). Federal Reserve of San Francisco.
JIMÉNEZ, G., ONGENA, S. y PEYDRO-ALCALDE, J. L. y SAURINA, J. (2009). 15. Hazardous times for monetary policy: What do twenty-three million bank loans say about the effects of monetary policy on credit risk-taking? (Documento de Trabajo 0833). Banco de España.
KAHNEMAN, D. y TVERSKY, A. (1979). ”Prospect theory: An analysis of 16. decision under risk”, Econometrica, 47(2):263-291.
KEELEY, M. C. (1990). “Deposit insurance, risk and market power in 17. banking”, American Economic Review, 80:1183-1200.
LAEVEN, L. y LEVINE, R. (2008). Bank governance, regulation and 18. bank risk-taking (Working Paper 14113). National Bureu of Economic Research.
MARKOWITZ, H. (1952). “Portfolio selection”, 19. Journal of Finance, 7(1): 77-91.
MARTÍNEZ-MIERA, D. y REPULLO R. (2008). Does competition reduce 20. the risk of bank failure? (Working Paper 0801). Cemfi.
MORALES, M. Á. (2011). Concentración y estabilidad financiera: el 21. caso del sistema bancario colombiano (Documento CEDE 2011-43). Universidad de los Andes.
NEUMANN, J. V. y MORGENSTERN, O. (1947). 22. Theory of games and economic behavior. Princeton, Nueva Jersey, Princeton University Press.
NICOLÓ, G., DELL’ARICCIA, G., LAEVEN, L. y VALENCIA, F. (2010). Mone-23. tary policy and bank risk taking (Note 09/10). imf Staff Position.

Estimating Risk and Excessive Risk-Taking in Colombia’s Commercial Banks 218
PODPIERA, J. y WEILL, L. (2010). “Measuring excessive risk taking in 24. banking”, Czech Journal of Economics and Finance, 60(4):294-306.
RAJAN, R. (2005). Has financial development made the world riskier? 25. (Working Paper 11728). nber.
SHEFRIN, H. (2007). 26. Behavioral corporate finance: Decisions that create value. Nueva York, McGraw-Hill Irwin.
STIGLITZ, J. y WEISS, A. (1981). “Credit rationing with imperfect infor-27. mation”, American Economic Review, 71:393-410.