Deposit insurance coverage, ownership, and banks' risk-taking in emerging markets
45
Deposit Insurance Coverage, Ownership, and Banks’ Risk-Taking in Emerging Markets Apanard Angkinand Department of Economics University of Illinois at Springfield One University Plaza Drive Springfield, IL 62703 e-mail: [email protected] Clas Wihlborg Argyros School of Business and Economics Chapman University One University Drive Orange, CA 92866 and Copenhagen Business School e-mail: [email protected] April, 2008 Abstract: We ask how deposit insurance systems and ownership of banks affect the degree of market discipline on banks’ risk-taking. Market discipline is determined by the extent of explicit deposit insurance, as well as by the credibility of non-insurance of groups of depositors and other creditors. Furthermore, market discipline depends on the ownership structure of banks and the responsiveness of bank managers to market incentives. An expected U-shaped relationship between explicit deposit insurance coverage and banks’ risk-taking is influenced by country specific institutional factors, including bank ownership. We analyze specifically how government ownership, foreign ownership and shareholder rights affect the disciplinary effect of partial deposit insurance systems in a cross-section analysis of industrial and emerging market economies, as well as in emerging markets alone. The coverage that maximizes market discipline depends on country-specific characteristics of bank governance. This “risk-minimizing” deposit insurance coverage is compared to the actual coverage in a group of countries in emerging markets in Eastern Europe and Asia. JEL Classification: G21; G28; G32 Keywords: Deposit Insurance; Non-performing Loans, Market Discipline; Bank Ownership; Bank Governance
Transcript of Deposit insurance coverage, ownership, and banks' risk-taking in emerging markets

Deposit Insurance Coverage, Ownership, and Banks’ Risk-Taking
in Emerging Markets
Apanard Angkinand Department of Economics
University of Illinois at Springfield One University Plaza Drive
Springfield, IL 62703 e-mail: [email protected]
Clas Wihlborg
Argyros School of Business and Economics Chapman University One University Drive Orange, CA 92866
and Copenhagen Business School
e-mail: [email protected]
April, 2008
Abstract: We ask how deposit insurance systems and ownership of banks affect the degree of market discipline on banks’ risk-taking. Market discipline is determined by the extent of explicit deposit insurance, as well as by the credibility of non-insurance of groups of depositors and other creditors. Furthermore, market discipline depends on the ownership structure of banks and the responsiveness of bank managers to market incentives. An expected U-shaped relationship between explicit deposit insurance coverage and banks’ risk-taking is influenced by country specific institutional factors, including bank ownership. We analyze specifically how government ownership, foreign ownership and shareholder rights affect the disciplinary effect of partial deposit insurance systems in a cross-section analysis of industrial and emerging market economies, as well as in emerging markets alone. The coverage that maximizes market discipline depends on country-specific characteristics of bank governance. This “risk-minimizing” deposit insurance coverage is compared to the actual coverage in a group of countries in emerging markets in Eastern Europe and Asia.
JEL Classification: G21; G28; G32
Keywords: Deposit Insurance; Non-performing Loans, Market Discipline; Bank Ownership; Bank Governance

1
1. Introduction
Deposit insurance is generally considered an important part of the regulatory structure for the
banking system. This structure should protect the “safety and soundness” of the banking system
while providing banks with the appropriate rules and incentives to allocate credit and liquidity
efficiently. An important role of deposit insurance within the regulatory structure is to limit the
risk of bank runs by guaranteeing that depositors receive some, or all, of their deposited funds
with reasonable speed even if their banks fail and must be shut down (Diamond and Dybvig,
1983).
The flip side of the role of deposit insurance as a safeguard against bank runs, as well as a
consumer protection device, is a moral hazard problem caused by limited liability of banks’
shareholders and the reduced incentives of insured depositors to evaluate the riskiness of their
banks. This moral hazard problem implies that banks have incentives to take on risk that can be
shifted to a deposit insurance fund or to tax payers. These incentives are particularly strong if
equity capital is low. Thus, deposit insurance systems can contribute to the very problem
(systemic bank failure) they are designed to reduce.1
The substantial resources devoted to the design of a Capital Adequacy Framework by
central bankers and regulators in the Basel Committee indicate that there is a strong concern
about incentives for excessive risk-taking. Bank managers, on the other hand, tend to deny that
such incentives exist. However, the incentives need not reveal themselves as deliberate risk-
taking. Instead it is the competition among banks with the opportunity to finance their lending
activities at a near risk-free interest rate that induces them to prefer debt financing to equity
financing. Furthermore, competition for funding will not be based on banks’ risk evaluation and
risk management skills. Benink and Benston (2005) show how banks’ equity capital relative to

2
total assets has declined worldwide from a level of 20-30 percent in the 20s, close to that in non-
financial firms, to a level around four percent in the late 80s when the Basel Committee began its
work. During this period explicit and implicit guarantees of banks’ liabilities were expanding.
Additional evidence of excess risk-taking is the frequency of banking crises around the
world as documented by Caprio et al. (2005). Barth et al. (2006) argue that increased resources
devoted to regulation and supervision and increased sophistication of supervisors have done little
to reduce the incidence of banking crises. They call for increased reliance on market discipline in
the regulatory framework for banks.
In this paper we ask how deposit insurance systems and important aspects of ownership
of banks separately and interactively affect market discipline and its impact on banks’ risk-taking
incentives. We argued in Angkinand and Wihlborg (2006) that banks’ incentives to shift risk are
likely to be minimized by a deposit insurance system offering partial coverage because market
discipline is likely to be weak at high as well as low levels of deposit insurance coverage. The
weak discipline at low levels is caused by high likelihood that governments find themselves
compelled to issue blanket guarantees to creditors of distressed banks, or to bail them out. Risk-
shifting and risk-taking incentives are likely to be influenced by bank managers’ objectives
relative to shareholders’ as well. The empirical analysis in this paper focuses on the interaction
between depositor protection and aspects of bank ownership. Specifically, we ask whether the
coverage of explicit deposit insurance systems that minimizes risk-taking depends on state and
foreign ownership of banks, and on shareholder and creditor protection.
Emerging market economies are emphasized in the empirical analysis since the variety of
ownership structures is particularly great in these countries. Furthermore, banks tend to dominate
1 See, for example, Bhattacharya, et al. (1993)

3
the financial systems in most of these countries, and many of them have recently liberalized and
privatized domestic banking systems.
In Section 2 we review recent literature on the relationship between deposit insurance
coverage and banks’ risk-taking, and on the impact of ownership on banks’ behavior and
performance. Thereafter we lay out the theoretical framework for analysis of risk-taking and
deposit insurance coverage in Section 3. The impact of bank governance on risk-taking is
discussed, and the hypothesis for the empirical work is presented. Proxies for risk-taking, deposit
insurance coverage, and governance are explained in Section 4 where the empirical methodology
is also laid out. Empirical relationships between risk-taking proxies, deposit insurance coverage,
ownership and other governance factors are presented in Section 5. Implications for deposit
insurance coverage in emerging markets are drawn in Section 6. Section 7 offers a brief
summary and concluding remarks.
2. Evidence on deposit insurance, ownership, and banks’ risk-taking
Banks’ incentives to shift risk to guarantors of their creditors can be the cause of banking crises
and are likely to be relatively strong in countries with extensive protection of depositors and
other creditors. This protection can be explicit or implicit. Stronger risk-taking incentives
increase the burden on regulation and supervision to control and monitor banks’ risk-taking in
order to reduce the likelihood of banking crises.
One solution to the moral hazard problem caused by creditor protection would be to design
a deposit insurance premium structure reflecting banks’ risk-taking. A private deposit insurance
market is likely to fail for reasons of both moral hazard and adverse selection, however.
Furthermore, the existence of government insurance, whether explicit or implicit, limits the
scope for private insurance. In some countries banks pay “risk-based” deposit insurance premia,
but the premium structure is generally based on very crude proxies for risk.

4
A number of empirical studies using different proxies for risk-taking address the question
of whether the existence and coverage of explicit deposit insurance schemes reduce market
discipline and encourage banks to take excessive risks. Most studies focus on explicit coverage
but in some studies implicit insurance is captured by proxies for institutional characteristics.
In cross country analyses Hutchison and McDill (1999), Demirgüç-Kunt and Detragiache
(2002), and Barth et al. (2004) find that explicit deposit insurance increases moral hazard
incentives and results in increasing financial fragility and, as a result, in increasing likelihood of
banking crises. Demirgüç-Kunt and Detragiache construct a variable that captures different
degrees of deposit insurance coverage. They find that greater coverage significantly increases the
likelihood of crises but this effect is reduced significantly in countries with high levels of
supervisory and legal system quality.2 Barth et al. (2004) support this view with respect to rule of
law but not with respect to prudential regulation and supervision.3
Eichengreen and Arteta (2002), Hoggarth et al. (2005), and Angkinand et al. (2007) find
that the relationship between banking crisis and deposit insurance coverage is sensitive to model
specification. Eichengreen and Arteta find that explicit deposit insurance schemes reduce the
likelihood of banking crises in developing countries. Hoggarth et al. using a smaller sample and
shorter period do not find a significant relationship between an explicit deposit insurance dummy
and the probability of crises. However, when distinguishing between limited and unlimited
deposit insurance coverage, they find that systems with limited coverage are strongly associated
with a smaller probability of crises. Angkinand et al. (2007) find that the impact of explicit
deposit insurance is sensitive to different definitions and proxies of banking crises.
2 Demirgüç-Kunt and Detragiache (2002) also construct a variable called the moral hazard index, which is found to increase the probability of banking crises. This index is built from the first principal component of deposit insurance features for no-coinsurance, foreign currency deposits covered, interbank deposits covered, type of funding, source of funding, management, membership and the level of explicit coverage. 3 Barth et al. employ a new database on bank regulation and supervision described in Barth et al. (2004, 2006).

5
The influence of deposit insurance on banks’ risk-taking incentives has also been
analyzed on the bank level. Gropp and Vesala (2004) and Nier and Baumann (2006) use
provisions for non-performing loans and the standard deviation of equity returns as proxies for
banks’ risk exposure. The former study presents evidence that implicit protection of banks’
creditors is relatively high in countries with low explicit protection and that high explicit
coverage is associated with relatively low risk-taking in European banks. Nier and Baumann
analyze the impact of market discipline by considering both explicit and implicit aspects of
depositor protection. They analyze banks’ risk taking as a function of bank capital, market
discipline variables, transparency measures, and a number of country and bank specific control
variables. Market discipline is measured by the extent of depositor protection on the country
level, the amount of uninsured funding, and the extent of government support on the bank level.
Their results indicate that lack of explicit deposit insurance and high amounts of uninsured
deposits are likely to reduce risk-taking through the impact on equity capital while the likelihood
of government support reduces market discipline both directly and through the effect on desired
capital.
Hovakimian et al. (2003) uses the put-option characteristics of a deposit insurance system
to estimate a “fair insurance premium” in a number of countries. They analyze the extent to
which this implicit measure of incentives for risk-shifting to deposit insurance funds and tax
payers depends on characteristics of the deposit insurance system and institutional characteristics
of each country. The “fair insurance premium” is estimated for individual banks as well as for
banking systems in a number of countries. Explicit coverage, as well as other characteristics of
deposit insurance systems, seems to contribute to the “fair insurance premium”.
The evidence with respect to implicit protection of banks’ creditors indicates that
institutional characteristics affect the credibility of deposit insurance systems. In this paper we

6
are particularly interested in institutions that influence bank managers’ and shareholders’
incentives in response to implicit and explicit depositor protection. Thereby, we enter the area of
corporate governance in the banking.
Bank governance refers to the (implicit and explicit) contractual relationships influencing
the incentives of bank managers. In the corporate governance literature it is usually assumed that
managers in a “good” governance system maximize shareholders’ wealth while the incentives to
serve the interests of other stakeholders are provided by market forces, law, and regulation.
Empirical evidence in Saunders et al. (1990) indicates that banks, wherein managers have large
stakes (i.e. own stocks), are more willing to take risk.
Several studies have found that state ownership of banks lead to inefficiency and poor
performance (e.g. La Porta et al., 2002). One reason is that management in these state-owned
banks sometimes comes under pressure to serve particular political interests. In cross country
analyses, Caprio and Martinez-Peria (2000) find evidence that a greater extent of state ownership
of banks is associated with a higher likelihood of banking crises in developing countries during
the period 1980-1995. Barth et al. (2004) find that state-owned banks increase the ratio of non-
performing loans to total loans, but do not find a significant impact of state ownership on
banking crises, bank development and performance as measured by net interest margins and
overhead costs. Using bank level data, Berger et al. (2005) and Iannotta et al. (2007) find that
state-ownership of banks is associated with relatively high risk taking as measured by the ratio of
non-performing loans to total loans, the standard deviation of bank’s asset returns, and Z-scores.
The large share of foreign ownership of the banking sectors in many emerging market
economies in Eastern Europe and Latin America has stimulated research on the effects of foreign
ownership on banking operations there. Many studies using cross-country data compare the
performance of foreign banks with domestic banks and find that foreign banks operating in

7
developing nations are more efficient and competitive than domestic banks (e.g. Claessens et al.
2001). According to Lensink and Hermes (2004) the entry of foreign banks improves the
performance of domestic banks although costs increase as well. Lensink and Naaborg,
(forthcoming) focus on the transition economies and the expanding foreign ownership of banks,
while Crystal et al. (2001) study Latin American experiences. The results indicate that foreign
banks grow faster than domestic banks, and that they have greater loss absorption capacity. For
the effect of foreign ownership on banks’ risk taking, Demirgüç-Kunt et al. (1998) find that the
presence of foreign banks is associated with lower financial fragility. On the other hand, Barth et
al. (2004) find that the degree of foreign ownership could not explain the likelihood of banking
crisis but restrictions on foreign bank entry and ownership are significantly associated with a
higher likelihood.
These studies of foreign ownership of banks support the argument that foreign banks
bring benefits to the domestic banking sector by bringing in technology and expertise in risk
management. They also increase competition, thereby forcing domestic banks to increase
efficiency. It has also been argued, however, that the intensified competition could induce weak
domestic banks to take more risks. For instance, Leye Yeyati and Micco (2007) find that foreign
banks are associated with higher risks, measured by the Z-score, than domestic banks in a sample
of Latin American banks.
Barth et al. (2006) and Caprio et al. (2007) analyze whether the quality of bank
governance across countries is influenced by rules with respect to shareholder rights and
disclosure. They use the market to book values of banks as a proxy for quality of governance.
The results show that greater transparency and stronger minority shareholder rights are
associated with higher market values but also that concentration of ownership substitutes for
shareholder protection. Tadesse (2005), Fernandez and Gonzalez (2005), and Nier and Baumann

8
(2006) find that greater disclosure and transparency strengthen market discipline and reduce risk-
taking of banks.
3. Credibility of non-insurance, bank governance and market discipline in banking
Both policy makers and banks’ creditors recognize that the latter are implicitly guaranteed to
some extent. The absence of explicit guarantees leads to strong expectations that in times of
banking distress or crises, governments and regulators will respond by issuing blanket guarantees
to all uninsured creditors and depositors of banks or by bailing them out in other ways. Thus, the
non-insurance of depositors and other creditors is not credible.
There are several reasons why an absence of guarantees of all creditors is not credible in
banking. First, a banking crisis tends to occur without much warning and, as a result, policy
makers must react very quickly to stave off threats to the financial system. Second, an important
function of the banking system is to supply liquidity, and lack of trust in the banking system can
rapidly become very costly. Central banks can provide liquidity assistance to banks in distress,
but the difficulty of distinguishing between liquidity- and insolvency crises in combination with
the fear of contagion tends to compel governments to issue blanket guarantees of all creditors or
to bail-out banks through, for example, rapid recapitalization. Third, banks are opaque with the
implication that one bank’s distress can lead to runs on healthy banks. Fourth, the failure of one
bank can have systemic implications through interbank clearing and settlement systems.
Many countries have introduced partial deposit guarantee schemes in order to reduce the
risk of runs of such magnitude that solvent banks must be closed while retaining an element of
market discipline. What is an appropriate level of deposit insurance coverage? As indicated by
the studies reviewed, the answer depends on a number of institutional factors that influence the
credibility of non-insurance.

9
Our hypotheses are based on the proposition that the degree of implicit protection of
banksä creditors depends on the level of explicit deposit insurance coverage. The credibility of
non-insurance falls as explicit coverage declines and, therefore, there is a level of partial
depositor protection that minimizes risk-shifting incentives (Angkinand and Wihlborg, 2006). In
this paper, we also argue that the risk-minimizing deposit insurance coverage level is affected by
governance characteristics of the banking system.
Figure 1 describes the relationship between explicit deposit insurance coverage (EC) on
the horizontal axis and risk-taking (RT) in the banking system on the vertical axis. We interpret
risk-taking (RT) as the probability of a bank’s capital buffer being exhausted within a certain
timeframe. If risk-taking depends on the degree of protection of depositors, market discipline is
insufficient to prevent bank managers from shifting risk to a deposit insurance fund or the tax
payers. In other words, market discipline imposed by banks’ creditors declines, and moral hazard
incentives become stronger along the vertical axis.
We distinguish between excessive risk-taking caused by explicit deposit insurance
(RTExpl) and excessive risk-taking caused by lack of credibility of non-insurance (RTImpl). In
Figure 1, the expectation that ExplRT / EC 0δ δ > is described by the upward sloping line denoted
“Explicit”. It shows that market discipline declines and risk-taking (RT) increases as explicit
insurance coverage (EC) expands at a constant degree of credibility of non-insurance. Other
characteristics of the deposit insurance system and other factors affecting incentives to take risk
are also held constant along the line. These factors include institutional and macroeconomic
factors.
Lack of credibility of non-insurance of creditors implies a degree of implicit insurance
described by the line denoted “Implicit”. The line shows how risk-taking incentives caused by

10
implicit insurance decline with increasing explicit coverage as a result of increased credibility of
non-insurance ( ImplRT / EC 0δ δ < ).
The total effect on risk-taking of explicit insurance coverage (EC) is described by the
vertical summation of the curves “Explicit” and “Implicit” in Figure 1. The total effect on risk-
taking is shown as a U-shaped curve. This relationship indicates that risk-taking is minimized at
a positive and partial insurance coverage level where market discipline is at its strongest.
The U-shaped curve in Figure 1 is not a mathematical necessity. Intuitively, along the
line “Explicit”, there are “diminishing returns” in terms of market discipline effects on risk-
taking when explicit coverage is reduced from full coverage. Similarly, there are diminishing
returns in terms of market discipline effects on risk-taking when implicit coverage is reduced as
we go to the right in the figure. Thus, a relatively small group of (credibly) uninsured creditors
can contribute substantially to market discipline.
[Insert Figure 1 here]
The hypothesis that there is a U-shaped relationship between explicit coverage and risk-
taking is, as noted, not general since institutional characteristics of countries could affect the
shape of the relationships. Assume for example, that the explicit deposit insurance system has
low credibility. If so, the line “Explicit” becomes flatter. Furthermore, the implicit protection
would depend less strongly on the explicit coverage. Therefore, the line “Implicit” would
become flatter as well. The sum of the two lines may be flat, upward sloping or downward
sloping depending on the position and shape of the relationships. The credibility of the explicit
system is, therefore, an important assumption. In countries with particularly weak political and
legal institutions, this credibility cannot be taken for granted.
If institutional characteristics of a country contribute to credibility of non-insurance the
line “Implicit” would shift down and flatten out. Such a shift is shown in Figure 1 by the line

11
“Implicit × Institution”. In Angkinand and Wihlborg (2006) the hypothesis that credibility of
non-insurance is enhanced by Powers and Procedures for Prompt Corrective Action, Rule of
Law, (Lack of) Corruption, and Powers of Supervisors was tested. The results indicated that
credibility of non-insurance can be enhanced by these institutional factors but the effects seemed
to be weak.
Risk taking and bank governance.
We turn now to bank governance. The question asked is how the quality of governance in
banks affects the relationship between explicit deposit insurance coverage (EC) and risk-taking
(RT). By high quality of governance we mean that the weight of shareholder’s wealth
maximization in the objective of a bank’s management is high.
In an efficient corporate governance system, shareholder’s wealth maximization will also
lead to the maximization of creditors’ stake in a firm through the market discipline exerted by
creditors. However, in the case of banks this market discipline is weak at very low or high levels
of explicit deposit insurance coverage as described in Figure 1. Therefore, the conflict of interest
between shareholders and creditors caused by limited liability can manifest itself as incentives
for risk-shifting and excessive risk-taking at these low and high levels of coverage. These
incentives are particularly strong if equity capital is low. The excess risk-taking implies a wealth
transfer from creditors (or insurers of creditors) to shareholders.
The conflict of interest between shareholders and creditors of banks and the problem of
excessive risk-taking depend on the governance structure of banks. High quality of bank
governance implies that shareholders’ objectives have a large weight in managers’ incentives.
Managers’ interest, on the other hand, can be assumed to be more oriented towards their own
reputation and job security. It is safe to assume that there is a degree of stigma to being the
manager of a failed bank. Therefore, managers can be expected to be less willing to take risk if
12
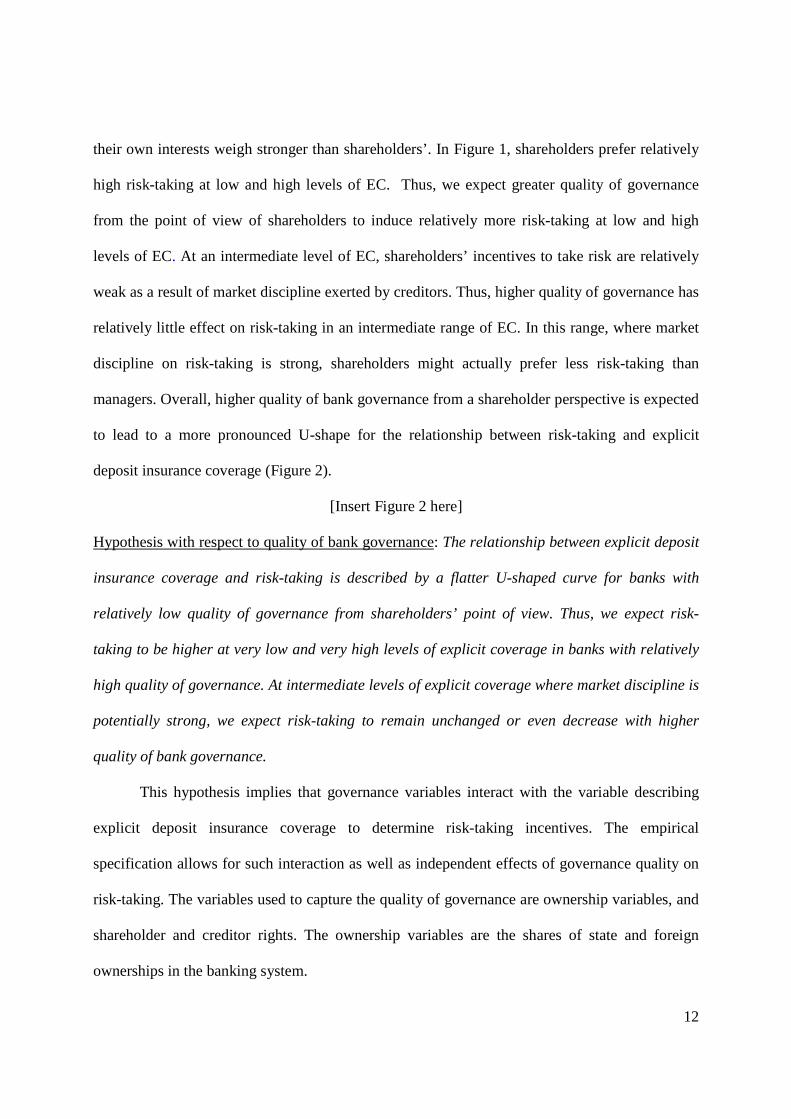
their own interests weigh stronger than shareholders’. In Figure 1, shareholders prefer relatively
high risk-taking at low and high levels of EC. Thus, we expect greater quality of governance
from the point of view of shareholders to induce relatively more risk-taking at low and high
levels of EC. At an intermediate level of EC, shareholders’ incentives to take risk are relatively
weak as a result of market discipline exerted by creditors. Thus, higher quality of governance has
relatively little effect on risk-taking in an intermediate range of EC. In this range, where market
discipline on risk-taking is strong, shareholders might actually prefer less risk-taking than
managers. Overall, higher quality of bank governance from a shareholder perspective is expected
to lead to a more pronounced U-shape for the relationship between risk-taking and explicit
deposit insurance coverage (Figure 2).
[Insert Figure 2 here]
Hypothesis with respect to quality of bank governance: The relationship between explicit deposit
insurance coverage and risk-taking is described by a flatter U-shaped curve for banks with
relatively low quality of governance from shareholders’ point of view. Thus, we expect risk-
taking to be higher at very low and very high levels of explicit coverage in banks with relatively
high quality of governance. At intermediate levels of explicit coverage where market discipline is
potentially strong, we expect risk-taking to remain unchanged or even decrease with higher
quality of bank governance.
This hypothesis implies that governance variables interact with the variable describing
explicit deposit insurance coverage to determine risk-taking incentives. The empirical
specification allows for such interaction as well as independent effects of governance quality on
risk-taking. The variables used to capture the quality of governance are ownership variables, and
shareholder and creditor rights. The ownership variables are the shares of state and foreign
ownerships in the banking system.

13
We expect that the U-shaped relationship will be more pronounced for countries with
relatively low shares of state-owned banks, high shares of foreign owned banks, strong
shareholder rights and strong creditor rights. These governance characteristics are expected to be
reflected in higher quality of bank governance. In state-owned banks, bureaucrat managers are
likely to have incentives that are not aligned with shareholders’ wealth maximization. Managers’
goals and credit allocation policies might be dictated by political objectives making them less
sensitive to market signals.
Foreign-owned banks are expected to have superior information and risk management
technologies, as well as greater transparency in emerging market economies. Therefore, market
discipline is expected to be relatively effective for foreign-owned banks. Foreign ownership is
expected to affect the governance of banks in emerging markets and developing countries in
particular.
Legally imposed and enforced shareholder rights are expected to improve the governance
structures of banks from a shareholder perspective. For creditor rights we do not expect an
obvious relation with quality of governance. However, creditor rights lower the costs of
enforcing loan contracts. Therefore, we expect strong creditor rights to reduce the risk banks are
exposed to at any level of deposit insurance coverage.
Ownership can affect risk-taking through other channels than quality of governance. In
particular, state ownership is expected to be associated with a relatively high level of implicit
protection, regardless of existing explicit coverage. If so, the Implicit curve in Figure 1 becomes
flatter with increasing state ownership and the risk-minimizing explicit coverage becomes
higher.
The impact of foreign ownership on risk-taking, on the other hand, would depend on
governance characteristics in the home country as well as in the host country. Although we

14
expect that an acquiring bank has superior governance relative to a target bank, foreign
acquisitions can be associated with a variety of expansion strategies. For this reason, foreign
ownership can affect risk-taking in other ways than improvement of governance. We return to
this issue when results are discussed in Section 5.
4. Variable definitions and model specification
We examine the impact of explicit deposit insurance coverage and banks’ governance
structures on banks’ risk-taking in a cross-section time-series, as well as cross-section analysis
using country-level data. One advantage of country level data is that we can get better
information about non-performing loans through the IMF’s Financial Stability Reports relative to
data available on the bank level. The IMF data reflects information the IMF has gathered in
addition to the data published by banks themselves.
The number of countries in our sample is limited by the availability of data on banking
systems from the IMF’s Financial Stability reports and by data on shareholder rights in
particular. Starting out with data for more than 100 countries, of which 41 are emerging markets,
the sample is reduced to 52 countries: 14 industrial, 32 emerging market, and 6 developing
countries. We test the hypothesis described above for two groups of countries. One consists of all
countries in our data set, and the other group is emerging market countries alone. The list of
emerging market economies in the sample is shown in Table 1.
We use three proxies for risk-taking: the ratio of non-performing loans relative to capital
in the banking system (NPL/CAP), the standard deviation of non-performing loans relative to the
average level of capital (STDNPL/CAP), and a Z-score as a proxy for “distance to default”.
There is no specific proxy for excessive risk-taking. Evidence of excess risk-taking caused by
weak market discipline is that risk-taking depends on the deposit insurance coverage and
possibly other variables affecting implicit protection of banks’ creditors.

15
Much of the literature reviewed above used an occurrence of banking crisis as evidence
of high risk-taking. One reason not to use this proxy to test the specific hypotheses here is that a
banking crisis in a country with low explicit coverage could be the result of bank runs rather than
low credibility of non-insurance. Furthermore, this proxy requires data for a long time period
while our data for governance characteristics cover relatively few years.
There are pros and cons with each of the proxies for risk-taking employed here. If we
perceive risk-taking as choosing a certain probability of default (distance to default), the Z-score
is conceptually an appropriate proxy.4 It incorporates a measure of asset side risk, as well as the
equity capital buffer. However, since we use accounting data to construct Z-scores the return on
assets and the equity ratio incorporates only provisions for credit losses as opposed to full losses.
Non-performing loans, on the other hand, is a proxy for total credit losses, and changes in this
variable tend to dominate as the direct cause of banking crises. Another drawback of the Z-score
is that it includes the return or loss on all activities of a financial firm while non-performing
loans specifically refer to traditional banking activities. These activities are presumably those
that enjoy the benefits of deposit insurance.5
Choosing a certain level of expected non-performing loans relative to capital can be seen
to be the most important part of choosing a probability of default. However, the probability of
default associated with a certain level of expected non-performing loans depends on their
standard deviation as well. We do not have a risk-measure that includes both the expected level
of non-performing loans and their standard deviation. Therefore, we use both non-performing
4 The Z-score is defined as (the Average Return on Assets (ROA)/standard deviation of ROA) + (the Equity to Assets ratio/standard deviation of ROA). We calculate Z-scores using annual data for from the IMF’s Financial Stability Reports. See Boyd and Graham (1988) and Goyeau and Tarazi (1992). Since the Z-score requires several years of data to construct one observation, we cannot obtain a time series of this variable for each country. 5 We do not use a “fair insurance premium” suggested by Hovakimian et al (2003) for several reasons. Its validity in cross-country analysis depends on strong assumptions with respect to the allocation of losses and bankruptcy costs for distressed bank.

16
loans relative to capital (NPL/CAP) and their standard deviation relative to capital
(STDNPL/CAP) as separate dependent variables reflecting the two aspects of risk-taking.
The ratio of non-performing loans to total loans (NPL), the ratio of equity capital to total
assets (CAP/TA), and the return on assets (ROA) are obtained from the IMF’s Financial Stability
reports wherein the IMF has published these banking data on the country level since 1997.6
Since the IMF data for non-performing loans are measured relative to total loans, while equity is
measured relative to capital, we have to measure NPL/CAP as the ratio of non-performing loans
relative to total loans divided by the ratio of capital to total assets. The standard deviations of
NPL and ROA (to estimate the Z-score) are calculated using the annual data for the whole
sample period. Therefore, regressions with STDNPL/CAP and Z-score as dependent variables
can only be estimated in cross-section. Regressions with NPL/CAP as proxy for risk-taking are
estimated in cross-section, as well as in a cross-section time-series model.
To analyze the impact of deposit insurance coverage and governance variables on proxies
for risk taking, we control for a number of macroeconomic variables that may contribute to risk
taking and thereby to loan losses. The model specification is as follows in cross-section while
time subscripts are added in the cross-section time-series model:7
θ2 2i 1 i 2 i j j,i j i j,i k k,i iRisk = α+β EC +β (EC ) +γ Governance +δ (EC ×Governance )+ Macro +ε
Risk stands for one of the three proxies for risk-taking. EC is the explicit deposit
insurance coverage, which is entered in the quadratic functional form. Our hypothesis of a U-
shaped relationship between risk-taking and the degree of explicit protection is supported if the
estimated coefficient for the squared term (β2) is positive and significant, and if the estimated
6 The NPL data and bank capital data in the IMF’s Financial Stability reports are based on “National authorities and IMF staff estimates”. 7 The empirical formulation for the cross-section time-series model is similar to the formulations in, for example, Demirguc-Kunt and Detragiache (2002) and Barth et al (2004). To test for our specific hypotheses we have added

17
coefficient for the linear term (β1) is negative and significant. Governancej stands for the
different proxies for ownership and the quality of bank governance, which are obtained from
various sources (discussed below). Governance also includes a measure of general institutional
quality and the banking system’s capital ratio (CAP/TA) of each country. In order to test the
hypotheses discussed above, governance variables are allowed to interact with the coverage of
explicit deposit insurance variable. Macrok refers to a set of economic control variables,
including the real GDP growth rate, the ratio of money supply to international reserves, the
inflation rate, and the real interest rate.8
The cross-section regression is estimated using the Ordinary Least Squares (OLS), while
the random effects model is used in the cross-section time-series regression.9 Several country
variables have little time variation; therefore, country fixed effects cannot be identified. We also
use the robust and clustering standard errors to correct for the covariance matrix for estimates of
heteroskedasticity and allow any type of correlation among the observations across time within
each country.
In the cross-section time-series model, the proxy for EC as well as all independent
variables are lagged one period in order to reduce a potential simultaneity problem caused by
political decisions to adopt explicit deposit insurance schemes or to alter the coverage limits in
response to credit losses. In the cross-section regressions, each independent variable with the
exception of the capital ratio (CAP/TA) is an average value for the whole sample period. There
is some variation across countries in the number of years included in the sample as a result of
differences in availability. CAP/TA in cross-section regressions is represented by its initial value
the quadratic term for deposit insurance coverage and the interaction between this quadratic term and governance variables. 8 These are a standard set of control variables used in the reviewed literature. By using the same variables, our results become comparable to those in the literature where the quadratic relationship is not considered. 9 The Haussman test suggests the use of the random effects over fixed effects models.

18
for the sample period. Thereby, the possibility that CAP/TA depends on risk-taking rather than
vice versa is minimized.
We turn next to a description of variables for explicit deposit insurance coverage (EC)
and governance variables. Data for these variables for emerging markets in Central & Eastern
Europe and Asia are presented in Table 1.
[Insert Table 1 here]
Deposit insurance data are taken from the Database of Deposit Insurance around the
World published by Demirgüç-Kunt et al. (2005), at the World Bank. In Table 1, “coverage
limit” is the maximum coverage per deposit account within each deposit insurance system. The
ratio between this coverage limit and the average deposit size per capita is denoted covdep. The
natural logarithm of (1+covdep) denoted lncovdep, represents our proxy for EC.10 The ln form is
used because there is relatively small number of countries with very high covdep ratios. The
countries with full deposit insurance coverage are given the value 4 for lncovdep.11
Turning to governance variables, we use the real GDP per capita to capture a country’s
general institutional quality. This variable is highly correlated with other country specific
institutional quality variables like the Rule of Law, and (lack of) Corruption. As noted in La
Porta et al. (1998, 2002), poorer countries generally have weaker governance structures. An
advantage of GDP/capita is that there is data for all countries in our sample.
One group of governance variables refers to ownership of banks. State- and Foreign
Ownerships are defined as the share of bank assets held by banks owned more than 50 percent by
10 Angkinand and Wihlborg (2006) used four different specifications of EC. Results were not sensitive to the choice of specification. 11 Other characteristics of deposit insurance system than the coverage are disregarded. Such characteristics could contribute to the level of risk-taking but, since our main concern is with the interaction between deposit insurance coverage and governance variables, they are not included.

19
governments or foreign banks. The ownership data comes from the World Bank Database of
Bank Regulation and Supervision (See Barth et al., 2004 and 2006).
Another group of governance variables includes proxies for stakeholder rights, and
market monitoring. Shareholder Rights and Creditor Rights data are those of La Porta et al.
(1998). The index of shareholder rights ranges from 0 to 6 with a higher value reflecting stronger
protection of minority shareholders against managers or dominant shareholders. The index of
creditor rights range from 0 to 4 with a higher value reflecting greater protection of secured
creditors in particular in reorganization and liquidation processes. Other proxies for market
monitoring can be found in Barth et al. (2006). The correlation between those variables and the
shareholder rights variable used here is high and the choice among them does not have much
impact on the results. We use only shareholder rights, since data for this variable exists for the
largest number of countries.
The capital to total asset ratio (CAP/TA) can also be considered a governance variable.
This variable is included because the risk-taking incentives of shareholders are reduced with
increased equity financing assuming that CAP/TA can be considered exogenous to some extent.
The existence of capital requirements implies that there is an exogenous component to this
variable. The moral hazard incentives are expected to increase when equity capital approaches
zero.
The extent to which capital requirements are binding would depend on the quality of
supervision of banks. There exist proxies for effectiveness of supervision as well. Barth et al.
(2006) has developed an index for the power of supervisors to influence banks behavior. We
included this index in the empirical analysis, but since its level of significance was consistently
low it is not included in the results presented below.

20
Descriptions and sources of all variables used in the analysis are presented in the Data
Appendix. The correlations among governance and institutional variables are reported in Table 2.
[Insert Table 2 here]
5. Empirical results
Tables 3-4 show results for regressions without interactive variables, while Tables 5-6
includes interactions. Tables 3 and 5 present the results for All Countries, while Tables 4 and 6
refer to Emerging Markets. The three different proxies for banks’ risk-taking are listed as column
heads. The first NPL/CAP column (first two in Tables 3 and 4) shows results of the panel
analysis. The other three columns are the results of cross section analyses for the three risk
proxies NPL/CAP, STDNPL/CAP and the Z-score. In all tables, coefficients marked with an
asterisk are significant on at least the 10 percent level. The coefficients marked with a # have
estimates that exclude zero within one standard deviation. We consider this weak evidence of a
relationship but nevertheless evidence worth taking note of.
Turning first to the issue of a quadratic relationship between explicit deposit insurance
coverage and risk-taking, we can observe in Tables 3 and 4 that the sign for the deposit insurance
coverage (lncovdep) is negative in the first four columns as expected, and the sign of the squared
term is positive in these columns. Most of these coefficients are significant or weakly significant.
Turning to the Z-score we expect the opposite signs for both terms since this variable measures
“distance to default”. The results for All Countries are as expected (column 5, Table 3), while for
Emerging Markets the sign for the linear term is contrary to the hypothesis but not significant at
all (column 5, Table 4). Taken together, the evidence favors the existence of a quadratic
relationship between explicit depositor protection and risk-taking.

21
In both Tables 3 and 4, the sign for CAP/TA is negative in the first four columns as
expected under conditions of potential moral hazard. The coefficients for CAP/TA are not
significant in the Z-score regressions.
State ownership seems to be associated with relatively high values of NPL/CAP, but the
Z-score does not seem to be affected by state ownership in Tables 3 and 4. On the other hand,
foreign ownership is significant in the Z-score regression for All Countries (column 5, Table 3),
but not in the NPL/CAP regressions. Contrary to expectations, the sign for foreign ownership in
the Z-score regressions in both Tables 3 and 4 is negative indicating higher risk-taking in
banking systems with more foreign ownership. We have reservations with respect to this result
since Z-scores do not include NPLs.
Increasing shareholder rights seems to reduce risk-taking and the coefficients are
significant in both Tables 3 and 4 when NPL/CAP is the dependent variable. Creditor rights
seem irrelevant for risk-taking in these tables. This variable is excluded in the remainder of the
analysis.
[Insert Tables 3 and 4 here]
In Tables 5 and 6 interaction terms are included in order to test the hypothesis with
respect to the interaction between governance quality and deposit insurance coverage.
Interactions with CAP/TA were also included but since these interactions were not significant in
any regression we excluded these interactions in the regressions presented here.
The results with respect to the non-interactive terms is similar to the results in Tables 3
and 4 but the impact of some governance variables seem to shift from the stand-alone variable to
the interaction term. The significantly negative sign for shareholder rights is robust and its
interaction term is significant (or weakly significant) in the NPL/CAP regressions both for All

22
Countries and for Emerging Markets. The significance of state ownership and lncovdep squared
in the panel regressions of NPL/CAP, however, is shifted to the interaction term.
There is one substantial difference in results for Emerging Markets in Table 6 relative to
Table 4: foreign ownership and its interaction with lncovdep squared become significant in the
Z-score regressions. They also become near-significant in the cross-section NPL/CAP regression
for All Countries in Table 5 relative to Table 3. The signs are consistent indicating greater risk-
taking with foreign ownership, as well as flatter curvature. These results are contrary to the
hypothesis based on a link between foreign ownership and quality of bank governance.
[Insert Tables 5 and 6 here]
The presence of interaction terms with the squared lncovdep makes interpretations of
results relative to hypotheses less obvious. The interaction terms modify the shape of the
relationship between deposit insurance coverage and risk-taking depending on country specific
values for ownership and shareholder rights variables. Therefore we draw figures to better
understand how the expected U-shaped relationship is modified by the interactions.
The illustrations in figures focus on Emerging Markets. Figure 3 shows how state
ownership and shareholder rights affect the quadratic relationship in these countries based on the
panel and cross-section analyses of NPL/CAP. The interaction terms of these two variables are
significant or weakly significant in the NPL/CAP regressions in Table 6. In Figure 4, the impact
of foreign ownership is presented based on the Z-score regression, since foreign ownership has a
significant effect only in the Z-score regression.
In both Figures 3 and 4, the fully drawn line shows the relationship between a proxy for
risk taking and deposit insurance coverage based on the mean values of all other variables. The
relationships for NPL/CAP regressions shown in Figure 3 are U-shaped, suggesting that there is
a partial or intermediate deposit insurance coverage level that minimizes risk-taking incentives.

23
Note that the Z-score measures the distance to default and the hypothesis with respect to Z-
scores is an inverted U-shape. For Emerging Markets the curve is downward sloping indicating
that risk-taking as measured by Z-scores increases with explicit deposit insurance coverage
(Figure 4). Thus, the implicit protection of depositors may be weaker in these countries. The
higher level of risk-taking as measured by NPL/CAP at full coverage relative to at no coverage
in Figure 3 is consistent with this interpretation.
The dotted lines take into account the impact of ownership and governance variables on
the relationship between explicit coverage and risk-taking. The dotted lines show the
relationships for relatively high levels of the different variables while the dashed lines shows the
relationships at relatively low values for the variables.
For the impact of state ownership, the figures in Panel 3a shows that a higher (lower)
share of state-ownership in a national banking system is associated with higher (lower)
NPL/CAP at any level of deposit insurance coverage. The curvature is not consistent with our
hypothesis, however, since we expected that a low level of state ownership should make bank
managers more sensitive to incentive effects of explicit and implicit insurance.
Panel 3b shows the effect of strong and weak shareholder rights on the U-shaped
relationship. Strong shareholder rights are generally associated with lower risk-taking and the
curvature is more pronounced for strong shareholder rights as suggested by our hypothesis.
However, in the cross-section regression for NPL/CAP stronger shareholder rights shift the
relationship from downward sloping for weak rights to upward sloping for strong rights. Thus, it
seems that incentive effects of explicit coverage are relatively strong with strong shareholder
rights while the incentive effects of implicit depositor protection are strong in Emerging Market
countries with weak shareholder rights. One can speculate that in countries where managers are
relatively powerful relative to shareholders, the same managers have strong links to or influence

24
on governments offering strong implicit protection. Thus, non-insurance is not credible in this
group of countries.
[Insert Figure 3 here]
In Figure 4 we present the effects of foreign ownership on the relationship between
explicit depositor protection and the Z-score for All Countries and for Emerging Markets. As
noted, the expected inverted U-shape is supported for All Countries but not for Emerging
Markets. The main result that both country groups in Figure 4 have in common is that foreign
ownership reduces the Z-scores (increased risk-taking) in countries with low explicit coverage.
In emerging markets it seems that increased foreign ownership reduces risk-taking at high levels
of explicit coverage.
[Insert Figure 4 here]
Risk-taking can be analyzed further in Table 7 where the results refer to regressions
wherein the dependent variables capture either asset side risk (NPL and STDROA) or liability
side risk (CAP/TA). The latter variable represents the capital banks hold as buffers against asset
side risk. These regressions can tell us whether the results discussed above are explained by
adjustment of assets side risk or the capital ration in response to differences in depositor
protection. For example, the coefficients for foreign ownership standing alone and interacting in
Table 7, Panel b, for Emerging Market indicate that the above results for the impact of foreign
ownership on the Z-score are explained primarily by the impact of foreign ownership on the
capital ratio, CAP/TA. This ratio is lower in banking systems with a high share of foreign
ownership but the interactive term shows that the foreign ownership is associated with a
relatively higher capital ratio in countries with high explicit deposit insurance coverage (Column
4).

25
The lower CAP/TA in countries with high foreign ownership is consistent with results in
Leye Yeyati and Micco (2007). One interpretation of this result is that foreign banks are
implicitly supported by capital in the home country banks. If so, the interactive term indicates
that this support is lesser in countries with high depositor protection. Are foreign banks unwilling
to commit capital in countries with little explicit deposit insurance coverage? A positive answer
to this question is consistent with the results but further studies of the interaction between home
country and host country capital is required to provide a confident answer.
Another observation that follows from the results in Table 7, Panel a, for All Countries is
that the above mentioned U-shaped relationship between NPL/CAP and deposit insurance
coverage is explained by an inverse U-shaped relationship between CAP/TA and deposit
insurance coverage. The coefficients in CAP/TA regressions in Table 7 for lncovdep and
lncovdep squared are significant or, in one case, near significant. Thus, high explicit coverage as
well as low explicit coverage induces risk-taking through relatively low capital ratios.
[Insert Table 7 here]
6. Risk minimizing deposit insurance coverage in Emerging Markets
In order to see how the risk minimizing explicit deposit insurance coverage depends on
country specific factors we turn to Table 8. Here we use regression results to calculate the risk
minimizing coverage for a number of emerging markets in Asia and Europe. Presumably this
risk minimizing coverage is the coverage that maximizes the impact of market discipline on
banks’ risk-taking. According to the regression results, the risk minimizing coverage depends on
state ownership, foreign ownership and shareholder rights although some relations are not
statistically significant in the previous tables.
In Table 8 the first column after the country names shows the actual ratio for deposit
insurance coverage relative to the average deposit size (covdep) in each country in 2003. The

26
next four columns show the ratio that would minimize risk-taking according to the results in the
different regressions for emerging markets in Table 6. The results in the two NPL/CAP columns
are fairly consistent in terms of ranking of the different countries (columns 2-3). The covdep that
would minimize the standard deviation of NPL/CAP looks very different, however (column 4).
Each proxy for risk-taking is imperfect for reasons discussed above. If we consider the panel
analysis of NPL/CAP as the one providing the most reliable estimates of coefficients, we can
compare the covdep value that minimize risk-taking according to this regression with the actual
covdep value in the different countries. According to this comparison Indonesia, Malaysia and
Thailand with full coverage should reduce the explicit deposit insurance coverage. Among the
Asian countries, Singapore with no deposit insurance and the Philippines should raise the
coverage.
In column 5, Table 8, the Z-score regression, where foreign ownership has a significant
effect, leads to the conclusion that emerging market countries with a large share of foreign
ownership should offer comprehensive coverage. For emerging market countries in Europe, the
share of foreign ownership ranges from 65% in Latvia to 98.9% in Estonia, and the Z-score
regression suggests that the risk-minimizing coverage for these countries could be full. In
accordance with the discussion above these results can be interpreted to mean that foreign banks
commit relatively more capital in countries with high explicit deposit insurance coverage.
The overall results also show that South Korea, the Czech Republic, Estonia, Hungary,
Latvia and Slovakia seem to offer deposit insurance coverage close to the risk-minimizing one.
[Insert Table 8 here]
7. Concluding Remarks
We have analyzed how country specific conditions with respect to ownership and
governance of banks interact with deposit insurance systems to determine the impact of market

27
discipline on banks’ risk-taking. The proxies we use for risk-taking are based on data for non-
performing loans and capital, as well as a Z-score based on accounting data. Each proxy has its
weaknesses relative to a theoretically appropriate measure of risk-taking. Data constraints
implies that in cross-section analysis of emerging markets, the number of countries is limited to
32. Although the proxies for risk-taking are appropriate for analysis on the level of individual
banks, we focus on the country level for two reasons. First, the governance and deposit insurance
characteristics are country specific and, second, data for non-performing loans on the bank level
are generally unreliable and inconsistent across countries, while our country level data is based
on estimates by the IMF.
The results suggest that the relationship between banks’ risk taking and explicit deposit
insurance coverage can be described as U-shaped as hypothesized. This result is fairly robust
although it does not hold for the Z-score. It holds for the capital ratio component of the Z-score
score, as well as for the ratio of nonperforming loans relative to capital and the standard
deviation of non-performing loams relative to capital.
The analysis of the impact of state and foreign ownership on the U-shaped relationship
indicates that these ownership variables affect risk-taking but not primarily through effects on
the quality of governance in the sense that bank managers maximize shareholder wealth. A large
share of state ownership in the banking system is associated with greater risk-taking as measured
by non-performing loans relative to capital. This effect seems to be associated with high explicit
depositor protection, in particular. Foreign ownership is not associated with risk-taking as
measured by non-performing loans relative to capital but with higher risk-taking as measured by
Z-scores and the capital ratio alone. However, in countries with high explicit deposit insurance
coverage this effect of foreign ownership is nullified or even reversed. One interpretation of this

28
result is that foreign banks prefer to commit capital in countries with high explicit deposit
insurance coverage.
The results with respect shareholder rights indicate that countries with stronger rights
have a lower level of non-performing loans relative to capital. This effect is particularly strong in
countries with low explicit depositor protection and presumably relatively high risk shifting
incentives caused by high implicit protection.
The hypothesis of a more pronounced U-shaped relationship between explicit deposit
insurance coverage and risk-taking in countries with higher quality of governance was partially
supported by the results for shareholder rights and state ownership.
Countries in Asia and Eastern Europe vary considerable in their deposit insurance
coverage and according to our results some countries would benefit by increasing the coverage
while other countries should reduce the coverage. The general policy implication of our analysis
is that banks’ risk-taking is minimized at an intermediate level of deposit insurance coverage.
Increasing shareholder rights allow countries to reduce the deposit insurance coverage, while the
coverage should be relatively high in countries with substantial foreign ownership of banks.
Further research is required to draw firm conclusions about the impact of governance
structures on risk-taking and market discipline in different deposit insurance systems.
Specifically, bank-specific governance characteristics should be introduced since the variation
across banks is likely to be substantial. Other avenues that should be explored are alternative
measures for market discipline in corporate behavior as well as in market prices.

29
Data Appendix
Variable Description Source
NPL Bank nonperforming loans to total loans Financial Stability reports, IMF
CAP/TA Bank capital to total assets Financial Stability reports, IMF
NPL/CAP Bank nonperforming loans to total loans divided by bank capital to assets
Authors’ calculation based on the data from Financial Stability reports, IMF
STDNPL/CAP The standard deviation of bank nonperforming loans to total loans divided by the average value of bank capital to assets
Authors’ calculation based on the data from Financial Stability reports, IMF
Z-Score The average return on assets (ROA) plus equity-asset ratio, divided by the standard deviation of ROA
Authors’ calculation based on the data from Financial Stability reports, IMF
STDROA The standard deviation of the return on assets Authors’ calculation based on the data from Financial Stability reports, IMF
Real GDP/Cap The natural log value real GDP per capita (constant 2000 US$) World Development Indicator (WDI)
Real GDP Growth Real GDP growth rate (annual %) WDI
M2 to Reserves The ratio of money and quasi money (M2) to gross international reserves
WDI
Inflation The natural log difference of the Consumer Price Index WDI
Real Interest Rate Real interest rate (%) WDI
lncovdep
The natural log value of (1+ covdep), where covdep is the ratio of the maximum deposit insurance coverage limit per deposit per capita.
Authors’ calculation based on the data from Demirgüç-Kunt et al. (2005)
State Ownership The fraction of the banking system’s assets that are 50% or more government owned.
The World Bank Survey of Bank Regulation and Supervision (Barth et al., 2004 & 2006)
Foreign Ownership The fraction of the banking system’s assets that are 50% or more foreign owned.
The World Bank Survey of Bank Regulation and Supervision (Barth et al., 2004 & 2006)
Shareholder Rights An index aggregating six characteristics of shareholder rights: proxy by mail allowed, shares not blocked before meeting, cumulative voting or proportional representation allowed, oppressed minorities in place, percentage of share capital to call an extraordinary meeting, and preemptive right to new issues. The index ranges from 0 to 6 with a higher value indicating the increase in shareholder protection.
La Porta et al. (1998) and Pistor et al (2000)
Creditor Rights An index aggregating four characteristics of creditor rights: no automatic stay on secured assets, secured creditors paid first, restrictions on going into reorganization, and management does not stay in reorganization. The index ranges from 0 to 4 with a higher value indicating the increase in creditor protection.
La Porta et al. (1998) and Pistor et al (2000)

30
References
Angkinand, A., Sawangngoeny, W., Wihlborg, C., 2007. Banking Crises: Definitions and Explanations. Claremont Working Paper. Claremont Graduate University, CA.
Angkinand, A., Wihlborg, C., 2006. Deposit Insurance Coverage, Credibility of Non-insurance and Banking Crisis. LEFIC Working paper no. 010. Center for Law, Economics and Financial Institutions, Copenhagen Business School.
Barth, J. R., Caprio, G., Levine, R., 2004. The Regulation and Supervision: What Works Best? Journal of Financial Intermediation 13, 205-248.
Barth, J. R., Caprio, G., Levine, R., 2006. Rethinking Bank Regulation: Till Angels Govern. Cambridge University Press, Cambridge and New York.
Benink, H., Benston, G., 2005. The Future of Banking Regulation in Developed Countries: Lessons from and for Europe. Financial Markets, Institutions & Instruments 14(5), 289-328.
Berger, A. N., Clarke, G. R. G., Cull, R., Klapper, L.F., Udell, G. F., 2005. Corporate Governance and Bank Performance: A Joint Analysis of the Static, Selection, and Dynamic Effects of Domestic, Foreign, and State Ownership. Journal of Banking and Finance 29, 2179-2221.
Bhattacharya, S., Thakor, A.V., 1993. Contemporary Banking Theory. Journal of Financial Intermediation 3, 2-50.
Boyd, J. H., Graham, S.L., 1988. The Profitability and Risk Effects of Allowing Bank Holding Companies to Merge with Other Financial Firms: A Simulation Study. Federal Reserve Bank of Minneapolis Quarterly Review 12(2), 3-20.
Caprio, G., Klingebiel, D., Laeven, L., Noguera, G., 2005. Banking Crisis Database. In: Honohan, P., Laeven, L.(Eds.), Systemic Financial Crises: Containment and Resolution. Cambridge University Press, Cambridge and New York.
Caprio, G., Laeven, L., Levine, R., 2007. Governance and Bank Valuation. Journal of Financial Intermediation 16(4), 584-617.
Caprio, G., Martinez-Peria, M.S., 2000. Avoiding Disaster: Policies to Reduce the Risk of Banking Crises. Discussion Paper. Egyptian Center for Economic Studies, Cairo, Egypt.
Claessens, S., Demirgüç-Kunt, A., Huizinga, H., 2001. How Does Foreign Entry Affect Domestic Banking Markets? Journal of Banking and Finance 25(5), 891–911.
Crystal, J. S., Dages, B.G., Goldberg, L.S., 2001. Does Foreign Ownership Contribute to Sounder banks in Emerging Markets? The Latin American Experience. Conference Paper. In: Open Doors: Foreign Participation in Financial Systems in Developing Countries, The Brookings Institution, Washington D.C.

31
Demirgüç-Kunt, A., Detragiache, E., 2002. Does Deposit Insurance Increase Banking system Stability? An Empirical Investigation. Journal of Monetary Economics 49, 1373-1406.
Demirgüç-Kunt, A., Karacaovali, B., Laeven, L., 2005. Deposit insurance around the World: A Comprehensive Database. World Bank Policy Research Working Paper, Washington, DC.
Demirgüç-Kunt, A., Levine, R., Min, H.G., 1998. Opening to Foreign Banks: Stability, Efficiency and Growth. In: Meltzer, A. (Ed), The Implications of Globalization Financial Markets, Bank of Korea, Korea.
Diamond, D. W., Dybvig, P.H., 1983. Bank Runs, Deposit Insurance, and Liquidity, The Journal of Political Economy 91(3), 401-419.
Eichengreen, B., Arteta, C., 2002. Banking Crises in Emerging Markets: Presumptions and Evidence. In: Blejer, M.I., Skreb, M (Eds.), Financial Policies in Emerging Markets. MIT Press, Cambridge, MA.
Fernandez, A., Gonzalez, F., 2005. How Accounting and Auditing Systems Can Counteract Risk-Shifting of Safety-Nets in Banking: Some International Evidence. Journal of Financial Stability 1(4), 466-500.
Goyeau, D., Tarazi, A., 1992. An Empirical Investigation on Ban Risk in Europe. International Finance Group Working Paper 93-11, the University of Birmingham.
Gropp, R., Vesala, J., 2004. Deposit Insurance, Moral Hazard, and Market Monitoring. Review of Finance 8, 571-602.
Hoggarth, G., Jackson, P, Nier, E., 2005. Banking Crises and the Design of Safety Nets. Journal of Banking and Finance 29, 143-159.
Hovakimian, A., Kane, E., Laeven, L. 2003. How Country and Safety-Net Characteristics Affect Bank Risk Shifting. Journal of Financial Services Research 23(3), 177-204.
Hutchison, M., McDill, K., 1999. Are All Banking Crises Alike? The Japanese Experience in International Comparison. Journal of the Japanese and International Economics 13. 155-180.
Iannotta, G., Nocera, G, Sironi, A, 2007. Ownership Structure, Risk and Performance in the European Banking Industry. Journal of Banking and Finance 31, 2127-2149.
La Porta, R., Lopez-de-Silanes, F., Shleifer, A., Vishny, R.W., 1998. Law and Finance. The Journal of Political Economy 106(6), 1113-1155.
La Porta, R., Lopez-de-Silanes, F., Shleifer, A., Vishny, R.W., 2002. Government Ownership of Banks. The Journal of Finance 57(1), 265-301.
Lensink, R., Hermes, N., 2004. The Short-term Effects of Foreign Bank Entry on Domestic Bank Behavior. Does Economic Development Matter? Journal of Banking and Finance 28(3), 553-568.

32
Lensink, R., Naaborg, I., Banking in Transition Economies: A Study of Foreign Ownership and Performance. European Journal of Finance, forthcoming.
Leye Yeyati, E., Micco, A., 2007. Concentration and Foreign Penetration in Latin American Banking Sectors: Impact on Competition and Risk. Journal of Banking and Finance 31, 1633-1647.
Nier, E., Baumann, U., 2006. Market Discipline, Disclosure and Moral Hazard in Banking. Journal of Financial Intermediation 15, 332–361.
Pistor, K., Raiser, M., Gelfer, S., 2000. Law and Finance in Transition Economies. Economics of Transition 8, 325-368.
Saunders, A., Strock, E., Travlos, N.G., 1990. Ownership Structure, Deregulation and Bank Risk Taking. The Journal of Finance 45(2), 643-654.
Tadesse, S., 2005. Banking Fragility and Disclosure: International Evidence. Working Paper no. 748. William Davidson Institute, the University of Michigan, MI.

33
Figure 1 Hypothesized relationships between explicit deposit insurance coverage (EC) and risk-taking (RT) and the impact of institutional and banks’ ownership variables.
This figure shows the relationship between bank’s excessive risk-taking (RT) and explicit deposit insurance
coverage (EC). The line “Explicit” is drawn at a constant degree of credibility of non-insurance; an upward slope reflects the moral hazard incentives become stronger at high levels of EC. The line “Implicit” is drawn at a constant level of risk taking caused by explicit deposit insurance coverage; a negative slope shows how RT caused by implicit insurance decline with increasing EC as a result of credibility of non-insurance (CNI). The two lines are added vertically. The total effect of EC on risk taking is shown as a U-shaped curve.
The line Implicit × Institution shows how the curve Implicit shifts as a result of better quality of institutions (and bank ownerships and financial supervisions) enhancing the CNI. The top dotted line is the vertical sum of Explicit and Implicit. The lower dotted line is the vertical sum of Explicit and Implicit × Institution.
Implicit
Explici
Implicit × Institution
EC
R

34
Figure 2 The U-shape relationship and the impact of bank governance
“Good” governance implies that shareholders’ objectives have a large weight in managers’ incentives.
Good governance
Weak governance
RT
EC

35
Figure 3 Risk-taking (proxied by NPL/CAP) at different levels of deposit insurance coverage and corporate governance in Emerging Markets
3a. State Ownership
Panel Regression of NPL/CAP
0
0.5
1
1.5
2
2.5
0 1 2 3 4lncovdep
Pre
dict
ed N
PL/
CA
P
State-ow ned = 0%
State-ow ned = 17% (mean)State-ow ned = 30%
Cross-Section of Average NPL/CAP
0
0.5
1
1.5
2
2.5
0 1 2 3 4lncovdep
Pre
dict
ed N
PL/
CA
P
State-ow ned = 0%State-ow ned = 18% (mean)State-ow ned = 30%
3b. Shareholder Rights
Panel Regression of NPL/CAP
0
0.5
1
1.5
2
2.5
0 1 2 3 4lncovdep
Pre
dict
ed N
PL/
CA
P
Shareholder Rights = 1Shareholder Rights = 3.08 (mean)Shareholder Rights = 5.5
Cross-Section Regression of Average NPL/CAP
0
1
2
3
4
5
0 1 2 3 4lncovdep
Pre
dict
ed N
PL/
CA
P
Shareholder Rights = 1Shareholder Rights = 3 (mean)Shareholder Rights = 5.5
Figures above plot the predicted values of NPL/CAP at different levels of coverage limit of deposit per capita. The predicted values are calculated by varying the levels of government ownership and shareholder rights and using the mean values of other independent variables. The figures are based on results in Table 6.

36
Figure 4 Risk-taking (proxied by Z-score) at different levels of deposit insurance coverage and foreign ownership
Z-score regression (All Countries)
0
1
2
3
4
5
0 1 2 3 4lncovdep
Pre
dict
ed Z
-sco
re
Foreign-ow ned = 0%
Foreign-ow ned = 32% (mean)
Foreign-ow ned = 99%
Z-score regression (Emerging Markets)
0
1
2
3
4
5
0 1 2 3 4lncovdep
Pre
dict
ed Z
-sco
reForeign-ow ned = 0%
Foreign-ow ned = 40% (mean)
Foreign-ow ned = 99%
Figures above plot the predicted values of Z-score at different levels of coverage limit of deposit per capita. The predicted values are calculated by varying the levels of foreign ownership and using the mean values of other independent variables. The figure on the left is based on the regression result in column 5, Table 4, and figure on the right is from column 5, Table 6.

37
Table 1 Deposit Insurance Coverage and Governance of Banks
NP
L/T
ota
l Lo
an
s (a
vera
ge, %
)
Cap
/TA
(a
vera
ge, %
)
Cov
erag
e Li
mit
as o
f 200
3
(Lo
cal C
urr
ency
)
Cov
erag
e Li
mit
as
of 2
003
(d
olla
rs)
Cov
erag
e Li
mit
/Dep
osi
t per
C
apita
(co
vdep
) as
of 2
003
Go
vern
men
t O
wn
ersh
ip in
2
001
Fo
reig
n
Ow
ner
ship
in
200
1
Sh
areh
old
er
righ
ts
Cre
dito
r ri
ght
s
East and Southeast Asia
Indonesia 30.8 7.2 Full Full Full 44 7 2 4
South Korea 5.5 4.3 50 Mil Won 41,925 4.49 39.97 29.54 2 3
Malaysia 14.6 8.6 Full Full Full 0 19 4 4
Philippines 19.0 13.9 P 100,000 1,800 3.76 11.17 14.95 3 0
Singapore 3.8 9.5 0 0 0 0 50 4 4
Thailand 23.1 7.5 Full Full Full 30.64 6.77 2 3
Central and Eastern Europe Bulgaria 14.4 14.1 BGL 15,000 8,654 10.87 17.6 74.56 4 3
Czech Republic 17.4 6.5 CZK 810,025 31,575 5.10 3.8 90 3 3
Estonia 1.1 14.9 EKK 100,000 8,058 3.13 0 98.9 3.75 4
Hungary 3.9 8.9 HUF 3,000,000 1,4429 4.02 9 88.8 3 3.75
Latvia 4.7 6.8 LVL 3,000 5,545 4.07 3.2 65.2 3.5 4
Lithuania 11.0 10.3 LTL 45,000 16,293 12.05 12.16 78.19 3.75 3
Poland 16.1 7.6 PLN 106,304.2 28,418 13.58 23.5 68.7 3 2.25
Romania 8.3 9.5 ROL 125,222,000 3,842 12.30 41.8 47.3 3 4
Slovakia 17.7 7.6 SKK 925,498.3 25,260 7.39 4.4 85.5 2.5 4
Slovenia 6.2 11.1 SIT 5,100,000 26,931 3.38 12.2 20.6 2.5 4
Other Emerging Market Economies
Argentina 17.9 11.4 Arg $ 30,000 10,327 13.31 31.9 31.8 4 1
Brazil 7.0 12.4 Reais 20,000 6,925 8.7 32 29.9 3 1
Chile 1.6 7.4 CLP 2,256,000 3,764 2.01 13.3 46.8 5 2
Colombia 9.4 10.7 20000000 7,192 16.82 18.3 21.5 3 0
Ecuador 18.2 12.1 Full Full Full 14 7 2 4
Egypt 16.6 5.2 0 0 0 64.7 13.3 2 4
India 12.6 5.7 Rs 100,000 2193 7.34 75.27 7.3 5 4
Israel 9.1 7.0 0 0 0 46.1 1.2 3 4
Jordan 16.5 6.6 JD 10,000 14104 7.22 0 64.3 1 -
Mexico 7.1 9.4 32,262,340 Pesos 2871337 Full 0 82.7 1 0
Nigeria 15.4 8.6 N 50,000 366 5.06 4.65 0 3 4
Russia 9.2 13.6 100,000 rubles 3,395 5.16 35.5 8.8 5.5 2.5
South Africa 3.5 8.0 0 0 0 0 7.7 5 3
Ukraine 28.1 14.8 UAH 1,500 281 1.19 12 10.5 2.5 4
Venezuela 6.7 13.9 Bs 10,000,000 6,258 10.3 6.86 43.22 1 -
Zimbabwe 10.0 8.9 Zimbabwe $ 200,000 3640 1.12 6.09 28.02 3 4
Minimum 1.10 4.34 0 1.2 1 0
Mean 11.75 9.53 19.02 39.5 3.18 3.02
Maximum 26.23 14.89 75.27 98.9 5.5 4 †converted using the exchange rates at the end of 2003

38
Table 2 Correlation for Governance and Institutional Variables
Rea
l GD
P/
Cap
Rea
l GD
P
Gro
wth
M2
to
Res
erve
Infla
tion
Rea
l In
tere
st
Rat
e
CA
P/T
A
Co
vdep
(Lnc
ovd
ep
× Lnco
vdep
)
Sta
te
Ow
ners
hip
For
eign
O
wne
rshi
p
Sha
reho
lder
rig
hts
Real GDP Growth 0.103
M2 to Reserve -0.108 0.003
Inflation -0.002 0.177 -0.054
Real Interest Rate 0.302 0.259 0.488 0.052
CAP/TA 0.406 -0.047 0.375 -0.411 0.272
lncovdep 0.421 0.037 0.166 -0.125 0.192 0.567
(lncovdep × lncovdep) -0.387 -0.022 -0.128 0.094 -0.117 -0.512 -0.988 State Ownership 0.188 -0.212 -0.008 0.031 0.238 0.206 0.121 -0.094 Foreign Ownership -0.149 -0.143 0.458 -0.060 0.194 0.045 -0.049 0.054 0.366 Shareholder rights 0.201 -0.016 0.241 0.117 0.367 0.039 0.030 0.009 0.301 0.263 Creditor rights 0.370 0.242 0.458 -0.046 0.331 0.275 0.516 -0.495 -0.124 0.092 0.103

39
Table 3 Deposit Insurance Coverage and Bank Ownership: All Countries
Dependent Variable NPL/CAP NPL/CAP NPL/CAP STDNPL/
CAP Z-score
Model Panel Panel Cross-Section Cross-Section Cross-Section
(1) (2) (3) (4) (5) Real GDP/Cap -0.334** -0.377** -0.518** -0.139** 0.080
(0.001) (0.000) (0.000) (0.011) (0.465)
Real GDP Growth -2.965* -2.794** -6.969# -3.321# 5.669
(0.051) (0.043) (0.201) (0.308) (0.464)
M2 to Reserve -0.135 -0.118 -0.012 -0.047 0.233#
(0.362) (0.390) (0.929) (0.417) (0.192)
Inflation 0.996** 0.829* -2.802** -0.425 -1.204
(0.029) (0.074) (0.008) (0.494) (0.427)
Real Interest Rate 1.731** 1.711** -0.242 -0.387# -2.175#
(0.001) (0.000) (0.773) (0.228) (0.162)
CAP/TA -0.070** -0.073** -0.073** -0.020* 0.014
(0.000) (0.000) (0.003) (0.057) (0.629)
lncovdep -0.329# -0.333# -0.306# -0.199# 0.483#
(0.198) (0.151) (0.168) (0.140) (0.117)
(lncovdep × lncovdep) 0.096* 0.096** 0.106* 0.075** -0.175**
(0.064) (0.043) (0.086) (0.036) (0.035)
State Ownership 0.917* 0.832# 1.228** 0.192 -0.128
(0.082) (0.110) (0.014) (0.470) (0.856)
Foreign Ownership 0.009 0.090 0.397 0.183 -0.880**
(0.985) (0.854) (0.431) (0.484) (0.045)
Shareholder Rights -0.169** -0.190** -0.203** -0.007 -0.023
(0.034) (0.010) (0.027) (0.887) (0.846)
Creditor Rights 0.041
(0.696)
Constant 0.566 0.899# 1.850** 0.714* 3.821**
(0.420) (0.142) (0.001) (0.064) (0.000)
R2 0.455 0.458 0.634 0.474 0.427
N 242 251 52 52 52
Chi-Square/F-Statistics 124.05 116.90 8.68 5.21 4.00
Prob>Chi-Square (Prob>F-stat) 0.000 0.000 0.000 0.000 0.001
This table reports the estimation results of the impact of bank governance, proxied by state- and foreign ownerships of banks, and shareholder and creditor rights, on banks’ risk-taking. The panel regressions of NPL/CAP are estimated using the random country effects model and independent variables are lagged by one year; the chi-square is reported for overall model fit. The cross-section regressions are estimated using OLS with the robust standard errors; the F-statistics is reported for overall model fit. The values of NPL/CAP and Z-score are in natural logarithm. *, ** indicate the significance levels of 10%, and 5% respectively. # indicates the coefficient value zero that falls outside one standard deviation of the estimate. The numbers in parentheses are p-values.

40
Table 4 Deposit Insurance Coverage and Bank Ownership: Emerging Market Economies
Dependent Variable NPL/CAP NPL/CAP NPL/CAP STDNPL/
CAP Z-score
Model Panel Panel Cross-Section Cross-Section Cross-Section
(1) (2) (3) (4) (5)
Real GDP/Cap -0.419** (0.002)
-0.465** 0.000
-0.393** (0.015)
-0.234* (0.063)
-0.134 (0.685)
Real GDP Growth -3.150* (0.061)
-2.963* (0.052)
-2.354 (0.759)
-8.530# (0.123)
1.436 (0.914)
M2 to Reserve -0.308# (0.152)
-0.258# (0.195)
-0.014 (0.959)
-0.113 (0.543)
-0.093 (0.828)
Inflation 1.443** (0.000)
1.154** (0.007)
-2.038# (0.188)
-1.283# (0.214)
-2.148 (0.393)
Real Interest Rate 1.423** (0.010)
1.494** (0.003)
-0.459 (0.699)
-0.223 (0.729)
-0.280 (0.873)
CAP/TA -0.069** (0.013)
-0.072** (0.005)
-0.069# (0.198)
-0.013 (0.487)
-0.013 (0.789)
lncovdep -0.519* (0.092)
-0.494* (0.075)
-0.154 (0.706)
-0.345# (0.291)
-0.173 (0.809)
(lncovdep × lncovdep) 0.129** (0.047)
0.123** (0.036)
0.043 (0.621)
0.105# (0.134)
-0.039 (0.803)
State Ownership 1.402** (0.020)
1.252** (0.034)
0.893# (0.141)
0.304 (0.498)
-0.523 (0.641)
Foreign Ownership 0.171
(0.763) 0.240
(0.661) -0.166 (0.786)
0.296 (0.438)
-0.540 (0.532)
Shareholder Rights -0.207* (0.083)
-0.221** (0.030)
-0.292** (0.017)
-0.002 (0.982)
0.018 (0.917)
Creditor Rights
-0.033 (0.773)
Constant 0.445
(0.582) 0.656
(0.406) 2.158** (0.012)
0.793# (0.200)
3.545** (0.020)
R2 0.336 0.338 0.612 0.422 0.4112
N 156 165 32 32 32
Chi-Square/F-Statistics 87.01 83.25 8.25 33.33 1.10
Prob>Chi-Square 0.000 0.000 0.000 0.009 0.412 This table reports the estimation results of the impact of bank governance on banks’ risk-taking for a sample of emerging market economies. The panel regressions of NPL/CAP are estimated using the random country effects model and independent variables are lagged by one year; the chi-square is reported for overall model fit. The cross-section regressions are estimated using OLS with the robust standard errors; the F-statistics is reported for overall model fit. The values of NPL/CAP and Z-score are in natural logarithm. *, ** indicate the significance levels of 10%, and 5% respectively. # indicates the coefficient value zero that falls outside one standard deviation of the estimate. The numbers in parentheses are p-values.

41
Table 5 Deposit Insurance Coverage, Ownership, and Interactions: All Countries
Dependent Variable NPL/CAP NPL/CAP STDNPL/
CAP Z-score
Model Panel Cross-Section Cross-Section Cross-Section
(1) (2) (3) (4)
Real GDP/Cap -0.371** -0.531** -0.124** 0.054
(0.000) (0.000) (0.020) (0.650)
Real GDP Growth -2.886** -3.036 -2.425 4.965
(0.037) (0.592) (0.459) (0.534)
M2 to Reserve -0.127 -0.002 -0.032 0.200#
(0.357) (0.985) (0.562) (0.296)
Inflation 0.830* -2.202* -0.191 -1.351
(0.092) (0.054) (0.743) (0.356)
Real Interest Rate 1.597** -0.230 -0.355# -2.153#
(0.001) (0.772) (0.240) (0.164)
CAP/TA -0.074** -0.083** -0.021* 0.017
(0.000) (0.002) (0.064) (0.563)
lncovdep -0.305# -0.382* -0.219* 0.433#
(0.185) (0.076) (0.067) (0.184)
(lncovdep × lncovdep) 0.026 0.102# 0.067# -0.211**
(0.671) (0.203) (0.102) (0.044)
State Ownership 0.302 1.641* -0.148 0.147
(0.630) (0.054) (0.529) (0.871)
Foreign Ownership 0.064 0.830# 0.465# -1.595**
(0.914) (0.245) (0.139) (0.003)
Shareholder Rights -0.258** -0.347** -0.046 -0.022
(0.003) (0.009) (0.390) (0.896)
0.117** -0.153# 0.071# -0.066 State Ownership × (lncovdep × lncovdep) (0.015) (0.178) (0.245) (0.763)
0.017 -0.087# -0.050# 0.148# Foreign Ownership ×
(lncovdep × lncovdep) (0.663) (0.277) (0.194) (0.112)
0.015* 0.028# 0.005 0.008 Shareholder Rights ×
(lncovdep × lncovdep) (0.096) (0.151) (0.554) (0.774)
Constant 1.149* 2.101** 0.806** 3.940**
(0.070) (0.002) (0.019) (0.000)
R2 0.472 0.699 0.564 0.481
N 251 52 52 52
Chi-Square/F-Statistics 205.137 9.15 4.97 4.39
Prob>Chi-Square 0.000 0.000 0.000 0.000 This table reports the estimation results of the impacts of bank governance on banks’ risk-taking and how it depends on explicit deposit insurance coverage (lncovdep). The panel regressions of NPL/CAP are estimated using the random country effects model and independent variables are lagged by one year; the chi-square is reported for overall model fit. The cross-section regressions are estimated using OLS with the robust standard errors; the F-statistics is reported for overall model fit. The values of NPL/CAP and Z-score are in natural logarithm. *, ** indicate the significance levels of 10%, and 5% respectively. # indicates the coefficient value zero that falls outside one standard deviation of the estimate. The numbers in parentheses are p-values.

42
Table 6 Deposit Insurance Coverage, Ownership, and Interactions: Emerging Markets
Dependent Variable NPL/CAP NPL/CAP STDNPL/
CAP Z-score
Model Panel Cross-Section Cross-Section Cross-Section
(1) (2) (3) (4)
Real GDP/Cap -0.400** -0.342** -0.159# -0.324#
(0.002) (0.042) (0.157) (0.298)
Real GDP Growth -3.122** 1.365 -5.272# -4.986
(0.042) (0.861) (0.309) (0.702)
M2 to Reserve -0.277# -0.012 -0.022 -0.423
(0.168) (0.964) (0.907) (0.362)
Inflation 1.220** -1.052 -0.710 -2.812#
(0.009) (0.542) (0.465) (0.201)
Real Interest Rate 1.259** -0.412 -0.353 0.293
(0.012) (0.743) (0.572) (0.855)
CAP/TA -0.076** -0.070# -0.020 0.010
(0.003) (0.163) (0.379) (0.855)
lncovdep -0.413# -0.414 -0.263 -0.810
(0.171) (0.330) (0.438) (0.334)
(lncovdep × lncovdep) 0.016 -0.064 0.077# -0.095
(0.848) (0.523) (0.229) (0.519)
State Ownership 0.370 0.361 -0.046 -0.504
(0.590) (0.681) (0.920) (0.681)
Foreign Ownership -0.078 -0.317 0.511# -1.543*
(0.914) (0.693) (0.244) (0.093)
Shareholder Rights -0.320** -0.569** -0.059 -0.130
(0.007) (0.001) (0.548) (0.599)
0.159** 0.087 0.045 0.063 State Ownership × (lncovdep × lncovdep) (0.012) (0.510) (0.644) (0.799)
0.041 0.049 -0.057 0.274** Foreign Ownership ×
(lncovdep × lncovdep) (0.409) (0.639) (0.348) (0.032)
0.019* 0.054** 0.008 0.040# Shareholder Rights ×
(lncovdep × lncovdep) (0.053) (0.020) (0.625) (0.264)
Constant 1.070# 3.003** 1.058# 3.734**
(0.222) (0.005) (0.106) (0.020)
R2 0.392 0.708 0.516 0.454
N 165 32 32 32
Chi-Square/F-Statistics 117.706 10.06 1.95 2.88
Prob>Chi-Square 0.000 0.000 0.095 0.020 This table reports the estimation results of the impact of bank governance on banks’ risk-taking and how it depends on deposit insurance coverage for a sample of emerging market economies. The panel regressions of NPL/CAP are estimated using the random country effects model and independent variables are lagged by one year; the chi-square is reported for overall model fit. The cross-section regressions are estimated using OLS with the robust standard errors; the F-statistics is reported for overall model fit. The values of NPL/CAP and Z-score are in natural logarithm. *, ** indicate the significance levels of 10%, and 5% respectively. # indicates the coefficient value zero that falls outside one standard deviation of the estimate. The numbers in parentheses are p-values.

43
Table 7 Components of NPL/CAP and Z-score
Dependent Variable (1) NPL (2) CAP/TA (3) NPL (4) CAP/TA (5) ROA (6) STDROA
Model Panel Panel Cross-Section Cross-Section Cross-Section Cross-Section
Panel a: All Countries
CAP/TA -0.018# 0.066** -0.027# 0.057** 0.032 0.035#
(0.200) (0.000) (0.298) (0.000) (0.689) (0.210)
lncovdep -0.209# 0.094** -0.245# 0.137* 0.208 -0.280#
(0.229) (0.044) (0.256) (0.053) (0.688) (0.318)
(lncovdep × lncovdep) -0.007 -0.021* 0.064 -0.037# -0.191# 0.151#
(0.897) (0.081) (0.429) (0.152) (0.204) (0.139)
State Ownership 0.107 -0.086 1.482* -0.159 -1.683# -0.512
(0.856) (0.545) (0.091) (0.377) (0.113) (0.554)
Foreign Ownership -0.127 -0.138* 0.533 -0.297** -0.762 1.245**
(0.820) (0.060) (0.459) (0.020) (0.397) (0.020)
Shareholder Rights -0.247** 0.019 -0.310** 0.036# 0.006 0.049
(0.005) (0.373) (0.022) (0.259) (0.975) (0.767)
0.135** -0.003 -0.153# 0.000 0.054 0.074 State Ownership × (lncovdep × lncovdep) (0.010) (0.870) (0.196) (0.996) (0.826) (0.693)
0.055# 0.023** -0.047 0.041* 0.135 -0.094# Foreign Ownership ×
(lncovdep × lncovdep) (0.165) (0.004) (0.562) (0.092) (0.356) (0.276)
0.015# -0.002 0.026# -0.002 0.012 -0.008 Shareholder Rights ×
(lncovdep × lncovdep) (0.155) (0.411) (0.172) (0.789) (0.721) (0.760)
Panel b: Emerging Markets
CAP/TA -0.015 0.081** -0.010 0.060** -0.046 0.042
(0.498) (0.000) (0.837) (0.000) (0.504) (0.412)
lncovdep -0.261# 0.053# -0.497# -0.083 -0.630 0.643
(0.230) (0.228) (0.272) (0.454) (0.401) (0.395)
(lncovdep × lncovdep) -0.019 -0.007 -0.074 -0.009 -0.196 0.076
(0.793) (0.632) (0.503) (0.791) (0.328) (0.593)
State Ownership -0.105 -0.171# 0.087 -0.274# -1.923# 0.054
(0.880) (0.153) (0.928) (0.247) (0.138) (0.963)
Foreign Ownership -0.440 -0.191** -0.683 -0.366* -1.007 1.159#
(0.51) (0.010) (0.397) (0.081) (0.387) (0.166)
Shareholder Rights -0.279** 0.026# -0.517** 0.052# -0.188 0.169
(0.023) (0.184) (0.009) (0.285) (0.391) (0.519)
0.174** -0.012 0.106 0.018 0.248 -0.030 State Ownership × (lncovdep × lncovdep) (0.014) (0.619) (0.428) (0.663) (0.438) (0.899)
0.076# 0.013# 0.112# 0.063* 0.314# -0.189# Foreign Ownership ×
(lncovdep × lncovdep) (0.128) (0.180) (0.262) (0.086) (0.127) (0.148)
0.016# -0.001 0.057** 0.003 0.041 -0.034 Shareholder Rights ×
(lncovdep × lncovdep) (0.172) (0.618) (0.022) (0.686) (0.410) (0.356)
This table reports the estimation results of the impacts of bank governance on the components of NPL/CAP and Z-score. Economic control variables are included but not reported. The panel regressions are estimated using the random country effects model and independent variables are lagged by one year. The cross-section regressions are estimated using OLS with the robust standard errors. The values of NPL, CAP/TA, and STDROA are in natural logarithm. *, ** indicate the significance levels of 10%, and 5% respectively. # indicates the coefficient value zero that falls outside one standard deviation of the estimate. The numbers in parentheses are p-values.

44
Table 8 Comparing Actual and Risk-minimizing Explicit Deposit Insurance Coverage (2003)
Column (1) shows the actual levels of coverage per average deposit, Covdep. The remaining columns show the level of covdep that minimizes banks’ risk-taking using different proxies. The calculations are based on results presented in Table 6 for Emerging Markets.
(1) (2) (3) (4) (5)
Country
Coverage Limit /Deposit per
Capita (covdep) as of
2003
NPL/CAP minimizing
covdep
(based on the Panel regression, column 1, Table
6)
NPL/CAP minimizing
covdep
(based on the Cross-Section
regression, column 2, Table
6)
Std(NPL)/Avg(CAP) minimizing
covdep
(based on the Cross-Section
regression, column 3, Table
6)
Z-score maximizing
covdep
(based on the Cross-Section
regression, column 4, Table
6)
Indonesia Full 4.1 10.0 2.4 0
South Korea 4.49 3.9 8.0 3.1 0
Malaysia Full 6.7 2.6 2.9 0
Philippines 3.76 7.3 4.9 2.9 0
Singapore 0 5.2 2.2 4.2 Full
Thailand Full 6.0 15.0 2.6 0
Bulgaria 10.87 2.9 1.7 5.0 Full
Czech Republic 5.10 4.9 3.1 12.3 Full Estonia 3.13 4.0 2.0 13.0 Full Hungary 4.02 4.3 3.0 10.5 Full Latvia 4.07 5.0 2.6 5.8 Full Lithuania 12.05 3.4 2.0 6.1 Full Poland 13.58 3.4 2.9 5.3 Full Romania 12.30 2.6 2.7 3.2 0
Slovakia 7.39 6.0 4.8 13.1 Full
Slovenia 3.38 8.5 8.4 3.3 0