risk and return analysis of the commercial banks
92
RISK AND RETURN ANALYSIS OF THE COMMERCIAL BANKS (With References to NABIL, NIBL, SCBL, HBL, EBL and BoK) By ANEEVA SHAKYA Shanker Dev Campus T.U. Regd. No. : 7-2-271-430-2000 Campus Roll No. : 382/060 A Thesis Submitted to: Office of the Dean Faculty of Management Tribhuvan University In partial fulfillment of the requirement for the Degree of Master of Business Studies (M.B.S) Kathmandu, Nepal October, 2009
-
Upload
khangminh22 -
Category
Documents
-
view
2 -
download
0
Transcript of risk and return analysis of the commercial banks
RISK AND RETURN ANALYSIS OF THE COMMERCIAL BANKS (With References to NABIL, NIBL, SCBL, HBL, EBL and BoK)
By
ANEEVA SHAKYA Shanker Dev Campus
T.U. Regd. No. : 7-2-271-430-2000 Campus Roll No. : 382/060
A Thesis Submitted to:
Office of the Dean Faculty of Management Tribhuvan University
In partial fulfillment of the requirement for the Degree of
Master of Business Studies (M.B.S)
Kathmandu, Nepal
October, 2009
RECOMMENDATION This is to certify that the Thesis
Submitted by:
ANEEVA SHAKYA
Entitled:
RISK AND RETURN ANALYSIS OF THE COMMERCIAL BANKS (With References to NABIL, NIBL, SCBL, HBL, EBL and BoK)
has been prepared as approved by this Department in the prescribed format of the
Faculty of Management. This thesis is forwarded for examination.
…...…………………… …………………………. ………………………….
Asso. Prof. Achyut Raj Bhattarai Prof. Bishweshor Man Shrestha Prof. Dr. Kamal Deep Dhakal
(Thesis Supervisor) (Head of Research Department) (Campus Chief)
…...……………………
Shashi Kumar Sharma
(Thesis Supervisor)
VIVA-VOCE SHEET
We have conducted the viva –voce of the thesis presented
by
ANEEVA SHAKYA
Entitled:
RISK AND RETURN ANALYSIS OF THE COMMERCIAL BANKS (With References to NABIL, NIBL, SCBL, HBL, EBL and BoK)
And found the thesis to be the original work of the student and written according to the prescribed format. We recommend the thesis to
be accepted as partial fulfillment of the requirement for the
Degree of Master’s in Business Studies (M.B.S.)
Viva-Voce Committee
Head, Research Department …………………….………
Member (Thesis Supervisor) …..………………………..
Member (Thesis Supervisor) …..………………………..
Member (External Expert) …..………………………..

TRIBHUVAN UNIVERSITY
Faculty of Management
Shanker Dev Campus
DECLARATION
I hereby declare that the work reported in this thesis entitled “RISK AND RETURN
ANALYSIS OF THE COMMERCIAL BANKS (With References to NABIL, NIBL,
SCBL, HBL, EBL and BoK)” submitted to Office of the Dean, Faculty of Management,
Tribhuvan University, is my original work done in the form of partial fulfillment of the
requirement for the Master’s Degree in Business Study (M.B.S.) under the supervision of
Associate Professor Achyut Raj Bhattarai and Shashi Kumar Sharma of Shanker
Dev Campus.
………………………………
ANEEVA SHAKYA
Researcher
T.U. Regd. No. : 7-2-271-430-2000
Campus Roll No. : 382/060

ACKNOWLEDGEMENT
This report on Risk and Return Analysis of the Commercial Banks has been prepared
as per the course of Master of Business Studies, second year. This report has attempted to
explore the risks and returns of some of the major joint-venture commercial banks and try
to compare them with the risk and return of the commercial banking sector and also with
that of the market risk and return before reaching into some deciding conclusions.
In this effort of preparing the report, I am especially grateful to Asso. Prof. Achyut Raj
Bhattarai and Shashi Kumar Sharma, my teachers, who has given me fruitful suggestions
and guidance to frame out this report. I am also thankful to the officers and staffs of
NEPSE together with staffs of various commercial banks for making me available
different resource materials and data. Similarly, I also want to remember the help that I
have received from the library staffs of various campuses, especially staffs of Shankar
Dev Campus and Central Libraries, T.U.
Last but not the least, I am most indebted to my loving husband Prabin Shakya for his
great support and encouragement that help to give a fine accomplishment to this report.
Aneeva Shakya
Researcher

ABBREVIATIONS
R - Expected Return
% - Percent
& - And
AD - Anno – Domini
AGM - Annual General Meeting
ANZ - Australia and Newzeland
BI - Banking Index
BoK - Bank of Kathmandu Limited
CB - Commercial Bank
Co. - Company
CS - Common Stock
CV - Coefficient of Variance
DPS - Dividend per Share
EBL - Everest Bank Limited
EPS - Earning Per Share
FY - Fiscal Year
HBL - Himalayan Bank Limited
Jr. - Junior
Ltd - Limited
MPS - Market Price per Share
Mr. - Mister
NABIL - Nabil Bank Limited
NEPSE - Nepal Stock Exchange.
NFR - Nominal-risk Free Rate
NI - Nepse Index
NIBL - Nepal Investment Bank Limited.
OI - Others Sector Index
P/pp - Page
R - Realized Rate of Return

RFR - Real-risk Free Rate
Rs - Rupees
SCBL - Standard Chartered Bank Limited
SD - Standard Deviation
TU - Tribhuvan University
US$ - United States Dollar
USA - United States of America

TABLE OF CONTENTS Acknowledgement
Table of Contents
List of Tables
List of Figures
Abbreviations
Page No.
CHAPTER – I INTRODUCTION
1.1 General Background of the Study 1
1.1.1 Concept of Risk and Return 3
1.1.2 Commercial Banks 4
1.2 Significance of the Study 5
1.3 Statement of the Problem 5
1.4 Objectives of the Study 6
1.5 Scope of the Study 6
1.6 Limitations of the Study 7
1.7 Organization of the Study 7
CHAPTER – II LITERATURE REVIEW
2.1 Conceptual Review (Book Review) 9
2.1.1 Investment 9
2.1.2 Common Stock 10
2.1.3 Relationship between Risk and Return 10
2.1.4 Sources of Risk 11
2.1.5 Expected Rate of Return 13
2.1.6 Required Rate of Return 14
2.1.7 Determinants of the Required Rate of Return 14
2.1.8 Types of Risk 15
2.1.9 Measurement of Risk and Return 16
2.1.10 Concept of Co-variance 17
2.2 Reviews from Journals and Articles 17
2.3Reviews from Thesis and Reports 20
2.4 Others 22
CHAPTER – III RESEARCH METHODOLOGY
3.1 Research Design 24
3.2 Population and Sample 25
3.3 Sources of Data and Data Collection Techniques 25
3.4 Tools for Analysis 26
3.4.1 Market Price of Share 26
3.4.2 Dividend 26
3.4.3 Return on Common Stock Investment 27
3.4.4 Expected Return of Common Stock 28
3.4.5 Standard Deviation 28
3.4.6 Coefficient of Variance 29
3.4.7 Beta 29
3.4.8 Correlation Coefficient 30
3.4.9 Return on Market 30
3.4.10 Portfolio Risk and Return 30
3.4.11 Portfolio Return 31
3.4.12 Portfolio Risk 31
3.4.13 Portfolio Beta 32
3.5 Method of Analysis and Presentation 32
CHAPTER – IV DATA PRESENTATION AND ANALYSIS
4.1 Nabil Bank Limited (NABIL) 33
4.1.1 Introduction 33
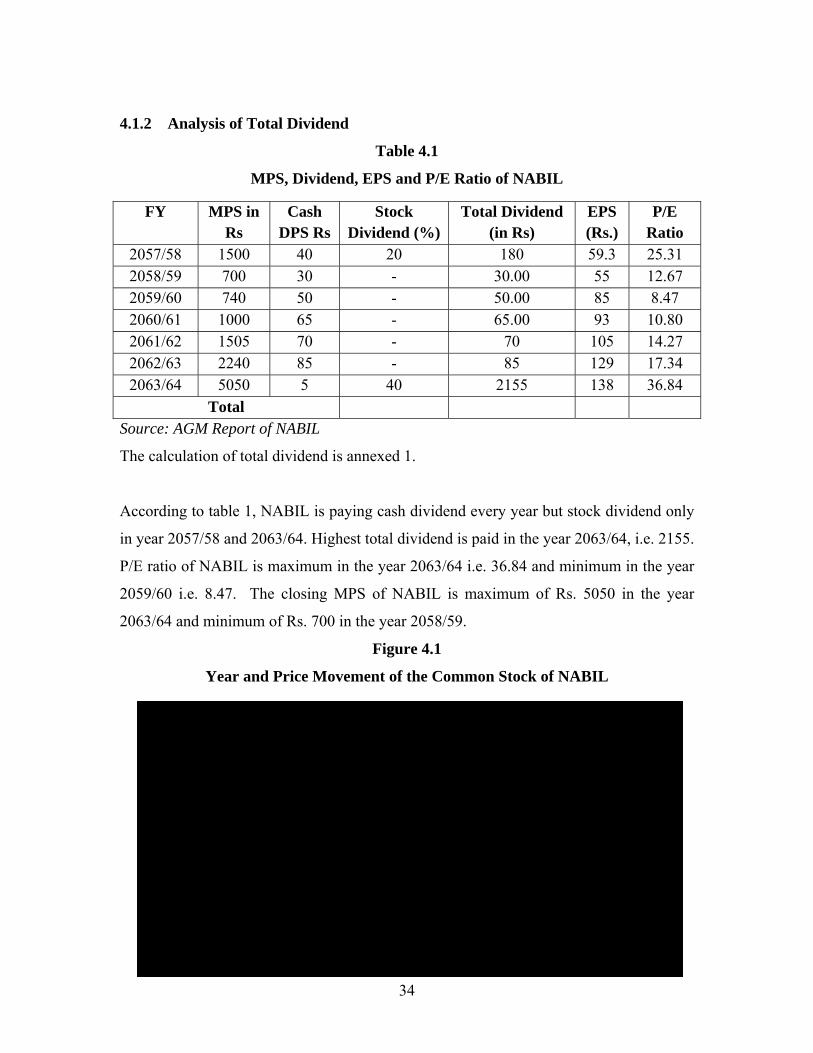
4.1.2 Analysis of Total Dividend 34
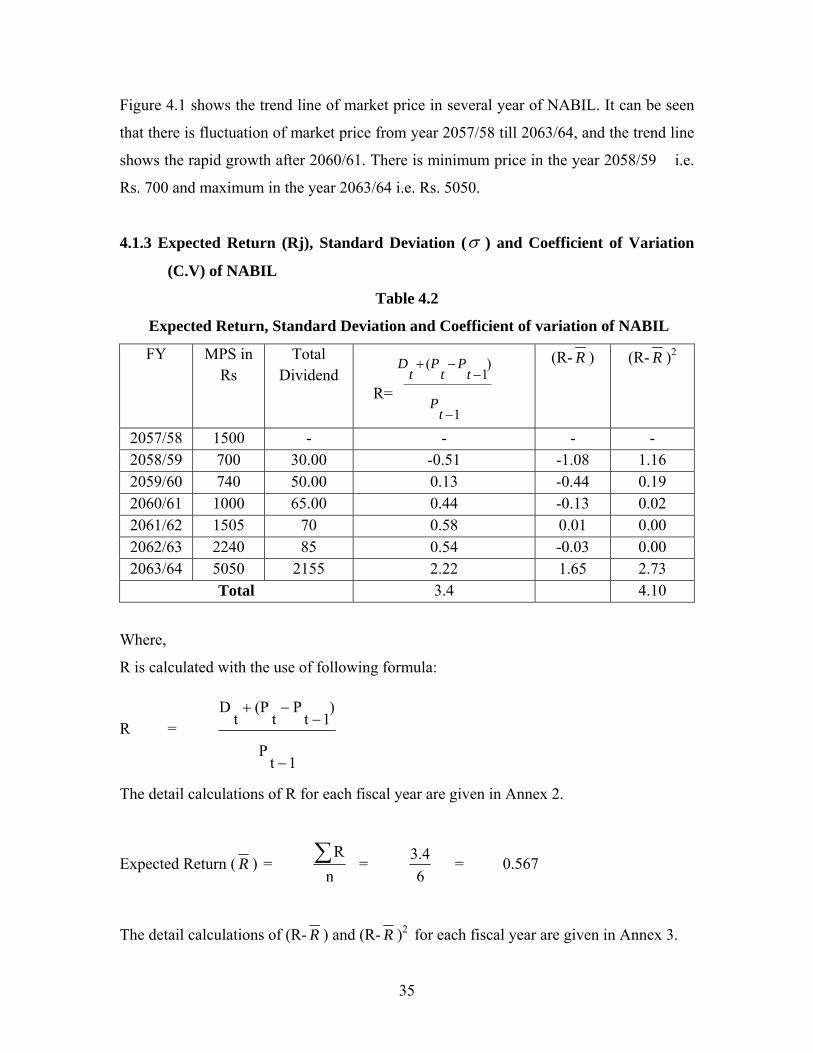
4.1.3 Expected Return, Standard Deviation and Coefficient of Variation of NABIL 35
4.2 Nepal Investment Bank Limited (NIBL) 37
4.2.1 Introduction 37
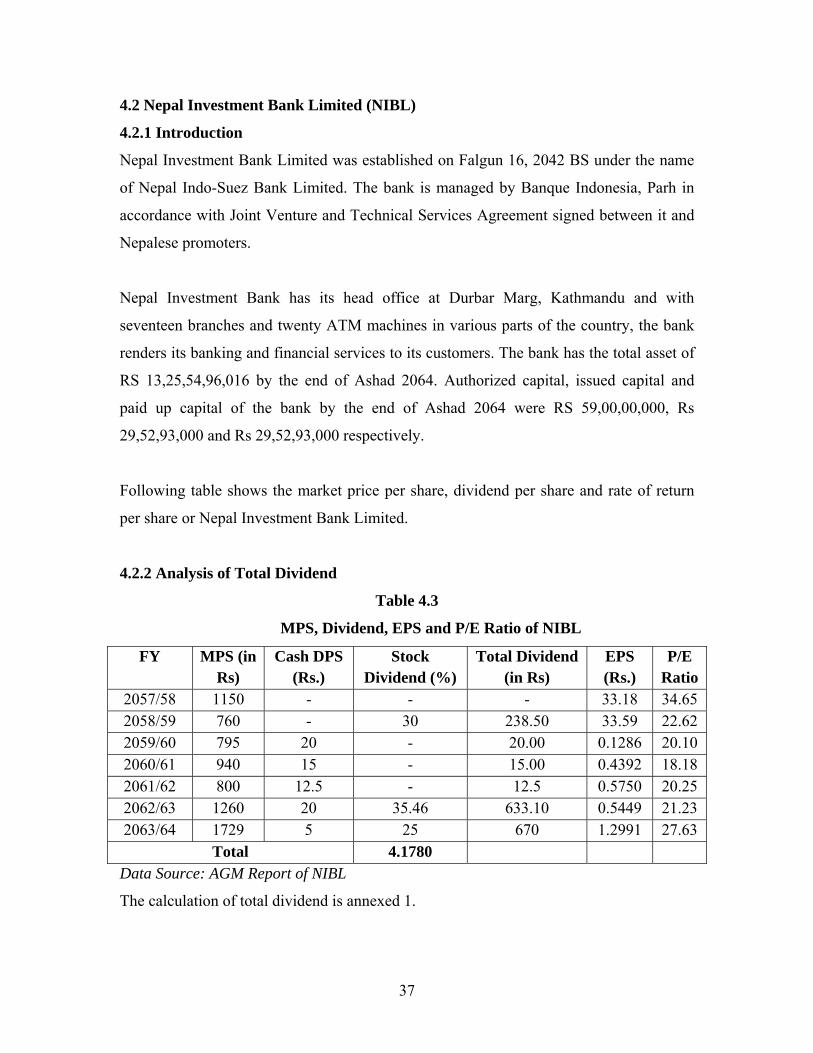
4.2.2 Analysis of Total Dividend 37
4.2.3 Expected Return, Standard Deviation and Coefficient of Variation of NIBL 39
4.3 Standard Chartered Bank Limited 40
4.3.1Introduction 40
4.3.2 Analysis of Total Dividend 42
4.2.3 Expected Return, Standard Deviation and Coefficient of Variation of SCBL 43
4.4 Himalayan Bank Limited 45
4.4.1 Introduction 45
4.4.2 Analysis of Total Dividend 45
4.4.3 Expected Return, Standard Deviation and Coefficient of Variation of HBL 47
4.5 Everest Bank Limited 48
4.5.1 Introduction 48
4.5.2 Analysis of Total Dividend 49
4.5.3 Expected Return, standard Deviation and Coefficient of Variation of EBL 50
4.6 Bank of Kathmandu Limited 52
4.6.1 Introduction 52
4.6.2 Analysis of Total Dividend 53
4.6.3 Expected Return, Standard Deviation and Coefficient of Variation of BOK 54
4.7 Comparison of Expected Returns, Standard Deviation and the
Coefficient of Variance between the Sampled Banks 55
4.8 Realized Returns, Standard Deviation and Expected Return of the Banking Sector 57
4.9 Study of Co-variance and Beta Coefficient of the Commercial
Banking Sector with that of Market (NEPSE) 58
4.9 Major Findings of the Study 60
CHAPTER – V SUMMARY, CONCLUSION AND RECOMMENDATIONS
5.1 Summary 61
5.2 Conclusion 63
5.3 Recommendations 63
Bibliography
Annexure
LIST OF TABLES
Table No. Title Page No.
4.1 MPS, Dividend, EPS and P/E Ratio of NABIL 34
4.2 Expected Return, Standard Deviation and Coefficient of variation of NABIL 35
4.3 MPS, Dividend, EPS and P/E Ratio of NIBL 37
4.4 Expected Return, Standard Deviation and Coefficient of variation of NIBL 39
4.5 MPS, Dividend, EPS and P/E Ratio of SCBL 42
4.6 Realized Rates of Return, Expected Return and S. D. of SCBL 43
4.7 MPS, Dividend, EPS and P/E Ratio of HBL 45
4.8 Expected Return, Standard Deviation and Coefficient of variation of HBL 47
4.9 MPS, DPS and P/E Ratio of EBL 49
4.10 Expected Return, S. D and CV of EBL 50
4.11 MPS, DPS and P/E Ratio of BOK 53
4.12 Expected Return, Standard Deviation and Coefficient of Variation of Bok 54
4.13 Expected Return, Standard Deviation and Coefficient of Variance of the
Sampled Banks 56
4.14 Realized Rates of Return, Expected Return and S. D. of Banking Sector 57
4.15 Expected Return, Standard Deviation and Coefficient of Variance of the
Market Index 58
4.16 Co-variance and Beta Coefficient of the Commercial Bank 59
LIST OF FIGURES
Figure No. Title Page No.
4.1 Year and Price Movement of the Common Stock of NABIL 34
4.2 Realized Rate of Return per Share of NABIL Bank Limited 36
4.3 Year and Price Movement of the Common Stock of NIBL 38
4.4 Rate of Return of Nepal Investment Bank 40
4.5 Year and Price Movement of the Common Stock of SCBL 43
4.6 Realized Rate of Return of Per Share of Standard Chartered Bank Limited 44
4.7 Year and Price Movement of the Common Stock of HBL 46
4.8 Annual Rate of Return of Himalayan Bank Ltd. 48
4.9 Year and Price Movement of the Common Stock of EBL 49
4.10 Annual Return of EBL 51
4.11 Year and Price Movement of the Common Stock of BoK 53
4.12 Rate of Return of Bank of Kathmandu 55
4.13 Expected Return, Standard Deviation and Coefficient of Variance of the
Sampled Banks 56

1
CHAPTER - I
INTRODUCTION
1.1 General Background of the Study
With the per capita income of US$ 250 per annum, Nepal represents one of the poorest
countries in the world. Despite per capita growth rates averaging 2.2 percent per annum
in the last decade, poverty reduction in Nepal has been much slow.
A sustained and self reliant growth of any economy is much more fueled by the
development of the capital market that mobilizes the saving of the people and provides it
at the disposal of the spending units like the central government, state, local bodies,
statutory corporation etc. together with the business enterprises and individuals to meet
their regular and planned development expenditures including that for expansion,
diversification and modernization of their existing enterprises or for setting up of new
ones. This case is very much true even in case of Nepal to lift up her economy.
Among the capital market too, the role of the security market is much immense that
offers a platform for the transaction of securities like government bond, corporate bond or
debentures, ordinary shares, preference shares, mutual funds etc.
In Nepal, the establishment and operation of Security Marketing Center in the year 1976
had geared up the issue of securities, which was later converted into the Stock Exchange
Center. The Security Exchange Act had been enacted only in 1983 AD but it was only in
the year 1993 AD that Security Exchange Center was converted into Nepal Stock
Exchange, in short NEPSE.
According to the Security Exchange Act 1983, each and every company wishing to
transact their shares in the market must list up their shares in the Nepal Stock Exchange.
"Until the end of the year 2001, 115 companies had been listed their securities in the
NEPSE with the market capitalization of Rs 46349.4 millions. However, by the end of

2
the year 2007, only 135 companies have been listed, with the market capitalization of Rs.
35240.4 millions".
Among the listed securities in the NEPSE, Commercial Banks dominates the position in
terms of the paid-up value with Rs 4856.16 millions paid-up value of commercial banks
shares being listed by the end of the year 2004. Commercial banks also occupy the major
portion among the listed companies on the basis of amount traded, number of transaction,
market capitalization etc.
A rational investor will also try to maximize the value of his/her investment. For this
he/she has to invest in securities only after evaluating their risks and returns.
The returns from holding an investment over some period say a year is simply any cash
payments received due to ownership, plus the change in market price, derived by the
beginning price.
"Of all the forms of securities, common stocks appear to be the most romantic. While
fixed income Investment Avenue may be more important to most of the investors, equity
shares seem to capture their interest the most due to the potential reward and penalties
associated with equity. Shares make them an interesting even exciting proposition, no
wonder; equity investment is a favorite topic for conversation in parties and get-
togethers."
Generally, investors are risk averse who always seek higher return for more risk as risk
premium. So, the primary problem in investment is to identify the security, which has
low risk and high return.
Investors generally do not invest their money in the only risky asset. The investor should
invest their money in portfolio of many assets. It will help to the investor to minimize the
risk. Therefore, an investor is concerned with the portfolio risk, which is the sum of the
relevant risk of individual assets included in portfolio. The revenant risk of an asset is
3
defined as the portion of its total risk that changes proportionately with market risk. Some
stocks are riskier than other and even in years when the overall money into one stock
goes down. Therefore, putting all your money into one stock is extremely risky. The
single best weapon against risk is diversification.
In Nepalese context, most of the potential investors and the shareholders themselves
have understood least about the risk- return behavior of the stocks. And they hardly
bother to know about these aspects before making investment in securities. Most of the
general Nepalese investors invest only in a single security and that too without any
analysis of risk and return. Their investment would not be grounded on any logic that
helps to reduce the overall risk and maximize the overall return. Hence, the analysis of
risk and return of individual stock and the industry together with their relationship with
stock price of other industries and NEPSE index should be well analyzed and studied for
the proper investments in stocks. Many investors are afraid to invest in stocks. People
participation in securities investment and its dynamic trading plays a vital role in overall
economic development. For this purpose potential investors must be able to analyze risk
and return of individual stock and portfolio as well. This will increase their confidence
and ultimately increase the degree of market efficiency, which is essential to spread
economic development of the nation.
1.1.1 Concept of Risk and Return
"Risk, defined most generally is the probability of the occurrence of unfavorable
outcomes. But risk has different meanings in different context. Two measures developed
from the probability distribution have been used as initial measures of return and risk.
These are the mean and the standard deviation of the probability distribution."
Risk is related to the future uncertainty. Risk is defined in Webster's as "a hazard; a peril;
exposure to loss or injury." Thus, "risk refers to the chance that some favorable event
occurs. It is a quantity presented in terms of statistical values. There is risk in skydiving
that is risk of life; risk in bet on horses and again in investment on speculative stocks that
is the risk of losing money or investment. Risk is an important element since investments
with greater risk require a higher return than investment with lower risk."
4
The return is income received on an investment, which is expressed as dividend, plus any
change in market price of share and usually expressed in percent. Again return is the
income received on an investment which is expected as dividend, plus any change in
market price of the share (MPS) and usually expressed in percent. There may be
occasions when actual return on the investment may vary from the expected return. This
variability of returns from those that are expected is defined as risk. The greater the
variability, the riskier the securities is said to be. The return is a reward from investment.
It may include both the current income and capital gains or losses that arise by the
increase or decrease of security price. Generally, investors invest in seek of returns.
Investors may like returns and dislike risk. People will invest in riskier assets only if they
expect to receive higher returns. A return along with risk is considered as two sides of the
business coin.
Thus, return is anything that an investor wants for his investment. It is the positive
outcome for his good decision making. An investment in an asset may have positive,
negative or zero returns. An asset would have positive return when an investor gains
something in terms of cash or other assets. Similarly an asset would have negative return
when an investor loses his cash or asset. When there is neither increase nor decrease of
assets due to the investment, the return is obviously zero.
1.1.2 Commercial Banks
A bank is a business organization that receives and holds deposit funds other, makes
loans and extends credit and transfers funds by written order deposit. According to Nepal
Commercial Banks Act 2031 B.S. “ A Commercial Bank refers to such type of bank
other than specified banks related to cooperative, agricultural, industrial and other which
deals in money exchange, accepting deposits and advancing loans etc.” (Commercial
Bank Act; 2031:25). Commercial banks are those financial institutions deal in accepting
deposits to persons and institutions and giving loans against securities. They provide
working capital needs of trade industry and even to agricultural sectors. Moreover
commercial banks also provide technical and administrative assistance to industries, trade
and business enterprises. They transfer monetary source from saver to users. In addition
5
to above, the main purpose is to uplift the backward sector of economy. Commercial
banks are organization on a joint stock company system, primarily for the purpose of
earning profit.
“Commercial bank is a corporation which accepts demand deposits subject to check and
makes short term loans to business enterprises, regardless of the scope of its other
service.”
In this way commercial banks are those banks, which are engaged in commercial banking
transaction. It develops saving habits in people. CB’s plays vital role for development of
a developing country. In Nepalese context, commercial banks have comparatively good
performance among the public limited companies. Because most of the banks are counted
within the top ten positions among the listed companies on the basis of amount traded,
number of transaction, market capitalization etc. As a public limited company, Nepal
Bank Limited is only one Nepalese commercial bank, which is listed in NEPSE.
1.2 Significance of the Study
• The study will be helpful for investors as well as commercial banks in Nepal.
• It provides the consolidated basic data and information about the NEPSE and
commercial banks under study.
• This study will cover the investors’ perception upon the risk and return factors
while investing in common stocks of commercial banks.
• It will provide the brief information on risk and return from the investors’
perspectives.
1.3 Statement of the Problem
• It has been more than a decade since the establishment of Nepal Stock Exchange.
The number of companies being listed has been increased tremendously.
• People's interest in investing on shares has also been growing. But the pour of
money on stocks has been much guided by the mere interest rate than the very
concept of the investment.
6
• General people who invest in shares have less or even no reason on why they have
invested in the particular shares.
• When people invest in more than one share and create a portfolio, they don't have
any answer on why they are investing in the shares of particular companies. Market
rumors and influence of friends used to be major reasons of many people's
investment in many a case.
Thus, there is less study of risk and return analysis of the stock. People are more willing
to invest their savings in shares of commercial banks but they don't know what
relationship is there between the portfolio return of the common stocks of commercial
banks and overall market portfolio return. They hardly bother to understand what relation
exists between portfolio beta of the commercial banks and market beta. Thus, lack of
proper analysis of risks and returns of stocks before investing on them is the major
problem of Nepalese stock market.
1.4 Objectives of the Study
The primary objective of the present study is to analyze the risk and return of listed
commercial banks in Nepal. The specific objectives of the proposed study are as follows:
a. To study the risk and return of the sampled commercial banks ( 6 out of 27 banks)
and also analyze their coefficient of variance.
b. To perform the comparative analysis of the risk and return on the common stocks of
the selected banks.
c. To find out how sensitive the stock price of the selected commercial banks and the
banking sector as a whole with that of the NEPSE.
d. To provide the valuable suggestions about the risk and returns on stocks of the
commercial banks that could be the deciding factors for the investors in their
investment.
1.5 Scope of the Study
The study mainly focuses on the risk and return analysis of the stocks of the commercial
banks. Thus the stocks of 8 listed commercial banks are taken as the sample for the study.
7
But the stocks of all the listed banks and other companies in NEPSE are considered as
population and data related to them are used in obtaining the market risk and return
situation.
Again, the data of the last seven years has been utilized to run this study. The proposed
study has not only explored the major outcomes on the risk and return behaviors of the
sampled banks but has also studied their current relation with the risk and return of the
stocks of the commercial banks as a whole and with the overall market portfolio. Finally,
it has given some recommendations useful for future investment.
1.6 Limitations of the Study
The present study has undergone various constraints and limitations. The major
limitations of this study are as below.
1. There are 27 commercial banks in Nepal that are in operation, among them 18
banks are listed in NEPSE. Only six joint-venture commercial banks are taken for
study and other banks are ignored by the study.
2. The study has analyzed the risk and return of the banks only taking the last seven
fiscal years from 2057/58 to 2063/64.
3. The study is basically concerned only with the risk and return of the listed
commercial banks i.e., other aspects of the banks have not been taken under
consideration.
4. The study has made recommendations without being focused on the future
uncertainties. Only the historical data are judged for arriving at the conclusions.
1.7 Organization of the Study
The study has presented the systematic presentation of the research design, analysis,
presentation and findings of the study. It has divided into five chapters
Chapter -I: Introduction
The first chapter of the study is introduction, which highlighted the basic information of
the research area, various problems, objectives, importance, limitations and organization
of the study.
8
Chapter - II: Review of Literature:
The second chapter of the study assures readers that they are familiar with important
research that has been carried out in similar areas by earlier scholars in related areas. It
also establishes that the study as link in a chain of research that is developing and
emerging knowledge about concerned field.
Chapter - III: Research Methodology
The third chapter refers to the various sequential steps to be adopted by a researcher in
studying a problem with certain objectives in view. It describes the various research
methods (i.e. research design, source of data, data collection techniques, data collection
methods).
Chapter - IV: Data Presentation and Analysis
The developed information has finished in required form in fourth chapter. Information is
presented and analyzed (i.e. both primaries as well as secondary source) by using various
financial and statistical tools in specified form to meet the stated objective of study.
Chapter - V: Summary, Conclusion and Recommendations
On the basis of the results from data analysis, the researcher concluded about the research
work. Besides, it also gives important suggestions to the concerned organization for
better improvement.

9
CHAPTER - II
LITERATURE REVIEW
On the ground of the research topic, this chapter shows a competent exploration of the
background to the work and a comprehensive review of the relevant literature. In this
regard, basic academic course books on finance, recently published books especially
related to the topic, and relevant articles from some of the major research based journals
and newspapers are reviewed.
Review of literature includes the following topics:
2.1 Conceptual Review (Book Review)
2.2 Review from Journals
2.3 Review from Other Thesis
2.4 Others
2.1 Conceptual Review (Book Review)
Central focus of the finance is trade off between risk and return. Varieties of books are
available that deal with the theoretical aspect on this matter. Here, the relevant subjects of
some of the well popular and worldwide accepted books are reviewed.
2.1.1 Investment
In general sense, investment means to pay out money to get more but in the broadest
sense, investment a present commitment for the future benefits. While the commitment
takes place with certainty, the future benefits are shrouded in uncertainty. The uncertainty
creates risk to investors and they desire to minimize such risks.
Therefore, taking decision about proper investment is crucial to the investor and it
requires a specific investment decision process, analysis of securities, identification of
overpriced, under priced securities, making appropriate investment strategies as well as
construction of efficient portfolio.
10
Investment is concerned with the management of an investor’s wealth, which is the sum
of current income and the present value of all future income. The term investment is
conceptualized as income, saving or other collected fund. It covers wide range of
activities. It is commonly known fact that an investment is possible only when there are
adequate saving. Therefore both saving and investment are interrelated (Fisher and
Jordan, 1995:104).
2.1.2 Common Stock
Common stock is a form of corporate equity ownership, a type of security. It is called
"common" to distinguish it from preferred stock. In the event of bankruptcy, common
stock investors receive their funds after preferred stock holders, bondholders, creditors,
etc. On the other hand, common shares on average perform better than preferred shares or
bonds over time.
Common stock is usually voting shares, though not always. Holders of common stock are
able to influence the corporation through votes on establishing corporate objectives and
policy, stock splits, and electing the company's board of directors. Some holders of
common stock also receive preemptive rights, which enable them to retain their
proportional ownership in a company should it issue another stock offering. Additional
benefits from common stock include earning dividends and capital appreciation.
Common stock is recipient of the residual income of the corporation. Through the rights
to vote, holders of common stock have legal control of the corporation. An element of
high risk is involved with common stock investment due to its low priority of claims at
liquidation. When investors buy common stock they receive certificate of ownership as a
proof to their being part of the company. The certificate states the number of shares
purchased and their value per share” (Bhalla, 1997:196).
2.1.3 Relationship between Risk and Return
The expected return from any investment proposal will be linked in fundamental
relationship to the degree of proposed risk. In order to be acceptable a higher risk

11
proposal must offer a higher forecast return than lower risk proposal (Hampton
1996:341).
“The observe difference in both the levels and variability of the rate of return across
securities are indicative of the underlying risk and return in the market” Generally, there
is a positive relationship between rate or return and risk. It means an investor can usually
attain more return by selecting dominant assets that involve more risk. While it is not
always true that a riskier asset will pay a higher average rate of return, it is usually in
practice. The reason is that investors are risk averse. As a result, high-risk assets must
offer investors’ high return to induce them to make the riskier investment normally;
investors are likely to prefer more return and less risk. It means investors will not choose
an investment that guarantee less return when investments promising higher returns in the
same level of risk class are readily available (Loric, Dodd and Kempton, 1985:1029).
2.1.4 Sources of Risk
An investment is commitment of money that is expected to generate addition money.
Every investment entails some degree of risks. A major objective of financial institution
is to increase the returns for its owner by taking minimum risk. The effective
management of the risk is central to its performance. Indeed, it can be argued that the
main business function of financial institution is managing these risks through the
consumption of maximum time and efforts in understanding and managing the various
source and kinds of risks factors with its different natures and complexities (Francis, Jack
Clark, 1995: 23).
The primary risks factor that create investments uncertainties are as follows:
a. Interest Rate Risk
Asset transformation function is the key functions of financial institution. It involves
buying primary securities or assets and issuing secondary securities or liabilities to fund
assets purchase. The primary security purchased by financial institutions often has
maturity and liquidity characteristics which are different from those of secondary security
that financial institutions sell. In mismatching the maturities of asserts and liabilities as
part of their asset transformation function (Francis, Jack Clark, 1995: 23).
12
b. Bull-Bear Market Risk
Market risk is incurred in the trading of assets and liabilities due to changes in market
forces like interest rates, exchange rates. Furthermore, market risk is the risk related to
uncertainty on the earning on its trading portfolios caused by changes in the market
condition. The various market forces make securities price upward and downward. The
upward trend of market price (Bull Market) and downward trend of market price (Bear
Market) create a long lasting source of investment at risk. (Francis, Jack Clark, 1995: 24)
c. Credit Risk
It is also called default risk. Default risk is probability that the borrower is unable to
fulfill the term promised under the loan agreement. It is that portion of investments total
risks that result from changes in the financial integrity of the investment (Francis, Jack
Clark, 1995: 24).
d. Liquidity Risk
Liquidity risk is sudden surges in liability withdrawal may leave as financial institution in
a position of having to liquidate assets in a very short period of time and at low prices.
Liquidity risks arises when its liability holders such as depositor or insurance policy
maker etc demand immediate cash for the financial claim they hold with financial
institution or when holders of loan commitment or credit line suddenly exercise their
right to borrow or draw down their right of loan commitments that situation financial
institution s must either borrow addition funds or sell assets to meet the demands for the
withdrawal of funds (Francis, Jack Clark, 1995: 24).
e. Call-Ability Risk
Some bonds and preferred stocks are issued with a provision that allows the issuer to call
them in for repurchase. Issuer like the call provision because it allows them to buy back
outstanding preferred stock and/on bond with funds from a newer issue if market interest
rate drop below the level being paid on the outstanding securities. There is chance of
creating call-ability risk (Francis, Jack Clark, 1995: 24).
13
f. Convertibility Risk
Call ability risk and convertibility risks are in two aspects. First both are contractual
stipulations that included in the term of original security issue. Second, both of these
provisions alter the variability of return from the affected security. Convertibility risk is
that portion of the variability of return from a convertible that the investment may be
converted into the issuer’s common stocks at a time or under terms to the investor’s best
interest (Francis, Jack Clark, 1995: 24).
g. Industrial Risk
An industry may be viewed as a group of companies that compete with each other to
market homogeneous products. Industry risk is that portion of risk that can be an
investment variability of return caused by events that affects the product and firms that
make up an industry (Francis, Jack Clark, 1995: 24).
h. Political Risk
Political risk arises from the exploitation of a politically weak group for the benefits of
politically strong group, with the efforts of various groups to improve their relative
positions increasing the variability return from the affected assets. Regardless of whether
the changes that cause political or by economic interests, the resulting variability of
return is called political risk (Francis, Jack Clark, 1995: 25).
i. Other Risk
Beside these above mentioned risks, there are other risks like off balance sheet risk,
technological and operational risk, country and sovereign risk, insolvency risk etc
(Francis, Jack Clark, 1995: 25).
2.1.5 Expected Rate of Return
The future is uncertain. Investors do not know with certainty whether the economy will
be growing rapidly or be in recession. As such, they do not know what rate of return their
investments will yield. Therefore, they base their decisions on their expectations
concerning the future.
14
The expected rate of return on a stock represents the mean of a probability distribution of
possible future returns on the stock. "It is the rate of return to be realized from an
investment, the weighted average of the probability distribution of possible assets. Thus
the expected rate of return for any asset is the weighted average rate of return, using
probability of each rate of return as the weight” (Brigham, Eugene F., Houston, Joel F,
1996:159).
2.1.6 Required Rate of Return
The required rate of return is the minimum rate of return (expressed as a percentage) that
an investor requires before investing capital. The degree of risk associated with an
investment is reflected in the required rate of return. Investors and analysts often use the
required rate of return as a discount rate for future cash flows from an investment. For
many investors, a beginning point in stock valuation is calculating the required rate of
return. On occasion, the required rate of return is confused with the internal rate of return.
“The capitalization or the discount rate is defined as the required rate of return. It is the
minimum rate expected by the investors to buy or hold a security." The required rate of
return is composed of a risk-free interest rate and a risk premium rate (Sheridon, Titman
& Grinblantt, Mark, 1998:105).
2.1.7 Determinants of the Required Rate of Return
1. Real Risk –Free Rate (RFR)
The risk-free interest rate is the interest rate that it is assumed can be obtained by
investing in financial instruments with no default risk. It is the basic interest rate if there
were no uncertainty at all about the future, also called pure time value of money. RFR
depends on the preference individual have for current consumption over future
consumption and the set of investment opportunities in the country (Van Horne,
1997:205).
2. Nominal Risk Free Rate
It is the interest rate obtained after the adjustment of expected inflation and supply and
demand aspect of funds (Van Horne, 1997:205).
15
2.1.8 Types of Risk
The total variance of the rate of return is the sum total of various risks which are
primarily classified into two types.
i. Systematic Risk
ii. Unsystematic Risk
Hence, Total Risk = Systematic Risk + Unsystematic Risk
i. Systematic Risk
It refers to that portion of the variability of an individual security's return caused by
factors affecting the market as a whole as such it can be thought of being non-
diversifiable. It is because of this that it is also called market risk or relevant risk. The
systematic risk is market related. In other words, it arises from the changes in the
economy and market condition. For example, high inflation, recession, impact of political
factors, wars, depression, long term changes etc which are beyond the control of
company management. It affects all the firms in the market. The systematic risk is
rewarded in the form of risk premium, Sometimes; systematic risk is called market risk.
Systematic risk affects almost all assets in the economy, at least to some degree, whereas
systematic risk affects at a small number of assets. The principle of diversification has an
important implication to a diversified investor, only systematic risk matters. Systematic
risk accounts for 25% to 50% of the total risk of any security. Some of the sources of
systematic risk include
a. Interest rate changes
b. Changes in purchasing power
c. Changes in investor's expectation about the overall performance of the economy.
Because diversification cannot eliminate systematic risk, this type of risk is the
predominant determinant of the individual security risk premium. This risk is also called
beta risk (Weston and Brigham, 1982:89).

16
ii. Unsystematic Risk
It is also called diversifiable risk or company specific risk or unavoidable risk. It is such a
risk which is unique to the firm. The unsystematic risk is non market factors related. In
other word, it arises from the project specific factors. This portion of risk is possible to
reduce or eliminate through diversification of their investments. It is inherent individual
companies or projects. It is the variability in the security's return caused by such factors
as:
a. Management capability and decisions
b. The availability of the raw materials
c. Strikes
d. The unique effects of government regulations such as pollution control
e. The effect of foreign competition
f. The particular levels of financial and operating leverage of the firm employees.
(Weston and Brigham, 1982:89)
2.1.9 Measurement of Risk and Return
i) Standard Deviation
Any measure of risk has a definite value and for this, the measure of the tightness of the
probability distribution is necessary. The tighter the probability of expected future return,
the smaller the risk of a given investment.
One such measure of risk is the use of standard deviation, the symbol for which is σ
pronounced "sigma". The smaller the standard deviation, the tighter the probability
distribution and accordingly, the lower is the risk of the stock.
The larger the standard deviation, the more variable is an investment's returns and the
riskier is the investment. A standard deviation of 0 indicates no variability and thus no
risk (Van Horne, 1997:38).
ii) Coefficient of Variation
The coefficient of variation shows the risk per unit of return, and it provides a more
meaningful basis for comparison when the expected returns on two alternatives are not
the same.

17
If a choice has to be made between two investments which have the same expected
returns but different standard deviation, most people would choose the one with the lower
standard deviation and therefore same risk. Similarly given a choice between two
investments with the same risk but different expected returns, investors would generally
prefer the investment with the higher expected return. Investors want as much returns as
little risk as possible and coefficient of variance helps to choose such investment or asset
(Van Horne, 1997:39).
2.1.10 Concept of Co-variance
The covariance is a measure of relatedness that depends on the units of measurement. For
example – the height of parents co-varies positively with the height of their children.
However, the size of the covariance will differ depending on which unit the height is
measured. The height measured in inches will be 144 times the covariance measured in
feet. For this reason, it is often convenient to employ a measure of relatedness that does
not depend on the unit of measure.
To compute a co-variance between two returns, it is necessary to pair each outcome for
one return with a corresponding outcome for the other return. The set of probabilities
attached to each pair is known as the joint distribution of the two returns. To compute a
covariance with the forward-looking approach, the probability weighted average of the
product of the two demeaned returns associated with each of the paired outcomes is
determined using the joint distribution (Weston and Brigham, 1980:336).
2.2 Reviews from Journals and Articles
Although, there are very less articles published about the risk and return analysis of
Nepalese commercial banks, some of the related articles published in national and
international newspapers and journals are extracted below.
"There is growing empirical evidence that multiple factors are cross-sectionally
correlated with average returns in the United States. Measured over a long time, stocks of
small firms earn higher average returns than that of the bigger firms. Fama French (1992,
1996) and Lakonishock, Shleifer and Vishny (1994) show that value/stocks with high

18
book-to-market, earning to price, on cash-flow to price outperform growth stocks with
low book-to-market, earning-to-price , on cash-flow to price. Moreover, stocks with high
return over the year continue to outperform stocks with poor prior performance. The
evidence that beta is also compensated for average returns is weaker.
The interpretation of evidence is strongly debated. Some believe that the premium are a
compensation for pervasive risk factors, others attribute them to firm characteristics or an
inefficiency in the way market incorporate information into prices. Yet others average
that the premiums may be biased by survivorship or data snooping.
Again from the perspective of collecting independent samples, emerging market
countries are particularly interesting because of their relative isolation from the capital
markets of other countries. Compared to the developed markets, the correlation between
most emerging markets and other stock markets has historically been low (Harvey, 1995)
and until recently many emerging countries restricted investment by foreign investors.
Interestingly, Bekaert and Harvey found that despite the recent trend toward abolition of
these restrictions and the substantial inflows of foreign capital, some emerging equity
markets have actually become more segmented from world capital markets. A large
portion of the equity capital of emerging economies is held by local investors who are
likely to evaluate their portfolios in light of local economies and market condition"
(Rouwenhorst, K. Greet 1999/1439-40).
"The share transaction in NEPSE is mostly dominated by commercial banks followed by
the finance companies in terms of number of share traded and transaction amount. The
faith of the investors in the shares of commercial banks is growing. As the commercial
banks are more and more diverse in their services, and with the new explore of
investment areas, the banks are earning more profit each year. This has positively
affected the investment of the investors.
However the investors seemed to have less willingness to find the long term
consequences of the banks' current investment. They also, do not understand the reason
behind the banks' growing profit amount. Without any proper analysis of risk and return
19
of these banks, it is possible that the investor's faith may collapse as the house of card in
the days ahead" (Ghimire, Vijay, The Kantipur Daily, 2007:5).
Akhigbe and Whyte (2004) in their research paper, ‘The Gram-Leach-Billey Act’ of
1999: Risk implications for the Financial Service Industry have focused on risk
implication of banking and private sectors. The research paper has included many other
studies some of the studies find that bank expansion into banking activities can affect
events that permitted only limited entry by banks into non banking activities. The study is
conducted on systematic, unsystematic and total risk, such risk are calculated by using
statistical tools i.e variance and standard deviation. The study has included 340 banks for
the sample size than they partition two sub-samples: 46 large banks and 294 small banks.
The major finding of the study is that evidence of a significant decline in systematic risk
for the banks securities firm and insurance companies but a significant increase in total
and unsystematic risk for the banks and insurance companies are less risk than other
securities business. If security wants to decline in risk, security firm can be explained by
their ability to diversify into less risky banking and insurance activities. The research
paper result suggests that regulators should carefully monitor and supervise banking
activities in new era of financial modernization to mitigate effects from the increase in
risk (Akhigbe and Whyte: 2004).
Pagano’s (2001) has a study on how theories of financial intermediation of corporate risk
management influence Bank risk taking behavior. This paper has based on the relation for
the risk taking and risk management behavior from a both corporate finance and banking
perspective. That data set covers the period from 1986-94, 1986-90 and 1991-94 but
overall time of study is nine year period. In this study, the research scholar has used
mathematical tools that are the standard deviation, total risk (systematic and unsystematic
risk), and interest rate risk. The main objective of the study is to examine the relation for
risk taking and risk management behavior for both corporate financial and a banking
perspective. After combining the theoretical insights from the corporate finance and
banking literatures related to hedging and risk taking the paper reviewed empirical tests
based on these theories to determine which of these theories are best supportive by the
20
data. Management incentives appear to be must consistently supported rational for
describing how bank manage risk. In particular, moderate/high levels of equity ownership
reduce bank risk while positive amount of stock option grants increase bank risk-taking
behavior. The empirical tests of theory of corporate risk management need to consider
individual subcomponents of total risk and the bank ability to trade these risks in a
component financial market (Pagano’s, 2001).
An article entitled “Expected Return, Realized returns and Assets Prising Tests” by
Edwin J Elton as journal of finance in the year 1999 is relevant to this study. In this he
pointed out the fundamental issues in finance like what the factors are that affect
expected return on assets, the sensitivity of expected return to those factors and the
reward for bearing this sensitivity. There is along history of testing in this area and it is
clearly one of the most investigated assess in finance.
Almost all of the testing being aware of using realized returns as a process for expected
returns. The sue of a average realized relies on a belief that information surprises tent to
out over the period of a study and realized returns are therefore an unbiased estimate of
expected returns. However he believes that there is ample evidence that this belief is
misplaced. There are period longer than 10 years during which stock market realized
returns are one average less than risk free rate (1973 to 1984). There are periods longer
than 50 years in which risk long term bond s on average under perform the risk free rate.
Having a risky asset with expected return above the risk less rate is an extremely weak
condition for realized returns to be and appropriate process for expected return, and 11
and 50 years is an awful longtime for such a weak condition not to be satisfied. In the
recent past, the United States has had stock market returns of higher than 30% per year
while Asian Markets have had negative returns (Elton, 1999:26).
2.3 Reviews from Thesis and Reports
Three theses has been reviewed in this section which seems to be little relevant with the
study. In a thesis submitted by Mr. Mohan Khatiwada in 1996, one of the objectives was
to analyze the stock market performance. In this aspect, the finding was – "interest rate so

21
ascertained by financial institution for the year 1995 ranges from 12% to 12.75% per
annum. As it is reviewed, commercial banks deposits accepted on fixed term carry 8% to
9.5% per annum interest rate in the same year.
Mohan Khatiwada (1996) in his study” Risk Analysis of commercial Banks” is related to
this study to some extent. Although interest rate on fixed deposit in an immediate return
was generated through savings, the return on securities cannot be exactly predicted. Some
of the companies yield on their securities investment is very low as compared to the
immediate return earned through fixed deposit.". But he had not stated the common stock
return in any exact figure.
About the market price movement of common stock, Khatiwada summarized that leaving
some exceptional cases aside, almost all the companies experienced their market price
going down by less than 50% in 1995. Even the banking group could not spare the share
price going down. More specifically, the year 1995 was a disheartening period for the
stock price. It is because, almost all the companies share price during the year were down
even in some cases below the face value. But the reason behind this deep declination in
prices was not mentioned in the thesis. The study had also not focused on the analysis of
individual security and the view point of the investors. (Khatiwada, Mohan MBA Thesis,
TU, Kathmandu 1996:88)
Another thesis by Jeet Bahadur Sapkota on "Risk and Return Analysis of Commercial
Bank" in 2001 is more relevant than the previous one. He had stated one of the objectives
as an analysis of the volatility of different stocks and other relevant variables that should
be considered while deciding investment in stocks. This objective is vague but in
findings, he had written that – "most of the Nepalese investors still invest on different
securities on the basis of expectation and assumption of individual security rather than
analysis of effect of portfolio. Again analysis of coefficient of variance and the
correlation analysis are seldom done for forming portfolio and making investment"
(Sapkota, Jeet Bahadur, MBA thesis, T.U., Kathmandu 2001:32).
22
He has also said that the portfolio between the common stock of the same industry cannot
reduce risk properly. So, portfolio should be so constructed that it reduces the overall risk
and increase the overall return and for this, the securities having negative correlation
should be selected.
A thesis report submitted by Sumita Shrestha, on "Stock Market and Investment" has
made a conclusion that "though the Nepalese investors in the last decade had grown
investment in the share of the commercial banks, development banks and finance
companies a lot, their investment decisions are merely depends upon rumors and baseless
expectations. A proper analysis of firm's financial positions and its potentiality of future
growth are not given much priority for the investment." It was noticed in her study that
there is a positive corelation between risk and return character of the company. Nepalese
capital market being inefficien, the price index itself is not sufficient to give the
information about the prevaling market. Situation and the company proper regualation
should be introduced so that there is more transparancy in issuancnce, sales and
distribution of the securities. Investors do not have any idea about the procedures of the
securities issuance. Neither company or the stock brokers transmit any information to the
investors about the current market situation and hence it becomes difficult for a common
investors to invest in the securities. Both government authorities and the stock exchange
regulator body should try to promote healthy practices so that the stock brokers do not
give false information to the investors for their personal benefit which is a common
practice in Nepal (Shrestha Sumita , MBA thesis, T.U., Kathmandu 2003:41).
2.4 Others
Very few independent studies can be found in the topics of finance. Specifically, it is rare
in the case of this research topic, risk and return analysis. However the available
independent studies which are related to the Nepalese stock market and about
shareholders are reviewed here.
The study carried out by professor Dr. Manohar Krishna Shrestha (1995) in the title of
“Shareholder’s Democracy and Annual General meeting feedback” is reviewed here. Dr.

23
Shrestha prefers to consider this book as assemblage of opinions which he had expresses
in different occasions of various annual general meeting here he has critically analyzed
the situation of common stock investors and the situation of common stock investors and
the situations that is not improving till date.
The content of the book have been divided into two parts. The first part includes views on
the rights of the shareholders regarding how they can exercise them in democratic
perspective , where as the second part consists of feedback and the issues raised by
shareholders art different annual general meeting of the public limited d companies and
financial institutions.
Writer has found the overall shareholders democracy in terms of the protection of their
interest, is basically focused on the payment of satisfactory wealth by appreciating the
value or share they hold.
In many cases the existing authoritarian mentality of management seems to have not
considered the shareholders in deciding managerial plans and policies. Top level decision
often by pass the interest of shareholders. As the management lacks serious concerns
about the protection of shareholders rights and expectations. The annual general meeting
has become a platform for shareholders to express their opinion and grievance in front of
the management and board of directors.
Many general meeting feedbacks reveal no serious response to the feelings of
shareholders. Thus it reflects unwillingness of the management and broad of directors to
change their traditionally held activities towards shareholders (Dr. Manohar Krishna
Shrestha, 1995:86).
24
CHAPTER - III
RESEARCH METHODOLOGY
This study has aimed to explore the risk and return aspects of various joint venture
commercial banks during the last seven years. Being focused on the commercial banking
sector, the study has done the comparative analysis between the commercial banking risk
and return with that of risk and return of the other sectors and also with the market. It has
also studied how sensitive the stocks of commercial banks with the NEPSE Index. And to
fulfill their objective, a systematic research methodology has been adopted, which has
been organized under the following heading.
1. Research Design
2. Population and Sample
3. Sources of Date and Data Collection Techniques
4. Specific Research Questions
5. Method of Analysis and Presentation.
3.1 Research Design
An attempt has been made in this paper to determine risk and return aspects of various
joint venture commercial banks. The study has adopted historical and analytical research
design. The data utilized are mostly secondary in nature. Some theoretical models have
been used and discussed to analyze return and risk characteristics of those commercial
banks. The research is based on historical data. For this purpose survey was conducted.
Survey is non experimental research design, classified as either descriptive or
exploratory, although there is no difference in classification. They are designed to obtain
information from sample population. Survey is conducted to obtain detail information of
existing variable by either structured questionnaires or structured (or unstructured
interviews). Collected data is simply explored by using some statistical tools. As most of
the data are quantitative, the research is based on scientific method. Detail analyses of
different variables have been made using both the financial and statistical tools. The raw
data have been arranged in the tables and various charts and bar-diagrams have been used

25
to clearly depict the data and findings. The period of study is between 2060/61 to
2063/64.
3.2 Population and Sample
The population of commercial banks would represent all the joint venture commercial
banks that have been listed in the NEPSE. The population of the study thus includes:
Nabil Bank Limited, Nepal Investment Bank Limited, Standard Chartered Bank Limited,
Himalayan Bank Limited, Everest Bank Limited and Bank of Kathmandu Limited.
However, due to the constraints of time and unavailability of data of some of the recently
established banks, only the first six joint-venture commercial banks are taken as the
sample, which have already been listed in the NEPSE during the period studied. The
selected banks taken for the study are:
a. Nabil Bank Limited
b. Nepal Investment Bank Limited.
c. Standard Chartered Bank Limited
d. Himalayan Bank Limited
e. Everest Bank Limited.
f. Bank of Kathmandu Limited.
3.3 Sources of Data and Data Collection Techniques
Nature of Data
All the data are secondary in nature and no primary data have been used in the study.
Secondary data are arranged in the respective tables and various analyses are done with
the use of financial tools applicable.
Sources of Data
Related data of respective banks are extracted from the various annual reports of the
banks under study. Data have also been taken surfing the websites of the respective
banks. The market price of share of the banks was taken from the publications of NEPSE.
Similarly, various publications of the banks and different articles published in the
26
newspapers and journals have been used as the source of the required material for the
study.
Data Collection Techniques
Data are secondary in nature as they are extracted from various annual reports and
websites of the commercial banks and NEPSE. Market price per share and dividend per
shares are taken through the annual reports of the banks whereas prices of different
stocks, NEPSE indices are collected from NEPSE. Data have also been collected through
various books and previous thesis and reports in libraries of different campuses.
3.4 Tools for Analysis
3.4.1 Market Price of Share (P)
One of the major data of this study is market price of the stock. Market price of stock for
a particular year should have represented the average price of the year, but for the sake of
simplicity, prices of the stock at the closing date of the fiscal years are taken as the
market price of stock for the particular years. And these data are taken from the annual
reports of the respective banks. Here in this study, each year closing price is taken as the
market price of stock which has specific time span of one year and the study has focused
in annual basis. To get the real average, volume and price of each transaction in the
whole year are essential which is tedious and impossible too, considering the data
availability and maintenance.
Market value in the secondary market is determined by the supply and demand factors
and reflects the opinion of investors and trader concerning the values of the stock closing
price is used as market price of stock because it is very difficult to obtain and include
these all information and average of high and low price may not be reliable and
representative information.
3.4.2 Dividend (D)
Dividend per share (including Bonus) provided under the major indicator section of the
respective banks have been used for the study. Dividend is the part of earning that is

27
distributed to the shareholders as a part of their investment. Dividend is return to equity
capital that consist price of time and price of risk taking by the investors. The total
amount of dividend out of earning available to the shareholder if distributed, the common
stock’s portion is said Dividend per share (DPS).
Symbolically DPS can be expressed as follows:
DPS= gOutstandin sharesCommon of No
Paid Dividend ofAmount Total
If company declares only cash dividend, there is no problem while taking the exact
amount of dividend that is relevant. But if the company declares stock dividend (bonus
share), it is difficult to obtain the amount that really shareholders has gained. In this case,
they get extra numbers of shares as dividend and simultaneously price of stock declines
as a result of increased number of stocks. To get a real amount of dividend following
model has been used through out.
Total Dividend Amount=Cash Dividend + Stock Dividend% X Next year MPS
3.4.3 Return on Common Stock Investment (R)
Return is income received on an investment plus any changes in the market price, usually
expressed as a percent of the beginning market price of the investment.
Symbolically,
R =
1tP
)1t
Pt
(Pt
D
−
−−+
Where;
R = Actual rate of return on common stock at time t.
Dt = Cash dividend received at time t.
Pt = Price of a stock at time t.
1−tP = Price of stock at time (t-1)

28
3.4.4 Expected Return of Common Stock ( )R
One of the main aims of the study is to determine the expected return on the investment
in the common stock. Generally, this rate is obtained by arithmetic mean of the past
years' return.
Symbolically,
( )jRE = jR = nR j∑
where,
( )jRE = jR = Expected rate of return on stock j
N = Number of years that the return is taken.
∑ = Sign of Summation.
3.4.5 Standard Deviation
It is a statistical measure of the variability of a distribution of return around its mean. It is
the square root of the variance and measure the unsystematic risk on stock investment. It
is widely used to measure risk from holding a single asset. It is also a statistical measure
of the variability of a set of observations. The standard deviation represents a large
dispersion of return and is a high risk and vice versa. The symbol is called (σ ) sigma. It
is the measure the total risk on stock investment.
Symbolically,
jσ = ( )
1
2
−
−
n
RR jj
where,
jσ = standard deviation of returns on stock j during the time period n.
Rj = Probability distribution of the observation
jR = Expected rate of return on stock j.
n = Number of years that the returns are taken

29
3.4.6 Coefficient of Variance (CV)
It is the ratio of standard deviation of returns to the mean of that distribution. It is a
measure of relative risk and return. It measures the risk per unit of return. It provides a
more meaningful basis for comparison when the expected returns on two alternatives are
not the same. The higher coefficient of variation, higher the risk.
Symbolically,
CV = j
j
R
σ
Where,
C.V. = Coefficient of variation of stock
jσ = standard deviation of returns on stock j.
jR = Expected rate of return on stock j.
3.4.7 Beta (ß)
It is an index of systematic risk. It measures the sensitivity of a stock's return on the
market portfolio. Higher the beta, higher the sensitivity and reaction to the market
movement. Beta coefficient of a particular stock will be less that equal or more than 1,
but the beta for market will be always 1.
Symbolically,
Beta j
B = ( )
2m
mj
σ
RCovR
where,
jB = Beta coefficient of stock j
Cov ( )mj RR = Covariance between jR and mR , and equal to
( ) ( )( )1n
RRRRRRCov
mmjjmj −
−−=
2mσ = Variance of market return.

30
3.4.8 Correlation Coefficient
Correlation coefficient is the relationship between two variables where one variable is
independent and other variables are dependent. Two variables are correlated when they
are related that the change in the value of one variable is accompanied by change in the
value of other. Correlation may be positive of negative. It always lies in the range of +1
to -1. A positive correlation coefficient indicates that the returns from two securities
generally move in the same direction or vice-versa. If return on two securities is
negatively correlated which combined in portfolio reduces the risk. If securities are
positively correlated risk cannot be reduced. Correlation is used to test the significant
relationship between risk and expected return. It can be calculated as follows.
Covj= iσ jσ ρij
ijρ =( )σiσj
Covij
Where iσ and jσ are the standard deviations of returns for assets I and j and pij is
correlation coefficient for asset I and j
3.4.9 Return on Market
It is the percentage increase in NEPSE index. Market return is the average return of the
market as a whole.
Rm=
Where,
∑ = sign of summation.
Rm=Market return
N=Number of samples period
3.4.10 Portfolio Risk and Return
Portfolio is combination of individual or a group of assets. Investors have different types
of investment opportunity but they have limited resource for investment so that investors

31
have to choose that investment opportunity which maximizes return for a given level of
return. Thus the combination of these investments is called portfolio.
3.4.11 Portfolio Return
The expected return on a portfolio is simply the weighted average of expected returns on
the individual assets in the portfolio with weights being the fraction of the total portfolio
invested in each asset.
E(Rp) = Wi E(Ri)+Wj E(Rj)
Where,
E(Rp)=Expected return on portfolio
Wi=Proportion of wealth investment in I assets.
Wj= Proportion of wealth investment in j assets.
E(Ri)=Expected return on i assets.
E(Rj)=Expected return on j assets.
3.4.12 Portfolio Risk
It is combined standard deviation of individual stock return. It is the risk of individual
securities plus covariance between the securities. It can be written as:
σ p =
Where
σ p=Standard deviation of stock i and j
Wi= Proportion of asset i
Wj=Proportion of asset j
iσ =Variance of assets i
jσ =Variance of assets j
Cov (Ri,Rj)=Covariance between the return of assets i and j

32
3.4.13 Portfolio Beta
The beta of portfolio can be easily estimated by using beta of individual assets it includes.
Symbolically, it can be represented by:
Portfolio beta(bp) = ∑=
n
1jWjbj
Where
Wj= proportion of the portfolio
bj=beta coefficient of asset j
bp=portfolio beta coefficient
3.5 Method of Analysis and Presentation
Methods of analysis are applied as simple as possible. Results are presented in tabular
form and clear interpretation on it is given simultaneously. Detail calculations, which can
not be shown in the body part of the report, are presented as annexes at the end of the
report. To make report simpler and easily understandable; charts, bar diagrams and charts
have been used. Summary, findings and recommendations are presented finally.
33
CHAPTER - IV
DATA PRESENTATION AND ANALYSIS
This chapter includes analysis of data collected and their presentation. In this chapter the
effort has been made to analyze “Risk and Return of Sampled commercial banks. Detail
data of MPS, EPS and dividend of each bank and their interpretation and analyses is done
with reference to the various reading and literature review in the preceding chapter.
Efforts are made to analyze and diagnose the recent Nepalese stock market movement,
with a special reference to the listed commercial banks. The analysis of data consists of
organizing, tabulating and assessing financial and statistical result from different tables
and diagrams are drawn to make the results more simple and understandable.
4.1 Nabil Bank Limited (NABIL)
4.1.1 Introduction
Nabil Bank Limited (erstwhile Nepal Arab Bank Limited) was established on July 12,
1984 under a technical service agreement with Dubai Bank Limited, Dubai, which was
later merged with Emirates Bank Ltd., Dubai. 50% of the total shares of Nabil Bank
Limited is owned by N.B. International Limited, Ireland; 20% by local financial
institutions and 30% by the Nepalese public.
The bank provides a complete range of personal, commercial and corporate banking and
related financial services through its 28 branches and 17 ATMs in various parts of the
country. Authorized capital, issued capital and paid-up capital of the bank by the end of
Ashad 2064 were 50,00,00,000 , 49,16,54,400 and 49,16,54,400 respectively.
34
4.1.2 Analysis of Total Dividend
Table 4.1
MPS, Dividend, EPS and P/E Ratio of NABIL
Source: AGM Report of NABIL
The calculation of total dividend is annexed 1.
According to table 1, NABIL is paying cash dividend every year but stock dividend only
in year 2057/58 and 2063/64. Highest total dividend is paid in the year 2063/64, i.e. 2155.
P/E ratio of NABIL is maximum in the year 2063/64 i.e. 36.84 and minimum in the year
2059/60 i.e. 8.47. The closing MPS of NABIL is maximum of Rs. 5050 in the year
2063/64 and minimum of Rs. 700 in the year 2058/59.
Figure 4.1
Year and Price Movement of the Common Stock of NABIL
FY MPS in Rs
Cash DPS Rs
Stock Dividend (%)
Total Dividend (in Rs)
EPS (Rs.)
P/E Ratio
2057/58 1500 40 20 180 59.3 25.31 2058/59 700 30 - 30.00 55 12.67 2059/60 740 50 - 50.00 85 8.47 2060/61 1000 65 - 65.00 93 10.80 2061/62 1505 70 - 70 105 14.27 2062/63 2240 85 - 85 129 17.34 2063/64 5050 5 40 2155 138 36.84
Total
0
1000
2000
3000
4000
5000
6000
2057/58 2058/ 59 2059/60 2060/61 2061/62 2062/63 2063/64
Market Price
Fiscal year
35
Figure 4.1 shows the trend line of market price in several year of NABIL. It can be seen
that there is fluctuation of market price from year 2057/58 till 2063/64, and the trend line
shows the rapid growth after 2060/61. There is minimum price in the year 2058/59 i.e.
Rs. 700 and maximum in the year 2063/64 i.e. Rs. 5050.
4.1.3 Expected Return (Rj), Standard Deviation (σ ) and Coefficient of Variation
(C.V) of NABIL
Table 4.2
Expected Return, Standard Deviation and Coefficient of variation of NABIL
FY MPS in Rs
Total Dividend
1
)1
(
−
−−+
tP
tP
tP
tD
(R- R ) (R- R )2
2057/58 1500 - - - - 2058/59 700 30.00 -0.51 -1.08 1.16 2059/60 740 50.00 0.13 -0.44 0.19 2060/61 1000 65.00 0.44 -0.13 0.02 2061/62 1505 70 0.58 0.01 0.00 2062/63 2240 85 0.54 -0.03 0.00 2063/64 5050 2155 2.22 1.65 2.73
Total 3.4 4.10
Where,
R is calculated with the use of following formula:
R =
1tP
)1t
Pt
(Pt
D
−
−−+
The detail calculations of R for each fiscal year are given in Annex 2.
Expected Return ( R ) = nR∑ =
63.4 = 0.567
The detail calculations of (R- R ) and (R- R )2 for each fiscal year are given in Annex 3.
R=

36
Standard Deviation (σ)
(σ) = ( )
1n
2RR
−
−=
164.10−
= 0.91
Coefficient of Variance
CV = Rσ
= 567.091.0 =1.597
Expected return of NABIL is 0.567 with the total risk (measured by S.D) of 0.91. The
C.V of NABIL is 1.597 which denotes that to get per unit return 1.597 risk must be
sacrifice. So, higher the C.V higher will be the risk.
Following chart shows the realized rate of return per share of Nabil Bank Limited in the
various years under study.
Figure 4.2
Realized Rate of Return per Share of Nabil Bank Limited
Figure 4.2 shows that the annual rate of return of C.S of NABIL in several years. The rate
of return is maximum on 2063/64 i.e. 2.22 which shows highest return profitable while
the return is negative in the year 2058/59 i.e -0.51.
37
4.2 Nepal Investment Bank Limited (NIBL)
4.2.1 Introduction
Nepal Investment Bank Limited was established on Falgun 16, 2042 BS under the name
of Nepal Indo-Suez Bank Limited. The bank is managed by Banque Indonesia, Parh in
accordance with Joint Venture and Technical Services Agreement signed between it and
Nepalese promoters.
Nepal Investment Bank has its head office at Durbar Marg, Kathmandu and with
seventeen branches and twenty ATM machines in various parts of the country, the bank
renders its banking and financial services to its customers. The bank has the total asset of
RS 13,25,54,96,016 by the end of Ashad 2064. Authorized capital, issued capital and
paid up capital of the bank by the end of Ashad 2064 were RS 59,00,00,000, Rs
29,52,93,000 and Rs 29,52,93,000 respectively.
Following table shows the market price per share, dividend per share and rate of return
per share or Nepal Investment Bank Limited.
4.2.2 Analysis of Total Dividend
Table 4.3
MPS, Dividend, EPS and P/E Ratio of NIBL
FY MPS (in Rs)
Cash DPS (Rs.)
Stock Dividend (%)
Total Dividend (in Rs)
EPS (Rs.)
P/E Ratio
2057/58 1150 - - - 33.18 34.65 2058/59 760 - 30 238.50 33.59 22.62 2059/60 795 20 - 20.00 0.1286 20.10 2060/61 940 15 - 15.00 0.4392 18.18 2061/62 800 12.5 - 12.5 0.5750 20.25 2062/63 1260 20 35.46 633.10 0.5449 21.23 2063/64 1729 5 25 670 1.2991 27.63
Total 4.1780 Data Source: AGM Report of NIBL
The calculation of total dividend is annexed 1.
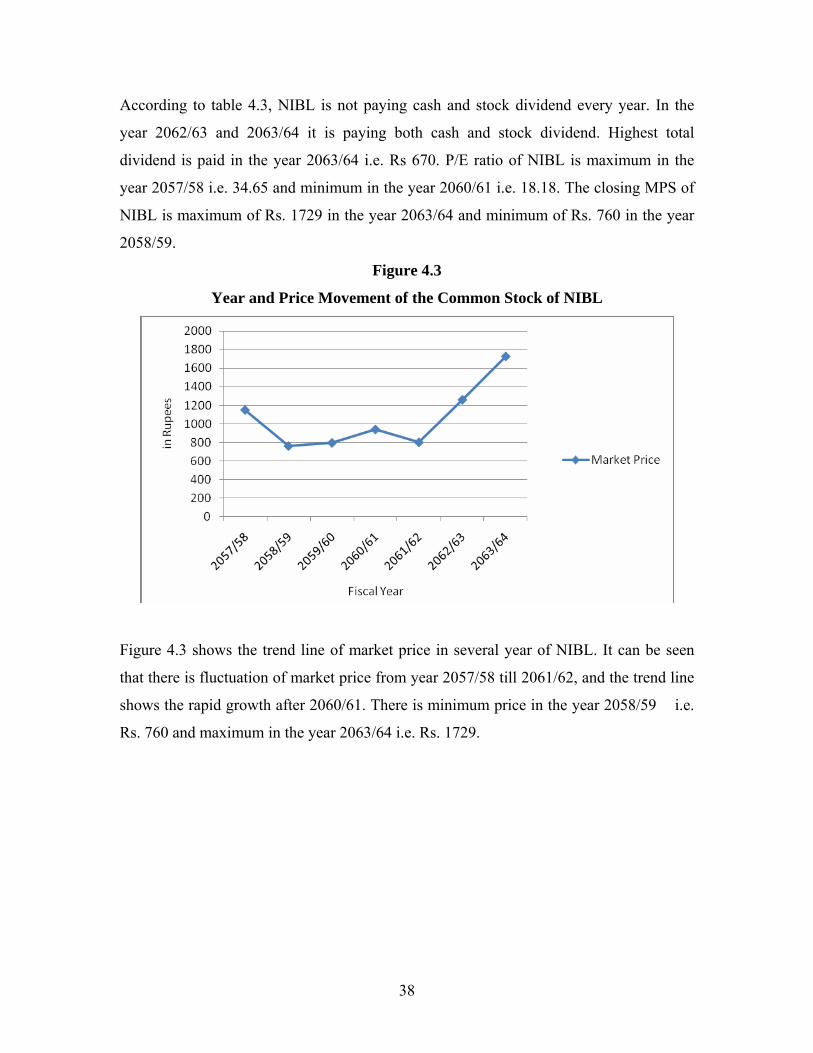
38
According to table 4.3, NIBL is not paying cash and stock dividend every year. In the
year 2062/63 and 2063/64 it is paying both cash and stock dividend. Highest total
dividend is paid in the year 2063/64 i.e. Rs 670. P/E ratio of NIBL is maximum in the
year 2057/58 i.e. 34.65 and minimum in the year 2060/61 i.e. 18.18. The closing MPS of
NIBL is maximum of Rs. 1729 in the year 2063/64 and minimum of Rs. 760 in the year
2058/59.
Figure 4.3
Year and Price Movement of the Common Stock of NIBL
Figure 4.3 shows the trend line of market price in several year of NIBL. It can be seen
that there is fluctuation of market price from year 2057/58 till 2061/62, and the trend line
shows the rapid growth after 2060/61. There is minimum price in the year 2058/59 i.e.
Rs. 760 and maximum in the year 2063/64 i.e. Rs. 1729.

39
4.2.3 Expected Return (Rj), Standard Deviation (σ ) and Coefficient of Variation
(C.V) of NIBL
Table 4.4
Expected Return, Standard Deviation and Coefficient of variation of NIBL
FY MPS in Rs
Total Dividend
1
)1
(
−
−−+
tP
tP
tP
tD
(R- R ) (R- R )2
2057/58 1150 - - - - 2058/59 760 238.50 -0.132 -0.5112 0.2613 2059/60 795 20 0.072 -0.3071 0.0943 2060/61 940 15 0.201 -0.1782 0.0318 2061/62 800 12.5 -0.136 -0.5151 0.2653 2062/63 1260 633.10 1.366 0.9869 0.9740 2063/64 1729 5 0.904 0.5245 0.2751
Total 2.275 1.9018
The detail calculations of R for each fiscal year are given in Annex 2.
Expected Return ( R ) = n
R∑ = 6275.2 = 0.379
The detail calculations of (R- R ) and (R- R )2 for each fiscal year are given in Annex 3.
Standard Deviation
(σ) = ( )1
2
−
−
n
RR = 16
1.9−
= 0.616
Coefficient of Variance
CV = Rσ
= 379.0616.0 =1.62
R=
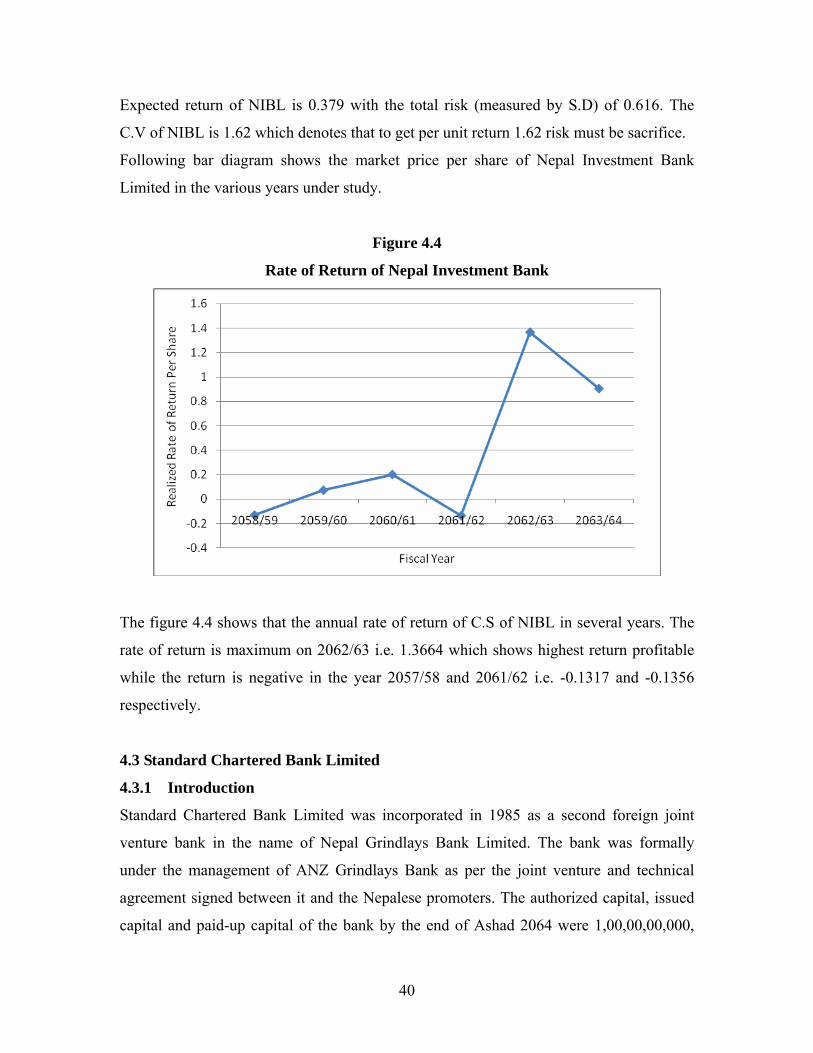
40
Expected return of NIBL is 0.379 with the total risk (measured by S.D) of 0.616. The
C.V of NIBL is 1.62 which denotes that to get per unit return 1.62 risk must be sacrifice.
Following bar diagram shows the market price per share of Nepal Investment Bank
Limited in the various years under study.
Figure 4.4
Rate of Return of Nepal Investment Bank
The figure 4.4 shows that the annual rate of return of C.S of NIBL in several years. The
rate of return is maximum on 2062/63 i.e. 1.3664 which shows highest return profitable
while the return is negative in the year 2057/58 and 2061/62 i.e. -0.1317 and -0.1356
respectively.
4.3 Standard Chartered Bank Limited
4.3.1 Introduction
Standard Chartered Bank Limited was incorporated in 1985 as a second foreign joint
venture bank in the name of Nepal Grindlays Bank Limited. The bank was formally
under the management of ANZ Grindlays Bank as per the joint venture and technical
agreement signed between it and the Nepalese promoters. The authorized capital, issued
capital and paid-up capital of the bank by the end of Ashad 2064 were 1,00,00,00,000,

41
50,00,00,000 and 37,46,40,400 respectively. The bank has ten branches and four counters
in different cities. The bank has provided various services including recently launched
home banking system.
Today the Bank is an integral part of Standard Chartered Group having an ownership of
75% in the company with 25% shares owned by the Nepalese public. The Bank enjoys
the status of the largest international bank currently operating in Nepal.
Standard Chartered has a history of over 150 years in banking and operates in many of
the world's fastest-growing markets with an extensive global network of over 1750
branches (including subsidiaries, associates and joint ventures) in over 70 countries in the
Asia Pacific Region, South Asia, the Middle East, Africa, the United Kingdom and the
Americas. As one of the world's most international banks, Standard Chartered employs
almost 75,000 people, representing over 115 nationalities, worldwide. This diversity lies
at the heart of the Bank's values and supports the Bank's growth as the world increasingly
becomes one market.
With 17 points of representation, 18 ATMs across the country and with more than 350
local staff, Standard Chartered Bank Nepal Ltd. is in a position to serve its customers
through an extensive domestic network. In addition, the global network of Standard
Chartered Group gives the Bank a unique opportunity to provide truly international
banking services in Nepal.
Standard Chartered Bank Nepal Limited offers a full range of banking products and
services in Consumer banking, Wholesale and SME Banking catering to a wide range of
customers encompassing individuals, mid-market local corporates, multinationals, large
public sector companies, government corporations, airlines, hotels as well as the DO
segment comprising of embassies, aid agencies, NGOs and INGOs.

42
4.3.2 Analysis of Total Dividend
Following table shows the market price per share, dividend per share and rate of return
per share.
Table 4.5
MPS, Dividend, EPS and P/E Ratio of SCBL
Data Source: AGM Report of SCBL
The calculation of total dividend is annexed 1.
According to table 4.5, SCBL is not paying stock dividend every year. Highest total
dividend is paid in the year 2062/63 i.e. Rs 140. P/E ratio of SCBL is maximum in the
year 2063/64 i.e. 35.23 and minimum in the year 2060/61 i.e. 12.16. The closing MPS of
SCBL is maximum of Rs. 5900 in the year 2063/64 and minimum of Rs. 1575 in the year
2058/59.
FY MPS in Rs
Cash DPS (Rs.)
Stock Dividend (%)
Total Dividend (in Rs)
EPS (Rs.)
P/E Ratio
2057/58 2144 100 - 100 96.17 24.62 2058/59 1575 100 - 100 98.48 20.65 2059/60 1640 120 - 120 100.22 18.08 2060/61 1745 110 - 110 143.55 12.16 2061/62 2345 120 - 120 143.95 16.29 2062/63 3775 140 - 140 175.84 21.47 2063/64 5900 80 - 80 167.46 35.23
Total
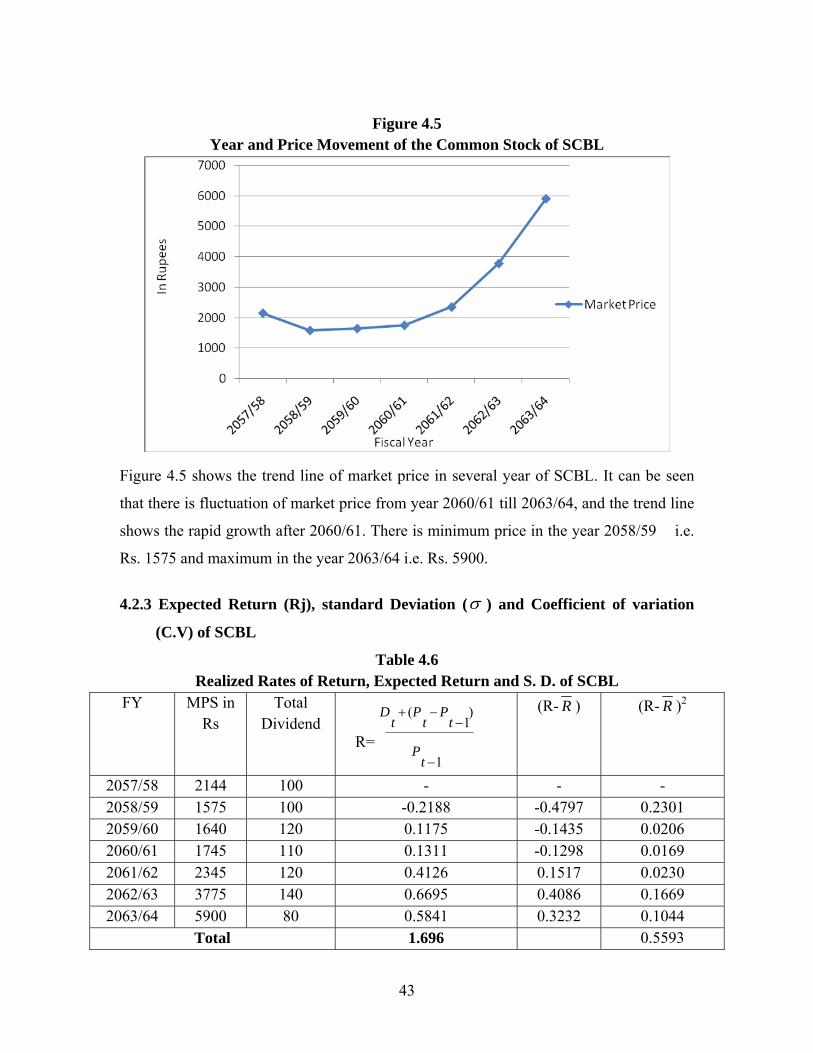
43
Figure 4.5
Year and Price Movement of the Common Stock of SCBL
Figure 4.5 shows the trend line of market price in several year of SCBL. It can be seen
that there is fluctuation of market price from year 2060/61 till 2063/64, and the trend line
shows the rapid growth after 2060/61. There is minimum price in the year 2058/59 i.e.
Rs. 1575 and maximum in the year 2063/64 i.e. Rs. 5900.
4.2.3 Expected Return (Rj), standard Deviation (σ ) and Coefficient of variation
(C.V) of SCBL
Table 4.6 Realized Rates of Return, Expected Return and S. D. of SCBL
FY MPS in Rs
Total Dividend
1
)1
(
−
−−+
tP
tP
tP
tD
(R- R ) (R- R )2
2057/58 2144 100 - - - 2058/59 1575 100 -0.2188 -0.4797 0.2301 2059/60 1640 120 0.1175 -0.1435 0.0206 2060/61 1745 110 0.1311 -0.1298 0.0169 2061/62 2345 120 0.4126 0.1517 0.0230 2062/63 3775 140 0.6695 0.4086 0.1669 2063/64 5900 80 0.5841 0.3232 0.1044
Total 1.696 0.5593
R=

44
The detail calculations of R for each fiscal year are given in Annex 2.
Now,
Expected Return ( R ) = 6696.1 = 0.28
The detail calculations of R - R and ( R - R )2 for each fiscal year are given in Annex 3.
Standard Deviation
σ = ( )1
2
−
−
n
RR = 16
0.5593−
=0.33
Coefficient of Variance
CV = Rσ
= 28.033.0 =1.19
Expected return of SCBL is 0.28 with the total risk (measured by S.D) of 0.33. The C.V
of SCBL is 1.19.
Following chart shows the rate of return of Standard Chartered Bank Limited in the
various years under scrutiny.
Figure 4.6
Realized Rate of Return of Per Share of Standard Chartered Bank Limited
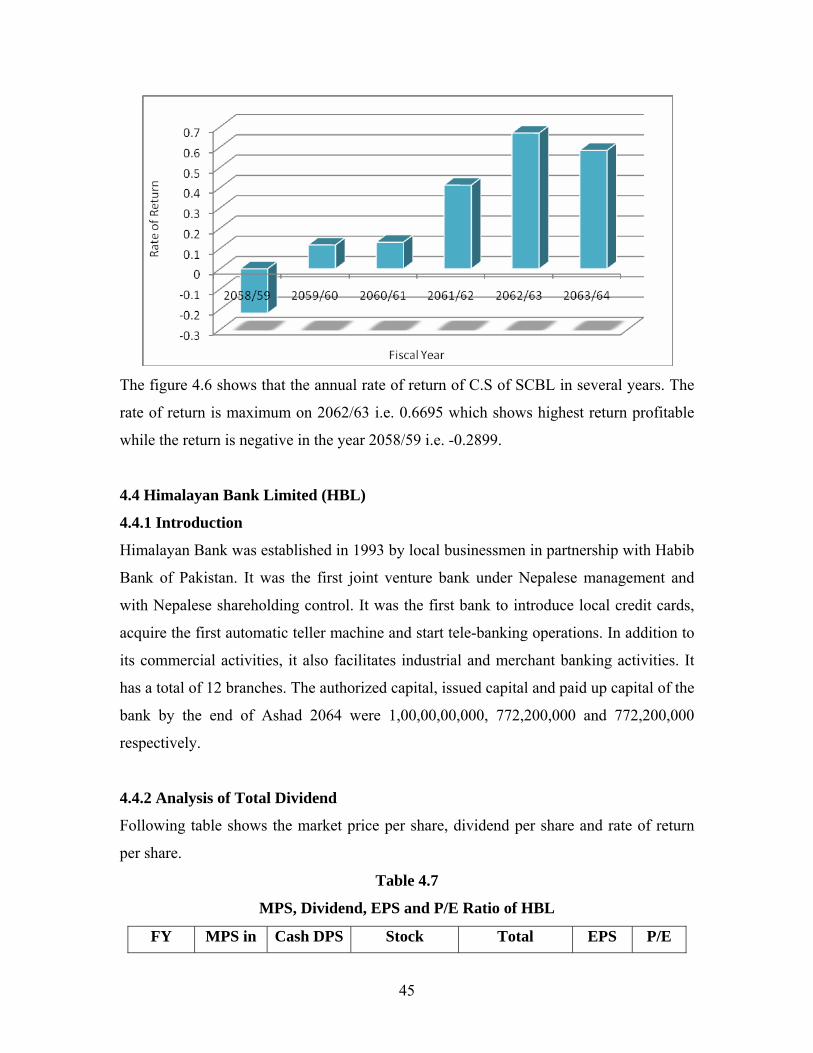
45
The figure 4.6 shows that the annual rate of return of C.S of SCBL in several years. The
rate of return is maximum on 2062/63 i.e. 0.6695 which shows highest return profitable
while the return is negative in the year 2058/59 i.e. -0.2899.
4.4 Himalayan Bank Limited (HBL)
4.4.1 Introduction
Himalayan Bank was established in 1993 by local businessmen in partnership with Habib
Bank of Pakistan. It was the first joint venture bank under Nepalese management and
with Nepalese shareholding control. It was the first bank to introduce local credit cards,
acquire the first automatic teller machine and start tele-banking operations. In addition to
its commercial activities, it also facilitates industrial and merchant banking activities. It
has a total of 12 branches. The authorized capital, issued capital and paid up capital of the
bank by the end of Ashad 2064 were 1,00,00,00,000, 772,200,000 and 772,200,000
respectively.
4.4.2 Analysis of Total Dividend
Following table shows the market price per share, dividend per share and rate of return
per share.
Table 4.7
MPS, Dividend, EPS and P/E Ratio of HBL
FY MPS in Cash DPS Stock Total EPS P/E
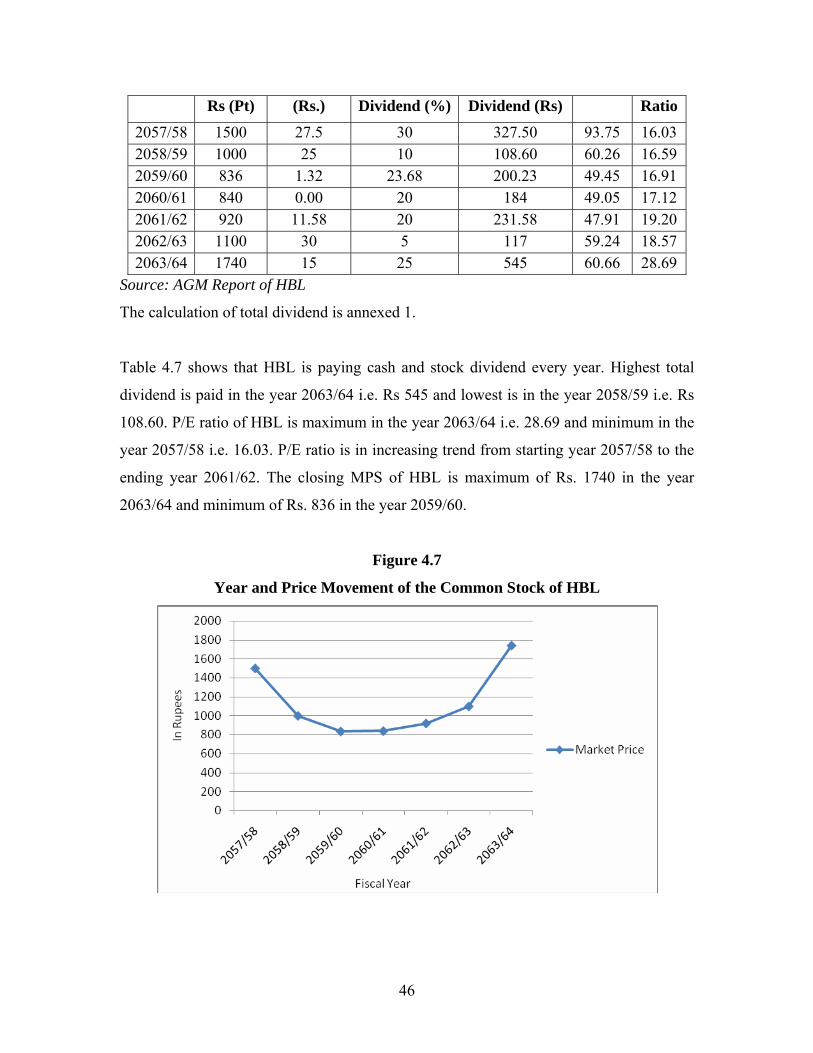
46
Rs (Pt) (Rs.) Dividend (%) Dividend (Rs) Ratio
2057/58 1500 27.5 30 327.50 93.75 16.03 2058/59 1000 25 10 108.60 60.26 16.59 2059/60 836 1.32 23.68 200.23 49.45 16.91 2060/61 840 0.00 20 184 49.05 17.12 2061/62 920 11.58 20 231.58 47.91 19.20 2062/63 1100 30 5 117 59.24 18.57 2063/64 1740 15 25 545 60.66 28.69
Source: AGM Report of HBL
The calculation of total dividend is annexed 1.
Table 4.7 shows that HBL is paying cash and stock dividend every year. Highest total
dividend is paid in the year 2063/64 i.e. Rs 545 and lowest is in the year 2058/59 i.e. Rs
108.60. P/E ratio of HBL is maximum in the year 2063/64 i.e. 28.69 and minimum in the
year 2057/58 i.e. 16.03. P/E ratio is in increasing trend from starting year 2057/58 to the
ending year 2061/62. The closing MPS of HBL is maximum of Rs. 1740 in the year
2063/64 and minimum of Rs. 836 in the year 2059/60.
Figure 4.7
Year and Price Movement of the Common Stock of HBL

47
Figure 4.7 shows the trend line of market price in several year of HBL. It can be seen in
the fluctuating trend. The minimum is in the year 2060/61 i.e Rs. 836 and maximum in
the year 2063/64 i.e. Rs. 1740. It can be seen that there is decreasing trend from 2058/59
and the trend line shows the rapid growth after 2060/61.
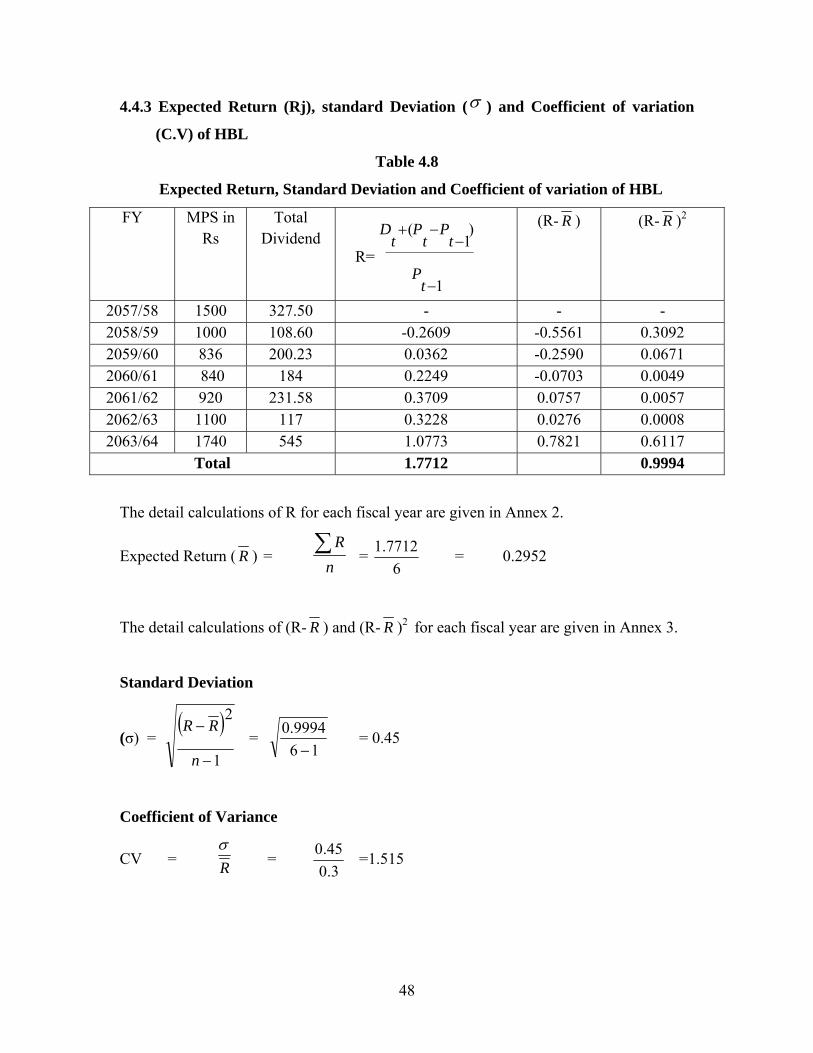
48
4.4.3 Expected Return (Rj), standard Deviation (σ ) and Coefficient of variation
(C.V) of HBL
Table 4.8
Expected Return, Standard Deviation and Coefficient of variation of HBL
FY MPS in Rs
Total Dividend
1
)1
(
−
−−+
tP
tP
tP
tD
(R- R ) (R- R )2
2057/58 1500 327.50 - - - 2058/59 1000 108.60 -0.2609 -0.5561 0.3092 2059/60 836 200.23 0.0362 -0.2590 0.0671 2060/61 840 184 0.2249 -0.0703 0.0049 2061/62 920 231.58 0.3709 0.0757 0.0057 2062/63 1100 117 0.3228 0.0276 0.0008 2063/64 1740 545 1.0773 0.7821 0.6117
Total 1.7712 0.9994
The detail calculations of R for each fiscal year are given in Annex 2.
Expected Return ( R ) = n
R∑ = 6
7712.1 = 0.2952
The detail calculations of (R- R ) and (R- R )2 for each fiscal year are given in Annex 3.
Standard Deviation
(σ) = ( )
1
2
−
−
n
RR=
160.9994
− = 0.45
Coefficient of Variance
CV = Rσ
= 3.0
45.0 =1.515
R=
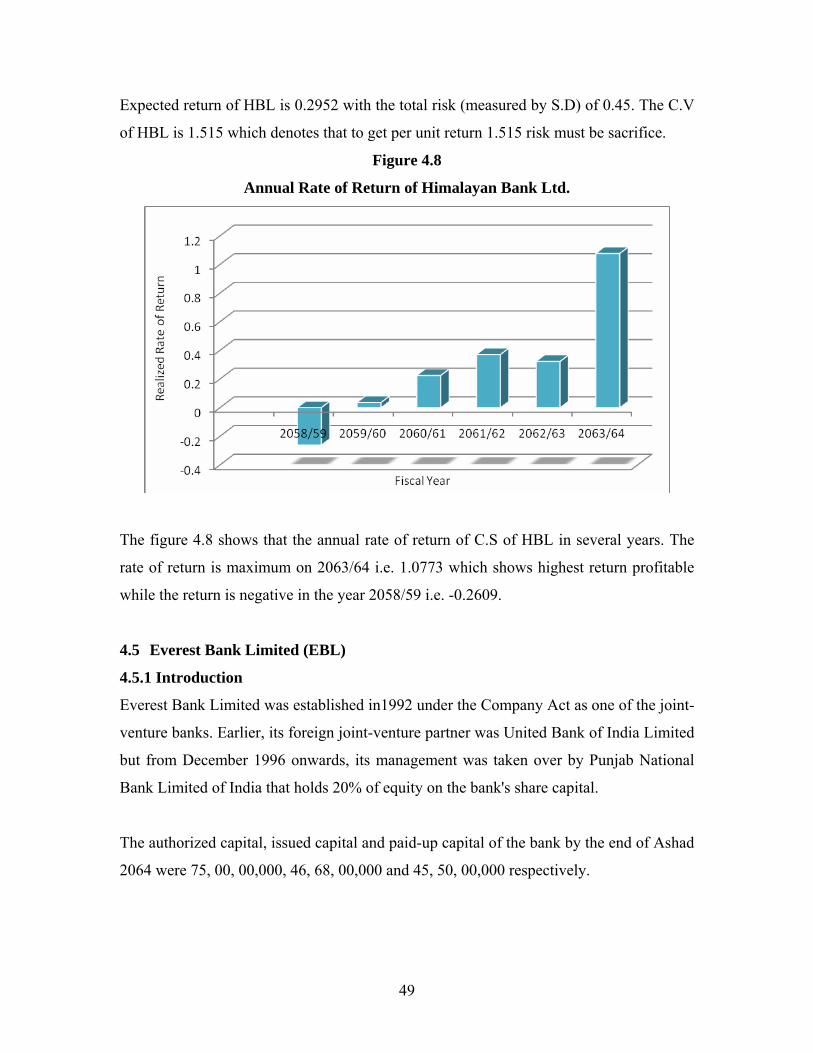
49
Expected return of HBL is 0.2952 with the total risk (measured by S.D) of 0.45. The C.V
of HBL is 1.515 which denotes that to get per unit return 1.515 risk must be sacrifice.
Figure 4.8
Annual Rate of Return of Himalayan Bank Ltd.
The figure 4.8 shows that the annual rate of return of C.S of HBL in several years. The
rate of return is maximum on 2063/64 i.e. 1.0773 which shows highest return profitable
while the return is negative in the year 2058/59 i.e. -0.2609.
4.5 Everest Bank Limited (EBL)
4.5.1 Introduction
Everest Bank Limited was established in1992 under the Company Act as one of the joint-
venture banks. Earlier, its foreign joint-venture partner was United Bank of India Limited
but from December 1996 onwards, its management was taken over by Punjab National
Bank Limited of India that holds 20% of equity on the bank's share capital.
The authorized capital, issued capital and paid-up capital of the bank by the end of Ashad
2064 were 75, 00, 00,000, 46, 68, 00,000 and 45, 50, 00,000 respectively.
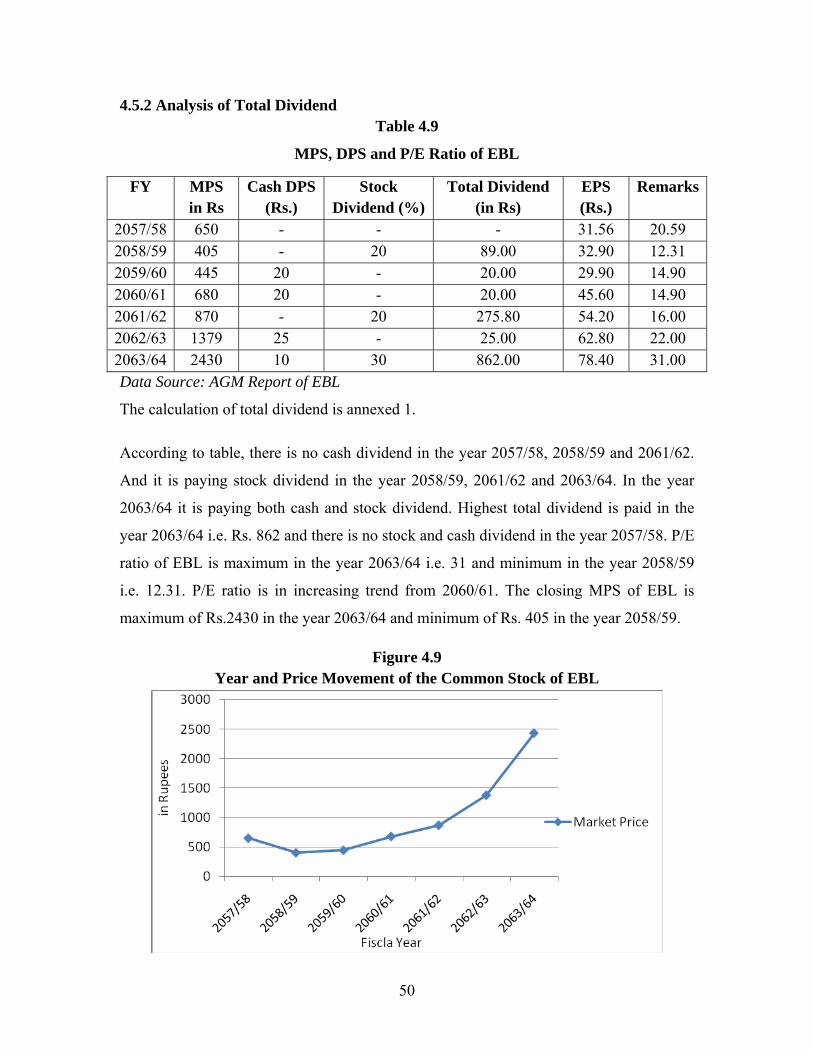
50
4.5.2 Analysis of Total Dividend Table 4.9
MPS, DPS and P/E Ratio of EBL
Data Source: AGM Report of EBL
The calculation of total dividend is annexed 1.
According to table, there is no cash dividend in the year 2057/58, 2058/59 and 2061/62.
And it is paying stock dividend in the year 2058/59, 2061/62 and 2063/64. In the year
2063/64 it is paying both cash and stock dividend. Highest total dividend is paid in the
year 2063/64 i.e. Rs. 862 and there is no stock and cash dividend in the year 2057/58. P/E
ratio of EBL is maximum in the year 2063/64 i.e. 31 and minimum in the year 2058/59
i.e. 12.31. P/E ratio is in increasing trend from 2060/61. The closing MPS of EBL is
maximum of Rs.2430 in the year 2063/64 and minimum of Rs. 405 in the year 2058/59.
Figure 4.9 Year and Price Movement of the Common Stock of EBL
FY MPS in Rs
Cash DPS (Rs.)
Stock Dividend (%)
Total Dividend (in Rs)
EPS (Rs.)
Remarks
2057/58 650 - - - 31.56 20.59 2058/59 405 - 20 89.00 32.90 12.31 2059/60 445 20 - 20.00 29.90 14.90 2060/61 680 20 - 20.00 45.60 14.90 2061/62 870 - 20 275.80 54.20 16.00 2062/63 1379 25 - 25.00 62.80 22.00 2063/64 2430 10 30 862.00 78.40 31.00
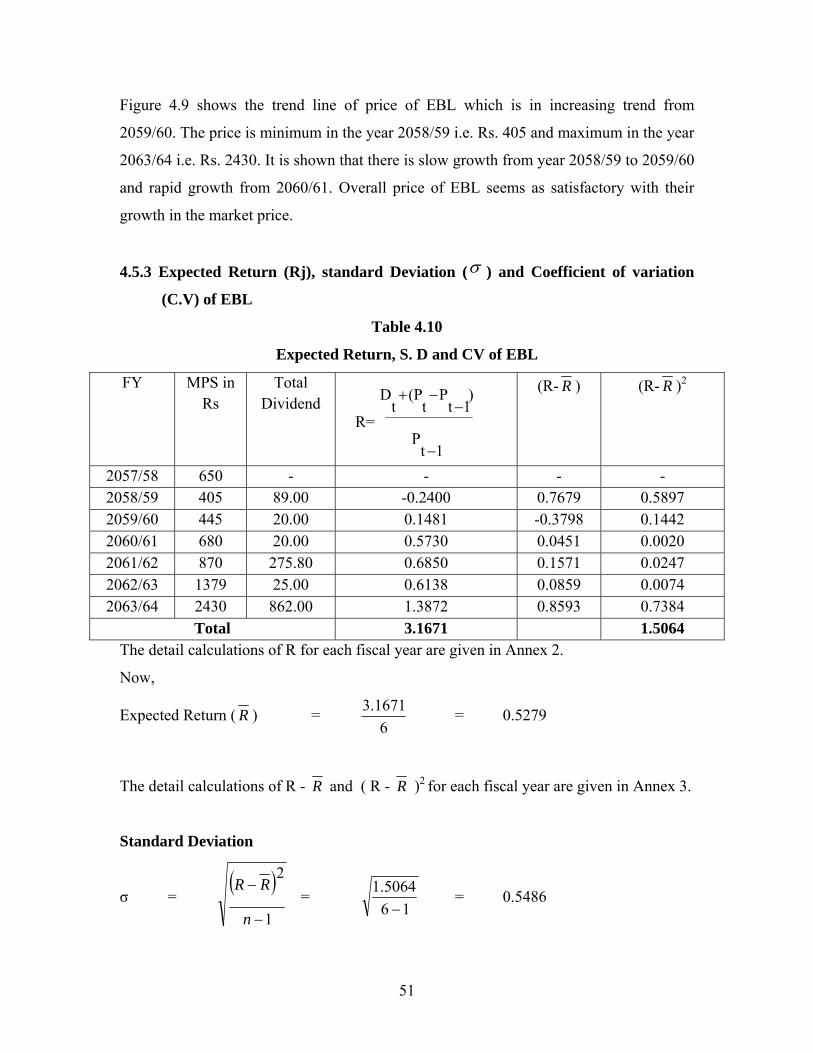
51
Figure 4.9 shows the trend line of price of EBL which is in increasing trend from
2059/60. The price is minimum in the year 2058/59 i.e. Rs. 405 and maximum in the year
2063/64 i.e. Rs. 2430. It is shown that there is slow growth from year 2058/59 to 2059/60
and rapid growth from 2060/61. Overall price of EBL seems as satisfactory with their
growth in the market price.
4.5.3 Expected Return (Rj), standard Deviation (σ ) and Coefficient of variation
(C.V) of EBL
Table 4.10
Expected Return, S. D and CV of EBL
FY MPS in Rs
Total Dividend
1tP
)1t
Pt
(Pt
D
−
−−+
(R- R ) (R- R )2
2057/58 650 - - - - 2058/59 405 89.00 -0.2400 0.7679 0.5897 2059/60 445 20.00 0.1481 -0.3798 0.1442 2060/61 680 20.00 0.5730 0.0451 0.0020 2061/62 870 275.80 0.6850 0.1571 0.0247 2062/63 1379 25.00 0.6138 0.0859 0.0074 2063/64 2430 862.00 1.3872 0.8593 0.7384
Total 3.1671 1.5064 The detail calculations of R for each fiscal year are given in Annex 2.
Now,
Expected Return ( R ) = 6
3.1671 = 0.5279
The detail calculations of R - R and ( R - R )2 for each fiscal year are given in Annex 3.
Standard Deviation
σ = ( )
1
2
−
−
n
RR=
161.5064
− = 0.5486
R=
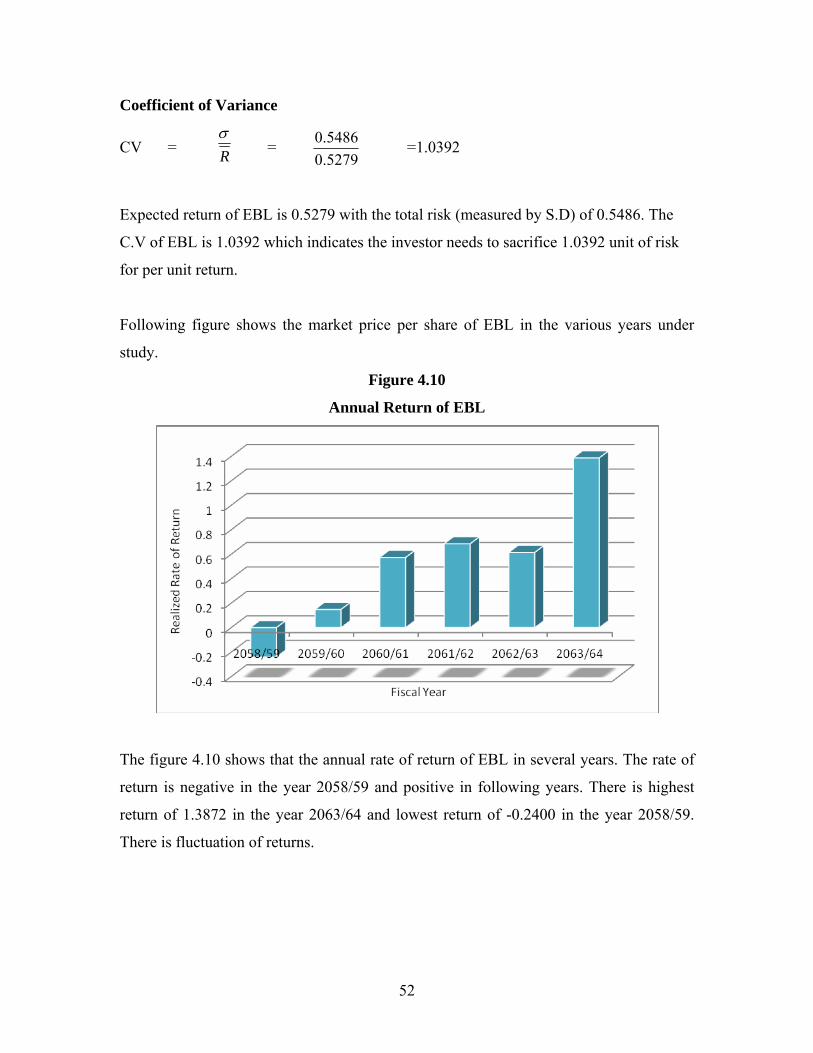
52
Coefficient of Variance
CV = Rσ
= 0.5279
5486.0 =1.0392
Expected return of EBL is 0.5279 with the total risk (measured by S.D) of 0.5486. The
C.V of EBL is 1.0392 which indicates the investor needs to sacrifice 1.0392 unit of risk
for per unit return.
Following figure shows the market price per share of EBL in the various years under
study.
Figure 4.10
Annual Return of EBL
The figure 4.10 shows that the annual rate of return of EBL in several years. The rate of
return is negative in the year 2058/59 and positive in following years. There is highest
return of 1.3872 in the year 2063/64 and lowest return of -0.2400 in the year 2058/59.
There is fluctuation of returns.
53
4.6 Bank of Kathmandu Limited (BoK)
4.6.1 Introduction
Bank of Kathmandu Limited was established in 2050 BS in collaboration with the SIAM
Commercial Bank PCC, Thailand under the Company Act with the objective to stimulate
the Nepalese economy and take it to newer heights.. Out of 50% of share holding, the
SIAM Commercial Bank diluted its 25% of holding to the Nepalese citizen in 1998. The
bank has eleven branches in operation. The authorized capital, issued capital and paid-up
capital of the bank by the end of Ashad 2064 were 1,00,00,00,000, 50, 00, 00,000 and 46,
35, 80,900 respectively. BOK aims to facilitate the nation's economy and to become more
competitive globally. To achieve these, BOK has been focusing on its set objectives right
from the beginning. Bank of Kathmandu Limited has become a prominent name in the
Nepalese banking sector.
Bank of Kathmandu Limited (BOK) has today become a landmark in the Nepalese
banking sector by being among the few commercial banks which is entirely managed by
Nepalese professionals and owned by the general public.
BOK's IT infrastructure has been designed, to facilitate, internal and customer
convenience. Nationwide, all the branches are connected to the central database via Wide
Area Network (WAN) powered by Finacle, state-of-the-art banking application software
supported by hardware like SUN Fire V880 RISC server, VSAT etc. Internally, BOK
relies on Information & Communication Technology (ICT), for a quick, reliable, efficient
system. Banking operations are powered by Finacle, which is listed among the top 40
companies that have reshaped the global economy as per the Wired Magazine.
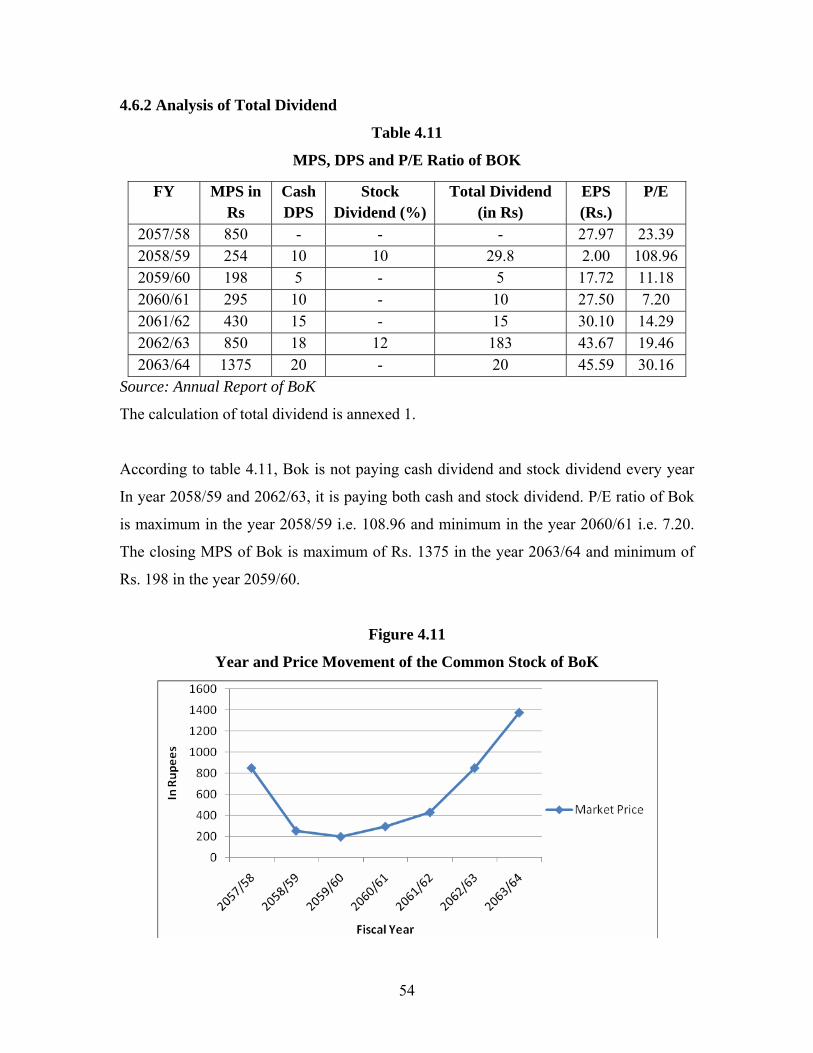
54
4.6.2 Analysis of Total Dividend
Table 4.11
MPS, DPS and P/E Ratio of BOK
Source: Annual Report of BoK
The calculation of total dividend is annexed 1.
According to table 4.11, Bok is not paying cash dividend and stock dividend every year
In year 2058/59 and 2062/63, it is paying both cash and stock dividend. P/E ratio of Bok
is maximum in the year 2058/59 i.e. 108.96 and minimum in the year 2060/61 i.e. 7.20.
The closing MPS of Bok is maximum of Rs. 1375 in the year 2063/64 and minimum of
Rs. 198 in the year 2059/60.
Figure 4.11
Year and Price Movement of the Common Stock of BoK
FY MPS in Rs
Cash DPS
Stock Dividend (%)
Total Dividend (in Rs)
EPS (Rs.)
P/E
2057/58 850 - - - 27.97 23.39 2058/59 254 10 10 29.8 2.00 108.962059/60 198 5 - 5 17.72 11.18 2060/61 295 10 - 10 27.50 7.20 2061/62 430 15 - 15 30.10 14.29 2062/63 850 18 12 183 43.67 19.46 2063/64 1375 20 - 20 45.59 30.16
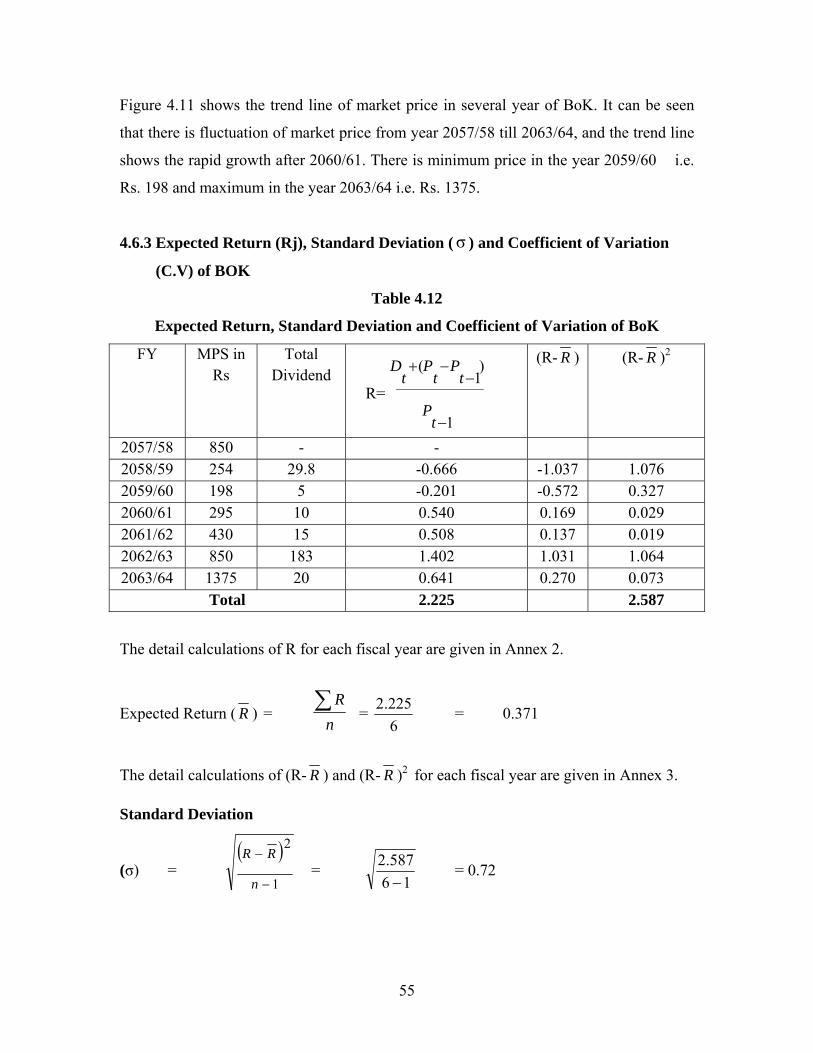
55
Figure 4.11 shows the trend line of market price in several year of BoK. It can be seen
that there is fluctuation of market price from year 2057/58 till 2063/64, and the trend line
shows the rapid growth after 2060/61. There is minimum price in the year 2059/60 i.e.
Rs. 198 and maximum in the year 2063/64 i.e. Rs. 1375.
4.6.3 Expected Return (Rj), Standard Deviation (σ ) and Coefficient of Variation
(C.V) of BOK
Table 4.12
Expected Return, Standard Deviation and Coefficient of Variation of BoK
FY MPS in Rs
Total Dividend
1
)1
(
−
−−+
tP
tP
tP
tD
(R- R ) (R- R )2
2057/58 850 - - 2058/59 254 29.8 -0.666 -1.037 1.076 2059/60 198 5 -0.201 -0.572 0.327 2060/61 295 10 0.540 0.169 0.029 2061/62 430 15 0.508 0.137 0.019 2062/63 850 183 1.402 1.031 1.064 2063/64 1375 20 0.641 0.270 0.073
Total 2.225 2.587
The detail calculations of R for each fiscal year are given in Annex 2.
Expected Return ( R ) = n
R∑ = 6225.2 = 0.371
The detail calculations of (R- R ) and (R- R )2 for each fiscal year are given in Annex 3.
Standard Deviation
(σ) = ( )
1
2
−
−
n
RR =
162.587−
= 0.72
R=
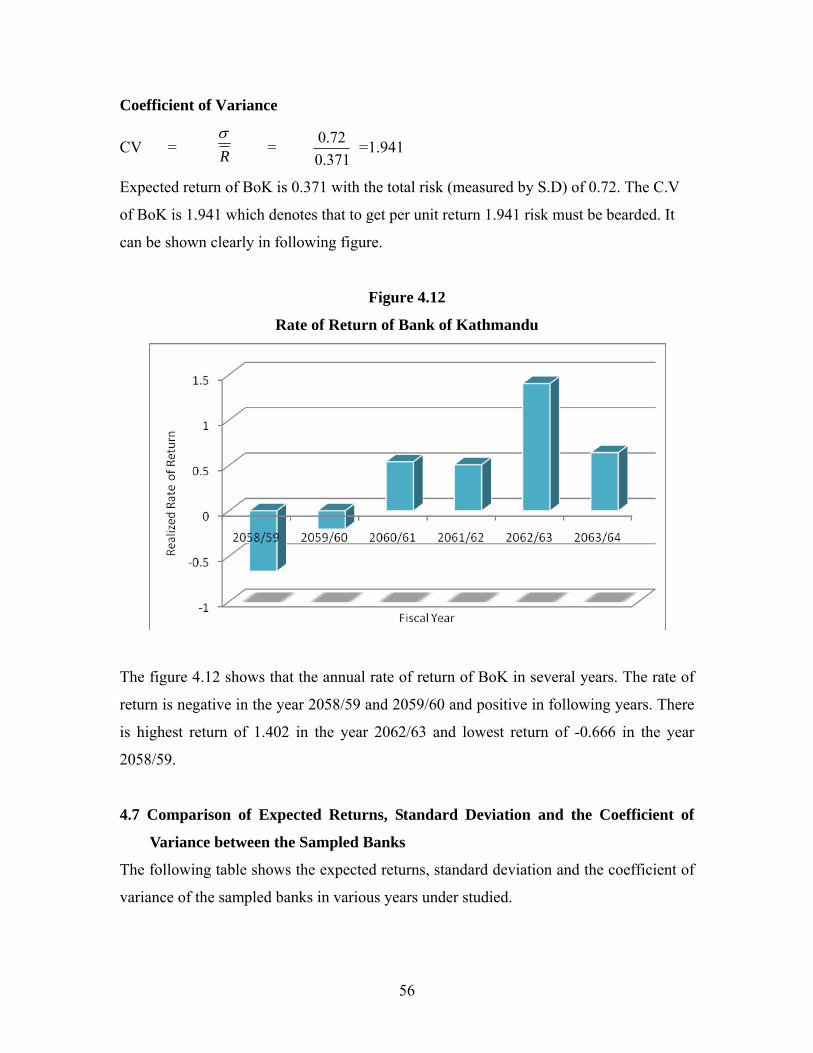
56
Coefficient of Variance
CV = Rσ
= 371.072.0 =1.941
Expected return of BoK is 0.371 with the total risk (measured by S.D) of 0.72. The C.V
of BoK is 1.941 which denotes that to get per unit return 1.941 risk must be bearded. It
can be shown clearly in following figure.
Figure 4.12
Rate of Return of Bank of Kathmandu
The figure 4.12 shows that the annual rate of return of BoK in several years. The rate of
return is negative in the year 2058/59 and 2059/60 and positive in following years. There
is highest return of 1.402 in the year 2062/63 and lowest return of -0.666 in the year
2058/59.
4.7 Comparison of Expected Returns, Standard Deviation and the Coefficient of
Variance between the Sampled Banks
The following table shows the expected returns, standard deviation and the coefficient of
variance of the sampled banks in various years under studied.
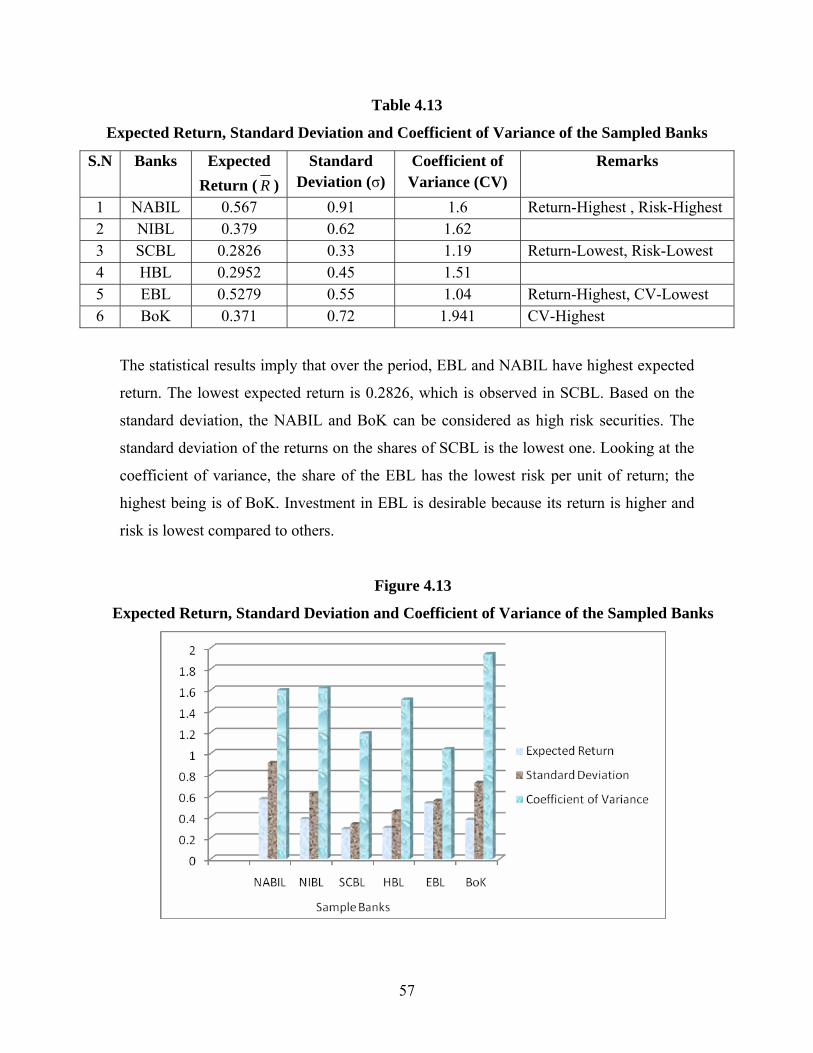
57
Table 4.13
Expected Return, Standard Deviation and Coefficient of Variance of the Sampled Banks
S.N Banks Expected Return ( R )
Standard Deviation (σ)
Coefficient of Variance (CV)
Remarks
1 NABIL 0.567 0.91 1.6 Return-Highest , Risk-Highest 2 NIBL 0.379 0.62 1.62 3 SCBL 0.2826 0.33 1.19 Return-Lowest, Risk-Lowest 4 HBL 0.2952 0.45 1.51 5 EBL 0.5279 0.55 1.04 Return-Highest, CV-Lowest 6 BoK 0.371 0.72 1.941 CV-Highest
The statistical results imply that over the period, EBL and NABIL have highest expected
return. The lowest expected return is 0.2826, which is observed in SCBL. Based on the
standard deviation, the NABIL and BoK can be considered as high risk securities. The
standard deviation of the returns on the shares of SCBL is the lowest one. Looking at the
coefficient of variance, the share of the EBL has the lowest risk per unit of return; the
highest being is of BoK. Investment in EBL is desirable because its return is higher and
risk is lowest compared to others.
Figure 4.13
Expected Return, Standard Deviation and Coefficient of Variance of the Sampled Banks
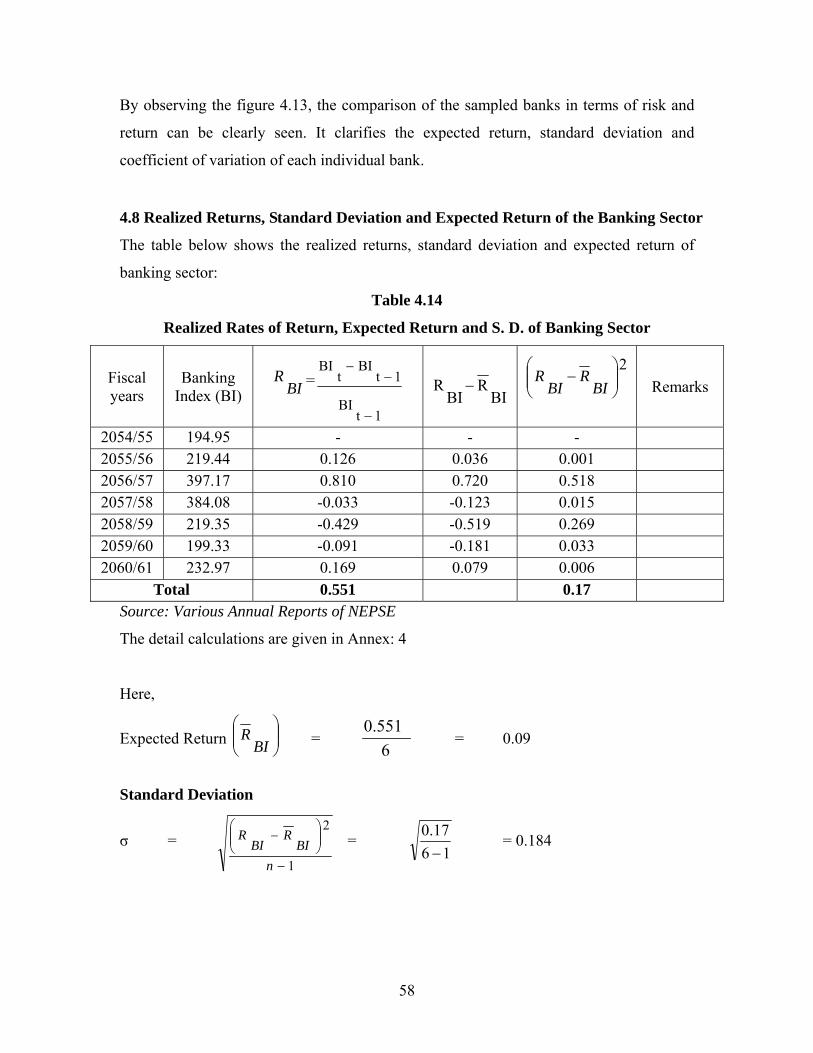
58
By observing the figure 4.13, the comparison of the sampled banks in terms of risk and
return can be clearly seen. It clarifies the expected return, standard deviation and
coefficient of variation of each individual bank.
4.8 Realized Returns, Standard Deviation and Expected Return of the Banking Sector
The table below shows the realized returns, standard deviation and expected return of
banking sector:
Table 4.14
Realized Rates of Return, Expected Return and S. D. of Banking Sector
Fiscal years
Banking Index (BI) BI
R =
1tBI
1tBI
tBI
−
−−
BI
RBI
R −2⎟⎟⎠
⎞⎜⎜⎝
⎛−
BIR
BIR
Remarks
2054/55 194.95 - - - 2055/56 219.44 0.126 0.036 0.001 2056/57 397.17 0.810 0.720 0.518 2057/58 384.08 -0.033 -0.123 0.015 2058/59 219.35 -0.429 -0.519 0.269 2059/60 199.33 -0.091 -0.181 0.033 2060/61 232.97 0.169 0.079 0.006
Total 0.551 0.17 Source: Various Annual Reports of NEPSE
The detail calculations are given in Annex: 4
Here,
Expected Return ⎟⎟⎠
⎞⎜⎜⎝
⎛BI
R = 6
0.551 = 0.09
Standard Deviation
σ = 1
2
−
⎟⎟⎠
⎞⎜⎜⎝
⎛−
nBI
RBI
R = 16
0.17−
= 0.184
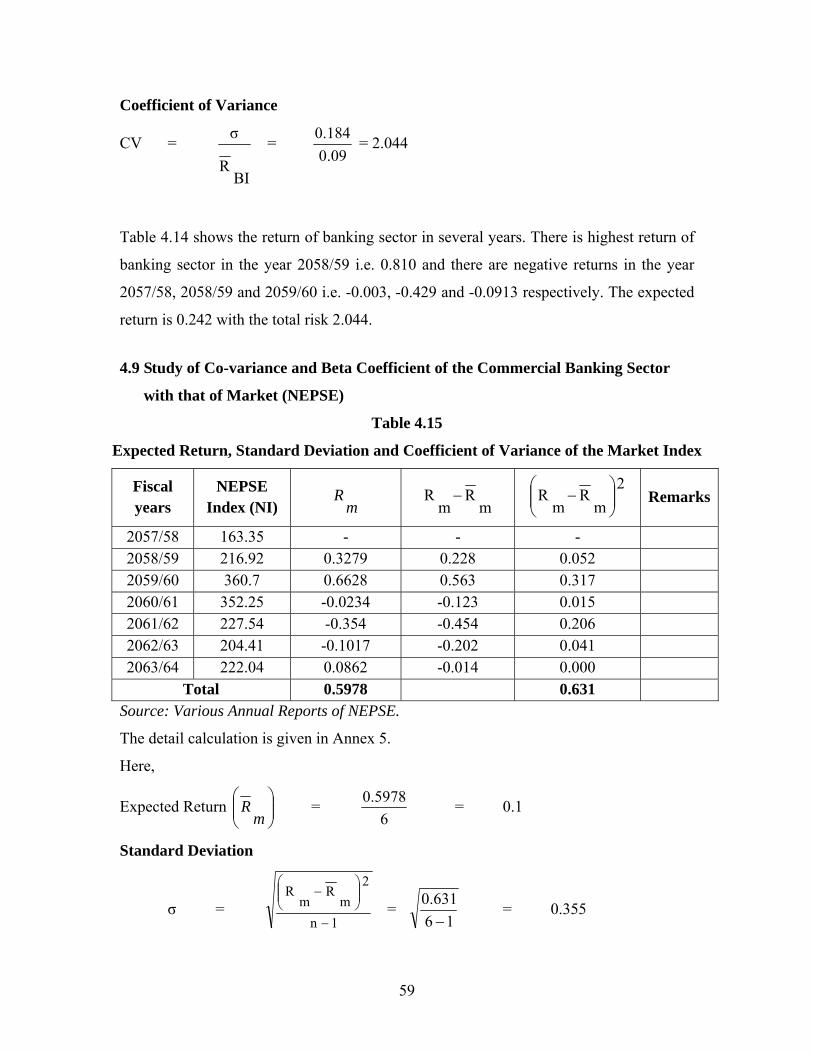
59
Coefficient of Variance
CV =
BIR
σ = 09.0
0.184 = 2.044
Table 4.14 shows the return of banking sector in several years. There is highest return of
banking sector in the year 2058/59 i.e. 0.810 and there are negative returns in the year
2057/58, 2058/59 and 2059/60 i.e. -0.003, -0.429 and -0.0913 respectively. The expected
return is 0.242 with the total risk 2.044.
4.9 Study of Co-variance and Beta Coefficient of the Commercial Banking Sector
with that of Market (NEPSE)
Table 4.15
Expected Return, Standard Deviation and Coefficient of Variance of the Market Index
Fiscal years
NEPSE Index (NI) m
R mR
mR −
2m
Rm
R ⎟⎟⎠
⎞⎜⎜⎝
⎛− Remarks
2057/58 163.35 - - - 2058/59 216.92 0.3279 0.228 0.052 2059/60 360.7 0.6628 0.563 0.317 2060/61 352.25 -0.0234 -0.123 0.015 2061/62 227.54 -0.354 -0.454 0.206 2062/63 204.41 -0.1017 -0.202 0.041 2063/64 222.04 0.0862 -0.014 0.000
Total 0.5978 0.631 Source: Various Annual Reports of NEPSE.
The detail calculation is given in Annex 5.
Here,
Expected Return ⎟⎟⎠
⎞⎜⎜⎝
⎛m
R = 6
5978.0 = 0.1
Standard Deviation
σ = 1n
2m
Rm
R
−
⎟⎟⎠
⎞⎜⎜⎝
⎛−
= 16
631.0−
= 0.355
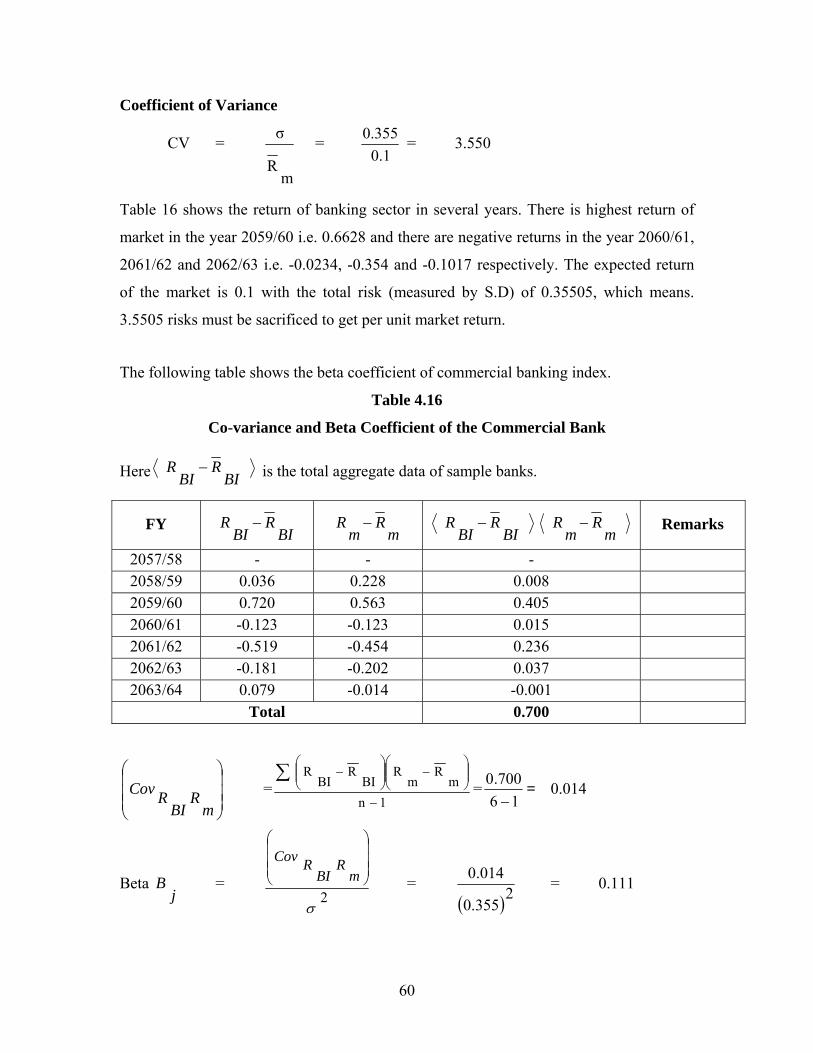
60
Coefficient of Variance
CV =
mR
σ = 1.0
355.0 = 3.550
Table 16 shows the return of banking sector in several years. There is highest return of
market in the year 2059/60 i.e. 0.6628 and there are negative returns in the year 2060/61,
2061/62 and 2062/63 i.e. -0.0234, -0.354 and -0.1017 respectively. The expected return
of the market is 0.1 with the total risk (measured by S.D) of 0.35505, which means.
3.5505 risks must be sacrificed to get per unit market return.
The following table shows the beta coefficient of commercial banking index.
Table 4.16
Co-variance and Beta Coefficient of the Commercial Bank
Here BIR
BIR − is the total aggregate data of sample banks.
FY BI
RBI
R − mR
mR − BI
RBI
R −m
Rm
R − Remarks
2057/58 - - - 2058/59 0.036 0.228 0.008 2059/60 0.720 0.563 0.405 2060/61 -0.123 -0.123 0.015 2061/62 -0.519 -0.454 0.236 2062/63 -0.181 -0.202 0.037 2063/64 0.079 -0.014 -0.001
Total 0.700
⎟⎟⎟
⎠
⎞
⎜⎜⎜
⎝
⎛
mR
BIRCov =
1nm
Rm
RBI
RBI
R
−
⎟⎟⎠
⎞⎜⎜⎝
⎛−⎟⎟
⎠
⎞⎜⎜⎝
⎛−∑
=16
700.0−
= 0.014
Beta j
B = 2
σ
⎟⎟⎟
⎠
⎞
⎜⎜⎜
⎝
⎛
mR
BIRCov
= ( )2355.0
014.0 = 0.111
61
Here the covariance is 0.014 beta-coefficients 0.111 of the commercial banking sector
with that of the market which seems good enough for the general investors to invest in
this sector.
4.9 Major Findings of the Study
This study enables investors to keep the returns they can expect and the risk they may
take into better perspective. Nepalese stock market is in effect of openness and
liberalization in national economy. But Nepalese individual investors cannot analyze the
securities as well as market properly because of the lack of information and poor
knowledge about the analysis of securities for investment.
• The return is the income received on a stock investment, which is usually expressed
in percentage. Expected return on common stock of NABIL is maximum (56.7%).
Similarly expected return of NIBL, SCBL, HBL, EBL and Bok are 37.9%, 28.26%,
29.52%, 52.79% and 37.1% respectively.
• Risk is the variability of returns which is measured in terms of standard deviation.
On the basis of standard deviation, common stock of NABIL is most risky since it
has high S.D i.e. 0.91. Common stock of SCBL has least risk because of its low S.D
of 0.33.
• On the other hand we know that C.V is more rational basis of investment decision,
which measures the risk per unit of return. On the basis of CV, common stock of
EBL is best among all other banks. EBL has 1.04 unit of risk per 1 unit of return.
But common stock of BoK has the highest risk per unit of return.
• Most of the investors invest only keeping the return in the mind but they are found
unable to calculate the risk factors of the security. Most of the Nepalese private
investors invest in single security. Some of the investors use their fund in two or
more securities. But it is found that they don't make any analysis of portfolio before
selecting security. They invest their fund in different securities on the basis of
expectation and assumption of individual securities rather than analysis of the effect
of portfolio. It seems that they don't have knowledge of the risk diversification by
using portfolio of their investment.
62
CHAPTER - V
SUMMARY, CONCLUSION AND RECOMMENDATIONS
5.1 Summary
In a developing economy like Nepal, capital market plays a vital role in making a
sustained and self-reliant growth of the economy. Capital market helps in the collection
and mobilization of the saving of the people which is much true even in case of Nepal.
Among the capital market too, the role of the security market is immense in the sense that
it offers a platform for the transaction of securities. In Nepal, NEPSE acts as a security
market where the transactions of the listed shares are performed. The NEPSE has 135
companies listed by the end of 2007. Among these listed companies, commercial banks
dominate the position in terms of amount traded, number of transactions and market
capitalization. Today, there are fifteen commercial banks listed in the NEPSE. Simply
saying, these banks collect deposits from the people and lend the same for investment and
thereby gain the profit in the transactions. Banks are making good profit in recent years
that is why general investors are more interested in making their investment in these
banks' shares.
But most of the general Nepalese investors are investing in the shares merely because of
the nice facts they have heard of or just for the sake of their interest. Proper analysis of
risk and return to decide their investment is nearly absent in the practice. They hardly
care for the risk- return behavior of the stocks before investing in them. Lack of
knowledge of the stocks' risk and return among the general investors and their investment
habit without thorough analysis of the coefficient of variance together with the
relationship between risk and return of a particular industry with that of total market risk
and return has been pinpointed as a major problem of this study.
Thus, describing the risk, return and other relevant variables that play role in stock
investment together with the analysis of risk, return and coefficient of variance have been
the major objectives of this report. And on the based of findings, the reports has
presented some valuable suggestions.
63
Risk of an investor in investment is nothing but the chance that his investment brings less
or no return and also the chance of losing all his investment. Return, on the other hand is
the gain an investor make from his investment in the stocks. Coefficient of variance
calculates risk per unit of return, useful especially in making investment decisions when
there are equal risks but different returns or equal returns but different risks among the
various stocks. In this aspect, expected rate of return for any stock is the weighted
average rate or return using the probability of each rate of return as the weight whereas
required rate of return is composed of a risk-free interest rate and a risk premium rate.
The study has adopted historical and analytical research design. The data utilized are
mostly secondary in nature. Various financial and statistical tools are applied to
synthesize and present the data. Among the fifteen commercial banks listed in the
NEPSE, eight earlier established banks are taken as the sample for the study. Data of the
last seven year are used for the study. Market price per share and dividend per share of
the banks are used to analyze the risk and returns of the banks together with the NEPSE
index of the banking sector and other industries are used.
Nabil Bank Limited was established in 1984 as the first joint venture commercial bank.
The expected return of the bank for the period studied was 56.7% with standard deviation
of 91% and coefficient of variance 1.6. Similarly, returns and risks of NIBL, SCBL and
HBL were 37.9%, 28%; 29.52%; and 61.6%, 33%, 45% respectively. The coefficients of
variance for these banks were 1.62, 1.19 and 1.515 respectively for the period studied.
EBL and BoK had expected rate of return for the period studied as 52.79% and 37.1%
respectively. The standard deviations for these banks for the same period were 54.86%
and 72% respectively. However, the coefficient of variance for EBL was 1.0392, for BoK
was 1.941.
The expected return, standard deviation and coefficient of variance of commercial
banking sector were 24.2%, 63.2% and 2.613 respectively. Similarly, the expected return,
standard deviation and coefficient of variance of market index were 10%, 35.5% and
3.550. Covariance and beta coefficient of commercial bank with market index were -
64
0.068 and -0.540 respectively which seems good enough for the general investors to
invest in this sector.
5.2 Conclusion
The expected return of EBL and NABIL are highest among the sampled banks i.e 56.7%
and 52.79% respectively. However, SCBL has lowest expected rate of return which is
28.26% followed by HBL with 29.52% expected rate of return. Analyzing the standard
deviation of the sampled banks, SCBL is in the best position with standard deviation of
0.33. NABIL is in the worst position with standard deviation as high as 0.91. The
coefficient of variance is worst for BoK which is 1.941. All the sampled joint-venture
commercial banks have positive expected rate of return. However, the commercial
banking sectors have positive return together with market sector.
5.3 Recommendations
Mainly this study is focused on individual investors. Other related components of stock
are also taken into account to some extent. The following recommendation and
suggestion are prescribed on the basis of data analysis and major findings of this
research.
1. Shares of commercial banking sector are more lucrative for the investors to invest.
it is safer for the Nepalese investors to invest in this sector.
2. The covariance and beta-coefficient of the commercial banking sector with that of
the market are also good enough for the general investors to invest in this sector.
3. Among the commercial banking sector too, investors should invest in shares of EBL
as their coefficient of variance are good than other sampled commercial banks.
However, NABIL, NIBL and BoK are more risky at the present time to invest in its
share than other selected banks.
4. Analysis of personal risk, attitude, needs and requirements will be helpful before
making an investment in stock market. Investors should make several discussions
with stock holder before reaching at the decision. Investors should make their
decision on the basis of reliable information rather than the imagination and rumors.

65
5. Broker firms are good way to exchange and share investment ideas. Mutual fund is
worth while for people with little interest in investment. Investors are recommended
to share experience, ideas and take view of expert before investing in stocks of
individual banks.

BIBLIOGRAPHY
Books
Alibe, Akigbe and Marie, Whyte (2004). The Gramn-Leach Billey Act of 1999: Risk-
Implications for the Financial Service Industry.
Brigham, E.F., and Houstan, J.F. (1996) Managerial Finance. London: Hold-Saunders
International Edition
Francis, J.C. (1997). Investment Analysis and Management. New York: McGraw Hill
Publication.
Hampton, J. (1998). Financial Decision Making. New Delhi: Prentice Hall of India Pvt.
Ltd.
Loric, J.D. and Kempton (1985). The Stock Market Theories and Evidence. Prentice Hall
of India Pvt. Ltd.
Sharpet, W.F., Alexander, G.J. and Bailey, G.V. (1995). Investment. USA: Prentice Hall
of India.
Sheridon, T., & Grinblantt, M. (1998) Financial Management. New York: McGraw-Hill
Publication
Van Horne, J.C. (1997). Financial Management and Policy. New Delhi: Prentice Hall of
India Pvt. Ltd.
Weston and Brigham (1982). Managerial Finance. London: Hold-Saunders International
Edition.
Wolff, H.K. and Pant, P.R. (2003). A Hand Book for Social Science Research and Thesis
Writing. Kathmandu: Buddha Academy.
Journals, Reports and Articles
Bank of Kathmandu. (2057/58-2063/64). Annual Report.
Everest Bank Limited. (2057/58-2063/64). Annual Report.
Himalayan Bank Limited. (2057/58-2063/64). Annual Report.
NABIL Bank Limited. (2057/58-2063/64). Annual Report.
Nepal Investment Bank Limited. (2057/58-2063/64). Annual Report.
Rouwenhost, K. Great (1999). Local Return Factors and The Turnover in Emerging
Markets. The Journal Of Finance.
Security Board of Nepal. (2057/58-2063/64), Annual Report, Kathmandu: SEBON
Standard Chartered Bank Limited. (2057/58-2063/64). Annual Report.
Thesis
Khatiwada, Mohan (1996). Risk Analysis of Commercial Banks. An Unpublished MBA
Thesis, T.U, Kathmandu.
Sapkota, Jeet Bahadur (2001). Risk and Return Analysis of Commercial Bank. An
Unpublished MBA Thesis, T.U, Kathmandu.
Shrestha, Sumita (2003). Stock Market and Investment. An Unpublished MBA Thesis,
T.U, Kathmandu.

ANNEX-1 Calculation of Total Dividend
Nabil Bank Limited (NABIL): Total Dividend in (Rs.)= Cash Dividend + % of stock Dividend × Next Year MPS
2057/58 = 40 + 20% × 700 = Rs. 180 2058/59 = 30 + 0% × 740 = Rs. 30 2059/60 = 50 + 0% × 1000 = Rs. 50 2060/61 = 65 + 0% × 1505 = Rs. 65 2061/62 = 70 + 0% × 2240 = Rs. 70 2062/63 = 85 + 0% × 5050 = Rs. 85 2063/64 = 5 + 40% × 5375 = Rs. 2155
Nepal Investment Bank Limited (NIBL): Total Dividend in (Rs.)= Cash Dividend + % of stock Dividend × Next Year MPS
2057/58 = 0 + 0% × 760 = Rs. 0 2058/59 = 0 + 30% × 795 = Rs. 238 2059/60 = 20 + 0% × 940 = Rs. 20 2060/61 = 15 + 0% × 800 = Rs. 15 2061/62 = 12.5 + 0% × 1260 = Rs. 12.50 2062/63 = 20 + 35.46% × 1729 = Rs. 633.10 2063/64 = 5 + 25% × 2660 = Rs. 670
Standard Chartered Bank Limited: Total Dividend in (Rs.)= Cash Dividend + % of stock Dividend × Next Year MPS
2057/58 = 100 + 0% × 1575 = Rs. 100 2058/59 = 100 + 0% × 1640 = Rs. 100 2059/60 = 120 + 0% × 1745 = Rs. 120 2060/61 = 110 + 0% × 2345 = Rs. 110 2061/62 = 120 + 0% × 3775 = Rs. 120 2062/63 = 140 + 0% × 5900 = Rs. 140 2063/64 = 80 + 0% × 6745 = Rs. 80
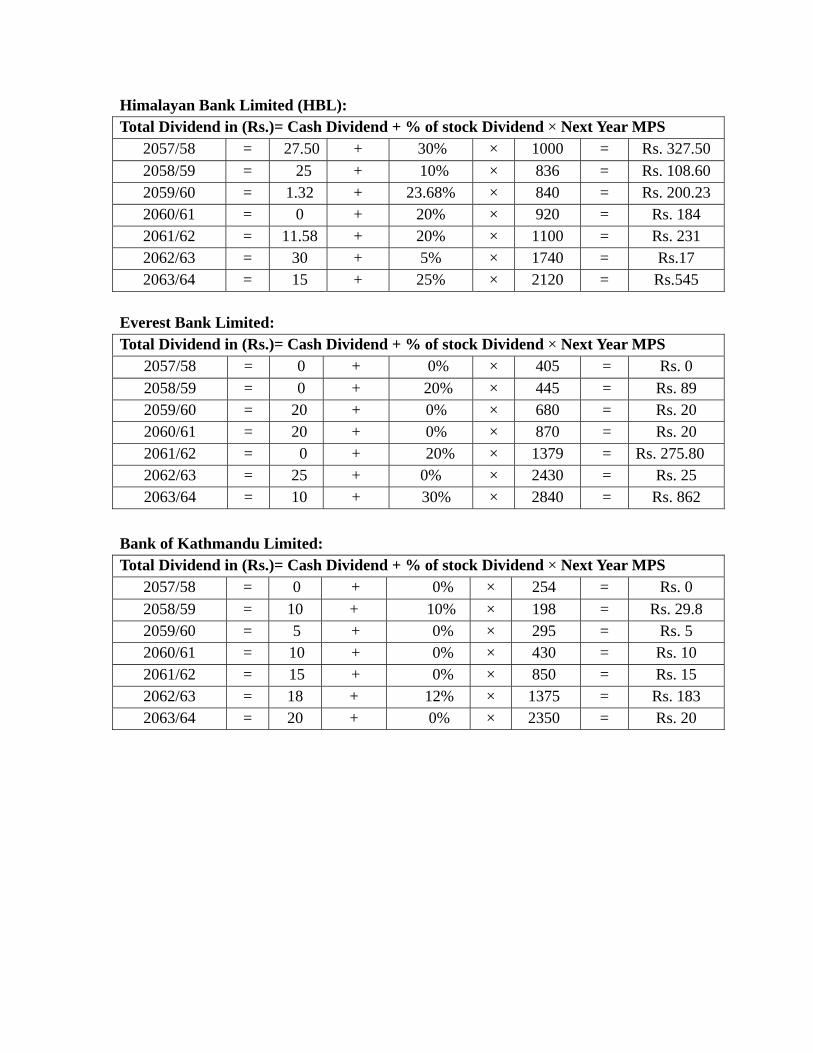
Himalayan Bank Limited (HBL): Total Dividend in (Rs.)= Cash Dividend + % of stock Dividend × Next Year MPS
2057/58 = 27.50 + 30% × 1000 = Rs. 327.50 2058/59 = 25 + 10% × 836 = Rs. 108.60 2059/60 = 1.32 + 23.68% × 840 = Rs. 200.23 2060/61 = 0 + 20% × 920 = Rs. 184 2061/62 = 11.58 + 20% × 1100 = Rs. 231 2062/63 = 30 + 5% × 1740 = Rs.17 2063/64 = 15 + 25% × 2120 = Rs.545
Everest Bank Limited: Total Dividend in (Rs.)= Cash Dividend + % of stock Dividend × Next Year MPS
2057/58 = 0 + 0% × 405 = Rs. 0 2058/59 = 0 + 20% × 445 = Rs. 89 2059/60 = 20 + 0% × 680 = Rs. 20 2060/61 = 20 + 0% × 870 = Rs. 20 2061/62 = 0 + 20% × 1379 = Rs. 275.80 2062/63 = 25 + 0% × 2430 = Rs. 25 2063/64 = 10 + 30% × 2840 = Rs. 862
Bank of Kathmandu Limited: Total Dividend in (Rs.)= Cash Dividend + % of stock Dividend × Next Year MPS
2057/58 = 0 + 0% × 254 = Rs. 0 2058/59 = 10 + 10% × 198 = Rs. 29.8 2059/60 = 5 + 0% × 295 = Rs. 5 2060/61 = 10 + 0% × 430 = Rs. 10 2061/62 = 15 + 0% × 850 = Rs. 15 2062/63 = 18 + 12% × 1375 = Rs. 183 2063/64 = 20 + 0% × 2350 = Rs. 20
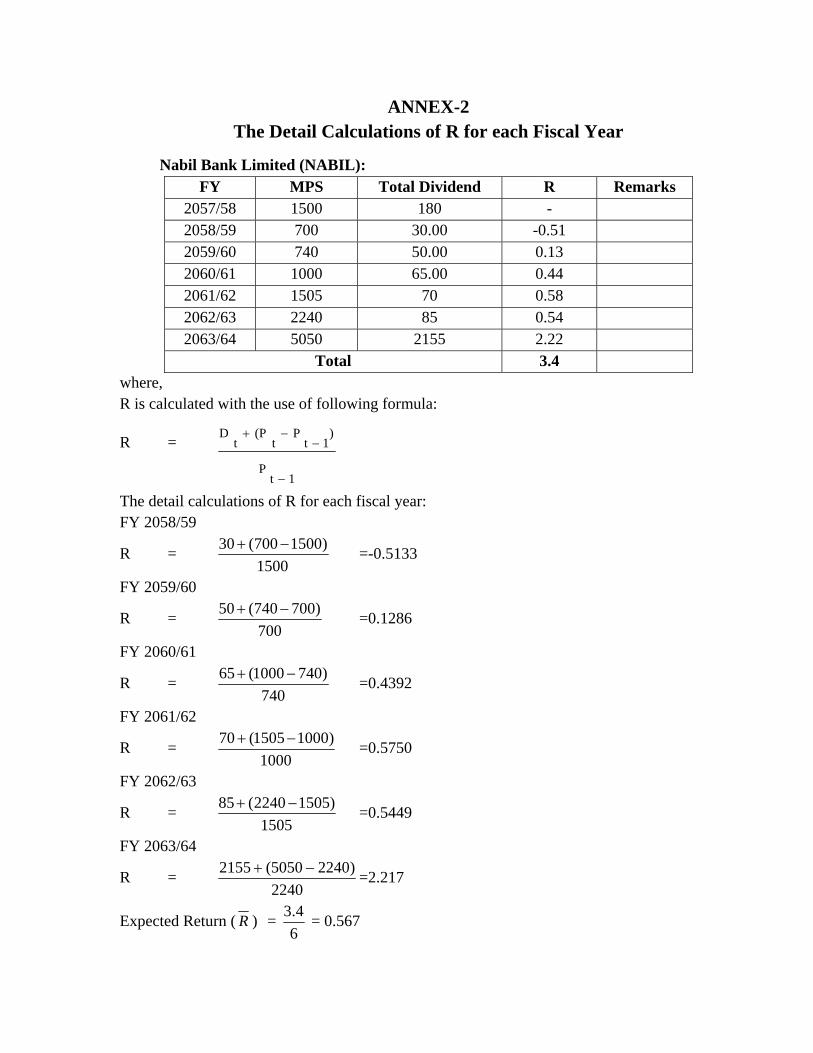
ANNEX-2 The Detail Calculations of R for each Fiscal Year
Nabil Bank Limited (NABIL): FY MPS Total Dividend R Remarks
2057/58 1500 180 - 2058/59 700 30.00 -0.51 2059/60 740 50.00 0.13 2060/61 1000 65.00 0.44 2061/62 1505 70 0.58 2062/63 2240 85 0.54 2063/64 5050 2155 2.22
Total 3.4 where, R is calculated with the use of following formula:
R =
1tP
)1t
Pt
(Pt
D
−
−−+
The detail calculations of R for each fiscal year: FY 2058/59
R = 1500
)1500700(30 −+ =-0.5133
FY 2059/60
R = 700
)700740(50 −+ =0.1286
FY 2060/61
R = 740
)7401000(65 −+ =0.4392
FY 2061/62
R = 1000
)10001505(70 −+ =0.5750
FY 2062/63
R = 1505
)15052240(85 −+ =0.5449
FY 2063/64
R = 2240
)22405050(2155 −+ =2.217
Expected Return ( R ) = 64.3 = 0.567
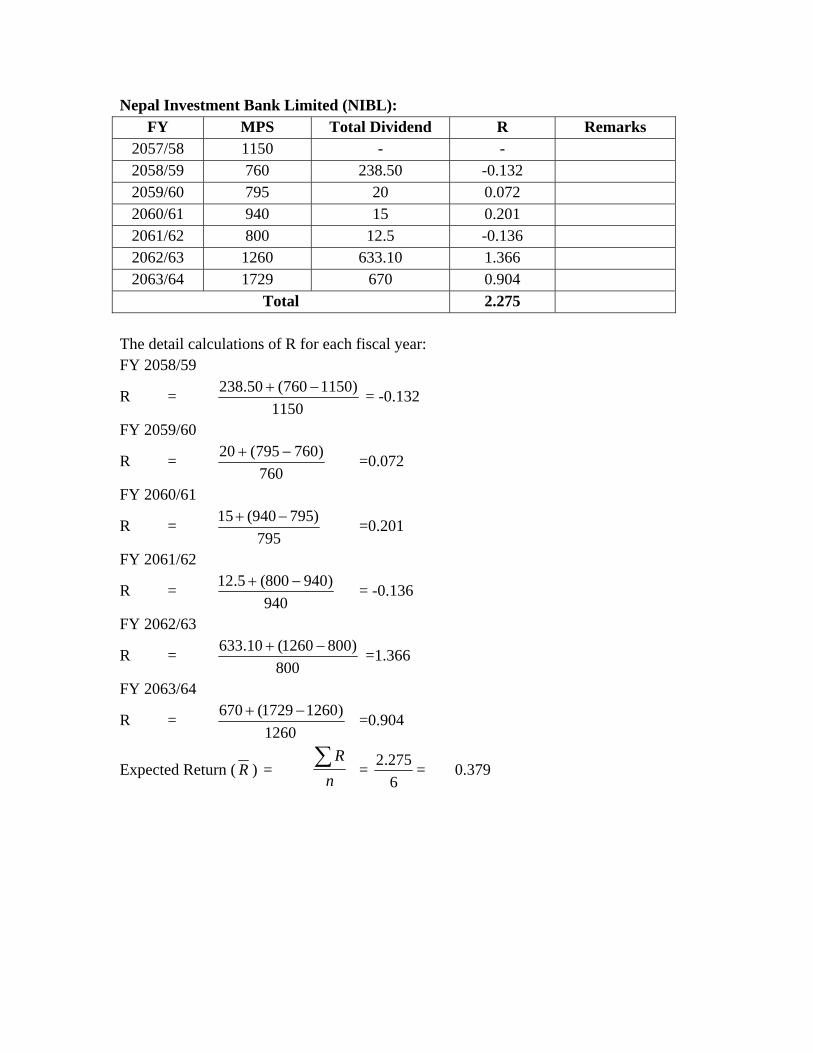
Nepal Investment Bank Limited (NIBL): FY MPS Total Dividend R Remarks
2057/58 1150 - - 2058/59 760 238.50 -0.132 2059/60 795 20 0.072 2060/61 940 15 0.201 2061/62 800 12.5 -0.136 2062/63 1260 633.10 1.366 2063/64 1729 670 0.904
Total 2.275 The detail calculations of R for each fiscal year: FY 2058/59
R = 1150
)1150760(50.238 −+ = -0.132
FY 2059/60
R = 760
)760795(20 −+ =0.072
FY 2060/61
R = 795
)795940(15 −+ =0.201
FY 2061/62
R = 940
)940800(5.12 −+ = -0.136
FY 2062/63
R = 800
)8001260(10.633 −+ =1.366
FY 2063/64
R = 1260
)12601729(670 −+ =0.904
Expected Return ( R ) = n
R∑ = 6275.2 = 0.379

Standard Chartered Bank Limited:
FY MPS Total Dividend R Remarks 2057/58 2144 - - 2058/59 1575 100 -02188 2059/60 1640 120 0.1175 2060/61 1745 110 0.1311 2061/62 2345 120 0.4126 2062/63 3775 140 0.6695 2063/64 5900 80 0.5841
Total 1.696 The detail calculations of R for each fiscal year: FY 2058/59
R = 2144
)21441575(100 −+ =-0.2188
FY 2059/60
R = 1575
)15751640(120 −+ =0.1175
FY 2060/61
R = 1640
)16401745(110 −+ =0.1311
FY 2061/62
R = 1745
)17452345(120 −+ =0.4126
FY 2062/63
R = 2345
)23453775(140 −+ =0.6695
FY 2063/64
R = 3775
)37755900(80 −+ =0.5841
Expected Return ( R ) = 6696.1 = 0.2826
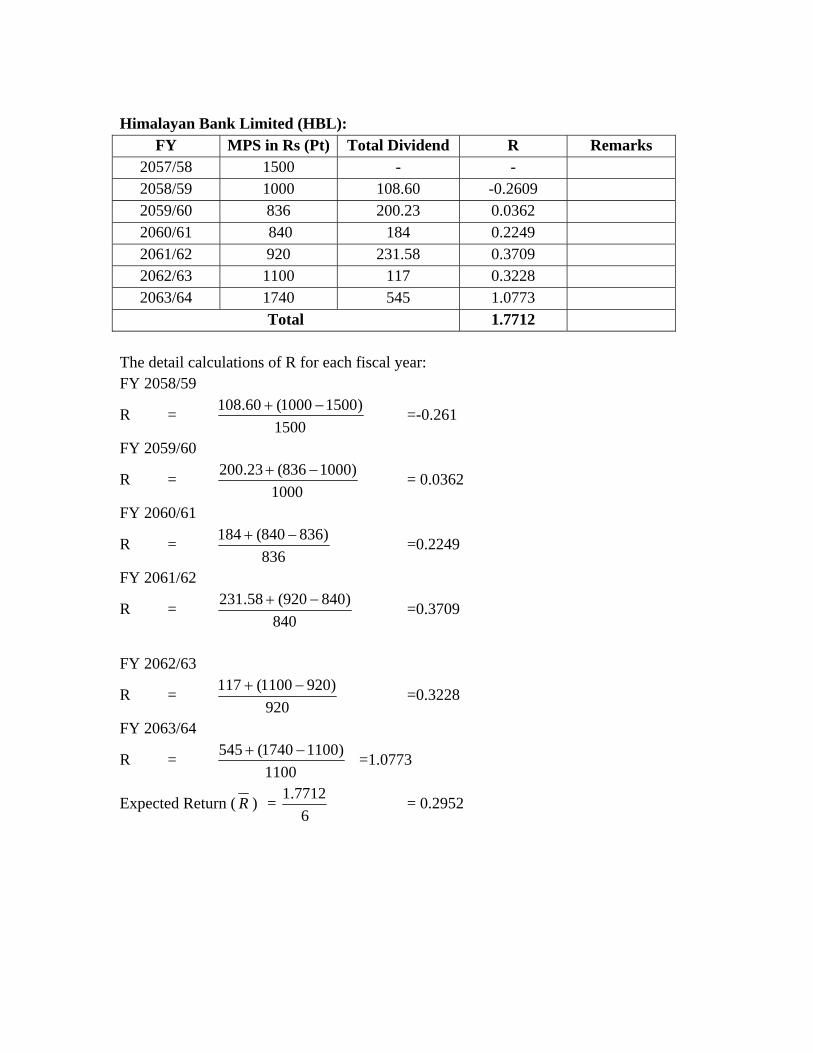
Himalayan Bank Limited (HBL):
FY MPS in Rs (Pt) Total Dividend R Remarks 2057/58 1500 - - 2058/59 1000 108.60 -0.2609 2059/60 836 200.23 0.0362 2060/61 840 184 0.2249 2061/62 920 231.58 0.3709 2062/63 1100 117 0.3228 2063/64 1740 545 1.0773
Total 1.7712 The detail calculations of R for each fiscal year: FY 2058/59
R = 1500
)15001000(60.108 −+ =-0.261
FY 2059/60
R = 1000
)1000836(23.200 −+ = 0.0362
FY 2060/61
R = 836
)836840(184 −+ =0.2249
FY 2061/62
R = 840
)840920(58.231 −+ =0.3709
FY 2062/63
R = 920
)9201100(117 −+ =0.3228
FY 2063/64
R = 1100
)11001740(545 −+ =1.0773
Expected Return ( R ) = 6
7712.1 = 0.2952
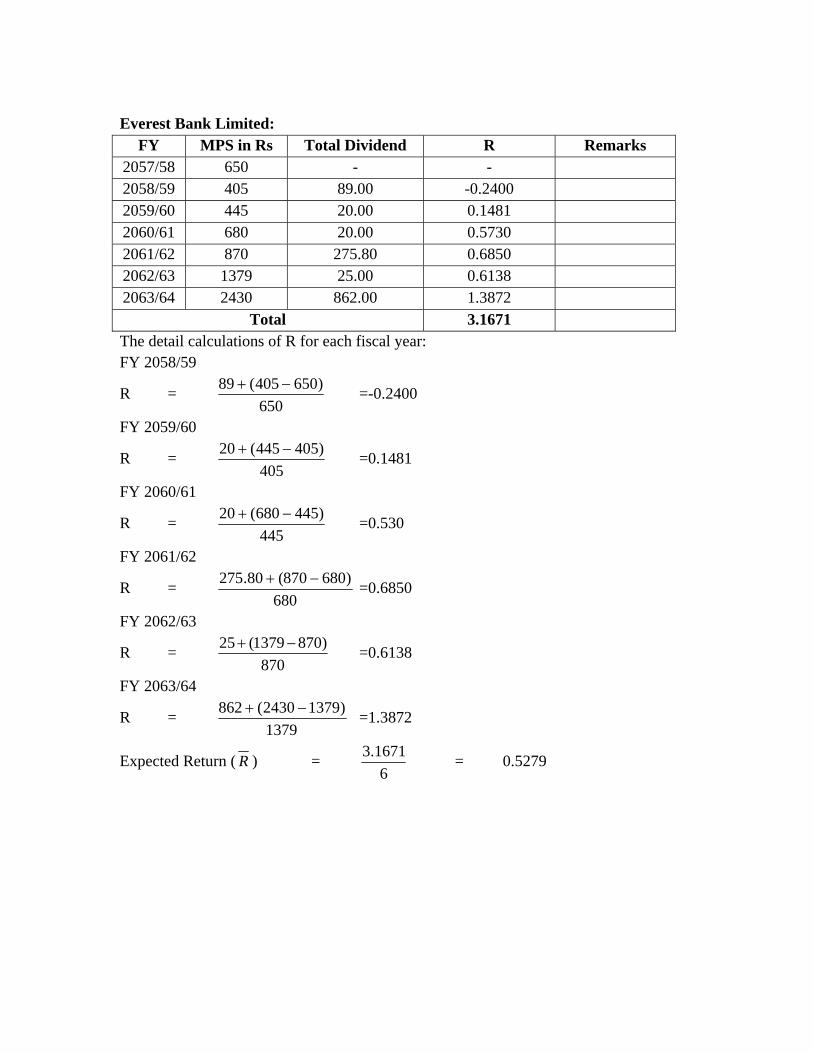
Everest Bank Limited:
FY MPS in Rs Total Dividend R Remarks 2057/58 650 - - 2058/59 405 89.00 -0.2400 2059/60 445 20.00 0.1481 2060/61 680 20.00 0.5730 2061/62 870 275.80 0.6850 2062/63 1379 25.00 0.6138 2063/64 2430 862.00 1.3872
Total 3.1671 The detail calculations of R for each fiscal year: FY 2058/59
R = 650
)650405(89 −+ =-0.2400
FY 2059/60
R = 405
)405445(20 −+ =0.1481
FY 2060/61
R = 445
)445680(20 −+ =0.530
FY 2061/62
R = 680
)680870(80.275 −+ =0.6850
FY 2062/63
R = 870
)8701379(25 −+ =0.6138
FY 2063/64
R = 1379
)13792430(862 −+ =1.3872
Expected Return ( R ) = 6
3.1671 = 0.5279
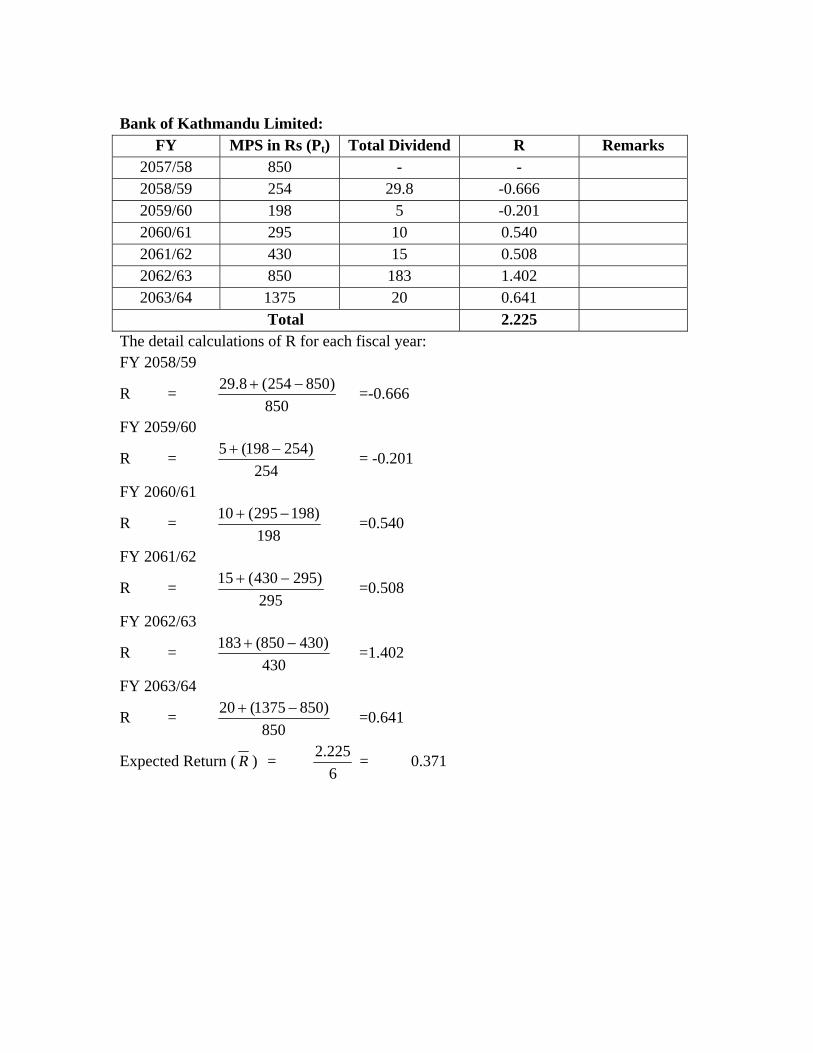
Bank of Kathmandu Limited:
FY MPS in Rs (Pt) Total Dividend R Remarks 2057/58 850 - - 2058/59 254 29.8 -0.666 2059/60 198 5 -0.201 2060/61 295 10 0.540 2061/62 430 15 0.508 2062/63 850 183 1.402 2063/64 1375 20 0.641
Total 2.225 The detail calculations of R for each fiscal year: FY 2058/59
R = 850
)850254(8.29 −+ =-0.666
FY 2059/60
R = 254
)254198(5 −+ = -0.201
FY 2060/61
R = 198
)198295(10 −+ =0.540
FY 2061/62
R = 295
)295430(15 −+ =0.508
FY 2062/63
R = 430
)430850(183 −+ =1.402
FY 2063/64
R = 850
)8501375(20 −+ =0.641
Expected Return ( R ) = 6
2.225 = 0.371
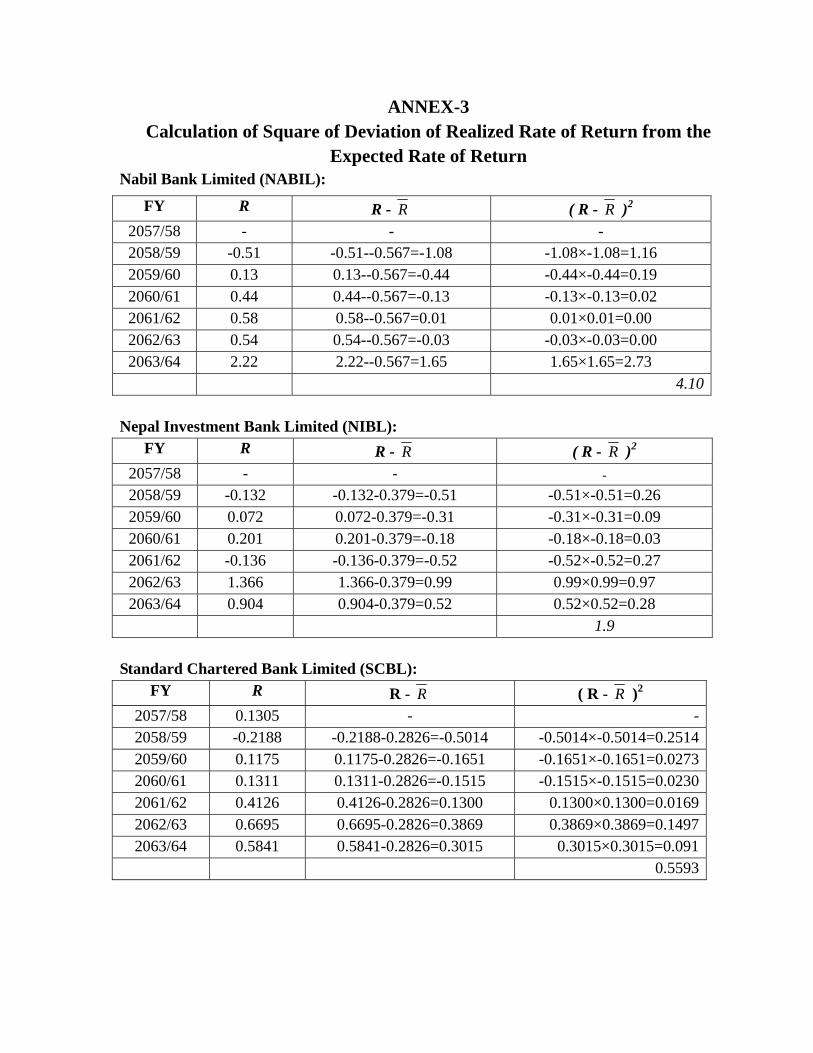
ANNEX-3 Calculation of Square of Deviation of Realized Rate of Return from the
Expected Rate of Return Nabil Bank Limited (NABIL):
Nepal Investment Bank Limited (NIBL):
FY R R - R ( R - R )2
2057/58 - - - 2058/59 -0.132 -0.132-0.379=-0.51 -0.51×-0.51=0.26 2059/60 0.072 0.072-0.379=-0.31 -0.31×-0.31=0.09 2060/61 0.201 0.201-0.379=-0.18 -0.18×-0.18=0.03 2061/62 -0.136 -0.136-0.379=-0.52 -0.52×-0.52=0.27 2062/63 1.366 1.366-0.379=0.99 0.99×0.99=0.97 2063/64 0.904 0.904-0.379=0.52 0.52×0.52=0.28
1.9 Standard Chartered Bank Limited (SCBL):
FY R R - R ( R - R )2
2057/58 0.1305 - -2058/59 -0.2188 -0.2188-0.2826=-0.5014 -0.5014×-0.5014=0.25142059/60 0.1175 0.1175-0.2826=-0.1651 -0.1651×-0.1651=0.02732060/61 0.1311 0.1311-0.2826=-0.1515 -0.1515×-0.1515=0.02302061/62 0.4126 0.4126-0.2826=0.1300 0.1300×0.1300=0.01692062/63 0.6695 0.6695-0.2826=0.3869 0.3869×0.3869=0.14972063/64 0.5841 0.5841-0.2826=0.3015 0.3015×0.3015=0.091
0.5593
FY R R - R ( R - R )2
2057/58 - - - 2058/59 -0.51 -0.51--0.567=-1.08 -1.08×-1.08=1.16 2059/60 0.13 0.13--0.567=-0.44 -0.44×-0.44=0.19 2060/61 0.44 0.44--0.567=-0.13 -0.13×-0.13=0.02 2061/62 0.58 0.58--0.567=0.01 0.01×0.01=0.00 2062/63 0.54 0.54--0.567=-0.03 -0.03×-0.03=0.00 2063/64 2.22 2.22--0.567=1.65 1.65×1.65=2.73
4.10
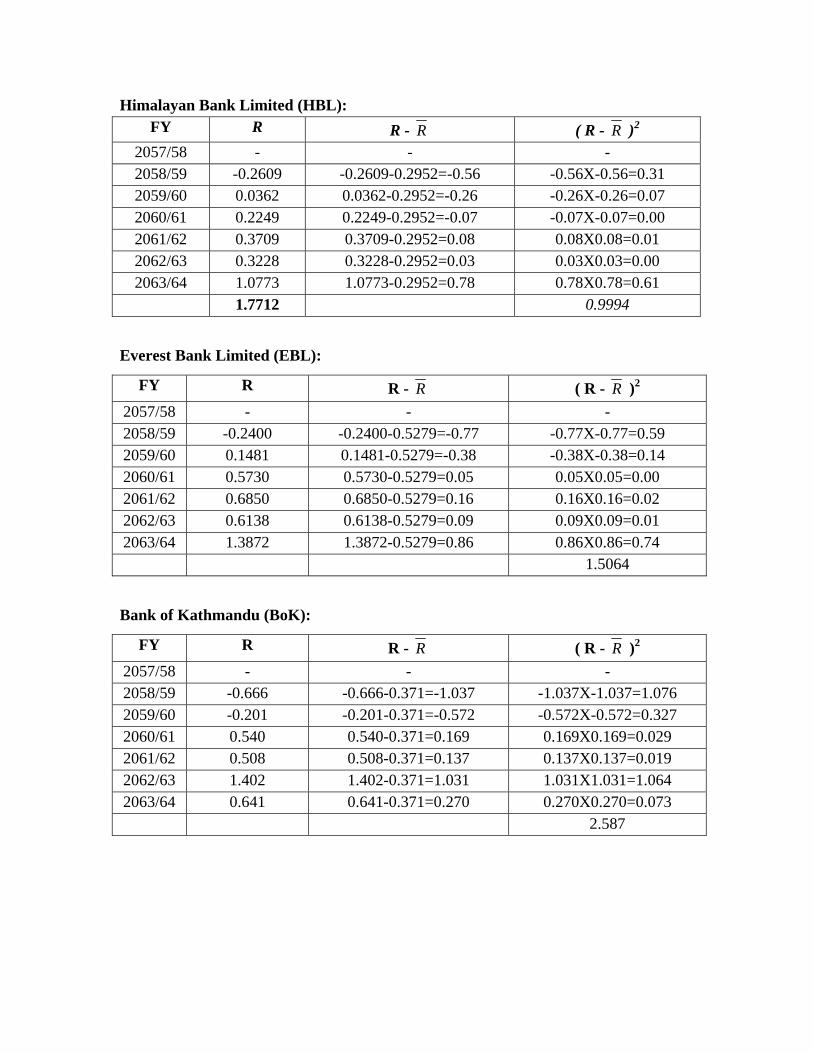
Himalayan Bank Limited (HBL): FY R R - R ( R - R )2
2057/58 - - - 2058/59 -0.2609 -0.2609-0.2952=-0.56 -0.56X-0.56=0.31 2059/60 0.0362 0.0362-0.2952=-0.26 -0.26X-0.26=0.07 2060/61 0.2249 0.2249-0.2952=-0.07 -0.07X-0.07=0.00 2061/62 0.3709 0.3709-0.2952=0.08 0.08X0.08=0.01 2062/63 0.3228 0.3228-0.2952=0.03 0.03X0.03=0.00 2063/64 1.0773 1.0773-0.2952=0.78 0.78X0.78=0.61
1.7712 0.9994
Everest Bank Limited (EBL):
FY R R - R ( R - R )2
2057/58 - - - 2058/59 -0.2400 -0.2400-0.5279=-0.77 -0.77X-0.77=0.59 2059/60 0.1481 0.1481-0.5279=-0.38 -0.38X-0.38=0.14 2060/61 0.5730 0.5730-0.5279=0.05 0.05X0.05=0.00 2061/62 0.6850 0.6850-0.5279=0.16 0.16X0.16=0.02 2062/63 0.6138 0.6138-0.5279=0.09 0.09X0.09=0.01 2063/64 1.3872 1.3872-0.5279=0.86 0.86X0.86=0.74
1.5064
Bank of Kathmandu (BoK):
FY R R - R ( R - R )2
2057/58 - - - 2058/59 -0.666 -0.666-0.371=-1.037 -1.037X-1.037=1.076 2059/60 -0.201 -0.201-0.371=-0.572 -0.572X-0.572=0.327 2060/61 0.540 0.540-0.371=0.169 0.169X0.169=0.029 2061/62 0.508 0.508-0.371=0.137 0.137X0.137=0.019 2062/63 1.402 1.402-0.371=1.031 1.031X1.031=1.064 2063/64 0.641 0.641-0.371=0.270 0.270X0.270=0.073
2.587

ANNEX-4
Calculation of BIR , BI
RBI
R − , 2⎟⎟⎠
⎞⎜⎜⎝
⎛−
BIR
BIR of Banking Sector
Fiscal years
Banking Index (BI) BI
R =
1
1
−
−−
tBI
tBI
tBI
BI
RBI
R − 2⎟⎟⎠
⎞⎜⎜⎝
⎛−
BIR
BIR
2057/58 194.95 - - -
2058/59 219.44 95.19495.19444.219 − =-0.126 -0.126-0.09=0.036 0.036X0.036=0.001
2059/60 397.17 44.21944.21917.397 − =-0.810 -0.810-0.09=0.720 0.720X0.720=0.518
2060/61 384.08 17.39717.39708.384 − =-0.033 -0.033-0.09=-0.123 -0.123X-0.123=0.015
2061/62 219.35 08.38408.38435.219 − =-0.429 -0.429-0.09=-0.519 -0.519X-0.519=0.269
2062/63 199.33 35.21935.21933.199 − =-0.091 -0.091-0.09=-0.181 -0.151X-0.151=0.033
2063/64 232.97 33.19933.19997.232 − =0.169 0.169-0.09=0.079 0.079X0.079=0.006
Total 0.551 0.17
Expected Return ⎟⎟⎠
⎞⎜⎜⎝
⎛BI
R = 6551.0 = 0.09
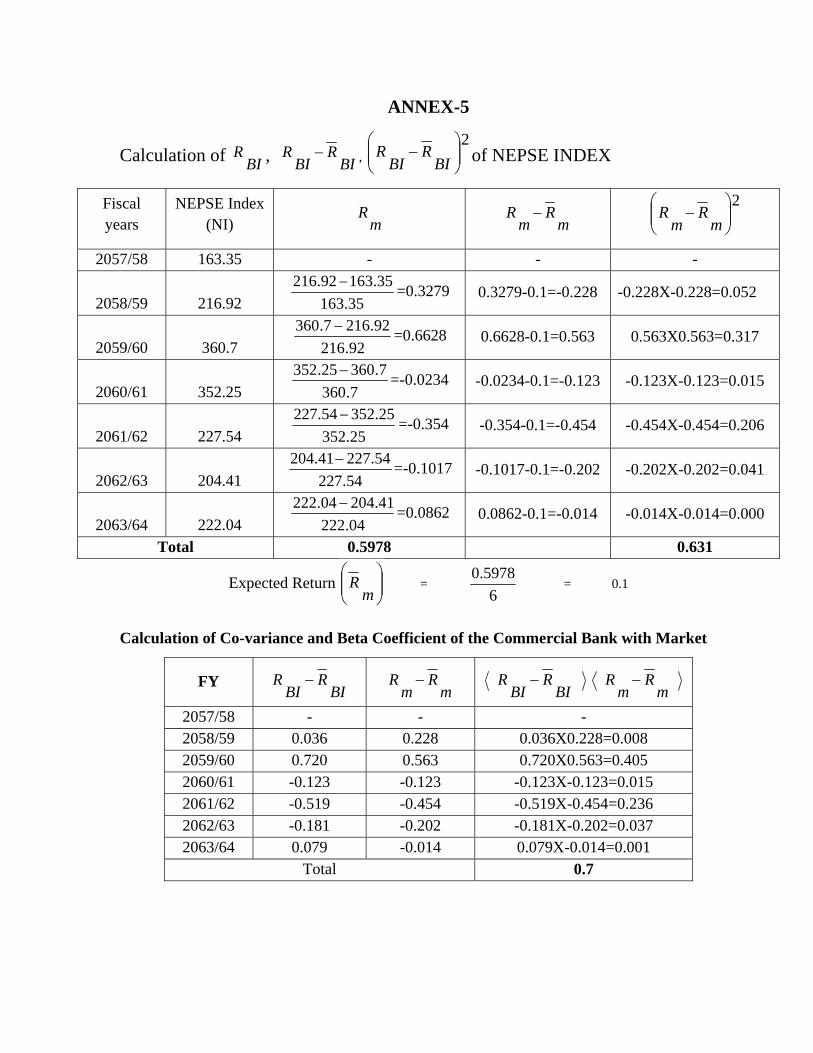
ANNEX-5
Calculation of BIR , BI
RBI
R − , 2⎟⎟⎠
⎞⎜⎜⎝
⎛−
BIR
BIR of NEPSE INDEX
Fiscal years
NEPSE Index (NI) m
R mR
mR −
2⎟⎟⎠
⎞⎜⎜⎝
⎛−
mR
mR
2057/58 163.35 - - -
2058/59 216.92 35.16335.16392.216 − =0.3279 0.3279-0.1=-0.228 -0.228X-0.228=0.052
2059/60 360.7 92.21692.2167.360 − =0.6628 0.6628-0.1=0.563 0.563X0.563=0.317
2060/61 352.25 7.3607.36025.352 − =-0.0234 -0.0234-0.1=-0.123 -0.123X-0.123=0.015
2061/62 227.54 25.35225.35254.227 − =-0.354 -0.354-0.1=-0.454 -0.454X-0.454=0.206
2062/63 204.41 54.22754.22741.204 − =-0.1017 -0.1017-0.1=-0.202 -0.202X-0.202=0.041
2063/64 222.04 04.22241.20404.222 − =0.0862 0.0862-0.1=-0.014 -0.014X-0.014=0.000
Total 0.5978 0.631
Expected Return ⎟⎟⎠
⎞⎜⎜⎝
⎛m
R = 6
5978.0 = 0.1
Calculation of Co-variance and Beta Coefficient of the Commercial Bank with Market
FY BI
RBI
R − mR
mR − BI
RBI
R −m
Rm
R −
2057/58 - - - 2058/59 0.036 0.228 0.036X0.228=0.008 2059/60 0.720 0.563 0.720X0.563=0.405 2060/61 -0.123 -0.123 -0.123X-0.123=0.015 2061/62 -0.519 -0.454 -0.519X-0.454=0.236 2062/63 -0.181 -0.202 -0.181X-0.202=0.037 2063/64 0.079 -0.014 0.079X-0.014=0.001
Total 0.7

⎟⎟⎟
⎠
⎞
⎜⎜⎜
⎝
⎛
mR
BIRCov =
1−
⎟⎟⎠
⎞⎜⎜⎝
⎛−⎟⎟
⎠
⎞⎜⎜⎝
⎛−∑
nm
Rm
RBI
RBI
R =
167.0−
=0.014
Beta jB =
2σ
⎟⎟⎟
⎠
⎞
⎜⎜⎜
⎝
⎛
mR
BIRCov
= ( )2355.0
014.0 = 0.111