Exchange rate movements and the stock returns of U.S. commercial banks
10
J BUSN RES 1991x22:233-242 233 Exchange Rate Movements and the Stock Returns of U. S. Commercial Banks John M. Harris Clemson University M. Wayne Marr Clemson University Michael F. Spivey Clemson Universitv This article investigates the correlation between exchange rates and the stock re- turns of a portfolio of commercial banks. The results provide some evidence that bank stocks are, on average, sensitive to foreign exchange rate movements. The results also suggest significant cross-sectional variation in the sensitivity of bank stock returns to exchange rate movements. Similar to a study of U.S. nonfinancial multinationals, this study finds evidence that the relationship of stock returns and exchange rates may be correlated with the degree of the firm’s foreign operations. Introduction Over the past 2 decades U.S. banks have rapidly increased their borrowing and lending activities in foreign markets. At the same time volatility in the exchange rate of the dollar has increased. Fluctuations in the value of assets and liabilities that result from changes in exchange rates may expose banks to substantial risks, if they are not properly hedged (see Adler and Dumas, 1984). While a variety of well-known mechanisms exist for hedging their exposure to exchange rate risk, the extent to which banks effectively utilize these mechanisms remains an unanswered empirical question (see Dufey and Srinvasulu, 1984). In many ways the issue of bank exposure to exchange rate risk is similar to the issue of their exposure to interest rate risk. Both interest rates and exchange rates reflect market forces that are to an extent unpredictable and outside the control of the banks. Banks can hedge interest rate risk by matching the maturities of their assets and liabilities or by utilizing interest rate futures and option markets. Sim- Address correspondence to: John M. Harris, Department of Finance, Clemson University, Clemson, SC 29634. 1323 Journal of Business Research 22, 233-242 (1991) 0 1991 Elsevier Science Publishing Co., Inc. 014%2963/91/$3.50 655 Avenue of the Americas, New York, NY lW10
-
Upload
independent -
Category
Documents
-
view
2 -
download
0
Transcript of Exchange rate movements and the stock returns of U.S. commercial banks

J BUSN RES 1991x22:233-242
233
Exchange Rate Movements and the Stock Returns of U. S. Commercial Banks
John M. Harris Clemson University
M. Wayne Marr Clemson University
Michael F. Spivey Clemson Universitv
This article investigates the correlation between exchange rates and the stock re- turns of a portfolio of commercial banks. The results provide some evidence that bank stocks are, on average, sensitive to foreign exchange rate movements. The results also suggest significant cross-sectional variation in the sensitivity of bank stock returns to exchange rate movements. Similar to a study of U.S. nonfinancial multinationals, this study finds evidence that the relationship of stock returns and exchange rates may be correlated with the degree of the firm’s foreign operations.
Introduction
Over the past 2 decades U.S. banks have rapidly increased their borrowing and lending activities in foreign markets. At the same time volatility in the exchange rate of the dollar has increased. Fluctuations in the value of assets and liabilities that result from changes in exchange rates may expose banks to substantial risks, if they are not properly hedged (see Adler and Dumas, 1984). While a variety of well-known mechanisms exist for hedging their exposure to exchange rate risk, the extent to which banks effectively utilize these mechanisms remains an unanswered empirical question (see Dufey and Srinvasulu, 1984).
In many ways the issue of bank exposure to exchange rate risk is similar to the issue of their exposure to interest rate risk. Both interest rates and exchange rates reflect market forces that are to an extent unpredictable and outside the control of the banks. Banks can hedge interest rate risk by matching the maturities of their assets and liabilities or by utilizing interest rate futures and option markets. Sim-
Address correspondence to: John M. Harris, Department of Finance, Clemson University, Clemson, SC 29634. 1323
Journal of Business Research 22, 233-242 (1991) 0 1991 Elsevier Science Publishing Co., Inc.
014%2963/91/$3.50
655 Avenue of the Americas, New York, NY lW10

234 J BUSN RES 1991:22:233-242
J. M. Harris et al.
ilarly, banks can hedge exchange rate risk by matching the currency denominations of their assets and liabilities or by using the exchange rate futures and options markets. However, these strategies may not be costless, and banks may choose to suffer some degree of exposure. Also, some banks may expose themselves to exchange rate risk to speculate on exchange rate movements in their trading room activities. The large volume of foreign exchange trading makes large profits (as well as losses) possible from even small movements in exchange rates.
While a number of empirical studies have attempted to measure the sensitivity of bank stock returns to interest rate risk in recent years (e.g., Chance and Lane, 1982; Flannery and James, 1984; and Sweeney and Warga, 1986), a review of the literature reveals a dearth of studies measuring the exposure of bank stocks to exchange rate risk. This article extends some of the methodologies used to examine bank stock sensitivity to interest rate risk to measure bank stocks’ exposure to exchange rate risk. The remainder of this article is organized as follows. Section 2 briefly reviews the nature of banks’ exposure to foreign exchange rate risk. Section 3 examines the relationship between banks’ stock returns and exchange rates. Section 4 examines how the relationship between banks’ stock returns and exchange rates varies with measures of their degree of foreign operations. Section 5 sum- marizes the study.
Banks and Foreign Exchange Rate Risk
Exchange rate risk may affect banks’ capital positions in a variety of ways. When- ever banks enter agreements that involve an international transfer of funds at a later date, exposure to foreign exchange risk results due to the uncertainty con- cerning the future spot exchange rate. Exchange rate movements can greatly affect the market value of banks’ overseas assets or liabilities and cause fluctuations in bank’s capital positions. Some of the fluctuations in banks’ capital can be offset somewhat by relative changes in the aggregate price level; however, studies by Adler and Dumas (1980) and Roll (1979) demonstrate that deviations from Pur- chasing Power Parity in the short run are substantial and not necessarily self- correcting.
Banks, like other firms, may seek various avenues to reduce or eliminate their sensitivity to exchange rate changes. The currency-futures market, forward- exchange market, the currency-options market, swap agreements, parallel loans, and matching of both the duration and currency of denomination of both assets and liabilities are all examples (see Shapiro and Rutenberg, 1976; and Cornell and Shapiro, 1983). Some banks may not attempt to hedge or diversify away exchange rate risk if they believe that they have a competitive advantage in forecasting exchange rate movements. In addition, the amount of exposure a bank is willing to accept is likely to vary over time along with the bank’s exchange rate expec- tations. We note that this article makes no attempt to assess the specific hedging or speculative trading practices of commercial banks.
Bank Stock Returns and Exchange Rate Changes
Measuring Exchange Rate Sensitivity
Adler and Dumas (1980), and Jorion (1987) model the foreign exchange exposure of a stock’s return as a simple linear relationship:

U.S. Commercial Banks-Exchange Rates vs Stock Returns J BUN RES 1!991:22:233-242
235
4, = c~ + Pev-5 + u,, (1)
where R, is the return of the ilh stock over time period t, E, is the percentage change in the exchange rate over time period t, and ui, is a random error term.
In this article, the exchange rate sensitivity of a portfolio of 28 commercial banks involved in international banking activities is estimated over the years 1977 to 1986. The estimation uses monthly stock returns collected from the Center for Research in Security Prices files. Banks were included in the sample if stock returns were available for every month during the 1977 to 1986 period and if there was a lead bank in situations of multibank holding companies.
In reality, numerous factors affect the stock returns of banks, many of which may not be easily observed or measured. In fact, since pooled cross-section and time-series are used in this estimation, many unobserved or immeasurable factors (both cross-sectional and time-wise) may be present in the data. The use of ordinary least-squares (OLS) to estimate Equation (1) for a portfolio of banks fails to take these factors into account and is likely to result in biased and inefficient estimates. To account for the potential influence of other factors, Equation (1) is respecified as:
R,, = 01 + Pe,,Er + w, + v, + u,, (2)
for i equals 1 to N and r equals 1 to T. N is the number of banks and T is the number of time periods with w; equaling time-invariant, unobserved cross-sectional effects; v, equaling cross-section invariant, unobserved time effects; and ui, equaling the remaining effects assumed to be both cross-sectional and time-wise determined. Equation (2) is known as an error components model and is estimated using a generalized least-squares procedure (GLS) ( see Kmenta, 1971; and Hsing and Chang, 1980). Equation (2) may be rewritten as:
R,, = 0~ + P<,,E, + sir (3)
where err equals wi plus v, plus u,,. Each of the error components is assumed to be an independent random variable with zero mean and constant variance. The pa- rameter estimates obtained from the error components model are more efficient than OLS estimates because the error components provide some information about cross-sectional and time-wise variation.
The rate of change in the exchange rate of the U.S. dollar (E,) is constructed by taking an equally weighted average of the monthly percentage changes in the value of the dollar as expressed in terms of the 5 major foreign currencies (the Japanese Yen (Y), the British Pound Sterling (f), the West German Deutsch Mark (dm), the Canadian Dollar (c$), and the French Franc (ff)) which have values that “floated” with respect to the dollar after 1975 (i.e, their values were allowed to fluctuate in response to supply and demand in the currency markets). These cur- rencies play a dominant role in world trade and the foreign exchange markets. Many smaller countries “peg” or tie the value of their currencies to these major currencies. The currencies of other major U.S. trading partners such as Taiwan, Mexico, and South Korea have values that are “pegged” or tied to the value of the U.S. dollar and were therefore excluded from the calculation of E,.
The percentage change (%A) in the value of the dollar was calculated for each currency using beginning-of-the month spot exchange rates as reported in annual

236 J BUSN RES 1991~221233-242
J. M. Harris et al.
issues of the International Monetary Market Yearbook from 1976 through 1986. For example, the percentage change in the value of the dollar in terms of the Yen (Y/$) from month t to month t + 1 is:
%A@‘/$) = [(Y/Q, + , - (Y/$),]/(Y/$), (4)
The percentage change in the value of the dollar in terms of the other 4 currencies is also calculated. The percentage change in the value of dollar (E,) is then calculated as an equally weighted average of these 5 values:
E, = {%A(c$/$) + %A@/$) + %A(&/$) + %A(ffl$) + %A(Y/$)}/5 (5)
Although the percentage change in the value of the dollar (E,) was also calculated as a trade-weighted average and an Special Drawing Right weighted average, results reported in this article are only for equally weighted average. The use of the other 2 techniques had no significant effect on the results. Furthermore, the use of unequal weights would presuppose that a competitive advantage resulting from an average exchange rate change would favor the more heavily weighted countries.
Many studies suggest that exchange rates are not a random walk in the sense that the expected future spot rate equals the current spot rate. Therefore, it may be appropriate to distinguish between expected and unexpected changes in ex- change rates. A simple approach to modeling expected future exchange rates is embodied in the Unbiased Forward Rate theory of exchange rates. The TJnbiased Forward Rate suggests that the premium or discount on the forward rate of ex- change (F,) constitutes an unbiased estimate of the expected rate of change in the exchange rate (see Cornell, 1977). Therefore, unanticipated rates of change in the exchange rate (LIE,) may be modeled as deviations of the forward premium or discount (F,) from subsequently observed rates of change in the exchange rate (E,), thus:
UE, = F, - E, (6)
where F, is calculated similarly to E, in Equation (5) with the exception that forward exchange rates are used instead of spot exchange rates. Subsequently, we also estimate the sensitivity to exchange rate movements for our sample using the following model:
R,, = a + L,, (UE), + E,, (7)
Table 1 presents the results obtained in the estimations of Equation (3) in Panel A and Equation (7) in Panel B for the entire portfolio of bank stocks. pr and pu represent the average value of the PC,, and the p(,,,, respectively. The estimations are done over the entire sample period of 1977 to 1986 and the subperiods 1977 to 1981 and 1982 to 1986 to examine the structural stability of the models. The subperiods 1977 to 1981 and 1982 to 1986 are presented because they are equal 5- year periods and because a strong structural shift occurs in our models over these subperiods. Since the difference between total and unanticipated changes in ex- change rates is anticipated changes, the closeness of the estimates for E, in Panel A and UE, in Panel B suggests that the return over periods t to t + 1 reflects only unanticipated changes in exchange rates, which is consistent with Efficient Market Theory. The estimated values of pp in Panel A and p,, in Panel B both indicate that bank stock returns were, on average, sensitive to exchange rate movements over the sample period. The significantly negative slope coefficients suggest that

U.S. Commercial Banks--Exchange Rates vs Stock Returns J BUSN RES 1991:22:233-242
237
Table 1. GLS Estimates Of Exchange Rate Sensitivity for a Portfolio of Bank Stocks (1977-1986)
R, = a + PXQ, + E,
Period a PC
Panel A 1977-1986
1977-1981
1982-1986
0.0155 - 0.4673 (2.823) (-2.241)
.0085 - 0.6722 (1.412) (-2.843)
0.0226 -0.3069 (2.387) (-0.891)
R, = a + P.(UE), + E,
Panel B 1977-1986 0.0163 - 0.4561
(2.952) (- 2.233)
1977-1981 0.0097 - 0.6297 (1.610) (-2.718)
1982-1986 0.0231 -0.3166 (2.426) ( - 0.955)
“T-statistics are in parentheses. Nore: R’ and the Durbin-Watson statistic are not reported since they cannot be interpreted clearly when GLS is
used.
an increase in the value of the dollar is associated with a reduction in U.S. bank stock returns and vice versa. However, the sensitivity of bank stocks to exchange rate movements is unstable over the sample period. The exchange rate sensitivity coefficients (pb and f3J are significantly negative during the weak dollar period (1977 to 1981), but insignificant over the 1982 to 1986 time period, in which the dollar was somewhat stronger. The correlation between exchange rates and stock prices may be obscured over the 1982 to 1986 time period by the increased volatility (noise) that followed the monetarist experiments in the U.S. and elsewhere or by the overall increase in stock prices that occurred during this period regardless of the direction of exchange rate movements. It may also be that banks decided to speculate less on exchange rate movements or better hedged exchange rate risk during this time period, or at least were perceived as doing so by the market.
The exchange rate sensitivities are also estimated for the 28 bank stocks individ- ually using OLS. Table 2 presents the distribution of the sensitivity to exchange rate risk coefficients (PC,, and p,,i) obtained from the individual regressions. For brevity, only the distribution of the pu,, is reported (the distribution of the PC,, were very
similar). All but one of the coefficients are negative and over one-half are significant at a 10% level of confidence over the entire sample period. During the 1977 to 1981 period, all of the coefficients are negative and over two-thirds are significant at least at a 10% level. Only 3 coefficients during the 1982 to 1986 time period were significant. This result supports the previous evidence showing the sensitivity of bank stocks to exchange rate movements to be unstable over the sample period. The results also indicate a high degree of cross-sectional variation in the sensitivity of the bank stocks to exchange rate risk, suggesting major differences in banks’ willingness to accept (or ability to hedge or diversify away) exchange rate risk.
238 J BUSN RES 1991:22:233-242
J. M. Harris et al.
Table 2. Distribution of Individual Sensitivity Coefficients (p,,,)” of Domestic Bank Stocks to Unanticipated Foreign Exchange Rate Changes”
1977-1986 1977-1981 1982-1986
Minimum
25th percentile
Median
75th percentile
-1.380 - 2.044 - 2.017 ( - 2.522) (-3.538) (-2.161)
- 0.548 - 0.890 - 0.531 (-2.188) ( - 2.438) ( - 0.722)
-0.355 - 0.528 -0.234 (~ 1.680) (- 1.775) (-0.691)
-0.251 ~ 0.327 0.001 (- 1.067) (- 1.025) (0.003)
Maximum 0.021 ~ 0.019 0.498 (0.064) (-0.047) (1.019)
No. of banks 2x
“The p.,, are the exchange rate sensitivity coefficients obtained when using OLS to regress stock returns against unanticipated changes in exchange rates (f/E,) for each bank individually.
*T-statistics are in parentheses.
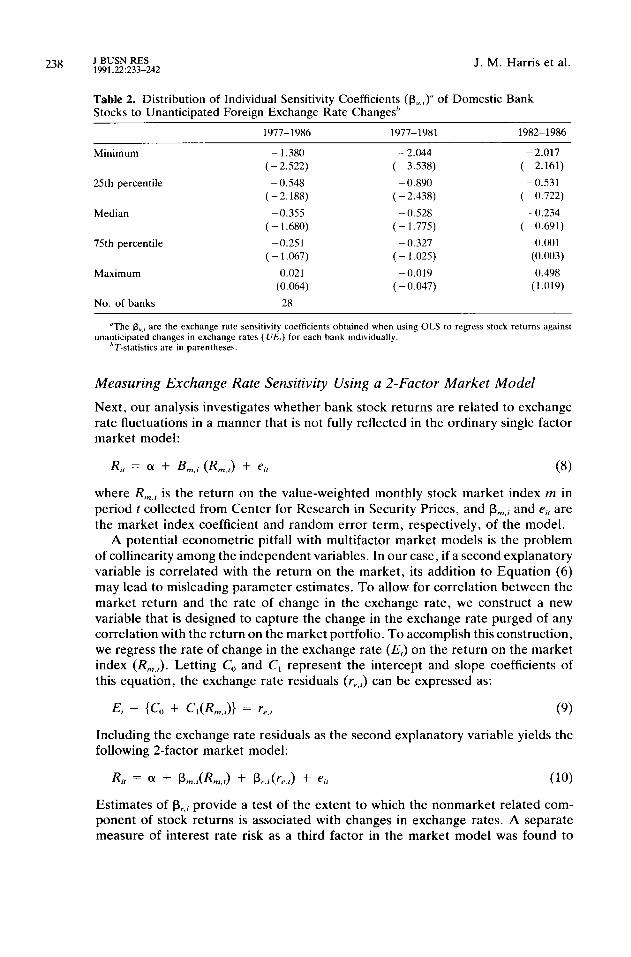
Measuring Exchange Rate Sensitivity Using a 2-Factor Market Model
Next, our analysis investigates whether bank stock returns are related to exchange rate fluctuations in a manner that is not fully reflected in the ordinary single factor market model:
4, = a + 4; (R,,,) + e, (8)
where R,,,, is the return on the value-weighted monthly stock market index m in period t collected from Center for Research in Security Prices, and pm,; and e, are the market index coefficient and random error term, respectively, of the model.
A potential econometric pitfall with multifactor market models is the problem of collinearity among the independent variables. In our case, if a second explanatory variable is correlated with the return on the market, its addition to Equation (6) may lead to misleading parameter estimates. To allow for correlation between the market return and the rate of change in the exchange rate, we construct a new variable that is designed to capture the change in the exchange rate purged of any correlation with the return on the market portfolio. To accomplish this construction, we regress the rate of change in the exchange rate (E,) on the return on the market index (R,,,). Letting CO and C, represent the intercept and slope coefficients of this equation, the exchange rate residuals (r,,,) can be expressed as:
E, - {CO + C&J~ = r,., (9)
Including the exchange rate residuals as the second explanatory variable yields the following 2-factor market model:
4, = a + P,.,(&J + Pr.i(rF,J + e,, (IO)
Estimates of p,.i provide a test of the extent to which the nonmarket related com- ponent of stock returns is associated with changes in exchange rates. A separate measure of interest rate risk as a third factor in the market model was found to

U.S. Commercial Banks-Exchange Rates vs Stock Returns J BUSN RES 1991:22:233-242
Table 3. GLS Estimates of a 2-Factor Market Model for a Portfolio of Bank Stocks (1977-1986)
239
R = Q + Pm(Rn.r) + Pro + E,
Period a Pm P,
Panel A 1977-1986
1977-1981
1982-1986
Panel B 1977-1986
1977-1981
1982-1986
0.0014 (0.377) 0.0020 (0.457)
-0.0021 (-0.387)
0.0013 (0.376) 0.0019
(0.453) -0.0021
( - 0.387)
1.1005 (13.740)
0.8155 (8.548) 1.4226
(12.040)
1.1004 (13.718)
0.8155 (8.473) 1.4226
(12.039)
-0.1999 (- 1.510) - 0.4075
(-2.422) - 0.0584
(-0.324)
-0.1807 (- 1.390) - 0.3695
(-2.227) - 0.0453
( - 0.253)
“T-statistics are in parentheses. Note: R2 and the Durbin-Watson statistic are not reported since they cannot be interpreted clearly when GLS is
used.
be statistically insignificant for financial institutions in a study by Harris and Sinkey (1987) and is not included in our model. Again, the error components model is used to estimate the 2-factor model. Thus, Equation (10) becomes:
&, = a + P,,JK,J + P,, (le.,) + Q (II)
Panel A of Table 3 presents the GLS estimation of Equation (11) for the entire portfolio of bank stocks. Panel B of Table 3 presents the results from the GLS estimation of Equation (11) for the portfolio of stocks when the unanticipated changes in exchange rates measure (V.5,) is substituted for Et in Equation (9). p, represents the average value of the individual pr_.;. Again the estimated coefficients are similar regardless of whether the rate of change (E,) or unanticipated rate of change, (UfZ),, in the exchange rate is used. Although the coefficient (pr) is negative, it is no longer significant at the 5% level over the entire sample period. It is, however, significant at the 5% level for the subperiod 1977 to 1981.
Table 4 presents the distribution of the estimated values of the p,, from the OLS estimations of Equation (10) for the individual banks. Again for brevity, only the coefficients obtained when using UE, in the estimation procedure are reported. All but 5 of the sensitivity coefficients (&) are negative, but only about one-sixth are significant at the 10% level over the period 1977 to 1986. As in Table 2, the distributions of the subperiods also reflect that the coefficients are unstable over the sample period. During the 1977 to 1981 period nearly one-third of the coeffi- cients are significant at a 10% level, whereas only one coefficient is significant during the 1982 to 1986 period.
Comparing the results of Tables 1 and 2 with the results of Tables 3 and 4 suggests that much of the unsystematic exchange-rate risk is captured by the tra- ditional single-factor market model. Thus, a separate exchange-rate risk factor in

240 J BUSN RES 1991:22:233-242 J. M. Harris et al.
Table 4. Distribution of Exchange Rate Sensitivity Coefficients (p,,,)” Estimated in a 2-Factor Market Modelh
1977-1986 1977-1981 1982-1986
Minimum ~ 0.9695 - 1.5739 - 1.6081 (~ 1.936) (-3.109) (- 1.911)
25th percentile ~ 0.2973 -0.5614 ~ 0.1980 ( ~ 0.297) ( - 1.834) (-0.691)
Median ~ 0.1309 ~ 0.3303 -0.0266 ( -0.57X) ( - 0.628) ( - 0.075)
75th percentile - 0.0403 -0.1604 0.1888 (-0.209) (-0.686) (0.5.54)
Maximum 0.3289 0.1526 0.8072 (1.191) (0.370) (2.193)
No. of Banks 28
“The p,, are the coefficients of the measure of unanticipated changes m exchange rates obtained in the estimation
of Equation (8) for each of the indiwdual hanks in the sample.
‘73tatistics are in parentheses.
market models may not be necessary, at least for the banks in our sample over the 1982 to 1986 time period. However, the results of Tables 1 through 4 do reveal that there was considerable cross-sectional and time-wise variation in the sensitivity of bank stock returns to exchange rate movements.
Exchange Rate Sensitivity and Foreign Operations
A recent study by Jorion (1987) indicates that the exchange rate sensitivity of nonfinancial U.S. multinationals is correlated with the degree of foreign involve- ment. Given this finding and the considerable cross-sectional variation in the sen- sitivity of bank stocks to exchange rates presented above, this section examines the relationship between this variation and the degree of foreign operations of the individual banks. As proxies for banks’ foreign operations, we use the averages over the designated time periods for 2 different measures: 1) the number of foreign branches, and 2) foreign deposits/total assets. These measures were obtained from Moody’s Bank and Finance Manual and the Consolidated Reports of Condition for Insured Banks, 1978-1986 of the Federal Financial Institution Examination Council. To examine the relationship of banks’ exchange rate sensitivity and the degree of foreign operations, we estimate the following equation using OLS regression:
IX-.; = a + WV, + e, (12)
where the p,., are the OLS estimates obtained in the individual estimations of Equation (lo), (FO), equals a measure of foreign operations for bank i, and e, is the error term for bank i.
The OLS regression results over the entire sample period of 1977 to 1986 and the 2 subperiods (1977 to 1981 and 1982 to 1986) are presented in Table 5. Panel A presents estimates for which the degree of foreign operations is proxied by the number of foreign branches. The coefficient of (FO), is significant for each period at a 5% level of confidence. Given that the sensitivity coef&ients obtained in the

U.S. Commercial Banks-Exchange Rates vs Stock Returns J BUSN RES 1991:22:233-242
241
Table 5. OLS Estimates of the Relationship of Exchange Rate Sensitivity to the Degree of Foreign Operations (1977-1986)
P,,, = Q + PXFO), + e,
Period a b, R2 F-Value
Panel A. FO = No. of foreign branches 1977-1986 -0.1261
(-2.715)
1977-1981 - 0.3020 (-6.310)
1982-1986 0.0387 (0.603)
Panel B. FO = Foreign deposits/total assets 1977-1986 -0.0339
( - 0.583)
1977-1981 - 0.0605 (- 0.336)
1982-1986 -0.1554 (-1.546)
- 1.0661 0.2423 7.997 (-2.828)
- 0.9700 0.1988 6.204 (-2.491)
- 1.1007 0.1515 4.464 (-2.113)
-0.0171 0.1850 2.496 (- 1.672)
- 0.6808 0.1024 1.254 (-1.780)
-0.0009 0.0849 1.020 (- 1.010)
“T-statistics are in parentheses
estimations of Equation (10) are generally negative, the significantly negative sign in each period indicates that the estimated sensitivity is higher for banks with more foreign branches.
Panel B presents the estimation of Equation (12) using foreign deposits/total assets as the proxy for (FO)i. Though not as strong as in Panel A, the results provide some evidence that bank sensitivity to exchange rate movements is cor- related to the degree of their foreign operations. The coefficient of (FO), is sig- nificant for the entire time period and the 1977 to 1981 subperiod at the 10% level.
Summary
This article has examined the relationship between the returns of a portfolio of bank stocks and foreign exchange rate movements over the period from 1977 to 1986. This relationship was tested in both a simple linear regression model and multifactor market model. In general, the evidence from both models suggests a relationship between exchange rates and bank stock returns, however, this rela- tionship is found to vary considerably over time. Bank stock prices appeared to be sensitive to exchange rates during the weak dollar period (1977 to 1981), but not during the 1982 to 1986 time period, in which the dollar was somewhat stronger. The correlation between exchange rates and stock prices may be obscured over the 1982 to 1986 time period by the increased volatility (noise) that followed the monetarist experiments in the U.S. and elsewhere, or by the overall increase in stock prices that occurred during this period regardless of the direction of exchange rate movements. It may also be that banks decided to speculate less on exchange rate movements or better hedged exchange rate risk during this time period, or at least were perceived as doing so by the market.
The article also finds significant cross-sectional variation in the sensitivity of bank stock returns to exchange rate movements, suggesting major differences in

242 J BUSN RES 1991:22:233-242
J. M. Harris et al.
banks’ willingness to accept (or their ability to hedge or diversify away) exchange rate risk. Bank sensitivity to exchange rates is shown to be correlated with the degree of foreign operations of the banks as proxied by both the number of foreign branches and foreign deposits/total assets.
References
1. Adler, M., and Dumas, B., The Exposure of Long-Term Foreign Currency Bonds. Journal of Financial and Quantitative Analysis 1.5 (November 1980): 973-995.
2. Adler, M., and Dumas, B., Exposure to Currency Risk: Definition and Measurement. Financial Management, 13 (Summer 1984): 41-50.
3. Adler, M., and Dumas, B., International Portfolio Choice and Corporation Finance: A Synthesis. The Journal of Finance 38 (June 1983): 925-975.
4. Cornell, B., and Shapiro, A., Managing Foreign Exchange Risks. Midland Corporate Finance Journal 1 (Fall 1983): 16-31.
5. Cornell, B., Spot Rates, Forward Rates, and Market Efficiency. Journal of Financial Economics 5 (1977): 55-65.
6. Dufey, G., and Srinivasulu, S., The Case for Corporate Management of Foreign Ex- change Risk. Financial Management 13 (Summer 1984): 54-62.
7. Fama, E., and Schwert, W. S., Asset Returns and Inflation. Journal of Financial Eco- nomics 15 (November 1977): 115-146.
8. Folger, H. R., Kose, J., and Tipton, J., Three Factors, Interest Rate Differentials and Stock Groups. Journal of Finance 36 (May 1981): 323-335.
9. Flannery, M., and James, C., The Effect of Interest Rate Changes on the Common Stock Returns of Financial Institutions. The Journal of Finance 39 (September 1984): 1141-1153.
10. Harris, J., and Sinkey, J. Jr., Tests for Systematic Exchange-Rate Risk in Multifactor Market Models. Working paper, The University of Georgia, presented at the 1986 Financial Management Association Meetings, 1987.
11. Hsing, Y., and Chang, H., Demand for Faculty of Public Higher Education in the Southeast: A Cross-Sectionally Correlated and Time-Wise Autoregressive Model. Pro- ceedings of the American Statistical Association (Business and Economics Section), 1980.
12. Jorion, P., The Exchange Rate Exposure of U.S. Multinationals. Working paper, Co- lumbia University, 1987.
13. Kaufold, H., and Smirlock, M., Managing Corporate Exchange and Interest Rate Ex- posure. Financial Management 15 (Autumn 1986): 64-72.
14. Kmenta, J. Elements of Econometrics, The MacMillan Company, New York, 1971.
15. Roll, R., Violations of Purchasing Power Parity and Their Implications for Efficient International Commodity Markets, in International Finance and Trade, Sarnat and Szego, eds., Ballinger Publishing Co., Cambridge, MA, 1979.
16. Shapiro, A., and Rutenberg, D., Managing Exchange Risks in a Floating World. Fi- nancial Management 5 (Summer 1976): 48-58.
17. Sweeney, R., and Warga, A., The Pricing of Interest Rate Risk: Evidence from the Stock Market. The Journal of Finance 41 (June 1986): 393-410.