The performance of de novo commercial banks: A profit efficiency approach
Upload
khangminh22Category
view
0download
0
Master Thesis
TAMTA PUTURIDZE
Brno
2021
Supervisor: Dagmar Vagnerova Linnertova
Financial Markets
FACULTY OF ECONOMICS AND ADMINISTRATION
Cross sectional analysis of commercial banks performance
operating in Georgia


Bibliographic record
Author: Tamta Puturidze Faculty of Economics and Administration
Masaryk University Department of Finance
Title of Thesis: Cross Sectional analysis of commercial banks performance operat-ing in Georgia
Degree Programme: Financial Markets
Field of Study: Financial Markets
Supervisor: Dagmar Vagnerova Linnertova
Year: 2021
Number of Pages: 78
Keywords: Commercial bank, valuation, ratios, analysis

Abstract
This master thesis analysed the financial performance of two systematically important commercial banks in Georgia for the financial year 2020. Selected banks were measured and compared to each other with the following parametres comprising: capital adequacy, assets quality, earnings, liquidity and different financial ratios. In addition some relevant stock valuation models were applied to compute fair value of their stocks and give recommendations for investment percpetive.

Declaration
I certify that I have written the Master’s Thesis ’’Cross sectional analysis of commercial banks operating in Georgia’’ by myself under the supervision of Dagmar Vagnerova Lin-
nertova and I have listed all the literature and other sources in accordance with legal reg-ulations, Masaryk University internal regulations, and the internal procedural deeds of Ma-
saryk University and the Faculty of Economics and Administration.
Brno, .......................................
Tamta Puturidze


Acknowledgement
I would like to give a sincere thanks to my supervisor Ing. Dagmar Vagnerova Linnertova, Ph.D. for her guidanc, as well as for providing necessary information and the direction. I would also like to express my gratitude to my mother Dodo Davituliani for her continuous moral support and motivation during all my life and studies.

Šablona DP 2.0.1 (9. ledna 2018) © 2014, 2016, 2018 Právnická fakulta Masarykovy univerzity
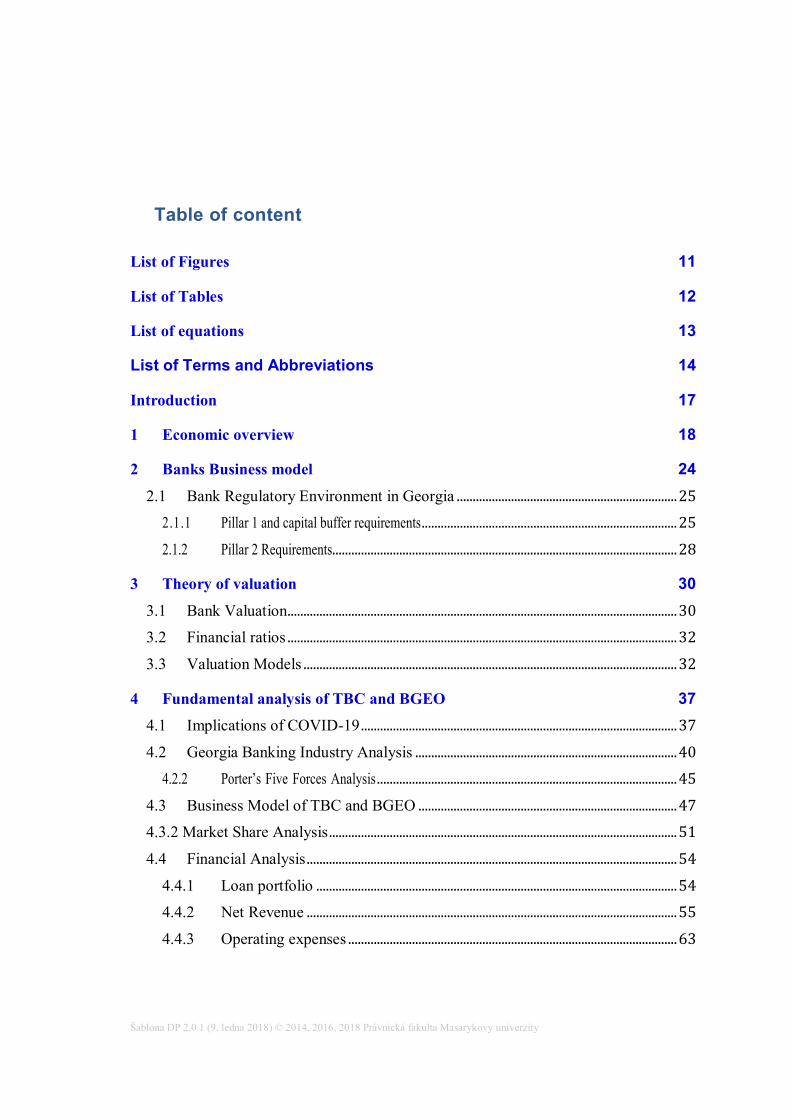
Table of content
List of Figures 11
List of Tables 12
List of equations 13
List of Terms and Abbreviations 14
Introduction 17
1 Economic overview 18
2 Banks Business model 24
2.1 Bank Regulatory Environment in Georgia ..................................................................... 25
2.1.1 Pillar 1 and capital buffer requirements ................................................................................ 25
2.1.2 Pillar 2 Requirements............................................................................................................ 28
3 Theory of valuation 30
3.1 Bank Valuation.......................................................................................................................... 30
3.2 Financial ratios .......................................................................................................................... 32
3.3 Valuation Models ..................................................................................................................... 32
4 Fundamental analysis of TBC and BGEO 37
4.1 Implications of COVID-19 ................................................................................................... 37
4.2 Georgia Banking Industry Analysis .................................................................................. 40
4.2.2 Porter’s Five Forces Analysis .............................................................................................. 45
4.3 Business Model of TBC and BGEO ................................................................................. 47
4.3.2 Market Share Analysis ............................................................................................................. 51
4.4 Financial Analysis .................................................................................................................... 54
4.4.1 Loan portfolio ................................................................................................................. 54
4.4.2 Net Revenue .................................................................................................................... 55
4.4.3 Operating expenses ....................................................................................................... 63
4.4.4 Capital adequacy and liquidity ................................................................................. 63
4.4.5 Dividend Policy .............................................................................................................. 64
5 Valuation 66
5.1 FCFE ............................................................................................................................................. 66
5.2 Residual income ........................................................................................................................ 68
5.3 Relative valuation ..................................................................................................................... 69
5.4 Summary of fundamental and financial analysis .......................................................... 71
Conclusion 72
References 74
11
List of Figures
FIGURE 1. GDP ANNUAL GROWTH RATE (ANNUAL %) .............................................................. 19 FIGURE 2. FOREIGN DIRECT INVESTMENTS (MLN USD) ........................................................... 20 FIGURE 3. GDP PER CAPITA GROWTH (ANNUAL %) .................................................................. 21 FIGURE 4. MONETARY POLICY INTEREST RATE DYNAMICS ........................................................ 22 FIGURE 5. PROFITABILITY RATIOS OF BANKING SECTOR............................................................ 44 FIGURE 6: DEPENDENCE ON LOANS RELATED INCOME .............................................................. 51 FIGURE 7: MARKET SHARE ANALYSIS ....................................................................................... 52 FIGURE 8: DEPOSITS FUNDING ................................................................................................. 53 FIGURE 9 LOAN PORTFOLIO (GEL MLN) .............................................................................................. 54 FIGURE 10. MARKET SHARE (%)– GROSS LOANS ..................................................................... 55 FIGURE 11. NET INTEREST INCOME (THOUSANDS, GEL) ........................................................... 56 FIGURE 12. NON INTEREST INCOME (THOUSANDS, GEL) ........................................................... 58 FIGURE 13. TBC BANK’S TOTAL NON-INTEREST INCOME (MLN GEL) ......................................... 59 FIGURE 14. BGEO TOTAL NON-INTEREST INCOME (MLN GEL) .................................................. 59 FIGURE 15. RETURN ON ASSETS ............................................................................................... 61 FIGURE 16. NET INTEREST MARGIN (%) .................................................................................. 62 FIGURE 17. SUBSECTOR PEER COMPARISIONS RELATIVE VALUATION – COMPETITORS‘ DATA ... 70

List of Tables
TABLE.1 SYSTEMIC BUFFER REQUIREMENTS ........................................................................... 27 TABLE 2. KEY FINANCIAL INDICATORS OF THE GEORGIAN BANKING SECTOR (GEL BILLION) .... 41 TABLE 3. AVERAGE INTEREST RATE ON COMMERCIAL BANK LOANS ......................................... 42 TABLE 4. AVERAGE INTEREST RATE ON COMMERCIAL BANK DEPOSITS ..................................... 42 TABLE 5. PROFITABILITY OF THE INDUSTRY............................................................................. 43 TABLE 6. INTEREST MARGIN FOR GEORGIAN BANKS ................................................................ 44 TABLE 7. NON-PERFORMING LOANS ........................................................................................ 45 TABLE 8: REVENUE DIVERSIFICATION...................................................................................... 55 TABLE 9. RETURN ON EQUITY ................................................................................................. 60 TABLE 10. COST-TO-INCOME .................................................................................................. 62 TABLE 11. CAPITAL ADEQUACY STANDARTS 2020 ................................................................... 63 TABLE 12. LIQUIDITY STANDARTS .......................................................................................... 64 TABLE 13. BOG DIVIDEND INFORMATION ............................................................................... 65 TABLE 14. DIVIDEND INFORMATION. ....................................................................................... 65 TABLE 15. FORECASTS............................................................................................................ 66 TABLE 16. COMPONENTS OF VALUATION ................................................................................. 66 TABLE 17. FCFE (BGEO) ...................................................................................................... 67 TABLE 18. FCFE (TBCG) ...................................................................................................... 67 TABLE: 19. EXCESS RETURN TBCG ........................................................................................ 68 TABLE: 20. BGEO EXCESS RETURN ......................................................................................... 68 TABLE 21. TBC RELATIVE VALUATION, GEL ........................................................................... 69 TABLE 22. BGEO RELATIVE VALUATION ................................................................................ 69 TABLE 23. FORECASTS............................................................................................................ 71

13
List of equations
EQUATION 1. FCFE ................................................................................................................ 33 EQUATION 2. GROWTH RATE ................................................................................................... 34 EQUATION 3. EQUITY VALUE .................................................................................................. 35 EQUATION 4. EXCESS RETURN ................................................................................................. 35 EQUATION 5. PRICE TO EARNINGS RATIO.................................................................................. 35 EQUATION 6. PRICE TO BOOK RATIO ........................................................................................ 36
List of Terms and Abbreviations
Gel Georgian Lari
Basel II International Convergence of Capital Measurement and Capital Standarts
Basel III Third Basel Capital Accord
BGEO Bank of Georgia
CAR Capital Adequacy Ratio
CAPEX Capital Expenditures
CEO Chief Executive officer
CET1 Common Equity Tier 1
CoE Cost of equity
C/I Cost-to-income
DDM Dividend Discound Model
DPS Dividend per share
EPS Earnings per share
EU European Union
FCFE Free cahs-flwo to equity
FDI Foreign Direct Investmetns
GDP Gross Domestic Product
GEO Georgia
GRAPE General Risk Assessment Program
IMF International Monetary Fund
LCR Liquidity Coverage Ratio
NBG National Bank of Georgia
NII Net interest income
NIM Net Interest Margin

15
NPL Non-performing loan
NSFR Net Stable Funding Ratio
P/B Price to book value
P/E Price to earnings
PV Present value
RI Residual income
ROA Return on Assets
ROE Return on Equity
RWA Risk Weighted Assets
TBC TBC PLC
T1 Tier 1 Capital
UK United Kingdom
US United States
WC Working Capital

17
Introduction
The banking sector is critical to the stability of financial markets and has a direct effect on the economy’s success. This is especially true for Georgia where other financial market representa-tives are not developed and banking sector remains key driver. Commercial banks have under-gone various regulatory reforms and changes since establishment. All together aiming to make them way more adequately capitalized and strong for the sake of depositors, creditors and for the whole economy. The purpose of this master thesis ’Cross sectional analysis of commercial banks operating in
Georgia’’ is to evaluate two domestic commercial banks’ financial performance and value their stocks. Both are operating in the same industry, listed on London Stock Exchange which make them easier for comparison. The theoretical part of the thesis starts with country’s economic overview with the help of vari-
ous indicators: GDP growth, Inflation rate, Foreign Direct Investments etc. Then comes descrip-tion of banking industry where author focuses on the regulatory and capital requirements set for commercial banks as they determine their operations and set boundaries. After that it is explained relevant valuation models solely for financial institutions. In the practical part the author firstly analyses overall country’s banking industry and then fo-
cuses on the selected banks. An attention is given to the banks’ business models’, their profita-bility and capital adequacy ratios, costs, dividend policies and, most importantly stock valuation models computation process. Also, it is explained implications of Covid-19, set by government or bank that made changed in their regulation requirements. In the end, the author summarises the banks’ financial performance, compares them to each other, declares own opinion about the firms’ future development and gives recommendations.
1 Economic overview
The first chapter of the thesis starts with reviewing the economic development of Georgia and analysing current state. The author aims to give overall idea of the environment banking sector operates in. For that reason different ratios and indicators will be mentioned.
Georgia is located at the crossroads of Europe and Asia, which makes it an unique geographic advantage for market integration with the rest of the world, including the European Union.
It takes the 7th place globally on Ease of Doing Business1, second place for starting a business and twelfth place in Economic Freedom Index2. All this positive ranking make the country attractive for investors. Overall country has BB/Negative rating according to Fitch, while Moody gives it Ba2/Stable rating. Up this moment Georgia has a developing economy.
In its thirty years old of independence, there were implemented many economic reforms, country faced rapid growths but still has not fully addressed the major economic challenges: poverty and high unemployment rate. While the national unemployment rate makes 18.5%3 in 2020, youth unemployment reaches more than 40% in some of the regions. According to World Bank4, poverty (national measure) declined to 19.5 percent in 2019, almost half its 2007 rate, as a result of better governance and sound macroeconomic policies. However, in the country has not been created enough jobs, and still many Georgians have to continue working in low-productivity agricultural jobs or leave the country to find relatively high paid ones.
After its independence from the Soviet Union in 1991, Georgia has once again become a place for competing interests. A variety of factors played a role in Georgia’s
economic collapse in the 1990s. Civil war, corruption, terrorism, a complete lack of knowledge about the market environment, hyperinflation, and the oil crisis all played a role in this situation, making it difficult to pick out the most damaging factor5. It took
1 Available at: https://openknowledge.worldbank.org/bitstream/handle/10986/32436/9781464814402.pdf, page 16
2 Available at: https://www.fraserinstitute.org/studies/economic-freedom-of-the-world-2019-annual-report
3 Available at: https://www.geostat.ge/ka/modules/categories/683/dasakmeba-umushevroba
4 Available at: https://www.worldbank.org/en/country/georgia/overview#1
5 The Economic History of Independent Georgia, Forbes Georgia, available at: https://forbes.ge/the-economic-history-of-independent-georgia/

19
four years the economy after independence to start creative positive GDP geowth rate. Figure 1.’’GDP annual growth rate’’ clearly shows that GDP growth began only after
1995 year, it took four years the economy to put positive growth rate.
Figure 1. GDP annual growth rate ( %)
Source: the world bank data6
In 1995 GDP increased by 2.6 %, while in 1996-1997, GDP had already increased by 10.6%, which was due to relatively stable political environment, the end of war and the monetary reforms implemented in September of 19957 when Georgian national currency Lari replaced the coupon (the currency of Soviet Union). According to national statistical office of Georgia, by 1996-1997, Georgian exports increased by 57%. 2004-2007 year was a rapid economic growth period. The rate of crime and corruption significantly decreased, regulations implemented by the government motivated business.
6 Online, Available at: https://data.worldbank.org/indicator/NY.GDP.MKTP.KD.ZG?end=2019&locations=GE&start=1991
7 Online, Available at: https://data.worldbank.org/indicator/NY.GDP.MKTP.KD.ZG?end=2019&locations=GE&start=1991
-50.00
-40.00
-30.00
-20.00
-10.00
0.00
10.00
20.00
19
91
19
92
19
93
19
94
19
95
19
96
19
97
19
98
19
99
20
00
20
01
20
02
20
03
20
04
20
05
20
06
20
07
20
08
20
09
20
10
20
11
20
12
20
13
20
14
20
15
20
16
20
17
20
18
20
19
20
20
By the end of 2008, the entire world faced the global financial crisis. The growth of Georgia GDP was delayed by the war with Russia in August 2008 and country again witnessed negative GDP pet capita as visible in the Figure 3.’’GDP per capita growth’’.
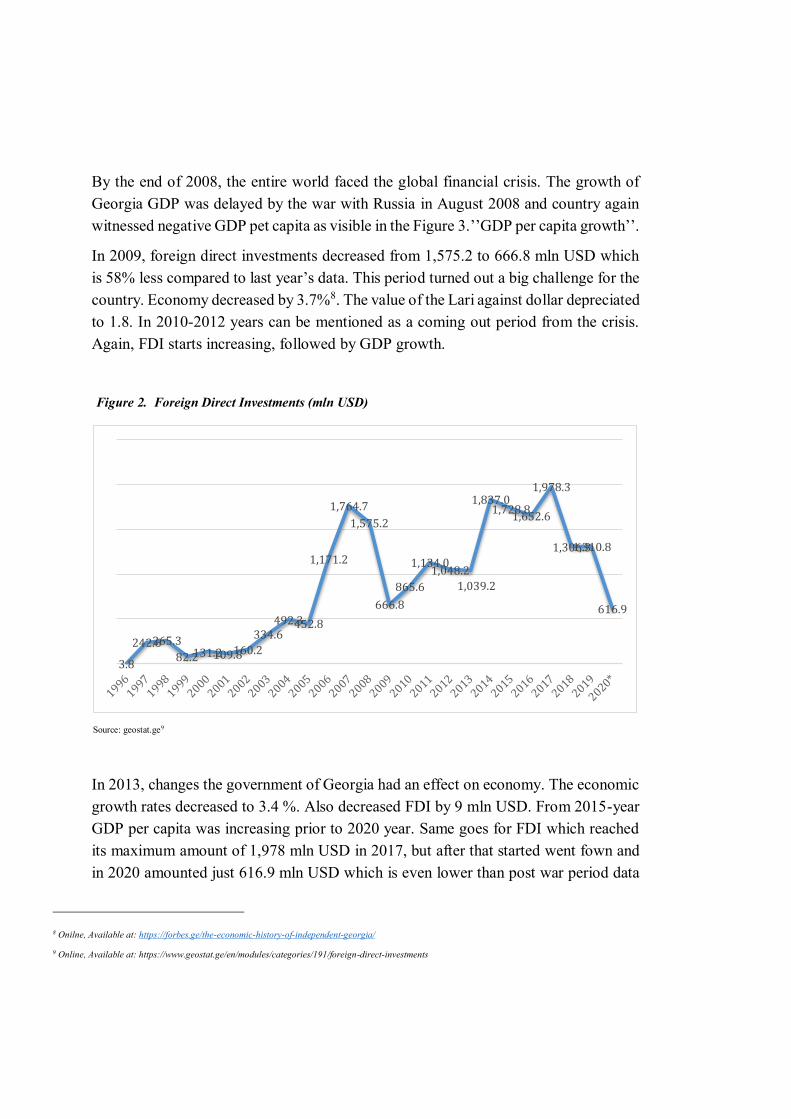
In 2009, foreign direct investments decreased from 1,575.2 to 666.8 mln USD which is 58% less compared to last year’s data. This period turned out a big challenge for the
country. Economy decreased by 3.7%8. The value of the Lari against dollar depreciated to 1.8. In 2010-2012 years can be mentioned as a coming out period from the crisis. Again, FDI starts increasing, followed by GDP growth.
Figure 2. Foreign Direct Investments (mln USD)
Source: geostat.ge9
In 2013, changes the government of Georgia had an effect on economy. The economic growth rates decreased to 3.4 %. Also decreased FDI by 9 mln USD. From 2015-year GDP per capita was increasing prior to 2020 year. Same goes for FDI which reached its maximum amount of 1,978 mln USD in 2017, but after that started went fown and in 2020 amounted just 616.9 mln USD which is even lower than post war period data
8 Onilne, Available at: https://forbes.ge/the-economic-history-of-independent-georgia/
9 Online, Available at: https://www.geostat.ge/en/modules/categories/191/foreign-direct-investments
3.8
242.6265.3
82.2131.2109.8160.2
334.6492.3452.8
1,171.2
1,764.7
1,575.2
666.8
865.6
1,134.01,048.2
1,039.2
1,837.01,728.8
1,652.6
1,978.3
1,306.31,310.8
616.9

21
in 2009. The completion of the South Caucasus Pipeline Expansion (the gas pipeline linking Azerbaijan and Turkey), the transition of many businesses to domestic ownership, and debt repayments between related companies are all contributing to the decline. FDI still remained the largest source of currency inflows despite the fall10.
In 2019 Georgian Lari faced another pressure. A Russian ban on direct flights to and from Georgia has been in force since July 2019. Due to the restrictions, some political uncertainties inflation has risen from 2.6 percent in 2018 to 6.4 percent in September 2019.
Figure 3. GDP per capita growth (annual %)
Source: the world bank data11
Georgia’s real GDP decreased by (-6.1 %) in 2020 due to COVID-19 related lock-down and restrictions throughout the year. Annual inflation dropped to 2.4% in December, from 3.8% in previous months. During 2020, NBG maintained a moderately tight monetary policy to anchor inflation mainly by refinance rate.
The main tool for the monetraty policy was refinance rate. The monetary policy committee’s decisions on monetary policy rate adjustments are based on real and
expected economic and financial market developments. If forecast inflation exceeds the target inflation rate, the NBG will tighten monetary policy by raising the policy
10Online, availbale at: https://www.ebrd.com/transition-report, country assessment Georgia,
11 Available at: https://data.worldbank.org/indicator/NY.GDP.PCAP.KD.ZG?end=2019&locations=GE&start=1986&view=chart
-50.00
-40.00
-30.00
-20.00
-10.00
0.00
10.00
20.00
19
91
19
92
19
93
19
94
19
95
19
96
19
97
19
98
19
99
20
00
20
01
20
02
20
03
20
04
20
05
20
06
20
07
20
08
20
09
20
10
20
11
20
12
20
13
20
14
20
15
20
16
20
17
20
18
20
19

rate to counteract a potential price spile. As a result, aggregate demand falls, resulting in a decline in aggregate price levels. The NBG, on the other hand, would follow an expansionary monetary policy by lowering the refinancing rate when aggregate demand is poor and current inflation expectations are below the goal. Reduced monetary policy rates translate into lower loan interest rates, which boosts credit to the economy and boosts aggregated demand.
As shown in the Figure 4.’’ Monetary policy interest rate dynamics’’ interest rate responds to the economic events happening in the country. The highest percentage was announced in May after the first total lockdown, the rate decreased just by 0.5 pp throughout the year and reached the year minimum level in the end of financial year -8%.
Figure 4. Monetary policy interest rate dynamics
Source: NBG12
12 Monetary Policy Rate statistical data. Available at: https://www.nbg.gov.ge/index.php?m=306&lng=eng
0.00
2.00
4.00
6.00
8.00
10.00Interest rate %

23
During the economic recession, government and NBG implemented many reforms, measures, trying to help businesses and households. The extension of IMF program also played a significant role in this process.
The gradual easing of the existing sanctions is expected to accelerate Georgia's economic recovery in 2021. Restrictions, vaccinations, strengthened domestic and international sentiments, and continued fiscal stimulus are all on the horizon. Nonetheless, the COVID-19 pandemic remains one of the most significant uncertainties in the development forecast.
2 Banks Business model
TBC Bank Group PLC (TBC Bank) and Bank of Georgia PLC (BGEO) are industry-leading systematically important banks in Georgia. To appraise such companies, first is needed to understand the theoretical basis of their business models.
A bank is profit seeking organization, which always plays a major part in the economy. In general, it is differentiated three types of banks: commercial banks, universal banks and investments banks. They do differ from each other by the functions and operations. The author below reviews the commercial bank, since the institutions that are valued belong to this category.
A commercial bank is a financial institution which performs the functions of accepting deposits from the general public and giving loans for investment with the aim of earning profit13. Besides those two main operations, commercial banks can offer customers other services: like trust operations, investment and financial advices and etc. Net interest income (NII) is the most significant revenue item for the majority of commercial banks. They do benefit from charging big interest rates on loans while paying low interest rate on deposits. The difference between the mentioned interest rates is called interest spread, is often tracked by analysts14. The related metric is net interest margin (NIM), which is a main metric in the industry.
Commercial banks’ profitability is influenced by a number of factors. The interest rates
that a bank pays on deposits and charges on loans are the most important. Naturally, not all of the issued loans are completely paid. As a result, every bank must be ready for the potential losses and set aside loan loss provisions. Loan loss provisions, also known as credit loss provisions, are a type of risk expense. Operating expenses are the third main group, with wages, salaries, and employee benefits typically ranking first.
13 Commercial Bank: Definition, Function, Credit Creation and Significances. Economic Discussion [online]. 2013 [cit. 2017-02-21]. Available at
http://www.economicsdiscussion.net/banks/commercial-bank-definition-function-credit-creation-and-significances/607 14 Commercial Bank: Definition, Function, Credit Creation and Significances. Economic Discussion [online]. 2013 [cit. 2017-02-21]. Available at
http://www.economicsdiscussion.net/banks/commercial-bank-definition-function-credit-creation-and-significances/607
25
2.1 Bank Regulatory Environment in Georgia
Banks amass large sums of money from both individual and corporate customers, which can be put at risk because of the financial institution’s financial difficulties. For that reason, a regulator, normally the national bank or another official body, establishes strict risk thresholds that banks must not exceed. Banking supervision is carried out by the National Bank of Georgia to promote financial stability. Articled 96 and 96 of Georgia’s
Constitution, as well as the Organic Law of Georgia ’’On the National Bank of Georgia,’’
the ’’Law on the Activities of Commercial Banks,’’ and other related laws, describe the
National Bank of Georgia’s mandate.
The National Bank of Georgia conducts risk-based supervision within framework of the General Risk Assessment Program. This process is regulated by the ‘’Rule on
General Risk Assessment Program (GRAPE)’’. GRAPE entails assessment of risk
levels of commercial banks according to the following risk categories: credit risk, liquidity risk, market risk, operating risk, business model and profitability risk, as well as considering the macroeconomic environment, group structure and corporate governance. Furthermore, GRAPE considers a bank’s potential access to resources in the case of risks of being realized15.
2.1.1 Pillar 1 and capital buffer requirements
Capital requirements for commercial banks are defined by Basel III standards, namely Regulation 575/2013 adopted on 26 June 2013 by the European Parliament and Commission, and Directive 2013/36/EU16. The Third Basel Agreement applies majority of countries all over the world.
BASEL III is a comprehensive reform designed to improve banking sector supervision and risk management. It based on the prior document International Convergence of Capital Measurement and Capital Standards, also known as BASEL II. Three pillars make up the Basel Framework. Calculations of regulatory capital requirements for credit, industry, and operating risk are implemented in Pillar 1. Pillar 2 lays out the
15 GRAPE, available at: https://www.nbg.gov.ge/uploads/publications/grape/grape_f.pdf, page 7
16 Capital Adequacy Standards, available at: https://www.nbg.gov.ge/index.php?m=698

steps the bank should take to determine its capital adequacy, as well as the mechanism that a regulator should use when evaluating the risks that banks take. Pillar 3 defines transparency standards with the aim of promoting market discipline. There are some parts that will be extensively discussed because they have a significant impact on bank’s core business and intrinsic value.
According to the amendments to’’the Regulation on Capital Adequacy Requirements
for Commercial Banks’’ Pillar 1 minimum requirements have become compatible with
the framework established by Basel Committee of Banking Supervision. Conservation buffer in the amount of 2.5% which used to be merged with minimum requirements, has been separated from the minimum capital requirements (Common Equity Tier 1, Tier 1 and Total Regulatory Capital respectively being 7%, 8.5% and 10.5%). Therefore, updated minimum capital requirements are: 4.5%, 6% and 8% for Common Equity Tier 1, Tier 1 and Total Regulatory Capital respectively17.
Another important explanation why financial services business are valued differently than non-financial corporations is because of capital requirements. The criteria influence not just how a bank works, but also how much equity it must hold to satisfy the requirements.
From an economic standpoint, Tier 1 Capital must possess the characteristics of shareholders’ equity. Tier 1 Capital must be able to withstand future losses while also
allowing the bank to operate. Common Equity Tier 1 and Additional Tier 1 are the two subcategories. Equity in the commons Tier 1 or core capital is the highest quality capital since it can withstand any losses
The aim of regulators is to keep banks well-funded because they are typically deeply entrenched in the economy. As a result, banks are normally required by the regulatory body to maintain specific capital ratios that are higher than the set threshold. In other words, Common Equity Tier 1 must always be at least 4.5 percent of risk-weighted assets (RWA).
Furthermore, besides above-mentioned changes, banks are required to hold additional so-called Combined Buffer through Common Equity Tier 1. The combined buffer consists of the conservation, the countercyclical and the systematic buffers18. Rate
17 Supervisory Plan of The National Bank of Georgia With Regard To COVID-19, available at: https://www.nbg.gov.ge/index.php?m=340&newsid=3901&lng=eng
18 The National bank of Georgia continuous convergence with Basel III standards, available at: https://www.nbg.gov.ge/index.php?m=340&newsid=3248&lng=eng
27
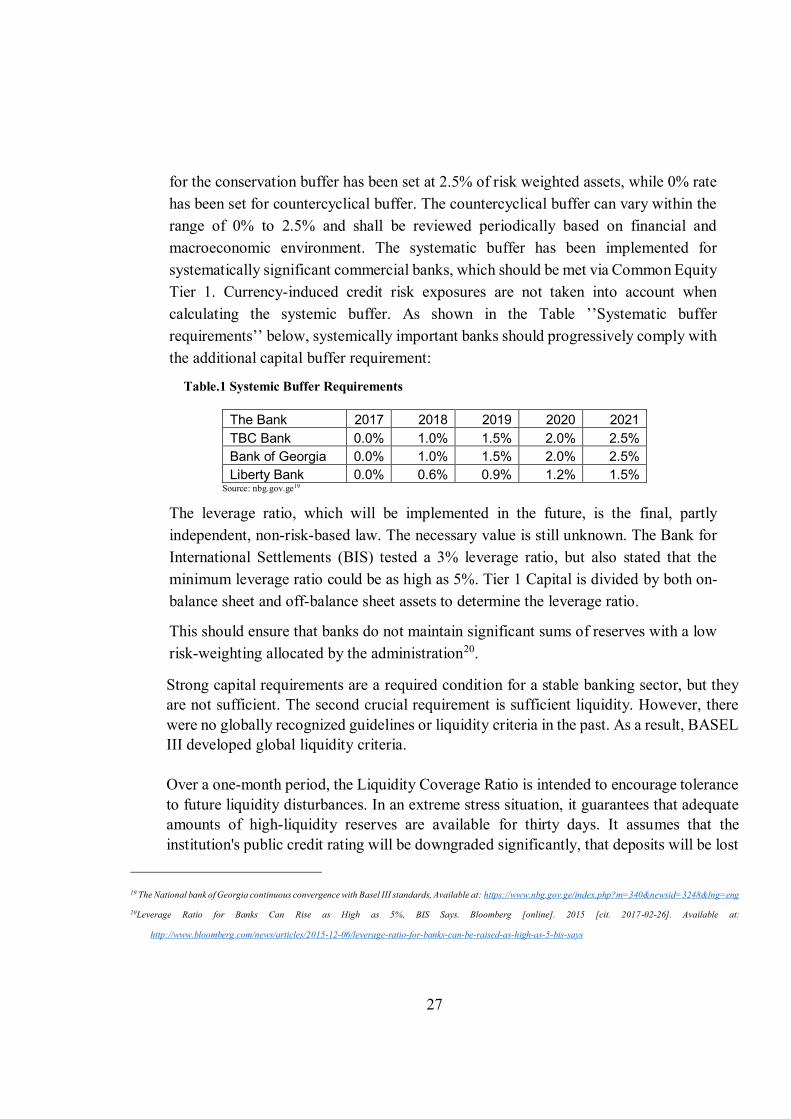
for the conservation buffer has been set at 2.5% of risk weighted assets, while 0% rate has been set for countercyclical buffer. The countercyclical buffer can vary within the range of 0% to 2.5% and shall be reviewed periodically based on financial and macroeconomic environment. The systematic buffer has been implemented for systematically significant commercial banks, which should be met via Common Equity Tier 1. Currency-induced credit risk exposures are not taken into account when calculating the systemic buffer. As shown in the Table ’’Systematic buffer
requirements’’ below, systemically important banks should progressively comply with the additional capital buffer requirement:
Table.1 Systemic Buffer Requirements
The Bank 2017 2018 2019 2020 2021 TBC Bank 0.0% 1.0% 1.5% 2.0% 2.5% Bank of Georgia 0.0% 1.0% 1.5% 2.0% 2.5% Liberty Bank 0.0% 0.6% 0.9% 1.2% 1.5%
Source: nbg.gov.ge19
The leverage ratio, which will be implemented in the future, is the final, partly independent, non-risk-based law. The necessary value is still unknown. The Bank for International Settlements (BIS) tested a 3% leverage ratio, but also stated that the minimum leverage ratio could be as high as 5%. Tier 1 Capital is divided by both on-balance sheet and off-balance sheet assets to determine the leverage ratio.
This should ensure that banks do not maintain significant sums of reserves with a low risk-weighting allocated by the administration20.
Strong capital requirements are a required condition for a stable banking sector, but they are not sufficient. The second crucial requirement is sufficient liquidity. However, there were no globally recognized guidelines or liquidity criteria in the past. As a result, BASEL III developed global liquidity criteria. Over a one-month period, the Liquidity Coverage Ratio is intended to encourage tolerance to future liquidity disturbances. In an extreme stress situation, it guarantees that adequate amounts of high-liquidity reserves are available for thirty days. It assumes that the institution's public credit rating will be downgraded significantly, that deposits will be lost
19 The National bank of Georgia continuous convergence with Basel III standards, Available at: https://www.nbg.gov.ge/index.php?m=340&newsid=3248&lng=eng
20Leverage Ratio for Banks Can Rise as High as 5%, BIS Says. Bloomberg [online]. 2015 [cit. 2017-02-26]. Available at:
http://www.bloomberg.com/news/articles/2015-12-06/leverage-ratio-for-banks-can-be-raised-as-high-as-5-bis-says
in part, and that the institution's assets will be liquidated, other serious concerns include the lack of unsecured wholesale financing.
Second, in order to comply with the net stable funding ratio, a bank must maintain a minimum number of stable sources of funding. The aim is to reduce the risk of a bank's liquidity status being seriously impacted by threats to its normal sources of funding. Supervisors, understandably, use a range of reporting methods to detect possible problems before they become severe21. The current global trend pushes banks to diversify their funding sources, which should help them maintain adequate liquidity at all times. As a result, the gap between banks financed by deposits and those funded by bond issuances is closing.
2.1.2 Pillar 2 Requirements
Commercial banks, in compliance with the Basel III system, can keep capital adequacy reserves for certain threats that aren't properly protected under Pillar 1. The National Bank of Georgia adopted the "Rule on Additional Capital Buffer Requirements for Commercial Banks within Pillar 2" with the aim of formalizing and establishing this structure.
Pillar 2 capital requirements, in compliance with this law, include requirements for an unhedged currency driven credit risk buffer, which was previously included in Pillar 1. The Unhedged Currency Exposure Buffer is a macroprudential shield against the systemic risk of dollarization. The addition of this buffer emphasizes the National Bank of Georgia's plan to gradually reduce banking system dollarization, resulting in a more robust banking system that can withstand external shocks. In addition, the Pillar 2 system specifies a capital buffer for credit portfolio concentration risk (both name and sectoral concentration risk), a net stress-test buffer based on supervisory stress-test outcomes, and a net GRAPE buffer set calculated by the NBG supervisory mechanism – General Risk Assessment Program (GRAPE).
It's important to note, that capital buffers under Pillar 2 should be proportionately incorporated in capital requirements. Therefore, 56% of capital required under Pillar 2 should be held through Common Equity Tier 1, while 75% through Tier 1 capital
21 Basel III summary, IBM (online) 2015 (cit. 2021-05-16). Available at: https://www.ibm.com/docs/en/bfmdw/8.8?topic=accord-basel-iii-summary
29
instruments22. Commercial banks have been granted sufficient timeframes to comply with these criteria.
As a result of the changes to capital adequacy requirements, when a commercial bank breaches the new total capital requirement, the combined buffer requirement is considered to be breached first. In such cases, distribution of own equity instruments, including dividend distributions, is prohibited under the updated ‘'Regulation on
Capital Adequacy Requirements for Commercial Banks." prohibited.
Furthermore, because of a sudden devaluation of currency that triggers a mechanical increase in risk weighted assets, the total capital requirement calculated under Pillar 2 may be temporarily decreased, for a period of one year. The specific amount of capital that will be used to minimize the capital requirement must be measured using the bank's methodology and approved by the NBG. This technique must be followed when calculating capital amounts by commercial banks. If a commercial bank's capital is reduced further than the methodology allows, the bank will fail to meet the combined buffer threshold and will be subject to dividend payment and other restrictions.
22 The National bank of Georgia continuous convergence with Basel III standards, available at: https://www.nbg.gov.ge/index.php?m=340&newsid=3248&lng=eng
3 Theory of valuation
After getting useful theoretical information about the country’s economic state and regulatory frameworks, the author in this chapter starts explaining key valuation models which are implied in the practical part of the thesis. For evaluating the financial performance of the banks and comparison well known financial ratios are calculated, then Porter’s five forces analysis are
used. Lastly the cross-sectional analysis concludes with valuation.
3.1 Bank Valuation
In general, any financial service firms it can be a bank, insurance company or something else, have different valuation technique compared to other profit seeking companies. When valuing a bank, the unique business model and operational activities must be considered. The differences between financial statements and activities are examined in this chapter. Bank valuation models are discussed in the second part of the chapter.
According to Damodaran23, there are four differences in financial service firms compared to others in the market that can create considerable issues in valuation: regulatory framework, accounting rules, definitions of debt and reinvestment.
Regulation
Financial companies are strictly regulated throughout the world. Considering their influence on the market it is quite needed. Besides the general Basel committee decisions, each country’s regulatory institute imposes different requirements related to capital ratios, investment opportunities, merges, and acquisition procedures or even the entrance of a new firm into the market. Overall, those restraints serve to protect banking sector itself, then customers and shareholders interests too. While analyzing financial services firms, the one must be aware all the regulations that govern their operations. Otherwise it can lead to a serious discrepancy
According Rules
The products, services (any financial instruments) financial firms offer to the customers often does not have fixed value. Their prices change depending on the
23 Valuing financial Sevices firms. NYU Stern (online). 2009 (cit. 2021-05-05). Availabe at: http://people.stern.nyu.edu/adamodar/pdfiles/papers/finfirm09.pdf
31
market performance. Therefore, for the accounting purposes marking assets to market value has been an established practice, well before other firms even started talking about fair value accounting24. Another peculiarity for bank’s bookkeeping is creating
loan loss provisions. Since there is no general rule regarding this amount, banks define amounts individually. Depending on the type of financial firm, it can create more for potential losses or way less and use it for reinvestment. Understanding, the accounting rule of the company you are evaluating is also quite important
Debt
Again, because of the essence of financial firms’ operations their definition of debt is different from typical case. Debt is a source for further operations, banks take excess capital from one part and turn it into a product -loan for another part. This is the easiest product. They do not account deposits as debts. If so the operating income for a bank should be measured prior to interest paid to depositors, which would be problematic25.
Reinvestment
As mentioned above, national authorities control where financial firms invest and how much. While reinvestment is needed for the future growth, it can be quite challenging to measure two required variables for computation: net capital expenditures (CAPEX) and working capital (WC). Financial firms usually invest in intangible assets and not in property, plant and equipment. Which are recorded as operational expenses in cash flow statement. When it comes to WC, the difference between current assets and current liabilities, a significant portion of a bank’s balance
sheet will fall under one of these categories and the number may have no relationship to reinvestment for growth. That is the reason we need to make some adjustments for valuation.
24 Valuing Financial Service Firms. NYU Stern [online]. 2009 [cit. 2021-05-05]. Available at: http://people.stern.nyu.edu/adamodar/pdfiles/papers/finfirm09.pdf p 6 25 Valuing Financial Service Firms. NYU Stern [online]. 2009 [cit. 2021-05-05]. Available at: http://people.stern.nyu.edu/adamodar/pdfiles/papers/finfirm09.pdf, p 8

3.2 Financial ratios
From the perspective of future investments usually investors are interested in the ratios which give them Therefore, their financial performance is important step in the analysis process. Prof-itability can be clearly measured with the following ratios: Return on Assets (ROA), Return on Equity (ROE) and Net Interest Margin (NIM). The author briefly describes their importance and idea’s below. ROA is the result of net profit divided by total assets. ROA indicates the ability of a bank to generate profit from its total assets, how profitably a commercial bank uses its resources. The higher the ROA, the more efficiently the resources are used by the bank26. ROE is the second important ratio, representing the relation of the bank profit to its total equity. A bank with a high value of ROE is capable of creating an internal cash flow. Therefore, the higher the ROE, the more profitable the company is in terms of making a profit27 NIM is the difference between the bank’s income and its expense related to interest such as
difference between the difference between the interest income received and the interest expense paid to a lender regarding his/her deposits28.
3.3 Valuation Models
Comparing the implied and actual share prices is the simplest step in the valuation process. Knowing how much an asset is worth and how that value is determined is important for making informed decisions29. Many assumptions are made in valuation models, but they should be sup-ported by data or logical explanations. Otherwise, the results cannot be trusted. The emphasis of this study is on valuing two banks for the intent of a future investment. The author theoretically
defines following valuation models: free cash flow to equity (FCFE), excess return and rel-
ative valuation and then compute TBC and BGEO banks’ value.
26 Nguyen, A. H., Nguyen, H. T., & Pham, H. T. (2020). Applying the CAMEL model to assess performance of commercial banks: empirical evidence from
Vietnam. Banks and Bank Systems, 15(2), 177. p179 27 Nguyen, A. H., Nguyen, H. T., & Pham, H. T. (2020). Applying the CAMEL model to assess performance of commercial banks: empirical evidence from Vietnam. Banks and Bank Systems, 15(2), 177. p179 28 Nguyen, A. H., Nguyen, H. T., & Pham, H. T. (2020). Applying the CAMEL model to assess performance of commercial banks: empirical evidence from
Vietnam. Banks and Bank Systems, 15(2), 177. p179 29 What is Valuation? NYU Stern [online]. 2014 [cit. 2021-05-05]. Available at: http://pages.stern.nyu.edu/~adamodar/New_Home_Page/background/valintro.htm
33
It is recommended that the three statements model (Income Statement, balance sheet, cash flow statement) be created in order to be able to build way more advanced models. An analyst actually forecasts how the company's financial statements will appear in the future, discounting anticipated future cash flows, dividends, or some other metric used in valuation. This is referred to as financial modeling30.
Free Cash Flow to Equity
The common Free Cash Flow to Equity (FCFE) approach is particularly useful for valuing banks because it considers the fact that banks can generate value from their liabilities.
For some factors, using cash flow as a basis for measuring profits of owners as dividend income potential for bank owners is inappropriate:
In the banking industry, the statement of cash flows is not appropriate for identifying sources for shareholders, such as dividends, which can only be paid from actual net income after tax, not from the movement of cash (cash flow).
Shareholders do not have fair access to bank and company income; in the bank, there is no issue with cash supply to shareholders due to the existence of the vast majority of assets and liabilities; however, other types of companies can produce large discrepancies between cash flow and profits in the sense that the business produces profits but not enough cash flow
Differences between interest income and cost, as well as payments for services, are the key sources of income in banking.
Interest income and cost, as the most significant component of their income and capital growth, or its renewal, must be taken into consideration when avluing financial institutions. The calculation of FCFE in banks and financial institutions can be implemented in the following way:
Equation 1. FCFE
30 What is Financial Modelling CFI. 2021 [cit. 2021-05-05]. Available at: https://corporatefinanceinstitute.com/resources/knowledge/modeling/what-is-financial-
modeling/
FCFE = Change in Assets – Change in Liabilities= Growth (change) of Capital +Net Income31
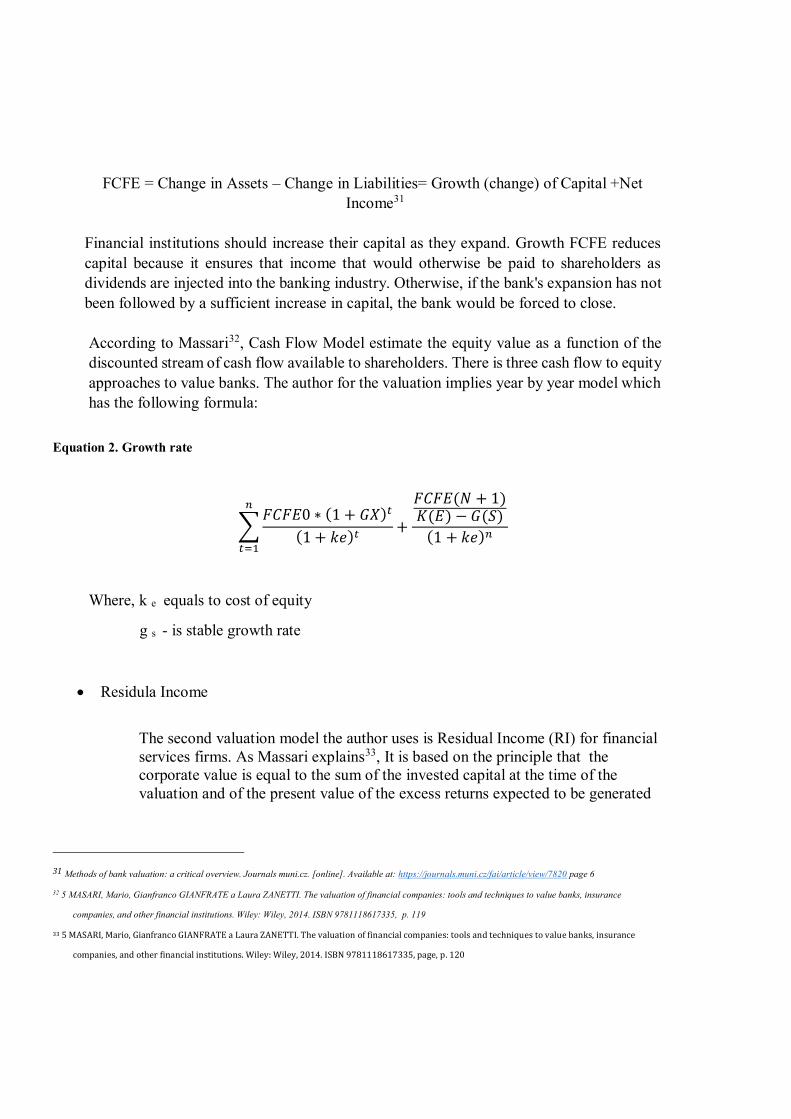
Financial institutions should increase their capital as they expand. Growth FCFE reduces capital because it ensures that income that would otherwise be paid to shareholders as dividends are injected into the banking industry. Otherwise, if the bank's expansion has not been followed by a sufficient increase in capital, the bank would be forced to close. According to Massari32, Cash Flow Model estimate the equity value as a function of the discounted stream of cash flow available to shareholders. There is three cash flow to equity approaches to value banks. The author for the valuation implies year by year model which has the following formula:
Equation 2. Growth rate
∑𝐹𝐶𝐹𝐸0 ∗ (1 + 𝐺𝑋)𝑡
(1 + 𝑘𝑒)𝑡+
𝐹𝐶𝐹𝐸(𝑁 + 1)𝐾(𝐸) − 𝐺(𝑆)
(1 + 𝑘𝑒)𝑛
𝑛
𝑡=1
Where, k e equals to cost of equity
g s - is stable growth rate
Residula Income
The second valuation model the author uses is Residual Income (RI) for financial services firms. As Massari explains33, It is based on the principle that the corporate value is equal to the sum of the invested capital at the time of the valuation and of the present value of the excess returns expected to be generated
31 Methods of bank valuation: a critical overview. Journals muni.cz. [online]. Available at: https://journals.muni.cz/fai/article/view/7820 page 6
32 5 MASARI, Mario, Gianfranco GIANFRATE a Laura ZANETTI. The valuation of financial companies: tools and techniques to value banks, insurance
companies, and other financial institutions. Wiley: Wiley, 2014. ISBN 9781118617335, p. 119
33 5 MASARI, Mario, Gianfranco GIANFRATE a Laura ZANETTI. The valuation of financial companies: tools and techniques to value banks, insurance
companies, and other financial institutions. Wiley: Wiley, 2014. ISBN 9781118617335, page, p. 120
35
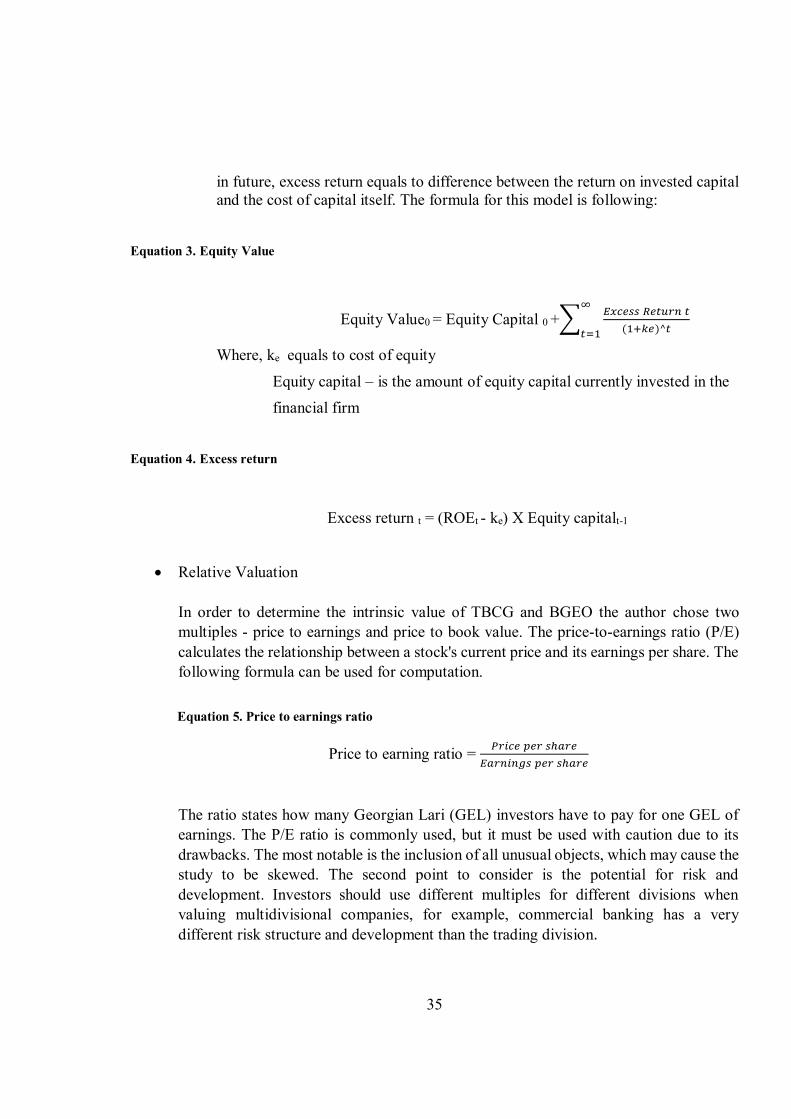
in future, excess return equals to difference between the return on invested capital and the cost of capital itself. The formula for this model is following:
Equation 3. Equity Value
Equity Value0 = Equity Capital 0 +∑𝐸𝑥𝑐𝑒𝑠𝑠 𝑅𝑒𝑡𝑢𝑟𝑛 𝑡
(1+𝑘𝑒)^𝑡
∞
𝑡=1
Where, ke equals to cost of equity
Equity capital – is the amount of equity capital currently invested in the financial firm
Equation 4. Excess return
Excess return t = (ROEt - ke) X Equity capitalt-1
Relative Valuation In order to determine the intrinsic value of TBCG and BGEO the author chose two multiples - price to earnings and price to book value. The price-to-earnings ratio (P/E) calculates the relationship between a stock's current price and its earnings per share. The following formula can be used for computation.
Equation 5. Price to earnings ratio
Price to earning ratio = 𝑃𝑟𝑖𝑐𝑒 𝑝𝑒𝑟 𝑠ℎ𝑎𝑟𝑒
𝐸𝑎𝑟𝑛𝑖𝑛𝑔𝑠 𝑝𝑒𝑟 𝑠ℎ𝑎𝑟𝑒
The ratio states how many Georgian Lari (GEL) investors have to pay for one GEL of earnings. The P/E ratio is commonly used, but it must be used with caution due to its drawbacks. The most notable is the inclusion of all unusual objects, which may cause the study to be skewed. The second point to consider is the potential for risk and development. Investors should use different multiples for different divisions when valuing multidivisional companies, for example, commercial banking has a very different risk structure and development than the trading division.

Price-to-book ratio (P/B) measures the relationship between the current price of a stock and the book value per share. Four factors influence the P/B ratio. The higher the growth rate, the higher the return on equity, the higher the dividend ratio, or the lower the cost of equity, the higher the P/B ratio34. Owing to the close relationship between the market value of equity and the book value of equity, which is primarily a result of banks' asset marked to market accounting process, financial services companies are often priced using the P/B ratio.
The standard computation is described by the formula below35.
Equation 6. Price to book ratio
𝑃𝑟𝑖𝑐𝑒 𝑡𝑜 𝑒𝑎𝑟𝑛𝑖𝑛𝑔𝑠 𝑟𝑎𝑡𝑖𝑜= 𝑃𝑟𝑖𝑐𝑒 𝑝𝑒𝑟 𝑠ℎ𝑎𝑟𝑒
𝐵𝑜𝑜𝑘 𝑣𝑎𝑙𝑢𝑒 𝑝𝑒𝑟 𝑠ℎ𝑎𝑟𝑒
34 Price-Book Value Ratio: Definition. NYU Stern [online]. 2012 [cit. 2017-02-21]. Available at http://people.stern.nyu.edu/adamodar/pdfiles/eqnotes/pbv.pdf
35 Overview: Making sense of the price-to-book value ratio. Market Realist [online]. 2014 [cit. 2021-05-05]. Available at http://marketrealist.com/2014/08/overview-
making-sense-price-book-value-ratio/
37
4 Fundamental analysis of TBC and BGEO
The practical part of the thesis is focused on cross sectional analysis of TBC and BGEO banks. In the first place the author conducts a systematic macroeconomic study. Since, banks are highly vulnerable to a number of macroeconomic factors, which cannot be overlooked. The importance of business-specific problems and individual company valuation is emphasized below.
4.1 Implications of COVID-19
During 2020, Georgia, like most countries of the world, faced Covid-19 pandemic which caused the recession in global economies. Economic downtown had a significant impact on banking sector as well, mainly by increasing loan provisions and consequently effecting the banks’ profitability. This became the main driver of Georgian banking sector’s negative
performance for the period. That is the reason implications of COVID-19 can not be missed.
The COVID -19 pandemic has tested the resilience and character of banking sector. The sector was directly affected by three following factors:
Measures implemented by the Georgian Government to address the COVID-19 crisis, including the economic lockdown
Measures introduced by the National Bank of Georgia (NBG) in response to the COVID-19 crisis, and
Actions implemented by the individual banks to address the COVID-19 crisis.
The Government anti-crisis stimulus plan.
The Government announced a series of support measures designed to mitigate the negative economic impact of COVID-19. The Government’s revised 2020 budget document was
approved by Parliament in June 2020. The revised budget incorporates the fiscal parameters agreed with the IMF, US$1.5 billion in donor funding and fiscal stimulus measures for businesses and households affected by the coronavirus pandemic. Business support is at 3.8% of GDP and social assistance is at 2.7% of GDP in 2020 revised budget document, similar
fiscal support package in 2021 is expected to reach Gel 1.247 million, 2.3 percent of 2021 GDP36.
Georgian authorities have mobilized US$3.0 billion financing from the International Monetary Fund (the “IMF”) and other international partners (US, EU, World Bank, KFW, AFD, EBRD, EIB, ADB, etc.) to respond effectively to the COVID-19 pandemic associated economic crisis. Of this funding, US$1.5 billion is earmarked for the public sector and US$1.5 billion for the private sector. The IMF’s financing is c.US$576.4 million37, of which US$200 million was already disbursed to the budget.
Georgia successfully contained the first wave of the pandemic by introducing tight lockdown measures, including a curfew and a ban on transportation in 2Q20. From mid-May, businesses gradually reopened, but international flights resumed only to a limited number of countries from August 2020. A surge in COVID-19 cases in autumn resulted in further lockdown measures put in place in the retail and hospitality sectors at the end of November 2020, as well as a curfew and a ban on public transportation, while avoiding a full-scale lockdown for other areas of the economy, unlike in April-May. The Government responded to the pandemic with higher healthcare spending, a social assistance package for individuals, as well as tax exemptions and various funding mechanisms for businesses, and stimulus plans for some sectors of the economy. This was financed with the support of international donors, as the ongoing IMF programme and trust in the Government’s continued prudent
macroeconomic policymaking enabled the authorities to mobilize significant donor funding Georgia’s economy contracted by an estimated 6.5% y-o-y in 4Q20, reversing the recovery in 3Q20, on the back of the second wave of the COVID-19 cases and the new restrictions introduced by the Government. Domestic demand moderated due to the restrictions on mobility, as well as other restrictions introduced in large cities at the end of November 2020. Despite deceleration, the banking sector loan portfolio growth remained robust, increasing by 9.1% y-o-y on a constant currency basis, minimizing the second wave impact of the pandemic on the economy. Importantly, remittances continued to grow and were up 15.7% y-o-y in 4Q20. This, along with an improved trade deficit and The NBG interventions, stabilized the local currency at the end of December 2020. International reserves increased to US$ 3.9 billion as at 31 December 2020, largely reflecting the increased donor funding. The NBG maintained a moderately tight monetary policy to anchor inflation expectations
36 Onilne, available at: https://www.imf.org/en/Topics/imf-and-covid19/Policy-Responses-to-COVID-19#G
37Online, available at: https://www.imf.org/en/News/Articles/2020/11/10/pr20336-georgia-imf-staff-concludes-virtual-review-mission
39
and limit any pass-through impact from local currency depreciation. Annual inflation dropped to 2.4% in December 2020 from 3.8% in previous months, mainly reflecting utility subsidies by the Government for low-energy consumers. Notably, on 12 February 2021, Fitch Ratings affirmed Georgia's sovereign credit rating at BB, supported by strong governance and business environment indicators as well as consistent and credible policy framework underpinning Georgia's relative resilience to shocks.
NBG Policy
The NBG was implementing countercyclical measures to support the financial stability of the banking system and to ensure the provision of financial support to sectors of the economy affected by the current turmoil. The measures included a significant reduction in capital adequacy requirements and standby liquidity support incentives. In addition, the NBG coordinated the creation of respective loan loss provisions across the system. In relation to capital adequacy requirements, this means:
Combined buffer - the conservation buffer requirement of 2.5% of risk-weighted assets has been reduced to 0% indefinitely38
Allowing banks to use the conservation buffer (currently at 2.5pp on CET1) and 2/3 of the CICR buffer resulted in the release of 1.0-2.0% of capital across our CET1, Tier 1 and Total CAR
Leaving open the possibility of releasing all pillar 2 buffers (remaining 1/3 CICR, HHI and Net Grape buffers) in the range of 1.0-4.0% of capital across our CET1, Tier 1 and Total CAR
NBG requested the Georgian banks to create general provisions under the local accounting basis in the first quarter of 2020; this accounting basis is that used for calculation of capital adequacy ratios. The specific quantum of the provision reflects the NBG’s current
expectation of estimated credit losses on the lending book of the banking system for the entire economic cycle, given current economic expectations. The NBG considers the banking system capital ratios to be sufficiently in excess of the expected minimum capital requirements, to be able to absorb this upfront general provision, whilst maintaining sufficiently comfortable buffers over the required minimum capital ratios.
38 Onilne, Available at: https://bankofgeorgiagroup.com/storage/news/National%20Bank%20of%20Georgia%20supervisory%20plan%20-%20COVID-19.pdf
In relation to liquidity requirements, the NBG has introduced a swap program for US$ 200 million, with an annual spread of 9%.39
Bank policies and outcomes
To respond to the pandemic outbreak in spring 2020, the banks introduced a number of protocols and a comprehensive Business Continuity Plan aimed at mitigating the negative impact on businesses, employees, customers and communities. They have implemented measures to reduce physical interactions to prevent the virus spread, whilst maintaining the full banking capability required to support and assist their customers. This included fully moving back office staff to working from home, significantly ramping up the capacity of the call center, temporarily closing the customer service support areas of Express branches (mostly re-opened in June), implementing a three-month grace period on principal and interest payments on all retail loans, also for all their individual and MSME customers as well as those corporate customers whose business is the most exposed in the current situation, applying more stringent risk assessment procedures during the lending process, incentivizing the offloading of customer activity to digital channels through the temporary removal of fees on transactions executed through their mobile and internet banking platforms, among others. In the fourth quarter of 2020, following the emergence of the second wave of the COVID-19 cases, the banks again adjusted accordingly, moving a large part of their back office staff to remote work and reintroducing two-week shifts for certain departments and the front office staff.
4.2 Georgia Banking Industry Analysis
The financial sector is one of the most developed areas of the Georgian economy. In total, the sector currently consists of 15 privately owned commercial banks40, 39 mi-crofinance organisations, six brokerage companies, private pension funds (owned by insurance companies), deposit insurance fund. The financial system is biased towards
39 TBC bank, annual report 2019, available at: https://www.tbcbank.ge/web/documents/10184/411010/JSC+TBC+Bank+MRA+2019.pdf/a36335a9-aab7-488c-
b838-a6e3435f4daf page 10
40 NBG.gov.ge. available at https://www.nbg.gov.ge/index.php?m=403
41
the banking system. The sector is quite diversified. Around 90% of assets are foreign owned. Here you can see financial organisations from Netherlands, Germany, Turkey, Russia, Kazakhstan, China, Azerbaijan and even from UAE. Among them TBC and Bank of Georgia are the biggest commercial banks.
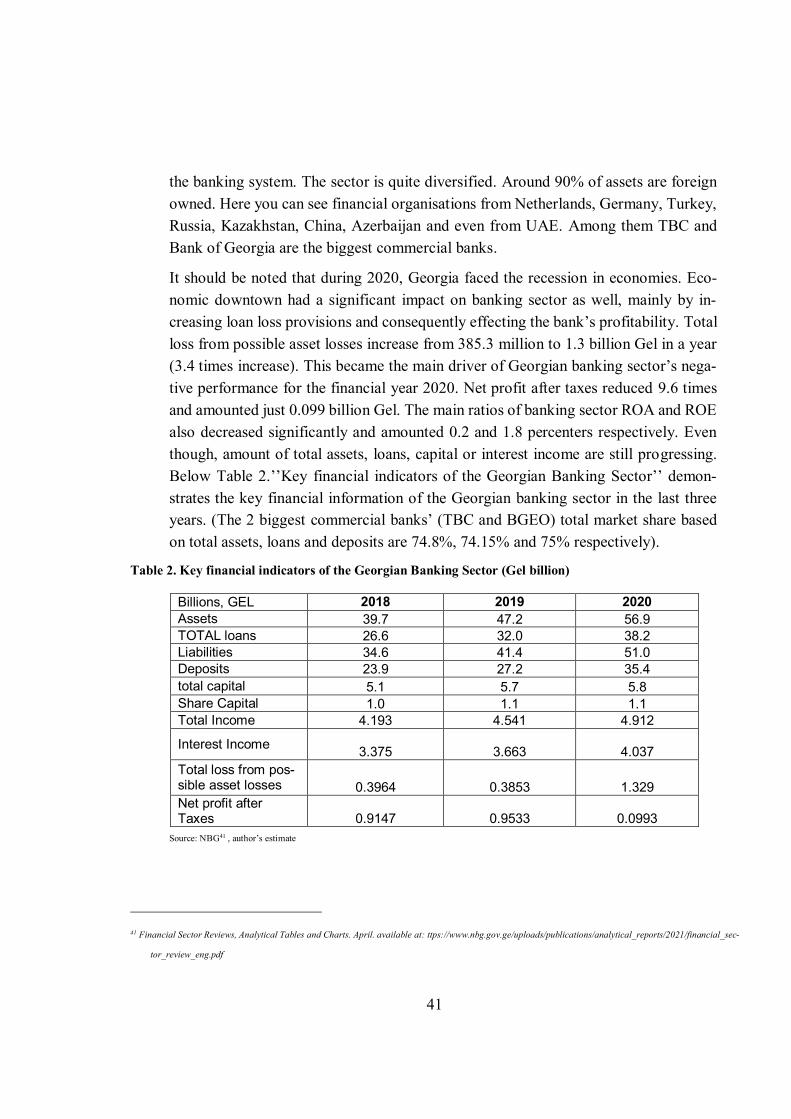
It should be noted that during 2020, Georgia faced the recession in economies. Eco-nomic downtown had a significant impact on banking sector as well, mainly by in-creasing loan loss provisions and consequently effecting the bank’s profitability. Total loss from possible asset losses increase from 385.3 million to 1.3 billion Gel in a year (3.4 times increase). This became the main driver of Georgian banking sector’s nega-
tive performance for the financial year 2020. Net profit after taxes reduced 9.6 times and amounted just 0.099 billion Gel. The main ratios of banking sector ROA and ROE also decreased significantly and amounted 0.2 and 1.8 percenters respectively. Even though, amount of total assets, loans, capital or interest income are still progressing. Below Table 2.’’Key financial indicators of the Georgian Banking Sector’’ demon-
strates the key financial information of the Georgian banking sector in the last three years. (The 2 biggest commercial banks’ (TBC and BGEO) total market share based on total assets, loans and deposits are 74.8%, 74.15% and 75% respectively).
Table 2. Key financial indicators of the Georgian Banking Sector (Gel billion)
Billions, GEL 2018 2019 2020 Assets 39.7 47.2 56.9 TOTAL loans 26.6 32.0 38.2 Liabilities 34.6 41.4 51.0 Deposits 23.9 27.2 35.4 total capital 5.1 5.7 5.8 Share Capital 1.0 1.1 1.1 Total Income 4.193 4.541 4.912
Interest Income 3.375 3.663 4.037 Total loss from pos-sible asset losses 0.3964 0.3853 1.329 Net profit after Taxes 0.9147 0.9533 0.0993
Source: NBG41 , author’s estimate
41 Financial Sector Reviews, Analytical Tables and Charts. April. available at: ttps://www.nbg.gov.ge/uploads/publications/analytical_reports/2021/financial_sec-
tor_review_eng.pdf
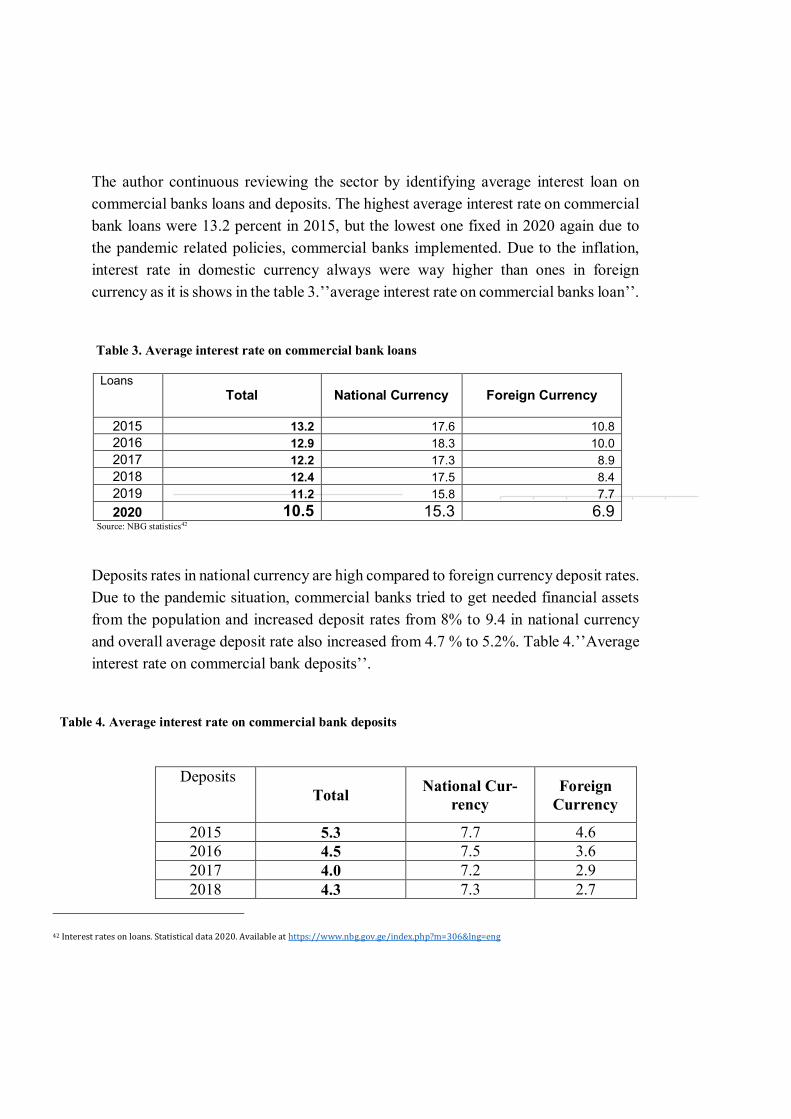
The author continuous reviewing the sector by identifying average interest loan on commercial banks loans and deposits. The highest average interest rate on commercial bank loans were 13.2 percent in 2015, but the lowest one fixed in 2020 again due to the pandemic related policies, commercial banks implemented. Due to the inflation, interest rate in domestic currency always were way higher than ones in foreign currency as it is shows in the table 3.’’average interest rate on commercial banks loan’’.
Table 3. Average interest rate on commercial bank loans
Loans
Total National Currency Foreign Currency
2015 13.2 17.6 10.8 2016 12.9 18.3 10.0 2017 12.2 17.3 8.9 2018 12.4 17.5 8.4 2019 11.2 15.8 7.7 2020 10.5 15.3 6.9
Source: NBG statistics42
Deposits rates in national currency are high compared to foreign currency deposit rates. Due to the pandemic situation, commercial banks tried to get needed financial assets from the population and increased deposit rates from 8% to 9.4 in national currency and overall average deposit rate also increased from 4.7 % to 5.2%. Table 4.’’Average
interest rate on commercial bank deposits’’.
Table 4. Average interest rate on commercial bank deposits
42 Interest rates on loans. Statistical data 2020. Available at https://www.nbg.gov.ge/index.php?m=306&lng=eng
Deposits
Total National Cur-rency
Foreign Currency
2015 5.3 7.7 4.6 2016 4.5 7.5 3.6 2017 4.0 7.2 2.9 2018 4.3 7.3 2.7
43
Source: NBG statistics43
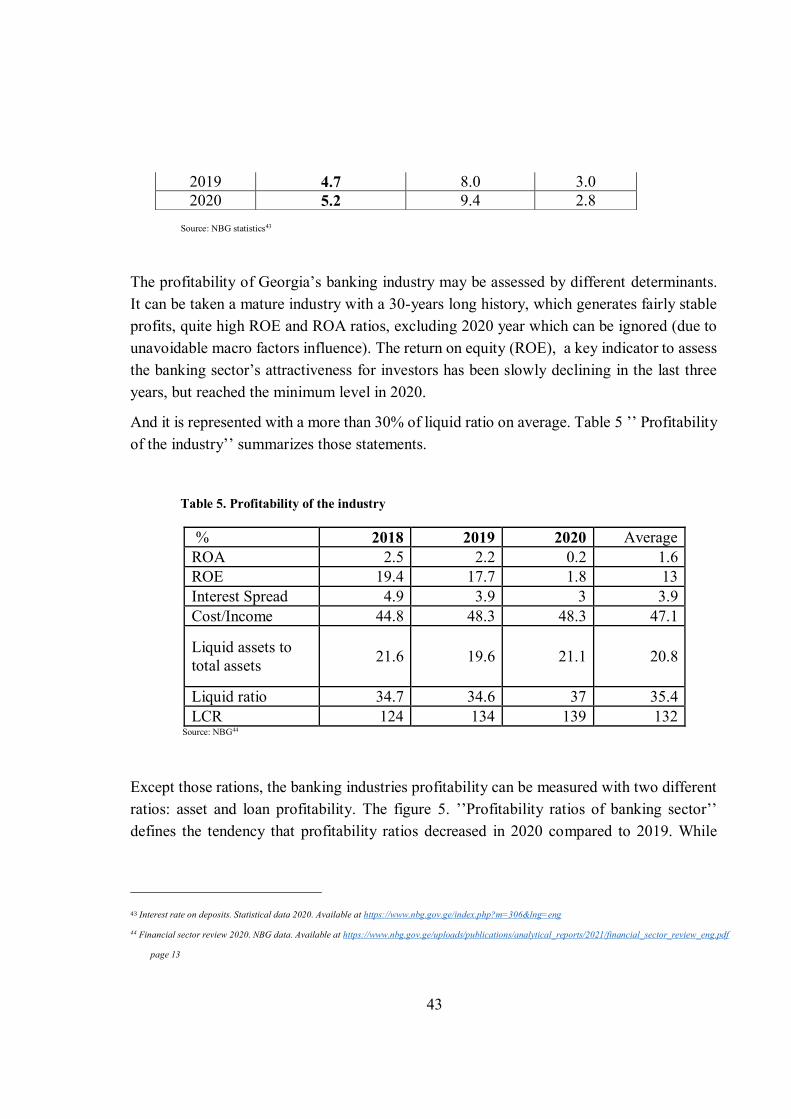
The profitability of Georgia’s banking industry may be assessed by different determinants. It can be taken a mature industry with a 30-years long history, which generates fairly stable profits, quite high ROE and ROA ratios, excluding 2020 year which can be ignored (due to unavoidable macro factors influence). The return on equity (ROE), a key indicator to assess the banking sector’s attractiveness for investors has been slowly declining in the last three
years, but reached the minimum level in 2020.
And it is represented with a more than 30% of liquid ratio on average. Table 5 ’’ Profitability of the industry’’ summarizes those statements.
Table 5. Profitability of the industry
% 2018 2019 2020 Average ROA 2.5 2.2 0.2 1.6 ROE 19.4 17.7 1.8 13 Interest Spread 4.9 3.9 3 3.9 Cost/Income 44.8 48.3 48.3 47.1
Liquid assets to total assets 21.6 19.6 21.1 20.8
Liquid ratio 34.7 34.6 37 35.4 LCR 124 134 139 132
Source: NBG44
Except those rations, the banking industries profitability can be measured with two different ratios: asset and loan profitability. The figure 5. ’’Profitability ratios of banking sector’’
defines the tendency that profitability ratios decreased in 2020 compared to 2019. While
43 Interest rate on deposits. Statistical data 2020. Available at https://www.nbg.gov.ge/index.php?m=306&lng=eng
44 Financial sector review 2020. NBG data. Available at https://www.nbg.gov.ge/uploads/publications/analytical_reports/2021/financial_sector_review_eng.pdf
page 13
2019 4.7 8.0 3.0 2020 5.2 9.4 2.8
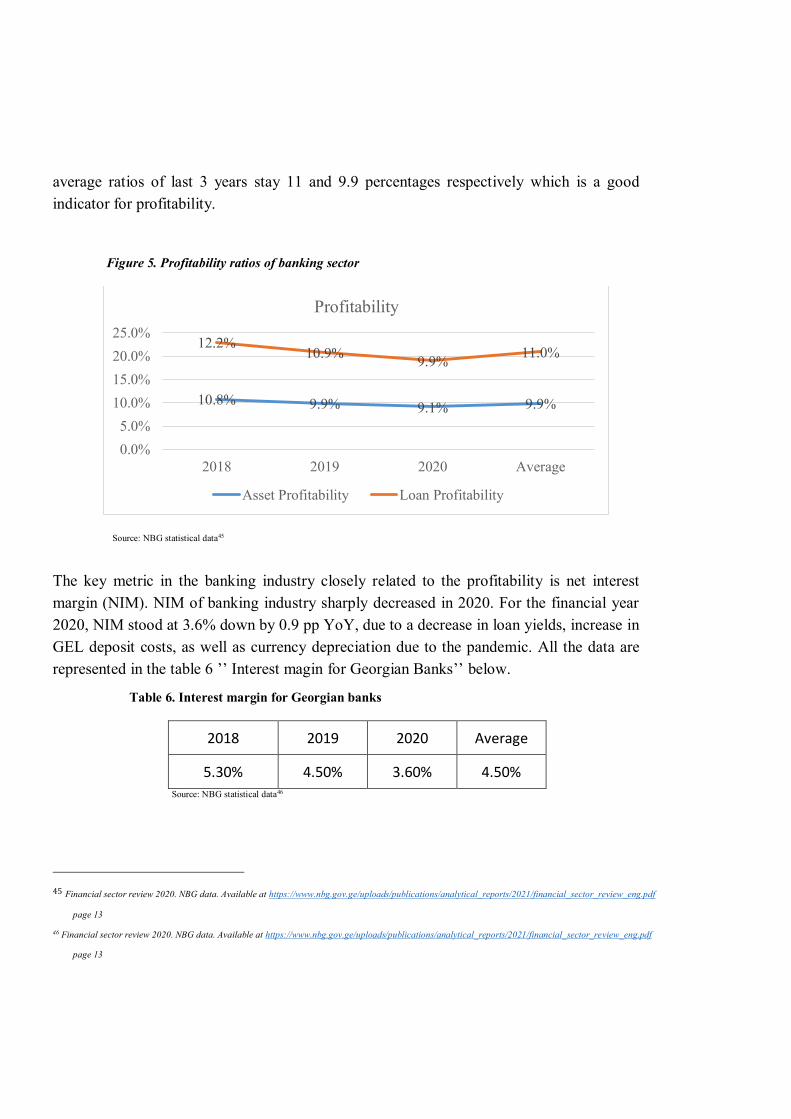
average ratios of last 3 years stay 11 and 9.9 percentages respectively which is a good indicator for profitability.
Figure 5. Profitability ratios of banking sector
Source: NBG statistical data45
The key metric in the banking industry closely related to the profitability is net interest margin (NIM). NIM of banking industry sharply decreased in 2020. For the financial year 2020, NIM stood at 3.6% down by 0.9 pp YoY, due to a decrease in loan yields, increase in GEL deposit costs, as well as currency depreciation due to the pandemic. All the data are represented in the table 6 ’’ Interest magin for Georgian Banks’’ below.
Table 6. Interest margin for Georgian banks
2018 2019 2020 Average
5.30% 4.50% 3.60% 4.50%
Source: NBG statistical data46
45 Financial sector review 2020. NBG data. Available at https://www.nbg.gov.ge/uploads/publications/analytical_reports/2021/financial_sector_review_eng.pdf
page 13
46 Financial sector review 2020. NBG data. Available at https://www.nbg.gov.ge/uploads/publications/analytical_reports/2021/financial_sector_review_eng.pdf
page 13
10.8% 9.9% 9.1% 9.9%
12.2%10.9% 9.9% 11.0%
0.0%5.0%
10.0%15.0%20.0%25.0%
2018 2019 2020 Average
Profitability
Asset Profitability Loan Profitability
45
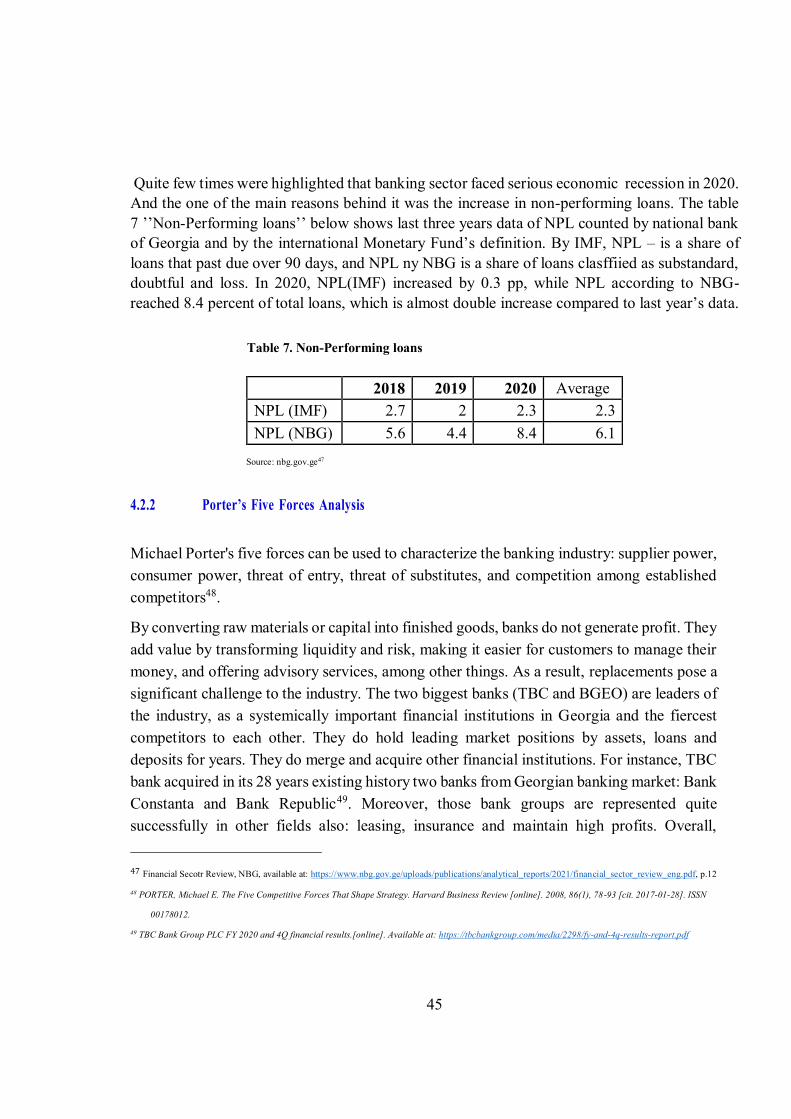
Quite few times were highlighted that banking sector faced serious economic recession in 2020. And the one of the main reasons behind it was the increase in non-performing loans. The table 7 ’’Non-Performing loans’’ below shows last three years data of NPL counted by national bank
of Georgia and by the international Monetary Fund’s definition. By IMF, NPL – is a share of loans that past due over 90 days, and NPL ny NBG is a share of loans clasffiied as substandard, doubtful and loss. In 2020, NPL(IMF) increased by 0.3 pp, while NPL according to NBG- reached 8.4 percent of total loans, which is almost double increase compared to last year’s data.
Table 7. Non-Performing loans
Source: nbg.gov.ge47
4.2.2 Porter’s Five Forces Analysis
Michael Porter's five forces can be used to characterize the banking industry: supplier power, consumer power, threat of entry, threat of substitutes, and competition among established competitors48.
By converting raw materials or capital into finished goods, banks do not generate profit. They add value by transforming liquidity and risk, making it easier for customers to manage their money, and offering advisory services, among other things. As a result, replacements pose a significant challenge to the industry. The two biggest banks (TBC and BGEO) are leaders of the industry, as a systemically important financial institutions in Georgia and the fiercest competitors to each other. They do hold leading market positions by assets, loans and deposits for years. They do merge and acquire other financial institutions. For instance, TBC bank acquired in its 28 years existing history two banks from Georgian banking market: Bank Constanta and Bank Republic49. Moreover, those bank groups are represented quite successfully in other fields also: leasing, insurance and maintain high profits. Overall, 47 Financial Secotr Review, NBG, available at: https://www.nbg.gov.ge/uploads/publications/analytical_reports/2021/financial_sector_review_eng.pdf, p.12
48 PORTER, Michael E. The Five Competitive Forces That Shape Strategy. Harvard Business Review [online]. 2008, 86(1), 78-93 [cit. 2017-01-28]. ISSN
00178012.
49 TBC Bank Group PLC FY 2020 and 4Q financial results.[online]. Available at: https://tbcbankgroup.com/media/2298/fy-and-4q-results-report.pdf
2018 2019 2020 Average NPL (IMF) 2.7 2 2.3 2.3 NPL (NBG) 5.6 4.4 8.4 6.1

competition and entrance of strong players are welcomed in the industry. But being in the same level as those two banks are quite challenging for any other banks even though they are domestic or foreign capital founded ones.
Money is, in essence, the most liquid and transferable of all financial instruments. If a consumer takes out a loan, the commodity, the loan itself, is nearly identical regardless of which bank offers it. The customer is given a certain amount of money and is required to repay it. The interest rate is the most significant variable. Other considerations, such as the branch office's proximity or a previous relationship with the bank, may be taken into account. Customers, on the other hand, almost always believe and know that they have a choice. As a result, market differentiation is extremely difficult.
As a result of the internet's rise, customers' bargaining power has greatly increased. Switching banks takes just a few minutes, and customers can quickly compare the terms and conditions of various banks. An individual does not pose a serious risk to a bank. Customers who shop in stores, on the other hand, have a lot of bargaining power. Since NII is traditionally the most important source of revenue for commercial banks. Corporate and high-net-worth individuals have more individual bargaining power because the loss of large accounts would have a greater impact on the bank's profitability. The asset management industry is unusual in that the loss of a single well-known customer will result in large withdrawals.
The bargaining power of suppliers cannot be measured all at once. Bank suppliers are divided into two groups based on their religious differences. Depositors (those who provide capital) make up the first category, while workers make up the second (supplying labor). The former party's situation is identical to that of the customers' bargaining power.
Employees usually do not have a lot of bargaining power. Individual vendors, with the exception of executives, have little influence over the bank's operations and policy, and labor union representation is low.
Georgia's banking sector is fiercely competitive. Essentially, any customer who requires banking services already has them. As a result, new consumers must be attracted from rivals. That, however, is prohibitively costly. Banks aim to sell as many items to their customers as possible. The behavior is due to two factors. For starters, more sold goods imply more income for the bank. Second, the higher a customer's switching costs are, and the less likely he is to accept a competitor's bid, the more goods he has.
47
Strict regulation, capital requirements, and the length of time required to develop brand identity and operations reduce the danger of new entrants to a bare minimum. TBC and BGEO, two financial behemoths, have been in existence for decades. In less than a decade, every new entrant has a very low chance of seriously threatening their spot.
To summarize, the Georgian banking industry is competitive, with suppliers and consumers wielding only moderate influence. However, due to the unique characteristics of capital, the sector as a whole is very unique. New entrants face a tough start due to the stringent regulatory criteria.
4.3 Business Model of TBC and BGEO
After analyzing the country’s banking sector, the author focuses on two systematically
important banks. The valuation process cannot be taken completed without first understanding their business descriptions by reviewing key operating categories. Later on, this chapter values and compares their economic conditions.
TBC Bank Group PLC
TBC Bank Group PLC (or the Group) was founded in 1992 and is headquartered in Tbilisi, Georgia. TBC Bank Group PLC was incorporated on 26 February 2016 as the ultimate hold-ing company for JSC TBC Bank Georgia50. TBC Bank became the parent company of JSC TBC Bank Georgia on 10 August 2016, following the Group’s restructuring. TBC Bank suc-cessfully listed on the London Stock Exchange’s premium listing segment on 10 August
2016. TBC Bank is a constituent of the FTSE 250 Index and MSCI United Kingdom Small Cap Index. It is also a member of the FTSE4 Good Index Series.
The company through its subsidiaries, provides banking, leasing, brokerage, and card processing services to corporate and individual customers in Georgia, Azerbaijan, and Uzbekistan. Its main home affiliates are: TBC Leasing, TBC Pay, and TBC Capital. TBC
50 Online, Available at tbcbankgroup.com/about-us/history/
Bank is the largest banking group in Georgia, where 99.5% of its business is concentrated, with a 38.2% market share by total assets (GEL 22,557.8 million).
Overall, TBC Bank offers various current/settlement accounts, and term deposits; mortgage, consumer, retail, and corporate loans, as well as loans for micro, small, and medium enterprises; credit cards, credit lines, letters of credit, and guarantees; and money transfer and currency exchange services. The company also provides motor, travel, personal accident, credit life and property, business property, liability, cargo, and agro insurance products; finance leasing; payment services; and corporate advisory, debt and equity capital markets, brokerage, investment research, PR and marketing, real estate management, computer and software, and postal services. In addition, it offers internet and mobile banking services.
But the key segments for the company can be divided into four categories: Retail, Corporate, and Micro, Small and Medium Enterprises segments.
Retail Banking
TBC Bank serves 2.6 million customers51. Which is 90% of the adult population of the country. They offer banking products to their clients and a full range of services focusing on digital distribution channels. Retail banking is divided into ‘’mass’’ retail and personal banking which allows offering
comfortable banking services to each customer. Moreover, bank offers multi-channel services to digital distribution channels to affluent customers with a focus that includes Internet and mobile banking services with improved features as well as well expanded capabilities of the call center.
The segment’s gross loans amounted 5,954 ml Gel in the end of the 2020
financial year with a bias to the mortgage loans mostly (66%), which formed approximately 39.4 % of market share. This is 2% growth rate with at constant currency compared to last year’s data. While Retail Banking deposits amounted
7,255 ml Gel and got 39.5% of market share. Which means 2% growth rates at constant currency prior to the last year52.
Corporate Banking
51 Key business segments. FY 2020 and 4Q Investor Presentation. Available at https://tbcbankgroup.com/media/2295/fy-and-4q-2020-investor-presentation.pdf
page 25
52 FY 2020 and Q4 2020 results report. TBC bank. available at: https://tbcbankgroup.com/media/2298/fy-and-4q-results-report.pdf page 17
49
Bank has a well-diversified loan portfolio serving 3.7 thousands clients and includes all major field of economy: Energy and utilities, real estate, food industry, hotels and recreation, construction healthcare, trade, agriculture, financial services, metallurgy and mining industry, auto-tech service, oil and gas and etc. It includes full range of core and supplementary products.
The segments gross loans reached 5,691 ml Gel at the end of financial year 2020 which is 38.6% of market share and means 2.8 % of growth at constant currency prior to last year. While corporate banking deposits amounted 3,940 ml Gel, 34.5 % of market share and 1.4 % growth at constant currency compared to last year53.
Micro, Small and Medium Enterprises (MSME)
In the country, 62% of newly registered legal entities choose TBC Bank. Diversified MSME portfolio with strong dynamics in Agriculture Hotel & Leisure and Trade. It serves 160.3 thousand clients which makes it the leading partner bank for MSMEs.
The segments gross loans amounted 3,556 ml Gel in the end of 2020 which means 2% growth rate at constant currency prior to last year. MSME deposits reached 1,378 ml Gel and got also 2% growth rate at constant currency prior to 2019 year54.
Bank of Georgia Group PLC
Bank of Georgia Group PLC (Bank of Georgia group or BOGG) was established in 1994. It is a UK incorporated holding company55 As of 31 December 2020, the principal shareholder of the Bank was JSC BGEO Group, owning 79.78% of the Bank’s shares. Bank of Georgia
Group plc (admitted to premium listing segment of the Official List of the UK listing Authority and to trading on the London Stock Exchange plc under ticker BGEO.
53 Key business segments. FY 2020 and 4Q Investor Presentation. Available at https://tbcbankgroup.com/media/2295/fy-and-4q-2020-investor-presentation.pdf
page 13
54 Key business segments. FY 2020 and 4Q Investor Presentation. Available at https://tbcbankgroup.com/media/2295/fy-and-4q-2020-investor-presentation.pdf
page 13
55 Annual report 2020. Bog.ge . available at https://bankofgeorgiagroup.com/reports/annual page 2
The company operates through Retail Banking, Corporate and Investment Banking, BNB, and other Banking Business segments.
The Retail Banking segment offers consumer loans, mortgage loans, overdrafts, credit cards, and other credit facilities; funds transfer and settlement services; and customers’ deposits for individuals and legal entities
under the Express, Bank of Georgia, and SOLO brands. Retail banking Gross loans amounted 9.0 bl Gel in the end of 2020 and means 65.2 % of gross loans of the bank56
(i) Express – designed to service emerging retail customers with minimal incremental operational costs through cost-efficient distance channels, such as Express Pay terminals, internet and mobile banking, and technology-intensive Express branches
(ii) Bank of Georgia – providing long-established traditional banking services to mass retail clients
(iii)SOLO- targeting mass affluent customers and providing a unique blend of banking and lifestyle products and services.
(iv) MSME- it serves micro, small and medium size enterprises through two respectively dedicated segments under the Retail Banking business.
The corporate Investment -Banking segment offers loans and other credit facilities, funds transfers and settlement services, trade finance services, and documentary operations support services; and handles saving and term deposits for corporate and institutional customers, as well as provides private banking services to high net worth clients. Corporate and Investment Banking gross loans were 4.8 bl Gel in 2020 which is 34.8 % of gross loans overall57
The BNB segment - offers retail and corporate banking services to clients in Belarus.
56 Annual report 2020. Bog.ge . available at https://bankofgeorgiagroup.com/reports/annual page 73,74
57 Annual report 2020. Bog.ge . available at https://bankofgeorgiagroup.com/reports/annual page 133, 134
51
The Other Banking Business segments provides compliance and governance services for various small corporate and social responsibility companies
Overall, the bank’s loan portfolio increased by 10.2 % on a constant currency basis in 2020
prior to last year. while deposits portfolio increased by 28.6% on a constant currency basis in a year.
Since the main purpose of the thesis does not include focusing on each of those categories, the author does not go into greater detail.
4.3.2 Market Share Analysis
For an appropriate market share analysis regarding the banks, it is necessary to first scrutinize and define the sub-industry they operate in. The Bank’s competitors are mostly other
domestic or foreign capital-based banks which may be placed into two major groups. First group consists of banks, which operates all over the country such as Liberty bank, the other group incorporates smaller capital banks or the institutions which in the last four or five years registered themselves as banks from micro-finance organizations (f.e. Credo Bank).
TBCG and BOGG are commercial banks of a significant size and loans are major parts of their assets, it is 64.37 percent for TBCG and 62% for BOGG. Similarly, other banks of the sector follow the tendency.
Interest income banks get from loans are quite high compared to net revenue. Mostly it exceeds multiple times of actual income after deduction of all expenses and taxes. TBCG earned ten times more from interest loans, while BOGG more than 20 times. This year was unprofitable for some banks (JSC Liberty Bank, Finka and VTB), therefore their ratio interest income on loans as percentage of net loans were negative.
The former statements are represented by the Figure 6. ’’Dependence on loans related income’’.
Figure 6: Dependence on loans related income
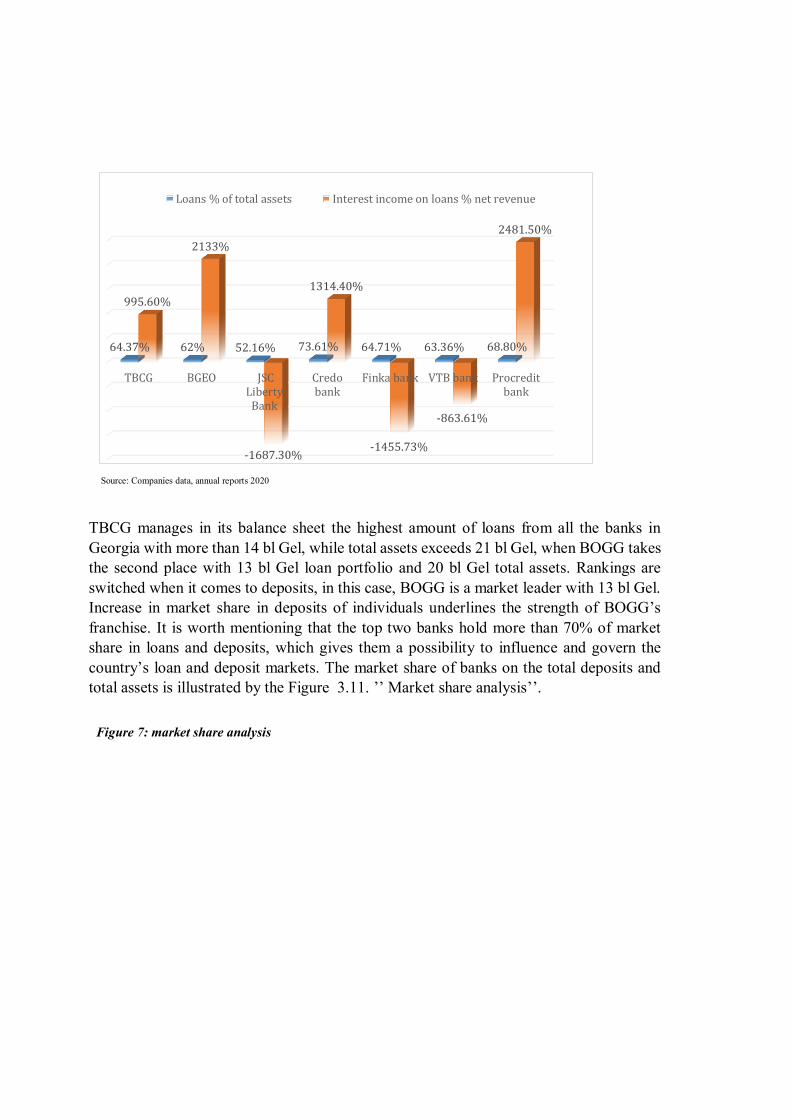
Source: Companies data, annual reports 2020
TBCG manages in its balance sheet the highest amount of loans from all the banks in Georgia with more than 14 bl Gel, while total assets exceeds 21 bl Gel, when BOGG takes the second place with 13 bl Gel loan portfolio and 20 bl Gel total assets. Rankings are switched when it comes to deposits, in this case, BOGG is a market leader with 13 bl Gel. Increase in market share in deposits of individuals underlines the strength of BOGG’s
franchise. It is worth mentioning that the top two banks hold more than 70% of market share in loans and deposits, which gives them a possibility to influence and govern the country’s loan and deposit markets. The market share of banks on the total deposits and
total assets is illustrated by the Figure 3.11. ’’ Market share analysis’’.
Figure 7: market share analysis
TBCG BGEO JSCLiberty
Bank
Credobank
Finka bank VTB bank Procreditbank
64.37% 62% 52.16% 73.61% 64.71% 63.36% 68.80%
995.60%
2133%
-1687.30%
1314.40%
-1455.73%
-863.61%
2481.50%
Loans % of total assets Interest income on loans % net revenue
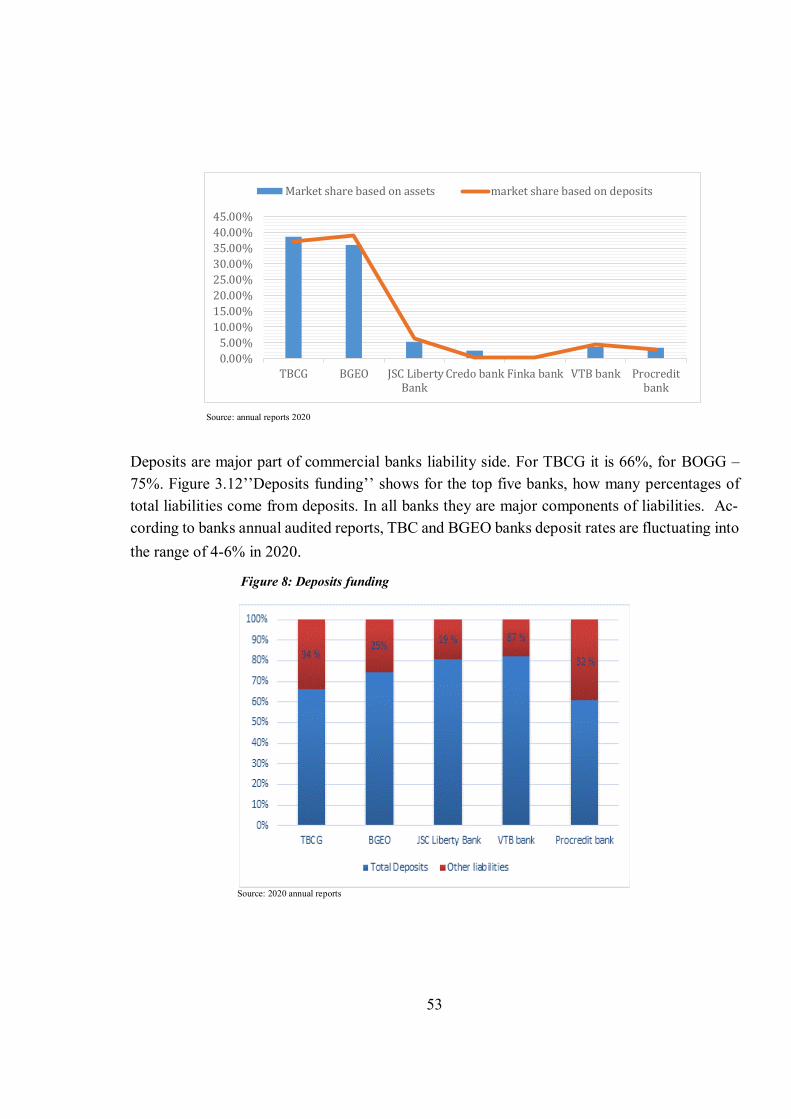
53
Source: annual reports 2020
Deposits are major part of commercial banks liability side. For TBCG it is 66%, for BOGG – 75%. Figure 3.12’’Deposits funding’’ shows for the top five banks, how many percentages of total liabilities come from deposits. In all banks they are major components of liabilities. Ac-cording to banks annual audited reports, TBC and BGEO banks deposit rates are fluctuating into the range of 4-6% in 2020.
Figure 8: Deposits funding
Source: 2020 annual reports
0.00%
5.00%
10.00%
15.00%
20.00%
25.00%
30.00%
35.00%
40.00%
45.00%
TBCG BGEO JSC LibertyBank
Credo bank Finka bank VTB bank Procreditbank
Market share based on assets market share based on deposits
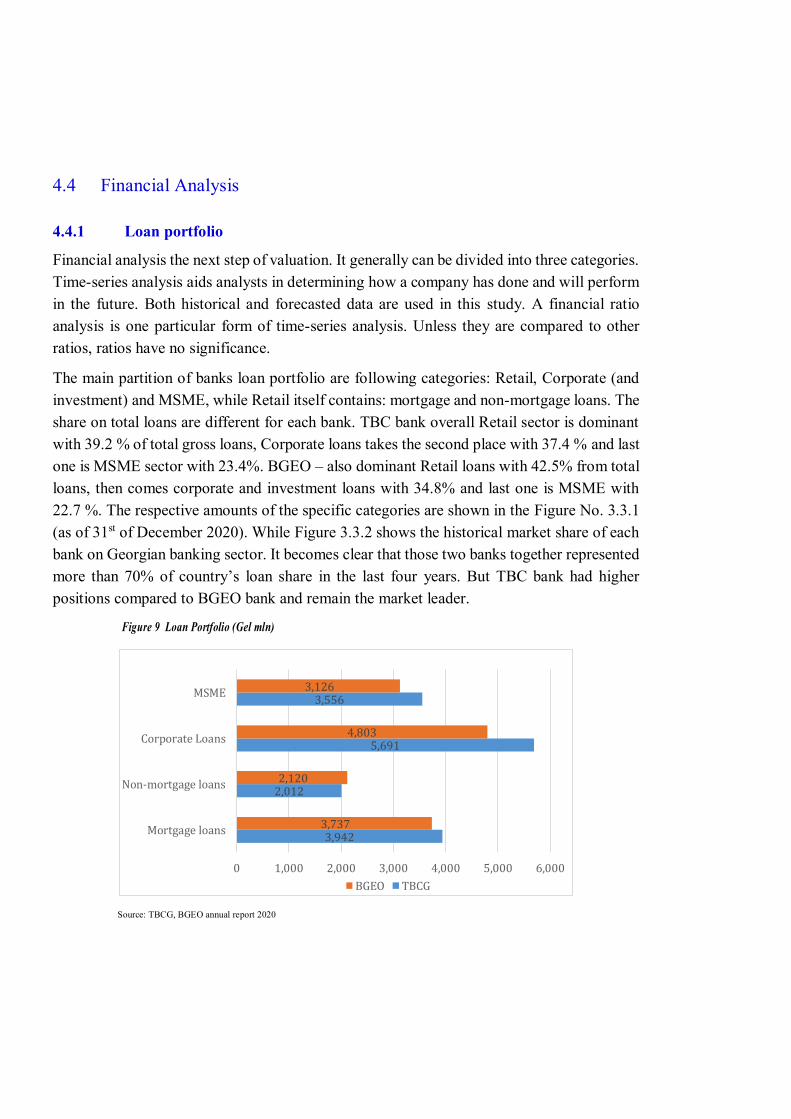
4.4 Financial Analysis
4.4.1 Loan portfolio
Financial analysis the next step of valuation. It generally can be divided into three categories. Time-series analysis aids analysts in determining how a company has done and will perform in the future. Both historical and forecasted data are used in this study. A financial ratio analysis is one particular form of time-series analysis. Unless they are compared to other ratios, ratios have no significance.
The main partition of banks loan portfolio are following categories: Retail, Corporate (and investment) and MSME, while Retail itself contains: mortgage and non-mortgage loans. The share on total loans are different for each bank. TBC bank overall Retail sector is dominant with 39.2 % of total gross loans, Corporate loans takes the second place with 37.4 % and last one is MSME sector with 23.4%. BGEO – also dominant Retail loans with 42.5% from total loans, then comes corporate and investment loans with 34.8% and last one is MSME with 22.7 %. The respective amounts of the specific categories are shown in the Figure No. 3.3.1 (as of 31st of December 2020). While Figure 3.3.2 shows the historical market share of each bank on Georgian banking sector. It becomes clear that those two banks together represented more than 70% of country’s loan share in the last four years. But TBC bank had higher positions compared to BGEO bank and remain the market leader.
Figure 9 Loan Portfolio (Gel mln)
Source: TBCG, BGEO annual report 2020
3,942
2,012
5,691
3,556
3,737
2,120
4,803
3,126
0 1,000 2,000 3,000 4,000 5,000 6,000
Mortgage loans
Non-mortgage loans
Corporate Loans
MSME
BGEO TBCG
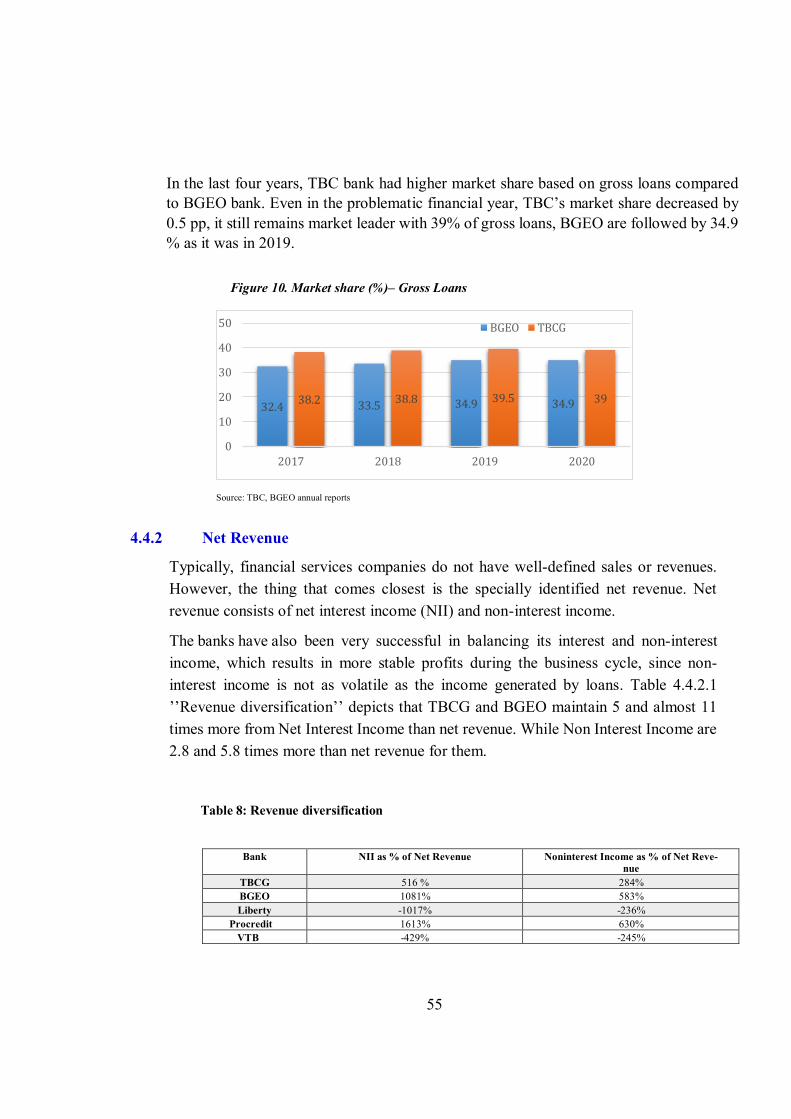
55
In the last four years, TBC bank had higher market share based on gross loans compared to BGEO bank. Even in the problematic financial year, TBC’s market share decreased by
0.5 pp, it still remains market leader with 39% of gross loans, BGEO are followed by 34.9 % as it was in 2019.
Figure 10. Market share (%)– Gross Loans
Source: TBC, BGEO annual reports
4.4.2 Net Revenue
Typically, financial services companies do not have well-defined sales or revenues. However, the thing that comes closest is the specially identified net revenue. Net revenue consists of net interest income (NII) and non-interest income.
The banks have also been very successful in balancing its interest and non-interest income, which results in more stable profits during the business cycle, since non-interest income is not as volatile as the income generated by loans. Table 4.4.2.1 ’’Revenue diversification’’ depicts that TBCG and BGEO maintain 5 and almost 11
times more from Net Interest Income than net revenue. While Non Interest Income are 2.8 and 5.8 times more than net revenue for them.
Table 8: Revenue diversification
Bank NII as % of Net Revenue Noninterest Income as % of Net Reve-
nue TBCG 516 % 284% BGEO 1081% 583% Liberty -1017% -236%
Procredit 1613% 630% VTB -429% -245%
32.4 33.5 34.9 34.938.2 38.8 39.5 39
0
10
20
30
40
50
2017 2018 2019 2020
BGEO TBCG
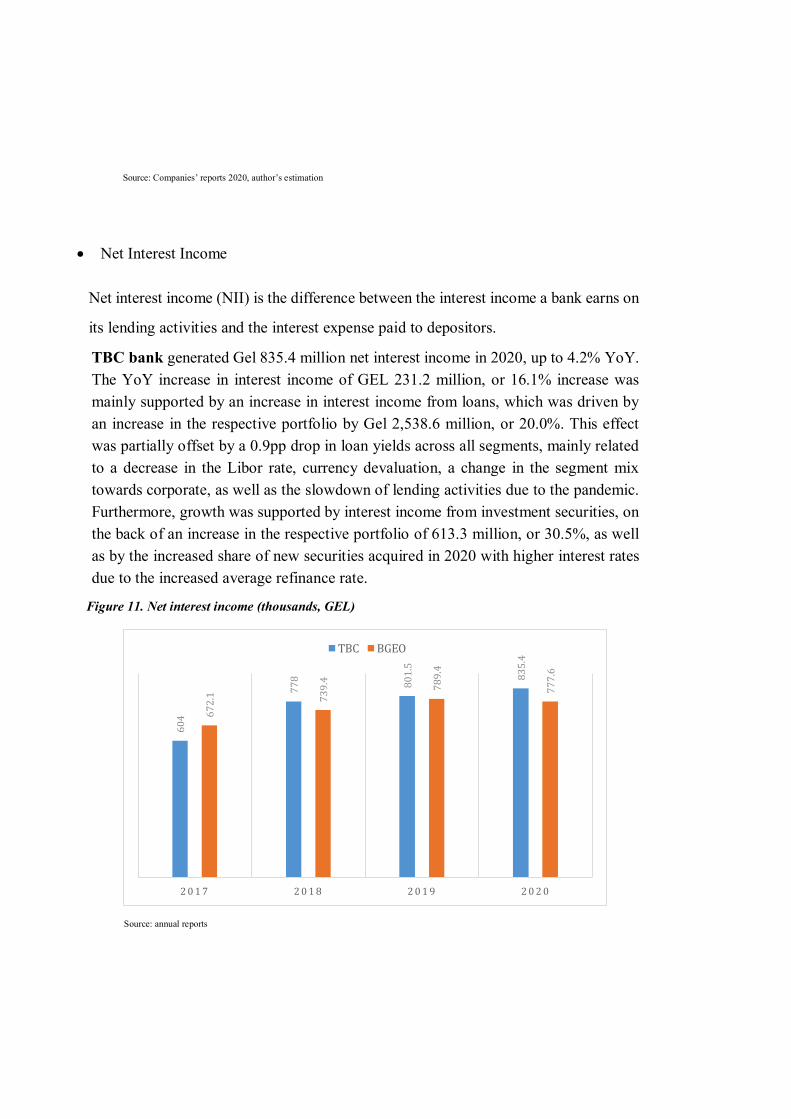
Source: Companies’ reports 2020, author’s estimation
Net Interest Income
Net interest income (NII) is the difference between the interest income a bank earns on
its lending activities and the interest expense paid to depositors.
TBC bank generated Gel 835.4 million net interest income in 2020, up to 4.2% YoY. The YoY increase in interest income of GEL 231.2 million, or 16.1% increase was mainly supported by an increase in interest income from loans, which was driven by an increase in the respective portfolio by Gel 2,538.6 million, or 20.0%. This effect was partially offset by a 0.9pp drop in loan yields across all segments, mainly related to a decrease in the Libor rate, currency devaluation, a change in the segment mix towards corporate, as well as the slowdown of lending activities due to the pandemic. Furthermore, growth was supported by interest income from investment securities, on the back of an increase in the respective portfolio of 613.3 million, or 30.5%, as well as by the increased share of new securities acquired in 2020 with higher interest rates due to the increased average refinance rate.
Figure 11. Net interest income (thousands, GEL)
Source: annual reports
60
4
77
8
80
1.5
83
5.4
67
2.1 73
9.4
78
9.4
77
7.6
2 0 1 7 2 0 1 8 2 0 1 9 2 0 2 0
TBC BGEO
57
TBC’s interest expense increased by GEL 189.7 million, or 28.6%, which was mainly related to an increase in interest expense from deposits and other borrowed funds. The former increase was attributable to a growth in the respective portfolio of GEL 2,523.4 million, or 25.1%, which was further supported by an increase in yields due to an increase in the average refinance rate, as well as currency depreciation. The latter increase was mainly driven by growth in the NBG loan balances, which further supported the growth in the respective yield by 0.1pp (the GEL yield went up by 0.9pp on the back of the higher average refinance rate, while the FC yield declined by 1.3pp due to the decrease in the Libor rate). Another contributor was the growth in debt securities in issue related to an increase in interest expense from the Senior and AT1 Bonds issued in June and July 2019, respectively, in the amount of US$ 425 million.
BGEO generated operating income of Gel 1,090.7 million in 2020 (down 1.8% y-o-y). The y-o-y decrease in operating income in 2020 was primarily driven by the slow-down in economic activity due to the COVID-19 pandemic, particularly affecting the Retail Banking segment. Robust q-o-q growth in operating income in 4Q20 was mainly due to increase in net other income, coupled with increase in net fee and commission income (up 3.1% q-o-q) and net foreign currency gains (up 37.9% q-o-q), as a result of recovery in customer activity since June 2020. This recovery slowed-down in 4Q20 following the new restrictions put in place by the Georgian Government to respond to the emerging COVID-19 second wave.
Operating expenses decreased by 2.2% y-o-y in 4Q20, mostly because of a number of cost optimization initiatives taken in 2Q20. That said, the Group continued its investment in IT-related resources, digitalization and marketing, as part of its key strategic priorities, at the same time maintaining its focus on efficiency and cost control, which resulted in largely flat (up 3.0% y-o-y) operating expenses in 2020. The 15.8% q-o-q increase in operating expenses mainly related to seasonal factors.
NIM was 4.4% in 4Q20 (down 100bps y-o-y and down 40bps q-o-q) and 4.6% in 2020 (down 100bps y-o-y). The NIM decrease primarily reflected a decline in currency blended loan yields on the back of the slower consumer lending activity due to the COVID-19 pandemic, and the effect of change in portfolio mix resulting in higher level of secured mortgage lending. On the other hand, despite the higher levels of liquidity, cost of funds were down 10bps y-o-y and q-o-q in 4Q20, and slightly up by 10bps y-o-y in 2020. The latter reflected the increase in client deposits and notes and higher

levels of liquidity, coupled with the NBG’s monetary policy rate changes, partially
offset by the impact of the GEL 500 million local currency bonds repayment in June 2020.
Non-interest income
Non-interest income is another important part of the net revenue. In case of TBC and BGEO it generally contains net fee and commission income, net foreign currency gain and other income. The historical record of their performance is iluctrated below
with figure 12. ’’Non interest income’’.
Figure 12. Non interest income (thousands, Gel)
Source: annual reports
TBC generated 320.2 mln Gel in 2020 as non-interest income, which is 2% decrease compared to financial year 2019. In detail, fee and commission income was Gel 182.8 million, which is less prior to last year’s amount by 2.4%. While, settlement
transactions, guarantees issued and letters of credit were increased. Total other non-interest income decreased also in 2020 and amounted GEL 137.4 million (139.4 ml
257
309.4
326.7
320.2
237.2
290.4
321
313
0 50 100 150 200 250 300 350
2017
2018
2019
2020
BGEO TBC
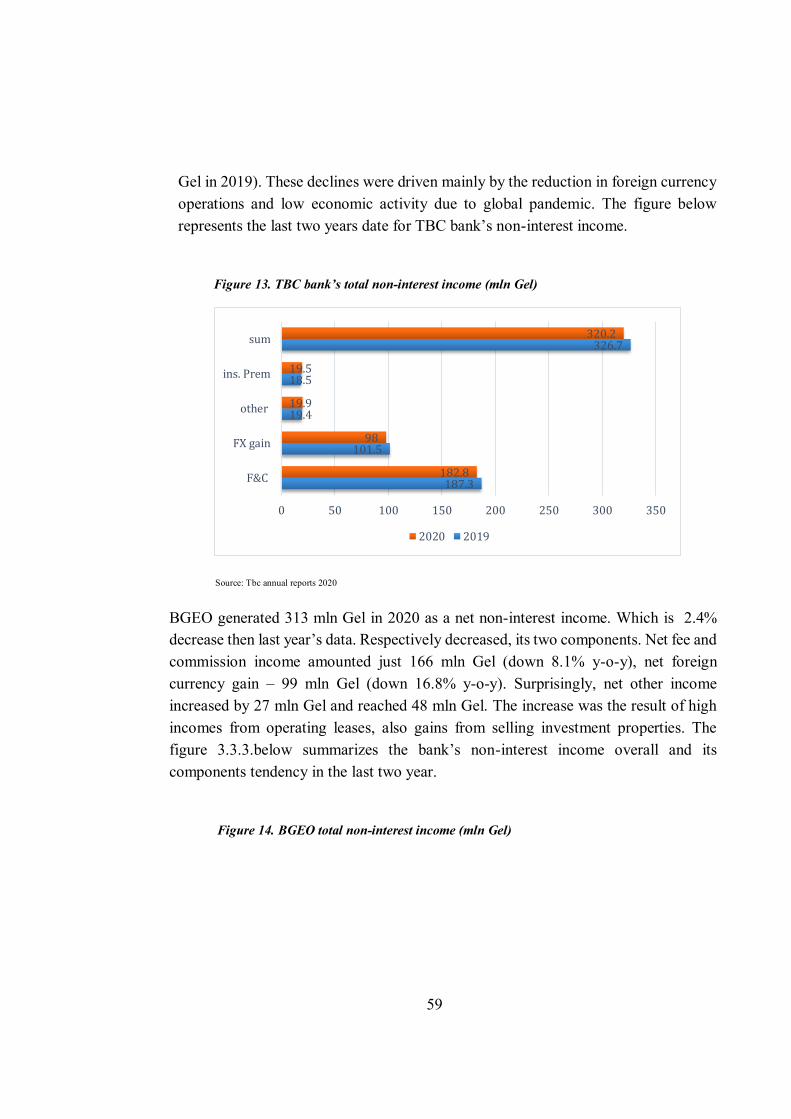
59
Gel in 2019). These declines were driven mainly by the reduction in foreign currency operations and low economic activity due to global pandemic. The figure below represents the last two years date for TBC bank’s non-interest income.
Figure 13. TBC bank’s total non-interest income (mln Gel)
Source: Tbc annual reports 2020 BGEO generated 313 mln Gel in 2020 as a net non-interest income. Which is 2.4% decrease then last year’s data. Respectively decreased, its two components. Net fee and
commission income amounted just 166 mln Gel (down 8.1% y-o-y), net foreign currency gain – 99 mln Gel (down 16.8% y-o-y). Surprisingly, net other income increased by 27 mln Gel and reached 48 mln Gel. The increase was the result of high incomes from operating leases, also gains from selling investment properties. The figure 3.3.3.below summarizes the bank’s non-interest income overall and its components tendency in the last two year.
Figure 14. BGEO total non-interest income (mln Gel)
187.3
101.5
19.4
18.5
326.7
182.8
98
19.9
19.5
320.2
0 50 100 150 200 250 300 350
F&C
FX gain
other
ins. Prem
sum
2020 2019
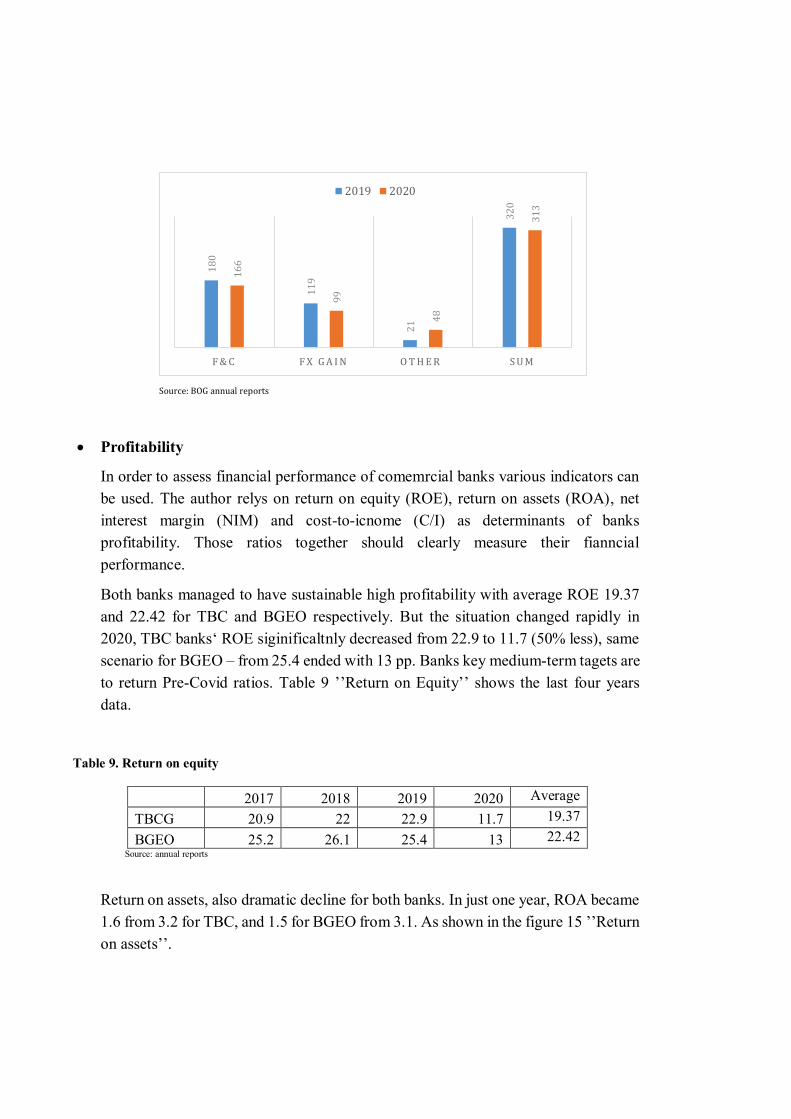
Source: BOG annual reports
Profitability
In order to assess financial performance of comemrcial banks various indicators can be used. The author relys on return on equity (ROE), return on assets (ROA), net interest margin (NIM) and cost-to-icnome (C/I) as determinants of banks profitability. Those ratios together should clearly measure their fianncial performance.
Both banks managed to have sustainable high profitability with average ROE 19.37 and 22.42 for TBC and BGEO respectively. But the situation changed rapidly in 2020, TBC banks‘ ROE siginificaltnly decreased from 22.9 to 11.7 (50% less), same
scenario for BGEO – from 25.4 ended with 13 pp. Banks key medium-term tagets are to return Pre-Covid ratios. Table 9 ’’Return on Equity’’ shows the last four years data.
Table 9. Return on equity
2017 2018 2019 2020 Average TBCG 20.9 22 22.9 11.7 19.37 BGEO 25.2 26.1 25.4 13 22.42
Source: annual reports
Return on assets, also dramatic decline for both banks. In just one year, ROA became 1.6 from 3.2 for TBC, and 1.5 for BGEO from 3.1. As shown in the figure 15 ’’Return
on assets’’.
18
0
11
9
21
32
0
16
6
99
48
31
3
F & C F X G A I N O T H E R S U M
2019 2020
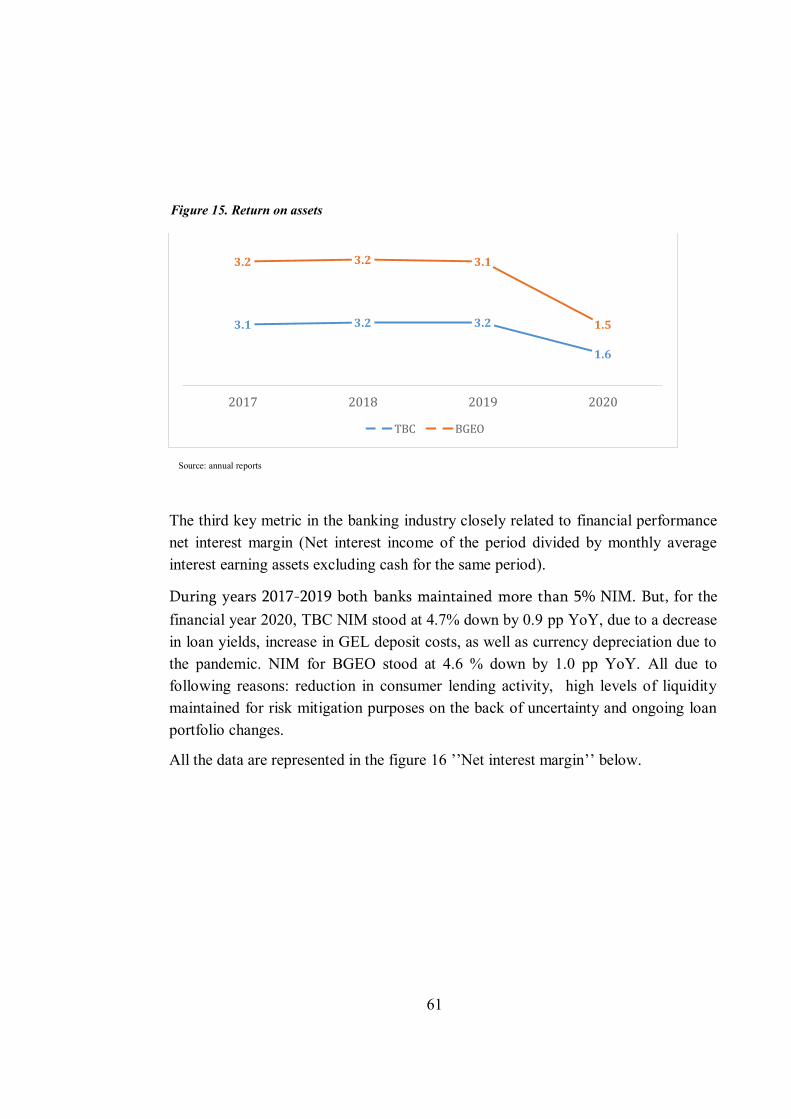
61
Figure 15. Return on assets
Source: annual reports
The third key metric in the banking industry closely related to financial performance
net interest margin (Net interest income of the period divided by monthly average interest earning assets excluding cash for the same period).
During years 2017-2019 both banks maintained more than 5% NIM. But, for the financial year 2020, TBC NIM stood at 4.7% down by 0.9 pp YoY, due to a decrease in loan yields, increase in GEL deposit costs, as well as currency depreciation due to the pandemic. NIM for BGEO stood at 4.6 % down by 1.0 pp YoY. All due to following reasons: reduction in consumer lending activity, high levels of liquidity maintained for risk mitigation purposes on the back of uncertainty and ongoing loan portfolio changes.
All the data are represented in the figure 16 ’’Net interest margin’’ below.
3.1 3.2 3.2
1.6
3.2 3.2 3.1
1.5
2017 2018 2019 2020
TBC BGEO
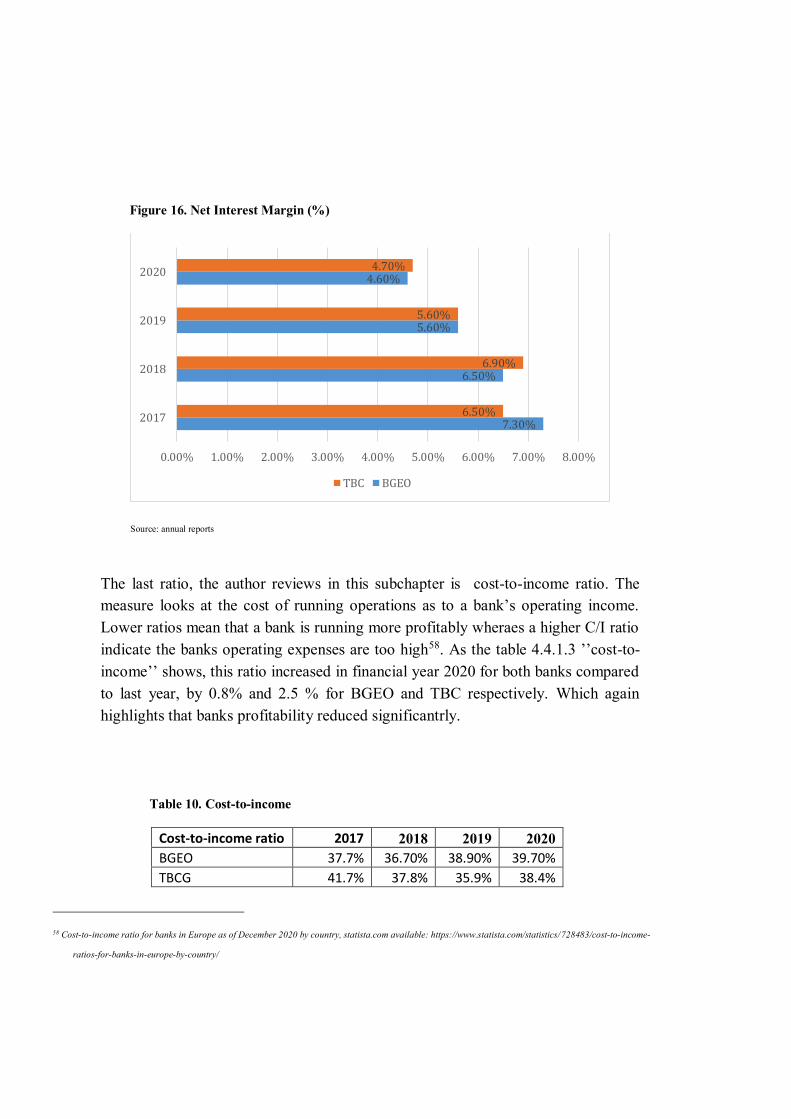
Figure 16. Net Interest Margin (%)
Source: annual reports
The last ratio, the author reviews in this subchapter is cost-to-income ratio. The measure looks at the cost of running operations as to a bank’s operating income.
Lower ratios mean that a bank is running more profitably wheraes a higher C/I ratio indicate the banks operating expenses are too high58. As the table 4.4.1.3 ’’cost-to-income’’ shows, this ratio increased in financial year 2020 for both banks compared
to last year, by 0.8% and 2.5 % for BGEO and TBC respectively. Which again highlights that banks profitability reduced significantrly.
Table 10. Cost-to-income
Cost-to-income ratio 2017 2018 2019 2020 BGEO 37.7% 36.70% 38.90% 39.70%
TBCG 41.7% 37.8% 35.9% 38.4%
58 Cost-to-income ratio for banks in Europe as of December 2020 by country, statista.com available: https://www.statista.com/statistics/728483/cost-to-income-
ratios-for-banks-in-europe-by-country/
7.30%
6.50%
5.60%
4.60%
6.50%
6.90%
5.60%
4.70%
0.00% 1.00% 2.00% 3.00% 4.00% 5.00% 6.00% 7.00% 8.00%
2017
2018
2019
2020
TBC BGEO
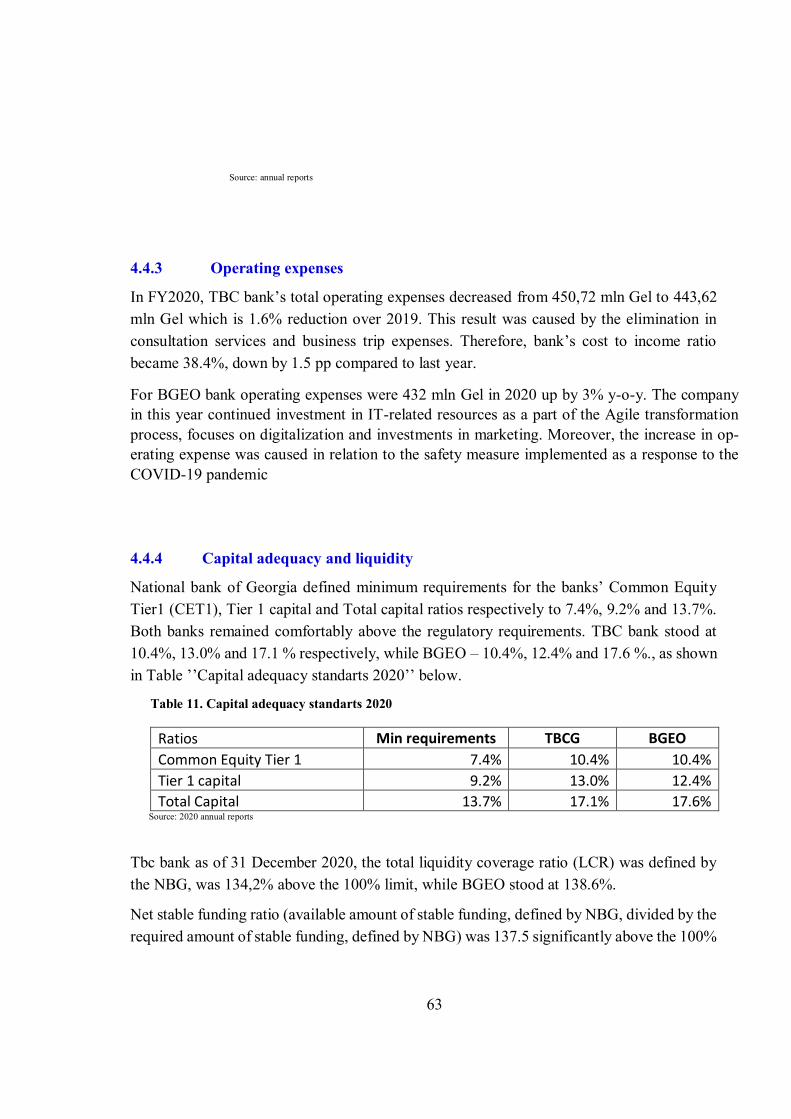
63
Source: annual reports
4.4.3 Operating expenses
In FY2020, TBC bank’s total operating expenses decreased from 450,72 mln Gel to 443,62 mln Gel which is 1.6% reduction over 2019. This result was caused by the elimination in consultation services and business trip expenses. Therefore, bank’s cost to income ratio
became 38.4%, down by 1.5 pp compared to last year.
For BGEO bank operating expenses were 432 mln Gel in 2020 up by 3% y-o-y. The company in this year continued investment in IT-related resources as a part of the Agile transformation process, focuses on digitalization and investments in marketing. Moreover, the increase in op-erating expense was caused in relation to the safety measure implemented as a response to the COVID-19 pandemic
4.4.4 Capital adequacy and liquidity
National bank of Georgia defined minimum requirements for the banks’ Common Equity
Tier1 (CET1), Tier 1 capital and Total capital ratios respectively to 7.4%, 9.2% and 13.7%. Both banks remained comfortably above the regulatory requirements. TBC bank stood at 10.4%, 13.0% and 17.1 % respectively, while BGEO – 10.4%, 12.4% and 17.6 %., as shown in Table ’’Capital adequacy standarts 2020’’ below.
Table 11. Capital adequacy standarts 2020
Ratios Min requirements TBCG BGEO
Common Equity Tier 1 7.4% 10.4% 10.4%
Tier 1 capital 9.2% 13.0% 12.4%
Total Capital 13.7% 17.1% 17.6% Source: 2020 annual reports
Tbc bank as of 31 December 2020, the total liquidity coverage ratio (LCR) was defined by the NBG, was 134,2% above the 100% limit, while BGEO stood at 138.6%.
Net stable funding ratio (available amount of stable funding, defined by NBG, divided by the required amount of stable funding, defined by NBG) was 137.5 significantly above the 100%
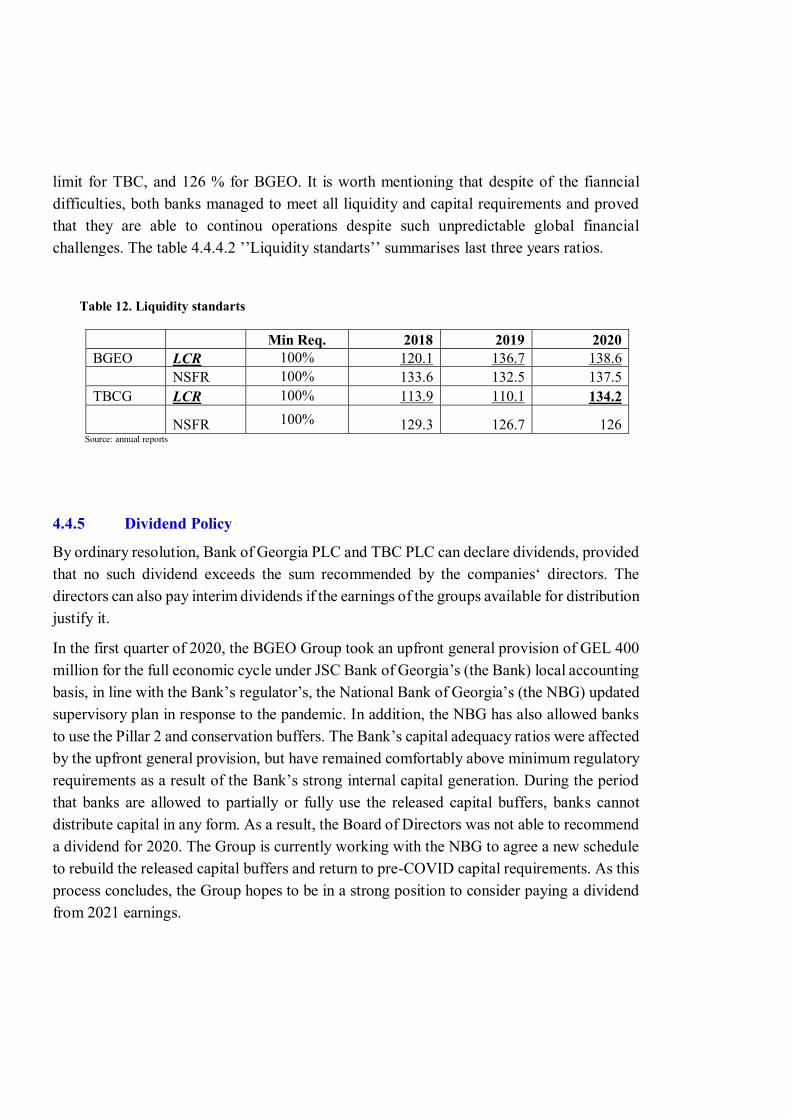
limit for TBC, and 126 % for BGEO. It is worth mentioning that despite of the fianncial difficulties, both banks managed to meet all liquidity and capital requirements and proved that they are able to continou operations despite such unpredictable global financial challenges. The table 4.4.4.2 ’’Liquidity standarts’’ summarises last three years ratios.
Table 12. Liquidity standarts
Min Req. 2018 2019 2020 BGEO LCR 100% 120.1 136.7 138.6 NSFR 100% 133.6 132.5 137.5 TBCG LCR 100% 113.9 110.1 134.2
NSFR 100% 129.3 126.7 126 Source: annual reports
4.4.5 Dividend Policy
By ordinary resolution, Bank of Georgia PLC and TBC PLC can declare dividends, provided that no such dividend exceeds the sum recommended by the companies‘ directors. The
directors can also pay interim dividends if the earnings of the groups available for distribution justify it.
In the first quarter of 2020, the BGEO Group took an upfront general provision of GEL 400 million for the full economic cycle under JSC Bank of Georgia’s (the Bank) local accounting
basis, in line with the Bank’s regulator’s, the National Bank of Georgia’s (the NBG) updated
supervisory plan in response to the pandemic. In addition, the NBG has also allowed banks to use the Pillar 2 and conservation buffers. The Bank’s capital adequacy ratios were affected
by the upfront general provision, but have remained comfortably above minimum regulatory requirements as a result of the Bank’s strong internal capital generation. During the period
that banks are allowed to partially or fully use the released capital buffers, banks cannot distribute capital in any form. As a result, the Board of Directors was not able to recommend a dividend for 2020. The Group is currently working with the NBG to agree a new schedule to rebuild the released capital buffers and return to pre-COVID capital requirements. As this process concludes, the Group hopes to be in a strong position to consider paying a dividend from 2021 earnings.
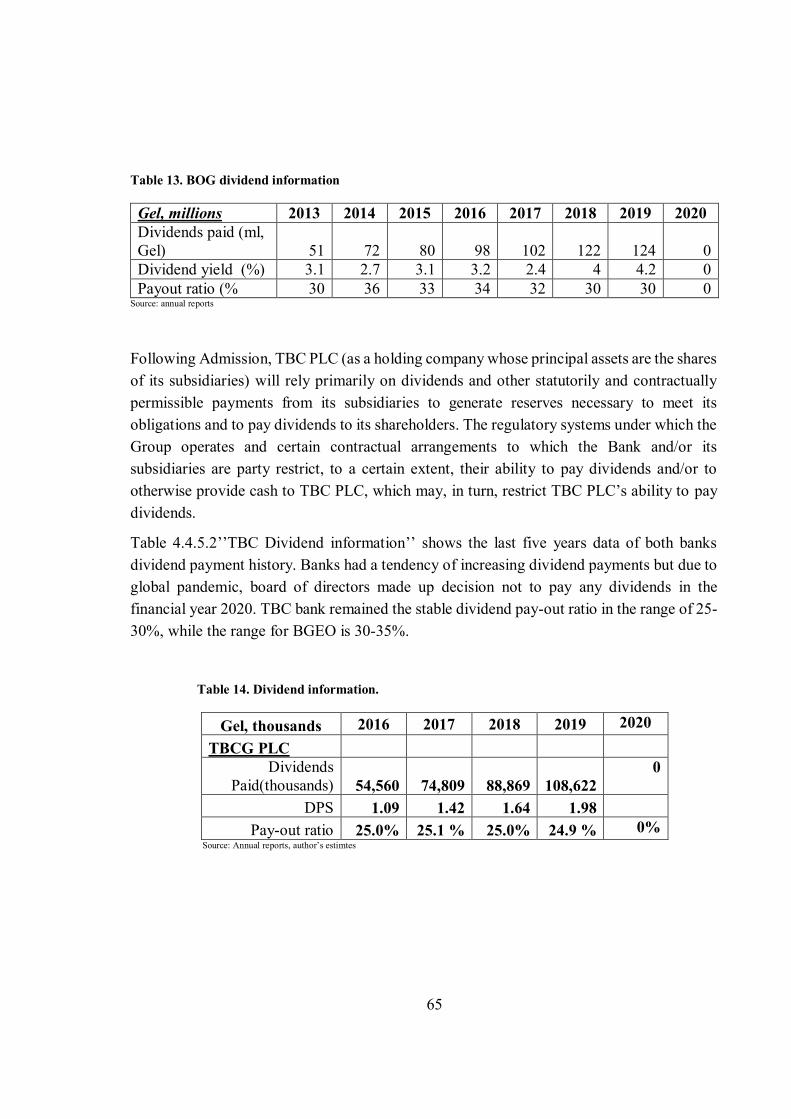
65
Table 13. BOG dividend information
Gel, millions 2013 2014 2015 2016 2017 2018 2019 2020 Dividends paid (ml, Gel) 51 72 80 98 102 122 124 0 Dividend yield (%) 3.1 2.7 3.1 3.2 2.4 4 4.2 0 Payout ratio (% 30 36 33 34 32 30 30 0
Source: annual reports
Following Admission, TBC PLC (as a holding company whose principal assets are the shares of its subsidiaries) will rely primarily on dividends and other statutorily and contractually permissible payments from its subsidiaries to generate reserves necessary to meet its obligations and to pay dividends to its shareholders. The regulatory systems under which the Group operates and certain contractual arrangements to which the Bank and/or its subsidiaries are party restrict, to a certain extent, their ability to pay dividends and/or to otherwise provide cash to TBC PLC, which may, in turn, restrict TBC PLC’s ability to pay dividends.
Table 4.4.5.2’’TBC Dividend information’’ shows the last five years data of both banks
dividend payment history. Banks had a tendency of increasing dividend payments but due to global pandemic, board of directors made up decision not to pay any dividends in the financial year 2020. TBC bank remained the stable dividend pay-out ratio in the range of 25-30%, while the range for BGEO is 30-35%.
Table 14. Dividend information.
Gel, thousands 2016 2017 2018 2019 2020 TBCG PLC
Dividends Paid(thousands) 54,560 74,809 88,869 108,622
0
DPS 1.09 1.42 1.64 1.98 Pay-out ratio 25.0% 25.1 % 25.0% 24.9 % 0%
Source: Annual reports, author’s estimtes

5 Valuation
After reviewing the theoretical part of the valuation models, the author implements them by using the banks’ audited financial reports for needed information.
5.1 FCFE
Very first model the author applies to calculate equity value of those banks is FCFE model. For that reason, It is required to forecast firms’ financial statements. The author used IMF report59, future expectations of Real GDP growth rate and inflation rate for the upcoming five years which are shown in the Table 15. ’’Forecasts’’. Table 15. Forecasts
2020 2021 2022 2023 2024 2025 GDP rate -6.1 3.5% 5.8% 5.5% 5.2% 5.2% Inflation 5.2 3.8% 2.69% 2.70% 3.00% 3.00%
Source: IMF report
Real GDP growth rate was used to predict future revenues and Inflation rate for the cost related components of the financial statements.
BGEO Based on the forecasts, the author ends up with the following net income, ROE and total equity as shown in the table 16 ’’components of valuation’’. For the defining of equity value the author
applied cost of equity which equals to 8.86% (data from Bloomberg terminal). Table 16. Components of valuation
Gel, thousand 2021 2022 2023 2024 2025 Net income 438,274 483,607 528,779 572,170 618,109 ROE 14.67% 13.93% 13.22% 12.51% 11.91% Total Equity 2,988,188 3,471,95 4,000,574 4,572,744 5,190,853
Source: author’s estimate
59 Georgia: Eight Review Under the Extended Fund Facility Arrangement, Available at: https://www.imf.org/en/Publications/CR/Issues/2021/04/16/Georgia-
Eighth-Review-Under-the-Extended-Fund-Facility-Arrangement-Press-Release-and-Staff-
50358?fbclid=IwAR0cQUcW3vOwO3jgu7kOuUDmG4o_cJXs_MidNBGFEjhngw7Xv651nHMCPvQ, p. 22
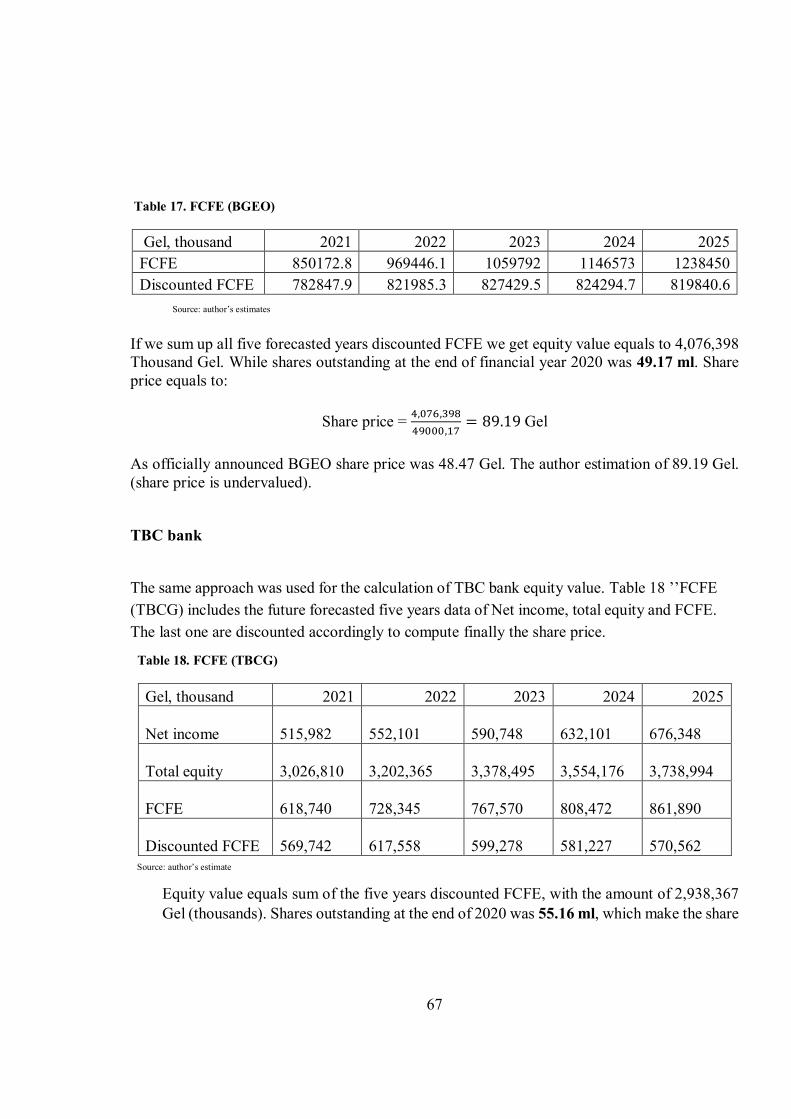
67
Table 17. FCFE (BGEO)
Gel, thousand 2021 2022 2023 2024 2025 FCFE 850172.8 969446.1 1059792 1146573 1238450 Discounted FCFE 782847.9 821985.3 827429.5 824294.7 819840.6
Source: author’s estimates If we sum up all five forecasted years discounted FCFE we get equity value equals to 4,076,398 Thousand Gel. While shares outstanding at the end of financial year 2020 was 49.17 ml. Share price equals to:
Share price = 4,076,398
49000,17= 89.19 Gel
As officially announced BGEO share price was 48.47 Gel. The author estimation of 89.19 Gel. (share price is undervalued).
TBC bank The same approach was used for the calculation of TBC bank equity value. Table 18 ’’FCFE
(TBCG) includes the future forecasted five years data of Net income, total equity and FCFE. The last one are discounted accordingly to compute finally the share price.
Table 18. FCFE (TBCG)
Gel, thousand 2021 2022 2023 2024 2025
Net income 515,982
552,101
590,748
632,101
676,348
Total equity 3,026,810
3,202,365
3,378,495
3,554,176
3,738,994
FCFE 618,740
728,345
767,570
808,472
861,890
Discounted FCFE 569,742
617,558
599,278
581,227
570,562
Source: author’s estimate
Equity value equals sum of the five years discounted FCFE, with the amount of 2,938,367 Gel (thousands). Shares outstanding at the end of 2020 was 55.16 ml, which make the share
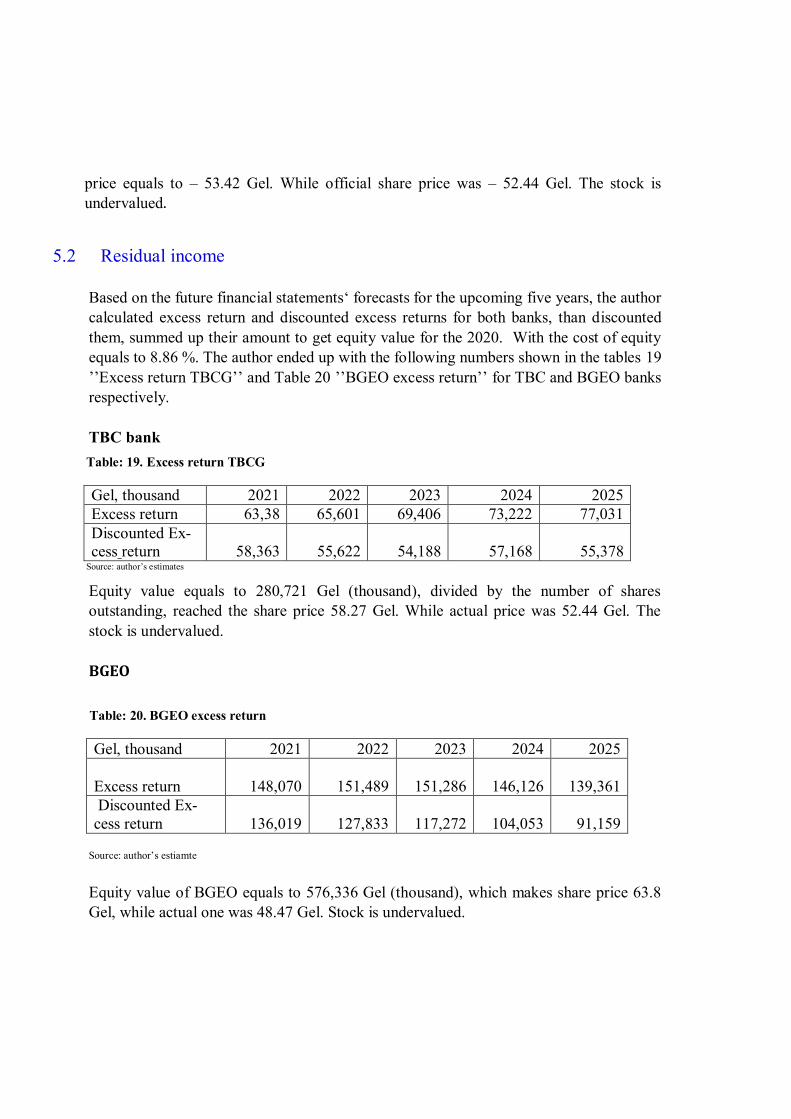
price equals to – 53.42 Gel. While official share price was – 52.44 Gel. The stock is undervalued.
5.2 Residual income
Based on the future financial statements‘ forecasts for the upcoming five years, the author calculated excess return and discounted excess returns for both banks, than discounted them, summed up their amount to get equity value for the 2020. With the cost of equity equals to 8.86 %. The author ended up with the following numbers shown in the tables 19 ’’Excess return TBCG’’ and Table 20 ’’BGEO excess return’’ for TBC and BGEO banks respectively. TBC bank
Table: 19. Excess return TBCG
Gel, thousand 2021 2022 2023 2024 2025 Excess return 63,38 65,601 69,406 73,222 77,031 Discounted Ex-cess return 58,363 55,622 54,188 57,168 55,378
Source: author’s estimates
Equity value equals to 280,721 Gel (thousand), divided by the number of shares outstanding, reached the share price 58.27 Gel. While actual price was 52.44 Gel. The stock is undervalued.
BGEO
Table: 20. BGEO excess return
Gel, thousand 2021 2022 2023 2024 2025
Excess return
148,070
151,489
151,286
146,126
139,361 Discounted Ex-cess return
136,019
127,833
117,272
104,053
91,159
Source: author’s estiamte
Equity value of BGEO equals to 576,336 Gel (thousand), which makes share price 63.8 Gel, while actual one was 48.47 Gel. Stock is undervalued.
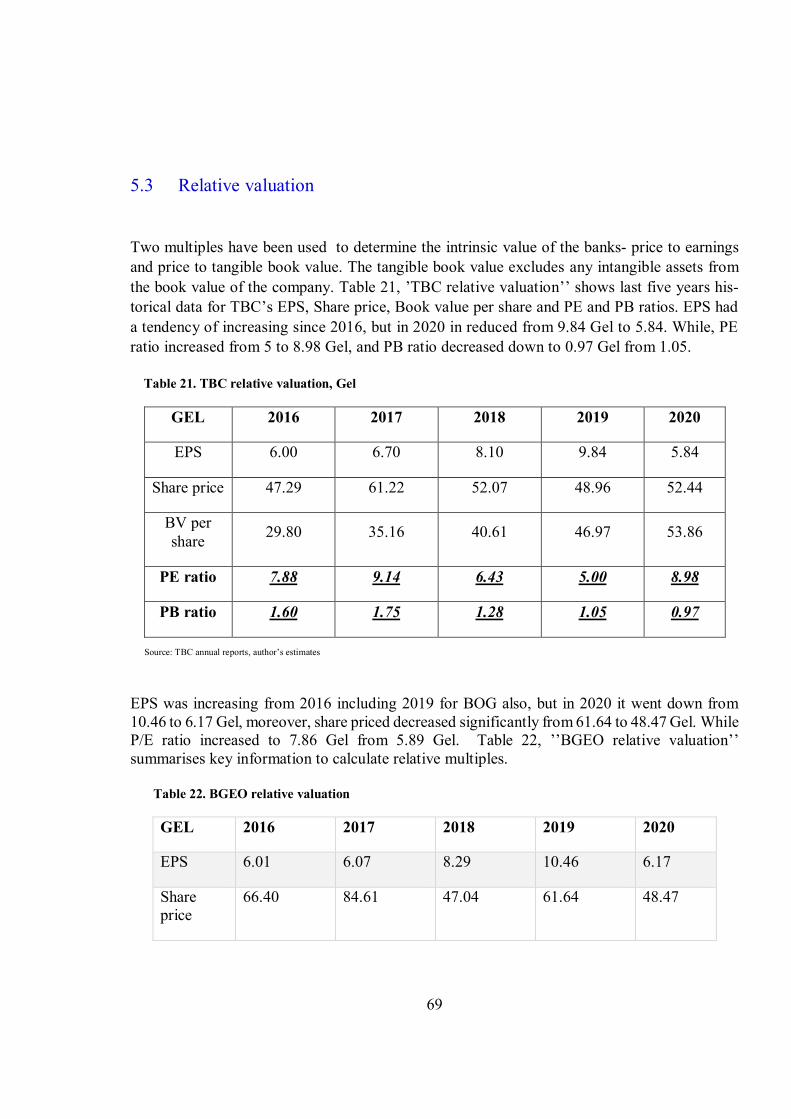
69
5.3 Relative valuation
Two multiples have been used to determine the intrinsic value of the banks- price to earnings and price to tangible book value. The tangible book value excludes any intangible assets from the book value of the company. Table 21, ’TBC relative valuation’’ shows last five years his-torical data for TBC’s EPS, Share price, Book value per share and PE and PB ratios. EPS had
a tendency of increasing since 2016, but in 2020 in reduced from 9.84 Gel to 5.84. While, PE ratio increased from 5 to 8.98 Gel, and PB ratio decreased down to 0.97 Gel from 1.05. Table 21. TBC relative valuation, Gel
GEL 2016 2017 2018 2019 2020
EPS 6.00 6.70 8.10 9.84 5.84
Share price 47.29 61.22 52.07 48.96 52.44
BV per share 29.80 35.16 40.61 46.97 53.86
PE ratio 7.88 9.14 6.43 5.00 8.98
PB ratio 1.60 1.75 1.28 1.05 0.97
Source: TBC annual reports, author’s estimates
EPS was increasing from 2016 including 2019 for BOG also, but in 2020 it went down from 10.46 to 6.17 Gel, moreover, share priced decreased significantly from 61.64 to 48.47 Gel. While P/E ratio increased to 7.86 Gel from 5.89 Gel. Table 22, ’’BGEO relative valuation’’
summarises key information to calculate relative multiples. Table 22. BGEO relative valuation
GEL 2016 2017 2018 2019 2020
EPS 6.01 6.07 8.29 10.46 6.17
Share price
66.40 84.61 47.04 61.64 48.47
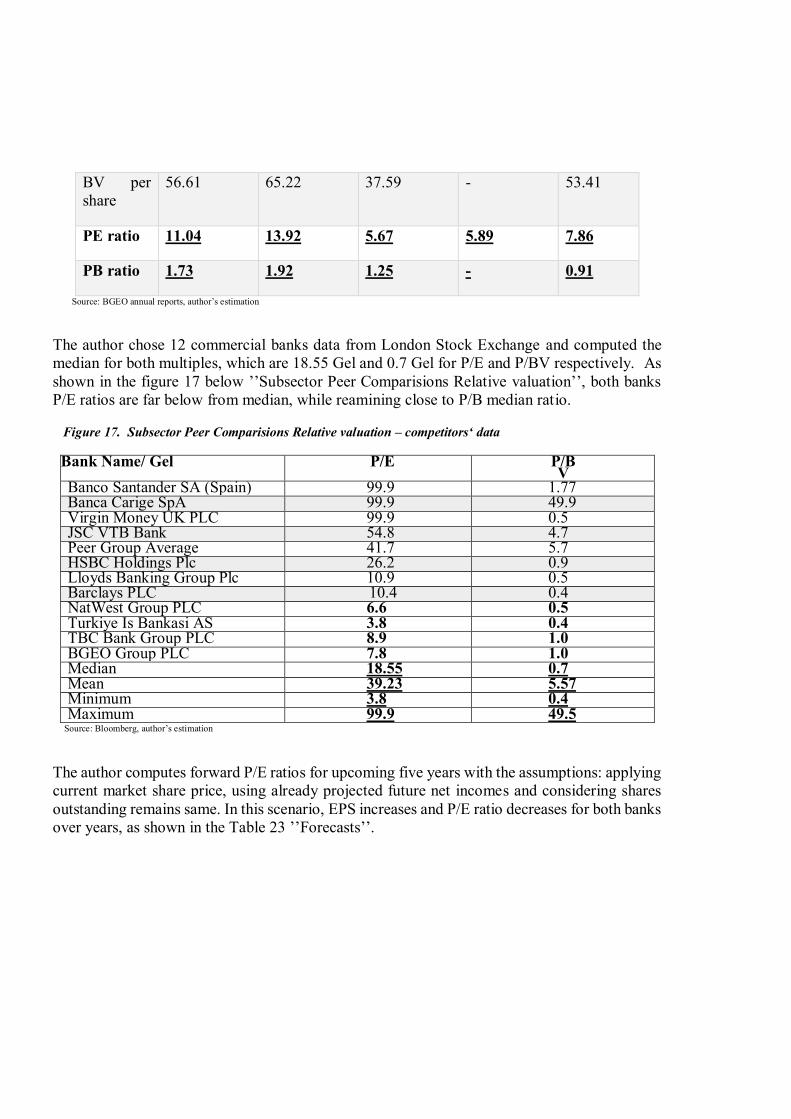
BV per share
56.61 65.22 37.59 - 53.41
PE ratio 11.04 13.92 5.67 5.89 7.86
PB ratio 1.73 1.92 1.25 - 0.91
Source: BGEO annual reports, author’s estimation
The author chose 12 commercial banks data from London Stock Exchange and computed the median for both multiples, which are 18.55 Gel and 0.7 Gel for P/E and P/BV respectively. As shown in the figure 17 below ’’Subsector Peer Comparisions Relative valuation’’, both banks
P/E ratios are far below from median, while reamining close to P/B median ratio. Figure 17. Subsector Peer Comparisions Relative valuation – competitors‘ data
Bank Name/ Gel P/E P/BV
Banco Santander SA (Spain) 99.9 1.77 Banca Carige SpA 99.9 49.9 Virgin Money UK PLC 99.9 0.5 JSC VTB Bank 54.8 4.7 Peer Group Average 41.7 5.7 HSBC Holdings Plc 26.2 0.9 Lloyds Banking Group Plc 10.9 0.5 Barclays PLC 10.4 0.4 NatWest Group PLC 6.6 0.5 Turkiye Is Bankasi AS 3.8 0.4 TBC Bank Group PLC 8.9 1.0 BGEO Group PLC 7.8 1.0 Median 18.55 0.7 Mean 39.23 5.57 Minimum 3.8 0.4 Maximum 99.9 49.5
Source: Bloomberg, author’s estimation
The author computes forward P/E ratios for upcoming five years with the assumptions: applying current market share price, using already projected future net incomes and considering shares outstanding remains same. In this scenario, EPS increases and P/E ratio decreases for both banks over years, as shown in the Table 23 ’’Forecasts’’.
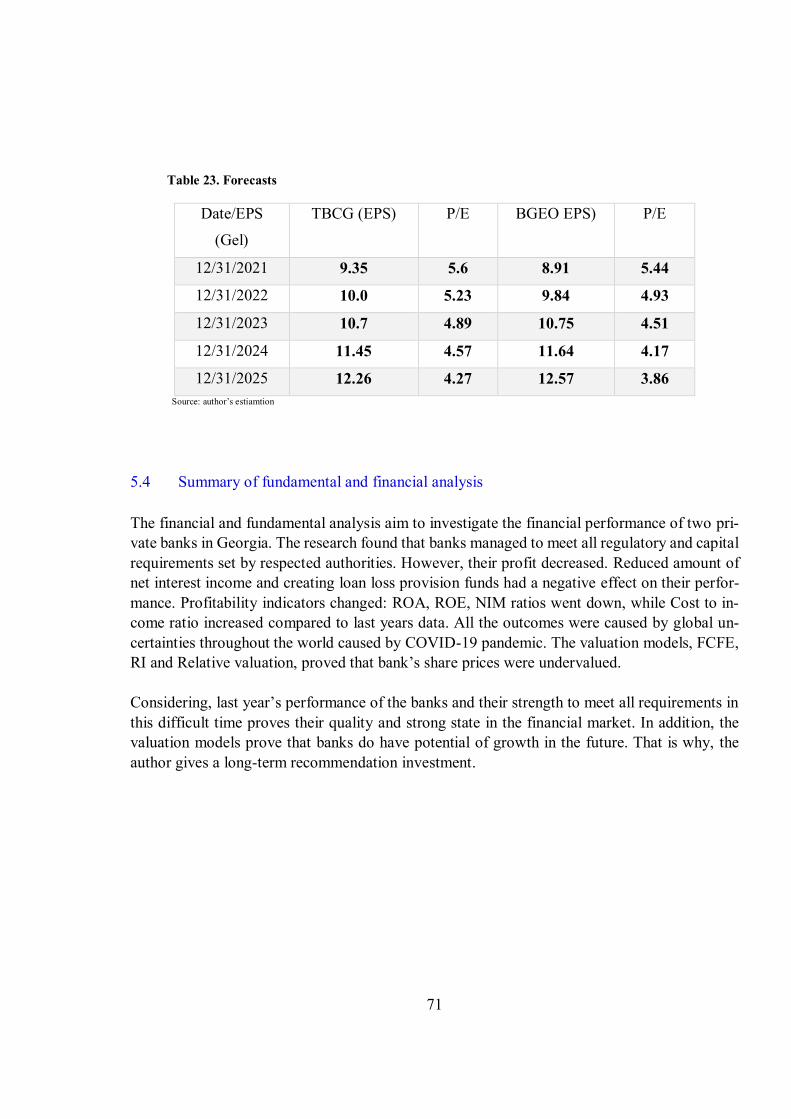
71
Table 23. Forecasts
Date/EPS
(Gel)
TBCG (EPS)
P/E BGEO EPS)
P/E
12/31/2021 9.35 5.6 8.91 5.44
12/31/2022 10.0 5.23 9.84 4.93
12/31/2023 10.7 4.89 10.75 4.51
12/31/2024 11.45 4.57 11.64 4.17
12/31/2025 12.26 4.27 12.57 3.86 Source: author’s estiamtion
5.4 Summary of fundamental and financial analysis
The financial and fundamental analysis aim to investigate the financial performance of two pri-vate banks in Georgia. The research found that banks managed to meet all regulatory and capital requirements set by respected authorities. However, their profit decreased. Reduced amount of net interest income and creating loan loss provision funds had a negative effect on their perfor-mance. Profitability indicators changed: ROA, ROE, NIM ratios went down, while Cost to in-come ratio increased compared to last years data. All the outcomes were caused by global un-certainties throughout the world caused by COVID-19 pandemic. The valuation models, FCFE, RI and Relative valuation, proved that bank’s share prices were undervalued. Considering, last year’s performance of the banks and their strength to meet all requirements in this difficult time proves their quality and strong state in the financial market. In addition, the valuation models prove that banks do have potential of growth in the future. That is why, the author gives a long-term recommendation investment.

Conclusion
A bank’s sound financial health is promise not only to its depositors but also to
shareholders, workers, and the entire economy. Period attempts have been made to assess each bank’s financial condition and handle it efficientrly and effectively. The thesis measured Georgian banking sector’s two biggest banks in the financial year 2020. Relevant ratios and valuation models were applied. The life of any business depends on the economic conditions of the country they operate. That was the main reason, author started the thesis with the introduction of country‘s brief economic history and current challenges. GDP growth rate, inflation or FDI rates clearly described the athmosphere. After that, one part of the theory explains bank’s key
pecularites, as financial isntitutions are valued differently compared to manufacturing firms. Debt, reinvestment, accounting rules and regulatory framework make commercial banks‘ assessment complicated. Which requires various assumptions in the process of valuation. The another half of theoretical part explains financial ratios and three most important valuation models which are applied. The practical part starts with the assessment of country’s banking sector. Various asset quality and profitability ratios indicate that the overall industry’s performance deteriorated in terms of earnings, all because of the their operating environmnet which was changed due to global pandemic. Covid-19 slowed down economic activites, many financial institutions could not even cover their expenses, faced negative income. In response to diffuclut economic state, credibility of the population significantly deteriorated. Majority of the debtors could not pay loans on time. Therefore, NBG reduced or annulazied some capital adequacy ratios to help banks create loan loss provisions. No dividends were paid throughout the year. As it was highly restricted by NBG. The author thouroughly reviewed the implications on the banks regulatory and capital adequacy requirements set by government authorities and banks. Both banks, TBC and BGEO are found to be insolvent, according to analysis and discussions in the proceeding pages. They have embraced sensible financial management procedures, making them financial viable. The banks have managed their capital adequacy ratios well above the minimum standard, as total capital 13.7 % fixed by NBG. So far liquidity is also concerned.The TBC has been able to maintain the ratio of LCR 134.2% and NSFR 137.5% while BGEO 138.6% and 126% respectively, far above of minimum standard of 100% for both ratios.
73
TBC has generated an average Net Interst margin of 4.7% compare to 4.6 % generated by BGEO. Return on Assets for TBC was 1.6 while BGEO just made 1.5. However, return on equity is more (13 %) in case of BGEO compare to TBC (11.7%). Even though TBC and BOG made profit in 2020, it was significantly less compared last years data. Increasing interest expenses, bigger loan loss provisions, less net inteerest income resulted in almost 50% deduction in ROE and ROA ratios. In order to caluclate banks‘ fair value, the author firstly forecasted future revenues they may have in the upcoming five years. Then applied three models: FCFE, RI and Relative valuation. According FCFE, TBC bank’s share price should be 53.42 Gel compare to real
price of 52.44 Gel, for BGEO author states that fair value is 89.19 Gel far more from real price 48.47 Gel at the end of 2020. The similar scenario is shown by Residual Income model, TBC fair value is 58.27 Gel, BGEO -63.8 Gel. Forecasted P/E ratios are decreasing, which indicates that both banks have a growing percepcitve in the future. Based on the results, author concludes that the stock‘ are undervalued and gives recommendation for the investment.
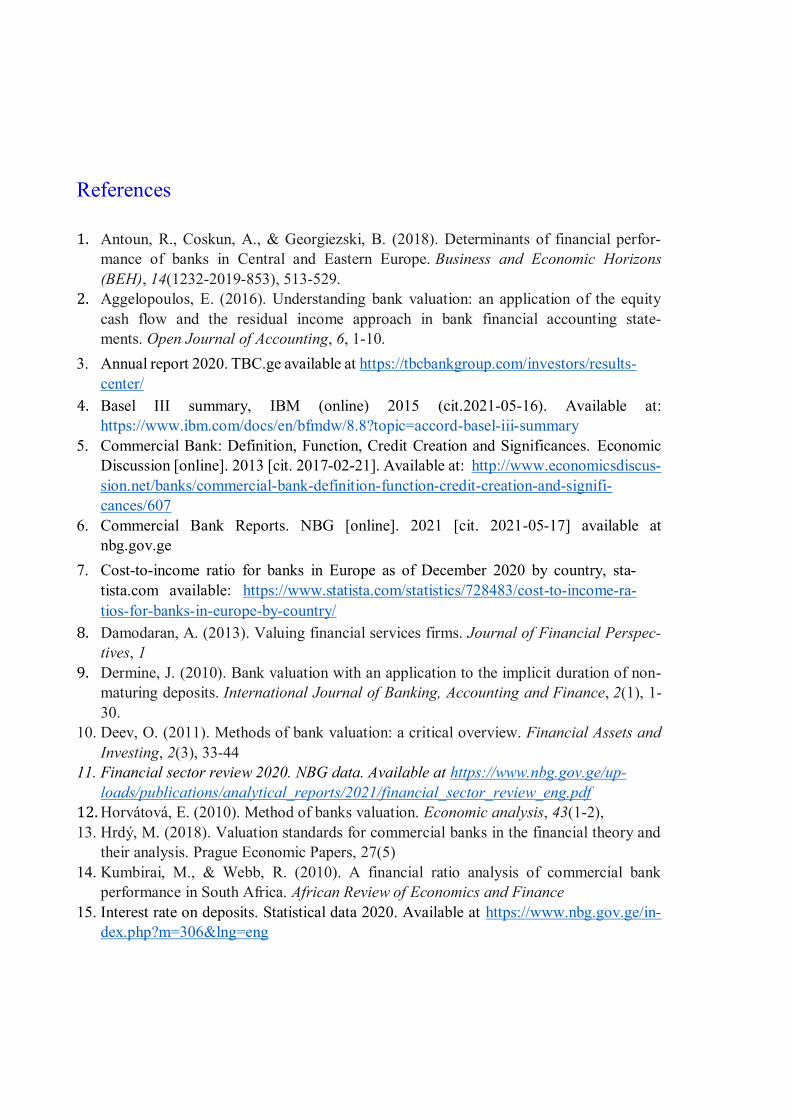
References
1. Antoun, R., Coskun, A., & Georgiezski, B. (2018). Determinants of financial perfor-mance of banks in Central and Eastern Europe. Business and Economic Horizons (BEH), 14(1232-2019-853), 513-529.
2. Aggelopoulos, E. (2016). Understanding bank valuation: an application of the equity cash flow and the residual income approach in bank financial accounting state-ments. Open Journal of Accounting, 6, 1-10.
3. Annual report 2020. TBC.ge available at https://tbcbankgroup.com/investors/results-center/
4. Basel III summary, IBM (online) 2015 (cit.2021-05-16). Available at: https://www.ibm.com/docs/en/bfmdw/8.8?topic=accord-basel-iii-summary
5. Commercial Bank: Definition, Function, Credit Creation and Significances. Economic Discussion [online]. 2013 [cit. 2017-02-21]. Available at: http://www.economicsdiscus-sion.net/banks/commercial-bank-definition-function-credit-creation-and-signifi-cances/607
6. Commercial Bank Reports. NBG [online]. 2021 [cit. 2021-05-17] available at nbg.gov.ge
7. Cost-to-income ratio for banks in Europe as of December 2020 by country, sta-tista.com available: https://www.statista.com/statistics/728483/cost-to-income-ra-tios-for-banks-in-europe-by-country/
8. Damodaran, A. (2013). Valuing financial services firms. Journal of Financial Perspec-tives, 1
9. Dermine, J. (2010). Bank valuation with an application to the implicit duration of non-maturing deposits. International Journal of Banking, Accounting and Finance, 2(1), 1-30.
10. Deev, O. (2011). Methods of bank valuation: a critical overview. Financial Assets and Investing, 2(3), 33-44
11. Financial sector review 2020. NBG data. Available at https://www.nbg.gov.ge/up-loads/publications/analytical_reports/2021/financial_sector_review_eng.pdf
12. Horvátová, E. (2010). Method of banks valuation. Economic analysis, 43(1-2), 13. Hrdý, M. (2018). Valuation standards for commercial banks in the financial theory and
their analysis. Prague Economic Papers, 27(5) 14. Kumbirai, M., & Webb, R. (2010). A financial ratio analysis of commercial bank
performance in South Africa. African Review of Economics and Finance 15. Interest rate on deposits. Statistical data 2020. Available at https://www.nbg.gov.ge/in-
dex.php?m=306&lng=eng
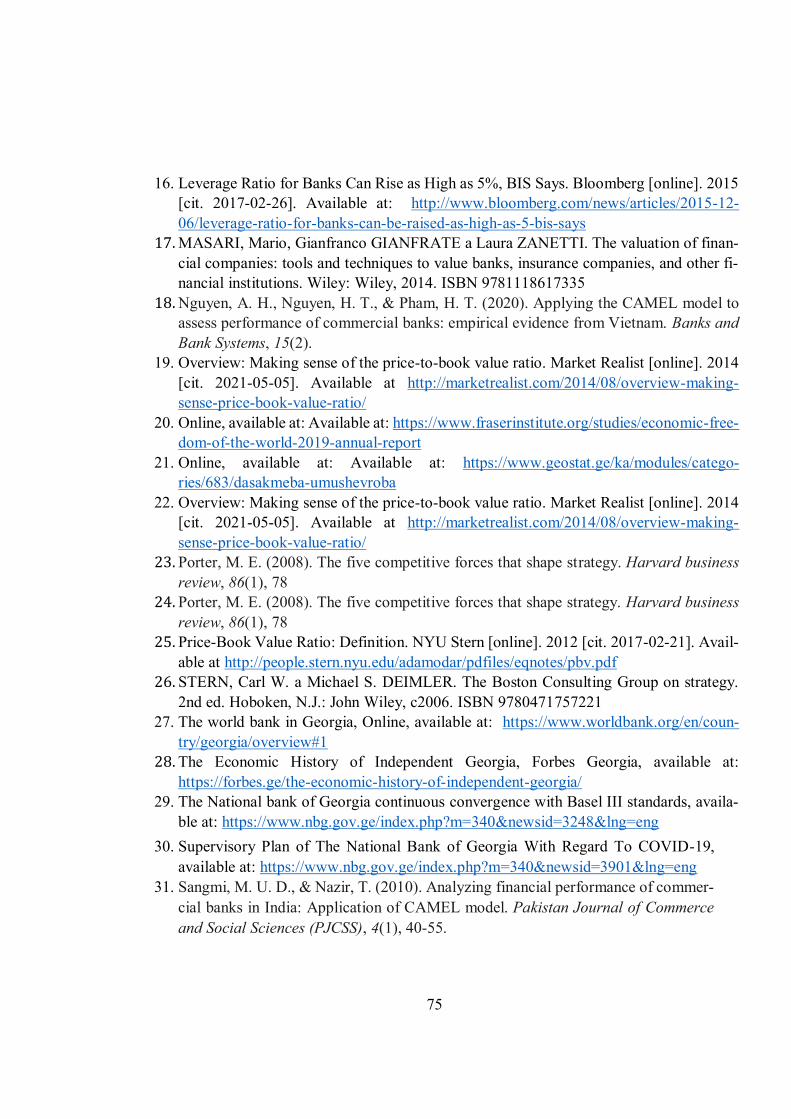
75
16. Leverage Ratio for Banks Can Rise as High as 5%, BIS Says. Bloomberg [online]. 2015 [cit. 2017-02-26]. Available at: http://www.bloomberg.com/news/articles/2015-12-06/leverage-ratio-for-banks-can-be-raised-as-high-as-5-bis-says
17. MASARI, Mario, Gianfranco GIANFRATE a Laura ZANETTI. The valuation of finan-cial companies: tools and techniques to value banks, insurance companies, and other fi-nancial institutions. Wiley: Wiley, 2014. ISBN 9781118617335
18. Nguyen, A. H., Nguyen, H. T., & Pham, H. T. (2020). Applying the CAMEL model to assess performance of commercial banks: empirical evidence from Vietnam. Banks and Bank Systems, 15(2).
19. Overview: Making sense of the price-to-book value ratio. Market Realist [online]. 2014 [cit. 2021-05-05]. Available at http://marketrealist.com/2014/08/overview-making-sense-price-book-value-ratio/
20. Online, available at: Available at: https://www.fraserinstitute.org/studies/economic-free-dom-of-the-world-2019-annual-report
21. Online, available at: Available at: https://www.geostat.ge/ka/modules/catego-ries/683/dasakmeba-umushevroba
22. Overview: Making sense of the price-to-book value ratio. Market Realist [online]. 2014 [cit. 2021-05-05]. Available at http://marketrealist.com/2014/08/overview-making-sense-price-book-value-ratio/
23. Porter, M. E. (2008). The five competitive forces that shape strategy. Harvard business review, 86(1), 78
24. Porter, M. E. (2008). The five competitive forces that shape strategy. Harvard business review, 86(1), 78
25. Price-Book Value Ratio: Definition. NYU Stern [online]. 2012 [cit. 2017-02-21]. Avail-able at http://people.stern.nyu.edu/adamodar/pdfiles/eqnotes/pbv.pdf
26. STERN, Carl W. a Michael S. DEIMLER. The Boston Consulting Group on strategy. 2nd ed. Hoboken, N.J.: John Wiley, c2006. ISBN 9780471757221
27. The world bank in Georgia, Online, available at: https://www.worldbank.org/en/coun-try/georgia/overview#1
28. The Economic History of Independent Georgia, Forbes Georgia, available at: https://forbes.ge/the-economic-history-of-independent-georgia/
29. The National bank of Georgia continuous convergence with Basel III standards, availa-ble at: https://www.nbg.gov.ge/index.php?m=340&newsid=3248&lng=eng
30. Supervisory Plan of The National Bank of Georgia With Regard To COVID-19, available at: https://www.nbg.gov.ge/index.php?m=340&newsid=3901&lng=eng
31. Sangmi, M. U. D., & Nazir, T. (2010). Analyzing financial performance of commer-cial banks in India: Application of CAMEL model. Pakistan Journal of Commerce and Social Sciences (PJCSS), 4(1), 40-55.

32. Valuing Financial Service Firms. NYU Stern [online]. 2009 [cit. 2017-02-19]. Available at http://people.stern.nyu.edu/adamodar/pdfiles/papers/finfirm09.pdf
33. What is Valuation? NYU Stern [online]. 2014 [cit. 2021-05-15]. Available at http://pages.stern.nyu.edu/~adamodar/New_Home_Page/background/valintro.htm
Copyright © 2022 FDOKUMEN