Racial and ethnic disparities - Child Advocacy Program
14
Please cite this article in press as: Putnam-Hornstein, E., et al. Racial and ethnic disparities: A population- based examination of risk factors for involvement with child protective services. Child Abuse & Neglect (2013), http://dx.doi.org/10.1016/j.chiabu.2012.08.005 ARTICLE IN PRESS G Model CHIABU-2493; No. of Pages 14 Child Abuse & Neglect xxx (2013) xxx–xxx Contents lists available at SciVerse ScienceDirect Child Abuse & Neglect Racial and ethnic disparities: A population-based examination of risk factors for involvement with child protective services Emily Putnam-Hornstein a,b,∗ , Barbara Needell b , Bryn King b , Michelle Johnson-Motoyama c a University of Southern California, School of Social Work, University Park Campus, SWC 218, Los Angeles, CA 90089-0411, USA b Center for Social Services Research, University of California at Berkeley, 16 Haviland Hall Berkeley, CA 94720-7400, USA c University of Kansas, School of Social Welfare, 1545 Lilac Lane, 311 Twente Hall, Lawrence, KS 66045, USA a r t i c l e i n f o Article history: Received 17 May 2012 Received in revised form 2 August 2012 Accepted 22 August 2012 Available online xxx Keywords: Child maltreatment Child protective services Risk Racial disparities Maternal nativity Poverty Health paradox a b s t r a c t Objective: Data from the United States indicate pronounced and persistent racial/ethnic differences in the rates at which children are referred and substantiated as victims of child abuse and neglect. In this study, we examined the extent to which aggregate racial differ- ences are attributable to variations in the distribution of individual and family-level risk factors. Methods: This study was based on the full population of children born in California in 2002. Birth records were linked to child protective service (CPS) records to identify all children referred for maltreatment by age 5. Generalized linear models were used to compute crude and adjusted racial/ethnic differences in children’s risk of referral, substantiation, and entry to foster care. Results: As expected, stark differences between Black and White children emerged in the rates of contact with CPS. Black children were more than twice as likely as White children to be referred for maltreatment, substantiated as victims, and enter foster care before age 5. Yet, there were also significant differences across racial/ethnic groups in the distribution of socioeconomic and health factors strongly correlated with child maltreatment and CPS involvement. After adjusting for these differences, low socioeconomic Black children had a lower risk of referral, substantiation, and entry to foster care than their socioeconomically similar White counterparts. Among Latinos, before adjusting for other factors, children of U.S.-born mothers were significantly more likely than White children to experience system contact, while children of foreign-born mothers were less likely to be involved with CPS. After adjusting for socioeconomic and health indicators, the relative risk of referral, sub- stantiation, and foster care entry was significantly lower for Latino children (regardless of maternal nativity) compared to White children. Conclusions: Race and ethnicity is a marker for a complex interaction of economic, social, political, and environmental factors that influence the health of individuals and communi- ties. This analysis indicates that adjusting for child and family-level risk factors is necessary to distinguish race-specific effects (which may reflect system, worker, or resource biases) from socioeconomic and health indicators associated with maltreatment risk. Identifying the independent effects of these factors is critical to developing effective strategies for reducing racial disparities. © 2012 Elsevier Ltd. All rights reserved. The authors would like to acknowledge Joseph Magruder and other colleagues at the Center for Social Services Research and the California Department of Social Services who assisted in the preparation of data underlying these analyses. Funding for this and other research arising from the California Child Welfare Performance Indicators Project is provided by the California Department of Social Services, the Stuart Foundation, and Casey Family Programs. ∗ Corresponding author. 0145-2134/$ – see front matter © 2012 Elsevier Ltd. All rights reserved. http://dx.doi.org/10.1016/j.chiabu.2012.08.005
-
Upload
khangminh22 -
Category
Documents
-
view
3 -
download
0
Transcript of Racial and ethnic disparities - Child Advocacy Program

G ModelC
Rf
Ea
b
c
a
ARRAA
KCCRRMPH
oW
0h
ARTICLE IN PRESSHIABU-2493; No. of Pages 14
Child Abuse & Neglect xxx (2013) xxx– xxx
Contents lists available at SciVerse ScienceDirect
Child Abuse & Neglect
acial and ethnic disparities: A population-based examination of riskactors for involvement with child protective services�
mily Putnam-Hornsteina,b,∗, Barbara Needellb, Bryn Kingb, Michelle Johnson-Motoyamac
University of Southern California, School of Social Work, University Park Campus, SWC 218, Los Angeles, CA 90089-0411, USACenter for Social Services Research, University of California at Berkeley, 16 Haviland Hall Berkeley, CA 94720-7400, USAUniversity of Kansas, School of Social Welfare, 1545 Lilac Lane, 311 Twente Hall, Lawrence, KS 66045, USA
r t i c l e i n f o
rticle history:eceived 17 May 2012eceived in revised form 2 August 2012ccepted 22 August 2012vailable online xxx
eywords:hild maltreatmenthild protective servicesiskacial disparitiesaternal nativity
overtyealth paradox
a b s t r a c t
Objective: Data from the United States indicate pronounced and persistent racial/ethnicdifferences in the rates at which children are referred and substantiated as victims of childabuse and neglect. In this study, we examined the extent to which aggregate racial differ-ences are attributable to variations in the distribution of individual and family-level riskfactors.Methods: This study was based on the full population of children born in California in 2002.Birth records were linked to child protective service (CPS) records to identify all childrenreferred for maltreatment by age 5. Generalized linear models were used to compute crudeand adjusted racial/ethnic differences in children’s risk of referral, substantiation, and entryto foster care.Results: As expected, stark differences between Black and White children emerged in therates of contact with CPS. Black children were more than twice as likely as White childrento be referred for maltreatment, substantiated as victims, and enter foster care before age5. Yet, there were also significant differences across racial/ethnic groups in the distributionof socioeconomic and health factors strongly correlated with child maltreatment and CPSinvolvement. After adjusting for these differences, low socioeconomic Black children had alower risk of referral, substantiation, and entry to foster care than their socioeconomicallysimilar White counterparts. Among Latinos, before adjusting for other factors, children ofU.S.-born mothers were significantly more likely than White children to experience systemcontact, while children of foreign-born mothers were less likely to be involved with CPS.After adjusting for socioeconomic and health indicators, the relative risk of referral, sub-stantiation, and foster care entry was significantly lower for Latino children (regardless ofmaternal nativity) compared to White children.Conclusions: Race and ethnicity is a marker for a complex interaction of economic, social,political, and environmental factors that influence the health of individuals and communi-ties. This analysis indicates that adjusting for child and family-level risk factors is necessaryto distinguish race-specific effects (which may reflect system, worker, or resource biases)from socioeconomic and health indicators associated with maltreatment risk. Identifyingthe independent effects of these factors is critical to developing effective strategies forreducing racial disparities.
Please cite this article in press as: Putnam-Hornstein, E., et al. Racial and ethnic disparities: A population-based examination of risk factors for involvement with child protective services. Child Abuse & Neglect (2013),http://dx.doi.org/10.1016/j.chiabu.2012.08.005
© 2012 Elsevier Ltd. All rights reserved.
� The authors would like to acknowledge Joseph Magruder and other colleagues at the Center for Social Services Research and the California Departmentf Social Services who assisted in the preparation of data underlying these analyses. Funding for this and other research arising from the California Childelfare Performance Indicators Project is provided by the California Department of Social Services, the Stuart Foundation, and Casey Family Programs.∗ Corresponding author.
145-2134/$ – see front matter © 2012 Elsevier Ltd. All rights reserved.ttp://dx.doi.org/10.1016/j.chiabu.2012.08.005

G Model
ARTICLE IN PRESSCHIABU-2493; No. of Pages 142 E. Putnam-Hornstein et al. / Child Abuse & Neglect xxx (2013) xxx– xxx
Introduction
In the United States, information collected by child protective service (CPS) agencies suggests that child maltreatment isnot randomly distributed throughout the population (U.S. Department of Health and Human Services, 2011). Rather, dataindicate that children of different racial/ethnic groups are subjected to abuse and neglect at different rates. Black children areover represented among maltreatment victims, whereas Latino and White children are typically underrepresented (Shaw,Putnam-Hornstein, Magruder, & Needell, 2008; U.S. General Accounting Office, 2007).
Historically, it was widely held that observed disparities reflected the incomplete or biased nature of CPS data, whichcaptures only those children officially reported for maltreatment. This position was based largely upon empirical supportfrom a single data source – the National Incidence Studies (NIS) – a periodic, community-based effort to estimate theincidence of abuse and neglect using information gathered for both unreported and reported cases (Sedlak, 1991; Sedlak& Broadhurst, 1996). Until 2010, the authors of these studies reported there to be “no race differences in the incidenceof maltreatment” (italics in original text) and concluded that racial and ethnic disparities arose from differential treatmentacross races (Sedlak & Broadhurst, 1996, p. 8). In other words, the conclusion was drawn that the overrepresentation of Blackchildren in official CPS statistics arose from reporting, substantiation, and removal processes in which race, rather than risk,was the relevant factor. As a result, efforts to address racial disparities in the United States during the last two decades havebeen developed accordingly, with a focus on reducing worker and agency racial biases (Bartholet, 2009; Wulczyn, 2009). Yet,while CPS data are undoubtedly incomplete, racial disparities in the incidence of maltreatment mirroring those in officialstatistics were reported for the first time in the most recent NIS (Sedlak, McPherson, & Das, 2010; Sedlak, Mettenburg et al.,2010). Further, Drake and Jonson-Reid (2011), noting fallacies in the conclusions drawn from the earlier NIS findings, havecompellingly argued that small samples led to the absence of statistically significant racial differences in earlier NIS studies.
Although recent research points to factors other than bias as important contributors to observed racial disparities (Drake,Jolley, Lanier, Fluke, Barth, & Jonson-Reid, 2011), an unanswered question is the extent to which racial differences in CPSinvolvement may be attributable to the distribution of individual and family-level risk factors associated with maltreatment.Indeed many of the most well-established correlates of child abuse and neglect – poverty, limited education, single-parentstatus, environmental stress (Berger, 2005; Berger, Paxson, & Waldfogel, 2009; Coulton, Korbin, Su, & Chow, 1995; Drake,Lee, & Jonson-Reid, 2009; Jonson-Reid, Drake, & Kohl, 2009; Parrish, Young, Perham-Hester, & Gessner, 2011) – are burdensdisproportionately borne by families of color. Yet, conclusions of risk differences are complicated by the fact that Latinochildren in California, and in many other states, have rates of CPS contact comparable to those of Whites, despite a socioeco-nomic profile that aligns more closely with that of Black families (Needell et al., 2012; Putnam-Hornstein & Needell, 2011;Drake & Rank, 2009; U.S. General Accounting Office, 2007).
Race/ethnicity is widely viewed as a marker for a complex interaction of economic, social, political, and environmentalfactors that influence the health of individuals and communities. In this study, we used population-based data, consistingof the entire cohort of children born in California in 2002, to examine: (1) racial disparities in socioeconomic and healthindicators predictive of children’s involvement with CPS, and (2) racial disparities in the rates of children reported to CPS,as well as disparities in rates of substantiation and entry to foster care, both before and after adjusting for socioeconomicand health indicators. Our aim was twofold: first, we wanted to explore whether aggregate Black/White disparities arelargely attributable to the distribution of risk and protective factors at birth; second, we sought to determine whether theepidemiologic or health paradox observed for Latinos in other domains of health is similarly observed in maltreatment riskamong children in California, and whether there were variations among Latinos by maternal nativity.
Methods
Dataset
This analysis is based on a dataset constructed by linking CPS records to vital birth records. CPS records for all childrenborn in 2002 and referred for maltreatment before the age of 5 were extracted from California’s statewide administrativedata system. These records fall under the authority of the California Department of Social Services and are hosted at theUniversity of California at Berkeley under a longstanding interagency collaborative agreement. CPS records were probabilis-tically matched to the complete file of 2002 birth records obtained from the California Department of Public Health. Thelinkage methodology used to create this dataset has been described in prior publications (Putnam-Hornstein & Needell, 2011;Putnam-Hornstein, Webster, Needell, & Magruder, 2011). This project received both state and university IRB approvals, andthe endorsement of the state’s Vital Statistics Advisory Board.
Variables
In this analysis, we examined race/ethnicity as predictor of a child’s: (1) referral for maltreatment, (2) substantiation
Please cite this article in press as: Putnam-Hornstein, E., et al. Racial and ethnic disparities: A population-based examination of risk factors for involvement with child protective services. Child Abuse & Neglect (2013),http://dx.doi.org/10.1016/j.chiabu.2012.08.005
as a victim of maltreatment, and (3) entry to an out-of-home foster care placement. We coded each child’s race/ethnicitybased on first identified maternal race and a Latino ethnicity indicator, as self-reported by the mother on the birth record. Toexplore possible variations by maternal nativity status for Latino children, we further stratified children based on maternalbirth place, resulting in six levels of our independent variable: (1) Black; (2) White; (3) Latino with U.S.-born mother; (4)
G Model
C
Log
tcphMS
2ylRsiwacc
A
aTwicbwsqtt&(T(
R
C
acLrIa
woc(ma
c
ARTICLE IN PRESSHIABU-2493; No. of Pages 14
E. Putnam-Hornstein et al. / Child Abuse & Neglect xxx (2013) xxx– xxx 3
atino with foreign-born mother; (5) Asian/Pacific Islander; and (6) Native American/Alaskan Native. Although included inur analysis, for reporting simplicity we suppressed results for Asian/Pacific Islander and Native American/Alaskan Nativeroups and focused on results for Black, Latino, and White children.
In an attempt to isolate the relationship between race/ethnicity and CPS contact, we examined differences in the dis-ribution of risk and protective factors for each racial/ethnic group in our descriptive tables and adjusted for these sameovariates in our multivariable models. All covariates were derived from the birth record. Chosen covariates consisted ofreviously identified sociodemographic risk factors for contact with CPS, as well as those markers for pregnancy and childealth which emerged as significant in prior linkages between birth records and CPS records (Murphey & Braner, 2000;urphy, Jenkins, Newcombe, & Sibert, 1981; Needell & Barth, 1998; Parrish et al., 2011; Putnam-Hornstein & Needell, 2011;
pencer, Wallace, Sundrum, Bacchus, & Logan, 2006; Wu et al., 2004).Covariates included: sex (male, female); birth weight (<2,500 g, ≥2,500 g); commencement of prenatal care (1st trimester,
nd trimester, 3rd trimester, no care); birth abnormality (1 or more abnormalities, none); maternal age (<20 years, 20–24ears, 25–29 years, 30+ years); maternal education (<high school, high school degree, some college, college+); paternity (estab-ished at birth, missing); birth order (first-born, second-born, third-born or higher); and health insurance (public, private).ates of missing values for these covariates were low, ranging from 0.04% (for child sex) to 2.21% (for maternal education). Ithould be noted that among women giving birth without any health insurance in California, infants are retroactively enrolledn the state’s public health insurance program and therefore fall in the public insurance group. Paternity was coded based on
hether or not a father was named on the birth record. The presence of a recorded abnormality at birth was gleaned from list of over thirty abnormality codes related to the fetus or newborn, including congenital anomalies (e.g., anencephaly,left palate, or down syndrome), birth injuries, and medical interventions (e.g., assisted ventilation or admission to intensiveare).
nalysis
Descriptive tabulations are presented in Table 1, capturing the distribution of all covariates for the full 2002 birth cohorts well as the subset of births covered by public health insurance, with stratifications by race/ethnicity and maternal nativity.ables 2–4 document cohort variations in referral, substantiation, and foster care entry rates per 1,000 children born, alongith crude risk ratios and corresponding 95% confidence intervals for all covariates. This allowed an examination of variations
n the likelihood of CPS involvement based on a child’s covariate level, and captured unadjusted risk ratios (or disparity ratios)ommonly cited in the racial disproportionality and disparities literature (Shaw et al., 2008). These same rates per 1,000irths and crude risk ratios are also reported for those children whose births were covered by public insurance. The decisionas made to focus our attention on those children eligible for public health insurance as a proxy for low socioeconomic
tatus (SES) because public health insurance eligibility: (1) consistently translates into at least half to more than threeuarters of children known to CPS across all racial/ethnic groups (see Fig. 1); and (2) reduces surveillance confounds givenhat all of these children were part of a public entitlement system at birth. Finally, we utilized generalized linear modelso calculate the adjusted relative risk of a referral, substantiation, and entry to foster care before the age of 5 (McCullagh
Nelder, 1989; Zou, 2004). We specified a Poisson distribution and log link, using a robust standard error adjustmentsandwich estimator) in order to correct for estimated confidence intervals that would otherwise be too wide (UCLA Academicechnology Services: Statistical Consulting Group, n.d.). All statistical analyses were conducted using StataSE version 11StataCorp).
esults
ohort Characteristics
As reflected in Table 1, there were a total of 531,035 children born in California in 2002 and included in this analysis;pproximately 43% were eligible and covered by the state’s public health insurance system (n = 226,904). In the overall birthohort, 6% (n = 31,148) of children were Black, 51% (n = 263,838) were Latino, and 31% (n = 165,192) were White. Amongatino children, 64% were born to mothers born outside of the United States (Latino with foreign-born mother), whereas theemaining 36% had native-born mothers (Latino with U.S.-born mother). Although not reported in this analysis, Asian/Pacificslander children comprised 12% of the cohort, whereas Native American/Alaskan Native children comprised less than half
percent. Only 1.2% of birth records were missing maternal race/ethnicity.Full birth cohort. Notable variations were observed in the distribution of cohort characteristics by racial/ethnic group, as
ell as maternal nativity. For example, 11.7% of Black children in the cohort were low birth weight, compared with only 6.0%f White children and 6.4% and 5.4% of Latino children with U.S.-born and foreign-born mothers, respectively. Among Latinohildren with foreign-born mothers, health advantages manifested in the form of a low prevalence of birth abnormalities4.6%) relative to other groups, despite a proportion of public health insurance utilization (a proxy for low SES) that was
Please cite this article in press as: Putnam-Hornstein, E., et al. Racial and ethnic disparities: A population-based examination of risk factors for involvement with child protective services. Child Abuse & Neglect (2013),http://dx.doi.org/10.1016/j.chiabu.2012.08.005
uch higher (71.3%). The health advantages reflected in normal birth weights and low levels of birth abnormalities werettenuated but still present for Latino children of U.S.-born mothers.
Nearly one out of every five (19.7%) Black children had no paternity established, a dynamic true of only 5.2% of Whitehildren, 8.5% of Latino children of foreign-born mothers, and 13.1% of Latino children with U.S.-born mothers. Meanwhile,

Please
cite
this
article
in
press
as:
Putn
am-H
ornstein
,
E.,
et
al.
Racial
and
ethn
ic
disp
arities:
A
pop
ulation
-based
examin
ation of
risk factors
for in
volvemen
t w
ith ch
ild p
rotective services.
Child A
buse &
Neglect
(2013),h
ttp://d
x.doi.org/10.1016/j.ch
iabu.2012.08.005
AR
TIC
LE
IN P
RE
SS
G M
odel
CH
IAB
U-2493;
No.
of Pages
14
4E.
Putnam-H
ornstein et
al. /
Child A
buse &
Neglect
xxx (2013) xxx– xxx
Table 1Characteristics of California’s 2002 birth cohort by maternal race/ethnicity and nativity.
Full birth cohort (N = 531,035) Public health insurance (N = 226,904)
White Black Latino, U.S. born mother Latino, foreign-born mother White Black Latino, U.S. born mother Latino, foreign-born mother(N = 165,192) (N = 31,418) (N = 94,388) (N = 169,450) (N = 31,388) (N = 15,210) (N = 43,395) (N = 120,572)
SexMale 51.3% 51.1% 50.9% 50.9% 51.2% 51.1% 50.8% 50.7%Female 48.7% 48.9% 49.1% 49.1% 48.8% 48.9% 49.2% 49.3%
Birth weightLow (<2,500 g) 6.0% 11.7% 6.4% 5.4% 6.7% 12.7% 6.5% 5.4%Normal (≥2,500 g) 94.0% 88.3% 93.6% 94.6% 93.3% 87.3% 93.5% 94.6%
Prenatal careNone 0.5% 0.9% 0.8% 0.4% 1.1% 1.0% 1.0% 0.3%3rd trimester 1.4% 2.4% 2.4% 2.7% 4.0% 3.2% 3.3% 3.0%2nd trimester 7.8% 13.6% 13.3% 12.5% 18.8% 17.4% 17.8% 13.4%1st trimester 90.3% 83.1% 83.5% 84.4% 76.2% 78.3% 78.0% 83.3%
Birth abnormality1+ abnormality 7.3% 8.3% 5.9% 4.6% 8.5% 5.9% 4.5% 4.5%None 92.7% 91.7% 94.1% 95.4% 91.5% 94.1% 95.5% 95.5%
Maternal age at birth<20 yrs 5.3% 13.6% 19.7% 9.8% 16.1% 17.9% 29.1% 12.2%20–24 yrs 17.8% 29.3% 34.9% 25.2% 37.7% 35.6% 42.8% 28.8%25–29 yrs 23.9% 23.9% 24.1% 29.1% 23.5% 23.3% 18.1% 28.7%30+ yrs 52.9% 33.1% 21.4% 35.9% 22.7% 23.2% 10.1% 30.4%
Maternal education<12th grade 7.3% 16.3% 26.8% 61.3% 25.1% 25.4% 41.6% 70.3%12th grade 26.2% 40.6% 41.1% 24.7% 46.2% 48.6% 42.5% 21.9%Some college 25.4% 28.0% 22.2% 8.9% 22.1% 21.8% 14.2% 5.7%College+ 41.1% 15.1% 9.9% 5.2% 6.6% 4.2% 1.7% 2.1%
PaternityMissing 5.2% 19.7% 13.1% 8.5% 20.2% 37.9% 20.2% 10.4%Established 94.8% 80.3% 86.9% 91.5% 79.8% 62.1% 79.8% 89.6%
Total children born to motherThree children 23.6% 35.1% 29.0% 38.4% 31.6% 39.9% 30.5% 38.1%Two children 34.0% 28.3% 30.6% 30.2% 28.2% 25.4% 27.5% 29.4%One child 42.4% 36.6% 40.4% 31.4% 40.2% 34.7% 42.0% 32.6%
Insurance coveragePublic (Medi-Cal) 19.1% 48.6% 46.1% 71.3% – – – –Private 80.9% 51.4% 53.9% 28.7% – – – –
Notes: 1,680 (0.3%) of birth records were missing birth payment method.

ARTICLE IN PRESSG Model
CHIABU-2493; No. of Pages 14
E. Putnam-Hornstein et al. / Child Abuse & Neglect xxx (2013) xxx– xxx 5
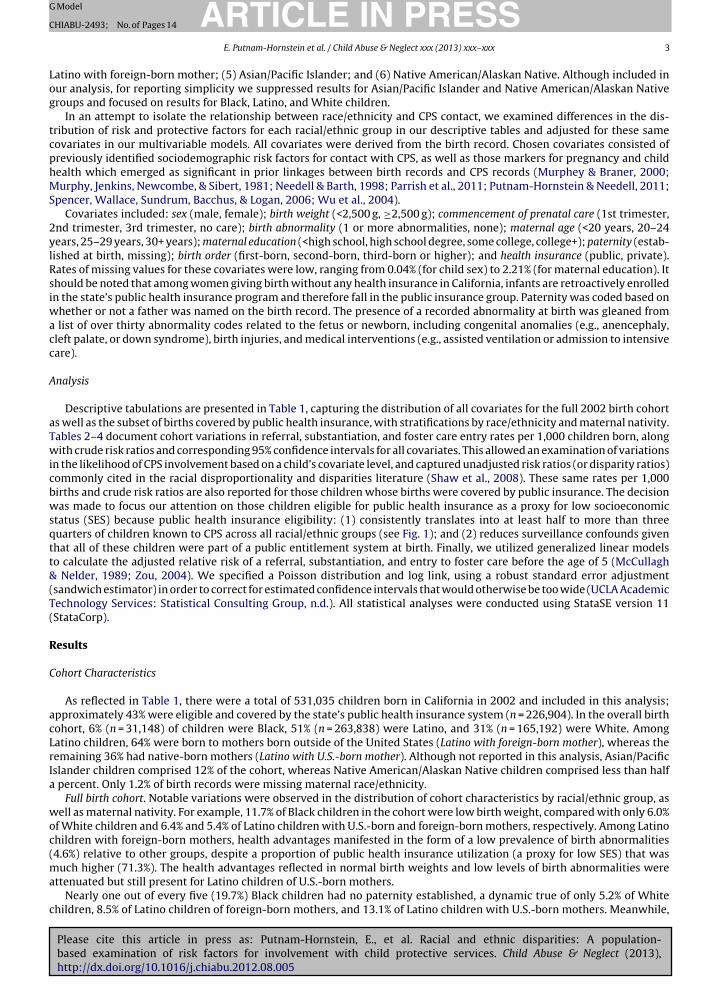
Fig. 1. Percentage of children covered by public health insurance at birth among those in the overall population of children born in 2002, referred formaltreatment, substantiated as victims, and entering foster care (by race, ethnicity, and maternal nativity). Notes. 1. Pop. = percentage of children born inCalifornia in 2002 who were covered by public health insurance at birth. 2. Referral = percentage of children referred for maltreatment before the age of 5wwa
tnp
eot(d
P
ofiWUcceGafr
C
ca
ho were covered by public insurance at birth. 3. Subst. = percentage of children with a substantiated allegation of maltreatment before the age of 5 whoere covered by public insurance at birth. 4. Placed = percentage of children placed in foster care before the age of 5 who were covered by public insurance
t birth.
he prevalence of teen births was highest among U.S.-born Latino mothers (19.7%). Overall, what emerged from an exami-ation of covariate distributions for the full birth cohort was a story of pronounced racial/ethnic heterogeneity in risk androtective correlates of child maltreatment.
Publicly insured births. Among the subset of children covered by public insurance at birth, a more consistent picturemerged – variations across racial/ethnic groups were notably attenuated. For example, in the overall birth cohort, the sharef Black mothers with less than a high school degree was more than twice that of White mothers (16.3% vs. 7.3%), yet amonghose covered by public insurance, the proportions were equivalent (25.1% vs. 25.4%). Similarly, late or absent prenatal carei.e., commencing after the first trimester) across racial/ethnic groups was fairly constant among publicly insured births,espite large disparities in the overall cohort.
ublic Health Insurance Coverage
Given the tremendous variation in rates of public insurance coverage by race, ethnicity, and maternal nativity in theverall birth cohort (as reported in Table 1), Fig. 1 presents a closer examination of these dynamics. As reflected in thisgure, among all children born in California in 2002, public insurance coverage at birth ranged from a low of 19.1% amonghite children to a high of 71.3% among Latino children with foreign-born mothers. Black children and Latino children of
.S.-born mothers had fairly comparable rates of public insurance coverage at 48.6% and 46.1%, respectively. Yet, a moreonsistent picture emerges for those children referred for maltreatment: among children reported to CPS, more than 50% ofhildren were covered by public health insurance at birth, independent of race/ethnicity. The prevalence of public insuranceligibility was consistently high across groups when substantiations and entries to foster care were similarly examined.iven the large and fairly racially invariant share of children reported to CPS who were covered by public health insurancet birth, as well as the implications this coverage may have had for surveillance and contact with mandated reporters, weocused our modeling attention on these children, providing unadjusted estimates for the overall birth cohort as a point ofeference to the method commonly used to report aggregate racial disparities.
rude and Adjusted Risk of Referral, Substantiation, and Entry to Foster Care
Please cite this article in press as: Putnam-Hornstein, E., et al. Racial and ethnic disparities: A population-based examination of risk factors for involvement with child protective services. Child Abuse & Neglect (2013),http://dx.doi.org/10.1016/j.chiabu.2012.08.005
Tables 2–4 display the crude rates (per 1,000), risk ratios (RR), and accompanying 95% confidence intervals (95% CI) ofhildren who, before the age of 5: (1) were reported for maltreatment, (2) were substantiated as victims of maltreatment,nd (3) entered an out-of-home foster care placement. These tables also present the corresponding unadjusted statistics for

ARTICLE IN PRESSG Model
CHIABU-2493; No. of Pages 14
6 E. Putnam-Hornstein et al. / Child Abuse & Neglect xxx (2013) xxx– xxx
Table 2California’s 2002 birth cohort: children referred for maltreatment before age 5.
Referred for maltreatment
Full birth cohort (N = 74,182) Public health insurance (N = 48,026)
Rates Crude risk ratios Rates Crude risk ratios Adjusted risk ratios
per 1,000 RR (95% CI) per 1,000 RR (95% CI) RR (95% CI)
Race/ethnicityBlack 300.0 2.24 (2.20, 2.29) 409.8 1.10 (1.07, 1.13) 0.95 (0.92, 0.97)Latino, US-born mother 207.6 1.55 (1.53, 1.58) 297.0 0.80 (0.78, 0.81) 0.72 (0.70, 0.73)Latino, foreign-born mother 107.2 0.80 (0.79, 0.82) 119.2 0.32 (0.31, 0.33) 0.30 (0.29, 0.31)White 133.5 Ref – 383.0 Ref – – –
SexMale 139.8 1.00 ns 211.5 1.00 ns 1.00 nsFemale 139.7 Ref – 211.8 Ref – – –
Birth weightLow (<2,500 g) 186.9 1.37 (1.33, 1.40) 284.6 1.38 (1.34, 1.42) 1.16 (1.12, 1.19)Normal (2,500 g+) 136.5 Ref – 206.6 Ref – – –
Prenatal careNone 488.5 3.92 (3.70, 4.13) 550.7 2.80 (2.67, 2.94) 1.48 (1.41, 1.56)3rd trimester 253.9 2.04 (1.96, 2.11) 280.2 1.42 (1.37, 1.48) 1.15 (1.11, 1.19)2nd trimester 222.8 1.79 (1.75, 1.82) 263.6 1.34 (1.31, 1.37) 1.10 (1.08, 1.12)1st trimester 122.7 Ref – 194.8 Ref – – –
Birth abnormality1+ abnormality 172.7 1.26 (1.22, 1.29) 284.7 1.37 (1.33, 1.41) 1.09 (1.06, 1.12)None 137.6 Ref – 207.1 Ref – – –
Maternal age at birth<20 yrs 256.6 2.75 (2.69, 2.81) 257.6 1.33 (1.30, 1.36) 1.59 (1.54, 1.63)20–24 yrs 189.5 2.03 (1.99, 2.07) 219.7 1.13 (1.11, 1.16) 1.21 (1.18, 1.23)25–29 yrs 125.6 1.35 (1.32, 1.37) 190.1 0.98 ns 1.03 (1.01, 1.05)30+ yrs 93.2 Ref – 193.5 Ref – – –
Maternal education<12th grade 200.7 4.40 (4.28, 4.53) 205.5 1.97 (1.85, 2.10) 1.96 (1.85, 2.10)12th grade 179.3 3.93 (3.82, 4.04) 235.2 2.26 (2.12, 2.41) 1.67 (1.58, 1.79)Some college 114.3 2.51 (2.43, 2.59) 205.3 1.97 (1.84, 2.11) 1.46 (1.37, 1.57)College+ 33.7 Ref – 104.1 Ref – – –
PaternityMissing 343.6 2.77 (2.73, 2.81) 359.4 1.95 (1.92, 1.98) 1.48 (1.46, 1.51)Established 124.0 Ref – 184.2 Ref – – –
Children born to motherThree children 207.4 1.96 (1.93, 1.99) 278.8 1.71 (1.67, 1.74) 2.22 (2.17, 2.27)Two children 118.7 1.12 (1.10, 1.14) 190.8 1.17 (1.14, 1.19) 1.44 (1.41, 1.47)One child 105.6 Ref – 163.1 Ref – – –
Notes. “Adjusted risk ratios” have been adjusted for race/ethnicity, sex, birth weight, prenatal care, birth abnormality, maternal age at birth, maternaleducation, paternity, and the number of children born.
children whose births were covered by public health insurance. Additionally, we included a fully adjusted model for childrencovered by public health insurance as our best attempt to identify the relative risk of CPS involvement for socioeconomicallysimilar Black, Latino, and White children. Our adjusted model includes: race/ethnicity, sex, birth weight, prenatal care, birthabnormality, maternal age at birth, maternal education, paternity, and the number of children born.
Prevalence of CPS involvement. Approximately 14% (n = 74,182) of children in the birth cohort were reported to CPS;37.5% (n = 27,805) of referred children were substantiated as victims at least once before the age of 5. In the overall birthcohort, 2.2% (n = 11,777) of children entered foster care before age 5, representing a placement prevalence of 15.9% of allreported children and 42.4% of all substantiated child victims. Among children covered by public health insurance at birth,21.2% (n = 48,026) were referred for maltreatment and 40.5% (n = 19,342) of referred children were substantiated as victims.Nearly 4% (n = 8,672) of publicly insured children entered foster care before the age of 5 – reflecting 18.1% of referred childrenand 44.6% of substantiated victims.
Fig. 2 charts the cumulative percentage of children’s CPS involvement by race, ethnicity, and maternal nativity. For each
Please cite this article in press as: Putnam-Hornstein, E., et al. Racial and ethnic disparities: A population-based examination of risk factors for involvement with child protective services. Child Abuse & Neglect (2013),http://dx.doi.org/10.1016/j.chiabu.2012.08.005
racial/ethnic grouping, we calculated the proportion of children in the overall birth cohort who were referred, substantiated,and entered foster care, as well as the comparable statistics for those who met the income threshold for public health insur-ance. Data for the overall birth cohort indicate systematic racial differences in SES. Notable are the diminished differencesacross racial/ethnic groups for children similarly covered by public health insurance. Risk differences are starkest between

ARTICLE IN PRESSG Model
CHIABU-2493; No. of Pages 14
E. Putnam-Hornstein et al. / Child Abuse & Neglect xxx (2013) xxx– xxx 7
Table 3California’s 2002 birth cohort: substantiated victims of maltreatment before age 5.
Substantiated as a victim of maltreatment
Full birth cohort (N = 27,805) Public health insurance (N = 19,432)
Rates Crude risk ratios Rates Crude risk ratios Adjusted risk ratios
per 1,000 RR (95% CI) per 1,000 RR (95% CI) RR (95% CI)
Race/ethnicityBlack 118.4 2.19 (2.11, 2.27) 172.7 0.97 ns 0.79 (0.76, 0.83)Latino, US-born mother 84.0 1.55 (1.51, 1.60) 129.6 0.73 (0.71, 0.75) 0.65 (0.63, 0.67)Latino, foreign-born mother 31.5 0.58 (0.56, 0.60) 36.3 0.20 (0.20, 0.21) 0.19 (0.18, 0.19)White 54.3 Ref – 183.6 Ref – – –
SexMale 57.5 1.00 ns 85.6 1.00 ns 1.00 nsFemale 57.3 Ref – 85.7 Ref – – –
Birth weightLow (<2,500 g) 95.3 1.74 (1.68, 1.80) 140.5 1.71 (1.64, 1.79) 1.33 (1.28, 1.40)Normal (2,500 g+) 54.8 Ref – 81.9 Ref – – –
Prenatal careNone 407.4 8.67 (8.24, 9.13) 410.1 5.53 (5.18, 5.91) 2.31 (2.15, 2.48)3rd trimester 148.1 3.15 (3.00, 3.32) 145.0 1.95 (1.84, 2.07) 1.45 (1.37, 1.53)2nd trimester 112.0 2.38 (2.32, 2.45) 121.3 1.64 (1.58, 1.69) 1.26 (1.22, 1.30)1st trimester 45.5 Ref – 72.5 Ref – – –
Birth abnormality1+ abnormality 86.3 1.55 (1.50, 1.62) 138.3 1.68 (1.61, 1.76) 1.14 (1.09, 1.20)None 55.5 Ref – 82.4 Ref – – –
Maternal age at birth<20 yrs 116.2 3.20 (3.09, 3.31) 100.4 1.23 (1.18, 1.28) 1.41 (1.34, 1.49)20–24 yrs 82.7 2.27 (2.21, 2.34) 88.5 1.08 (1.05, 1.12) 1.13 (1.09, 1.17)25–29 yrs 49.9 1.37 (1.33, 1.42) 76.5 0.94 (0.90, 0.97) 0.99 ns30+ yrs 36.3 Ref – 81.6 Ref – – –
Maternal education<12th grade 92.5 6.28 (5.98, 6.59) 84.1 2.46 (2.19, 2.76) 2.69 (2.40, 3.02)12th grade 76.1 5.16 (4.92, 5.42) 95.8 2.80 (2.49, 3.15) 2.06 (1.83, 2.31)Some college 39.8 2.70 (2.56, 2.86) 76.7 2.24 (1.99, 2.53) 1.62 (1.44, 1.82)College+ 8.4 Ref – 34.2 Ref – – –
PaternityMissing 204.0 4.32 (4.21, 4.43) 177.0 2.57 (2.51, 2.65) 1.77 (1.72, 1.82)Established 47.2 Ref – 68.6 Ref – – –
Children born to motherThree children 97.7 2.51 (2.44, 2.58) 122.4 2.04 (1.17, 1.26) 2.56 (2.46, 2.67)Two children 44.7 1.15 (1.11, 1.19) 73.2 1.22 (1.97, 2.10) 1.52 (1.34, 1.49)
Ne
Bbi(ot
acnetcr
rp
One child 38.6 Ref – 59.8 Ref – – –
otes. “Adjusted risk ratios” have been adjusted for race/ethnicity, sex, birth weight, prenatal care, birth abnormality, maternal age at birth, maternalducation, paternity, and the number of children born.
lack and White children. Thirty percent of all Black children born in California’s 2002 birth cohort were referred for possi-le abuse or neglect by age 5, versus only 13.4% of White children. Yet, when only those children covered by public health
nsurance are considered, we find a fairly small cumulative risk difference in CPS referrals between Black (41.0%) and White38.3%) children. Similarly, whereas nearly 12% of Black children born in California were substantiated as victims of abuser neglect before age 5, this is true of only 5.4% of White children. Among recipients of public health insurance, however,he proportions were close to equivalent, with 17.3% and 18.4% of Black and White children substantiated, respectively.
Racial variations in risk and protective factors. As displayed in Table 2 through 4, there were statistically significant (p < .05)nd substantive variations in the relative risk of CPS contact for all covariates, with the exception of child gender. Largelyonsistent gradations in crude risk ratios were observed both within each covariate (i.e., from one variable value level to theext), and with increasing penetration into the CPS system (i.e., from referral to substantiation to entry into foster care). Forxample, children in the full birth cohort with low birth weight were 1.37 times more likely to be referred for maltreatmenthan those weighing 2,500 g or more (Table 2). This risk differential increased with CPS involvement: low birth weighthildren were 1.74 times more likely to be substantiated (Table 3) and 2.18 times more likely to enter foster care (Table 4),
Please cite this article in press as: Putnam-Hornstein, E., et al. Racial and ethnic disparities: A population-based examination of risk factors for involvement with child protective services. Child Abuse & Neglect (2013),http://dx.doi.org/10.1016/j.chiabu.2012.08.005
elative to their normal weight peers.Similarly, prenatal care that began during the first trimester of pregnancy was a protective factor associated with reduced
isk of a child’s report for maltreatment, substantiation, and entry to foster care. Children in the full birth cohort whoserenatal care began during the second trimester were 1.79 times as likely to be referred as those whose care commenced

ARTICLE IN PRESSG Model
CHIABU-2493; No. of Pages 14
8 E. Putnam-Hornstein et al. / Child Abuse & Neglect xxx (2013) xxx– xxx
Table 4California’s 2002 birth cohort: children entering foster care before age 5.
Entered an out-of-home foster care placement
Full birth cohort (N = 11,777) Public health insurance (N = 8,672)
Rates Crude risk ratios Rates Crude risk ratios Adjusted risk ratios
per 1,000 RR (95% CI) per 1,000 RR (95% CI) RR (95% CI)
Race/ethnicityBlack 62.4 2.57 (2.44, 2.71) 95.4 1.07 ns 0.81 (0.76, 0.86)Latino, US-born mother 37.5 1.55 (1.48, 1.62) 61.0 0.68 (0.65, 0.72) 0.62 (0.59, 0.70)Latino, foreign-born mother 8.6 0.35 (0.33, 0.37) 9.9 0.11 (0.10, 0.12) 0.10 (0.09, 0.11)White 24.2 Ref – 92.4 Ref – – –
SexMale 22.4 1.03 ns 38.7 1.02 ns 1.02 nsFemale 21.7 Ref – 37.7 Ref – – –
Birth weightLow (<2,500 g) 44.6 2.18 (2.06, 2.29) 77.2 2.17 (2.04, 2.31) 1.53 (1.43, 1.64)Normal (2,500 g+) 20.5 Ref – 35.5 Ref – – –
Prenatal careNone 232.2 14.66 (12.9, 16.6) 274.6 9.98 (8.54, 11.65) 2.88 (2.61, 3.19)3rd trimester 69.8 4.19 (3.71, 4.72) 79.6 2.47 (2.15, 2.85) 1.74 (1.61, 1.89)2nd trimester 48.4 2.91 (2.71, 3.12) 61.8 1.99 (1.83, 2.16) 1.46 (1.39, 1.54)1st trimester 15.5 Ref – 29.1 Ref – – –
Birth abnormality1+ abnormality 39.9 1.91 (1.81, 2.02) 74.3 2.07 (1.94, 2.20) 1.18 (1.10, 1.27)None 20.9 Ref – 36.0 Ref – – –
Maternal age at birth<20 yrs 41.1 2.80 (2.65, 2.95) 43.0 1.08 (1.01, 1.15) 1.14 (1.05, 1.23)20–24 yrs 30.6 2.09 (1.99, 2.18) 38.2 0.96 ns 0.95 ns25–29 yrs 19.0 1.30 (1.23, 1.36) 33.7 0.85 (0.77, 0.93) 0.89 (0.84, 0.94)30+ yrs 14.7 Ref – 39.7 Ref – – –
Maternal education<12th grade 36.2 19.71 (17.23, 22.54) 37.2 2.91 (2.40, 3.52) 3.50 (2.90, 4.24)12th grade 28.9 15.74 (13.75, 18.01) 43.7 3.42 (2.82, 4.14) 2.45 (2.04, 2.97)Some college 12.9 7.03 (6.10, 8.10) 31.6 2.47 (2.02, 3.02) 1.71 (1.40, 2.08)College+ 1.2 Ref – 12.8 Ref – – –
PaternityMissing 96.3 6.60 (6.37, 6.84) 102.1 3.88 (3.72, 4.04) 2.28 (2.11, 2.46)Established 14.6 Ref – 26.3 Ref – – –
Children born to motherThree children 39.4 2.82 (2.70, 2.94) 58.5 2.37 (2.25, 2.50) 2.67 (2.39, 2.97)Two children 15.9 1.14 (1.08, 1.20) 30.7 1.25 (1.17, 1.32) 1.60 (1.44, 1.78)One child 13.7 Ref – 24.3 Ref – – –
Notes. “Adjusted risk ratios” have been adjusted for race/ethnicity, sex, birth weight, prenatal care, birth abnormality, maternal age at birth, maternal
education, paternity, and the number of children born.during the first trimester, whereas those with prenatal care that began during the third trimester or not at all were 2.04 and3.92 times as likely to have been referred, respectively. The risk disparities were even starker for substantiations and entriesto foster care. Children without any prenatal care were 14.66 times as likely to have entered foster care by the age of 5 asthose with first-trimester care.
Crude and adjusted models for publicly insured births. Across all three levels of CPS system contact, crude racial/ethnic dis-parities were significantly attenuated upon stratification by public health insurance coverage. These disparities diminishedfurther upon inclusion of covariates (see Fig. 3 and the adjusted risk columns in Tables 2–4), such that the relative risk ofreferral, substantiation, and entry to foster care was significantly lower for Black and Latino children compared with theWhite reference group. After adjusting for covariates in the public health insurance model, Black children were less likelythan other sociodemographically similar White children to be referred for maltreatment (RR: 0.95; 95% CI [0.92, 0.97]),substantiated as victims (RR: 0.79; 95% CI [0.76, 0.83]), or placed in foster care (RR: 0.81; 95% CI [0.76, 0.86]). Latino childrenhad a consistently lower risk of referral, substantiation, and placement in foster care regardless of covariate adjustments or
Please cite this article in press as: Putnam-Hornstein, E., et al. Racial and ethnic disparities: A population-based examination of risk factors for involvement with child protective services. Child Abuse & Neglect (2013),http://dx.doi.org/10.1016/j.chiabu.2012.08.005
maternal nativity. Among Latino children, risk across all three levels of contact with CPS was significantly lower for childrenof foreign-born mothers than those with U.S.-born mothers, both before and after adjusting for other risk and protectivefactors at birth.

Please cite this article in press as: Putnam-Hornstein, E., et al. Racial and ethnic disparities: A population-based examination of risk factors for involvement with child protective services. Child Abuse & Neglect (2013),http://dx.doi.org/10.1016/j.chiabu.2012.08.005
ARTICLE IN PRESSG Model
CHIABU-2493; No. of Pages 14
E. Putnam-Hornstein et al. / Child Abuse & Neglect xxx (2013) xxx– xxx 9
Fig. 2. Cumulative percentage of children referred, substantiatiated, and entering foster care by age 5 in the overall birth cohort vs. those covered by publichealth insurance at birth (by race, ethnicity, and maternal nativity). Notes: 1. “All” refers to the overall population of children in the 2002 birth cohort. 2.“Public” refers to those children covered by public health insurance at birth.
0.950.79 0.81referral
subst. placement*** ******
0.72 0.66 0.62referral subst. placement
*** *** ***
0.30
0.19
0.10
referral
subst.
***
***
***
Black(vs. White)
Latino, U.S.-born mother(vs. White)
Latino, foreign-born m other(vs. White)
placement
RR 95 % Confidence Interval
Fig. 3. Adjusted relative risk of referral, substantiation, and foster care placement by age 5 among children covered by public health insurance at birth(by race, ethnicity, and maternal nativity vs. White children). Notes. 1. *p < .05; **p < .01; ***p < .001. 2. Risk ratios for referral, substantiation, and foster careplacement are plotted relative to the risk observed for White children (i.e., the line value of 1.0). 3. Covariate adjustments made for child sex, birth weight,prenatal care, birth abnormality, maternal age, maternal education, paternity, and number of children born to mother.

G Model
ARTICLE IN PRESSCHIABU-2493; No. of Pages 1410 E. Putnam-Hornstein et al. / Child Abuse & Neglect xxx (2013) xxx– xxx
Discussion
The purpose of this study was to advance an understanding of the interplay between race/ethnicity, maternal birthplace, and indicators of SES and health in order to determine the extent to which individual and family-level risk andprotective factors contribute to aggregate variations in rates of CPS involvement. Our first objective was to assess whethercrude Black/White CPS disparities were attributable to the distribution of risk and protective factors observed at birth.Findings both supported and contradicted well-established understandings of racial disparities. Consistent with publisheddata reflecting aggregate racial differences (Needell et al., 2012; Putnam-Hornstein, 2012), these population-based dataindicated that between birth and age five, Black children in California were more than twice as likely as White childrento: (1) be referred for maltreatment, (2) be substantiated as victims, and (3) enter foster care. Yet, an examination of thedistribution of risk and protective factors at birth highlighted corresponding disparities for many well-established correlatesof child maltreatment and CPS involvement, including low SES, young maternal age, absent fathers, and poor child health.Black children were born with a significantly higher concentration of correlates of child maltreatment compared to theirWhite (and Latino) counterparts. Previous research has demonstrated that controlling for SES diminishes or even reversesBlack/White disparities, both at the individual (Ards, Myers, Chung, Malkis, & Hagerty, 2003; Ards, Myers, Malkis, Sugrue, &Zhou, 2003; Dettlaff, Rivaux, Baumann, Fluke, Rycraft, & James, 2011; Dworsky, Courtney, & Zinn, 2007; Slack et al., 2007)and neighborhood/county level (Drake et al., 2009; Wulczyn, Gibbons, Snowden, & Lery, 2013). When adjustments for thesecorrelates were modeled, we found that low SES Black children were significantly less likely than low SES White children to bereferred, substantiated, or enter foster care. Although observed Black/White racial disparities in aggregate statistics are veryreal, these data suggest that race/ethnicity may not be the most salient factor, but rather a proxy for entrenched and systemicracial differences in the prevalence of other correlates of child maltreatment. This finding has important implications forefforts to reduce racial disparities.
A second objective of this study was to determine if an epidemiologic health paradox exists in referral, substantiation,and foster care placements between Latinos and Whites based on protective effects associated with maternal nativity. InCalifornia, there have been minimal or nonexistent Latino/White disparities documented (Needell et al., 2012), an unexpectedfinding given that Latinos have a socioeconomic profile more consistent with Black than White families (Putnam-Hornstein& Needell, 2011). The term epidemiologic or health paradox typically refers to a pattern of morbidity and/or mortality for aparticular group (e.g., Latinos, immigrants) at odds with expectations based on the group’s socioeconomic profile (Acevedo-Garcia & Bates, 2007). Health paradoxes have been observed among Latinos and immigrants for several health outcomes,including maternal and child health indicators such as low birth weight and infant mortality (Franzini, Ribble, & Keddie,2001; Hayes-Bautista, 2002; Jasso, Massey, Rosenzweig, & Smith, 2004; Palloni & Arias, 2004; Palloni & Morenoff, 2001).
Data from our study indicated that the absence of aggregate Latino/White racial disparities in California statistics reflectsdivergent risks by maternal nativity. Before adjusting for any risk or protective factors, Latino children with U.S.-born motherswere referred, substantiated, and entered foster care at roughly 1.55 times the rate of White children. In contrast, Latinochildren with foreign-born mothers were involved with the CPS system at .20 to .65 the rate of White children. Uponcontrolling for socioeconomic and health indicators, and in keeping with what was observed for Black/White disparity, riskdifferences reversed for Latino children of U.S.-born mothers (i.e., low SES Latino children were less likely to be referred,substantiated, or enter foster care than low SES white children) and became even more extreme for children of foreign-bornmothers.
Possible explanations for Latino epidemiologic paradoxes have not been subject to rigorous empirical testing, largelydue to the interplay of conceptual and data limitations. In the context of child maltreatment, only a handful of studies haveattempted to broach the topic (Dettlaff, Earner, & Phillips, 2009; Dettlaff & Johnson, 2011; Johnson-Motoyama, Dettlaff,& Finno, 2012; Osterling & Han, 2011; Vericker, Kuehn, & Capps, 2007). Health paradoxes have been widely attributedto social and cultural protective factors present among Latinos (e.g., familism, religiosity, social support) and immigrants(e.g., strong social network ties and salutary health behavior), associated with health advantages (Alegría, Mulvaney-Day,Torres, Polo, Cao, & Canino, 2007; Grant, Stinson, Hasin, Dawson, Chou, & Anderson, 2004; McGuire & Miranda, 2008; Vega,Alderete, Kolody, & Aguilar-Gaxiola, 1998). Identification with Latino cultural values and beliefs appear to play a role inthese protective processes (De La Rosa, 2002; Holleran & Waller, 2003). This social-cultural explanation is often presentedin association with an acculturation hypothesis that predicts an erosion of protective factors with time spent in the UnitedStates and across generations, resulting in the deterioration of health outcomes.
This socio-cultural explanation, coupled with an acculturation hypothesis, largely comports with the results from ouranalysis. Findings suggest that although Latino children of foreign-born mothers are born into lower socioeconomic con-ditions than their White counterparts, as reflected by high levels of public health insurance eligibility and low levels ofmaternal educational attainment, a number of protective factors – including paternal presence at birth, older maternal age,healthy birth weight, and low rates of birth abnormalities – may offset the risks typically associated with the utilizationof means-tested public health insurance programs. Likewise, while protective factors are attenuated for Latino children ofU.S.-born mothers when compared with children of foreign-born mothers, we observed significant differences in the distri-
Please cite this article in press as: Putnam-Hornstein, E., et al. Racial and ethnic disparities: A population-based examination of risk factors for involvement with child protective services. Child Abuse & Neglect (2013),http://dx.doi.org/10.1016/j.chiabu.2012.08.005
bution of risk and protective factors for Latino children of U.S.-born mothers relative to Black and White children, consistentwith the broader maternal and child health literature. Although it is unknown whether what has been measured as pater-nity establishment, child health advantages, and maternal age actually protect against maltreatment and CPS involvement,or simply reflect other unobserved maternal and familial attributes associated with the selection of foreign-born mothers

G Model
C
imso
L
oal&ifwmibvpair
mPlOii2Lrpfg
paCtcar
I
vuUwf
ifRbtSp
ARTICLE IN PRESSHIABU-2493; No. of Pages 14
E. Putnam-Hornstein et al. / Child Abuse & Neglect xxx (2013) xxx– xxx 11
nto the United States, Latino children appear to benefit from an increased likelihood of being born with these conditionset. Benefits that may differentially accrue for Latino children, especially children of foreign-born mothers, is of particular
alience given the implications this has for disentangling etiologic risk factors for maltreatment, as well as the identificationf markers for targeted interventions.
imitations
Despite the strengths of this large, population-based, longitudinal examination of children born in California, a numberf limitations must be considered when interpreting findings. Limitations are primarily related to the use of state-specificdministrative data, which not only restricts the generalizability of findings, but is also accompanied by a number of estab-ished shortcomings, including variables that are narrow in scope and errant or missing record entries (Brady, Grand, Powell,
Schink, 2002; Drake & Jonson-Reid, 1999). During the creation of the linked dataset, 16% of CPS records meeting linkagenclusionary criteria were not matched to a birth record (Putnam-Hornstein et al., 2011). Although some may have been truealse negatives, reflecting children born in another state and then referred for maltreatment in California, some matchesere certainly missed. Our birth cohort analysis was unable to account for children born in California who may have died oroved to another state. Although we were able to control for a range of sociodemographic covariates, such as public health
nsurance eligibility and paternity, these covariates were captured at birth and may have changed over time, accompaniedy corresponding changes in a child’s risk profile. By and large, the covariates we were able to measure were merely proxyariables for more complex dynamics we would have ideally measured (e.g., public health insurance as a proxy for income;aternity as a proxy for the likelihood of unrelated male caregivers in the home). Finally, it should be noted that our findingsre specific to racial disparities observed at the front-end of the system among young children under the age of five – thenfluence of socioeconomic status and other risk factors may be different for older children, or once children have beenemoved from the home.
We were unable to rule out the possibility that these data reflect a systematic undercount of Latino births to foreign-bornothers stemming from a series of initiatives directed at immigrant eligibility for public services. Specifically, California
roposition 187, a 1994 ballot initiative that sought to prohibit undocumented residents from accessing health care, pub-ic education, and other social services in the state (Gibbs & Bankhead, 2001), and the Personal Responsibility and Workpportunity Reconciliation Act of 1996, which restricted the eligibility of undocumented immigrants, as well as many legal
mmigrants, for various public programs. National and local evaluations suggest that the eligibility restrictions embeddedn these initiatives successfully reduced participation of immigrant families in public programs (Borjas, 2011; Fix & Passel,002; Zimmerman & Fix, 1998). The “chilling effect” of these complex reforms may have led to a potential undercount ofatino children with foreign-born mothers in vital statistics records while simultaneously reducing exposure to mandatedeporters. In California, more than three quarters of maltreatment referrals involving children under the age of 5 arise fromrofessional service providers (Needell et al., 2012). The differential access and utilization of health, social services, andormal child care among immigrant Latinos suggests patterns of involvement with professionals that may differ from otherroups (Flores et al., 2002; Karoly & Gonzalez, 2011).
Additionally, we cannot rule out biases that may arise from the differential mobility of racial/ethnic groups in California,articularly Latinos. In modeling group differences in the risk of referral, substantiation, and entries to foster care, wessumed that we were able to consistently capture contacts with the CPS system through each child’s fifth birthday. Inalifornia, 84.3% of Latinos are of Mexican origin, and many Mexican immigrants cross the U.S.-Mexico border throughouthe year in seasonal patterns that correspond with U.S. labor demand (Dockterman, 2011; Passel & Cohn, 2009). Latinohildren, particularly those with foreign-born mothers, may be at lower risk for CPS involvement when compared to Whitesnd children of native-born Latino mothers due to these migration patterns, which increase the likelihood of out-of-stateesidence and therefore limit the exposure window.
mplications for Practice and Policy
Our work raises more questions than it answers. It is readily apparent that crude racial disparity risk ratios mask importantariations in correlates of child abuse and neglect. It is striking that only 19% of White children in California’s birth cohorttilized public health insurance at birth, a surrogate marker of low SES, whereas nearly half of Black and Latino children of.S.-born mothers (with a still higher proportion among Latinos with foreign-born mothers) utilized public insurance. Buthy these racial variations in the correlates of maltreatment are observed – and whether they hold the same implications
or child safety and well-being across racial/ethnic groups – is complex.Parenting in a resource-deprived environment does not bode well for child development, well-being, or child safety. So
t is perhaps not surprising that this and other studies have found that most children who are reported to CPS are born intoamilies with limited economic, social, and human resources (Coulton, Crampton, Irwin, Spilsbury, & Korbin, 2007; Jonson-eid et al., 2009; Sedlak et al., 2010; U.S. Department of Health and Human Services, 2011). Yet, the reasons that a family may
Please cite this article in press as: Putnam-Hornstein, E., et al. Racial and ethnic disparities: A population-based examination of risk factors for involvement with child protective services. Child Abuse & Neglect (2013),http://dx.doi.org/10.1016/j.chiabu.2012.08.005
e poor, and the degree to which those reasons for poverty correlate with parenting capacity and child risk, are manifold. Ifhe antecedent reasons for poverty differ by race/ethnicity, as Drake et al. (2009) have suggested, then the measures of lowES used in this analysis may serve as proxies for different latent risk factors for child maltreatment. Among White mothers,ublic health insurance, low education, the absence of established paternity, and late or absent prenatal care may be fairly

G Model
ARTICLE IN PRESSCHIABU-2493; No. of Pages 1412 E. Putnam-Hornstein et al. / Child Abuse & Neglect xxx (2013) xxx– xxx
direct measures of maternal and familial characteristics and behaviors that place a child at risk of maltreatment. Yet, amongBlack and Latino mothers, these measures of poverty and resources may be confounded by systemic, non-maternal barriersto economic opportunities, and therefore less predictive of a child’s risk of maltreatment. Further differential sorting mayoccur based on maternal nativity.
This hypothesis is partly supported by data from the National Surveys of Child and Adolescent Well-being (NSCAW),population-based studies of children and families involved in the CPS system in the United States. When compared toWhites, Black and Latino caregivers who participated in the NSCAW II had a lower prevalence of alcohol abuse and seriousmental health or emotional problems. Within the Latino population, immigrant Latino caregivers were significantly lesslikely to engage in active alcohol and/or drug abuse (Dettlaff et al., 2009; Dettlaff & Johnson, 2011; Johnson-Motoyama et al.,2012) and to have physical, intellectual, or cognitive impairments (Dettlaff et al., 2009) when compared to their U.S.-borncounterparts. If there is a “differential sorting” of Blacks, Latinos, and Whites by socioeconomic status, then the absence orreversal of observed racial differences following risk adjustments should not be interpreted as an indication that there is nobias in the racial distribution of children who have contact with the child protection system in California. We have no basisfor claiming that these data indicate children of all races/ethnicities are being treated equally by CPS. Nor can we argue thataggregate disparities suggest that one or more groups are being treated unfairly.
Our findings do, however, suggest research that examines racial disparities, but ignores the role of the socioeconomicconditions into which a child is born, is incomplete at best. The association between race and CPS involvement is stronglyconfounded by socioeconomic differences; studies that lack even the crudest indicators of SES deliver results that havelimited application in the practice and policy arena. Increasing attention is now being paid to the reduction and eventualelimination of racial disparities (Black/White racial disparities, in particular) (Bartholet, 2009; Wulczyn, 2009). Legislators,foundations, and even courts have implemented or are considering interventions to address racial disparities. Yet, many ofthese interventions focus primarily on the detection and amelioration of biased decision-making on the part of mandatedand community reporters, staff, judges, and others who come in contact with children and families. Our findings suggestthat although working to address these biases is in no way inappropriate, these efforts, in isolation, are unlikely to achievethe desired effects. If we want overall Black/White disparity ratios to change, it would appear that poverty and its correlatesmust also be the targets of our efforts.
Summary
In the United States, racial disparity discussions have been largely based on ecological data which correctly demonstratethat, in aggregate, Black children are disproportionately represented among children referred for maltreatment, substan-tiated as victims, and entering foster care. Yet, population-based, individual data used in this study suggests that the riskof referral, substantiation, and entry to foster care for individual children is far more dependent on the presence of multi-ple risk factors at birth and the socioeconomic conditions into which they are born than race/ethnicity. Although far fromprecluding the role of racial bias, the results of this California study point to real racial/ethnic differences in maltreatmentrisk as an important contributor to observed disparities. Our findings indicate that efforts to reduce racial/ethnic disparitiesmust consider the role of children’s differential exposure to risk factors associated with maltreatment.
References
Acevedo-Garcia, D., & Bates, L. M. (2007). Latino health paradoxes: Empirical evidence, explanations, future research and implications. In H. Rodríguez, R.Sáenz, & C. Menjívar (Eds.), Latinas/os in the United States: Changing the face of America (pp. 101–113). New York, NY: Springer.
Alegría, M., Mulvaney-Day, N., Torres, M., Polo, A., Cao, Z., & Canino, G. (2007). Prevalence of psychiatric disorders across Latino subgroups in the UnitedStates. American Journal of Public Health, 97(1), 68–75. http://dx.doi.org/10.2105/AJPH. 2006.087205s
Ards, S. D., Myers, S. L., Jr., Chung, C., Malkis, A., & Hagerty, B. (2003). Decomposing Black-White differences in child maltreatment. Child Maltreatment, 8(2),112–121. http://dx.doi.org/10.1177/1077559502250817
Ards, S. D., Myers, S. L., Jr., Malkis, A., Sugrue, E., & Zhou, L. (2003). Racial disproportionality in reported and sustained child abuse and neglect: An examinationof systematic bias. Children and Youth Services Review, 25(5/6), 375–392. http://dx.doi.org/10.1016/S0190-7409(03)00027-6
Bartholet, E. (2009). The racial disproportionality movement in child welfare: False facts and dangerous directions. Arizona Law Review, 51, 871–932.Berger, L. M. (2005). Income, family characteristics, and physical violence toward children. Child Abuse & Neglect, 29(2), 107–133.
http://dx.doi.org/10.1016/j.chiabu.2004.02.006Berger, L. M., Paxson, C., & Waldfogel, J. (2009). Mothers, men, and child protective services involvement. Child Maltreatment, 14(3), 263–276.
http://dx.doi.org/10.1177/1077559509337255Borjas, G. J. (2011). Poverty and program participation among immigrant children. Future of Children, 21(1), 247–266.Brady, H. E., Grand, S. A., Powell, M. A., & Schink, W. (2002). Access and confidentiality issues with administrative data. In M. Ver Ploeg, R. A. Moffit, & C. F.
Citro (Eds.), Studies of welfare populations: Data collection and research issues (pp. 220–274). Washington, DC: National Academy Press.Coulton, C. J., Crampton, D. S., Irwin, M., Spilsbury, J. C., & Korbin, J. E. (2007). How neighborhoods influence child maltreatment: A review of the literature
and alternative pathways. Child Abuse & Neglect, 31(11/12), 1117–1142. http://dx.doi.org/10.1016/j.chiabu.2007.03.023Coulton, C. J., Korbin, J. E., Su, M., & Chow, J. (1995). Community level factors and child maltreatment rates. Child Development, 66(5), 1262–1276.
http://dx.doi.org/10.1111/j.1467-8624.1995.tb00934.xDe La Rosa, M. (2002). Acculturation and Latino adolescents’ substance use: A research agenda for the future. Substance Use & Misuse, 37(4),
Please cite this article in press as: Putnam-Hornstein, E., et al. Racial and ethnic disparities: A population-based examination of risk factors for involvement with child protective services. Child Abuse & Neglect (2013),http://dx.doi.org/10.1016/j.chiabu.2012.08.005
429–456.Dettlaff, A. J., Earner, I., & Phillips, S. D. (2009). Latino children of immigrants in the child welfare system: Prevalence, characteristics, and risk. Children and
Youth Services Review, 31(7), 775–783. http://dx.doi.org/10.1016/j.childyouth.2009.02.004Drake, B., & Rank, M. R. (2009). The racial divide among American children in poverty: Reassessing the importance of neighborhood. Children and Youth
Services Review, 31(12), 1264–1271. http://dx.doi.org/10.1016/j.childyouth.2009.05.012

G Model
C
D
D
DD
D
D
D
D
FF
FGG
H
H
J
J
J
KMM
M
M
N
N
O
PP
P
PP
P
P
SSS
S
SS
S
U
U
U
ARTICLE IN PRESSHIABU-2493; No. of Pages 14
E. Putnam-Hornstein et al. / Child Abuse & Neglect xxx (2013) xxx– xxx 13
ettlaff, A. J., & Johnson, M. A. (2011). Child maltreatment dynamics among immigrant and U.S. born Latino children: Findings from the National Survey ofChild and Adolescent Well-being (NSCAW). Children Youth Services Review, 33(6), 936–944. http://dx.doi.org/10.1016/j.childyouth.2010.12.017
ettlaff, A. J., Rivaux, S. L., Baumann, D. J., Fluke, J. D., Rycraft, J. R., & James, J. (2011). Disentangling substantiation: The influence of race, income, and risk onthe substantiation decision in child welfare. Children and Youth Services Review, 33(9), 1630–1637. http://dx.doi.org/10.1016/j.childyouth.2011.04.005
ockterman, D. (2011). Hispanics of Mexican origin in the United States, 2009. Washington, DC: Pew Hispanic Center.rake, B., Jolley, J. M., Lanier, P., Fluke, J., Barth, R. P., & Jonson-Reid, M. (2011). Racial bias in child protection? A comparison of competing explanations
using national data. Pediatrics, 127(3), 471–478. http://dx.doi.org/10.1542/peds.2010-1710rake, B., & Jonson-Reid, M. (1999). Some thoughts on the increasing use of administrative data in child maltreatment research. Child Maltreatment, 4(4),
308–315. http://dx.doi.org/10.1177/1077559599004004004rake, B., & Jonson-Reid, M. (2011). NIS interpretations: Race and the National Incidence Studies of Child Abuse and Neglect. Children and Youth Services
Review, 33(1).rake, B., Lee, S. M., & Jonson-Reid, M. (2009). Race and child maltreatment reporting: Are Blacks overrepresented? Children and Youth Services Review,
31(3), 309–316. http://dx.doi.org/10.1016/j.childyouth.2008.08.004worsky, A., Courtney, M. E., & Zinn, A. (2007). Child, parent, and family predictors of child welfare services involvement among TANF applicant families.
Children and Youth Services Review, 29(6), 802–820. http://dx.doi.org/10.1016/j.childyouth.2006.12.007ix, M. E., & Passel, J. S. (2002). The scope and impact of welfare reform’s immigrant provisions (Discussion Paper No. 02-03). Washington, DC: Urban Institute.lores, G., Fuentes-Afflick, E., Barbot, O., Carter-Pokras, O., Claudio, L., Lara, M., McLaurin, J. A., Pachter, L., Ramos-Gomez, F., Mendoza, F., Valdez, R. B.,
Villarruel, A. M., Zambrana, R. E., Greenberg, R., & Weitzman, M. (2002). The health of Latino children: Urgent priorities, unanswered questions, and aresearch agenda. Journal of the American Medical Association, 288(1), 82–90.
ranzini, L., Ribble, J. C., & Keddie, A. M. (2001). Understanding the Hispanic paradox. Ethnicity and Disease, 11(3), 496–518.ibbs, J. T., & Bankhead, T. (2001). Preserving privilege: California politics, propositions, and people of color. Westport, CT: Praeger.rant, B. F., Stinson, F. S., Hasin, D. S., Dawson, D. A., Chou, S. P., & Anderson, K. (2004). Immigration and lifetime prevalence of DSM-IV psychiatric disorders
among Mexican Americans and non-Hispanic Whites in the United States: Results from the National Epidemiologic Survey on Alcohol and RelatedConditions. Archives of General Psychiatry, 61(12), 1226–1233.
ayes-Bautista, D. E. (2002). The Latino health research agenda for the twenty-first century. In M. M. Suárez-Orozco, & M. Páez (Eds.), Latinos remakingAmerica (pp. 215–235). Berkeley, CA: University of California Press.
olleran, L. K., & Waller, M. A. (2003). Sources of resilience among Chicano/a youth: Forging identities in the borderlands. Child and Adolescent Social WorkJournal, 20(5), 335–350. http://dx.doi.org/10.1023/A:1026043828866
asso, G., Massey, D. S., Rosenzweig, M. R., & Smith, J. P. (2004). Immigrant health: Selectivity and acculturation. London, England: Institute for Fiscal Studies.http://dx.doi.org/10.1920/wp.ifs.2004.0423
ohnson-Motoyama, M., Dettlaff, A. J., & Finno, M. (2012). Parental nativity and the decision to substantiate: Findings from a study of Latino children in thesecond National Survey of Child and Adolescent Well-being (NSCAW II). Children and Youth Services Review, 34(11), 2229–2239.
onson-Reid, M., Drake, B., & Kohl, P. L. (2009). Is the overrepresentation of the poor in child welfare caseloads due to bias or need? Children and YouthServices Review, 31(3), 422–427. http://dx.doi.org/10.1016/j.childyouth.2008.09.009
aroly, L. A., & Gonzalez, G. C. (2011). Early care and education for children in immigrant families. Future of Children, 21(1), 71–101.cCullagh, P., & Nelder, J. A. (1989). Generalized linear models (2nd ed.). London, England: Chapman & Hall/CRC.cGuire, T. G., & Miranda, J. (2008). New evidence regarding racial and ethnic disparities in mental health: Policy implications. Health Affairs, 27(2), 393–403.
http://dx.doi.org/10.1377/hlthaff.27.2.393urphey, D. A., & Braner, M. (2000). Linking child maltreatment retrospectively to birth and home visit records: An initial examination. Child Welfare, 79(6),
711–728.urphy, J. F., Jenkins, J., Newcombe, R. G., & Sibert, J. R. (1981). Objective birth data and the prediction of child abuse. Archives of Disease in Childhood, 56(4),
295–297. http://dx.doi.org/10.1136/adc.56.4.295eedell, B., & Barth, R. P. (1998). Infants entering foster care compared to other infants using birth status indicators. Child Abuse & Neglect, 22(12), 1179–1187.
http://dx.doi.org/10.1016/S0145-2134(98)00096-9eedell, B., Webster, D., Armijo, M., Lee, S., Dawson, W., Magruder, J., Exel, M., Cuccaro-Alamin, S., Putnam-Hornstein, E., Williams, D., Simon, V., Hamilton,
D., Lou, C., Peng, C., Moore, M., King, B., Henry, C., & Nuttbrock, A. (2012). Child Welfare Services Reports for California. Retrieved April 1, 2012, from theUniversity of California at Berkeley Center for Social Services Research website: http://cssr.berkeley.edu/ucb childwelfare
sterling, K. L., & Han, M. (2011). Reunification outcomes among Mexican immigrant families in the child welfare system. Children and Youth Services Review,33(9), 1658–1666. http://dx.doi.org/10.1016/j.childyouth.2011.04.020
alloni, A., & Arias, E. (2004). Paradox lost: Explaining the Hispanic adult mortality advantage. Demography, 41(3), 385–415.alloni, A., & Morenoff, J. D. (2001). Interpreting the paradoxical in the Hispanic paradox. Annals of the New York Academy of Sciences, 954, 140–174.
http://dx.doi.org/10.1111/j.1749-6632.2001.tb02751.xarrish, J. W., Young, M. B., Perham-Hester, K. A., & Gessner, B. D. (2011). Identifying risk factors for child maltreatment in Alaska: A population-based
approach. American Journal of Preventive Medicine, 40(6), 666–673. http://dx.doi.org/10.1016/j.amepre.2011.02.022assel, J. S., & Cohn, D. (2009). Mexican immigrants: How many come? How many leave? Washington, DC: Pew Hispanic Center.utnam-Hornstein, E. (2012). Preventable injury deaths: A population-based proxy of child maltreatment risk in California. Public Health Reports, 127(2),
163–172.utnam-Hornstein, E., & Needell, B. (2011). Predictors of child protective service contact between birth and age five: An examination of California’s 2002
birth cohort. Children and Youth Services Review, 33(11), 2400–2407. http://dx.doi.org/10.1016/j.childyouth.2011.07.010utnam-Hornstein, E., Webster, D., Needell, B., & Magruder, J. (2011). A public health approach to child maltreatment surveillance: Evidence from a data
linkage project in the United States. Child Abuse Review, 20(4), 256–273. http://dx.doi.org/10.1002/car.1191edlak, A. (1991). National Incidence and Prevalence of Child Abuse and Neglect: 1988. Washington, DC: U.S. Government Printing Office.edlak, A., & Broadhurst, D. (1996). The third national incidence study of child abuse and neglect. Washington, DC: U.S. Government Printing Office.edlak, A. J., McPherson, K., & Das, B. (2010). Supplementary analyses of race differences in child maltreatment rates in the NIS-4. Washington, DC: U.S.
Government Printing Office.edlak, A. J., Mettenburg, J., Basena, M., Petta, I., McPherson, K., Greene, A., & Li, S. (2010). The Fourth National Incidence Study of Child Abuse and Neglect
(NIS-4): Report to Congress. Washington, DC: U.S. Government Printing Office.haw, T. V., Putnam-Hornstein, E., Magruder, J., & Needell, B. (2008). Measuring racial disparity in child welfare. Child Welfare, 87(2), 23–36.lack, K. S., Magnuson, K. A., Berger, L. M., Yoo, J., Coley, R. L., Dunifon, R., Dworsky, A., Kalil, A., Knab, J., & Lohman, B. (2007). Family economic well-
being following the 1996 welfare reform: Trend data from five non-experimental panel studies. Children and Youth Services Review, 29(6), 698–720.http://dx.doi.org/10.1016/j.childyouth.2006.12.002
pencer, N., Wallace, A., Sundrum, R., Bacchus, C., & Logan, S. (2006). Child abuse registration, fetal growth, and preterm birth: A population based study.Journal of Epidemiology & Community Health, 60(4), 337–340. http://dx.doi.org/10.1136/jech.2005.042085
CLA Academic Technology Services: Statistical Consulting Group (n.d.). Stata FAQ: How can I estimate relative risk using glm for common outcomes in cohort
Please cite this article in press as: Putnam-Hornstein, E., et al. Racial and ethnic disparities: A population-based examination of risk factors for involvement with child protective services. Child Abuse & Neglect (2013),http://dx.doi.org/10.1016/j.chiabu.2012.08.005
studies? Retrieved from http://www.ats.ucla.edu/stat/stata/ado/analysis/.S. Department of Health and Human Services. (2011). Child maltreatment 2010 (Report of the Children’s Bureau, Administration on Children, Youth and
Families, Administration for Children and Families). Washington, DC: U.S. Government Printing Office..S. General Accounting Office. (2007). African American children in foster care: Additional HHS assistance needed to help states reduce the proportion in care
(Report No. GAO-07-816). Washington, DC: U.S. Government Printing Office.

G Model
ARTICLE IN PRESSCHIABU-2493; No. of Pages 1414 E. Putnam-Hornstein et al. / Child Abuse & Neglect xxx (2013) xxx– xxx
Vega, W. A., Alderete, E., Kolody, B., & Aguilar-Gaxiola, S. (1998). Illicit drug use among Mexicans and Mexican Americans in California: The effects of genderand acculturation. Addiction, 93(12), 1839–1850. http://dx.doi.org/10.1046/j.1360-0443.1998.931218399.x
Vericker, T., Kuehn, D., & Capps, R. (2007). Latino children of immigrants in the Texas child welfare system. Protecting Children, 22(2), 20–40.Wu, S. S., Ma, C.-X., Carter, R. L., Ariet, M., Feaver, E. A., Resnick, M. B., & Roth, J. (2004). Risk factors for infant maltreatment: A population-based study. Child
Abuse & Neglect, 28(12), 1253–1264. http://dx.doi.org/10.1016/j.chiabu.2004.07.005Wulczyn, F. (2009). Epidemiological perspectives on maltreatment prevention. The Future of Children, 39(2), 39–66.
Please cite this article in press as: Putnam-Hornstein, E., et al. Racial and ethnic disparities: A population-based examination of risk factors for involvement with child protective services. Child Abuse & Neglect (2013),http://dx.doi.org/10.1016/j.chiabu.2012.08.005
Wulczyn, F., Gibbons, R., Snowden, L., & Lery, B. (2013). Poverty, social disadvantage, and the black/white placement gap. Children and Youth Services Review,35(1), 65–74. http://dx.doi.org/10.1016/j.childyouth.2012.10.005
Zimmerman, W., & Fix, M. E. (1998). Declining immigrant applications for Medi-Cal and welfare benefits in Los Angeles County. Washington, DC: Urban Institute.Zou, G. (2004). A modified Poisson regression approach to prospective studies with binary data. American Journal of Epidemiology, 159(7), 702–706.
http://dx.doi.org/10.1093/aje/kwh090