FINSCOPE 2020 THEMATIC REPORT - Access to Finance ...
68
FINSCOPE 2020 THEMATIC REPORT Gender and Financial Inclusion in Rwanda
-
Upload
khangminh22 -
Category
Documents
-
view
3 -
download
0
Transcript of FINSCOPE 2020 THEMATIC REPORT - Access to Finance ...

FINSCOPE 2020 THEMATIC REPORT
Gender and Financial Inclusion in Rwanda

Address:
KG 5 Avenue, House No. 13 Kacyiru
P.O. Box 1599 Kigali
Call Us: +(250) 782-507-751
Email: [email protected]
Website: www://afr.rw
Recommended citation:
Access to Finance Rwanda,
Gender and Financial Inclusion in
Rwanda thematic report- FinScope
2020
Gender thematic report 2020 produced by the Access to Finance Rwanda.
Additional information about FinScope my be obtained from AFR:

i FINSCOPE RWANDA GENDER THEMATIC REPORT 2020
CONTENTS
Executive summary ...................................................................................................................... 1
1. Introduction ....................................................................................................................... 9
1.1. FinScope methodology and survey design ............................................................... 10
1.2. Sampling frame for FinScope Rwanda 2020 survey .............................................. 10
1.3. Sample size and sample allocation ............................................................................. 11
2. Profile of women in Rwanda .......................................................................................12
2.1. Who these women are (demographic data) ............................................................12
2.2. What these women have (education) .......................................................................13
2.3. How and where these women live (geographical distribution and
infrastructure) ..................................................................................................................13
2.4. What they do with what they have (income-generating activities): ................. 14
3. Determinants of financial inclusion ...........................................................................15
3.1. Location/area type ..........................................................................................................15
3.2. Age ..................................................................................................................................... 16
3.3. Education .......................................................................................................................... 18
3.4. Employment and income ............................................................................................. 18
4. Responsible finances ......................................................................................................21
4.1. Consumer empowerment and transparency ............................................................21
4.2. Financial attitudes and behaviour ..............................................................................22
4.3. Financial decision-making ............................................................................................23
4.4. Financial planning ...........................................................................................................24
5. Financial inclusion among women in Rwanda .........................................................25
5.1. Overall levels of financial inclusion ............................................................................25
5.2. Financial services products ever used .......................................................................27
5.3. Satisfaction with financial services products ..........................................................28
5.4. Banking ..............................................................................................................................30
5.5. Mobile money ..................................................................................................................33
5.6. Digital payments .............................................................................................................34
5.7. Savings and investments ..............................................................................................35
5.8. Borrowing and credit .....................................................................................................39
5.9. Informal services .............................................................................................................42
5.10. Insurance and risk mitigation ......................................................................................43
5.11. Remittances ....................................................................................................................45
6. Financial needs ................................................................................................................47
iiFINSCOPE RWANDA GENDER THEMATIC REPORT 2020
LIST OF TABLES
Table 1: Consumer process of choosing and using financial products by gender ..................................................................................................................22
Table 2: Financial decision-making within households by gender ............................24
Table 3: Trended overview of financial products/services uptake by gender .........27
Table 4: Bank account usage by segment groups (main source of income) (%) ..............................................................................31
Table 5: Sentiments about mobile money .......................................................................34
Table 6: Saving and investment attitudes and beliefs ..................................................35
Table 7: Definition of saving between men and women ..............................................36
Table 8: Trended overview of savings products/services uptake by gender .......... 37
Table 9: Top three reasons why you belong to a group/club ......................................38
Table 10: Overall sentiments towards borrowing ............................................................39
Table 11: Trended overview of credit products/services uptake by gender ...............41
Table 12: Credit sentiments ...................................................................................................41
Table 13: Life events ............................................................................................................... 44
Table 14: Sentiments about insurance policies ................................................................45
Table 15: Trended overview of remittance channels by gender ...................................46
Table 16: Financial health indicators by gender ...............................................................50
7. Financial health .............................................................................................................. 49
8. Conclusion ........................................................................................................................53
Gender equality .........................................................................................................................53
Holistic approach to poverty alleviation and development ............................................53
Financial capability ....................................................................................................................54
Financial health ..........................................................................................................................54
9. Recommendations .........................................................................................................55
Finscope footprint .....................................................................................................................58
iii FINSCOPE RWANDA GENDER THEMATIC REPORT 2020
LIST OF FIGURES
Figure 1: Age group by gender (%) ...................................................................................12
Figure 2: Education level by gender (%) ..........................................................................13
Figure 3: No formal education by gender (%) ................................................................13
Figure 4: Area type by gender (%) ....................................................................................13
Figure 5: Sources of income by gender (%) ....................................................................14
Figure 6: Gender financial inclusion by area type (%) .................................................16
Figure 7: Gender financial inclusion by age (%) ............................................................16
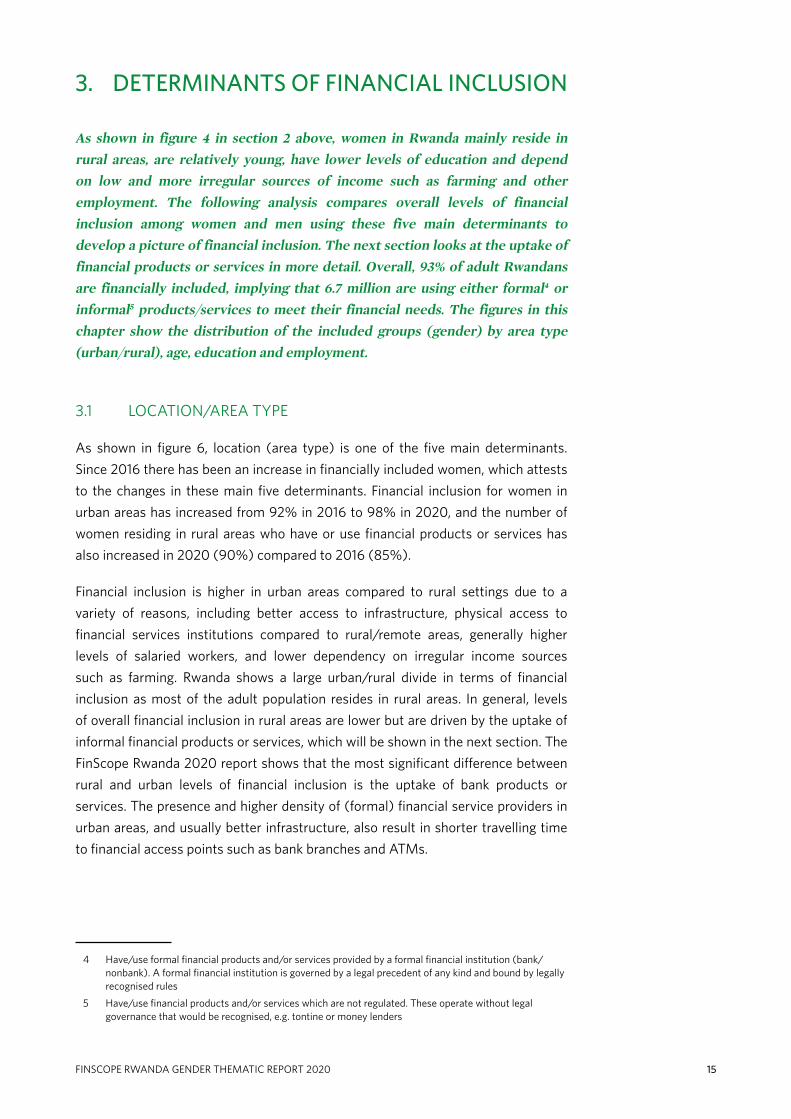
Figure 8: Trended gender financial inclusion by age (%) .............................................17
Figure 9: Financial inclusion by age (16–17 years) and education (%) .....................17
Figure 10: Trended gender financial inclusion by education levels (%) .....................17
Figure 11: Gender financial inclusion by education levels (%) ....................................18
Figure 12: Gender financial inclusion by sources of income (%) .................................19
Figure 13: Trended gender financial inclusion by sources of income (%) .................19
Figure 14: Consumer empowerment score ........................................................................21
Figure 15: Transparency of information .............................................................................22
Figure 16: Financial attitudes by gender (%) ...................................................................23
Figure 17: Financial planning ...............................................................................................24
Figure 18: Analytical framework ..........................................................................................25
Figure 19: Overview of financial products/services uptake by gender (%) .............27
Figure 20: Financial institutions ever used (%) ...............................................................28
Figure 21: Satisfaction with financial services products ...............................................28
Figure 22: Access strand by gender in other East African countries where FinScope surveys have recently been conducted – ranked by gender gap in total level of financial inclusion (%) ....................................29
Figure 23: Banked population (%) ......................................................................................30
Figure 24: Drivers and barriers to banking ........................................................................32
Figure 25: Trended overview of banking products by gender (%) ..............................32
Figure 26: Drivers and barriers to mobile money account ............................................ 33
Figure 27: Mobile money usage by women ......................................................................34
Figure 28: Digital payments (%) .........................................................................................35
Figure 29: Drivers and barriers between women who save and do not save ...........36
Figure 30: Overview of savings products/services uptake by gender (%) ...............38
ivFINSCOPE RWANDA GENDER THEMATIC REPORT 2020
Figure 31: Borrowing for which purposes ......................................................................... 40
Figure 32: Drivers and barriers for women to borrowing ............................................. 40
Figure 33: Overview of credit products/services uptake by gender ...........................42
Figure 34: Savings groups’ penetration (%) .....................................................................42
Figure 35: Drivers of informal mechanisms (%) .............................................................43
Figure 36: Main reason for belonging to informal mechanism (%) ...........................43
Figure 37: Insurance uptake by gender (%) .................................................................... 44
Figure 38: Drivers and barriers for women to insurance ...............................................45
Figure 39: Overview of remittance channels by gender (%)........................................46
Figure 40: FinNeeds ................................................................................................................48
Figure 41: FinNeeds indicators .............................................................................................49
v FINSCOPE RWANDA GENDER THEMATIC REPORT 2020
ACRONYMS AND ABBREVIATIONS
AFR Access to Finance Rwanda
ATM Automatic Teller Machine
CESS Centre for Economic and Social Studies
BNR National Bank of Rwanda
DFID Department for International Development
EICV Integrated Household Living Condition Survey
FMT FinMark Trust
NGOs Non-Governmental Organisations
NISR National Institute of Statistics of Rwanda
NFIS National Financial Inclusion Strategy
PSU Primary Sampling Unit
SACCOs Savings and Credit Cooperative Organisation
VSLAs Village Savings and Lending Associations

ACKNOWLEDGEMENTS
Access to Finance Rwanda (AFR) is honoured to present the 2020 FinScope
Gender Thematic Report. This report is a result of collaborative efforts by different
stakeholders whose contribution is appreciated.
First and foremost, we are grateful to our Funders, namely, the United Kingdom’s
Foreign, Commonwealth and Development Office (FCDO), the Mastercard
Foundation, Sweden, and USAID who financially supported the development of this
report.
Our sincere appreciation goes to the members of the FinScope Steering
Committee, made of representatives from Access to Finance Rwanda, the Ministry
of Finance and Economic Planning, the National Bank of Rwanda, the National
Institute of Statistics of Rwanda, and FinMark Trust for their overall technical
guidance and for overseeing all FinScope related activities.
viFINSCOPE RWANDA GENDER THEMATIC REPORT 2020
vii FINSCOPE RWANDA GENDER THEMATIC REPORT 2020

• EXECUTIVE SUMMARY
viiiFINSCOPE RWANDA GENDER THEMATIC REPORT 2020

1.9 Mil
40 years and younger
40yrs
Women in Rwanda mainly reside in rural areas, are relatively young , have lower levels of education (and depend on low and more irregular sources of income such as farming).
General demographic profile of women in Rwanda
1.6 Mil
Income from farming
41%
2.9 Mil
Reside in RuralAreas
23%
0.9 Mil
without formal education
1 FINSCOPE RWANDA GENDER THEMATIC REPORT 2020
EXECUTIVE SUMMARY
The development landscape in Rwanda has changed considerably since the adoption of Vision 2020. The progress made has given Rwandans much hope and the desire to aspire for greater achievements. Financial inclusion is one of the key priority areas (priority area 5) in achieving the National Strategy for Transformation (NST1), which is the key pillar in overseeing the crossover from Vision 2020 to Vision 2050. To strengthen policies that support narrowing the financial inclusion gender gap, the Government of Rwanda (GoR) has supported and participated in the fourth FinScope Rwanda Consumer Survey 2020. This is conducted by monitoring and evaluating gender interventions driven by the National Financial Inclusion Strategy (NFIS).
As shown in this report, there has been an increase in financial inclusion among
women, and Rwanda is nearly achieving gender parity in financial inclusion. These
are great achievements, however, there is an opportunity to deepen the financial
inclusion of women to pair or even go beyond that of their male counterparts.
Since the first FinScope Gender Report released in 2016, we have observed changes
in the demographic profile of women in Rwanda in the following ways:
30/ /50
75%
25%
Farming and Piece jobs
Other sources of income
Proactive attitudestowards financial
affairs34%
28%Money managment decisions in the
household
66%71%
5%
2.6 Mil Women1.9 Mil
40 years and younger
40yrs
Women in Rwanda mainly reside in rural areas, are relatively young , have lower levels of education (and depend on low and more irregular sources of income such as farming).
General demographic profile of women in Rwanda
1.6 Mil
Income from farming
41%
2.9 Mil
Reside in RuralAreas
23%
0.9 Mil
without formal education
KEY:
2020_Male
2020_Female
2020_Gender Gap
2FINSCOPE RWANDA GENDER THEMATIC REPORT 2020
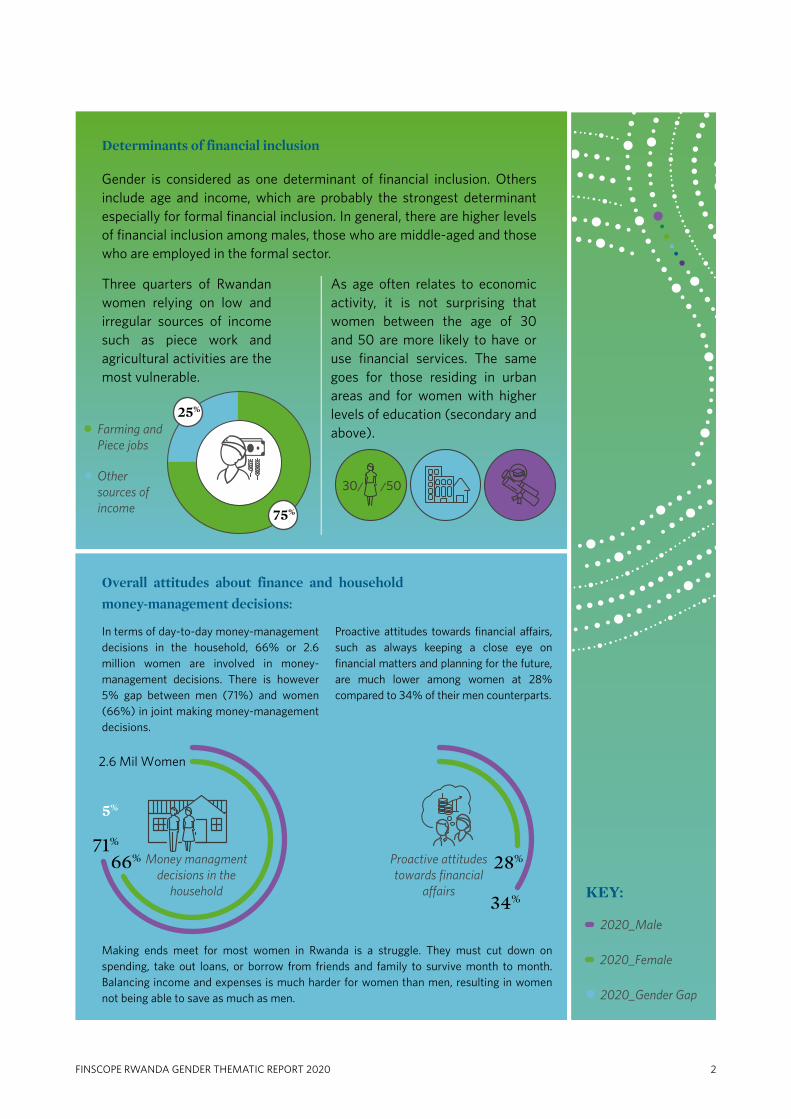
Determinants of financial inclusion
Gender is considered as one determinant of financial inclusion. Others include age and income, which are probably the strongest determinant especially for formal financial inclusion. In general, there are higher levels of financial inclusion among males, those who are middle-aged and those who are employed in the formal sector.
Three quarters of Rwandan women relying on low and irregular sources of income such as piece work and agricultural activities are the most vulnerable.
As age often relates to economic activity, it is not surprising that women between the age of 30 and 50 are more likely to have or use financial services. The same goes for those residing in urban areas and for women with higher levels of education (secondary and above).
Overall attitudes about finance and household
money-management decisions:
In terms of day-to-day money-management decisions in the household, 66% or 2.6 million women are involved in money-management decisions. There is however 5% gap between men (71%) and women (66%) in joint making money-management decisions.
Proactive attitudes towards financial affairs, such as always keeping a close eye on financial matters and planning for the future, are much lower among women at 28% compared to 34% of their men counterparts.
Making ends meet for most women in Rwanda is a struggle. They must cut down on spending, take out loans, or borrow from friends and family to survive month to month. Balancing income and expenses is much harder for women than men, resulting in women not being able to save as much as men.
B2.9 M
il Wom
en
3.1 Mil W
omen
2.5 Mil M
en
2.2 Mil M
en
74% 76%74%
63%
80%
93%
92%
71% 71%81%
7% 4%
11%
0.3 Mil Men
0.7 Mil Women
12%
24%
19%
17%
7%
7%
2.9 Mil Men3.6 Mil W
omen
financial inclusion
B
1%
1%
KEY:
2016_Male
2020_Male
2016_Female
2020_Female
2016_Gender Gap
2020_Gender Gap
3 FINSCOPE RWANDA GENDER THEMATIC REPORT 2020
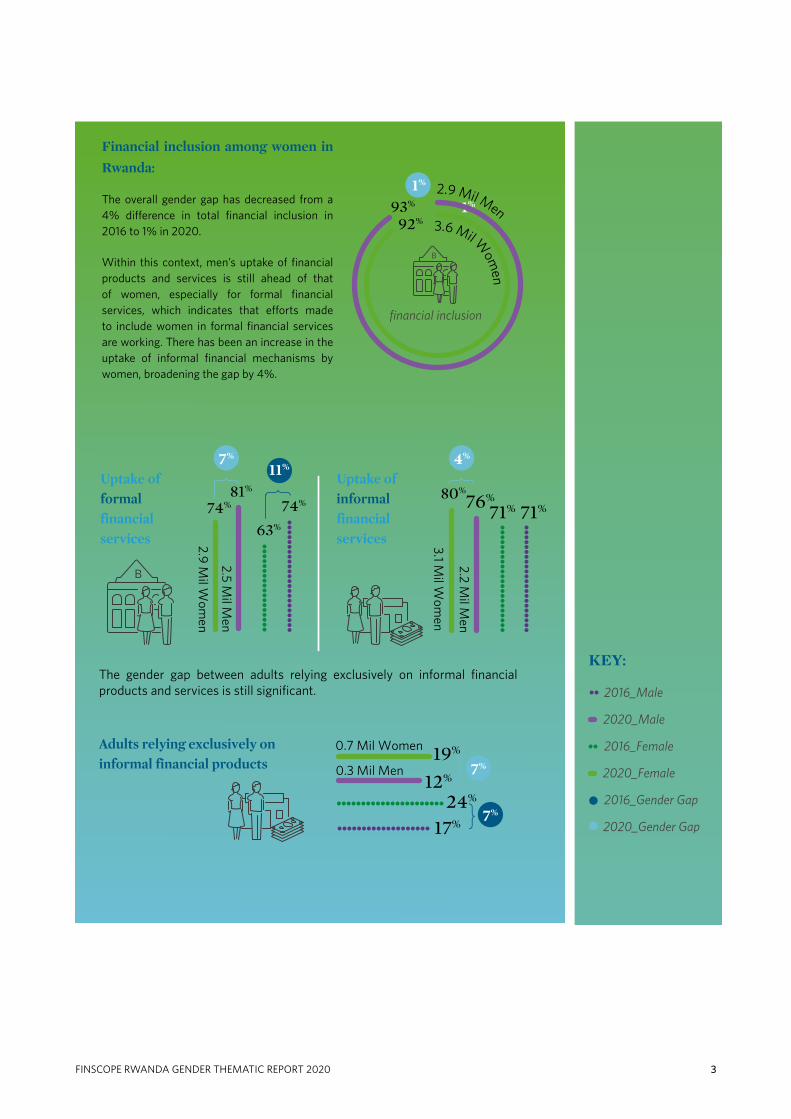
Financial inclusion among women in
Rwanda:
The overall gender gap has decreased from a 4% difference in total financial inclusion in 2016 to 1% in 2020.
Within this context, men’s uptake of financial products and services is still ahead of that of women, especially for formal financial services, which indicates that efforts made to include women in formal financial services are working. There has been an increase in the uptake of informal financial mechanisms by women, broadening the gap by 4%.
The gender gap between adults relying exclusively on informal financial products and services is still significant.
Uptake of formal financial services
Uptake of informal financial services
Adults relying exclusively on informal financial products
Borrowing informal BorrowingBank Loans
3 Mil Women2.3 Mil Men
2.4 Mil Women1.8 Mil Men
77%
5%
3%
5%
10%76%
71%
69%
58%63%
0.6 Mil Women0.6 Mil Men
Insurance
19%15%
10%8%
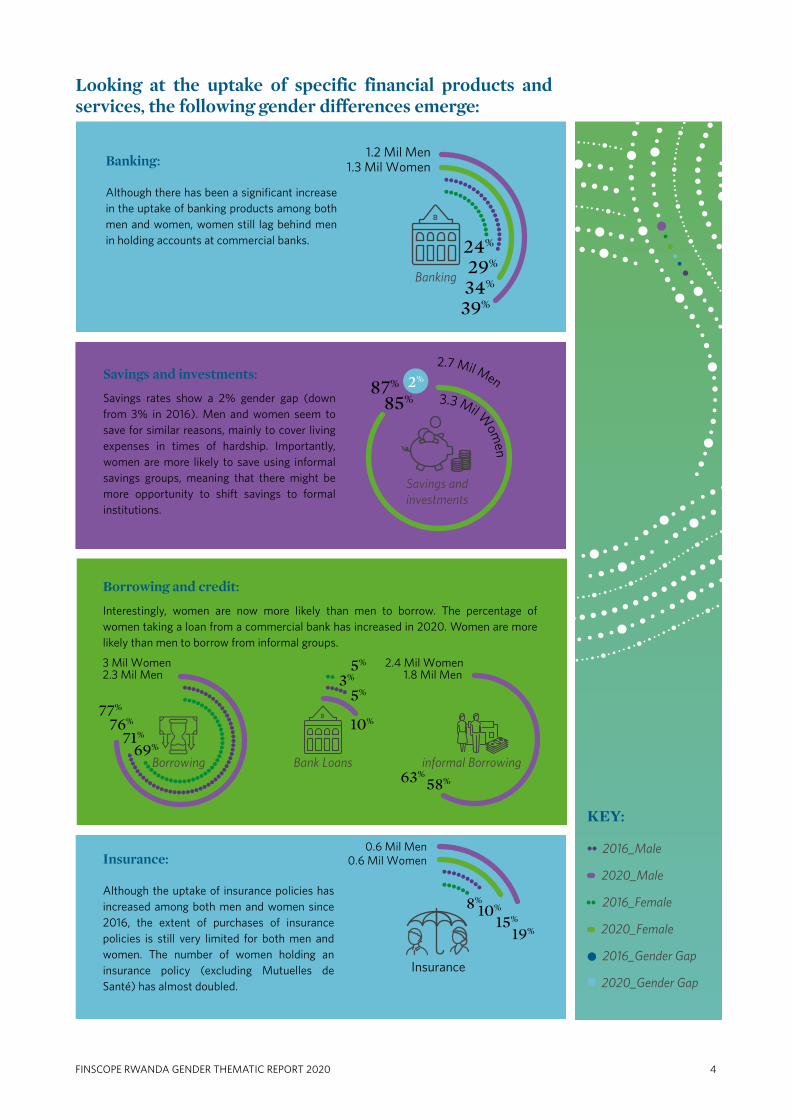
Looking at the uptake of specific financial products and services, the following gender differences emerge:
Banking
1.2 Mil Men1.3 Mil Women
24%
29%
39%34%
2.7 Mil Men
KEY:
2016_Male
2020_Male
2016_Female
2020_Female
2016_Gender Gap
2020_Gender Gap
Savings and investments
87%
85%
2.7 Mil Men
3.3 Mil Wom
en
2%
4FINSCOPE RWANDA GENDER THEMATIC REPORT 2020
Borrowing and credit:
Interestingly, women are now more likely than men to borrow. The percentage of women taking a loan from a commercial bank has increased in 2020. Women are more likely than men to borrow from informal groups.
Savings and investments:
Savings rates show a 2% gender gap (down from 3% in 2016). Men and women seem to save for similar reasons, mainly to cover living expenses in times of hardship. Importantly, women are more likely to save using informal savings groups, meaning that there might be more opportunity to shift savings to formal institutions.
Banking:
Although there has been a significant increase in the uptake of banking products among both men and women, women still lag behind men in holding accounts at commercial banks.
Insurance:
Although the uptake of insurance policies has increased among both men and women since 2016, the extent of purchases of insurance policies is still very limited for both men and women. The number of women holding an insurance policy (excluding Mutuelles de Santé) has almost doubled.

3.1 Mil Women2.3 Mil Men
Informal mechanisms
80%
76%
2.1 Mil Women2 Mil Men
66%
46%33%
55%
Mobile money
8%9%
Remittances
49%41%
KEY:
2016_Male
2020_Male
2016_Female
2020_Female
2016_Gender Gap
2020_Gender Gap
5 FINSCOPE RWANDA GENDER THEMATIC REPORT 2020
Conclusions and recommendations: As shown in this report, financial inclusion
among women in Rwanda is relatively high at 92%. Nevertheless, there is
opportunity for further growth and improvement to narrow the gender gap,
especially in terms of deepening financial inclusion beyond access and moving
towards a greater level of formal inclusion (particularly with regard to the uptake of
banking products or services) which require:
Remittances:
Remittance rates show an 8% gender gap. Fewer women either sent or received money compared to men, using almost exclusively formal mechanisms, i.e. mobile money.
Mobile money:
The uptake of mobile money has increased significantly since 2016, mainly because they trust it and because it is affordable and convenient, but also to pay bills and keep money safe.
Informal mechanisms:
Informal mechanisms push the exclusion boundaries among women. Women are likely to be vulnerable through relying exclusively on informal mechanisms. This reliance shows a 7% gap (informal only) compared to their male counterparts.
6FINSCOPE RWANDA GENDER THEMATIC REPORT 2020
Gender policy – continue with monitoring and evaluating the National Gender
Policy and Girls’1 Education Sector Strategic Plan (2018/19 to 2023/24) as these
initiatives have proven successful in driving financial inclusion.
Small- and medium-enterprise development – females have the largest proportion
of dependents. The proposed strategy would be to assist women who own
businesses while also enabling more women to start their own businesses. Engaging
the needs of these females and establishing firm entrepreneur-led businesses and
farming will be key in expanding access to employment for other females, who are
dependents, involved in informal sectors and non-commercial farming.
Emphasise the focus on the usage and quality of the financial services – females’
use of digital financial services and economic platforms has the potential to unlock
opportunities and contribute positively to financial inclusion.
Information dissemination – industry sectors (policymakers, NGOs and the
private sector) to recommend and share financial sector policy and make it
available to other stakeholders involved in the policymaking and advocacy process
(networks, associations and other civil society organisations as well as donor
agencies). These financial sector policy recommendations can be useful for setting
female financial inclusion targets, to support the assessment of financial needs and
to design appropriate services for women according to their context (e.g. level of
education, daily activities and level of poverty).
Dedicated training/financial education programme targeted at women –
integrating financial literacy within school-level and adult basic education can play
a pivotal role in reducing the gender disparity.
Supporting the digital financial services – electronic money transfers are key to
lowering the cost of remittances for poor economies that depend heavily on such
transfers and technology. It is currently evolving so fast that costs will be significantly
lower in the near future, favouring local development and financial inclusion.
1 http://www.minecofin.gov.rw/fileadmin/templates/documents/NDPR/Sector_Strategic_Plans/Education.pdf
7 FINSCOPE RWANDA GENDER THEMATIC REPORT 2020
• INTRODUCTION
• PROFILE OF WOMEN IN RWANDA
• DETERMINANTS OF FINANCIAL INCLUSION
• RESPONSIBLE FINANCES
• FINANCIAL INCLUSION AMONG WOMEN IN
RWANDA
• FINANCIAL NEEDS
• FINANCIAL HEALTH
8FINSCOPE RWANDA GENDER THEMATIC REPORT 2020

9 FINSCOPE RWANDA GENDER THEMATIC REPORT 2020
1. INTRODUCTION
It is widely accepted that financial inclusion plays an important role in promoting faster, broad-based economic growth and poverty reduction and thus strongly supports national-level objectives. In recognising efforts to support financial inclusion, the GoR has introduced several initiatives to promote financial inclusion. These include the implementation of the NFIS 2019–2024 and ensuring that the NFIS is a living document that continues to measure and monitor the identified areas of priority or pillars.
This thematic report summarises gender differences in the uptake/usage of
financial products and services (both formal and informal), and as such contributes
to documenting Rwanda’s development towards greater financial inclusion of
women.1 Findings are based on the FinScope Survey2 Rwanda 2020, which was
initiated by the GoR and Access to Finance Rwanda (AFR)3 with the intention to
continue measuring progress in financial inclusion. Implemented by the Centre
for Economic and Social Studies (CESS), the survey was conducted under the
supervision of the steering committee members (e.g. including the Ministry of
Finance, National Bank of Rwanda, NISR, AFR, CESS) and with technical support
from FinMark Trust (FMT).
The main objectives of the FinScope Survey Rwanda 2020 were to describe the
levels of financial inclusion (i.e. levels of access to financial products and services
– both formal and informal) and the landscape of access (i.e. the type of products
and services used by financially included individuals). As such, it aimed to
identify the drivers of, and barriers to, financial access and, therefore, to stimulate
evidence-based dialogue that will ultimately lead to effective public and private
sector interventions aimed to increase and deepen financial inclusion.
The purpose of this Gender Report is to identify and address gender financial
inclusion inequalities, by acknowledging differences between and among
women and men, based on the unequal distribution of resources, opportunities,
constraints, and power. Lastly, to promote better-informed, gender-responsive and
effective interventions. The analysis of this report is derived from FinScope Rwanda
1 For a better understanding of the country context, the financial landscape, and overall levels of financial inclusion, this paper shall be read in conjunction with the full FinScope Rwanda 2020 report, which is available upon request from FMT or AFR
2 FinScope Consumer Surveys: FinScope is a comprehensive and nationally representative survey on financial inclusion, looking at how individuals source their income and manage their financial lives. It provides insight into attitudes and perceptions regarding financial products and services. The key objective of the FinScope Consumer Survey is to measure and profile levels of access to and use of financial services by all eligible adults (16/18 years and older), across income ranges and other demographics, and to make this information available for use by key stakeholders such as policymakers, regulators, and financial service providers. To date, FinScope Surveys in Rwanda have been conducted in 2008, 2012, 2016 and 2020
3 AFR was launched in March 2010 at the request the Government of Rwanda and with support from DFID and the World Bank. The core objective of AFR is to remove systemic barriers to financial services by putting the poor at the centre of its interventions

10FINSCOPE RWANDA GENDER THEMATIC REPORT 2020
Consumer 2020 survey and comparison against FinScope Consumer Rwanda 2016
survey. The following sections give a brief background into the FinScope Rwanda
2020 survey’s methodology:
1.1 FINSCOPE METHODOLOGY AND SURVEY DESIGN
The target population for the Rwanda State of Financial Inclusion 2020 survey
consisted of eligible members of private households in Rwanda. The sample
design was a stratified three-stage cluster sample, where the first stage units were
the primary sampling units (PSUs), the second stage units were the households,
and the third stage units were the eligible members. These were individuals who,
at the time of the survey were 16 or older, available for the duration of the survey,
mentally/physically capable of being interviewed, and had resided in the selected
household for at least six months preceding the survey. The age limit for the
eligibility criteria was based on the fact that only individuals aged 16 or older are
officially authorised to obtain personal formal financial products (such as opening a
personal bank account or mobile money account) from formal financial institutions
in Rwanda, which makes them a target population of the financial sector. Only one
individual per selected household was interviewed.
1.2 SAMPLING FRAME FOR FINSCOPE RWANDA 2020 SURVEY
The survey is based on a nationally representative sample of the adult population
in Rwanda aged 16 years and older. A total of 12 480 face-to-face interviews were
conducted from September 2019 to November 2019 using Computer Assisted
Personal Interviews (CAPI). The data were weighted and benchmarked to the
2016/17 Integrated Household Survey (EICV5), and the FinScope Rwanda 2020
survey findings were validated and approved by the National Institute of Statistics
of Rwanda (NISR). Data analysis was conducted by FMT with the involvement of
AFR and the steering committee.
Rwanda is divided geographically into four provinces and the city of Kigali, 30
districts, 416 sectors, 2 148 cells, and 14 816 villages. The PSUs for the FinScope
Rwanda 2020 survey were selected as a subsample of the 2012 Census frame
PSUs. A list of households was compiled in each sample village selected for the
FinScope survey and a sample of households was selected at the last sampling
stage. The units of analysis for the survey were the individual households and
people who are usually resident in those households.
11 FINSCOPE RWANDA GENDER THEMATIC REPORT 2020
1.3 SAMPLE SIZE AND SAMPLE ALLOCATION
The sample size for the FinScope Survey 2020 depended on the level of precision
required for key indicators at the district level, as well as on resource constraints
and logistical considerations. It is essential to ensure good quality control in order
to minimise non-sampling errors. The estimates of the sampling errors for the
population with a savings account by district from the EICV5 data were examined,
in order to determine sample size for the FinScope Survey 2020.
Please refer to the FinScope Rwanda Consumer Survey Report 2020 for the
complete survey methodology.

16 - 17 years
18 - 30 years
31 - 40 years
41 - 50 years
51 - 60 years
61 years +
17%
13%
18%
23%
25%
12%
16%
19%
23%
26%
4% 4%
Figure 1: Age group by gender (%)
Male
Female
12FINSCOPE RWANDA GENDER THEMATIC REPORT 2020
2. PROFILE OF WOMEN IN RWANDA
This section summarises basic demographic, socioeconomic and geographic information of women in Rwanda. It looks at who these women are (demographic data), what they have (education), how and where they live (geographical distribution and infrastructure), and what they do with what they have (income-generating activities). A new element added in 2020 is the understanding of financial attitudinal data and financial skills, to help paint a better picture of the overall profile of women in Rwanda.
All these factors influence the financial lives of women to varying degrees and
therefore affect financial inclusion, which will be discussed further in the following
sections.
2.1 WHO THESE WOMEN ARE (DEMOGRAPHIC DATA)
FinScope Rwanda 2020 estimated the total adult population (16 years and older)
to be just over 7 million, of which 56% are female (about 3.9 million). The large
majority is rural-based (figure 4), with 74% of women (2.9 million) residing in rural
areas. In general, the adult female population in Rwanda is relatively young, with
53% being 40 years of age and younger (1.9 million).
Figure 1: Age group by gender (%)
2.2 WHAT THESE WOMEN HAVE (EDUCATION)
Women are more likely to have no formal education (23%, around 900 000) than
men (15%). This is driven by the large gender gap seen in the older generations,
particularly 51 years and up. The gender gap for no formal education is closing
within the younger generations (see figure 3).

15% 23%No formal education
53% 52%Primary education
23% 20%Secondary education
8% 5%Tertiary education
2% 1%Vocational education
Figure 2: Education level by gender (%)
Male
Female
16 - 17 years
18 - 30 years
31 - 40 years
41 - 50 years
51 - 60 years
61 years + 60%
38%
38%
23%
21%
14%
15%
13%
4%
1%
7%
4%
Figure 3: No formal education by gender (%)
Male
Female
Figure 4: Area type by gender (%)
26%
74%
26%
74%
26%
74%
Urban
Rural
Total FemaleMale
13 FINSCOPE RWANDA GENDER THEMATIC REPORT 2020
Figure 2: Education level by gender (%)
Figure 3: No formal education by gender (%)
2.3 HOW AND WHERE THESE WOMEN LIVE (GEOGRAPHICAL DISTRIBUTION AND INFRASTRUCTURE)
Data shows that women are less likely to come from household with good
infrastructure compared to male counterparts: Only 19% of women come from
households that have access to piped water in their homes or yards compared to
21% of men. There are also more men from households with access to electricity
that could be used for cooking and lighting purposes (47%) compared to women
(43%). The majority of women use sources other than electricity for lighting
purposes, such as oil lamps (29%) and solar panels (13%). Fetching drinking water
and firewood for cooking purposes is a daily reality for girls and women in these
households. This is not surprising as the large majority of women are rural-based;
figure 4 shows that 74% or 2.9 million reside in rural areas.
Figure 4: Area type by gender (%)

Money from farming 43% 41%
33% 34%Piece work
13%12%Sell something I grow
Salary or wages from a farmer 12% 13%
Salary from a private business/company 6% 4%
Salary from Government institution 6% 5%
12% 10%Self-employed
Male Female
14FINSCOPE RWANDA GENDER THEMATIC REPORT 2020
2.4 WHAT THEY DO WITH WHAT THEY HAVE (INCOME-GENERATING ACTIVITIES):
The large majority of women are from households that are involved in farming
activities (61% or 2.4 million). Most of the households’ consumption comes
from the food that they grow. Farming activities account for 41% or 1.6 million of
Rwandan women’s income and 13% or 0.5 million from selling something that
they grow. 34% or 1.3 million adult women earn an income from piece work. This
makes farming and piece work leading sources of income. These livelihoods are
often related to irregular and low levels of income and, as such, women generating
their income from farming activities are less likely to prioritise the use of financial
products or services. In total, only about 9% or 0.3 million women receive their
main income from a salary or wage from the formal sector (public = 5% and
private = 4%) compared to 12% or 0.4 million men.
Figure 5: Sources of income by gender (%)
15 FINSCOPE RWANDA GENDER THEMATIC REPORT 2020
3. DETERMINANTS OF FINANCIAL INCLUSION
As shown in figure 4 in section 2 above, women in Rwanda mainly reside in rural areas, are relatively young, have lower levels of education and depend on low and more irregular sources of income such as farming and other employment. The following analysis compares overall levels of financial inclusion among women and men using these five main determinants to develop a picture of financial inclusion. The next section looks at the uptake of financial products or services in more detail. Overall, 93% of adult Rwandans are financially included, implying that 6.7 million are using either formal4 or informal5 products/services to meet their financial needs. The figures in this chapter show the distribution of the included groups (gender) by area type (urban/rural), age, education and employment.
3.1 LOCATION/AREA TYPE
As shown in figure 6, location (area type) is one of the five main determinants.
Since 2016 there has been an increase in financially included women, which attests
to the changes in these main five determinants. Financial inclusion for women in
urban areas has increased from 92% in 2016 to 98% in 2020, and the number of
women residing in rural areas who have or use financial products or services has
also increased in 2020 (90%) compared to 2016 (85%).
Financial inclusion is higher in urban areas compared to rural settings due to a
variety of reasons, including better access to infrastructure, physical access to
financial services institutions compared to rural/remote areas, generally higher
levels of salaried workers, and lower dependency on irregular income sources
such as farming. Rwanda shows a large urban/rural divide in terms of financial
inclusion as most of the adult population resides in rural areas. In general, levels
of overall financial inclusion in rural areas are lower but are driven by the uptake of
informal financial products or services, which will be shown in the next section. The
FinScope Rwanda 2020 report shows that the most significant difference between
rural and urban levels of financial inclusion is the uptake of bank products or
services. The presence and higher density of (formal) financial service providers in
urban areas, and usually better infrastructure, also result in shorter travelling time
to financial access points such as bank branches and ATMs.
4 Have/use formal financial products and/or services provided by a formal financial institution (bank/nonbank). A formal financial institution is governed by a legal precedent of any kind and bound by legally recognised rules
5 Have/use financial products and/or services which are not regulated. These operate without legal governance that would be recognised, e.g. tontine or money lenders

Total
Total
98%
91%
Female
98%
90%
Male
FemaleMale
97%
92%
92%
85%
97%
89%94%
87%
Figure 6: Gender financial inclusion by area type (%)
Urban
Rural
2020
2016
Figure 7: Gender financial inclusion by age (%)
16–17 years 18–30 years 31–40 years 41–50 years 51–60 years 61 years +
96%96% 97%95%95% 96%
91%91% 90%
68%64%
61%
94%96% 97%
88%90% 93%
Total
Male
Female
16FINSCOPE RWANDA GENDER THEMATIC REPORT 2020
Figure 6: Gender financial inclusion by area type (%)
3.2 AGE
Age is a determinant of financial inclusion. In general, there are higher levels of
financial inclusion among those who are middle-aged, which might be connected
to their economic activity. While FinScope considers an age of above 30 years as
economically settled, those 30 years and younger tend to have a higher incidence
of unemployment as well as low or no income. As such, economically settled
people tend to use more financial products or services, i.e. show higher levels of
financial inclusion. A 3% decline in the number of financially included women aged
16 to 17 years has been observed since 2016 (71%), with 68% in 2020. A general
increase in financial inclusion, since 2016, is observed across all other age groups,
but more so in woman aged 51 years and older. The gender gap of 7% in financially
included adults aged 16–17 years, is driven by the level of education. As can be
seen in figure 9, 63% of women aged 16–17 years with no formal education are
financially included, compared to 0% of men in this category.
Figure 7: Gender financial inclusion by age (%)
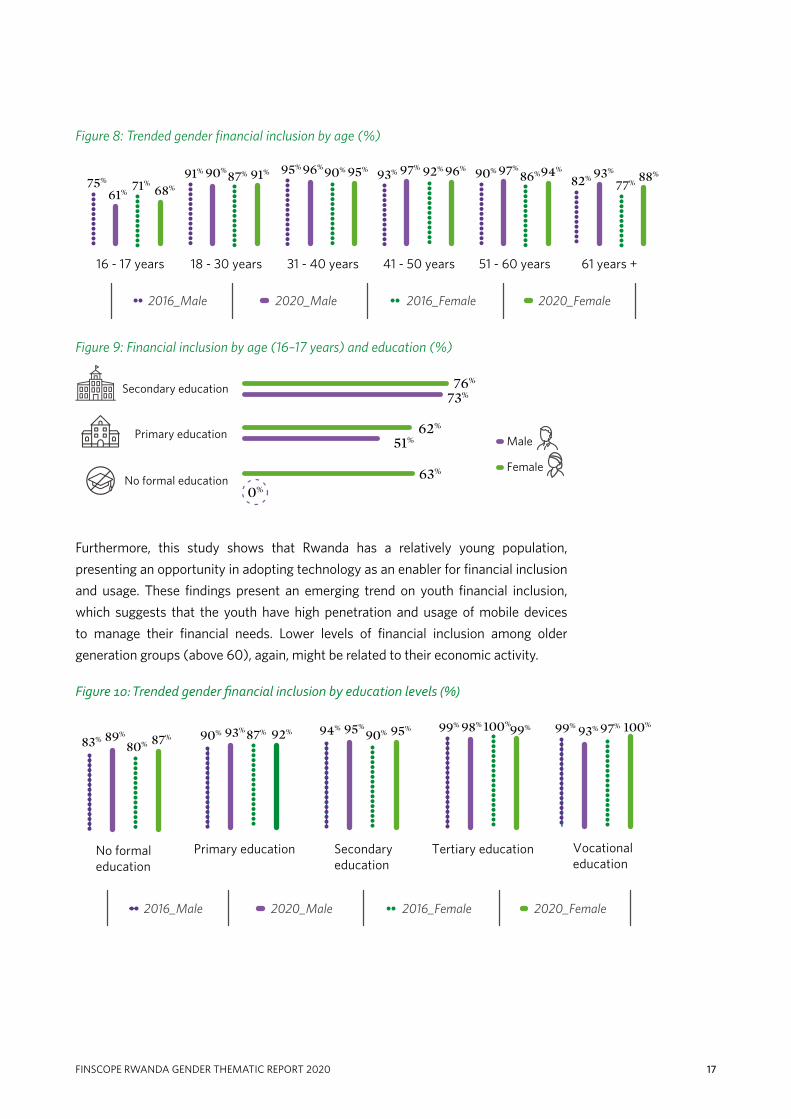
Figure 8: Trended gender financial inclusion by age (%)
61 years +
88%93%
82%77%
51 - 60 years
94%97%90% 86%
41 - 50 years
96%97%93% 92%
18 - 30 years
91%90%91% 87%
31 - 40 years
95%96%95% 90%
16 - 17 years
68%61%
75% 71%
2016_Male 2020_Male 2016_Female 2020_Female
Figure 9: Financial inclusion by age (16–17 years) and education (%)
76%
73%
62%
63%
0%
51%
No formal education
Primary education
Secondary education
Male
Female
Lorem ipsum
Figure 10: Trended gender financial inclusion by education levels (%)
Vocationaleducation
100%93%99% 97%
Tertiary education
98% 100%99% 99%
Secondaryeducation
95%94%90% 95%
Primary education
93%90% 87% 92%
No formaleducation
89%83%
80% 87%
2016_Male 2020_Male 2016_Female 2020_Female
17 FINSCOPE RWANDA GENDER THEMATIC REPORT 2020
Figure 8: Trended gender financial inclusion by age (%)
Figure 9: Financial inclusion by age (16–17 years) and education (%)
Furthermore, this study shows that Rwanda has a relatively young population,
presenting an opportunity in adopting technology as an enabler for financial inclusion
and usage. These findings present an emerging trend on youth financial inclusion,
which suggests that the youth have high penetration and usage of mobile devices
to manage their financial needs. Lower levels of financial inclusion among older
generation groups (above 60), again, might be related to their economic activity.
Figure 10: Trended gender financial inclusion by education levels (%)

Figure 11: Gender financial inclusion by education levels (%)
Primary education
93% 93% 92%
Tertiary education
99% 99%98%
Vocationaleducation
96% 100%
93%
Secondaryeducation
95%95% 95%
No formaleducation
87%88% 89%
Total
Male
Female
18FINSCOPE RWANDA GENDER THEMATIC REPORT 2020
3.3 EDUCATION
There is often a direct relationship between education levels and financial
behaviour and literacy. Furthermore, there is a relationship between education
levels, income sources, and levels of income. Hence, it is not surprising that levels
of financial inclusion are lower among people with lower levels of education or no
formal education. While 87% of women with no education are financially included,
100% of those with tertiary education have or use financial products or services.
Recognising this relationship, the GoR successfully implemented key policies and
strategies such as the National Gender Policy and the Girls’ Education Sector
Strategic Plan (2008–12), which have improved girls’ enrolment, retention and
completion and in the long term might have positive effects on women’s economic
participation and possibly financial inclusion. It is, however, important to note that
there has been a significant improvement in financial inclusion among women
with lower levels of education. Financially included women without any formal
education increased from 80% in 2016 to 87% in 2020.
Figure 11: Gender financial inclusion by education levels (%)
3.4 EMPLOYMENT AND INCOME
Income is probably one of the strongest determinants of (formal) financial
inclusion, referring to income levels as well as sources of income/regularity of
income. From a supply-side perspective, formal institutions are likely to target
these individuals. From a demand-side perspective, those who receive salaries
and wages are likely to need a formal product for the purpose of receiving
payments (salaries and wages). They are also more likely to reside in urban
areas and have generally higher levels of education. In 2020, 93% of women
who generated an income from farming activities were financially included (an
increase from 86% in 2016).
Since 2016 there has been a significant increase in financially included women
across most sources of income. Almost all women that receive a salary from
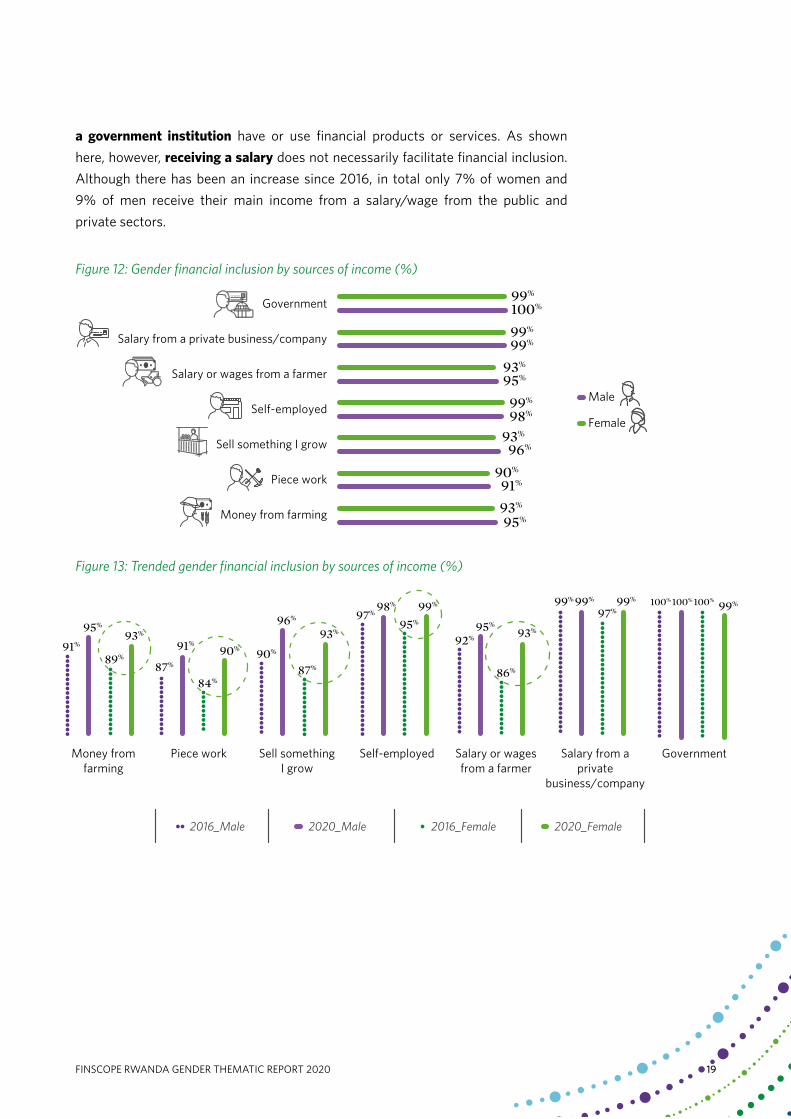
Figure 12: Gender financial inclusion by sources of income (%)
Money from farming
Piece work
Sell something I grow
Self-employed
Salary or wages from a farmer
Salary from a private business/company
Government 99%
99%
99%
99%
98%
93%
96%
90%
91%
93%
95%
93%
95%
100%
Male
Female
Figure 12: Trended gender financial inclusion by sources of income (%)
Government
100% 100% 100%99%
Salary from aprivate
business/company
99%99% 99%
97%
Salary or wagesfrom a farmer
93%
86%
95%
92%
Self-employed
97%98% 99%
95%
Sell something I grow
90%
96%
93%
87%
Piece work
87%
91%90%
84%
Money fromfarming
93%
89%
95%
91%
2016_Male 2020_Male 2016_Female 2020_Female
19 FINSCOPE RWANDA GENDER THEMATIC REPORT 2020
a government institution have or use financial products or services. As shown
here, however, receiving a salary does not necessarily facilitate financial inclusion.
Although there has been an increase since 2016, in total only 7% of women and
9% of men receive their main income from a salary/wage from the public and
private sectors.
Figure 12: Gender financial inclusion by sources of income (%)
Figure 13: Trended gender financial inclusion by sources of income (%)

20FINSCOPE RWANDA GENDER THEMATIC REPORT 2020
Furthermore, it needs to be highlighted that the gender gap of financially included
adults, across income sources, is relatively small – with an average of a 3%
difference between women and their male counterparts. The biggest differences
in the uptake of financial products or services can be seen among older women
and men (above 50 years of age) and those selling something they grow. Though,
this picture changes somewhat when looking at the uptake of particular financial
products or services, especially those offered by formal financial institutions/
service providers.
Opportunity: As shown in figures 5–8, women residing in rural areas who are
young (below 30 years of age), older women (above the age of 50) with no or low
levels of formal education, and those who generate an income from piece work or
agricultural activities (including those receiving a salary from a farmer) seem to
be most vulnerable in terms of financial inclusion and, therefore, should be given
priority. These efforts should go hand in hand with overall poverty alleviation
initiatives as they are closely linked.
Figure 13: Consumer empowerment score
9% 33% 59%
Total
Vulnerable Coping Empowered
7% 31% 62%
Male
10% 34% 56%
Female
21 FINSCOPE RWANDA GENDER THEMATIC REPORT 2020
4. RESPONSIBLE FINANCES
4.1 CONSUMER EMPOWERMENT AND TRANSPARENCY
The GoR aims at promoting and protecting the interests of financial services consumers. This is partially encouraged through the establishment of legal and regulatory frameworks that promote transparency and the honest and fair treatment of customers within the financial sector. This section looks at consumer empowerment and the level of transparency experienced. Consumer empowerment and financial service providers’ transparency are key pillars of financial capability and are of great importance in Rwanda. The purpose of financial capability is to provide consumers with the knowledge to safeguard themselves against unfair or exploitative practices. It is also to improve their decision making regarding financial products and services appropriate to their needs. Consumer protection and financial literacy (financial capability) ensure that there is trust in the financial sector. Uptake and use of financial services are optimised in this way.
A consumer empowerment score (ladder) was created to profile Rwandan adults
who exhibit vulnerable, coping, and empowered financial capability. In order
to determine the scores, the average was calculated based on the Likert scale
questions in table 1 – Consumer Empowerment Dimensions (statements). Figure
14 shows that the financial capability gap between men and women on average
is 7%. The financial capability of women is below that of the population average,
which indicates a continued development focus on financial education for the
women in Rwanda.
Figure 14: Consumer empowerment score
The biggest financial capability gaps between men and women are related to low
confidence to make a complaint against a financial institution if not satisfied with
the service or product offered (6%) and what to do when not satisfied with a
financial service (6%). The gap between males and females feeling like they are
treated fairly by financial institutions is 8%, with females being less likely to feel
like they are treated fairly.
63%
64%
55%
62%
18%
18%
Were informed of changes to fees or charges of financialproducts/services
Information on financial products or services recently boughtwas provided in a clear and easily understandable manner
Taken a financial product/service and later surprised aboutthe fees/charges associated to that product
Male Female
22FINSCOPE RWANDA GENDER THEMATIC REPORT 2020
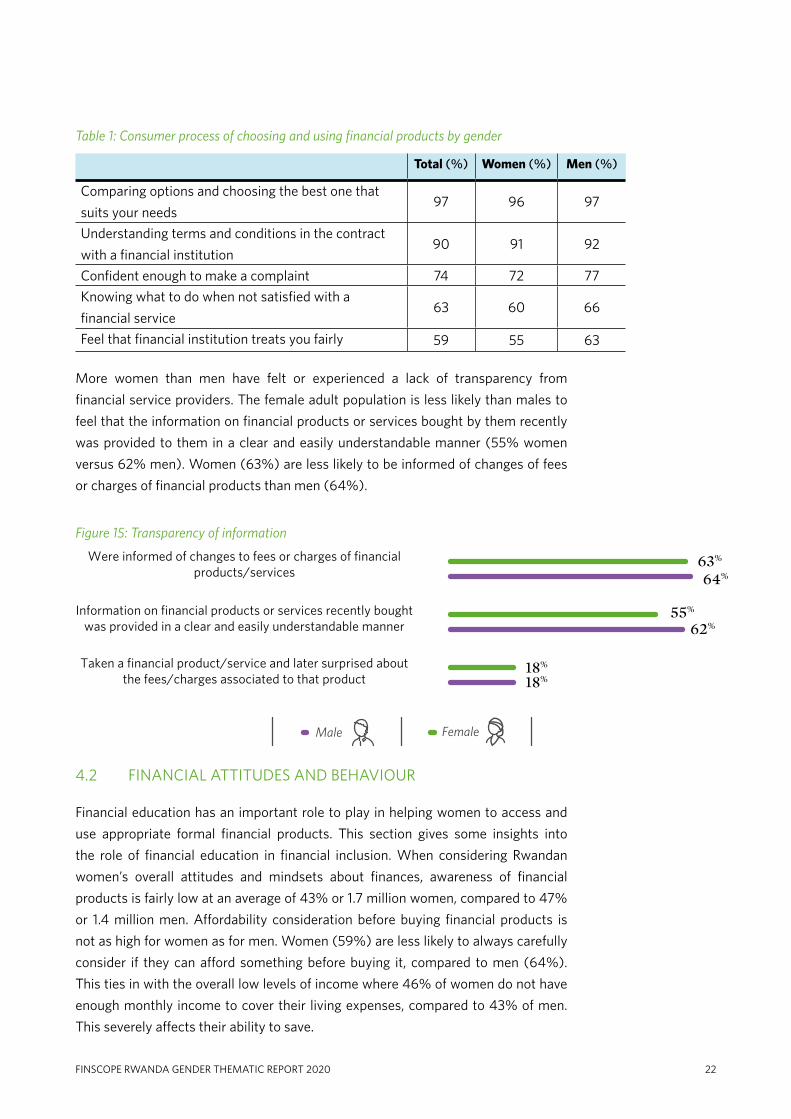
Table 1: Consumer process of choosing and using financial products by gender
Total (%) Women (%) Men (%)
Comparing options and choosing the best one that
suits your needs97 96 97
Understanding terms and conditions in the contract
with a financial institution90 91 92
Confident enough to make a complaint 74 72 77
Knowing what to do when not satisfied with a
financial service63 60 66
Feel that financial institution treats you fairly 59 55 63
More women than men have felt or experienced a lack of transparency from
financial service providers. The female adult population is less likely than males to
feel that the information on financial products or services bought by them recently
was provided to them in a clear and easily understandable manner (55% women
versus 62% men). Women (63%) are less likely to be informed of changes of fees
or charges of financial products than men (64%).
Figure 15: Transparency of information
4.2 FINANCIAL ATTITUDES AND BEHAVIOUR
Financial education has an important role to play in helping women to access and
use appropriate formal financial products. This section gives some insights into
the role of financial education in financial inclusion. When considering Rwandan
women’s overall attitudes and mindsets about finances, awareness of financial
products is fairly low at an average of 43% or 1.7 million women, compared to 47%
or 1.4 million men. Affordability consideration before buying financial products is
not as high for women as for men. Women (59%) are less likely to always carefully
consider if they can afford something before buying it, compared to men (64%).
This ties in with the overall low levels of income where 46% of women do not have
enough monthly income to cover their living expenses, compared to 43% of men.
This severely affects their ability to save.

Figure 14: Transparency of information
61%
64%
59%
27%
30%
25%
38%
41%
35%
30%
34%
28%
Before you buy something, you carefullyconsider whether you can afford it
Paying bills on time
Keeping close personal watch on financialaffairs
Setting long-term financial goals and workinghard to achieve them
FemaleTotal Male
23 FINSCOPE RWANDA GENDER THEMATIC REPORT 2020
Women are less likely to always keep a close personal watch over their financial
affairs (35%), compared to men (41%). With regards to always setting long-term
financial goals, women are also less likely to do so (28%) than men (34%). To
make ends meet, women are more likely to take a loan from their savings and loans
clubs (24%), compared to men (22%), and less likely to sell something that they
own (12%) than men (14%).
Figure 16: Financial attitudes by gender (%)
4.3 FINANCIAL DECISION-MAKING
This dimension refers to an individual’s attitude and knowledge as it relates to
making sound financial decisions and key learning moments. In terms of day-to-
day money-management decisions in the household, 66% or 2.6 million women
come from households where joint decisions on money-management are made
in the household. There is 4% gap between men (71%) and women (66%) that
come from household making joint money-management decisions. Joint decision
making is considered best practice and should therefore be encouraged especially
in the male headed households. In some society’s female children are involved in
discussions around household budgets. Financial education experts encourage
these types of conversations within households to create greater understanding
among women of the challenges involved in managing finances and the importance
of having a budget, saving and managing risks.

Figure 16: Financial planning
Always budget for your money
You know exactly, the money spent personally in the last 7 days
Always keep track of money spent
58%
45%
49%
60%
46%
52%
55%
44%
46%
MaleTotal Population Female
*the gender gap between women and men and to total population
24FINSCOPE RWANDA GENDER THEMATIC REPORT 2020
Table 2: Financial decision-making within households by gender
4.4 FINANCIAL PLANNING
Women are less likely than men to always budget, know exactly what they spent
in the past seven days and always keep track of the money that they spend. This
indicates a further gap in financial planning by women, which can be addressed
through education and development.
Figure 17: Financial planning
Total (%) Women (%) Men (%)
You alone 20 22 16
You and your spouse/partner 58 53 60
You and other household member/family members 9 12 10
Another family member or (or family members) 1 1 1
You are not involved 12 13 14

Figure 17: Analytical framework
Total adult population = 16 years and older in Rwanda.
Financially included = have/use financial products and/or services – formal and/or informal.
Financially excluded = do not have/use any financial products and/or services – neither formal nor informal.
Formally served = have/use financial products and/or services provided by a formal financial institution (bank and/or non-bank). A formal financial institution is governed by a legal precedent of any kind and bound by legally recognised rules.
Banked = have/use financial products/services provided by a bank, regulated by the National Bank of Rwanda (BNR).
Served by other formal financial institutions have/use financial products/services provided by other regulated (non-bank) financial institutions, e.g. mobile money, SACCOs.
Informally served = have/use financial products and/or services that are not regulated and operate without legal governance that would be recognised.
25 FINSCOPE RWANDA GENDER THEMATIC REPORT 2020
5. FINANCIAL INCLUSION AMONG WOMEN
IN RWANDA
The concept of ‘financial inclusion’ is core to the FinScope methodology and is based on the extent to which individuals (i.e. percentage of the adult population) currently have or use financial products or services both formal and/or informal (including banking, savings and investments, borrowing and credit, insurance and risk management, remittance). This section summarises overall levels of financial inclusion following the analytical framework illustrated in figure 18 and further explores the uptake of banking, savings, credit, insurance, and remittance products or services.
Figure 18: Analytical framework
5.1 OVERALL LEVELS OF FINANCIAL INCLUSION
Given that Rwanda’s population is relatively young, has low levels of education,
resides mostly in rural areas, and is largely dependent on irregular/low sources
of income (agricultural), the overall national level of financial inclusion is
remarkably high at 93% or 6.7 million adult Rwandans. In 2020 only 8% (a
decrease from 14% in 2016) of the female adult population in Rwanda (about
312 000) are financially excluded (compared to 7% or 217 000 men), meaning
that they manage their financial lives without the use of any financial products or
mechanisms external to their personal relationships. If they borrow, they rely on

26FINSCOPE RWANDA GENDER THEMATIC REPORT 2020
family and friends; if they save, they save at home. In turn, 92% of women (3.6
million) are financially included (an increase from 86% in 2016), i.e. they have
or use formal and/or informal financial products and mechanisms (compared to
93% or 2.9 million men).
The financially included population includes those who are:
• Formally served: The female adult population who have or use products or
services from financial institutions that are regulated through an act of law
(formal financial institutions), which is driven by other formal (non-bank)
financial products or services, has increased from 63% in 2016 to 74% in
2020. Also, the formally served gender gap has decreased by 3% since 2016.
• Informally served: A very large portion of the population, 80% (3.1
million), which is an increase from 71% in 2016, have or use products or
services from financial institutions that are not regulated (informal financial
institutions and mechanisms) and/or use community-based organisations or
mechanisms to save or borrow money. This is mainly driven by the uptake of
informal savings groups.
The formally served population further includes those who are:
• Banked: The total female adult population who have or use products or
services from licensed commercial banks that are regulated by the central
bank has increased from 24% in 2016 to 34% (or 1.3 million) in 2020. Men
are more likely than women to be banked, with 39% of men and 34% of
women, showing a gender gap of 5%.
• Served by other formal financial institutions (non-bank): A large portion of
women (71% or 2.8 million), have or use products or services from financial
institutions that are regulated through acts of law but are not commercial
banks. This is mainly driven by the uptake of mobile money, as well as the
continued increase of Umurenge SACCOs. About 32% of women in Rwanda
are members of Umurenge SACCOs (compared to 37% of men). The gender
gap between men (80%) and women (71%) served by other formal financial
institutions has decreased by 9% since 2016, but the gender disparity
remains high.
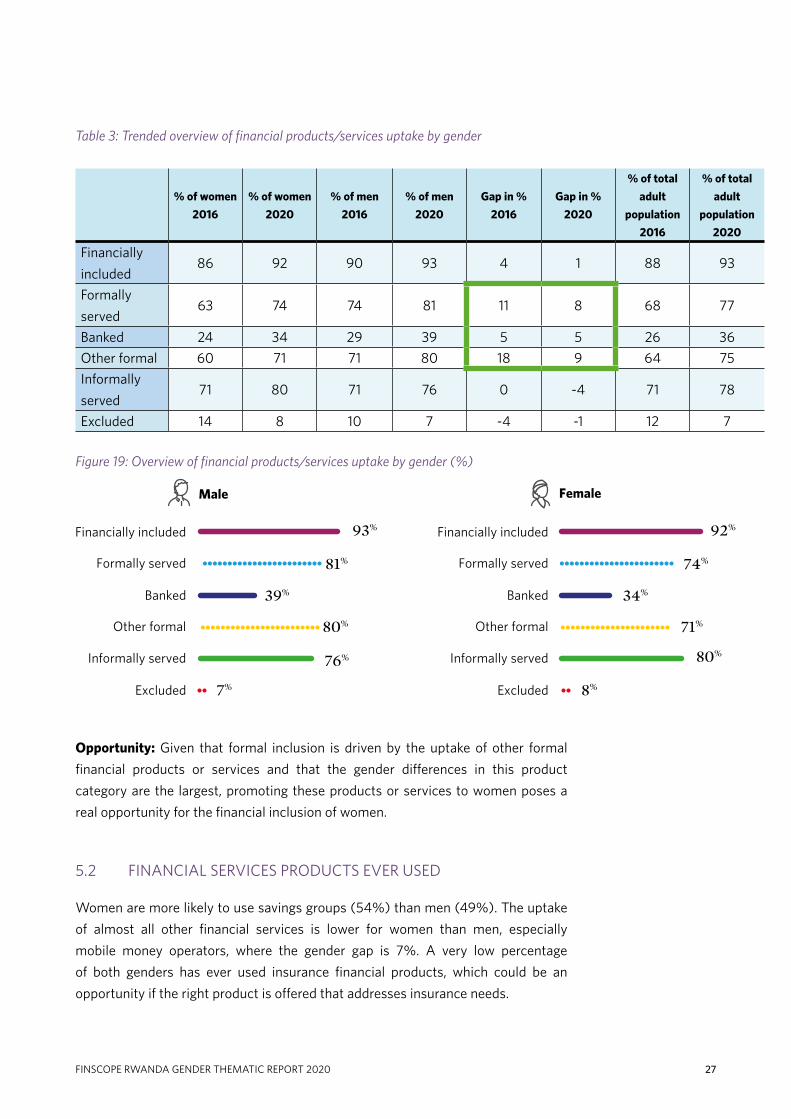
Figure 18: Overview of financial products/services uptake by gender (%)
Financially included
Formally served
Other formal
Informally served
Excluded
Banked
92%
74%
34%
71%
80%
8%
Female
Financially included
Formally served
Other formal
Informally served
Excluded
Banked
93%
81%
39%
80%
76%
7%
Male
27 FINSCOPE RWANDA GENDER THEMATIC REPORT 2020
Table 3: Trended overview of financial products/services uptake by gender
% of women
2016
% of women
2020
% of men
2016
% of men
2020
Gap in %
2016
Gap in %
2020
% of total
adult
population
2016
% of total
adult
population
2020
Financially
included86 92 90 93 4 1 88 93
Formally
served63 74 74 81 11 8 68 77
Banked 24 34 29 39 5 5 26 36
Other formal 60 71 71 80 18 9 64 75
Informally
served71 80 71 76 0 -4 71 78
Excluded 14 8 10 7 -4 -1 12 7
Figure 19: Overview of financial products/services uptake by gender (%)
Opportunity: Given that formal inclusion is driven by the uptake of other formal
financial products or services and that the gender differences in this product
category are the largest, promoting these products or services to women poses a
real opportunity for the financial inclusion of women.
5.2 FINANCIAL SERVICES PRODUCTS EVER USED
Women are more likely to use savings groups (54%) than men (49%). The uptake
of almost all other financial services is lower for women than men, especially
mobile money operators, where the gender gap is 7%. A very low percentage
of both genders has ever used insurance financial products, which could be an
opportunity if the right product is offered that addresses insurance needs.
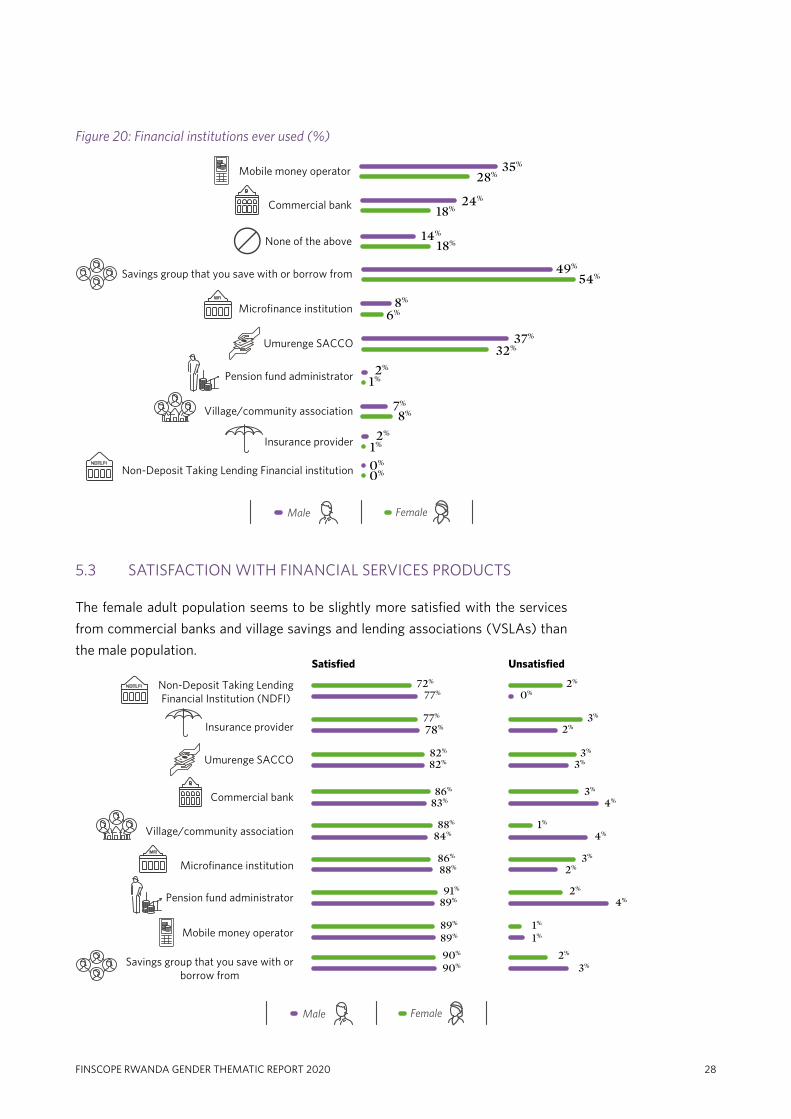
Figure 18: Overview of financial products/services uptake by gender (%)
Mobile money operator 35%
28%
Commercial bank 24%
18%
None of the above 14%
18%
Microfinance institution 8%
6%
Insurance provider 2%
1%
Non-Deposit Taking Lending Financial institution 0%0%
Village/community association 7%
8%
Savings group that you save with or borrow from 49%
54%
Male Female
Umurenge SACCO 37%
32%
Pension fund administrator 2%
1%
NDTLFI
Non-Deposit Taking LendingFinancial Institution (NDFI)
Satisfied Unsatisfied
Insurance provider
Umurenge SACCO
Commercial bank
Village/community association
Microfinance institution
Pension fund administrator
Mobile money operator
Savings group that you save with orborrow from
72%
77%
77%
78%
82%
82%
86%
88%
91%
89%
89%
89%
90%
90%
86%
83%
88%
84%
2%
0%
3%
2%
3%
3%
3%
2%
2%
4%
1%
1%
2%
3%
3%
4%
1%
4%
Figure 20: Satisfaction with financial services products
Male Female
NDTLFI
28FINSCOPE RWANDA GENDER THEMATIC REPORT 2020
Figure 20: Financial institutions ever used (%)
5.3 SATISFACTION WITH FINANCIAL SERVICES PRODUCTS
The female adult population seems to be slightly more satisfied with the services
from commercial banks and village savings and lending associations (VSLAs) than
the male population.
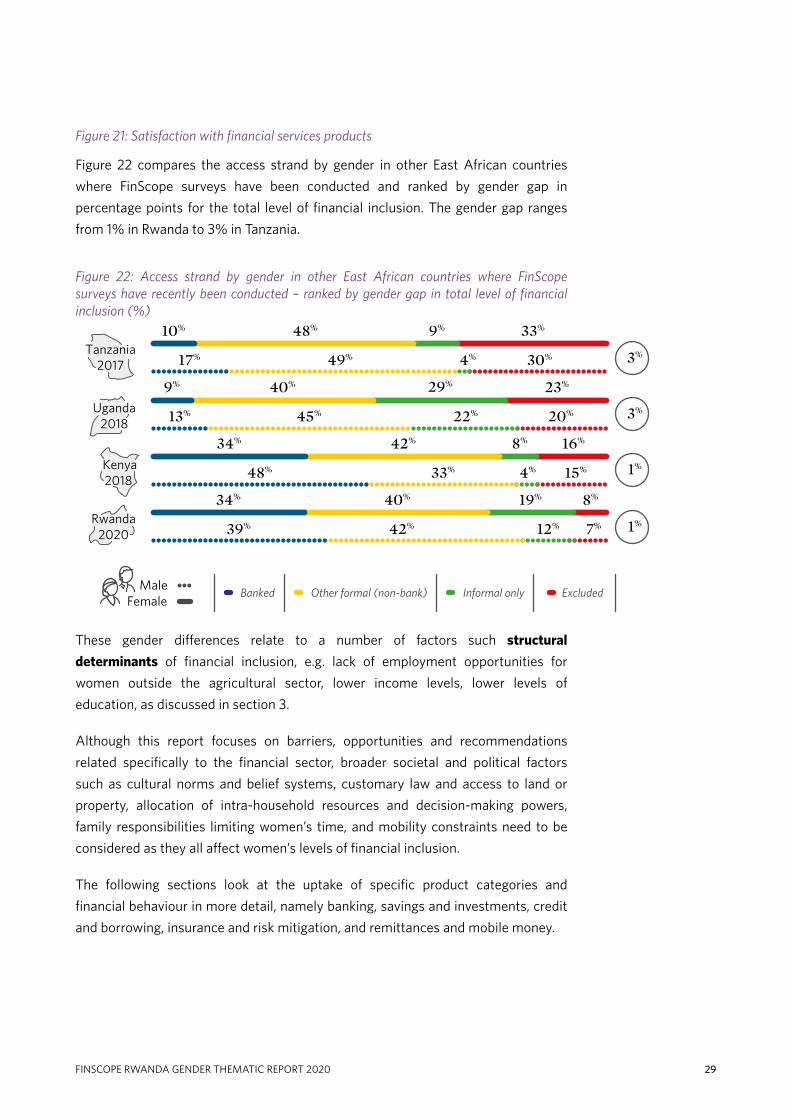
Figure 21: Access strand by gender in other East African countries where FinScope surveys have recently been conducted – ranked by gender gap in total level of financial inclusion (%)
Banked Other formal (non-bank) Informal only Excluded
10% 48% 9% 33%
17% 49% 4% 30%
9% 40% 29% 23%
34% 42% 8% 16%
48% 33% 4% 15%
34% 40% 19% 8%
39% 42% 12% 7%
13% 45% 22% 20%
Tanzania2017 3%
Uganda2018
Kenya2018
Rwanda2020
3%
1%
1%
MaleFemale
29 FINSCOPE RWANDA GENDER THEMATIC REPORT 2020
Figure 21: Satisfaction with financial services products
Figure 22 compares the access strand by gender in other East African countries
where FinScope surveys have been conducted and ranked by gender gap in
percentage points for the total level of financial inclusion. The gender gap ranges
from 1% in Rwanda to 3% in Tanzania.
Figure 22: Access strand by gender in other East African countries where FinScope surveys have recently been conducted – ranked by gender gap in total level of financial inclusion (%)
These gender differences relate to a number of factors such structural
determinants of financial inclusion, e.g. lack of employment opportunities for
women outside the agricultural sector, lower income levels, lower levels of
education, as discussed in section 3.
Although this report focuses on barriers, opportunities and recommendations
related specifically to the financial sector, broader societal and political factors
such as cultural norms and belief systems, customary law and access to land or
property, allocation of intra-household resources and decision-making powers,
family responsibilities limiting women’s time, and mobility constraints need to be
considered as they all affect women’s levels of financial inclusion.
The following sections look at the uptake of specific product categories and
financial behaviour in more detail, namely banking, savings and investments, credit
and borrowing, insurance and risk mitigation, and remittances and mobile money.

Figure 22: Banked population (%)
Own bank account Indirect banked Unbanked
22% 14% 64%
Total
26% 13% 61%
Male
19% 15% 66%
Female
30FINSCOPE RWANDA GENDER THEMATIC REPORT 2020
5.4 BANKING
Women who have access to bank products or services increased from 24% in
2016 to 34% (1.3 million) in 2020. Usage of banks among women is mainly
driven by the uptake of savings accounts, as well as current or cheque accounts.
Furthermore, they show a high level of cross-selling within the sector (i.e. multiple
accounts, multiple banking products per client). The increase in banked women is
driven by women who opened bank accounts in their own names, increasing from
12% in 2016 to 19% in 2020. Around one in five or 0.7 million women have bank
accounts in their own name, while an additional 15% or 0.5 million women use
bank accounts indirectly. They do this either through using banking channels (over
the counter6) or someone else’s account, but they do not have a bank account in
their own name. Figure 23 shows that women (15%) are more likely to be banked
indirectly than men (13%).
Almost all the banked women claim that their bank accounts help them to manage
their money better – optimising their money. Important factors that matter most in
a bank account include quality of customer service in a bank and convenient access
to bank branches.
Figure 23: Banked population by gender (%)
There is a high uptake of banking financial products and services among women
working in the formal sector (90%), albeit they lag their male counterparts in the
formal sector by 6%. Women business owners (51%) are less likely to have a bank
account compared to men business owners (58%).
There has also been an increase in women who earn a salary from farmers and
government institutions. Sadly, however, most of these women who earn a salary
from farmers and piece jobs still do not have enough money after covering daily
6 Other banking services refer to banking services over the counter (OTC), e.g. paying school fees, receiving income and remitting through a bank without having an account in their name, which is more popular among women than men
31 FINSCOPE RWANDA GENDER THEMATIC REPORT 2020
expenses to warrant a bank account. These livelihoods are often related to irregular
and low levels of income and as such women generating their income from farming
activities are less likely to prioritise the use of financial products or services.
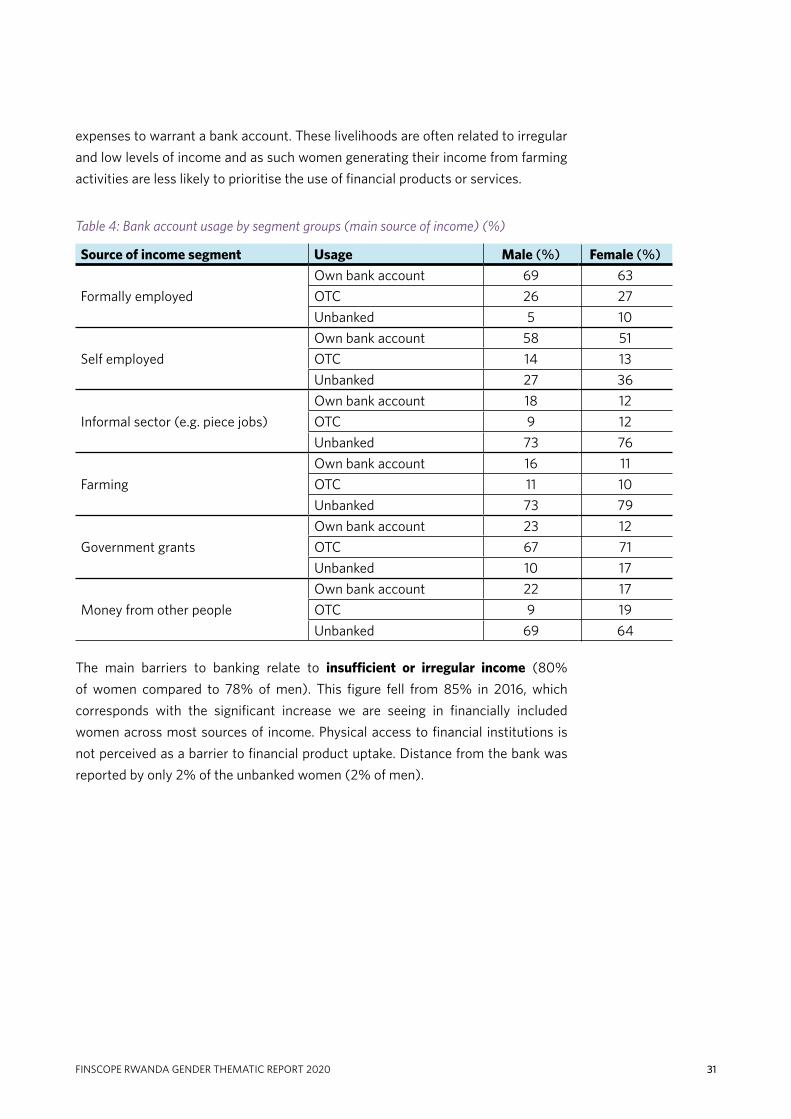
Table 4: Bank account usage by segment groups (main source of income) (%)
Source of income segment Usage Male (%) Female (%)
Formally employed
Own bank account 69 63
OTC 26 27
Unbanked 5 10
Self employed
Own bank account 58 51
OTC 14 13
Unbanked 27 36
Informal sector (e.g. piece jobs)
Own bank account 18 12
OTC 9 12
Unbanked 73 76
Farming
Own bank account 16 11
OTC 11 10
Unbanked 73 79
Government grants
Own bank account 23 12
OTC 67 71
Unbanked 10 17
Money from other people
Own bank account 22 17
OTC 9 19
Unbanked 69 64
The main barriers to banking relate to insufficient or irregular income (80%
of women compared to 78% of men). This figure fell from 85% in 2016, which
corresponds with the significant increase we are seeing in financially included
women across most sources of income. Physical access to financial institutions is
not perceived as a barrier to financial product uptake. Distance from the bank was
reported by only 2% of the unbanked women (2% of men).
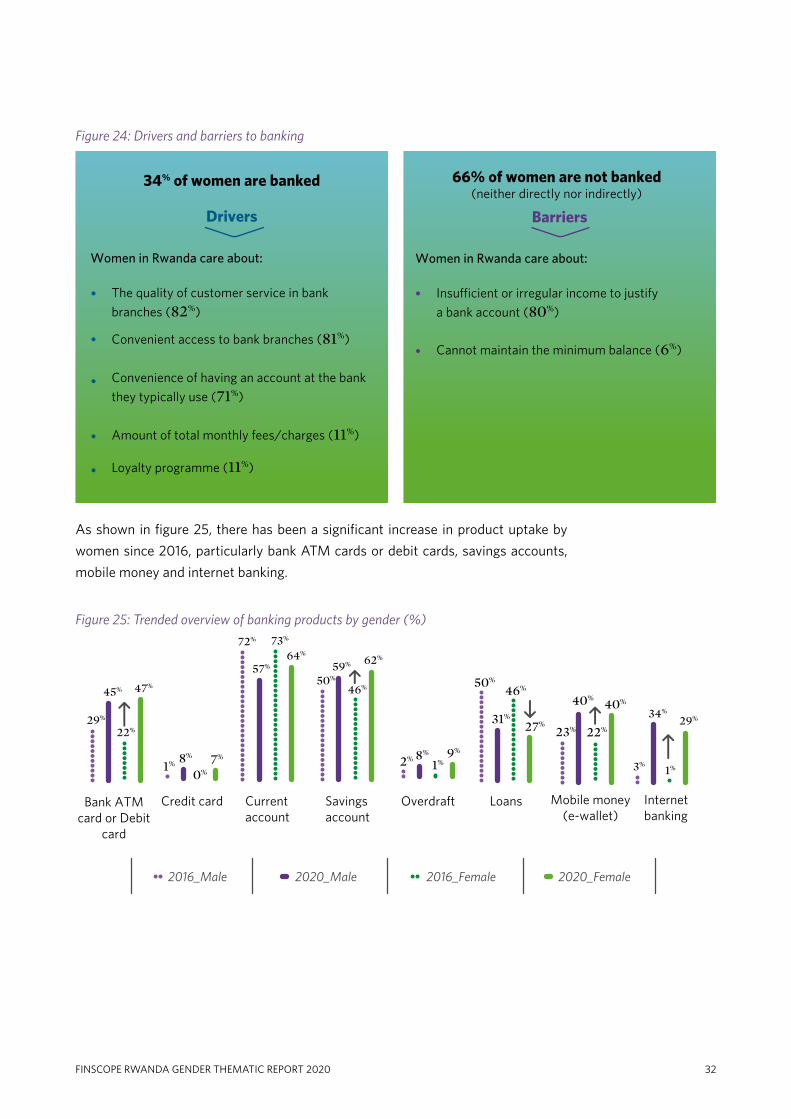
Women in Rwanda care about:
The quality of customer service in bank
branches (82%)
Convenient access to bank branches (81%)
Convenience of having an account at the bank
they typically use (71%)
Amount of total monthly fees/charges (11%)
Loyalty programme (11%)
34% of women are banked
Women in Rwanda care about:
Insufficient or irregular income to justify
a bank account (80%)
Cannot maintain the minimum balance (6%)
66% of women are not banked(neither directly nor indirectly)
Drivers Barriers
2016_Male 2020_Male 2016_Female 2020_Female
Currentaccount
57%
72% 73%
64%
Credit card
1% 8%
0%7%
Overdraft
2% 8%
1%9%
Bank ATMcard or Debit
card
45%
29%
22%
47%
Savingsaccount
59%
50%
46%
62%
Mobile money(e-wallet)
23%
40%
22%
40%
Loans
50%
31%
46%
27%
Internetbanking
34%
3%1%
29%
32FINSCOPE RWANDA GENDER THEMATIC REPORT 2020
Figure 24: Drivers and barriers to banking
As shown in figure 25, there has been a significant increase in product uptake by
women since 2016, particularly bank ATM cards or debit cards, savings accounts,
mobile money and internet banking.
Figure 25: Trended overview of banking products by gender (%)
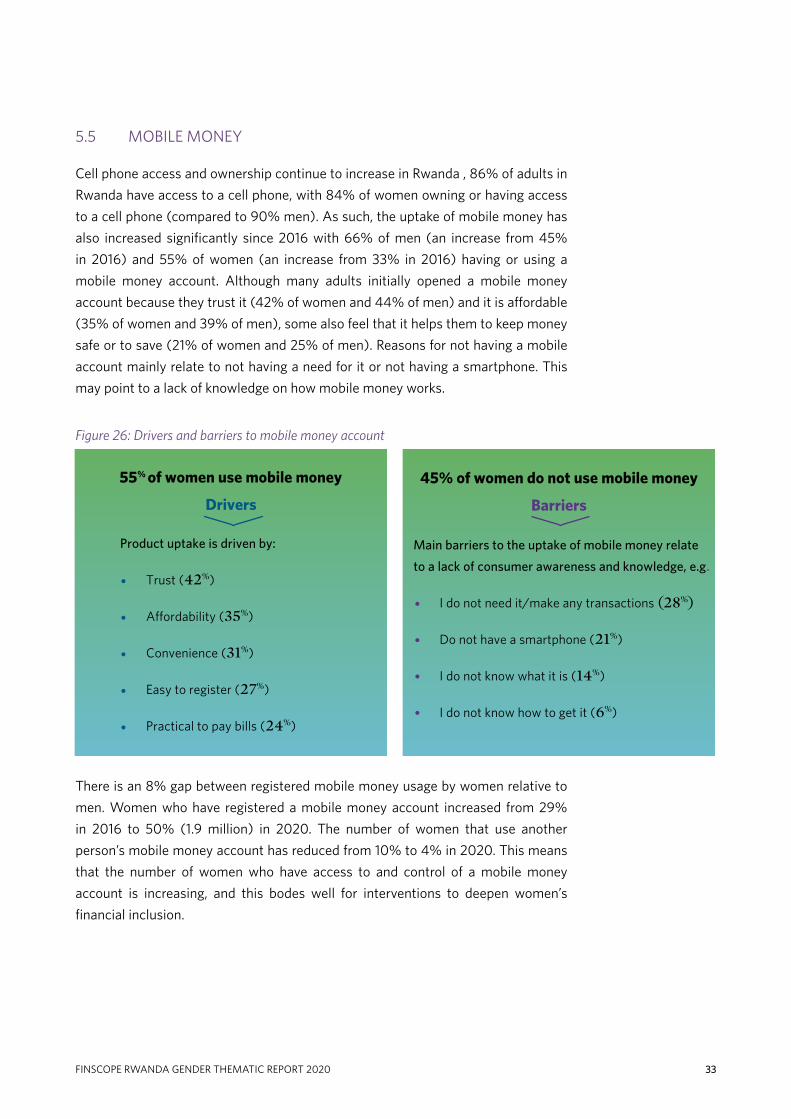
Drivers
55% of women use mobile money
Product uptake is driven by:
Trust (42%)
Affordability (35%)
Convenience (31%)
Easy to register (27%)
Practical to pay bills (24%)
Barriers
45% of women do not use mobile money
Main barriers to the uptake of mobile money relate
to a lack of consumer awareness and knowledge, e.g.
I do not need it/make any transactions (28%)
Do not have a smartphone (21%)
I do not know what it is (14%)
I do not know how to get it (6%)
33 FINSCOPE RWANDA GENDER THEMATIC REPORT 2020
5.5 MOBILE MONEY
Cell phone access and ownership continue to increase in Rwanda , 86% of adults in
Rwanda have access to a cell phone, with 84% of women owning or having access
to a cell phone (compared to 90% men). As such, the uptake of mobile money has
also increased significantly since 2016 with 66% of men (an increase from 45%
in 2016) and 55% of women (an increase from 33% in 2016) having or using a
mobile money account. Although many adults initially opened a mobile money
account because they trust it (42% of women and 44% of men) and it is affordable
(35% of women and 39% of men), some also feel that it helps them to keep money
safe or to save (21% of women and 25% of men). Reasons for not having a mobile
account mainly relate to not having a need for it or not having a smartphone. This
may point to a lack of knowledge on how mobile money works.
Figure 26: Drivers and barriers to mobile money account
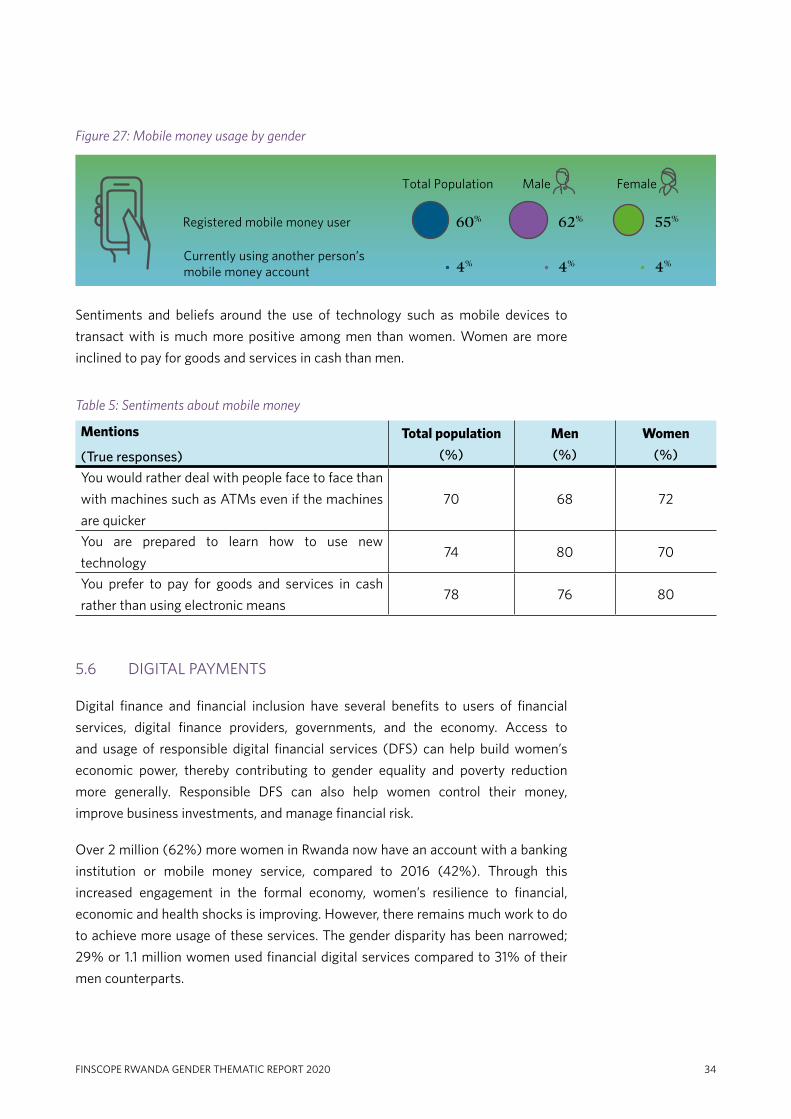
There is an 8% gap between registered mobile money usage by women relative to
men. Women who have registered a mobile money account increased from 29%
in 2016 to 50% (1.9 million) in 2020. The number of women that use another
person’s mobile money account has reduced from 10% to 4% in 2020. This means
that the number of women who have access to and control of a mobile money
account is increasing, and this bodes well for interventions to deepen women’s
financial inclusion.
60%
4%
62%
4%
55%
4%
Total Population Male Female
Registered mobile money user
Currently using another person’s mobile money account
34FINSCOPE RWANDA GENDER THEMATIC REPORT 2020
Figure 27: Mobile money usage by gender
Sentiments and beliefs around the use of technology such as mobile devices to
transact with is much more positive among men than women. Women are more
inclined to pay for goods and services in cash than men.
Table 5: Sentiments about mobile money
5.6 DIGITAL PAYMENTS
Digital finance and financial inclusion have several benefits to users of financial
services, digital finance providers, governments, and the economy. Access to
and usage of responsible digital financial services (DFS) can help build women’s
economic power, thereby contributing to gender equality and poverty reduction
more generally. Responsible DFS can also help women control their money,
improve business investments, and manage financial risk.
Over 2 million (62%) more women in Rwanda now have an account with a banking
institution or mobile money service, compared to 2016 (42%). Through this
increased engagement in the formal economy, women’s resilience to financial,
economic and health shocks is improving. However, there remains much work to do
to achieve more usage of these services. The gender disparity has been narrowed;
29% or 1.1 million women used financial digital services compared to 31% of their
men counterparts.
Mentions
(True responses)
Total population
(%)
Men
(%)
Women
(%)
You would rather deal with people face to face than
with machines such as ATMs even if the machines
are quicker
70 68 72
You are prepared to learn how to use new
technology74 80 70
You prefer to pay for goods and services in cash
rather than using electronic means78 76 80
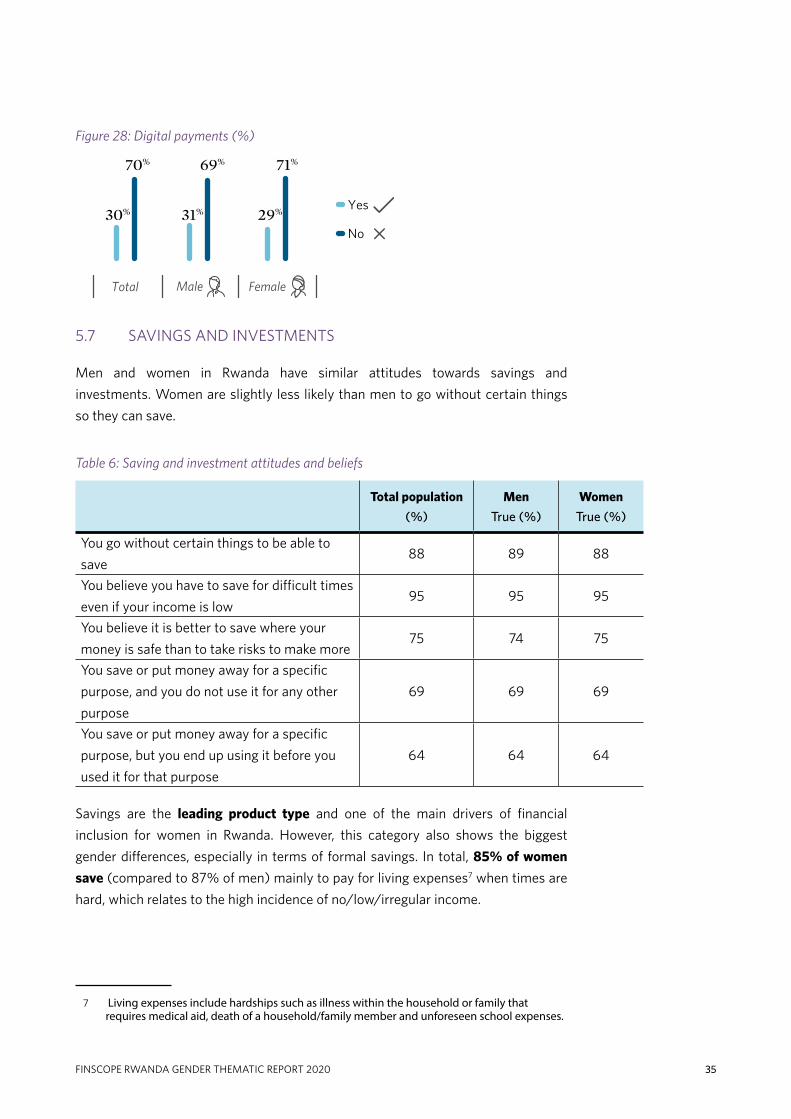
Figure 28: Digital payments (%)
31%
69%
29%
71%
30%
70%
Yes
No
Total Male Female
35 FINSCOPE RWANDA GENDER THEMATIC REPORT 2020
Figure 28: Digital payments (%)
5.7 SAVINGS AND INVESTMENTS
Men and women in Rwanda have similar attitudes towards savings and
investments. Women are slightly less likely than men to go without certain things
so they can save.
Table 6: Saving and investment attitudes and beliefs
Total population
(%)
Men
True (%)
Women
True (%)
You go without certain things to be able to
save88 89 88
You believe you have to save for difficult times
even if your income is low95 95 95
You believe it is better to save where your
money is safe than to take risks to make more75 74 75
You save or put money away for a specific
purpose, and you do not use it for any other
purpose
69 69 69
You save or put money away for a specific
purpose, but you end up using it before you
used it for that purpose
64 64 64
Savings are the leading product type and one of the main drivers of financial
inclusion for women in Rwanda. However, this category also shows the biggest
gender differences, especially in terms of formal savings. In total, 85% of women
save (compared to 87% of men) mainly to pay for living expenses7 when times are
hard, which relates to the high incidence of no/low/irregular income.
7 Living expenses include hardships such as illness within the household or family that requires medical aid, death of a household/family member and unforeseen school expenses.

85% of women save 15% of women do not save
Women in Rwanda mainly save:
To cover living expenses (63%)
Education or school fees (8%)
To buy livestock (7%)
To cover medical expenses/emergencies (6%)
Women do not save mainly due to
monetary reasons:
Do not have money to save/invest (69%)
Do not have a job (31%)
Too expensive (16%)
Do not have a bank account (13%)
Drivers Barriers
36FINSCOPE RWANDA GENDER THEMATIC REPORT 2020
Men and women in Rwanda have slightly different ways of describing what it
means to save. Men are more likely to believe that to save means putting money
in a special place/account to keep it safe than women, while more women feel that
buying an asset that could be sold later is a form of saving than men.
Table 7: Definition of saving between men and women
In turn, 15% of women do not save, mainly because they do not have money to
save or invest. Men and women who do save seem to save for similar reasons.
However, there are some (minor) gender differences in terms of barriers that
prevent women from saving. More women than men mentioned that they do not
save because of monetary reasons: they do not have money to save/invest (69%
of women compared to 73% of men), they do not have a job (31% of women
compared to 25% of men), they find it too expensive (16% compared to 14%,
respectively).
Figure 29: Drivers and barriers between women who save and do not save
Definition of saving Total (%) Men (%)Women
(%)
Putting money in a special place/account to keep it safe 21 23 19
Putting money aside to stop you from spending it
immediately so that you have it later when you need it14 13 15
Putting money away so that the total amount increases
over time as you put more away13 14 13
Putting money aside for you to use later for a specific
purpose24 23 24
Buying an asset that could be sold later 28 27 29
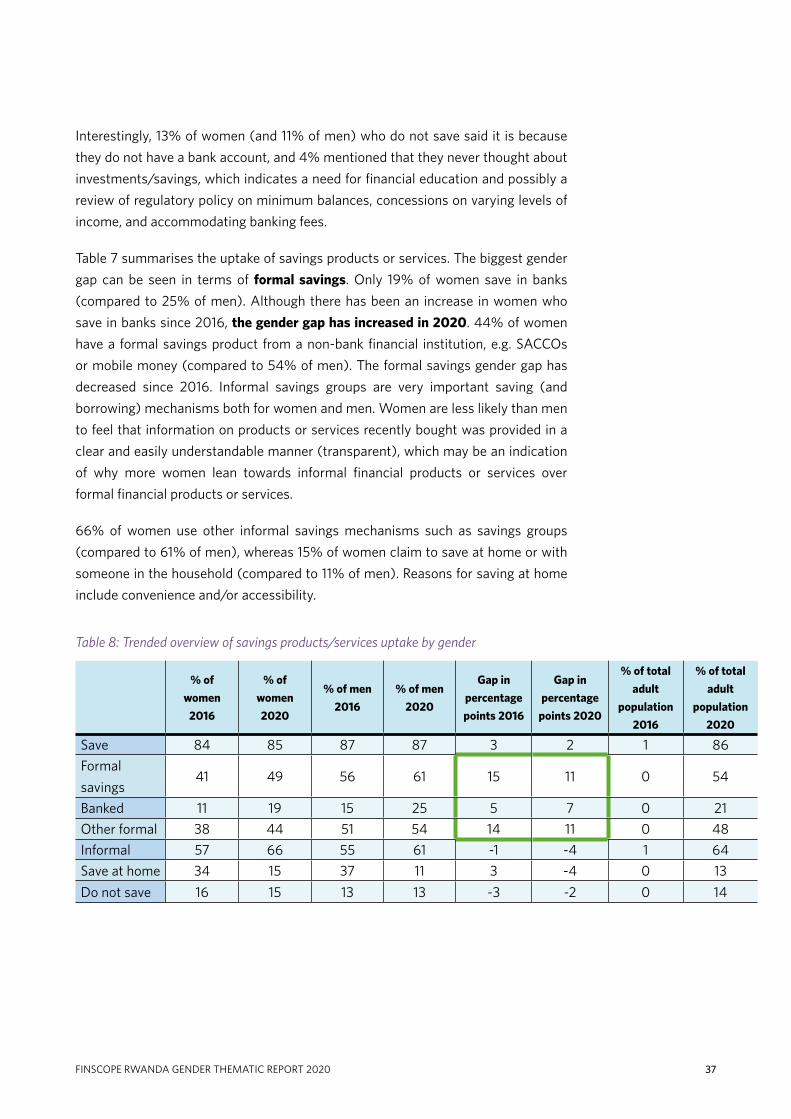
37 FINSCOPE RWANDA GENDER THEMATIC REPORT 2020
Interestingly, 13% of women (and 11% of men) who do not save said it is because
they do not have a bank account, and 4% mentioned that they never thought about
investments/savings, which indicates a need for financial education and possibly a
review of regulatory policy on minimum balances, concessions on varying levels of
income, and accommodating banking fees.
Table 7 summarises the uptake of savings products or services. The biggest gender
gap can be seen in terms of formal savings. Only 19% of women save in banks
(compared to 25% of men). Although there has been an increase in women who
save in banks since 2016, the gender gap has increased in 2020. 44% of women
have a formal savings product from a non-bank financial institution, e.g. SACCOs
or mobile money (compared to 54% of men). The formal savings gender gap has
decreased since 2016. Informal savings groups are very important saving (and
borrowing) mechanisms both for women and men. Women are less likely than men
to feel that information on products or services recently bought was provided in a
clear and easily understandable manner (transparent), which may be an indication
of why more women lean towards informal financial products or services over
formal financial products or services.
66% of women use other informal savings mechanisms such as savings groups
(compared to 61% of men), whereas 15% of women claim to save at home or with
someone in the household (compared to 11% of men). Reasons for saving at home
include convenience and/or accessibility.
Table 8: Trended overview of savings products/services uptake by gender
% of
women
2016
% of
women
2020
% of men
2016
% of men
2020
Gap in
percentage
points 2016
Gap in
percentage
points 2020
% of total
adult
population
2016
% of total
adult
population
2020
Save 84 85 87 87 3 2 1 86
Formal
savings41 49 56 61 15 11 0 54
Banked 11 19 15 25 5 7 0 21
Other formal 38 44 51 54 14 11 0 48
Informal 57 66 55 61 -1 -4 1 64
Save at home 34 15 37 11 3 -4 0 13
Do not save 16 15 13 13 -3 -2 0 14
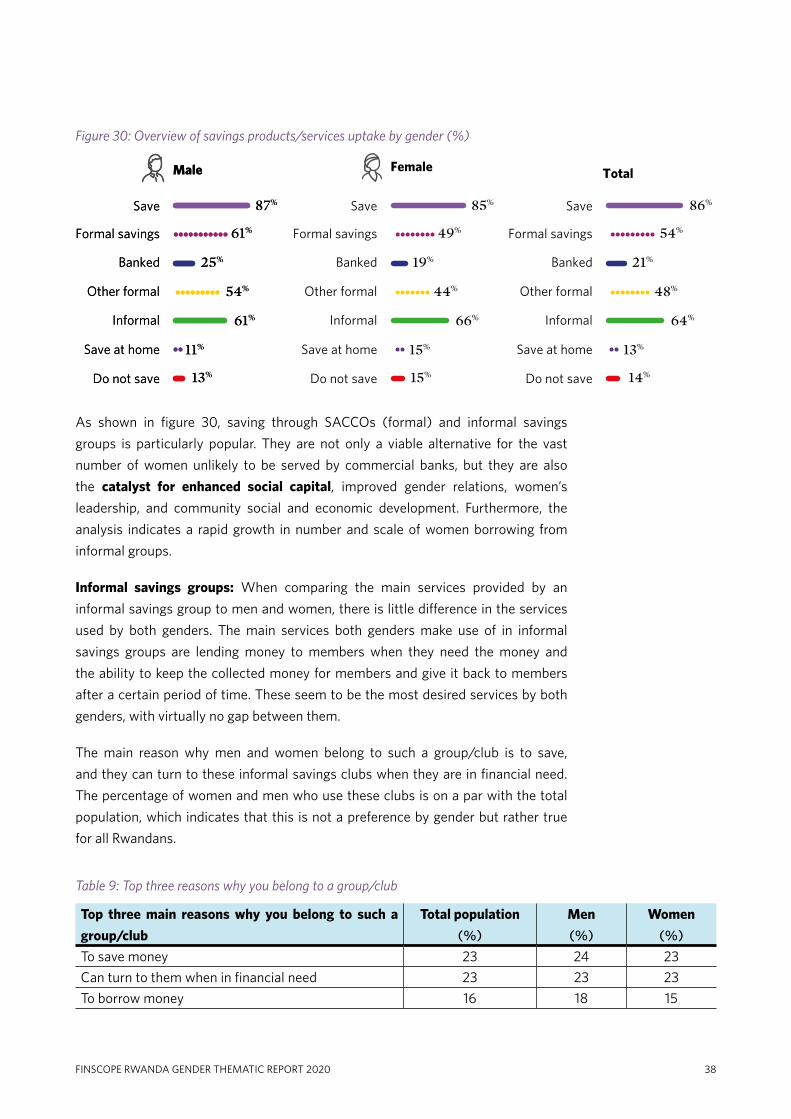
Save
Formal savings
Other formal
Informal
Save at home
Do not save
Banked
86%
54%
21%
48%
64%
13%
14%
Total
Figure 30: Overview of savings products/services uptake by gender (%)
Save
Formal savings
Other formal
Informal
Save at home
Do not save
Banked
85%
49%
19%
44%
66%
15%
15%
Female
Save
Formal savings
Other formal
Informal
Save at home
Do not save
Banked
87%
61%
25%
54%
61%
11%
13%
Male
Save
Formal savings
Other formal
Informal
Save at home
Do not save
Banked
87%
61%
25%
54%
61%
11%
13%
Male
38FINSCOPE RWANDA GENDER THEMATIC REPORT 2020
Figure 30: Overview of savings products/services uptake by gender (%)
As shown in figure 30, saving through SACCOs (formal) and informal savings
groups is particularly popular. They are not only a viable alternative for the vast
number of women unlikely to be served by commercial banks, but they are also
the catalyst for enhanced social capital, improved gender relations, women’s
leadership, and community social and economic development. Furthermore, the
analysis indicates a rapid growth in number and scale of women borrowing from
informal groups.
Informal savings groups: When comparing the main services provided by an
informal savings group to men and women, there is little difference in the services
used by both genders. The main services both genders make use of in informal
savings groups are lending money to members when they need the money and
the ability to keep the collected money for members and give it back to members
after a certain period of time. These seem to be the most desired services by both
genders, with virtually no gap between them.
The main reason why men and women belong to such a group/club is to save,
and they can turn to these informal savings clubs when they are in financial need.
The percentage of women and men who use these clubs is on a par with the total
population, which indicates that this is not a preference by gender but rather true
for all Rwandans.
Table 9: Top three reasons why you belong to a group/club
Top three main reasons why you belong to such a
group/club
Total population
(%)
Men
(%)
Women
(%)
To save money 23 24 23
Can turn to them when in financial need 23 23 23
To borrow money 16 18 15

39 FINSCOPE RWANDA GENDER THEMATIC REPORT 2020
5.8 BORROWING AND CREDIT
Overall sentiments towards borrowing between men and women are aligned with
no gap; 76% of men reported that they have borrowed, relative to 77% of women.
The overall sentiment for most Rwandans about a credit facility is that they prefer
to save money for something rather than borrowing to pay for it, and that they are
aware of the consequences of defaulting on a loan. So, they avoid borrowing money
if they can. However, we do see a high percentage of men and women borrowing
money and a sentiment towards keeping savings rather than using them to pay
debt.
Table 10: Overall sentiments towards borrowing
Sentiment to borrowing: Reason
(based on 1 = agree responses)
Total population
(%)
Men
(%)
Women
(%)
Be aware of the consequences of defaulting on a loan 89 91 88
Better to keep savings than to use them to pay a debt 78 77 78
Borrowing money when needed is more important
than the amount of money you have to pay back
66 66 65
Have checked credit history through Credit Reference
Bureau
18 20 16
If you borrow money, it is okay to pay it a bit later
than agreed
25 26 25
Without borrowing money, you would not be able to
pay for children’s education
34 33 35
You avoid borrowing money if you can 69 69 69
You prefer to save money for something rather than
borrow to pay for it
90 89 90
Women are slightly more likely to borrow compared to men (especially from
informal sources). In total, 77% of women borrow (compared to 76% of men).
Women are more likely than men to borrow money to cover education and school
fees (26% of women who compared to 7% of men), buying land/dwelling (17%
of women compared to 12% of men) and emergencies other than medical (7%
compared to 1%, respectively].
Men are more likely than women to borrow money for developmental reasons
(such as business, building/improving dwelling, living expenses, farming
equipment/expenses, livestock) at 60% and 36%, respectively.
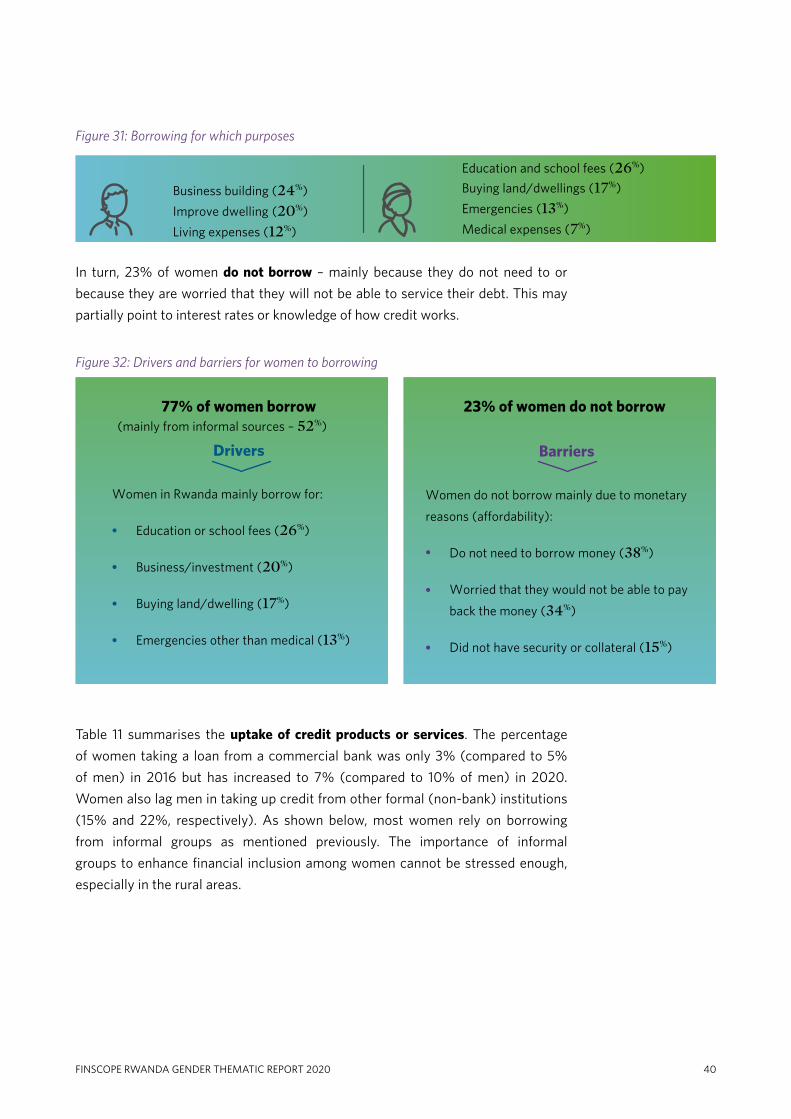
Buying land/dwellings (17%)Business building (24%)
Improve dwelling (20%)
Living expenses (12%)
Emergencies (13%)
Education and school fees (26%)
Medical expenses (7%)
23% of women do not borrow77% of women borrow(mainly from informal sources – 52%)
Women in Rwanda mainly borrow for:
Education or school fees (26%)
Business/investment (20%)
Buying land/dwelling (17%)
Emergencies other than medical (13%)
Women do not borrow mainly due to monetary
reasons (affordability):
Do not need to borrow money (38%)
Worried that they would not be able to pay
back the money (34%)
Did not have security or collateral (15%)
Drivers Barriers
40FINSCOPE RWANDA GENDER THEMATIC REPORT 2020
Figure 31: Borrowing for which purposes
In turn, 23% of women do not borrow – mainly because they do not need to or
because they are worried that they will not be able to service their debt. This may
partially point to interest rates or knowledge of how credit works.
Figure 32: Drivers and barriers for women to borrowing
Table 11 summarises the uptake of credit products or services. The percentage
of women taking a loan from a commercial bank was only 3% (compared to 5%
of men) in 2016 but has increased to 7% (compared to 10% of men) in 2020.
Women also lag men in taking up credit from other formal (non-bank) institutions
(15% and 22%, respectively). As shown below, most women rely on borrowing
from informal groups as mentioned previously. The importance of informal
groups to enhance financial inclusion among women cannot be stressed enough,
especially in the rural areas.
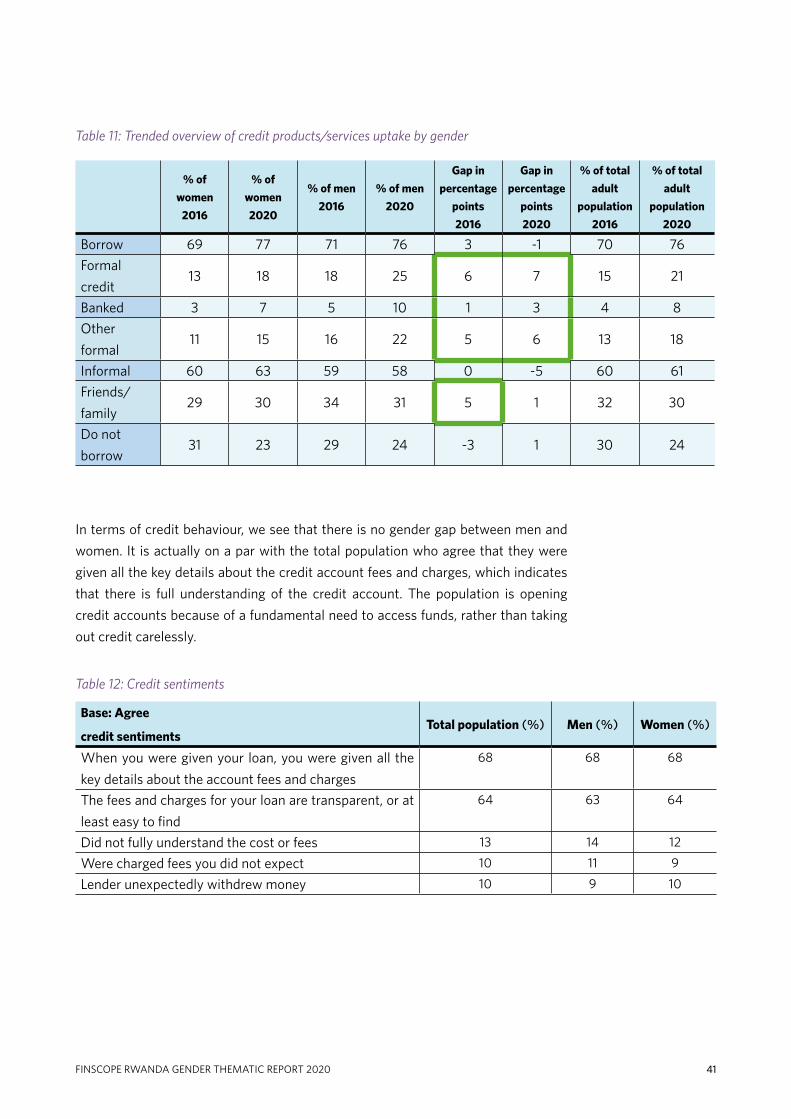
% of
women
2016
% of
women
2020
% of men
2016
% of men
2020
Gap in
percentage
points
2016
Gap in
percentage
points
2020
% of total
adult
population
2016
% of total
adult
population
2020
Borrow 69 77 71 76 3 -1 70 76
Formal
credit13 18 18 25 6 7 15 21
Banked 3 7 5 10 1 3 4 8
Other
formal11 15 16 22 5 6 13 18
Informal 60 63 59 58 0 -5 60 61
Friends/
family29 30 34 31 5 1 32 30
Do not
borrow31 23 29 24 -3 1 30 24
41 FINSCOPE RWANDA GENDER THEMATIC REPORT 2020
Table 11: Trended overview of credit products/services uptake by gender
In terms of credit behaviour, we see that there is no gender gap between men and
women. It is actually on a par with the total population who agree that they were
given all the key details about the credit account fees and charges, which indicates
that there is full understanding of the credit account. The population is opening
credit accounts because of a fundamental need to access funds, rather than taking
out credit carelessly.
Table 12: Credit sentiments
Base: Agree
credit sentimentsTotal population (%) Men (%) Women (%)
When you were given your loan, you were given all the
key details about the account fees and charges
68 68 68
The fees and charges for your loan are transparent, or at
least easy to find
64 63 64
Did not fully understand the cost or fees 13 14 12
Were charged fees you did not expect 10 11 9
Lender unexpectedly withdrew money 10 9 10
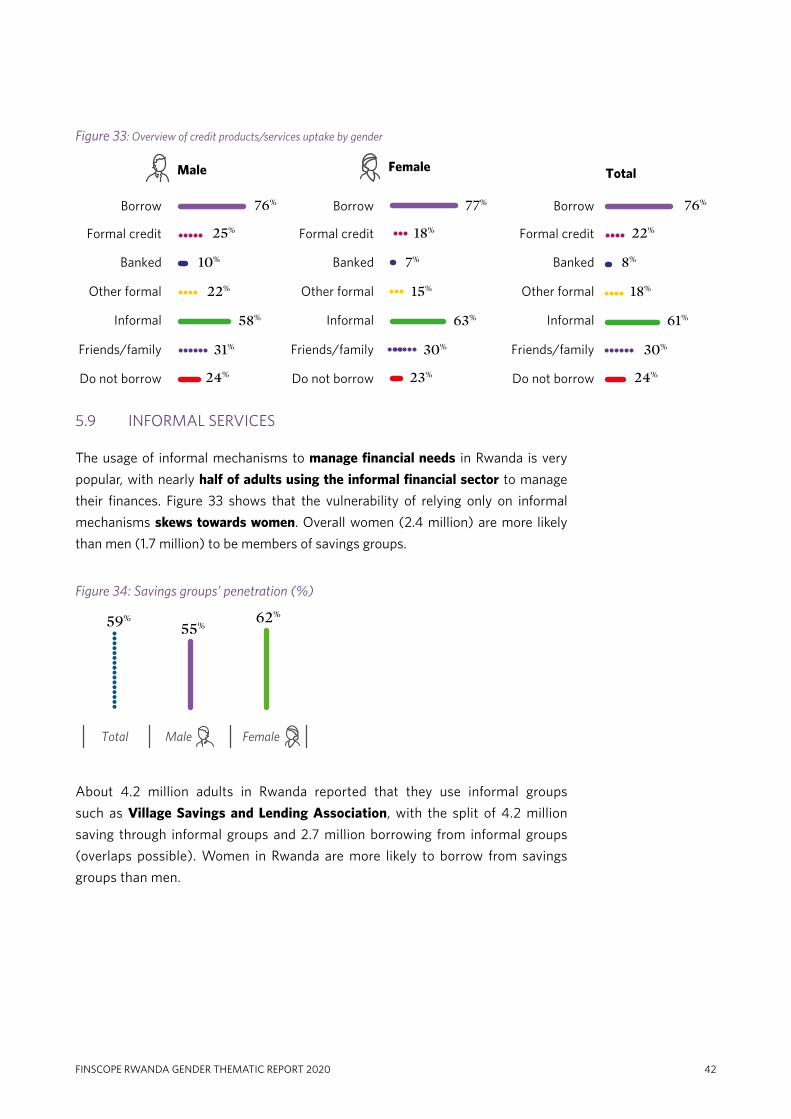
Borrow
Formal credit
Other formal
Informal
Friends/family
Do not borrow
Banked
76%
22%
8%
18%
61%
30%
24%
Total
Borrow
Formal credit
Other formal
Informal
Friends/family
Do not borrow
Banked
76%
25%
10%
22%
58%
31%
24%
Male
Borrow
Formal credit
Other formal
Informal
Friends/family
Do not borrow
Banked
77%
18%
7%
15%
63%
30%
23%
Female
59%55%
62%
Total Male Female
42FINSCOPE RWANDA GENDER THEMATIC REPORT 2020
Figure 33: Overview of credit products/services uptake by gender
5.9 INFORMAL SERVICES
The usage of informal mechanisms to manage financial needs in Rwanda is very
popular, with nearly half of adults using the informal financial sector to manage
their finances. Figure 33 shows that the vulnerability of relying only on informal
mechanisms skews towards women. Overall women (2.4 million) are more likely
than men (1.7 million) to be members of savings groups.
Figure 34: Savings groups’ penetration (%)
About 4.2 million adults in Rwanda reported that they use informal groups
such as Village Savings and Lending Association, with the split of 4.2 million
saving through informal groups and 2.7 million borrowing from informal groups
(overlaps possible). Women in Rwanda are more likely to borrow from savings
groups than men.

59%
33%39%
55%
31%36%
62%
33%41% Savings
Credit
Credit shop
Total Male Female
23%
23%
23%
15%
18%
16%
17%
15%
16%
12%
13%
13%
5%
5%
5%
3%
2%
3%
To save money
Can turn to them when in financial need
To borrow money
Can get money easily when needed
They give financial advice
I trust and know them
To socialise or meet friends
23%
24%
23%
Total Male Female
43 FINSCOPE RWANDA GENDER THEMATIC REPORT 2020
Figure 35: Drivers of informal mechanisms (%)
The main reason for belonging to a savings group is to save, while a secondary
driver is to have someone to turn to when in financial need.
Figure 36: Main reason for belonging to informal mechanism (%)
5.10 INSURANCE AND RISK MITIGATION
More women have taken out insurance products since 2016, when only 8% of
women were covered by insurance, compared to 15% (0.6 million) in 2020
(compared to 19% of men), which is mainly driven by the uptake of medical
insurance at 30% (compared to 38% of men).

Mentions
(Top 5 yes responses) (below 7% not included in table)Total population (%) Men (%) Women (%)
Have not experienced 39 41 37
Serious illness of a household member 34 33 35
Price increases 11 11 12
Death of a relative/household member 8 7 9
Agricultural crop/livestock destroyed by fire/flood/
storm
7 7 7
17% 83%
Total
Insured Not insured
15% 85%
Female
19% 81%
Male
44FINSCOPE RWANDA GENDER THEMATIC REPORT 2020
Figure 37: Insurance uptake by gender (%)
Micro-insurance: A very small percentage of the overall population has micro-
insurance when asked about it spontaneously. However, there is a high percentage
of interest in having such insurance by both genders – slightly more among men
(70% men to 68% women). Considering that most women earn a salary from
farming and selling what they farm from their rural areas, the risk factor for
losing crops and livestock is not known to or understood by them. This further
puts women at high risk of losing income and savings and making them more
vulnerable. There is, overall, only an average of 23% interest across 12 different
types of micro-insurance products and particularly 22% on average for women.
However, there is a recognition of interest for health insurance among women
(more so than men), which ties into women being more affected by life events of
serious illness in the household.
Medical insurance has a high penetration rate (88%) with most people covered
through a form of community health insurance, Mutuelles de Santé. Excluding this
form of insurance, however, risk cover is low in Rwanda.
Insurable risks: More women than men reported having been affected by a life
event that happened in the past 12 months that caused them to struggle to meet
expense commitments, which indicates a greater vulnerability among women.
More women also are affected than men by the serious illness of a household
member, which affects their ability to make ends meet.
Table 13: Life events
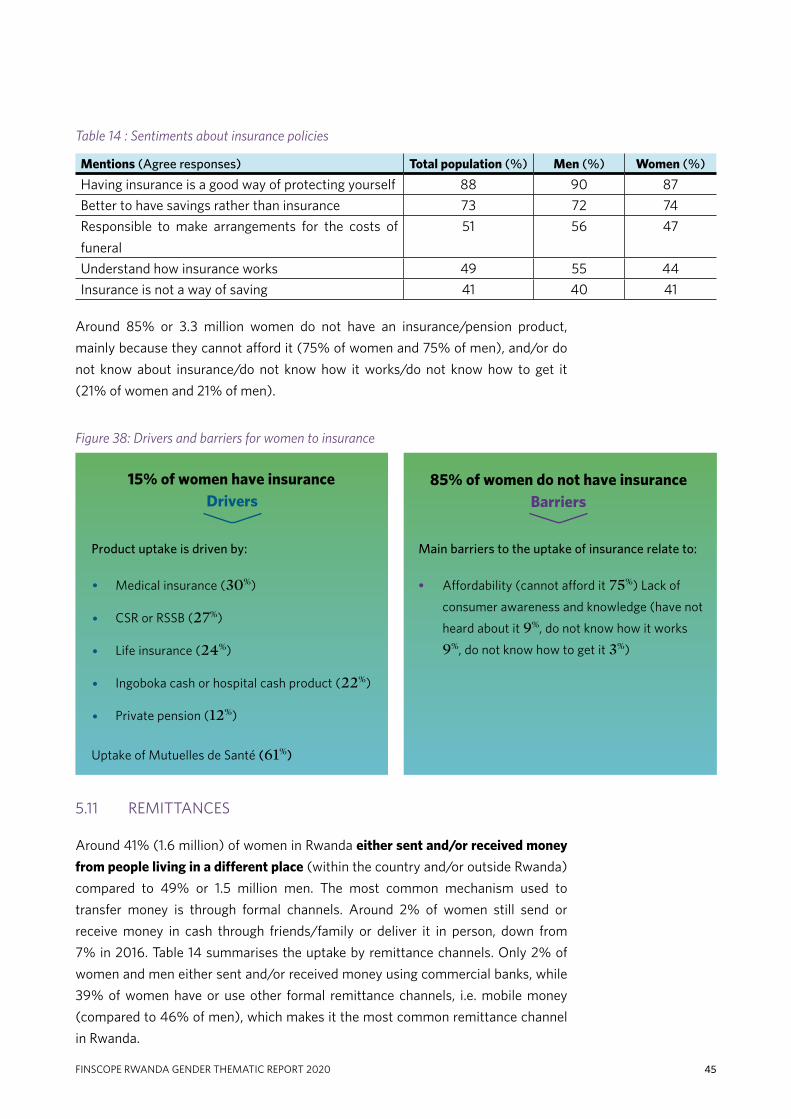
Drivers 15% of women have insurance
Barriers 85% of women do not have insurance
Product uptake is driven by:
Uptake of Mutuelles de Santé (61%)
Main barriers to the uptake of insurance relate to:
Affordability (cannot afford it 75%) Lack of
consumer awareness and knowledge (have not
heard about it 9%, do not know how it works
9%, do not know how to get it 3%)
Ingoboka cash or hospital cash product (22%)
Private pension (12%)
Life insurance (24%)
CSR or RSSB (27%)
Medical insurance (30%)
45 FINSCOPE RWANDA GENDER THEMATIC REPORT 2020
Table 14 : Sentiments about insurance policies
Mentions (Agree responses) Total population (%) Men (%) Women (%)
Having insurance is a good way of protecting yourself 88 90 87
Better to have savings rather than insurance 73 72 74
Responsible to make arrangements for the costs of
funeral
51 56 47
Understand how insurance works 49 55 44
Insurance is not a way of saving 41 40 41
Around 85% or 3.3 million women do not have an insurance/pension product,
mainly because they cannot afford it (75% of women and 75% of men), and/or do
not know about insurance/do not know how it works/do not know how to get it
(21% of women and 21% of men).
Figure 38: Drivers and barriers for women to insurance
5.11 REMITTANCES
Around 41% (1.6 million) of women in Rwanda either sent and/or received money
from people living in a different place (within the country and/or outside Rwanda)
compared to 49% or 1.5 million men. The most common mechanism used to
transfer money is through formal channels. Around 2% of women still send or
receive money in cash through friends/family or deliver it in person, down from
7% in 2016. Table 14 summarises the uptake by remittance channels. Only 2% of
women and men either sent and/or received money using commercial banks, while
39% of women have or use other formal remittance channels, i.e. mobile money
(compared to 46% of men), which makes it the most common remittance channel
in Rwanda.

Remit
Formal remittance
Other formal
Informal
Relative/friend/personal
Do not remit
Banked
4%
43%
2%
42%
0%
3%
5559% %
Total
Remit
Formal remittance
Other formal
InformalRelative/friend/
personal
Do not remit
Banked
49%
47%
2.5%
46%
0%
%
50%
Male
Remit
Formal remittance
Other formal
Informal
Relative/friend/personal
Do not remit
Banked
41%
39%
%
3%
0%
2%
Female
46FINSCOPE RWANDA GENDER THEMATIC REPORT 2020
Table 15: Trended overview of remittance channels by gender
% of
women
2016
% of
women
2020
% of men
2016
% of men
2020
Gap in
percentage
points
2016
Gap in
percentage
points
2020
% of total
adult
population
2016
% of total
adult
population
2020
Remit 40 41 48 49 9 8 43 45
Formal remittance 36 39 45 47 9 8 40 43
Banked 1 2 2 2 1 1 1 2
Other formal 35 39 44 46 9 8 39 42
Informal 0 0 0 0 0 0 0 0
Relative/fr iend/
personal7 2 6 3 -1 1 7 3
Do not remit 60 59 52 51 -9 -8 57 55
Figure 39: Overview of remittance channels by gender (%)
47 FINSCOPE RWANDA GENDER THEMATIC REPORT 2020
6. FINANCIAL NEEDS
The financial inclusion measurement agenda over past years has been evolving – the current perspective does not only measure if people are using financial services, but more: do the financial services they are using have an impact on their lives? This section and the next section (financial health) give an indication of whether the financial systems in Rwanda meet women’s underlying financial needs to help them to achieve positive outcomes. As can be seen from the quadrants in figure 40, women have financial needs across the four universal financial needs that include transfer of value (money), manage liquidity, resilience, and meeting goals.
Figure 40 shows that almost all adult women have a need to make a payment or
transfer money. Around three in five adult women in Rwanda have a transaction
account through either mobile money and/or a bank account. There is a gender
gap of 9%, with women with transactional accounts at 62% compared to 71% of
their men counterparts. However, the gap is reduced when it comes to using these
devices for digital payments; 29% or 1.2 million adult women use digital financial
services compared to 31% or 0.9 million of their male equivalents. Men (58%) are
more likely to be meeting life goals than women (50%). Further analysis shows
that women are more likely to have goals and aspirations in investing in businesses
(24%) and education (11%) than men (business at 20% and education at 9%).
Women have far more resilience than men to deal with unexpected shocks that
have an impact on them. This is supported throughout by the financial inclusion
gap of women overall. The Covid-19 outbreak may have shed new light on the
limited financial resilience of women. However, the Rwanda FinScope 2020 survey
shows that women’s livelihoods were more likely to cope with the serious illness
of a household member (47%), theft or destroyed agricultural crops or livestock
(12%) and the death of a relative/household member (10%). More women (46%
compared to 43% of their men counterparts) are in severe distress about meeting
expenses in each income life cycle, which correlates with the findings in this report.

43% 46%
100% 100%
59% 63%
58% 50%
Men% of yes
Women
Severe distress
Men% of yes
Women
% of yes
ResilienceThe ability to dealwith unexpected
shocks that have afinancial impact
Liquidity
The need to meetexpenses in each
income cycle
Transfer of valueSend money or
digital value fromone person to
another
Meeting goalsAchieve life objectives
or obligations that require funding across
income cycles
Financial needs framework – known as FinNeeds
Need: A collection of use cases that can be fulfilled by financial services
48FINSCOPE RWANDA GENDER THEMATIC REPORT 2020
Figure 40: FinNeeds
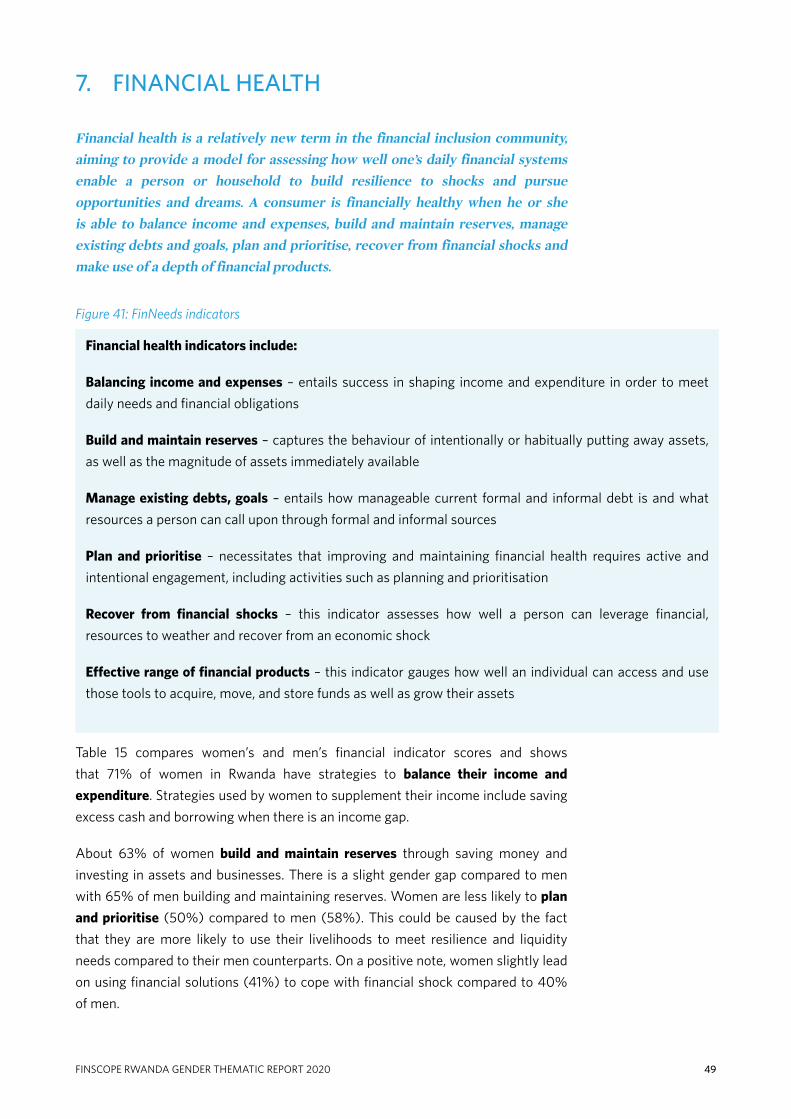
49 FINSCOPE RWANDA GENDER THEMATIC REPORT 2020
7. FINANCIAL HEALTH
Financial health is a relatively new term in the financial inclusion community, aiming to provide a model for assessing how well one’s daily financial systems enable a person or household to build resilience to shocks and pursue opportunities and dreams. A consumer is financially healthy when he or she is able to balance income and expenses, build and maintain reserves, manage existing debts and goals, plan and prioritise, recover from financial shocks and make use of a depth of financial products.
Figure 41: FinNeeds indicators
Table 15 compares women’s and men’s financial indicator scores and shows
that 71% of women in Rwanda have strategies to balance their income and
expenditure. Strategies used by women to supplement their income include saving
excess cash and borrowing when there is an income gap.
About 63% of women build and maintain reserves through saving money and
investing in assets and businesses. There is a slight gender gap compared to men
with 65% of men building and maintaining reserves. Women are less likely to plan
and prioritise (50%) compared to men (58%). This could be caused by the fact
that they are more likely to use their livelihoods to meet resilience and liquidity
needs compared to their men counterparts. On a positive note, women slightly lead
on using financial solutions (41%) to cope with financial shock compared to 40%
of men.
Financial health indicators include:
Balancing income and expenses – entails success in shaping income and expenditure in order to meet
daily needs and financial obligations
Build and maintain reserves – captures the behaviour of intentionally or habitually putting away assets,
as well as the magnitude of assets immediately available
Manage existing debts, goals – entails how manageable current formal and informal debt is and what
resources a person can call upon through formal and informal sources
Plan and prioritise – necessitates that improving and maintaining financial health requires active and
intentional engagement, including activities such as planning and prioritisation
Recover from financial shocks – this indicator assesses how well a person can leverage financial,
resources to weather and recover from an economic shock
Effective range of financial products – this indicator gauges how well an individual can access and use
those tools to acquire, move, and store funds as well as grow their assets
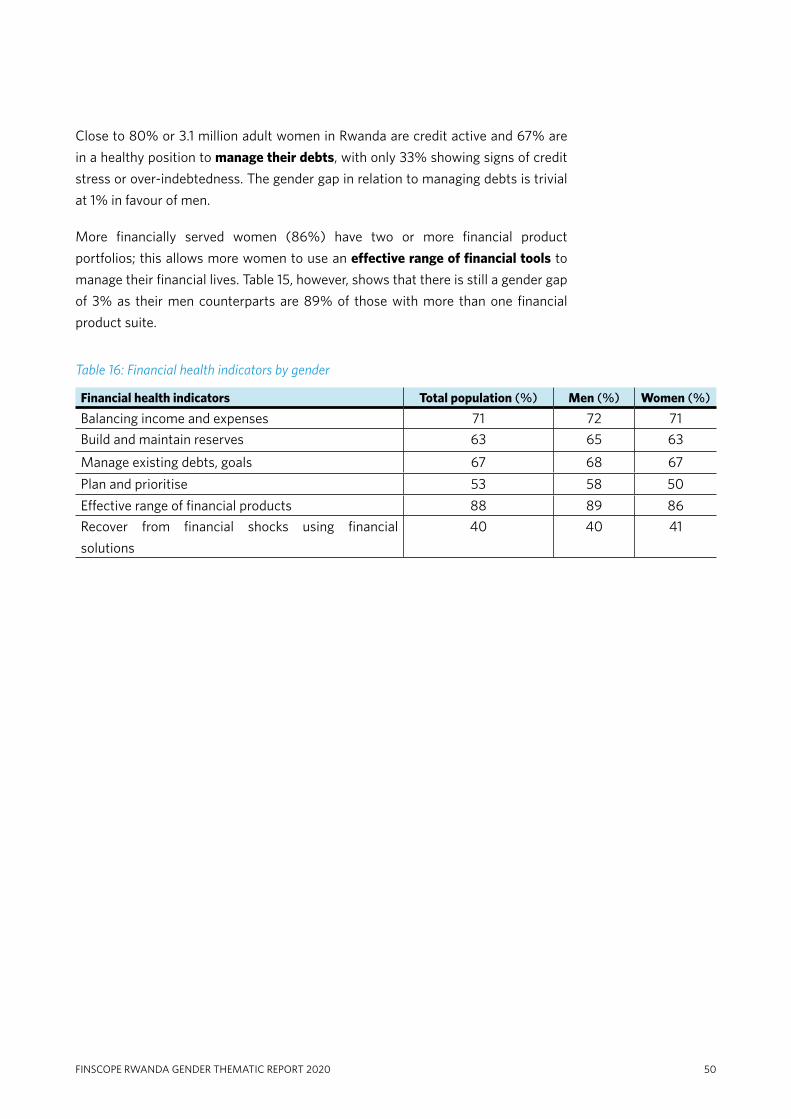
50FINSCOPE RWANDA GENDER THEMATIC REPORT 2020
Close to 80% or 3.1 million adult women in Rwanda are credit active and 67% are
in a healthy position to manage their debts, with only 33% showing signs of credit
stress or over-indebtedness. The gender gap in relation to managing debts is trivial
at 1% in favour of men.
More financially served women (86%) have two or more financial product
portfolios; this allows more women to use an effective range of financial tools to
manage their financial lives. Table 15, however, shows that there is still a gender gap
of 3% as their men counterparts are 89% of those with more than one financial
product suite.
Table 16: Financial health indicators by gender
Financial health indicators Total population (%) Men (%) Women (%)
Balancing income and expenses 71 72 71
Build and maintain reserves 63 65 63
Manage existing debts, goals 67 68 67
Plan and prioritise 53 58 50
Effective range of financial products 88 89 86
Recover from financial shocks using financial
solutions
40 40 41
51 FINSCOPE RWANDA GENDER THEMATIC REPORT 2020
• CONCLUSION
• RECOMMENDATIONS
52FINSCOPE RWANDA GENDER THEMATIC REPORT 2020

53 FINSCOPE RWANDA GENDER THEMATIC REPORT 2020
8. CONCLUSION
As shown in this report, financial inclusion among women in Rwanda is relatively high at 92% with a reduced gender gap from 4% in 2016 to 1% in 2020. Nevertheless, there is opportunity for further growth, especially in terms of deepening financial inclusion beyond access and moving towards a greater level of formal inclusion (particularly with regard to the uptake of banking products or services and mobile money services), which requires continued gender equality efforts, a holistic approach of poverty alleviation and development, constant innovation, financial education, as well as persistent monitoring of progress (e.g. using FinScope surveys and additional research).
GENDER EQUALITY
As shown in this report, various constraints might prevent women from engaging
with (formal) financial products or services. They refer to both specific ones related
to the financial sector and overarching structural issues such as cultural norms and
belief systems, low levels of education, lack of employment opportunities and lower
levels of income, access to property and land, decision-making power, etc. Therefore,
moving to a state in which financial inclusion is unaffected by gender requires a
holistic approach. Gender mainstreaming requires cooperation of the public and
private sector so that a gender equality perspective is incorporated at all levels.
HOLISTIC APPROACH TO POVERTY ALLEVIATION AND DEVELOPMENT
Women and men traditionally engage in different roles along social norms and
economic opportunities. This affects women’s demand for different financial
products and services. Women residing in rural areas, below 30 years of age
and above the age of 50, with no or low levels of formal education, and those
who generate an income from piece work or agricultural activities (including
those receiving a salary from a farmer) seem to be the most vulnerable in terms
of financial inclusion and therefore should be given priority. To meet the specific
challenges, they need a wide range of financial services that are tailored to their
needs as caretakers of their families, networkers in their communities, and
entrepreneurs – especially in the agricultural sector and on micro- and small-
enterprise level. As such, women seek safe and convenient ways to save, borrow,
and transact small amounts reflecting their low and often irregular income levels.
Given their greater levels of vulnerability, there might be a need for appropriate
means of risk management strategies and gender-sensitive financial products,
especially in the micro-insurance sector.

54FINSCOPE RWANDA GENDER THEMATIC REPORT 2020
FINANCIAL CAPABILITY
This gender-themed report shows a huge financial skills gap between women
and men. In addition, financial capability and confidence, especially with regard
to formal financial services, have also been shown to be key barriers (i.e. for the
uptake of mobile money and insurance), particularly for women that have little
or no experience with financial services. Consequently, access to information
and consumer education becomes important, which calls for further strategic
intervention from both the private and public sector. An improved understanding
of benefits, costs and risks of financial services increases the likelihood of the
beneficial use of appropriate financial services. Given that formal inclusion is driven
by the uptake of other formal financial products or services (i.e. mobile money)
and that the gender differences in this product category are the largest, promoting
these products and services to women poses a real opportunity for the financial
inclusion of women.
FINANCIAL HEALTH
Although women’s indicator scores are slightly lower than men’s, women’s
state of financial health shows some good, positive signs. Similar to the national
picture, there are however, visible shortfalls in the indicator areas of planning and
prioritising (time horizon for planning, types of goals, action steps towards goals),
and strategies used to cope with financial setbacks. The data show that women’s
goals and aspirations revolve around improving their economic wellbeing, whether
through starting a business or improving their education. The steps/devices
used towards meeting their goals do not show financial health confidence as the
majority of women use informal and non-financial methods to do so. This minimal
use of formal financial devices may suggest that the formal products currently
available do not meet women’s needs.

55 FINSCOPE RWANDA GENDER THEMATIC REPORT 2020
9. RECOMMENDATIONS
Financial inclusion is seen as a major driver of economic development in Rwanda. However, access to formal financial services by women is still limited across the country. Gender plays a particularly important role, as women are much more under-served (i.e. relying on informal mechanisms only) than men. The analysis in this report offers many opportunities for improving women’s financial inclusion in Rwanda.
Gender policy – continue with monitoring and evaluating the National Gender
Policy and Girls’ Education Sector Strategic Plan (2018/19 to 2023/24) as these
initiatives have proven successful in driving financial inclusion.
Small- and medium-enterprise development – females have the largest
proportion of dependents. The proposed strategy would be to assist women who
own businesses while also enabling more women to start their own businesses.
Engaging the needs of these females and establishing firm entrepreneur-led
businesses and farming will be key in expanding access to employment for other
females, who are dependents, involved in informal sectors and non-commercial
farming. Some of the strategies may include the following:
• Improving the supply chain and route-to-market for women residing in rural
areas, to stimulate the commercial opportunities and bring a trade flow to
these women through a collaborative community and government-driven
initiative.
• Providing subsidies and funding to enable women to participate more actively
in a trade environment where they can commercially thrive through provision
of equipment and services that they do not have to pay for themselves.
• Poverty alleviation and development (given the link between financial inclusion
and income), efforts need to be increased through creative, collaborative
community and public sector initiatives. Funding from various NGO, sustainable
development and other global funds should support these efforts.
Emphasise the focus on the usage and quality of the financial services – females’
use of digital financial services and economic platforms has the potential to unlock
opportunities and contribute positively to financial inclusion.
• Tailoring and personalising financial products and services to the specific
challenges and needs of women should take place where formal financial
services are not simply offering a commercial offer but disrupt the typical
offering to accommodate women’s current realities.
• Women are attracted to informal financial mechanisms for various reasons
– mostly because of the social element of it, the low cost, the convenience,
56FINSCOPE RWANDA GENDER THEMATIC REPORT 2020
and the ease of use. If these attributes are replicable in a more formal manner,
women should be open to using these services and products, but it will require
legislation, regulation and policy amendments by the formal financial service
providers.
Information dissemination – industry sectors (policy makers, NGOs and the
private sector) to recommend and share financial sector policy and make it
available to other stakeholders involved in the policy-making and advocacy process
(networks, associations and other civil society organisations as well as donor
agencies). These financial sector policy recommendations can be useful to set
women-financial-inclusion targets, to support the assessment of financial needs
and to design appropriate services for women according to their context (e.g. level
of education, daily activities and level of poverty).
• Continue to monitor progress across the transdisciplinary steps taken
for improvement of financial inclusion – incorporating all data to elevate
understanding and adjust initiatives and investments towards the financial
inclusion levels using a gender-sensitive approach.
Dedicated training/financial education programme targeted at women –
integrating financial literacy within school-level and adult basic education can play
a pivotal role in reducing the gender disparity. This could be achieved through the
following tactics:
• Increased awareness, especially among the predominant profile of women
residing in rural areas.
• Improving education for women on financial wellness based on practices of
making money from farming and other agricultural activities.
• Women’s attitudes and mindsets towards finances can be used as an asset as
most women are not irresponsible with their money.
• Closing the financial skills gap between men and women through educational
initiatives run through public sector and non-profit organisations can ensure
that women gain the confidence and skills needed to manage an informal
micro-enterprise that can support them financially.
57 FINSCOPE RWANDA GENDER THEMATIC REPORT 2020
Supporting the digital financial services – electronic money transfers are key to
lowering the cost of remittances for poor economies that heavily depend on such
transfers and technology. It is currently evolving so fast that costs will be significantly
lower in the near future, favouring local development and financial inclusion.
• Optimising the use of electronic means of financial transacting may be
another avenue to increase inclusion among, especially, younger women.
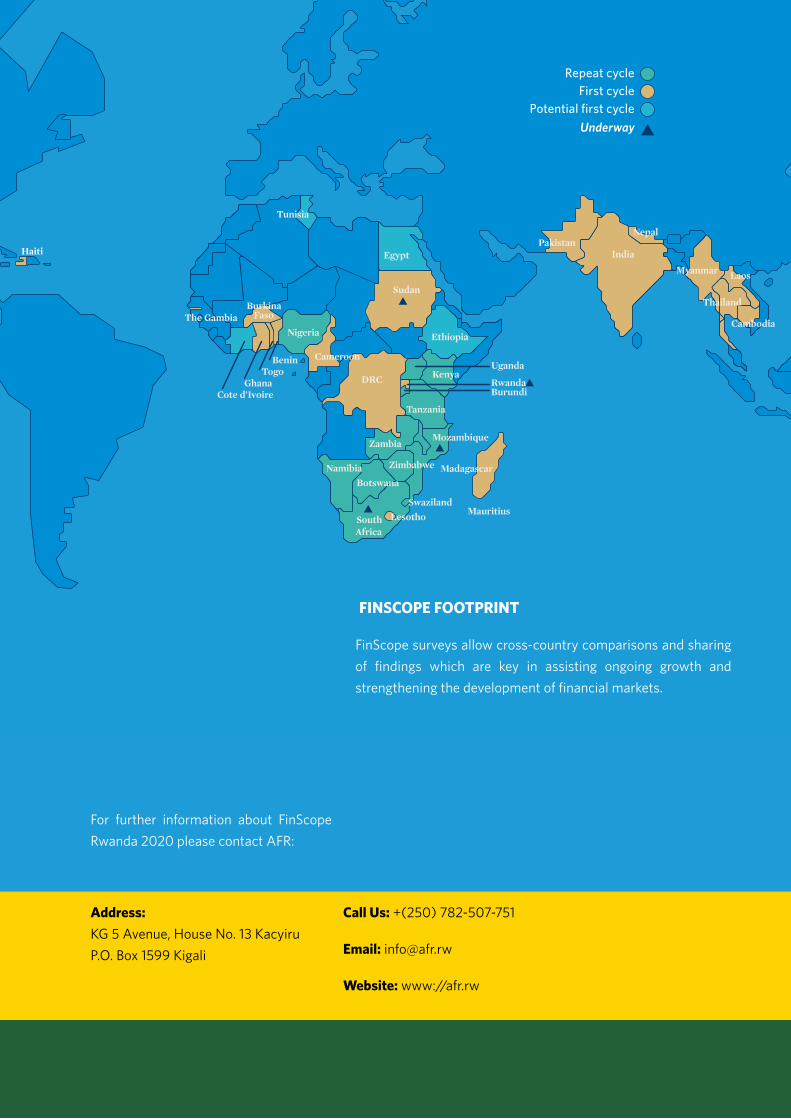
SouthAfrica
LesothoSwaziland
Madagascar
Mauritius
RwandaBurundi
Uganda
Mozambique
Tanzania
Kenya
Ethiopia
Cameroon
Nigeria
GhanaCote d’Ivoire
TogoBenin
BurkinaFaso
Tunisia
Egypt
Sudan
PakistanIndia
Nepal
Myanmar Laos
Thailand
Cambodia
DRC
Zimbabwe
BotswanaNamibia
Zambia
The Gambia
Haiti
Repeat cycleFirst cycle
Potential first cycle
Underway
FINSCOPE FOOTPRINT
FinScope surveys allow cross-country comparisons and sharing
of findings which are key in assisting ongoing growth and
strengthening the development of financial markets.
For further information about FinScope
Rwanda 2020 please contact AFR:
Address:
KG 5 Avenue, House No. 13 Kacyiru
P.O. Box 1599 Kigali
Call Us: +(250) 782-507-751
Email: [email protected]
Website: www://afr.rw