Monetization of Forests’ Service Functions for Sustainable Forest Resources Management
Upload
khangminh22Category
view
1download
0
GlobalForest
ResourcesAssessment
2020Main report


GlobalForest
ResourcesAssessment
2020Main report
Food and Agriculture Organization of the United NationsRome 2020

Required citation:FAO. 2020. Global Forest Resources Assessment 2020: Main report. Rome. https://doi.org/10.4060/ca9825en
The designations employed and the presentation of material in this information product do not imply the expression of any opinion whatsoever on the part of the Food and Agriculture Organization of the United Nations (FAO) concerning the legal or development status of any country, territory, city or area or of its authorities, or concerning the delimitation of its frontiers or boundaries. Dashed lines on maps represent approximate border lines for which there may not yet be full agreement. The mention of specific companies or products of manufacturers, whether or not these have been patented, does not imply that these have been endorsed or recommended by FAO in preference to others of a similar nature that are not mentioned.
The views expressed in this information product are those of the author(s) and do not necessarily reflect the views or policies of FAO.
ISBN 978-92-5-132974-0© FAO, 2020
Some rights reserved. This work is made available under the Creative Commons Attribution-NonCommercial-ShareAlike 3.0 IGO licence (CC BY-NC-SA 3.0 IGO; https://creativecommons.org/licenses/by-nc-sa/3.0/igo/legalcode/legalcode).
Under the terms of this licence, this work may be copied, redistributed and adapted for non-commercial purposes, provided that the work is appropriately cited. In any use of this work, there should be no suggestion that FAO endorses any specific organization, products or services. The use of the FAO logo is not permitted. If the work is adapted, then it must be licensed under the same or equivalent Creative Commons licence. If a translation of this work is created, it must include the following disclaimer along with the required citation: “This translation was not created by the Food and Agriculture Organization of the United Nations (FAO). FAO is not responsible for the content or accuracy of this translation. The original English edition shall be the authoritative edition.”Disputes arising under the licence that cannot be settled amicably will be resolved by mediation and arbitration as described in Article 8 of the licence except as otherwise provided herein. The applicable mediation rules will be the mediation rules of the World Intellectual Property Organization http://www.wipo.int/amc/en/mediation/rules and any arbitration will be conducted in accordance with the Arbitration Rules of the United Nations Commission on International Trade Law (UNCITRAL).
Third-party materials. Users wishing to reuse material from this work that is attributed to a third party, such as tables, figures or images, are responsible for determining whether permission is needed for that reuse and for obtaining permission from the copyright holder. The risk of claims resulting from infringement of any third-party-owned component in the work rests solely with the user.
Sales, rights and licensing. FAO information products are available on the FAO website (www.fao.org/publications) and can be purchased through [email protected]. Requests for commercial use should be submitted via: www.fao.org/contact-us/licence-request. Queries regarding rights and licensing should be submitted to: [email protected].
iii
iii Contentsviii Forewordix Acknowledgementsx Acronyms and abbreviationsxi Key findings
1 1. Introduction3 Process5 Scope6 Data analysis 6 Outputs
11 2. Forest extent and changes13 Forest area 21 Other land with tree cover 23 Other wooded land
25 3. Forest characteristics27 Naturally regenerating forest 30 Planted forest 32 Plantation forest and other planted forest 34 Plantations of introduced species 34 Primary forest 38 Mangroves 39 Bamboo 40 Rubber plantations
41 4. Growing stock biomass and carbon44 Growing stock 45 Growing-stock composition 48 Biomass stock 51 Carbon stock
55 5. Designation and management58 Global overview 58 Analysis by designation category
Contents
77 6. Ownership and management rights79 Forest ownership 82 Private ownership, by type of owner83 Holders of management rights in publicly
owned forests
87 7. Disturbances92 Insects 93 Diseases 94 Severe weather events
97 8. Policies and legislation99 Findings
101 9. Employment and education103 Employment 104 Education
107 10. Non-wood forest products removals and value
115 11. Discussion 117 Enhanced country participation117 Reduced reporting burden117 Stronger capacity development 119 Improved data availability and quality
123 12. Conclusion125 Take-home messages126 Next steps
127 Annexes129 Annex 1. Statistical factsheets136 Annex 2. Global tables 163 References
iv
TABLES
4 Table 1. Key milestones in the development of the Global Forest Resources Assessment 2020
14 Table 2. Forest area, by region and subregion, 202015 Table 3. Top ten countries for forest area, 2020 15 Table 4. Top ten countries and territories for
forest cover as a percentage of total land area, 202016 Table 5. Forest area, by region and subregion,
1990–202017 Table 6. Annual average net change in forest area,
by region and subregion, 1990–202018 Table 7. Top ten countries for average annual net loss
of forest area, 2010–202018 Table 8. Top ten countries for average annual net gain
in forest area, 2010–202019 Table 9. Deforestation rate, by climatic domain,
for four periods spanning 1990–202019 Table 10. Deforestation rate, by region and subregion,
for four periods spanning 1990–202023 Table 11. Area of other land with tree cover,
by region and subregion, 2020 23 Table 12. Area of other wooded land, by region
and subregion, 202024 Table 13. Top ten countries for area of other wooded
land, 202024 Table 14. Area of other wooded land and annual
change, by region and subregion, 1990–2020 28 Table 15. Area of naturally regenerating forest,
by region and subregion, 202028 Table 16. Area of naturally regenerating forest,
by region and subregion, 1990–202029 Table 17. Annual change in the area of naturally
regenerating forest, by region and subregion, 1990–2020
30 Table 18. Area of planted forest, and planted forest as a proportion of total forest area, by region and subregion, 2020
30 Table 19. Top ten countries and territories for planted forest as a proportion of total forest area, 2020
31 Table 20. Area of planted forest, by region and subregion, 1990–2020
31 Table 21. Annual change in the area of planted forest, by region and subregion, 1990–2020
32 Table 22. Area of plantation forest and other planted forest, by region and subregion, 2020
33 Table 23. Top ten countries and territories for plantation forest as a proportion of total forest area, 2020
35 Table 24. Plantation forests composed of introduced species, by region and subregion, 2020
35 Table 25. Plantation forests composed of introduced species as a proportion of total plantation forest area, by region and subregion, 1990–2020
36 Table 26. Area of primary forest, by region and subregion, 2020
36 Table 27. Top five countries for primary forest area, 2020
37 Table 28. Top five countries and territories for primary forest as a proportion of total forest area, 2020
37 Table 29. Area of primary forest and annual change, by region and subregion, 1990–2020
38 Table 30. Area of mangroves, by region and subregion, 2020
39 Table 31. Area of mangroves and annual change, by region and subregion, 1990–2020
39 Table 32. Area of bamboo, by region and subregion, 2020
40 Table 33. Area of rubber plantations, by reporting country, 2020
44 Table 34. Volume of forest growing stock, by region and subregion, 2020
45 Table 35. Top ten countries for volume of forest growing stock, 2020
46 Table 36. Total volume of forest growing stock, by region and subregion, 1990–2020
46 Table 37. Volume of forest growing stock per hectare, by region and subregion, 1990–2020
48 Table 38. Volume of biomass and dead-wood stock, by region and subregion, 2020
49 Table 39. Forest biomass conversion and expansion factor, root–shoot ratio and dead–live ratio, by region and subregion, 2020
49 Table 40. Total living biomass, by region and subregion, 1990–2020
50 Table 41. Dead-wood stock, by region and subregion, 1990–2020
51 Table 42. Forest carbon stock in carbon pools, by region and subregion, 2020
52 Table 43. Total forest carbon stock, by region and subregion, 1990–2020

v
59 Table 44. Forest area designated primarily for production, by region and subregion, 2020
59 Table 45. Top ten countries for share of forest area designated primarily for production, 2020
60 Table 46. Forest area designated primarily for production, and annual change, by region and subregion, 1990–2020
61 Table 47. Forest area designated primarily for multiple use, by region and subregion, 2020
61 Table 48. Countries and territories with 100 percent of their total forest area designated primarily for multiple use, 2020
62 Table 49. Area of forest designated primarily for multiple use, and annual change, by region and subregion, 1990–2020
63 Table 50. Forest area designated primarily for soil and water protection, by region and subregion, 2020
64 Table 51. Top ten countries and territories for the proportion of total forest area designated primarily for soil and water protection, 2020
64 Table 52. Area of forest area designated primarily for soil and water protection, and annual change, by region and subregion, 1990–2020
66 Table 53. Forest area designated primarily for biodiversity conservation, by region and subregion, 2020
66 Table 54. Top ten countries and territories for the proportion of total forest area designated primarily for biodiversity conservation, 2020
67 Table 55. Area of forest designated primarily for biodiversity conservation, and annual change, by region and subregion, 1990–2020
68 Table 56. Forest area designated primarily for social services, by region and subregion, 2020
68 Table 57. Top ten countries for the proportion of total forest area designated primarily for social services, 2020
69 Table 58. Area of forest designated primarily for social services, and annual change, by region and subregion, 1990–2020
70 Table 59. Forest area designated primarily for other management objectives, by region and subregion, 2020
71 Table 60. Forest in protected areas, by region and subregion, 2020
72 Table 61. Top ten countries for forest in protected areas, 2020
72 Table 62. Forest in protected areas, and annual change, by region and subregion, 1990–2020
73 Table 63. Area of forest with long-term management plans, by region and subregion, 2020
74 Table 64. Forest area with long-term management plans, and annual change, by region and subregion, 2000–2020
80 Table 65. Forest ownership, by region and subregion, 2015
80 Table 66. Top ten countries and territories for the proportion of privately owned forest, 2015
81 Table 67. Forest ownership, by region and subregion, 1990–2015
82 Table 68. Area of forest in three types of private ownership, by region, 2015
83 Table 69. Holders of management rights to public forests, by region, 2015
92 Table 70. Proportion of tree-covered burned area in total wildfire area, by region or subregion, 2001–2018
92 Table 71. Country-reported burned area, by ecological domain, 2015
93 Table 72. Forest area affected by insects, by region, 2015
93 Table 73. Forest area disturbed by insects annually, by region, 2002–2016
94 Table 74. Forest area affected by disease, by region, 2015
94 Table 75. Forest area affected annually by disease, by region, 2002–2017
95 Table 76. Forest area affected by severe weather events, by region, 2015
95 Table 77. Forest area affected by severe weather events, by region, 2002–2015
96 Table 78. Number and forest area of countries reporting on forest degradation, by region
103 Table 79. Number of people employed in forestry and logging, by region, 2015
104 Table 80. Number of people employed in forestry and logging, by region, 1990–2015
105 Table 81. Number of graduated students, by level of education, 2015
105 Table 82. Graduated students in forestry, by region and level of education, 2015

vi
110 Table 83. Reporting coverage for non-wood forest products
112 Table 84. Industrial wood and woodfuel removals, by region and subregion, 1990–2018
120 Table 85. The three-class tier system applied in the assessment of data quality
120 Table 86. Number of countries by data-reliability tier, for six indicators
121 Table 87. Proportion of forest area (%) by data-reliability tier, for six indicators
121 Table 88. Proportion of forest area in data-reliability tier 3, by region
FIGURES
6 Figure 1. Regional and subregional breakdown used in the Global Forest Resources Assessment 2020
7 Figure 2. Sustainable Development Goal 15, and relevant targets
8 Figure 3. Forest area as a proportion (%) of total land area, 2000, 2010 and 2015–2020, by Sustainable Development Goal regional grouping
9 Figure 4. Traffic-light dashboard for subindicators of indicator 15.2.1, 2020
14 Figure 5. The global distribution of forests, by climatic domain
16 Figure 6. Forest area as a percentage of total land area, 2020
17 Figure 7. Forest area, by region, 1990–202021 Figure 8. Global distribution of consensus among
eight satellite-based datasets22 Figure 9. Global area of other land with tree cover,
1990–202027 Figure 10. Components of planted forest33 Figure 11. Proportion of plantation forest and other
planted forest, by region, 2020 34 Figure 12. Plantation forest and other planted forest
as a proportion of total planted forest area, by region, 1990–2020
40 Figure 13. Total area of bamboo, 1990–202040 Figure 14. Total area of rubber plantations, 1990–202044 Figure 15. Forest growing stock per unit area,
by country, 2020
45 Figure 16. Naturally regenerating and planted forest growing stock distribution, by region, 2020
47 Figure 17. Proportion of growing stock in planted forest, by region, 1990–2020
47 Figure 18. Volume of growing stock for the top five genera, Africa, 2020
47 Figure 19. Volume of growing stock for the top five genera, Asia, 2020
47 Figure 20. Volume of growing stock for the top five genera, Europe, 2020
47 Figure 21. Volume of growing stock for the top five genera, North America, 2020
50 Figure 22. Regional and global trends in biomass stock per hectare, by region, 1990–2020
52 Figure 23. Trends in total forest carbon stock, by carbon pool, 1990–2020
53 Figure 24. Change in forest biomass carbon stock, by region and subregion, 1990–2020
53 Figure 25. Forest carbon stock per hectare, by carbon pool, 1990–2020
58 Figure 26. Proportion of total forest area designated for various primary management objectives, by region and globally, 2020
60 Figure 27. Proportion of total forest area designated primarily for production, by region, 1990–2020
62 Figure 28. Proportion of total forest area designated primarily for multiple use, by region, 1990–2020
65 Figure 29. Proportion of total forest area designated primarily for the protection of soil and water,by region, 1990–2020
67 Figure 30. Proportion of total forest area designated primarily for biodiversity conservation, by region, 1990–2020
70 Figure 31. Proportion of total forest area designated primarily for social services, by region, 1990–2020
71 Figure 32. Proportion of total forest area designated primarily for other purposes, by region, 1990–2020
75 Figure 33. Forest area certified under the Forest Stewardship Council and the Programme for the Endorsement of Forest Certification, 1990–2019
75 Figure 34. Total area of certified forest after adjustment for double certification, by region, 2000–2019
79 Figure 35. Proportion of total forest area, by three ownership categories, 2015
vii
81 Figure 36. Proportion of total forest area, by ownership type and region, 1990–2015
83 Figure 37. Proportion of total private forest area, by ownership type and region, 1990–2015
84 Figure 38. Proportion of total publicly owned forest area, by holder of administrative rights and region, 2015
84 Figure 39. Proportion of total area of publicly owned forests, by holder of management rights and region, 1990–2015
90 Figure 40. Global total land area burned per year, 2001–2018
90 Figure 41. Total land area burned in 2001–2018, by region or subregion
91 Figure 42. Annual average land area burned between 2001 and 2018, by region or subregion
96 Figure 43. Proportion of total forest area of countries reporting on forest degradation, by climatic domain
96 Figure 44. Criteria used in national definitions of degraded forest
96 Figure 45. Methods applied by countries for monitoring degraded forest
106 Figure 46. Number of forestry students, by degree category, 2000–2015
106 Figure 47. Proportion of female and male graduated forestry students, by education level, 2000–2015
110 Figure 48. Global importance of non-wood forest product categories, 2015
111 Figure 49. Non-wood forest product categories as a proportion of total reported economic value, 2015
112 Figure 50. Top ten countries for wood removals, 2018113 Figure 51. Global trends in wood removals, 1961–2018118 Figure 52. Sample sites for the remote sensing survey 119 Figure 53. Data availability for status and trends,
21 main variables
BOXES
4 Box 1. The Global Forest Resources Assessment online platform
7 Box 2. Global Forest Resources Assessment reporting and the Sustainable Development Goals
13 Box 3. Difference between deforestation and forest area net change
20 Box 4. Seeing the forest and the trees22 Box 5. Understanding regional differences between
products in estimated forest area and tree cover74 Box 6. Forest certification89 Box 7. Fire95 Box 8. Forest degradation111 Box 9. Wood removals118 Box 10. Remote sensing survey, 2020120 Box 11. National forest monitoring tier assessment

viii
In September 2015, the world’s leaders agreed on the 2030 Agenda for Sustainable Development, including its 17 Sustainable Development Goals. The 2030 Agenda is now guiding the development of policies worldwide aimed at eradicating poverty and hunger, promoting sustained, inclusive and sustainable growth, reducing inequalities, tackling climate change and environmental degradation, and sustainably managing our natural resources.
Forests are at the heart of the 2030 Agenda. They are a source of food, medicines and biofuel for more than 1 billion people. They protect soils and water, host more than three-quarters of the world’s terrestrial biodiversity, and help tackle climate change. Forests provide many products and services that contribute to socio-economic development and create work and income for tens of millions of people.
Forests have immense potential to support sustainable development pathways, and the key to realizing this is reliable evidence. Accurate information on forest resources is also needed to monitor progress towards the nationally determined contributions of countries under the Paris Agreement on climate change; the Global Forest Goals and Targets of the United Nations Strategic Plan for Forests 2017–2030; and the forthcoming post-2020 global biodiversity framework and United Nations Decade on Ecosystem Restoration.
FAO completed its first assessment of the world’s forest resources in 1948. At that time, its major objective was to collect information on available timber supply to satisfy post-war reconstruction demand. Since then, the Global Forest Resources Assessment (FRA) has evolved into a comprehensive evaluation of forest resources and their condition, management and uses, covering all the thematic elements of sustainable forest management.
This, the latest of these assessments, examines the status of, and trends in, forest resources over the period 1990–2020, drawing on the efforts of hundreds of experts worldwide. The production of FRA 2020 also involved collaboration among many partner organizations, thereby reducing the reporting burden on countries, increasing synergies among reporting processes, and improving data consistency.
The results of FRA 2020 are available in several formats, including this report and an online database containing the original inputs of countries and territories as well as desk studies and regional and global analyses prepared by FAO. I invite you to use these materials to support our common journey towards a more sustainable future with forests.
Maria Helena SemedoDeputy Director-General
Foreword
1

ix
The Global Forest Resources Assessment (FRA) 2020 is the result of a collective effort by the FAO Forestry Department, FAO member countries, institutional and resource partners, and many individuals.
More than 700 people have been directly involved in the FRA 2020 process. They include 342 national correspondents and their alternates and collaborators, who compiled the detailed country reports, and more than 30 external reviewers who, together with FAO experts, supported the national correspondents in obtaining the best-possible quality and consistency in the reports. Ten FAO experts coordinated the FRA 2020 process, including related capacity development, the compilation, review and analysis of data, and preparation of this report.
The FRA 2020 process was supported by two groups of experts: participants in the expert consultation held in Joensuu, Finland, in 2017; and the FRA Advisory Group. The expert consultation provided initial guidance on the scope and reporting content of FRA 2020, and the FRA Advisory Group guided overall implementation.
The Collaborative Forest Resources Questionnaire partners made important contributions to data collection and review. Roman Michalak (Forestry and Timber Section of the United Nations Economic Commission for Europe) and Rastislav Raši (FOREST EUROPE) supported data collection and review for the pan-European countries; they also coordinated the following team of reviewers for those countries: Martin Moravčík, Ivana Pešut, Matej Schwarz, Roksolana Shelest, Venera Surappaeva, Stein Michael Tomter and Mati Valgepea. Adjé Olivier Ahimin (International Tropical Timber Organization) assisted in the preparation and review of reports for francophone African countries. Florence Palla and Donald Jomha Djossi (Central Africa Forest Observatory of the Central African Forest Commission) assisted with the preparation and review of reports for the Central African countries. Lars Gunnar Marklund (Swedish University of Agricultural Sciences) assisted in the data-collection, review, analysis and reporting phases of the FRA 2020 process. Tom Brandeis (United States Forest Service) supported the reporting and review process for the Caribbean English-speaking countries.
A number of countries and institutions provided the FRA 2020 process with technical support, including the Center for International Forestry Research, the National Forestry Commission (Mexico), the Forest Stewardship Council, the Forest Survey of India, the Joint Research Centre of the European Commission, the Natural Resources Institute Finland, the Programme for the Endorsement of Forest Certification, the Swedish University of Agricultural Sciences, the Pacific Community, and Wageningen University.
Collaboration with Google and SERVIR (a joint venture between the National Aeronautics and Space Administration of the United States of America and the United States Agency for International Development) ensured that all countries and territories had access to freely available geospatial data and products, and it also enabled the customization of Collect Earth Online for the collection of data for the FRA remote sensing survey.
The FRA 2020 process and its various activities received financial support from Finland’s Ministry for Foreign Affairs and Ministry of Agriculture and Forestry; the European Union; the Government of Norway; the Global Environment Facility; Australia’s Department of Agriculture, Water and the Environment; New Zealand’s Ministry for Primary Industries; Japan’s Forestry Agency in the Ministry of Agriculture, Forestry and Fisheries; and Natural Resources Canada.
The drafting and preparation of this report was coordinated by Anssi Pekkarinen, Monica Garzuglia and Örjan Jonsson. Other contributors were Anne Branthomme, Benjamin Caldwell, Valeria Contessa, Donatas Dudutis, Adolfo Kindgard, Jarkko Koskela, Arvydas Lebedys, Agamy Mohamed, Peter Moore, Chiara Patriarca, Sara Maulo and Simona Sorrenti. The FRA 2020 process was supported by Lucilla Marinaro, Marisalee Palermo, Giordana Conti and Esther Phillips.
The report was edited by Alastair Sarre and proofread by James Kenneth Varah. Chiara Caproni did the design and layout.
FAO is grateful to all countries and territories, institutions and individuals who have made FRA 2020 possible.
Acknowledgements
3
x
BCEF biomass conversion and expansion factor CFRQ Collaborative Forest Resources QuestionnaireFAO Food and Agriculture Organization of the United NationsFRA Global Forest Resources AssessmentFSC Forest Stewardship CouncilGt gigatonne(s)ha hectare(s)IPCC Intergovernmental Panel on Climate ChangeIUCN International Union for Conservation of Naturen.a. not applicableNFI national forest inventoryn.s. not significantPEFC Programme for the Endorsement of Forest CertificationRSS remote sensing surveySDG Sustainable Development GoalUNFCCC United Nations Framework Convention on Climate Change
Acronyms and abbreviations
A
Note that numbers given in the text, tables and figures in this report may not sum to the totals indicated and percentages may not tally to 100 due to rounding. Not all countries reported on all parameters mentioned herein.
xi
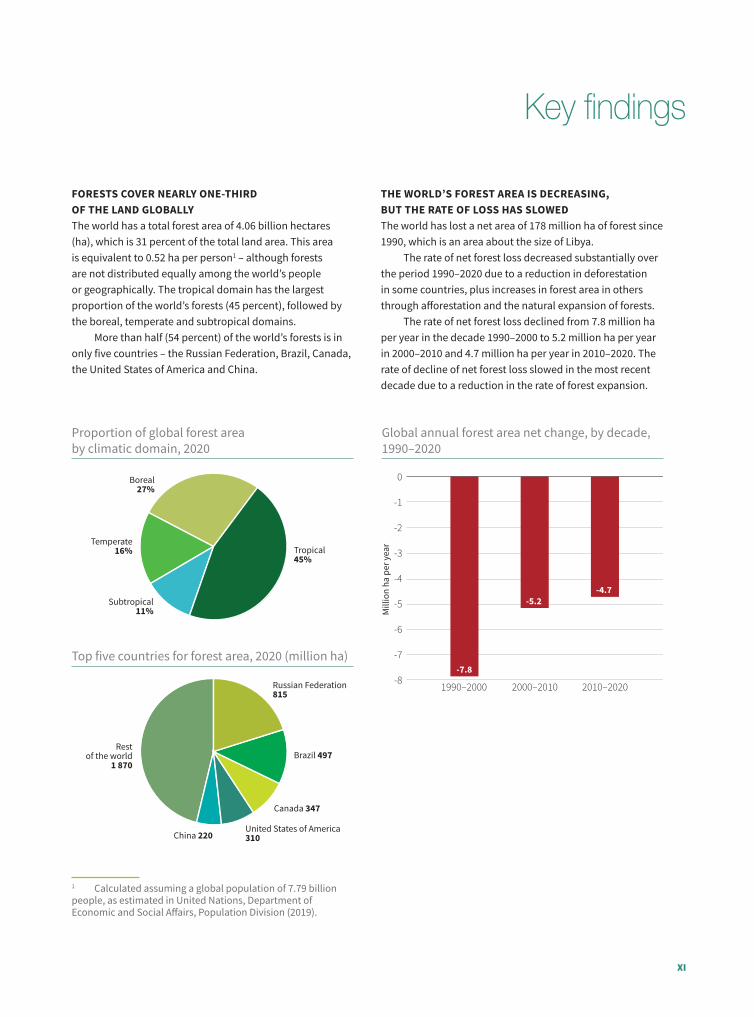
FORESTS COVER NEARLY ONE-THIRD OF THE LAND GLOBALLYThe world has a total forest area of 4.06 billion hectares (ha), which is 31 percent of the total land area. This area is equivalent to 0.52 ha per person1 – although forests are not distributed equally among the world’s people or geographically. The tropical domain has the largest proportion of the world’s forests (45 percent), followed by the boreal, temperate and subtropical domains.
More than half (54 percent) of the world’s forests is in only five countries – the Russian Federation, Brazil, Canada, the United States of America and China.
1 Calculated assuming a global population of 7.79 billion people, as estimated in United Nations, Department of Economic and Social Affairs, Population Division (2019).
Key findings
THE WORLD’S FOREST AREA IS DECREASING, BUT THE RATE OF LOSS HAS SLOWED The world has lost a net area of 178 million ha of forest since 1990, which is an area about the size of Libya.
The rate of net forest loss decreased substantially over the period 1990–2020 due to a reduction in deforestation in some countries, plus increases in forest area in others through afforestation and the natural expansion of forests.
The rate of net forest loss declined from 7.8 million ha per year in the decade 1990–2000 to 5.2 million ha per year in 2000–2010 and 4.7 million ha per year in 2010–2020. The rate of decline of net forest loss slowed in the most recent decade due to a reduction in the rate of forest expansion.
Proportion of global forest area by climatic domain, 2020
Top five countries for forest area, 2020 (million ha)
Global annual forest area net change, by decade, 1990–2020
Subtropical11%
Temperate16% Tropical
45%
Boreal27%
China 220
Restof the world
1 870Brazil 497
Canada 347
United States of America 310
Russian Federation815
0
-1
-2
-3
-4
-5
-6
-7
-8
Mill
ion
ha p
er y
ear
1990–2000 2000–2010 2010–2020
-4.7-5.2
-7.8

xii
AFRICA HAS THE HIGHEST NET LOSS OF FOREST AREAAfrica had the highest annual rate of net forest loss in 2010–2020, at 3.9 million ha, followed by South America, at 2.6 million ha.
The rate of net forest loss has increased in Africa in each of the three decades since 1990. It has declined substantially in South America, however, to about half the rate in 2010–2020 compared with 2000–2010.
Asia had the highest net gain of forest area in 2010–2020, followed by Oceania and Europe.2 Nevertheless, both Europe and Asia recorded substantially lower rates of net gain in 2010–2020 than in 2000–2010. Oceania experienced net losses of forest area in the decades 1990–2000 and 2000–2010.
2 According to the regional breakdown used in FRA 2020, Europe includes the Russian Federation.
DEFORESTATION CONTINUES, BUT AT A LOWER RATEAn estimated 420 million ha of forest has been lost worldwide through deforestation since 1990, but the rate of forest loss has declined substantially. In the most recent five-year period (2015–2020), the annual rate of deforestation was estimated at 10 million ha, down from 12 million ha in 2010–2015.
Annual forest area net change, by decade and region, 1990–2020
Annual rate of forest expansion and deforestation, 1990–2020
3
2
1
0
-1
-2
-3
-4
-5
-6
Mill
ion
ha p
er y
ear
1990–2000 2000–2010 2010–2020
Asia Oceania Europe North and Central America
South America Africa
0.2 0.2
2.4
1.2
0.40.8
0.3
1.2
-0.2 -0.2 -0.3 -0.1
-5.1 -5.2
-2.6
-3.3 -3.4-3.9
Mill
ion
ha p
er y
ear
1990–2000 2000–2010 2010–2015 2015–2020
15
10
5
0
-5
-10
-15
-20
Forest expansion Deforestation
810
75
-16 -15-12
-10

xiii
MORE THAN 90 PERCENT OF THE WORLD’S FORESTS HAS REGENERATED NATURALLY Ninety-three percent (3.75 billion ha) of the forest area worldwide is composed of naturally regenerating forests and 7 percent (290 million ha) is planted.
The area of naturally regenerating forest has decreased since 1990 (at a declining rate of loss), but the area of planted forest has increased by 123 million ha. The rate of increase in the area of planted forest has slowed in the last ten years.
PLANTATIONS ACCOUNT FOR ABOUT 3 PERCENT OF THE WORLD’S FORESTSPlantation forests cover about 131 million ha, which is 3 percent of the global forest area and 45 percent of the total area of planted forests.
The highest share of plantation forest is in South America, where this forest type represents 99 percent of the total planted forest area and 2 percent of the total forest area.
The lowest share of plantation forest is in Europe, where it represents 6 percent of the planted forest estate and 0.4 percent of the total forest area.
Globally, 44 percent of plantation forests feature introduced species. There are large differences between regions: for example, plantation forests in North and Central America are composed mostly of native species and those in South America consist almost entirely of introduced species.
MORE THAN 700 MILLION HA OF FOREST IS IN LEGALLY ESTABLISHED PROTECTED AREAS There is an estimated 726 million ha of forest in protected areas worldwide. Of the six world regions, South America has the highest share of forests in protected areas, at 31 percent.
The area of forest in protected areas globally has increased by 191 million ha since 1990, but the rate of annual increase slowed in 2010–2020.
Annual net change in area of naturally regenerating and planted forest, by decade, 1990–2020
Proportion of introduced and native species in plantation forest, by region, 2020
Proportion of forest in protected areas, by region, 2020
Mill
ion
ha p
er y
ear
6
4
2
0
-2
-4
-6
-8
-10
-12
-141990–2000 2000–2010 2010–2020
Naturally regenerating forest Planted forest
45
3
-12
-10
-8
Introduced species Native species
0 10 20 30 40 50%
60 70 80 90 100
Africa
Asia
Europe
North andCentral America
Oceania
South America
World
0 5 10 15 20 25%
30 35
27%
25%
6%
11%
16%
31%
18%
Africa
Asia
Europe
North andCentral America
Oceania
South America
World
xiv
PRIMARY FORESTS COVER ABOUT 1 BILLION HAThe world still has at least 1.11 billion ha of primary forest – that is, forests composed of native species in which there are no clearly visible indications of human activity and the ecological processes have not been significantly disturbed. Combined, three countries – Brazil, Canada and the Russian Federation – host more than half (61 percent) of the world’s primary forest.
The area of primary forest has decreased by 81 million ha since 1990, but the rate of loss more than halved in 2010–2020 compared with the previous decade.
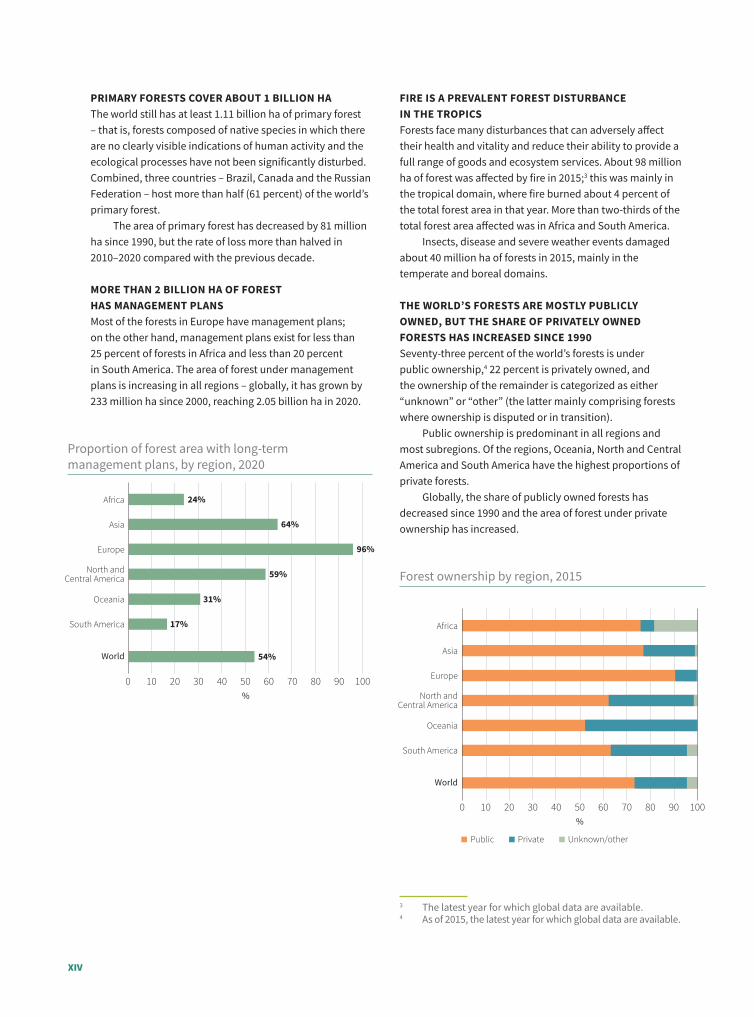
MORE THAN 2 BILLION HA OF FOREST HAS MANAGEMENT PLANSMost of the forests in Europe have management plans; on the other hand, management plans exist for less than 25 percent of forests in Africa and less than 20 percent in South America. The area of forest under management plans is increasing in all regions – globally, it has grown by 233 million ha since 2000, reaching 2.05 billion ha in 2020.
FIRE IS A PREVALENT FOREST DISTURBANCE IN THE TROPICS Forests face many disturbances that can adversely affect their health and vitality and reduce their ability to provide a full range of goods and ecosystem services. About 98 million ha of forest was affected by fire in 2015;3 this was mainly in the tropical domain, where fire burned about 4 percent of the total forest area in that year. More than two-thirds of the total forest area affected was in Africa and South America.
Insects, disease and severe weather events damaged about 40 million ha of forests in 2015, mainly in the temperate and boreal domains.
THE WORLD’S FORESTS ARE MOSTLY PUBLICLY OWNED, BUT THE SHARE OF PRIVATELY OWNED FORESTS HAS INCREASED SINCE 1990 Seventy-three percent of the world’s forests is under public ownership,4 22 percent is privately owned, and the ownership of the remainder is categorized as either “unknown” or “other” (the latter mainly comprising forests where ownership is disputed or in transition).
Public ownership is predominant in all regions and most subregions. Of the regions, Oceania, North and Central America and South America have the highest proportions of private forests.
Globally, the share of publicly owned forests has decreased since 1990 and the area of forest under private ownership has increased.
3 The latest year for which global data are available.4 As of 2015, the latest year for which global data are available.
Proportion of forest area with long-term management plans, by region, 2020
Africa
Asia
Europe
North andCentral America
Oceania
South America
World
24%
0 10 20 30 40 50%
60 70 80 90 100
64%
59%
31%
17%
54%
96%
Forest ownership by region, 2015
Public Private Unknown/other
0 10 20 30 40 50%
60 70 80 90 100
Africa
Asia
Europe
North andCentral America
Oceania
South America
World

xv
Public administrations hold management rights to 83 percent of the publicly owned forest area globally. Management by public administrations is particularly predominant in South America, where it accounts for 97 percent of management responsibility in publicly owned forests. The share of public administration management rights has decreased globally since 1990, with an increasing share of publicly owned forests managed by business entities and institutions and by indigenous and tribal communities.
THE WORLD’S FOREST GROWING STOCK IS DECLINING The world’s total growing stock of trees decreased slightly, from 560 billion m3 in 1990 to 557 billion m3 in 2020, due to a net decrease in forest area. On the other hand, growing stock is increasing per unit area globally and in all regions; it rose from 132 m3 per ha in 1990 to 137 m3 per ha in 2020. Growing stock per unit area is highest in the tropical forests of South and Central America and West and Central Africa.
The world’s forests contain about 606 gigatonnes of living biomass (above- and below-ground) and 59 gigatonnes of dead wood. The total biomass has decreased slightly since 1990, but biomass per unit area has increased.
TOTAL FOREST CARBON STOCK IS DECREASING Most forest carbon is found in the living biomass (44 percent) and soil organic matter (45 percent), with the remainder in dead wood and litter. The total carbon stock in forests decreased from 668 gigatonnes in 1990 to 662 gigatonnes in 2020; carbon density increased slightly over the same period, from 159 tonnes to 163 tonnes per ha.
ABOUT 30 PERCENT OF ALL FORESTS IS USED PRIMARILY FOR PRODUCTIONGlobally, about 1.15 billion ha of forest is managed primarily for the production of wood and non-wood forest products. In addition, 749 million ha is designated for multiple use, which often includes production.
Worldwide, the area of forest designated primarily for production has been relatively stable since 1990, but the area of multiple-use forest has decreased by about 71 million ha.
ABOUT TEN PERCENT OF THE WORLD’S FORESTS IS ALLOCATED FOR BIODIVERSITY CONSERVATION Globally, 424 million ha of forest is designated primarily for biodiversity conservation. In total, 111 million ha has been so designated since 1990, of which the largest part was allocated between 2000 and 2010. The rate of increase in the area of forest designated primarily for biodiversity conservation has slowed in the last ten years.
THE AREA OF FOREST DESIGNATED PRIMARILY FOR SOIL AND WATER PROTECTION IS INCREASINGAn estimated 398 million ha of forest is designated primarily for the protection of soil and water, an increase of 119 million ha since 1990. The rate of increase in the area of forest allocated for this purpose has grown over the entire period but especially in the last ten years.
MORE THAN 180 MILLION HA OF FOREST IS USED MAINLY FOR SOCIAL SERVICESAn area of 186 million ha of forest worldwide is allocated for social services such as recreation, tourism, education research and the conservation of cultural and spiritual sites. The area designated for this forest use has increased at a rate of 186 000 ha per year since 2010.
Proportion of carbon stock in forest carbon pools, 2020
44%in living biomass
4%in dead wood
6%in litter
45%in soil
organic matter
B

@ F
AO /
NCo
gnom
e

@ F
AO /
NCo
gnom
e
1 Introduction
©U
npla
sh/C
onsc
ious
Des
ign
©U
npla
sh/C
onsc
ious
Des
ign
31. Introduction
ince its creation, the Food and Agriculture Organization of the United Nations (FAO) has, at the request of its member countries, regularly collected, analysed and disseminated
information on the status of and trends in the world’s forest resources through the Global Forest Resources Assessment (FRA).
The scope, methodology and periodicity of FRAs have evolved over time in response to changing information needs. Early assessments were mainly FAO-driven processes focused on timber availability; later assessments have been country-driven, with a more holistic perspective (FAO, 2018a). Since 2005, FRAs have relied on country data provided by a well-established network of officially nominated national correspondents.
As FRAs have evolved to become more comprehensive, the amount of information requested from members has increased substantially. In the past, the reporting burden on countries was exacerbated by requests for the same or similar data from other forest-related reporting processes. Starting from FRA 2005, however, FAO’s FRA secretariat has collaborated with other international reporting processes and organizations involved in the collection of forest-related data, and it has worked with members of the Collaborative Partnership on Forests to improve definitions and streamline reporting. This approach led to the establishment of the Collaborative Forest Resources Questionnaire (CFRQ),5 which was used in the production of FRA 2015. In consultation with countries and international experts, the FRA secretariat also reviewed the scope of assessments with the aim of avoiding overlaps with other data-collection processes and further reducing the reporting burden.
5 In 2011, FAO, the International Tropical Timber Organization, FOREST EUROPE, the United Nations Economic Commission for Europe, the Observatory of Central African Forests and the countries of the Montréal Process combined to create the CFRQ. This joint questionnaire was established with the aim of reducing the reporting burden on countries and increasing data consistency across organizations through standardized definitions and the common timing of data collection.
FRA 2020 has continued on this path, with adaptations to its scope and reporting periodicity to better respond to recent developments in international forestry. For the first time since FRA 2000, the number of variables has been reduced (to about 60 broad categories), and an online platform has been put in place to facilitate reporting. This platform also serves to increase transparency, the reliability of results, and the accessibility and usability of data for end users (Box 1).
Process
Preparations for FRA 2020 began with an internal evaluation of FRA 2015 and an online user survey, which helped determine the scope and reporting content of FRA 2020. Scope and content were also addressed in consultations with various teams in the FAO Forestry Department, the FRA Advisory Group,6 CFRQ partners and the FAO/United Nations Economic Commission for Europe Team of Specialists on Monitoring Sustainable Forest Management. The Seventh Expert Consultation on FRA, held in Joensuu, Finland, in June 2017, concluded this consultation cycle and provided important inputs into the scope and reporting content of FRA 2020 (Luke, 2017). The recommendations of the Seventh Expert Consultation focused on developing the capacity of FRA to provide timely responses to information requirements while also further reducing the reporting burden on countries. The agenda of that meeting reflected significant recent developments in international forest policy, including the Paris Agreement on climate change, the Sustainable Development Goals (SDGs) (Box 2, p. 7),
6 The FRA Advisory Group was established in 2002 on the recommendation of an expert consultation in Kotka, Finland. The FRA Advisory Group is informal in nature, but it is recognized by FAO’s Committee on Forestry, which generally endorses its recommendations. The group has a long-term commitment to meet annually. Its role is to review FRA activities and outputs and to make recommendations aimed at strengthening existing institutional networks and making future FRAs more user-oriented and demand-driven and more closely linked with other international processes.
S

4 Global Forest Resources Assessment 2020
Box 1. The Global Forest Resources Assessment online platform
Evaluations of previous Global Forest Resources Assessments (FRAs) identified a need for an online tool to facilitate reporting and the dissemination of results to end users. The FRA 2020 online platform aims to:
· Increase transparency – the platform contains all the documentation necessary for understanding how the reported figures were produced, including original data sources, definitions, and the methodologies applied to convert national figures to FRA estimates.
· Ensure ease of use – the platform has an intuitive interface enabling easy data entry, copying and pasting from existing datasheets, and the uploading of existing documentation.
· Add value – the platform expedites reporting and guarantees consistency in reported values.
· Improve communication – the platform enables a transparent review process and facilitates communication between countries and reviewer teams.
· Improve dissemination – the platform provides easy access to country-reported data and summary information.
For countries that lack inventory and monitoring systems capable of producing annual data, the platform
is a useful tool for generating consistent interpolations and extrapolations of data and provides a transparent mechanism for reviewing data and updating them. To facilitate the reporting process, especially for countries where forest information is limited or unavailable, the platform enables access to previous country reports as well as freely available geospatial data derived from remote sensing.
The platform stores all the information and data provided by countries and territories, which will substantially expedite future reporting.
The platform makes a significant contribution to the implementation of the 2030 Agenda for Sustainable Development and to reporting on the forest-related indicators of the Sustainable Development Goals (SDGs), which was initiated in 2016 and will continue annually. In addition to the SDGs, the platform serves as a common reporting tool for other partners of the Collaborative Forest Resources Questionnaire. For example, the platform has been used to collect data for pan-European reporting on indicators of sustainable forest management in collaboration with FOREST EUROPE and the United Nations Economic Commission for Europe.
TABLE 1. Key milestones in the development of the Global Forest Resources Assessment 2020
Milestone/activity Date Comment
Global meeting of national correspondents
March 2018 Launch of the Global Forest Resources Assessment (FRA) 2020 process. Training of national correspondents and work on key variables for reporting on the Sustainable Development Goals
Deadline for submission of draft country reports
Ten days before regional/subregional workshops
Draft country reports submitted for first review at least ten days before participation in regional/subregional workshops
Regional/subregional workshops April 2018–December 2018 Technical assistance and review of draft country reports
Official validation of final country reports
September 2019 Official request for validation of final country reports sent to national authorities
Release of FRA 2020 key findings May 2020 Key results of FRA 2020
Launch of FRA 2020 main report Second half of 2020 Full results, country reports and database published at the 25th Session of the FAO Committee on Forestry

51. Introduction
and the United Nations Strategic Plan for Forests 2017–2030,7 all of which have set new demands for the FRA process in terms of both scope and periodicity.
The FRA 2020 country reporting process started with a technical meeting in Toluca, Mexico, in March 2018 (Table 1 shows key milestones in the process). This meeting brought together nearly 160 participants from more than 90 countries, including national correspondents, representatives of the CFRQ, and members of the FRA Advisory Group. At the meeting, national correspondents familiarized themselves with all aspects of the reporting process.
Throughout the reporting phase, Regional FRA focal points were in regular contact with the national correspondents and their teams to provide technical support on the reporting tables, the analysis and interpretation of national data, and the use of the online reporting platform.
Nine regional and subregional workshops were organized in April–December 2018 to further support countries in compiling and finalizing the FRA 2020 country reports (FAO, undated). These workshops provided a forum in which national correspondents could share their experiences with colleagues from other countries.
National correspondents submitted their country reports, once compiled, through the online platform for technical review. In this review, the draft country reports underwent detailed checks to ensure completeness and the correct application of definitions and methodologies. Internal consistency was checked and a comparison made with information provided for FRA 2015 and with other published information sources. Around 30 experts from among FAO staff, CFRQ partners and other international bodies contributed to the review process. A final validation phase was conducted to officially inform the heads of forestry of each country of the contents of the report and to request their clearance for publication on a no-objection basis.
7 The United Nations Strategic Plan for Forests 2017–2030 provides a global framework for action at all levels to sustainably manage all types of forests and trees outside forests, and to halt deforestation and forest degradation. The plan was agreed at a special session of the United Nations Forum on Forests in January 2017 and subsequently adopted by the United Nations General Assembly in April 2017.
Scope
FRA 2020 examines the status and trends of around 60 broad categories (under seven main topics) in the period 1990–2020. The backbone of the assessment are data reported through standardized country reports, which were compiled by officially nominated national correspondents through an online platform, as described above.
Each country report contains 22 reporting tables organized around the following main topics: forest extent and characteristics; growing stock, biomass and carbon; designation and management objectives; ownership and management rights; disturbances; policies and legislation; and employment, education and non-wood forest products. Annex 1 summarizes data for variables at the global and regional levels, and Annex 2 presents data on forest area for all countries and territories.
For each reporting table, countries were requested to provide full references for original data, describe the methodologies used for estimation, forecasting and reclassification, and explain any assumptions made.
A total of 236 countries and territories are included in FRA 2020, based on the list used by the United Nations Statistics Division (United Nations Statistics Division, undated). The following listed units were excluded from FRA 2020 unless otherwise indicated:
· Åland Islands (included under Finland in FRA 2020)
· British Indian Ocean Territory
· Channel Islands (listed separately as Guernsey and Jersey)
· China, Hong Kong SAR (included under China)
· China, Macao SAR (included under China)
· Christmas Island
· Cocos (Keeling) Islands
· French Southern Territories
· Heard and McDonald Islands
· South Georgia and the South Sandwich Islands
· United States Minor Outlying Islands. The Netherlands Antilles, reported as a single entity in
FRA 2015, is reported in FRA 2020 as Bonaire, Sint Eustatius and Saba, Curaçao and Sint Maarten (Dutch part).
The regional and subregional groupings are those used in previous FRAs (Figure 1).

6 Global Forest Resources Assessment 2020
Data analysis
Data submitted by countries through the online platform were stored in a database for easy retrieval and analysis. Forty-seven desk studies, representing 0.5 percent of the total forest area, were prepared for countries and territories that did not submit reports.
National data were aggregated to derive subregional, regional and global estimates. Trend estimates generally only include countries that reported complete time series (although, in some cases, gap-filling was performed for missing values to obtain complete time series for estimates of trends). It is not always possible, therefore, to reproduce the estimates of global, regional and subregional aggregates presented in this report by aggregating the reported country data.
This report presents the findings of the data analysis, comprising the status of and main trends in each variable.
Outputs
In addition to this main report, outputs of FRA 2020 include:
· 236 country and territory reports, each in the language of official correspondence (English, French, Russian or Spanish);
· an interactive database with the complete FRA 2020 dataset;
· key findings (a summary of the FRA 2020 main findings at the global and regional levels in English, French and Spanish);
· FRA working papers, including on the FRA 2020 terms and definitions, FRA 2020 guidelines and specifications, and workshop reports; and
· scientific papers and special studies using FRA 2020 data, produced in collaboration with partner institutions and international experts (in preparation).
All FRA-related materials are available at www.fao.org/forest-resources-assessment.
FIGURE 1. Regional and subregional breakdown used in the Global Forest Resources Assessment 2020
North and Central AmericaNorth AmericaCentral AmericaCaribbean
South AmericaSouth America
EuropeEurope
AfricaNorthern AfricaWestern and Central AfricaEastern and Southern Africa
OceaniaOceania
AsiaWestern and Central AsiaSouth and Southeast AsiaEast Asia
Source: Adapted from United Nations World map, 2020.
71. Introduction
8
8 The SDG indicators metadata repository is available at https://unstats.un.org/sdgs/metadata.
Box 2. Global Forest Resources Assessment reporting and the Sustainable Development Goals
The 193 member states of the United Nations adopted the 17 Sustainable Development Goals (SDGs) of the 2030 Agenda for Sustainable Development in September 2015. The SDGs are global objectives expected to guide the actions of the international community between 2016 and 2030. A global indicator framework, which includes 232 indicators, was agreed in March 2017. Forests are important in several of the SDGs. In particular, SDG 15 – “life on land” – emphasizes the importance of forests for the sustainability of terrestrial ecosystems (Figure 2). FAO is the designated United Nations custodian agency for 21 SDG indicators and a contributing agency for another five. Three of these indicators are under SDG 15, and data for two of these are collected and reported through the Global Forest Resources Assessment.
Indicator 15.1.1 (“forest area as a proportion of total land area”) is derived directly by dividing the forest area reported by countries and territories to FRA by the official land area of each country and territory in 2015 (as reported to FAOSTAT); Figure 3 shows the indicator values, by region, for 2000, 2010, 2015 and 2020.
Indicator 15.2.1 (“progress towards sustainable forest management”) is more difficult to measure because there is no single quantifiable and measurable characteristic that fully encompasses the many dimensions of sustainable forest management. FAO worked with partners to develop a methodology for reporting, and a set of five subindicators was established to measure progress towards the economic, social and environmental dimensions of sustainable forest management.
The five subindicators are: 1. Forest area annual net change rate 2. Above-ground biomass stock in forest 3. Proportion of forest area located within legally
established protected areas 4. Proportion of forest area under long-term forest
management plans 5. Forest area under independently verified forest
management certification schemes.Subindicators 1–3 address the environmental values
of forests, focusing on changes in forest area over time, biomass stored in forest, and actions taken to protect and maintain biodiversity and other natural and cultural resources. Subindicators 4 and 5 address all dimensions of sustainable forest management, including economic and social aspects.
The existence of forest management plans indicates the intention to manage the forests for long-term purposes. The area of certified forest provides information on the area of forest in which management complies with national or international standards, including independent verification.
Data on subindicators 1–4 are collected through the FRA country reporting process, and data for subindicator 5 are obtained from the main certification bodies (Box 6, p. 74). Detailed definitions and methodologies for each indicator and subindicator are available in the SDG metadata repository.8
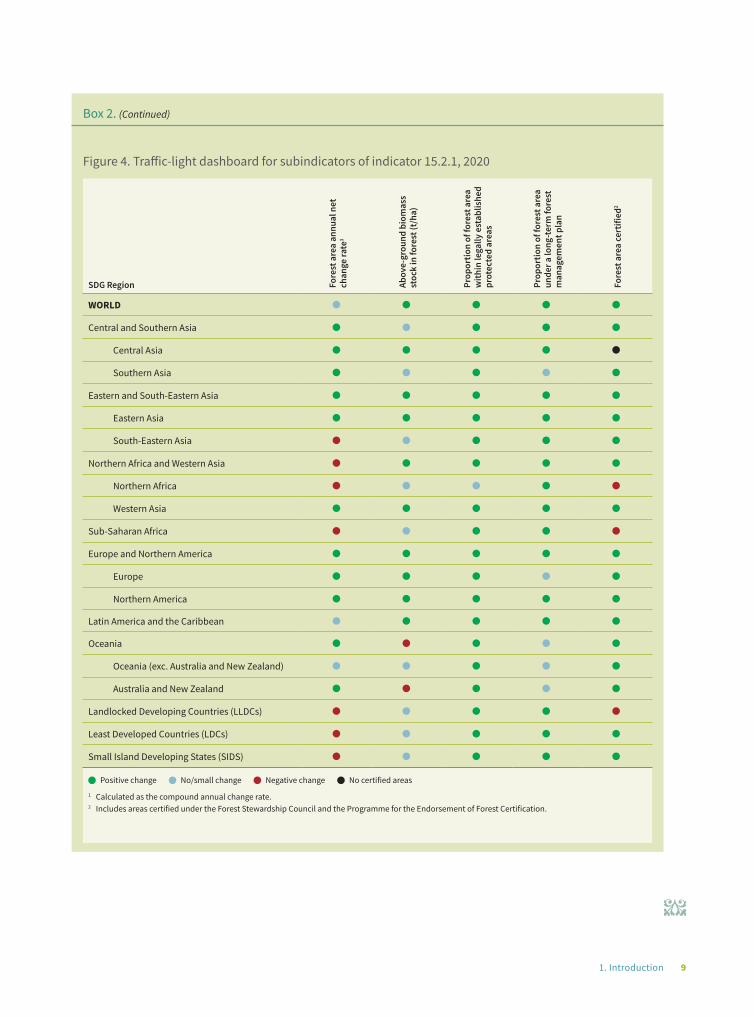
At the regional and global levels, “traffic lights” are used to indicate, for each subindicator, whether the situation is stable, improving or deteriorating (Figure 4).
Figure 2. Sustainable Development Goal 15, and relevant targets
SDG 15 Targets* Indicators reported through FRA
Protect, restore and promote sustainable use of terrestrial ecosystems, sustainably manage forests, combat desertification, and halt and reverse land degradation and halt biodiversity loss
15.1: By 2020, ensure the conservation, restoration and sustainable use of terrestrial and inland freshwater ecosystems and their services, in particular forests, wetlands, mountains and drylands, in line with obligations under international agreements
15.1.1: Forest area as a proportion of total land area
15.2: By 2020, promote the implementation of sustainable management of all types of forests, halt deforestation, restore degraded forests and substantially increase afforestation and reforestation globally
15.2.1: Progress towards sustainable forest management
* The full set of targets and indicators under SDG 15 is available at www.un.org/sustainabledevelopment/biodiversity.
(Continued)

8 Global Forest Resources Assessment 2020
FAO has reported data for these indicators and subindicators to the SDG secretariat annually since 2017. Reports up to 2019 were based on data from FRA 2015; from 2020 they will be based on FRA 2020, with updates from countries as new data become available.
Box 2. (Continued)
Figure 3. Forest area as a proportion (%) of total land area, 2000, 2010 and 2015–2020, by Sustainable Development Goal regional grouping
2000 2010 2015 2016 2017 2018 2019 2020
0 10 20 30 40 50%
60 70 80
Central andSouthern Asia
Eastern andSouth-Eastern Asia
Northern Africa andWestern Asia
Sub-Saharan Africa
Europe andNorthern America
Latin America andthe Caribbean
Oceania
Landlocked Developing Countries (LLDCs)
Least DevelopedCountries (LDCs)
Small Island Developing States (SIDS)
World
(Continued)
91. Introduction
Box 2. (Continued)
Figure 4. Traffic-light dashboard for subindicators of indicator 15.2.1, 2020
SDG Region Fore
st a
rea
annu
al n
et
chan
ge ra
te1
Abov
e-gr
ound
bio
mas
s st
ock
in fo
rest
(t/h
a)
Prop
ortio
n of
fore
st a
rea
with
in le
gally
est
ablis
hed
prot
ecte
d ar
eas
Prop
ortio
n of
fore
st a
rea
unde
r a lo
ng-te
rm fo
rest
m
anag
emen
t pla
n
Fore
st a
rea
cert
ified
2
WORLD • • • • •Central and Southern Asia • • • • •
Central Asia • • • • •Southern Asia • • • • •
Eastern and South-Eastern Asia • • • • •Eastern Asia • • • • •South-Eastern Asia • • • • •
Northern Africa and Western Asia • • • • •Northern Africa • • • • •Western Asia • • • • •
Sub-Saharan Africa • • • • •Europe and Northern America • • • • •
Europe • • • • •Northern America • • • • •
Latin America and the Caribbean • • • • •Oceania • • • • •
Oceania (exc. Australia and New Zealand) • • • • •Australia and New Zealand • • • • •
Landlocked Developing Countries (LLDCs) • • • • •Least Developed Countries (LDCs) • • • • •Small Island Developing States (SIDS) • • • • •• Positive change • No/small change • Negative change • No certified areas
1 Calculated as the compound annual change rate. 2 Includes areas certified under the Forest Stewardship Council and the Programme for the Endorsement of Forest Certification.
C

@ F
AO /
NCo
gnom
e

@ F
AO /
NCo
gnom
e
2 Forest extentand changes
©FA
O/G
iulio
Nap
olita
no
132. Forest extent and changes
orests are crucial resources for addressing SDGs related to sustainable production and consumption, poverty alleviation, food security, biodiversity conservation and climate change.
The benefits of forests go well beyond forest boundaries and help maintain suitable conditions for life on Earth. Monitoring the extent and other aspects of the world’s forests assists in identifying and amending unsustainable practices and in restoring and rehabilitating degraded forest landscapes.
Information on forest area and the way it changes over time is essential for measuring progress towards the SDGs. Forests feature in the SDGs because of their significant contributions to food security and livelihoods and for the many products and ecosystem services they provide. SDG 15 (“life on land”), in particular, puts forests at the centre of the sustainability of terrestrial ecosystems, aiming to “protect, restore and promote sustainable use of terrestrial ecosystems, sustainably manage forests, combat desertification, and halt and reverse land degradation and halt biodiversity loss”.
Changes in forest area over time reflect changes in demand for land for other uses. But, on its own, this parameter is insufficient to describe and explain complex land-use dynamics. Additional information is needed to understand how much forest has been lost due to conversion to other land uses and how much has been gained due to natural expansion and afforestation.
This chapter provides insight into such dynamics, presenting estimates of both deforestation and net forest area change at the regional and global levels (Box 3). It also provides data on two non-forest categories, “other wooded land” and “other land with tree cover”, both of which are important resources in many countries.
Forest area
STATUSFRA 2020 received data (or, for desk studies, made estimates based on available information) on forest area in 2020 for all 236 countries and territories included in the assessment. The global average of the reference years for the data used to estimate forest area for 2020 is 2011. Estimates for countries with large forest areas, however, are mostly based on more recent data; thus, 2015 is the weighted average reference year for forest area. In total, 143 countries and territories encompassing 80 percent of the world’s total forest area based their forest-area estimates for 2020 on data published in 2013 or later. The availability of new data not only increases the reliability of forest-area estimates for 2020; in most cases
F
Box 3. Difference between deforestation and forest area net change
Deforestation is the conversion of forest to other land uses, such as agriculture and infrastructure. On the other hand, forest area can increase when trees are planted on land that was not previously forested (“afforestation”) or when trees grow back on abandoned agricultural or other land (“natural forest expansion”).
Over a given period, the sum of all losses due to deforestation and all gains due to afforestation and natural forest expansion results in forest area net change. Depending on whether forest expansion or deforestation prevails, forest area net change can be positive, meaning there has been an overall gain in forest area, or negative, meaning an overall loss of forest area. Thus:
Forest area net change = ∑ gains (forest expansion) – ∑ losses (deforestation)
The difference between forest area net change and deforestation is that the former is the result of all losses and gains and the latter takes into account only the area of forest that has been converted to other land uses. In FRA 2020, the net change in forest area was calculated as the difference in forest area between two points in time.

14 Global Forest Resources Assessment 2020
it also improves trend estimates derived from historical and previously reported data. In most cases, data from 2013 or later were unavailable for FRA 2015; their availability for FRA 2020 explains differences in forest-area estimates in FRA 2015 and FRA 2020 for the same reference years.
The global forest area in 2020 is estimated at 4.06 billion ha, which is 31 percent of the total land area. This area is equivalent to 0.52 ha of forest per capita,9 although forests are not distributed equally among the world’s people or geographically. Forty-five percent of the world’s forests are in the tropical domain, followed by the boreal (27 percent), temperate (16 percent) and subtropical (11 percent) domains (Figure 5). Table 2 shows the distribution of forest area at the regional and subregional levels. Europe accounts for 25 percent of the world’s forest area, followed by South America (21 percent), North and Central America (19 percent), Africa (16 percent), Asia (15 percent) and Oceania (5 percent).
More than half (54 percent) of the world’s forest area is in only five countries – the Russian Federation, Brazil, Canada, the United States of America and China. The ten countries with the largest forest area account for about two-thirds (66 percent) of the world total (Table 3).
9 Calculated assuming a global population of 7.79 billion people, as estimated by United Nations, Department of Economic and Social Affairs, Population Division (2019).
FIGURE 5. The global distribution of forests, by climatic domain
BorealForest area 1 000 ha
TemperateSubtropicalTropical
1 109 871 665 803 449 122
1 834 136
Source: Adapted from United Nations World map, 2020.
TABLE 2. Forest area, by region and subregion, 2020
Region/subregion Forest area
1 000 ha % of world forest area
Eastern and Southern Africa 295 778 7
Northern Africa 35 151 1
Western and Central Africa 305 710 8
Total Africa 636 639 16
East Asia 271 403 7
South and Southeast Asia 296 047 7
Western and Central Asia 55 237 1
Total Asia 622 687 15
Europe excl. Russian Federation 202 150 5
Total Europe 1 017 461 25
Caribbean 7 889 0
Central America 22 404 1
North America 722 417 18
Total North and Central America 752 710 19
Total Oceania 185 248 5
Total South America 844 186 21
WORLD 4 058 931 100
152. Forest extent and changes
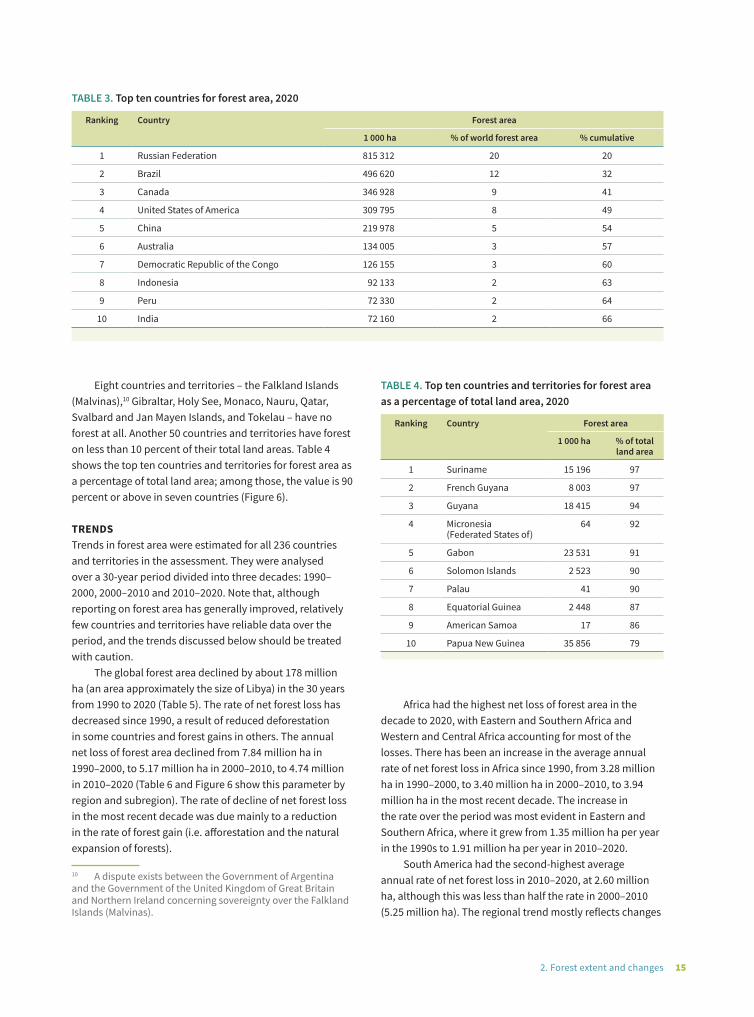
TABLE 3. Top ten countries for forest area, 2020
Ranking Country Forest area
1 000 ha % of world forest area % cumulative
1 Russian Federation 815 312 20 20
2 Brazil 496 620 12 32
3 Canada 346 928 9 41
4 United States of America 309 795 8 49
5 China 219 978 5 54
6 Australia 134 005 3 57
7 Democratic Republic of the Congo 126 155 3 60
8 Indonesia 92 133 2 63
9 Peru 72 330 2 64
10 India 72 160 2 66
Eight countries and territories – the Falkland Islands (Malvinas),10 Gibraltar, Holy See, Monaco, Nauru, Qatar, Svalbard and Jan Mayen Islands, and Tokelau – have no forest at all. Another 50 countries and territories have forest on less than 10 percent of their total land areas. Table 4 shows the top ten countries and territories for forest area as a percentage of total land area; among those, the value is 90 percent or above in seven countries (Figure 6).
TRENDSTrends in forest area were estimated for all 236 countries and territories in the assessment. They were analysed over a 30-year period divided into three decades: 1990–2000, 2000–2010 and 2010–2020. Note that, although reporting on forest area has generally improved, relatively few countries and territories have reliable data over the period, and the trends discussed below should be treated with caution.
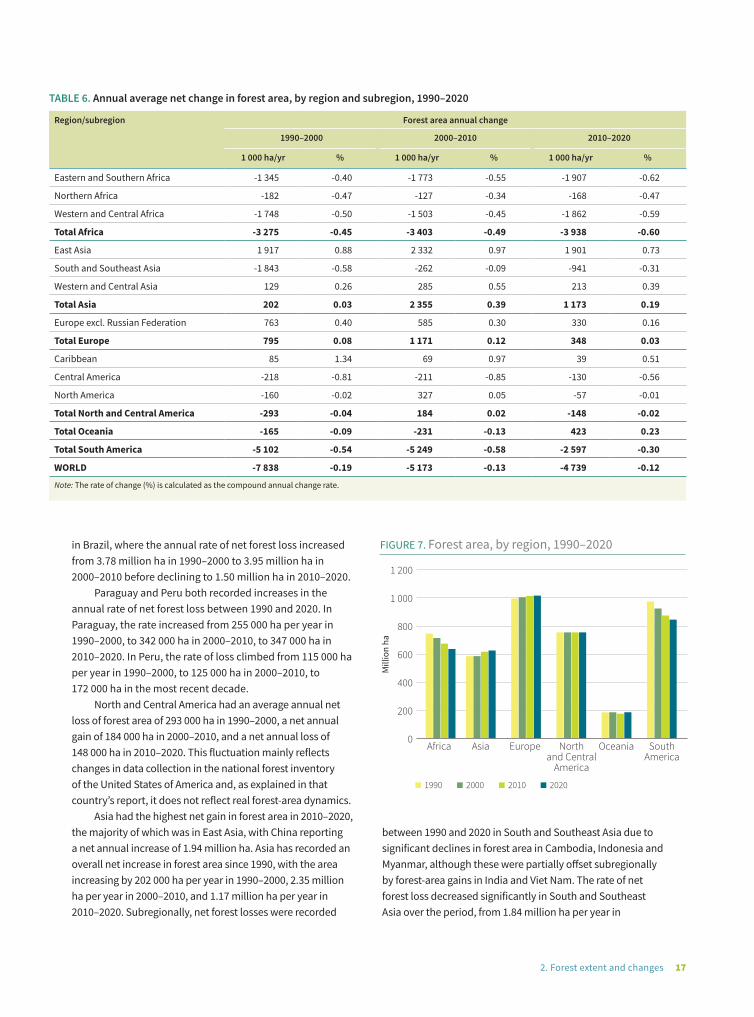
The global forest area declined by about 178 million ha (an area approximately the size of Libya) in the 30 years from 1990 to 2020 (Table 5). The rate of net forest loss has decreased since 1990, a result of reduced deforestation in some countries and forest gains in others. The annual net loss of forest area declined from 7.84 million ha in 1990–2000, to 5.17 million ha in 2000–2010, to 4.74 million in 2010–2020 (Table 6 and Figure 6 show this parameter by region and subregion). The rate of decline of net forest loss in the most recent decade was due mainly to a reduction in the rate of forest gain (i.e. afforestation and the natural expansion of forests).
10 A dispute exists between the Government of Argentina and the Government of the United Kingdom of Great Britain and Northern Ireland concerning sovereignty over the Falkland Islands (Malvinas).
Africa had the highest net loss of forest area in the decade to 2020, with Eastern and Southern Africa and Western and Central Africa accounting for most of the losses. There has been an increase in the average annual rate of net forest loss in Africa since 1990, from 3.28 million ha in 1990–2000, to 3.40 million ha in 2000–2010, to 3.94 million ha in the most recent decade. The increase in the rate over the period was most evident in Eastern and Southern Africa, where it grew from 1.35 million ha per year in the 1990s to 1.91 million ha per year in 2010–2020.
South America had the second-highest average annual rate of net forest loss in 2010–2020, at 2.60 million ha, although this was less than half the rate in 2000–2010 (5.25 million ha). The regional trend mostly reflects changes
TABLE 4. Top ten countries and territories for forest area as a percentage of total land area, 2020
Ranking Country Forest area
1 000 ha % of total land area
1 Suriname 15 196 97
2 French Guyana 8 003 97
3 Guyana 18 415 94
4 Micronesia (Federated States of)
64 92
5 Gabon 23 531 91
6 Solomon Islands 2 523 90
7 Palau 41 90
8 Equatorial Guinea 2 448 87
9 American Samoa 17 86
10 Papua New Guinea 35 856 79

16 Global Forest Resources Assessment 2020
FIGURE 6. Forest area as a percentage of total land area, 2020
Proportion ofland forested (%)
0–1011–3031–5051–7071–100No data
Source: Adapted from United Nations World map, 2020.
TABLE 5. Forest area, by region and subregion, 1990–2020
Region/subregion Forest area (1 000 ha)
1990 2000 2010 2020
Eastern and Southern Africa 346 034 332 580 314 849 295 778
Northern Africa 39 926 38 104 36 833 35 151
Western and Central Africa 356 842 339 365 324 333 305 710
Total Africa 742 801 710 049 676 015 636 639
East Asia 209 906 229 071 252 390 271 403
South and Southeast Asia 326 511 308 077 305 461 296 047
Western and Central Asia 48 976 50 262 53 109 55 237
Total Asia 585 393 587 410 610 960 622 687
Europe excl. Russian Federation 185 369 193 000 198 847 202 150
Total Europe 994 319 1 002 268 1 013 982 1 017 461
Caribbean 5 961 6 808 7 497 7 889
Central America 28 002 25 819 23 706 22 404
North America 721 317 719 721 722 987 722 417
Total North and Central America 755 279 752 349 754 190 752 710
Total Oceania 184 974 183 328 181 015 185 248
Total South America 973 666 922 645 870 154 844 186
WORLD 4 236 433 4 158 050 4 106 317 4 058 931
172. Forest extent and changes
in Brazil, where the annual rate of net forest loss increased from 3.78 million ha in 1990–2000 to 3.95 million ha in 2000–2010 before declining to 1.50 million ha in 2010–2020.
Paraguay and Peru both recorded increases in the annual rate of net forest loss between 1990 and 2020. In Paraguay, the rate increased from 255 000 ha per year in 1990–2000, to 342 000 ha in 2000–2010, to 347 000 ha in 2010–2020. In Peru, the rate of loss climbed from 115 000 ha per year in 1990–2000, to 125 000 ha in 2000–2010, to 172 000 ha in the most recent decade.
North and Central America had an average annual net loss of forest area of 293 000 ha in 1990–2000, a net annual gain of 184 000 ha in 2000–2010, and a net annual loss of 148 000 ha in 2010–2020. This fluctuation mainly reflects changes in data collection in the national forest inventory of the United States of America and, as explained in that country’s report, it does not reflect real forest-area dynamics.
Asia had the highest net gain in forest area in 2010–2020, the majority of which was in East Asia, with China reporting a net annual increase of 1.94 million ha. Asia has recorded an overall net increase in forest area since 1990, with the area increasing by 202 000 ha per year in 1990–2000, 2.35 million ha per year in 2000–2010, and 1.17 million ha per year in 2010–2020. Subregionally, net forest losses were recorded
between 1990 and 2020 in South and Southeast Asia due to significant declines in forest area in Cambodia, Indonesia and Myanmar, although these were partially offset subregionally by forest-area gains in India and Viet Nam. The rate of net forest loss decreased significantly in South and Southeast Asia over the period, from 1.84 million ha per year in
TABLE 6. Annual average net change in forest area, by region and subregion, 1990–2020
Region/subregion Forest area annual change
1990–2000 2000–2010 2010–2020
1 000 ha/yr % 1 000 ha/yr % 1 000 ha/yr %
Eastern and Southern Africa -1 345 -0.40 -1 773 -0.55 -1 907 -0.62
Northern Africa -182 -0.47 -127 -0.34 -168 -0.47
Western and Central Africa -1 748 -0.50 -1 503 -0.45 -1 862 -0.59
Total Africa -3 275 -0.45 -3 403 -0.49 -3 938 -0.60
East Asia 1 917 0.88 2 332 0.97 1 901 0.73
South and Southeast Asia -1 843 -0.58 -262 -0.09 -941 -0.31
Western and Central Asia 129 0.26 285 0.55 213 0.39
Total Asia 202 0.03 2 355 0.39 1 173 0.19
Europe excl. Russian Federation 763 0.40 585 0.30 330 0.16
Total Europe 795 0.08 1 171 0.12 348 0.03
Caribbean 85 1.34 69 0.97 39 0.51
Central America -218 -0.81 -211 -0.85 -130 -0.56
North America -160 -0.02 327 0.05 -57 -0.01
Total North and Central America -293 -0.04 184 0.02 -148 -0.02
Total Oceania -165 -0.09 -231 -0.13 423 0.23
Total South America -5 102 -0.54 -5 249 -0.58 -2 597 -0.30
WORLD -7 838 -0.19 -5 173 -0.13 -4 739 -0.12
Note: The rate of change (%) is calculated as the compound annual change rate.
FIGURE 7. Forest area, by region, 1990–2020
Mill
ion
ha
1 200
1 000
800
600
400
200
0Africa Asia Europe North
and CentralAmerica
Oceania SouthAmerica
1990 2000 2010 2020
FIGURE 3. Forest area as a proportion (%) of total land area, 2000, 2010 and 2015–2020, by Sustainable Development Goal regional grouping
18 Global Forest Resources Assessment 2020
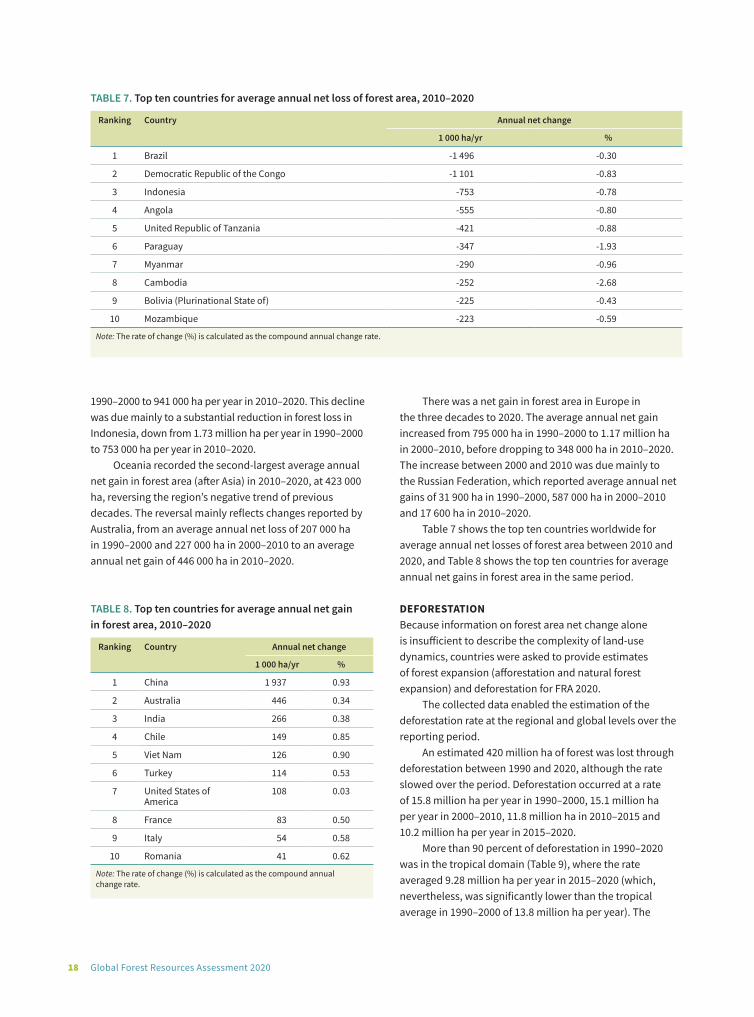
TABLE 7. Top ten countries for average annual net loss of forest area, 2010–2020
Ranking Country Annual net change
1 000 ha/yr %
1 Brazil -1 496 -0.30
2 Democratic Republic of the Congo -1 101 -0.83
3 Indonesia -753 -0.78
4 Angola -555 -0.80
5 United Republic of Tanzania -421 -0.88
6 Paraguay -347 -1.93
7 Myanmar -290 -0.96
8 Cambodia -252 -2.68
9 Bolivia (Plurinational State of) -225 -0.43
10 Mozambique -223 -0.59
Note: The rate of change (%) is calculated as the compound annual change rate.
TABLE 8. Top ten countries for average annual net gain in forest area, 2010–2020
Ranking Country Annual net change
1 000 ha/yr %
1 China 1 937 0.93
2 Australia 446 0.34
3 India 266 0.38
4 Chile 149 0.85
5 Viet Nam 126 0.90
6 Turkey 114 0.53
7 United States of America
108 0.03
8 France 83 0.50
9 Italy 54 0.58
10 Romania 41 0.62
Note: The rate of change (%) is calculated as the compound annual change rate.
1990–2000 to 941 000 ha per year in 2010–2020. This decline was due mainly to a substantial reduction in forest loss in Indonesia, down from 1.73 million ha per year in 1990–2000 to 753 000 ha per year in 2010–2020.
Oceania recorded the second-largest average annual net gain in forest area (after Asia) in 2010–2020, at 423 000 ha, reversing the region’s negative trend of previous decades. The reversal mainly reflects changes reported by Australia, from an average annual net loss of 207 000 ha in 1990–2000 and 227 000 ha in 2000–2010 to an average annual net gain of 446 000 ha in 2010–2020.
There was a net gain in forest area in Europe in the three decades to 2020. The average annual net gain increased from 795 000 ha in 1990–2000 to 1.17 million ha in 2000–2010, before dropping to 348 000 ha in 2010–2020. The increase between 2000 and 2010 was due mainly to the Russian Federation, which reported average annual net gains of 31 900 ha in 1990–2000, 587 000 ha in 2000–2010 and 17 600 ha in 2010–2020.
Table 7 shows the top ten countries worldwide for average annual net losses of forest area between 2010 and 2020, and Table 8 shows the top ten countries for average annual net gains in forest area in the same period.
DEFORESTATION Because information on forest area net change alone is insufficient to describe the complexity of land-use dynamics, countries were asked to provide estimates of forest expansion (afforestation and natural forest expansion) and deforestation for FRA 2020.
The collected data enabled the estimation of the deforestation rate at the regional and global levels over the reporting period.
An estimated 420 million ha of forest was lost through deforestation between 1990 and 2020, although the rate slowed over the period. Deforestation occurred at a rate of 15.8 million ha per year in 1990–2000, 15.1 million ha per year in 2000–2010, 11.8 million ha in 2010–2015 and 10.2 million ha per year in 2015–2020.
More than 90 percent of deforestation in 1990–2020 was in the tropical domain (Table 9), where the rate averaged 9.28 million ha per year in 2015–2020 (which, nevertheless, was significantly lower than the tropical average in 1990–2000 of 13.8 million ha per year). The
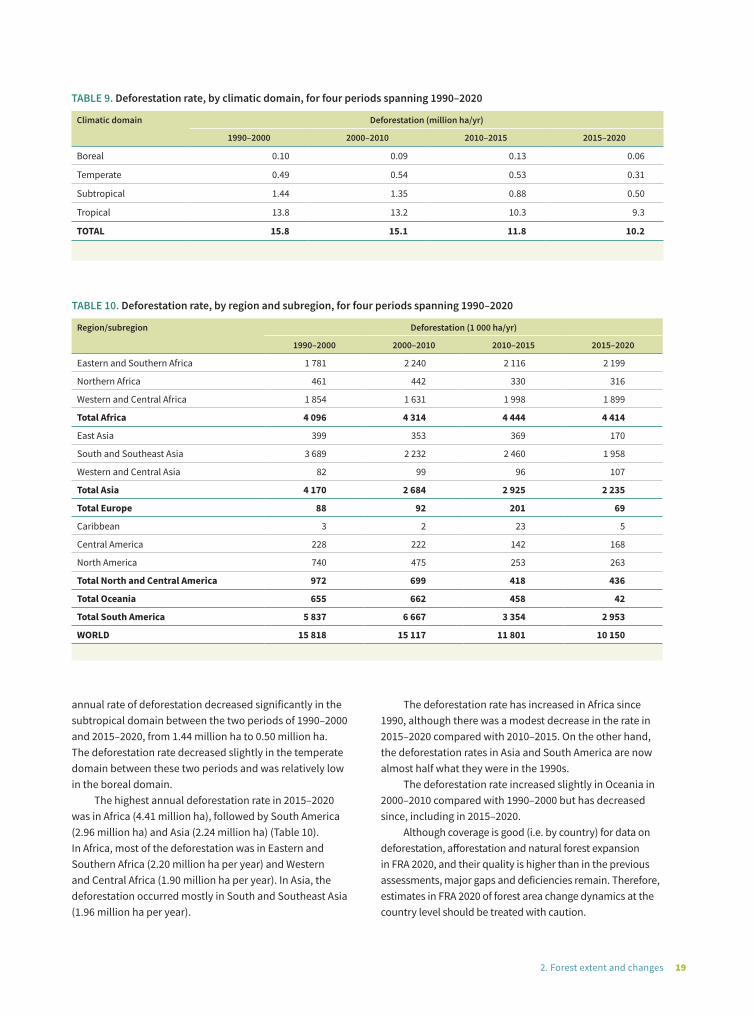
192. Forest extent and changes
annual rate of deforestation decreased significantly in the subtropical domain between the two periods of 1990–2000 and 2015–2020, from 1.44 million ha to 0.50 million ha. The deforestation rate decreased slightly in the temperate domain between these two periods and was relatively low in the boreal domain.
The highest annual deforestation rate in 2015–2020 was in Africa (4.41 million ha), followed by South America (2.96 million ha) and Asia (2.24 million ha) (Table 10). In Africa, most of the deforestation was in Eastern and Southern Africa (2.20 million ha per year) and Western and Central Africa (1.90 million ha per year). In Asia, the deforestation occurred mostly in South and Southeast Asia (1.96 million ha per year).
The deforestation rate has increased in Africa since 1990, although there was a modest decrease in the rate in 2015–2020 compared with 2010–2015. On the other hand, the deforestation rates in Asia and South America are now almost half what they were in the 1990s.
The deforestation rate increased slightly in Oceania in 2000–2010 compared with 1990–2000 but has decreased since, including in 2015–2020.
Although coverage is good (i.e. by country) for data on deforestation, afforestation and natural forest expansion in FRA 2020, and their quality is higher than in the previous assessments, major gaps and deficiencies remain. Therefore, estimates in FRA 2020 of forest area change dynamics at the country level should be treated with caution.
TABLE 9. Deforestation rate, by climatic domain, for four periods spanning 1990–2020
Climatic domain Deforestation (million ha/yr)
1990–2000 2000–2010 2010–2015 2015–2020
Boreal 0.10 0.09 0.13 0.06
Temperate 0.49 0.54 0.53 0.31
Subtropical 1.44 1.35 0.88 0.50
Tropical 13.8 13.2 10.3 9.3
TOTAL 15.8 15.1 11.8 10.2
TABLE 10. Deforestation rate, by region and subregion, for four periods spanning 1990–2020
Region/subregion Deforestation (1 000 ha/yr)
1990–2000 2000–2010 2010–2015 2015–2020
Eastern and Southern Africa 1 781 2 240 2 116 2 199
Northern Africa 461 442 330 316
Western and Central Africa 1 854 1 631 1 998 1 899
Total Africa 4 096 4 314 4 444 4 414
East Asia 399 353 369 170
South and Southeast Asia 3 689 2 232 2 460 1 958
Western and Central Asia 82 99 96 107
Total Asia 4 170 2 684 2 925 2 235
Total Europe 88 92 201 69
Caribbean 3 2 23 5
Central America 228 222 142 168
North America 740 475 253 263
Total North and Central America 972 699 418 436
Total Oceania 655 662 458 42
Total South America 5 837 6 667 3 354 2 953
WORLD 15 818 15 117 11 801 10 150
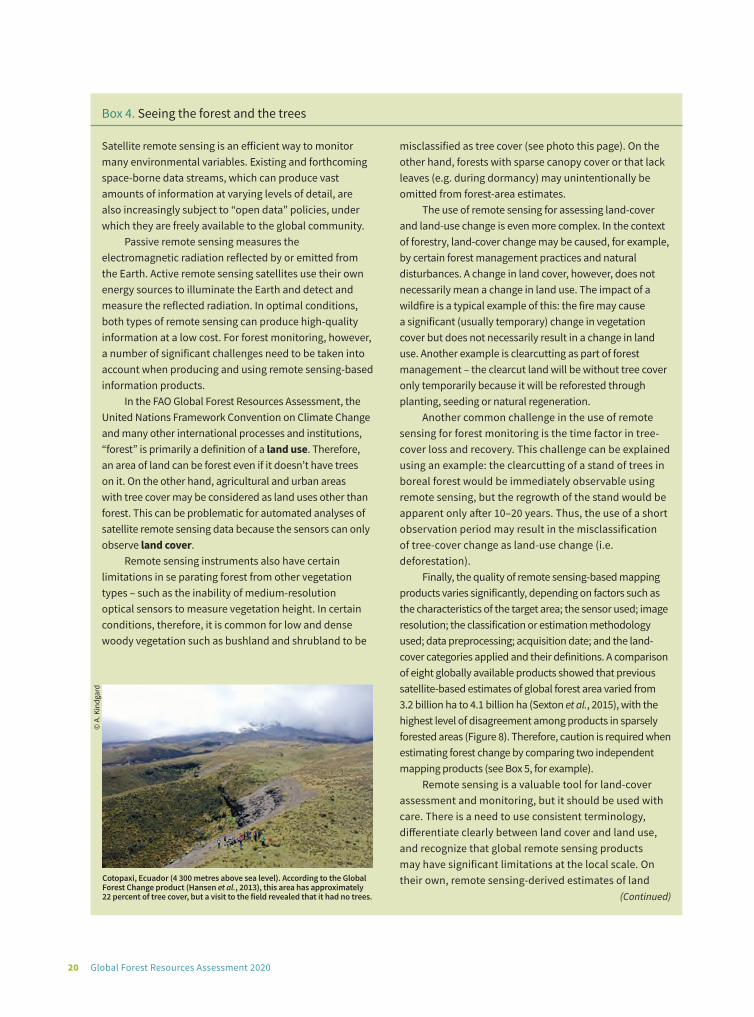
20 Global Forest Resources Assessment 2020
Box 4. Seeing the forest and the trees
Satellite remote sensing is an efficient way to monitor many environmental variables. Existing and forthcoming space-borne data streams, which can produce vast amounts of information at varying levels of detail, are also increasingly subject to “open data” policies, under which they are freely available to the global community.
Passive remote sensing measures the electromagnetic radiation reflected by or emitted from the Earth. Active remote sensing satellites use their own energy sources to illuminate the Earth and detect and measure the reflected radiation. In optimal conditions, both types of remote sensing can produce high-quality information at a low cost. For forest monitoring, however, a number of significant challenges need to be taken into account when producing and using remote sensing-based information products.
In the FAO Global Forest Resources Assessment, the United Nations Framework Convention on Climate Change and many other international processes and institutions, “forest” is primarily a definition of a land use. Therefore, an area of land can be forest even if it doesn’t have trees on it. On the other hand, agricultural and urban areas with tree cover may be considered as land uses other than forest. This can be problematic for automated analyses of satellite remote sensing data because the sensors can only observe land cover.
Remote sensing instruments also have certain limitations in se parating forest from other vegetation types – such as the inability of medium-resolution optical sensors to measure vegetation height. In certain conditions, therefore, it is common for low and dense woody vegetation such as bushland and shrubland to be
misclassified as tree cover (see photo this page). On the other hand, forests with sparse canopy cover or that lack leaves (e.g. during dormancy) may unintentionally be omitted from forest-area estimates.
The use of remote sensing for assessing land-cover and land-use change is even more complex. In the context of forestry, land-cover change may be caused, for example, by certain forest management practices and natural disturbances. A change in land cover, however, does not necessarily mean a change in land use. The impact of a wildfire is a typical example of this: the fire may cause a significant (usually temporary) change in vegetation cover but does not necessarily result in a change in land use. Another example is clearcutting as part of forest management – the clearcut land will be without tree cover only temporarily because it will be reforested through planting, seeding or natural regeneration.
Another common challenge in the use of remote sensing for forest monitoring is the time factor in tree-cover loss and recovery. This challenge can be explained using an example: the clearcutting of a stand of trees in boreal forest would be immediately observable using remote sensing, but the regrowth of the stand would be apparent only after 10–20 years. Thus, the use of a short observation period may result in the misclassification of tree-cover change as land-use change (i.e. deforestation).
Finally, the quality of remote sensing-based mapping products varies significantly, depending on factors such as the characteristics of the target area; the sensor used; image resolution; the classification or estimation methodology used; data preprocessing; acquisition date; and the land-cover categories applied and their definitions. A comparison of eight globally available products showed that previous satellite-based estimates of global forest area varied from 3.2 billion ha to 4.1 billion ha (Sexton et al., 2015), with the highest level of disagreement among products in sparsely forested areas (Figure 8). Therefore, caution is required when estimating forest change by comparing two independent mapping products (see Box 5, for example).
Remote sensing is a valuable tool for land-cover assessment and monitoring, but it should be used with care. There is a need to use consistent terminology, differentiate clearly between land cover and land use, and recognize that global remote sensing products may have significant limitations at the local scale. On their own, remote sensing-derived estimates of land
© A
. Kin
dgar
d
(Continued)
Cotopaxi, Ecuador (4 300 metres above sea level). According to the Global Forest Change product (Hansen et al., 2013), this area has approximately 22 percent of tree cover, but a visit to the field revealed that it had no trees.

212. Forest extent and changes
cover and land-cover change are insufficient to support holistic policy formulation and decision-making – which also require data on, among other things, growing stock, biomass, carbon stock, biodiversity and forest
health. Responding to these data needs requires a well-designed, multipurpose field inventory, which can also be used to derive reliable forest-area estimates with known confidence limits.
Box 4. (Continued)
Other land with tree cover
STATUS The category “other land with tree cover” comprises areas found in rural landscapes and urban settings that meet the thresholds for tree cover established by FAO’s forest definition but for which the land use is not forest (and therefore the land does not meet FAO’s forest definition). This category is reported here because of its importance in the provision of goods and ecosystem services. It has four subcategories: trees in urban settings; tree orchards; palms; and agroforestry.
Table 11 (p. 23) shows the estimated areas in each of these subcategories, by region and subregion. Not all countries reported areas in all subcategories. Overall, there is an estimated 11.8 million ha of palms in 94 countries and territories, mostly in Asia (8.18 million ha), Africa (1.66 million ha) and South America (1.01 million ha).
Seventy-six countries and territories reported a total area of tree orchards of 27.8 million ha, mostly in Asia (11.7 million ha), Europe (8.34 million ha), Africa (3.99 million ha) and North and Central America (3.41 million ha).
Seventy-one countries and territories reported an area of 45.4 million ha of agroforestry in 2020, mostly in Asia (31.2 million ha) and Africa (12.8 million ha). There is an estimated 1.28 million ha of agroforestry in North and Central America.
Trees in urban settings were reported by 52 countries and territories, with a total area of 20.3 million ha. Of this, more than two-thirds (13.8 million ha) is in North and Central America, with more modest areas in Europe (2.77 million ha) and Asia (2.40 million ha).
TRENDSFigure 9 shows global change in the area of other land with tree cover from 1990 to 2020. The trend for palms is based on data reported by 83 countries and territories. The area
Figure 8. Global distribution of consensus among eight satellite-based datasets
Note: A high value of votes means a high level of agreement among datasets, and vice versa. Source: Sexton et al. (2015).
Fore
st v
otes
8
1
0

22 Global Forest Resources Assessment 2020
FIGURE 9. Global area of other land with tree cover, 1990–2020
Mill
ion
ha
50
45
40
35
30
25
20
15
10
5
0Agroforestry Palms Tree
orchardsTrees
in urbansettings
1990 2000 2010 2020
Box 5. Understanding regional differences between products in estimated forest area and tree cover
A comparison was made of estimates of forest area by the Global Forest Resources Assessment (FRA) and of tree cover derived from the Global Forest Change (GFC) product (University of Maryland), at the subregional level. Data for 2010 were used for the comparison because this was the most recent year for which the GFC tree-cover layer was available.11
The largest relative differences between the two sets of estimates were in Northern Africa and Western and Central Asia, where FRA forest-area estimates were much higher than those derived using the GFC. In these regions, the forest share of the total land area was typically low (less than 5 percent); these regions are characterized by open-forest formations such as open woodlands, savannas and the saxaul forests of Central Asia.
In Central America, Western and Central Africa, and South and Southeast Asia, FRA estimates of total forest area were lower than those derived from the GFC product. In these subregions, the share of the land area with forest cover is high (>30 percent), with large areas characterized by tropical rainforest, having high (>70 percent) crown cover, and also by landscapes consisting of 10–30 percent tree cover and 50 percent croplands (Mayaux et al., 2013).
There are many reasons for these differences. The GFC used optical remote sensing; as described in Box 4, this technology has certain challenges in detecting open-forest formations, which are widespread in Northern Africa and Western and Central Asia. Moreover, separating forest from “other wooded land” is sometimes problematic in those
regions, which may affect FRA estimates. This is likely to be especially true in Western and Central Asia, where 16 of 25 countries reported forest-area data based on secondary sources such as land registers and questionnaires.
In those areas where FRA estimates of forest area were much lower than those of the GFC, the likely explanation is that remote sensing-based estimates include large areas of agricultural land with canopy cover (e.g. oil palm and cacao), agroforestry, and other vegetation not meeting the FRA definition of forest. In such areas, the quality of data used for the FRA reports is high, with only 2 of 51 countries basing their estimates on the lowest-tier sources (see Box 11).
Overall, more work is required to determine the reasons for differences between the datasets and thereby to better understand the extent and dynamics of global forest resources. Cross-checking country-reported data with other data sources and understanding the reasons for differences will help improve both the remote sensing products and FRA reports and increase the overall transparency of forest resource information. To this end, the FRA process seeks to improve the capacity of countries to access and use remote sensing data and products. During the process to produce FRA 2020, FAO took initial steps towards integrating freely available geospatial data and products into the new FRA reporting platform, with support from Google. This work will continue in coming years with the aim of helping countries assess the value of remote sensing data and products and supporting them to integrate such products into national processes.
of palms more than doubled between 1990 and 2020, from 4.20 million ha to 9.34 million ha. Most of the increase was in Asia (up from 3.14 million ha in 1990 to 7.61 million ha in 2020) and mainly in Malaysia (up from 2.35 million ha to 6.36 million ha). 11
Seventy-six countries and territories reported on trends in the area of tree orchards, which increased by 7.64 million ha between 1990 and 2020. Asia contributed a large part of this, with the area in that region growing from 5.71 million ha in 1990 to 11.7 million ha in 2020. Most of the increase was in China (up from 3.95 million ha to 10.2 million ha).
Fifty-four countries and territories reported trend data on agroforestry. The area of land subject to agroforestry increased by 4.21 million ha between 1990
11 The GFC data used in this analysis were generated using a 30 percent tree-cover threshold. The data were downloaded from www.globalforestwatch.org
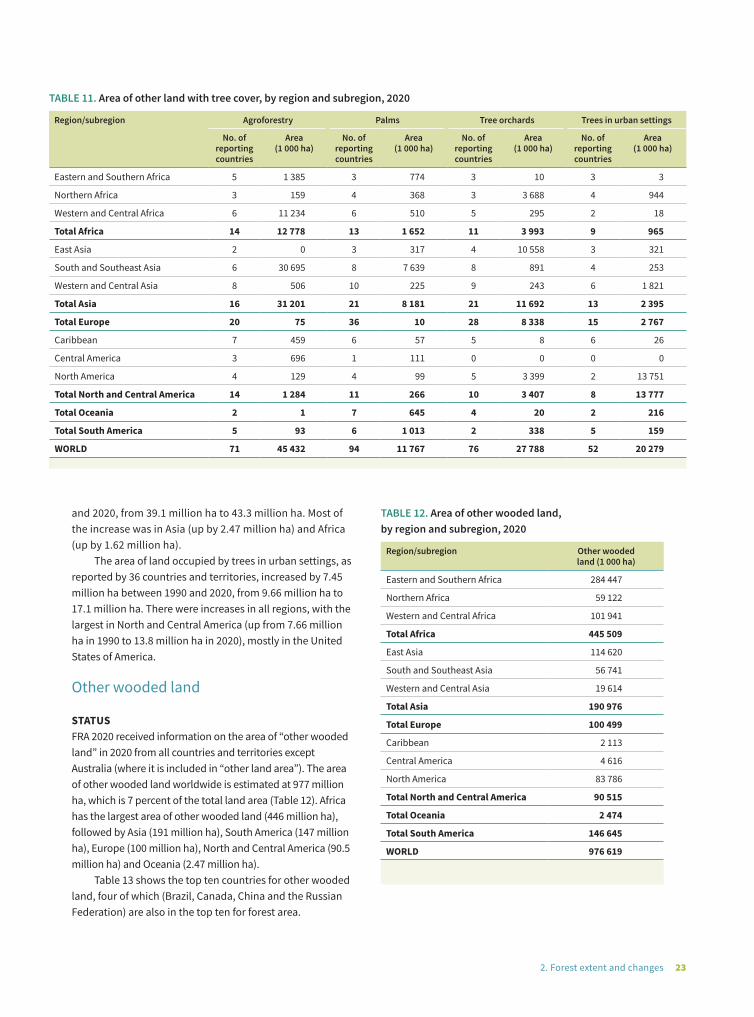
232. Forest extent and changes
TABLE 11. Area of other land with tree cover, by region and subregion, 2020
Region/subregion Agroforestry Palms Tree orchards Trees in urban settings
No. of reporting countries
Area (1 000 ha)
No. of reporting countries
Area (1 000 ha)
No. of reporting countries
Area (1 000 ha)
No. of reporting countries
Area (1 000 ha)
Eastern and Southern Africa 5 1 385 3 774 3 10 3 3
Northern Africa 3 159 4 368 3 3 688 4 944
Western and Central Africa 6 11 234 6 510 5 295 2 18
Total Africa 14 12 778 13 1 652 11 3 993 9 965
East Asia 2 0 3 317 4 10 558 3 321
South and Southeast Asia 6 30 695 8 7 639 8 891 4 253
Western and Central Asia 8 506 10 225 9 243 6 1 821
Total Asia 16 31 201 21 8 181 21 11 692 13 2 395
Total Europe 20 75 36 10 28 8 338 15 2 767
Caribbean 7 459 6 57 5 8 6 26
Central America 3 696 1 111 0 0 0 0
North America 4 129 4 99 5 3 399 2 13 751
Total North and Central America 14 1 284 11 266 10 3 407 8 13 777
Total Oceania 2 1 7 645 4 20 2 216
Total South America 5 93 6 1 013 2 338 5 159
WORLD 71 45 432 94 11 767 76 27 788 52 20 279
TABLE 12. Area of other wooded land, by region and subregion, 2020
Region/subregion Other wooded land (1 000 ha)
Eastern and Southern Africa 284 447
Northern Africa 59 122
Western and Central Africa 101 941
Total Africa 445 509
East Asia 114 620
South and Southeast Asia 56 741
Western and Central Asia 19 614
Total Asia 190 976
Total Europe 100 499
Caribbean 2 113
Central America 4 616
North America 83 786
Total North and Central America 90 515
Total Oceania 2 474
Total South America 146 645
WORLD 976 619
and 2020, from 39.1 million ha to 43.3 million ha. Most of the increase was in Asia (up by 2.47 million ha) and Africa (up by 1.62 million ha).
The area of land occupied by trees in urban settings, as reported by 36 countries and territories, increased by 7.45 million ha between 1990 and 2020, from 9.66 million ha to 17.1 million ha. There were increases in all regions, with the largest in North and Central America (up from 7.66 million ha in 1990 to 13.8 million ha in 2020), mostly in the United States of America.
Other wooded land
STATUSFRA 2020 received information on the area of “other wooded land” in 2020 from all countries and territories except Australia (where it is included in “other land area”). The area of other wooded land worldwide is estimated at 977 million ha, which is 7 percent of the total land area (Table 12). Africa has the largest area of other wooded land (446 million ha), followed by Asia (191 million ha), South America (147 million ha), Europe (100 million ha), North and Central America (90.5 million ha) and Oceania (2.47 million ha).
Table 13 shows the top ten countries for other wooded land, four of which (Brazil, Canada, China and the Russian Federation) are also in the top ten for forest area.
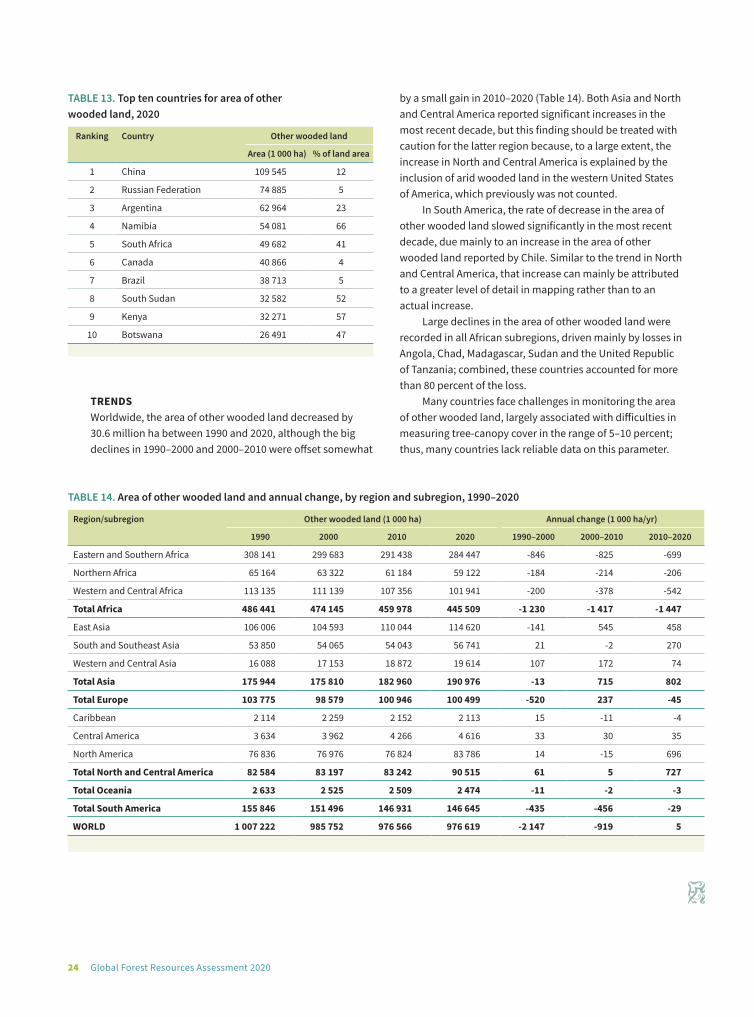
@ F
AO /
NCo
gnom
e
24 Global Forest Resources Assessment 2020
TABLE 14. Area of other wooded land and annual change, by region and subregion, 1990–2020
Region/subregion Other wooded land (1 000 ha) Annual change (1 000 ha/yr)
1990 2000 2010 2020 1990–2000 2000–2010 2010–2020
Eastern and Southern Africa 308 141 299 683 291 438 284 447 -846 -825 -699
Northern Africa 65 164 63 322 61 184 59 122 -184 -214 -206
Western and Central Africa 113 135 111 139 107 356 101 941 -200 -378 -542
Total Africa 486 441 474 145 459 978 445 509 -1 230 -1 417 -1 447
East Asia 106 006 104 593 110 044 114 620 -141 545 458
South and Southeast Asia 53 850 54 065 54 043 56 741 21 -2 270
Western and Central Asia 16 088 17 153 18 872 19 614 107 172 74
Total Asia 175 944 175 810 182 960 190 976 -13 715 802
Total Europe 103 775 98 579 100 946 100 499 -520 237 -45
Caribbean 2 114 2 259 2 152 2 113 15 -11 -4
Central America 3 634 3 962 4 266 4 616 33 30 35
North America 76 836 76 976 76 824 83 786 14 -15 696
Total North and Central America 82 584 83 197 83 242 90 515 61 5 727
Total Oceania 2 633 2 525 2 509 2 474 -11 -2 -3
Total South America 155 846 151 496 146 931 146 645 -435 -456 -29
WORLD 1 007 222 985 752 976 566 976 619 -2 147 -919 5
D
TRENDSWorldwide, the area of other wooded land decreased by 30.6 million ha between 1990 and 2020, although the big declines in 1990–2000 and 2000–2010 were offset somewhat
by a small gain in 2010–2020 (Table 14). Both Asia and North and Central America reported significant increases in the most recent decade, but this finding should be treated with caution for the latter region because, to a large extent, the increase in North and Central America is explained by the inclusion of arid wooded land in the western United States of America, which previously was not counted.
In South America, the rate of decrease in the area of other wooded land slowed significantly in the most recent decade, due mainly to an increase in the area of other wooded land reported by Chile. Similar to the trend in North and Central America, that increase can mainly be attributed to a greater level of detail in mapping rather than to an actual increase.
Large declines in the area of other wooded land were recorded in all African subregions, driven mainly by losses in Angola, Chad, Madagascar, Sudan and the United Republic of Tanzania; combined, these countries accounted for more than 80 percent of the loss.
Many countries face challenges in monitoring the area of other wooded land, largely associated with difficulties in measuring tree-canopy cover in the range of 5–10 percent; thus, many countries lack reliable data on this parameter.
TABLE 13. Top ten countries for area of other wooded land, 2020
Ranking Country Other wooded land
Area (1 000 ha) % of land area
1 China 109 545 12
2 Russian Federation 74 885 5
3 Argentina 62 964 23
4 Namibia 54 081 66
5 South Africa 49 682 41
6 Canada 40 866 4
7 Brazil 38 713 5
8 South Sudan 32 582 52
9 Kenya 32 271 57
10 Botswana 26 491 47
@ F
AO /
NCo
gnom
e
3 Forest
characteristics

©U
npla
sh/S
ugar
Bee
©U
npla
sh/S
ugar
Bee

273. Forest characteristics
orests encompass a wide range of ecosystems that vary considerably in their characteristics, such as in species composition, structure and the extent of modification by humans
and by non-human factors. Thus, forest area is an insufficient parameter, on its own, for identifying important trends and assessing progress towards sustainable forest management.
FRA identifies two broad categories of forest: naturally regenerating forest, and planted forest. FRA 2020 collected information on both these categories, as well as on certain subcategories discussed below.
There is ongoing debate on the functions and values of naturally regenerating versus planted forests. Naturally regenerating forests (also called natural forests) generally contribute more to biodiversity conservation and provide a wider range of benefits and certain ecosystem services
compared with planted forests. When sustainably managed, planted forests can help reduce harvesting pressure on natural forests, and some may also provide important ecosystem services.
Information was collected on two subcategories of planted forest: “plantation” and “other planted” (Figure 10). Countries also estimated the proportion of their plantation forests mainly composed of introduced species. In addition to the main categories of natural and planted forest, information was collected on primary forests; mangroves; bamboo forests; and rubberwood plantations.
Naturally regenerating forest
STATUSFRA 2020 received information on the area of naturally regenerating forest in 2020 from 219 countries and
F
FIGURE 10. Components of planted forest
PLANTED FORESTForest predominantly composed of trees established through
planting and/or deliberate seeding.
PLANTATION FOREST OTHER PLANTED FORESTPlanted forest which is
intensively managed and meets all the
following criteria at planting and stand
maturity: one or two species, even age class, and regular
spacing. Plantation forests are established
for the production of timber, fibre, energy
and non-wood forest products.
Plantation forests mainly composed
of introduced species represent a subcategory of
plantation forests
Planted forest that does not meet the criteria of a plantation forest and may even resemble natural forests at stand maturity. Other planted forests may be established for purposes such as ecosystem restoration and the protection of soil and water
© S
hutte
rsto
ck/J
. Mar
tin
©Sh
utte
rsto
ck/D
. Lep
pert
©Sh
utte
rsto
ck/P
. Vile
la
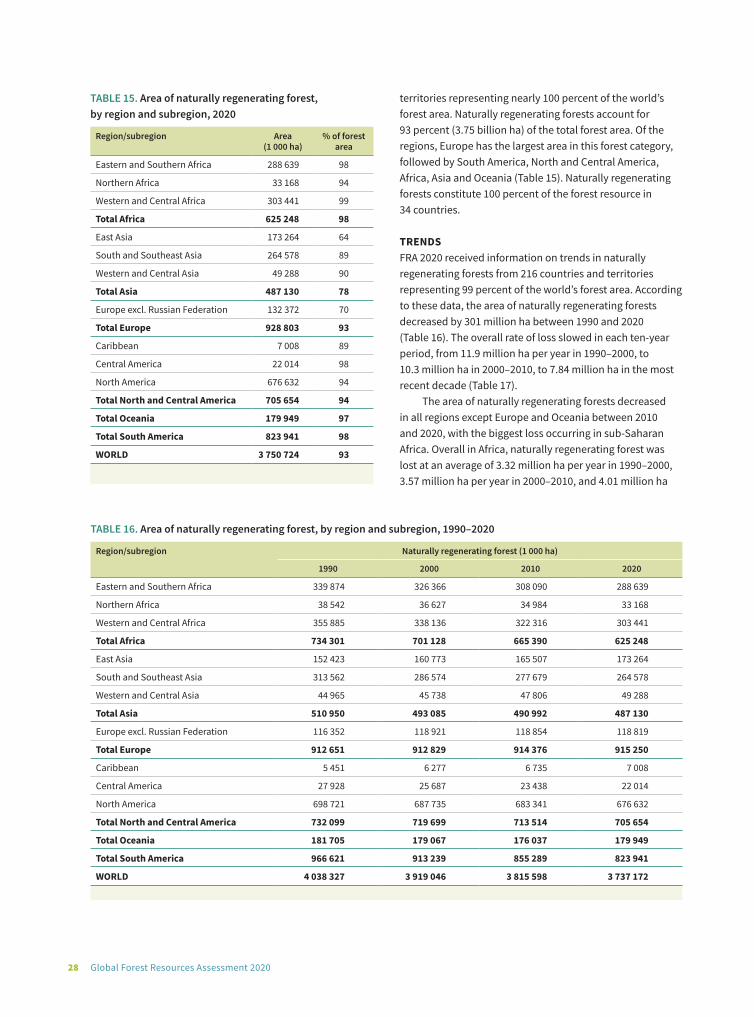
28 Global Forest Resources Assessment 2020
territories representing nearly 100 percent of the world’s forest area. Naturally regenerating forests account for 93 percent (3.75 billion ha) of the total forest area. Of the regions, Europe has the largest area in this forest category, followed by South America, North and Central America, Africa, Asia and Oceania (Table 15). Naturally regenerating forests constitute 100 percent of the forest resource in 34 countries.
TRENDSFRA 2020 received information on trends in naturally regenerating forests from 216 countries and territories representing 99 percent of the world’s forest area. According to these data, the area of naturally regenerating forests decreased by 301 million ha between 1990 and 2020 (Table 16). The overall rate of loss slowed in each ten-year period, from 11.9 million ha per year in 1990–2000, to 10.3 million ha in 2000–2010, to 7.84 million ha in the most recent decade (Table 17).
The area of naturally regenerating forests decreased in all regions except Europe and Oceania between 2010 and 2020, with the biggest loss occurring in sub-Saharan Africa. Overall in Africa, naturally regenerating forest was lost at an average of 3.32 million ha per year in 1990–2000, 3.57 million ha per year in 2000–2010, and 4.01 million ha
TABLE 15. Area of naturally regenerating forest, by region and subregion, 2020
Region/subregion Area (1 000 ha)
% of forest area
Eastern and Southern Africa 288 639 98
Northern Africa 33 168 94
Western and Central Africa 303 441 99
Total Africa 625 248 98
East Asia 173 264 64
South and Southeast Asia 264 578 89
Western and Central Asia 49 288 90
Total Asia 487 130 78
Europe excl. Russian Federation 132 372 70
Total Europe 928 803 93
Caribbean 7 008 89
Central America 22 014 98
North America 676 632 94
Total North and Central America 705 654 94
Total Oceania 179 949 97
Total South America 823 941 98
WORLD 3 750 724 93
TABLE 16. Area of naturally regenerating forest, by region and subregion, 1990–2020
Region/subregion Naturally regenerating forest (1 000 ha)
1990 2000 2010 2020
Eastern and Southern Africa 339 874 326 366 308 090 288 639
Northern Africa 38 542 36 627 34 984 33 168
Western and Central Africa 355 885 338 136 322 316 303 441
Total Africa 734 301 701 128 665 390 625 248
East Asia 152 423 160 773 165 507 173 264
South and Southeast Asia 313 562 286 574 277 679 264 578
Western and Central Asia 44 965 45 738 47 806 49 288
Total Asia 510 950 493 085 490 992 487 130
Europe excl. Russian Federation 116 352 118 921 118 854 118 819
Total Europe 912 651 912 829 914 376 915 250
Caribbean 5 451 6 277 6 735 7 008
Central America 27 928 25 687 23 438 22 014
North America 698 721 687 735 683 341 676 632
Total North and Central America 732 099 719 699 713 514 705 654
Total Oceania 181 705 179 067 176 037 179 949
Total South America 966 621 913 239 855 289 823 941
WORLD 4 038 327 3 919 046 3 815 598 3 737 172
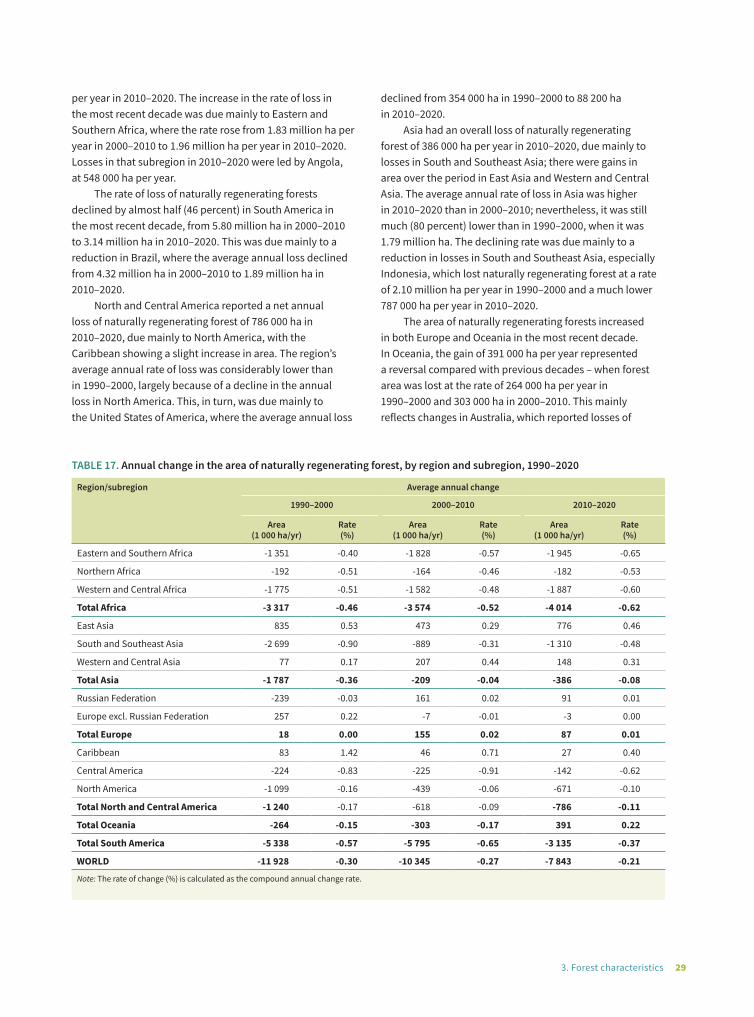
293. Forest characteristics
per year in 2010–2020. The increase in the rate of loss in the most recent decade was due mainly to Eastern and Southern Africa, where the rate rose from 1.83 million ha per year in 2000–2010 to 1.96 million ha per year in 2010–2020. Losses in that subregion in 2010–2020 were led by Angola, at 548 000 ha per year.
The rate of loss of naturally regenerating forests declined by almost half (46 percent) in South America in the most recent decade, from 5.80 million ha in 2000–2010 to 3.14 million ha in 2010–2020. This was due mainly to a reduction in Brazil, where the average annual loss declined from 4.32 million ha in 2000–2010 to 1.89 million ha in 2010–2020.
North and Central America reported a net annual loss of naturally regenerating forest of 786 000 ha in 2010–2020, due mainly to North America, with the Caribbean showing a slight increase in area. The region’s average annual rate of loss was considerably lower than in 1990–2000, largely because of a decline in the annual loss in North America. This, in turn, was due mainly to the United States of America, where the average annual loss
declined from 354 000 ha in 1990–2000 to 88 200 ha in 2010–2020.
Asia had an overall loss of naturally regenerating forest of 386 000 ha per year in 2010–2020, due mainly to losses in South and Southeast Asia; there were gains in area over the period in East Asia and Western and Central Asia. The average annual rate of loss in Asia was higher in 2010–2020 than in 2000–2010; nevertheless, it was still much (80 percent) lower than in 1990–2000, when it was 1.79 million ha. The declining rate was due mainly to a reduction in losses in South and Southeast Asia, especially Indonesia, which lost naturally regenerating forest at a rate of 2.10 million ha per year in 1990–2000 and a much lower 787 000 ha per year in 2010–2020.
The area of naturally regenerating forests increased in both Europe and Oceania in the most recent decade. In Oceania, the gain of 391 000 ha per year represented a reversal compared with previous decades – when forest area was lost at the rate of 264 000 ha per year in 1990–2000 and 303 000 ha in 2000–2010. This mainly reflects changes in Australia, which reported losses of
TABLE 17. Annual change in the area of naturally regenerating forest, by region and subregion, 1990–2020
Region/subregion Average annual change
1990–2000 2000–2010 2010–2020
Area (1 000 ha/yr)
Rate (%)
Area (1 000 ha/yr)
Rate (%)
Area (1 000 ha/yr)
Rate (%)
Eastern and Southern Africa -1 351 -0.40 -1 828 -0.57 -1 945 -0.65
Northern Africa -192 -0.51 -164 -0.46 -182 -0.53
Western and Central Africa -1 775 -0.51 -1 582 -0.48 -1 887 -0.60
Total Africa -3 317 -0.46 -3 574 -0.52 -4 014 -0.62
East Asia 835 0.53 473 0.29 776 0.46
South and Southeast Asia -2 699 -0.90 -889 -0.31 -1 310 -0.48
Western and Central Asia 77 0.17 207 0.44 148 0.31
Total Asia -1 787 -0.36 -209 -0.04 -386 -0.08
Russian Federation -239 -0.03 161 0.02 91 0.01
Europe excl. Russian Federation 257 0.22 -7 -0.01 -3 0.00
Total Europe 18 0.00 155 0.02 87 0.01
Caribbean 83 1.42 46 0.71 27 0.40
Central America -224 -0.83 -225 -0.91 -142 -0.62
North America -1 099 -0.16 -439 -0.06 -671 -0.10
Total North and Central America -1 240 -0.17 -618 -0.09 -786 -0.11
Total Oceania -264 -0.15 -303 -0.17 391 0.22
Total South America -5 338 -0.57 -5 795 -0.65 -3 135 -0.37
WORLD -11 928 -0.30 -10 345 -0.27 -7 843 -0.21
Note: The rate of change (%) is calculated as the compound annual change rate.

30 Global Forest Resources Assessment 2020
253 000 ha per year in the 1990s and gains of 424 000 ha per year in 2010–2020.12
In Europe, the area of naturally regenerating forest has increased in each of the last three decades, although the rate of gain slowed by almost half in 2010–2020 compared with 2000–2010, from 155 000 ha per year to 87 400 ha per year. This was due mainly to the Russian Federation, where the average annual increase in area declined from 161 000 ha in 2000–2010 to 90 900 ha in 2010–2020. If the Russian Federation is excluded, Europe experienced small decreases in the area of naturally regenerated forest in 2000–2010 (6 690 ha per year) and 2010–2020 (3 490 ha per year).
12 Time-series data in Australia’s country report to FRA 2020 show a decrease in forest area between 1990 and 2008, followed by a progressive increase to 2016, with a net increase of 3.9 million ha between 2011 and 2016. This reflects real on-the-ground changes in forest area derived from a consistent time series of Landsat satellite data and the uniform application across the time series of a current-area algorithm, as interpreted for Australia’s National Greenhouse Gas Inventory. The change in forest area is due to the net effect of forest clearing or re-clearing for agricultural use; the regrowth of forest on areas previously cleared for agricultural use; the expansion of forest into areas not recently containing forest; the establishment of environmental plantings; and changes in the commercial plantation estate.
Planted forest
STATUSFRA 2020 received information on the area of planted forests (including in the subcategories “plantation forest” and “other planted forest”) in 2020 from 219 countries and territories. The total area of planted forests globally is estimated at 294 million ha, which is 7 percent of the world forest area.
Among the regions, Asia has the largest area of planted forest, at 135 million ha (Table 18). The largest share of total forest area held by planted forests is also in Asia (22 percent); the proportion is 7 percent in Europe (the second-highest after Asia), although this increases to 30 percent if the Russian Federation is excluded. The lowest share of planted forest is in Africa and South America (each with 2 percent).
Six countries and territories – Bahrain, Egypt, the Faroe Islands, Greenland, Kuwait and Libya – reported that 100 percent of their forest area is composed of planted forests (Table 19). Forty-two countries and territories, of which eight have no forest, reported no areas of planted forest.
TRENDSFRA 2020 received information on trends in planted forests from 216 countries and territories representing 99 percent of the world’s forest area. Globally, the area of planted forests increased by 123 million ha between 1990 and 2020 (Table 20). The average annual rate of increase was higher in 2000–2010, at 5.13 million ha, than in 1990–2000, at 4.06 million ha, but it dropped to 3.06 million ha in 2010–2020 (Table 21).
TABLE 18. Area of planted forest, and planted forest as a proportion of total forest area, by region and subregion, 2020
Region/subregion Planted forest (1 000 ha)
Planted forest as a proportion of total forest
area (%)
Eastern and Southern Africa 7 139 2
Northern Africa 1 983 6
Western and Central Africa 2 269 1
Total Africa 11 390 2
East Asia 98 139 36
South and Southeast Asia 31 469 11
Western and Central Asia 5 621 10
Total Asia 135 230 22
Europe excl. Russian Federation 56 312 30
Total Europe 75 193 7
Caribbean 851 11
Central America 391 2
North America 45 785 6
Total North and Central America 47 027 6
Total Oceania 4 812 3
Total South America 20 245 2
WORLD 293 895 7
TABLE 19. Top ten countries and territories for planted forest as a proportion of total forest area, 2020
Ranking Country Planted forest as a proportion of total
forest area (%)
1 Bahrain 100
2 Egypt 100
3 Faroe Islands 100
4 Greenland 100
5 Kuwait 100
6 Libya 100
7 Czechia 95
8 Netherlands 90
9 United Kingdom of Great Britain and Northern Ireland
89
10 Ireland 86
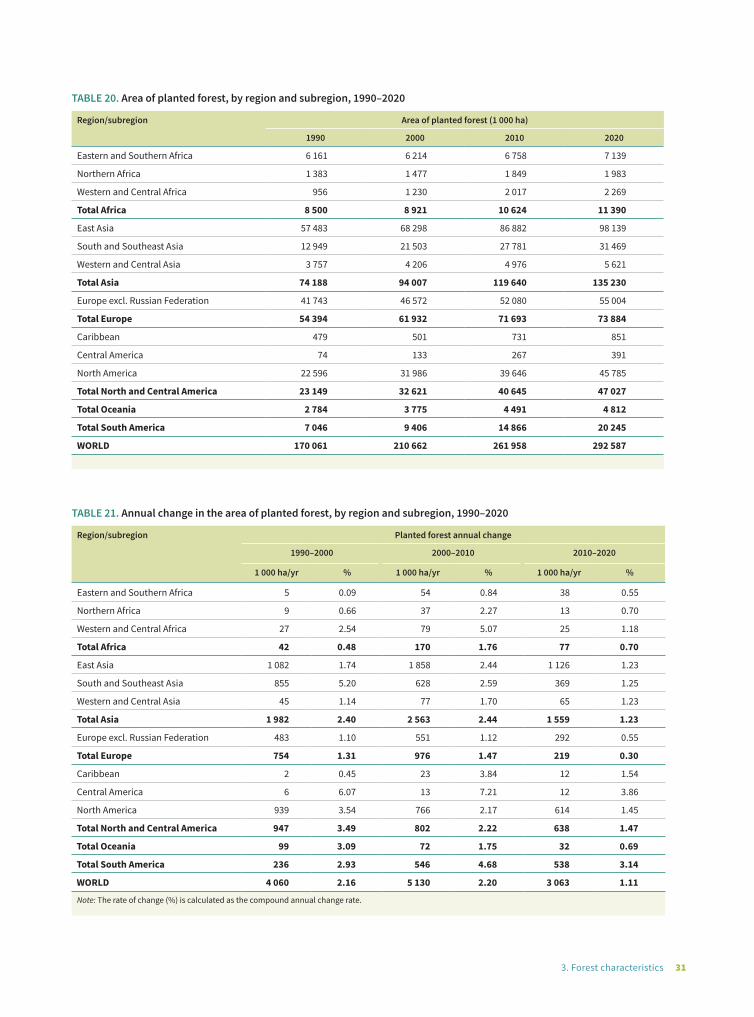
313. Forest characteristics
TABLE 20. Area of planted forest, by region and subregion, 1990–2020
Region/subregion Area of planted forest (1 000 ha)
1990 2000 2010 2020
Eastern and Southern Africa 6 161 6 214 6 758 7 139
Northern Africa 1 383 1 477 1 849 1 983
Western and Central Africa 956 1 230 2 017 2 269
Total Africa 8 500 8 921 10 624 11 390
East Asia 57 483 68 298 86 882 98 139
South and Southeast Asia 12 949 21 503 27 781 31 469
Western and Central Asia 3 757 4 206 4 976 5 621
Total Asia 74 188 94 007 119 640 135 230
Europe excl. Russian Federation 41 743 46 572 52 080 55 004
Total Europe 54 394 61 932 71 693 73 884
Caribbean 479 501 731 851
Central America 74 133 267 391
North America 22 596 31 986 39 646 45 785
Total North and Central America 23 149 32 621 40 645 47 027
Total Oceania 2 784 3 775 4 491 4 812
Total South America 7 046 9 406 14 866 20 245
WORLD 170 061 210 662 261 958 292 587
TABLE 21. Annual change in the area of planted forest, by region and subregion, 1990–2020
Region/subregion Planted forest annual change
1990–2000 2000–2010 2010–2020
1 000 ha/yr % 1 000 ha/yr % 1 000 ha/yr %
Eastern and Southern Africa 5 0.09 54 0.84 38 0.55
Northern Africa 9 0.66 37 2.27 13 0.70
Western and Central Africa 27 2.54 79 5.07 25 1.18
Total Africa 42 0.48 170 1.76 77 0.70
East Asia 1 082 1.74 1 858 2.44 1 126 1.23
South and Southeast Asia 855 5.20 628 2.59 369 1.25
Western and Central Asia 45 1.14 77 1.70 65 1.23
Total Asia 1 982 2.40 2 563 2.44 1 559 1.23
Europe excl. Russian Federation 483 1.10 551 1.12 292 0.55
Total Europe 754 1.31 976 1.47 219 0.30
Caribbean 2 0.45 23 3.84 12 1.54
Central America 6 6.07 13 7.21 12 3.86
North America 939 3.54 766 2.17 614 1.45
Total North and Central America 947 3.49 802 2.22 638 1.47
Total Oceania 99 3.09 72 1.75 32 0.69
Total South America 236 2.93 546 4.68 538 3.14
WORLD 4 060 2.16 5 130 2.20 3 063 1.11
Note: The rate of change (%) is calculated as the compound annual change rate.

32 Global Forest Resources Assessment 2020
The area of planted forest increased in all regions between 1990 and 2020, including in the most recent decade, at varying rates of annual gain. Most of the increases in 2010–2020 were in Asia, even though the average annual rate of gain was substantially less in that region than in previous decades. This trend mainly reflected a decrease in the rate of gain in East Asia, especially China, which reported an annual increase in planted forest of 1.07 million ha in 1990–2000, 1.85 million ha in 2000–2010 and 1.14 million ha in 2010–2020. There was also a reduction in the rate of gain in South and Southeast Asia; the average annual increase in planted forest area in India, for example, was 365 000 ha in 1990–2000, 341 000 ha in 2000–2010, and only 49 100 ha 2010–2020.
North and Central America had the second-largest increase in planted forest area in 2010–2020, but the average annual rate of gain has been slowing – from 947 000 ha in 1990–2000, to 802 000 ha in 2000–2010, to 638 000 ha in the most recent decade. This reduction in the rate of gain mainly reflects the situation in the United States of America, where the average annual increase in planted forest area more than halved from 462 000 ha in 1990–2000 to 196 000 ha in 2010–2020.
The average annual rate of increase in planted forest area slowed slightly in South America, from 546 000 ha in 2000–2010 to 538 000 ha in 2010–2020. The biggest influence on the growth of planted forest area in the region in the last two decades has been Brazil, where the average annual increase was 9 410 ha in 1990–2000, 368 000 ha in 2000–2010 and 390 000 ha in 2010–2020. On the other hand, the rate of increase slowed in the most recent decade in Chile, Colombia, Peru and Uruguay.
The average annual rate of gain in planted forest area was substantially lower in Europe in 2010–2020 than in the previous two decades. This was due mainly to the Russian Federation, which had an average annual gain of 271 000 ha in 1990–2000 and 425 000 ha in 2000–2010 but an average annual loss of 73 300 ha in 2010–2020.
The area of planted forests in Africa increased by an annual average of 76 600 ha in 2010–2020, down from 170 000 ha in 2000–2010. The rate was 42 100 ha in 1990–2000.
The average annual rate of increase in the area of planted forests has trended downward in Oceania in the last three decades, from 99 100 ha in 1990–2000, to 71 600 ha in 2000–2010, to 32 100 ha in 2010–2020. This mainly reflects the situation in New Zealand, where the average annual increase in planted forest area declined from 49 400 ha in 1990–2000 to 6 020 ha in 2010–2020. The average annual increase in planted forest area grew in Australia, from 46 200 ha in 1990–2000 to 68 300 ha in 2000–2010, before dropping to 22 200 ha in 2010–2020.
Plantation forest and other planted forest
STATUSThis analysis of the status of plantation forests and other planted forests in 2020 is based on data reported by 219 countries and territories representing nearly 100 percent of the global forest area.
Worldwide, there are 131 million ha of plantation forests, which is 45 percent of the total planted forest area. The remainder (55 percent) is categorized as other planted forest, covering 163 million ha. The highest share of plantation forests is in South America, where this subcategory constitutes about 99 percent of the total area of planted forests. Plantation forests also account for most (91 percent) of the total planted forest area in Oceania, about two-thirds (67 percent) in Africa, and more than half (59 percent) in Asia (Table 22; Figure 11). Plantation forests comprise 100 percent of the planted forest area in six countries and territories (Table 23).
Other planted forests predominate in Europe, accounting for 94 percent of the total planted forest area,
TABLE 22. Area of plantation forest and other planted forest, by region and subregion, 2020
Region/subregion Area (1 000 ha)
Plantation forest
Other planted
forest
Total planted
forest
Eastern and Southern Africa 4 968 2 171 7 139
Northern Africa 1 241 741 1 983
Western and Central Africa 1 469 800 2 269
Total Africa 7 678 3 712 11 390
East Asia 48 994 49 144 98 139
South and Southeast Asia 26 631 4 839 31 469
Western and Central Asia 3 707 1 914 5 621
Total Asia 79 332 55 897 135 230
Europe excl. Russian Federation
4 495 51 817 56 312
Total Europe 4 495 70 697 75 193
Caribbean 716 135 851
Central America 356 35 391
North America 14 105 31 680 45 785
Total North and Central America
15 177 31 850 47 027
Total Oceania 4 356 456 4 812
Total South America 20 099 145 20 245
WORLD 131 137 162 758 293 895

333. Forest characteristics
and in North and Central America, at 68 percent of the total.
TRENDSThe area of plantation forests worldwide increased by 55.8 million ha between 1990 and 2020, with the biggest jump (21.2 million ha) occurring between 2000 and 2010. The average annual rate of gain increased from 1.98 million ha in 1990–2000 to 2.12 million ha in 2000–2010 before falling back to 1.48 million ha per year in the most recent decade.
The area of other planted forest increased by 66.8 million ha between 1990 and 2020. The average annual rate of gain increased from 2.08 million ha in 1990–2000 to 3.01 million ha in 2000–2010 before dropping to 1.59 million ha in 2010–2020.
The area of plantation forest has increased substantially in Asia in the last three decades, albeit with a declining average annual rate of increase, from 1.26 million ha in 1990–2000, to 975 000 ha in 2000–2010, to 735 000 ha in 2010–2020. The average annual rate of gain in other planted forest in the region more than doubled from 717 000 ha in 1990–2000 to 1.59 million ha in 2000–2010, before falling back to 824 000 ha in 2010–2020. The big increase in 2000–2010 was due largely to the implementation of large-scale afforestation programmes in China. The proportion of the planted forest area held by plantation forests declined in Asia between 1990 and 2020 (Figure 12).
The area of plantation forest in North and Central America increased at an average annual rate of 164 000 ha in the most recent decade, down from 270 000 ha in 1990–2000 and 420 000 ha in 2000–2010. The area of plantation forest in Europe decreased by an average annual rate of
FIGURE 11. Proportion of plantation forest and other planted forest, by region, 2020
Plantation forest Other planted forest
0 10 20 30 40 50%
60 70 80 90 100
Africa
Asia
Europe
North and Central America
Oceania
South America
World
TABLE 23. Top ten countries and territories for plantation forest as a proportion of total forest area, 2020
Ranking Country Proportion of plantation forest (%)
1 Bahrain 100
2 Faroe Islands 100
3 Greenland 100
4 Kuwait 100
5 Libya 100
6 Ireland 86
7 Cabo Verde 70
8 Belgium 64
9 Uruguay 58
10 Rwanda 54
17 700 ha in 2010–2020, reversing the previous increasing trend of 94 200 ha in 1990–2000 and 38 200 ha in 2000–2010. The shift from gain to loss was due mainly to Sweden, which experienced an average annual loss of 30 100 ha in 2010–2020.
The average annual rate of increase in the area of plantation forest was lower in Africa in 2010–2020, at 55 300 ha, than in 2000–2010, at 89 800 ha (the rate of increase in 1990–2000 was 25 300 ha). The proportion of the planted forest area held by plantation forest in Africa was 70 percent in 1990, declining slightly to 67 percent in 2020.
Plantation forests accounted for 99.9 percent of the planted forest area in South America in 1990 and for about 99 percent in 2020; in Oceania, they comprised 99.7 percent in 1990 and 90.5 percent in 2020.

34 Global Forest Resources Assessment 2020
Plantations of introduced species
STATUS Of the 219 countries and territories that reported on the area of planted forests in 2020, 173 – representing 85 percent of the world’s forest area – reported on the area of plantation forest composed of introduced species. Of those, almost half (86) reported that they have no introduced species and that all their plantation forests are composed of native species.
Globally, the area of plantation forest composed of introduced species is 49.7 million ha, which is 1.4 percent of the total forest area of the reporting countries. Introduced species account for 44 percent of the total area of plantation forest in the reporting countries (Table 24).
The largest area of plantation forest composed of introduced species is in Asia, at 20.9 million ha (32 percent of the total area of plantation forest in that region), followed by South America, at 17.8 million ha. The region with the highest proportion of plantation forest composed of introduced species is South America, at 97 percent, followed by Europe and Oceania (both 78 percent), Africa (70 percent) and North and Central America (4 percent). Thirty-nine countries reported that 100 percent of their plantation forest area is composed of introduced species.
TRENDSInformation on trends in the area of plantation forest composed of introduced species was available for 170 countries representing 85 percent of the world’s forest area.
The area of plantation forest worldwide composed of introduced species increased by 26.7 million ha between
1990 and 2020, and the proportion of the total plantation forest area comprising introduced species increased from 34 percent in 1990 to 44 percent in 2020 (Table 25). This proportion almost doubled over the period in Asia, from 17 percent to 32 percent; it declined, however, in all other regions. Most of the increase in Asia was in East Asia; in China, for example, the area of plantation forest consisting of introduced species grew from 4.39 million ha in 1990 to 14.2 million ha in 2020.
Primary forest
Primary forests are naturally regenerated forests of native tree species, where there are no clearly visible indications of human activities and ecological processes are not significantly disturbed. Primary forests – especially primary tropical moist forests – are highly species-rich, diverse ecosystems, and their extent is an important environmental indicator.
STATUSFRA 2020 received information on the area of primary forest in 2020 from 146 countries and territories representing 81 percent of the world’s forest area. Despite the relatively high percentage of reporting on this variable, the reliability of the data is a cause for concern, with many countries and territories relying for their estimates on proxies such as the area of forest in national parks and other conservation areas.
Based on the provided data, the area of primary forests worldwide is estimated at 1.11 billion ha, or about one-third (34 percent) of the forest area of reporting
FIGURE 12. Plantation forest and other planted forest as a proportion of total planted forest area, by region, 1990–2020FIGURE xx. rest area as a proportion (%) of total land area, Development Goal regional grouping
%
100
90
80
70
60
50
40
30
20
10
0
Plantation forest Other planted forest
Africa
1990
2000
2010
2020
1990
2000
2010
2020
1990
2000
2010
2020
1990
2000
2010
2020
1990
2000
2010
2020
1990
2000
2010
2020
1990
2000
2010
2020
Asia Europe North andCentral America
Oceania South America World

353. Forest characteristics
TABLE 24. Plantation forests composed of introduced species, by region and subregion, 2020
Region/subregion Data availability Plantation forest
No. of reporting countries
% of total forest area
Total area (1 000 ha)
… of which composed of
introduced species
% introduced
Eastern and Southern Africa 20 95 4 089 3 019 74
Northern Africa 7 47 894 444 50
Western and Central Africa 17 78 716 528 74
Total Africa 44 84 5 699 3 992 70
East Asia 4 98 48 007 14 779 31
South and Southeast Asia 9 45 15 107 6 043 40
Western and Central Asia 20 79 2 448 116 5
Total Asia 33 71 65 562 20 938 32
Total Europe 39 97 3 978 3 116 78
Caribbean 22 95 684 221 32
Central America 4 62 201 36 18
North America 4 91 14 029 268 2
Total North and Central America 30 90 14 915 525 4
Total Oceania 18 100 4 337 3 392 78
Total South America 9 75 18 278 17 767 97
WORLD 173 85 112 769 49 731 44
TABLE 25. Plantation forests composed of introduced species as a proportion of total plantation forest area, by region and subregion, 1990–2020
Region/subregion Data availability Proportion of plantation forests composed of species (%)
No. of reporting countries
% of total forest area
1990 2000 2010 2020
Eastern and Southern Africa 20 95 72 72 73 74
Northern Africa 7 47 79 73 57 50
Western and Central Africa 17 78 91 89 77 74
Total Africa 44 84 74 73 71 70
East Asia 4 98 13 19 24 31
South and Southeast Asia 9 45 45 35 37 40
Western and Central Asia 20 79 4 4 4 5
Total Asia 33 71 17 21 27 32
Total Europe 36 96 84 71 72 77
Caribbean 22 95 33 39 33 32
Central America 4 62 52 40 25 18
North America 4 91 5 4 3 2
Total North and Central America 30 90 7 6 5 4
Total Oceania 18 100 95 85 76 78
Total South America 9 75 98 98 98 97
WORLD 170 85 34 35 39 44

36 Global Forest Resources Assessment 2020
countries (Table 26). Among the regions, North and Central America has the largest area of primary forest, at 313 million ha, followed by South America (299 million ha) and Europe (259 million ha) (although, if the Russian Federation is excluded, Europe would have only 4.18 million ha). Africa has an estimated 150 million ha of primary forest, Asia 86.4 million ha and Oceania 2.62 million ha.
Primary forest accounts for 49 percent of the total forest area in South America, 43 percent in North and Central America, 38 percent in Africa, 27 percent in Europe (or 3 percent if the Russian Federation is excluded) and 21 percent in Oceania. Asia has the lowest area of primary forest as a proportion of its total forest area, at 15 percent. Table 27 shows the top five countries for primary forest area in 2020.
Primary forests account for 95 percent or more of the total forest area in three countries and territories: Suriname, Venezuela (Bolivarian Republic of) and French Guyana (Table 28).
TRENDSFRA 2020 received information on trends in the area of primary forest from 137 countries and territories, representing 57 percent of the world’s forest area. The low number of countries and territories reporting on this parameter, and the use of proxies such as the area of forest in protected areas and other types of forest reserve, reduces the reliability of the trend analysis, and the findings here should be treated with caution. Moreover, the data do not
TABLE 26. Area of primary forest, by region and subregion, 2020
Region/subregion Data availability Primary forest (1 000 ha)
% of total forest area of reporting
countries
Share of global area of primary
forest (%)No. of reporting countries
% of total forest area
Eastern and Southern Africa 10 49 59 412 41 5.4
Northern Africa 5 77 1 284 5 0.1
Western and Central Africa 16 72 88 891 40 8.0
Total Africa 31 62 149 586 38 13.5
East Asia 3 95 16 799 6 1.5
South and Southeast Asia 12 87 67 351 26 6.1
Western and Central Asia 18 95 2 241 4 0.2
Total Asia 33 91 86 392 15 7.8
Europe excl. Russian Federation 41 77 4 180 3 0.4
Total Europe 42 95 259 392 27 23.4
Caribbean 13 67 184 3 0.0
Central America 1 16 658 19 0.1
North America 4 100 312 471 43 28.2
Total North and Central America 18 97 313 313 43 28.2
Total Oceania 14 7 2 617 21 0.2
Total South America 8 72 298 698 49 26.9
WORLD 146 81 1 109 997 34 100.0
TABLE 27. Top five countries for primary forest area, 2020
Ranking Country Area of primary forest (1 000 ha)
Share of global primary forest area of reporting
countries (%)
Cumulative %
1 Russian Federation 255 212 23 23
2 Brazil 216 187 19 42
3 Canada 205 131 18 61
4 Democratic Republic of the Congo 82 752 7 68
5 United States of America 75 300 7 75
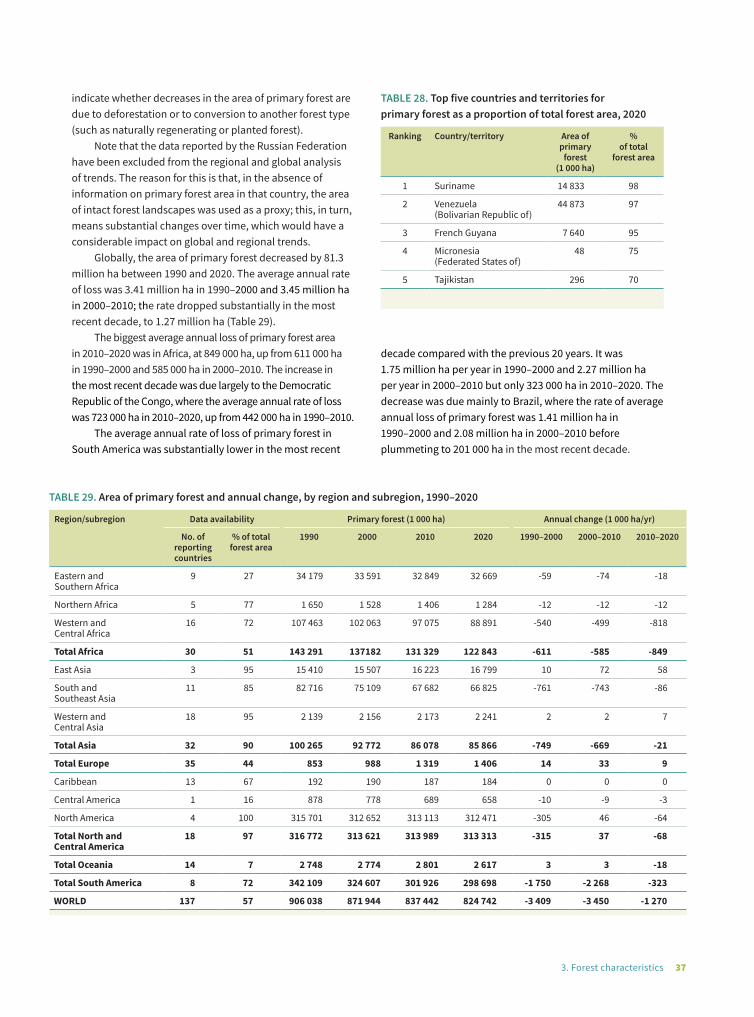
373. Forest characteristics
indicate whether decreases in the area of primary forest are due to deforestation or to conversion to another forest type (such as naturally regenerating or planted forest).
Note that the data reported by the Russian Federation have been excluded from the regional and global analysis of trends. The reason for this is that, in the absence of information on primary forest area in that country, the area of intact forest landscapes was used as a proxy; this, in turn, means substantial changes over time, which would have a considerable impact on global and regional trends.
Globally, the area of primary forest decreased by 81.3 million ha between 1990 and 2020. The average annual rate of loss was 3.41 million ha in 1990–2000 and 3.45 million ha in 2000–2010; the rate dropped substantially in the most recent decade, to 1.27 million ha (Table 29).
The biggest average annual loss of primary forest area in 2010–2020 was in Africa, at 849 000 ha, up from 611 000 ha in 1990–2000 and 585 000 ha in 2000–2010. The increase in the most recent decade was due largely to the Democratic Republic of the Congo, where the average annual rate of loss was 723 000 ha in 2010–2020, up from 442 000 ha in 1990–2010.
The average annual rate of loss of primary forest in South America was substantially lower in the most recent
TABLE 28. Top five countries and territories for primary forest as a proportion of total forest area, 2020
Ranking Country/territory Area of primary
forest (1 000 ha)
% of total
forest area
1 Suriname 14 833 98
2 Venezuela (Bolivarian Republic of)
44 873 97
3 French Guyana 7 640 95
4 Micronesia (Federated States of)
48 75
5 Tajikistan 296 70
decade compared with the previous 20 years. It was 1.75 million ha per year in 1990–2000 and 2.27 million ha per year in 2000–2010 but only 323 000 ha in 2010–2020. The decrease was due mainly to Brazil, where the rate of average annual loss of primary forest was 1.41 million ha in 1990–2000 and 2.08 million ha in 2000–2010 before plummeting to 201 000 ha in the most recent decade.
TABLE 29. Area of primary forest and annual change, by region and subregion, 1990–2020
Region/subregion Data availability Primary forest (1 000 ha) Annual change (1 000 ha/yr)
No. of reporting countries
% of total forest area
1990 2000 2010 2020 1990–2000 2000–2010 2010–2020
Eastern and Southern Africa
9 27 34 179 33 591 32 849 32 669 -59 -74 -18
Northern Africa 5 77 1 650 1 528 1 406 1 284 -12 -12 -12
Western and Central Africa
16 72 107 463 102 063 97 075 88 891 -540 -499 -818
Total Africa 30 51 143 291 137182 131 329 122 843 -611 -585 -849
East Asia 3 95 15 410 15 507 16 223 16 799 10 72 58
South and Southeast Asia
11 85 82 716 75 109 67 682 66 825 -761 -743 -86
Western and Central Asia
18 95 2 139 2 156 2 173 2 241 2 2 7
Total Asia 32 90 100 265 92 772 86 078 85 866 -749 -669 -21
Total Europe 35 44 853 988 1 319 1 406 14 33 9
Caribbean 13 67 192 190 187 184 0 0 0
Central America 1 16 878 778 689 658 -10 -9 -3
North America 4 100 315 701 312 652 313 113 312 471 -305 46 -64
Total North and Central America
18 97 316 772 313 621 313 989 313 313 -315 37 -68
Total Oceania 14 7 2 748 2 774 2 801 2 617 3 3 -18
Total South America 8 72 342 109 324 607 301 926 298 698 -1 750 -2 268 -323
WORLD 137 57 906 038 871 944 837 442 824 742 -3 409 -3 450 -1 270
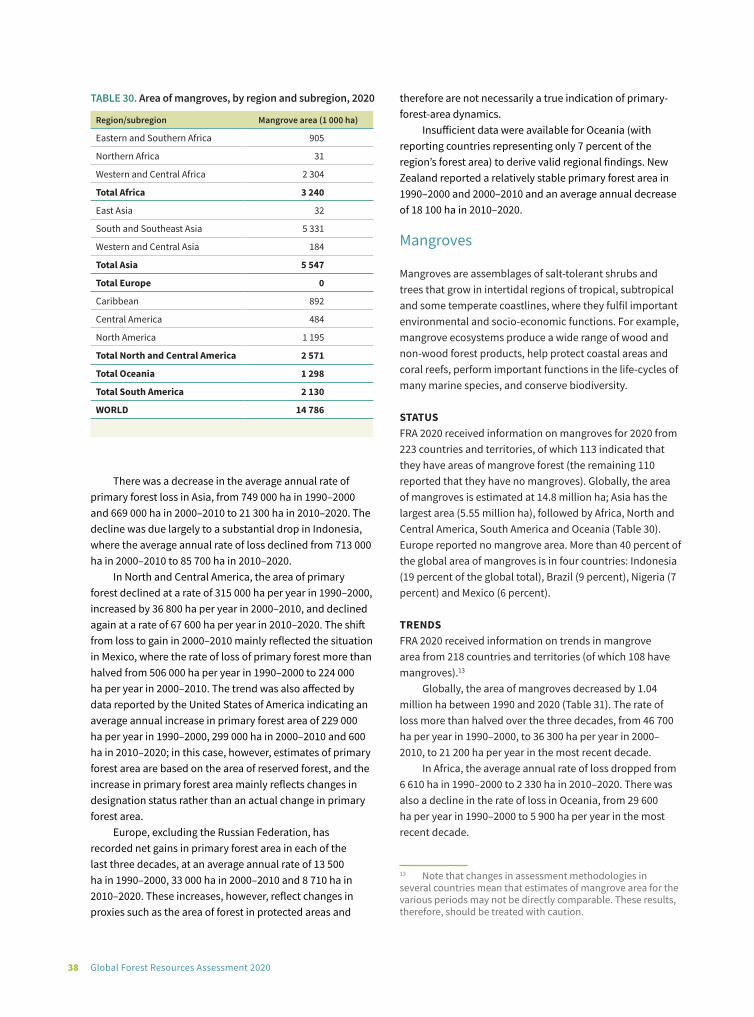
38 Global Forest Resources Assessment 2020
There was a decrease in the average annual rate of primary forest loss in Asia, from 749 000 ha in 1990–2000 and 669 000 ha in 2000–2010 to 21 300 ha in 2010–2020. The decline was due largely to a substantial drop in Indonesia, where the average annual rate of loss declined from 713 000 ha in 2000–2010 to 85 700 ha in 2010–2020.
In North and Central America, the area of primary forest declined at a rate of 315 000 ha per year in 1990–2000, increased by 36 800 ha per year in 2000–2010, and declined again at a rate of 67 600 ha per year in 2010–2020. The shift from loss to gain in 2000–2010 mainly reflected the situation in Mexico, where the rate of loss of primary forest more than halved from 506 000 ha per year in 1990–2000 to 224 000 ha per year in 2000–2010. The trend was also affected by data reported by the United States of America indicating an average annual increase in primary forest area of 229 000 ha per year in 1990–2000, 299 000 ha in 2000–2010 and 600 ha in 2010–2020; in this case, however, estimates of primary forest area are based on the area of reserved forest, and the increase in primary forest area mainly reflects changes in designation status rather than an actual change in primary forest area.
Europe, excluding the Russian Federation, has recorded net gains in primary forest area in each of the last three decades, at an average annual rate of 13 500 ha in 1990–2000, 33 000 ha in 2000–2010 and 8 710 ha in 2010–2020. These increases, however, reflect changes in proxies such as the area of forest in protected areas and
therefore are not necessarily a true indication of primary-forest-area dynamics.
Insufficient data were available for Oceania (with reporting countries representing only 7 percent of the region’s forest area) to derive valid regional findings. New Zealand reported a relatively stable primary forest area in 1990–2000 and 2000–2010 and an average annual decrease of 18 100 ha in 2010–2020.
Mangroves
Mangroves are assemblages of salt-tolerant shrubs and trees that grow in intertidal regions of tropical, subtropical and some temperate coastlines, where they fulfil important environmental and socio-economic functions. For example, mangrove ecosystems produce a wide range of wood and non-wood forest products, help protect coastal areas and coral reefs, perform important functions in the life-cycles of many marine species, and conserve biodiversity.
STATUSFRA 2020 received information on mangroves for 2020 from 223 countries and territories, of which 113 indicated that they have areas of mangrove forest (the remaining 110 reported that they have no mangroves). Globally, the area of mangroves is estimated at 14.8 million ha; Asia has the largest area (5.55 million ha), followed by Africa, North and Central America, South America and Oceania (Table 30). Europe reported no mangrove area. More than 40 percent of the global area of mangroves is in four countries: Indonesia (19 percent of the global total), Brazil (9 percent), Nigeria (7 percent) and Mexico (6 percent).
TRENDSFRA 2020 received information on trends in mangrove area from 218 countries and territories (of which 108 have mangroves).13
Globally, the area of mangroves decreased by 1.04 million ha between 1990 and 2020 (Table 31). The rate of loss more than halved over the three decades, from 46 700 ha per year in 1990–2000, to 36 300 ha per year in 2000–2010, to 21 200 ha per year in the most recent decade.
In Africa, the average annual rate of loss dropped from 6 610 ha in 1990–2000 to 2 330 ha in 2010–2020. There was also a decline in the rate of loss in Oceania, from 29 600 ha per year in 1990–2000 to 5 900 ha per year in the most recent decade.
13 Note that changes in assessment methodologies in several countries mean that estimates of mangrove area for the various periods may not be directly comparable. These results, therefore, should be treated with caution.
TABLE 30. Area of mangroves, by region and subregion, 2020
Region/subregion Mangrove area (1 000 ha)
Eastern and Southern Africa 905
Northern Africa 31
Western and Central Africa 2 304
Total Africa 3 240
East Asia 32
South and Southeast Asia 5 331
Western and Central Asia 184
Total Asia 5 547
Total Europe 0
Caribbean 892
Central America 484
North America 1 195
Total North and Central America 2 571
Total Oceania 1 298
Total South America 2 130
WORLD 14 786

393. Forest characteristics
There was an increase in the area of mangroves in South America in 2010–2020 at an average annual rate of 14 800 ha, reversing the declining trend in 1990–2000, when the region lost mangroves at a rate of 10 200 ha per year. This reversal was due mainly to Guyana, which reported an average annual increase in mangrove area of 19 500 ha in 2010–2020, due partly to a mangrove restoration project and partly to improvements in mapping (and therefore the increase does not necessarily reflect actual changes in mangrove area).
There was also an increase in mangrove area in North and Central America in 2010–2020, at an average annual rate of 10 500 ha (there was minimal change between 1990 and 2010). The increase in the region in 2010–2020 was attributable mainly to Cuba, which reported a gain of 12 000 ha per year in that period. As in the case of Guyana, this increase was due partly to improved data collection and partly to restoration programmes and does not necessarily reflect actual changes in mangrove area.
There was a substantial increase in the average annual rate of mangrove loss in Asia, from 1 030 ha in 1990–2000 to 38 200 ha in 2010–2020. The increased rate of loss was due mainly to Indonesia, which reported an average annual loss of 6 800 ha in 1990–2000 and 21 100 ha in the most recent decade.
TABLE 31. Area of mangroves and annual change, by region and subregion, 1990–2020
Region/subregion Mangrove area (1 000 ha) Annual change (1 000 ha/yr)
1990 2000 2010 2020 1990–2000 2000–2010 2010–2020
Eastern and Southern Africa 929 902 883 905 -2.7 -1.9 2.2
Northern Africa 34 31 32 31 -0.3 0.1 -0.1
Western and Central Africa 2 436 2 400 2 349 2 304 -3.6 -5.1 -4.5
Total Africa 3 398 3 332 3 264 3 240 -6.6 -6.9 -2.3
East Asia 24 22 25 32 -0.2 0.3 0.7
South and Southeast Asia 6 117 6 108 5 713 5 330 -0.8 -39.6 -38.3
Western and Central Asia 190 190 190 184 0.0 0.0 -0.7
Total Asia 6 331 6 320 5 928 5 545 -1.0 -39.3 -38.2
Total Europe 0 0 0 0 0 0 0
Caribbean 787 789 774 891 0.2 -1.6 11.7
Central America 492 482 483 466 -1.0 0.1 -1.8
North America 1 152 1 167 1 190 1 195 1.5 2.3 0.5
Total North and Central America 2 431 2 439 2 447 2 552 0.8 0.8 10.5
Total Oceania 1 447 1 150 1 314 1 255 -29.6 16.4 -5.9
Total South America 2 152 2 050 1 976 2 124 -10.2 -7.4 14.8
WORLD 15 759 15 292 14 928 14 717 -46.7 -36.3 -21.2
Bamboo
Bamboo is a widely distributed grass in the tropical, subtropical and temperate climatic domains. It is an
TABLE 32. Area of bamboo, by region and subregion, 2020
Region/subregion Bamboo area (1 000 ha)
Eastern and Southern Africa 3 984
Northern Africa 30
Western and Central Africa 634
Total Africa 4 648
East Asia 7 005
South and Southeast Asia 17 872
Western and Central Asia 0
Total Asia 24 877
Total Europe 0
Caribbean 125
Central America 0
North America 0
Total North and Central America 125
Total Oceania 0
Total South America 5 389
WORLD 35 040

@ F
AO /
NCo
gnom
e
40 Global Forest Resources Assessment 2020
important non-wood forest product with many traditional uses and also an important industrial material for construction and furniture, either in its natural form or as a reconstituted material (e.g. laminated boards and panels). Bamboo shoots are an increasingly mainstream food.
FIGURE 13. Total area of bamboo, 1990–2020 FIGURE 14. Total area of rubber plantations, 1990–2020FIGURE xx. rest area as a proportion (%) of total land area, Development Goal regional grouping
40
35
30
25
20
15
10
5
0
Mill
ion
ha
1990 2000Year
2010 2020
FIGURE xx. rest area as a proportion (%) of total land area, Development Goal regional grouping
8
7
6
5
4
3
2
1
0
Mill
ion
ha
1990 2000Year
2010 2020
STATUS AND TRENDSOf the 132 countries that reported on bamboo for FRA 2020, 23 indicated that they had bamboo resources. The total estimated bamboo resource in these countries is 35.0 million ha, of which 24.9 million ha (71 percent of the total bamboo area) is in Asia (Table 32).
The total area of bamboo increased by almost 50 percent between 1990 and 2020 (Figure 13), largely because of increases in China and India.
Rubber plantations
Rubber plantations are important in some regions, especially Asia. Although their main purpose is latex production, they are included in FRA 2020 because rubberwood is an important timber product. Some countries categorize rubber plantations as agricultural tree crops, however, and do not include them in their forest statistics.
STATUS AND TRENDSSeventeen of the 167 countries and territories that reported on this parameter for FRA 2020 indicated that they had areas of rubber plantation. Several important rubber-producing countries did not report on their rubber plantation resources and are missing from the totals reported here, which therefore are likely to underestimate the global rubber plantation resource.
The total area of rubber plantations in the 17 reporting countries is estimated at 7.73 million ha, of which 87 percent is in South and Southeast Asia (Table 33). The total area of rubber plantations increased by an estimated 1.99 million ha between 1990 and 2020 (Figure 14).
TABLE 33. Area of rubber plantations, by reporting country, 2020
Ranking Country/territory Area of rubber plantations (1 000 ha)
1 Thailand 3 537
2 Malaysia 1 073
3 India 882
4 Cambodia 559
5 Côte d'Ivoire 542
6 Viet Nam 500
7 Guinea** 237
8 Sri Lanka 137
9 Guatemala* 82.4
10 Colombia* 58.3
11 Cameroon 54.0
12 Bangladesh* 23.7
13 Gabon 23.0
14 Papua New Guinea 11.7
15 Ecuador* 6.22
16 Zambia* 1.00
17 Nepal 1.00
TOTAL 7 728
Note: * Did not report for 2020; data for 2015 used for 2020. ** Did not report for 2020; data for 2010 used for 2020. E

@ F
AO /
NCo
gnom
e
4 Growing
stock,biomass
and carbon
©FA
O

434. Growing stock, biomass and carbon
rowing stock – the total volume of living trees in a forest – has been assessed in every previous FRA. This parameter provides information on existing wood resources; when expressed as
growing stock per unit area, it indicates how well or poorly stocked a forest is. In FRA 2020, information was collected from countries and territories on total growing stock and growing stock per hectare for both naturally regenerating and planted forests and for the total forest resource.
Many countries use growing stock as the basis for estimating biomass and carbon stocks. Forest biomass, expressed in terms of dry weight of living vegetation, is an important indicator of a forest’s productivity and its capacity to sequester and store carbon. Forest ecosystems are the largest terrestrial carbon sink, and knowledge on the status of, and trends in, the various forest carbon pools is important for understanding the role of forests in the global carbon cycle.
The United Nations Framework Convention on Climate Change (UNFCCC) requests all countries to periodically assess and report on national greenhouse-gas emissions, including emissions and removals of carbon on forest land. The Intergovernmental Panel on Climate Change (IPCC) has developed guidelines and methodologies for ensuring the consistent reporting of emissions over time.
FRA 2020 uses the same carbon pools and definitions as those in the IPCC guidelines, and it recommended that countries follow the IPCC guidelines for reporting on carbon stocks.14 Nevertheless, the data reported to FRA 2020 do not always correspond with the data reported to the UNFCCC. There are several possible reasons for this: for example, forest definitions may vary; the UNFCCC requests countries to report on “managed forests”, which may comprise all or only part of a country’s forest resource; and FRA-specific methods related to, for example, calibration,
14 The IPCC recently published an update of its guidelines on national greenhouse-gas inventories (IPCC, 2019), which contains improved conversion factors for carbon estimation; this will help improve estimates for countries lacking national data on biomass and carbon.
reclassification, estimation and forecasting are usually implemented differently in reporting to the UNFCCC.
Data on growing stock, biomass and carbon are improving as more countries conduct national forest inventories as part of their national forest monitoring systems. In many cases, however, historical data are weak, affecting the reliability of trend analyses. Most countries have only one estimate of growing stock per unit area; for those countries, estimates of changes in growing stock are mainly extrapolated from changes in forest area. The same issue also applies to biomass and carbon. Estimates of carbon in dead wood, litter and soil are especially weak, with many countries not reporting on these carbon pools.
FRA 2020 sought information on the composition of growing stock. Information on growing-stock composition and the diversity of tree species in general is crucial not only for managing forests sustainably and developing new tree-based products but also for optimizing the role of forests in mitigating and adapting to climate change. Many countries were unable to report their growing-stock composition, even by the most common native and introduced tree species, and relatively few countries reported full time series for growing-stock composition. Inconsistencies were also found in the taxonomic nomenclature used by countries, which were often not in accordance with globally agreed taxonomic checklists. Increasing the availability and quality of data on growing-stock composition is a formidable task for many countries, especially in the tropics, where the diversity of tree species is very high. Fortunately, tools such as national tree checklists and field identification guides are increasingly available for this purpose. Recently, too, a global checklist of tree species was made available in the GlobalTreeSearch database,15 which includes data on more than 60 000 tree species worldwide and is continuously updated.
15 https://tools.bgci.org/global_tree_search.php
G
44 Global Forest Resources Assessment 2020
Growing stock
STATUSFRA 2020 received information on growing stock in 2020 from 183 countries and territories, representing 95 percent of the world’s forests. For countries and territories that provided no information on this parameter, growing stock was estimated by multiplying subregional averages of growing stock per hectare by total forest area.
The world’s total forest growing stock is estimated at 557 billion m3. Growing stock per unit area is highest in the tropics, led by South America, Central America and Western and Central Africa (in descending order), but it is also high in some regions – such as Europe – with temperate and boreal forests (Table 34; Figure 15). Among countries, Brazil is estimated to have the largest forest growing stock, at 120 billion m3; this amounts to almost 22 per cent of the world’s total growing stock. The Russian Federation, Canada and the United States of America also have very large volumes of growing stock (Table 35).
FRA 2020 received information on the distribution of growing stock in 2020 from 157 countries and territories representing 92 per cent of the world’s total growing stock. Globally, 95 percent of the growing stock is held in naturally regenerating forest, with planted forests accounting for 5 percent. The average growing stock per unit area is higher in naturally regenerating forest (140 m3 per ha) than in planted forest (110 m3 per ha). One reason for this is that there has been a large increase in the area of
TABLE 34. Volume of forest growing stock, by region and subregion, 2020
Region/subregion Total growing
stock (million m3)
Growing stock per unit area (m3/ha)
Eastern and Southern Africa 19 146 64.7
Northern Africa 841 23.9
Western and Central Africa 56 419 184.6
Total Africa 76 406 120.0
East Asia 27 049 99.7
South and Southeast Asia 31 518 106.5
Western and Central Asia 3 935 71.2
Total Asia 62 502 100.4
Europe excl. Russian Federation 35 158 173.9
Total Europe 116 230 114.2
Caribbean 725 91.9
Central America 4 233 188.9
North America 90 108 124.7
Total North and Central America 95 067 126.3
Total Oceania 18 867 101.8
Total South America 187 455 222.1
WORLD 556 526 137.1
FIGURE 15. Forest growing stock per unit area, by country, 2020
Growing stock(m3/ha)
<5051–100101–150151–200201–250>250No data
Source: Adapted from United Nations World map, 2020

454. Growing stock, biomass and carbon
planted forests, and recent plantings are yet to achieve high volumes of growing stock. Among the regions, Asia has the highest proportion of growing stock in planted forests and Africa the lowest (Figure 16).
TRENDSFRA 2020 received complete time series on growing stock for 1990–2020 from 182 countries and territories representing 95 percent of the world’s forest area. For countries that did not provide such data, growing stock was estimated by taking subregional averages of growing stock per hectare and multiplying these by forest area (as estimated for each point in the time series). For countries that provided incomplete time series, the missing data were estimated by using the value for growing stock per hectare of the nearest
data point. A complete dataset with no gaps was obtained using this procedure.
Although total growing stock declined slightly between 1990 and 2020 (Table 36), it increased per unit area (Table 37). The latter is true for all regions and subregions and is particularly significant in East Asia and Europe (excluding the Russian Federation). The increase in East Asia is due to significant increases in growing stock in China, Japan and the Republic of Korea, all of which have undertaken major reforestation programmes in recent decades. The increase in Europe follows a long-term trend and is likely due to the widespread use of forest management practices that encourage forest growth.
There was a significant increase in the proportion of total forest growing stock in planted forests between 1990 and 2020 (Figure 17, p. 47) . This finding holds for all regions, with the most significant increases in East Asia, North and Central America, South America and Oceania.
Growing-stock composition
STATUSFRA 2020 received information on the composition of forest growing stock (i.e. whether comprising native or introduced tree species) in 2020 from 75 countries and territories representing 62 percent of the world’s forest area and almost half its growing stock.
It is estimated that, globally, 92 percent of the growing stock consists of native tree species and 8 percent comprises introduced tree species. Native tree species dominate the composition of growing stock in all regions, with the share highest in Asia (98 percent) and lowest in Africa (86 percent).
The most common native and introduced tree species in the growing stock reported for FRA 2020 belong to
TABLE 35. Top ten countries for volume of forest growing stock, 2020
Ranking Country Growing stock (million m3)
1 Brazil 120 358
2 Russian Federation 81 071
3 Canada 45 108
4 United States of America 41 269
5 Democratic Republic of the Congo 30 782
6 China 19 191
7 Colombia 14 830
8 Indonesia 12 727
9 Peru 11 525
10 Venezuela (Bolivarian Republic of) 10 254
FIGURE 16. Naturally regenerating and planted forest growing stock distribution, by region, 2020
Naturally regenerating forest Planted forest
0 10 20 30 40 50%
60 70 80 90 100
Africa
Asia
Europe
North and Central America
Oceania
South America
World

46 Global Forest Resources Assessment 2020
TABLE 36. Total volume of forest growing stock, by region and subregion, 1990–2020
Region/subregion Forest growing stock (million m3)
1990 2000 2010 2020
Eastern and Southern Africa 21 915 21 273 20 337 19 146
Northern Africa 891 876 872 841
Western and Central Africa 64 835 62 213 59 780 56 419
Total Africa 87 640 84 361 80 989 76 406
East Asia 15 657 18 390 22 226 27 049
South and Southeast Asia 33 288 32 815 32 506 31 518
Western and Central Asia 2 646 3 085 3 464 3 935
Total Asia 51 591 54 290 58 196 62 502
Europe excl. Russian Federation 24 245 27 817 31 539 35 158
Total Europe 104 285 108 087 113 062 116 230
Caribbean 544 617 683 725
Central America 5 118 4 762 4 429 4 233
North America 84 684 86 432 88 141 90 108
Total North and Central America 90 346 91 811 93 253 95 067
Total Oceania 18 713 18 706 18 798 18 867
Total South America 207 186 199 019 190 753 187 455
WORLD 559 761 556 276 555 050 556 526
TABLE 37. Volume of forest growing stock per hectare, by region and subregion, 1990–2020
Region/subregion Forest growing stock (m3/ha)
1990 2000 2010 2020
Eastern and Southern Africa 63.3 64.0 64.6 64.7
Northern Africa 22.3 23.0 23.7 23.9
Western and Central Africa 181.7 183.3 184.3 184.6
Total Africa 118.0 118.8 119.8 120.0
East Asia 74.6 80.3 88.1 99.7
South and Southeast Asia 102.0 106.5 106.4 106.5
Western and Central Asia 54.0 61.4 65.2 71.2
Total Asia 88.1 92.4 95.3 100.4
Europe excl. Russian Federation 130.8 144.1 158.6 173.9
Total Europe 104.9 107.8 111.5 114.2
Caribbean 91.3 90.7 91.1 91.9
Central America 182.8 184.4 186.8 188.9
North America 117.4 120.1 121.9 124.7
Total North and Central America 119.6 122.0 123.6 126.3
Total Oceania 101.2 102.0 103.8 101.8
Total South America 212.8 215.7 219.2 222.1
WORLD 132.1 133.8 135.2 137.1

474. Growing stock, biomass and carbon
202 genera. Many country reports were incomplete in the information provided on this attribute, however, and several countries that did report could only do so at the genus level. Figures 18 to 21 show the reported top five genera, by volume and region (or subregion in the case of North America), in the forest growing stock of reporting countries (note, however, that reporting was insufficient for some regions and subregions and therefore those are not represented below).
TRENDSTrends in the species composition of forest growing stock cannot be assessed reliably because of the incompleteness of data on this attribute. Nevertheless, the available data suggest that the share of introduced tree species increased between 1990 and 2020 in all regions except Asia and
FIGURE 17. Proportion of growing stock in planted forest, by region, 1990–2020
20001990 2010 2020
0 2 4 6 8 10%
12 14
Africa
Asia
Europe
North andCentral America
Oceania
South America
World
FIGURE 19. Volume of growing stock for the top five genera, Asia, 2020
FIGURE 18. Volume of growing stock for the top five genera, Africa, 2020
FIGURE 21. Volume of growing stock for the top five genera, North America, 2020
FIGURE 20. Volume of growing stock for the top five genera, Europe, 2020
0 100 200 300 400 500Million m3
Genu
s
600
0 500 1 000 1 500 2 000 2 500 3 000Million m3
Genu
s
3 500
0 10 000 20 000 30 000 40 000Million m3
Genu
s
0 5 000 10 000 15 000 25 00020 000Million m3
Genu
s
Shorea
Pinus
Larix
Quercus
Abies
Pinus
Larix
Picea
Betula
Populus
Picea
Pinus
Pseudotsuga
Populus
Abies
Brachystegia
Julbernadia
Colophospermum
Isoberlinia
Pinus
Note: Only North America is shown here because insu�icient data were available for Central America and the Caribbean. In this figure, an estimate was made for Canada based on the share of growing-stock composition reported by that country for 2000 multiplied by the total growing stock reported for 2020.
48 Global Forest Resources Assessment 2020
North America (where it remained at about 2 percent and 4 percent, respectively, over the period). Globally, the share of introduced tree species increased from 6 percent in 1990 to 8 percent in 2020.
Biomass stock
STATUSFRA 2020 received information on forest biomass in 2020 from 193 countries and territories representing 99 percent of the world’s forests. Data on dead wood were reported by 78 countries and territories (accounting for 74 percent of the world’s forests). For those countries and territories that provided no data, biomass and dead wood were estimated by multiplying subregional averages per hectare by forest area (as estimated for each point in the time series).
The total living biomass in the world’s forests amounts to almost 606 gigatonnes (Gt) (Table 38), or about 149 tonnes per ha. The highest biomass stock per hectare was in regions with tropical forests – with values above 200 tonnes per ha in South America and Western and Central Africa. Dead wood in the world’s forests is estimated at 59.0 Gt of dry matter (equivalent to 14.5 tonnes per ha).
Many countries used the default conversion factors provided by the IPCC to estimate biomass from growing
stock, although an increasing number of countries are developing estimates based on national data. Table 39 shows the average biomass conversion and expansion factor (BCEF),16 root–shoot ratio17 and dead–live ratio,18 by subregion, based on estimates of growing stock and biomass for 2020. The calculated factors are well within the range of default values presented in the IPCC guidelines.
TRENDSFRA 2020 received complete time-series data on above- and below-ground forest biomass from 189 countries and territories representing more than 95 per cent of the global forest area. For non-reporting countries and territories, biomass was estimated by multiplying the subregional averages of biomass per hectare by forest area (as estimated for each point in the time series).
The global biomass stock decreased by about 8 Gt between 1990 and 2020 (Table 40). The largest decreases
16 The BCEF is calculated as above-ground biomass in tonnes divided by growing stock in m3.17 The root–shoot ratio is calculated as below-ground biomass divided by above-ground biomass.18 The dead–live ratio is calculated as the dry weight of dead wood divided by the total living biomass (above-ground and below-ground).
TABLE 38. Biomass and dead-wood stock, by region and subregion, 2020
Region/subregion Biomass Dead wood
Million tonnes tonnes/ha Million tonnes tonnes/ha
Eastern and Southern Africa 27 855 94.2 1 577 5.3
Northern Africa 2 293 65.2 17 0.5
Western and Central Africa 76 837 251.3 1 851 6.1
Total Africa 106 985 168.0 3 444 5.4
East Asia 23 958 88.3 3 326 12.3
South and Southeast Asia 49 911 168.6 320 1.1
Western and Central Asia 4 885 88.4 40 0.7
Total Asia 78 754 126.5 3 685 5.9
Europe excl. Russian Federation 28 335 140.2 1 603 7.9
Total Europe 109 817 107.9 16 263 16.0
Caribbean 1 035 131.2 69 8.8
Central America 3 752 167.5 248 11.1
North America 78 829 109.1 19 781 27.4
Total North and Central America 83 616 111.1 20 099 26.7
Total Oceania 28 264 152.6 4 699 25.4
Total South America 198 556 235.2 10 839 12.8
WORLD 605 993 149.3 59 029 14.5

494. Growing stock, biomass and carbon
TABLE 39. Forest biomass conversion and expansion factor, root–shoot ratio and dead–live ratio, by region and subregion, 2020
Region/subregion BCEF Root–shoot ratio Dead–live ratio
Eastern and Southern Africa 1.14 0.27 0.06
Northern Africa 2.11 0.29 0.01
Western and Central Africa 1.04 0.31 0.02
Total Africa 1.07 0.30 0.03
East Asia 0.70 0.26 0.14
South and Southeast Asia 1.25 0.26 0.01
Western and Central Asia 0.97 0.29 0.01
Total Asia 1.00 0.26 0.05
Europe excl. Russian Federation 0.65 0.25 0.06
Total Europe 0.74 0.28 0.15
Caribbean 1.14 0.25 0.07
Central America 0.70 0.27 0.07
North America 0.71 0.23 0.25
Total North and Central America 0.71 0.23 0.24
Total Oceania 1.13 0.33 0.17
Total South America 0.85 0.24 0.05
WORLD 0.86 0.26 0.10
Note: BCEF = biomass conversion and expansion factor.
TABLE 40. Total living biomass, by region and subregion, 1990–2020
Region/subregion Living biomass (million tonnes)
1990 2000 2010 2020
Eastern and Southern Africa 32 813 31 391 29 718 27 855
Northern Africa 2 572 2 485 2 408 2 293
Western and Central Africa 88 929 85 219 81 577 76 837
Total Africa 124 314 119 095 113 703 106 985
East Asia 14 417 17 031 19 717 23 958
South and Southeast Asia 53 790 52 879 51 657 49 911
Western and Central Asia 3 661 4 015 4 567 4 885
Total Asia 71 868 73 924 75 941 78 754
Europe excl. Russian Federation 19 332 22 042 25 085 28 335
Total Europe 90 713 95 629 102 995 109 817
Caribbean 766 874 976 1 035
Central America 4 514 4 198 3 917 3 752
North America 73 887 76 010 77 282 78 829
Total North and Central America 79 166 81 082 82 174 83 616
Total Oceania 28 396 28 254 28 225 28 264
Total South America 219 518 210 979 202 309 198 556
WORLD 613 975 608 963 605 348 605 993

50 Global Forest Resources Assessment 2020
were in Africa and South America, mainly because of declines in forest area. In contrast, Asia, Europe and North America all showed increases in total biomass stock.
Biomass stock per hectare increased between 1990 and 2020 in all regions except Africa and Oceania, where this attribute was relatively stable (Figure 22).
Only 72 countries and territories, representing 68 percent of the world’s forest area, reported complete time series for dead-wood stock; estimates for this carbon pool, therefore, are less reliable than for living biomass. For non-reporting countries, the dead-wood stock was estimated by multiplying the subregional averages per hectare by forest area (as estimated for each point in the time series). Globally, the stock of dead wood was reasonably stable between 1990 and 2020 (Table 41). There were regional differences, however, with dead-wood stocks decreasing in Africa and South America (due mainly to reductions in forest area) and increasing in Asia, Europe and North America.
FIGURE 22. Regional and global trends in biomass stock per hectare, by region, 1990–2020
20001990 2010 2020
0 50 100 150 200 250Tonnes per ha
Africa
Asia
Europe
North andCentral America
Oceania
South America
World
TABLE 41. Dead-wood stock, by region and subregion, 1990–2020
Region/subregion Dead wood (million tonnes)
1990 2000 2010 2020
Eastern and Southern Africa 1 877 1 794 1 685 1 577
Northern Africa 20 19 18 17
Western and Central Africa 2 738 2 345 2 112 1 851
Total Africa 4 635 4 158 3 815 3 444
East Asia 2 219 2 516 2 896 3 326
South and Southeast Asia 356 334 332 320
Western and Central Asia 28 32 36 40
Total Asia 2 603 2 882 3 265 3 685
Europe excl. Russian Federation 1 179 1 273 1 526 1 603
Total Europe 14 831 14 995 15 804 16 263
Caribbean 53 59 65 69
Central America 302 281 260 248
North America 19 120 19 026 19 736 19 781
Total North and Central America 19 475 19 366 20 061 20 099
Total Oceania 4 740 4 710 4 716 4 699
Total South America 12 051 11 577 11 082 10 839
WORLD 58 336 57 689 58 742 59 029

514. Growing stock, biomass and carbon
Carbon stock
STATUSFRA 2020 received information on forest carbon stock in 2020 from 192 countries and territories (representing 99 percent of the world’s forests) for biomass; 79 countries and territories (76 percent) for dead wood; 77 countries and territories (65 percent) for litter carbon; and 76 countries and territories (66 percent) for soil carbon. For non-reporting countries and territories, carbon stock was estimated by multiplying subregional averages for each of the carbon pools by forest area.
The total forest carbon stock (i.e. including all carbon pools) is estimated at 662 Gt (163 tonnes per ha), comprising 300 Gt in soil organic matter, 295 Gt in living biomass and 68.0 Gt in dead wood and litter (Table 42). Soil organic matter constitutes the biggest pool, with 45.2 percent of the total carbon, followed by above-ground biomass, below-ground biomass, litter and dead wood.
TABLE 42. Forest carbon stock in carbon pools, by region and subregion, 2020
Region/subregion Carbon in living biomass Carbon in dead wood and litter
Carbon in soil Total carbon
Million tonnes
tonnes/ha Million tonnes
tonnes/ha Million tonnes
tonnes/ha Million tonnes
tonnes/ha
Eastern and Southern Africa 13 248 44.8 1 302 4.4 11 700 39.6 26 250 88.7
Northern Africa 1 090 31.0 103 2.9 897 25.5 2 090 59.5
Western and Central Africa 36 229 118.5 1 522 5.0 14 795 48.4 52 546 171.9
Total Africa 50 567 79.4 2 927 4.6 27 392 43.0 80 886 127.1
East Asia 11 767 43.4 5 051 18.6 21 089 77.7 37 907 139.7
South and Southeast Asia 23 393 79.0 976 3.3 17 100 57.8 41 468 140.1
Western and Central Asia 2 388 43.2 399 7.2 2 571 46.5 5 358 97.0
Total Asia 37 547 60.3 6 426 10.3 40 760 65.5 84 733 136.1
Europe excl. Russian Federation 13 833 68.4 3 725 18.4 21 635 107.0 39 192 193.9
Total Europe 54 574 53.6 17 191 16.9 100 677 98.9 172 442 169.5
Caribbean 493 62.5 82 10.4 1 522 193.0 2 098 265.9
Central America 1 840 82.1 166 7.4 2 063 92.1 4 069 181.6
North America 39 301 54.4 30 953 42.8 69 697 96.5 139 951 193.7
Total North and Central America 41 634 55.3 31 201 41.5 73 282 97.4 146 118 194.1
Total Oceania 13 881 74.9 3 247 17.5 15 935 86.0 33 063 178.5
Total South America 96 331 114.1 7 057 8.4 41 457 49.1 144 846 171.6
WORLD 294 535 72.6 68 049 16.8 299 504 73.8 662 088 163.1
TRENDSFRA 2020 received complete time-series data from 188 countries and territories (representing 95 percent of the total forest area) for forest biomass (above- and below-ground); 72 countries and territories (70 percent) for dead wood; 73 countries and territories (60 percent) for litter; and 72 countries (51 percent) for soil carbon.
For those countries and territories that did not report, carbon stocks were estimated by multiplying the subregional average stock per hectare by forest area (as estimated for each point in the time series).
The global forest carbon stock decreased between 1990 and 2020 (Figure 23), from 668 Gt to 662 Gt (Table 43), due to an overall decrease in forest area. There were considerable regional and subregional differences in the trend, however: for example, the carbon stock in forest biomass increased significantly in East Asia, Western and Central Asia, Europe and North America (where forest area increased) and decreased considerably in South America and Western and Central Africa (Figure 24, p. 53).
Although total forest carbon stocks decreased globally between 1990 and 2020, carbon stock per hectare increased for all pools (Figure 25, p. 53).

52 Global Forest Resources Assessment 2020
TABLE 43. Total forest carbon stock, by region and subregion, 1990–2020
Region/subregion Forest carbon stock (million tonnes)
1990 2000 2010 2020
Eastern and Southern Africa 30 932 29 642 27 978 26 250
Northern Africa 2 338 2 242 2 190 2 090
Western and Central Africa 61 005 58 253 55 745 52 546
Total Africa 94 274 90 137 85 913 80 886
East Asia 27 110 30 261 33 908 37 907
South and Southeast Asia 45 804 43 792 43 071 41 468
Western and Central Asia 4 180 4 511 4 959 5 358
Total Asia 77 093 78 564 81 938 84 733
Europe excl. Russian Federation 31 625 34 260 36 833 39 192
Total Europe 158 744 162 457 168 069 172 442
Caribbean 1 552 1 783 1 977 2 098
Central America 4 988 4 617 4 270 4 069
North America 136 644 137 730 139 324 139 951
Total North and Central America 143 184 144 131 145 572 146 118
Total Oceania 33 338 33 111 33 077 33 063
Total South America 161 765 154 917 147 917 144 846
WORLD 668 399 663 316 662 485 662 088
FIGURE 23. Trends in total forest carbon stock, by carbon pool, 1990–2020
20001990 2010 2020
0 200 400 600100 300 500 700Gigatonnes
Carbon inabove-ground biomass
Carbon inbelow-ground biomass
Carbon in dead wood
Carbon in litter
Carbon insoil organic matter
Total carbon stockin forest
534. Growing stock, biomass and carbon
FIGURE 24. Change in forest biomass carbon stock, by region and subregion, 1990–2020
1990–2000 2000–2010 2010–2020
Million tonnes/year-500 -400 -300 -200 -100 0 100 200 300 400
Europe
East Asia
North America
Western and Central Asia
Caribbean
Oceania
Northern Africa
Central America
South and Southeast Asia
Eastern and Southern Africa
South America
Western and Central Africa
FIGURE 25. Forest carbon stock per hectare, by carbon pool, 1990–2020
20001990 2010 2020
Tonnes/ha
Carbon inabove-ground biomass
Carbon inbelow-ground biomass
Carbon in dead wood
Carbon in litter
Carbon insoil organic matter
0 10 20 30 40 50 60 70 80
F

@ F
AO /
NCo
gnom
e

@ F
AO /
NCo
gnom
e
5 Designation and
management

©FA
O/G
iuse
ppe
Bizz
arr
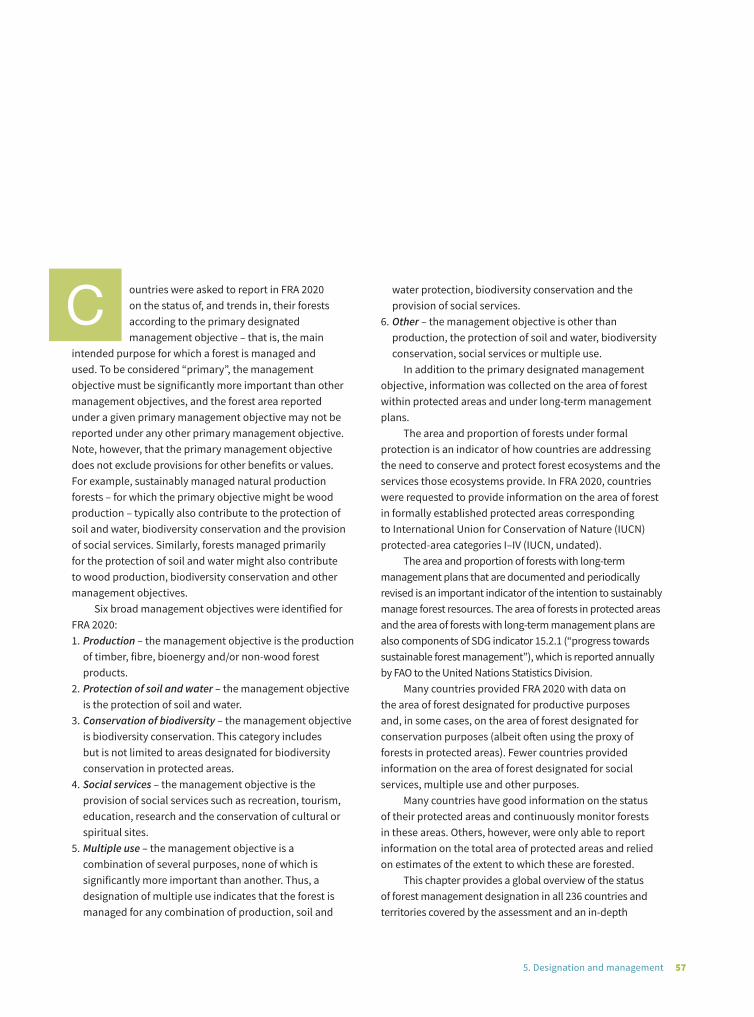
575. Designation and management
ountries were asked to report in FRA 2020 on the status of, and trends in, their forests according to the primary designated management objective – that is, the main
intended purpose for which a forest is managed and used. To be considered “primary”, the management objective must be significantly more important than other management objectives, and the forest area reported under a given primary management objective may not be reported under any other primary management objective. Note, however, that the primary management objective does not exclude provisions for other benefits or values. For example, sustainably managed natural production forests – for which the primary objective might be wood production – typically also contribute to the protection of soil and water, biodiversity conservation and the provision of social services. Similarly, forests managed primarily for the protection of soil and water might also contribute to wood production, biodiversity conservation and other management objectives.
Six broad management objectives were identified for FRA 2020: 1. Production – the management objective is the production
of timber, fibre, bioenergy and/or non-wood forest products.
2. Protection of soil and water – the management objective is the protection of soil and water.
3. Conservation of biodiversity – the management objective is biodiversity conservation. This category includes but is not limited to areas designated for biodiversity conservation in protected areas.
4. Social services – the management objective is the provision of social services such as recreation, tourism, education, research and the conservation of cultural or spiritual sites.
5. Multiple use – the management objective is a combination of several purposes, none of which is significantly more important than another. Thus, a designation of multiple use indicates that the forest is managed for any combination of production, soil and
water protection, biodiversity conservation and the provision of social services.
6. Other – the management objective is other than production, the protection of soil and water, biodiversity conservation, social services or multiple use.
In addition to the primary designated management objective, information was collected on the area of forest within protected areas and under long-term management plans.
The area and proportion of forests under formal protection is an indicator of how countries are addressing the need to conserve and protect forest ecosystems and the services those ecosystems provide. In FRA 2020, countries were requested to provide information on the area of forest in formally established protected areas corresponding to International Union for Conservation of Nature (IUCN) protected-area categories I–IV (IUCN, undated).
The area and proportion of forests with long-term management plans that are documented and periodically revised is an important indicator of the intention to sustainably manage forest resources. The area of forests in protected areas and the area of forests with long-term management plans are also components of SDG indicator 15.2.1 (“progress towards sustainable forest management”), which is reported annually by FAO to the United Nations Statistics Division.
Many countries provided FRA 2020 with data on the area of forest designated for productive purposes and, in some cases, on the area of forest designated for conservation purposes (albeit often using the proxy of forests in protected areas). Fewer countries provided information on the area of forest designated for social services, multiple use and other purposes.
Many countries have good information on the status of their protected areas and continuously monitor forests in these areas. Others, however, were only able to report information on the total area of protected areas and relied on estimates of the extent to which these are forested.
This chapter provides a global overview of the status of forest management designation in all 236 countries and territories covered by the assessment and an in-depth
C
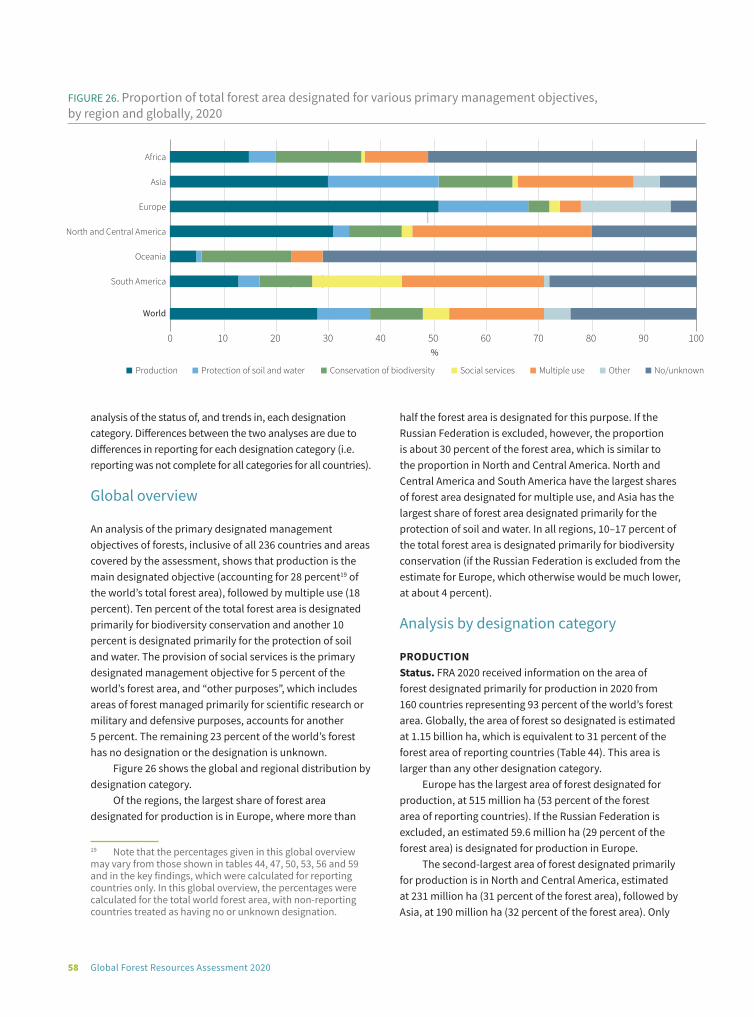
58 Global Forest Resources Assessment 2020
analysis of the status of, and trends in, each designation category. Differences between the two analyses are due to differences in reporting for each designation category (i.e. reporting was not complete for all categories for all countries).
Global overview
An analysis of the primary designated management objectives of forests, inclusive of all 236 countries and areas covered by the assessment, shows that production is the main designated objective (accounting for 28 percent19 of the world’s total forest area), followed by multiple use (18 percent). Ten percent of the total forest area is designated primarily for biodiversity conservation and another 10 percent is designated primarily for the protection of soil and water. The provision of social services is the primary designated management objective for 5 percent of the world’s forest area, and “other purposes”, which includes areas of forest managed primarily for scientific research or military and defensive purposes, accounts for another 5 percent. The remaining 23 percent of the world’s forest has no designation or the designation is unknown.
Figure 26 shows the global and regional distribution by designation category.
Of the regions, the largest share of forest area designated for production is in Europe, where more than
19 Note that the percentages given in this global overview may vary from those shown in tables 44, 47, 50, 53, 56 and 59 and in the key findings, which were calculated for reporting countries only. In this global overview, the percentages were calculated for the total world forest area, with non-reporting countries treated as having no or unknown designation.
half the forest area is designated for this purpose. If the Russian Federation is excluded, however, the proportion is about 30 percent of the forest area, which is similar to the proportion in North and Central America. North and Central America and South America have the largest shares of forest area designated for multiple use, and Asia has the largest share of forest area designated primarily for the protection of soil and water. In all regions, 10–17 percent of the total forest area is designated primarily for biodiversity conservation (if the Russian Federation is excluded from the estimate for Europe, which otherwise would be much lower, at about 4 percent).
Analysis by designation category
PRODUCTIONStatus. FRA 2020 received information on the area of forest designated primarily for production in 2020 from 160 countries representing 93 percent of the world’s forest area. Globally, the area of forest so designated is estimated at 1.15 billion ha, which is equivalent to 31 percent of the forest area of reporting countries (Table 44). This area is larger than any other designation category.
Europe has the largest area of forest designated for production, at 515 million ha (53 percent of the forest area of reporting countries). If the Russian Federation is excluded, an estimated 59.6 million ha (29 percent of the forest area) is designated for production in Europe.
The second-largest area of forest designated primarily for production is in North and Central America, estimated at 231 million ha (31 percent of the forest area), followed by Asia, at 190 million ha (32 percent of the forest area). Only
FIGURE 26. Proportion of total forest area designated for various primary management objectives, by region and globally, 2020
0 10 20 30 40 50%
60 70 80 90 100
Africa
Asia
Europe
North and Central America
Oceania
South America
World
Production Protection of soil and water Conservation of biodiversity Social services Multiple use Other No/unknown

595. Designation and management
5 percent of the forest area in Oceania is designated primarily for production.
Three countries – Albania, Denmark and Montenegro – reported that 80 percent or more of their forest area is designated primarily for production. Nine of the top ten countries with the highest share of forest area designated primarily for production are in Europe (Table 45). Thirty-nine countries reported that they have no forest area designated for production.
Trends. The analysis of trends in the area of forest designated primarily for production encompasses 151 countries representing 89 percent of the total forest area.
The area of forest designated primarily for production decreased slightly (by 1.33 million ha) between 1990 and 2020, although there were fluctuations over the period (Table 46). The area of forest area so designated decreased at a rate of 2.32 million ha per year in 1990–2000 and 1.55 million ha per year in 2000–2010, before increasing by 3.74 million ha per year in 2010–2020. The shift to an increasing trend was driven mainly by Europe and especially the Russian Federation, which reported an annual increase in the area of forest designated primarily for production of 3.38 million ha in 2010–2020. Overall in Europe, however, the relative share of forest designated primarily for production decreased from 54 percent in 1990 to 53 percent in 2020 (Figure 27). The
proportion of the total forest area designated primarily for production increased steadily in North and Central America between 1990 and 2020, from 31 percent to 35 percent.
In Africa, the area of forest designated primarily for production decreased in absolute terms between 1990 and 2020, from 109 million ha to 91.4 million ha, but the proportion of the total forest area so designated was steady
TABLE 44. Forest area designated primarily for production, by region and subregion, 2020
Region/subregion Data availability Forest designated for production
No. of reporting countries
% of total forest area
Area (1 000 ha)
% of forest area
Eastern and Southern Africa 15 70 30 062 15
Northern Africa 5 77 1 579 6
Western and Central Africa 18 95 67 693 28
Total Africa 38 82 99 333 19
East Asia 4 98 73 980 28
South and Southeast Asia 14 98 105 231 36
Western and Central Asia 14 84 10 614 23
Total Asia 32 97 189 825 32
Europe excl. Russian Federation 37 76 59 603 29
Total Europe 38 95 514 895 53
Caribbean 15 59 1 149 25
Central America 2 29 3 226 50
North America 5 100 226 643 31
Total North and Central America 22 97 231 017 31
Total Oceania 18 99 10 051 5
Total South America 12 90 106 348 14
WORLD 160 93 1 151 470 31
TABLE 45. Top ten countries for share of forest area designated primarily for production, 2020
Ranking Country Forest designated for production
Area (1 000 ha)
% of total forest area
1 Montenegro 675 82
2 Denmark 504 80
3 Albania 628 80
4 Latvia 2 603 76
5 Ghana 5 908 74
6 Czechia 1 975 74
7 Estonia 1 776 73
8 Lithuania 1 577 72
9 Sweden 19 587 70
10 Croatia 1 334 69

60 Global Forest Resources Assessment 2020
TABLE 46. Forest area designated primarily for production, and annual change, by region and subregion, 1990–2020
Region/subregion Data availability Forest area designated for production (1 000 ha) Annual change (1 000 ha/yr)
No. of reporting countries
% of total forest area
1990 2000 2010 2020 1990–2000 2000–2010 2010–2020
Eastern and Southern Africa
15 70 39 501 37 908 36 306 30 062 -159 -160 -624
Northern Africa 5 77 1 520 1 506 1 520 1 579 -1 1 6
Western and Central Africa
16 87 68 051 64 746 53 072 59 803 -330 -1 167 673
Total Africa 36 79 109 072 104 160 90 899 91 443 -491 -1 326 54
East Asia 4 98 83 936 83 347 67 314 73 980 -59 -1 603 667
South and Southeast Asia
14 98 109 326 113 918 110 835 105 231 459 -308 -560
Western and Central Asia
14 84 9 191 9 828 10 143 10 614 64 31 47
Total Asia 32 97 202 453 207 093 188 292 189 825 464 -1 880 153
Europe excl. Russian Federation
35 76 63 657 61 936 60 738 58 927 -172 -120 -181
Total Europe 36 95 510 335 473 373 482 229 514 219 -3 696 886 3 199
Caribbean 15 59 875 866 1 051 1 149 -1 18 10
Central America 1 15 4 352 3 672 2 848 2 317 -68 -82 -53
North America 4 91 202 172 212 796 220 848 226 302 1 062 805 545
Total North and Central America
20 88 207 398 217 334 224 746 229 768 994 741 502
Total Oceania 16 98 8 035 8 721 9 293 9 205 69 57 -9
Total South America 11 83 98 533 101 977 101 666 100 033 344 -31 -163
WORLD 151 89 1 135 826 1 112 657 1 097 126 1 134 493
-2 317 -1 553 3 737
FIGURE 27. Proportion of total forest area designated primarily for production, by region, 1990–2020
%
Africa Asia Europe excl.Russian
Federation
Europe Northand Central
America
Oceania SouthAmerica
World
1990 2000 2010 2020
FIGURE 3. Forest area as a proportion (%) of total land area, 2000, 2010 and 2015–2020, by Sustainable Development Goal regional grouping
0
10
20
30
40
50
60

615. Designation and management
TABLE 47. Forest area designated primarily for multiple use, by region and subregion, 2020
Region/subregion Data availability Forest area designated for multiple use
No. of reporting countries
% of total forest area
Area (1 000 ha)
% of forest area
Eastern and Southern Africa 11 40 37 059 31
Northern Africa 3 19 4 298 64
Western and Central Africa 14 77 32 808 14
Total Africa 28 57 74 164 21
East Asia 4 98 78 536 30
South and Southeast Asia 14 98 46 819 16
Western and Central Asia 14 84 8 380 18
Total Asia 32 97 133 734 22
Europe excl. Russian Federation 31 71 42 360 30
Total Europe 32 94 45 923 5
Caribbean 11 55 282 7
Central America 2 29 825 13
North America 5 100 253 531 35
Total North and Central America 18 97 254 638 35
Total Oceania 15 99 13 467 7
Total South America 9 74 226 681 36
WORLD 134 85 748 606 22
TABLE 48. Countries and territories with 100 percent of their total forest area designated primarily for multiple use, 2020
Country/territory Forest area designated for multiple use (1 000 ha)
France 17 253
Botswana 15 255
French Guyana 8 003
Saudi Arabia 977
Syrian Arab Republic 522
United Arab Emirates 317
Réunion 98.4
Guadeloupe 71.9
Micronesia (Federated States of) 64.4
Martinique 52.3
Palau 41.4
Mayotte 13.9
Saint Kitts and Nevis 11.0
Marshall Islands 9.40
Djibouti 5.80
Isle of Man 3.46
Montserrat 2.50
Saint Pierre and Miquelon 1.22
Faroe Islands 0.08
at 18 percent. Thus, the trend of decreasing area was driven mainly by a decrease in forest area rather than by changes in management designation.
In Asia, the area of forest designated primarily for production decreased from 202 million ha in 1990 to 190 million ha in 2020. The proportion of the total forest area designated for production also declined, from 36 percent in 1990 to 32 percent in 2020.
There were slight increases in the area of forest designated primarily for production in South America and Oceania between 1990 and 2020, as well as in the proportion of the total forest area so designated – from 12 percent to 14 percent in South America and from 4 percent to 5 percent in Oceania.
MULTIPLE USEStatus. FRA 2020 received information on the area of forest designated primarily for multiple use in 2020 from 134 countries and territories representing 85 percent of the world’s forest area. The area so designated is estimated at 749 million ha, which is 22 percent of the total forest area of the reporting countries and territories (Table 47).
The largest area of forest designated for multiple use is in North and Central America, at 255 million ha (35 percent of the region’s total forest area), followed by South America, at 227 million ha (36 percent).

62 Global Forest Resources Assessment 2020
TABLE 49. Area of forest designated primarily for multiple use, and annual change, by region and subregion, 1990–2020
Region/subregion Data availability Forest area designated primarily for multiple use (1 000 ha)
Annual change (1 000 ha/yr)
No. of reporting countries
% of total forest area
1990 2000 2010 2020 1990–2000 2000–2010 2010–2020
Eastern and Southern Africa
11 40 45 576 42 735 40 692 37 059 -284 -204 -363
Northern Africa 3 19 4 995 4 844 4 456 4 298 -15 -39 -16
Western and Central Africa
12 35 44 265 40 200 36 831 31 665 -406 -337 -517
Total Africa 26 37 94 835 87 779 81 980 73 021 -706 -580 -896
East Asia 3 93 46 438 57 148 68 300 78 536 1 071 1 115 1 024
South and Southeast Asia
14 98 43 615 46 130 44 116 46 819 251 -201 270
Western and Central Asia
14 84 4 789 5 476 8 017 8 380 69 254 36
Total Asia 31 94 94 843 108 755 120 433 133 734 1 391 1 168 1 330
Europe excl. Russian Federation
29 68 37 638 37 951 39 020 39 136 31 107 12
Total Europe 30 94 37 746 38 105 40 724 42 699 36 262 198
Caribbean 11 55 302 291 284 282 -1 -1 n.s.
Central America 1 15 0 0 0 0 0 0 0
North America 4 91 260 124 259 652 257 496 253 435 -47 -216 -406
Total North and Central America
16 88 260 426 259 942 257 780 253 717 -48 -216 -406
Total Oceania 13 97 12 677 10 451 11 887 11 846 -223 144 -4
Total South America 8 71 308 654 275 426 237 925 223 446 -3 323 -3 750 -1 448
WORLD 124 79 809 181 780 458 750 728 738 464 -2 872 -2 973 -1 226
Note: n.s. = not significant.
FIGURE 28. Proportion of total forest area designated primarily for multiple use, by region, 1990–2020
%
Africa Asia Europe excl.Russian
Federation
Europe Northand Central
America
Oceania SouthAmerica
World
1990 2000 2010 2020
FIGURE 3. Forest area as a proportion (%) of total land area, 2000, 2010 and 2015–2020, by Sustainable Development Goal regional grouping
0
10
20
30
40
50
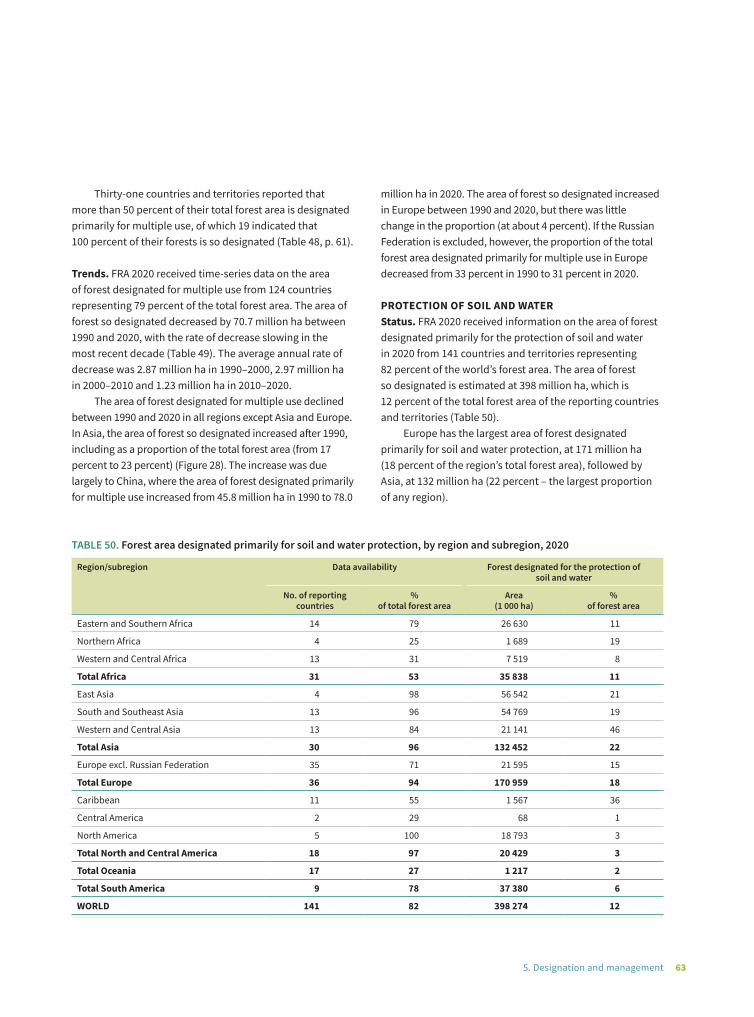
635. Designation and management
TABLE 50. Forest area designated primarily for soil and water protection, by region and subregion, 2020
Region/subregion Data availability Forest designated for the protection of soil and water
No. of reporting countries
% of total forest area
Area (1 000 ha)
% of forest area
Eastern and Southern Africa 14 79 26 630 11
Northern Africa 4 25 1 689 19
Western and Central Africa 13 31 7 519 8
Total Africa 31 53 35 838 11
East Asia 4 98 56 542 21
South and Southeast Asia 13 96 54 769 19
Western and Central Asia 13 84 21 141 46
Total Asia 30 96 132 452 22
Europe excl. Russian Federation 35 71 21 595 15
Total Europe 36 94 170 959 18
Caribbean 11 55 1 567 36
Central America 2 29 68 1
North America 5 100 18 793 3
Total North and Central America 18 97 20 429 3
Total Oceania 17 27 1 217 2
Total South America 9 78 37 380 6
WORLD 141 82 398 274 12
Thirty-one countries and territories reported that more than 50 percent of their total forest area is designated primarily for multiple use, of which 19 indicated that 100 percent of their forests is so designated (Table 48, p. 61).
Trends. FRA 2020 received time-series data on the area of forest designated for multiple use from 124 countries representing 79 percent of the total forest area. The area of forest so designated decreased by 70.7 million ha between 1990 and 2020, with the rate of decrease slowing in the most recent decade (Table 49). The average annual rate of decrease was 2.87 million ha in 1990–2000, 2.97 million ha in 2000–2010 and 1.23 million ha in 2010–2020.
The area of forest designated for multiple use declined between 1990 and 2020 in all regions except Asia and Europe. In Asia, the area of forest so designated increased after 1990, including as a proportion of the total forest area (from 17 percent to 23 percent) (Figure 28). The increase was due largely to China, where the area of forest designated primarily for multiple use increased from 45.8 million ha in 1990 to 78.0
million ha in 2020. The area of forest so designated increased in Europe between 1990 and 2020, but there was little change in the proportion (at about 4 percent). If the Russian Federation is excluded, however, the proportion of the total forest area designated primarily for multiple use in Europe decreased from 33 percent in 1990 to 31 percent in 2020.
PROTECTION OF SOIL AND WATERStatus. FRA 2020 received information on the area of forest designated primarily for the protection of soil and water in 2020 from 141 countries and territories representing 82 percent of the world’s forest area. The area of forest so designated is estimated at 398 million ha, which is 12 percent of the total forest area of the reporting countries and territories (Table 50).
Europe has the largest area of forest designated primarily for soil and water protection, at 171 million ha (18 percent of the region’s total forest area), followed by Asia, at 132 million ha (22 percent – the largest proportion of any region).

64 Global Forest Resources Assessment 2020
The proportion of the total forest area designated primarily for soil and water protection is higher than 90 percent in four countries – Kiribati and Kuwait (both 100 percent), Cabo Verde (98 percent) and Kyrgyzstan (92 percent) (Table 51). Fifty-one countries and territories reported no forest designated primarily for soil and water protection (eight of which have no forest area).
Trends. FRA 2020 received time-series data on the area of forest designated primarily for soil and water protection from 131 countries and territories representing 71 percent of the total forest area. The area of forest so designated increased by 119 million ha between 1990 and 2020 (Table 52). The average annual rate of increase grew over
TABLE 52. Area of forest area designated primarily for soil and water protection, and annual change, by region and subregion, 1990–2020
Region/subregion Data availability Forest area designated for the protection of soil and water (1 000 ha)
Annual change (1 000 ha/yr)
No. of reporting countries
% of total forest area
1990 2000 2010 2020 1990–2000 2000–2010 2010–2020
Eastern and Southern Africa
14 79 29 228 28 738 27 181 26 630 -49 -156 -55
Northern Africa 4 25 1 536 1 553 1 527 1 689 2 -3 16
Western and Central Africa
11 29 12 220 10 961 9 298 7 474 -126 -166 -182
Total Africa 29 52 42 984 41 252 38 005 35 793 -173 -325 -221
East Asia 4 98 29 016 40 317 58 363 56 542 1 130 1 805 -182
South and Southeast Asia
13 96 51 462 53 810 54 017 54 769 235 21 75
Western and Central Asia
13 83 22 069 22 478 21 655 21 129 41 -82 -53
Total Asia 30 96 102 547 116 606 134 035 132 440 1 406 1 743 -160
Europe excl. Russian Federation
33 71 16 916 19 656 20 687 21 482 274 103 80
Total Europe 34 94 75 612 90 044 105 798 170 846 1 443 1 575 6 505
Caribbean 11 55 884 1 124 1 467 1 567 24 34 10
Central America 1 15 128 108 84 68 -2 -2 -2
North America 3 48 15 039 15 188 15 165 15 115 15 -2 -5
Total North and Central America
15 47 16 051 16 420 16 716 16 751 37 30 3
Total Oceania 15 26 1 165 1 163 1 161 1 152 n.s n.s -1
Total South America 8 71 33 169 30 639 29 660 33 505 -253 -98 384
WORLD 131 71 271 528 296 124 325 376 390 487 2 460 2 925 6 511
Note: n.s. = not significant.
TABLE 51. Top ten countries and territories for the proportion of total forest area designated primarily for soil and water protection, 2020
Ranking Country/territory Forest designated for the protection of soil and water
Area (1 000 ha)
% of total forest area
1 Kiribati 1.2 100
2 Kuwait 6.3 100
3 Cabo Verde 44.7 98
4 Kyrgyzstan 1 212 92
5 Tunisia 627 89
6 Wallis and Futuna Islands
5.1 87
7 Bahrain 0.6 86
8 Uzbekistan 2 532 69
9 Mongolia 9 192 65
10 Kazakhstan 2 160 63
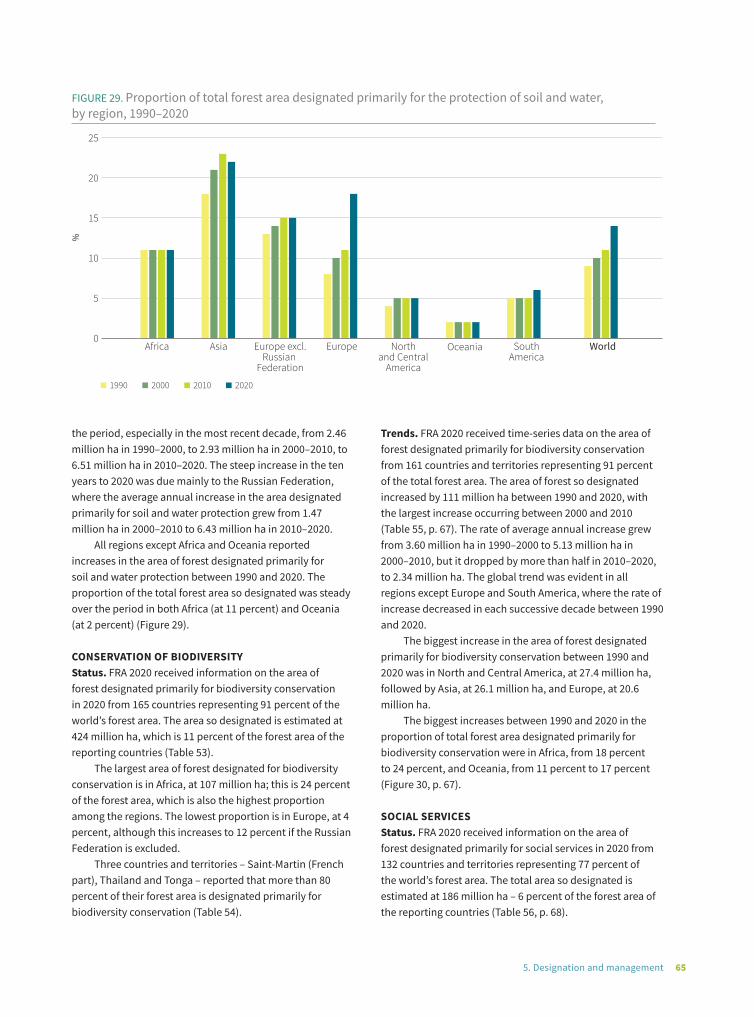
655. Designation and management
the period, especially in the most recent decade, from 2.46 million ha in 1990–2000, to 2.93 million ha in 2000–2010, to 6.51 million ha in 2010–2020. The steep increase in the ten years to 2020 was due mainly to the Russian Federation, where the average annual increase in the area designated primarily for soil and water protection grew from 1.47 million ha in 2000–2010 to 6.43 million ha in 2010–2020.
All regions except Africa and Oceania reported increases in the area of forest designated primarily for soil and water protection between 1990 and 2020. The proportion of the total forest area so designated was steady over the period in both Africa (at 11 percent) and Oceania (at 2 percent) (Figure 29).
CONSERVATION OF BIODIVERSITYStatus. FRA 2020 received information on the area of forest designated primarily for biodiversity conservation in 2020 from 165 countries representing 91 percent of the world’s forest area. The area so designated is estimated at 424 million ha, which is 11 percent of the forest area of the reporting countries (Table 53).
The largest area of forest designated for biodiversity conservation is in Africa, at 107 million ha; this is 24 percent of the forest area, which is also the highest proportion among the regions. The lowest proportion is in Europe, at 4 percent, although this increases to 12 percent if the Russian Federation is excluded.
Three countries and territories – Saint-Martin (French part), Thailand and Tonga – reported that more than 80 percent of their forest area is designated primarily for biodiversity conservation (Table 54).
Trends. FRA 2020 received time-series data on the area of forest designated primarily for biodiversity conservation from 161 countries and territories representing 91 percent of the total forest area. The area of forest so designated increased by 111 million ha between 1990 and 2020, with the largest increase occurring between 2000 and 2010 (Table 55, p. 67). The rate of average annual increase grew from 3.60 million ha in 1990–2000 to 5.13 million ha in 2000–2010, but it dropped by more than half in 2010–2020, to 2.34 million ha. The global trend was evident in all regions except Europe and South America, where the rate of increase decreased in each successive decade between 1990 and 2020.
The biggest increase in the area of forest designated primarily for biodiversity conservation between 1990 and 2020 was in North and Central America, at 27.4 million ha, followed by Asia, at 26.1 million ha, and Europe, at 20.6 million ha.
The biggest increases between 1990 and 2020 in the proportion of total forest area designated primarily for biodiversity conservation were in Africa, from 18 percent to 24 percent, and Oceania, from 11 percent to 17 percent (Figure 30, p. 67).
SOCIAL SERVICESStatus. FRA 2020 received information on the area of forest designated primarily for social services in 2020 from 132 countries and territories representing 77 percent of the world’s forest area. The total area so designated is estimated at 186 million ha – 6 percent of the forest area of the reporting countries (Table 56, p. 68).
FIGURE 29. Proportion of total forest area designated primarily for the protection of soil and water, by region, 1990–2020
%
Africa Asia Europe excl.Russian
Federation
Europe Northand Central
America
Oceania SouthAmerica
World
1990 2000 2010 2020
FIGURE 3. Forest area as a proportion (%) of total land area, 2000, 2010 and 2015–2020, by Sustainable Development Goal regional grouping
0
5
10
15
20
25
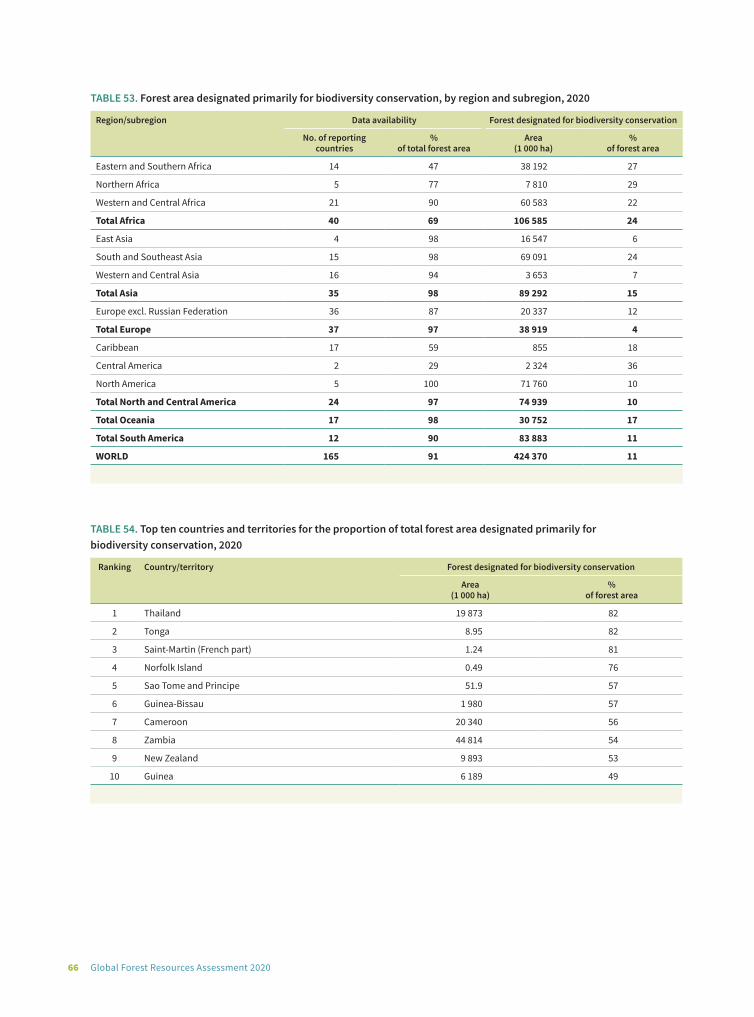
66 Global Forest Resources Assessment 2020
TABLE 53. Forest area designated primarily for biodiversity conservation, by region and subregion, 2020
Region/subregion Data availability Forest designated for biodiversity conservation
No. of reporting countries
% of total forest area
Area (1 000 ha)
% of forest area
Eastern and Southern Africa 14 47 38 192 27
Northern Africa 5 77 7 810 29
Western and Central Africa 21 90 60 583 22
Total Africa 40 69 106 585 24
East Asia 4 98 16 547 6
South and Southeast Asia 15 98 69 091 24
Western and Central Asia 16 94 3 653 7
Total Asia 35 98 89 292 15
Europe excl. Russian Federation 36 87 20 337 12
Total Europe 37 97 38 919 4
Caribbean 17 59 855 18
Central America 2 29 2 324 36
North America 5 100 71 760 10
Total North and Central America 24 97 74 939 10
Total Oceania 17 98 30 752 17
Total South America 12 90 83 883 11
WORLD 165 91 424 370 11
TABLE 54. Top ten countries and territories for the proportion of total forest area designated primarily for biodiversity conservation, 2020
Ranking Country/territory Forest designated for biodiversity conservation
Area (1 000 ha)
% of forest area
1 Thailand 19 873 82
2 Tonga 8.95 82
3 Saint-Martin (French part) 1.24 81
4 Norfolk Island 0.49 76
5 Sao Tome and Principe 51.9 57
6 Guinea-Bissau 1 980 57
7 Cameroon 20 340 56
8 Zambia 44 814 54
9 New Zealand 9 893 53
10 Guinea 6 189 49
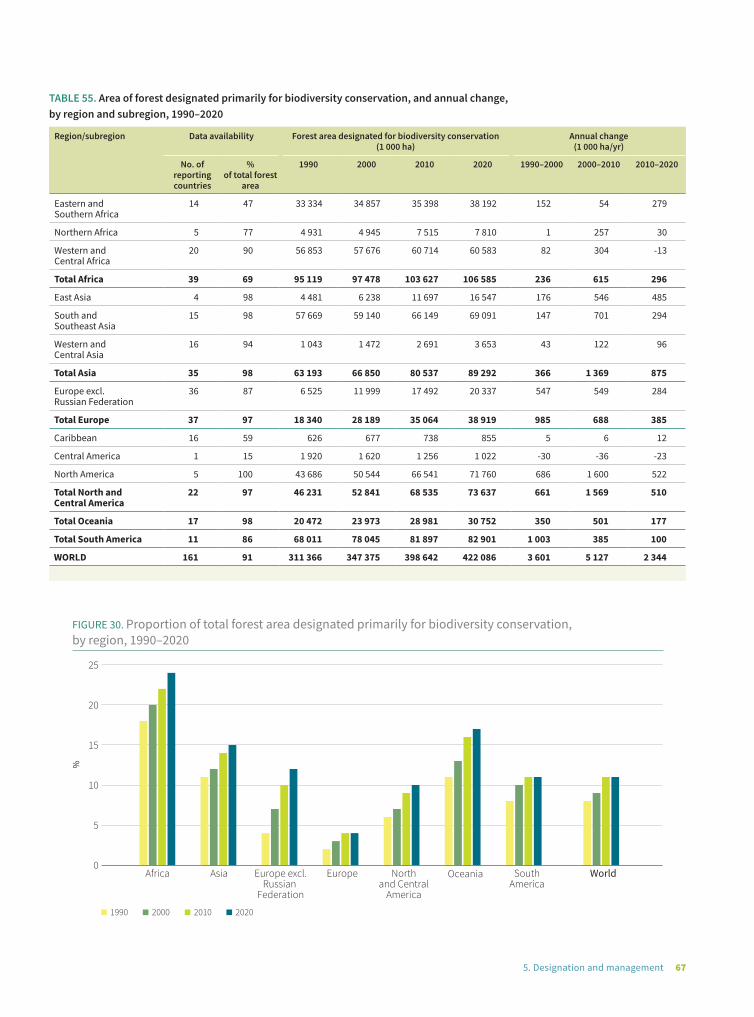
675. Designation and management
TABLE 55. Area of forest designated primarily for biodiversity conservation, and annual change, by region and subregion, 1990–2020
Region/subregion Data availability Forest area designated for biodiversity conservation (1 000 ha)
Annual change (1 000 ha/yr)
No. of reporting countries
% of total forest
area
1990 2000 2010 2020 1990–2000 2000–2010 2010–2020
Eastern and Southern Africa
14 47 33 334 34 857 35 398 38 192 152 54 279
Northern Africa 5 77 4 931 4 945 7 515 7 810 1 257 30
Western and Central Africa
20 90 56 853 57 676 60 714 60 583 82 304 -13
Total Africa 39 69 95 119 97 478 103 627 106 585 236 615 296
East Asia 4 98 4 481 6 238 11 697 16 547 176 546 485
South and Southeast Asia
15 98 57 669 59 140 66 149 69 091 147 701 294
Western and Central Asia
16 94 1 043 1 472 2 691 3 653 43 122 96
Total Asia 35 98 63 193 66 850 80 537 89 292 366 1 369 875
Europe excl. Russian Federation
36 87 6 525 11 999 17 492 20 337 547 549 284
Total Europe 37 97 18 340 28 189 35 064 38 919 985 688 385
Caribbean 16 59 626 677 738 855 5 6 12
Central America 1 15 1 920 1 620 1 256 1 022 -30 -36 -23
North America 5 100 43 686 50 544 66 541 71 760 686 1 600 522
Total North and Central America
22 97 46 231 52 841 68 535 73 637 661 1 569 510
Total Oceania 17 98 20 472 23 973 28 981 30 752 350 501 177
Total South America 11 86 68 011 78 045 81 897 82 901 1 003 385 100
WORLD 161 91 311 366 347 375 398 642 422 086 3 601 5 127 2 344
FIGURE 30. Proportion of total forest area designated primarily for biodiversity conservation, by region, 1990–2020
%
Africa Asia Europe excl.Russian
Federation
Europe Northand Central
America
Oceania SouthAmerica
World
1990 2000 2010 2020
FIGURE 3. Forest area as a proportion (%) of total land area, 2000, 2010 and 2015–2020, by Sustainable Development Goal regional grouping
0
5
10
15
20
25

68 Global Forest Resources Assessment 2020
South America has both the largest absolute area of forest designated primarily for social services, at 140 million ha, and the largest proportion of total forest area so designated, at 22 percent. This area is composed almost entirely of forests reported by Brazil for the protection of the culture and way of life of forest-dependent people, at 139 million ha (almost one-third of that country’s total forest area).
More than 10 percent of the total forest area is designated primarily for social services in ten countries and territories, led by Singapore at 78 percent, Brazil at 28 percent and the Republic of Moldova at 20 percent (Table 57). Seventy-eight countries and territories (of which eight have no forest) reported no area designated primarily for social services.
Trends. FRA 2020 received time-series data on the area of forest designated primarily for social services from 122 countries and territories representing 66 percent of the total forest area. The area so designated decreased by 6.06 million ha between 1990 and 2020, although there was a slight increase (of 186 000 ha per year) in the most recent decade (Table 58).
The area of forest designated primarily for social services declined in Europe and South America between 1990 and 2020 and increased slightly in the other regions.
TABLE 56. Forest area designated primarily for social services, by region and subregion, 2020
Region/subregion Data availability Forest designated for social services
No. of reporting countries
% of total forest area
Area (1 000 ha)
% of forest area
Eastern and Southern Africa 11 27 1 551 2
Northern Africa 4 25 165 2
Western and Central Africa 11 29 1 286 1
Total Africa 26 28 3 002 2
East Asia 4 98 3 591 1
South and Southeast Asia 14 98 203 n.s.
Western and Central Asia 13 65 1 864 5
Total Asia 31 95 5 658 1
Europe excl. Russian Federation 34 82 5 269 3
Total Europe 35 96 18 874 2
Caribbean 11 55 23 1
Central America 2 29 0 0
North America 5 100 18 001 2
Total North and Central America 18 97 18 024 2
Total Oceania 13 7 54 n.s.
Total South America 9 74 140 023 22
WORLD 132 77 185 634 6
Note: n.s. = not significant.
TABLE 57. Top ten countries for the proportion of total forest area designated primarily for social services, 2020
Ranking Country Forest designated primarily for social services
% of total forest area
% of forest area
1 Singapore 12.2 78
2 Brazil 139 394 28
3 Republic of Moldova 76 20
4 Ukraine 1 450 15
5 Belarus 1 290 15
6 Brunei Darussalam 50.8 13
7 Senegal 1 044 13
8 Iceland 6.67 13
9 Georgia 348 12
10 Poland 1 021 11

695. Designation and management
TABLE 58. Area of forest designated primarily for social services, and annual change, by region and subregion, 1990–2020
Region/subregion Data availability Forest area designated for social services(1 000 ha)
Annual change (1 000 ha/yr)
No. of reporting countries
% of total forest area
1990 2000 2010 2020 1990–2000 2000–2010 2010–2020
Eastern and Southern Africa
11 27 19 20 21 1551 n.s. n.s. 153
Northern Africa 4 25 3 2 165 165 n.s. 16 n.s.
Western and Central Africa
10 29 1 960 1 740 1 552 1286 -22 -19 -27
Total Africa 25 28 1 983 1 762 1 738 3002 -22 -2 126
East Asia 4 98 1 078 1 583 2 679 3591 51 110 91
South and Southeast Asia
12 91 175 188 200 200 1 1 n.s.
Western and Central Asia
13 64 2 399 1 737 1 784 1861 -66 5 8
Total Asia 29 92 3 652 3 509 4 663 5652 -14 115 99
Europe excl. Russian Federation
33 82 6 169 6 023 5 673 5 267 -15 -35 -41
Total Europe 34 96 23 545 17 356 18 041 18 872 -619 69 83
Caribbean 11 55 5 5 23 23 0 2 0
Central America 1 15 0 0 0 0 0 0 0
North America 3 48 14 643 14 694 14 682 14 700 5 -1 2
Total North and Central America
15 47 14 648 14 699 14 705 14 723 5 1 2
Total Oceania 11 5 0 0 0 0 0 0 0
Total South America 8 71 144 499 143 143 141 259 140 019 -136 -188 -124
WORLD 122 66 188 327 180 468 180 405 182 269 -786 -6 186
Note: n.s. = not significant.
Nevertheless, the proportion of the total forest area so designated increased in South America over the period (from 21 percent to 23 percent) and was relatively steady in the other regions (Figure 31).
OTHER MANAGEMENT OBJECTIVESStatus. FRA 2020 received information on the area of forest designated primarily for other purposes (most commonly forest managed primarily for scientific research or for military and defensive purposes) in 2020 from 122 countries and territories representing 72 percent of the world’s forest area. Worldwide, the area of forest so designated is estimated at 218 million ha (7 percent of the forest area of reporting countries) (Table 59).
Of the regions, the largest area of forest designated primarily for other purposes is in Europe, at 178 million ha (18 percent of the total forest area). This forest is almost entirely in the Russian Federation, where 175 million ha is designated primarily for other uses, including “remote
forests”, which are forests designated to remain untouched for 20 or more years.
Trends. FRA 2020 received time-series data on the area of forest designated primarily for other purposes from 112 countries and territories representing 68 percent of the total forest area. The area of forest so designated decreased by 112 million ha between 1990 and 2020, due mostly to Europe and especially the Russian Federation, where the area declined by 99.4 million ha over the period (Figure 32, p. 71).
FOREST IN PROTECTED AREAS Status. FRA 2020 received information on the area of forest in protected areas in 2020 from 173 countries and territories accounting for 97 percent of the global forest area. The total area of forest in legally protected areas is estimated at 726 million ha (18 percent of the total forest area in reporting countries and territories) (Table 60, p. 71).

70 Global Forest Resources Assessment 2020
FIGURE 31. Proportion of total forest area designated primarily for social services, by region, 1990–2020 %
Africa Asia Europe excl.Russian
Federation
Europe Northand Central
America
Oceania SouthAmerica
World
1990 2000 2010 2020
0
5
10
15
20
25
TABLE 59. Forest area designated primarily for other management objectives, by region and subregion, 2020
Region/subregion Data availability Forest designated for other management objectives
No. of reporting countries
% of total forest area
Area (1 000 ha)
% of forest area
Eastern and Southern Africa 9 21 0 0
Northern Africa 3 19 0 0
Western and Central Africa 10 27 0 0
Total Africa 22 24 0 0
East Asia 4 98 27 509 10
South and Southeast Asia 13 98 956 n.s.
Western and Central Asia 11 64 173 n.s.
Total Asia 28 95 28 638 5
Europe excl. Russian Federation 34 80 2 699 2
Total Europe 32 96 177 604 18
Caribbean 11 55 0 0
Central America 2 29 0 0
North America 3 48 945 n.s.
Total North and Central America 16 48 945 n.s.
Total Oceania 14 79 67 n.s.
Total South America 10 81 10 609 2
WORLD 122 72 217 864 7
Note: n.s. = not significant.

715. Designation and management
FIGURE 32. Proportion of total forest area designated primarily for other management objectives, by region, 1990–2020
%
Africa Asia Europe excl.Russian
Federation
Europe Northand Central
America
Oceania SouthAmerica
World
1990 2000 2010 2020
0
5
10
15
20
25
30
35
TABLE 60. Forest in protected areas, by region and subregion, 2020
Region/subregion Data availability Forest in protected areas
No. of reporting countries
% of total forest area
Area (1 000 ha)
% of forest area
Eastern and Southern Africa 19 91 91 251 34
Northern Africa 5 77 5 214 19
Western and Central Africa 24 98 61 365 21
Total Africa 48 94 157 829 27
East Asia 4 98 38 233 14
South and Southeast Asia 14 92 91 495 34
Western and Central Asia 13 87 14 469 30
Total Asia 31 94 144 197 25
Europe excl. Russian Federation 40 96 39 198 20
Total Europe 41 99 57 780 6
Caribbean 18 66 984 19
Central America 7 100 9 336 42
North America 5 100 69 267 10
Total North and Central America 30 100 79 587 11
Total Oceania 10 98 29 120 16
Total South America 13 98 257 293 31
WORLD 173 97 725 807 18
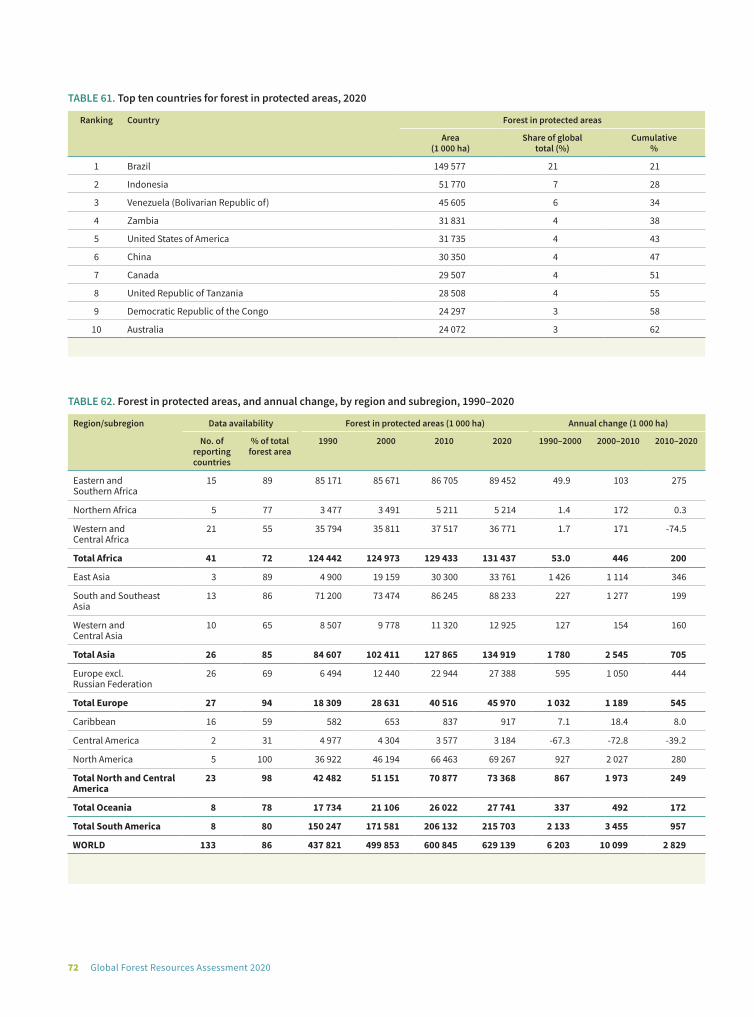
72 Global Forest Resources Assessment 2020
TABLE 61. Top ten countries for forest in protected areas, 2020
Ranking Country Forest in protected areas
Area (1 000 ha)
Share of global total (%)
Cumulative %
1 Brazil 149 577 21 21
2 Indonesia 51 770 7 28
3 Venezuela (Bolivarian Republic of) 45 605 6 34
4 Zambia 31 831 4 38
5 United States of America 31 735 4 43
6 China 30 350 4 47
7 Canada 29 507 4 51
8 United Republic of Tanzania 28 508 4 55
9 Democratic Republic of the Congo 24 297 3 58
10 Australia 24 072 3 62
TABLE 62. Forest in protected areas, and annual change, by region and subregion, 1990–2020
Region/subregion Data availability Forest in protected areas (1 000 ha) Annual change (1 000 ha)
No. of reporting countries
% of total forest area
1990 2000 2010 2020 1990–2000 2000–2010 2010–2020
Eastern and Southern Africa
15 89 85 171 85 671 86 705 89 452 49.9 103 275
Northern Africa 5 77 3 477 3 491 5 211 5 214 1.4 172 0.3
Western and Central Africa
21 55 35 794 35 811 37 517 36 771 1.7 171 -74.5
Total Africa 41 72 124 442 124 973 129 433 131 437 53.0 446 200
East Asia 3 89 4 900 19 159 30 300 33 761 1 426 1 114 346
South and Southeast Asia
13 86 71 200 73 474 86 245 88 233 227 1 277 199
Western and Central Asia
10 65 8 507 9 778 11 320 12 925 127 154 160
Total Asia 26 85 84 607 102 411 127 865 134 919 1 780 2 545 705
Europe excl. Russian Federation
26 69 6 494 12 440 22 944 27 388 595 1 050 444
Total Europe 27 94 18 309 28 631 40 516 45 970 1 032 1 189 545
Caribbean 16 59 582 653 837 917 7.1 18.4 8.0
Central America 2 31 4 977 4 304 3 577 3 184 -67.3 -72.8 -39.2
North America 5 100 36 922 46 194 66 463 69 267 927 2 027 280
Total North and Central America
23 98 42 482 51 151 70 877 73 368 867 1 973 249
Total Oceania 8 78 17 734 21 106 26 022 27 741 337 492 172
Total South America 8 80 150 247 171 581 206 132 215 703 2 133 3 455 957
WORLD 133 86 437 821 499 853 600 845 629 139 6 203 10 099 2 829
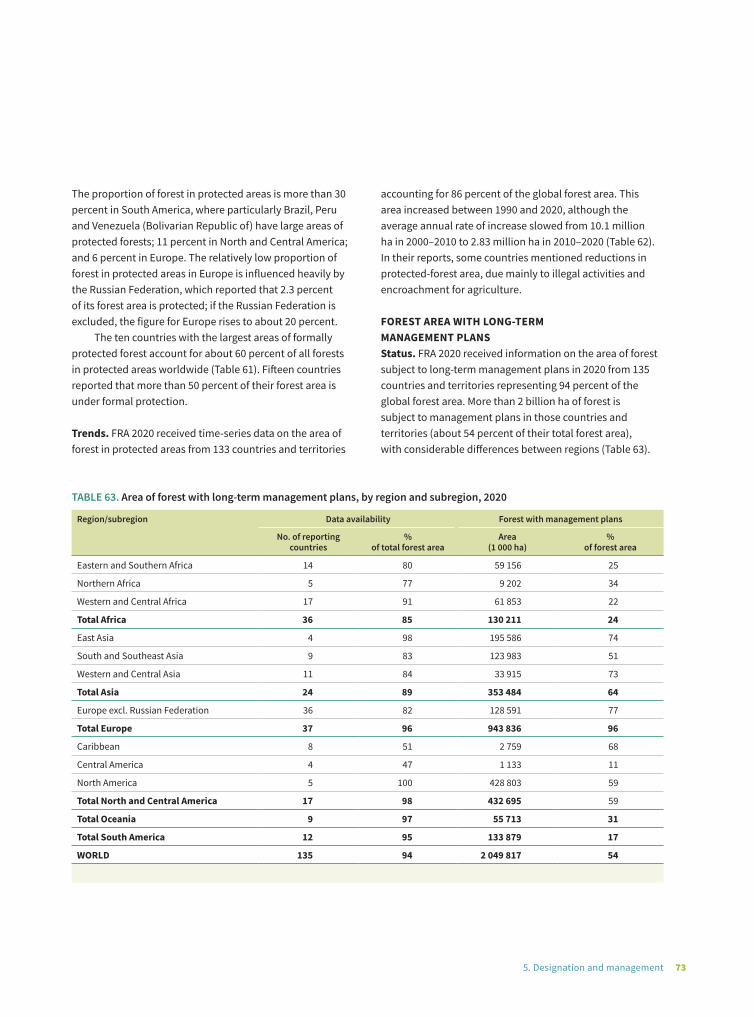
735. Designation and management
The proportion of forest in protected areas is more than 30 percent in South America, where particularly Brazil, Peru and Venezuela (Bolivarian Republic of) have large areas of protected forests; 11 percent in North and Central America; and 6 percent in Europe. The relatively low proportion of forest in protected areas in Europe is influenced heavily by the Russian Federation, which reported that 2.3 percent of its forest area is protected; if the Russian Federation is excluded, the figure for Europe rises to about 20 percent.
The ten countries with the largest areas of formally protected forest account for about 60 percent of all forests in protected areas worldwide (Table 61). Fifteen countries reported that more than 50 percent of their forest area is under formal protection.
Trends. FRA 2020 received time-series data on the area of forest in protected areas from 133 countries and territories
TABLE 63. Area of forest with long-term management plans, by region and subregion, 2020
Region/subregion Data availability Forest with management plans
No. of reporting countries
% of total forest area
Area (1 000 ha)
% of forest area
Eastern and Southern Africa 14 80 59 156 25
Northern Africa 5 77 9 202 34
Western and Central Africa 17 91 61 853 22
Total Africa 36 85 130 211 24
East Asia 4 98 195 586 74
South and Southeast Asia 9 83 123 983 51
Western and Central Asia 11 84 33 915 73
Total Asia 24 89 353 484 64
Europe excl. Russian Federation 36 82 128 591 77
Total Europe 37 96 943 836 96
Caribbean 8 51 2 759 68
Central America 4 47 1 133 11
North America 5 100 428 803 59
Total North and Central America 17 98 432 695 59
Total Oceania 9 97 55 713 31
Total South America 12 95 133 879 17
WORLD 135 94 2 049 817 54
accounting for 86 percent of the global forest area. This area increased between 1990 and 2020, although the average annual rate of increase slowed from 10.1 million ha in 2000–2010 to 2.83 million ha in 2010–2020 (Table 62). In their reports, some countries mentioned reductions in protected-forest area, due mainly to illegal activities and encroachment for agriculture.
FOREST AREA WITH LONG-TERM MANAGEMENT PLANSStatus. FRA 2020 received information on the area of forest subject to long-term management plans in 2020 from 135 countries and territories representing 94 percent of the global forest area. More than 2 billion ha of forest is subject to management plans in those countries and territories (about 54 percent of their total forest area), with considerable differences between regions (Table 63).
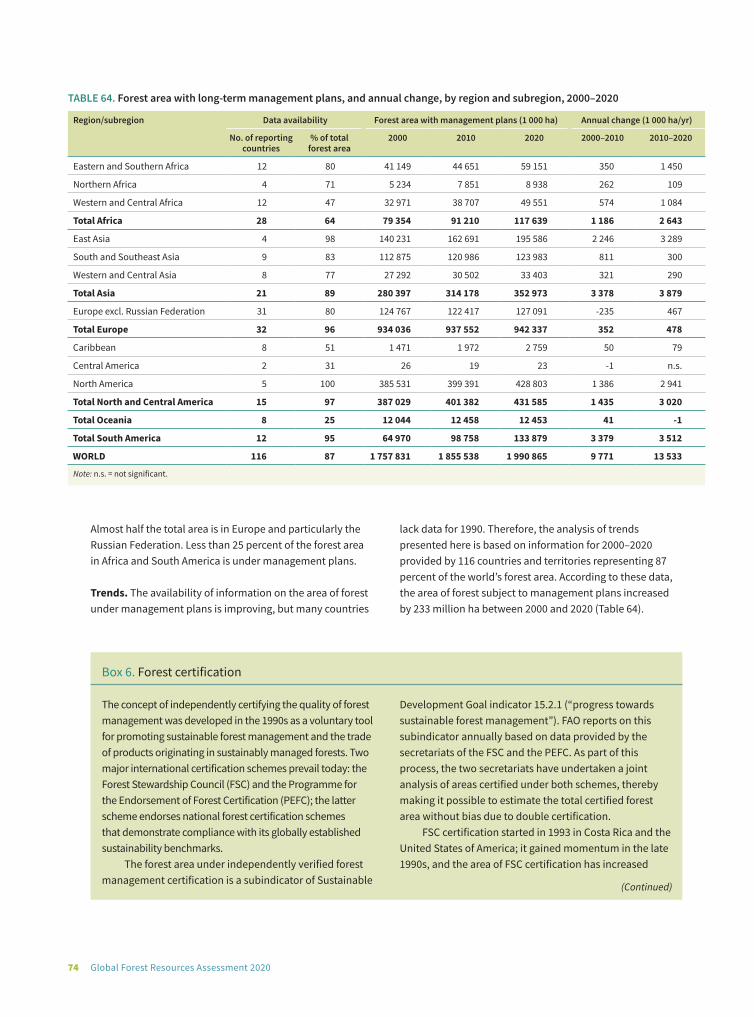
74 Global Forest Resources Assessment 2020
TABLE 64. Forest area with long-term management plans, and annual change, by region and subregion, 2000–2020
Region/subregion Data availability Forest area with management plans (1 000 ha) Annual change (1 000 ha/yr)
No. of reporting countries
% of total forest area
2000 2010 2020 2000–2010 2010–2020
Eastern and Southern Africa 12 80 41 149 44 651 59 151 350 1 450
Northern Africa 4 71 5 234 7 851 8 938 262 109
Western and Central Africa 12 47 32 971 38 707 49 551 574 1 084
Total Africa 28 64 79 354 91 210 117 639 1 186 2 643
East Asia 4 98 140 231 162 691 195 586 2 246 3 289
South and Southeast Asia 9 83 112 875 120 986 123 983 811 300
Western and Central Asia 8 77 27 292 30 502 33 403 321 290
Total Asia 21 89 280 397 314 178 352 973 3 378 3 879
Europe excl. Russian Federation 31 80 124 767 122 417 127 091 -235 467
Total Europe 32 96 934 036 937 552 942 337 352 478
Caribbean 8 51 1 471 1 972 2 759 50 79
Central America 2 31 26 19 23 -1 n.s.
North America 5 100 385 531 399 391 428 803 1 386 2 941
Total North and Central America 15 97 387 029 401 382 431 585 1 435 3 020
Total Oceania 8 25 12 044 12 458 12 453 41 -1
Total South America 12 95 64 970 98 758 133 879 3 379 3 512
WORLD 116 87 1 757 831 1 855 538 1 990 865 9 771 13 533
Note: n.s. = not significant.
Almost half the total area is in Europe and particularly the Russian Federation. Less than 25 percent of the forest area in Africa and South America is under management plans.
Trends. The availability of information on the area of forest under management plans is improving, but many countries
lack data for 1990. Therefore, the analysis of trends presented here is based on information for 2000–2020 provided by 116 countries and territories representing 87 percent of the world’s forest area. According to these data, the area of forest subject to management plans increased by 233 million ha between 2000 and 2020 (Table 64).
Box 6. Forest certification
The concept of independently certifying the quality of forest management was developed in the 1990s as a voluntary tool for promoting sustainable forest management and the trade of products originating in sustainably managed forests. Two major international certification schemes prevail today: the Forest Stewardship Council (FSC) and the Programme for the Endorsement of Forest Certification (PEFC); the latter scheme endorses national forest certification schemes that demonstrate compliance with its globally established sustainability benchmarks.
The forest area under independently verified forest management certification is a subindicator of Sustainable
Development Goal indicator 15.2.1 (“progress towards sustainable forest management”). FAO reports on this subindicator annually based on data provided by the secretariats of the FSC and the PEFC. As part of this process, the two secretariats have undertaken a joint analysis of areas certified under both schemes, thereby making it possible to estimate the total certified forest area without bias due to double certification.
FSC certification started in 1993 in Costa Rica and the United States of America; it gained momentum in the late 1990s, and the area of FSC certification has increased
(Continued)

755. Designation and management
steadily since. The first PEFC certification occurred in Austria, Finland, Germany, Norway and Sweden in 2000, increased slowly in Europe for a few years, and almost quadrupled in 2005 with the endorsement of two North American certification schemes (those of the Sustainable Forestry Initiative and the Canadian Standards Association) (Figure 33).
A total of 200 million ha of forest was certified under the FSC in 2019 and 319 million ha was certified under the PEFC. Of these areas, 93 million ha was certified under both systems; thus, the total net certified forest area in 2019 was 426 million ha. Figure 34 shows that the majority of the certified area was in Europe and North America. Canada had by far the most, at 167 million ha, followed by the Russian Federation (54.1 million ha) and the United States of America (38.1 million ha). These three countries together accounted for more than 60 percent of the world’s certified forest area in 2019.
Box 6. (Continued)
o
Figure 33. Forest area certified under the Forest Stewardship Council and the Programme for the Endorsement of Forest Certification, 1990–2019
Mill
ion
ha1990 1995 2000 2005 2010 2015 2020
FSC PEFC
0
50
100
150
200
250
300
350
Note: FSC = Forest Stewardship Council; PEFC = Programme for the Endorsement of Forest Certification.
Figure 34. Total area of certified forest after adjustment for double certification, by region, 2000–2019
20052000 2010 2019
0 10050 200150 250 300 350 400Million ha
450
Africa
Asia
Europe
North andCentral America
Oceania
South America
World

@ F
AO /
NCo
gnom
e

@ F
AO /
NCo
gnom
e
6 Ownership
and management rights
©Fl
ickr
/Mar
tin

796. Ownership and management rights
nformation on the ownership of, and management rights to, forests is crucial for governments in formulating effective forest policies. Clear and secure forest ownership
and management rights are important for encouraging public and private investment in forests and for alleviating the poverty of people who depend directly or indirectly on forests for their livelihoods.
FRA 2020 collected information on ownership and management rights for 1990, 2000, 2010 and 2015; 2015, therefore, is the reference year for status analysis.
Three main forest ownership categories were assessed: 1) public ownership; 2) private ownership; and 3) unknown/other.
Three subcategories were specified for private ownership: 1) forest owned by individuals; 2) forest owned by business entities or institutions; and 3) forest owned by local, tribal or indigenous communities.
FRA 2020 also collected information on who holds management rights in public forests, defined as the right to manage and use publicly owned forests for a specified period. Five main categories of management rights holders were identified: 1) public administrations; 2) individuals; 3) private business entities and institutions; 4) local, tribal and indigenous communities; and 5) unknown/other.
Forest ownership
STATUSFRA 2020 received information on forest ownership in 2015 for the main categories (i.e. public, private and unknown/other) from 180 countries and territories representing 97 percent of the world’s forests. Figure 35 shows the proportion of the total forest area in these three categories in 2015.
Public ownership was predominant in 2015 in all regions and subregions except Central America, where private ownership accounted for 51 percent of the forest area (Table 65). The largest share of public ownership was in Europe, where it accounted for 90 percent – although if
the Russian Federation is excluded, the share decreases to 46 percent.
The largest share of public ownership at the subregional level was in Western and Central Asia, at 99 percent. The regions with the largest shares of privately owned forests were Oceania, at 47 percent, and North and Central America, at 36 percent.
In Europe, private forest accounted for 9 percent of the forest area; if the Russian Federation is excluded, the share increases to 52 percent.
Seventy-three countries reported that more than 90 percent of their forests was publicly owned in 2015. The share was 100 percent in 48 of those countries, of which 23 were in Asia (mostly Western and Central Asia) and 16 were in Africa (mostly Western and Central Africa).
Public ownership was below 10 percent in 15 countries; five countries and territories, all in Oceania, reported that 100 percent of their forest area was owned privately (and therefore no forest was publicly owned). Table 66 shows the top ten countries and territories for the proportion of forest area under private ownership in 2015.
I
FIGURE 35. Proportion of total forest area, by three ownership categories, 2015
Unknown/other4%
Public73%
Private22%
Note: “Other” applies mainly to forest areas with disputed ownership or with ownership in transition, and to forest areas in which there are discrepancies between national forest inventory datasets and public registers.
Unknown/other4%
Public73%
Private22%
Note: “Other” applies mainly to forest areas with disputed ownership or with ownership in transition, and to forest areas in which there are discrepancies between national forest inventory datasets and public registers.

80 Global Forest Resources Assessment 2020
TRENDSFRA 2020 received information on trends in forest ownership from 166 countries and territories representing 95 percent of the world’s forest.
The area of forest under public ownership decreased by 116 million ha between 1990 and 2015 and the area of privately owned forest increased by 29 million ha (Table 67). The proportion of the total forest area that is privately owned increased from 21 percent to 22 percent over the period, and the share of publicly owned forests decreased from 74 percent to 73 percent.
Asia had the highest gain in the area of private forest between 1990 and 2015, at about 69 million ha. This mainly reflects the trend in East Asia, where China reported an increase of just over 53 million ha of private forest since 1990. The share of private forest increased in China from 17 percent in 1990 to 41 percent in 2015.
The biggest decrease in the area of privately owned forest between 1990 and 2015 was in South America, where it declined by about 53 million ha, due mainly to a reduction of 85 million ha in Brazil. The proportion of privately owned forest in Brazil decreased from 47 percent of the total forest area in 1990 to 44 percent in 2015.
TABLE 66. Top ten countries and territories for the proportion of privately owned forest, 2015
Ranking Country/territory Forest under private ownership
Area (1 000 ha)
% of total forest area
1 American Samoa 17 100
2 Marshall Islands 9 100
3 Niue 19 100
4 Papua New Guinea 35 974 100
5 Vanuatu 442 100
6 Uruguay 1 906 99
7 Portugal 3 215 97
8 Yemen 522 95
9 El Salvador 548 90
10 Samoa 148 90
TABLE 65. Forest ownership, by region and subregion, 2015
Region/subregion Data availability Forest area (1 000 ha) % of forest area
No. of reporting countries
% of total forest area
Private Public Unknown/other
Private Public Unknown/other
Eastern and Southern Africa 17 92 22 634 161 327 98 017 8 57 35
Northern Africa 5 77 7 492 20 328 66 27 73 n.s.
Western and Central Africa 21 96 5 881 281 155 16 229 2 93 5
Total Africa 43 93 36 007 462 810 114 312 6 75 19
East Asia 5 100 105 815 156 074 0 40 60 0
South and Southeast Asia 17 100 26 688 264 512 7 883 9 88 3
Western and Central Asia 21 99 760 52 675 0 1 99 0
Total Asia 43 100 133 263 473 262 7 883 22 77 1
Europe excl. Russian Federation 41 87 92 056 80 519 2 943 52 46 2
Total Europe 42 97 92 056 895 449 2 943 9 90 n.s.
Caribbean 14 72 996 4 535 81 18 81 1
Central America 3 32 3 668 2 675 802 51 37 11
North America 5 100 261 163 449 605 12 775 36 62 2
Total North and Central America 22 98 265 827 456 815 13 658 36 62 2
Total Oceania 17 100 86 986 96 241 1 051 47 52 1
Total South America 13 98 273 581 527 702 37 806 33 63 5
WORLD 180 97 887 721 2 912 280 177 653 22 73 4
Note: n.s. = not significant.

816. Ownership and management rights
TABLE 67. Forest ownership, by region and subregion, 1990–2015
Region/subregion Data availability Forest ownership (1 000 ha)
No. of reporting countries
% of total forest area
Private Public Unknown/other
1990 2015 1990 2015 1990 2015
Eastern and Southern Africa 16 92 25 860 22 630 180 525 161 318 112 076 98 016
Northern Africa 5 77 7 153 7 492 24 629 20 328 61 66
Western and Central Africa 21 96 13 017 5 881 320 427 281 155 9 304 16 229
Total Africa 42 93 46 029 36 002 525 580 462 801 121 441 114 312
East Asia 5 100 46 809 105 815 163 098 156 074 0 0
South and Southeast Asia 15 96 16 474 26 029 279 164 255 277 19 251 7 883
Western and Central Asia 20 98 598 631 47 627 52 639 0 0
Total Asia 40 98 63 882 132 475 489 889 463 991 19 250 7 883
Europe excl. Russian Federation 39 87 74 443 91 614 84 961 80 045 2 214 2 943
Total Europe 40 97 74 443 91 614 893 911 894 976 2 214 2 943
Caribbean 14 72 752 996 3 404 4 535 137 81
Central America 1 16 2 244 1 717 1 741 1 351 796 518
North America 5 100 261 085 261 163 444 909 449 605 15 323 12 775
Total North and Central America 20 97 264 081 263 876 450 054 455 491 16 257 13 373
Total Oceania 13 98 77 539 84 340 102 707 95 351 1 022 1 043
Total South America 11 87 301 571 248 280 488 356 462 213 66 499 37 806
WORLD 166 95 827 546 856 588 2 950 498 2 834 823 226 683 177 359
FIGURE 36. Proportion of total forest area, by ownership type and region, 1990–2015FIGURE xx. rest area as a proportion (%) of total land area, Development Goal regional grouping
%
100
90
80
70
60
50
40
30
20
10
0
PrivatePublic Unknown/other
Africa
1990
2000
2010
2015
1990
2000
2010
2015
1990
2000
2010
2015
1990
2000
2010
2015
1990
2000
2010
2015
1990
2000
2010
2015
1990
2000
2010
2015
Asia Europe North andCentral America
Oceania South America World
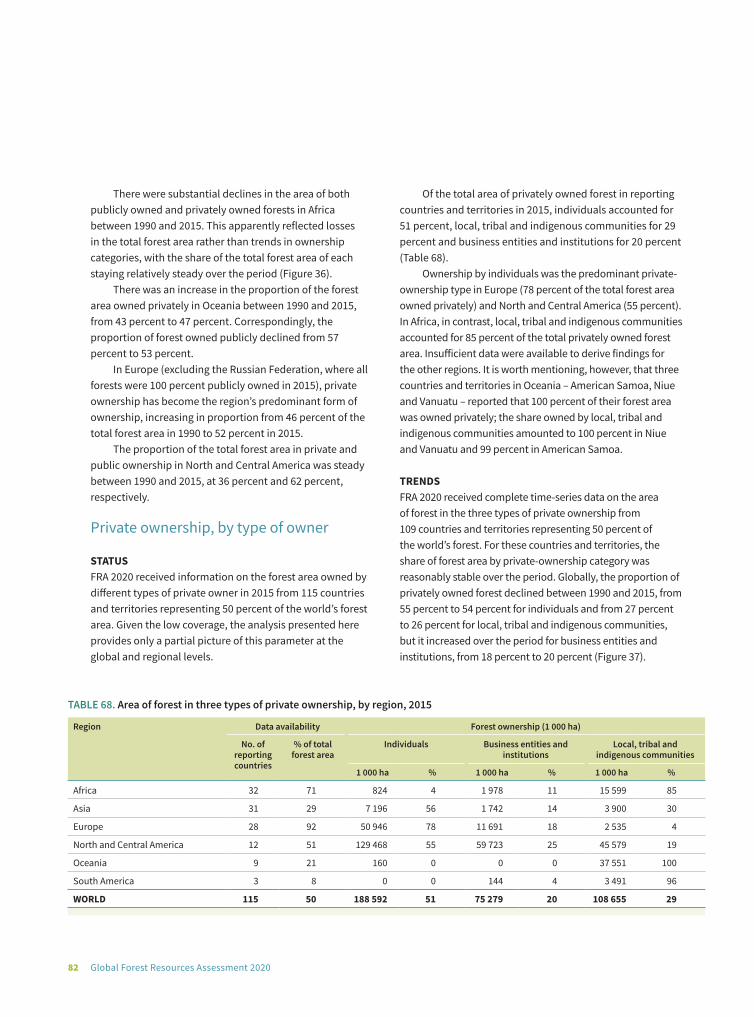
82 Global Forest Resources Assessment 2020
There were substantial declines in the area of both publicly owned and privately owned forests in Africa between 1990 and 2015. This apparently reflected losses in the total forest area rather than trends in ownership categories, with the share of the total forest area of each staying relatively steady over the period (Figure 36).
There was an increase in the proportion of the forest area owned privately in Oceania between 1990 and 2015, from 43 percent to 47 percent. Correspondingly, the proportion of forest owned publicly declined from 57 percent to 53 percent.
In Europe (excluding the Russian Federation, where all forests were 100 percent publicly owned in 2015), private ownership has become the region’s predominant form of ownership, increasing in proportion from 46 percent of the total forest area in 1990 to 52 percent in 2015.
The proportion of the total forest area in private and public ownership in North and Central America was steady between 1990 and 2015, at 36 percent and 62 percent, respectively.
Private ownership, by type of owner
STATUSFRA 2020 received information on the forest area owned by different types of private owner in 2015 from 115 countries and territories representing 50 percent of the world’s forest area. Given the low coverage, the analysis presented here provides only a partial picture of this parameter at the global and regional levels.
Of the total area of privately owned forest in reporting countries and territories in 2015, individuals accounted for 51 percent, local, tribal and indigenous communities for 29 percent and business entities and institutions for 20 percent (Table 68).
Ownership by individuals was the predominant private-ownership type in Europe (78 percent of the total forest area owned privately) and North and Central America (55 percent). In Africa, in contrast, local, tribal and indigenous communities accounted for 85 percent of the total privately owned forest area. Insufficient data were available to derive findings for the other regions. It is worth mentioning, however, that three countries and territories in Oceania – American Samoa, Niue and Vanuatu – reported that 100 percent of their forest area was owned privately; the share owned by local, tribal and indigenous communities amounted to 100 percent in Niue and Vanuatu and 99 percent in American Samoa.
TRENDSFRA 2020 received complete time-series data on the area of forest in the three types of private ownership from 109 countries and territories representing 50 percent of the world’s forest. For these countries and territories, the share of forest area by private-ownership category was reasonably stable over the period. Globally, the proportion of privately owned forest declined between 1990 and 2015, from 55 percent to 54 percent for individuals and from 27 percent to 26 percent for local, tribal and indigenous communities, but it increased over the period for business entities and institutions, from 18 percent to 20 percent (Figure 37).
TABLE 68. Area of forest in three types of private ownership, by region, 2015
Region Data availability Forest ownership (1 000 ha)
No. of reporting countries
% of total forest area
Individuals Business entities and institutions
Local, tribal and indigenous communities
1 000 ha % 1 000 ha % 1 000 ha %
Africa 32 71 824 4 1 978 11 15 599 85
Asia 31 29 7 196 56 1 742 14 3 900 30
Europe 28 92 50 946 78 11 691 18 2 535 4
North and Central America 12 51 129 468 55 59 723 25 45 579 19
Oceania 9 21 160 0 0 0 37 551 100
South America 3 8 0 0 144 4 3 491 96
WORLD 115 50 188 592 51 75 279 20 108 655 29
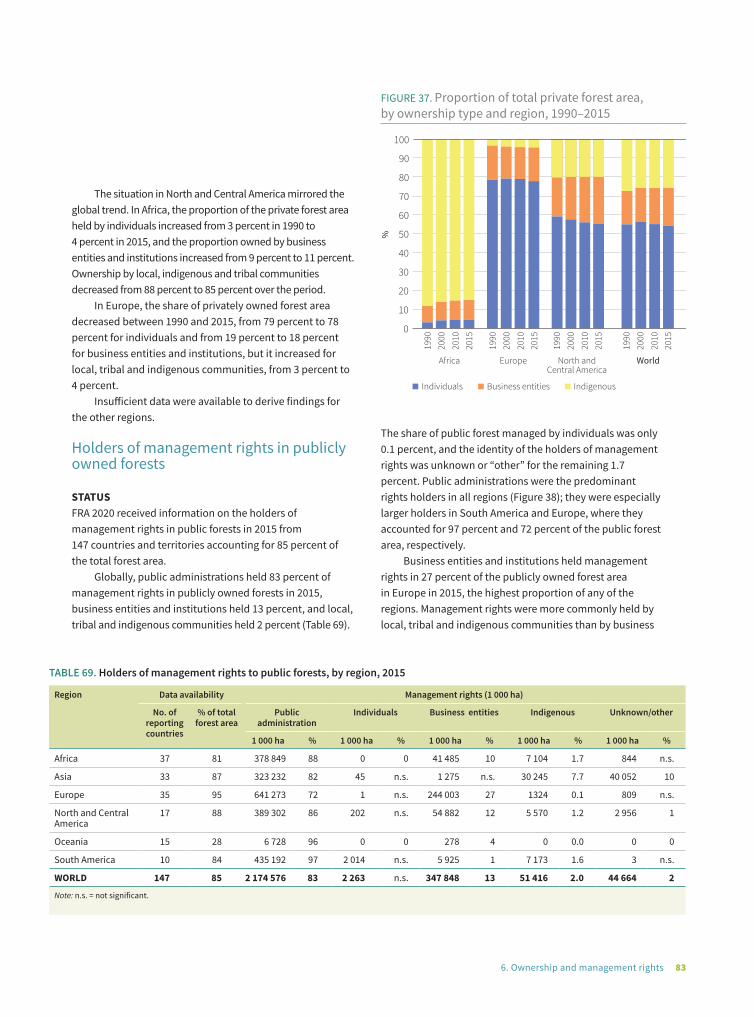
836. Ownership and management rights
The situation in North and Central America mirrored the global trend. In Africa, the proportion of the private forest area held by individuals increased from 3 percent in 1990 to 4 percent in 2015, and the proportion owned by business entities and institutions increased from 9 percent to 11 percent. Ownership by local, indigenous and tribal communities decreased from 88 percent to 85 percent over the period.
In Europe, the share of privately owned forest area decreased between 1990 and 2015, from 79 percent to 78 percent for individuals and from 19 percent to 18 percent for business entities and institutions, but it increased for local, tribal and indigenous communities, from 3 percent to 4 percent.
Insufficient data were available to derive findings for the other regions.
Holders of management rights in publicly owned forests
STATUSFRA 2020 received information on the holders of management rights in public forests in 2015 from 147 countries and territories accounting for 85 percent of the total forest area.
Globally, public administrations held 83 percent of management rights in publicly owned forests in 2015, business entities and institutions held 13 percent, and local, tribal and indigenous communities held 2 percent (Table 69).
TABLE 69. Holders of management rights to public forests, by region, 2015
Region Data availability Management rights (1 000 ha)
No. of reporting countries
% of total forest area
Public administration
Individuals Business entities Indigenous Unknown/other
1 000 ha % 1 000 ha % 1 000 ha % 1 000 ha % 1 000 ha %
Africa 37 81 378 849 88 0 0 41 485 10 7 104 1.7 844 n.s.
Asia 33 87 323 232 82 45 n.s. 1 275 n.s. 30 245 7.7 40 052 10
Europe 35 95 641 273 72 1 n.s. 244 003 27 1324 0.1 809 n.s.
North and Central America
17 88 389 302 86 202 n.s. 54 882 12 5 570 1.2 2 956 1
Oceania 15 28 6 728 96 0 0 278 4 0 0.0 0 0
South America 10 84 435 192 97 2 014 n.s. 5 925 1 7 173 1.6 3 n.s.
WORLD 147 85 2 174 576 83 2 263 n.s. 347 848 13 51 416 2.0 44 664 2
Note: n.s. = not significant.
FIGURE 37. Proportion of total private forest area, by ownership type and region, 1990–2015FIGURE xx. rest area as a proportion (%) of total land area, Development Goal regional grouping
%
100
90
80
70
60
50
40
30
20
10
0
Individuals Business entities Indigenous
Africa
1990
2000
2010
2015
1990
2000
2010
2015
1990
2000
2010
2015
1990
2000
2010
2015
Europe North andCentral America
World
The share of public forest managed by individuals was only 0.1 percent, and the identity of the holders of management rights was unknown or “other” for the remaining 1.7 percent. Public administrations were the predominant rights holders in all regions (Figure 38); they were especially larger holders in South America and Europe, where they accounted for 97 percent and 72 percent of the public forest area, respectively.
Business entities and institutions held management rights in 27 percent of the publicly owned forest area in Europe in 2015, the highest proportion of any of the regions. Management rights were more commonly held by local, tribal and indigenous communities than by business
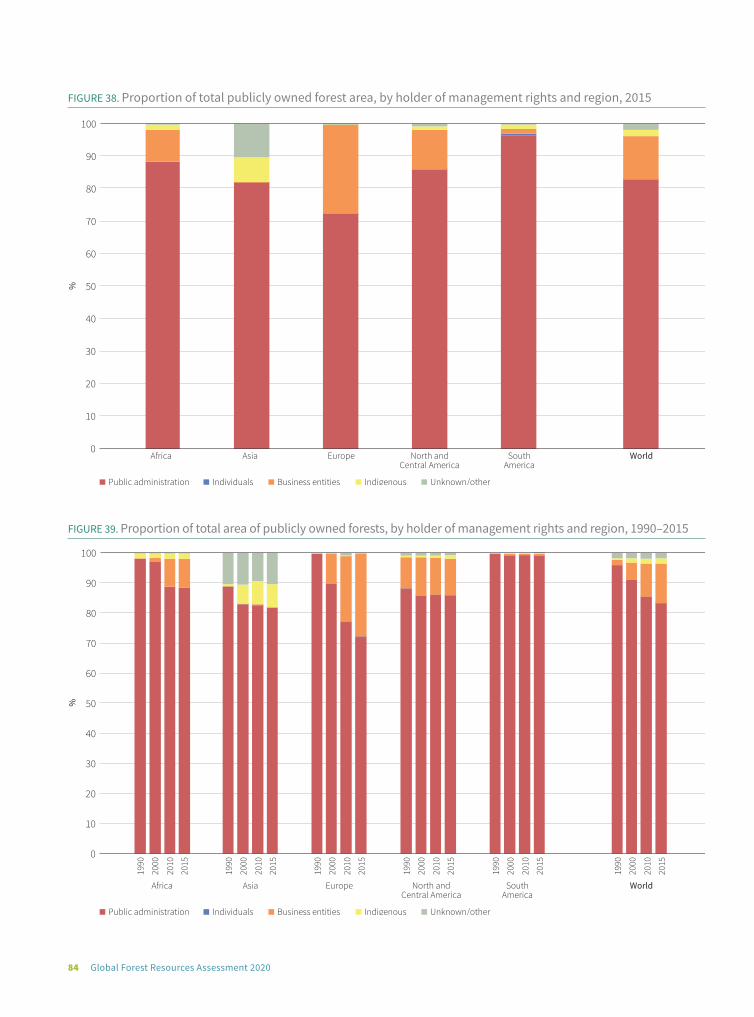
84 Global Forest Resources Assessment 2020
FIGURE 38. Proportion of total publicly owned forest area, by holder of management rights and region, 2015
%
100
90
80
70
60
50
40
30
20
10
0Africa Asia Europe North and
Central AmericaSouth
AmericaWorld
Public administration Individuals Business entities Indigenous Unknown/other
FIGURE 39. Proportion of total area of publicly owned forests, by holder of management rights and region, 1990–2015
%
100
90
80
70
60
50
40
30
20
10
0
Africa Asia Europe North andCentral America
SouthAmerica
World
Public administration Individuals Business entities Indigenous Unknown/other
1990
2000
2010
2015
1990
2000
2010
2015
1990
2000
2010
2015
1990
2000
2010
2015
1990
2000
2010
2015
1990
2000
2010
2015
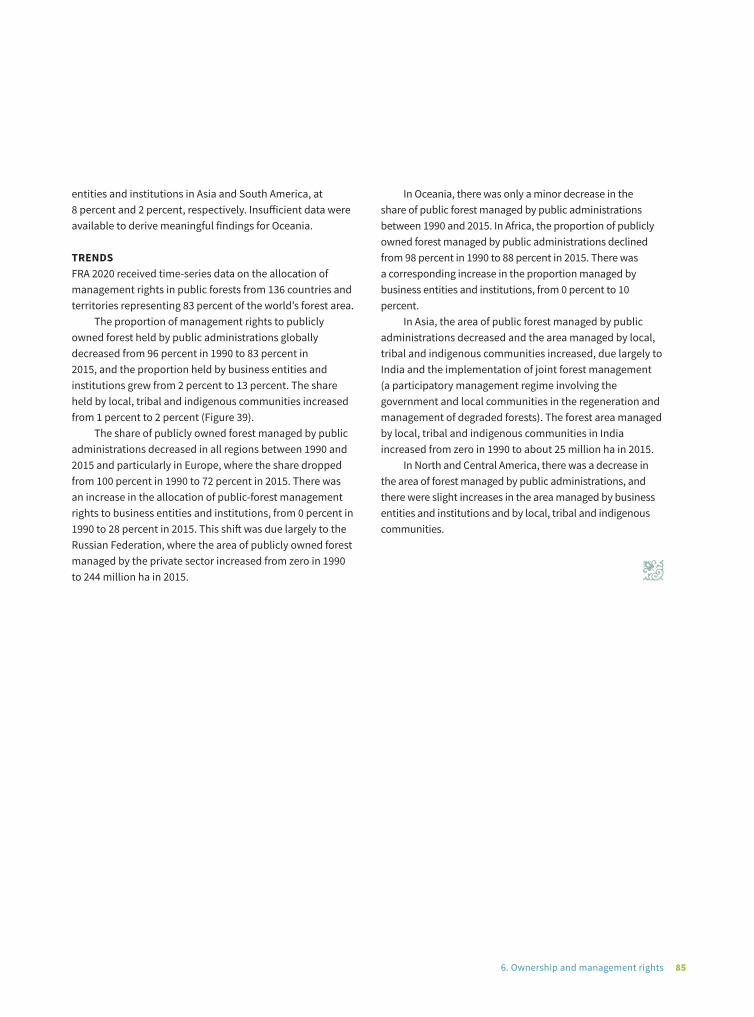
856. Ownership and management rights
entities and institutions in Asia and South America, at 8 percent and 2 percent, respectively. Insufficient data were available to derive meaningful findings for Oceania.
TRENDSFRA 2020 received time-series data on the allocation of management rights in public forests from 136 countries and territories representing 83 percent of the world’s forest area.
The proportion of management rights to publicly owned forest held by public administrations globally decreased from 96 percent in 1990 to 83 percent in 2015, and the proportion held by business entities and institutions grew from 2 percent to 13 percent. The share held by local, tribal and indigenous communities increased from 1 percent to 2 percent (Figure 39).
The share of publicly owned forest managed by public administrations decreased in all regions between 1990 and 2015 and particularly in Europe, where the share dropped from 100 percent in 1990 to 72 percent in 2015. There was an increase in the allocation of public-forest management rights to business entities and institutions, from 0 percent in 1990 to 28 percent in 2015. This shift was due largely to the Russian Federation, where the area of publicly owned forest managed by the private sector increased from zero in 1990 to 244 million ha in 2015.
In Oceania, there was only a minor decrease in the share of public forest managed by public administrations between 1990 and 2015. In Africa, the proportion of publicly owned forest managed by public administrations declined from 98 percent in 1990 to 88 percent in 2015. There was a corresponding increase in the proportion managed by business entities and institutions, from 0 percent to 10 percent.
In Asia, the area of public forest managed by public administrations decreased and the area managed by local, tribal and indigenous communities increased, due largely to India and the implementation of joint forest management (a participatory management regime involving the government and local communities in the regeneration and management of degraded forests). The forest area managed by local, tribal and indigenous communities in India increased from zero in 1990 to about 25 million ha in 2015.
In North and Central America, there was a decrease in the area of forest managed by public administrations, and there were slight increases in the area managed by business entities and institutions and by local, tribal and indigenous communities.
n


@ F
AO /
NCo
gnom
e
7Disturbances
©FA
O/G
iulio
Nap
olita
no

897. Disturbances
orests are subject to many disturbances that can adversely affect their health and vitality, reduce their capacity to provide a full range of goods and services, and cause tree mortality.
For FRA 2020, countries were requested to report on the forest area affected annually by disturbances, defined as any biotic or abiotic factor adversely affecting the vigour and productivity of the forest that is not a direct result of human activities. Specifically, countries were asked to report on the area of forest affected by insects, disease (caused by bacteria, fungi, phytoplasma or viruses) and severe weather events (e.g. snow, storms or drought) in the period 2000–2017. Reporting on the various categories of disturbances was exclusive and required that only the additional area of forest affected in a given year was reported (and not the cumulative total).20
The baseline for reporting status was 2015, for which most data were available. The periods used for the analysis
20 The findings on fire presented in this box are based mainly on the Global Wildfire Information System (Artes et al., 2019) prepared by the Joint Research Centre of the European Commission, the Moderate-Resolution Imaging Spectroradiometer (MODIS) Collection 6 burned-area product (Giglio et al., 2018) and the Global Forest Change product (Hansen et al., 2013). Data on fire from FRA country reports, which were insufficient to produce global statistics, were used to estimate the proportion of burned area by ecological domain and compared with some of the results obtained from the aforementioned remote sensing products.
of trends varied depending on the availability of data for the given disturbance category. Overall, however, relatively few data were available for this parameter and it was not possible, therefore, to accurately estimate the total forest area affected by disturbances globally (e.g. some countries that reported on one category of disturbance did not necessarily report on others). Moreover, although it may be easiest to report on this parameter on an annual basis, this approach has the disadvantage of not fully reflecting the magnitude of an outbreak (in the case of pests and diseases). For future FRAs, therefore, further discussion is warranted on how best to obtain and analyse data and whether more information is needed to properly assess this parameter.
In addition to the disturbances listed above, FRA 2020 includes analyses of forest fire (Box 7) and forest degradation (Box 8, p. 95).
F
Box 7. Fire
Humans have used fire as a management tool for millennia, for example to improve hunting conditions, favour plants used for food or fibre, clear vegetation for agriculture and grazing, facilitate travel and control pests. Fires contribute to the maintenance of some ecosystems, such as savannas, and less-frequent fires in temperate and boreal ecosystems help create habitat mosaics of various ages and stages of regeneration. More or less fire in an ecosystem may change the species mix, habitat structure and biodiversity.20
Nearly all disastrous wildfires are associated with extreme fire-danger conditions driven by meteorological factors such
as a lack of precipitation, high wind speeds, low humidity and high temperatures.
Wildfires continue to have significant impacts globally, causing the loss of, among other things, human life, built assets, biodiversity, habitat, production and productivity; the degradation of landscapes; and the disruption of livelihoods. Recent damaging fire events associated with heat waves and droughts include those in the Amazon (where weather conditions hastened fire spread) and the Arctic in 2019; Australia in 2009 and 2019/20; Canada in 2016; Chile in 2017;
(Continued)
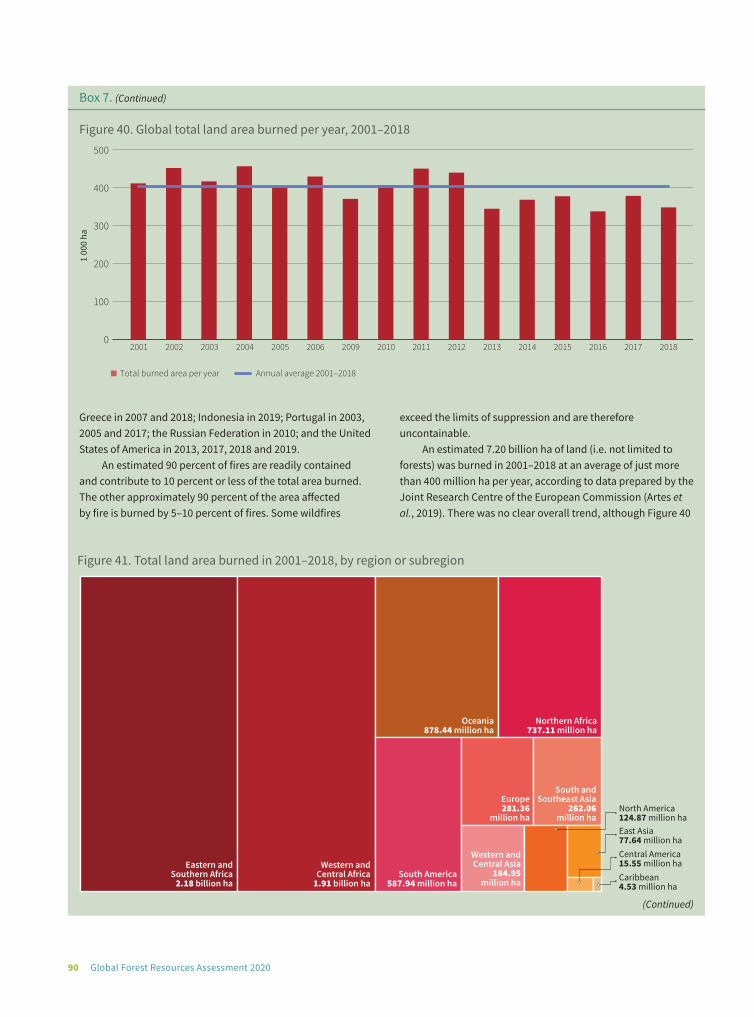
90 Global Forest Resources Assessment 2020
Greece in 2007 and 2018; Indonesia in 2019; Portugal in 2003, 2005 and 2017; the Russian Federation in 2010; and the United States of America in 2013, 2017, 2018 and 2019.
An estimated 90 percent of fires are readily contained and contribute to 10 percent or less of the total area burned. The other approximately 90 percent of the area affected by fire is burned by 5–10 percent of fires. Some wildfires
exceed the limits of suppression and are therefore uncontainable.
An estimated 7.20 billion ha of land (i.e. not limited to forests) was burned in 2001–2018 at an average of just more than 400 million ha per year, according to data prepared by the Joint Research Centre of the European Commission (Artes et al., 2019). There was no clear overall trend, although Figure 40
Box 7. (Continued)
Figure 40. Global total land area burned per year, 2001–2018
0
100
200
300
400
500
2001 2002 2003 2004 2005 2006 2009 2010 2011 2012 2013 2014 2015 2016 2017 2018
Total burned area per year Annual average 2001–2018
1 00
0 ha
(Continued)
Eastern and Southern Africa
2.18 billion ha
Western andCentral Africa
1.91 billion haSouth America
587.94 million ha
Western andCentral Asia
184.95 million ha
Oceania878.44 million ha
Northern Africa737.11 million ha
Europe281.36
million ha
South andSoutheast Asia
262.06 million ha
Caribbean4.53 million ha
Central America15.55 million ha
North America124.87 million haEast Asia77.64 million ha
Figure 41. Total land area burned in 2001–2018, by region or subregion
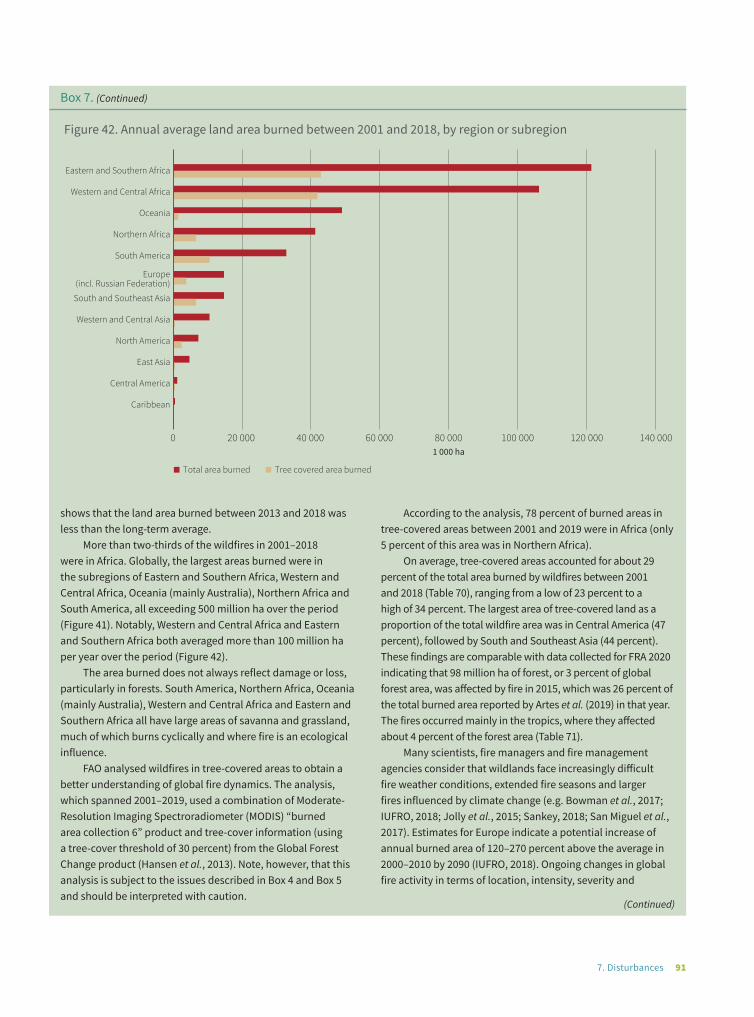
917. Disturbances
shows that the land area burned between 2013 and 2018 was less than the long-term average.
More than two-thirds of the wildfires in 2001–2018 were in Africa. Globally, the largest areas burned were in the subregions of Eastern and Southern Africa, Western and Central Africa, Oceania (mainly Australia), Northern Africa and South America, all exceeding 500 million ha over the period (Figure 41). Notably, Western and Central Africa and Eastern and Southern Africa both averaged more than 100 million ha per year over the period (Figure 42).
The area burned does not always reflect damage or loss, particularly in forests. South America, Northern Africa, Oceania (mainly Australia), Western and Central Africa and Eastern and Southern Africa all have large areas of savanna and grassland, much of which burns cyclically and where fire is an ecological influence.
FAO analysed wildfires in tree-covered areas to obtain a better understanding of global fire dynamics. The analysis, which spanned 2001–2019, used a combination of Moderate-Resolution Imaging Spectroradiometer (MODIS) “burned area collection 6” product and tree-cover information (using a tree-cover threshold of 30 percent) from the Global Forest Change product (Hansen et al., 2013). Note, however, that this analysis is subject to the issues described in Box 4 and Box 5 and should be interpreted with caution.
According to the analysis, 78 percent of burned areas in tree-covered areas between 2001 and 2019 were in Africa (only 5 percent of this area was in Northern Africa).
On average, tree-covered areas accounted for about 29 percent of the total area burned by wildfires between 2001 and 2018 (Table 70), ranging from a low of 23 percent to a high of 34 percent. The largest area of tree-covered land as a proportion of the total wildfire area was in Central America (47 percent), followed by South and Southeast Asia (44 percent). These findings are comparable with data collected for FRA 2020 indicating that 98 million ha of forest, or 3 percent of global forest area, was affected by fire in 2015, which was 26 percent of the total burned area reported by Artes et al. (2019) in that year. The fires occurred mainly in the tropics, where they affected about 4 percent of the forest area (Table 71).
Many scientists, fire managers and fire management agencies consider that wildlands face increasingly difficult fire weather conditions, extended fire seasons and larger fires influenced by climate change (e.g. Bowman et al., 2017; IUFRO, 2018; Jolly et al., 2015; Sankey, 2018; San Miguel et al., 2017). Estimates for Europe indicate a potential increase of annual burned area of 120–270 percent above the average in 2000–2010 by 2090 (IUFRO, 2018). Ongoing changes in global fire activity in terms of location, intensity, severity and
Box 7. (Continued)
(Continued)
Total area burned Tree covered area burned
1 000 ha140 0000 20 000 40 000 60 000 80 000 100 000 120 000
Eastern and Southern Africa
Western and Central Africa
Oceania
Northern Africa
South America
Europe(incl. Russian Federation)
South and Southeast Asia
Western and Central Asia
North America
East Asia
Central America
Caribbean
Figure 42. Annual average land area burned between 2001 and 2018, by region or subregion
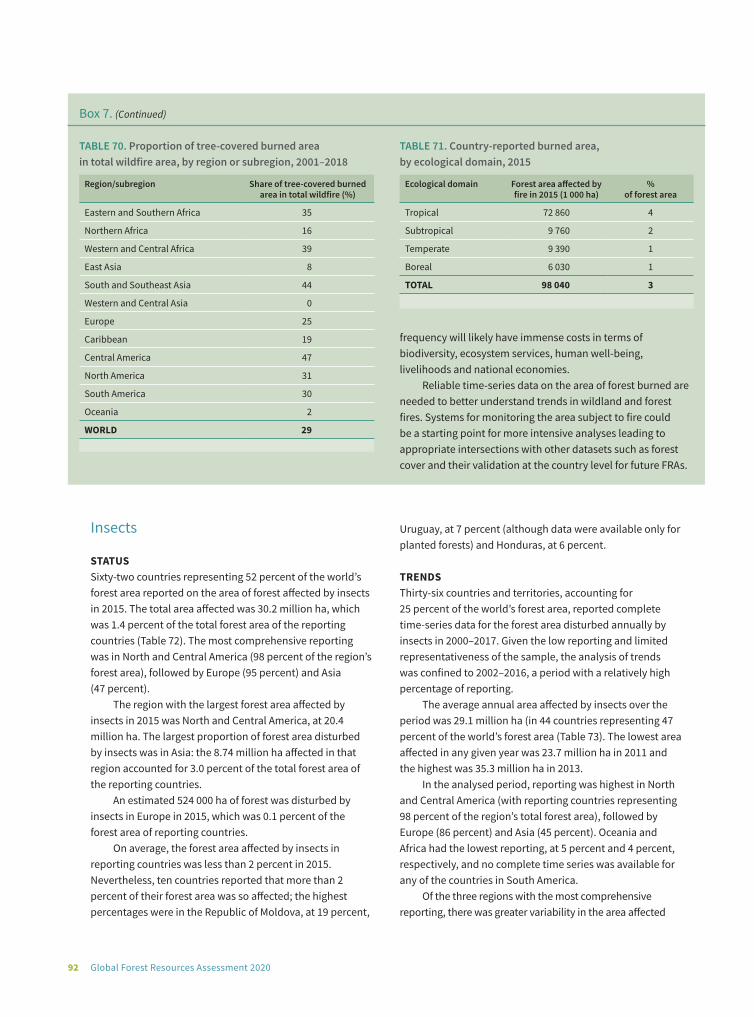
92 Global Forest Resources Assessment 2020
Insects
STATUSSixty-two countries representing 52 percent of the world’s forest area reported on the area of forest affected by insects in 2015. The total area affected was 30.2 million ha, which was 1.4 percent of the total forest area of the reporting countries (Table 72). The most comprehensive reporting was in North and Central America (98 percent of the region’s forest area), followed by Europe (95 percent) and Asia (47 percent).
The region with the largest forest area affected by insects in 2015 was North and Central America, at 20.4 million ha. The largest proportion of forest area disturbed by insects was in Asia: the 8.74 million ha affected in that region accounted for 3.0 percent of the total forest area of the reporting countries.
An estimated 524 000 ha of forest was disturbed by insects in Europe in 2015, which was 0.1 percent of the forest area of reporting countries.
On average, the forest area affected by insects in reporting countries was less than 2 percent in 2015. Nevertheless, ten countries reported that more than 2 percent of their forest area was so affected; the highest percentages were in the Republic of Moldova, at 19 percent,
Uruguay, at 7 percent (although data were available only for planted forests) and Honduras, at 6 percent.
TRENDSThirty-six countries and territories, accounting for 25 percent of the world’s forest area, reported complete time-series data for the forest area disturbed annually by insects in 2000–2017. Given the low reporting and limited representativeness of the sample, the analysis of trends was confined to 2002–2016, a period with a relatively high percentage of reporting.
The average annual area affected by insects over the period was 29.1 million ha (in 44 countries representing 47 percent of the world’s forest area (Table 73). The lowest area affected in any given year was 23.7 million ha in 2011 and the highest was 35.3 million ha in 2013.
In the analysed period, reporting was highest in North and Central America (with reporting countries representing 98 percent of the region’s total forest area), followed by Europe (86 percent) and Asia (45 percent). Oceania and Africa had the lowest reporting, at 5 percent and 4 percent, respectively, and no complete time series was available for any of the countries in South America.
Of the three regions with the most comprehensive reporting, there was greater variability in the area affected
frequency will likely have immense costs in terms of biodiversity, ecosystem services, human well-being, livelihoods and national economies.
Reliable time-series data on the area of forest burned are needed to better understand trends in wildland and forest fires. Systems for monitoring the area subject to fire could be a starting point for more intensive analyses leading to appropriate intersections with other datasets such as forest cover and their validation at the country level for future FRAs.
Box 7. (Continued)
TABLE 70. Proportion of tree-covered burned area in total wildfire area, by region or subregion, 2001–2018
Region/subregion Share of tree-covered burned area in total wildfire (%)
Eastern and Southern Africa 35
Northern Africa 16
Western and Central Africa 39
East Asia 8
South and Southeast Asia 44
Western and Central Asia 0
Europe 25
Caribbean 19
Central America 47
North America 31
South America 30
Oceania 2
WORLD 29
TABLE 71. Country-reported burned area, by ecological domain, 2015
Ecological domain Forest area affected by fire in 2015 (1 000 ha)
% of forest area
Tropical 72 860 4
Subtropical 9 760 2
Temperate 9 390 1
Boreal 6 030 1
TOTAL 98 040 3

937. Disturbances
by insects in North and Central America, where an average of 20.1 million ha was affected annually, ranging from 14.7 million ha in 2011 to 25.9 million ha in 2013. The peak in 2013 was due to a massive attack in Canada of defoliator insects, mainly the forest tent caterpillar. According to Canada’s country report, forest tent caterpillar outbreaks follow a well-established pattern of occurrence about every 11 years; comparable peaks in the area defoliated by this insect were observed in 1990–1991 and 2000–2001. The average area affected by insects in Europe in 2002–2016 was 506 000 ha per year and the average in Asia was 8.42 million ha per year.
Diseases
STATUSFifty-one countries representing 42 percent of the total forest area reported data on the area of forest affected by disease in 2015. The total area so affected was 6.60 million ha, which was 0.4 percent of the forest area of the reporting countries (Table 74). The most data on this parameter was for Europe, where the reporting countries represented 96
percent of the region’s forest area, followed by North and Central America (50 percent) and Asia (38 percent).
North and Central America reported the largest area of forest affected by disease in 2015, at 3.75 million ha (1 percent of the forest area of the region’s reporting countries), followed by Asia and Europe.
TRENDSThirty countries and territories, representing 24 percent of the forest area, reported complete time-series data for the forest area affected by disease in 2000–2017. More comprehensive reporting was available for 2002–2017, with data provided by 33 countries representing 37 percent of the world’s forest area. Coverage in this period was highest in Europe, with reporting countries accounting for 86 percent of the region’s forest area, followed by North and Central America (50 percent), Asia (38 percent), Oceania (5 percent) and Africa (3 percent); no countries or territories in South America provided complete time series for the analysed period.
The average forest area affected by disease in reporting countries in 2002–2017 was 4.76 million ha, with a low of
TABLE 72. Forest area affected by insects, by region, 2015
Region Data availability Forest affected by insects
No. of reporting countries
% of total forest area Area (1 000 ha)
% of forest area
Africa 6 7 436 1.0
Asia 11 47 8 743 3.0
Europe 30 95 524 0.1
North and Central America 9 98 20 381 2.7
Oceania 3 5 1.0 n.s.
South America 3 7 130 0.2
WORLD 62 52 30 215 1.4
Note: n.s. = not significant.
TABLE 73. Forest area disturbed by insects annually, by region, 2002–2016
Region Data availability Forest area affected annually (1 000 ha)
No. of reporting countries
% of total forest area
Maximum Minimum Average
Africa 5 4 50 16 37
Asia 8 45 9 244 7 162 8 419
Europe 20 86 1 385 256 506
North and Central America 7 98 25 903 14 656 20 146
Oceania 3 5 40 1.0 12
WORLD 44 47 35 277 23 736 29 119
Note: No countries or territories in South America provided complete time series for the analysed period.

94 Global Forest Resources Assessment 2020
2.18 million ha in 2002 and a high of 6.63 million ha in 2011 (Table 75).
Of the three regions with the highest reporting, North and Central America had the highest variability in the area affected by disease, with a low of 877 000 ha in 2002, a high of 5.13 million ha in 2011 and an average of 3.26 million ha. The area of forest affected by disease was relatively stable over the period in Asia and Europe.
Severe weather events
STATUSForty-eight countries and territories representing 37 percent of the total forest area reported data on the area of forest affected by severe weather events in 2015. The total area affected was 3.83 million ha, which was 0.3 percent of the forest area of the reporting countries.
The most comprehensive reporting of the forest area disturbed by severe weather events was in Europe (95 percent of the region’s forest area), followed by North and Central America (50 percent); reporting was below 10 percent in the other regions.
Among the regions, North and Central America reported the largest area of forest affected by severe weather events in 2015, at 2.08 million ha (0.5 percent of the forest area of reporting countries in the region). The second-largest area was in Europe, at 866 000 ha (0.1 percent) (Table 76).
TRENDSThirty-two countries and territories representing 24 percent of the world’s forest area reported annual data on the area of forest affected by severe weather events in 2000–2017. The analysis presented here is for 2002–2015, with data for 37 countries and territories representing 33 percent of the world’s forest area. Reporting was highest in Europe, with reporting countries accounting for 87 percent of the region’s forest area, followed by North and Central America (50 percent), Asia (8 percent) Oceania (5 percent) and Africa (3 percent). No countries or territories in South America provided complete time series for the analysed period.
The average forest area affected by severe weather events globally over the period was 5.96 million ha, with a high of 9.38 million ha in 2006 and a low of 2.79 million ha in 2015 (Table 77).
TABLE 74. Forest area affected by disease, by region, 2015
Region Data availability Forest affected by disease
No. of reporting countries
% of total forest area
Area (1 000 ha)
% of forest area
Africa 4 6 301 0.8
Asia 5 38 1 409 0.6
Europe 32 96 821 0.1
North and Central America 4 50 3 751 1.0
Oceania 3 5 62 0.6
South America 3 7 259 0.4
WORLD 51 42 6 603 0.4
TABLE 75. Forest area affected annually by disease, by region, 2002–2017
Region Data availability Forest area affected annually (1 000 ha)
No. of reporting countries
% of total forest area
Maximum Minimum Average
Africa 2 3 1.1 0.1 0.4
Asia 4 38 1 393 763 1 152
Europe 19 86 383 153 250
North and Central America 4 50 5 129 877 3 257
Oceania 3 5 335 1.0 97
WORLD 33 37 6 629 2 177 4 757
Note: No countries or territories in South America provided complete time series for the analysed period.
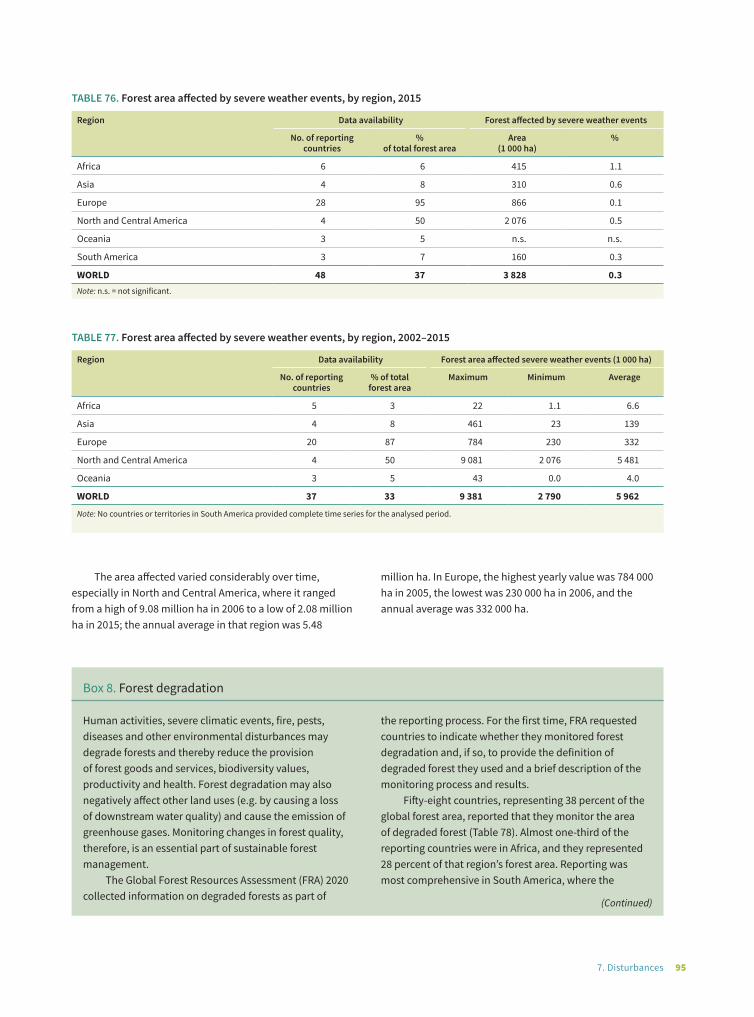
957. Disturbances
The area affected varied considerably over time, especially in North and Central America, where it ranged from a high of 9.08 million ha in 2006 to a low of 2.08 million ha in 2015; the annual average in that region was 5.48
TABLE 77. Forest area affected by severe weather events, by region, 2002–2015
Region Data availability Forest area affected severe weather events (1 000 ha)
No. of reporting countries
% of totalforest area
Maximum Minimum Average
Africa 5 3 22 1.1 6.6
Asia 4 8 461 23 139
Europe 20 87 784 230 332
North and Central America 4 50 9 081 2 076 5 481
Oceania 3 5 43 0.0 4.0
WORLD 37 33 9 381 2 790 5 962
Note: No countries or territories in South America provided complete time series for the analysed period.
TABLE 76. Forest area affected by severe weather events, by region, 2015
Region Data availability Forest affected by severe weather events
No. of reporting countries
%of total forest area
Area(1 000 ha)
%
Africa 6 6 415 1.1
Asia 4 8 310 0.6
Europe 28 95 866 0.1
North and Central America 4 50 2 076 0.5
Oceania 3 5 n.s. n.s.
South America 3 7 160 0.3
WORLD 48 37 3 828 0.3Note: n.s. = not significant.
million ha. In Europe, the highest yearly value was 784 000 ha in 2005, the lowest was 230 000 ha in 2006, and the annual average was 332 000 ha.
Box 8. Forest degradation
Human activities, severe climatic events, fire, pests, diseases and other environmental disturbances may degrade forests and thereby reduce the provision of forest goods and services, biodiversity values, productivity and health. Forest degradation may also negatively affect other land uses (e.g. by causing a loss of downstream water quality) and cause the emission of greenhouse gases. Monitoring changes in forest quality, therefore, is an essential part of sustainable forest management.
The Global Forest Resources Assessment (FRA) 2020 collected information on degraded forests as part of
the reporting process. For the first time, FRA requested countries to indicate whether they monitored forest degradation and, if so, to provide the definition of degraded forest they used and a brief description of the monitoring process and results.
Fifty-eight countries, representing 38 percent of the global forest area, reported that they monitor the area of degraded forest (Table 78). Almost one-third of the reporting countries were in Africa, and they represented 28 percent of that region’s forest area. Reporting was most comprehensive in South America, where the
(Continued)

@ F
AO /
NCo
gnom
e
96 Global Forest Resources Assessment 2020
reporting countries accounted for 79 percent of the region’s forest area. Seventy-two percent of the forest area of reporting countries was in the tropical climatic domain; the boreal forest domain, in contrast, accounted for only 4 percent (Figure 43).
Countries use various definitions of degraded forest and it is infeasible, therefore, to aggregate and compare data on forest area at the regional and global levels. Most definitions are based mainly on the presence of forest disturbances. Some countries specify the type of disturbance (mostly anthropogenic factors such as logging and fire) and others are more generic.
Other criteria commonly used by countries in their definitions of degraded forest include change in forest structure (including decrease in forest canopy) and loss of productivity and forest goods (Figure 44). Few countries apply quantitative criteria in their definitions.
Field inventories and observations are the most commonly used methods for monitoring and assessing the area of degraded forest, followed by remote sensing and mapping (Figure 45). The low number of reporting countries and the overall lack of data on degraded forests is explained partly by the difficulty of assessing degraded forest areas and a lack of available tools and methods. Nevertheless, many countries have started monitoring forest degradation in recent years.
Box 8. (Continued)
Figure 43. Proportion of total forest area of countries reporting on forest degradation, by climatic domain
Boreal 3%
Temperate 15%
Tropical 72%
Subtropical 9%
Figure 44. Criteria used in national definitions of degraded forest
0 5 10 15 20 25 30 35
Forest disturbances
Change in forest structure/decrease in forest canopy
Loss of productivity andforest goods
Loss of carbon, biomassand growing stock
Change in forest structure
Decrease in forest canopy
Loss of forest services
Loss of biological diversity
Soil damage/erosion
Not defined
Number of reporting countries
Note: Many countries use several criteria in their definitions of degraded forest.
Figure 45. Methods applied by countries for monitoring degraded forest
0 5 10 15 20 25 30 35
Field inventory andobservations
Remote sensing/mappingForest inventory
Field observationsNot specified/under
developmentExpert opinion
Production/harvest dataForest management
plan report
Number of reporting countries
Note: Some countries use a combination of methods to monitor their degraded forests.
b
TABLE 78. Number and forest area of countries reporting on forest degradation, by region
Region No. of reporting countries
Forest area of reporting
countries (1000 ha)
% of total
forest area
Africa 18 178 226 28
Asia 16 271 887 44
Europe 7 18 063 2
North and Central America
6 383 297 51
Oceania 3 39 519 21
South America 8 663 849 79
WORLD 58 1 554 841 38
@ F
AO /
NCo
gnom
e
8Policies and
legislation
©FA
O/B
alin
t Por
necz
i©
FAO
/Bal
int P
orne
czi

998. Policies and legislation
any countries have developed policies and laws designed to promote the sustainable and multipurpose use of forests and trees. Such policies and laws serve as a foundation
for sustainable forest management by, for example, promoting legal timber trade, involving stakeholders in forest management, addressing forest tenure and providing incentives.
The findings of FRA 2020 presented in this chapter show that most countries – encompassing the large majority of the world’s forests – have formalized the principles of sustainable forest management in forest-related policies and laws. The existence of such policies and basic legislation, however, does not, on its own, ensure sustainable forest management; other possible indicators include the existence of specialized legislation on forest use; systems for ensuring the legality of timber trade; traceability systems for wood products; appropriate capacities in relevant institutions; and mechanisms for involving stakeholders in forest-related decision-making processes and supervision.
Findings
FRA 2020 received information on forest policies in 2020 from 187 countries and territories representing 99 percent of the total forest area. Of these, 164 countries and territories (also representing about 99 percent of the total forest area) indicated that they have national forest policies. The large majority reported that they have national-level policy statements; only three countries reported that they have subnational statements but no national forest policy statement (or they did not report on the latter). Twenty-three countries and territories reported that they had no forest policy statement.
One hundred and seventy-two countries and territories representing 99 percent of the total forest area indicated that they have forest legislation. The other 64 countries and territories (representing 1 percent of the total forest area) did not report on this aspect or did not provide an
M affirmative response on the presence of forest legislation. All but one of the countries that responded in the affirmative (i.e. 171 countries) indicated that they have specific forest-targeted legislation at the national level. Belgium reported that its forests are regulated through subnational but not national legislation.
A total of 142 countries and territories representing 95 percent of the total forest area reported that they have platforms to enable the participation of stakeholders in forest policy development; 40 countries and territories indicated that they do not have such a platform and 54 did not report. Of the 142 countries with platforms, 44 are in Africa, 29 are in Asia, 32 are in Europe and 17 are in North and Central America, and there are ten each in Oceania and South America. Only three countries (all in Europe) reported having subnational rather than national platforms to enable stakeholder participation in forest policy development.
Ninety-four countries and territories reported the existence of traceability systems for wood products21 at the national level and another three (including the United States of America) reported that such systems exist at the subnational level; in total, these 97 countries and territories represent 84 percent of the total forest area. In South America, 13 of the 14 countries and territories that reported on this aspect indicated the existence of traceability systems for wood products. Wood-product traceability systems exist in 25 countries and territories in Europe (accounting for nearly 95 percent of the region’s forest area), 11 in North and Central America (91 percent), 32 in Africa (79 percent), 2 (Australia and Niue) in Oceania (72 percent), and 14 in Asia (48 percent).
21 Traceability systems for wood products are defined here as systems that provide the ability to trace the origin, location and movement of wood products by means of recorded identifications. This involves two main aspects: 1) identification of the product by marking; and 2) the recording of data on the movement and location of a product all the way along the production, processing and distribution chain.
V

@ F
AO /
NCo
gnom
e

@ F
AO /
NCo
gnom
e
9Employment
and education

©FA
O/V
asily
Mak
sim
ov

1039. Employment and education
mployment in the forest sector is an important indicator of the impact of forests on people, and it helps quantify the contribution of the sector to broader economic objectives. Employment
provides income; because most forest activities occur in rural areas that are often poorer than average, this indicator helps in measuring the contribution of the forest sector to poverty alleviation. Data on forest-related education can indicate a country’s capacity for, and commitment to, managing, conserving and enhancing forests and building institutional frameworks to promote sustainable forest management.
Employment
FRA 2020 collected data on full-time-equivalent employment in the forestry and logging sector, as defined by the Industrial Classification of all Economic Activities (United Nations Statistics Division, 2008, p. 75):
This division includes the production of roundwood for the forest-based manufacturing industries (ISIC [International Standard Industrial Classification] divisions 16 and 17) as well as the extraction and gathering of wild growing non-wood forest products. Besides the production of timber, forestry activities result in products that undergo little processing, such as fire wood, charcoal, wood chips and roundwood used in an unprocessed form (e.g. pit-props, pulpwood etc.). These activities can be carried out in natural or planted forests. It excludes employment in forest-based manufacturing industries (ISIC divisions 16 and 17).
Countries were requested to report disaggregated data by gender, where available, for four reference years, based on the average of the following three-year periods: 1989–1991 for 1990; 1999–2001 for 2000; 2009–2011 for 2010; and 2014–2016 for 2015. Overall, the outcomes confirmed the need to improve the quality of employment data. Data collection on this indicator presents challenges in terms of definitions and methodologies; nevertheless, the data collected for FRA
2020 suggest an ongoing decreasing trend in employment in the forestry and logging sector.
An in-depth revision of the data-collection process, and collaboration with other global data providers such as the International Labour Organization, would help improve employment statistics.
STATUS FRA 2020 received information on employment in forestry and logging in 2015 from 136 countries representing 91 percent of the world’s forests. Total employment in the forest sector was estimated at 12.5 million people (full-time equivalent) in 2015, almost 90 percent of whom were in Asia and Africa (Table 79). Asia accounted for more than 70 percent (8.90 million people employed) of total employment globally, led by India (6.23 million people employed) and China (1.15 million people).
Seventy-one countries representing 38 percent of the world’s forests reported gender-disaggregated data. The total number of employees in forestry and logging in these countries in 2015 was estimated at 3.88 million, of whom 58 percent were male and 42 percent were female.
TABLE 79. Number of people employed in forestry and logging, by region, 2015
Region Data availability No. of people employed
(1 000 full-time equivalent)
No. of reporting countries
% of total forest area
Africa 34 62 2 135
Asia 29 94 8 896
Europe 38 99 696
North and Central America
14 98 406
Oceania 10 80 28
South America 11 97 332
WORLD 136 91 12 492
E

104 Global Forest Resources Assessment 2020ì
TRENDSThe number of people employed in forestry and logging decreased by 1.47 million between 1990 and 2015, although the rate of decrease slowed in the period 2010–2015; decreases occurred in all regions except Africa and South America (although insufficient data were available to determine employment trends in Oceania) (Table 80).
The decline in employment in Asia mainly reflected a steep decline in China, where the number of people employed more than halved between 1990 and 2015 (due partly to a partial logging ban in the late 1990s). The decline in employment in Europe was due to the restructuring of formerly centrally planned economies, which, in some countries, led to decreased production and lower employment. More generally, the privatization of forestry in Eastern Europe led to large increases in labour productivity and consequently to a decline in employment. Increases in employment in Africa and South America occurred partly because roundwood production grew faster than labour productivity.22
Education
Education on forests will be crucial for enabling societies to address challenges such as climate change, energy demand, environmental degradation and biodiversity loss and to adapt to changing economic, social and environmental conditions. The forest managers of the future are likely to require a wide range of skills, such as in implementing integrated landscape approaches and participatory forest management, the adoption of new technologies, and managing the multifunctional roles of forests.
FRA 2020 sought data on the number of graduates in post-secondary education programmes with a focus on
22 The explanations for employment trends in this paragraph draw on FAO (2008).
forests and related subjects, disaggregated by gender and level of education. The collected data indicate an increase in the number of students graduating in forestry, including the strong involvement of women in forest education and progress towards gender parity.
STATUSFRA 2020 received information on forest education from 119 countries and territories representing 86 percent of the global forest area. Reporting varied considerably between regions: for example, the reporting countries represented 97 percent of the regional forest areas in Europe and North and Central America and 55 percent in Africa.
Globally, 331 000 students graduated in forestry in 2015 (Table 81), which is equivalent to 95 graduates per 1 million ha of forest. About 6 000 doctoral degrees were awarded in forestry in that year, as well as 28 200 master’s degrees, 113 000 bachelor’s degrees and 149 000 technical certificates. Most countries provided data for only a few levels of education; thus, the aggregated numbers at the global and regional levels are underestimated, particularly in Africa, Europe (where data by level of education were missing for the Russian Federation) and Oceania.
The largest number of graduated students in all forestry degrees combined was in Asia, with 194 000 graduated students in 2015 (Table 82), of whom the majority (60 percent) were graduates with technical certificates or diplomas. Asia also had by far the highest ratio of forestry graduates by forest area (at 336 forestry-graduated students per 1 million ha of forest). The number of graduated students in China accounted for 82 percent of the regional total.
The second-largest number of graduated students was in North and Central America, at 65 900, of whom the majority (53 percent) graduated with bachelor’s degrees. The number of graduated students was low in Africa and Oceania, at least partly because of the relatively small number of countries reporting on this parameter.
TABLE 80. Number of people employed in forestry and logging, by region, 1990–2015
Region Data availability No. of people employed (1 000 full-time equivalent)
No. of reporting countries
% of total forest area
1990 2000 2010 2015
Africa 27 54 1 740 2 003 1 969 2 030
Asia 22 84 9 948 9 338 8 735 8 511
Europe 35 99 1 036 883 658 691
North and Central America 7 88 220 192 169 189
Oceania 4 5 6 9 9 9
South America 9 89 251 252 341 301
WORLD 104 81 13 201 12 677 11 881 11 730

1059. Employment and education
TABLE 81. Number of graduated students, by level of education, 2015
Level of education Data availability Graduated students
No. of reporting countries
% of total forest area
Total no.of graduates
% female
Doctoral degree 95 59 5 593 33
Master’s degree or equivalent 104 62 28 210 48
Bachelor’s degree or equivalent 105 62 112 631 48
Technical certificate or diploma 95 47 149 358 31
Not specified 2 20 35 120 42
TOTAL GRADUATES 330 912 33
TABLE 82. Graduated students in forestry, by region and level of education, 2015
Region Doctoral degree
Master’s degree or
equivalent
Bachelor’s degree or
equivalent
Technical certificate or
diploma
Not specified Total number of graduates
No. of graduates
per 1 million ha of forest
% female
Africa 86 766 1 836 3 035 120 5 843 17 30
Asia 2 002 12 618 63 624 115 379 – 193 623 336 36
Europe 417 3 297 6 705 10 416 35 000 55 835 56 23
North and Central America 1 727 9 559 34 709 19 917 – 65 912 91 50
Oceania 56 3 58 501 – 618 4 63
South America 1 305 1 967 5 699 110 – 9 081 13 36
WORLD 5 593 28 210 112 631 149 358 35 120 330 912 95 42
Women represented about 42 percent of all graduated forestry students in 2015, with some differences by education level. The proportion of women graduating in forestry in 2015 was highest in Oceania, at 63 percent, although the total number of graduates in that region was small. Women accounted for 50 percent of all graduates in North and Central America.
Males and females were represented almost equally in master’s and bachelor’s degrees (with women accounting for 48 percent in both), but women were underrepresented in doctoral degrees and technical certificates, at about one-third of graduated students. The proportion of women by education level varied notably between regions: for example, the lowest proportion of women graduating with doctoral degrees was 10 percent in Asia, and the highest was 47 percent in North and Central America. Europe had the lowest proportion of women in forestry education, at
23 percent, but the percentage of women in that region graduating with doctoral degrees was much higher than the global average, at 43 percent.
TRENDS The countries and territories providing complete time-series data for one or more education category represent only about half the global forest area; therefore, the trends reported here should be treated with caution. Overall, there was a substantial increase in the number of graduated forestry students between 2000 and 2015, with the number more than doubling in all levels of education (Figure 46).
For those countries providing time series of gender-disaggregated data, the proportion of women graduating in forestry increased between 2000 and 2015 (Figure 47). This was true for all education levels, although the number of women graduating with doctoral degrees declined between

@ F
AO /
NCo
gnom
e
106 Global Forest Resources Assessment 2020ì
2010 and 2015 after increasing substantially between 2000 and 2010. Women, therefore, are increasingly participating in forest-related education in many countries, but efforts may still be needed to achieve gender parity, especially for doctoral degrees and technical qualifications.
FIGURE 47. Proportion of female and male graduated forestry students, by education level, 2000–2015
%
100
90
80
70
60
50
40
30
20
10
0
Female Male
Doctoral
2000
2010
2015
2000
2010
2015
2000
2010
2015
2000
2010
2015
2000
2010
2015
Master’s Bachelor’s Technicalcertificate/
diploma
Total
k
FIGURE 46. Number of forestry students, by degree category, 2000–2015
160 000
140 000
120 000
100 000
80 000
60 000
40 000
20 000
0
Num
ber o
f for
estr
y st
uden
ts
2000 2010 2015
Doctoral Master’sBachelor’s Technical certificate/diploma
@ F
AO /
NCo
gnom
e
10Non-wood
forest products removalsand value

©FA
O/G
iulio
Nap
olita
no
10910. Non-wood forest products removals and value
orests provide a wide range of non-wood forest products (NWFPs), including foods, medicines, fodder, aromatic products, wild meat and honey. Most global statistical
compilations and reporting on the production, trade and consumption of forest products focus on wood products (Box 9, p. 111), and data collection on NWFPs has rarely been systematic, despite their considerable economic and social importance. There are two main reasons for this: NWFPs are largely the domain of the informal sector; and the range of NWFPs is highly diverse.
For FRA 2020, countries and territories were asked to identify the ten most important NWFPs, estimate the quantity of removals in 2015 and commercial values of marketed production, and provide information on key NWFP species. FRA 2020 defined NWFPs as “goods derived from forests that are tangible and physical objects of biological origin other than wood”; information was categorized according to product characteristics (i.e. plant- or animal-based) and end uses.23
Information on NWFPs is still poor: in addition to the reasons mentioned above, there is a lack of harmonization of definitions and difficulties associated with the collation and standardization of data from different sources.
Despite the scarcity of information, NWFPs are economically important in many countries and for large numbers of people. The collection of better data on NWFPs would help in determining their contributions to healthy diets, nature conservation, poverty alleviation, economic development and the SDGs and in ensuring their sustainable management. A starting point would be to improve the methods used for data collection and
23 For FRA 2020, NWFPs were classified as either plant-based or animal-based. Plant-based products include food, fodder, raw material for medicine and aromatic products, raw material for colorants and dyes, raw material for handicrafts, utensils and construction, ornamental plants, exudates, and other plant products. Animal-based products comprised wild meat, honey and beeswax, hides, skins and trophies, living animals, raw material for medicine, raw material for colorants, other edible products and other non-edible products.
F to increase statistical support for those countries lacking sufficient capacity to do so.
COVERAGEFRA 2020 received information on NWFPs from 124 countries and territories representing 73 percent of the global forest area. Information was provided by countries representing more than 75 percent of the forest area in all regions except Europe, where no data were forthcoming from the Russian Federation (Table 83).
Although countries and territories were asked to identify their ten commercially most important NWFPs for 2015, not all did so, with the average varying from five in North and Central America to eight in Africa and South America. Some countries identified more than ten such products, including Argentina (50 products), Brazil (37), Canada (which, in reporting on wild pelts, specified quantities and values for 24 species), and the Central African Republic (23).
FOREST PRODUCT CATEGORIES OF MAJOR IMPORTANCENWFPs that constitute foods represent almost half of all NWFPs reported (Figure 48). They include edible non-animal products – fruits, vegetables, spices and mushrooms – as well as animal products such as honey, insects and wild meat.
Edible plant products are of considerable importance in Africa, with 77 percent of reporting countries providing information on these. Edible plant products are also important in other regions; for example, a huge diversity – such as nuts and many species of fruits, vegetables and spices – are marketed in Asia. European plant-based forest foods mainly comprise berries, nuts (pine nuts and chestnuts) and mushrooms.
Fifty-six of the 124 reporting countries and territories provided information on medicinal and aromatic plants (this was the second-most reported category in Africa, Asia and Oceania). “Raw material for handicrafts, utensils and construction” – which includes bamboo, rattan, palm leaves, cork and other species – was the most-reported
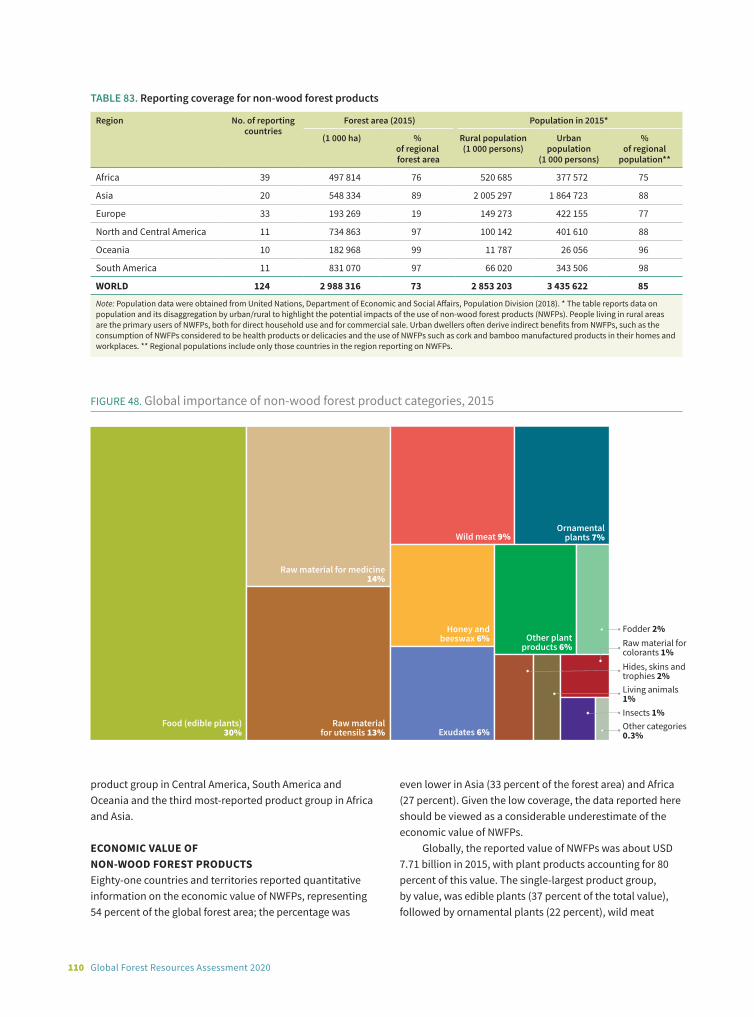
110 Global Forest Resources Assessment 2020
product group in Central America, South America and Oceania and the third most-reported product group in Africa and Asia.
ECONOMIC VALUE OF NON-WOOD FOREST PRODUCTSEighty-one countries and territories reported quantitative information on the economic value of NWFPs, representing 54 percent of the global forest area; the percentage was
TABLE 83. Reporting coverage for non-wood forest products
Region No. of reporting countries
Forest area (2015) Population in 2015*
(1 000 ha) % of regional forest area
Rural population (1 000 persons)
Urban population
(1 000 persons)
% of regional
population**
Africa 39 497 814 76 520 685 377 572 75
Asia 20 548 334 89 2 005 297 1 864 723 88
Europe 33 193 269 19 149 273 422 155 77
North and Central America 11 734 863 97 100 142 401 610 88
Oceania 10 182 968 99 11 787 26 056 96
South America 11 831 070 97 66 020 343 506 98
WORLD 124 2 988 316 73 2 853 203 3 435 622 85
Note: Population data were obtained from United Nations, Department of Economic and Social Affairs, Population Division (2018). * The table reports data on population and its disaggregation by urban/rural to highlight the potential impacts of the use of non-wood forest products (NWFPs). People living in rural areas are the primary users of NWFPs, both for direct household use and for commercial sale. Urban dwellers often derive indirect benefits from NWFPs, such as the consumption of NWFPs considered to be health products or delicacies and the use of NWFPs such as cork and bamboo manufactured products in their homes and workplaces. ** Regional populations include only those countries in the region reporting on NWFPs.
FIGURE 48. Global importance of non-wood forest product categories, 2015
Food (edible plants)30%
Raw materialfor utensils 13%
Raw material for medicine 14%
Exudates 6%
Honey andbeeswax 6%
Wild meat 9%Ornamental
plants 7%
Other plantproducts 6%
Hides, skins andtrophies 2%
Other categories0.3%
Living animals1%
Raw material forcolorants 1%
Fodder 2%
Insects 1%
even lower in Asia (33 percent of the forest area) and Africa (27 percent). Given the low coverage, the data reported here should be viewed as a considerable underestimate of the economic value of NWFPs.
Globally, the reported value of NWFPs was about USD 7.71 billion in 2015, with plant products accounting for 80 percent of this value. The single-largest product group, by value, was edible plants (37 percent of the total value), followed by ornamental plants (22 percent), wild meat

11110. Non-wood forest products removals and value
(9 percent), other plant products (8 percent), honey and beeswax (7 percent), and medicinal and aromatic plants (5 percent) (Figure 49).
In Europe, the main product groups were ornamental plants (39 percent), edible plants (30 percent), wild meat (17 percent) and bee products (8 percent). The high value of the ornamental plants product group was due mainly (97 percent) to Christmas trees, where the market was dominated by Germany (51 percent), the United Kingdom of Great Britain and Northern Ireland (28 percent) and Denmark (8 percent).
In North and Central America and in South America, the most economically important categories are edible plant products (49 percent of total value), other plant products (21 percent) and exudates (10 percent) (the latter are especially important in South American countries).
In Africa, the most commercially important product groups reported were edible plants (45 percent of the commercial value), medicinal and aromatic plants (20 percent) and raw material for colorants (19 percent).
The most economically important product group in Asia in 2015 was edible plants, at 42 percent of the reported
FIGURE 49. Non-wood forest product categories as a proportion of total reported economic value, 2015
Ornamental plants22%
Wild meat 9%
Other plantproducts 8%
Honey and beeswax7%
Medicines andaromatic products
5%
Raw material forhandicra�s, utensils
and construction 4%
Edible plants37%
Other 1%
Exudates 3%Raw materialfor colorants 3%
Note: Numbers may not sum to the totals indicated and percentages may not tally to 100 due to rounding.
value, followed by raw materials for handicrafts, utensils and construction (25 percent) and other plant products (21 percent).
In Oceania, honey and beeswax accounted for the highest reported value, at 68 percent (although this figure was due entirely to Australia and New Zealand). The product group “wild meat, hides, skins and trophies” accounted for 17 percent of the regional value.
Box 9. Wood removals
The volume of wood removed from forests is an indicator of the economic and social roles of forest resources in national economies and dependent local communities. In most countries, revenue from harvested wood is the single-largest income source from forests. Information on wood removals also helps in monitoring the use of forest and tree resources by comparing actual removals with the sustainable potential.
Data on wood removals were requested from countries in Global Forest Resources Assessments in 2005, 2010 and 2015; in contrast, the analysis presented here is based on data on removals contained in the FAOSTAT database (FAO, 2020a). FAO and partner agencies (Eurostat, the International Tropical Timber Organization and the United Nations Economic Commission for Europe) annually collect statistics on removals of roundwood, the production of various wood and paper products, and trade in these products. Global statistics
on wood and paper products (including wood removals) have been collected and published annually in the FAO Yearbook of Forest Products (e.g. FAO, 2020b) since 1947. To reduce the reporting burden on countries, and because detailed annual statistics are already available in FAOSTAT, wood removals were not included in the Global Forest Resources Assessment 2020 questionnaire.
Global wood removals were estimated at 3.97 billion m3 in 2018 (the latest available data), of which about half was industrial roundwood and the other half woodfuel. This amount includes removals from forests, other wooded land and trees outside forests. There are significant differences among the regions in the percentages of the wood harvest used as woodfuel, ranging from 90 percent in Africa and 62 percent in Asia to less than 25 percent in Europe, North America and Oceania (removals were roughly even for woodfuel and
(Continued)

112 Global Forest Resources Assessment 2020
industrial roundwood in South America). Table 84 shows regional and subregional wood removals for selected years during 1990–2018.
The top ten countries for wood removals, led by the United States of America, accounted for 55 percent of total global removals in 2018 (Figure 50).
Production and trade values for global wood removals and all major wood-based products reached their highest levels since 1947 (when FAO started reporting forest product statistics) in 2018 (FAO, 2019). Global wood removals have fluctuated in response to changes in the production of coniferous industrial roundwood, with significant declines in the early 1990s (during the breakup of the Soviet Union) and 2009 (during the global financial crisis). In contrast, global
Box 9. (Continued)
TABLE 84. Industrial wood and woodfuel removals, by region and subregion, 1990–2018
Region/subregion Wood removals (million m3)
Industrial roundwood Woodfuel Total
1990 2000 2010 2018 1990 2000 2010 2018 1990 2000 2010 2018
Eastern and Southern Africa
29 36 35 37 200 250 293 317 229 286 327 354
Northern Africa 3 4 3 2 45 50 54 58 48 53 58 60
Western and Central Africa
32 35 37 41 245 301 351 383 277 337 388 425
Total Africa 61 71 72 79 445 551 644 700 506 623 715 779
East Asia 123 117 184 211 295 236 196 176 418 353 380 387
South and Southeast Asia
137 142 177 206 590 563 557 527 727 705 734 733
Western and Central Asia
9 14 19 25 11 9 11 15 20 22 29 41
Total Asia 268 273 379 442 897 808 764 718 1 165 1 081 1 144 1 161
Europe excl. Russian Federation
n.a. 374 371 430 n.a. 97 140 158 n.a. 470 511 588
Total Europe 642 519 533 650 157 109 154 175 799 628 687 824
Caribbean 1 1 1 1 6 4 5 5 7 6 6 6
Central America 3 3 3 4 34 38 42 44 37 42 45 48
North America 591 628 480 527 123 86 82 111 713 714 562 638
Total North and Central America
595 632 485 532 162 129 129 159 757 761 613 691
Total Oceania 34 47 57 77 9 13 11 10 43 60 68 87
Total South America
110 147 198 248 162 185 162 181 272 332 359 429
WORLD 1 710 1 690 1 723 2 028 1 833 1 795 1 863 1 943 3 543 3 485 3 586 3 971
Note: n.a. = not available.
Figure 50. Top ten countries for wood removals, 2018
United States of America 11%
India 9%
China 9%
Brazil 7%
Russian Federation 6%Canada 4%
Indonesia 3%
Ethiopia 3%
Democratic Republicof the Congo 2%
Nigeria 2%
Rest of the world44%
(Continued)
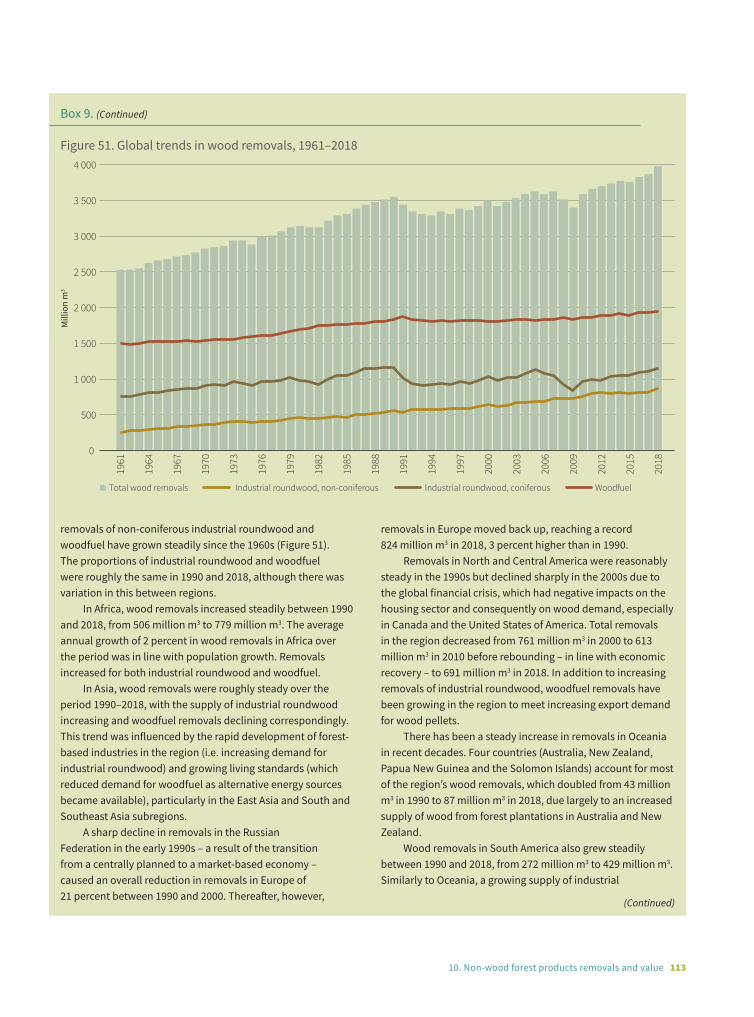
11310. Non-wood forest products removals and value
removals of non-coniferous industrial roundwood and woodfuel have grown steadily since the 1960s (Figure 51). The proportions of industrial roundwood and woodfuel were roughly the same in 1990 and 2018, although there was variation in this between regions.
In Africa, wood removals increased steadily between 1990 and 2018, from 506 million m3 to 779 million m3. The average annual growth of 2 percent in wood removals in Africa over the period was in line with population growth. Removals increased for both industrial roundwood and woodfuel.
In Asia, wood removals were roughly steady over the period 1990–2018, with the supply of industrial roundwood increasing and woodfuel removals declining correspondingly. This trend was influenced by the rapid development of forest-based industries in the region (i.e. increasing demand for industrial roundwood) and growing living standards (which reduced demand for woodfuel as alternative energy sources became available), particularly in the East Asia and South and Southeast Asia subregions.
A sharp decline in removals in the Russian Federation in the early 1990s – a result of the transition from a centrally planned to a market-based economy – caused an overall reduction in removals in Europe of 21 percent between 1990 and 2000. Thereafter, however,
removals in Europe moved back up, reaching a record 824 million m3 in 2018, 3 percent higher than in 1990.
Removals in North and Central America were reasonably steady in the 1990s but declined sharply in the 2000s due to the global financial crisis, which had negative impacts on the housing sector and consequently on wood demand, especially in Canada and the United States of America. Total removals in the region decreased from 761 million m3 in 2000 to 613 million m3 in 2010 before rebounding – in line with economic recovery – to 691 million m3 in 2018. In addition to increasing removals of industrial roundwood, woodfuel removals have been growing in the region to meet increasing export demand for wood pellets.
There has been a steady increase in removals in Oceania in recent decades. Four countries (Australia, New Zealand, Papua New Guinea and the Solomon Islands) account for most of the region’s wood removals, which doubled from 43 million m3 in 1990 to 87 million m3 in 2018, due largely to an increased supply of wood from forest plantations in Australia and New Zealand.
Wood removals in South America also grew steadily between 1990 and 2018, from 272 million m3 to 429 million m3. Similarly to Oceania, a growing supply of industrial
Box 9. (Continued)
(Continued)
Figure 51. Global trends in wood removals, 1961–20184 000
3 500
3 000
2 500
2 000
1 500
1 000
500
0
1961
1964
1967
1970
1973
1976
1979
1982
1985
1988
1991
1994
1997
2000
2003
2006
2009
2012
2015
2018
Mill
ion
m3
Total wood removals Industrial roundwood, non-coniferous Industrial roundwood, coniferous Woodfuel

@ F
AO /
NCo
gnom
e
114 Global Forest Resources Assessment 2020
roundwood from forest plantations (especially in Argentina, Brazil, Chile and Uruguay) accounted for most of the increase.
Overall, wood removals are increasing globally as demand for and the consumption of wood products escalates in line with growing populations and incomes. This trend is expected to continue in coming decades.
Not all wood removals originate in forests, and the volume of wood removals in 2018 was less than 1 percent of the forest growing stock.
Most of the long-term growth in wood supply is occurring in countries that have established forest plantations in recent decades (especially in Asia, Latin America and Oceania). Removals in Europe have increased significantly since 2000, particularly in Eastern Europe (including the Russian Federation), where forest industries and demand for wood are expanding rapidly.
Box 9. (Continued)
q

@ F
AO /
NCo
gnom
e
11Discussion

©FA
O/V
asily
Mak
sim
ov

11711. Discussion
uilding on the experience obtained over more than 70 years (FAO, 2018a), FRA 2020 has achieved several important results, including increased country participation, a reduced
reporting burden, stronger capacity-development activities, and improved data availability and quality.
Enhanced country participation
Since 2005, FRAs have been based on country reports prepared by a global network of officially nominated national correspondents, who are responsible for compiling national data for FRA reports and communicating these to the FRA secretariat. For FRA 2020, 187 national correspondents were nominated, an increase of 19 compared with FRA 2015.
Many national correspondents coordinated the inputs of other collaborators in compiling country reports. To help in sharing the reporting workload among national collaborators, data for FRA 2020 were collected via an online platform that enabled national correspondents to invite other contributors. More than 700 contributors had registered by the end of the data-collection process, showing the strong participation of countries and their commitment to the FRA process.
Overall, there was greater participation by countries in FRA 2020 compared with previous assessments. This is illustrated by the number of desk studies prepared by FAO for countries that did not nominate national correspondents or submit reports, which declined from 79 in FRA 2015 to 47 (compiled mainly for small countries and territories and representing less than 0.5 percent of the global forest area) in FRA 2020.
Reduced reporting burden
FRA 2020 reduced the reporting burden on countries through the revision of the reporting content and by excluding data already available via other reporting processes. For the first time since FRA 2000, therefore, there was a substantial
B reduction in the number of variables for which data were requested. The introduction of the FRA online platform also improved the reporting process and simplified the work of national correspondents. The main features of this platform are easy access to the reporting tables; facilitated data entry; on-the-fly validation checks; tools for data visualization and analysis; and a communication module that allows direct messaging between collaborators and reviewers. FAO’s collaboration with Google has enabled the platform to link with Google Earth Engine’s functionalities, thereby providing all countries with access to remote sensing data and products and allowing them to use these to generate estimates on, for example, tree cover, burned area, protected-forest area and mangrove area.
Stronger capacity development
Capacity development is a key factor in delivering successful FRAs and ensuring consistency and continuity. At its 23rd and 24th sessions in 2016 and 2018, the FAO Committee on Forestry recommended that FAO “supports the countries in strengthening collection, analysis and dissemination of forest data with a view to support the national SDG indicator framework and country reports”, “continues to explore new and innovative tools and techniques to further improve support to Members in collecting, analysing and reporting data on forest and related aspects”, and “supports countries with tools, methodologies and capacity-building for generating better information and data on forests’ contribution to the SDGs” (FAO, 2016, 2018b).
In responding to these recommendations, FRA 2020 initiated an intensive capacity-development programme in early 2018. The programme had two components – FRA 2020 reporting, and remote sensing. The reporting workshops focused on training national correspondents in the FRA methodology and the new online reporting tool and on supporting countries to complete their reports. One global and nine regional reporting workshops were convened between March and December 2018 involving more than 300 national collaborators.
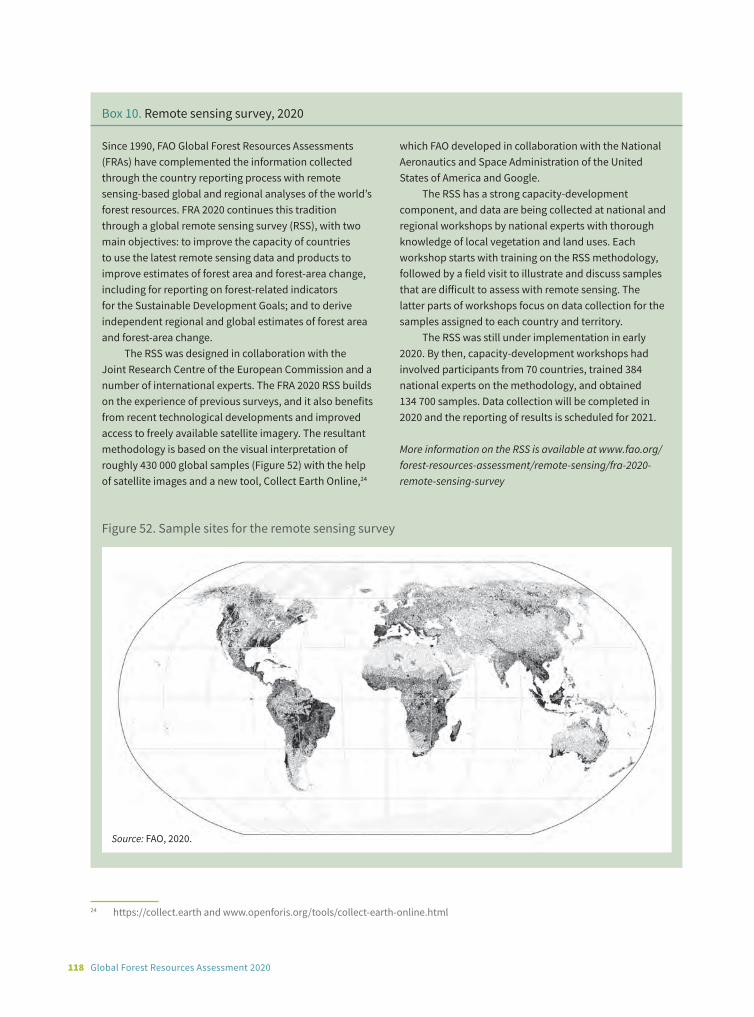
118 Global Forest Resources Assessment 2020
24 https://collect.earth and www.openforis.org/tools/collect-earth-online.html
Box 10. Remote sensing survey, 2020
Since 1990, FAO Global Forest Resources Assessments (FRAs) have complemented the information collected through the country reporting process with remote sensing-based global and regional analyses of the world’s forest resources. FRA 2020 continues this tradition through a global remote sensing survey (RSS), with two main objectives: to improve the capacity of countries to use the latest remote sensing data and products to improve estimates of forest area and forest-area change, including for reporting on forest-related indicators for the Sustainable Development Goals; and to derive independent regional and global estimates of forest area and forest-area change.
The RSS was designed in collaboration with the Joint Research Centre of the European Commission and a number of international experts. The FRA 2020 RSS builds on the experience of previous surveys, and it also benefits from recent technological developments and improved access to freely available satellite imagery. The resultant methodology is based on the visual interpretation of roughly 430 000 global samples (Figure 52) with the help of satellite images and a new tool, Collect Earth Online,24
which FAO developed in collaboration with the National Aeronautics and Space Administration of the United States of America and Google.
The RSS has a strong capacity-development component, and data are being collected at national and regional workshops by national experts with thorough knowledge of local vegetation and land uses. Each workshop starts with training on the RSS methodology, followed by a field visit to illustrate and discuss samples that are difficult to assess with remote sensing. The latter parts of workshops focus on data collection for the samples assigned to each country and territory.
The RSS was still under implementation in early 2020. By then, capacity-development workshops had involved participants from 70 countries, trained 384 national experts on the methodology, and obtained 134 700 samples. Data collection will be completed in 2020 and the reporting of results is scheduled for 2021.
More information on the RSS is available at www.fao.org/forest-resources-assessment/remote-sensing/fra-2020-remote-sensing-survey
Figure 52. Sample sites for the remote sensing survey
Source: FAO, 2020.
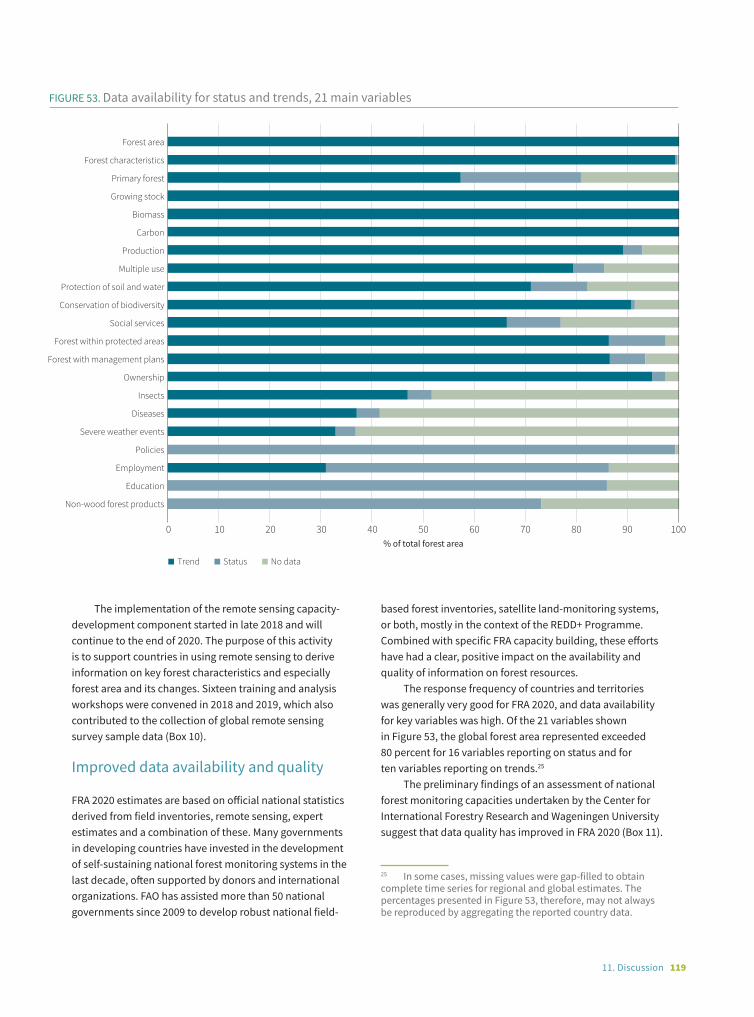
11911. Discussion
The implementation of the remote sensing capacity-development component started in late 2018 and will continue to the end of 2020. The purpose of this activity is to support countries in using remote sensing to derive information on key forest characteristics and especially forest area and its changes. Sixteen training and analysis workshops were convened in 2018 and 2019, which also contributed to the collection of global remote sensing survey sample data (Box 10).
Improved data availability and quality
FRA 2020 estimates are based on official national statistics derived from field inventories, remote sensing, expert estimates and a combination of these. Many governments in developing countries have invested in the development of self-sustaining national forest monitoring systems in the last decade, often supported by donors and international organizations. FAO has assisted more than 50 national governments since 2009 to develop robust national field-
FIGURE 53. Data availability for status and trends, 21 main variables
Trend Status No data
0 10 20 30 40 50% of total forest area
60 70 80 90 100
Forest area
Forest characteristics
Primary forest
Growing stock
Biomass
Carbon
Production
Multiple use
Protection of soil and water
Conservation of biodiversity
Social services
Forest within protected areas
Forest with management plans
Ownership
Insects
Diseases
Severe weather events
Policies
Employment
Education
Non-wood forest products
based forest inventories, satellite land-monitoring systems, or both, mostly in the context of the REDD+ Programme. Combined with specific FRA capacity building, these efforts have had a clear, positive impact on the availability and quality of information on forest resources.
The response frequency of countries and territories was generally very good for FRA 2020, and data availability for key variables was high. Of the 21 variables shown in Figure 53, the global forest area represented exceeded 80 percent for 16 variables reporting on status and for ten variables reporting on trends.25
The preliminary findings of an assessment of national forest monitoring capacities undertaken by the Center for International Forestry Research and Wageningen University suggest that data quality has improved in FRA 2020 (Box 11).
25 In some cases, missing values were gap-filled to obtain complete time series for regional and global estimates. The percentages presented in Figure 53, therefore, may not always be reproduced by aggregating the reported country data.

120 Global Forest Resources Assessment 2020
Box 11. National forest monitoring tier assessment
The Center for International Forestry Research (CIFOR) and Wageningen University assessed national forest monitoring capacities based on country reports submitted for the Global Forest Resources Assessment (FRA) 2020.26
The assessment applied a three-class tier system for data quality (Table 85) to a selection of core forest indicators: forest-area status, forest-area trend, growing-stock status, growing-stock trend, biomass, and carbon (Table 86 and Table 87).
26 The analysis was conducted by Mst Karimon Nesha, Veronique De Sy and Martin Herold (CIFOR/Wageningen University), updating a previous publication by Romijn et al. (2015). The full findings of the FRA 2020 analysis will be published in 2020.
TABLE 85. The three-class tier system applied in the assessment of data quality
Class Variable Status Trend
Tier 3 Forest area Data from 2013 or more recentSource: national forest inventories (NFIs), remote sensing surveys or wall-to-wall mapping
Multiple sets of consistent data (in terms of methods and classes), 2013 or more recent, including change estimates from (e.g.) REDD+ forest reference (emission) levels
Growing stock Data from 2009 or more recent Source: NFIs or remote sensing-based method calibrated with plot data
Multiple consistent NFIs or consistent remote sensing-based estimate
Biomass Country-specific expansion factors or allometric equations used for deriving biomass estimates
Carbon Data provided for all five carbon pools
Tier 2 Forest area Data older than 2013Source: NFIs, remote sensing surveys or wall-to-wall mapping
Limited consistency between data sources
Growing stock Data older than 2009 Multiple NFIs or remote sensing-based estimates but limited consistency and/or older than 2009
Carbon Data provided for at least two carbon pools
Tier 1 Forest area Other data sources, such as registers or questionnaires, expert assessments
Other data sources, including data from registers or questionnaires, and expert assessments
Growing stock
Biomass Use of Intergovernmental Panel on Climate Change default factors or generic equations
Carbon Other
TABLE 86. Number of countries by data-reliability tier, for six indicators
Indicator FRA 2015 FRA 2020
No data Tier 1 Tier 2 Tier 3 No data Tier 1 Tier 2 Tier 3
Forest-area status 0 106 64 66 0 54 57 125
Forest-area trend 0 128 64 44 0 71 62 103
Growing-stock status 34 113 44 45 32 72 40 92
Growing-stock trend 36 129 41 30 32 84 60 60
Biomass* 36 149 – 51 30 146 – 60
Carbon 37 – – – 30 22 139 45
Note: *Only tiers 1 and 3 were used for biomass.
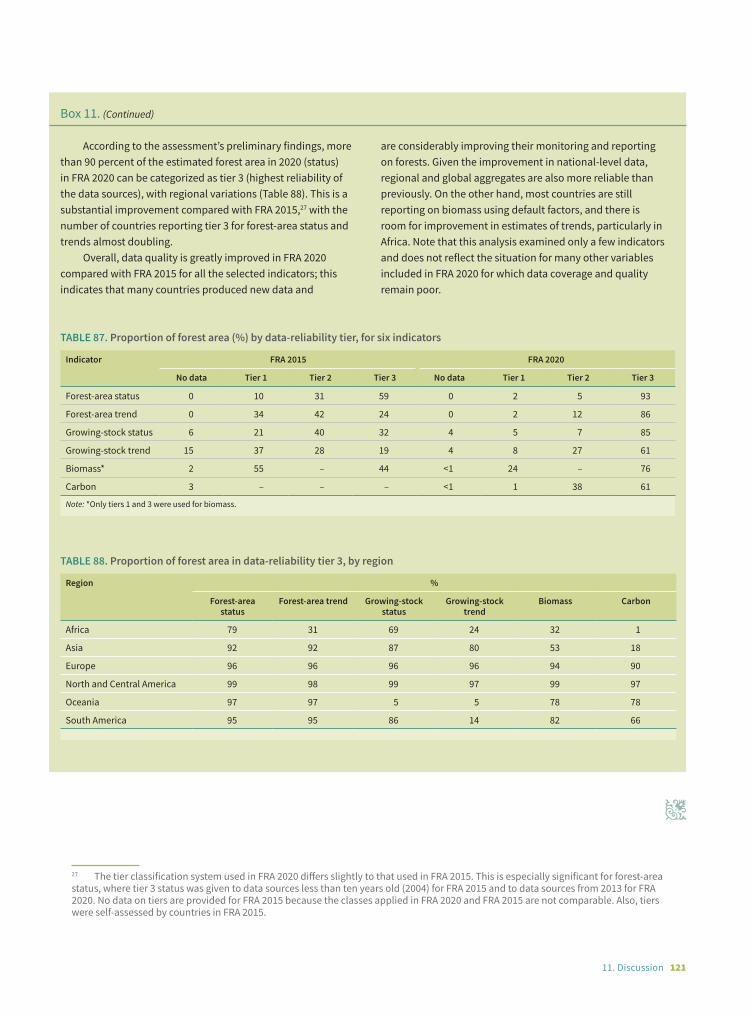
12111. Discussion
Box 11. (Continued)
According to the assessment’s preliminary findings, more than 90 percent of the estimated forest area in 2020 (status) in FRA 2020 can be categorized as tier 3 (highest reliability of the data sources), with regional variations (Table 88). This is a substantial improvement compared with FRA 2015,27 with the number of countries reporting tier 3 for forest-area status and trends almost doubling.
Overall, data quality is greatly improved in FRA 2020 compared with FRA 2015 for all the selected indicators; this indicates that many countries produced new data and
are considerably improving their monitoring and reporting on forests. Given the improvement in national-level data, regional and global aggregates are also more reliable than previously. On the other hand, most countries are still reporting on biomass using default factors, and there is room for improvement in estimates of trends, particularly in Africa. Note that this analysis examined only a few indicators and does not reflect the situation for many other variables included in FRA 2020 for which data coverage and quality remain poor.
27 The tier classification system used in FRA 2020 differs slightly to that used in FRA 2015. This is especially significant for forest-area status, where tier 3 status was given to data sources less than ten years old (2004) for FRA 2015 and to data sources from 2013 for FRA 2020. No data on tiers are provided for FRA 2015 because the classes applied in FRA 2020 and FRA 2015 are not comparable. Also, tiers were self-assessed by countries in FRA 2015.
TABLE 87. Proportion of forest area (%) by data-reliability tier, for six indicators
Indicator FRA 2015 FRA 2020
No data Tier 1 Tier 2 Tier 3 No data Tier 1 Tier 2 Tier 3
Forest-area status 0 10 31 59 0 2 5 93
Forest-area trend 0 34 42 24 0 2 12 86
Growing-stock status 6 21 40 32 4 5 7 85
Growing-stock trend 15 37 28 19 4 8 27 61
Biomass* 2 55 – 44 <1 24 – 76
Carbon 3 – – – <1 1 38 61
Note: *Only tiers 1 and 3 were used for biomass.
TABLE 88. Proportion of forest area in data-reliability tier 3, by region
Region %
Forest-area status
Forest-area trend Growing-stock status
Growing-stock trend
Biomass Carbon
Africa 79 31 69 24 32 1
Asia 92 92 87 80 53 18
Europe 96 96 96 96 94 90
North and Central America 99 98 99 97 99 97
Oceania 97 97 5 5 78 78
South America 95 95 86 14 82 66
m

@ F
AO /
NCo
gnom
e

@ F
AO /
NCo
gnom
e
12 Conclusion
©FA
O/S
erge
i Gap
on
12512. Conclusion
Take-home messages
The global forest area continues to shrink – by an average of 4.7 million ha per year. Globally, the rate of net forest loss has declined since the 1990s, but the latest data show that the pace of this decline slowed in the most recent ten-year period, mainly because the forest area in Asia and Europe expanded less than in the previous decade. Given the current global trend of a shrinking net forest area, it is unlikely that the Global Forest Goal of increasing the world’s forest area by 3 percent will be met by 2030.
Halting deforestation remains a challenge. Deforestation continues, albeit at a lower rate than in the past. In the most recent five-year period (2015–2020), deforestation occurred at a rate of 10 million ha per year – 2 million ha less per year than in 2010–2015. At this rate of reduction, however, achieving the SDG 15 target of halting deforestation will take another 25 years.
The deforestation hotspot is now in Africa. More than 90 percent of deforestation is taking place in the tropics. Of the world’s six regions, Africa lost the largest area to deforestation in 2010–2020, surpassing South America (the previous leader). Earlier studies have shown that, in tropical and subtropical countries, agricultural expansion accounts for 73 percent of deforestation. In Africa, the continuation of a high rate of deforestation largely reflects the combined impacts of high population growth and the need to sustain livelihoods with small-scale agriculture.
Deforestation has halved in Asia and South America. Deforestation rates in Asia and South America are only about half what they were in the 1990s. In Asia, this is mainly the result of reductions in deforestation in South and Southeast Asia. The decline in deforestation in South America is due largely to a reduction in Brazil, particularly between 2010 and 2015, although some other countries in the region have also curbed deforestation.
Forest management is moving towards sustainability. Long-term management plans exist for more than half the global forest area, and the area of forest with management plans has increased steadily since 2000. Less than 25 percent of the forest area in Africa and South America is under long-term management plans, however; this is cause for concern, given that the existence of such plans is an indicator of the intention to sustainably manage forest resources.
Production is still an important forest management objective. About 30 percent of all forests globally is managed primarily for the production of wood and non-wood forest products – this has been the case since at least 1990. Although the volume of wood removals increased between 1990 and 2020, the number of people employed in forestry and logging declined because of increases (in some regions) in mechanization and labour productivity.
Aichi Biodiversity Target 11 (to protect at least 17 percent of the terrestrial area by 2020) has been exceeded for forest ecosystems as a whole. Globally, 18 percent of the world’s forest area, or more than 700 million ha, is in legally established protected areas such as national parks, conservation areas and game reserves (IUCN categories I–IV).
Urgent action is needed to strengthen the positive trend of declining deforestation and to incentivize afforestation, forest restoration and forest conservation, especially in tropical developing countries. Such action is necessary if the world is to meet commitments to halt deforestation, increase forest area, and restore 350 million ha of the world’s deforested and degraded land.
Global forest monitoring capacity is greater than ever, but important information gaps remain. Countries need additional support to improve their capacity to collect and report data on a number of key forest indicators. By
@ F
AO /
NCo
gnom
e
126 Global Forest Resources Assessment 2020
facilitating the sharing of tools and data sources, FAO’s new digital reporting platform is helping address such information gaps.
Next steps
FRA is a country-driven process, which FAO conducts at the request of its member states. Future assessments should continue to build capacity in countries with the aim of enabling continuous forest reporting capacity. This is likely to be increasingly important, with emerging needs for frequent reporting on key variables and indicators – such as the two forest-related SDG indicators, which also have strong linkages with other initiatives such as the New York Declaration on Forests and the Bonn Challenge.
The aim behind several changes to FRA 2020 was to reduce the reporting burden for countries and improve data availability and consistency. This effort should continue as a means to assist national and international policy formulation and decision-making processes. With support from the European Union, the Government of Norway, the Global Environment Facility and potentially other donors, and in collaboration with FAO member states, the FRA Advisory Group, Collaborative Forest Resources Questionnaire partners, and others, FRA will continue to evolve as a dynamic and transparent reporting process that provides easy access to up-to-date, high-quality data.
g

Annexes
@ F
AO /
NCo
gnom
e

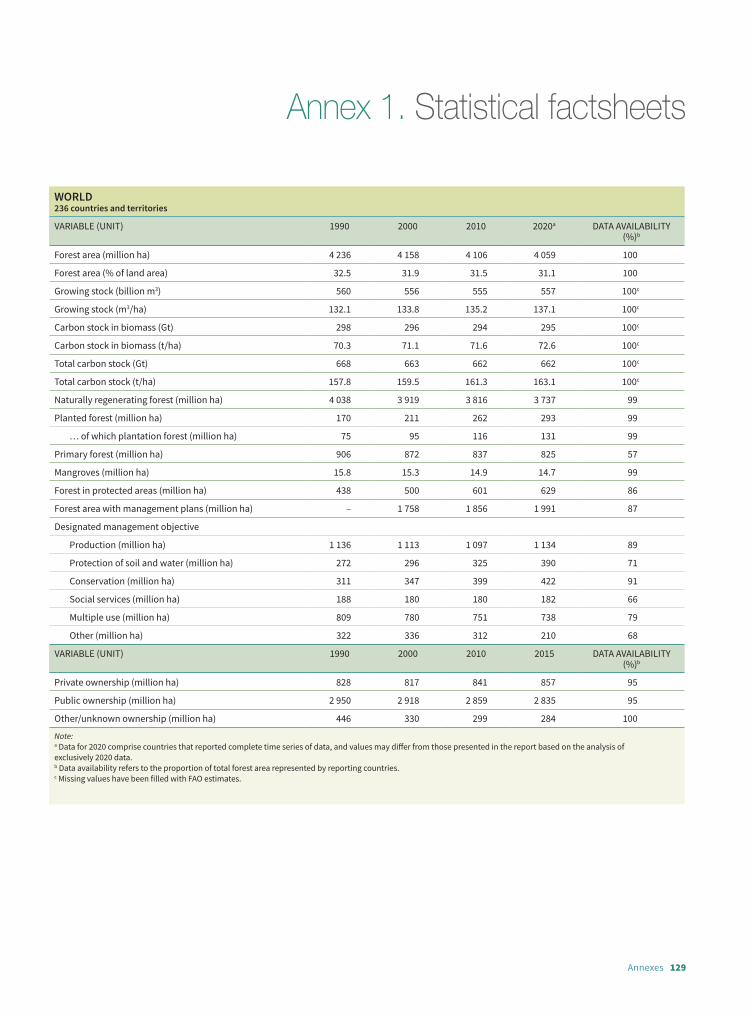
129Annexes
WORLD236 countries and territories
VARIABLE (UNIT) 1990 2000 2010 2020a DATA AVAILABILITY (%)b
Forest area (million ha) 4 236 4 158 4 106 4 059 100
Forest area (% of land area) 32.5 31.9 31.5 31.1 100
Growing stock (billion m3) 560 556 555 557 100c
Growing stock (m3/ha) 132.1 133.8 135.2 137.1 100c
Carbon stock in biomass (Gt) 298 296 294 295 100c
Carbon stock in biomass (t/ha) 70.3 71.1 71.6 72.6 100c
Total carbon stock (Gt) 668 663 662 662 100c
Total carbon stock (t/ha) 157.8 159.5 161.3 163.1 100c
Naturally regenerating forest (million ha) 4 038 3 919 3 816 3 737 99
Planted forest (million ha) 170 211 262 293 99
… of which plantation forest (million ha) 75 95 116 131 99
Primary forest (million ha) 906 872 837 825 57
Mangroves (million ha) 15.8 15.3 14.9 14.7 99
Forest in protected areas (million ha) 438 500 601 629 86
Forest area with management plans (million ha) – 1 758 1 856 1 991 87
Designated management objective
Production (million ha) 1 136 1 113 1 097 1 134 89
Protection of soil and water (million ha) 272 296 325 390 71
Conservation (million ha) 311 347 399 422 91
Social services (million ha) 188 180 180 182 66
Multiple use (million ha) 809 780 751 738 79
Other (million ha) 322 336 312 210 68
VARIABLE (UNIT) 1990 2000 2010 2015 DATA AVAILABILITY (%)b
Private ownership (million ha) 828 817 841 857 95
Public ownership (million ha) 2 950 2 918 2 859 2 835 95
Other/unknown ownership (million ha) 446 330 299 284 100
Note: a Data for 2020 comprise countries that reported complete time series of data, and values may differ from those presented in the report based on the analysis of exclusively 2020 data. b Data availability refers to the proportion of total forest area represented by reporting countries. c Missing values have been filled with FAO estimates.
Annex 1. Statistical factsheets

130 Global Forest Resources Assessment 2020
AFRICA58 countries and territories
VARIABLE (UNIT) 1990 2000 2010 2020a DATA AVAILABILITY (%)b
Forest area (million ha) 743 710 676 637 100
Forest area (% of land area) 24.9 23.8 22.6 21.3 100
Growing stock (billion m3) 88 84 81 76 100c
Growing stock (m3/ha) 118.0 118.8 119.8 120.0 100c
Carbon stock in biomass (Gt) 59 56 54 51 100c
Carbon stock in biomass (t/ha) 79.1 79.3 79.5 79.4 100c
Total carbon stock (Gt) 94 90 86 81 100c
Total carbon stock (t/ha) 126.9 126.9 127.1 127.1 100c
Naturally regenerating forest (million ha) 734 701 665 625 100
Planted forest (million ha) 8.5 8.9 10.6 11.4 100
… of which plantation forest (million ha) 6.0 6.2 7.1 7.7 100
Primary forest (million ha) 143 137 131 123 51
Mangroves (million ha) 3.40 3.33 3.26 3.24 95
Forest in protected areas (million ha) 124 125 129 131 72
Forest area with management plans (million ha) – 79 91 118 64
Designated management objective
Production (million ha) 109 104 91 91 79
Protection of soil and water (million ha) 43 41 38 36 52
Conservation (million ha) 95 97 104 107 69
Social services (million ha) 2.0 1.8 1.7 3.0 28
Multiple use (million ha) 95 88 82 73 37
Other (million ha) 0 0 0 0 23
VARIABLE (UNIT) 1990 2000 2010 2015 DATA AVAILABILITY (%)b
Private ownership (million ha) 46 39 37 36 93
Public ownership (million ha) 526 508 481 463 93
Other/unknown ownership (million ha) 166 158 154 157 100
Note: a Data for 2020 comprise countries that reported complete time series of data, and values may differ from those presented in the report based on the analysis of exclusively 2020 data. b Data availability refers to the proportion of total forest area represented by reporting countries. c Missing values have been filled with FAO estimates.
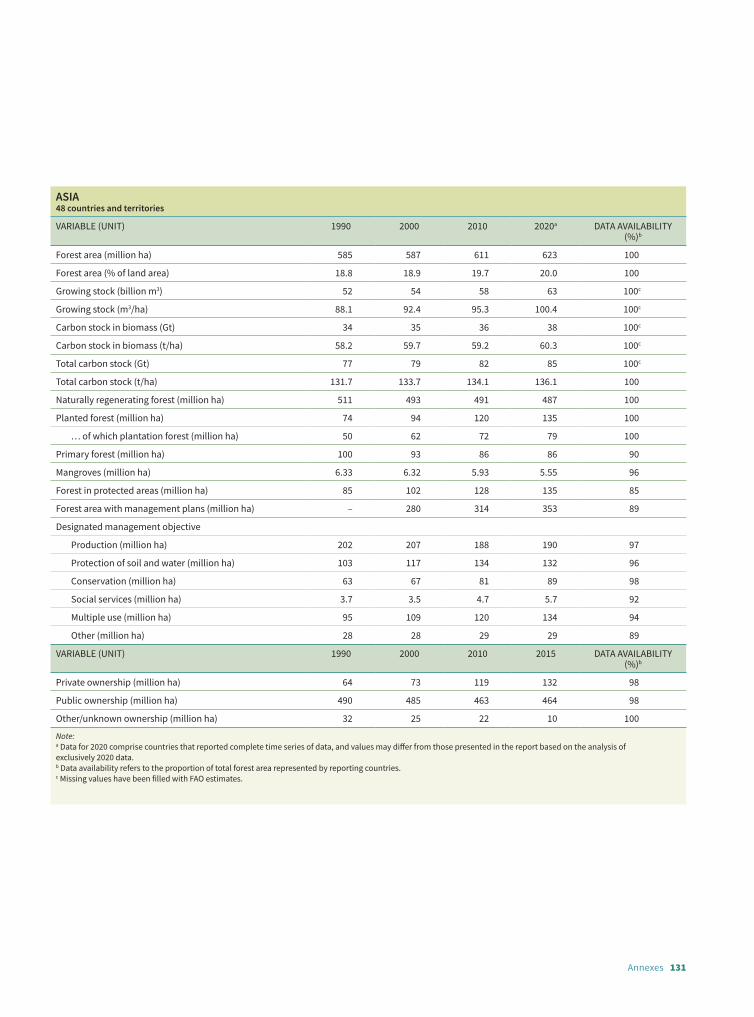
131Annexes
ASIA48 countries and territories
VARIABLE (UNIT) 1990 2000 2010 2020a DATA AVAILABILITY (%)b
Forest area (million ha) 585 587 611 623 100
Forest area (% of land area) 18.8 18.9 19.7 20.0 100
Growing stock (billion m3) 52 54 58 63 100c
Growing stock (m3/ha) 88.1 92.4 95.3 100.4 100c
Carbon stock in biomass (Gt) 34 35 36 38 100c
Carbon stock in biomass (t/ha) 58.2 59.7 59.2 60.3 100c
Total carbon stock (Gt) 77 79 82 85 100c
Total carbon stock (t/ha) 131.7 133.7 134.1 136.1 100
Naturally regenerating forest (million ha) 511 493 491 487 100
Planted forest (million ha) 74 94 120 135 100
… of which plantation forest (million ha) 50 62 72 79 100
Primary forest (million ha) 100 93 86 86 90
Mangroves (million ha) 6.33 6.32 5.93 5.55 96
Forest in protected areas (million ha) 85 102 128 135 85
Forest area with management plans (million ha) – 280 314 353 89
Designated management objective
Production (million ha) 202 207 188 190 97
Protection of soil and water (million ha) 103 117 134 132 96
Conservation (million ha) 63 67 81 89 98
Social services (million ha) 3.7 3.5 4.7 5.7 92
Multiple use (million ha) 95 109 120 134 94
Other (million ha) 28 28 29 29 89
VARIABLE (UNIT) 1990 2000 2010 2015 DATA AVAILABILITY (%)b
Private ownership (million ha) 64 73 119 132 98
Public ownership (million ha) 490 485 463 464 98
Other/unknown ownership (million ha) 32 25 22 10 100
Note: a Data for 2020 comprise countries that reported complete time series of data, and values may differ from those presented in the report based on the analysis of exclusively 2020 data. b Data availability refers to the proportion of total forest area represented by reporting countries. c Missing values have been filled with FAO estimates.

132 Global Forest Resources Assessment 2020
EUROPE50 countries and territories
VARIABLE (UNIT) 1990 2000 2010 2020a DATA AVAILABILITY (%)b
Forest area (million ha) 994 1 002 1 014 1 017 100
Forest area (% of land area) 44.9 45.3 45.8 46.0 100
Growing stock (billion m3) 104 108 113 116 100c
Growing stock (m3/ha) 104.9 107.8 111.5 114.2 100c
Carbon stock in biomass (Gt) 45 48 51 55 100c
Carbon stock in biomass (t/ha) 45.4 47.5 50.5 53.6 100c
Total carbon stock (Gt) 159 162 168 172 100c
Total carbon stock (t/ha) 159.7 162.1 165.8 169.5 100c
Naturally regenerating forest (million ha) 913 913 914 915 97
Planted forest (million ha) 54 62 72 74 97
… of which plantation forest (million ha) 2.9 3.8 4.2 4.0 97
Primary forest (million ha) 0.85 0.99 1.32 1.41 44
Mangroves (million ha) 0 0 0 0 100
Forest in protected areas (million ha) 18 29 41 46 94
Forest area with management plans (million ha) – 934 938 942 96
Designated management objective
Production (million ha) 510 473 482 514 95
Protection of soil and water (million ha) 76 90 106 171 94
Conservation (million ha) 18 28 35 39 97
Social services (million ha) 24 17 18 19 96
Multiple use (million ha) 38 38 41 43 94
Other (million ha) 277 303 279 178 96
VARIABLE (UNIT) 1990 2000 2010 2015 DATA AVAILABILITY (%)b
Private ownership (million ha) 74 83 90 92 97
Public ownership (million ha) 894 890 895 895 97
Other/unknown ownership (million ha) 18 20 8 28 100
Note: a Data for 2020 comprise countries that reported complete time series of data, and values may differ from those presented in the report based on the analysis of exclusively 2020 data. b Data availability refers to the proportion of total forest area represented by reporting countries. c Missing values have been filled with FAO estimates.

133Annexes
NORTH AND CENTRAL AMERICA41 countries and territories
VARIABLE (UNIT) 1990 2000 2010 2020a DATA AVAILABILITY (%)b
Forest area (million ha) 755 752 754 753 100
Forest area (% of land area) 35.4 35.3 35.4 35.3 100
Growing stock (billion m3) 90 92 93 95 100c
Growing stock (m3/ha) 119.6 122.0 123.6 126.3 100c
Carbon stock in biomass (Gt) 39 40 41 42 100c
Carbon stock in biomass (t/ha) 52.2 53.7 54.2 55.3 100c
Total carbon stock (Gt) 143 144 146 146 100c
Total carbon stock (t/ha) 189.6 191.6 193.0 194.1 100c
Naturally regenerating forest (million ha) 732 720 714 706 100
Planted forest (million ha) 23 33 41 47 100
… of which plantation forest (million ha) 6.6 9.3 13.5 15.2 100
Primary forest (million ha) 317 314 314 313 97
Mangroves (million ha) 2.43 2.44 2.45 2.55 100
Forest in protected areas (million ha) 42 51 71 73 98
Forest area with management plans (million ha) – 387 401 432 97
Designated management objective
Production (million ha) 207 217 225 230 88
Protection of soil and water (million ha) 16 16 17 17 47
Conservation (million ha) 46 53 69 74 97
Social services (million ha) 15 15 15 15 47
Multiple use (million ha) 260 260 258 254 88
Other (million ha) 0.9 1.0 0.9 0.9 47
VARIABLE (UNIT) 1990 2000 2010 2015 DATA AVAILABILITY (%)b
Private ownership (million ha) 264 263 262 264 97
Public ownership (million ha) 450 450 455 455 97
Other/unknown ownership (million ha) 41 39 36 32 100
Note: a Data for 2020 comprise countries that reported complete time series of data, and values may differ from those presented in the report based on the analysis of exclusively 2020 data. b Data availability refers to the proportion of total forest area represented by reporting countries. c Missing values have been filled with FAO estimates.
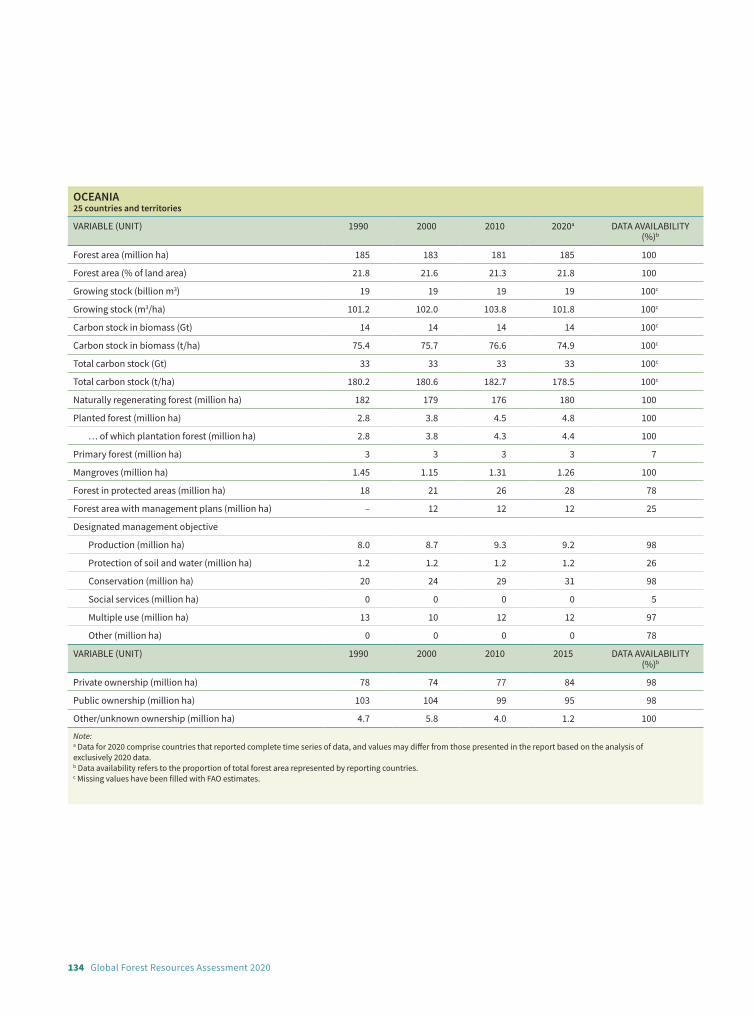
134 Global Forest Resources Assessment 2020
OCEANIA25 countries and territories
VARIABLE (UNIT) 1990 2000 2010 2020a DATA AVAILABILITY (%)b
Forest area (million ha) 185 183 181 185 100
Forest area (% of land area) 21.8 21.6 21.3 21.8 100
Growing stock (billion m3) 19 19 19 19 100c
Growing stock (m3/ha) 101.2 102.0 103.8 101.8 100c
Carbon stock in biomass (Gt) 14 14 14 14 100c
Carbon stock in biomass (t/ha) 75.4 75.7 76.6 74.9 100c
Total carbon stock (Gt) 33 33 33 33 100c
Total carbon stock (t/ha) 180.2 180.6 182.7 178.5 100c
Naturally regenerating forest (million ha) 182 179 176 180 100
Planted forest (million ha) 2.8 3.8 4.5 4.8 100
… of which plantation forest (million ha) 2.8 3.8 4.3 4.4 100
Primary forest (million ha) 3 3 3 3 7
Mangroves (million ha) 1.45 1.15 1.31 1.26 100
Forest in protected areas (million ha) 18 21 26 28 78
Forest area with management plans (million ha) – 12 12 12 25
Designated management objective
Production (million ha) 8.0 8.7 9.3 9.2 98
Protection of soil and water (million ha) 1.2 1.2 1.2 1.2 26
Conservation (million ha) 20 24 29 31 98
Social services (million ha) 0 0 0 0 5
Multiple use (million ha) 13 10 12 12 97
Other (million ha) 0 0 0 0 78
VARIABLE (UNIT) 1990 2000 2010 2015 DATA AVAILABILITY (%)b
Private ownership (million ha) 78 74 77 84 98
Public ownership (million ha) 103 104 99 95 98
Other/unknown ownership (million ha) 4.7 5.8 4.0 1.2 100
Note: a Data for 2020 comprise countries that reported complete time series of data, and values may differ from those presented in the report based on the analysis of exclusively 2020 data. b Data availability refers to the proportion of total forest area represented by reporting countries. c Missing values have been filled with FAO estimates.

135Annexes
SOUTH AMERICA14 countries and territories
VARIABLE (UNIT) 1990 2000 2010 2020a DATA AVAILABILITY (%)b
Forest area (million ha) 974 923 870 844 100
Forest area (% of land area) 55.8 52.8 49.8 48.3 100
Growing stock (billion m3) 207 199 191 187 100c
Growing stock (m3/ha) 212.8 215.7 219.2 222.1 100c
Carbon stock in biomass (Gt) 106 102 98 96 100c
Carbon stock in biomass (t/ha) 109.4 111.0 112.9 114.1 100c
Total carbon stock (Gt) 162 155 148 145 100c
Total carbon stock (t/ha) 166.1 167.9 170.0 171.6 100c
Naturally regenerating forest (million ha) 967 913 855 824 100
Planted forest (million ha) 7.0 9.4 14.9 20.2 100
… of which plantation forest (million ha) 7.0 9.3 14.7 20.1 100
Primary forest (million ha) 342 325 302 299 72
Mangroves (million ha) 2.15 2.05 1.98 2.12 100
Forest in protected areas (million ha) 150 172 206 216 80
Forest area with management plans (million ha) – 65 99 134 95
Designated management objective
Production (million ha) 99 102 102 100 83
Protection of soil and water (million ha) 33 31 30 34 71
Conservation (million ha) 68 78 82 83 86
Social services (million ha) 144 143 141 140 71
Multiple use (million ha) 309 275 238 223 71
Other (million ha) 16 3.0 3.0 2.9 71
VARIABLE (UNIT) 1990 2000 2010 2015 DATA AVAILABILITY (%)b
Private ownership (million ha) 302 286 255 248 87
Public ownership (million ha) 488 480 466 462 87
Other/unknown ownership (million ha) 184 82 75 55 100
Note: a Data for 2020 comprise countries that reported complete time series of data, and values may differ from those presented in the report based on the analysis of exclusively 2020 data. b Data availability refers to the proportion of total forest area represented by reporting countries. c Missing values have been filled with FAO estimates.

136 Global Forest Resources Assessment 2020
TABLE A1. (Continued)
Country/territory Forest area (1 000 ha) Net annual change
1990 2000 2010 2020 1990–2000 2000–2010 2010–2020
1 000 ha/yr
% 1 000 ha/yr
% 1 000 ha/yr
%
Afghanistan 1 208 1 208 1 208 1 208 0.0 0.00 0.0 0.00 0.0 0.00
Albania 789 769 782 789 -2.0 -0.25 1.3 0.16 0.7 0.09
Algeria 1 667 1 579 1 918 1 949 -8.8 -0.54 33.9 1.96 3.1 0.16
American Samoa 18 18 17 17 n.s. -0.19 n.s. -0.17 n.s. -0.17
Andorra 16 16 16 16 0.0 0.00 0.0 0.00 0.0 0.00
Angola 79 263 77 709 72 158 66 607 -155.4 -0.20 -555.1 -0.74 -555.1 -0.80
Anguilla 6 6 6 6 0.0 0.00 0.0 0.00 0.0 0.00
Antigua and Barbuda 10 9 9 8 -0.1 -0.67 -0.1 -0.73 -0.1 -0.78
Argentina 35 204 33 378 30 214 28 573 -182.6 -0.53 -316.4 -0.99 -164.1 -0.56
Armenia 335 333 331 328 -0.2 -0.06 -0.2 -0.06 -0.2 -0.06
Aruba n.s. n.s. n.s. n.s. 0.0 0.00 0.0 0.00 0.0 0.00
Australia 133 882 131 814 129 546 134 005 -206.8 -0.16 -226.8 -0.17 445.9 0.34
Austria 3 776 3 838 3 863 3 899 6.2 0.16 2.5 0.07 3.6 0.09
Azerbaijan 945 987 1 032 1 132 4.2 0.44 4.5 0.45 9.9 0.92
Bahamas 510 510 510 510 0.0 0.00 0.0 0.00 0.0 0.00
Bahrain n.s. n.s. 1 1 n.s. 5.34 n.s. 3.46 n.s. 3.02
Bangladesh 1 920 1 920 1 888 1 883 n.s. n.s. -3.2 -0.17 -0.5 -0.03
Barbados 6 6 6 6 0.0 0.00 0.0 0.00 0.0 0.00
Belarus 7 780 8 273 8 630 8 768 49.3 0.62 35.7 0.42 13.8 0.16
Belgium 677 667 690 689 -1.0 -0.15 2.3 0.33 -0.1 -0.01
Belize 1 600 1 459 1 391 1 277 -14.1 -0.92 -6.8 -0.48 -11.4 -0.85
Benin 4 835 4 135 3 635 3 135 -70.0 -1.55 -50.0 -1.28 -50.0 -1.47
Bermuda 1 1 1 1 0.0 0.00 0.0 0.00 0.0 0.00
Bhutan 2 507 2 606 2 705 2 725 9.9 0.39 9.9 0.37 2.0 0.07
Bolivia (Plurinational State of) 57 805 55 101 53 086 50 834 -270.3 -0.48 -201.5 -0.37 -225.2 -0.43
Bonaire, Sint Eustatius and Saba
2 2 2 2 0.0 0.00 0.0 0.00 0.0 0.00
Bosnia and Herzegovina 2 210 2 112 2 103 2 188 -9.8 -0.45 -0.9 -0.04 8.5 0.40
Botswana 18 804 17 621 16 438 15 255 -118.3 -0.65 -118.3 -0.69 -118.3 -0.74
Brazil 588 898 551 089 511 581 496 620 -3 780.9 -0.66 -3 950.8 -0.74 -1 496.1 -0.30
British Virgin Islands 4 4 4 4 n.s. -0.11 n.s. -0.08 n.s. -0.06
Brunei Darussalam 413 397 380 380 -1.6 -0.39 -1.7 -0.44 0.0 0.00
Bulgaria 3 327 3 375 3 737 3 893 4.8 0.14 36.2 1.02 15.6 0.41
Burkina Faso 7 717 7 217 6 717 6 216 -50.0 -0.67 -50.0 -0.72 -50.0 -0.77
(Continued)
Annex 2. Global tables
TABLE A1. Extent of forest, 1990–2020
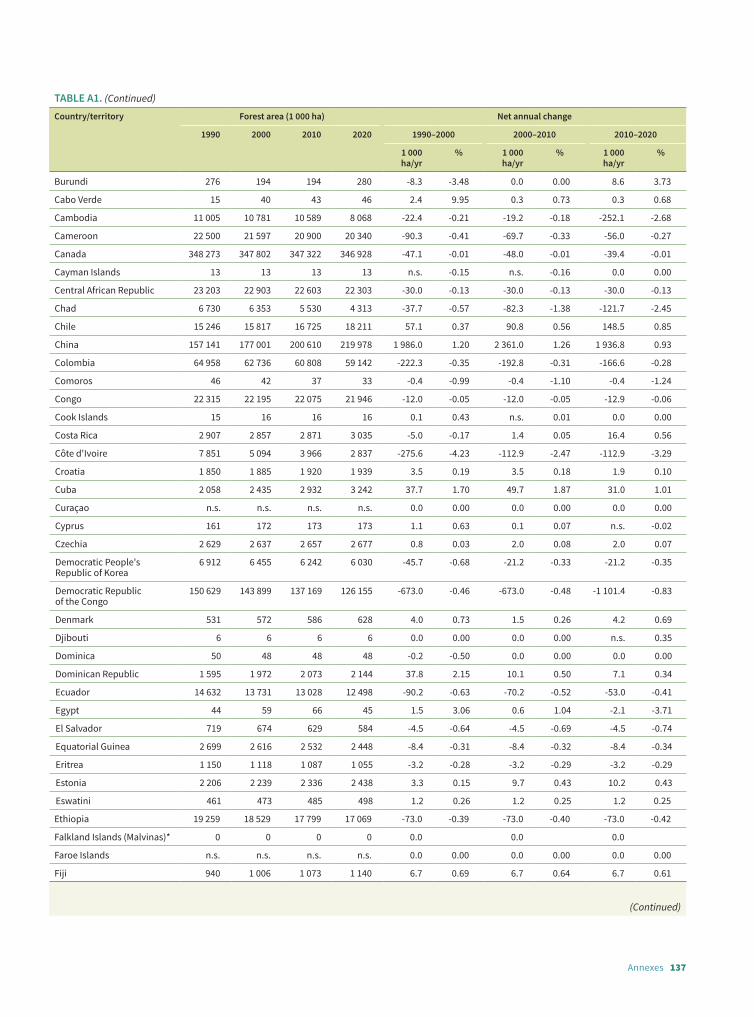
137Annexes
TABLE A1. (Continued)
Country/territory Forest area (1 000 ha) Net annual change
1990 2000 2010 2020 1990–2000 2000–2010 2010–2020
1 000 ha/yr
% 1 000 ha/yr
% 1 000 ha/yr
%
Burundi 276 194 194 280 -8.3 -3.48 0.0 0.00 8.6 3.73
Cabo Verde 15 40 43 46 2.4 9.95 0.3 0.73 0.3 0.68
Cambodia 11 005 10 781 10 589 8 068 -22.4 -0.21 -19.2 -0.18 -252.1 -2.68
Cameroon 22 500 21 597 20 900 20 340 -90.3 -0.41 -69.7 -0.33 -56.0 -0.27
Canada 348 273 347 802 347 322 346 928 -47.1 -0.01 -48.0 -0.01 -39.4 -0.01
Cayman Islands 13 13 13 13 n.s. -0.15 n.s. -0.16 0.0 0.00
Central African Republic 23 203 22 903 22 603 22 303 -30.0 -0.13 -30.0 -0.13 -30.0 -0.13
Chad 6 730 6 353 5 530 4 313 -37.7 -0.57 -82.3 -1.38 -121.7 -2.45
Chile 15 246 15 817 16 725 18 211 57.1 0.37 90.8 0.56 148.5 0.85
China 157 141 177 001 200 610 219 978 1 986.0 1.20 2 361.0 1.26 1 936.8 0.93
Colombia 64 958 62 736 60 808 59 142 -222.3 -0.35 -192.8 -0.31 -166.6 -0.28
Comoros 46 42 37 33 -0.4 -0.99 -0.4 -1.10 -0.4 -1.24
Congo 22 315 22 195 22 075 21 946 -12.0 -0.05 -12.0 -0.05 -12.9 -0.06
Cook Islands 15 16 16 16 0.1 0.43 n.s. 0.01 0.0 0.00
Costa Rica 2 907 2 857 2 871 3 035 -5.0 -0.17 1.4 0.05 16.4 0.56
Côte d'Ivoire 7 851 5 094 3 966 2 837 -275.6 -4.23 -112.9 -2.47 -112.9 -3.29
Croatia 1 850 1 885 1 920 1 939 3.5 0.19 3.5 0.18 1.9 0.10
Cuba 2 058 2 435 2 932 3 242 37.7 1.70 49.7 1.87 31.0 1.01
Curaçao n.s. n.s. n.s. n.s. 0.0 0.00 0.0 0.00 0.0 0.00
Cyprus 161 172 173 173 1.1 0.63 0.1 0.07 n.s. -0.02
Czechia 2 629 2 637 2 657 2 677 0.8 0.03 2.0 0.08 2.0 0.07
Democratic People's Republic of Korea
6 912 6 455 6 242 6 030 -45.7 -0.68 -21.2 -0.33 -21.2 -0.35
Democratic Republic of the Congo
150 629 143 899 137 169 126 155 -673.0 -0.46 -673.0 -0.48 -1 101.4 -0.83
Denmark 531 572 586 628 4.0 0.73 1.5 0.26 4.2 0.69
Djibouti 6 6 6 6 0.0 0.00 0.0 0.00 n.s. 0.35
Dominica 50 48 48 48 -0.2 -0.50 0.0 0.00 0.0 0.00
Dominican Republic 1 595 1 972 2 073 2 144 37.8 2.15 10.1 0.50 7.1 0.34
Ecuador 14 632 13 731 13 028 12 498 -90.2 -0.63 -70.2 -0.52 -53.0 -0.41
Egypt 44 59 66 45 1.5 3.06 0.6 1.04 -2.1 -3.71
El Salvador 719 674 629 584 -4.5 -0.64 -4.5 -0.69 -4.5 -0.74
Equatorial Guinea 2 699 2 616 2 532 2 448 -8.4 -0.31 -8.4 -0.32 -8.4 -0.34
Eritrea 1 150 1 118 1 087 1 055 -3.2 -0.28 -3.2 -0.29 -3.2 -0.29
Estonia 2 206 2 239 2 336 2 438 3.3 0.15 9.7 0.43 10.2 0.43
Eswatini 461 473 485 498 1.2 0.26 1.2 0.25 1.2 0.25
Ethiopia 19 259 18 529 17 799 17 069 -73.0 -0.39 -73.0 -0.40 -73.0 -0.42
Falkland Islands (Malvinas)* 0 0 0 0 0.0 0.0 0.0
Faroe Islands n.s. n.s. n.s. n.s. 0.0 0.00 0.0 0.00 0.0 0.00
Fiji 940 1 006 1 073 1 140 6.7 0.69 6.7 0.64 6.7 0.61
(Continued)
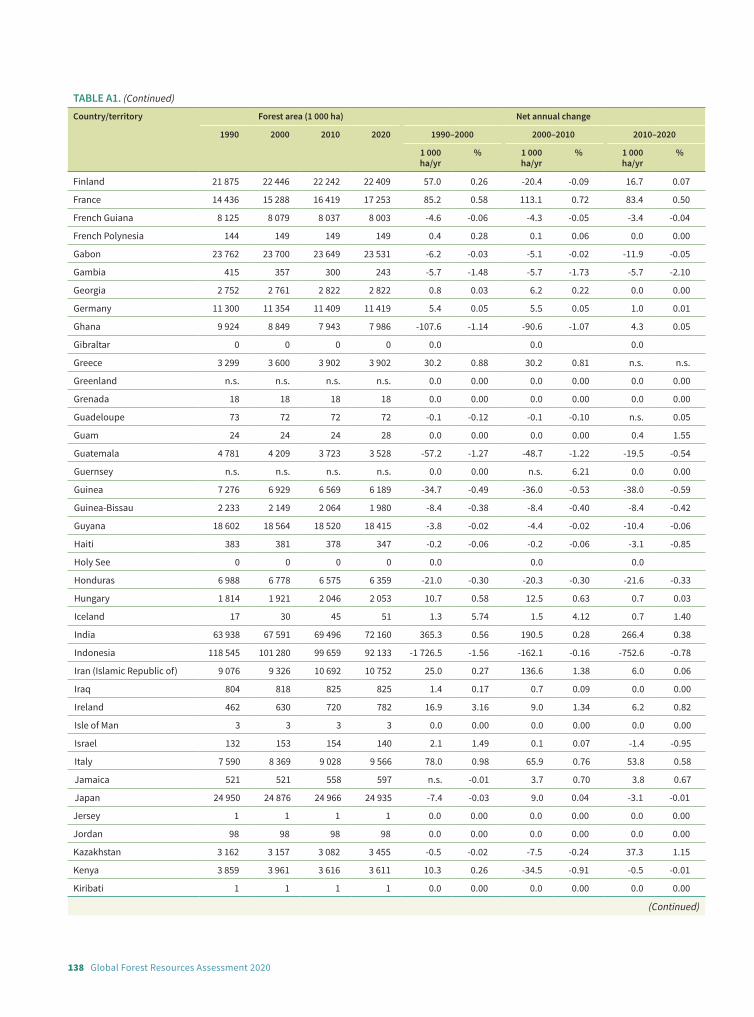
138 Global Forest Resources Assessment 2020
TABLE A1. (Continued)
Country/territory Forest area (1 000 ha) Net annual change
1990 2000 2010 2020 1990–2000 2000–2010 2010–2020
1 000 ha/yr
% 1 000 ha/yr
% 1 000 ha/yr
%
Finland 21 875 22 446 22 242 22 409 57.0 0.26 -20.4 -0.09 16.7 0.07
France 14 436 15 288 16 419 17 253 85.2 0.58 113.1 0.72 83.4 0.50
French Guiana 8 125 8 079 8 037 8 003 -4.6 -0.06 -4.3 -0.05 -3.4 -0.04
French Polynesia 144 149 149 149 0.4 0.28 0.1 0.06 0.0 0.00
Gabon 23 762 23 700 23 649 23 531 -6.2 -0.03 -5.1 -0.02 -11.9 -0.05
Gambia 415 357 300 243 -5.7 -1.48 -5.7 -1.73 -5.7 -2.10
Georgia 2 752 2 761 2 822 2 822 0.8 0.03 6.2 0.22 0.0 0.00
Germany 11 300 11 354 11 409 11 419 5.4 0.05 5.5 0.05 1.0 0.01
Ghana 9 924 8 849 7 943 7 986 -107.6 -1.14 -90.6 -1.07 4.3 0.05
Gibraltar 0 0 0 0 0.0 0.0 0.0
Greece 3 299 3 600 3 902 3 902 30.2 0.88 30.2 0.81 n.s. n.s.
Greenland n.s. n.s. n.s. n.s. 0.0 0.00 0.0 0.00 0.0 0.00
Grenada 18 18 18 18 0.0 0.00 0.0 0.00 0.0 0.00
Guadeloupe 73 72 72 72 -0.1 -0.12 -0.1 -0.10 n.s. 0.05
Guam 24 24 24 28 0.0 0.00 0.0 0.00 0.4 1.55
Guatemala 4 781 4 209 3 723 3 528 -57.2 -1.27 -48.7 -1.22 -19.5 -0.54
Guernsey n.s. n.s. n.s. n.s. 0.0 0.00 n.s. 6.21 0.0 0.00
Guinea 7 276 6 929 6 569 6 189 -34.7 -0.49 -36.0 -0.53 -38.0 -0.59
Guinea-Bissau 2 233 2 149 2 064 1 980 -8.4 -0.38 -8.4 -0.40 -8.4 -0.42
Guyana 18 602 18 564 18 520 18 415 -3.8 -0.02 -4.4 -0.02 -10.4 -0.06
Haiti 383 381 378 347 -0.2 -0.06 -0.2 -0.06 -3.1 -0.85
Holy See 0 0 0 0 0.0 0.0 0.0
Honduras 6 988 6 778 6 575 6 359 -21.0 -0.30 -20.3 -0.30 -21.6 -0.33
Hungary 1 814 1 921 2 046 2 053 10.7 0.58 12.5 0.63 0.7 0.03
Iceland 17 30 45 51 1.3 5.74 1.5 4.12 0.7 1.40
India 63 938 67 591 69 496 72 160 365.3 0.56 190.5 0.28 266.4 0.38
Indonesia 118 545 101 280 99 659 92 133 -1 726.5 -1.56 -162.1 -0.16 -752.6 -0.78
Iran (Islamic Republic of) 9 076 9 326 10 692 10 752 25.0 0.27 136.6 1.38 6.0 0.06
Iraq 804 818 825 825 1.4 0.17 0.7 0.09 0.0 0.00
Ireland 462 630 720 782 16.9 3.16 9.0 1.34 6.2 0.82
Isle of Man 3 3 3 3 0.0 0.00 0.0 0.00 0.0 0.00
Israel 132 153 154 140 2.1 1.49 0.1 0.07 -1.4 -0.95
Italy 7 590 8 369 9 028 9 566 78.0 0.98 65.9 0.76 53.8 0.58
Jamaica 521 521 558 597 n.s. -0.01 3.7 0.70 3.8 0.67
Japan 24 950 24 876 24 966 24 935 -7.4 -0.03 9.0 0.04 -3.1 -0.01
Jersey 1 1 1 1 0.0 0.00 0.0 0.00 0.0 0.00
Jordan 98 98 98 98 0.0 0.00 0.0 0.00 0.0 0.00
Kazakhstan 3 162 3 157 3 082 3 455 -0.5 -0.02 -7.5 -0.24 37.3 1.15
Kenya 3 859 3 961 3 616 3 611 10.3 0.26 -34.5 -0.91 -0.5 -0.01
Kiribati 1 1 1 1 0.0 0.00 0.0 0.00 0.0 0.00
(Continued)

139Annexes
TABLE A1. (Continued)
Country/territory Forest area (1 000 ha) Net annual change
1990 2000 2010 2020 1990–2000 2000–2010 2010–2020
1 000 ha/yr
% 1 000 ha/yr
% 1 000 ha/yr
%
Kuwait 3 5 6 6 0.1 3.46 0.1 2.57 0.0 0.00
Kyrgyzstan 1 136 1 181 1 230 1 315 4.4 0.38 4.9 0.41 8.6 0.68
Lao People's Democratic Republic
17 843 17 425 16 941 16 596 -41.8 -0.24 -48.5 -0.28 -34.5 -0.21
Latvia 3 173 3 241 3 372 3 411 6.8 0.21 13.1 0.40 3.9 0.11
Lebanon 140 138 137 143 -0.2 -0.11 -0.1 -0.06 0.6 0.43
Lesotho 35 35 35 35 0.0 0.00 0.0 0.00 0.0 0.00
Liberia 8 525 8 223 7 920 7 617 -30.3 -0.36 -30.3 -0.37 -30.3 -0.39
Libya 217 217 217 217 0.0 0.00 0.0 0.00 0.0 0.00
Liechtenstein 7 7 7 7 n.s. 0.30 n.s. n.s. n.s. n.s.
Lithuania 1 945 2 020 2 170 2 201 7.5 0.38 15.0 0.72 3.1 0.14
Luxembourg 86 87 89 89 0.1 0.10 0.2 0.23 0.0 0.00
Madagascar 13 693 13 031 12 562 12 430 -66.3 -0.49 -46.9 -0.37 -13.2 -0.11
Malawi 3 502 3 082 2 662 2 242 -42.0 -1.27 -42.0 -1.45 -42.0 -1.70
Malaysia 20 619 19 691 18 948 19 114 -92.7 -0.46 -74.4 -0.38 16.6 0.09
Maldives 1 1 1 1 0.0 0.00 0.0 0.00 0.0 0.00
Mali 13 296 13 296 13 296 13 296 0.0 0.00 0.0 0.00 0.0 0.00
Malta n.s. n.s. n.s. n.s. 0.0 0.00 0.0 0.00 n.s. 2.77
Marshall Islands 9 9 9 9 0.0 0.00 0.0 0.00 0.0 0.00
Martinique 48 49 50 52 0.1 0.19 0.2 0.31 0.2 0.39
Mauritania 476 422 367 313 -5.4 -1.21 -5.4 -1.37 -5.4 -1.59
Mauritius 41 42 38 39 0.1 0.21 -0.4 -0.88 n.s. 0.10
Mayotte 19 16 14 14 -0.3 -1.96 -0.1 -0.83 -0.1 -0.37
Mexico 70 592 68 381 66 943 65 692 -221.0 -0.32 -143.8 -0.21 -125.1 -0.19
Micronesia (Federated States of)
64 64 64 64 n.s. 0.04 n.s. 0.04 n.s. 0.05
Monaco 0 0 0 0 0.0 0.0 0.0
Mongolia 14 352 14 264 14 184 14 173 -8.8 -0.06 -8.0 -0.06 -1.1 -0.01
Montenegro 626 626 827 827 0.0 0.00 20.1 2.82 0.0 0.00
Montserrat 4 3 3 3 -0.1 -3.31 0.0 0.00 0.0 0.00
Morocco 5 485 5 507 5 675 5 742 2.1 0.04 16.8 0.30 6.8 0.12
Mozambique 43 378 41 188 38 972 36 744 -219.0 -0.52 -221.6 -0.55 -222.8 -0.59
Myanmar 39 218 34 868 31 441 28 544 -435.0 -1.17 -342.7 -1.03 -289.7 -0.96
Namibia 8 769 8 059 7 349 6 639 -71.0 -0.84 -71.0 -0.92 -71.0 -1.01
Nauru 0 0 0 0 0.0 0.0 0.0
Nepal 5 672 5 781 5 962 5 962 10.9 0.19 18.1 0.31 0.0 0.00
Netherlands 345 360 373 370 1.4 0.40 1.4 0.38 -0.4 -0.11
New Caledonia 831 838 839 838 0.7 0.08 0.1 0.01 -0.1 -0.01
New Zealand 9 372 9 850 9 848 9 893 47.8 0.50 -0.2 n.s. 4.4 0.05
Nicaragua 6 399 5 399 4 188 3 408 -100.0 -1.68 -121.1 -2.51 -78.1 -2.04
(Continued)
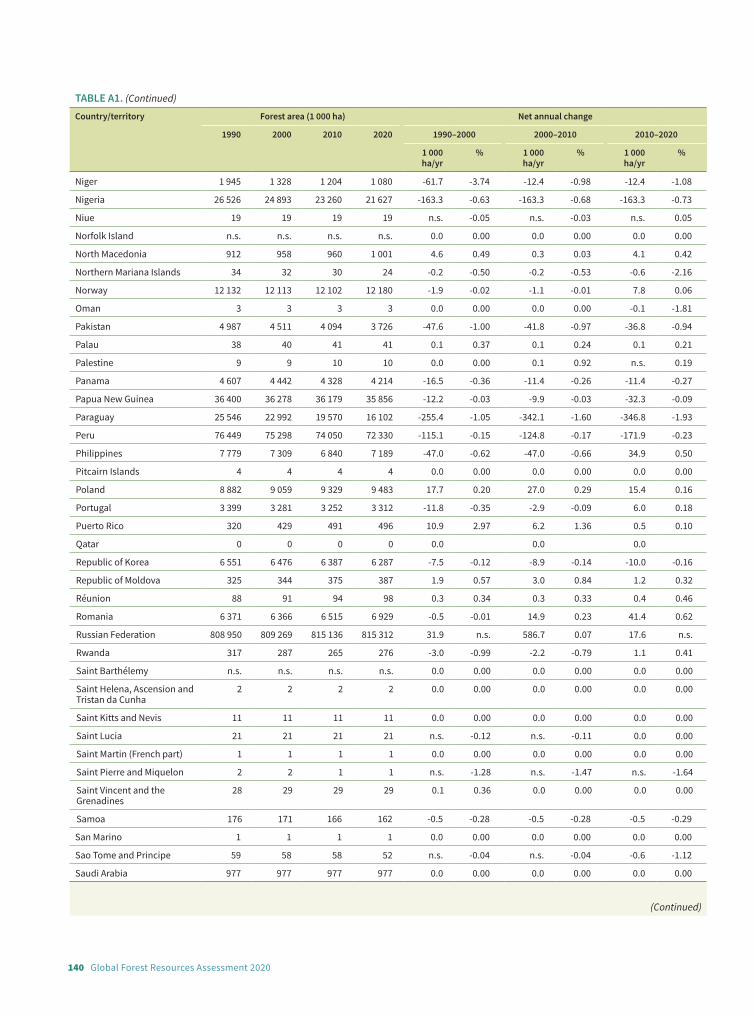
140 Global Forest Resources Assessment 2020
TABLE A1. (Continued)
Country/territory Forest area (1 000 ha) Net annual change
1990 2000 2010 2020 1990–2000 2000–2010 2010–2020
1 000 ha/yr
% 1 000 ha/yr
% 1 000 ha/yr
%
Niger 1 945 1 328 1 204 1 080 -61.7 -3.74 -12.4 -0.98 -12.4 -1.08
Nigeria 26 526 24 893 23 260 21 627 -163.3 -0.63 -163.3 -0.68 -163.3 -0.73
Niue 19 19 19 19 n.s. -0.05 n.s. -0.03 n.s. 0.05
Norfolk Island n.s. n.s. n.s. n.s. 0.0 0.00 0.0 0.00 0.0 0.00
North Macedonia 912 958 960 1 001 4.6 0.49 0.3 0.03 4.1 0.42
Northern Mariana Islands 34 32 30 24 -0.2 -0.50 -0.2 -0.53 -0.6 -2.16
Norway 12 132 12 113 12 102 12 180 -1.9 -0.02 -1.1 -0.01 7.8 0.06
Oman 3 3 3 3 0.0 0.00 0.0 0.00 -0.1 -1.81
Pakistan 4 987 4 511 4 094 3 726 -47.6 -1.00 -41.8 -0.97 -36.8 -0.94
Palau 38 40 41 41 0.1 0.37 0.1 0.24 0.1 0.21
Palestine 9 9 10 10 0.0 0.00 0.1 0.92 n.s. 0.19
Panama 4 607 4 442 4 328 4 214 -16.5 -0.36 -11.4 -0.26 -11.4 -0.27
Papua New Guinea 36 400 36 278 36 179 35 856 -12.2 -0.03 -9.9 -0.03 -32.3 -0.09
Paraguay 25 546 22 992 19 570 16 102 -255.4 -1.05 -342.1 -1.60 -346.8 -1.93
Peru 76 449 75 298 74 050 72 330 -115.1 -0.15 -124.8 -0.17 -171.9 -0.23
Philippines 7 779 7 309 6 840 7 189 -47.0 -0.62 -47.0 -0.66 34.9 0.50
Pitcairn Islands 4 4 4 4 0.0 0.00 0.0 0.00 0.0 0.00
Poland 8 882 9 059 9 329 9 483 17.7 0.20 27.0 0.29 15.4 0.16
Portugal 3 399 3 281 3 252 3 312 -11.8 -0.35 -2.9 -0.09 6.0 0.18
Puerto Rico 320 429 491 496 10.9 2.97 6.2 1.36 0.5 0.10
Qatar 0 0 0 0 0.0 0.0 0.0
Republic of Korea 6 551 6 476 6 387 6 287 -7.5 -0.12 -8.9 -0.14 -10.0 -0.16
Republic of Moldova 325 344 375 387 1.9 0.57 3.0 0.84 1.2 0.32
Réunion 88 91 94 98 0.3 0.34 0.3 0.33 0.4 0.46
Romania 6 371 6 366 6 515 6 929 -0.5 -0.01 14.9 0.23 41.4 0.62
Russian Federation 808 950 809 269 815 136 815 312 31.9 n.s. 586.7 0.07 17.6 n.s.
Rwanda 317 287 265 276 -3.0 -0.99 -2.2 -0.79 1.1 0.41
Saint Barthélemy n.s. n.s. n.s. n.s. 0.0 0.00 0.0 0.00 0.0 0.00
Saint Helena, Ascension and Tristan da Cunha
2 2 2 2 0.0 0.00 0.0 0.00 0.0 0.00
Saint Kitts and Nevis 11 11 11 11 0.0 0.00 0.0 0.00 0.0 0.00
Saint Lucia 21 21 21 21 n.s. -0.12 n.s. -0.11 0.0 0.00
Saint Martin (French part) 1 1 1 1 0.0 0.00 0.0 0.00 0.0 0.00
Saint Pierre and Miquelon 2 2 1 1 n.s. -1.28 n.s. -1.47 n.s. -1.64
Saint Vincent and the Grenadines
28 29 29 29 0.1 0.36 0.0 0.00 0.0 0.00
Samoa 176 171 166 162 -0.5 -0.28 -0.5 -0.28 -0.5 -0.29
San Marino 1 1 1 1 0.0 0.00 0.0 0.00 0.0 0.00
Sao Tome and Principe 59 58 58 52 n.s. -0.04 n.s. -0.04 -0.6 -1.12
Saudi Arabia 977 977 977 977 0.0 0.00 0.0 0.00 0.0 0.00
(Continued)

141Annexes
TABLE A1. (Continued)
Country/territory Forest area (1 000 ha) Net annual change
1990 2000 2010 2020 1990–2000 2000–2010 2010–2020
1 000 ha/yr
% 1 000 ha/yr
% 1 000 ha/yr
%
Senegal 9 303 8 853 8 468 8 068 -45.0 -0.49 -38.5 -0.44 -40.0 -0.48
Serbia 2 313 2 460 2 713 2 723 14.7 0.62 25.3 0.98 1.0 0.04
Seychelles 34 34 34 34 0.0 0.00 0.0 0.00 0.0 0.00
Sierra Leone 3 127 2 929 2 732 2 535 -19.7 -0.65 -19.7 -0.69 -19.7 -0.75
Singapore 15 17 18 16 0.2 1.39 0.1 0.42 -0.2 -1.30
Sint Maarten (Dutch part) n.s. n.s. n.s. n.s. 0.0 0.00 0.0 0.00 0.0 0.00
Slovakia 1 902 1 901 1 918 1 926 -0.1 -0.01 1.7 0.09 0.8 0.04
Slovenia 1 188 1 233 1 247 1 238 4.5 0.37 1.4 0.11 -0.9 -0.07
Solomon Islands 2 545 2 538 2 530 2 523 -0.7 -0.03 -0.7 -0.03 -0.7 -0.03
Somalia 8 283 7 515 6 748 5 980 -76.8 -0.97 -76.8 -1.07 -76.8 -1.20
South Africa 18 142 17 778 17 414 17 050 -36.4 -0.20 -36.4 -0.21 -36.4 -0.21
South Sudan 7 157 7 157 7 157 7 157 0.0 0.00 0.0 0.00 0.0 0.00
Spain 13 905 17 094 18 545 18 572 318.9 2.09 145.1 0.82 2.7 0.01
Sri Lanka 2 350 2 166 2 104 2 113 -18.4 -0.81 -6.3 -0.29 0.9 0.04
Sudan 23 570 21 826 20 081 18 360 -174.4 -0.77 -174.5 -0.83 -172.2 -0.89
Suriname 15 378 15 341 15 300 15 196 -3.7 -0.02 -4.1 -0.03 -10.4 -0.07
Svalbard and Jan Mayen Islands
0 0 0 0 0.0 0.0 0.0
Sweden 28 063 28 163 28 073 27 980 10.0 0.04 -9.0 -0.03 -9.3 -0.03
Switzerland 1 154 1 196 1 235 1 269 4.3 0.36 3.9 0.32 3.4 0.28
Syrian Arab Republic 372 432 492 522 6.0 1.51 6.0 1.31 3.0 0.59
Tajikistan 408 410 410 424 0.2 0.05 0.0 0.00 1.4 0.33
Thailand 19 361 18 998 20 073 19 873 -36.3 -0.19 107.5 0.55 -20.0 -0.10
Timor-Leste 963 949 935 921 -1.4 -0.15 -1.4 -0.15 -1.4 -0.15
Togo 1 362 1 268 1 239 1 209 -9.3 -0.71 -3.0 -0.24 -3.0 -0.24
Tokelau 0 0 0 0 0.0 0.0 0.0
Tonga 9 9 9 9 0.0 0.00 0.0 0.00 0.0 0.00
Trinidad and Tobago 242 237 232 228 -0.5 -0.23 -0.4 -0.18 -0.4 -0.18
Tunisia 644 668 687 703 2.4 0.36 2.0 0.29 1.5 0.22
Turkey 19 783 20 148 21 083 22 220 36.5 0.18 93.5 0.45 113.7 0.53
Turkmenistan 4 127 4 127 4 127 4 127 0.0 0.00 0.0 0.00 0.0 0.00
Turks and Caicos Islands 11 11 11 11 0.0 0.00 0.0 0.00 0.0 0.00
Tuvalu 1 1 1 1 0.0 0.00 0.0 0.00 0.0 0.00
Uganda 3 575 3 163 2 750 2 338 -41.3 -1.22 -41.3 -1.39 -41.3 -1.61
Ukraine 9 274 9 510 9 548 9 690 23.6 0.25 3.8 0.04 14.2 0.15
United Arab Emirates 245 309 317 317 6.4 2.36 0.8 0.25 0.0 0.00
United Kingdom of Great Britain and Northern Ireland
2 778 2 954 3 059 3 190 17.6 0.62 10.5 0.35 13.1 0.42
United Republic of Tanzania 57 390 53 670 49 950 45 745 -372.0 -0.67 -372.0 -0.72 -420.5 -0.88
United States of America 302 450 303 536 308 720 309 795 108.6 0.04 518.4 0.17 107.5 0.03
(Continued)
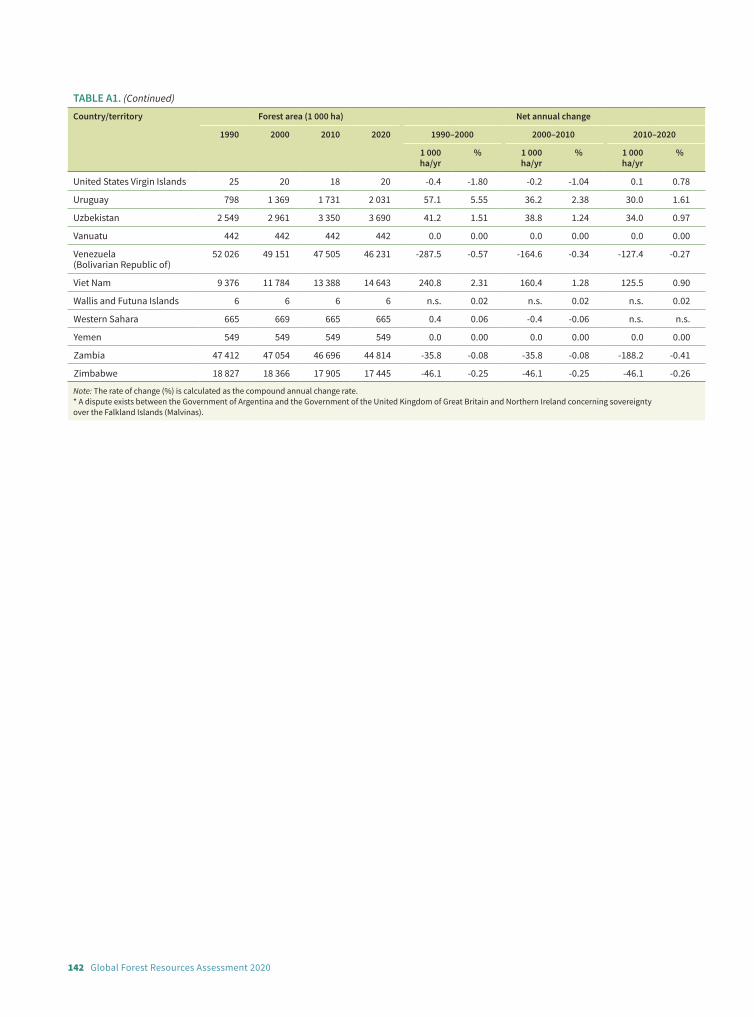
142 Global Forest Resources Assessment 2020
TABLE A1. (Continued)
Country/territory Forest area (1 000 ha) Net annual change
1990 2000 2010 2020 1990–2000 2000–2010 2010–2020
1 000 ha/yr
% 1 000 ha/yr
% 1 000 ha/yr
%
United States Virgin Islands 25 20 18 20 -0.4 -1.80 -0.2 -1.04 0.1 0.78
Uruguay 798 1 369 1 731 2 031 57.1 5.55 36.2 2.38 30.0 1.61
Uzbekistan 2 549 2 961 3 350 3 690 41.2 1.51 38.8 1.24 34.0 0.97
Vanuatu 442 442 442 442 0.0 0.00 0.0 0.00 0.0 0.00
Venezuela (Bolivarian Republic of)
52 026 49 151 47 505 46 231 -287.5 -0.57 -164.6 -0.34 -127.4 -0.27
Viet Nam 9 376 11 784 13 388 14 643 240.8 2.31 160.4 1.28 125.5 0.90
Wallis and Futuna Islands 6 6 6 6 n.s. 0.02 n.s. 0.02 n.s. 0.02
Western Sahara 665 669 665 665 0.4 0.06 -0.4 -0.06 n.s. n.s.
Yemen 549 549 549 549 0.0 0.00 0.0 0.00 0.0 0.00
Zambia 47 412 47 054 46 696 44 814 -35.8 -0.08 -35.8 -0.08 -188.2 -0.41
Zimbabwe 18 827 18 366 17 905 17 445 -46.1 -0.25 -46.1 -0.25 -46.1 -0.26
Note: The rate of change (%) is calculated as the compound annual change rate.* A dispute exists between the Government of Argentina and the Government of the United Kingdom of Great Britain and Northern Ireland concerning sovereignty over the Falkland Islands (Malvinas).

143Annexes
TABLE A2. (Continued)
Country/territory Naturally regenerating forest (1 000 ha) Net annual change
1990 2000 2010 2020 1990–2000 2000–2010 2010–2020
1 000 ha/yr
% 1 000 ha/yr
% 1 000 ha/yr
%
Afghanistan 1 208 1 208 1 208 1 208 0.0 0.00 0.0 0.00 0.0 0.00
Albania – – 712 – – – – – – –
Algeria 1 334 1 234 1 420 1 439 -10.0 -0.78 18.6 1.41 1.9 0.13
American Samoa 18 18 17 17 n.s. -0.19 n.s. -0.17 n.s. -0.17
Andorra 16 16 16 16 0.0 0.00 0.0 0.00 0.0 0.00
Angola 78 302 76 767 71 284 65 800 -153.5 -0.20 -548.3 -0.74 -548.3 -0.80
Anguilla – – – – – – – – – –
Antigua and Barbuda – – – – – – – – – –
Argentina 34 438 32 302 29 027 27 137 -213.6 -0.64 -327.5 -1.06 -189.0 -0.67
Armenia 321 322 310 310 0.1 0.03 -1.2 -0.38 0.0 0.00
Aruba n.s. n.s. n.s. n.s. 0.0 0.00 0.0 0.00 0.0 0.00
Australia 132 859 130 329 127 378 131 615 -253.0 -0.19 -295.1 -0.23 423.7 0.33
Austria 2 037 2 154 2 184 2 228 11.8 0.56 2.9 0.14 4.4 0.20
Azerbaijan 652 681 743 826 2.9 0.44 6.2 0.88 8.3 1.06
Bahamas 510 510 510 510 0.0 0.00 0.0 0.00 0.0 0.00
Bahrain 0 0 0 0 0.0 0.0 0.0
Bangladesh 1 845 1 845 1 816 1 725 n.s. n.s. -2.9 -0.16 -9.1 -0.51
Barbados 6 6 6 6 0.0 0.00 0.0 0.00 0.0 0.00
Belarus 6 576 6 413 6 484 6 556 -16.3 -0.25 7.0 0.11 7.2 0.11
Belgium 231 259 283 251 2.8 1.15 2.4 0.90 -3.2 -1.20
Belize 1 598 1 457 1 389 1 275 -14.1 -0.92 -6.8 -0.48 -11.4 -0.86
Benin 4 823 4 119 3 615 3 112 -70.4 -1.57 -50.4 -1.30 -50.3 -1.49
Bermuda – – – – – – – – – –
Bhutan 2 487 2 586 2 686 2 704 9.9 0.39 9.9 0.38 1.9 0.07
Bolivia (Plurinational State of)
57 785 55 066 53 036 50 771 -271.8 -0.48 -203.0 -0.37 -226.5 -0.44
Bonaire, Sint Eustatius and Saba
2 2 2 2 0.0 0.00 0.0 0.00 0.0 0.00
Bosnia and Herzegovina – – – – – – – – – –
Botswana 18 804 17 621 16 438 15 255 -118.3 -0.65 -118.3 -0.69 -118.3 -0.74
Brazil 585 340 547 436 504 252 485 396 -3 790.4 -0.67 -4 318.4 -0.82 -1 885.6 -0.38
British Virgin Islands
Brunei Darussalam 412 396 376 375 -1.6 -0.40 -2.0 -0.51 -0.2 -0.04
Bulgaria 2 295 2 442 2 920 3 116 14.7 0.62 47.8 1.80 19.6 0.65
Burkina Faso 7 703 7 148 6 594 6 039 -55.4 -0.74 -55.4 -0.80 -55.5 -0.87
(Continued)
TABLE A2. Extent of naturally regenerating forest, 1990–2020

144 Global Forest Resources Assessment 2020
TABLE A2. (Continued)
Country/territory Naturally regenerating forest (1 000 ha) Net annual change
1990 2000 2010 2020 1990–2000 2000–2010 2010–2020
1 000 ha/yr
% 1 000 ha/yr
% 1 000 ha/yr
%
Burundi 115 81 81 167 -3.4 -3.46 0.0 0.00 8.6 7.49
Cabo Verde 14 14 14 14 0.0 0.00 0.0 0.00 0.0 0.00
Cambodia 10 938 10 681 10 435 7 464 -25.6 -0.24 -24.6 -0.23 -297.0 -3.29
Cameroon 22 482 21 576 20 859 20 279 -90.6 -0.41 -71.7 -0.34 -58.0 -0.28
Canada 343 655 338 416 333 306 328 765 -523.9 -0.15 -510.9 -0.15 -454.2 -0.14
Cayman Islands 13 13 13 13 n.s. -0.15 n.s. -0.16 0.0 0.00
Central African Republic 23 201 22 901 22 601 22 301 -30.0 -0.13 -30.0 -0.13 -30.0 -0.13
Chad 6 719 6 339 5 513 4 293 -38.0 -0.58 -82.6 -1.39 -122.0 -2.47
Chile 13 600 13 539 13 895 15 026 -6.1 -0.04 35.6 0.26 113.1 0.79
China 112 989 122 170 127 286 135 282 918.2 0.78 511.6 0.41 799.6 0.61
Colombia 64 861 62 570 60 426 58 715 -229.1 -0.36 -214.3 -0.35 -171.2 -0.29
Comoros 43 39 36 33 -0.3 -0.80 -0.3 -0.87 -0.3 -0.95
Congo 22 256 22 136 22 016 21 887 -12.0 -0.05 -12.0 -0.05 -12.9 -0.06
Cook Islands 14 14 14 14 0.0 0.00 0.0 0.00 0.0 0.00
Costa Rica 2 881 2 811 2 804 2 948 -7.0 -0.25 -0.6 -0.02 14.4 0.50
Côte d'Ivoire 7 844 5 081 3 951 2 823 -276.4 -4.25 -112.9 -2.48 -112.9 -3.31
Croatia 1 758 1 803 1 845 1 871 4.6 0.26 4.2 0.23 2.5 0.14
Cuba 1 711 2 093 2 436 2 709 38.2 2.04 34.3 1.53 27.3 1.07
Curaçao n.s. n.s. n.s. n.s. 0.0 0.00 0.0 0.00 0.0 0.00
Cyprus 137 144 142 140 0.7 0.52 -0.2 -0.13 -0.2 -0.17
Czechia 31 47 88 138 1.6 4.28 4.0 6.39 5.0 4.61
Democratic People's Republic of Korea
5 782 5 399 5 222 5 043 -38.3 -0.68 -17.8 -0.33 -17.9 -0.35
Democratic Republic of the Congo
150 574 143 842 137 111 126 098 -673.1 -0.46 -673.1 -0.48 -1 101.4 -0.83
Denmark – – 140 216 – – – – 7.7 4.49
Djibouti 6 6 6 6 0.0 0.00 0.0 0.00 0.0 0.00
Dominica 50 47 47 47 -0.2 -0.50 0.0 0.00 0.0 0.00
Dominican Republic 1 574 1 929 1 963 1 954 35.6 2.06 3.3 0.17 -0.9 -0.04
Ecuador 14 588 13 660 12 943 12 387 -92.7 -0.65 -71.7 -0.54 -55.7 -0.44
Egypt 0 0 0 0 0.0 0.0 0.0
El Salvador 709 661 614 566 -4.8 -0.69 -4.8 -0.74 -4.8 -0.80
Equatorial Guinea 2 699 2 491 2 407 2 323 -20.9 -0.80 -8.4 -0.34 -8.4 -0.35
Eritrea 1 140 1 097 1 058 1 012 -4.3 -0.38 -3.9 -0.36 -4.6 -0.45
Estonia 2 011 2 041 2 129 2 223 3.0 0.15 8.9 0.43 9.3 0.43
Eswatini 297 330 363 396 3.3 1.05 3.3 0.95 3.3 0.87
Ethiopia 18 919 18 189 17 058 15 865 -73.0 -0.39 -113.1 -0.64 -119.3 -0.72
Falkland Islands (Malvinas)* 0 0 0 0 0.0 0.0 0.0
Faroe Islands 0 0 0 0 0.0 0.0 0.0
Fiji 855 881 907 933 2.6 0.30 2.6 0.29 2.6 0.28
(Continued)
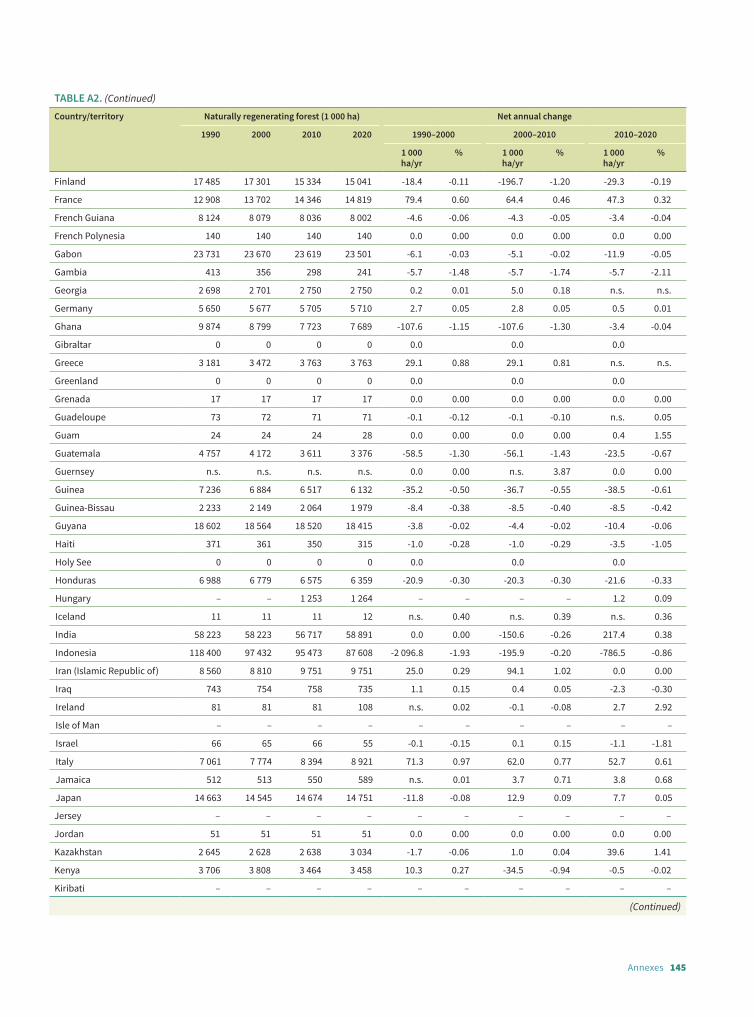
145Annexes
TABLE A2. (Continued)
Country/territory Naturally regenerating forest (1 000 ha) Net annual change
1990 2000 2010 2020 1990–2000 2000–2010 2010–2020
1 000 ha/yr
% 1 000 ha/yr
% 1 000 ha/yr
%
Finland 17 485 17 301 15 334 15 041 -18.4 -0.11 -196.7 -1.20 -29.3 -0.19
France 12 908 13 702 14 346 14 819 79.4 0.60 64.4 0.46 47.3 0.32
French Guiana 8 124 8 079 8 036 8 002 -4.6 -0.06 -4.3 -0.05 -3.4 -0.04
French Polynesia 140 140 140 140 0.0 0.00 0.0 0.00 0.0 0.00
Gabon 23 731 23 670 23 619 23 501 -6.1 -0.03 -5.1 -0.02 -11.9 -0.05
Gambia 413 356 298 241 -5.7 -1.48 -5.7 -1.74 -5.7 -2.11
Georgia 2 698 2 701 2 750 2 750 0.2 0.01 5.0 0.18 n.s. n.s.
Germany 5 650 5 677 5 705 5 710 2.7 0.05 2.8 0.05 0.5 0.01
Ghana 9 874 8 799 7 723 7 689 -107.6 -1.15 -107.6 -1.30 -3.4 -0.04
Gibraltar 0 0 0 0 0.0 0.0 0.0
Greece 3 181 3 472 3 763 3 763 29.1 0.88 29.1 0.81 n.s. n.s.
Greenland 0 0 0 0 0.0 0.0 0.0
Grenada 17 17 17 17 0.0 0.00 0.0 0.00 0.0 0.00
Guadeloupe 73 72 71 71 -0.1 -0.12 -0.1 -0.10 n.s. 0.05
Guam 24 24 24 28 0.0 0.00 0.0 0.00 0.4 1.55
Guatemala 4 757 4 172 3 611 3 376 -58.5 -1.30 -56.1 -1.43 -23.5 -0.67
Guernsey n.s. n.s. n.s. n.s. 0.0 0.00 n.s. 3.87 0.0 0.00
Guinea 7 236 6 884 6 517 6 132 -35.2 -0.50 -36.7 -0.55 -38.5 -0.61
Guinea-Bissau 2 233 2 149 2 064 1 979 -8.4 -0.38 -8.5 -0.40 -8.5 -0.42
Guyana 18 602 18 564 18 520 18 415 -3.8 -0.02 -4.4 -0.02 -10.4 -0.06
Haiti 371 361 350 315 -1.0 -0.28 -1.0 -0.29 -3.5 -1.05
Holy See 0 0 0 0 0.0 0.0 0.0
Honduras 6 988 6 779 6 575 6 359 -20.9 -0.30 -20.3 -0.30 -21.6 -0.33
Hungary – – 1 253 1 264 – – – – 1.2 0.09
Iceland 11 11 11 12 n.s. 0.40 n.s. 0.39 n.s. 0.36
India 58 223 58 223 56 717 58 891 0.0 0.00 -150.6 -0.26 217.4 0.38
Indonesia 118 400 97 432 95 473 87 608 -2 096.8 -1.93 -195.9 -0.20 -786.5 -0.86
Iran (Islamic Republic of) 8 560 8 810 9 751 9 751 25.0 0.29 94.1 1.02 0.0 0.00
Iraq 743 754 758 735 1.1 0.15 0.4 0.05 -2.3 -0.30
Ireland 81 81 81 108 n.s. 0.02 -0.1 -0.08 2.7 2.92
Isle of Man – – – – – – – – – –
Israel 66 65 66 55 -0.1 -0.15 0.1 0.15 -1.1 -1.81
Italy 7 061 7 774 8 394 8 921 71.3 0.97 62.0 0.77 52.7 0.61
Jamaica 512 513 550 589 n.s. 0.01 3.7 0.71 3.8 0.68
Japan 14 663 14 545 14 674 14 751 -11.8 -0.08 12.9 0.09 7.7 0.05
Jersey – – – – – – – – – –
Jordan 51 51 51 51 0.0 0.00 0.0 0.00 0.0 0.00
Kazakhstan 2 645 2 628 2 638 3 034 -1.7 -0.06 1.0 0.04 39.6 1.41
Kenya 3 706 3 808 3 464 3 458 10.3 0.27 -34.5 -0.94 -0.5 -0.02
Kiribati – – – – – – – – – –
(Continued)
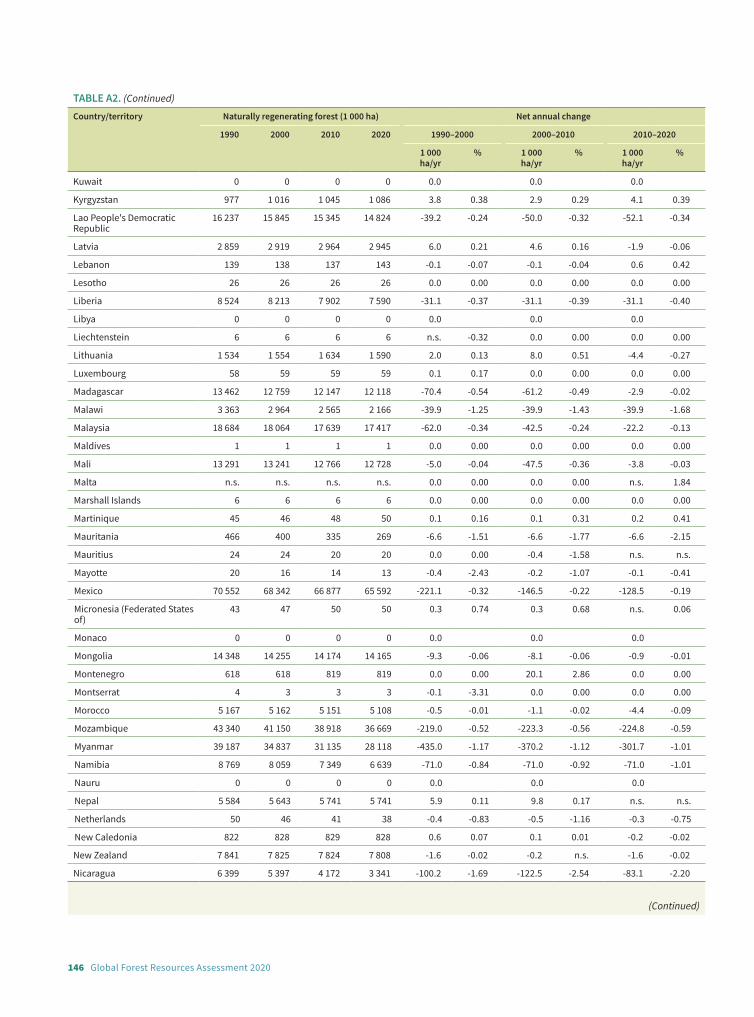
146 Global Forest Resources Assessment 2020
TABLE A2. (Continued)
Country/territory Naturally regenerating forest (1 000 ha) Net annual change
1990 2000 2010 2020 1990–2000 2000–2010 2010–2020
1 000 ha/yr
% 1 000 ha/yr
% 1 000 ha/yr
%
Kuwait 0 0 0 0 0.0 0.0 0.0
Kyrgyzstan 977 1 016 1 045 1 086 3.8 0.38 2.9 0.29 4.1 0.39
Lao People's Democratic Republic
16 237 15 845 15 345 14 824 -39.2 -0.24 -50.0 -0.32 -52.1 -0.34
Latvia 2 859 2 919 2 964 2 945 6.0 0.21 4.6 0.16 -1.9 -0.06
Lebanon 139 138 137 143 -0.1 -0.07 -0.1 -0.04 0.6 0.42
Lesotho 26 26 26 26 0.0 0.00 0.0 0.00 0.0 0.00
Liberia 8 524 8 213 7 902 7 590 -31.1 -0.37 -31.1 -0.39 -31.1 -0.40
Libya 0 0 0 0 0.0 0.0 0.0
Liechtenstein 6 6 6 6 n.s. -0.32 0.0 0.00 0.0 0.00
Lithuania 1 534 1 554 1 634 1 590 2.0 0.13 8.0 0.51 -4.4 -0.27
Luxembourg 58 59 59 59 0.1 0.17 0.0 0.00 0.0 0.00
Madagascar 13 462 12 759 12 147 12 118 -70.4 -0.54 -61.2 -0.49 -2.9 -0.02
Malawi 3 363 2 964 2 565 2 166 -39.9 -1.25 -39.9 -1.43 -39.9 -1.68
Malaysia 18 684 18 064 17 639 17 417 -62.0 -0.34 -42.5 -0.24 -22.2 -0.13
Maldives 1 1 1 1 0.0 0.00 0.0 0.00 0.0 0.00
Mali 13 291 13 241 12 766 12 728 -5.0 -0.04 -47.5 -0.36 -3.8 -0.03
Malta n.s. n.s. n.s. n.s. 0.0 0.00 0.0 0.00 n.s. 1.84
Marshall Islands 6 6 6 6 0.0 0.00 0.0 0.00 0.0 0.00
Martinique 45 46 48 50 0.1 0.16 0.1 0.31 0.2 0.41
Mauritania 466 400 335 269 -6.6 -1.51 -6.6 -1.77 -6.6 -2.15
Mauritius 24 24 20 20 0.0 0.00 -0.4 -1.58 n.s. n.s.
Mayotte 20 16 14 13 -0.4 -2.43 -0.2 -1.07 -0.1 -0.41
Mexico 70 552 68 342 66 877 65 592 -221.1 -0.32 -146.5 -0.22 -128.5 -0.19
Micronesia (Federated States of)
43 47 50 50 0.3 0.74 0.3 0.68 n.s. 0.06
Monaco 0 0 0 0 0.0 0.0 0.0
Mongolia 14 348 14 255 14 174 14 165 -9.3 -0.06 -8.1 -0.06 -0.9 -0.01
Montenegro 618 618 819 819 0.0 0.00 20.1 2.86 0.0 0.00
Montserrat 4 3 3 3 -0.1 -3.31 0.0 0.00 0.0 0.00
Morocco 5 167 5 162 5 151 5 108 -0.5 -0.01 -1.1 -0.02 -4.4 -0.09
Mozambique 43 340 41 150 38 918 36 669 -219.0 -0.52 -223.3 -0.56 -224.8 -0.59
Myanmar 39 187 34 837 31 135 28 118 -435.0 -1.17 -370.2 -1.12 -301.7 -1.01
Namibia 8 769 8 059 7 349 6 639 -71.0 -0.84 -71.0 -0.92 -71.0 -1.01
Nauru 0 0 0 0 0.0 0.0 0.0
Nepal 5 584 5 643 5 741 5 741 5.9 0.11 9.8 0.17 n.s. n.s.
Netherlands 50 46 41 38 -0.4 -0.83 -0.5 -1.16 -0.3 -0.75
New Caledonia 822 828 829 828 0.6 0.07 0.1 0.01 -0.2 -0.02
New Zealand 7 841 7 825 7 824 7 808 -1.6 -0.02 -0.2 n.s. -1.6 -0.02
Nicaragua 6 399 5 397 4 172 3 341 -100.2 -1.69 -122.5 -2.54 -83.1 -2.20
(Continued)
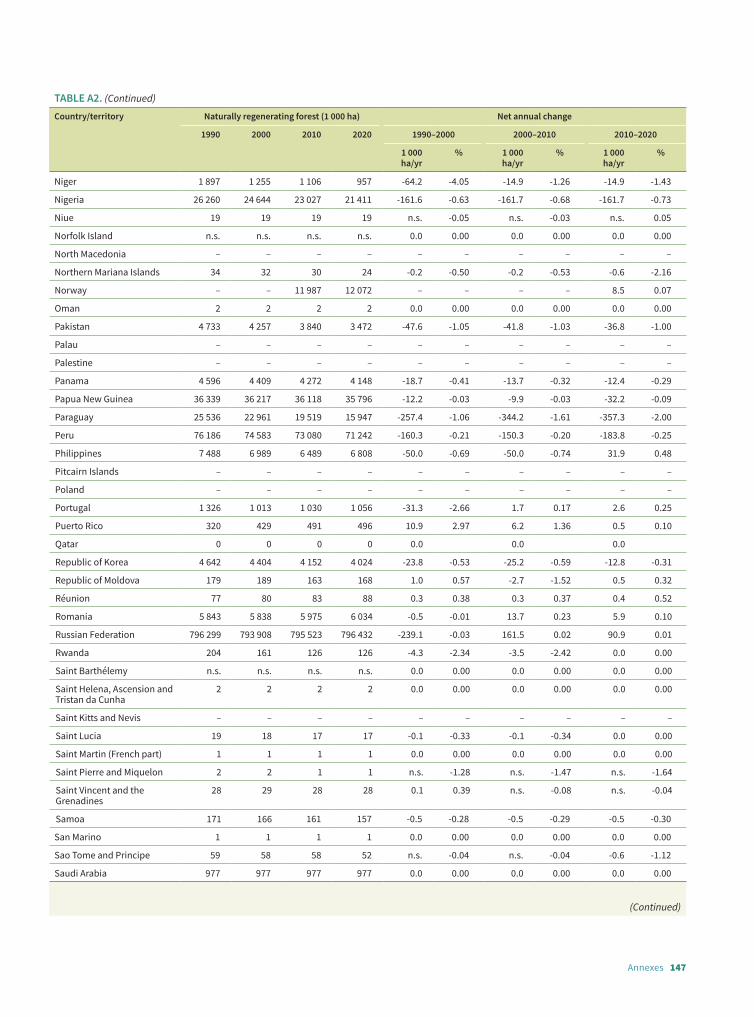
147Annexes
TABLE A2. (Continued)
Country/territory Naturally regenerating forest (1 000 ha) Net annual change
1990 2000 2010 2020 1990–2000 2000–2010 2010–2020
1 000 ha/yr
% 1 000 ha/yr
% 1 000 ha/yr
%
Niger 1 897 1 255 1 106 957 -64.2 -4.05 -14.9 -1.26 -14.9 -1.43
Nigeria 26 260 24 644 23 027 21 411 -161.6 -0.63 -161.7 -0.68 -161.7 -0.73
Niue 19 19 19 19 n.s. -0.05 n.s. -0.03 n.s. 0.05
Norfolk Island n.s. n.s. n.s. n.s. 0.0 0.00 0.0 0.00 0.0 0.00
North Macedonia – – – – – – – – – –
Northern Mariana Islands 34 32 30 24 -0.2 -0.50 -0.2 -0.53 -0.6 -2.16
Norway – – 11 987 12 072 – – – – 8.5 0.07
Oman 2 2 2 2 0.0 0.00 0.0 0.00 0.0 0.00
Pakistan 4 733 4 257 3 840 3 472 -47.6 -1.05 -41.8 -1.03 -36.8 -1.00
Palau – – – – – – – – – –
Palestine – – – – – – – – – –
Panama 4 596 4 409 4 272 4 148 -18.7 -0.41 -13.7 -0.32 -12.4 -0.29
Papua New Guinea 36 339 36 217 36 118 35 796 -12.2 -0.03 -9.9 -0.03 -32.2 -0.09
Paraguay 25 536 22 961 19 519 15 947 -257.4 -1.06 -344.2 -1.61 -357.3 -2.00
Peru 76 186 74 583 73 080 71 242 -160.3 -0.21 -150.3 -0.20 -183.8 -0.25
Philippines 7 488 6 989 6 489 6 808 -50.0 -0.69 -50.0 -0.74 31.9 0.48
Pitcairn Islands – – – – – – – – – –
Poland – – – – – – – – – –
Portugal 1 326 1 013 1 030 1 056 -31.3 -2.66 1.7 0.17 2.6 0.25
Puerto Rico 320 429 491 496 10.9 2.97 6.2 1.36 0.5 0.10
Qatar 0 0 0 0 0.0 0.0 0.0
Republic of Korea 4 642 4 404 4 152 4 024 -23.8 -0.53 -25.2 -0.59 -12.8 -0.31
Republic of Moldova 179 189 163 168 1.0 0.57 -2.7 -1.52 0.5 0.32
Réunion 77 80 83 88 0.3 0.38 0.3 0.37 0.4 0.52
Romania 5 843 5 838 5 975 6 034 -0.5 -0.01 13.7 0.23 5.9 0.10
Russian Federation 796 299 793 908 795 523 796 432 -239.1 -0.03 161.5 0.02 90.9 0.01
Rwanda 204 161 126 126 -4.3 -2.34 -3.5 -2.42 0.0 0.00
Saint Barthélemy n.s. n.s. n.s. n.s. 0.0 0.00 0.0 0.00 0.0 0.00
Saint Helena, Ascension and Tristan da Cunha
2 2 2 2 0.0 0.00 0.0 0.00 0.0 0.00
Saint Kitts and Nevis – – – – – – – – – –
Saint Lucia 19 18 17 17 -0.1 -0.33 -0.1 -0.34 0.0 0.00
Saint Martin (French part) 1 1 1 1 0.0 0.00 0.0 0.00 0.0 0.00
Saint Pierre and Miquelon 2 2 1 1 n.s. -1.28 n.s. -1.47 n.s. -1.64
Saint Vincent and the Grenadines
28 29 28 28 0.1 0.39 n.s. -0.08 n.s. -0.04
Samoa 171 166 161 157 -0.5 -0.28 -0.5 -0.29 -0.5 -0.30
San Marino 1 1 1 1 0.0 0.00 0.0 0.00 0.0 0.00
Sao Tome and Principe 59 58 58 52 n.s. -0.04 n.s. -0.04 -0.6 -1.12
Saudi Arabia 977 977 977 977 0.0 0.00 0.0 0.00 0.0 0.00
(Continued)
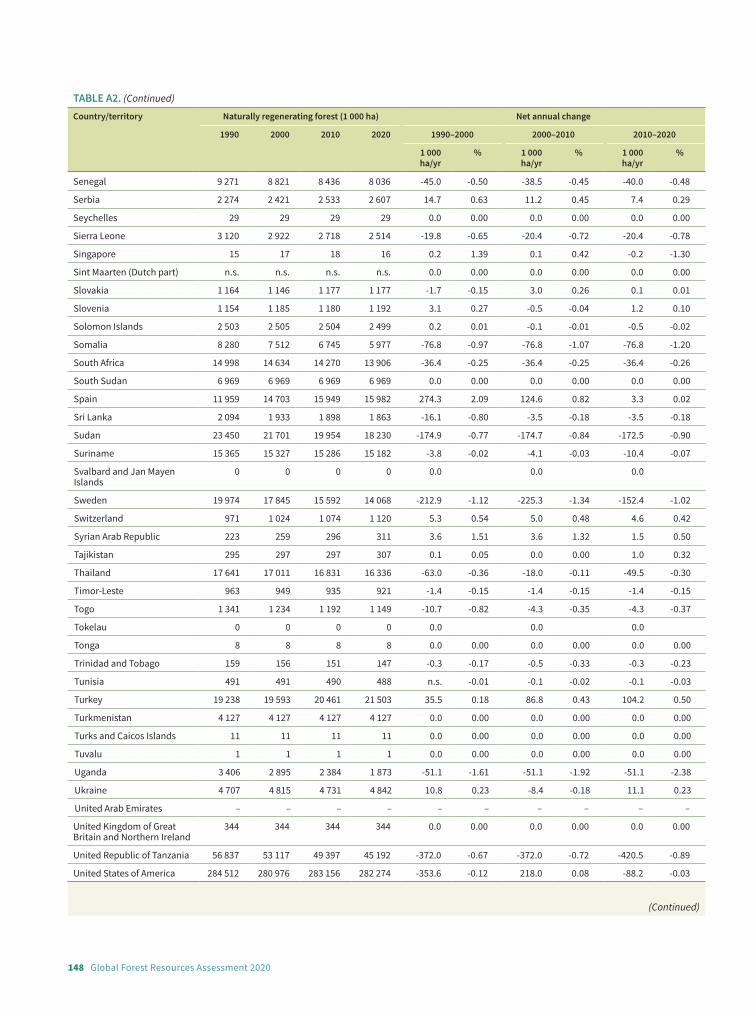
148 Global Forest Resources Assessment 2020
TABLE A2. (Continued)
Country/territory Naturally regenerating forest (1 000 ha) Net annual change
1990 2000 2010 2020 1990–2000 2000–2010 2010–2020
1 000 ha/yr
% 1 000 ha/yr
% 1 000 ha/yr
%
Senegal 9 271 8 821 8 436 8 036 -45.0 -0.50 -38.5 -0.45 -40.0 -0.48
Serbia 2 274 2 421 2 533 2 607 14.7 0.63 11.2 0.45 7.4 0.29
Seychelles 29 29 29 29 0.0 0.00 0.0 0.00 0.0 0.00
Sierra Leone 3 120 2 922 2 718 2 514 -19.8 -0.65 -20.4 -0.72 -20.4 -0.78
Singapore 15 17 18 16 0.2 1.39 0.1 0.42 -0.2 -1.30
Sint Maarten (Dutch part) n.s. n.s. n.s. n.s. 0.0 0.00 0.0 0.00 0.0 0.00
Slovakia 1 164 1 146 1 177 1 177 -1.7 -0.15 3.0 0.26 0.1 0.01
Slovenia 1 154 1 185 1 180 1 192 3.1 0.27 -0.5 -0.04 1.2 0.10
Solomon Islands 2 503 2 505 2 504 2 499 0.2 0.01 -0.1 -0.01 -0.5 -0.02
Somalia 8 280 7 512 6 745 5 977 -76.8 -0.97 -76.8 -1.07 -76.8 -1.20
South Africa 14 998 14 634 14 270 13 906 -36.4 -0.25 -36.4 -0.25 -36.4 -0.26
South Sudan 6 969 6 969 6 969 6 969 0.0 0.00 0.0 0.00 0.0 0.00
Spain 11 959 14 703 15 949 15 982 274.3 2.09 124.6 0.82 3.3 0.02
Sri Lanka 2 094 1 933 1 898 1 863 -16.1 -0.80 -3.5 -0.18 -3.5 -0.18
Sudan 23 450 21 701 19 954 18 230 -174.9 -0.77 -174.7 -0.84 -172.5 -0.90
Suriname 15 365 15 327 15 286 15 182 -3.8 -0.02 -4.1 -0.03 -10.4 -0.07
Svalbard and Jan Mayen Islands
0 0 0 0 0.0 0.0 0.0
Sweden 19 974 17 845 15 592 14 068 -212.9 -1.12 -225.3 -1.34 -152.4 -1.02
Switzerland 971 1 024 1 074 1 120 5.3 0.54 5.0 0.48 4.6 0.42
Syrian Arab Republic 223 259 296 311 3.6 1.51 3.6 1.32 1.5 0.50
Tajikistan 295 297 297 307 0.1 0.05 0.0 0.00 1.0 0.32
Thailand 17 641 17 011 16 831 16 336 -63.0 -0.36 -18.0 -0.11 -49.5 -0.30
Timor-Leste 963 949 935 921 -1.4 -0.15 -1.4 -0.15 -1.4 -0.15
Togo 1 341 1 234 1 192 1 149 -10.7 -0.82 -4.3 -0.35 -4.3 -0.37
Tokelau 0 0 0 0 0.0 0.0 0.0
Tonga 8 8 8 8 0.0 0.00 0.0 0.00 0.0 0.00
Trinidad and Tobago 159 156 151 147 -0.3 -0.17 -0.5 -0.33 -0.3 -0.23
Tunisia 491 491 490 488 n.s. -0.01 -0.1 -0.02 -0.1 -0.03
Turkey 19 238 19 593 20 461 21 503 35.5 0.18 86.8 0.43 104.2 0.50
Turkmenistan 4 127 4 127 4 127 4 127 0.0 0.00 0.0 0.00 0.0 0.00
Turks and Caicos Islands 11 11 11 11 0.0 0.00 0.0 0.00 0.0 0.00
Tuvalu 1 1 1 1 0.0 0.00 0.0 0.00 0.0 0.00
Uganda 3 406 2 895 2 384 1 873 -51.1 -1.61 -51.1 -1.92 -51.1 -2.38
Ukraine 4 707 4 815 4 731 4 842 10.8 0.23 -8.4 -0.18 11.1 0.23
United Arab Emirates – – – – – – – – – –
United Kingdom of Great Britain and Northern Ireland
344 344 344 344 0.0 0.00 0.0 0.00 0.0 0.00
United Republic of Tanzania 56 837 53 117 49 397 45 192 -372.0 -0.67 -372.0 -0.72 -420.5 -0.89
United States of America 284 512 280 976 283 156 282 274 -353.6 -0.12 218.0 0.08 -88.2 -0.03
(Continued)

149Annexes
TABLE A2. (Continued)
Country/territory Naturally regenerating forest (1 000 ha) Net annual change
1990 2000 2010 2020 1990–2000 2000–2010 2010–2020
1 000 ha/yr
% 1 000 ha/yr
% 1 000 ha/yr
%
United States Virgin Islands 25 20 18 20 -0.4 -1.80 -0.2 -1.04 0.1 0.78
Uruguay 597 740 752 849 14.3 2.17 1.2 0.16 9.7 1.22
Uzbekistan 1 356 1 416 1 497 1 423 6.0 0.43 8.1 0.56 -7.4 -0.51
Vanuatu – – – – – – – – – –
Venezuela (Bolivarian Republic of)
51 600 48 411 46 516 44 873 -318.9 -0.64 -189.6 -0.40 -164.3 -0.36
Viet Nam 8 631 9 865 10 305 10 294 123.4 1.34 44.0 0.44 -1.1 -0.01
Wallis and Futuna Islands 6 5 5 5 n.s. -0.31 n.s. -0.32 n.s. -0.17
Western Sahara 665 669 665 665 0.4 0.06 -0.4 -0.06 n.s. n.s.
Yemen 549 549 549 549 0.0 0.00 0.0 0.00 0.0 0.00
Zambia 47 355 46 999 46 642 44 762 -35.6 -0.08 -35.7 -0.08 -188.0 -0.41
Zimbabwe 18 673 18 246 17 797 17 337 -42.7 -0.23 -44.9 -0.25 -46.1 -0.26
Note: The rate of change (%) is calculated as the compound annual change rate. * A dispute exists between the Government of Argentina and the Government of the United Kingdom of Great Britain and Northern Ireland concerning sovereignty over the Falkland Islands (Malvinas).
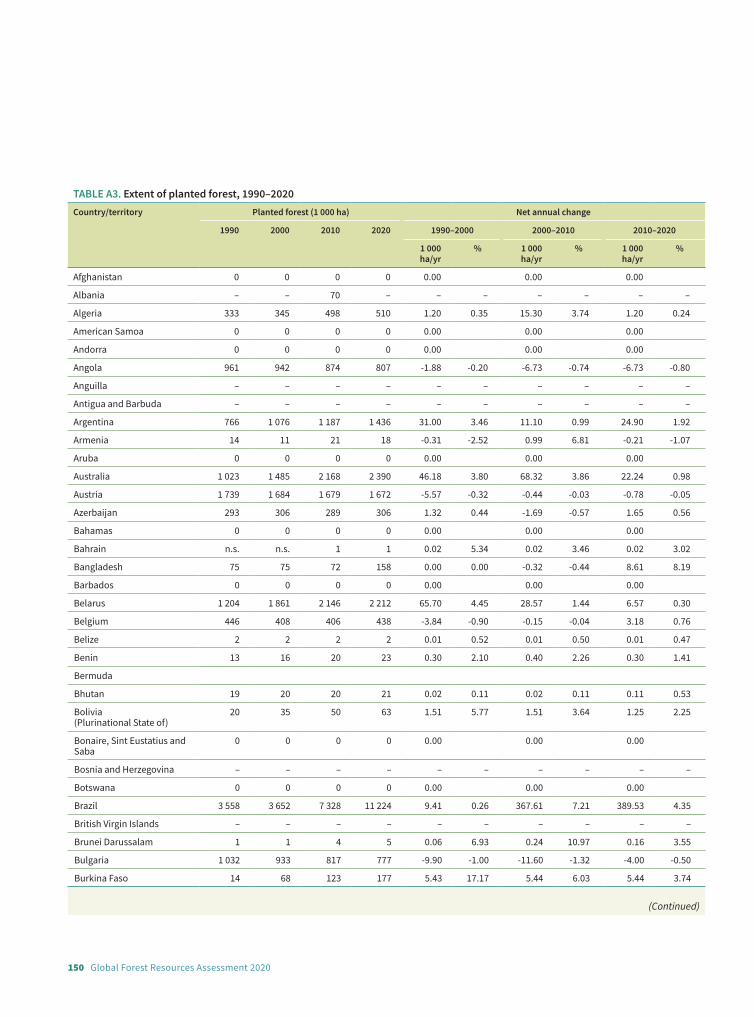
150 Global Forest Resources Assessment 2020
TABLE A3. (Continued)
Country/territory Planted forest (1 000 ha) Net annual change
1990 2000 2010 2020 1990–2000 2000–2010 2010–2020
1 000 ha/yr
% 1 000 ha/yr
% 1 000 ha/yr
%
Afghanistan 0 0 0 0 0.00 0.00 0.00
Albania – – 70 – – – – – – –
Algeria 333 345 498 510 1.20 0.35 15.30 3.74 1.20 0.24
American Samoa 0 0 0 0 0.00 0.00 0.00
Andorra 0 0 0 0 0.00 0.00 0.00
Angola 961 942 874 807 -1.88 -0.20 -6.73 -0.74 -6.73 -0.80
Anguilla – – – – – – – – – –
Antigua and Barbuda – – – – – – – – – –
Argentina 766 1 076 1 187 1 436 31.00 3.46 11.10 0.99 24.90 1.92
Armenia 14 11 21 18 -0.31 -2.52 0.99 6.81 -0.21 -1.07
Aruba 0 0 0 0 0.00 0.00 0.00
Australia 1 023 1 485 2 168 2 390 46.18 3.80 68.32 3.86 22.24 0.98
Austria 1 739 1 684 1 679 1 672 -5.57 -0.32 -0.44 -0.03 -0.78 -0.05
Azerbaijan 293 306 289 306 1.32 0.44 -1.69 -0.57 1.65 0.56
Bahamas 0 0 0 0 0.00 0.00 0.00
Bahrain n.s. n.s. 1 1 0.02 5.34 0.02 3.46 0.02 3.02
Bangladesh 75 75 72 158 0.00 0.00 -0.32 -0.44 8.61 8.19
Barbados 0 0 0 0 0.00 0.00 0.00
Belarus 1 204 1 861 2 146 2 212 65.70 4.45 28.57 1.44 6.57 0.30
Belgium 446 408 406 438 -3.84 -0.90 -0.15 -0.04 3.18 0.76
Belize 2 2 2 2 0.01 0.52 0.01 0.50 0.01 0.47
Benin 13 16 20 23 0.30 2.10 0.40 2.26 0.30 1.41
Bermuda
Bhutan 19 20 20 21 0.02 0.11 0.02 0.11 0.11 0.53
Bolivia (Plurinational State of)
20 35 50 63 1.51 5.77 1.51 3.64 1.25 2.25
Bonaire, Sint Eustatius and Saba
0 0 0 0 0.00 0.00 0.00
Bosnia and Herzegovina – – – – – – – – – –
Botswana 0 0 0 0 0.00 0.00 0.00
Brazil 3 558 3 652 7 328 11 224 9.41 0.26 367.61 7.21 389.53 4.35
British Virgin Islands – – – – – – – – – –
Brunei Darussalam 1 1 4 5 0.06 6.93 0.24 10.97 0.16 3.55
Bulgaria 1 032 933 817 777 -9.90 -1.00 -11.60 -1.32 -4.00 -0.50
Burkina Faso 14 68 123 177 5.43 17.17 5.44 6.03 5.44 3.74
(Continued)
TABLE A3. Extent of planted forest, 1990–2020

151Annexes
TABLE A3. (Continued)
Country/territory Planted forest (1 000 ha) Net annual change
1990 2000 2010 2020 1990–2000 2000–2010 2010–2020
1 000 ha/yr
% 1 000 ha/yr
% 1 000 ha/yr
%
Burundi 161 113 113 113 -4.84 -3.50 0.00 0.00 0.00 0.00
Cabo Verde 2 26 29 32 2.43 31.38 0.30 1.10 0.30 0.99
Cambodia 67 100 155 604 3.26 4.03 5.46 4.46 44.94 14.60
Cameroon 18 21 41 61 0.30 1.55 2.00 6.89 2.00 4.04
Canada 4 618 9 386 14 016 18 163 476.79 7.35 462.96 4.09 414.76 2.63
Cayman Islands 0 0 0 0 0.00 0.00 0.00
Central African Republic 2 2 2 2 0.00 0.00 0.00 0.00 0.00 0.00
Chad 11 14 18 20 0.30 2.48 0.39 2.52 0.21 1.13
Chile 1 646 2 278 2 830 3 185 63.19 3.30 55.23 2.19 35.43 1.19
China 44 152 54 830 73 324 84 696 1067.83 2.19 1849.39 2.95 1137.22 1.45
Colombia 97 166 381 427 6.87 5.50 21.56 8.69 4.61 1.15
Comoros 4 2 1 n.s. -0.11 -3.69 -0.11 -5.91 -0.11 -16.73
Congo 60 60 60 60 0.00 0.00 0.00 0.00 0.00 0.00
Cook Islands 1 1 1 1 0.06 7.99 0.00 0.00 0.00 0.00
Costa Rica 27 47 67 87 2.00 5.77 2.00 3.64 2.00 2.66
Côte d'Ivoire 7 14 14 14 0.73 7.61 0.00 0.00 0.00 0.00
Croatia 92 82 75 69 -1.07 -1.23 -0.68 -0.86 -0.63 -0.87
Cuba 347 342 496 533 -0.50 -0.15 15.40 3.79 3.67 0.72
Curaçao 0 0 0 0 0.00 0.00 0.00
Cyprus 24 28 31 33 0.32 1.25 0.31 1.08 0.21 0.65
Czechia 2 598 2 590 2 570 2 539 -0.83 -0.03 -2.04 -0.08 -3.02 -0.12
Democratic People's Republic of Korea
1 130 1 055 1 021 987 -7.48 -0.68 -3.47 -0.33 -3.32 -0.33
Democratic Republic of the Congo
56 57 58 58 0.12 0.21 0.10 0.17 0.00 0.00
Denmark – – 447 412 – – – – -3.49 -0.81
Djibouti 0 0 0 n.s. 0.00 0.00 0.02
Dominica 1 1 1 1 0.00 0.00 0.00 0.00 0.00 0.00
Dominican Republic 21 43 110 190 2.20 7.44 6.73 9.87 7.97 5.59
Ecuador 44 70 85 111 2.57 4.67 1.47 1.92 2.62 2.73
Egypt 44 59 66 45 1.54 3.06 0.64 1.04 -2.07 -3.71
El Salvador 10 12 15 18 0.26 2.32 0.26 1.89 0.26 1.58
Equatorial Guinea 0 125 125 125 12.50 0.00 0.00 0.00 0.00
Eritrea 10 21 29 43 1.10 7.70 0.75 3.10 1.49 4.30
Estonia 195 198 207 216 0.29 0.15 0.86 0.43 0.91 0.43
Eswatini 164 143 123 102 -2.06 -1.34 -2.06 -1.54 -2.06 -1.82
Ethiopia 340 340 741 1 203 0.00 0.00 40.11 8.11 46.26 4.97
Falkland Islands (Malvinas)* 0 0 0 0 0.00 0.00 0.00
Faroe Islands n.s. n.s. n.s. n.s. 0.00 0.00 0.00 0.00 0.00 0.00
Fiji 85 125 166 207 4.07 4.00 4.07 2.85 4.07 2.21
(Continued)
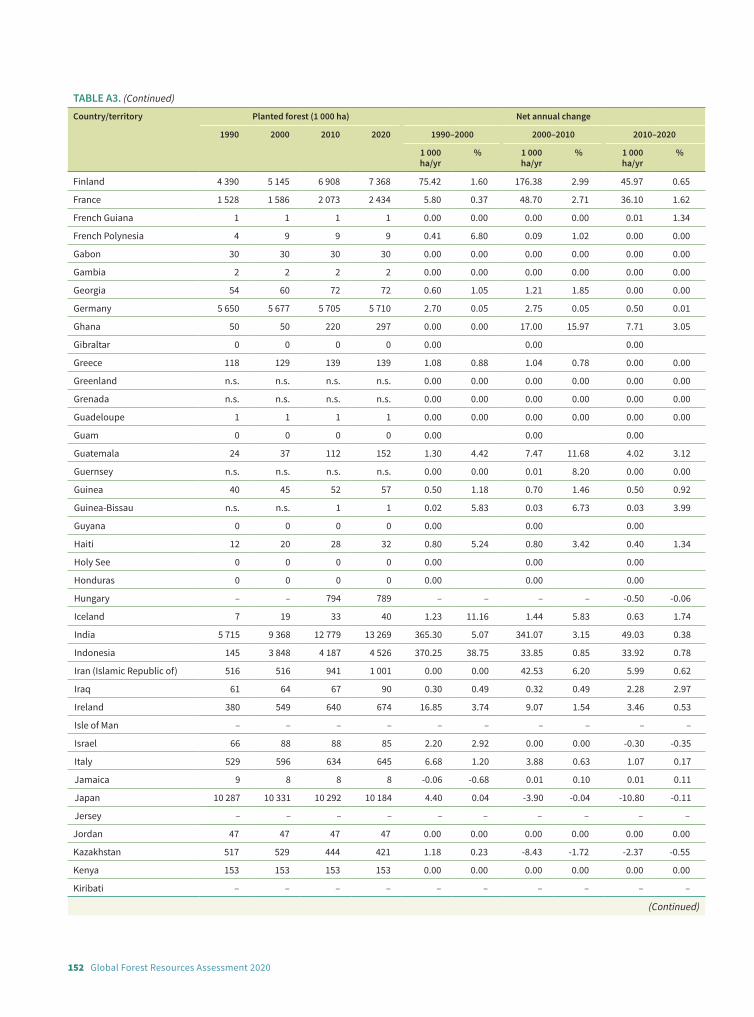
152 Global Forest Resources Assessment 2020
TABLE A3. (Continued)
Country/territory Planted forest (1 000 ha) Net annual change
1990 2000 2010 2020 1990–2000 2000–2010 2010–2020
1 000 ha/yr
% 1 000 ha/yr
% 1 000 ha/yr
%
Finland 4 390 5 145 6 908 7 368 75.42 1.60 176.38 2.99 45.97 0.65
France 1 528 1 586 2 073 2 434 5.80 0.37 48.70 2.71 36.10 1.62
French Guiana 1 1 1 1 0.00 0.00 0.00 0.00 0.01 1.34
French Polynesia 4 9 9 9 0.41 6.80 0.09 1.02 0.00 0.00
Gabon 30 30 30 30 0.00 0.00 0.00 0.00 0.00 0.00
Gambia 2 2 2 2 0.00 0.00 0.00 0.00 0.00 0.00
Georgia 54 60 72 72 0.60 1.05 1.21 1.85 0.00 0.00
Germany 5 650 5 677 5 705 5 710 2.70 0.05 2.75 0.05 0.50 0.01
Ghana 50 50 220 297 0.00 0.00 17.00 15.97 7.71 3.05
Gibraltar 0 0 0 0 0.00 0.00 0.00
Greece 118 129 139 139 1.08 0.88 1.04 0.78 0.00 0.00
Greenland n.s. n.s. n.s. n.s. 0.00 0.00 0.00 0.00 0.00 0.00
Grenada n.s. n.s. n.s. n.s. 0.00 0.00 0.00 0.00 0.00 0.00
Guadeloupe 1 1 1 1 0.00 0.00 0.00 0.00 0.00 0.00
Guam 0 0 0 0 0.00 0.00 0.00
Guatemala 24 37 112 152 1.30 4.42 7.47 11.68 4.02 3.12
Guernsey n.s. n.s. n.s. n.s. 0.00 0.00 0.01 8.20 0.00 0.00
Guinea 40 45 52 57 0.50 1.18 0.70 1.46 0.50 0.92
Guinea-Bissau n.s. n.s. 1 1 0.02 5.83 0.03 6.73 0.03 3.99
Guyana 0 0 0 0 0.00 0.00 0.00
Haiti 12 20 28 32 0.80 5.24 0.80 3.42 0.40 1.34
Holy See 0 0 0 0 0.00 0.00 0.00
Honduras 0 0 0 0 0.00 0.00 0.00
Hungary – – 794 789 – – – – -0.50 -0.06
Iceland 7 19 33 40 1.23 11.16 1.44 5.83 0.63 1.74
India 5 715 9 368 12 779 13 269 365.30 5.07 341.07 3.15 49.03 0.38
Indonesia 145 3 848 4 187 4 526 370.25 38.75 33.85 0.85 33.92 0.78
Iran (Islamic Republic of) 516 516 941 1 001 0.00 0.00 42.53 6.20 5.99 0.62
Iraq 61 64 67 90 0.30 0.49 0.32 0.49 2.28 2.97
Ireland 380 549 640 674 16.85 3.74 9.07 1.54 3.46 0.53
Isle of Man – – – – – – – – – –
Israel 66 88 88 85 2.20 2.92 0.00 0.00 -0.30 -0.35
Italy 529 596 634 645 6.68 1.20 3.88 0.63 1.07 0.17
Jamaica 9 8 8 8 -0.06 -0.68 0.01 0.10 0.01 0.11
Japan 10 287 10 331 10 292 10 184 4.40 0.04 -3.90 -0.04 -10.80 -0.11
Jersey – – – – – – – – – –
Jordan 47 47 47 47 0.00 0.00 0.00 0.00 0.00 0.00
Kazakhstan 517 529 444 421 1.18 0.23 -8.43 -1.72 -2.37 -0.55
Kenya 153 153 153 153 0.00 0.00 0.00 0.00 0.00 0.00
Kiribati – – – – – – – – – –
(Continued)

153Annexes
TABLE A3. (Continued)
Country/territory Planted forest (1 000 ha) Net annual change
1990 2000 2010 2020 1990–2000 2000–2010 2010–2020
1 000 ha/yr
% 1 000 ha/yr
% 1 000 ha/yr
%
Kuwait 3 5 6 6 0.14 3.46 0.14 2.57 0.00 0.00
Kyrgyzstan 159 165 185 229 0.62 0.38 1.94 1.12 4.40 2.16
Lao People's Democratic Republic
1 606 1 580 1 596 1 771 -2.60 -0.16 1.58 0.10 17.55 1.05
Latvia 314 322 408 465 0.77 0.24 8.56 2.38 5.78 1.33
Lebanon 1 1 n.s. n.s. -0.05 -6.12 -0.03 -5.36 0.00 0.29
Lesotho 9 9 9 9 0.00 0.00 0.00 0.00 0.00 0.00
Liberia 1 10 18 27 0.86 23.38 0.86 6.50 0.86 3.91
Libya 217 217 217 217 0.00 0.00 0.00 0.00 0.00 0.00
Liechtenstein n.s. 1 1 1 0.04 11.61 0.00 0.00 0.00 0.00
Lithuania 411 466 536 611 5.52 1.27 6.96 1.40 7.52 1.32
Luxembourg 28 28 30 30 -0.01 -0.04 0.20 0.69 0.00 0.00
Madagascar 231 272 415 312 4.10 1.65 14.30 4.32 -10.30 -2.81
Malawi 139 118 97 76 -2.11 -1.63 -2.12 -1.96 -2.11 -2.43
Malaysia 1 935 1 628 1 309 1 697 -30.72 -1.71 -31.86 -2.16 38.82 2.63
Maldives 0 0 0 0 0.00 0.00 0.00
Mali 5 55 530 568 5.00 27.10 47.50 25.43 3.80 0.69
Malta 0 0 0 n.s. 0.00 0.00 0.00
Marshall Islands 3 3 3 3 0.00 0.00 0.00 0.00 0.00 0.00
Martinique 2 3 3 3 0.02 0.60 0.01 0.34 0.00 0.07
Mauritania 10 21 32 44 1.12 7.75 1.12 4.32 1.11 3.00
Mauritius 17 18 18 18 0.09 0.49 -0.01 -0.03 -0.01 -0.06
Mayotte n.s. n.s. n.s. 1 0.01 5.84 0.02 4.37 0.01 1.80
Mexico 39 40 67 100 0.03 0.08 2.68 5.28 3.39 4.20
Micronesia (Federated States of)
20 17 14 14 -0.30 -1.60 -0.30 -1.91 0.00 0.00
Monaco 0 0 0 0 0.00 0.00 0.00
Mongolia 4 9 10 8 0.46 7.45 0.11 1.15 -0.24 -2.72
Montenegro 8 8 8 8 0.00 0.00 0.00 0.00 0.00 0.00
Montserrat 0 0 0 0 0.00 0.00 0.00
Morocco 318 344 523 635 2.59 0.79 17.88 4.27 11.15 1.95
Mozambique 38 38 55 74 0.00 0.00 1.66 3.70 1.96 3.12
Myanmar 31 31 305 427 0.00 0.01 27.45 25.81 12.19 3.42
Namibia 0 0 0 0 0.00 0.00 0.00
Nauru 0 0 0 0 0.00 0.00 0.00
Nepal 88 138 221 221 4.98 4.59 8.29 4.83 0.00 0.00
Netherlands 295 314 333 332 1.82 0.60 1.91 0.59 -0.10 -0.03
New Caledonia 9 10 10 10 0.08 0.85 0.06 0.55 0.00 0.00
New Zealand 1 531 2 025 2 024 2 084 49.40 2.84 -0.08 n.s. 6.02 0.29
Nicaragua n.s. 2 16 66 0.20 22.79 1.37 21.59 5.03 15.30
(Continued)

154 Global Forest Resources Assessment 2020
TABLE A3. (Continued)
Country/territory Planted forest (1 000 ha) Net annual change
1990 2000 2010 2020 1990–2000 2000–2010 2010–2020
1 000 ha/yr
% 1 000 ha/yr
% 1 000 ha/yr
%
Niger 48 73 98 123 2.50 4.28 2.50 2.99 2.45 2.26
Nigeria 265 249 233 216 -1.63 -0.63 -1.63 -0.68 -1.63 -0.73
Niue n.s. n.s. n.s. n.s. 0.00 0.00 0.00 0.00 0.00 0.00
Norfolk Island n.s. n.s. n.s. n.s. 0.00 0.00 0.00 0.00 0.00 0.00
North Macedonia – – – – – – – – – –
Northern Mariana Islands 0 0 0 0 0.00 0.00 0.00
Norway – – 115 108 – – – – -0.70 -0.63
Oman 1 1 1 1 0.00 0.00 0.00 0.00 -0.05 -6.70
Pakistan 254 254 254 254 0.00 0.00 0.00 0.00 0.00 0.00
Palau – – – – – – – – – –
Palestine – – – – – – – – – –
Panama 11 33 56 66 2.18 11.49 2.31 5.47 0.98 1.64
Papua New Guinea 61 61 61 61 0.00 0.00 0.00 0.00 0.00 0.00
Paraguay 10 31 51 156 2.03 11.54 2.03 5.23 10.49 11.85
Peru 263 715 970 1 088 45.21 10.52 25.48 3.09 11.86 1.16
Philippines 291 321 351 381 3.00 0.99 3.00 0.90 3.00 0.82
Pitcairn Islands – – – – – – – – – –
Poland – – – – – – – – – –
Portugal 2 073 2 268 2 222 2 256 19.50 0.90 -4.60 -0.20 3.40 0.15
Puerto Rico 0 0 0 0 0.00 0.00 0.00
Qatar 0 0 0 0 0.00 0.00 0.00
Republic of Korea 1 909 2 072 2 235 2 263 16.31 0.82 16.31 0.76 2.79 0.12
Republic of Moldova 146 155 212 219 0.86 0.57 5.70 3.18 0.68 0.32
Réunion 11 11 11 11 0.00 0.00 0.00 0.00 0.00 0.00
Romania 528 528 540 895 0.00 0.00 1.20 0.22 35.51 5.18
Russian Federation 12 651 15 360 19 613 18 880 270.92 1.96 425.25 2.47 -73.28 -0.38
Rwanda 113 127 138 150 1.35 1.13 1.15 0.87 1.20 0.84
Saint Barthélemy 0 0 0 0 0.00 0.00 0.00
Saint Helena, Ascension and Tristan da Cunha
0 0 0 0 0.00 0.00 0.00
Saint Kitts and Nevis – – – – – – – – – –
Saint Lucia 3 3 3 3 0.00 0.00 0.00 0.00 0.00 0.00
Saint Martin (French part) 0 0 0 0 0.00 0.00 0.00
Saint Pierre and Miquelon 0 0 0 0 0.00 0.00 0.00
Saint Vincent and the Grenadines
n.s. n.s. n.s. n.s. 0.01 10.65 0.01 5.62 0.01 4.67
Samoa 5 5 5 5 n.s. -0.08 n.s. -0.08 n.s. -0.02
San Marino 0 0 0 0 0.00 0.00 0.00
Sao Tome and Principe 0 0 0 0 0.00 0.00 0.00
Saudi Arabia 0 0 0 0 0.00 0.00 0.00
(Continued)

155Annexes
TABLE A3. (Continued)
Country/territory Planted forest (1 000 ha) Net annual change
1990 2000 2010 2020 1990–2000 2000–2010 2010–2020
1 000 ha/yr
% 1 000 ha/yr
% 1 000 ha/yr
%
Senegal 32 32 32 32 0.00 0.00 0.00 0.00 0.00 0.00
Serbia 39 39 180 116 0.00 0.00 14.14 16.55 -6.46 -4.33
Seychelles 5 5 5 5 0.00 0.00 0.00 0.00 0.00 0.00
Sierra Leone 7 8 15 21 0.12 1.63 0.67 6.39 0.67 3.87
Singapore 0 0 0 0 0.00 0.00 0.00
Sint Maarten (Dutch part) 0 0 0 0 0.00 0.00 0.00
Slovakia 739 755 741 749 1.63 0.22 -1.39 -0.19 0.73 0.10
Slovenia 34 48 67 46 1.39 3.49 1.93 3.44 -2.15 -3.78
Solomon Islands 41 33 27 24 -0.84 -2.26 -0.60 -2.01 -0.24 -0.93
Somalia 3 3 3 3 0.00 0.00 0.00 0.00 0.00 0.00
South Africa 3 144 3 144 3 144 3 144 0.00 0.00 0.00 0.00 0.00 0.00
South Sudan 188 188 188 188 0.00 0.00 0.00 0.00 0.00 0.00
Spain 1 945 2 391 2 596 2 590 44.62 2.09 20.52 0.83 -0.64 -0.02
Sri Lanka 257 234 206 250 -2.30 -0.93 -2.80 -1.27 4.40 1.96
Sudan 120 125 127 130 0.50 0.41 0.20 0.16 0.30 0.23
Suriname 13 14 14 14 0.12 0.85 0.00 0.00 0.00 0.00
Svalbard and Jan Mayen Islands
0 0 0 0 0.00 0.00 0.00
Sweden 8 089 10 318 12 481 13 912 222.90 2.46 216.30 1.92 143.10 1.09
Switzerland 182 172 161 149 -1.06 -0.60 -1.12 -0.67 -1.16 -0.75
Syrian Arab Republic 149 173 196 211 2.40 1.51 2.36 1.29 1.50 0.74
Tajikistan 113 113 113 117 0.05 0.05 0.00 0.00 0.43 0.37
Thailand 1 720 1 987 3 242 3 537 26.70 1.45 125.50 5.02 29.50 0.87
Timor-Leste 0 0 0 0 0.00 0.00 0.00
Togo 21 34 47 61 1.33 5.10 1.33 3.36 1.34 2.52
Tokelau 0 0 0 0 0.00 0.00 0.00
Tonga 1 1 1 1 0.00 0.00 0.00 0.00 0.00 0.00
Trinidad and Tobago 83 81 81 81 -0.27 -0.33 0.00 0.00 0.00 0.00
Tunisia 153 177 198 214 2.43 1.48 2.05 1.10 1.68 0.82
Turkey 546 556 622 717 0.97 0.18 6.63 1.13 9.53 1.44
Turkmenistan 0 0 0 0 0.00 0.00 0.00
Turks and Caicos Islands 0 0 0 0 0.00 0.00 0.00
Tuvalu 0 0 0 0 0.00 0.00 0.00
Uganda 170 268 367 465 9.84 4.67 9.84 3.17 9.84 2.41
Ukraine 4 567 4 695 4 817 4 848 12.80 0.28 12.20 0.26 3.10 0.06
United Arab Emirates – – – – – – – – – –
United Kingdom of Great Britain and Northern Ireland
2 434 2 610 2 715 2 846 17.60 0.70 10.50 0.40 13.10 0.47
United Republic of Tanzania 553 553 553 553 0.00 0.00 0.00 0.00 0.00 0.00
United States of America 17 938 22 560 25 564 27 521 462.20 2.32 300.40 1.26 195.70 0.74
(Continued)

156 Global Forest Resources Assessment 2020
TABLE A3. (Continued)
Country/territory Planted forest (1 000 ha) Net annual change
1990 2000 2010 2020 1990–2000 2000–2010 2010–2020
1 000 ha/yr
% 1 000 ha/yr
% 1 000 ha/yr
%
United States Virgin Islands 0 0 0 0 0.00 0.00 0.00
Uruguay 201 629 979 1 182 42.80 12.08 35.01 4.52 20.29 1.90
Uzbekistan 1 193 1 545 1 852 2 267 35.19 2.62 30.72 1.83 41.44 2.04
Vanuatu – – – – – – – – – –
Venezuela (Bolivarian Republic of)
426 740 989 1 358 31.36 5.67 24.97 2.95 36.89 3.22
Viet Nam 745 1 920 3 083 4 349 117.46 9.93 116.37 4.85 126.61 3.50
Wallis and Futuna Islands n.s. n.s. 1 1 0.02 6.35 0.02 3.85 0.01 1.55
Western Sahara 0 0 0 0 0.00 0.00 0.00
Yemen 0 0 0 0 0.00 0.00 0.00
Zambia 57 55 54 52 -0.20 -0.36 -0.05 -0.10 -0.24 -0.45
Zimbabwe 154 120 108 108 -3.40 -2.46 -1.20 -1.05 0.00 0.00
Note: The rate of change (%) is calculated as the compound annual change rate.* A dispute exists between the Government of Argentina and the Government of the United Kingdom of Great Britain and Northern Ireland concerning sovereignty over the Falkland Islands (Malvinas).

157Annexes
TABLE A4. (Continued)
Country/territory Plantation forest (% of planted forest) Other planted forest (% of planted forest)
1990 2000 2010 2020 1990 2000 2010 2020
Afghanistan – – – – – – – –
Albania 0 0 100 0 0 0 0 0
Algeria 0 0 0 0 100 100 100 100
American Samoa – – – – – – – –
Andorra – – – – – – – –
Angola 100 100 100 100 0 0 0 0
Anguilla 0 0 0 0 0 0 0 0
Antigua and Barbuda 0 0 0 0 0 0 0 0
Argentina 100 100 100 100 0 0 0 0
Armenia 0 0 0 0 100 100 100 100
Aruba – – – – – – – –
Australia 100 100 93 81 0 0 7 19
Austria 0 0 0 0 100 100 100 100
Azerbaijan 3 3 4 7 97 97 96 93
Bahamas – – – – – – – –
Bahrain 100 100 100 100 0 0 0 0
Bangladesh 100 100 100 100 0 0 0 0
Barbados – – – – – – – –
Belarus n.s. n.s. n.s. n.s. 100 100 100 100
Belgium 100 100 100 100 0 0 0 0
Belize 100 100 100 100 0 0 0 0
Benin 100 100 100 100 0 0 0 0
Bermuda 0 0 0 0 0 0 0 0
Bhutan 100 100 100 100 0 0 0 0
Bolivia (Plurinational State of) 100 77 68 62 0 23 32 38
Bonaire, Sint Eustatius and Saba – – – – – – – –
Bosnia and Herzegovina 0 0 0 0 0 0 0 0
Botswana – – – – – – – –
Brazil 100 100 100 100 0 0 0 0
British Virgin Islands 0 0 0 0 0 0 0 0
Brunei Darussalam 0 0 0 0 100 100 100 100
Bulgaria 0 0 0 0 100 100 100 100
Burkina Faso 5 5 5 5 95 95 95 95
Burundi 100 100 100 100 0 0 0 0
Cabo Verde 100 100 100 100 0 0 0 0
(Continued)
TABLE A4. Proportion of total planted forest area occupied by plantation forest and other planted forest, 1990, 2000, 2010 and 2020
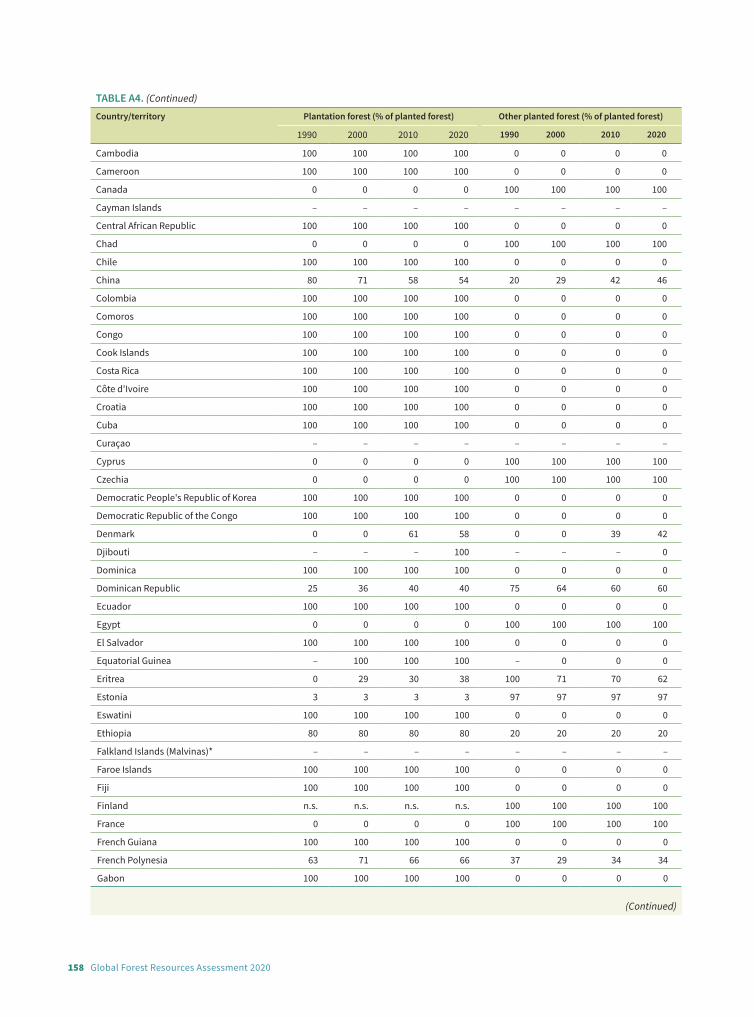
158 Global Forest Resources Assessment 2020
TABLE A4. (Continued)
Country/territory Plantation forest (% of planted forest) Other planted forest (% of planted forest)
1990 2000 2010 2020 1990 2000 2010 2020
Cambodia 100 100 100 100 0 0 0 0
Cameroon 100 100 100 100 0 0 0 0
Canada 0 0 0 0 100 100 100 100
Cayman Islands – – – – – – – –
Central African Republic 100 100 100 100 0 0 0 0
Chad 0 0 0 0 100 100 100 100
Chile 100 100 100 100 0 0 0 0
China 80 71 58 54 20 29 42 46
Colombia 100 100 100 100 0 0 0 0
Comoros 100 100 100 100 0 0 0 0
Congo 100 100 100 100 0 0 0 0
Cook Islands 100 100 100 100 0 0 0 0
Costa Rica 100 100 100 100 0 0 0 0
Côte d'Ivoire 100 100 100 100 0 0 0 0
Croatia 100 100 100 100 0 0 0 0
Cuba 100 100 100 100 0 0 0 0
Curaçao – – – – – – – –
Cyprus 0 0 0 0 100 100 100 100
Czechia 0 0 0 0 100 100 100 100
Democratic People's Republic of Korea 100 100 100 100 0 0 0 0
Democratic Republic of the Congo 100 100 100 100 0 0 0 0
Denmark 0 0 61 58 0 0 39 42
Djibouti – – – 100 – – – 0
Dominica 100 100 100 100 0 0 0 0
Dominican Republic 25 36 40 40 75 64 60 60
Ecuador 100 100 100 100 0 0 0 0
Egypt 0 0 0 0 100 100 100 100
El Salvador 100 100 100 100 0 0 0 0
Equatorial Guinea – 100 100 100 – 0 0 0
Eritrea 0 29 30 38 100 71 70 62
Estonia 3 3 3 3 97 97 97 97
Eswatini 100 100 100 100 0 0 0 0
Ethiopia 80 80 80 80 20 20 20 20
Falkland Islands (Malvinas)* – – – – – – – –
Faroe Islands 100 100 100 100 0 0 0 0
Fiji 100 100 100 100 0 0 0 0
Finland n.s. n.s. n.s. n.s. 100 100 100 100
France 0 0 0 0 100 100 100 100
French Guiana 100 100 100 100 0 0 0 0
French Polynesia 63 71 66 66 37 29 34 34
Gabon 100 100 100 100 0 0 0 0
(Continued)
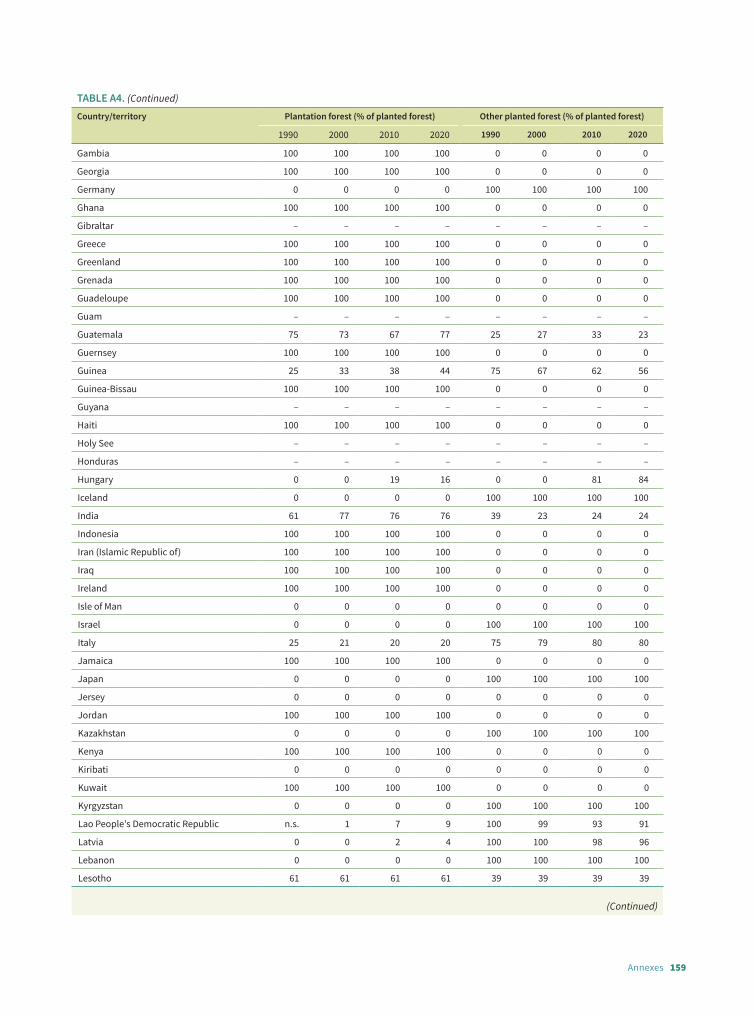
159Annexes
TABLE A4. (Continued)
Country/territory Plantation forest (% of planted forest) Other planted forest (% of planted forest)
1990 2000 2010 2020 1990 2000 2010 2020
Gambia 100 100 100 100 0 0 0 0
Georgia 100 100 100 100 0 0 0 0
Germany 0 0 0 0 100 100 100 100
Ghana 100 100 100 100 0 0 0 0
Gibraltar – – – – – – – –
Greece 100 100 100 100 0 0 0 0
Greenland 100 100 100 100 0 0 0 0
Grenada 100 100 100 100 0 0 0 0
Guadeloupe 100 100 100 100 0 0 0 0
Guam – – – – – – – –
Guatemala 75 73 67 77 25 27 33 23
Guernsey 100 100 100 100 0 0 0 0
Guinea 25 33 38 44 75 67 62 56
Guinea-Bissau 100 100 100 100 0 0 0 0
Guyana – – – – – – – –
Haiti 100 100 100 100 0 0 0 0
Holy See – – – – – – – –
Honduras – – – – – – – –
Hungary 0 0 19 16 0 0 81 84
Iceland 0 0 0 0 100 100 100 100
India 61 77 76 76 39 23 24 24
Indonesia 100 100 100 100 0 0 0 0
Iran (Islamic Republic of) 100 100 100 100 0 0 0 0
Iraq 100 100 100 100 0 0 0 0
Ireland 100 100 100 100 0 0 0 0
Isle of Man 0 0 0 0 0 0 0 0
Israel 0 0 0 0 100 100 100 100
Italy 25 21 20 20 75 79 80 80
Jamaica 100 100 100 100 0 0 0 0
Japan 0 0 0 0 100 100 100 100
Jersey 0 0 0 0 0 0 0 0
Jordan 100 100 100 100 0 0 0 0
Kazakhstan 0 0 0 0 100 100 100 100
Kenya 100 100 100 100 0 0 0 0
Kiribati 0 0 0 0 0 0 0 0
Kuwait 100 100 100 100 0 0 0 0
Kyrgyzstan 0 0 0 0 100 100 100 100
Lao People's Democratic Republic n.s. 1 7 9 100 99 93 91
Latvia 0 0 2 4 100 100 98 96
Lebanon 0 0 0 0 100 100 100 100
Lesotho 61 61 61 61 39 39 39 39
(Continued)

160 Global Forest Resources Assessment 2020
TABLE A4. (Continued)
Country/territory Plantation forest (% of planted forest) Other planted forest (% of planted forest)
1990 2000 2010 2020 1990 2000 2010 2020
Liberia 100 100 100 100 0 0 0 0
Libya 100 100 100 100 0 0 0 0
Liechtenstein 0 0 0 0 100 100 100 100
Lithuania 0 0 0 0 100 100 100 100
Luxembourg 0 0 0 0 100 100 100 100
Madagascar 100 100 100 100 0 0 0 0
Malawi 100 100 100 100 0 0 0 0
Malaysia 100 100 100 100 0 0 0 0
Maldives – – – – – – – –
Mali 0 0 0 0 100 100 100 100
Malta – – – 100 – – – 0
Marshall Islands 0 0 0 0 100 100 100 100
Martinique 100 100 99 99 0 0 1 1
Mauritania 0 0 0 0 100 100 100 100
Mauritius 0 0 0 0 100 100 100 100
Mayotte 18 10 7 5 82 90 93 95
Mexico 98 87 93 75 2 13 7 25
Micronesia (Federated States of) 100 100 100 100 0 0 0 0
Monaco – – – – – – – –
Mongolia 100 100 100 100 0 0 0 0
Montenegro 100 100 100 100 0 0 0 0
Montserrat – – – – – – – –
Morocco 100 100 100 100 0 0 0 0
Mozambique 100 100 100 100 0 0 0 0
Myanmar 100 100 100 100 0 0 0 0
Namibia – – – – – – – –
Nauru – – – – – – – –
Nepal 100 100 100 100 0 0 0 0
Netherlands 10 1 1 1 90 99 99 99
New Caledonia 100 100 100 100 0 0 0 0
New Zealand 100 100 100 100 0 0 0 0
Nicaragua 100 100 100 100 0 0 0 0
Niger 100 100 100 100 0 0 0 0
Nigeria 100 100 100 100 0 0 0 0
Niue 100 100 100 100 0 0 0 0
Norfolk Island 100 100 100 100 0 0 0 0
North Macedonia 0 0 0 0 0 0 0 0
Northern Mariana Islands – – – – – – – –
Norway 0 0 100 100 0 0 0 0
Oman 0 0 0 0 100 100 100 100
Pakistan 100 100 100 100 0 0 0 0
(Continued)

161Annexes
TABLE A4. (Continued)
Country/territory Plantation forest (% of planted forest) Other planted forest (% of planted forest)
1990 2000 2010 2020 1990 2000 2010 2020
Palau 0 0 0 0 0 0 0 0
Palestine 0 0 0 0 0 0 0 0
Panama 100 100 100 100 0 0 0 0
Papua New Guinea 100 100 100 100 0 0 0 0
Paraguay 100 100 100 100 0 0 0 0
Peru 100 100 100 100 0 0 0 0
Philippines 100 100 100 100 0 0 0 0
Pitcairn Islands 0 0 0 0 0 0 0 0
Poland 0 0 0 0 0 0 0 0
Portugal 28 27 31 31 72 73 69 69
Puerto Rico – – – – – – – –
Qatar – – – – – – – –
Republic of Korea 100 100 100 100 0 0 0 0
Republic of Moldova 0 0 0 0 100 100 100 100
Réunion 91 91 91 91 9 9 9 9
Romania 0 0 0 0 100 100 100 100
Russian Federation 0 0 0 0 100 100 100 100
Rwanda 100 100 100 100 0 0 0 0
Saint Barthélemy – – – – – – – –
Saint Helena, Ascension and Tristan da Cunha
– – – – – – – –
Saint Kitts and Nevis 0 0 0 0 0 0 0 0
Saint Lucia 100 100 100 100 0 0 0 0
Saint Martin (French part) – – – – – – – –
Saint Pierre and Miquelon – – – – – – – –
Saint Vincent and the Grenadines 25 45 53 57 75 55 47 43
Samoa 57 67 77 87 43 33 23 13
San Marino – – – – – – – –
Sao Tome and Principe – – – – – – – –
Saudi Arabia – – – – – – – –
Senegal 100 100 100 100 0 0 0 0
Serbia 0 0 12 30 100 100 88 70
Seychelles 100 100 100 100 0 0 0 0
Sierra Leone 100 100 100 100 0 0 0 0
Singapore – – – – – – – –
Sint Maarten (Dutch part) – – – – – – – –
Slovakia 0 n.s. 1 1 100 100 99 99
Slovenia 0 0 0 0 100 100 100 100
Solomon Islands 97 97 97 96 3 3 3 4
Somalia 100 100 100 100 0 0 0 0
South Africa 40 40 40 40 60 60 60 60
(Continued)

162 Global Forest Resources Assessment 2020
TABLE A4. (Continued)
Country/territory Plantation forest (% of planted forest) Other planted forest (% of planted forest)
1990 2000 2010 2020 1990 2000 2010 2020
South Sudan 100 100 100 100 0 0 0 0
Spain 39 39 39 39 61 61 61 61
Sri Lanka 100 100 100 100 0 0 0 0
Sudan 100 100 100 100 0 0 0 0
Suriname 100 92 92 92 0 8 8 8
Svalbard and Jan Mayen Islands – – – – – – – –
Sweden 0 6 5 3 100 94 95 97
Switzerland n.s. n.s. 1 1 100 100 99 99
Syrian Arab Republic 100 100 100 100 0 0 0 0
Tajikistan 69 69 69 69 31 31 31 31
Thailand 100 100 100 100 0 0 0 0
Timor-Leste – – – – – – – –
Togo 80 80 80 80 20 20 20 20
Tokelau – – – – – – – –
Tonga 100 100 100 100 0 0 0 0
Trinidad and Tobago 72 74 74 74 28 26 26 26
Tunisia 33 33 33 33 67 67 67 67
Turkey 100 100 100 100 0 0 0 0
Turkmenistan – – – – – – – –
Turks and Caicos Islands – – – – – – – –
Tuvalu – – – – – – – –
Uganda 100 100 100 100 0 0 0 0
Ukraine 7 7 7 8 93 93 93 92
United Arab Emirates 0 0 0 0 0 0 0 0
United Kingdom of Great Britain and Northern Ireland
0 0 0 0 100 100 100 100
United Republic of Tanzania 100 100 100 100 0 0 0 0
United States of America 34 39 49 51 66 61 51 49
United States Virgin Islands – – – – – – – –
Uruguay 100 100 100 100 0 0 0 0
Uzbekistan 52 63 71 64 48 37 29 36
Vanuatu 0 0 0 0 0 0 0 0
Venezuela (Bolivarian Republic of) 99 90 88 91 1 10 12 9
Viet Nam 100 100 100 100 0 0 0 0
Wallis and Futuna Islands 100 100 100 100 0 0 0 0
Western Sahara – – – – – – – –
Yemen – – – – – – – –
Zambia 100 100 98 87 0 0 2 13
Zimbabwe 100 100 100 100 0 0 0 0
* A dispute exists between the Government of Argentina and the Government of the United Kingdom of Great Britain and Northern Ireland concerning sovereignty over the Falkland Islands (Malvinas).
L
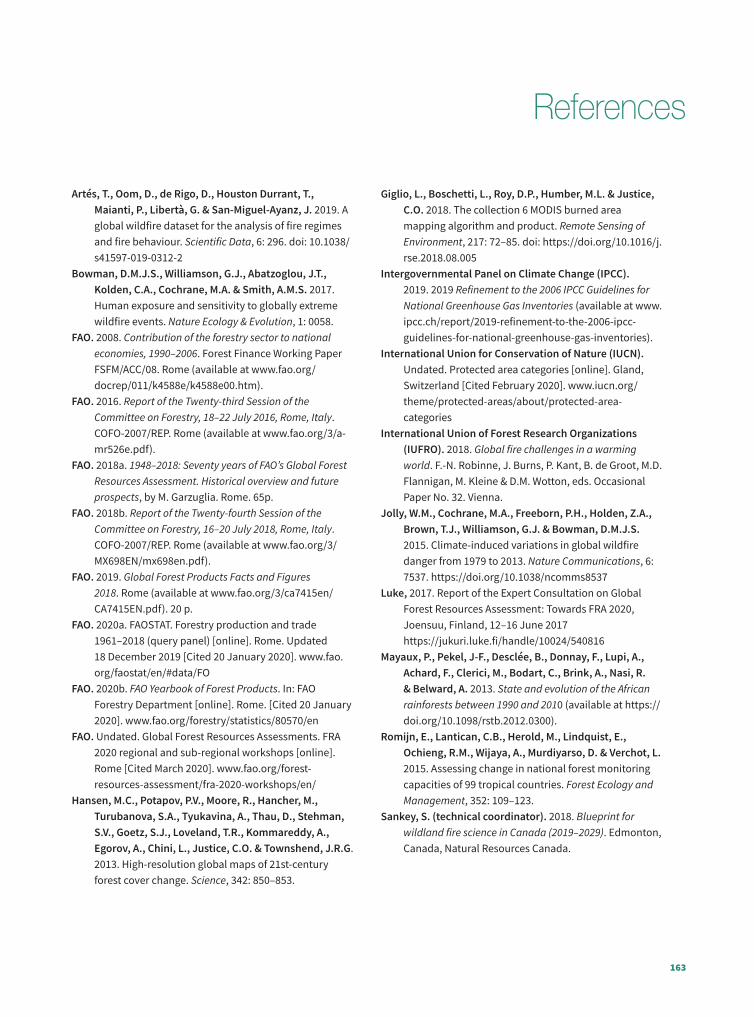
163
References
Artés, T., Oom, D., de Rigo, D., Houston Durrant, T., Maianti, P., Libertà, G. & San-Miguel-Ayanz, J. 2019. A global wildfire dataset for the analysis of fire regimes and fire behaviour. Scientific Data, 6: 296. doi: 10.1038/s41597-019-0312-2
Bowman, D.M.J.S., Williamson, G.J., Abatzoglou, J.T., Kolden, C.A., Cochrane, M.A. & Smith, A.M.S. 2017. Human exposure and sensitivity to globally extreme wildfire events. Nature Ecology & Evolution, 1: 0058.
FAO. 2008. Contribution of the forestry sector to national economies, 1990–2006. Forest Finance Working Paper FSFM/ACC/08. Rome (available at www.fao.org/docrep/011/k4588e/k4588e00.htm).
FAO. 2016. Report of the Twenty-third Session of the Committee on Forestry, 18–22 July 2016, Rome, Italy. COFO-2007/REP. Rome (available at www.fao.org/3/a-mr526e.pdf).
FAO. 2018a. 1948–2018: Seventy years of FAO’s Global Forest Resources Assessment. Historical overview and future prospects, by M. Garzuglia. Rome. 65p.
FAO. 2018b. Report of the Twenty-fourth Session of the Committee on Forestry, 16–20 July 2018, Rome, Italy. COFO-2007/REP. Rome (available at www.fao.org/3/MX698EN/mx698en.pdf).
FAO. 2019. Global Forest Products Facts and Figures 2018. Rome (available at www.fao.org/3/ca7415en/CA7415EN.pdf). 20 p.
FAO. 2020a. FAOSTAT. Forestry production and trade 1961–2018 (query panel) [online]. Rome. Updated 18 December 2019 [Cited 20 January 2020]. www.fao.org/faostat/en/#data/FO
FAO. 2020b. FAO Yearbook of Forest Products. In: FAO Forestry Department [online]. Rome. [Cited 20 January 2020]. www.fao.org/forestry/statistics/80570/en
FAO. Undated. Global Forest Resources Assessments. FRA 2020 regional and sub-regional workshops [online]. Rome [Cited March 2020]. www.fao.org/forest-resources-assessment/fra-2020-workshops/en/
Hansen, M.C., Potapov, P.V., Moore, R., Hancher, M., Turubanova, S.A., Tyukavina, A., Thau, D., Stehman, S.V., Goetz, S.J., Loveland, T.R., Kommareddy, A., Egorov, A., Chini, L., Justice, C.O. & Townshend, J.R.G. 2013. High-resolution global maps of 21st-century forest cover change. Science, 342: 850–853.
Giglio, L., Boschetti, L., Roy, D.P., Humber, M.L. & Justice, C.O. 2018. The collection 6 MODIS burned area mapping algorithm and product. Remote Sensing of Environment, 217: 72–85. doi: https://doi.org/10.1016/j.rse.2018.08.005
Intergovernmental Panel on Climate Change (IPCC). 2019. 2019 Refinement to the 2006 IPCC Guidelines for National Greenhouse Gas Inventories (available at www.ipcc.ch/report/2019-refinement-to-the-2006-ipcc-guidelines-for-national-greenhouse-gas-inventories).
International Union for Conservation of Nature (IUCN). Undated. Protected area categories [online]. Gland, Switzerland [Cited February 2020]. www.iucn.org/theme/protected-areas/about/protected-area-categories
International Union of Forest Research Organizations (IUFRO). 2018. Global fire challenges in a warming world. F.-N. Robinne, J. Burns, P. Kant, B. de Groot, M.D. Flannigan, M. Kleine & D.M. Wotton, eds. Occasional Paper No. 32. Vienna.
Jolly, W.M., Cochrane, M.A., Freeborn, P.H., Holden, Z.A., Brown, T.J., Williamson, G.J. & Bowman, D.M.J.S. 2015. Climate-induced variations in global wildfire danger from 1979 to 2013. Nature Communications, 6: 7537. https://doi.org/10.1038/ncomms8537
Luke, 2017. Report of the Expert Consultation on Global Forest Resources Assessment: Towards FRA 2020, Joensuu, Finland, 12–16 June 2017 https://jukuri.luke.fi/handle/10024/540816
Mayaux, P., Pekel, J-F., Desclée, B., Donnay, F., Lupi, A., Achard, F., Clerici, M., Bodart, C., Brink, A., Nasi, R. & Belward, A. 2013. State and evolution of the African rainforests between 1990 and 2010 (available at https://doi.org/10.1098/rstb.2012.0300).
Romijn, E., Lantican, C.B., Herold, M., Lindquist, E., Ochieng, R.M., Wijaya, A., Murdiyarso, D. & Verchot, L. 2015. Assessing change in national forest monitoring capacities of 99 tropical countries. Forest Ecology and Management, 352: 109–123.
Sankey, S. (technical coordinator). 2018. Blueprint for wildland fire science in Canada (2019–2029). Edmonton, Canada, Natural Resources Canada.

164 Global Forest Resources Assessment 2020
San Miguel, J., Chuvieco, E., Handmer, J., Moffat, A., Montiel-Molina, C. & Sandahl, L. 2017. Chapter 3.10. Climatological risk: wildfires. In: K. Poljanšek, M. Marin Ferrer, T. De Groeve & I. Clark, eds. Science for disaster risk management 2017: knowing better and losing less. EUR 28034 EN. Luxembourg, Publications Office of the European Union.
Sexton, J., Noojipady, P., Song, X-P., Feng, M., Song, D-X., Kim, D-H., Anand, A., Huang, C., Channan, S., Pimm, S. & Townshend, J. 2015. Conservation policy and the measurement of forests. Nature Climate Change, 6: 192–196. doi 10.1038/NCLIMATE2816
United Nations, Department of Economic and Social Affairs, Population Division. 2018. World urbanization prospects: the 2018 revision [online]. [Cited March 2020]. https://population.un.org/wpp
United Nations, Department of Economic and Social Affairs, Population Division. 2019. World population prospects 2019 [online]. [Cited March 2020.] https://population.un.org/wpp
United Nations Statistics Division. 2008. International Standard Industrial Classification of All Economic Activities Revision 4. Statistical papers Series M No. 4/Rev.4. New York, USA, United Nations.
United Nations Statistics Division. Undated. Methodology. Standard country or area codes for statistical use (M49) [Online]. New York, USA [Cited March 2020]. https://unstats.un.org/unsd/methodology/m49/#fn2
g
The following corrections were made to the PDF of the report after it went to print. Page Location Text in printed PDF Text in corrected PDF
3 Second column, line 16 Team of Specialists on Sustainable Forest Management
Team of Specialists on Monitoring Sustainable Forest Management
15 Table 4 caption Top ten countries and territories for forest cover as a percentage of total land area, 2020
Top ten countries and territories for forest area as a percentage of total land area, 2020
48 Table 38 caption Volume of biomass and dead-wood stock, by region and subregion, 2020
Biomass and dead-wood stock, by region and subregion, 2020
70 Figure 32 caption Proportion of total forest area designated primarily for other purposes by region, 1990-2020
Proportion of total forest area designated primarily for other management objectives by region, 1990-2020
79 Second column, starting from line 14 and 15
The share was 100 percent in 48 of those countries, of which 29 were in Asia (mostly Western and Central Asia) and 26 were in Africa (mostrly Western and Central Africa).
The share was 100 percent in 48 of those countries, of which 23 were in Asia (mostly Western and Central Asia) and 16 were in Africa (mostrly Western and Central Africa).
83 Table 69 heading Forest ownership Management rights
84 Figure 38 Proportion of total publicly owned forest area, by holder of administrative rights and region, 2015
Proportion of total publicly owned forest area, by holder of management rights and region, 2015
96 Table 78 3rd and 4th column heading
Degraded forest area/Degraded forest area as % of forest area
Forest area of reporting countries/% of total forest area
120 Note 26 The analysis was conducted by Karimon Nesha, Veronique De Sy and Martin Herold (CIFOR/Wageningen Univesity), updating a previous publication by Romin et al (2015).
The analysis was conducted by Mst Karimon Nesha, Veronique De Sy and Martin Herold (CIFOR/Wageningen Univesity), updating a previous publication by Romin et al (2015).
Corrigendum12/11/2020


Since its creation in 1946, FAO has been monitoring the world’s forest resources through periodic assessments conducted in cooperation with its member countries.
The Global Forest Resources Assessment 2020 (FRA 2020), the latest of these assessments, examines the status of, and trends in, more than 60 forest-related variables in 236 countries and territories in the period 1990–2020.
This main report of FRA 2020 presents a comprehensive view of the world’s forests and the ways in which the resource is changing. Such a clear global picture supports the development of sound policies, practices and investments affecting forests and forestry.
This publication has been produced with the assistance of the European Union, the Government of Finland and the Government of Norway.
The contents of this publication are the sole responsibility of FAO and can in no way be taken to reflect the views of the European Union, the Government of Finland or the Government of Norway.
Desi
gn a
nd il
lust
ratio
n: C
hiar
a Ca
pron
i
CA9825EN/1/07.20
ISBN 978-92-5-132974-0
9 7 8 9 2 5 1 3 2 9 7 4 0
LAST UPDATED 12/11/2020
Copyright © 2022 FDOKUMEN