Tree and forest resources of Bangladesh
231
i
-
Upload
khangminh22 -
Category
Documents
-
view
0 -
download
0
Transcript of Tree and forest resources of Bangladesh

i

ii

iii

iv
Tree and forest resources of
Bangladesh Report on the Bangladesh Forest Inventory

v
Phot
o: M
angrove forest, The Sundarban, ©
FD

vi

i
Tree and forest resources of Bangladesh Report on the Bangladesh Forest Inventory Prepared and published by Forest Department, Ministry of Environment, Forest and Climate Change,
2019 Contact Forest Department
Ministry of Environment, Forest and Climate Change
Government of the People’s Republic of Bangladesh
Bana Bhaban, Plot No‐ E‐8, B‐2
Agargaon, Sher‐e‐Bangla Nagar
Dhaka‐1207
This effort was financially supported by USAID with technical support from FAO and Silvacarbon.
Project Code : GCP/BGD/058/USA
Suggested Citation
GoB (2019), Tree and forest resources of Bangladesh: Report on the Bangladesh Forest Inventory. Forest Department, Ministry of Environment, Forest and Climate Change, Government of the People’s Republic
of Bangladesh, Dhaka, Bangladesh.
ISBN: 978‐984‐34‐7255‐7
Disclaimer
This report is designed to reflect the activities and progress related to the Bangladesh Forest Inventory.
Should readers find any errors in the documents or would like to provide comments for improving its
quality they are encouraged to contact the above contact.
All rights reserved. Reproduction and dissemination of material in this information product for educational
or other non‐commercial purposes are authorized without any prior written permission from the copyright
holders provided the sources is fully acknowledged. Reproduction of material in this information product
for resale or other commercial purposes is prohibited without written permission of the copyright holders.
© 2019 Forest Department, Ministry of Environment, Forest and Climate Change, Bangladesh.

ii
Environmental and social challenges ............................................................................................ 9
Evolution of forest assessment ................................................................................................... 11
The National Forest and Tree Resources Assessment 2005 ‐ 2007 ............................................ 12
Establishing sustainable goals ..................................................................................................... 14
The Bangladesh Forest Inventory process .................................................................................. 20
2.1.1 Objectives ............................................................................................................................ 21
2.1.2 Partnerships ......................................................................................................................... 22
2.1.3 Institutionalization process ................................................................................................. 24
Criteria and indicators ................................................................................................................. 27
2.2.1 Mapping of criteria and indicators to national plans and strategies .................................. 29
State of the art forest monitoring ............................................................................................... 31
2.3.1 Zoning .................................................................................................................................. 34
2.3.2 Land cover mapping ............................................................................................................ 36
2.3.3 Biophysical inventory design ............................................................................................... 39
2.3.4 Socio‐economic survey design ............................................................................................ 45
2.3.5 Supporting information ....................................................................................................... 49
2.3.6 Data management and data quality control ....................................................................... 47
Access to information .................................................................................................................. 54
Extent of trees and forest resources ........................................................................................... 60
Tree cover changes ...................................................................................................................... 64
Table of Contents
iii
4.1. Tree species composition, stem density, and size characteristics .............................................. 72
4.1.1 Plant diversity and basal area .............................................................................................. 72
4.1.2 Stand characteristics by species .......................................................................................... 75
Regeneration and recruitment .................................................................................................... 79
4.2.1 Regeneration by species and zone ...................................................................................... 79
4.2.2 Regeneration ....................................................................................................................... 81
4.2.3 Recruitment status by species and zone ............................................................................. 83
Plant diversity index of trees ....................................................................................................... 85
Status of native and introduced tree species .............................................................................. 87
Red List tree and animal species ................................................................................................. 91
4.5.1 Density of Red List tree species ........................................................................................... 91
4.5.2 Red List tree and animal species traded ............................................................................. 94
Growing stocks .......................................................................................................................... 104
5.1.1 Growing stocks by native and introduced species ............................................................ 104
5.1.2 Growing stocks, national estimate by zone and land cover class ..................................... 106
5.1.3 Growing stocks by diameter class and height class .......................................................... 110
5.1.4 Bamboo stock, national estimate by zone and land cover class ....................................... 112
Tree biomass ............................................................................................................................. 114
5.2.1 Above ground biomass by species .................................................................................... 114
5.2.2 Above ground biomass, national estimate by zone and land cover class ......................... 116
Dead wood biomass and potential fuelwood ........................................................................... 120
Carbon ....................................................................................................................................... 124
5.4.1 Carbon pools, national estimate by zone .......................................................................... 124
5.4.2 Carbon pools by administrative division ........................................................................... 126
5.4.3 Total carbon by zone and land cover class ........................................................................ 127
5.4.4 Soil carbon by zone and land cover class .......................................................................... 130
5.4.5 Soil properties by land cover class .................................................................................... 133
Tree and forest management type ............................................................................................ 140
Trees and forest by ownership class ......................................................................................... 143

iv
Tree and forest product collection by ownership type ............................................................. 145
Disturbance area and disturbances most cited by households ................................................ 152
Drivers of tree cover changes .................................................................................................... 155
Types of support received from organizations .......................................................................... 162
Households receiving seedling support from BFD .................................................................... 164
Seedlings purchased by households .......................................................................................... 165
Primary tree and forest products .............................................................................................. 172
9.1.1 Quantity of each primary tree and forest products collected .......................................... 172
9.1.2 Economic value of primary products collected, including NWFP ..................................... 175
9.1.3 Quantity/Share of collected primary products sold .......................................................... 181
9.1.4 Annual income earned by the households from selling primary tree and forest products
…………………………………………………………………………………………………………………………………….183
Processed tree and forest products .......................................................................................... 187
9.2.1 Quantity of the processed tree and forest products......................................................... 187
9.2.2 Quantity of the processed tree and forest products supplied to the market by households
189
9.2.3 Annual income earning from processed tree and forest products ................................... 190
Involvement with tree and forest related activities .................................................................. 191
9.3.1 Number and proportion of household members involved/employed in tree and forest
related activities ................................................................................................................................ 191
Services and benefits from trees and forests ............................................................................ 194
Dependence on trees and forests for energy............................................................................ 195
9.5.1 Value of collected forest products used for cooking and heating .................................... 195
9.5.2 Cost of forest products used for cooking and heating ...................................................... 196
9.5.3 Presumed amount of purchased tree and forest products used for energy .................... 198
Total annual income from trees and forests ............................................................................. 199

v
Foreword
The entire world is looking at forest ecosystems for providing solutions to the adverse impacts of climate change and ensuring the ecological security of the world. Forest ecosystems are dynamic in nature and so require regular monitoring of changes in order to ensure balance between its conservation and development. It gives me great pleasure to note that Bangladesh Forest Department has fulfilled this national need by carrying out first cycle of the inventory from 2015 to 2019 through the project “Strengthening National Forest Inventory and Satellite Land Monitoring System in support of REDD+ in Bangladesh“ technically supported by Food and Agriculture Organization of the United Nations (FAO) and financially assisted by the United Agency for International Development (USAID). This National Forest Inventory has provided qualitative and quantitative information at the national level, including information on forest growing stock, carbon accounting and other forestry parameters which are not only important to forestry professionals but also to policy makers, planners, researchers, academicians, non‐government organizations, community based organizations, etc. having interest in the conservation of forest resources. All these forestry statistics have provided us with a comprehensive picture of our forest resources that allows us to understand these resources and to inform national plans and strategies for balancing sustainable development with natural resource conservation, in particular the Sustainable Development Goal 15 ‐ Life on Land. I am delighted to note that Bangladesh Forest Department has proved its professional competence in the assessment of forest resources as well as forest cover mapping by using satellite‐based land monitoring system, the concept of which is in accordance with the Hon’ble Prime Minister’s vision of “Digital Bangladesh”. I hope that Forest Department will continue to strive making use of advanced remote sensing‐based technologies consistent with changing times to provide more comprehensive information for sustainable management of forest resources in the country. I am confident that Bangladesh Forest Department will be able to pursue periodic forest inventory to monitor the changes in our forest resources for sustainable utilization without compromising our effort on conservation. I am happy to note that this inventory has included trees outside the forest which are major sources of meeting the local demands of timber, fuel wood and fodder. The forest statistics and other information produced by this National Forest Inventory will be widely used in forest policy making, forest management planning, planning of forest industry investments, assessing sustainability of forestry, evaluation of greenhouse gas emissions and changes in carbon storage and research. Moreover, this assessment will make significant contribution towards international commitments by reporting and complying various requirements under Global Forest Resource Assessment, REDD+, UNFCCC, UNCCD, CBD etc. I am thankful to the USAID and FAO for their continued assistance and support. I express my deep appreciation to the Chief Conservator of Forests and his team for engaging in this endeavour, and for their dedicated efforts, devotion and hard work in successfully completing the inventory to bring about this highly useful and informative report. My hope is this effort will provide the robust information to decision makers for sustainable forest management and conservation in the country.
Md. Shahab Uddin, MP Minister Ministry of Environment, Forest and Climate Change

vi
Message
National forest inventories have gained global importance and momentum with countries striving to monitor
their forest resources with the intention to generate reliable estimates of the country’s tree and forest
resources, which will have a long‐term impact on improving the management, conservation and benefits
from trees and forests. Reliable and up‐to‐date information on the state of forest resources is crucial for
supporting policy formulation, strategic planning, financial investment and sustainable forest management.
To generate this information, Bangladesh Forest Department under the Ministry of Environment, Forest and
Climate Change implemented the project “Strengthening National Forest Inventory and Satellite Land
Monitoring System in support of REDD+ in Bangladesh“from 2015 to 2019 with financial support from the
USAID and technical support from the FAO of the United Nations. The resulting Bangladesh Forest Inventory
(BFI) is a key contribution to the Measurement, Reporting and Verification (MRV) component of the REDD+
mechanism (reducing emissions from deforestation and forest degradation, conservation of existing forest
carbon stocks, sustainable forest management and enhancement of forest carbon stocks).
I am delighted to note that the Bangladesh Forest Department successfully applied the latest remote sensing
technologies to lead the comprehensive National Forest Monitoring in the country through a dedicated set
of forestry professionals. I am confident that the forestry professionals have been able to enhance their
capacities in forest resource assessment and so be able to implement forest resource assessments in future.
The successful completion of BFI and the publication of this report is a testimony to our commitment to the
management and conservation of the country’s forest resources. It is impressive to look at the contributions
of various professionals involved with the implementation of the project and preparation of this report, which
provides us with an updated understanding of national tree and forest resources. I am thankful to the FAO of
the United Nations for providing technical support and to the USAID for financial assistance to implement the
BFI project.
Finally, I would like to record my sincere appreciation, in general, to the Forest Department and in particular,
to the BFI team and all the stakeholders contributing to the successful and commendable achievement of the
project. I hope the information disseminated by this report will be utilized in full extent to all decision makers,
planners, academicians, students and other professionals working in the field of natural resource
management.
Habibun Nahar Deputy Minister Ministry of Environment, Forest and Climate Change
vii
One of the core missions of the Ministry of Environment, Forest and Climate Change (MoEFCC) is to ensure
sustainable management of forests through the conservation of ecosystems and biodiversity helpful for
addressing climate change. At the same time, it seeks to develop forest resources and recognize the socio‐
economic contribution and community dependence on trees and forests. As the country continues to
experience both economic and population growth, it is critically important to have a national forest
monitoring system which captures the impacts of expanding industries and other activities for livelihoods
on natural resources.
The data collected from national forest inventory is useful to forestry professionals as well as policy makers
as it accurately provides multiple functions of forest ecosystems. For many years, we had been lacking in
establishing a repeatable and comprehensive national forest inventory system in Bangladesh required
for mapping forest coverage and socio‐ economic scenario. Now with the implementation of the
Bangladesh Forest Inventory (BFI), a system is in place to provide accurate information as to forest and
tree coverage in the country with mention of different uses. The system is the main tool in the forestry
sector for monitoring progress towards achieving Sustainable Development Goal No.15 – Life on Land. It
helps adopt appropriate policies and plans related to other national forestry related priorities as well. It is
also the basis for Monitoring, Reporting and Verification (MRV) of Reducing Emissions from Deforestation
and Forest Degradation (REDD+) activities that maintain and increase terrestrial carbon stocks to address
climate change. I wish to congratulate Bangladesh Forest Department and its partners for their integrated role in
successfully implementing the Bangladesh Forest Inventory. With pleasure I endorse this report, an
accurate national baseline document which will help us sustainably manage and develop our forest
resources in a transparent way. From now on we will be able to confidently take informed decisions as to
our plans, policies and projects requiring data of forestry sector. I look forward to have similar future
inventories done in a regular interval. Finally, I am delighted to record my appreciation for officials of
Forest Department and consultants of FAO for their cordial efforts in producing this national forest
inventory document. I would like to urge all the officials of Bangladesh Forest Department to keep
going with sincere endeavour, innovation and proactive role to profile forestry as a viable sector for
promoting and implementing sustainable forest management in all its dimensions and capturing its
contribution to improving human livelihoods as well as poverty reduction in the country.
Ziaul Hasan ndc Secretary Ministry of Environment, Forest and Climate Change
Message

viii
Message
Tree and forest resources play an important role to the sustenance and livelihood of many people
of Bangladesh, but the sustainability of those resources is threatened by population growth,
agriculture land expansion and shifting land tenure. It is essential to monitor trees and forests to
inform decision makers about their status and plan strategies and form policies that ensure
sustainable use of forestry resources.
This publication was produced to meet the needs of forest managers and policy makers using results
from the Bangladesh Forest Inventory (BFI) first cycle (2015‐2019). Although the implementation of
the inventory was carried out with financial support from USAID and technical support from Food
and Agriculture Organization of the United Nations (FAO) and SilvaCarbon, it is anticipated that
future inventories will be performed by a fully institutionalized unit within the Forest Department.
The data generated from across the country and over multiple inventory cycles will help Forest
Department succeed in its goals to effectively monitor and ensure wise stewardship of the country’s
forest.
This publication gives readers a glimpse of the total inventory process, including its design,
protocols, and partnerships. It provides results about tree and forest extent, tree diversity,
regeneration status, income for livelihoods and other important indicators of sustainable forest
management. The results include quantifying the supply and demand of forest resources, which
highlights the relationship between communities and forest and helps in deciding interventions.
The report provides relevant information for reaching national targets, including sustainable
development goals, and reporting to national and international frameworks. It is with great
pleasure that the Forest Department presents the final results of the BFI.
Md. Amir Hosain Chowdhury Chief Conservator of Forests
Forest Department

ix
The United States Agency for International Development (USAID) has supported the development
of Bangladesh since the country gained independence in 1971. Over this time, Bangladesh has
made impressive strides in many sectors, including agriculture, natural resource management,
education, and health. These improvements have increased the nation’s prosperity, food security,
and resilience to natural disasters. USAID is proud of its partnership with the government and
people of Bangladesh and we are encouraged by the positive results emerging from investments
in development projects.
The Bangladesh Forest Inventory (BFI) is Bangladesh’s first comprehensive nationwide, long‐term
forest monitoring system. The BFI is the culmination of a four‐year, $5.6 million commitment by
USAID, to support the Government of Bangladesh’s priorities in climate change adaptation,
biodiversity conservation, and natural resource management. With this tool Bangladesh will be
able to make long‐term policy decisions regarding trees and forest resources and their
contribution to sustainable livelihoods.
Science, technology, and innovation are vitally important to the success of USAID’s activities as
they have the transformative power to accelerate development impact, improve cost‐efficiency,
and increase program reach and sustainability. Tools like the BFI strengthen the evidence for
building resilience to natural hazards by increasing the quality of research and analytical skills for
assessing risk and promoting adaptation, mitigation, and resilience.
USAID is pleased to support the Bangladesh Forest Department to implement the BFI as its long‐
term forest monitoring system. This comprehensive and innovative system integrates remote
sensing, field measurements, and socio‐economic survey results which touch on each major need
the Forest Department has to assess and improve Bangladesh’s forest resources.
USAID continues to support the Government of Bangladesh’s efforts to sustainably manage the
country’s forest resources and looks forward to seeing the Bangladesh Forest Inventory used to
enhance these efforts.
Derrick S. Brown Bangladesh Mission Director
United States Agency for International Development
Message

x
The current state of the world’s forests means that sustainable forest management has never been
more relevant because trees and forests play such a fundamental role in the global nutrients
cycling, carbon sequestration, conservation of biodiversity, and provision of forest products to
livelihoods. The message that future prosperity is linked to wise stewardship of natural resources
is gaining greater public recognition.
Over the past four decades, FAO has been providing technical support to the Government of
Bangladesh as sustainable tree and forest management has increasingly been considered in
national plans and strategies. Whether through developing technical capacity or through direct
support to implement forest monitoring, FAO is committed to assisting the government to meet
its sustainable forestry goals, including its sustainable development goals and 7th five‐year plan
targets.
Tree and forest monitoring is crucial to provide baseline information to policy makers for planning
and guiding interventions. The launch of the Bangladesh Forest Inventory in 2016 was a great
achievement towards long‐term national monitoring of tree and forest resources. Throughout the
first cycle of the Bangladesh Forest Inventory, the Forest Department, especially the RIMS unit,
proved its capacity in deploying an innovative system that benefits from the latest technologies
and to implement an exemplar national forest monitoring system in Asia.
FAO congratulates the Forest Department for this successful implementation and reiterates its
support when needed for sustainable forest management. The knowledge disseminated through
this report has the potential to be far reaching and impactful, influencing many sectors outside
forestry towards integrated natural resources management.
Robert Simpson Representative
Food and Agriculture Organization of the United Nations
Phot
o: Tangail, Rubber plantation, F
algo
onee
Kum
ar M
ondo
l
Message
xi
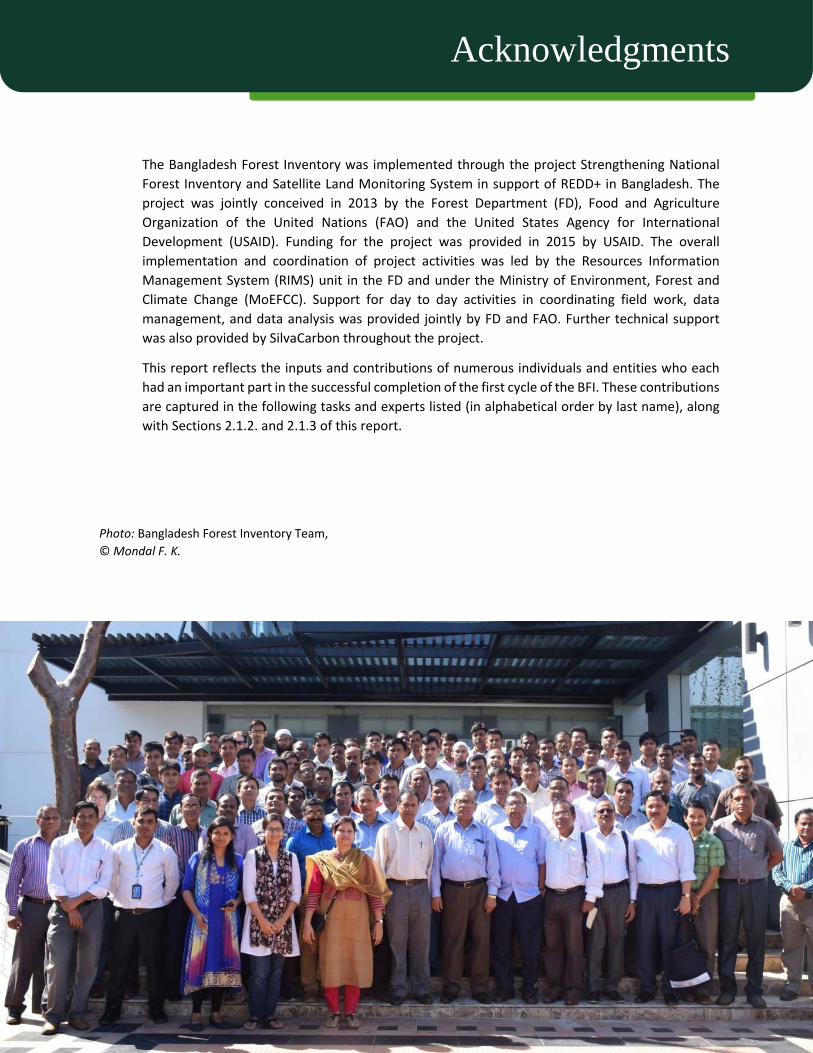
The Bangladesh Forest Inventory was implemented through the project Strengthening National
Forest Inventory and Satellite Land Monitoring System in support of REDD+ in Bangladesh. The
project was jointly conceived in 2013 by the Forest Department (FD), Food and Agriculture
Organization of the United Nations (FAO) and the United States Agency for International
Development (USAID). Funding for the project was provided in 2015 by USAID. The overall
implementation and coordination of project activities was led by the Resources Information
Management System (RIMS) unit in the FD and under the Ministry of Environment, Forest and
Climate Change (MoEFCC). Support for day to day activities in coordinating field work, data
management, and data analysis was provided jointly by FD and FAO. Further technical support
was also provided by SilvaCarbon throughout the project.
This report reflects the inputs and contributions of numerous individuals and entities who each
had an important part in the successful completion of the first cycle of the BFI. These contributions
are captured in the following tasks and experts listed (in alphabetical order by last name), along
with Sections 2.1.2. and 2.1.3 of this report.
Acknowledgments
Photo: Bangladesh Forest Inventory Team,
© Mondal F. K.

FYP ‐ Five Year Plan
ACF ‐ Assistant Conservator of Forests
AGB – Above Ground Biomass
AF ‐ Arannayk Foundation
BA – Basal Area
BBS ‐ Bangladesh Bureau of Statistics
BDT – Bangladesh Taka
FD‐ Forest Department
BFI ‐ Bangladesh Forest Inventory
BGB ‐ Below Ground Biomass
BNH – Bangladesh National Herbarium
CAGB – Carbon in Above Ground Biomass
CBD – Convention on Biological Diversity
CBGB – Carbon in Below Ground Biomass
CCF – Chief Conservator of Forests
CHTRC ‐ Chittagong Hill Tracts Regional Council
C&I ‐ Criteria and Indicator
CIP ‐ Country Investment Plan
CR ‐ Critically Endangered
CZ ‐ Coastal Zone
CWD – Coarse Woody Debris
DAN – Data Analysis
DB ‐ Dead Biomass
DBH ‐ Diameter at Breast Height
DCF ‐ Deputy Conservator of Forests
DCCF – Deputy Chief Conservator of Forests
DU – University of Dhaka
EFCC ‐ Environment, Forestry and Climate Change
EN ‐ Endangered
ES ‐ Ecosystem Services
FAO ‐ Food and Agriculture Organization of the
United Nations
FGD ‐ Focused Group Discussion
FRA ‐ Global Forest Resources Assessment
FWD – Fine Woody Debris
GDP ‐ Gross Domestic Product
GIS – Geographic Information System
GoB ‐ Government of Bangladesh
GPS – Global Positioning System
GS – Growing Stock
Ha ‐ Hectare
HH – Household
HTAC – Household Tree Availability Class
HZ ‐ Hill Zone
IFESCU – Institute of Forestry and Environmental
Sciences Chittagong University
LCC ‐ Land Cover Class
mill. ‐ Million
MoEFCC – Ministry of Environment, Forest and
Climate Change
MRI ‐ Margalef’s Richness index
NLCL‐ National Land Class Legends
LRSB –Land Representation System of Bangladesh
PEI ‐ Pielou’s Evenness index
QA/QC ‐ Quality Assurance and Quality Control.
SDGs ‐ Sustainable Development Goals
SDI ‐ Simpson’s Dominance index
SE – Standard Error
SFM ‐ Sustainable Forest Management
SOC – Soil Organic Carbon
SRDI – Soil Research and Development Institute
SuZ‐ Subdarbans Zone
SWDI ‐ Shannon‐Wiener Diversity Index
SZ ‐ Sal Zone
UN ‐ United Nations
UNREDD ‐ The United Nations Programme on
Reducing Emissions from Deforestation and Forest
Degradation
USAID – United States Agency for International
Development
USFS – United States Forest Service
VU – Vulnerable
VZ ‐ Village Zone
Yr – Year
List of Acronyms

1
Trees and forests in Bangladesh provide a wealth of resources in the form of nutrition, energy,
medicine and materials which local communities heavily depend on. They are also valued for their
contribution to soil and water protection, carbon sequestration and many other services.
Nonetheless, these resources are under extreme pressure from rapid population growth, land
degradation, and expanding industries. While Bangladesh is aspiring to become a higher middle‐
income country by 2021, sustainably using and conserving these resources is central to the
sustainable development of the country.
Tree and forest resources of Bangladesh: Report on the Bangladesh Forest Inventory is a publication which summarizes the results of the first cycle of the inventory performed from 2015 to 2019. It
includes national scale estimates from a land cover map and satellite land monitoring system, a
forest inventory of 1858 plots, and a socio‐economic survey of 6400 households. Each provides
baseline information for sustainable tree and forest management and conservation. This system
allows for stronger monitoring of both forests and Trees Outside Forest (TOF) and will be updated
with results from future cycles.
The results of the Bangladesh Forest Inventory (BFI) are aimed to inform national plans and
strategies for balancing sustainable development with natural resource conservation, in particular
the Sustainable Development Goal 15 ‐ Life on Land (SDG 15). The BFI process can also be intensified
and enhanced to meet specific regional purposes. In summary, it is a comprehensive National Forest
Monitoring System (NFMS) which applies the latest technologies to ensure reliable estimates of the
country’s tree and forest resources and will have a long‐term impact on improving the management,
conservation and benefits from trees and forests.
More than 30 government agencies, universities and NGO’s assisted the Forest Department in
completing the first cycle of the BFI by contributing to the design, trainings, data collection, data
analysis and other components. The United States Agency for International Development (USAID),
the Food and Agriculture Organization of the United Nations (FAO) and SilvaCarbon provided
technical and financial resources to the process1.
The following seven criteria embody this vision of sustainable forest management:
1. Forest extent and tree cover changes
2. Biological diversity and conservation
3. Growing stock, biomass and carbon
4. Management and ownership
5. Tree and forest disturbances
6. Support for sustainable forest management
7. Tree and forest services and livelihoods
1 Other collaborators include US Forest Service, University of Maryland, National Aeronautics and Space Administration (NASA) and French Agricultural Research Centre for International Development (CIRAD).
Executive Summary

2
Criterion 1 - Forest extent and tree cover changes (Section 3)
In 2015, forest cover in Bangladesh was 1,884,019 ha, or 12.8% of the total country area using the FRA (2018) definition of forest cover2. This amounts to 11.7 ha per 1000 people. When only
terrestrial land area is considered (i.e. excluding river and lake area), the forest cover is 14.1%. Hill
Forest is the largest forest type by area (4.6% of the country area) followed by Shrubs with Scattered
Trees (4.2%) and Mangrove Forest (2.7%). Permanent Crops covered half of the country area and,
although these areas are primarily used for agriculture, they still have an average tree cover of about
7%. Notable increases of average tree cover occurs within Mangrove Plantation (12% increase),
followed by Mangrove Forest (4%) and Rubber Plantation (2%). The highest decreases in tree cover
occurs in Plain Land Forest (Sal Forest) (18%), Shifting Cultivation (14%) and Hill Forest (7%).
Criterion 2 - Biological diversity and conservation (Section 4)
Biological diversity in terms of number of tree species per land cover is highest in the Hill Forest and
Rural Settlements, where each have more than 240 different species. However, 63% of individual
trees in the Rural Settlement are introduced species, compared to only 33% in the Hill Forest. Thus,
humans are partially responsible for high biological diversity occurring within their own living
environment while native tree diversity is preserved more in natural forests. In total, there were 12
threatened species identified in the biophysical inventory, occurring mostly in the Hill zone. At least
two species in the Hill zone were determined to be globally Endangered or Critically Endangered
(Aquilaria malaccensis and Anisoptera scaphula) per IUCN’s Red List, although their status within Bangladesh was Vulnerable or Unknown.
Criterion 3 - Growing stock, biomass and carbon (Section 5)
Rural settlements are the largest source of the national growing stock volume which is 2.7 times
higher than the volume in Forest area, contributing to 50% of the total growing stock. Similarly,
bamboo volume in the Rural Settlement is 59% of the total national bamboo stock.
Trees Outside Forest, which include Rural Settlement, contains 66% of the total biomass. The highest
biomass density occurs in the Sundarban zone. One fruit species (Mangifera indica), one introduced species (Swietenia mahagoni), and one mangrove species (Heritiera fomes), are the top three species by biomass in the country and comprise 19% of the national biomass. The highest supply of
biomass that is usable for fuelwood (i.e. coarse woody debris, fine woody debris, and litter) is from
the Hill Forest (3,408 tons biomass, or 33% of the total), but a substantial amount is also found in
Rural Settlement (2,587 tons, or 25%).
The total terrestrial carbon stock (aboveground, belowground, dead wood, litter and 0‐30cm soil) is
estimated to be 1275.55 million tons. The majority of the country’s carbon stock is held in soils to
30cm depth3 (80.5%), followed by aboveground biomass (15.3%), belowground biomass (3.6%),
dead wood biomass (0.5%), and litter biomass (0.1%). Forest areas hold 21.5% of the total carbon
2 The following land cover classes were considered as forest cover: Bamboo Forest, Forest Plantation, Hill Forest, Mangrove Forest, Mangrove Plantation, Plain Land Forest (Sal Forest), Rubber Plantation, Shrubs with scattered trees, Swamp Forest 3 Soil carbon was determined by LOI without removing carbonates and may yield higher estimates than other methods such as Walkley‐Black.

3
stock in the country and Hill forest and Mangrove forest alone hold 9.7% and 5.2% of the total,
respectively.
Criterion 4 - Forest management and ownership (Section 6)
There are 3.1 million ha of land, or 23.2% of the total area, which have some form of tree and forest
management observed by field teams. 48% of the managed land is some form of plantation (general,
woodlot, coastal, rubber or strip), while the remaining managed land is mostly agro‐forestry, tea
garden, or orchard. Households collect most of their tree and forest products from privately owned
lands in the form of energy (41% of total households), materials (8%), and nutrition (7%). Those
same products are not collected abundantly from FD owned land (e.g. energy is 2% of total
households and nutrition is 1%.
Forest land ownership is still being digitally delineated in Bangladesh. Nonetheless, the BFI is a
sample of the total land area and may be used to generate proportions of ownership types. Based
on this approach, 9.4% of the total land is owned by FD which subsequently held 24.5% of the
country’s total aboveground carbon stock.
Criterion 5 - Tree and forest disturbances (Section 7)
About 32% of the forest area experience some kind of natural disturbance, with landsliding, other
erosion, and cyclones being the most common types. In contrast, in TOF the most common
disturbance is waterlogging. Disturbance is also assessed through household interviews where
respondents overwhelmingly identified cyclones and infrastructure development as major
disturbance types. When asked specifically about the reasons for tree cover loss, the respondents
mostly identified degradation in the form of overharvesting and tree removals from construction.
Criterion 6 - Support for forestry activities (Section 8)
The socio‐economic survey revealed that few respondents (1.3%) reported receiving support for sustainable tree and forest management from any organization. Those who did reported receiving
free seedlings and trainings on tree planting. For planting purposes, people usually purchase
seedlings and plantings materials from local market; but in some cases, people receive free seedlings
from Forest Department also. Nationally, 43% of the households purchase their own seedlings over
the past year (2017 to 2018) and spend an average of 1,015 BDT for those seedlings.
Criterion 7 - Trees and forests services and livelihoods (Section 9)
The socio‐econonomic survey revealed that trees and forests are a rich source of materials, energy,
nutrition, and income for the majority of households. An estimated 64% of the total population is
involved in collecting primary tree and forest products. The total estimated value of the primary
tree and forest products collected is 3.07% of the 2017‐18’s national Gross Domestic Product (GDP)
measured in current price. The value of primary forest products collected by households is on
average 19,518 BDT/year, mostly contributed in the form of fruit (47%) and energy (40%).

4
Trees outside Forest supply most of the country’s primary tree and forest products. An exception is
in the Hill zone, where about 70% of the timber, bamboo, fuelwood, and leaves, and almost half of
the fruits, are supplied from Forest area near the households.
The total value of products used for cooking and heating is 202,927 million BDT/year. The value of
these products to households in the Hill zone is nearly four times more than the national average
(24,476 v. 6,138 BDT/HH/year, respectively). The average cost of buying forest products for cooking
and heating purposes is 2,554 BDT/HH/year nationally.
In terms of income, a household in Bangladesh annually earns BDT 9,160 from selling primary tree
and forest products which contributed to 1.29% of the 2017‐18’s national Gross National Income
(GNI) measured in current market price. Households belonging to higher income classes earn more
from tree and forest products. Nowhere is the total annual income from trees and forests greater
than in the Sundarban periphery zone at 29,275 BDT/year, which is 9% of the total income of that
zone, earned mainly from selling fishery products.

5

6
A new era for forest assessment and monitoring

7
Phot
o: BFI field m
easuremen
t, Tangail, ©
Mon
dal F
.K.

8
A new era for forest
assessment and monitoring
Trees and forests are of immense importance to the world’s population due to their role in global
nutrient cycles and provision of a wide array of goods and services. An increasing amount of both
public interest and political will are directed towards plans and strategies that develop, protect,
manage and conserve forest resources. In Bangladesh, trees and forests play a crucial role in the
country’s plans towards sustainable development. Ideally, these natural resources should be
managed in such a way that balances commercial production, food security and sustainable
livelihoods with protection of biological diversity, conservation of plant, soil and water resources,
and mitigating climate change. Achieving this balance requires innovative and forward‐thinking
approaches in tree and forest assessment, monitoring, and management.
The BFI participates in a new era of forest assessment and monitoring because it: 1) provides long‐
term monitoring, 2) is designed to be fully institutionalized, 3) uses multiple sources of information
and the latest forest mensuration technologies, and 4) meets the data needs of multiple purposes.
In parallel, its conception and implementation involved a wide range of national stakeholders to
ensure their engagement and their contribution throughout the process. Despite the simple name,
it is more than just a database of tree measurements. It achieves “the technical process of data
compilation and analysis of forest resources from a multitude of data sources, including field
inventories and remote sensing, to estimate relevant forest characteristics at particular points in
time” (FAO 2017b). The BFI not only quantifies benefits from forests and Trees Outside Forest (TOF),
it also provides information about their relationships with the people that use them and makes
accessible the information to multiple beneficiaries (FAO 2015b). Furthermore, the BFI is designed
to be updated through periodic field measurement cycles, which helps meet evolving societal needs.
It is the country’s national forest monitoring system (NFMS) for providing science‐based information
to support policies to conserve and sustainably manage forests in Bangladesh.
Section 1

9
1.1
Environmentalandsocialchallenges
As in many countries, deforestation and forest degradation has been occurring in Bangladesh for
hundreds of years. The country’s forests are heavily used but the ability to restore forests is limited.
Although overall tree canopy coverage increased modestly from 2000 to 2014, the natural forest
area declined rapidly (Potapov, Siddiqui et al. 2017), and there is a persistent widening gap between
the demand and supply of forest products (Rahman 2016). There is limited national level information
about the status of tree and forest resources to guide local to national forest management and
conservation activities.
The growing need of land for human settlement, agriculture, industries, and timber and fuelwood is
largely responsible for deforestation and forest degradation (Chowdhury, Costello et al. 2016). Most
of the forest loss can be attributed to overpopulation, poverty and unemployment, and lack of
governance (UN‐REDD 2017). Governance impacts all forest types and specifically included problems
related to uncertainty in land tenure and lack of capacity to implement forestry related management,
policies, and law enforcement. These indirect drivers in turn lead to a suite of direct drivers of
deforestation, namely uncontrolled encroachment from industrialization and agriculture, and illegal
logging (UN‐REDD 2017). Specific direct drivers of forest degradation differ by zone. For example,
forests in Sundarban and Coastal zones compete with shrimp farming or suffer from industrial
pollution related to shrimp farms, pesticides, and oil spills. On the other hand, forests in the Sal and
Hill zones experience intense pressure due to firewood collection, illegal logging, and exotic species
(Chowdhury, Costello et al. 2016). The Sundarbans are threatened with oil spills from cargo vessels
(Aziz and Paul 2015) and increasing numbers of factories and thermal power plants. The waste and
pollution generated impact water quality and threaten the mangrove ecosystem (Sarker, Akhand et
al. 2016).
The impacts of deforestation and forest degradation in Bangladesh often interact with natural
disturbances. For example, despite a moratorium on logging lasting from 1989 until 2020, in the
Chittagong Hill Tracts, the exploitation of trees has resulted in a substantial loss of forest cover and
soil degradation. Removals of timber and poles and shifting cultivation has degraded landscapes, and
when coupled with heavy rainfall has led to heavy soil erosion and landsliding (Mahmood and Khan
2010). Furthermore, in low lying areas the impacts of both human and natural disturbances are more

10
severe in Bangladesh than in neighboring countries due to its vulnerable location among major river
systems GOB (2015). Rising sea levels in combination with storms and cyclones make coastal areas
especially vulnerable. Salinity intrusion, caused by reduced freshwater flow, changing rainfall
patterns and growing aquaculture industry could reduce the fresh water supply for people and their
crops (Dasgupta, Hossain et al. 2014, Dasgupta, Akther Kamal et al. 2015).
Photo: QA/QC training, Cox’s Bazar, © Mondal F.K.

11
1.2
Evolutionofforestassessment
Previous forest policies and inventories reflect the
history of how people viewed Bangladesh’s natural
resources. Beginning in the British colonial period, forest
resources of the Indian subcontinent were diverse and
seemed to be unlimited. However, the colonial
authorities soon took into consideration that British
India's forests were not inexhaustible. Although a
national level forest inventory was not available until
2005 (MoEF and FAO 2007), there is a 200 years history
of forest inventories at the sub‐national level. The first
inventory was implemented from 1769 to 1773, but it
was limited to selected forest areas in Sundarban. Later,
various forests inventories were undertaken for the
preparation of forest management plans for major
forest types (e.g. mangrove forests in the Sundarban; hill
forests in Chittagong, Cox’s Bazar, Sylhet and Chittagong
Hill Tracts; sal forests in Gazipur, Tangail and
Mymensingh). These inventories focused on forest area
and crude estimates of what is now characterized as
growing stock volume. Only recently did inventories
begin to include more forest variables for understanding
biological diversity and carbon storage. A complete list
of past forest inventories in Bangladesh is found in
Appendix 1.3.
Photo: Garjan forest, Cox’s Bazar © Henry M.

12
1.3
Thenationalforestandtreeresourcesassessment2005–2007
During 2005‐2007, the Forest Department implemented the first National Forest Assessment (NFA)
which covered both forests and TOF whereas earlier management inventories were confined within
the designated forest reserves only (MoEF and FAO 2007). The NFA objective was to capture detailed
information about forest resources and land use. It included remote sensing analyses and a ground
inventory with 299 sampling plots (referred to as tracts) throughout the country in a systematic
design. Further, the inventory enumerated national land use area, growing stock, biodiversity and
regeneration, social and economic aspects of forests and trees and biomass and carbon.
Though the NFA has been used for international reporting purposes, its current use for informing
and impacting policies is limited as national objectives and the environment sector have shifted to
capturing and monitoring changes at both the national and sub‐national scales. In addition, although
the NFA design was statistically sound at the national scale, it suffered from some key technical
limitations. Firstly, the strategy to establish relatively large but fewer plots resulted in an under
representation of certain important forest types such as Sal forest and coastal plantation areas which
are key strategic forest types for FD. Second, estimations of volume, biomass, and carbon only used
one general allometric equation for all tree species. Third, the inventory was not usable for
monitoring purposes as the plots could not be relocated to update the information to observe
changes over time (Costello, Piazza et al. 2016). For these reasons, the NFA was discontinued, leaving
a widening gap between the information needed for national forest assessment and what was
available.

13
Box 1 – Comparing BFI and 2005-07 NFA results
Both the BFI and 2005‐07 NFA provide national level estimates of forest area, volume, biomass, carbon,
and information about tree and forest socio‐economic products and services. Nonetheless, comparsions
between the two inventories are complicated because each uses different land cover classification
systems, allometric equations, and sampling design and intensity. For example, the choice about which
allometric equations to use in an inventory can dramatically alter volume, biomass, and carbon
estimates (Duncanson, Huang et al. 2017). Additionally, the NFA socio‐economic survey did not collect
information about the value and income from tree and forest products, but this was the central purpose
of the BFI socio‐economic survey. In some cases, meaningful comparisons are possible after adjusting
the BFI data, for example by using the same volume equation for both datasets. Some comparisons with
explanations are included throughout this report and more comparisons are found in Appendix 1.2.
Photo: Modhupur Sal forest, Tangail,
© Mondal F.K.

14
1.4
Establishingsustainablegoals
A number of national targets, plans and strategies have been developed in Bangladesh and globally that are
aimed at achieving both environmental responsibility and economic growth through science‐based policy
decisions. In September 2015, the UN General Assembly approved 17 Sustainable Development Goals (SDG’s)
that are meant to link and address societal, economical, and environmental issues. To achieve SDG 154, the
7th Five Year Plan (2016‐2020) of Bangladesh (7FYP) targets to have productive forest coverage at 20 percent
with 70 percent crown density. The 7FYP strategies for achieving the goals include continuing a moratorium
on felling trees in natural forests, increasing tree density through 'enrichment planting' and 'assisted natural
regeneration', intensification of plantation activities in coastal areas and continuing social forestry
programmes (GED 2015).
A five‐year (2016‐2020) country investment plan (CIP) was also recently developed and endorsed to
coordinate the management of the environment, forestry and climate change (EFCC) sectors in the country.
This supports the implementation of the National Conservation Strategy of Bangladesh by overcoming
challenges related to lack of coordination among ministries. The CIP is a cross‐sectoral and whole‐of‐
government investment framework for mobilizing and delivering effective, coordinated, sustainable and
country‐driven investment programmes in environmental protection, sustainable forest management,
climate‐change adaptation and mitigation, and environmental governance. The CIP will be monitored on an
annual basis to track the impact of investments, identify success stories and challenges, and provide
recommendations for improvements (GoB 2017a).
There are several other important policies related to sustainable forest management. For example, the
National Forest Policy (Amended) 1994 attempted to bring 20% of the country’s land under afforestation
programmes by 2015 (GoB 2016). In addition, the Perspective Plan of Bangladesh 2010‐2021 aims at
increasing the tree coverage on 2.84 million hectares designated for forests (GED 2012). Finally, the vision of
the draft National Forestry Policy 2016 is to increase and stabilize its forest cover to at least 20% of the
country's geographical area.
4 SDG 15 is “Protect, restore and promote sustainable use of terrestrial ecosystems, sustainably manage forests, combat desertification, and halt and reverse land degradation and halt biodiversity loss”.

15
In parallel to the above developments, in March 2018 Bangladesh became eligible to graduate from a Least
Developed Country and will officially graduate given the ability to meet certain requirements over the next
6 years. While this is a significant achievement, challenges remain to sustainably manage the country’s
natural resources while maintaining economic growth.
A national forest monitoring system is potentially a powerful tool for achieving SDG’s and related national
plans and strategies. However, to truly empower progress towards these goals through science‐based
decision making, an NFMS needs to go beyond traditional measurements such as merchantable timber
volumes. Multi‐purpose and multi‐resource forest inventories gather information on many different
attributes of forests which forest managers and decision makers use for policy formulation, strategic
planning, day‐to‐day management operations and monitoring.

16
Photo: Accessing the plot center, the Sundarban, © Mondal F.K.

17
18
The Bangladesh Forest Inventory

19
Phot
o: Roadside plantation, ©
FD

20
TheBangladeshForestInventoryprocess
The Bangladesh Forest Inventory (BFI) is a multi‐source and multi‐purpose NFMS that assesses,
evaluates, interprets and reports the status of trees and forest resources nationally. The BFI is also a
process of assessing the relationships of tree and forest resources to livelihoods and forest
management. The BFI process integrates biophysical and socio‐economic data with GIS and RS
technologies in the design, mapping, survey and reporting phases. The concept behind the BFI
originates from the Bangladesh REDD+ Readiness Roadmap and the need to report for activities to
reduce deforestation and forest degradation, monitor greenhouse gas emissions and removals, and
enhance sustainable forest management (UN‐REDD 2012). For example, BFI results provide “data
and information suitable for measuring, reporting and verifying (MRV) anthropogenic forest‐related
emissions”, which supports potential mechanisms for payments of environmental services, including
REDD+ (UN‐REDD 2015, FAO 2015a). It follows the decision of the United Nations Convention on
Climate Change, stipulating the need to use a combination of remote sensing and ground‐based
forest carbon inventory approaches for estimating anthropogenic forest‐related greenhouse gas
emissions and removals, forest carbon stocks and forest area changes (Decision 4/CP15) (UNFCCC
2009). The BFI further adheres to the technical recommendations provided in the guidance
documents of the Global Forest Observations Initiative (GFOI 2014).
The first BFI cycle was initiated in 2015 by FD5 and will provide updated estimates of tree and forest
resources in future cycles. All land uses of the country (not only forest land) are considered for
facilitating nationally consistent results across different sectors. The land cover map allows for
forestry and agricultural related intervention activities to be planned in a spatially explicit manner
that removes technical barriers and ensures cost‐efficiency as much as possible (Vargas, Alcaraz‐
Segura et al. 2017). Data gathered for TOF areas will support activities related to social forestry,
agroforestry, sustainable land management, and climate‐smart agriculture (CIAT and WB 2017).
5 Initial implementation by the FD under the USAID‐funded project “Strengthening National Forest Inventory and Satellite Land Monitoring System in Support of REDD+ in Bangladesh” (GCP/BGD/058/USA).
Section 2
21
The biophysical and socio‐economic surveys complement each other and are particularly adept to
meeting the needs of monitoring and information national plans and strategies that promote
sustainable forest management. Without this supporting information, forests may be under‐valued,
and in the light of pressing needs for socio‐economic development, many policymakers may see little
benefit to sustainable forest management (Kengen 1997). These issues are particularly important in
Bangladesh, where the relationships between people and trees and forests are closely connected,
but perhaps not fully appreciated. Characterizing this dependency at national and sub‐national scales
with a socio‐economic survey better informs decision makers about the importance of tree and
forest resources.
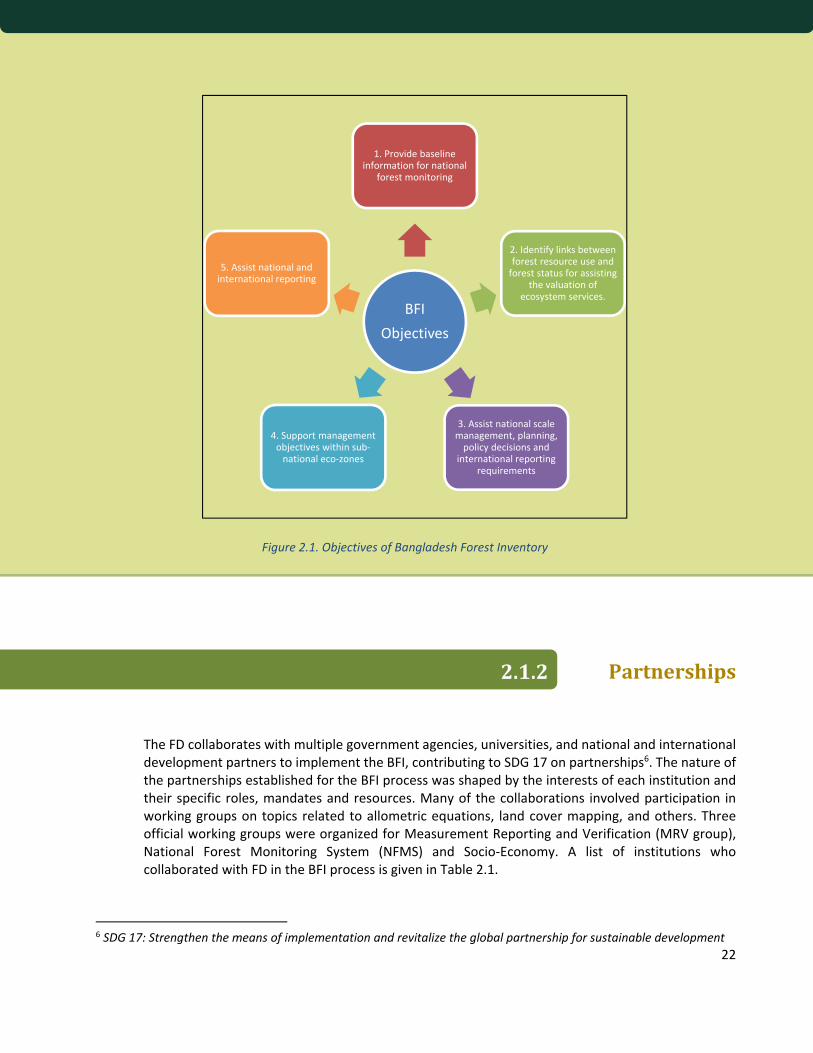
Objectives
The overall objectives of the BFI are to provide national scale baseline information about tree and
forest resources and their relationships with people, with the aim to support sustainable tree and
forest management and conservation in all land uses. In order to realize the aim, five specific
objectives were set through a national stakeholder consultation process. The objectives consider the
perspectives and needs of multiple users of the BFI data and analysis results with regards to
sustainable forest management. The specific objectives are (Figure 2.1):
1. Provide baseline information for national forest monitoring
2. Identify links between forest resource use and status for assisting the valuation of ecosystem
services.
3. Assist national scale management, planning, policy decisions and international reporting
requirements for the forestry sector.
4. Support management objectives within sub‐national zones.
5. Assist national and international reporting on tree and forest resources.
22
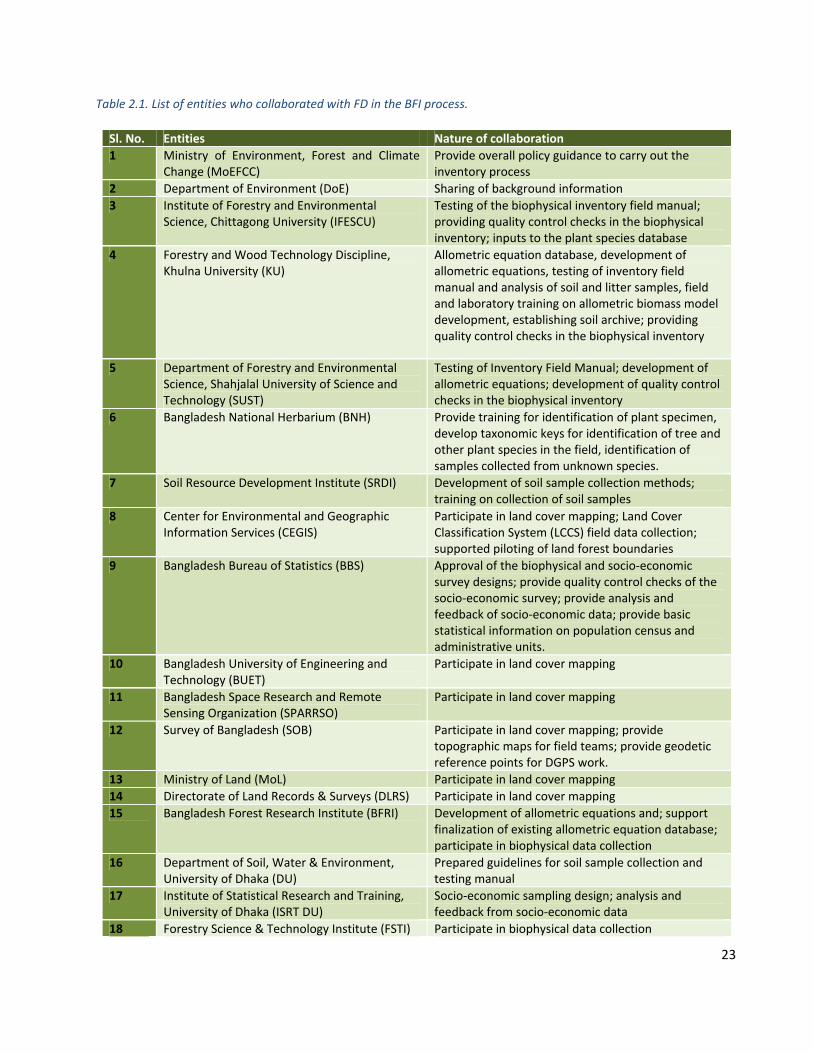
Partnerships
The FD collaborates with multiple government agencies, universities, and national and international development partners to implement the BFI, contributing to SDG 17 on partnerships6. The nature of the partnerships established for the BFI process was shaped by the interests of each institution and their specific roles, mandates and resources. Many of the collaborations involved participation in working groups on topics related to allometric equations, land cover mapping, and others. Three official working groups were organized for Measurement Reporting and Verification (MRV group), National Forest Monitoring System (NFMS) and Socio‐Economy. A list of institutions who collaborated with FD in the BFI process is given in Table 2.1.
6 SDG 17: Strengthen the means of implementation and revitalize the global partnership for sustainable development
Figure 2.1. Objectives of Bangladesh Forest Inventory
BFI
Objectives
1. Provide baseline information for national
forest monitoring
2. Identify links between forest resource use and forest status for assisting
the valuation of ecosystem services.
3. Assist national scale management, planning, policy decisions and
international reporting requirements
4. Support management objectives within sub‐national eco‐zones
5. Assist national and international reporting
23
Table 2.1. List of entities who collaborated with FD in the BFI process.
Sl. No. Entities Nature of collaboration1 Ministry of Environment, Forest and Climate
Change (MoEFCC) Provide overall policy guidance to carry out the inventory process
2 Department of Environment (DoE) Sharing of background information
3 Institute of Forestry and Environmental Science, Chittagong University (IFESCU)
Testing of the biophysical inventory field manual; providing quality control checks in the biophysical inventory; inputs to the plant species database
4 Forestry and Wood Technology Discipline, Khulna University (KU)
Allometric equation database, development of allometric equations, testing of inventory field manual and analysis of soil and litter samples, field and laboratory training on allometric biomass model development, establishing soil archive; providing quality control checks in the biophysical inventory
5 Department of Forestry and Environmental Science, Shahjalal University of Science and Technology (SUST)
Testing of Inventory Field Manual; development of allometric equations; development of quality control checks in the biophysical inventory
6 Bangladesh National Herbarium (BNH) Provide training for identification of plant specimen, develop taxonomic keys for identification of tree and other plant species in the field, identification of samples collected from unknown species.
7 Soil Resource Development Institute (SRDI) Development of soil sample collection methods; training on collection of soil samples
8 Center for Environmental and Geographic Information Services (CEGIS)
Participate in land cover mapping; Land Cover Classification System (LCCS) field data collection; supported piloting of land forest boundaries
9 Bangladesh Bureau of Statistics (BBS) Approval of the biophysical and socio‐economic survey designs; provide quality control checks of the socio‐economic survey; provide analysis and feedback of socio‐economic data; provide basic statistical information on population census and administrative units.
10 Bangladesh University of Engineering and Technology (BUET)
Participate in land cover mapping
11 Bangladesh Space Research and Remote Sensing Organization (SPARRSO)
Participate in land cover mapping
12 Survey of Bangladesh (SOB) Participate in land cover mapping; provide topographic maps for field teams; provide geodetic reference points for DGPS work.
13 Ministry of Land (MoL) Participate in land cover mapping
14 Directorate of Land Records & Surveys (DLRS) Participate in land cover mapping
15 Bangladesh Forest Research Institute (BFRI) Development of allometric equations and; support finalization of existing allometric equation database; participate in biophysical data collection
16 Department of Soil, Water & Environment, University of Dhaka (DU)
Prepared guidelines for soil sample collection and testing manual
17 Institute of Statistical Research and Training, University of Dhaka (ISRT DU)
Socio‐economic sampling design; analysis and feedback from socio‐economic data
18 Forestry Science & Technology Institute (FSTI) Participate in biophysical data collection

24
Institutionalizationprocess
The first cycle of the Bangladesh Forest Inventory (BFI) was implemented as a project by the FD under
the Ministry of Environment, Forest and Climate Change (MoEFCC). Project activities were executed
through a National Project Coordinator (NPC) who had the overall responsibility for planning,
managing, coordinating and supervising BFI activities. The activities were further monitored and
advised by a National Forest Monitoring System (NFMS) Working Group constituted by the Chief
Conservator of Forests and the Project Steering Committee (PSC).
It is critical that a full‐fledged NFMS such as the BFI be institutionalized to maximize its potential for
informing country strategies and goals (FAO 2015b, FAO 2017b). The institutionalization process
includes official institutional arrangement and set of formal documents such as policy directives,
laws, mandates and inclusion in the official organogram. It also requires long‐term support from
qualified and committed professionals from relevant disciplines. Financial support and skilled human
resources, especially information technology, are equally important to the process. Strengthening
national and international collaborations and the continuous involvement of research organizations
and youth will provide future expertise and ensure the process remains up‐to‐date regarding
technological advancement and ability to meet societal needs. Furthermore, the institutionalization
process will make the BFI a critical tool to engage national entities and provide the necessary
baselines to robustly monitor progress towards forestry related goals (FAO 2015b, FAO 2017b).
Sl. No. Entities Nature of collaboration19 Bangladesh Society of Geo‐Informatics (BSGI) Participate in land cover mapping; Land Cover
Classification System (LCCS) field data collection and land feature data collection protocol preparation
20 Bangladesh Institute of Planners (BIP) Participate in land cover mapping
21 Bangladesh Agricultural Research Institute (BARI)
Participate in land cover mapping
22 Center for Natural Resource Studies (CNRS) Socio‐economic survey implementation
23 Sthapati LLC Georeferencing biophysical plot centers with DGPS
24 DATEX Supported piloting of forest land boundary delineation
25 Arannyak Foundation (AF) Socio‐economic sampling design; analysis and feedback from socio‐economic data
26 Overseas Marketing Company (OMC) Support for DGPS training

25
Steps have been taken to permanently establish the BFI as the country’s NFMS. The FD proposed its
re‐organogram in 2017 to MoEFCC wherein a BFI unit was included. The proposed organizational set‐
up of the FD is currently being reviewed for approval. Under the current proposal, the BFI unit will
lead and facilitate the data collection, analysis and dissemination. This will provide clear concept of
mandate for forest monitoring, allow for sharing data, knowledge and experiences between entities,
and promote sustainable integrated efforts for national development. A data sharing policy is being
reviewed to allow sharing the inventory data to national stakeholders. Figure 2.2 presents the
proposed institutional arrangement.
According to the proposed re‐organogram, the BFI unit will be headed by a Deputy Conservator of
Forests (DCF) and staffed with 33 personnel for conducting the biophysical inventory and
coordinating the socio‐economic survey. At the field level, there will be field teams, Quality
Assurance/Quality Control (QA/QC) teams and supervisors for biophysical and socio‐economic data
collection. Field teams will be headed by Assistant Conservator of Forests (ACF); QA/QC teams will
be coordinated by Deputy Conservator of Forests along with a university faculty member as technical
expert. A Conservator of Forests (CF) will supervise the data collection activities at field level in their
respective jurisdictions. As supervisors, CFs will initiate upward communication from CF (Monitoring
Figure 2.2. Proposed institutional setup for the sustainability of the Bangladesh Forest Inventory (DCF - Deputy Conservator of Forests, CF – Coservator of Forests, ACF - Assistant Conservator of Forests, CCF – Chief
Conservator of Forests.

26
Cell) to Chief Conservator of Forests (CCF) through the Additional CCF (Development and
Management Wing).
The BFI unit’s role will be to coordinate the periodic assessments of national forest resources. Ideally,
operationalization will include as annual field programme to collect both biophysical and socio‐
economic data. The data would be collected systematically in panels to ensure a yearly and
statistically unbiased estimate at the national scale. All the panels would be completed every five
years, resulting in a full sample and higher precision estimates (FAO 2015b, FAO 2017b). In contrast
to a single year inventory, this continuous approach avoids the need for major recruitment and
training at the beginning of each inventory and is currently followed or proposed in other countries
(FAO 2015b).
In order to strengthen institutional relationships and collaborations for implementing the BFI, the FD
will ideally sign a number of MoU’s and other formal agreements with different organizations. The
MoU’s also serve to strengthen national capacities and promote the transparency and harmonization
of datasets. The partnerships FD and different organizations to be formalized through MoU’s and
other agreements between are depicted in Figure 2.3.
Figure 2.3. Potential collaborations between national public and private entities under different formal agreements to achieve different components of the BFI. The acronym definitions of the insitutions are listed in
Table 2.1.

27
Criteriaandindicators
Forest assessment is a process of monitoring the value of forest benefits, including past trends and
projections into the future concerning these benefits (FAO 2017a). The process starts with defining
meaningful and achievable objectives related to sustainable forest management. Criteria and
indicators are then used to measure the status and progress towards objectives. Criteria define the
“desired results of particular programme or project in an understandable and communicable way ….
and conditions against which [sustainable forest management] should be assessed … and may be
described by one or more indicators” (Larrubia, Ross et al. 2017). Indicators enable results to be
measured, analysed and reported in a consistent and verifiable manner. These requirements form
the basis of lead questions, such as – what is the impact of government reforestation programs? The
questions in turn help to determine which indicators, or variables, can be measured in field surveys.
The formulation process of criteria, indicators and variables is downward starting from the objectives
while the process of integrating these parameters with each other is upward (Figure 2.4).
Figure 2.4. The process for determining the variables and indicators to be estimated, which then inform objectives.

28
BFI objectives reflect the needs of national stakeholders and international reporting frameworks and were
identified through meetings, national consultations and review of the Global Forest Resources Assessment
2020 (FAO 2018b), Statistical Yearbook Bangladesh (SYB), and National Forest and Tree Resources
Assessment 2005‐2007 (MoEF and FAO 2007). A national consultation was carried out in March 2015 to assist
in the process of defining the BFI objectives using the Design Tool for Inventory and Monitoring (DTIM) (Scott
and Bush 2009, Silvacarbon 2015). DTIM was used for the identification of the broad monitoring objectives,
the related monitoring questions, and the main metrics to address those questions. Through this process a
set of functional objectives were proposed by various stakeholder groups and ranked in order of priority.
Once the functional objectives were defined, the DTIM tool assisted in framing questions that need to be
asked to meet the defined objectives. Taking into account the objectives and goals related to sustainable
management of trees and forests in Bangladesh (e.g. Bangladesh’s 7FYP and CIP EFCC), the criteria and
indicators were defined. The resulting list of criteria closely follow FRA 2020 but are modified according to
the country context and needs (Table 2.2) (FAO 2015a, Larrubia, Ross et al. 2017, FAO 2018a, FAO 2018b).
For example, the results for forest extent, forest growing stock, forest disturbances, forest ownership and
management are largely the same as in FRA 2020. However, additional criteria for understanding biological
diversity and tree and forest livelihoods were added. In the current report, information about trees and
forests is presented in sections according to criteria and indicators which will be monitored in future BFI
cycles.
Photo: Soil sample collection, The Sundarban,
©Mondal F.K.
29
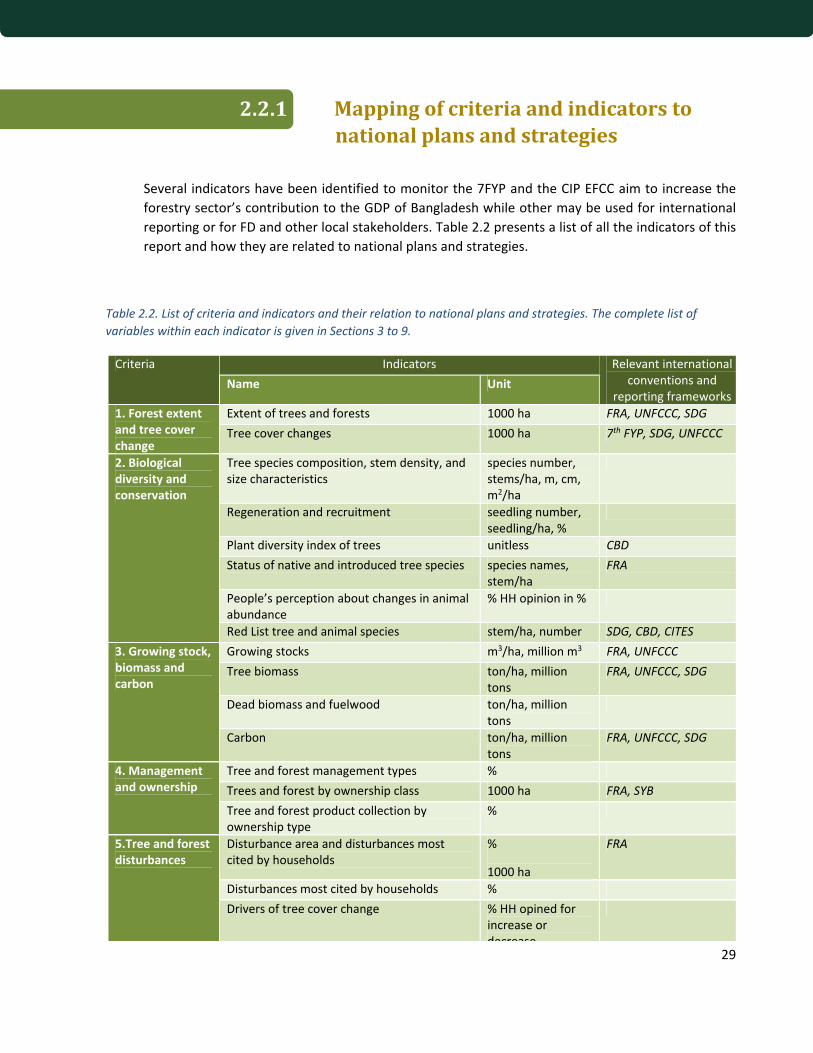
Mappingofcriteriaandindicatorstonationalplansandstrategies
Several indicators have been identified to monitor the 7FYP and the CIP EFCC aim to increase the
forestry sector’s contribution to the GDP of Bangladesh while other may be used for international
reporting or for FD and other local stakeholders. Table 2.2 presents a list of all the indicators of this
report and how they are related to national plans and strategies.
Table 2.2. List of criteria and indicators and their relation to national plans and strategies. The complete list of variables within each indicator is given in Sections 3 to 9.
Criteria Indicators Relevant internationalconventions and
reporting frameworksName Unit
1. Forest extent and tree cover change
Extent of trees and forests 1000 ha FRA, UNFCCC, SDG
Tree cover changes 1000 ha 7th FYP, SDG, UNFCCC
2. Biological diversity and conservation
Tree species composition, stem density, and size characteristics
species number, stems/ha, m, cm, m2/ha
Regeneration and recruitment seedling number, seedling/ha, %
Plant diversity index of trees unitless CBD
Status of native and introduced tree species species names, stem/ha
FRA
People’s perception about changes in animal abundance
% HH opinion in %
Red List tree and animal species stem/ha, number SDG, CBD, CITES
3. Growing stock, biomass and carbon
Growing stocks m3/ha, million m3 FRA, UNFCCC
Tree biomass ton/ha, million tons
FRA, UNFCCC, SDG
Dead biomass and fuelwood ton/ha, million tons
Carbon ton/ha, million tons
FRA, UNFCCC, SDG
4. Management and ownership
Tree and forest management types %
Trees and forest by ownership class 1000 ha FRA, SYB
Tree and forest product collection by ownership type
%
5.Tree and forest disturbances
Disturbance area and disturbances most cited by households
%
1000 ha
FRA
Disturbances most cited by households %
Drivers of tree cover change % HH opined for increase or decrease

30
Criteria Indicators Relevant internationalconventions and
reporting frameworks Name Unit
6. Support for sustainable forest management
Types of support received from organizations % HH receiving support
Households receiving seedling support from FD
% of HH, species names, seedlings/HH
Seedlings purchased by households BDT/seedling
7. Tree and forest services and livelihoods
Quantity collected, value, and income fromprimary products (including NWFP)
qty/HH/yr, BDT/HH/ yr, %
SDG, 7FYP, CIP EFCC, FRA
Quantity, supply, and income from processed products
qty/HH/yr, BDT/HH/ yr
Involvement with tree and forest related activities
% HH members FRA
Services and benefits from forest % SDG, 7FYP, CIP EFCC
Dependence on trees and forests for energy qty/HH/yr, % 7FYP, CIP EFCC
Total annual income from trees and forest BDT/HH/ yr, % SDG, 7FYP, CIP EFCC
31
Stateoftheartforestmonitoring
The BFI overcomes several logistical and technical challenges to implementing a full‐fledged and
institutionalized national forest inventory in Bangladesh. For example, the latest technologies were
used to minimize field measurement errors, reduce costs, and ensure plot re‐location. A new high‐
resolution land cover map was created to meaningfully summarize estimation results. Updated tree
species list, wood density, and allometric equation databases were developed and made accessible
that benefits multiple users in the forestry sector. Finally, government and other personnel were
trained in information technology support, inventory procedures, GIS and remote sensing, and
statistical analysis. Both the biophysical and socio‐economic components apply best practices and
recommendations from the latest methodologies (Magnussen and Reed 2004, Köhl, Magnussen et
al. 2006, Corona and Marchetti 2007, GFOI 2014, FAO 2017b, Masiero, Pettenella et al. 2019). The
result is a rich source of information for understanding many aspects of Bangladesh’s natural
resources. Emphasis is placed on providing clear and interpretable results for answering key
questions and meeting specific objectives.
Biophysical and socio‐economic results are summarized by zones (Section 2.3.1) and land cover
classes (Section 2.3.2) to meet multiple purposes. The biophysical inventory (Section 2.3.3) provides
information for the assessment of carbon, biomass and timber stocks in trees and forests in the
country among other supporting information such as land ownership and land use. The socio‐
economic survey (Section 2.3.4) provides information for understanding the relationship between
human, and tree and forest resources in the country. The biophysical and socio‐economic
components can be integrated with the land cover map for analyzing more profoundly the
relationships between trees, forests, and people.
Further supporting information to the BFI process includes new zone‐specific and species‐specific
allometric biomass models, soils data, data quality procedures, supporting information, and efficient
estimation procedures. Several zone‐specific allometric equations were developed that follow
recommendations for sampling schemes and best practices for selecting models (Section 2.3.5)
(Henry, Cifuentes Jara et al. 2015). Quality control systems in both the biophysical and socio‐
economic surveys, to control errors and provide feedback to field teams (Haub, Kleinewillinghöfer et
al. 2015, FAO 2017b) (Section 2.3.6). Several national and international forest statisticians have
consulted the data collection and analysis procedures to determine robust and appropriate

32
estimation procedures (Korhonen and Salmensuu 2014, Scott 2018) (Section 2.3.6). The process in
its entirety supports the estimations of indicators that are linked to their criteria (Figure2.4).
In summary, the BFI process benefits from, and builds upon, state of the art best practices for
implementing a multi‐source and multi‐purpose forest inventory (Figure2.5). The latest methods and
tools, along with in‐house innovations (e.g. tree species identification app, BGD Trees), have been
applied to provide accurate, user‐friendly, and interpretable results that are in line with
internationally accepted guidelines for monitoring tree and forest resource. A dense set of manuals,
trainings proceedings, and publications are available for sustaining the BFI process as Bangladesh’s
national forest monitoring system now and in the future.
Photo: Watershed management, Bandarban,
©Chakma P.

33
Figure 2.5. Visualization of the the relationships of data from multiple sources for multiple purposes in the BFI process. The numbering corresponds to report sections.

34
Zoning
To give context to how trees, forests and people interact, five BFI zones capture the major
differences that occur geographically across the country (Figure 2.6). In the case of the biophysical
inventory, the zones are Sal, Sundarban, Village, Hill, and Coastal (BFD, 2016). The socio‐economic
zones are identical to the biophysical zones except for the Sundarban zone is called the Sundarban
periphery zone. The zones are a convenient way to report results and serve a statistical purpose for
grouping results to obtain higher precision of forest attribute estimates (BFD 2016f). The boundaries
of the zones are based on biotic and abiotic characteristics which do not match administrative
boundaries.
The Hill zone represents hilly geographical areas in the eastern part of the country. The average
elevation is 125 m, and water and terrestrial land area occupy 3% and 97% of the land, respectively
(GoB 2019). The mean annual precipitation is 2720 mm (2061 ‐ 4370 mm) (Hijmans, Cameron et al.
2005). The soils of Hill zone have been classified as acid sulphate, brown hill, and noncalcareous grey
floodplain (nonsaline) (FAO‐UNDP 1988). Evergreen and semi‐evergreen forest types dominate, and
Figure 2.6. Zones of the Bangladesh Forest Inventory. In the left figure are the zones of the biophysical inventory and in the right are the zones of the socio-economic survey.

35
the most common tree species are Dipterocarpus spp., Syzygium spp., Gmelina arborea, Ficus carica, Grewia spp., Albizia spp., Acacia auriculiformis, Artocarpus heterophyllus, Swietenia mahagoni, Tectona grandis, Acacia auriculiformis, and homestead tree species such as Mangifera indica.
The Sundarban zone represents the mangroves of the sundarban reserve forest found in the south‐
western part of the country. The elevation ranges from 2 to 9m with an average of 6 m. Water and
terrestrial land area occupy 37% and 63%, respectively. The mean annual precipitation is 2004 mm
(1783 ‐ 2343 mm). The soils have been classified as acid sulphate and non‐calcareous grey floodplain
(non‐saline). This zone consists of natural mangrove forest and the most common tree species are
Heritiera fomes, Excoecaria algallocha, and Ceriops decandra.
The Sal zone represents the geographical areas in Madhupur and Barind tract with small hillocks and
plain land. The average elevation is 17 m, and water and terrestrial land area occupy 3% and 97%,
respectively. The mean annual precipitation is 2040 mm (1804 ‐ 2462mm). The soils of sal zone have
been classified as acid basin clays, brown hill, brown mottled terrace, deep red‐brown terrace,
shallow grey and shallow red‐brown terrace. This zone consists of deciduous Sal forest, and the most
common tree species are Shorea robusta, Albizia spp., Artocarpus heterophyllus, Swietenia mahagoni, Acacia auriculiformis etc. and homestead tree species such as Mangifera indica.
The Coastal zone represents geographical areas with accreted land in the southern part of the
country. The average elevation of coastal zone is 3 m, and water and terrestrial land area occupy
55% and 45%, respectively. The mean annual precipitation is 2870 mm (2267 ‐ 3698 mm). The soils
of coastal zone have been classified as brown hill, acid sulphate, calcareous alluvium (non‐saline),
calcareous grey floodplain, non‐calcareous alluvium and noncalcareous grey floodplain. The most
common tree species are Sonneratia apetala, Avicennia officinalis, Excoecaria agallocha, Areca catechu and homestead tree species such as Artocarpus heterophyllus, Samanea saman, Azadirachta indica and Mangifera indica.
Box 2 – The Sundarban periphery zone of the socio-economic survey
The Sundarban is unique among the zones because it has the highest stem density and lowest population
density. Its socio‐economic importance to the surrounding communities is well documented (e.g.
Abdullah et al. 2016) and needs special consideration in a national level survey such as the BFI. As there
is no sizable population within the Sundarban forest, the socio‐economic survey was not conducted
within the Sundarban zone, but instead within a 10 km buffer outside the zone boundaries which included
89 unions. The same number of unions and households were surveyed as the other zones. Throughout
this report, the socio‐economic results from this area are summarized and referred to as the “Sundarban
periphery” to distinguish it from the “Sundarban” zone of the biophysical inventory.
36
The Village zone covers the rest of the area not occupied by the Hill, Sundarban, Sal or Coastal zones.
The average elevation is 16m, and water and terrestrial land area occupy 8% and 92%, respectively.
The mean annual precipitation is 1600 mm. The soils of village zone have been classified as acid basin
clays, brown hill, calcareous alluvium (non‐saline), calcareous brown floodplain, calcareous dark grey
floodplain, deep grey terrace, grey piedmont, non‐calcareous alluvium, non‐calcareous brown
floodplain, non‐calcareous dark grey floodplain, non‐calcareous grey floodplain (non‐saline), and
shallow Grey Terrace. The most common tree species are Swietenia mahagoni, Areca catechu, Mangifera indica, Acacia auriculiformis, Samanea saman, and Eucalyptus camaldulensis.
Landcovermapping
In response to prevailing classification inconsistency between land cover maps and in order to
provide a solid reference to mapping activities, an object‐based Land Representation System of
Bangladesh (LRSB) has been developed (GoB 2019, Jalal, Iqbal et al. 2019). The LRSB is a result of
several processes of data collection, translation, gap identification and analysis of existing land
cover/use mapping processes. This process was started in 2013 and finalized in 2016 (Akhter 2013,
Di Gregorio 2013, Shaheduzzaman and Akhter 2013, Di Gregorio, Akhter et al. 2014, Costello and
Piazza 2015, BSGI 2016, Di Gregorio 2016, Franceschini, Jalal et al. 2016, Hadi 2016, Hadi 2016). The
legends of three existing national land cover/use maps were collected, documented and translated
using the Land Cover Classification System (LCCS v3) – an implementation tool of the ISO standard
(ISO 19144‐2) Land Cover Meta Language (LCML) (Di Gregorio, 2016).
The legend classes for the national land cover map 2015 have been derived from the LRSB (Figure
2.7) based on the distinction of classes from satellite image interpretation, availability of ancillary
data, and expert knowledge (Islam, Iqbal et al. 2016). These initial classes were further refined during
map development process with the ground information to develop the final legend. Multi‐spectral
ortho (Level 3) SPOT6/7 images of 6‐meter spatial resolution with maximum 10% cloud coverage
were used for the whole country. To delineate some land cover classes with temporal variability (e.g.,
single and multiple crops) Landsat 8 and Sentinel 2 images were used. The multi resolution
segmentation algorithm was used to develop image objects using the bands green, red and NIR with
equal weights as input layers. The delineated image objects were used as the basic unit of
classification, and a land cover code was assigned. Not‐qualified image segments were manually
edited to correspond well to geo‐objects in geometry before assigning appropriate land cover code.
Quality checking was an integral part of the land cover process (Franceschini, Jalal et al. 2016) and
was completed using multiple approaches, including spatial topology check, attribute check, and

37
consistency check. The accuracy assessment analysis was designed using a pseudo‐ground truth
validation technique, with a stratified random sampling by district and by land cover class (Jalal, Iqbal
et al. 2019). Sample numbers for each of the land cover classes within a district were chosen based
on the district size and the relative occurrence (in terms of area) of the land cover class in the district.
Land cover classes and maps form the basis, which can be further refined, by which tree and forest
characteristics may be summarized and compared. Additionally, land cover classes can be used to
link and integrate biophysical and socio‐economic data. Land cover classes of land features in the
biophysical inventory plots were determined post‐hoc (i.e. not determined directly by field teams).
Furthermore, the biophysical plots occurred in only 28 of the 33 classes and trees occurred in only
22 of the classes (Appendix 2.1).
Figure 2.7. Flow diagram of the process for developing the Land Representation System of Bangladesh and Land cover map 2015.
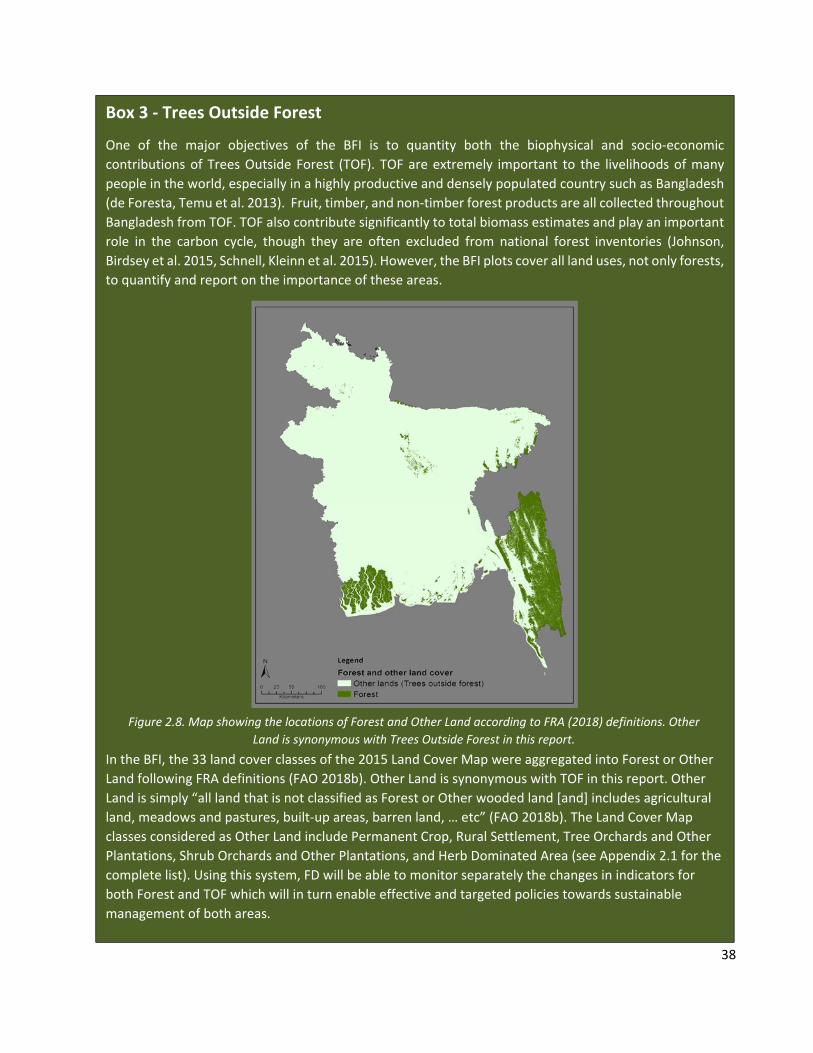
38
Box 3 - Trees Outside Forest
One of the major objectives of the BFI is to quantity both the biophysical and socio‐economic
contributions of Trees Outside Forest (TOF). TOF are extremely important to the livelihoods of many
people in the world, especially in a highly productive and densely populated country such as Bangladesh
(de Foresta, Temu et al. 2013). Fruit, timber, and non‐timber forest products are all collected throughout
Bangladesh from TOF. TOF also contribute significantly to total biomass estimates and play an important
role in the carbon cycle, though they are often excluded from national forest inventories (Johnson,
Birdsey et al. 2015, Schnell, Kleinn et al. 2015). However, the BFI plots cover all land uses, not only forests,
to quantify and report on the importance of these areas.
In the BFI, the 33 land cover classes of the 2015 Land Cover Map were aggregated into Forest or Other
Land following FRA definitions (FAO 2018b). Other Land is synonymous with TOF in this report. Other
Land is simply “all land that is not classified as Forest or Other wooded land [and] includes agricultural
land, meadows and pastures, built‐up areas, barren land, … etc” (FAO 2018b). The Land Cover Map
classes considered as Other Land include Permanent Crop, Rural Settlement, Tree Orchards and Other
Plantations, Shrub Orchards and Other Plantations, and Herb Dominated Area (see Appendix 2.1 for the
complete list). Using this system, FD will be able to monitor separately the changes in indicators for
both Forest and TOF which will in turn enable effective and targeted policies towards sustainable
management of both areas.
Figure 2.8. Map showing the locations of Forest and Other Land according to FRA (2018) definitions. Other Land is synonymous with Trees Outside Forest in this report.
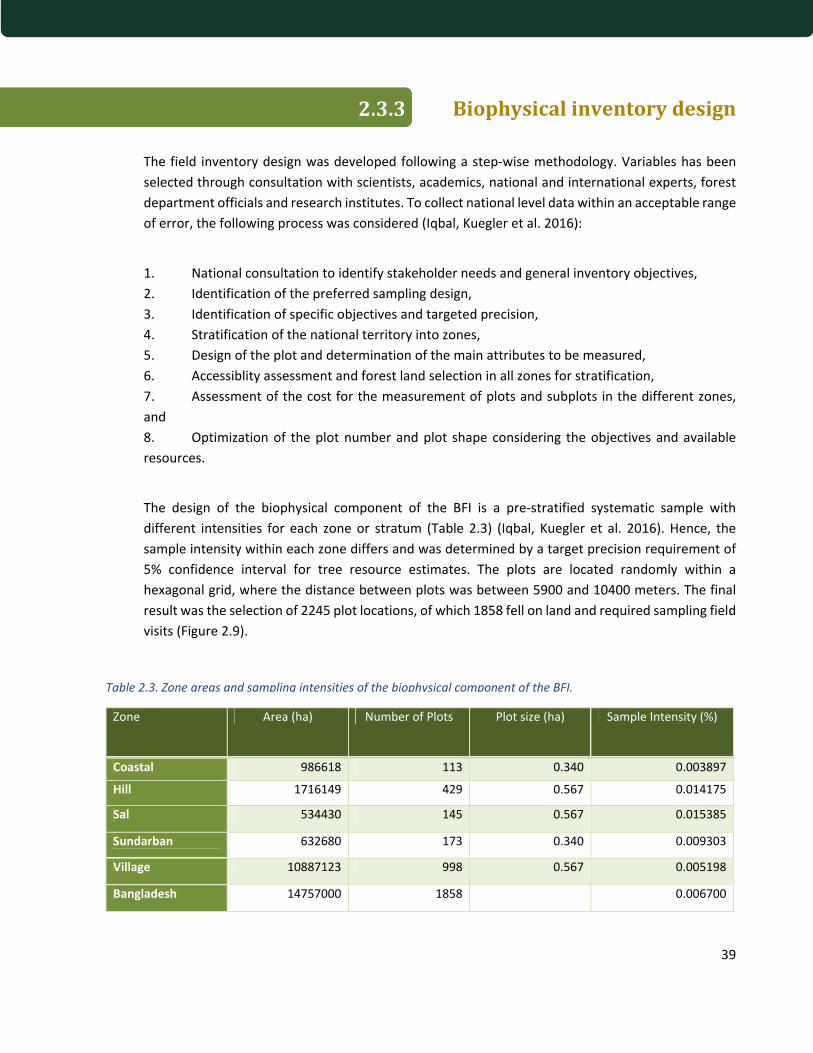
39
Biophysicalinventorydesign
The field inventory design was developed following a step‐wise methodology. Variables has been
selected through consultation with scientists, academics, national and international experts, forest
department officials and research institutes. To collect national level data within an acceptable range
of error, the following process was considered (Iqbal, Kuegler et al. 2016):
1. National consultation to identify stakeholder needs and general inventory objectives,
2. Identification of the preferred sampling design,
3. Identification of specific objectives and targeted precision,
4. Stratification of the national territory into zones,
5. Design of the plot and determination of the main attributes to be measured,
6. Accessiblity assessment and forest land selection in all zones for stratification,
7. Assessment of the cost for the measurement of plots and subplots in the different zones,
and
8. Optimization of the plot number and plot shape considering the objectives and available
resources.
The design of the biophysical component of the BFI is a pre‐stratified systematic sample with
different intensities for each zone or stratum (Table 2.3) (Iqbal, Kuegler et al. 2016). Hence, the
sample intensity within each zone differs and was determined by a target precision requirement of
5% confidence interval for tree resource estimates. The plots are located randomly within a
hexagonal grid, where the distance between plots was between 5900 and 10400 meters. The final
result was the selection of 2245 plot locations, of which 1858 fell on land and required sampling field
visits (Figure 2.9).
Zone Area (ha) Number of Plots Plot size (ha) Sample Intensity (%)
Coastal 986618 113 0.340 0.003897
Hill 1716149 429 0.567 0.014175
Sal 534430 145 0.567 0.015385
Sundarban 632680 173 0.340 0.009303
Village 10887123 998 0.567 0.005198
Bangladesh 14757000 1858 0.006700
Table 2.3. Zone areas and sampling intensities of the biophysical component of the BFI.

40
Figure 2.9. The distribution of biophysical inventory plots among five zones in Bangladesh.

41
In each plot, tree, seedling, sapling, litter, down woody debris and soil and other major forest
attributes were sampled (BFD 2016c). The subplot descriptions (Figure 2.10C) and protocols for data
collection are as follows:
N
(A)Distance between subplots centres is 38 mSubplot
(B)Subplot
360
90270
180
315 45
135225
19m
5m8m
L plot Radius is 19 m
M plot Radius is 8 m
S plot Radius is 2.5 m
Distance between S and M plot centre = 5m
(C)
Down woody material transect
Soil sample
Litter sample
Figure 2.10. (A) Plot design for Hill, Sal, Coastal and Village zones- one plot is composed by five sub-plots, (B) Plot design of Sundarban zone- one plot is composed by three sub-plots. (C) Subplot layout for data collection.
42
Seedling and sapling information was collected within a radius of 2.5 meter from the
small plot (“S plot”).
All trees having a Diameter at Breast Height (DBH) from >10 cm to 30 cm were
measured within the 8‐meter radius of the medium plot (“M plot”).
All trees having >30 cm DBH were measured within the 19‐meter radius of the large
plot (“L plot”).
Litter and soil sample were collected at 8 meters distance from the plot center at
270 degrees.
Down woody debris data was collected along two transects within the M plot.
Land feature, objects info, leaf cover, crown cover, land management, disturbance
information were also collected. Photos were taken of the land features.
The measurements on field plots were performed by 13 field inventory teams7, while local
Conservators of Forests supervised the implementation of the biophysical inventory in each district.
Field teams consisted of seven members, including team leaders, technical experts, and labourers.
Local people were engaged as much as possible in the composition of the field team or as guides
(Costello and Henry 2016). Local FD staff helped by providing information about access conditions to
the plot and recruiting local people with required local knowledge. In some cases, some tree species
could not be identified in the field, usually when leaf samples could not be gathered. Data were
collected using open source software (Open Foris) installed on android‐based tablets.
Field work began in 2016 when 5% of the plots were visited, but the majority of plots were visited in
2017 (65%) and 2018 (26%) before finally finishing in 2019 (4%). Field data collection concluded by
visiting 1781 out of 1858 plots (1480 accessible, 301 partially accessible), or 96% of the total. Among
those plots which were not visited were 42 inaccessible plots (2.3%) and 35 nonsampled plots (1.9%).
In the case of inaccessible plots, a visit was attempted but tree measurements were not possible in
any subplot, most commonly due to the plot center falling inside hazardous conditions such as steep
slopes (52%), water (33%), or other reasons such as denied access, restricted areas, or wall or
building (15%). Partially accessible plots were cases where at least one subplot could be measured
but other subplots could not due to water (44%), hazardous conditions such as steep slopes (25%),
walls or buildings (21%), or other reasons (10%) such as denied access and restricted areas or border
areas. Finally, a nonsampled plot status means that no visit was attempted, usually due to plot falling
in an extremely remote location (69%), restricted area (20%), or other reason such as water or border
areas (11%). The effect of inaccessible and nonsampled plots is not expected to substantially bias
national or zone level estimates because they were relatively few (12% of the Hill zone plots; 4% of
the total) and mostly randomly distributed (Figure 2.12).
7 In 2019, an additional team team was formed specifically to measure the BFI plots in remote and difficult areas in the Chittagong Hill Tracts

43
Box 4 – Ensuring the relocation of biophysical plots
It is critical in forest monitoring to relocate the plots to ensure the same area is measured in each
successive inventory. In some cases, moving the plot center only a few cm can cause gross errors in
counting and measuring trees (Figure 2.11). Some common approaches to relocate plots include
recording multiple reference points, inserting metal bars into the plot center, tagging trees, and
recording the plot coordinates with a GPS. In practice, however, none of these is completely effective.
For example, trees used as reference points may be cut down between inventories, metal bars may be
exposed and removed by locals, trees tags often fall out, and GPS points may have errors of up to 10m.
Using a combination of these approaches further increases the chances of relocating a plots, but may
still not be enough.
Figure 2.11. Accurate biophysical data collection depends on locating the plot center with high precision. The BFI uses DGPS technology to obtain cm level coordinates for future teams to navigate to the plot center.
The BFI overcomes challenges of plot relocation by recording the center of most plots with Differential
Global Positioning System (DGPS) for cm‐level accuracy. To accomplish this work, DGPS teams from the
FD and Sthapati were trained and deployed to georeference the plots with DGPS coordinates after they
had been initially established by regular field teams. Additionally, to address problems related to tree
marking and tagging, Radio Frequency Identification (RFID) chips are inserted into reference trees
(Kumar, Mahamud et al. 2017). Nearly all the plots were completed to ensure the most accurate
measurements are taken in future cycles. Plots in the Hill zone were not georeferenced due to
difficulties of working in that area.

44
Figure 2.12. The distribution of BFI plots according to plot status.

45
Socio‐economicsurveydesign
The socio‐economic survey is designed to provide information about the interactions between
people and tree and forest resources as well as the valuation of tree and forest ecosystem services.
Specifically, the design aimed to achieve national estimates and spatial comparisons between areas
of greater versus lower impact or dependence on tree and forests. The survey was designed by
multiple partners and approved by Bangladesh Bureau of Statistics (GoB 2017b).
A multi‐stage random sample was used for the stratification of the survey (GoB 2017b). The
assumption was made that tree and forest ecosystem services and their relationship with local
households depends on tree cover per household, which was used as a proxy for the quantity of tree
and forest resources available). Tree cover was obtained from remotely sensed Landsat data from
2014 (Potapov, Siddiqui et al. 2017), and household data from the ‘Population and Household Census
‐ 2011’ dataset (BBS 2016). The variable Household Tree Availability or percent tree cover per
household (%TC HH‐1) was calculated for each union or ward:
Household Tree Availability =
%.
This metric was then defined into four Household Tree Availability Classes (HTAC) within each zone
by quartiles, and unions were assigned an HTAC class. Thus, the total sub‐strata were 4 classes * 5
zones = 20 strata. The first quartile represents lowest %TC but highest number of HH’s per union
(Table 2.4). In other words, strata 1 represents the lowest availability of tree and forest resources,
or the highest impact of the people on their resources, and strata 4 may represent the highest
availability due to lowest impact. Once the strata were defined, and to give the equal allocation of
union to each stratum, 16 unions (or wards) were randomly sampled from each strata (Table 2.4)
(GoB 2017b).
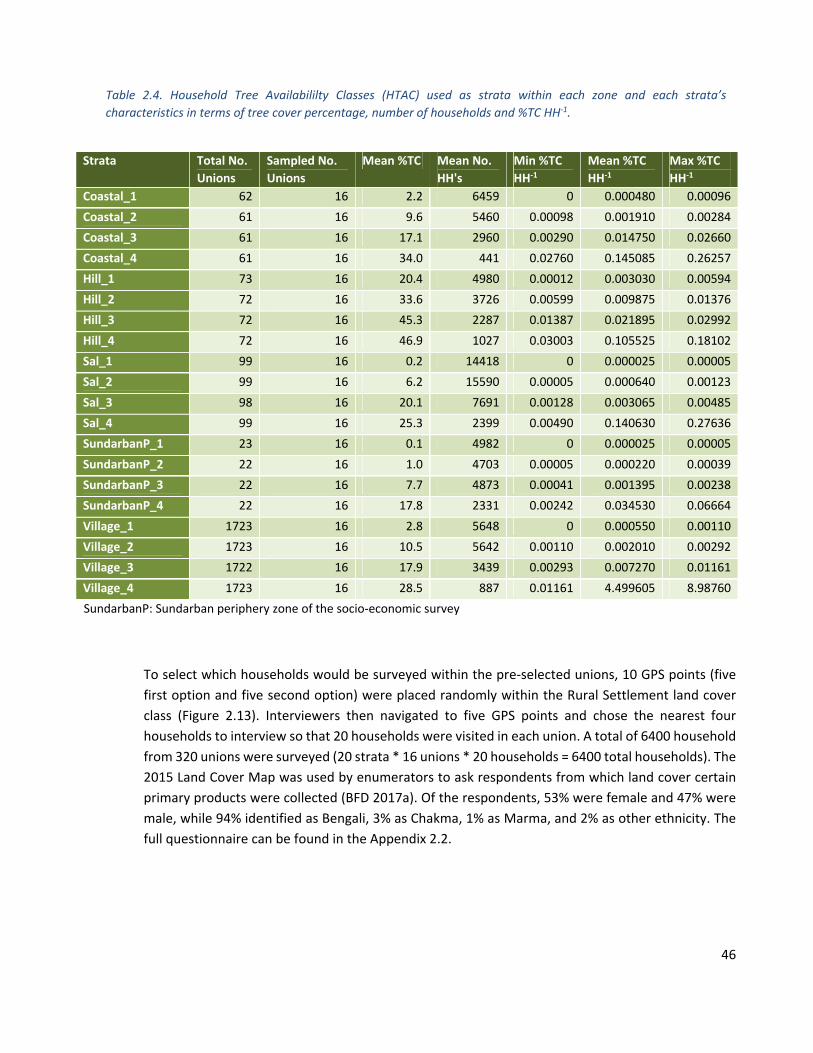
46
To select which households would be surveyed within the pre‐selected unions, 10 GPS points (five
first option and five second option) were placed randomly within the Rural Settlement land cover
class (Figure 2.13). Interviewers then navigated to five GPS points and chose the nearest four
households to interview so that 20 households were visited in each union. A total of 6400 household
from 320 unions were surveyed (20 strata * 16 unions * 20 households = 6400 total households). The
2015 Land Cover Map was used by enumerators to ask respondents from which land cover certain
primary products were collected (BFD 2017a). Of the respondents, 53% were female and 47% were
male, while 94% identified as Bengali, 3% as Chakma, 1% as Marma, and 2% as other ethnicity. The
full questionnaire can be found in the Appendix 2.2.
Table 2.4. Household Tree Availabililty Classes (HTAC) used as strata within each zone and each strata’s characteristics in terms of tree cover percentage, number of households and %TC HH-1.
Strata Total No. Unions
Sampled No. Unions
Mean %TC Mean No. HH's
Min %TC HH-1
Mean %TC HH-1
Max %TC HH-1
Coastal_1 62 16 2.2 6459 0 0.000480 0.00096
Coastal_2 61 16 9.6 5460 0.00098 0.001910 0.00284
Coastal_3 61 16 17.1 2960 0.00290 0.014750 0.02660
Coastal_4 61 16 34.0 441 0.02760 0.145085 0.26257
Hill_1 73 16 20.4 4980 0.00012 0.003030 0.00594
Hill_2 72 16 33.6 3726 0.00599 0.009875 0.01376
Hill_3 72 16 45.3 2287 0.01387 0.021895 0.02992
Hill_4 72 16 46.9 1027 0.03003 0.105525 0.18102
Sal_1 99 16 0.2 14418 0 0.000025 0.00005
Sal_2 99 16 6.2 15590 0.00005 0.000640 0.00123
Sal_3 98 16 20.1 7691 0.00128 0.003065 0.00485
Sal_4 99 16 25.3 2399 0.00490 0.140630 0.27636
SundarbanP_1 23 16 0.1 4982 0 0.000025 0.00005
SundarbanP_2 22 16 1.0 4703 0.00005 0.000220 0.00039
SundarbanP_3 22 16 7.7 4873 0.00041 0.001395 0.00238
SundarbanP_4 22 16 17.8 2331 0.00242 0.034530 0.06664
Village_1 1723 16 2.8 5648 0 0.000550 0.00110
Village_2 1723 16 10.5 5642 0.00110 0.002010 0.00292
Village_3 1722 16 17.9 3439 0.00293 0.007270 0.01161
Village_4 1723 16 28.5 887 0.01161 4.499605 8.98760
SundarbanP: Sundarban periphery zone of the socio‐economic survey

47
In addition to quantitative data collected from household surveys, qualitative techniques were used
to collect in‐depth and perceptual information at the community level. Five unions were randomly
selected in each stratum, i.e. 100 unions (5 unions*20 strata) and thus 20 community surveys were
performed in each zone. The main purpose of the community survey was to collect the information
related to trends of land use, access to services, tree and forest products prices based on market
value, benefits from tree and forest resources. The survey was administered among the community
people using Focus Group Discussion (FGD) methodology where 8‐10 participants attended in the
selected union or ward (BFD 2017a). The target groups of the community survey were forest resource
users in the society that were believed to have important impacts on forest and tree resources of
the country.
Figure 2.13. Left: Map of 320 unions selected for socio-economic field data collection stratified by 20 HTAC’s. Right:Map of a single union indicating 10 GPS points where field teams chose to visit either even or odd numbers, but not
both.

48
Box 5 - Learning from and engaging local communities in the BFI
Trees and forests play an important role in the development of household livelihoods. Two important
activities of the BFI sought to better understand how local communities use these resources and to
engage them in the BFI process. Firstly, 100 FGD’s were conducted in each of the five socio‐economic
zones with the objectives of learning about the use of tree and forest resources in communities. FGD
techniques were applied such as interviewing men and women separately to encourage open
discussions and capture gender specific answers (e.g. men and women might not always have same
perception on the importance and use of forest resources) (BFD 2017a). A total of 20 FGD’s (10 women and 10 men) were conducted in each zone. Besides tree and forest resource users, the
participants included small businesses owners and community leaders. A structured questionnaire
was used to collect information on biodiversity and conservation, economics and livelihoods (e.g. tree
and forest products collection amounts, selling time, and unit prices), tree and forest product access
and conflict, community benefits for conserving trees and forests, illegal activities, law enforcement
and REDD+ safeguards. The FGD was an efficient way to capture information about general patterns
in the community and also helped to interpret the results of the household survey.
In a separate activity, FD arranged three separate community meetings in the Khagrachari, Rangamati
and Bandarban Hill districts to raise awareness about the BFI, its role and objectives and factilitate the
operationalization in Chittagong Hill Tracts. Later, several meetings were held with Chairmen of the
Chittagong Hill Tracts Regional Council (CHTRC) which led to the organization of 24 additional
information sharing meetings at Upazila level (sub‐district). The meetings served the purpose of
obtaining consent and guidance from the local people and institutions for conducting the BFI in their
areas. Among the participants were representatives from 12 ethnic minority groups, traditional
institutions, government and non‐government stakeholders. The meetings were critical for engaging
the local support needed to efficiently implement the BFI and were a step towards future participatory
forest monitoring. Additionally, they provided a platform for community leaders to reflect on the
importance of forest resources, communicate specific needs, and give feedback related to forest
monitoring (Chakma 2016).

49
Volume,biomassandcarbonstockestimations
Supporting information for estimating volume, biomass and carbon stocks includes a tree species
database, wood density database, soils analysis and tree allometric equations. The precision of the
tree volume, biomass, and carbon estimations largely depends on reliable and appropriate allometric
equations (Picard, Saint André et al. 2012). A list of 517 allometric equations for 39 tree species were
reviewed in terms of statistical performance and operational applicability (Hossain 2016). Because
of the lack of available allometric equations in terms of number and quality, additional allometric
biomass models were developed at both zone and species level through extensive field data
collections in all five zones (Figure 2.14) (BFD 2016f, Mahmood 2018, Hossain, Anik et al. 2019). In
addition to these, biomass expansion factor, wood density of selected species as well as allometric
equations for biomass and carbon (on biomass) estimations of the tree parts (i.e. leaf, branch and
stem) were also developed. A decision tree was developed with expert consultation for selecting
appropriate volume, biomass or carbon allometric equations at different levels (species or zone)
considering the statistical features of the model such as diameter range, sample size, and co‐efficient
of determination. A complete list of all the allometric equations used for volume, biomass, and
Figure 2.14. Spatial distribution of 517 species specific and nine zone specific allometric equations considered for volume, carbon, and biomass estimations. Larger circles represent more species specific equations from locations throughout Bangladesh. Boxed equations refer to zone specific equations documented in 1Mahmood, Siddique et
al. (2019a), 2BFD (2018), and 3Mahmood, Siddique et al. (2019b).

50
carbon estimation, and the decision tree, are found in the Appendix tables 2.3 to 2.6 and the
Bangladesh Forest Information System web platform (see Section 2.3.6), and further described in
Hossain, Anik et al. (2019).
Similar to aboveground biomass, below ground biomass was estimated for trees, saplings, bamboos
and live stumps. However, unlike aboveground biomass, the equations used for belowground
biomass were from secondary sources not specific to Bangladesh (Hossain, Anik et al. 2019). The
biomass and volume of standing dead trees and down woody debris (DWD) were estimated using
the equations prescribed in current literature (Marshall, Davis et al. 2000, Harmon, Woodall et al.
2011). Above ground bamboo biomass was calculated applying the model proposed by de Melo,
Sanquetta et al. (2015) whereas the belowground bamboo biomass was assumed to be 5% of culm
as per conversion factor of Stokes, Lucas et al. (2007).
Other supporting information and resources have been developed to further facilitate the estimation
procedures such as tree species and wood density databases (BFD 2016a). The databases are
available online through the Bangladesh Forest Inventory System (see section 2.4 Access to
information). Besides soils carbon, analyses included soil texture, soil bulk density, and soil pH and
salinity for the Sundarban and Coastal zones (BFD 2016d). An agreement was established between
FD and Khulna University to establish a soil archive for the soil samples under the BFI and for any
future analyses. Finally, for the socio‐economic survey, the sample design depended on important
information about Union boundaries, and number of households.
For reporting sample‐based estimates and uncertainties for any forest attribute in the biophysical
inventory, estimators were selected that were consistent with the sampling method (McRoberts,
Tomppo et al. 2015). Ratio to size estimators were used for computing the means and variances of
the variable (e.g. Table 2.3) (Korhonen and Salmensuu 2014, Scott 2018). The areas used for
expanding the ratio estimates to totals by zone are the areas defined by the zone map. The areas
used to expand ratios to totals by land cover class were extracted from the 2015 land cover map
after overlaying the subplot boundaries on the map in order to make the area estimates determined
from the land cover map and the sample more consistent. Therefore the subplot level areas could
be affected by geolocation error, but this effect is reduced by the use of DGPS for georeferening the
plot center (Box 4). Biophysical estimations were done in R statistical software version 3.5.0, while
socio‐economic estimations were done using Stata statistical software. The R‐scripts are be found in
the BFIS e‐library (Section 2.4) (Hossain 2017, Hossain, Laurent et al. 2017, Hossain, Laurent et al.
2017, Laurent and Hossain 2017). The full details of the equations for both the biophysical inventory
or the socio‐economic survey are found in Hossain, Anik et al. (2019).

51
Datamanagementanddataqualitycontrol
In both surveys, field data collection, data cleaning, quality control, and data archiving were part of
a simultaneous process performed both in the field and in the central office (BFD 2016b, BFD 2016e,
Kumar, Costello et al. 2017, BFD 2017b) (Figure 2.15). Open Foris software was installed on mobile
tablets after it was tested in several field trials. Paper forms were also used in the case of drawing
sketch maps and in the rare case the tablet could not be used. Data collection was completed in
batches of plots, i.e. field teams visited as many as 20 plots at a time, and then submitted their data
to a central team electronically. As field data were collected, they were checked for outliers or
suspect data entries, both manually and with R scripts. If an obvious correction was needed, it was
updated in the Open Foris database, otherwise the field teams were consulted about suspect data
to understand the problem and take further decision.
At the same time, four QA/QC teams consisting of government and academic foresters performed
quality assessments of data collection directly in the field through hot and cold checks (BFD 2016b,
BFD 2017b). Hot checks refer to quality assessments of plot attributes or household responses in the
presence of the field team, allowing for the opportunity to give feedback in the field. Cold checks
refer to quality assessments done through an independent visit to a plot or household subsequent
to the original visit. In the biophysical inventory, QA/QC teams visited a total of 93 plots (39 hot
checks, 54 cold checks), or about 5% of the sampled plots. The most common errors made by the
field teams were: 1) incomplete identification of land feature objects, 2) incorrect identification of
reference point, and 3) incomplete tree diameters and heights. In the case of egregious errors, the
field teams were sent back to re‐measure the plots. The total number of plots re‐measured was 52.
For the socio‐economic survey, QA/QC teams visited 267 households (254 hot checks, 13 cold
checks), or about 4% of the total number of households sampled.

52
Figure 2.15. Flow diagram of the data management, data cleaning, QA/QC and estimation processes used in the biophysical and socio-economic surveys.

53
Box 6 – Adapting BFI data for multiple purposes
Both the biophysical and socio‐economic data can be enhanced, intensified, or modified to meet more
specific needs. For example, the biophysical plot design was used for the assessment of fuelwood
supply and demand in and around refugee camps in Cox’s Bazar (FAO‐IOM, 2016). Fourteen additional
plots were measured and combined with remote sensing datasets. One finding was that 40% of the
standing biomass was already depleted before the main influx of refugees in August 2017. The results
also helped inform a strategy for reducing the demand on forest resources to stabilize the landscape.
Figure 2.16. The locations of 14 additional field plots that were integrated with existing BFI plots in Cox’s Bazar district.
In another example, both biophysical and
socio‐economic BFI data can be
summarized by FD Forest Divisions to help
inform forest planning and monitor changes
of programs implemented in that Division.
Basic statistics about species composition,
volume, seedling densities, fuelwood stock
together with fuelwood collection and
planting preferences by households can
give a forester a good idea of the status of
tree and forest resources in their area.
Other potential applications of BFI that
inform intervention activities could include
enhancing soil analyses to understand the
spatial distribution of the impacts of soil
salinity on rice production and assessing the
extent and location of potential areas for
wetland rehabilitation.
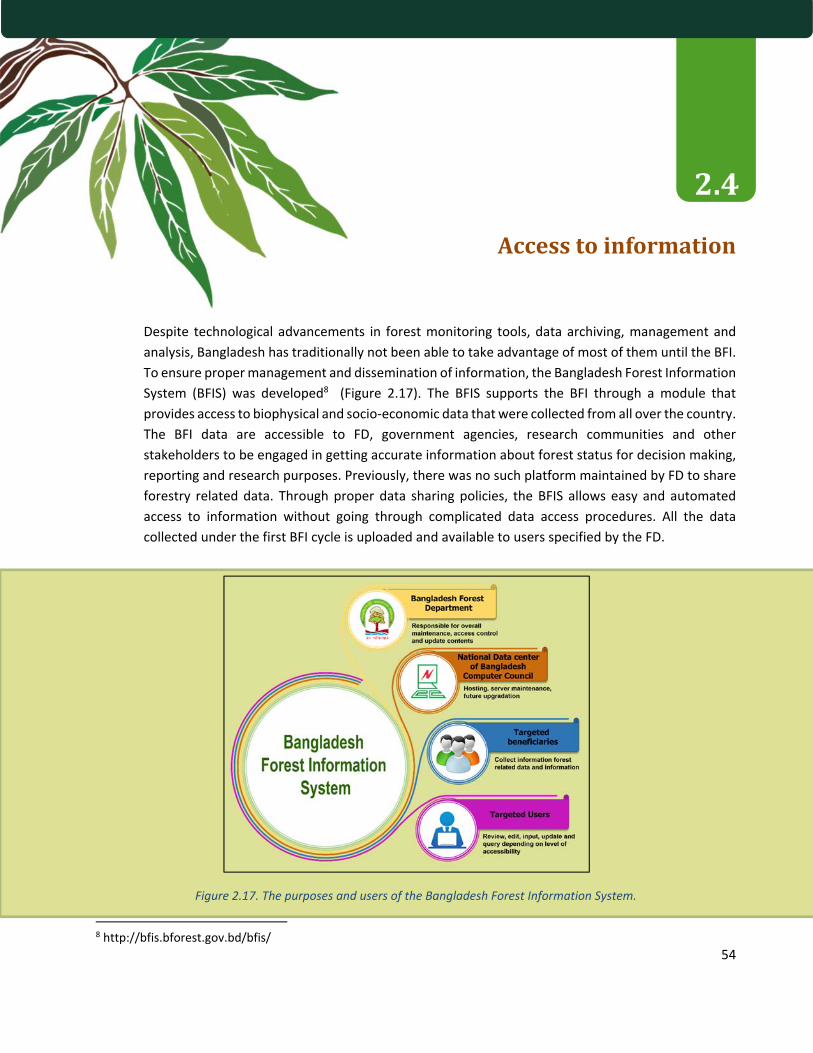
54
Accesstoinformation
Despite technological advancements in forest monitoring tools, data archiving, management and
analysis, Bangladesh has traditionally not been able to take advantage of most of them until the BFI.
To ensure proper management and dissemination of information, the Bangladesh Forest Information
System (BFIS) was developed8 (Figure 2.17). The BFIS supports the BFI through a module that
provides access to biophysical and socio‐economic data that were collected from all over the country.
The BFI data are accessible to FD, government agencies, research communities and other
stakeholders to be engaged in getting accurate information about forest status for decision making,
reporting and research purposes. Previously, there was no such platform maintained by FD to share
forestry related data. Through proper data sharing policies, the BFIS allows easy and automated
access to information without going through complicated data access procedures. All the data
collected under the first BFI cycle is uploaded and available to users specified by the FD.
8 http://bfis.bforest.gov.bd/bfis/
Figure 2.17. The purposes and users of the Bangladesh Forest Information System.

55

56
Criteria 1 - Forest extent and tree cover changes
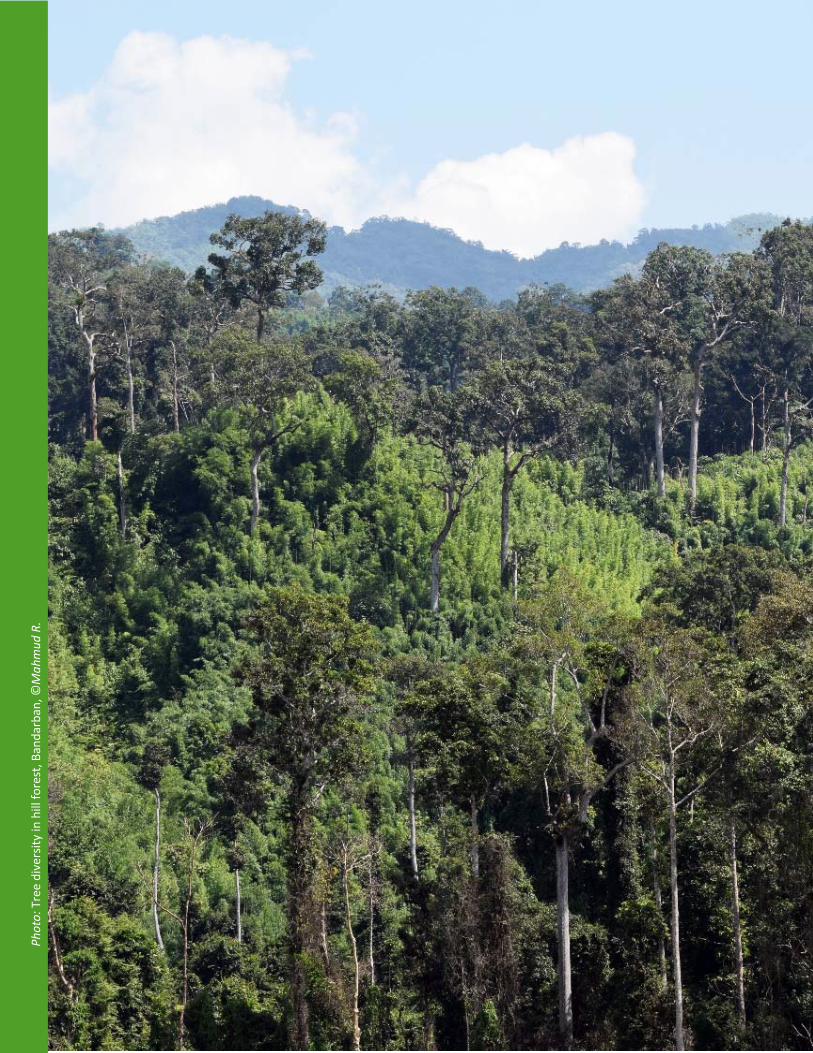
57
Phot
o: Tree diversity in
hill forest, B
andarban, ©
Mah
mud
R.

58
Criteria 1
Tree and forests extent
Section Highlights
Remote sensing information was used to report the forest and tree extent.
In 2015, forest cover in Bangladesh was 1,884,019 ha, or 12.8% of the total country area. This
amounts to about 11.7 ha forest cover per 1000 people.
Hill Forest is the largest forest type by area (4.6% of the country area) followed by Shrubs with
scattered trees (4.2%) and Mangrove Forest (i.e. Sundarban) (2.7%).
All classes defined as Other Land (i.e. TOF) combined to cover a total of 87.2% of the country,
and Permanent Crop and Rural Settlement alone combined to cover 69.8% of the area.
The highest increase of average tree cover occurs within Mangrove Plantation (12%), while
the highest decrease occurs in Plain Land Forest (Sal Forest) (18%).
Introduction
This criterion describes the areas and distribution of land cover and tree cover and tree cover
changes over time. Land cover is not only the area, but also the attributes of the area. The extent
and spatial distribution of forest cover as a specific type of land cover is used to understand the
status of resources and their changes. Forest cover is the aggregation of different forest and
plantation land cover types. Tree cover is different from forest cover because trees can occur
within any land cover class. Tree cover change is used to understand at a fine resolution changes
in TOF, in addition to forest extent changes. Questions that drive this criterion include – in what
areas are changes in tree cover concentrated the most in the country? Land cover is also the link
between biophysical and socio‐economic components of the BFI. Future BFI cycles will monitor
the trends of forest and tree cover indicators over time.
Section 3
59
Methods
Multi‐spectral ortho (Level 3) SPOT6/7 images of 6‐meter spatial resolution with maximum 10%
cloud coverage were used for the development of land cover map 2015. The legend classes were
derived from the Land Representation System of Bangladesh (LRSB) of Bangladesh based on the
distinction of classes from satellite image interpretation, availability of ancillary data, and expert
knowledge. Multi resolution segmentation algorithm was used to develop image objects using the
bands green, red and near‐infrared (NIR) with equal weights as input layers. The image objects
developed were then used as the basic unit of classification and land cover code was assigned to
each segment by trained photo interpreters. Based on the LRSB class hierarchy, the legend classes
of the land cover map 2015 are aggregated for assessing extent of forest, other wooded land, etc.
Note that while some land cover classes are named for a single condition or vegetation type (e.g.
Bamboo Forest, Single Crop, and Pond) tree species may still occur within the class.
The 2015 Land Cover Map has 33 land cover classes which can be grouped into Forest or Other
Land following FRA definitions (FAO 2018b). The following land cover classes were considered as
Forest cover: Bamboo Forest, Forest Plantation, Hill Forest, Mangrove Forest, Mangrove
Plantation, Plain Land Forest (Sal Forest), Rubber Plantation, Shrubs with scattered trees, Swamp
Forest. The Other Land category is used synonymously with the term TOF in this report and is
comprised of classes such as Rural Settlement, Single and Multiple crop, and Rivers and Khals. A
table of all land cover class assignments to Forest or Other Land is given in the Appendix 2.1. (Note
that Forest cover is different from Forest Land, which is all the land managed by the FD, regardless
of whether forest is present or not).
Wall‐to‐wall Landsat based tree cover extent and change maps, developed by RIMS unit of FD
and the University of Maryland (Potapov, Siddiqui et al. 2017), have been integrated with land
cover 2015 data. At the scale of the polygons of the land cover map 2015 zonal statistics of the
2000‐2014 tree cover data are computed. This results in each polygon of the land cover map
containing the number of pixels with tree cover in 2000, the number of pixels with tree cover
gains and the number of pixels with tree cover loss for each year between 2000 and 2014. Based
on this, tree cover percentage within each land cover was calculated for 2000 and 2015
(assuming 2014 tree cover), and changes in percentage tree cover were computed.

60
Extentofforestandtreeresources
Description
Of the 33 classes in the land cover map, 10 classes (i.e. Bamboo Forest, Forest Plantation, Hill
Forest, Mangrove Forest, Mangrove Plantation, Plain Land Sal Forest, Rubber Plantation, Shrubs
with scattered tree, Swamp Forest and Swamp Plantation) belong to Forest (according to FRA
definition) which cover about 1,884,019 ha of land (12.8% of the country). Forest cover is highest
in the Hill and Sundarban zones and lowest in the Village, Coastal, and Sal zones (Table 3.1).
Permanent Crop (Single plus Multiple Crop) is the largest land cover class, accounting for 48.6%
of the total country area. Rural Settlement is the next largest class covering 21.2% of the area. All
the classes defined as Other Land combined to cover a total of 87.2% of the country (Figure 3.1;
Table 3.2).
Highlights
- Hill Forest is the largest forest type within the Forest classes (36.3% of Forest area)
followed by Shrubs with scattered trees and Mangrove Forest (Sundarbans)
(32.6% and 21.4% of forest, respectively) while swamp forest represented only
0.013%.
- Within the BFI zones, forest coverage is highest in the Hill (about 78.0% of the
zone), followed by Sundarban (about 63.2% of the zone).
- The Sundarban zone is almost exclusively covered by either Mangrove Forest
(63.2%) or Rivers and Khals (36.8%).
- Orchards (tree or shrub) and plantations were only 1.7% and 1.1% of the total
area, respectively.
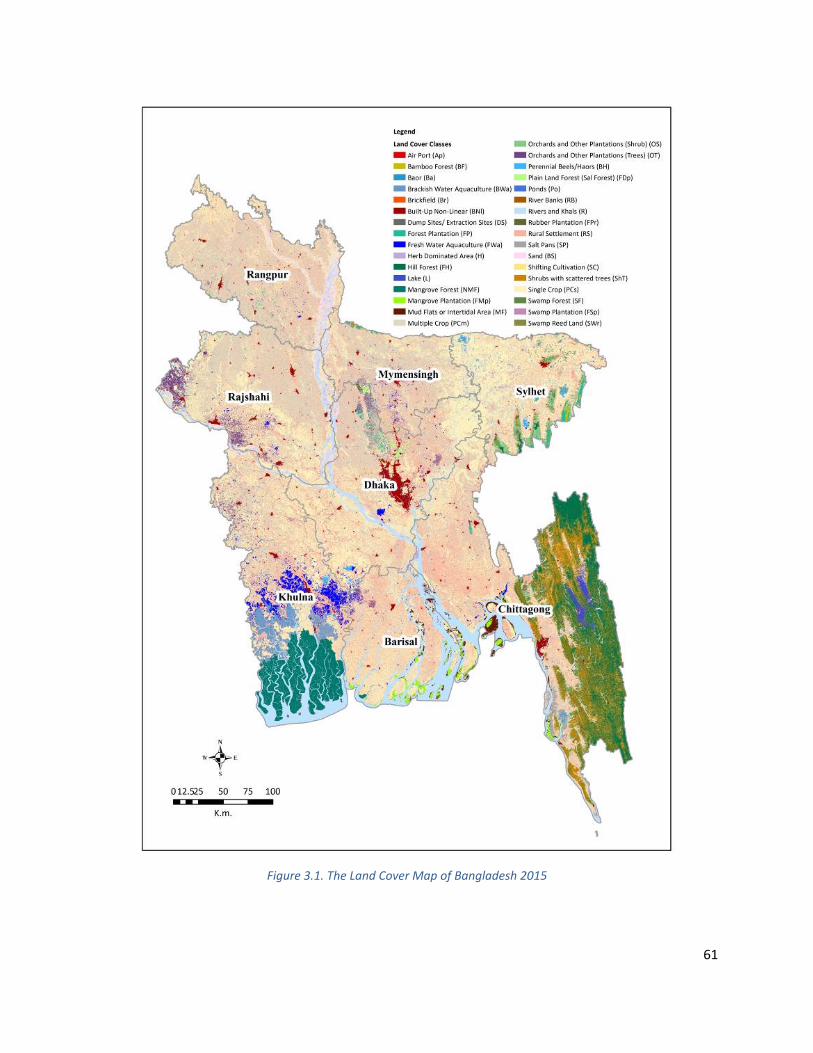
61
Figure 3.1. The Land Cover Map of Bangladesh 2015

62
Zone FRA land cover1 Area (% of total zone area)
Area (ha)
Coastal Forest 6.2 61,497
Other Land (TOF) 93.8 925,121
Hill Forest 78.0 1,338,807
Other Land (TOF) 22.0 377,342
Sal Forest 8.7 46,338
Other Land (TOF) 91.3 488,092
Sundarban Forest 63.2 399,900
Other Land (TOF) 36.8 232,779
Village Forest 0.3 37,476
Other Land (TOF) 99.7 10,849,647
National Forest 12.8 1,884,019
Other Land (TOF) 87.2 12,872,981
1 Other Land is used to define Trees Outside Forest (TOF) throughout the report
Table 3.1. Distribution of Forest cover and Other Land (TOF) cover within zones.

63
Leve
l1Le
vel2
Leve
l3Le
vel4
Leve
l5Le
vel6
FRA
1ha
% o
f tot
alNatural
Tree Dominated Area
Evergreen Forest
Hill Forest
F683,852
4.63
Mixed
Forest
Bamboo Forest
F5,686
0.04
Deciduous Forest
Plain Land Forest (Sal Forest)
F18,918
0.13
Shrub Dominated Area
Shrub Dominated Area
Shrubs with scattered
trees
F614,537
4.16
Herb Dominated Area
Herb Dominated Area
Herb Dominated Area
OL
65,424
0.44
Cultivated
Cultivated Trees
Rubber Platation
Rubber Plantation
F23,684
0.16
Forest Plantation
Forest Plantation
F79,299
0.54
Orchards and Other Plantation
Orchards and Other Plantations (Trees)
OL
180,698
1.22
Cultivated Shrub
Orchards and Other Plantation
Orchards and Other Plantations (Shrub)
OL
70,279
0.48
Herbaceous Crops
Permanent crop
Single Crop
OL
4,348,516
29.47
Multiple Crop
OL
2,822,319
19.13
Shifting Cultivation
Shifting Cultivation
OL
34,253
0.23
Natural
Tree Dominated Area
Swamp Forest
Swamp Forest
F140
0.00
Mangrove Forest
Mangrove Forest
F402,185
2.73
Shrub Dominated Area
Swamp Reed Land
Swamp Reed Land
OL
13,437
0.09
Cultivated
Tree Crop
Mangrove Plantation
Mangrove Plantation
F55,089
0.37
Swamp Plantation
Swamp Plantation
F628
0.00
Rural
Settlement
Rural
Settlement
Rural
Settlement
Rural Settlement
Rural Settlement
Rural Settlement
OL
3,124,468
21.17
Natural
Soil, Sand Deposit
Mud Flats or Intertidal Area
Mud Flats or Intertidal Area
OL
76,301
0.52
Sand
Sand
OL
151,267
1.03
River Banks
River Banks
OL
782
0.01
Artificial
Built‐up Non‐Linear
Built‐up Non‐Linear
Built‐up Non‐Linear
OL
179,223
1.21
Airport
Airport
Airport
OL
2,538
0.02
Dump / Extraction Sites
Dump / Extraction Sites
Dump / Extraction Sites
OL
4,399
0.03
Brickfield
Brickfield
Brickfield
OL
20,966
0.14
Salt Pans
Salt Pans
Salt Pans
OL
37,272
0.25
Natural
Rivers and Khals
Rivers and Khals
Rivers and Khals
OL
1,253,573
8.49
Standing Natural Waterbody
Baor
Baor
OL
18,457
0.13
Perennial Beels/Haors
Perennial Beels/Haors
OL
57,639
0.39
Artificial
Standing Large Artificial Waterbody
Lake
Lake
OL
53,318
0.36
Standing Sm
all Artificial Waterbody
Fresh W
ater Aquaculture
Fresh W
ater Aquaculture
OL
190,330
1.29
Brackish W
ater Aquaculture
Brackish W
ater Aquaculture
OL
156,962
1
Ponds
Ponds
OL
10,561
0.07
Tota
l F1,
884,
019
12.8
Tota
l O
L12
,872
,981
87
.2To
tal
14,7
57,0
00
100
1 F ‐ Forest, O
L ‐ Other Land according to FRA (2018). OL is synonym
ous with Trees Outside Forest (TO
F) in this report.
Non‐
Vegetated
Area
Terresterial
Water
Land
cov
er c
lass
Land
cov
er a
rea
Vegetated AreTerresterial
Aquatic or
Regularly
Flooded
Tabl
e 3.
2. D
isag
rega
ted
leve
ls a
nd a
reas
of e
ach
land
cov
er c
lass
.

64
Treecoverchanges
Description
For specific land cover classes, the average tree
cover increased in Mangrove Plantation,
Mangrove Forest, and Rubber Plantation. On
the other hand, tree cover within Plain Land Sal
Forest, Shifting Cultivation, Hill Forest, Forest
Plantation, Shrub with Scattered Trees,
Bamboo Forest, and others decreased from
2000 to 2015 (Figure 3.2).
Highlights
- The highest increase of tree cover
occurrs within Mangrove Plantation
(12%) and Mangrove Forest (4%).
- The highest decrease of tree cover
occurrs within Plain Land Forest (Sal
Forest) (18%).
- A decrease in average tree cover is
also observed in Hill Forest (8%),
Forest Plantation (7%) and Bamboo
Forest (5%).
Photo: The great white egret, Sundarban, ©Mondol F.K.

65
Figure 3.2. The change in tree cover within 2015 land cover classes.
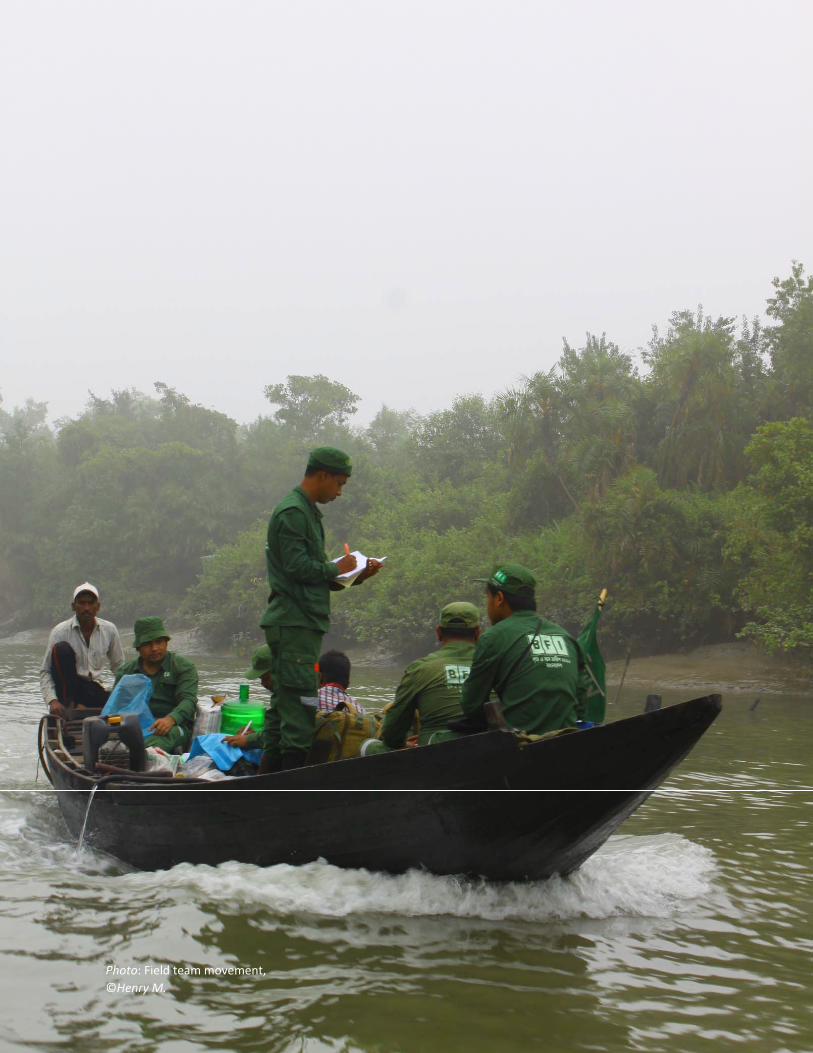
66
Photo: Field team movement,
©Henry M.

67
68
Criteria2‐Biologicaldiversityandconservation

69
Phot
o: Rubber plantation, Tangail, ©
Mon
dal F
.K.

70
Criteria 2
Biological diversity and conservation
Section Highlights
A total of 390 tree species are identified in the biophysical inventory. TOF areas have more
species than Forest areas (286 and 274, respectively).
Heritiera fomes 10,094 seedlings/ha in the Sundarban zone) and Shorea robusta (4065
seedlings/ha in the Sal zone) have the highest seedling zone level densities.
There are 11 IUCN Red List tree species inventoried in the BFI, including Dipterocarpus spp.
(Garjan) and Corypha taliera (Tali) which are considered critically endangered in Bangladesh.
The Mangrove Forest holds 44% of the national seedling stock, mainly comprised of Heritiera
fomes (Sundri), Ceriops decandra (Goran), and Excoecaria agallocha (Gewa).
Introduction Forests are habitats for both plant and animal species. This criterion describes the structure and
composition of trees and forests, and the abundance of regenerating and threatened tree species.
Monitoring these characteristics over time informs conservation initiatives and policies. This
criteria answers questions such as “what is the status of introduced and regenerating species?”,
and “where do endangered species occur?” In Bangladesh, there is a large variation observed in
the structure and composition of tree species. This ranges from the Rural Settlements where
species richness is highest with moderate tree densities to the Mangrove Forest which is relatively
homogeneous in terms of species but has very high tree densities.
Methods
Trees and saplings were surveyed in small, medium and large nested subplots (Section 2.3.3).
Seedlings were counted in the small subplots. References to “trees” in basal area and recruitment
estimations include both saplings and trees. The Bangladesh National Herbarium Tree Species
Database was used for tree species identification. Where summary statistics are by species, only
the ten most dominant species are shown whereas the complete list can be found in the Appendix
Section 4

71
4 tables. Zone level estimations of basal area, stem density, and other statistics followed
estimators prescribed for stratified random sampling as in Scott (2018). For estimates by land
cover class, the classes were assigned to the land feature of the biophysical inventory plot post
hoc by overlaying the 2015 Land Cover Map onto the subplot perimeters and extracting the areas.
The R code for the estimations can be found in the BFIS e‐Library (see also Hossain, Anik et al.
2019). Note that all data were collected from the biophysical inventory, except in the case of
Sections 4.6 to 4.7 which show data from the socio‐economic survey. Cells were left blank where
there was no sample of that condition and a 0 value indicates < 0.01 of the respective unit. More
estimates of stem densities, DBH, height, recruitment and basal area at the family level and for all
species are found in the Appendix 4 tables.
Maps were produced by applying the mean estimate by land cover class and zone to the polygons
of the 2015 Land Cover Map. When there was no or little data for very small land cover areas,
values were substituted from other classes. For example, as there was no plots occurring in Herb
Dominated Area in the Coastal or Sal zones to estimate growing stock value, the value for Herb
Dominated Area in the Village zone was substituted.
Photo: Goalpata (Nypa) transportation, The Sundarban, © Mondal F.K.

72
Treespeciescomposition,stemdensityandsizecharacteristics
Plantdiversityandbasalarea
Description
A total of 392 tree species were identified in the biophysical survey of the BFI. The number of
species is highest in the Hill zone (primarily Hill Forest) followed by the Village zone (primarily
Rural Settlement). The number of tree species in TOF is actually somewhat higher than in Forest
(Table 4.1 and 4.2). The Hill Forest is naturally regenerated forest whereas trees in Rural
Settlement are mostly planted, especially fruit trees. Although the Rural Settlement has 26% of
the total number of stems, it has 49% of the total basal area, perhaps reflecting the preference
for specific tree species and larger trees for their services by those who plant them.
Basal area includes both saplings and trees. The Mangrove Forest is also naturally regenerated
and has the highest stem density and basal area (m2/ha) though its tree species richness is much
less than other land cover classes. Trees in agricultural land primarily used for cultivation
(Multiple and Single Crop) have low sapling and tree densities (49 to 56 stem/ha) and low basal
area (0.80 to 0.91 m2/ha). A complete list of tree species and their basal areas is found in the
Appendix 4.1 (a, b, c).
Highlights
- Hill zone harbors 284 tree species which is the highest among the zones.
- The national average basal area density is 4.52 m2/ha and the national total is
60.84 million m2.
- Basa area density in Forest is 3.4 times higher than in TOF.
- Multiple and Single Crop has very low stem density yet high number of species
which may reflect agro‐forestry practices.

73
Table 4.1. Number of tree species, tree and sapling stem densities and tree and sapling basal area by zone.
Table 4.2. Number of tree species identified, tree and sapling stem densities and basal area by land cover class, ranked by basal area (m2/ha
Zone Number of species1
Tree stem density (stem/ha)
Total number of stem (stem/ha)
Basal area (m2/ha)
Total basal area (million m2)
Coastal 103 229 969 8.82 4.50
Hill 284 146 630 6.23 10.34
Sal 113 169 268 5.89 3.08
Sundarban2 28 661 6,861 22.29 8.99
Village 232 98 184 3.28 33.93
National 392 129 472 4.52 60.84
1Excludes unknown tree species
2Sundarban zone has only two land cover classes ‐ Mangrove forest and River Bank. Tree and sapling density for
the whole Sundarbans was 6861 where for Mangrove forest class the density was 6843 stem/ha and for River
Bank 23418 stem/ha. River Bank tree and sapling density was 470 stem/ha for all zones.
Land Cover Classes Number of species
Tree stem density (stem/ha)
Sapling and tree density (stem/ha)
Total number of stems (million)
Basal area (m2/ha)
Total Basal area (million m2)
Forest
Mangrove Forest 28 662 6843 2,758.01 22.26 8.97
Mangrove Plantation 12 325 2156 355.49 15.8 2.61
Plain Land Forest (Sal Forest)
18 539 810 34.15 14.61 0.62
Rubber Plantation 8 249 507 25.16 9.82 0.49
Hill Forest 229 210 788 487.54 9.38 5.80
Forest Plantation 88 256 759 71.24 8.85 0.83
Shrubs with scattered trees
158 103 696 397.86 4.27 2.44
Bamboo Forest 2 10 112 0.60 0.84 0.004
Total Forest 274 292 2192 4,130.05 11.55 21.764

74
Land Cover Classes Number of species
Tree stem density1 (stem/ha)
Sapling and tree density1 (stem/ha)
Total number of stems (million)
Basal area (m2/ha)
Total Basal area (million m2)
Other Land (TOF)
Rural Settlement 249 315 578 1671.52 10.18 29.45
Orchards and Other Plantations (Trees)
65 192
308 61.08 9.61 1.90
Swamp Reed Land 2 92 92 0.91 5.29 0.05
Built-Up Non-Linear 33 128 231 19.26 4.77 0.40
Orchards and Other Plantations (Shrub)
35 104
146 14.25 4.63 0.45
Shifting Cultivation 29 46 1201 36.7 3.44 0.11
River Banks 24 41 470 11.11 2.73 0.06
Ponds 7 71 71 0.57 2.71 0.022
Multiple Crop 90 26 56 177.24 0.91 2.89
Single Crop 122 22 49 224.24 0.80 3.65
Fresh Water Aquaculture 13 15 15 1.7 0.45 0.05
Brickfield 3 3 3 0.08 0.42 0.01
Herb Dominated Area 4 15 15 0.87 0.37 0.02
Sand 2 0.3 0.3 0.04 0.03 0.004
Brackish Water Aquaculture 1 31 1.19 0.01 0.0005
Total Other Land (TOF) 286 101 192 2,220.76 3.38 39.07
1Trees are stems with diameter ≥ 10cm; saplings are stems with diameters between 2 to 10cm.

75
Standcharacteristicsbyspecies
Description
Diameters and heights vary widely across zones indicating the growth forms of the dominant
trees that occur in those zones. There were several individual trees inventoried with DBH greater
than 150 cm, namely, Bombax ceiba (190 cm), Ficus benghalensis (182 cm), Duabanga grandiflora (175 cm), Avicennia officinalis (164 cm) etc. There were two individual trees that were greater
than 45 m in height, both of them in the Hill zone ‐ Swintonia floribunda (45.3 m), and
Dipterocarpus costatus (45.3 m).
The lower height and DBH classes have more stem density than higher size classes (Figure 4.1 and
4.2). More specifically, height classes greater than 20m in all zones have the least density (<1
stem/ha) indicating lower tree populations in the higher size classes. The stem density of
Sundarban is about 3.5 times higher than the total stem density of the remaining four zones when
trees had DBH’s of 2 to 10 cm.
C. decandra, E. agallocha, and H. fomes are the three highest species in terms of stem density
across the country, though they almost exclusively occur in the Sundarban zone (Appendix 4.1.2).
T. grandis dominated the Hill zone and E. agallocha is highest in the Coastal zone (Table 4.3). S. mahagoni has the highest density in the Village zone, while S. robusta is highest in the Sal zone. Stem density, DBH and height estimates at the family level and for all species can be found in the
Appendix 4.1.2 (a,b,c).
Highlights
- Stem density is highest in DBH classes <10 cm and height class <5 m.
- The three highest densities by species are all found in the Sundarban zone (C. decandra, E. agallocha, and H. fomes).
- Aam (mango) is the largest growing of the most common species, reaching diameters of
126 cm and heights of 37m (Table 4.3).
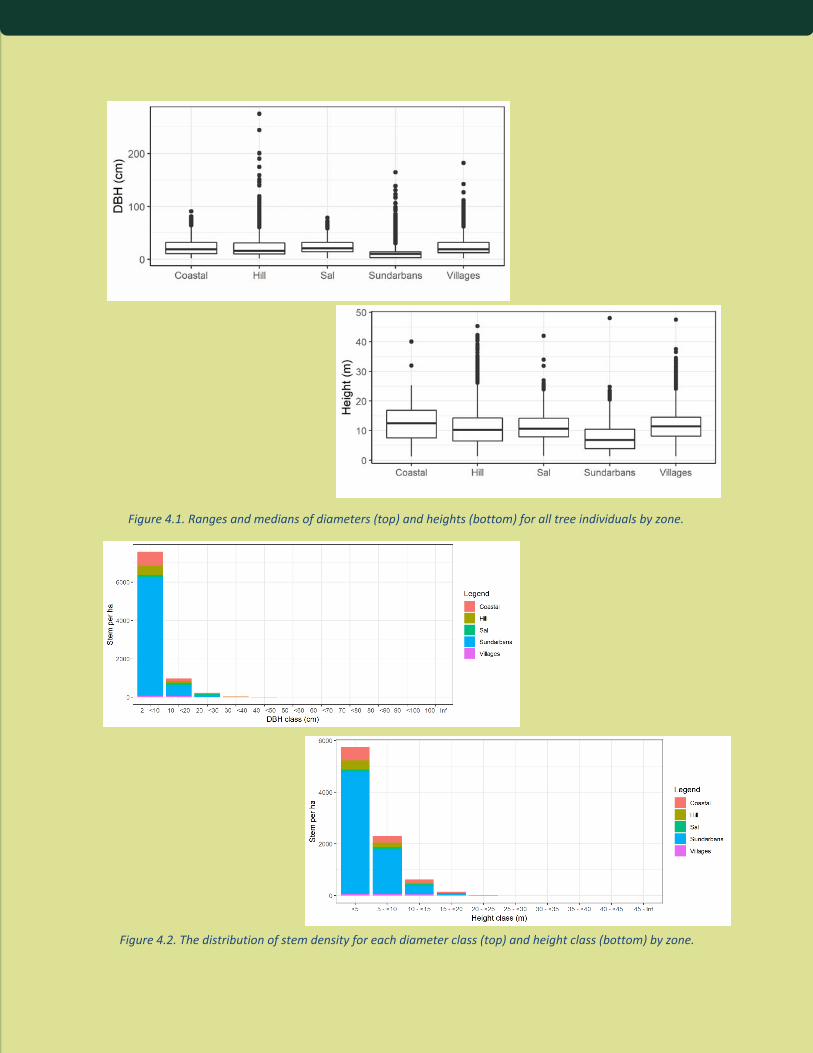
76
Figure 4.1. Ranges and medians of diameters (top) and heights (bottom) for all tree individuals by zone.
Figure 4.2. The distribution of stem density for each diameter class (top) and height class (bottom) by zone.

77
Tree Scientific Name Local Name Tree stem density1 (stem/ha)
Tree and sapling stem density1 (stem/ha)
DBH (cm) Height (m)
Min Mean Max Min Mean Max
Coastal Zone
Excoecaria agallocha Gewa 10 523 2 9.6 46.7 1.5 7.0 22.4
Sonneratia apetala Keora 86 104 2 78.7 130 1.8 16.8 24.8
Areca catechu Supari 59 100 3 11.8 69.6 1.7 11.3 22.1
Memecylon edule Anjan 35 2 3.5 7.8 2.1 3.7 7.21
Samanea saman Siris 14 24 2 35.7 110.8 1.7 14.8 37.5
Hill Zone
Tectona grandis Shegun 34 117 1.8 15.2 48 1.4 10.1 29.6
Macaranga
denticulata
Bura/Khoi 6 48 2 8.8 31.6 1.6 6.4 14.7
Acacia auriculiformis Akashmoni 7 39 2 15.2 61.4 1.6 11.6 32.5
Ficus carica Anjir/Dumur 4 37 2 11.2 78.5 1.7 6.2 27.9
Gmelina arborea Gamari 7 18 2.05 25.9 117.1 2.1 12.6 31.6
Sal Zone
Shorea robusta Sal 43 76 2 19.1 64.5 1.8 11.7 26
Acacia auriculiformis Akashmoni 43 65 2 15.2 61.4 1.6 11.6 32.5
Artocarpus
heterophyllus
Kathal 16 17 2 26.6 78.2 2.1 9.9 33.2
Swietenia mahagoni Mehogoni 8 16 2 18.9 86.1 1.4 11.4 32
Mangifera indica Aam 8 11 2 27.8 125.7 1.5 10.0 36.5
Sundarban Zone
Ceriops decandra Goran 0 2,522 2 2.8 9.8 1.4 3.1 11.2
Excoecaria agallocha Gewa 288 2,111 2 9.6 46.7 1.5 7.0 22.4
Heritiera fomes Sundri 331 1,744 2 13.0 117 1.4 9.5 24.8
Aglaia cucullata Amoor 3 230 2 4.9 65 1.46 4.2 17.8
Cynometra ramiflora Singra 1 65 2 5.9 41.5 2.5 4.5 16
Table 4.3. Stem densities, Diameter at Breast Height (DBH), and height statistics of the ten most dominant tree species of Bangladesh.

78
Tree Scientific Name Local Name Tree stem density (stem/ha)
Tree and sapling stem density (stem/ha)
DBH (cm) Height (m)
Min Mean Max Min Mean Max
Village Zone
Swietenia mahagoni Mehogoni 13 31 2 18.9 86.1 1.4 11.4 32
Areca catechu Supari 23 30 3 11.8 69.6 1.7 11.3 22.1
Mangifera indica Aam 10 18 2 27.8 125.7 1.5 10.0 36.5
Eucalyptus
camaldulensis
Eucalyptus 5 11 2 18.0 55.5 1.5 14.2 34.5
Acacia auriculiformis Akashmoni 3 10 2 15.2 61.4 1.6 11.6 32.5
National Level
Excoecaria agallocha Gewa 9 83 2 9.6 46.7 1.5 7.0 22.4
Ceriops decandra Goran 76 2 2.8 9.8 1.4 3.1 11.2
Heritiera fomes Sundri 10 53 2 13.0 117 1.4 9.5 24.8
Areca catechu Supari 20 27 3 11.8 69.6 1.7 11.3 22.1
Swietenia mahagoni Mehogoni 11 26 2 18.9 86.1 1.4 11.4 32
1Trees are stems with diameter ≥ 10cm; saplings are stems with diameters from 2 to 10cm.

79
Regenerationandrecruitment
Regenerationbyspeciesandzone
Description
Seedling density varies widely by zone. Similar to tree
densities (Section 4.1.2), mangrove species have some of
the highest seedling densities (H. fomes, C. decandra and E. agallocha) (Table 4.4). S. robusta seedlings dominated
the Sal zone. Common seedlings in the Village zone
included F. carica, S. cumini, C. mitis, and S. asper. The most common seedling specie of the Hill zone is F. carica. Seedling density estimates for all species can be found in
the Appendix 4.2.1 (a,b).
Highlights
- Seedling density is highest in mangrove species
of the Sundarban zone. For example, H. fomes is 5.9 times higher than the national average (see
Section 4.2.2)
- S. cumini and E. agallocha seedlings each occur as a top five species in more than one zone.
- The most evenly distributed seedling species
occurs in the Village zone.
- The top three species in the country in terms of
seedling density are H. fomes, C. decandra, and S. robusta.
Photo: Bashpata (Podocarpus Neriifolius), © Mondal F.K.
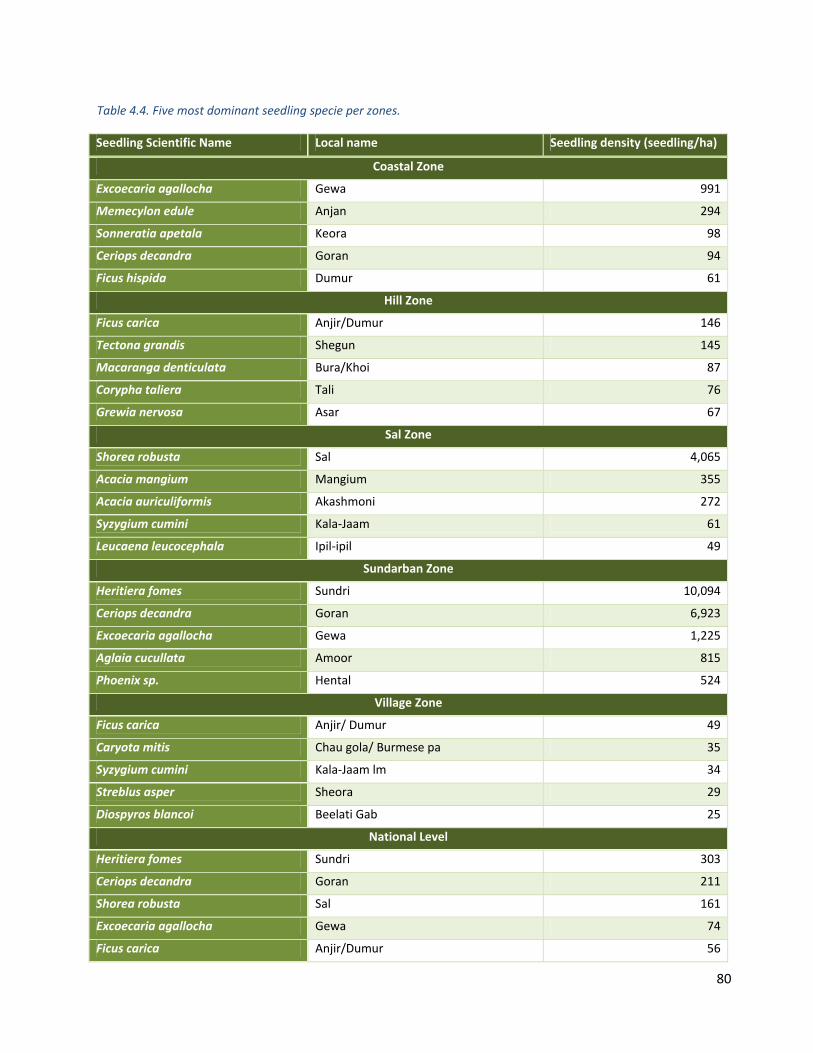
80
Seedling Scientific Name Local name Seedling density (seedling/ha)
Coastal Zone
Excoecaria agallocha Gewa 991
Memecylon edule Anjan 294
Sonneratia apetala Keora 98
Ceriops decandra Goran 94
Ficus hispida Dumur 61
Hill Zone
Ficus carica Anjir/Dumur 146
Tectona grandis Shegun 145
Macaranga denticulata Bura/Khoi 87
Corypha taliera Tali 76
Grewia nervosa Asar 67
Sal Zone
Shorea robusta Sal 4,065
Acacia mangium Mangium 355
Acacia auriculiformis Akashmoni 272
Syzygium cumini Kala‐Jaam 61
Leucaena leucocephala Ipil‐ipil 49
Sundarban Zone
Heritiera fomes Sundri 10,094
Ceriops decandra Goran 6,923
Excoecaria agallocha Gewa 1,225
Aglaia cucullata Amoor 815
Phoenix sp. Hental 524
Village Zone
Ficus carica Anjir/ Dumur 49
Caryota mitis Chau gola/ Burmese pa 35
Syzygium cumini Kala‐Jaam lm 34
Streblus asper Sheora 29
Diospyros blancoi Beelati Gab 25
National Level
Heritiera fomes Sundri 303
Ceriops decandra Goran 211
Shorea robusta Sal 161
Excoecaria agallocha Gewa 74
Ficus carica Anjir/Dumur 56
Table 4.4. Five most dominant seedling specie per zones.

81
Regeneration
Description
Seedling density is by far the highest in the Sundarban zone, more than 12 times higher than the
national average, which also resulted in this zone containg 44% of the total number of seedlings
in the country (Table 4.5). Nevertheless, the diversity of seedlings among zones is the highest in
the Hill zone. In contrast, the Sundarban zone has the lowest number of species and families yet
the highest number of total seedlings.
Seedlings occur in 19 of the 33 land cover classes and the highest totals are in the Mangrove
Forest, Rural Settlement, and Hill Forest (Table 4.6). For number of species, unlike the case of tree
and saplings, the number of seedling species observed is much higher in Forest areas (216)
compared to TOF (160).
Highlights
- There are about 19.1 billion estimated seedlings.
- There are 135 regenerating species within the Hill Forest.
- Seedling density in Forest area is 15 times higher than in TOF.
- Seedling density in the Mangrove Forest is 4.3 times higher than in Mangrove
Plantation.
Zone Number of species1
Number of families1
Seedling density (seedling/ha)
Total number of seedling (million)
Coastal 56 26 2,099 1,070.9
Hill 195 52 1,584 2,627.7
Sal 42 20 5,086 2,655.6
Sundarban 19 12 20,942 8,449.3
Village 110 41 413 4,275.6
National 278 63 1,419 19,079.1
1Unknown species or families were excluded
Table 4.5. Seedling number, species and family composition by zones.
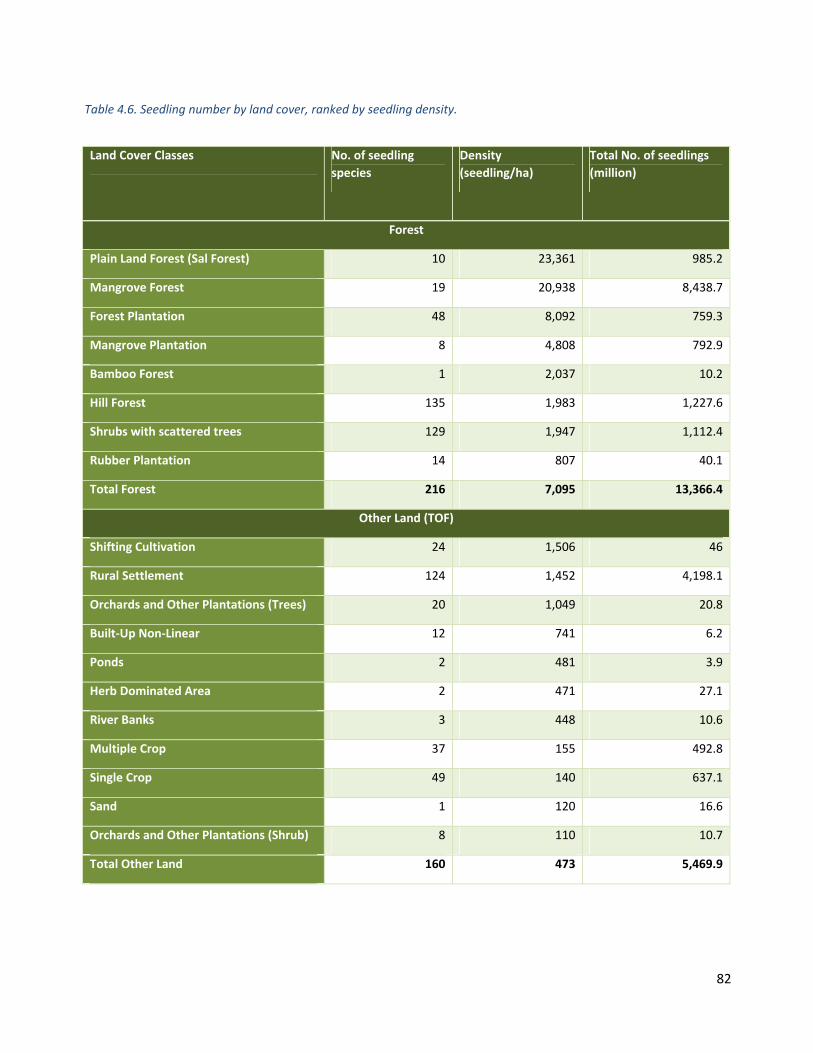
82
Land Cover Classes No. of seedling
species Density (seedling/ha)
Total No. of seedlings (million)
Forest
Plain Land Forest (Sal Forest) 10 23,361 985.2
Mangrove Forest 19 20,938 8,438.7
Forest Plantation 48 8,092 759.3
Mangrove Plantation 8 4,808 792.9
Bamboo Forest 1 2,037 10.2
Hill Forest 135 1,983 1,227.6
Shrubs with scattered trees 129 1,947 1,112.4
Rubber Plantation 14 807 40.1
Total Forest 216 7,095 13,366.4
Other Land (TOF)
Shifting Cultivation 24 1,506 46
Rural Settlement 124 1,452 4,198.1
Orchards and Other Plantations (Trees) 20 1,049 20.8
Built-Up Non-Linear 12 741 6.2
Ponds 2 481 3.9
Herb Dominated Area 2 471 27.1
River Banks 3 448 10.6
Multiple Crop 37 155 492.8
Single Crop 49 140 637.1
Sand 1 120 16.6
Orchards and Other Plantations (Shrub) 8 110 10.7
Total Other Land 160 473 5,469.9
Table 4.6. Seedling number by land cover, ranked by seedling density.
83
Recruitmentstatusbyspeciesandzone
Description
Understanding the patterns of survivorship is crucial for establishment and management of tree
populations. As there is currently only one inventory cycle of the BFI, recruitment status was not
calculated based on observed change in seedlings or saplings between two time periods, rather,
the proportions of seedlings or saplings was reported. The seedling to tree recruitment was the
percent of seedling density of total seedling and tree density by zone (seedling to tree recruitment
= seedling / (seedling + tree)). The top 10 species ranked by stem density are given here, while
recruitment estimates for all species can be found in the Appendix 4.2.3 (a,b).
The percentage of recruitment from seedling to sapling is comparable in all the 5 zones except
Sal (Figure 4.3). In the Sal zone the sapling density is very little in comparison to tree density which
resulted in a high recruitment percentage from sapling to trees but low percentage from seedling
to sapling. This may indicate poor survival of the seedlings.
A. auriculiformis has the highest percent recruitment from seedling to tree, especially in the
Village zone (Table 4.7).
Not shown are those species with very low recruitment. For example, for some fruit tree species
(e.g. S. cumini) human management may be interfering with natural regeneration, resulting in a
higher percentage of trees over saplings. Despite the large number of seedlings observed for S. robusta in the Sal zone (see 4.2.1), only a modest 1% seedling survival is observed.
Highlights
- Seedlings of A. auriculiformis, A. richardiana and E. agallocha are commonly occurring
trees with high percentage recruitment to trees indicating low interference in growth
for these species.
- Seedling to tree recruitment is especially high for A. indica in the Hill zone.
- A. cucullata and C. mitis (not shown) both have lower recruitment from seedling to tree,
perhaps indicating less preference of these species by people living in the Village and
Hill zones, respectively.
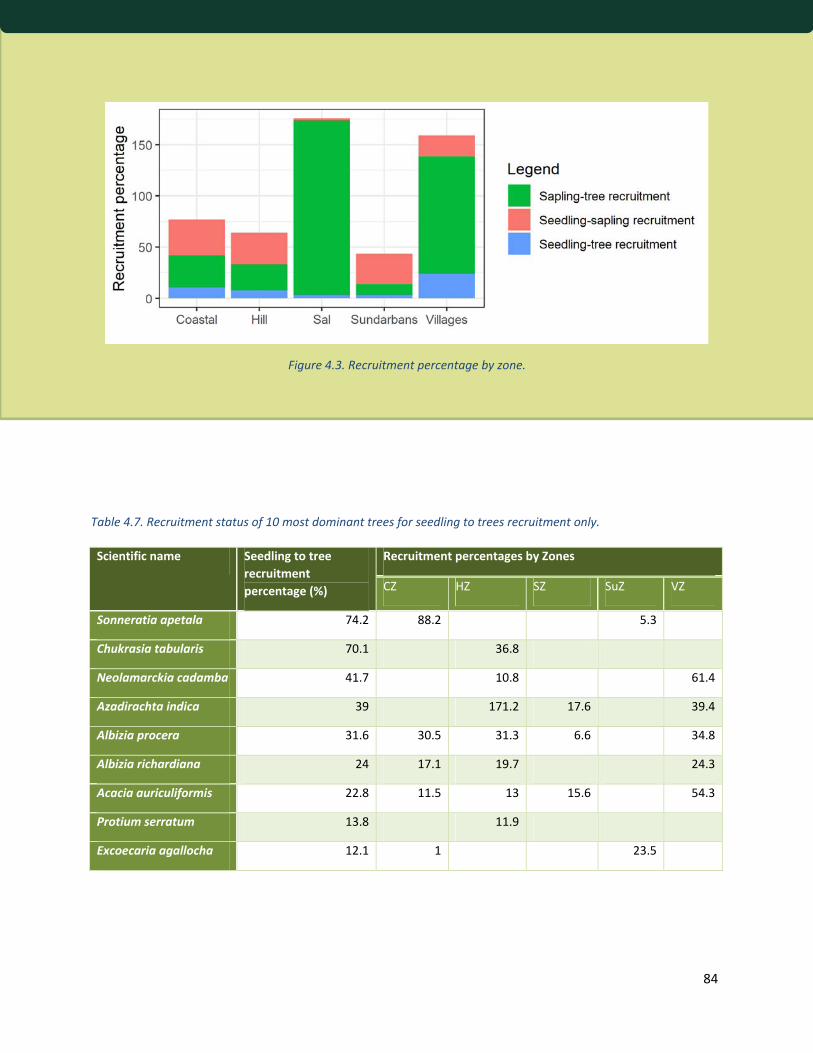
84
Scientific name Seedling to tree recruitment percentage (%)
Recruitment percentages by Zones
CZ HZ SZ SuZ VZ
Sonneratia apetala 74.2 88.2 5.3
Chukrasia tabularis 70.1 36.8
Neolamarckia cadamba 41.7 10.8 61.4
Azadirachta indica 39 171.2 17.6 39.4
Albizia procera 31.6 30.5 31.3 6.6 34.8
Albizia richardiana 24 17.1 19.7 24.3
Acacia auriculiformis 22.8 11.5 13 15.6 54.3
Protium serratum 13.8 11.9
Excoecaria agallocha 12.1 1 23.5
Table 4.7. Recruitment status of 10 most dominant trees for seedling to trees recruitment only.
Figure 4.3. Recruitment percentage by zone.

85
Plantdiversityindexoftrees
Description
Several diversity indices were considered for quantifying trees diversity by zone, reflecting zones
of lower or higher diversity. This is different than a plot level approach which would average the
index over many plots. Four common diversity indices were used: Shannon‐Wiener Diversity
Index (SWDI), Simpson’s Dominance index (SDI), Margalef’s Richness index (MRI) and Pielou’s
Evenness index (PEI) following Shannon (1963), Simpson (1949), Margalef (1958) and Pielou
(1966) respectively.
The Shannon‐Wiener diversity index value indicated somewhat low tree diversity across the
country. Yet, the Hill and Village zones have comparatively higher Shannon‐Wiener diversity than
in Coastal and Sundarban zones (Figure 4.4; Table 4.8). The dominance of a relatively fewer
species in the Coastal and Sundarban zones (e.g. E. agallocha and H. fomes) is the reason for their lower diversities. The Margalef’s Richness also indicated higher species richness in Village and Hill
zones. Peilou’s Evenness index, indicating the closeness of the population of each species, showed
higher unevenness in the number of each species in the Hill zone.
Highlights
- The Hill and Village zones have the highest species diversity (SWDI) and species richness
(MRI)
- The lowest species diversity and species richness occurs in the Sundarban zone.
- Relative abundance of the species is lowest in Hill zone (SDI).
Zone SWI SDI MRI PEI
Coastal 1.990 0.318 9.439 0.428
Hill 3.984 0.054 24.316 0.705
Sal 2.737 0.151 11.485 0.578
Sundarban 1.403 0.296 2.187 0.417
Village 3.400 0.077 20.286 0.624
National 3.162 0.116 29.372 0.529
Table 4.8. Plant diversity index by zone.

86
Figure 4.4. Map of the spatial distribution of Shannon-Weiner Index determine from BFI plots.

87
Statusofnativeandintroducedtreespecies
Description
Tree species that were introduced less than 250 years ago are considered to be introduced
species (FAO 2018b). Introduced tree species were brought to Bangladesh at different times for
purposes such as commercial timber productivity and improving site quality. Previously published
literature (Davidson and Das 1985, Zabala 1990, Hossain and Pasha 2004, Akter and Zuberi 2009,
Hossain and Hoque 2013) were used to identify the introduced tree species in BFI.
The stem densities presented refer to both sapling and trees. The more urbanized the zone, the
larger proportion of introduced tree individuals, i.e. Village > Sal > Hill > Coastal > Sundarban
(Figure 4.5). Though there are no introduced species found in the sample plots of the Sundarban
zone, each of the remaining four zones harbored 20‐30 introduced species. Though the
distribution of introduced seedling individuals is comparable to the trees, the percentages of
introduced seedlings are lower than the tree individuals (Figure 4.6).
Among the 24 land cover classes with presence of trees, comparatively more introduced species
by tree density are found in Rubber Plantation, Rural Settlement, and Shifting Cultivation (Table
4.9). High percentages of introduced species are also inventoried in marginal areas around Ponds
and Multiple and Single Crops (Table 4.9). At least 34 introduced species are found in Rural
Settlement. There are a total of 36 introduced species inventoried among which A. catechu is most common (Table 4.10).
Highlights
- Rubber plantations have the highest density of introduced tree species though only 4
species are counted, indicating monoculture systems.
- The high number of introduced species in Rural Settlement suggests the popularity of
planting these species in homestead gardens.
- The highest stem density of introduced species by zone is T. grandis in the Hill zone. - The fast‐growing A. auriculiformis (Sal zone, used for fuelwood), A. catechu (Hill zone,
harvested for nuts), and S. mahagoni (Village zone, used for construction) are some of
the notable introduced species of Bangladesh.

88
Figure 4.5. Percentage of native and exotic tree individuals in different zones.
Figure 4.6. Percentage of native and exotic seedling individuals in different zones.

89
Table 4.9. Origin of tree species in different land cover classes, ranked by introduced species stem density.
Land Cover Classes Species number Percentage of total sapling and tree individuals
Tree and sapling density(stem/ha)
Native Introduced Native Introduced Native Introduced
Forest
Rubber Plantation 15 4 24.86 75.14 137.61 415.83
Forest Plantation 87 15 65.76 34.24 503.37 262.11
Shrubs with scattered trees
180 17 67.27 32.73 469.59 228.44
Hill Forest 223 18 72.15 27.85 568.29 219.4
Plain Land Forest (Sal Forest)
19 5 95.98 4.02 779.96 32.66
Bamboo Forest 2 0 100 0 111.81 0
Mangrove Plantation 13 0 100 0 2,155.72 0
Mangrove Forest 30 0 100 0 6,843.28 0
Other Land (TOF)
Rural Settlement 238 34 36.18 63.82 209.14 368.93
Shifting Cultivation 35 5 70.57 29.43 847.7 353.58
Built-Up Non-Linear 24 14 23.61 76.39 54.59 176.62
Orchards and Other Plantations (Trees)
53 16 56.52 43.48 174.14 133.98
Ponds 5 4 52.79 47.21 130.75 116.93
Orchards and Other Plantations (Shrub)
31 8 64.67 35.33 94.47 51.61
Multiple Crop 79 20 31.77 68.23 17.7 38.01
Single Crop 110 25 45.31 54.69 22.37 27
River Banks 20 7 95.57 4.43 449.49 20.82
Fresh Water Aquaculture 6 7 34.72 65.28 5.24 9.85
Herb Dominated Area 3 4 44.6 55.4 7.42 9.22
Sand 1 2 0 100 0 0.3
Brickfield 3 0 100 0 3.35 0
Brackish Water Aquaculture
1 0 100 0 30.55 0
Mud Flats or Intertidal Area
2 0 0 0 0 0
Swamp Reed Land 2 0 100 0 91.98 0

90
Table 4.10. Complete list of introduced tree species densities by zone, ranked by stem density.
Scientific name Local Name Stem density (stem/ha)
Distribution of density into zones (tree/ha)
CZ HZ SZ SuZ VZ
Areca catechu1 Supari 27 100.29 3.27 0.81 29.56
Swietenia mahagoni Mahogony 26 15.25 1.48 15.58 31.44
Tectona grandis1 Segun 15 0.02 116.73 4.69 0.56
Acacia auriculiformis Akashmoni 15 1.14 39.43 64.89 9.76
Eucalyptus camaldulensis Eucalyptus 9 0.20 2.78 11.34
Artocarpus heterophyllus1 Kanthal 6 21.64 6.31 17.40 5.07
Samanea saman Sirish 5 23.55 0.046 1.80 4.77
Cocos nucifera1 Narikel 4 7.68 0.17 0.94 4.68
Albizia richardiana Raj Koroi 4 3.94 1.47 0.85 4.64
Eucalyptus alba Eucalyptus 2 0.40 1.08 1.87 2.54
Acacia mangium Mangium 2 0.10 10.78 3.24 0.76
Swietenia macrophylla Mehogoni 2 2.38
Psidium guajava Peyara 2 3.26 1.08 3.70 1.77
Litchi chinensis Lichu 1 0.46 0.54 1.57
Polyalthia longifolia Debdaru 1 1.12 0.08 1.43
Borassus flabellifer1 Tal 1 0.94 0.03 3.93 1.19
Hevea brasiliensis Rubber 1 3.79 8.73
Senna siamea Minjiri 1 4.04 0.03
Dalbergia sissoo Sissoo 0.4 0.47
Lagerstroemia speciosa Jarul 0.3 0.48 0.29
Leucaena leucocephala Ipil ipil 0.3 0.10 0.03 0.30
Acacia nilotica Babla 0.3 0.81 0.31
Tamarindus indica Tetul 0.3 1.57 0.01 0.15 0.24
Melia azedarach Ghora nim 0.2 0.30 0.40 0.23
Eucalyptus citriodora Eucalyptus 0.2 0.10 0.62 0.15
Delonix regia Krishnachura 0.1 0.10 0.98 0.03
Anacardium occidentale Kaju 0.1 0.90 0.47 0.03
Pinus kesiya Saral 0.04 0.01 0.04
Acacia catechu Khayer 0.03 0.03 0.08 0.02
Phyllanthus acidus Amla 0.02 0.03 0.24 0.01
Morus alba Tut 0.02 0.02
Alstonia macrophylla Chhatim 0.02 0.10 0.03 0.01
Pithecellobium dulce Khai‐babla 0.004 0.12
Adenanthera pavonina Raktachandan 0.0005 0.01
1These species are introduced but considered naturalized in Bangladesh

91
RedListtreeandanimalspecies
DensityofRedListtreespecies
Description
The IUCN Red List of trees was used for identifying threatened trees in Bangladesh (IUCN 2018).
However, the IUCN list is a global list, and the same status may not apply in the context of
Bangladesh. The sources used to determine the status of the species in Bangladesh were Khan,
Rahman et al. (2001), Ahmed, Begum et al. (2008).
Among the 22 tree species identified in the Red List, 11 are found in the biophysical inventory. H. fomes has the highest population density followed by A. chittagonga and D. alatus.
The spatial occurrence of many Red List species is concentrated in the Sundarban and Hill zones,
however they also occur somewhat randomly in the Village zone (Figure 4.7).
Highlights
- 10 of the 11 species species identified from the IUCN list occur in the Hill zone. - Considering the IUCN status, Aquilaria malaccensis, or Agar, and Sonneratia griffithii, a
mangrove specie, are the only designated as Critically Endangered (Table 4.11). - Four species were identified as threatened in both the IUCN and Bangladesh lists:
Dipterocarpus costatus, Knema bengalensis, Anisoptera scaphula, and Aglaia chittagonga.
- Heritiera fomes has the largest density of Red List tree species is identified in the IUCN list, but is not identified as threathened in Bangladesh.
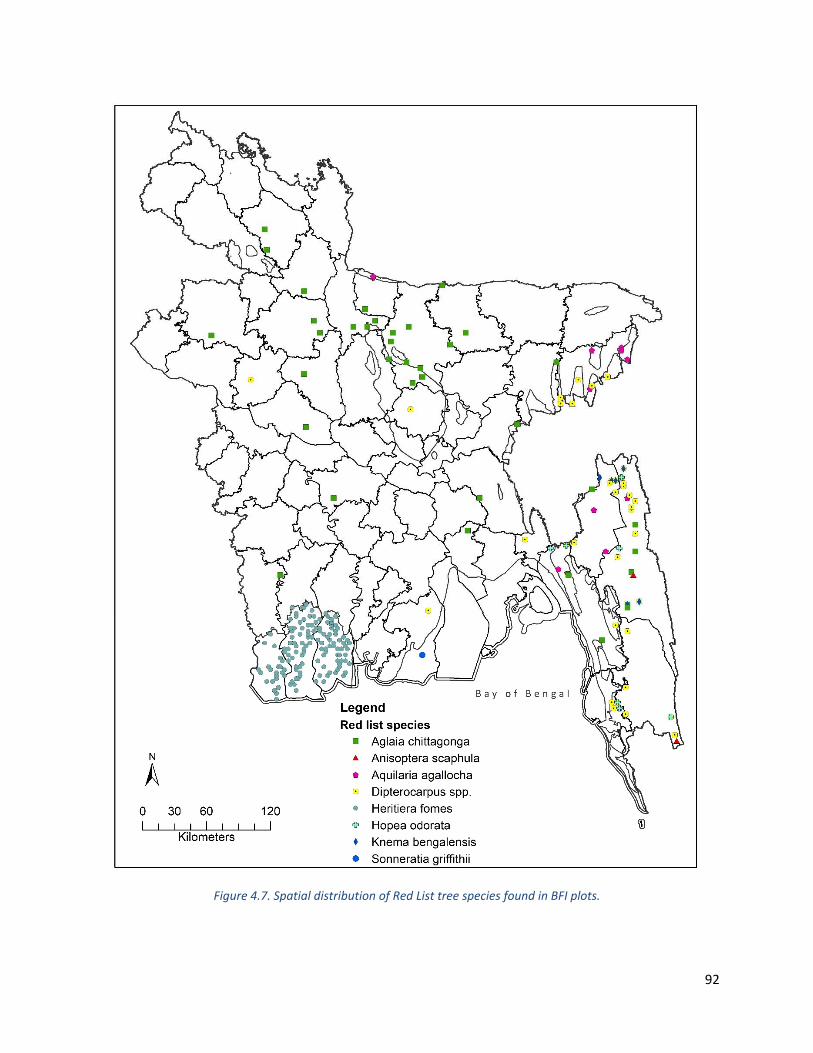
92
Figure 4.7. Spatial distribution of Red List tree species found in BFI plots.

93
Common name
Scientific name
Global Red List status1
Bangladesh status
Density (stem/ha)
Distribution by zone (stem/ha)
CZ HZ SZ SuZ VZ
Dholi Garjan Dipterocarpus alatus
Vulnerable Least
Concern3
0.69 5.61
Baittya Garjan
Dipterocarpus costatus
Vulnerable Conservation
Dependent3
0.08 0.63
Arjan, Dholi Garjan
Dipterocarpus gracilis
Vulnerable 0.02 0.10 0.03 0.01
Teliya Garjan
Dipterocarpus turbinatus
Vulnerable Least
Concern3
0.09 0.75 0.00
Agar Aquilaria malaccensis (or Aquilaria agallocha)
Critically
Endangered
Least
Concern3
0.46 3.08 0.84 0.06
Khudi berala
Knema bengalensis
Vulnerable Vulnerable2 0.09 0.73
Choila Sonneratia griffithii
Critically
Endangered
0.004 0.10
Boilam Anisoptera scaphula
Endangered Conservation
Dependent3
0.01 0.07
Sundri Heritiera fomes
Endangered 52.49 1.54 1743.57
Titpasing Aglaia chittagonga
Vulnerable Conservation
Dependent3
1.07 4.08 1.72 3.28 0.75
Telsur Hopea odorata
Vulnerable Least
Concern3
0.12 0.90 0.01
1Khan, Rahman et al. (2001), Ara, Khan et al. (2013), Ahmed, Begum et al. (2008); 2IUCN (2018)
Table 4.11. Density of the threatened tree species by zone.

94
RedListtreeandanimalspeciestraded
Description
The socio‐economic survey and community questionnaire asked what animal and tree species
were being hunted, collected, and traded by households. These were then matched with the
species listed in the IUCN Red List for Extinct, Critically Endangered, Endangered, or Vulnerable
categories (IUCN 2018). The sources used to determine the status of the species in Bangladesh
were Khan, Rahman et al. (2001), Ahmed, Begum et al. (2008).
As the respondents used local common names to describe the tree and animal species, in some
cases it is not possible to determine the exact species referred to. Therefore, all possible species
and their status are listed for reference. In the case of turtle, although it is mentioned to be traded
in the survey, it is not included because it is unknown if they were the same as Red List turtle
species.
Among the 11 Red List plant species identified in the biophysical inventory, at least eight are
found to be traded in Bangladesh (Table 4.12). It remains unclear, however, the exact species of
Garjan that is mentioned to be traded.
At least four Red List animal species are mentioned to be traded in the survey (Table 4.13). They
are considered threatened at some level both within and outside the country. The status of Gayal
is mentioned to be endangered in Bangladesh in at least one study, though the designation is
unofficial (Faruque et al. 2015) and it remains unclear the exact species.
Highlights
- The Hill zone is mentioned for all species except one as a place where Red List species are traded.
- The prevalence of Dipterocarpus indicates that this species remains vulnerable due to harvesting and trading for its many uses.
- Varanus bengalensis is also mentioned in the CITES Trade Database for Bangladesh exports (CITES 2019).
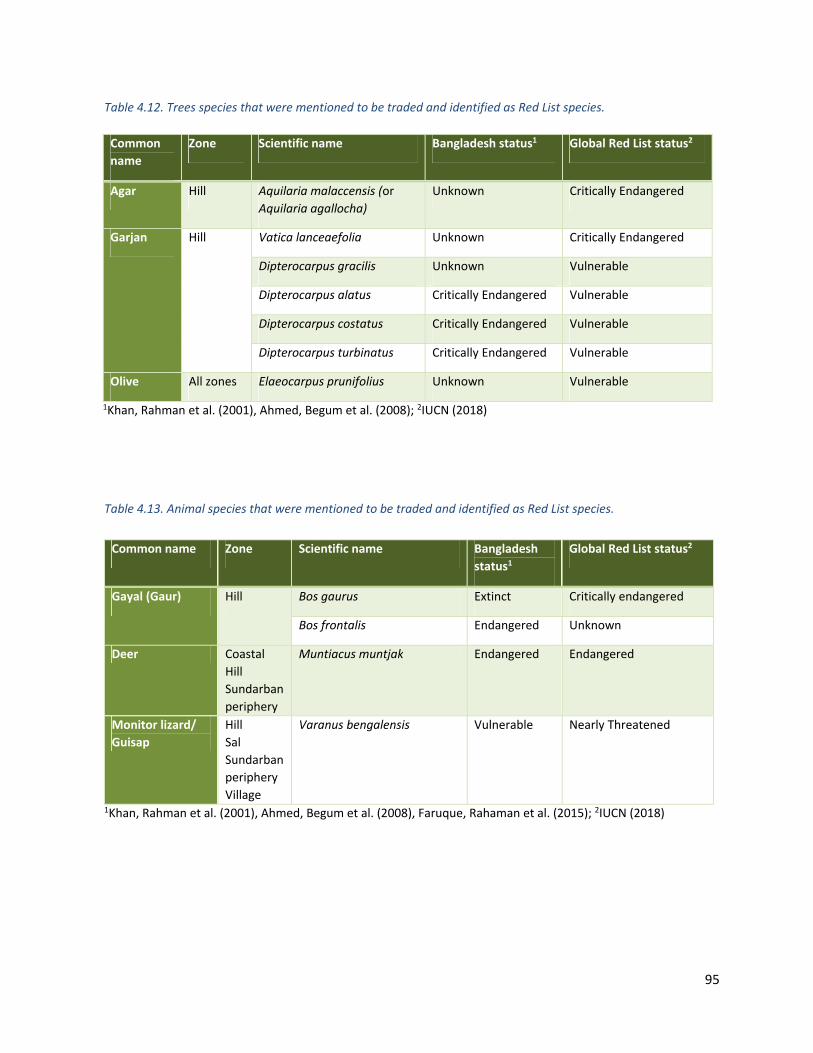
95
Common name Zone Scientific name Bangladesh status1
Global Red List status2
Gayal (Gaur) Hill Bos gaurus Extinct Critically endangered
Bos frontalis Endangered Unknown
Deer Coastal
Hill
Sundarban
periphery
Muntiacus muntjak Endangered Endangered
Monitor lizard/ Guisap
Hill
Sal
Sundarban
periphery
Village
Varanus bengalensis Vulnerable Nearly Threatened
1Khan, Rahman et al. (2001), Ahmed, Begum et al. (2008), Faruque, Rahaman et al. (2015); 2IUCN (2018)
Table 4.13. Animal species that were mentioned to be traded and identified as Red List species.
Common name
Zone Scientific name Bangladesh status1 Global Red List status2
Agar Hill Aquilaria malaccensis (orAquilaria agallocha)
Unknown Critically Endangered
Garjan Hill Vatica lanceaefolia Unknown Critically Endangered
Dipterocarpus gracilis Unknown Vulnerable
Dipterocarpus alatus Critically Endangered Vulnerable
Dipterocarpus costatus Critically Endangered Vulnerable
Dipterocarpus turbinatus Critically Endangered Vulnerable
Olive All zones Elaeocarpus prunifolius Unknown Vulnerable
1Khan, Rahman et al. (2001), Ahmed, Begum et al. (2008); 2IUCN (2018)
Table 4.12. Trees species that were mentioned to be traded and identified as Red List species.
ter passage in
Thanchi, Bandarban. P
urna
ta
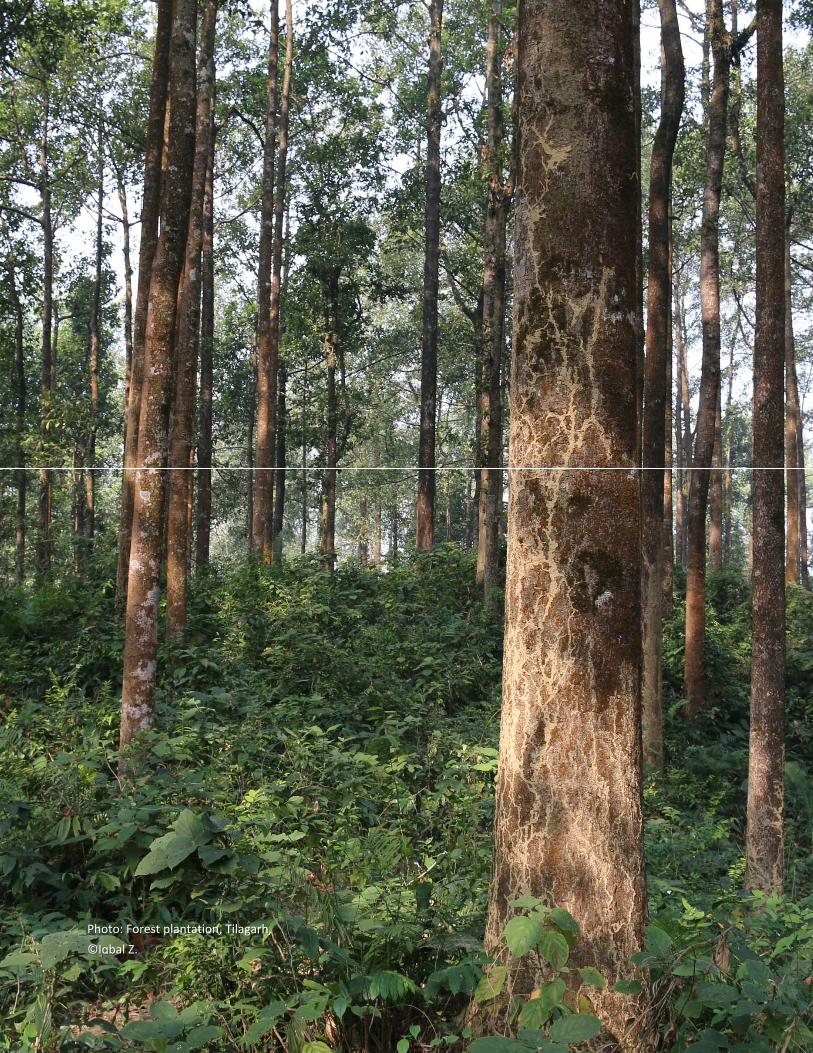
96
Photo: Forest plantation, Tilagarh,
©Iqbal Z.

97

98
Criteria 3 - Growing stock, biomass and carbon
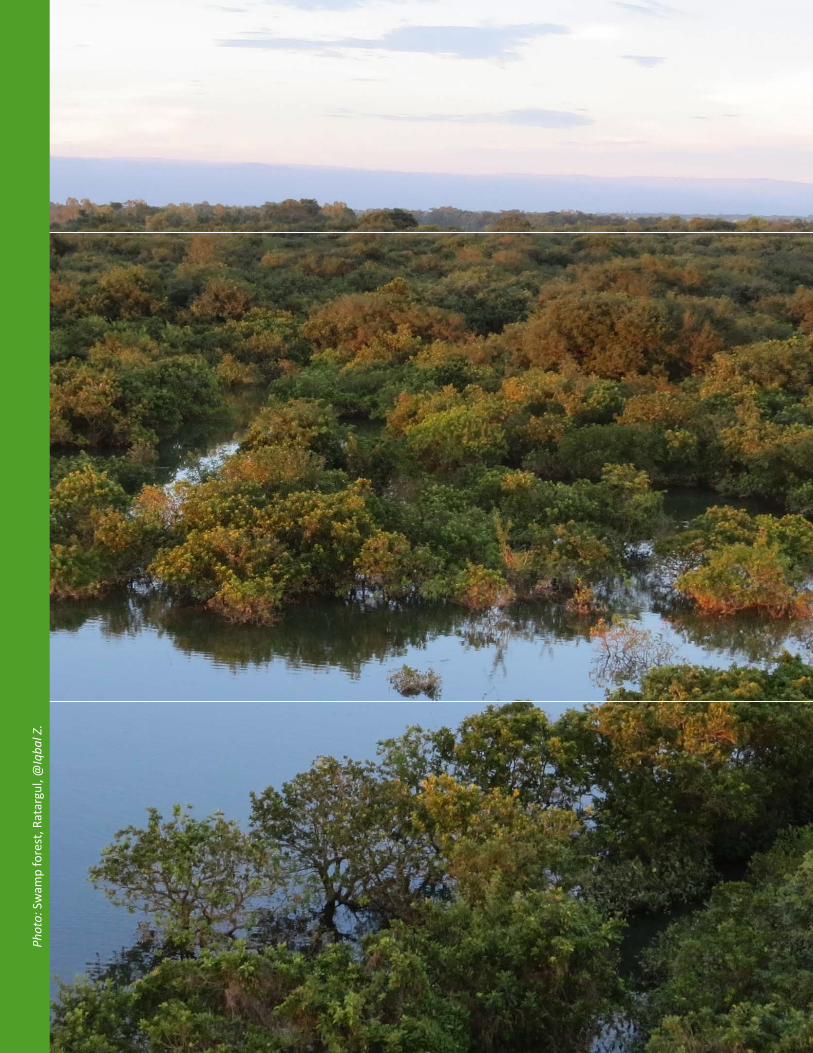
99
Phot
o: Swam
p forest, R
atargul, @
Iqba
l Z.

100
Criteria 3
Growing stock, biomass and carbon
Section Highlights
The most common native species by volume are Mangifera indica (Aam), Heritiera fomes (Sundri), Sonneratia apetala (Keora). The most common introduced species by volume are
Swietenia mahagoni (Mahogany), Areca catechu (Supari), and Cocos nucifera (Narikel).
TOF account for 66% of the country’s total volume and 66% of the total biomass.
Bamboos account for nearly 17% of the nation’s total tree volume.
There are 10,326 tons of dead wood considered usable as fuelwood (CWD, FWD, litter) and most
of this stock is supplied by the Hill Forest (33%) and Rural Settlement (25%) land cover classes.
The Sundarban zone contains extremely high densities of aboveground and belowground
biomass carbon stocks, having 3.4 times and 9.6 times higher densities, respectively, than the
national average. The total carbon density of all five carbon pools in the Sundarban is 345 t/ha
(soil to 1m depth).
Introduction
This criterion describes the status, productive capacity, and spatial distribution of the country’s
trees and forests. It answers questions such as – in what species and in what areas are carbon
stocks the highest? Growing stock is mostly used to indicate the availability of resources for
commercial extraction. Biomass is the estimate of productive capacity of ecosystems and is useful
for mapping. Carbon stocks indicate the contribution of the country’s trees and forest to the global
terrestrial carbon cycle. Changes in forest areas and land management impacts the rate of capture
or release of carbon between terrestrial ecosystems and the atmosphere (e.g. Houghton 2005).
Future inventory cycles will monitor the trends of these indicators over time. This section also
contains estimates of TOF following the FAO definition, which is simply all trees that occur in the
Other Land category in FAO’s Global Forest Resource Assessment (Schnell et al. 2015; FAO, 2018).
See Appendix 5 tables for details about which classes were aggregated to Forest and Other Land
Section 1

101
(i.e. TOF). Besides trees, estimates of dead wood biomass, soil carbon and other soil properties
are presented.
Methods
Tree and saplings were surveyed in small, medium and large nested subplots (Section 2.3.3).
Growing stock is volume over bark of all living trees with a minimum diameter of 10 cm at breast
height (FAO 2018b). There were 28 species specific and one general volume equations used to
estimate tree volume (see Appendix 2.3) (Hossain, Anik et al. 2019). Growing stock was estimated
using total tree height (commercial volume was not estimated). Bamboos were recorded and
measured in the medium (8 m radius subplot) plot. Bamboos were measured by average height,
average DBH and number by clump. Bamboo culm volume was calculated directly using a general
equation following Altrell (2007). All equations used are found in the Appendix 2.3 to 2.6 and
Hossain, Anik et al. (2019).
There were seven species specific and four zone specific allometric equations used to estimate
aboveground biomass. A decision tree was followed for appropriate selection of allometric
equations (Hossain, Anik et al. 2019). Aboveground biomass includes biomass from live tree (DBH
≥ 10cm), saplings (DBH ≥ 2cm), bamboo and live stumps. The wood density at species level was
collected from local sources found in Bangladesh’s online wood density database (BFD 2016a) and
other global sources. Genera or family level wood density was also used in cases when species
level wood density was not available. Biomass from palms, such as Areca catechu, Borassus flabellifer, and Phoenix sylvestris which were recorded as trees during the biophysical survey were also included. Aboveground biomass was also estimated at the Forest Division level and is included
in the Appendix 5.2.4.
Each of the five main carbon pools were estimated ‐ above ground biomass, below ground
biomass, down woody debris, litter and soil organic matter. Carbon in aboveground biomass was
estimated with five species specific allometric equations and three zone‐specific equations (Hill,
Sal and Sundarban) and assumed 50% carbon content in wood, except for bamboo species which
was assumed to be 54% (Allen 1986). Similar to volume and biomass, a decision tree was followed
for proper selection of allometric models (BFD 2016a).
Carbon in belowground biomass (CBGB) includes all live plant parts including roots of trees,
saplings, bamboos and live stumps. CBGB is estimated as 50% of BGB of trees, saplings, live stumps
and bamboo. Below Ground Biomass (BGB) estimation procedure varied with the trees and
saplings, stumps, bamboo and zones. In case of Sundarban tree and sapling DBH and species‐
specific wood density was used to calculate the BGB following Komiyama, Ong et al. (2008). For
trees and saplings of other four zones the BGB was calculated from AGB following Pearson, Brown
et al. (2007). A diameter based equation following Hjelm (2015) was used to calculate the BGB of
live stumps, where the top diameter was used. Bamboo BGB is comparatively less and estimated
following Lobovikov, Ball et al. (2007) for B. vulgaris and Bijaya and Bhandari (2008) for other bamboo species.
102
Dead wood biomass and carbon is composed of standing dead tree, dead stumps (and their
belowground portion), coarse woody debris and fine woody debris, and carbon in biomass, litter,
and soils. Dead stumps were calculated using a cylindrical volume equation (Jenkins, Chojnacky et
al. 2003) and then volume was multiplied with species‐specific or general wood densities to
calculate biomass. Carbon in dead wood biomass assumed a carbon content of 50% of the dead
wood biomass. The diameters of coarse woody debris (CWD) were measured along a transect to
estimate CWD volume following Marshall, Davis et al. (2000). For fine woody debris (FWD) an
average diameter was assumed for small, medium and large FWD and then the volume was
estimated following Marshall et al. (2000) and summed up for getting total FWD volume by
subplot. CWD and FWD wood density reductions were used to calculate their biomass (Jenkins,
Chojnacky et al. 2003, Harmon, Woodall et al. 2011). Standing dead tree biomass was estimated
using the height, DBH, decay status and reduced wood density and biomass models. The wood
density reduction factor was calculated considering the wood decay classes prescribed in BFI
manual and the raw data collected for allometric equation development (BFD 2016a, BFD 2016c).
For litter, a sample collected from the field was processed in the laboratory and litter carbon was
assessed multiplying the oven dry litter mass by its organic carbon percentage (BFD 2016d).
Soil samples were collected and analyzed for bulk density and soil organic carbon (SOC) density.
Samples were collected from 0‐15 cm and 15‐30 cm depths from all zones whereas an additional
sample from 30‐100 cm depth was collected in Coastal and Sundarban zones. Soil organic carbon
was estimated by plot and land feature using the bulk density and SOC percentage data (Donato,
Kauffman et al. 2009, BFD 2016d). Soil organic carbon percentage was determined by loss on
ignition (LOI) method without removing carbonates,
Estimates are presented by species, zone, land cover class, Forest Divisions, height class and DBH
classes (Hossain, Anik et al. 2019). The Bangladesh National Herbarium Tree Species Database was
used for tree species identification. When summary statistics are by species, only the ten most
dominant species are shown whereas the complete list can be found in the Appendix 5.1 tables.
Zone level estimations of volume, biomass, and carbon followed estimators prescribed for
stratified random sampling (Hossain, Anik et al. 2019). For estimates by land cover class, the
classes were assigned to the land feature of the biophysical inventory plot post hoc by overlaying the 2015 Land Cover Map onto the subplot perimeters and extracting the areas. The R code for
the estimations can be found in the BFIS e‐Library (see also Hossain, Anik et al. 2019). Note that
all data were collected from the biophysical inventory, except in the case of Sections 4.6 to 4.7
which show data from the socio‐economic survey. Cells were left blank where there was no sample
of that condition and a 0 value indicates < 0.01 of the respective unit. Volume and biomass
estimates for all families and species can be found in the Appendix 5.1 and 5.2 tables.
Maps were produced by applying the mean estimate by land cover class and zone to the polygons
of the 2015 Land Cover Map. When there was no or little data for very small land cover areas,
values were substituted from other classes. For example, as there was no plot occurring in Herb
Dominated Area in the Coastal or Sal zones to estimate growing stock value, the value for Herb
Dominated Area in the Village zone was substituted.

103
Growingstocks
Growingstocksbynativeandintroducedspecies
Description
Among the 392 tree species inventoried, there are 354 native species, or 90% of the total number
(Section 4.4). Among all species, S. mahagoni was the most abundant (Table 5.1). S. apetala was another important species which almost exclusively occurs in the Coastal zone. In contrast, the
third most dominant species, M. indica (mango), grows in all the zones except Sundarban.
Two palms, C. nucifera and A. catechu, are notably abundant. A. catechu occurs in every zone except Sundarban and most abundantly in the Village zone (Table 5.2). The popularity of some of
these introduced species in homestead plantations is partly the reason for their high volumes.
Growing stock estimates for all families and species can be found in the Appendix 5.1 tables.
Highlights
- The most common trees of each zone are Sundri in Sundarban, Keora in Coastal, Sal in Sal
zone, Shegun (teak) in Hill zone, and Mehogoni in Village zone.
- The Sundarban and Coastal zones are dominated by native tree species whereas the Sal
and Village zones have many introduced species.
- Overall, the top ten native and introduced species by volume possess 27% and 40% of
total national tree volume, respectively (Section 5.1.2).

104
Native species Introduced species
Species Growing stock (m3/ha)
Total growing stock (million m3)
Species Growing stock (m3/ha)
Total growing stock (million m3)
Mangifera indica 1.77 23.75 Swietenia mahagoni 2.59 34.84
(Aam) (Mahagoni)
Heritiera fomes 1.75 23.57 Areca catechu1 1.85 24.90
(Sundri) (Supari)
Sonneratia apetala 1.00 13.39 Cocos nucifera1 1.84 24.77
(Keora) (Narikel)
Excoecaria agallocha 0.84 11.26 Samanea saman 1.19 16.02
(Gewa) (Rain tree)
Albizia lebbeck 0.51 6.88 Borassus flabellifer1 0.87 11.76
(Kala koroi) (Tal)
Bombax ceiba 0.38 5.16 Eucalyptus camaldulensis 0.87 11.69
(Simul) (Eucalyptus)
Albizia chinensis 0.37 4.93 Artocarpus heterophyllus1 0.76 10.27
(Chakua Koroi) (Kanthal)
Phoenix sylvestris 0.35 4.69 Acacia auriculiformis 0.58 7.84
(Khejur) (Akashmoni)
Shorea robusta 0.35 4.64 Albizia richardiana 0.51 6.82
(Sal) (Raj Koroi)
Dipterocarpus alatus 0.33 4.39 Eucalyptus alba 0.44 5.86
(Sil Garjan) (Eucalyptus)
1These species are introduced but considered naturalized in Bangladesh
Table 5.1. Top ten native species ranked by total growing stocks. Common names are given below the scientific names.

105
Scientific name Local name Growing stock (m3/ha) Origin
Coastal Zone
Sonneratia apetala Keora 25.60 Native
Areca catechu1 Supari 5.14 Introduced
Samanea saman Siris 4.90 Introduced
Cocos nucifera1 Narikel 3.33 Introduced
Sonneratia caseolaris Ora 1.61 Native
Hill Zone
Tectona grandis1 Shegun 3.00 Introduced
Dipterocarpus alatus Sil Garjan 2.65 Native
Gmelina arborea Gamari 2.01 Native
Swintonia floribunda Civit 1.54 Native
Schima wallichii Kanak 1.31 Native
Sal Zone
Shorea robusta Sal 8.11 Native
Acacia auriculiformis Akashmoni 5.19 Introduced
Borassus flabellifer1 Tali palm 3.16 Introduced
Artocarpus heterophyllus1 Kanthal 2.72 Introduced
Hevea brasiliensis Rubber 2.63 Introduced
Sundarban Zone
Heritiera fomes Sundri 58.42 Native
Excoecaria agallocha Gewa 26.44 Native
Xylocarpus mekongensis Dhundol 4.06 Native
Avicennia officinalis Baen 3.83 Native
Bruguiera sexangula Kankra 1.35 Native
Village Zone
Swietenia mahagoni Mehogoni 3.13 Introduced
Cocos nucifera1 Narikel 2.19 Introduced
Areca catechu1 Supari 2.11 Introduced
Mangifera indica Aam 2.04 Native
Samanea saman Siris 1.27 Introduced
1These species were introduced but considered naturalized in Bangladesh
Table 5.2. Top five species by zone and ranked by growing stock.

106
Growingstocks,nationalestimatebyzoneandlandcoverclass
Description
The total gross tree volume of the country is 383.92 million m3. This amounts to 2.38 m3 per
person.
The national average gross volume is 28.5 m3/ha (Table 5.3). By comparison, the national level
volume reported in the NFA was only 14 m3/ha (MoEF and FAO, 2007). However, in the NFA only
one common volume equation was used compared to the 29 equations used in the BFI. When
the same NFA equation was used in the BFI, the resulting mean volume was still higher at 26
m3/ha. The difference between the two estimates may be due to differences in sample design
and/or some growth between the two periods.
Among the five zones, the Sundarban zone has the highest volume density followed by Coastal
zone (Figure 5.1; Table 5.3). However, the Village zone has the highest total tree volume due to
its extent, containing 222 million m3.
Among the 33 land cover classes, there are 22 which have trees (Table 5.4). The Mangrove
Plantation and Mangrove Forest have the highest volume density (Table 5.4). Tree Orchards and
Rural Settlement volume densitites are also substantial. In terms of total volume, the Rural
Settlement and Hill Forest are the highest.
TOF are an important resource in Bangladesh however there was previously no national level
estimate to quantify the growing stock until now. Although the volume density in Forest was 3
times greater than TOF, TOF have almost two times more total gross volume than Forest.
Highlights
- 58% of the country’s total gross tree volume (m3) occurs in the Village zone followed by
20% in the Hill zone (Figure 5.2).
- The Sundarban zone volume (m3/ha) is 3.4 times higher than the national average and
more than 4.6 times higher than the Village zone.
- Notably high volume densities within zones include Mangrove Plantation (Coastal),
Forest Plantation (Hill zone) and Plain Land Forest (Village zone).
- TOF accounts for 66% of the country’s total tree gross volume.

107
Figure 5.1. Spatial distribution of gross growing stock volume.

108
Zone Volume (m3/ha) Total volume (million m3) Sampling error (±%)
Coastal 50.08 25.55 22.80
Hill 47.69 79.12 18.75
Sal 34.17 17.84 17.03
Sundarban 97.75 39.44 12.36
Village 21.44 221.98 10.85
National 28.54 383.92 7.67
Table 5.3. Gross tree volume by zone.
7%
20%
5%
10%
58%
Coastal
Hill
Sal
Sundarban
Village
Figure 5.2. Percent total gross tree volume by zone.

109
Land Cover Classes Volume (m3/ha)
Total volume (1000 m3)
Distribution of volume by zone (m3/ha)
CZ HZ SZ SuZ VZ
Forest
Mangrove Forest 97.85 39,436.74 97.85
Mangrove Plantation 88.63 14,614.60 88.63
Plain Land Forest (Sal Forest) 84.10 3,546.79 82.22 104.22
Hill Forest 82.77 51,232.49 83.77 5.89
Forest Plantation 65.95 6,188.85 83.14 45.15
Rubber Plantation 51.68 2,566.93 36.53 81.00
Shrubs with scattered trees 23.47 13,408.02 104.41 23.35 13.67
Bamboo Forest 0.65 3.25 0.65
Total Forest 67.21 130,997.70 88.75 55.21 64.07 97.85 34.22
Other Land (TOF)
Rural Settlement 66.58 192,526.60 85.97 50.31 52.07 67.04
Orchards and Other Plantations (Trees) 56.84 11,266.76 25.69 64.36 58.14
Built-Up Non-Linear 37.54 3,126.53 58.24 4.45 40.41
Orchards and Other Plantations (Shrub) 36.85 3,595.71 29.51 99.06
River Banks 17.82 421.10 62.21 16.10 7.83 6.96
Swamp Reed Land 15.00 149.03 15.00
Ponds 13.42 108.09 46.80
Shifting Cultivation 9.27 283.28 9.27
Multiple Crop 5.86 18,657.42 2.42 10.54 7.92 5.78
Single Crop 4.91 22,285.83 2.17 8.29 10.70 4.73
Brickfield 3.20 80.99 3.30
Fresh Water Aquaculture 2.82 316.52 16.1 2.47
Herb Dominated Area 1.31 75.34 0.70 1.48
Sand 0.24 33.11 0.24
Total Other Land (TOF) 21.99 252,926.30 31.39 23.39 27.04 7.83 21.42
Table 5.4. Gross tree volume by zone and land cover class, ranked by volume (m3/ha).

110
Growingstocksbydiameterclassandheightclass
Description
Tree diameters were grouped into 10 classes, and there were few trees having more than 100 cm
DBH. The highest volume density occurs in the 10 ‐ <20 cm DBH class and was closely followed by
the 20 ‐ <30 class (Figure 5.3; Table 5.6). The greatest proportion of growing stock density within
the first two classes was found in the Sundarban zone, however it was more equally distributed
among zones for larger classes. In the Sal zone there are no trees having ≥80 cm DBH. However,
Hill, Sundarban and Village zones have trees in all diameter classes.
Tree heights were also grouped into 10 classes. Growing stock density reached a maximum in the
10‐<15 m height class indicating higher occurrence of trees in this class (Figure 5.4; Table 5.7).
Similar to DBH classes, the Sundarban zone has the highest growing stock in the lower height
classes. The height range 10‐<20m has maximum volume density in all zones except Sundarban.
Highlights
‐ Trees with DBH < 40 cm make up 80% of the total tree volume.
‐ Nearly 90% of the total volume is made up of trees with heights less than 20m.
‐ The Sundarban zone has comparatively higher DBH trees due to the presence of species
such as H. fomes and E. agallocha (Section 5.1.1).
Figure 5.4. Growing stock by height class and zone.
Figure 5.3. Growing stock by DBH class and zones.

111
DBH class Volume (m3/ha)
Total volume (million m3)
Distribution of GS by Zone (m3/ha)
CZ HZ SZ SuZ VZ
10-<20 8.76 117.87 14.02 9.42 9.95 56.16 6.49
20-<30 8.60 115.77 18.18 10.18 13.46 29.88 6.81
30-<40 4.67 62.84 11.35 6.02 5.19 5.36 4.074
40-<50 2.44 32.88 3.89 4.71 3.48 2.12 1.97
50-<60 1.26 16.95 1.50 3.41 1.46 1.02 0.90
60-<70 0.73 9.80 0.62 2.61 0.54 0.78 0.44
70-<80 0.57 7.73 0.33 2.23 0.09 0.39 0.35
80-<90 0.40 5.41 0.12 2.42 0.34 0.12
90-<100 0.19 2.56 0.07 0.64 0.47 0.12
≥ 100 0.90 12.11 6.06 1.23 0.15
Table 5.6. Growing stock by DBH class and zones.
Height class
Volume (m3/ha)
Total volume (million m3)
Distribution of GS by Zone (m3/ha)
CZ HZ SZ SuZ VZ
<5 0.32 4.30 0.42 0.21 0.60 0.84 0.30
5-<10 4.98 67.00 5.51 5.19 8.35 23.72 4.02
10-<15 11.32 152.19 18.05 12.55 14.16 50.98 9.10
15-<20 7.80 104.94 16.36 11.93 8.75 20.19 6.19
20-<25 2.49 33.54 9.63 6.68 1.87 1.96 1.52
25-<30 0.66 8.89 0.02 3.62 0.32 0.26
30-<35 0.40 5.41 0.02 3.01 0.08 0.04
35-<40 0.38 5.11 3.04 0.01
40-<45 0.15 1.98 0.07 1.16 0.04
≥ 45 0.04 0.55 0.30 0.06 0.00
Table 5.7. Gross volume by height class and zone.
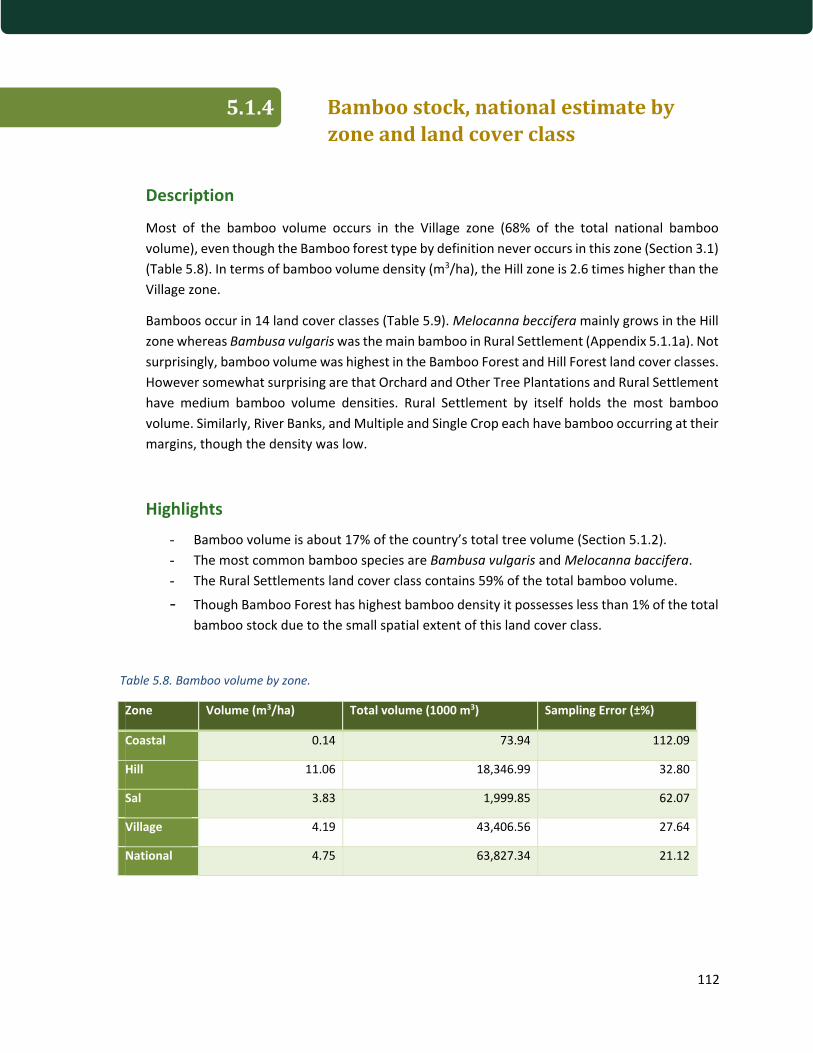
112
Bamboostock,nationalestimatebyzoneandlandcoverclass
Description
Most of the bamboo volume occurs in the Village zone (68% of the total national bamboo
volume), even though the Bamboo forest type by definition never occurs in this zone (Section 3.1)
(Table 5.8). In terms of bamboo volume density (m3/ha), the Hill zone is 2.6 times higher than the
Village zone.
Bamboos occur in 14 land cover classes (Table 5.9). Melocanna beccifera mainly grows in the Hill
zone whereas Bambusa vulgaris was the main bamboo in Rural Settlement (Appendix 5.1.1a). Not
surprisingly, bamboo volume was highest in the Bamboo Forest and Hill Forest land cover classes.
However somewhat surprising are that Orchard and Other Tree Plantations and Rural Settlement
have medium bamboo volume densities. Rural Settlement by itself holds the most bamboo
volume. Similarly, River Banks, and Multiple and Single Crop each have bamboo occurring at their
margins, though the density was low.
Highlights
- Bamboo volume is about 17% of the country’s total tree volume (Section 5.1.2).
- The most common bamboo species are Bambusa vulgaris and Melocanna baccifera. - The Rural Settlements land cover class contains 59% of the total bamboo volume.
- Though Bamboo Forest has highest bamboo density it possesses less than 1% of the total
bamboo stock due to the small spatial extent of this land cover class.
Table 5.8. Bamboo volume by zone.
Zone Volume (m3/ha) Total volume (1000 m3) Sampling Error (±%)
Coastal 0.14 73.94 112.09
Hill 11.06 18,346.99 32.80
Sal 3.83 1,999.85 62.07
Village 4.19 43,406.56 27.64
National 4.75 63,827.34 21.12

113
Land Cover Classes Volume (m3/ha) Total volume (m3)
ForestBamboo Forest 26.15 131,288.11
Hill Forest 23.86 14,765,782.74
Shrubs with scattered trees 3.25 1,855,935.83
Forest Plantation 1.1 103,623.90
Total Forest 8.95 16,856,630.58
Other Land (TOF)
Orchards and Other Plantations (Trees) 15.65 3,102,210.05
Rural Settlement 13 37,598,496.21
Shifting Cultivation 8.09 247,098.94
River Banks 4.06 96,016.18
Plain Land Forest (Sal Forest) 1.33 56,148.94
Single Crop 0.77 3,518,343.13
Multiple Crop 0.72 2,286,961.29
Sand 0.31 43,616.13
Fresh Water Aquaculture 0.16 17,915.60
Orchards and Other Plantations (Shrub) 0.04 3,904.11
Total Other Land (TOF) 3.65 46,970,710.58
Photo: Bamboo rafting, Kassalong, Rangamati,
©Iqbal Z.
Table 5.9. Bamboo volume by land cover class.

114
Treebiomass
Abovegroundbiomassbyspecies
Description
Certain tree species dominate their respective zones. Here, the top five species in
aboveground biomass in each zone were ranked (Table 5.10). The local names of the most
dominant species per zone are well recognized by the people living within them – Keora
(Coastal), Shegun (Hill), Kanthal (Sal), Sundri (Sundarban), and Mahagoni (Village).
Biomass will often show the same patterns of spatial distribution as volume. For example,
similar to volume, H. fomes has the highest above ground biomass in the Sundarban (Table
5.10). S. mahagoni was the highest introduced species, occurring mostly in the Village zone.
E. agallocha was a top five species in both the Coastal and Sundarban zones. Aboveground biomass estimates for all species can be found in the Appendix 5.2.1.
Highlights
- H. fomes and S. apetala each dominate in their respective zones, having 4.0 and 2.4
times higher biomass than any other species in their respective zones.
- M. indica is a top species in both the Sal and Village zones, indicating its popularity as a planted tree.
- In contrast to other zones, no single species in the Village and Sal zones dominated
as species there are more evenly distributed and diverse (see Section 4).

115
Species Local name AGB (t/ha)
Coastal
Sonneratia apetala Keora 20.52
Samanea saman Rain tree 5.14
Areca catechu Supa 4.27
Cocos nucifera Narikel 2.24
Excoecaria agallocha Gewa 2.21
Hill
Tectona grandis Shegun 5.74
Gmelina arborea Gamar 1.45
Albizia procera Sada koroi 1.25
Dipterocarpus alatus Dholi Garjan 1.24
Acacia auriculiformis Akashmoni 1.03
Sal
Artocarpus heterophyllus Kanthal 7.72
Hevea brasiliensis Rubber 6.42
Borassus flabellifer Tali 6.37
Shorea robusta Sal 5.73
Mangifera indica Aam 5.27
Sundarbans
Heritiera fomes Sundri 56.01
Excoecaria agallocha Gewa 23.17
Avicennia officinalis Baen 5.70
Ceriops decandra Goran 4.72
Xylocarpus mekongensis Passur 2.80
Village
Swietenia mahagoni Mahagoni 2.21
Mangifera indica Aam 2.08
Areca catechu Supari 1.46
Cocos nucifera Narikel 1.40
Samanea saman Rain tree 1.30
National
Mangifera indica Aam 1.93
Swietenia mahagoni Mahagoni 1.90
Heritiera fomes Sundri 1.68
Areca catechu Supari 1.31
Samanea saman Rain tree 1.27
Table 5.10. Above ground biomass by species, ranked by top five occurrence in each zone.
116
Abovegroundbiomass,nationalestimatebyzoneandlandcoverclass
Description
The above ground biomass density is highest in Sundarban (98.37 t/ha) perhaps due to its high
stem density (Figure 5.5; Table 5.11; see also Section 4.1.1) and is 3.4 times higher than the
national average. Similar to tree volume, the aboveground biomass density (t/ha) is lowest in the
Village zone, yet it contains the highest total amount of biomass.
The national average aboveground biomass across the zones is 28.78 t/ha (Table 5.11). By
comparison, the national level biomass reported in the NFA was 57 t/ha (MoEF and FAO, 2007).
However, in the NFA, one common volume equation and biomass expansion factor were used for
the estimation compared to the 11 biomass equations used in the BFI. When the same NFA
equation is used in the BFI, the resulting mean volume is 88 t/ha. The difference between the
two estimates may be due to differences in sample design or some growth between the two
periods. See Appendix tables for more NFA comparisons.
Among the 22 land cover classes where trees occur, aboveground biomass density is highest in
the Mangrove Forest (Table 5.12). The Rural Settlement is highest in total stocks, containing
about 50% of the total country’s biomass.
Notably high values among land cover and zones include Mangrove Plantations (Coastal), Forest
Plantation (Hill), Rubber Plantations (Sal), and Plain Land Forest (Village).
Biomass density in Forest is three times higher than in TOF (Table 5.13). Yet, TOF have almost
two times higher total biomass.
Highlights
- TOF contain 66% of the total biomass stock.
- The Sundarban zone has the highest biomass density (t/ha), about five times higher than
the Village zone.
- Plain Land Sal Forest biomass density (t/ha) is 3.3 times higher than the national average.
- Rubber Plantation in the Sal zone have extremely high biomass density (198 t/ha).
- The highest biomass density by land cover occurring in the Hill zone is Hill Forest followed
by Forest Plantations.
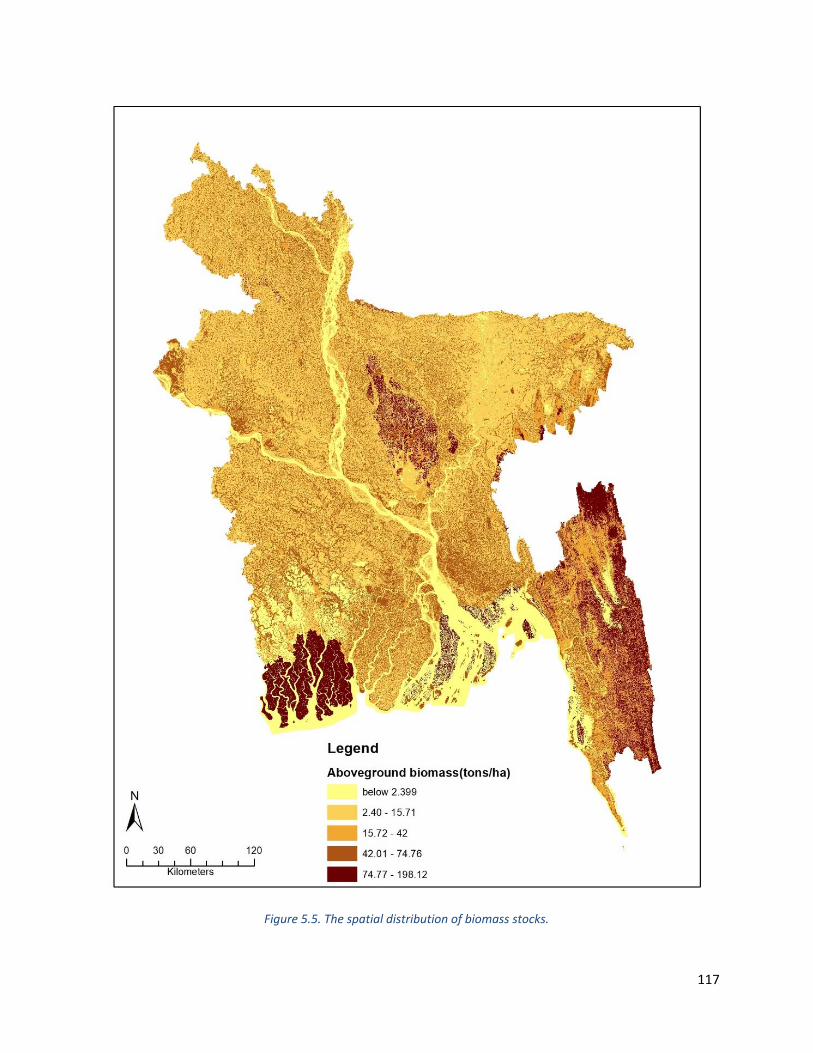
117
Figure 5.5. The spatial distribution of biomass stocks.

118
Land Cover Classes AGB (t/ha) Total AGB (1000 t) Distribution of AGB into Zones (t/ha)
CZ HZ SZ SuZ VZ
Forest
Mangrove Forest 98.34 39,633.33 98.34
Rubber Plantation 95.19 4,728.14 42 198.12
Hill Forest 82.76 51,222.09 83.38 34.79
Mangrove Plantation 74.76 12,328.46 74.76
Plain Land Forest (Sal Forest) 67.06 2,828.23 66.86 69.21
Forest Plantation 58.52 5,491.15 63.07 53.78 0
Bamboo Forest 33.15 166.39 33.15
Shrubs with scattered trees 27.06 15,459.94 87.72 27.03 12.25 0
Total Forest 67.66 131,857.73 74.86 56.11 81.32 98.34 42.67
Other Land (TOF)
Orchards and Other Plantations (Trees) 70.41 13,957.97 23.15 135.99 64.43
Rural Settlement 66.27 19,1622.1 77.96 50.97 101.46 64.22
Ponds 31.52 253.87 109.91 0
Orchards and Other Plantations (Shrub) 28.06 2,738.23 22.86 72.11
Built-Up Non-Linear 25.4 2,115.74 45.46 11.57 26.12
Table 5.12. Above ground biomass by land cover class and zone.
Zone AGB (t/ha) Total AGB (million t) Sampling Error (±%)
Coastal 43.63 22.26 20.25
Hill 48.32 80.15 14.27
Sal 59.43 31.03 17.14
Sundarban 98.37 39.69 8.18
Village 20.66 213.97 10.12
National 28.78 387.09 6.63
Table 5.11. Above ground biomass by zones.

119
Land Cover Classes AGB (t/ha) Total AGB (1000 t) Distribution of AGB into Zones (t/ha)
CZ HZ SZ SuZ VZ
Other Land (TOF)
Swamp Reed Land 25.37 252.05 25.37
Shifting Cultivation 24.28 741.70 24.28
River Banks 19.12 451.94 56 41.65 5.86
Multiple Crop 5.9 18,778.67 2.4 10.66 15 5.5
Single Crop 5.24 23,819.92 2.19 8.43 24.41 4.76
Fresh Water Aquaculture 2.59 291.37 15.71 2.25
Herb Dominated Area 1.79 102.91 0 1.74 1.97
Brickfield 1.62 41 0 1.67
Sand 0.45 62.48 0.45
Brackish Water Aquaculture 0.03 1.13 0.03
Mud Flats or Intertidal Area 0.03 0.67 0.03 0
Total Other Land (TOF) 22.19 255,231.80 28.53 23.14 54.21 0.00 20.64
Photo: Oven dried leaf, Nutrient dynamics lab, Khulna University,
©Mondal F.K.

120
Deadwoodbiomassandpotentialfuelwood
Description
Dead wood and litter biomass is important to ecosystem function and stores carbon (Section
5.4). It is also major source of fuel for households (see Section 9.5.1). The main pools of dead
biomass used for fuel are coarse woody debris (CWD), fine woody debris (FWD), and litter.
The dead wood biomass across the zones is 0.89 t/ha and varied greatly among zones (Table
5.14). The Sundarban zone shows the highest dead wood biomass density which is 5.7 times
higher than the national average. Low fuel wood collection, natural disasters (e.g. cyclones)
and top dying of Sundri are potential reasons for high dead wood biomass in the Sundarban
and Coastal zones. Standing dead tree and FWD biomass density is highest in Sundarban
whereas dead stump is highest in the Coastal and CWD in the Hill zone.
Dead wood and litter biomass used as fuel (CWD, FWD, litter) occurs in 22 land cover classes
among which Mangrove Plantations, Shifting Cultivation, Hill Forest, and Mangrove Forest
showed the highest biomass density (Table 5.15). The high values for Shifting Cultivation
indicate the large amounts of CWD and FWD that are left behind after cutting the trees. Hill
Forest, Rural Settlement and Shrubs with scattered trees have the highest total volume,
indicating these as major suppliers of dead wood potentially used for fuel. Notably low
amounts are found near urban areas and areas surrounding the Sundarban (Figure 5.6).
Highlights
‐ The Hill zone has 43% of the total dead wood and litter biomass followed by Village
zone at 26%.
‐ The high dead wood and litter biomass density in the Coastal and Sundarban zones
may indicate lower pressure from collection (e.g. more difficult access) (see Section
9.5).
‐ There is 10,326 tons of dead wood that could potentially be used for fuel (CWD, FWD,
litter) and 33% of this is supplied by Hill Forest while 25% is supplied by Rural
Settlement.
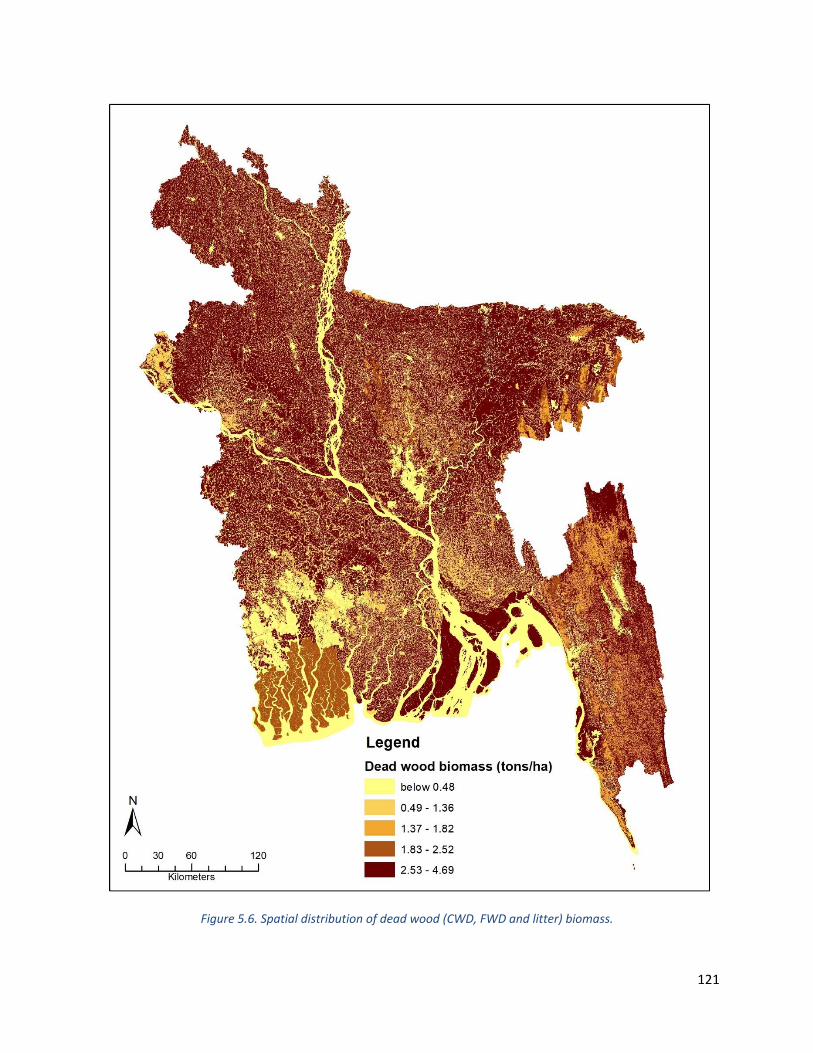
121
Figure 5.6. Spatial distribution of dead wood (CWD, FWD and litter) biomass.

122
Zone
St
andi
ng d
ead
tree
D
ead
Stum
p CW
D
FWD
Li
tter
A
ll D
ead
Biom
ass
(t/h
a)
Tota
l Dea
d Bi
omas
s (M
illio
n t)
Biomass
(t/ha)
SE
(±%)
Biomass
(t/ha)
SE (±%
) Biomass
(t/ha)
SE (±%
) Biomass
(t/ha)
SE
(±%)
Biomass
(t/ha)
SE
(±%)
Coas
tal
0.69
73.27
0.16
61.53
0.66
89.96
0.92
23.27
0.11
36.80
2.43
1.24
Hill
0.50
72.43
0.10
27.82
1.23
45.43
1.24
6.00
0.57
10.69
3.06
5.08
Sal
0.23
72.35
0.02
105.98
0.01
195.87
0.64
15.38
0.33
25.12
0.89
0.46
Sund
arba
n 3.03
26.48
0.11
53.70
0.42
35.14
1.54
5.93
0.32
15.72
5.10
2.06
Vill
age
0.05
34.44
0.01
43.58
0.01
111.90
0.23
14.62
0.05
19.12
0.30
3.10
Nat
iona
l 0.23
24.75
0.03
21.33
0.19
37.57
0.44
6.67
0.14
8.36
0.89
11.93
Tabl
e 5.
14. D
ead
biom
ass
and
stan
dard
err
ors
by z
one.

123
Land Cover Class CWD, FWD and Litter
(t/ha)
Total (t) Distribution of CWD, FWD, and Litter into zones (t/ha)
CZ HZ SZ SuZ VZ
Forest
Hill Forest 5.16 3407.78 5.18 4.27
Shrubs with scattered trees
1.82 986.66 1.07 1.83 0.67 0
Mangrove Forest 2.28 919.62 2.28
Mangrove Plantation 3.49 579.23 3.49
Forest Plantation 2.25 222.05 2.57 1.92 0
Rubber Plantation 1.93 108.03 2.09 1.64
Plain Land Forest (Sal Forest)
1.97 80.72 2.01 1.00
Bamboo Forest 2.28 12.67 2.28
Total Forest 0.0034 6316.76 3.11 3.55 1.86 2.28 0.89
Other Land (TOF)
Rural Settlement 0.93 2586.83 2.14 1.41 1.29 0.85
Single Crop 0.12 579.95 0.18 0.65 0.44 0.10
Multiple Crop 0.10 341.77 0.06 0.55 0.34 0.09
Orchards and Other Plantations (Trees)
1.13 233.77 1.95 1.78 0.95
Orchards and Other Plantations (Shrub)
1.57 157.17 1.64 0.76
Shifting Cultivation 1.94 51.14 1.94
Built-Up Non-Linear 0.34 32.09 1.60 0.26 0.30
River Banks 0.38 8.46 1.75 0 0.06
Fresh Water Aquaculture
0.06 7.62 0.05 0.06
Brackish Water Aquaculture
0.08 2.98 0.08
Swamp Reed Land 0.22 2.20 0.22
Ponds 0.24 1.92 0.83 0
Herb Dominated Area 0.03 1.65 0 0.58 0
Mud Flats or Intertidal Area
0.05 1.39 0.05 0.00
Total Other Land (TOF) 0.0003 4008.94 0.32 1.01 0.73 0.00 0.30
CZ: Coastal zone, HZ: Hill zone, SZ: Sal zone, SuZ : Sundarban zone, and V: Village zone.
Table 5.15. Dead wood biomass that could potentially be used for fuel (i.e. CWD, FWD and Litter) by land cover class and zone, ranked by total biomass.

124
Carbon
Carbonpools,nationalestimatebyzone
Description
Most of the carbon stock is contained in the top 30 cm of the soil (80%), followed by the
above ground component (15%) (Figure 5.7). The density of carbon in above ground,
below ground and dead biomass is highest in the Sundarban zone followed by the Sal
(Table 5.16).
Highlights
- Most of the national carbon stock is in the Village zone (70%, soils to 30cm depth)
due to its large spatial extent.
- Carbon density in below ground biomass is 9.6 times higher in the Sundarban zone
compared to the national average.
- The Hill zone is highest in soil carbon (up to 30 cm) and litter carbon compared to
other zones.
- In the Coastal and the Sundarbans zones soil carbon density in 100 cm depth is
more than double the 30 cm depth.
0
50
100
150
200
250
300
350
400
Coastal Hill Sal Sundarban Village National
Carb
on S
tock
(t/h
a) CLitter
CDB
CBGB
CAGB
SOC, 30cm
SOC, 100cm
Figure 5.7. Carbon stock densities in the major pools by zone (DB: dead biomass, BGB: belowground biomass, AGB: aboveground biomass, SOC: soil organic carbon for 0-30cm depth soil layer and 30-100 cm depth soil
layer). Note that soil data for 30-100cm depth was not collected in the Hill, Sal and Village zones.
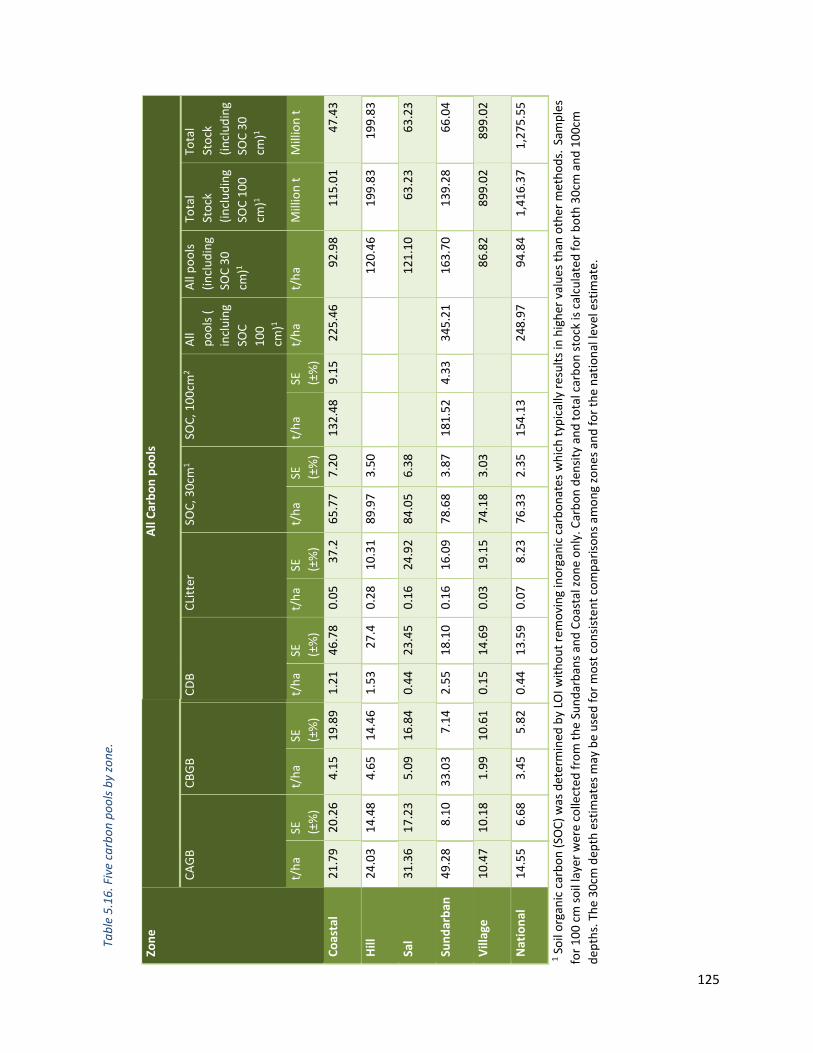
125
Zone
A
ll Ca
rbon
poo
ls
CAGB
CBGB
CDB
CLitter
SOC, 30cm
1 SO
C, 100cm
2
All
pools (
incluing
SOC
100
cm)1
All pools
(including
SOC 30
cm)1
Total
Stock
(including
SOC 100
cm)1
Total
Stock
(including
SOC 30
cm)1
t/ha
SE
(±%)
t/ha
SE
(±%)
t/ha
SE
(±%)
t/ha
SE
(±%)
t/ha
SE
(±%)
t/ha
SE
(±%)
t/ha
t/ha
Million t
Million t
Coas
tal
21.79
20.26
4.15
19.89
1.21
46.78
0.05
37.2
65.77
7.20
132.48
9.15
225.46
92.98
115.01
47.43
Hill
24.03
14.48
4.65
14.46
1.53
27.4
0.28
10.31
89.97
3.50
120.46
199.83
199.83
Sal
31.36
17.23
5.09
16.84
0.44
23.45
0.16
24.92
84.05
6.38
121.10
63.23
63.23
Sund
arba
n 49.28
8.10
33.03
7.14
2.55
18.10
0.16
16.09
78.68
3.87
181.52
4.33
345.21
163.70
139.28
66.04
Vill
age
10.47
10.18
1.99
10.61
0.15
14.69
0.03
19.15
74.18
3.03
86.82
899.02
899.02
Nat
iona
l 14.55
6.68
3.45
5.82
0.44
13.59
0.07
8.23
76.33
2.35
154.13
248.97
94.84
1,416.37
1,275.55
1 Soil organic carbon (SO
C) was determined
by LO
I without removing inorganic carbonates which typically results in higher values than
other m
ethods. Sam
ples
for 100 cm soil layer were collected
from the Sundarbans and Coastal zone only. Carbon den
sity and total carbon stock is calculated for both 30cm
and 100cm
dep
ths. The 30cm
dep
th estim
ates m
ay be used for most consisten
t comparisons am
ong zones and for the national level estim
ate.
Tabl
e 5.
16. F
ive
carb
on p
ools
by
zone
.

126
Carbonpoolsbyadministrativedivision
Description
Administrative divisions are often used for policy and planning purposes. The five carbon
pools were summarized by administrative units for the purpose that planners may
understand the status of carbon stocks in their divisions and use the information as a
baseline for climate change policies. Overall, the carbon densities are higher where there
are more forests. For example, in Chittagong and Khulna where the Mangrove and Hill Forest
is common (Table 5.17).
Highlights
- The Khulna division has the highest carbon stocks by density, and Rangpur has the
lowest.
- The total carbon stocks are highest in Chittagong and Khulna divisions which
together have 38% of the total carbon stock.
Division Carbon density by pool (t/ha)
CAGB CBGB CDB CLitter SOC, 30
cm1
Total
Mean Total (million t)
Barisal 24.61 4.62 0.72 0.06 69.83 99.85 89.91
Chittagong 20.46 3.93 1.03 0.18 79.37 104.97 284.05
Dhaka 13.97 2.51 0.21 0.06 73.57 90.33 152.86
Khulna 18.84 8.47 0.61 0.06 79.80 107.77 203.82
Mymensingh 10.12 1.88 0.06 0.02 73.50 85.57 81.83
Rajshahi 11.20 1.94 0.14 0.03 66.90 80.21 137.98
Rangpur 8.36 1.70 0.14 0.02 65.29 75.52 160.18
Sylhet 6.83 1.24 0.21 0.03 101.79 110.12 164.91
1 Soil organic carbon (SOC) was determined by LOI without removing inorganic carbonates which typically results
in higher values than other methods. Samples for 100 cm soil layer were collected from the Sundarbans and
Coastal zone only. The 30cm depth estimates may be used for most consistent comparisons among divisions.
Table 5.17. Five carbon pools by administrative division.

127
TotalCarbonbyzoneandlandcover class
Description
Total carbon includes the five carbon pools ‐ aboveground, belowground, deadwood, litter,
and soil to 30cm depth. Generally speaking, total carbon is mostly concentrated in the
forested areas of the country and varied widely, ranging from 14.6 t/ha in Sand to 176.6 t/ha
in Bamboo Forest (Figure 5.8; Table 5.18). Especially large and extensive amounts of carbon
are found in the Mangrove Forest and Hill Forest. The large area of Multiple and Single Crop
and Rural Settlement resulted in their high total carbon stocks.
Highlights
- Forest areas hold 21.5% of the total carbon stock in the country. Hill forest and
Mangrove forest alone hold 9.7% and 5.2% of the total, respectively.
- Multiple and Single Crop and Rural Settlement together hold 72.4% of the total
carbon stock in the country.
Photo: Royal Bengal Tiger, The Sundarban, ©FD

128
Figure 5.8. Spatial distribution of all five carbon pools (SOC to 30cm).
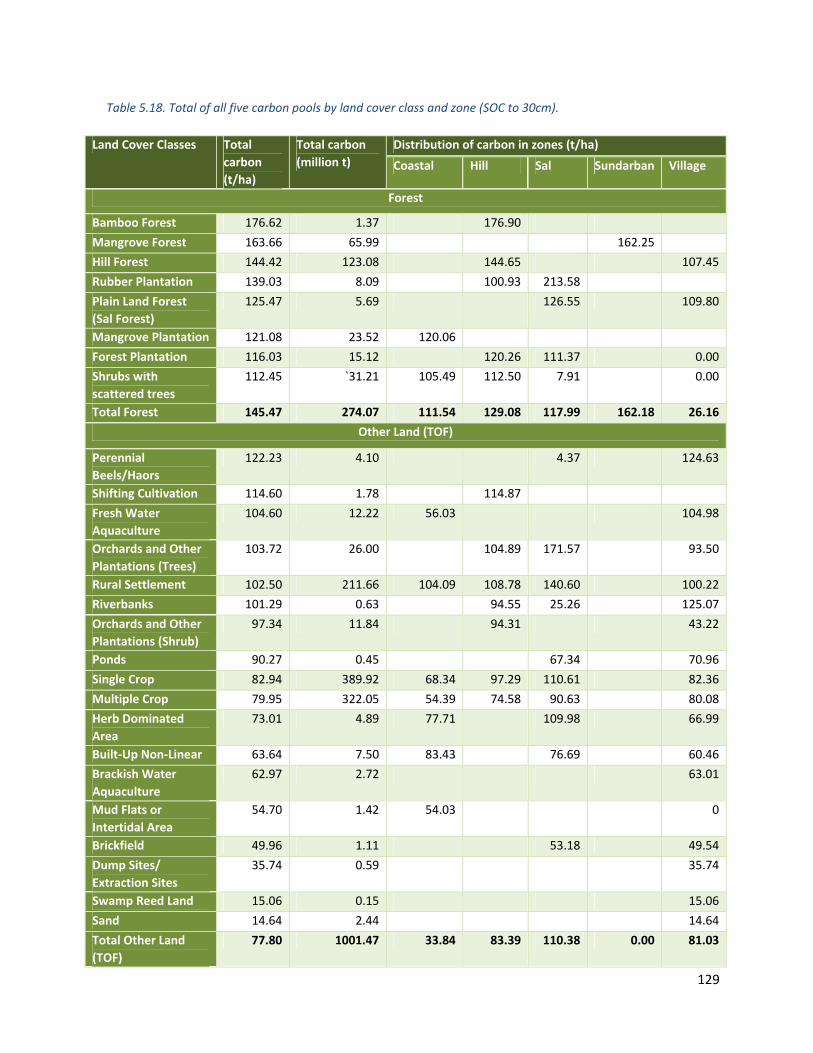
129
Land Cover Classes Total carbon (t/ha)
Total carbon (million t)
Distribution of carbon in zones (t/ha)
Coastal Hill Sal Sundarban Village
Forest
Bamboo Forest 176.62 1.37 176.90
Mangrove Forest 163.66 65.99 162.25
Hill Forest 144.42 123.08 144.65 107.45
Rubber Plantation 139.03 8.09 100.93 213.58
Plain Land Forest (Sal Forest)
125.47 5.69 126.55 109.80
Mangrove Plantation 121.08 23.52 120.06
Forest Plantation 116.03 15.12 120.26 111.37 0.00
Shrubs with scattered trees
112.45 `31.21 105.49 112.50 7.91 0.00
Total Forest 145.47 274.07 111.54 129.08 117.99 162.18 26.16
Other Land (TOF)
Perennial Beels/Haors
122.23 4.10 4.37 124.63
Shifting Cultivation 114.60 1.78 114.87
Fresh Water Aquaculture
104.60 12.22 56.03 104.98
Orchards and Other Plantations (Trees)
103.72 26.00 104.89 171.57 93.50
Rural Settlement 102.50 211.66 104.09 108.78 140.60 100.22
Riverbanks 101.29 0.63 94.55 25.26 125.07
Orchards and Other Plantations (Shrub)
97.34 11.84 94.31 43.22
Ponds 90.27 0.45 67.34 70.96
Single Crop 82.94 389.92 68.34 97.29 110.61 82.36
Multiple Crop 79.95 322.05 54.39 74.58 90.63 80.08
Herb Dominated Area
73.01 4.89 77.71 109.98 66.99
Built-Up Non-Linear 63.64 7.50 83.43 76.69 60.46
Brackish Water Aquaculture
62.97 2.72 63.01
Mud Flats or Intertidal Area
54.70 1.42 54.03 0
Brickfield 49.96 1.11 53.18 49.54
Dump Sites/ Extraction Sites
35.74 0.59 35.74
Swamp Reed Land 15.06 0.15 15.06
Sand 14.64 2.44 14.64
Total Other Land (TOF)
77.80 1001.47 33.84 83.39 110.38 0.00 81.03
Table 5.18. Total of all five carbon pools by land cover class and zone (SOC to 30cm).

130
Soilcarbonbyzoneandlandcoverclass
Description
SOC density varies by zone and soil layer. The Hill
zone shows highest SOC density up to 30cm depth
whereas the lowest SOC density is in the Coastal
zone (Table 5.19; Figure 5.10).
Highlights
- The decrease of SOC from 0‐15cm to 15‐30
cm is highest in the Hill, Village, and
Coastal zones (Figure 5.9).
- SOC in the Sundarban zone is about 49 t/ha
higher than the Coastal zone in the 30 to
100 cm.
- Among Forest land cover classes, Bamboo
Forest shows the highest SOC density
(Table 5.20).
Figure 5.9. Soil carbon (g/cm3) by depth and by zone. Error bars indicate the stand error of the estimate.
Zone SOC density and stock distributed into different soil depth
0‐15 cm 15‐30 cm 0‐30 cm 30‐100 cm
Mean
(t/ha)
Total
(million
t)
SE Mean
(t/ha)
Total
(million
t)
SE Mean
(t/ha)
Total
(million t)
SE Mean
(t/ha)
Total
(million
t)
SE
Coastal 34.25 17.47 8.41 31.52 16.08 7.72 65.77 33.55 7.20 132.48 67.58 9.15
Hill 47.21 78.31 3.40 42.76 70.93 3.93 89.97 149.24 3.50
Sal 42.83 22.36 6.74 41.22 21.52 6.94 84.05 43.89 6.38
Sundarban 39.86 16.08 4.43 38.82 15.66 4.02 78.68 31.74 3.87 181.52 73.24 4.33
Village 39.16 405.48 2.98 35.02 362.69 3.39 74.18 768.17 3.03
National 40.13 539.70 2.33 36.20 486.87 2.63 76.33 1,026.59 2.35 154.13 140.82 2.43
Soil organic carbon (SOC) was determined by LOI without removing inorganic carbonates which typically results in higher values
than other methods. Samples for 100 cm soil layer were collected from the Sundarbans and Coastal zone only.
Table 5.19. Soil carbon by depth and zone.
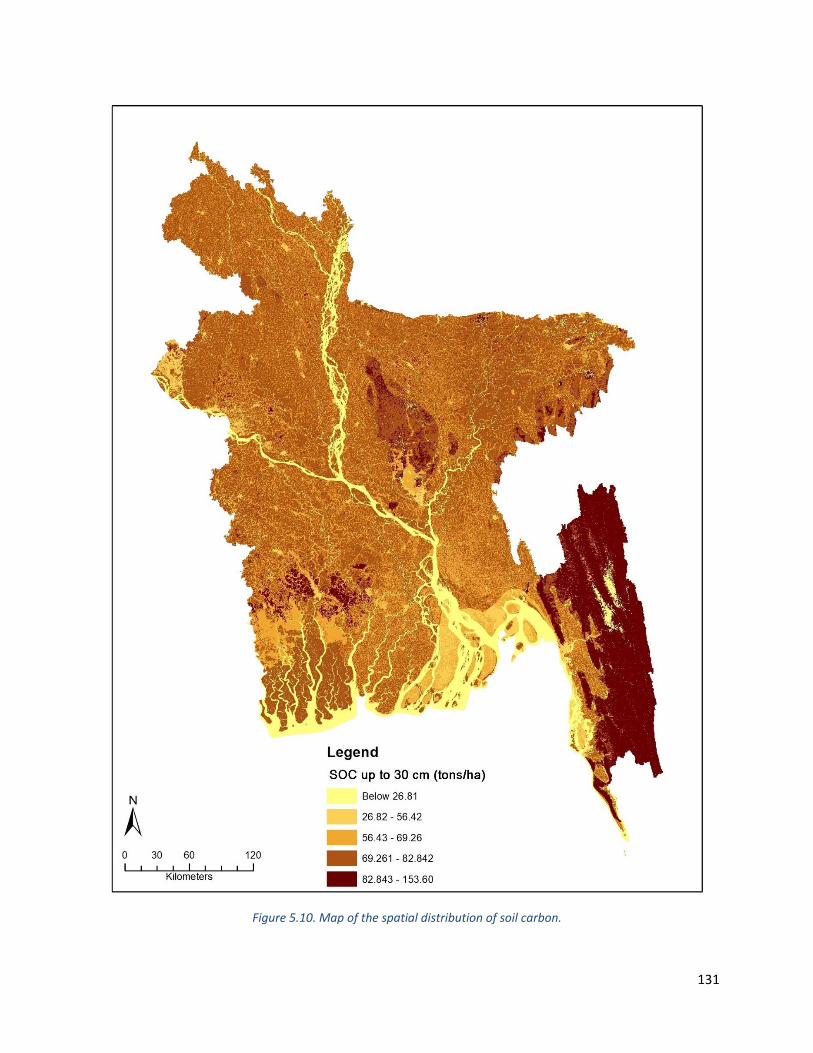
131
Figure 5.10. Map of the spatial distribution of soil carbon.

132
Land cover class Number of plots
Distribution of SOC (t/ha) by layer (cm)
SOC to 30cm (t/ha)
Total SOC to 30 cm (million t)
0‐15 15‐30 30‐100
Forest
Bamboo Forest 1 79.04 74.56 153.60 1.26
Shrubs with scattered trees
34 49.23 46.10 95.33 21.45
Hill Forest 214 48.57 43.15 91.72 90.37
Plain Land Forest (Sal Forest)
9 40.53 41.54 82.07 3.86
Rubber Plantation 11 43.15 37.73 80.88 5.20
Forest Plantation 26 42.06 38.62 80.68 11.80
Mangrove Forest 167 39.86 38.82 181.52 78.68 31.74
Mangrove Plantation 35 38.41 35.44 160.00 73.84 15.73
Total Forest 497 46.28 42.76 43.43 89.04 181.41
Other Land (TOF)
Perennial Beels/Haors 3 66.28 55.96 122.23 4.10
Fresh Water Aquaculture 15 57.24 45.79 79.50 103.02 12.04
Shifting Cultivation 5 53.33 45.43 98.76 1.30
Riverbanks 4 48.33 40.60 88.94 0.33
Orchards and Other Plantations (Shrub)
17 41.54 38.87 80.42 10.19
Single Crop 434 41.67 38.03 123.42 79.71 375.24
Multiple Crop 442 40.20 36.13 99.86 76.34 310.54
Herb Dominated Area 10 38.42 33.50 127.28 71.92 4.83
Ponds 1 40.66 30.30 70.96 0.30
Brackish Water Aquaculture
5 35.94 26.97 62.91 2.72
Rural Settlement 204 32.98 28.97 102.82 61.95 94.45
Orchards and Other Plantations (Trees)
34 32.68 27.87 60.56 17.44
Mud Flats or Intertidal Area
5 27.32 26.66 121.97 53.99 1.41
Brickfield 3 27.60 21.41 49.02 1.09
Built-Up Non-Linear 15 26.22 22.16 48.38 6.22
Dump Sites/ Extraction Sites
1 15.39 20.35 35.74 0.59
Sand 13 7.69 6.65 14.35 2.40
Total Other Land (TOF) 1211 34.20 30.56 41.49 64.77 845.19
Soil organic carbon (SOC) was determined by LOI without removing inorganic carbonates which typically results
in higher values than other methods. Samples for 30‐100 cm soil layer were collected from the Sundarbans and
Coastal zones only.
Table 5.20. Soil carbon by depth and land cover class.

133
Soilpropertiesbylandcoverclass
Description
Soil carbon was not the only soil
property measured in the BFI. Texture,
pH, and Salinity (EC, electric
conductivity) were also measured and
can give an indication of the quality of
soils for certain land cover classes. Soil
texture sampled were collected for all
soils and depths. In contrast, pH and EC
were only measured in the Coastal and
Sundarban zones (Table 5.21).
Highlights
- Sandy soils occur in land cover
classes typically occurring in
hilly areas such as Bamboo
Forest, Hill Forest, and Shifting
Cultivation.
- EC is noticeably higher, i.e.
more saline, in the Mangrove
forest compared to the
Mangrove Plantation.
- Shrubs with scattered trees and
Salt Pans have soils with the
lowest pH, i.e. most acidic.
Photo: River Kingfisher, The Sundarban, ©Mondal F.K.

134
Land Cover Classes Texture (%) pH in different soil depth (cm)
Salinity (mS/cm in different depth (cm)
sand silt clay 0‐15 15‐30 30‐100 0‐15 15‐30 30‐100
ForestMangrove Forest 2.28 50.67 47.05 7.43 7.48 7.34 2.82 2.58 2.90
Mangrove Plantation 3.90 56.96 39.14 7.47 7.62 7.73 1.88 1.67 1.63
Bamboo Forest 42.93 19.63 37.45
Plain Land Forest (Sal Forest) 29.58 40.96 29.47
Shrubs with scattered trees 51.37 23.44 25.19
Forest Plantation 48.89 27.46 23.64
Rubber Plantation 52.38 25.43 22.20
Hill Forest 58.96 20.01 21.03
Total Forest 41.90 29.34 28.72 7.40 7.46 7.30 2.68 2.44 2.72
Other Land (TOF)Brackish Water Aquaculture 6.65 52.19 41.16
Fresh Water Aquaculture 27.31 35.76 36.93 8.10 8.18 8.18 0.87 0.66 0.53
Herb Dominated Area 34.53 33.10 32.36 7.18 7.31 7.37 2.42 1.44 1.24
Single Crop 37.38 35.27 27.35 7.49 7.54 7.70 0.34 0.37 0.41
Perennial Beels/Haors 62.46 10.43 27.11
Ponds 52.49 20.69 26.83
Multiple Crop 40.04 35.12 24.84 7.34 7.48 7.59 0.29 0.25 0.28
Orchards and Other Plantations (Shrub)
55.77 20.23 24.01
Shifting Cultivation 59.99 16.23 23.79
Rural Settlement 36.24 40.39 23.37 7.24 7.54 7.63 0.56 0.46 0.39
Mud Flats or Intertidal Area 5.22 72.68 22.11 7.56 7.64 7.77 1.10 0.95 0.78
Orchards and Other Plantations (Trees)
42.92 35.67 21.42
Riverbanks 45.46 34.93 19.61
Brickfield 56.1 25.73 18.18
Built-Up Non-Linear 59.88 25.56 14.56 7.37 7.49 0.57 0.27
Sand 72.99 20.02 7.00
Dump Sites/ Extraction Sites 96.43 1.63 1.95
Total Other Land (TOF) 38.19 36.44 25.37 7.30 7.44 7.54 0.54 0.48 0.45
Samples for pH, salinity, and 30‐100 cm soil layer were collected from the Sundarbans and Coastal zones only.
Table 5.21. Soil properties by depth and land cover class.

135
136
Criteria 4 - Management and ownership

137
Phot
o: A landscape of hill forest, ©
Mon
dal F
.K.

138
Criteria 4
Forest management and ownership
Section Highlights In 23% of the land in Bangladesh, some form of management is observed (e.g. Homestead
Forestry, Orchard, Tea garden, etc.).
Several types of plantation management (e.g. coastal, rubber, strip and woodlot plantations)
account for 50% of managed areas.
Aboveground carbon is about two or three times higher on FD land compared to other
ownership types.
Private lands are the major supplier of tree and forest products in the form of energy,
materials, and nutrition according to respondents of the socio‐economic survey.
Introduction
Tree and forest resources are better understood when knowing who owns them and how they are
managed. Both the biophysical and socio‐economic surveys provide estimates about the relative
types of management and ownership, and the types of services they provide. This criterion looks
at the extent and types of forest management. It answers questions such as what is the area of
management activities, and what is the status of ownership of tree and forest land? In general,
Bangladesh is highly managed and diversified in the types of management. Monoculture
plantations occur throughout the country, but the locations and types of plantations (tea gardens,
woodlots, strip plantations, orchards, etc.) vary substantially.
Section 6

139
Methods
The managed forest area refers to any vegetated land feature which field teams observed signs of
human management. Thus, it does not directly correspond to forest land areas managed by the
FD. Vegetated land feature areas with specific management types were summed and then divided
by the total sampled area of the population of interest (Hossain Anik et al. 2019). Ownership of
the land feature was noted by field teams and the area was estimated the same way as
management type. Thus, the areas of management and ownership type are a sample‐based
estimates, meaning no maps were used. Volume, biomass, and carbon were estimated the same
as outlined in Section 5.
The land from which tree and forest products are collected by ownership type was determined by
asking respondents of the socio‐economic survey “What are the tree and forest products collected by your household?” and “What is the ownership of the land from where the product was collected?” The products collected were grouped into categories of Materials (e.g. bamboo,
timber), Energy (e.g. fuelwood, leaves), or Nutrition (e.g. fruits). The results were summarized by
the percent of households responding they collected from the specified ownership type,
regardless of the quantity of the product collected.
Photo: Deer, The Sundarban, ©Iqbal Z.
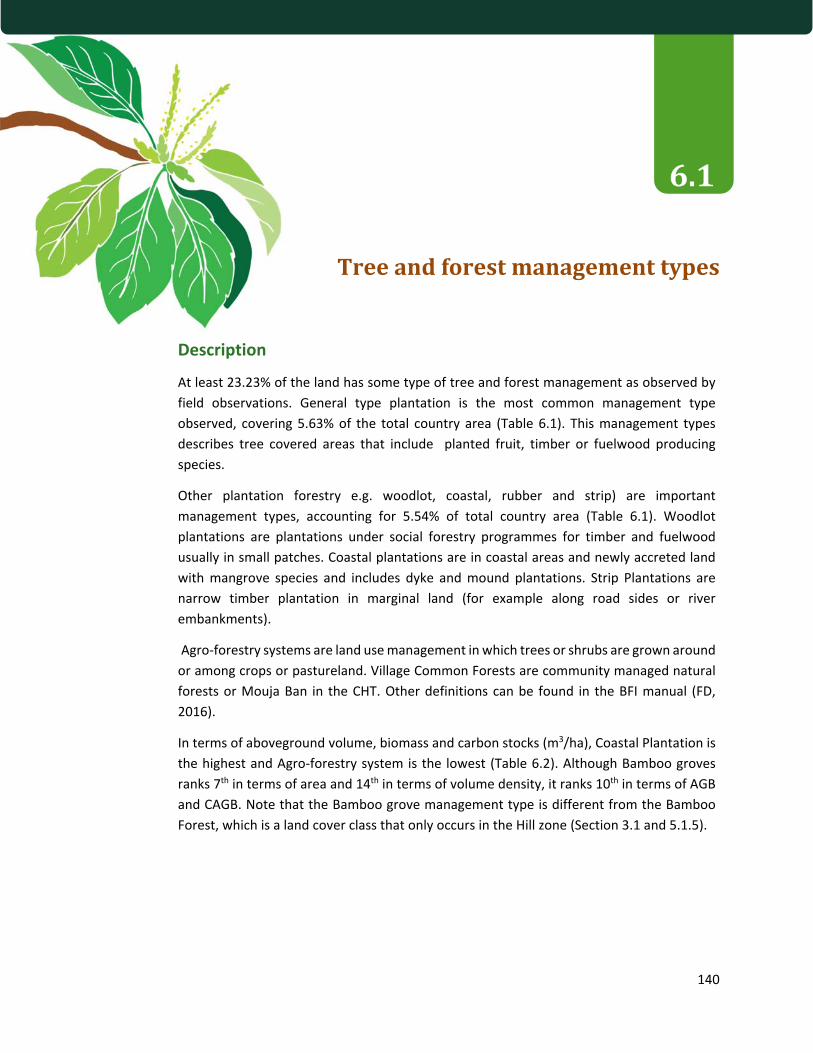
140
Treeandforestmanagementtypes
Description
At least 23.23% of the land has some type of tree and forest management as observed by
field observations. General type plantation is the most common management type
observed, covering 5.63% of the total country area (Table 6.1). This management types
describes tree covered areas that include planted fruit, timber or fuelwood producing
species.
Other plantation forestry e.g. woodlot, coastal, rubber and strip) are important
management types, accounting for 5.54% of total country area (Table 6.1). Woodlot
plantations are plantations under social forestry programmes for timber and fuelwood
usually in small patches. Coastal plantations are in coastal areas and newly accreted land
with mangrove species and includes dyke and mound plantations. Strip Plantations are
narrow timber plantation in marginal land (for example along road sides or river
embankments).
Agro‐forestry systems are land use management in which trees or shrubs are grown around
or among crops or pastureland. Village Common Forests are community managed natural
forests or Mouja Ban in the CHT. Other definitions can be found in the BFI manual (FD,
2016).
In terms of aboveground volume, biomass and carbon stocks (m3/ha), Coastal Plantation is
the highest and Agro‐forestry system is the lowest (Table 6.2). Although Bamboo groves
ranks 7th in terms of area and 14th in terms of volume density, it ranks 10th in terms of AGB
and CAGB. Note that the Bamboo grove management type is different from the Bamboo
Forest, which is a land cover class that only occurs in the Hill zone (Section 3.1 and 5.1.5).

141
Management Type Percentage of country area
Total managed area (ha) 1
Plantation (general) 5.63 757,005.4
Woodlot plantation 3.38 453,983.4
Agro-forestry system 2.90 390,428.9
Coastal plantation 1.04 140,116.3
Tea garden 0.60 80,659.9
Rubber Plantation 0.58 78,013.9
Bamboo groves 0.55 73,764.5
Strip Plantation 0.54 72,197.3
Orchard 0.49 65,478.6
Village Common Forests 0.21 27,666.0
Jhum 0.07 9,104.0
Homestead Forest 0.06 8,023.9
Urban parkland 0.04 5,019.9
Other 7.16 962,390.3
None observed 76.78 1,0326,257.0
1Sample‐based estimate based on observations from field teams.
2Urban parkland only occurred in one plot in Sreemangal of the Hill zone.
3None observed refers to the field team not finding evidence for any type of specific forest management on the
plot
Table 6.1. Percentage and area of management types ranked by area.
Highlights
- About 23.23% of the land in Bangladesh has some kind of tree and forest
management.
- Homestead gardens and orchards both have high amounts of aboveground biomass
and carbon
- Coastal plantations make up 83% of the managed area in the Coastal zone.
- Agro‐forestry systems make up 12% of the managed forest area and are located
mostly in the Village zone. Yet, volume, biomass and carbon stocks (m3/ha) are
lower in this type compared to other types.

142
Management Type Volume (m3/ha) AGB (t/ha) CAGB (t/ha)
Agro-forestry system 14.88 14.18 7.13
Bamboo groves 7.06 27.34 14.52
Coastal plantation 89.60 75.56 37.71
Homestead Forest 73.81 52.34 25.28
Jhum 35.12 35.11 17.45
None observed 23.08 23.76 12.01
Orchard 45.09 51.21 25.86
Other 82.89 79.16 40.05
Plantation (general) 62.13 63.69 32.49
Rubber Plantation 38.01 70.92 36.64
Strip Plantation 27.66 20.83 10.40
Tea garden 29.79 23.07 11.15
Urban parkland 33.06 26.50 12.74
Village Common Forests 44.33 51.03 24.92
Woodlot plantation 31.90 32.61 16.35
Table 6.2. Volume, aboveground biomass (AGB), and carbon in aboveground biomass (CAGB) by management type in m3/ha and ranked by volume.

143
Treesandforestbyownershipclass
Description
The biophysical inventory plots are a sample of the land area of the country. It is therefore
possible to estimate the area of ownership type based on the proportion of land features
which belong to specific ownerships. Government (other) refers to land owned by
governments, or by government‐owned institutions or corporations other than the Forest
Department (e.g. Railways, Water Development Board, Roads and Highways). Un‐classed
State Forest (USF) was also considered under Government (other). Unknown and Other
ownership was sometimes recorded for pond, river banks and other cases where ownership
was unclear. In addition to area, the aboveground volume, biomass and carbon stocks are
given.
Most of the sampled area was owned privately (Table 6.3). Aboveground volume, biomass
and carbon stocks are highest on lands owned by the FD. Carbon in AGB on FD land, for
example, are about two or three times higher than any other ownership type.
Highlights
- Lands owned by the government (either FD or other) is 2,299,207 ha or 17% of the
total country area.
- 81% of the area is owned privately.
- Land ownership is unknown for 1.8% of the land inventoried.
- Aboveground carbon is 3.3 times higher on FD land compared to Private land and
FD land holds 24.5% of the country’s aboveground carbon stock.

144
Ownership class1 Total area (ha)1 % of country area
Volume (m3/ha)
AGB (t/ha) CAGB (t/ha)
Forest Department 1,264,319.0 9.40 79.43 75.62 37.94
Government (other) 1,034,888.0 7.69 24.78 28.57 14.37
Other2 50,501.6 0.38 59.12 95.17 48.91
Private 10,857,811.8 80.73 22.53 22.69 11.51
Unknown 242,588.8 1.80 42.29 44.47 21.87
1Ownership class was determined by field teams, often by asking local landowners. The area is a sample‐based
estimate applied to the total country areas.
2The other category mainly includes the marginal areas of Rivers, Khals, and Lakes.
Table 6.3. National estimates of volume, biomass and area under different ownership classes.
Photo: Tea garden, Sylhet, ©Iqbal Z.
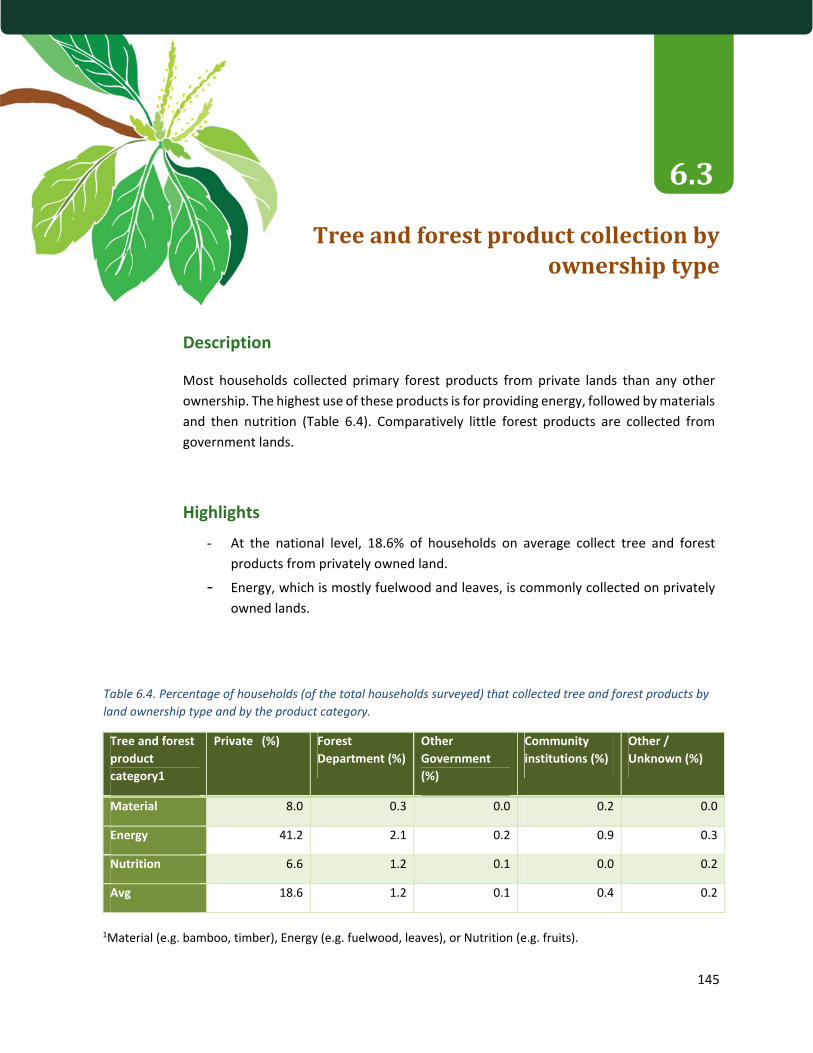
145
Treeandforestproductcollectionbyownershiptype
Description
Most households collected primary forest products from private lands than any other
ownership. The highest use of these products is for providing energy, followed by materials
and then nutrition (Table 6.4). Comparatively little forest products are collected from
government lands.
Highlights
- At the national level, 18.6% of households on average collect tree and forest
products from privately owned land.
- Energy, which is mostly fuelwood and leaves, is commonly collected on privately
owned lands.
Tree and forest product category1
Private (%) Forest Department (%)
Other Government (%)
Community institutions (%)
Other / Unknown (%)
Material 8.0 0.3 0.0 0.2 0.0
Energy 41.2 2.1 0.2 0.9 0.3
Nutrition 6.6 1.2 0.1 0.0 0.2
Avg 18.6 1.2 0.1 0.4 0.2
1Material (e.g. bamboo, timber), Energy (e.g. fuelwood, leaves), or Nutrition (e.g. fruits).
Table 6.4. Percentage of households (of the total households surveyed) that collected tree and forest products by land ownership type and by the product category.

146
Photo: Costal plantation of Moheshkhali,
©Arafat M.F.

147

148
Criteria 5 - Treeandforestdisturbances

149
Phot
o: Forest resource destruction in hill, ©
Hen
ry M
.
150
Criteria 5
Tree and forest disturbances
Section Highlights
Disturbance is observed in 32% of the country at the time of the biophysical survey.
Waterlogging, flooding and pests were the most common disturbances nationally.
Cyclone (78%) and Infrastructure development (56%) are the most common disturbances
observed by respondents of the socio‐economic survey. In the Coastal zone, cyclone affects
57.7% of the land and was observed by 98% of the respondents.
According to respondent opinions, the main driver of tree cover gain in the Coastal zone is
increasing coastal plantations. The main drivers of tree cover loss in the Hill and Sal zones are
human‐caused such as urbanization and management of forests (e.g. overharvesting, perhaps
by locals, and not planting new trees).
Introduction
Bangladesh is known for the impacts of extreme weather and other natural disasters on its general
population. Human disturbances are also significant and often interact with natural disturbances.
Data from both the biophysical and socio‐economic surveys indicate the relative extent and impact
of disturbances by either land area or number of households, respectively. This criterion describes
various disturbances that occur and their effect on the health of trees and forests. The negative
impacts of such disturbances may contribute to a loss of benefits. This indicator answers questions
such as ‐ what is the severity of natural and anthropogenic disturbances in each zone?
Methods
Both the biophysical and socio‐economic survey each provide information on tree and forest
disturbances. The occurrence of natural and human made disturbances on BFI plots is observed
and recorded in the biophysical inventory. The area and percent of disturbance is then expanded
by zone area (Akther et al., 2019). See Appendix 2.1 for details about which classes were
aggregated to Forest and Other Land (TOF).
Section 7

151
Households interviewed during the socio‐economic survey were asked: “what types of disturbances have occurred in your union in the past 10 years?” The data were then summarized
by type and zone. The total percent observance in the country is the weighted average.
Tree cover change results from Section 3.3 were used to determine increases and decreases in
tree cover by zone. The drivers of tree cover change were identified by asking socio‐economic
survey respondents “Have there been any changes in the area of tree cover on your land in the past ten years?”, and if so, “What are the reasons for increasing/decreasing tree cover?” There was no pre‐defined list of answers for the respondents to choose from, so open answers were
later grouped into common responses. Next, the responses were summarized by zone and
presented as ranked lists of the reasons for increasing or decreasing tree cover. Only the five most
common reasons within the zones are shown here.
Photo: Land slide in Rangamati,
©Chakma S.
152
Disturbanceareaanddisturbancesmostcitedbyhouseholds
Description
Disturbances were recorded two ways in the BFI. In the biophysical inventory, field team
recorded observations of one or more disturbance types on the plots. In the socio‐economic
survey, households were asked: “what types of disturbances have occurred in your union in the past 10 years?”
Overall, three times more land area is disturbed by natural causes than human‐made (Table
7.1). Similarly, respondents generally noted more natural disturbance than human caused.
There were notable exceptions, however. Over grazing and water pollution were major
disturbances affecting land area (a combined total of 1,307,702 ha), and infrastructure
development was noted by more than half of the respondents nationally.
In terms of affected land area within zones, the Coastal zone is most affected by cyclone
(57.7% of the zone area), the Hill zone by erosion (19.4%), the Sal zone by leaf collection
(6.4%), the Sundarban zone by siltation (22.2%), and the Village zone by waterlogging
(12.5%).
Highlights
‐ Cyclone, Flooding, Waterlogging, and Pests are among the top five natural
disturbances observed in both the biophysical and socio‐economic surveys.
‐ The largest disturbances to TOF are Waterlogging and Pests/Insects/Fungus (11.0%
and 9.1% of the TOF area, respectively).
‐ Fire is a relatively minor disturbance, but occurred more commonly in the Sal and Hill
zones (4.5% and 4.7% of the zone areas, respectively)
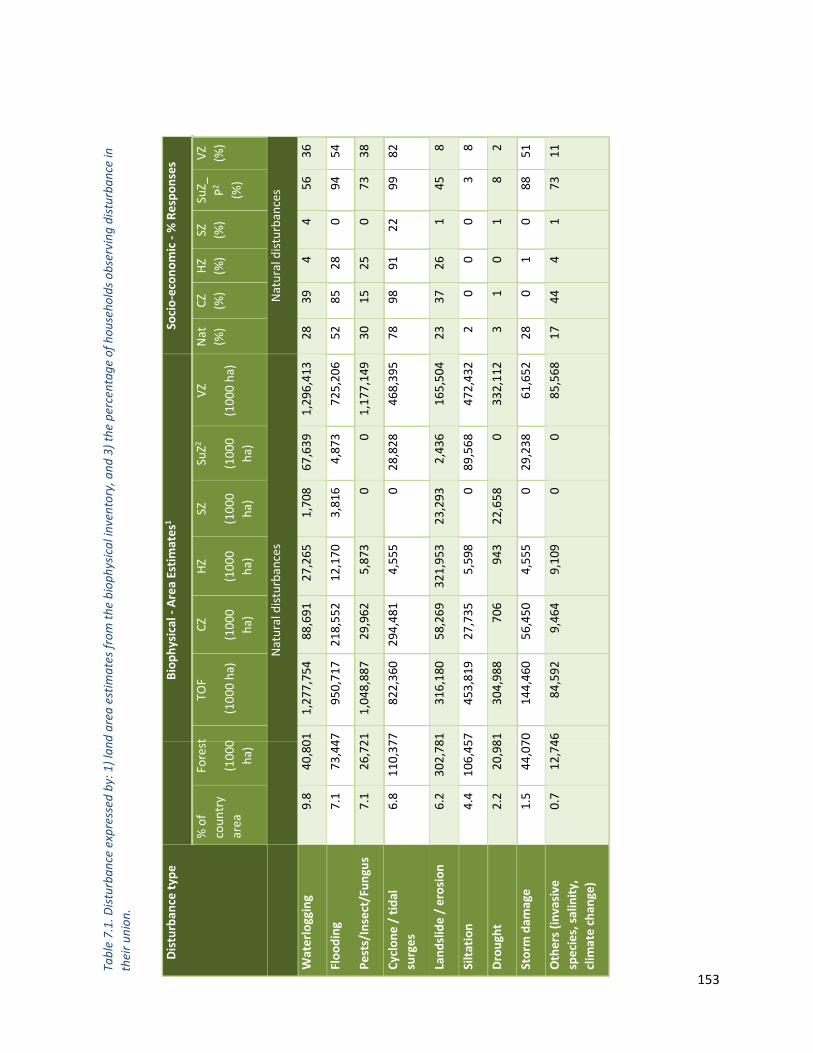
153
Dis
turb
ance
typ
e
Biop
hysi
cal -
Are
a Es
tim
ates
1 So
cio-
econ
omic
- %
Res
pons
es
% of
country
area
Forest
(1000
ha)
TOF
(1000 ha)
CZ
(1000
ha)
HZ
(1000
ha)
SZ
(1000
ha)
SuZ2
(1000
ha)
VZ
(1000 ha)
Nat
(%)
CZ
(%)
HZ
(%)
SZ
(%)
SuZ_ P2
(%)
VZ
(%)
Natural disturbances
Natural disturbances
Wat
erlo
ggin
g 9.8
40,801
1,277,754
88,691
27,265
1,708
67,639
1,296,413
28
39
4
4
56
36
Floo
ding
7.1
73,447
950,717
218,552
12,170
3,816
4,873
725,206
52
85
28
0
94
54
Pest
s/In
sect
/Fun
gus
7.1
26,721
1,048,887
29,962
5,873
0
0
1,177,149
30
15
25
0
73
38
Cycl
one
/ ti
dal
surg
es
6.8
110,377
822,360
294,481
4,555
0
28,828
468,395
78
98
91
22
99
82
Land
slid
e /
eros
ion
6.2
302,781
316,180
58,269
321,953
23,293
2,436
165,504
23
37
26
1
45
8
Silt
atio
n 4.4
106,457
453,819
27,735
5,598
0
89,568
472,432
2
0
0
0
3
8
Dro
ught
2.2
20,981
304,988
706
943
22,658
0
332,112
3
1
0
1
8
2
Stor
m d
amag
e 1.5
44,070
144,460
56,450
4,555
0
29,238
61,652
28
0
1
0
88
51
Oth
ers
(inva
sive
sp
ecie
s, s
alin
ity,
cl
imat
e ch
ange
)
0.7
12,746
84,592
9,464
9,109
0
0
85,568
17
44
4
1
73
11
Tabl
e 7.
1. D
istu
rban
ce e
xpre
ssed
by:
1) l
and
area
est
imat
es fr
om th
e bi
ophy
sica
l inv
ento
ry, a
nd 3
) the
per
cent
age
of h
ouse
hold
s ob
serv
ing
dist
urba
nce
in
thei
r uni
on.

154
Hum
an-c
ause
d di
stur
banc
es
Hum
an-c
ause
d di
stur
banc
es
Ove
r gr
azin
g 5.3
37,304
756,202
53,100
19,589
10,772
758,358
1
0
2
0
1
0
Wat
er p
ollu
tion
4.4
8,155
667,906
14,196
8,290
1,713
723,606
1
0
0
1
5
0
Encr
oach
men
t 1.9
93,520
90,987
92,617
17,159
4,873
61,129
19
3
18
2
52
0
Fire
1.7
91,549
68,918
4,732
75,515
24,513
52,478
4
0
15
0
3
9
Leaf
col
lect
ion
1.4
37,052
144,213
15,478
33,569
127,293
22
1
80
0
20
18
Infr
astr
uctu
re
deve
lopm
ent
0.2
0
27,727
31,487
56
41
88
45
40
66
Oth
ers
(pad
dy fi
eld
expa
nsio
n, s
hift
ing
cult
ivat
ion)
0.1
6,778
3,741
9,109
1
0
3
0
0
0
None observed
Non
e ob
serv
ed
67.9
993,348
8,467,60 5
82,212
1,003,0 73
398,430
219,650
5,573,0 62
‐
‐
‐
‐
‐
‐
1Sample‐based
estim
ate based
on observation from field teams.
2Note that SuZ and SuZ_P cover different areas (section 2.3.1)

155
Driversoftreecoverchanges
Description
Tree cover change determined from remote sensing is an important indicator of the BFI
(Section 3.3). Attributing the changes to specific causes is difficult without a field survey.
For this purpose, responses from the socio‐economic household survey were used to
understand drivers of tree cover change.
There was a large increase in tree cover in the Coastal zone, but only a modest increase in
the Village and Sundarban zones (Table 7.2). In the Coastal zone, according to a large
number of respondents, this increase is due to increasing tree plantations and related
management of coastal forests (Table 7.3). At least some thought that fewer natural
disturbances contributed to favorable conditions for tree cover increase (from 9.1% in the
Village to 16.9% in the Sundarban periphery).
Net tree cover loss occurred only in the Hill and Sal zones. The absolute loss over the period
was highest in the Hill zone (23,807 ha), but by percent it was highest in the Sal zone
(13.7%). See also Section 3.3 and (Potapov, Siddiqui et al. 2017) for more interpretations
about tree cover changes.
Although the Hill and Sal zones are quite different demographically and biophysically, in
both places the respondents noted similar reasons for decreasing tree cover. Broadly
categorized, they mainly refer to urbanization (infrastructure development and land use
change) and management (overharvesting and lack of tree planting) (Table 7.4).
Highlights
- Increasing tree plantations, along with fewer natural disturbances, are possible
drivers of increasing tree cover in the Coastal zone.
- Both the Hill and Sal zones are decreasing in tree cover due to mainly human
influences according to respondents.
- At least some in the Hill zone noted that Cyclone is a major reason for decreasing
tree cover.

156
Zone Tree Cover of sampled unions in 2000, ha
Tree Cover of sampled unions in 2014, ha
% Change
Coastal 16,638 18,089 14.60
Hill 232,541 208,734 ‐10.30
Sal 25,108 21,671 ‐13.70
Sundarban 10,681 11,891 0.68
Village 9,698 10,088 3.00
National 2,468,716 2,388,622 ‐3.20
Table 7.2. The absolute and percent change in tree cover loss and land cover by zone. Data are from sampled unions only.
Zone Reasons for increased tree cover % respondents
Coastal Zone More tree plantation 45.31
Proper management 17.81
Fewer natural disturbances 10.50
Profitability 8.53
Less salinity 4.24
Sundarban periphery More tree plantation 34.12
Proper management 24.25
Fewer natural disturbances 16.89
Less salinity 8.00
Profitability 6.44
Village More tree plantation 41.51
Proper management 23.33
Profitability 12.88
Fewer natural disturbances 9.07
Reduced extraction plant of species 4.09
Table 7.3. The five most common reasons mentioned by respondents for increases in tree cover area for those zones where tree cover increased (Table 7.2).
Zone Reasons for decreased tree cover % respondents
Hill Zone Over harvesting 34.11
Infrastructure development 19.02
Land use change 8.17
No new tree planting 6.62
Cyclone (e.g. Ayla, Sidor) 5.48
Sal Zone Tree harvesting 36.26
No new tree planting 14.46
Infrastructure development 8.62
Land use change 8.29
Population growth 4.47
Table 7.4. The five most common reasons mentioned by respondents for decreases in tree cover area for those zones where tree cover decreased (Table 7.2).

157

158
Criteria 6 - Support for sustainable forest management

159
Phot
o: Keo
ra plantation in
Borguna, ©
Mon
dal F
.K.

160
Criteria 6
Support for sustainable forest management
Section Highlights
Few households receive direct support for sustainable forest management from any
organization, reflecting a potential need and opportunity for more training and education.
The few households who receive support mention trainings and seedling programs. The
government and private sectors provides 43% and 58% of this support, respectively.
A substantial number of households reported buying seedlings, ranging from 30% in the Sal
zone to 64% in the Sundarban periphery, which indicates that tree planting is an important
activity for many in the country.
Introduction
The benefits of sustainably managing tree and forest resources are recognized by many. The FD
and other organizations have programs to promote sustainable forest management which are
monitored by the indicators in this section. This criterion describes the overall support of
sustainable forest management in terms of implementing programs that improve tree and forest
cover. It answers questions such as – which organizations provide support to households for
sustainable tree and forest management? And, which areas receive the most seedlings from the
FD? Overall the following results suggest that most people in Bangladesh manage their own tree
resources without the support of any organization. Thus, there is potential to increase support in
the forms of training, education, communication materials, and workshops that share experiences
among tree and forest beneficiaries.
Section 8
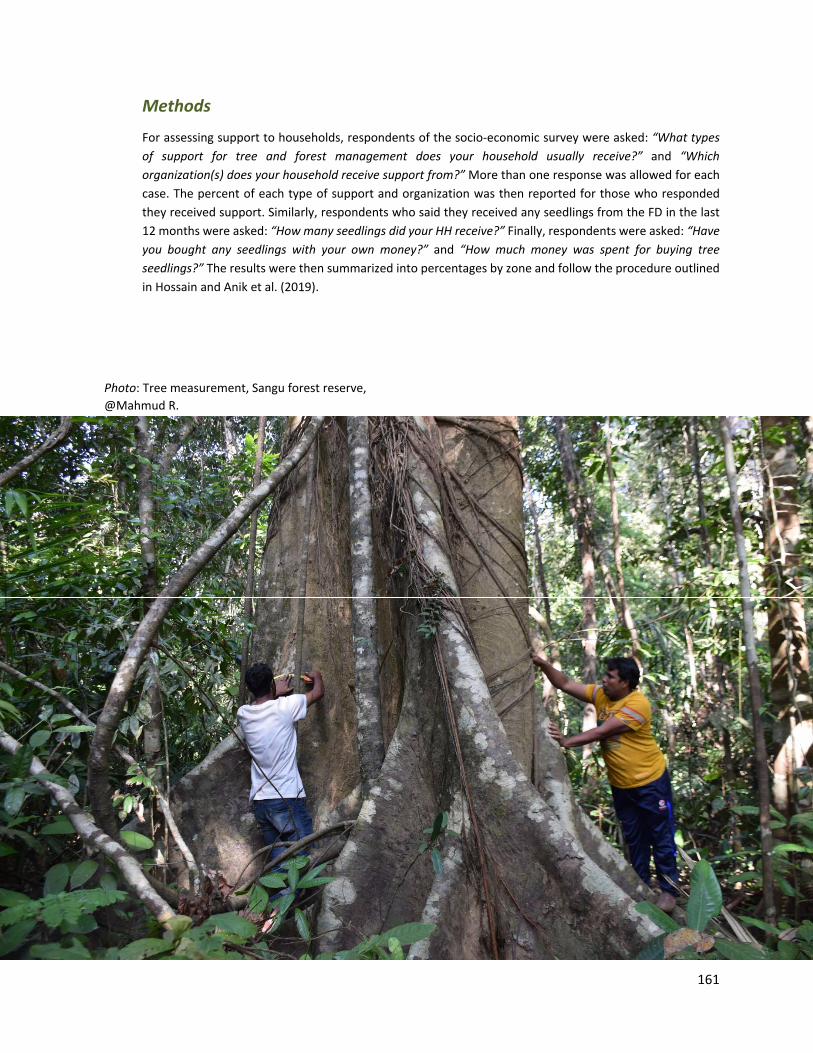
161
Methods
For assessing support to households, respondents of the socio‐economic survey were asked: “What types of support for tree and forest management does your household usually receive?” and “Which organization(s) does your household receive support from?” More than one response was allowed for each
case. The percent of each type of support and organization was then reported for those who responded
they received support. Similarly, respondents who said they received any seedlings from the FD in the last
12 months were asked: “How many seedlings did your HH receive?” Finally, respondents were asked: “Have you bought any seedlings with your own money?” and “How much money was spent for buying tree seedlings?” The results were then summarized into percentages by zone and follow the procedure outlined
in Hossain and Anik et al. (2019).
Photo: Tree measurement, Sangu forest reserve,
@Mahmud R.

162
Typesofsupportreceivedfromorganizations
Description
Knowing the status about who provides sustainable management support and for what is
basic information needed for planning policies and activities. About 1.1% of the
respondents in the country report receiving some type of support for tree and forest
management (Table 8.1). However, this figure rises to 6.9% when considering Hill zone
areas with high tree cover and low populations (i.e. Hill_4 strata; results not shown).
Among those who receive support, 55% reported the private sector as the source while 33%
reported the government sector. Other sources of support include universities, schools and
NGO’s. Support is usually in the form of training or providing seedlings. Support on raising
nurseries exclusively concerns the Sundarban periphery and the Village zones. Training in
processing forest products was reported exclusively in the Hill zone (Table 8.1).
Highlights
- The Hill zone receive the most support from organizations, followed by the
Sundarban periphery
- The Coastal, Village and Sal zones receive the lowest support. Most of the support
provided is in the form of tree planting and free seedlings (Table 8.1).

163
Zone Any
Support (%)
Cash (%)
Free seedlings (%)
Other (%)
Training in forest product collection and processing (%)
Training on raising nursery (%)
Training on tree and forest management (%)
Training on tree planting (%)
Coastal 0.95 0.14 0.76 0.00 0.00 0.00 0.00 0.46
Hill 3.13 0.00 2.36 0.00 0.11 0.00 0.24 1.72
Sal 1.28 0.00 0.35 0.23 0.00 0.00 0.05 0.65
Sundarban periphery 2.28 0.21 1.75 0.00 0.00 0.32 0.12 0.83
Village 1.03 0.00 0.00 0.20 0.00 0.04 0.04 0.34
National 1.13 0.01 0.43 0.19 0.02 0.04 0.08 0.63
Table 8.1. Zone level responses for percent of households who received support from any organization and the type of support they received.

164
HouseholdsreceivingseedlingsupportfromBFD
Description
Another way to support sustainable forest management is through seedling distribution.
The FD About 0.15% of households, or approximately 48,000 total households, in the
country received seedlings from the FD over a 12 months period from 2017 to 2018. A
greater proportion of households received seedings in the Coastal zone (Table 8.2). In the
case that seedlings were received, the average number received per household ranged
from 5 to 32. Although these figures are modest, they do indicate some activity for
promoting tree planting and potential for growing this type of support in the future.
Highlights
‐ Seedling distribution by the FD was limited over a one‐year period and not
distributed equally across the zones.
‐ Seedling distribution is much lower in the Sundarban periphery and Village
zones.
‐ Of those who did receive seedlings from FD, the average number received is 13
per household.
Zone % HH receiving seedling Total no. of HH Average no. of seedlings per HH1
Coastal 0.87 8,155 9.73
Hill 0.55 4,827 18.40
Sal 0.14 5,722 31.50
Sundarban periphery 0.11 403 5.00
Village 0.11 29,558 5.50
National 0.15 48,665 12.681The estimated average for households who reported receiving seedlings from the FD, i.e. it does not include all
households surveyed.
Table 8.2. Zone level responses of the average number of seedlings received by households who received seedling from the FD in the last 12 months.

165
Seedlingspurchasedbyhouseholds
Description
The percent households buying seedlings and the number they purchase indicates the tree
planting activities of communities. Over half of the population in Coastal and Sundarban
periphery zones reported purchasing tree seedlings using their own financial resources,
but they were among the lowest in average money spent (Table 8.3). National level results
reflect heavily the results of the Village zone, where 45% spent their own financial
resources on seedlings.
Highlights
‐ The percent who spent their own financial resources ranges from 27.4% (Sal) to
66.8% (Sundarban periphery).
‐ For those who spend their own financial resources on seedlings, the highest
average amount spent is in the Village zone, which may reflect the lower number
of naturally growing trees in these areas.
‐ A lower proportion of people in the Sal zone spend their own financial resources
which may reflect higher urbanization and less direct dependence on tree
resources in the areas. Nonetheless, almost a third of households in the Sal zone
still purchase their own seedlings.
Zone % who spent own financial resources
No. of HHs who spent own financial resources
Average money spent (BDT/HH/yr)1
Coastal 54.2 509,696 1,542
Hill 48.0 418,166 2,093
Sal 27.4 1,086,056 1,378
Sundarban periphery 66.8 256,014 1,202
Village 44.9 12,075,438 905
National 43.4 14,345,371 1,015 1Average spent was based on only those households who reported spending their own financial resources for
seedlings.
Table 8.3. Zone level responses for number of households purchasing seedlings and the average amount spent per year using their own financial resources.

166
Photo: A portion of Hill forest, Sajek,
©Mondal F.K.

167

168
Criteria 7 - Treeandforestservicesandlivelihoods

169
Phot
o: Tree and forest services in dailylife, ©
Mon
dal F
.K.
170
Criteria 7
Tree and forest services and livelihoods Section Highlights
Every household surveyed benefits from at least one tree and forest related service according
to the survey.
64% of the total population is involved with primary tree and forest product collection, with
almost equal participation of both male and female.
About three quarters of the major primary products are supplied from TOF which cover 87.2%
of the total country area (see Section 3.1).
Tree and forests are an important source of employment for women. Around 65% of the
country’s total female population are involved with collecting primary tree and forest
products.
The total value of the primary tree and forest products collected is 3.11% of the 2017‐18’s
national Gross Domestic Product (GDP) measured in current price.
Trees and forests contribute 1.29% of the 2017‐18’s national Gross National Income (GNI)
measured in current market price.
Nationally fruits contribute around 47% of total value of primary tree and forest products
collected.
Introduction
This criterion describes the quantity, value of different primary and processed tree and forest
products collected by the households and the associated employment and income generated for
the households. It also estimates the value of different provisional services that households
benefit from. It answers questions such as ‐ what is the total income earned by households from
primary tree and forest products in each zone and what is the proportion of households receiving
benefits from forests? The results are presented at zone and divisional levels. These results are
based on socio‐economic survey data collected through household survey and the indicators are
estimated through using Stata V14. The details of the analysis and estimation procedure are
available in Hossain et al. (2019). The full questionnaire is available in Appendix 2.2.
Section 9

171
Methods
Value and income estimates are derived from data collected about quantity of tree and forest
primary products and prices. During the survey the households were asked about quantity, price,
days employed, income earned, different services received from tree and forests and other
livelihood related questions. For estimating value and income from tree and forest products it was
necessary to know product price. Price data were gathered from households which sold products.
In the case that no price was available for the household, a zone level average price was used. In
the cases that no household in the zone reported price, the average of other zones was used.
Maps of quantity and value of products were produced by applying the means of zone and HTAC
(i.e. Tree Availability strata) to Union polygons.
The zone‐specific average values were multiplied with total number of households in the zone to
estimate the total quantity or value of different products. A two‐factor weight was assigned to per
household per year averages of quantity or value, then the national level average was derived as
the weighted sum of the zone level estimates. Fisheries products (i.e. fish, shrimp, shrimp fry and
crab) contribute heavily in total value of primary tree and forest products, particularly in the
Sundarban periphery. Therefore, to understand the effect of fisheries on total estimates, separate
estimates that consider only non‐fisheries products are also provided for some indicators. Specific
methods used for other socio‐economic estimations are given in the respective sub‐sections. Cells
were left blank where there was no sample of that condition and a 0 value indicates < 0.01 of the
respective unit. The equations applied are found in the Appendix 9.1 to 9.13. Also see the
Appendix 2.1 for details about which land cover classes were aggregated to Forest and Other Land
(i.e. TOF).
The quantity and value of Non Wood Forest Products (NWFP) collected from Forests are also
presented. NWFP are “goods derived from forests that are tangible and physical objects of
biological origin other than wood” FAO (2018) and excludes products from TOF. Households
reported collecting from Forest, TOF, or both. Collecting from Forest only represents a low
estimate of quantity or value. On the other hand, collection from both Forest and TOF can be
added to the Forest only estimate to represent a high estimate. The estimated total value was
assumed to be the average of the low and high estimates. The top 10 values are shown in this
section and the full results for Forest, TOF, or both are shown in Appendix 9.2 (b, c).

172
Primarytreeandforestproducts
Quantityofeachprimarytreeandforestproductscollected
Description
During the socio‐economic survey, households are asked for the quantity of all the primary
tree and forest products they collected in the past 12 months and from which land covers
they are collected from. The five most common primary products are shown by zone.
The total product quantities are also summarized by Forest and TOF. Most of the primary
tree and forest products collected from Forest is in the Hill zone, which is mostly comprised
of Hill Forest (Figure 9.1).
Some major primary tree and forest products are collected mainly within specific zones
while others are collected across all zones (Table 9.1). Average household level collection
of bamboo and fuel wood is highest in the Hill zone, whereas timber and leaves are highest
in the Coastal zone.
There is little variation observed in the quantities of fruits collected across zones, though
the highest household level collection is in the Village zone. Moreover, in the Village zone
the total quantity collected is highest for all the products across zones.
From the Hill and Sundarban periphery zones, households collect a larger variety of
products, whereas the variety collected in Sal and Coastal zones is relatively limited (see
Appendix 9.1 tables).
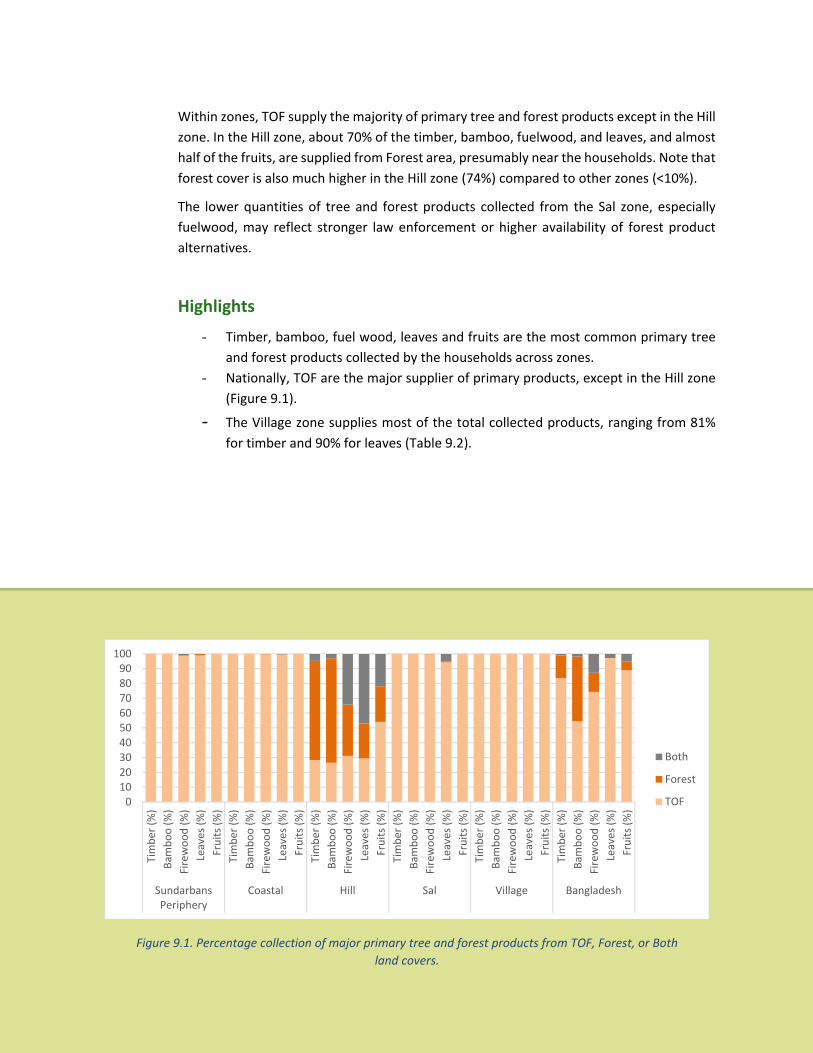
173
Within zones, TOF supply the majority of primary tree and forest products except in the Hill
zone. In the Hill zone, about 70% of the timber, bamboo, fuelwood, and leaves, and almost
half of the fruits, are supplied from Forest area, presumably near the households. Note that
forest cover is also much higher in the Hill zone (74%) compared to other zones (<10%).
The lower quantities of tree and forest products collected from the Sal zone, especially
fuelwood, may reflect stronger law enforcement or higher availability of forest product
alternatives.
Highlights
- Timber, bamboo, fuel wood, leaves and fruits are the most common primary tree
and forest products collected by the households across zones.
- Nationally, TOF are the major supplier of primary products, except in the Hill zone
(Figure 9.1).
- The Village zone supplies most of the total collected products, ranging from 81%
for timber and 90% for leaves (Table 9.2).
0102030405060708090100
Timber (%)
Bam
boo (%)
Firewood (%)
Leaves (%)
Fruits (%
)
Timber (%)
Bam
boo (%)
Firewood (%)
Leaves (%)
Fruits (%
)
Timber (%)
Bam
boo (%)
Firewood (%)
Leaves (%)
Fruits (%
)
Timber (%)
Bam
boo (%)
Firewood (%)
Leaves (%)
Fruits (%
)
Timber (%)
Bam
boo (%)
Firewood (%)
Leaves (%)
Fruits (%
)
Timber (%)
Bam
boo (%)
Firewood (%)
Leaves (%)
Fruits (%
)
SundarbansPeriphery
Coastal Hill Sal Village Bangladesh
Both
Forest
TOF
Figure 9.1. Percentage collection of major primary tree and forest products from TOF, Forest, or Both land covers.
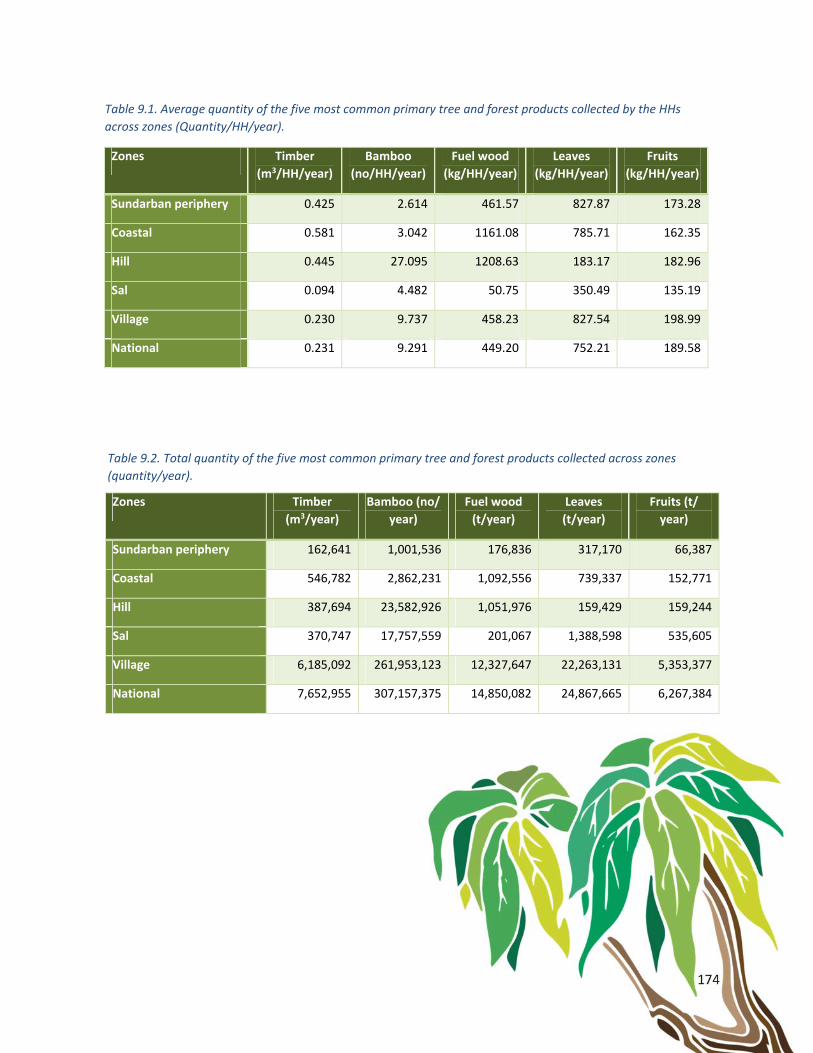
174
Zones Timber
(m3/HH/year) Bamboo
(no/HH/year) Fuel wood
(kg/HH/year) Leaves
(kg/HH/year) Fruits
(kg/HH/year)
Sundarban periphery 0.425 2.614 461.57 827.87 173.28
Coastal 0.581 3.042 1161.08 785.71 162.35
Hill 0.445 27.095 1208.63 183.17 182.96
Sal 0.094 4.482 50.75 350.49 135.19
Village 0.230 9.737 458.23 827.54 198.99
National 0.231 9.291 449.20 752.21 189.58
Table 9.1. Average quantity of the five most common primary tree and forest products collected by the HHs across zones (Quantity/HH/year).
Zones Timber (m3/year)
Bamboo (no/ year)
Fuel wood (t/year)
Leaves (t/year)
Fruits (t/ year)
Sundarban periphery 162,641 1,001,536 176,836 317,170 66,387
Coastal 546,782 2,862,231 1,092,556 739,337 152,771
Hill 387,694 23,582,926 1,051,976 159,429 159,244
Sal 370,747 17,757,559 201,067 1,388,598 535,605
Village 6,185,092 261,953,123 12,327,647 22,263,131 5,353,377
National 7,652,955 307,157,375 14,850,082 24,867,665 6,267,384
Table 9.2. Total quantity of the five most common primary tree and forest products collected across zones (quantity/year).

175
Economicvalueofprimaryproductscollected,includingNWFP
Description
The economic value of primary products is the quantity collected multiplied by their prices.
Results are summarized in terms of per household and total values, and grouped by zones
and Forest and TOF. The quantity and value of Non Wood Forest Products collected from
Forests are also presented. The top 10 values are shown in this section and the full results
for Forest, TOF, or both are shown in Appendix 9.2 b, c.
The total value of primary tree and forest products collected in Bangladesh is 699,894 million
BDT/year, and on an average each household collected 21,171 BDT/year. The Sundarban
periphery has the highest average value per household whereas the highest total value
occurs in the Village zone (Figure 9.2; Table 9.3; Appendix 9.2a). When fisheries products are
removed, the value of primary tree and forest products reduces notably, particularly in
Sundarban periphery where value becomes less than half. The Coastal zone then becomes
the highest in terms of average income (Table 9.3). In Sundarban periphery and Hill zones,
energy products (i.e. fuelwood, leaves, twigs, branches and other energy products) have the
highest contribution, which is the second highest contributor at the national level (Figure
9.3).
TOF contribute the most to primary product value, although value from Forest in the Hill
zone is also notable (Figure 9.4).
Nationally, and also in the Village, Sal and Coastal zones, fruits harvesting is the highest
contributor in value of primary tree and forest products collected (Figure 9.3 and Table 9.4).
Fruits also contributed to nearly half of the total value of NWFP collected from Forest area
(Table 9.5).
Highlights
‐ The total value of primary tree and forest products collected is 3.11% of the 2017‐
18’s national GDP measured in current price. The contribution becomes 2.91% when
value of fisheries products is not considered.
‐ More than 80% of the total value of primary tree and forest products is collected
from the Village zone (Table 9.3).
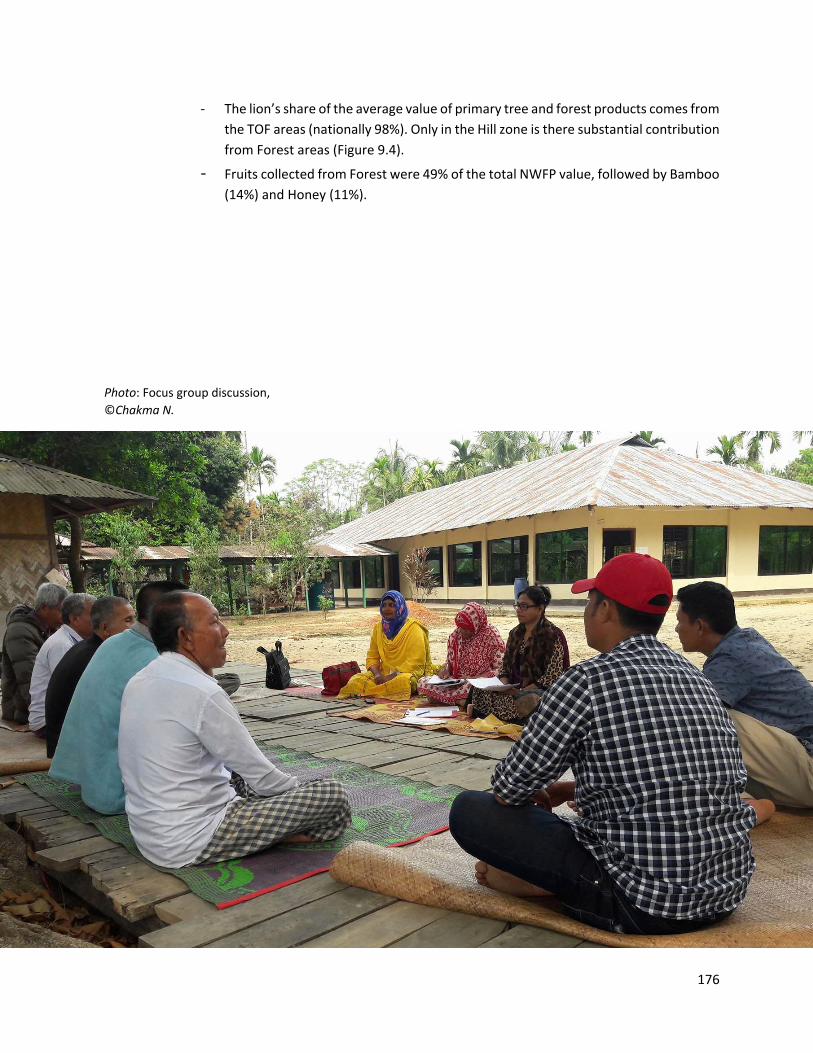
176
‐ The lion’s share of the average value of primary tree and forest products comes from
the TOF areas (nationally 98%). Only in the Hill zone is there substantial contribution
from Forest areas (Figure 9.4).
‐ Fruits collected from Forest were 49% of the total NWFP value, followed by Bamboo
(14%) and Honey (11%).
Photo: Focus group discussion, ©Chakma N.

177
Figure 9.2. Average values (BDT/HH/year) of primary tree and forest products collected by households
across zones.

178
Zone All primary tree and forest products Primary tree and forest products excluding fisheries
Average value
(BDT/hh/year)
Total value (million
BDT/year)
Average value
(BDT/hh/year)
Total value (million
BDT/year)
Sundarban periphery 49,354 18,908 22,697 8,695
Coastal 30,113 28,336 26,402 24,844
Hill 20,509 17,851 18,644 16,227
Sal 13,828 54,784 13,822 54,762
Village 21,560 580,015 20,435 549,763
National 21,171 699,894 19,791 654,292
Table 9.3. Values of primary tree and forest products collected by households across zones.
Table 9.4. Average (BDT/HH/year) and total (million BDT/year) values of different wood and non-wood primary tree and forest products collected by households across zones.
Primary tree & forest products
Unit Sundarbans periphery
Coastal Hill Sal Villages National
Timber
BDT/hh/year 3,703.02 6,723.58 3,469.82 2,137.80 2,841.72 2,894.37
million BDT/year 1,418.69 6,326.78 3,020.08 8,469.71 76,450.65 95,685.91
Poles
BDT/hh/year 621.83 299.03 106.49 120.07 116.24
million BDT/year 238.23 281.38 92.69 3,230.35 3,842.65
Bamboo
BDT/hh/year 392.28 573.68 1,559.48 489.59 1,547.03 1,379.55
million BDT/year 150.29 539.83 1,357.35 1,939.71 41,619.70 45,606.86
Brooms
BDT/hh/year 74.16 36.04 228.06 46.61 39.55 45.66
million BDT/year 28.41 33.91 198.50 184.65 1,063.99 1,509.46
Nypa
BDT/hh/year 142.34 1.65
million BDT/year 54.53 54.53
Medicinal plants
BDT/hh/year 87.10 10.78 16.12 44.65 59.07 55.16
million BDT/year 33.37 10.14 14.03 176.89 1,589.28 1,823.72
Murta
BDT/hh/year 10.58 99.34 0.26 0.23 19.36 18.74
million BDT/year 4.05 93.48 0.23 0.90 520.78 619.44
Tree seedlings
BDT/hh/year 143.18 441.25 10.22 16.51 27.92
million BDT/year 54.86 415.21 8.89 444.08 923.04
Fodder
BDT/hh/year 7.19 41.86 251.40 7.15 42.00 42.93
million BDT/year 2.76 39.39 218.82 28.33 1,130.05 1,419.34
Seeds
BDT/hh/year 27.64 19.78 26.93 8.44 8.46
million BDT/year 10.59 18.61 23.44 227.20 279.83
Fuelwood
BDT/hh/year 3,180.84 4,440.25 4,693.30 507.50 2,543.18 2,417.22
million BDT/year 1,218.63 4,178.21 4,084.99 2,010.67 68,418.94 79,911.44
Leaves
BDT/hh/year 3,193.63 1,489.44 562.91 1,927.53 3,515.61 3,186.15
million BDT/year 1,223.53 1,401.54 489.95 7,636.65 94,580.08 105,331.75

179
Rank Name of NWFP Quantity Unit Value (million BDT) NWFP category
1 Fruits 22,810,916 kg/year 1,297.215 Plant Product
2 Bamboo 12,529,474 No/year 374.625 Plant Product
3 Honey 793,423 kg/year 303.190 Animal Product
4 Brooms 1,686,024 bundle/year 177.490 Plant Product
5 Thatching materials 297,534 bundle/year 114.507 Plant Product
6 Bamboo shoots 12,529,474 kg/year 107.373 Plant Product
7 Mushrooms 363,652 kg/year 69.175 Plant Product
8 Other vegetables 2,810,040 kg/year 76.985 Plant Product
9 Root tubers 1,024,838 kg/year 35.502 Plant Product
10 Fodder 8,330,943 kg/year 53.913 Plant Product
All other plant products 34.416
All other animal products 18.907
Total 2,663.300
Table 9.5. List of top ten Non Wood Forest Products collected from Forest areas only, ranked by value.
Primary tree and forest products
Unit Sundarban periphery
Coastal Hill Sal Village National
Fruits
BDT/hh/year 10,254.67 12,201.20 7,089.23 8,649.83 9,507.26 9,426.18
million BDT/year 3,928.73 11,481.13 6,170.36 34,269.61 255,773.06 311,622.90
Bamboo shoots
BDT/hh/year 128.14 3.37
million BDT/year 111.53 111.53
Mushroom
BDT/hh/year 99.62 2.62
million BDT/year 86.71 86.71
Root tubers
BDT/hh/year 30.71 41.29 6.35 6.61
million BDT/year 11.76 35.94 170.78 218.49
Other vegetables
BDT/hh/year 197.35 3.07 33.27 32.64
million BDT/year 171.77 12.18 894.96 1,078.91
Spices
BDT/hh/year 5.07 0.10 8.53 7.94 2.87 3.57
million BDT/year 1.94 0.09 7.43 31.47 77.22 118.15
Other animal products
BDT/hh/year 23.23 0.61
million BDT/year 20.22 20.22
Fish
BDT/hh/year 7,147.05 3,671.27 1,772.50 5.59 970.78 1,024.66
million BDT/year 2,738.15 3,454.61 1,542.76 22.13 26,116.89 33,874.53
Shrimp
BDT/hh/year 13,940.19 39.45 72.31 150.71 287.22
million BDT/year 5,340.71 37.12 62.94 4,054.49 9,495.25
Shrimp fry
BDT/hh/year 742.12 8.60
million BDT/year 284.32 284.32
Crabs
BDT/hh/year 4,828.08 20.61 3.01 58.94
million BDT/year 1,849.71 17.94 80.99 1,948.64

180
0
20
40
60
80
100
Sundarbansperiphery (%)
Coastal (%) Hill (%) Sal (%) Village (%) National (%)
Others
Timber
Fisheries
Energy
Fruits
Figure 9.3. Contribution of major products to total value of primary tree and forest (%).
0
20
40
60
80
100
Sundarbansperiphery (%)
Coastal (%) Hill (%) Sal (%) Village (%) National (%)
Both
Forest
TOF
Figure 9.4. Percentage of value of primary tree and forest products from TOF, Forest, or Both land covers.

181
Quantity/shareofcollectedprimaryproductssold
Description
Households sell a variety of tree and forest products that they collect (Table 9.6). More than
2.1 million tons of fruit, 434, 100 tons of fishery products and 4,448 million tons of timber
are annually sold.
Some products are sold across all zones (e.g. timber, fuelwood, bamboo, fish, fruits, etc.),
whereas others are zone specific (e.g. Nypa and shrimp fry in the Sundarban periphery, poles
in Sundarban periphery and Coastal zones, etc.) (Appendix 9.3 tables). The total quantity
sold in the Village zone is the highest compared to other zones.
In terms of the proportion of the collected products that are sold, Fruits is the highest at
10.3%, followed by Timber at 7.2%, and Bamboo at 5.7%. For most products, households in
the Coastal and Sundarban periphery zones sold a higher percentage of the products they
collected.
Highlights
‐ 458,513 tons are annually collected for cooking and heating by households (see
9.5.1 for their value).
‐ Households sell a very small portion of the products they collect, suggesting they
collect these products mostly for their own use and subsistence (Table 9.7).
‐ Regarding the products sold across all zones (e.g. timber, bamboo, fuelwood, leaves,
fruits, and fish) the Village zone sells at least 70% of the national quantity (Appendix
9.3 tables).

182
Primary tree and forest products Annual quantity
Timber (m3/year) 4,448,173
Poles (no/year) 306,607
Bamboo (no/year) 152,475,809
Medicinal plants (kg/year) 327,001
Murta (no/year) 906,904
Fodder (kg/year) 371,641
Brooms (bundles/year) 2,284,504
Nypa (bundles/year) 320,648
Tree seedlings (bundle/year) 4,178,220
Seeds (kg/year) 9,644
Fruits (kg/year) 2,092,782,915
Bamboo shoots (kg/year) 252,375
Mushroom (kg/year) 20,935
Root tubers (kg/year) 216,460
Other vegetables (kg/year) 342,859
Spices (kg/year) 1,206,459
Other animal products (kg/year) 66,080
Fish (kg/year) 183,896,683
Shrimp (kg/year) 23,536,583
Shrimp fry (no/year) 222,598,710
Crabs (kg/year) 4,068,851
Energy products used for cooking & heating
Fuelwood (kg/year) 414,214,511
Leaves (kg/year) 44,298,624
Table 9.6. Total annual quantity (quantity/year) of different primary tree and forest products sold by households at national scale.
Zone Timber Bamboo Fuelwood Leaves Fruits Fish
Sundarban periphery
7.6 2.6 0.6 0.5 14.4 6.3
Coastal 11.3 4.5 1.0 0.7 13.0 2.8
Hill 7.2 6.1 1.2 11.0 2.0
Sal 1.7 3.8 0.0 0.0 6.7 0.0
Village 7.9 6.0 0.8 0.1 10.6 1.1
National 7.2 5.7 0.7 0.1 10.3 1.1
Table 9.7. Share of the collected quantity sold for six of the most common primary tree and forest products (%).

183
Annualincomeearnedbythehouseholdsfromsellingprimarytreeandforestproducts
Description
The gross income that a household earns from selling primary tree and forest products was
estimated by multiplying the selling quantities with price. Then the associated selling cost
was deducted to know the household’s net income. Similar to primary tree and forest
products, total annual income was estimated both with and without income from fisheries
products.
In most of the parts of the country, particularly in the Village zone, households income
earned from primary tree and forest product is low (Figure 9.5 and Table 9.8). On average,
a household annually earns BDT 6,664 from selling primary tree and forest products and the
total national income generated is more than 220 billion BDT (Table 9.8).
When fishery products are removed from the national annual income, it reduces by about
33 billion BDT, or 15% (Table 9.8). Fruits and timber are the major contributor in income in
most of the zones, but to varying degrees (Figure 9.6). To note that a portion of the
Sundarbans is protected area where fishing is banned, but likely supplies fishery resources
to adjacent limited use areas. Thus, conservation efforts are providing income to fishermen
from surrounding communities.
In the Hill and Sal zones, households with greater access to tree and forest resources may
receive more income from selling forest products. The higher Household Tree Availability
Classes (HTAC) had relatively higher average income than their counterparts belonging to
the relatively lower HTAC (Appendix 9. 4). In other three zones, no such correlations are
observed.
Highlights
‐ A household in the Sundarban periphery earned more from selling than their
counterparts living in other zones, contributed mainly by shrimp and crab.
‐ More than three‐fourth of the total annual income is earned by the households
living in the Village zone (Table 9.8).
‐ Income from fruit is the major contributor to income in all the zones, except
Sundarban periphery, where households earn highest portion of their annual
income from shrimp (Figure 9.6).

184
Figure 9.5. Average income (BDT/HH/year) from selling primary tree and forest products collected by households across zones.

185
Table 9.8. Income from primary forest products by zone and product type.
Primary tree and forest products
Unit Sundarban periphery
Coastal Hill Sal Village National
Timber
BDT/hh/year 1,561.90 2,519.65 2,683.22 580.03 1,698.45 1,612.14
million BDT/year 598.39 2,370.95 2,335.44 2,298.03 45,693.28 53,296.09
Poles
BDT/hh/year 17.13 3.84 0.31
million BDT/year 6.56 3.61 10.17
Bamboo
BDT/hh/year 201.11 200.50 995.24 355.40 711.79 656.07
million BDT/year 77.05 188.67 866.25 1,408.06 19,149.26 21,689.28
Brooms
BDT/hh/year 8.28 0.67 104.70 0.87 3.58
million BDT/year 3.17 0.63 91.13 23.33 118.26
Nypa
BDT/hh/year 36.79 0.43
million BDT/year 14.10 14.10
Medicinal plants
BDT/hh/year 1.01 3.94 0.45 0.17
million BDT/year 0.39 3.43 1.77 5.58
Murta
BDT/hh/year 22.15 4.91 4.63
million BDT/year 20.84 132.12 152.96
Tree seedlings
BDT/hh/year 14.17 52.67 1.66
million BDT/year 5.43 49.56 54.99
Fodder
BDT/hh/year 0.28 0.03
million BDT/year 1.11 1.11
Seeds
BDT/hh/year 3.32 0.09
million BDT/year 2.89 2.89
Fuelwood
BDT/hh/year 56.74 102.26 221.16 0.21 56.22 55.17
million BDT/year 21.74 96.23 192.50 0.83 1,512.53 1,823.82
Leaves
BDT/hh/year 13.66 17.39 1.31 4.95 4.84
million BDT/year 5.23 16.37 5.18 133.21 159.99
Fruits
BDT/hh/year 3,564.28 4,810.95 3,220.09 4,274.38 2,996.76 3,213.96
million BDT/year 1,365.53 4,527.03 2,802.72 16,934.57 80,621.58 106,251.42
Bamboo shoots
BDT/hh/year 6.82 0.18
million BDT/year 5.94 5.94
Mushroom
BDT/hh/year 3.54 0.09
million BDT/year 3.08 3.08
Root tubers
BDT/hh/year 2.75 8.08 0.24
million BDT/year 1.05 7.03 8.09

186
0
5000
10000
15000
20000
25000
30000
Sundarbansperiphery
Coastal Hill Sal Village
Average income (BDT/HH/year)
Shrimp Timber Bamboo Fruits Fish Crab Other
Figure 9.6. Income from different primary tree and forest products across zones.
Primary tree and forest products
Unit Sundarban periphery
Coastal Hill Sal Village National
Other vegetables
BDT/hh/year 3.78 1.16 0.24
million BDT/year 3.29 4.59 7.88
Spices
BDT/hh/year 1.50 6.04 7.87 2.73 3.34
million BDT/year 0.57 5.26 31.20 73.36 110.39
Other animal products
BDT/hh/year 2.49 0.07
million BDT/year 2.17 2.17
Fish
BDT/hh/year 5,715.76 3,139.59 1,210.37 2.00 678.07 739.51
million BDT/year 2,189.80 2,954.31 1,053.48 7.93 18,242.19 24,447.71
Shrimp
BDT/hh/year 11,619.95 30.88 41.76 82.20 203.53
million BDT/year 4,451.79 29.06 36.35 2,211.43 6,728.63
Shrimp fry
BDT/hh/year 726.23 8.42
million BDT/year 278.23 278.23
Crabs
BDT/hh/year 4,319.47 3.31 3.01 52.59
million BDT/year 1,654.86 2.88 80.99 1,738.73
All products BDT/hh/year 28,638.50 10,902.61 8,527.02 5,223.09 6,355.26 6,664.43
million BDT/year 10,971.87 10,259.18 7,421.80 20,693.25 170,975.13 220,321.23
All products excluding fisheries
BDT/hh/year 6,257.09 7,732.13 7,271.58 5,221.09 5,591.97 5,660.37
million BDT/year 2,397.19 7,275.81 6,329.08 20,685.33 150,440.50 187,127.91

187
Processedtreeandforestproducts
Quantityoftheprocessedtreeandforestproducts
Description
During the socio‐economic survey, the households were asked about the quantity of
different processed tree and forest products that they produced in the past 12 months.
Wooden furniture and handicrafts are the two most common processed tree and forest
products. In the Village zone, households produce highest quantity of wooden furniture,
wooden agricultural appliances and handicrafts. But average household level production is
highest in Sundarban periphery for wooden furniture and handicrafts (Table 9.9 and 9.10).
Highlights
‐ The number of products processed per household is notably high in the Sundarban
periphery zone and low in the Sal zone. ‐ Production of wooden furniture is highest in the Village zone, followed by
Sundarban periphery, Sal, Hill and Coastal zones (Table 9.10). ‐ In the case of handicrafts, the highest quantity is produced in the Village followed
by Coastal, Hill, Sal and Sundarban periphery zones (Table 9.10).

188
Zone Wooden furniture (No/HH/year)
Wooden agricultural appliances (No/HH/year)
Handicrafts (No/HH/year)
Sundarban periphery 0.895 2.415
Coastal 0.030 2.766
Hill 0.098 1.871
Sal 0.047 0.008 0.274
Village 0.092 0.014 0.154
National 0.094 0.012 0.314
Table 9.9. Average quantity of tree and forest products processed across zones (No/HH/year).
Zone Wooden furniture (No/year)
Wooden agricultural appliances (No/ year)
Handicrafts (No/year)
Sundarban periphery 343,060 925,087
Coastal 28,581 2,602,351
Hill 85,325 1,628,747
Sal 187,492 33,207 1,085,019
Village 2,465,742 379,135 4,144,781
National 3,110,200 412,342 10,385,985
Table 9.10. Total quantity of tree and forest products processed across zones (No/year).

189
Quantityoftheprocessedtree&forestproductssuppliedtothemarketbyhouseholds
Description
The surveyed households reported to sell two broad categories of processed products:
wooden furniture and handicrafts. The highest quantity of handicraft is sold in the Coastal
zone, followed by Village, Hill, Sal and Sundarban periphery. In the Village zone, highest
quantity of wooden furniture is sold, though average household level quantity is highest in
the Sal zone (Table 9.11).
Highlights
‐ As with primary tree and forest products, households sell very little processed
products, probably because they are for household use.
‐ Handicraft is the most common product sold across zones.
‐ The number of handicrafts produced is higher in the Coastal zone compared to
others.
‐ The quantity of wooden furniture sold is highest in the Village zone due to a larger
number of total households.
Table 9.11. Quantity of the processed tree and forest products supplied to the market by households.
Zones Wooden furniture Handicrafts
No/HH/year No/year No/HH/year No/year
Sundarban periphery 0.070 26,812 1.653 633,105
Coastal 0.001 531 2.304 2,167,737
Hill 0.000 0 1.729 1,504,682
Sal 0.047 185,884 0.242 960,554
Village 0.013 343,916 0.073 1,954,581
National 0.017 557,143 0.218 7,220,660

190
Annualincomeearningfromprocessedtreeandforestproducts
Description
The gross income from processed tree and forest products was estimated by multiplying
the quantity sold with price. Then, the associated selling cost was deducted to know the
zone‐specific net income (BDT/HH/year).
The annual income earned from selling processed products is limited. Though a household
in the Coastal zone earned higher than their counterparts living in other zones, total income
is highest in the Village zone. The Village zone contributed more than half of the total
income from processed products (Table 9.12).
Highlights
‐ In the Village zone, total household income from processed products is higher than
in other zones. ‐ The total annual national income from processed tree and forest products is 1,994
million BDT.
‐ Processed tree and forest products represent 0.01% of the Gross National Income
measured in current market price.
Table 9.12. Income from processed tree and forest products across zones.
Zone Average income (BDT/hh/year) Total income (million BDT/year)
Sundarban periphery 45.18 17.31
Coastal 512.43 482.19
Hill 271.28 236.12
Sal 28.46 112.74
Village 42.60 1,146.11
National 60.33 1,994.47

191
Involvementwithtreeandforestrelatedactivities
Numberandproportionofhouseholdmembersinvolved/employedintree&forestrelatedactivities
Description
During the socio‐economic survey respondents were asked for the number of household
members involved with different tree and forest related activities during the last 12 months.
For those households which were involved with tree and forest related activities, about three
members per household collected primary tree and forest products, with the highest members
per household in the Village zone (Table 9.13).
Primary tree and forest product collection is also the main tree and forest related activity in
terms of total number of people, involving 105.5 million people annually at the national scale
(Table 9.14). This is 64% of the total population compared to only 1.7% and 0.1% for processing
and selling activities, respectively.
Nationally, 53.3 million women collect primary tree and forest products. More women per
household in the Sundarban periphery, Coastal, and Hill zones were involved with processing
and selling tree and forest products than in the Sal and Village zones (Table 9.15).
Highlights
‐ More people in the Village zone (both in terms of number and proportion) were
involved with primary tree and forest product collection than other zones (Table 9.13
and 9.14).
‐ 64% of the total national population is involved in collecting primary tree and forest
products (Table 9.14).
‐ Women involvement in collecting tree and forest resources is significant. Around 65%
of the country’s total women population were involved with collecting primary tree
and forest products (Table 9.15).
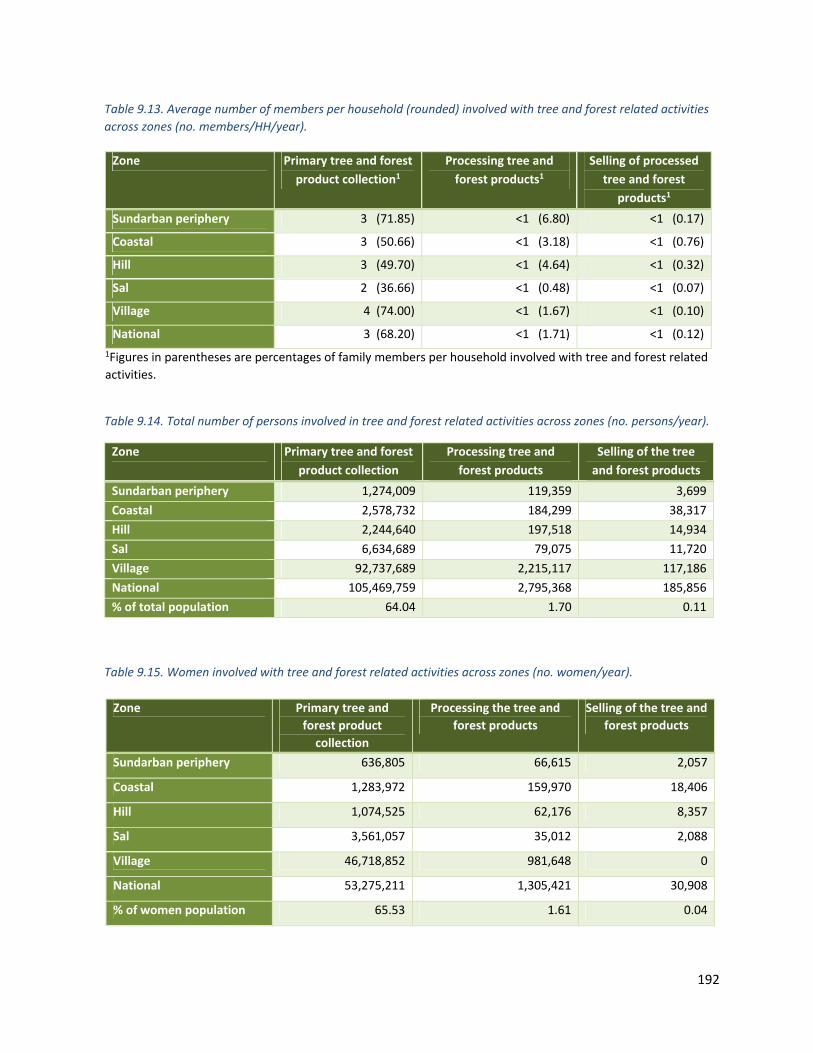
192
Zone Primary tree and forest
product collection1 Processing tree and
forest products1 Selling of processed
tree and forest products1
Sundarban periphery 3 (71.85) <1 (6.80) <1 (0.17)
Coastal 3 (50.66) <1 (3.18) <1 (0.76)
Hill 3 (49.70) <1 (4.64) <1 (0.32)
Sal 2 (36.66) <1 (0.48) <1 (0.07)
Village 4 (74.00) <1 (1.67) <1 (0.10)
National 3 (68.20) <1 (1.71) <1 (0.12)
1Figures in parentheses are percentages of family members per household involved with tree and forest related
activities.
Table 9.13. Average number of members per household (rounded) involved with tree and forest related activities across zones (no. members/HH/year).
Zone Primary tree and forest product collection
Processing tree and forest products
Selling of the tree and forest products
Sundarban periphery 1,274,009 119,359 3,699
Coastal 2,578,732 184,299 38,317
Hill 2,244,640 197,518 14,934
Sal 6,634,689 79,075 11,720
Village 92,737,689 2,215,117 117,186
National 105,469,759 2,795,368 185,856
% of total population 64.04 1.70 0.11
Table 9.14. Total number of persons involved in tree and forest related activities across zones (no. persons/year).
Zone Primary tree and forest product
collection
Processing the tree and forest products
Selling of the tree and forest products
Sundarban periphery 636,805 66,615 2,057
Coastal 1,283,972 159,970 18,406
Hill 1,074,525 62,176 8,357
Sal 3,561,057 35,012 2,088
Village 46,718,852 981,648 0
National 53,275,211 1,305,421 30,908
% of women population 65.53 1.61 0.04
Table 9.15. Women involved with tree and forest related activities across zones (no. women/year).

193
Servicesandbenefitsfromtreesandforest
Description
The proportion of households in a zone receiving a forest related service was estimated as the
ratio of total service recipient households and total number of households surveyed in the zone,
adjusted by a two‐factor weight.
Households not only earn their livelihood from tree and forests, but also benefit from several other
essential services. A high proportion of households benefiting from different tree and forest
related services may indicate for high level of interaction between human and tree and forests.
Among different tree and forest related livelihood options, highest proportion of households were
involved with primary tree and forest products (Table 9.16 and 9.17).
Few of the households earn income from co‐management and social forestry. In the Sal and Village
zones, no household reported to earn from co‐managed forestry (Table 9.16). Only 0.2%
households participate in social forestry programs according to respondents.
The FD also has records from social forestry participation which indicate 2% of households
participate in social forestry from 1981 to 2018. The FD figure is cumulative over many years, in
contrast to the socio‐economic survey, which is a snapshot of the current number of beneficiaries.
Highlights
‐ All the households have received at least one tree and forest related service (Table 9.16
and 9.17), which indicates very high level of interactions between trees and forest and
human in Bangladesh.
‐ Among the livelihood related services, collection of primary tree and forest products is the
most common, particularly in Sundarban periphery, Village, Hill and Coastal zones.
Primary tree and forest products contribute in income of one out of every three
households (Table 9.16).
‐ Shade, natural windbreak, pollution control, medicinal, soil quality and fertility are the
most common services enjoyed by the households (Table 9.17).

194
Zones Collection and production of tree and forest products
Tree and forest as source of income
Collection of
primary tree
and forest
products
Producing
tree and
forest
products
Primary
tree and
forest
products
Processed
tree and
forest
products
Co‐managed
forestry
Social
forestry
Sundarban periphery
99.47 23.37 47.62 0.67 1.51 0.41
Coastal 94.70 11.27 36.62 2.77 0.15 0.07
Hill 95.31 14.79 28.73 1.48 0.50 0.71
Sal 52.65 0.80 14.85 0.24 0.00 0.11
Village 97.56 6.13 31.65 0.40 0.00 0.17
National 92.06 6.07 29.89 0.48 0.04 0.18
Table 9.16. Percentage of HH receiving different livelihood services from tree and forest related services.
Services/benefits % of HHs
Shade 94.51
Natural windbreak 86.93
Pollution control 65.33
Medicinal 53.29
Soil quality and fertility 51.26
Erosion control 40.09
Livestock grazing 25.16
Tourism 12.14
Recreation 15.09
Aesthetic 14.26
Religious/ spiritual 7.18
Freshwater/ water conservation 5.88
Others 21.47
Table 9.17. Percentage of HH receiving different services/benefits from tree and forest.
195
Dependenceontreesandforestsforenergy
Valueofcollectedforestproductsusedforcookingandheating
Description
The value of the tree and forest products that a household collects for heating and cooking
purposes was estimated by multiplying the quantities of fuel wood and leaves collected with
the price. The price here was the price at which the households sold the products.
The national level total value of products used for cooking and heating is 202,927 million
BDT/year. The Village zone has the highest total value among all zones, followed by Hill, Sal,
Coastal and Sundarban periphery. The average household level collection is by far the highest
in the Hill zone, followed by Sundarban periphery, Village, Coastal and Sal zones (Table 9.18).
Highlights
‐ The national average amount of forest products collected for cooking and heating
is 1,442 kg/HH/year,
‐ The Hill zone average value of cooking and heating forest products is four times
higher than the national average.
‐ The Sal zone collected 2.4 times less forest products for cooking and heating than
the national average, perhaps because this more urbanized zone is using more
alternative fuels than other zones.
‐ 80% of the total national value is from the Village zone (Table 9.18).
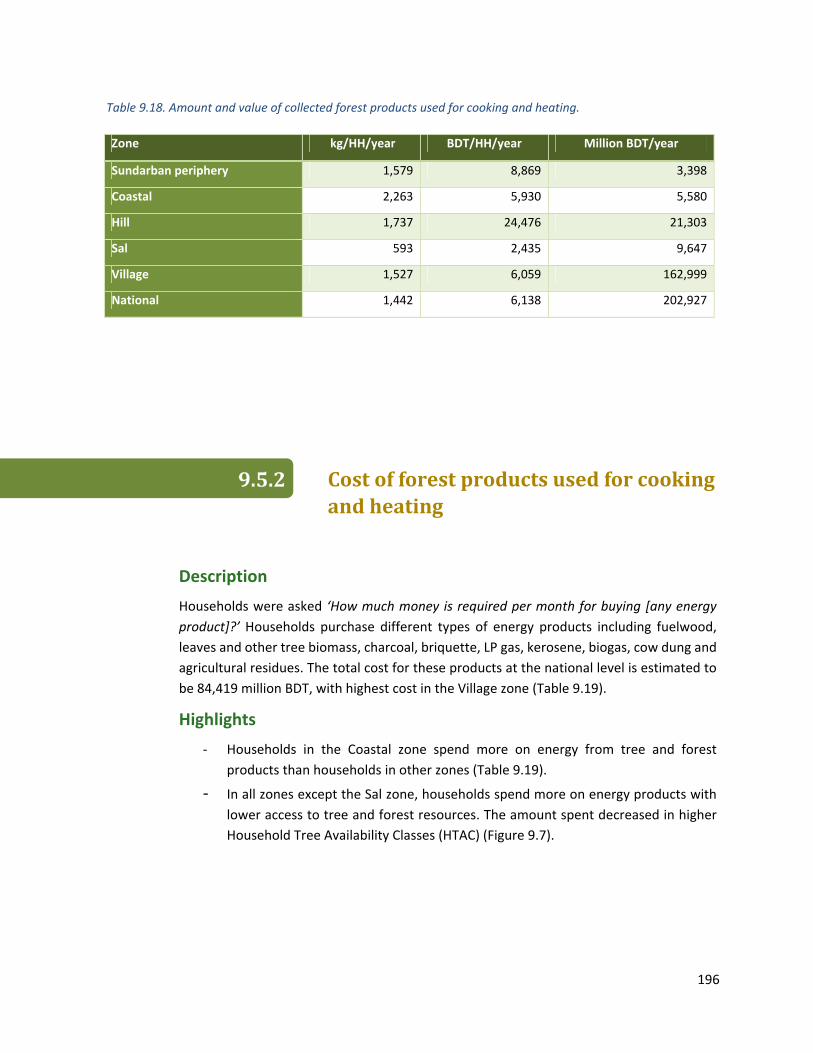
196
Costofforestproductsusedforcookingandheating
Zone kg/HH/year BDT/HH/year Million BDT/year
Sundarban periphery 1,579 8,869 3,398
Coastal 2,263 5,930 5,580
Hill 1,737 24,476 21,303
Sal 593 2,435 9,647
Village 1,527 6,059 162,999
National 1,442 6,138 202,927
Table 9.18. Amount and value of collected forest products used for cooking and heating.
Description
Households were asked ‘How much money is required per month for buying [any energy product]?’ Households purchase different types of energy products including fuelwood, leaves and other tree biomass, charcoal, briquette, LP gas, kerosene, biogas, cow dung and
agricultural residues. The total cost for these products at the national level is estimated to
be 84,419 million BDT, with highest cost in the Village zone (Table 9.19).
Highlights
‐ Households in the Coastal zone spend more on energy from tree and forest
products than households in other zones (Table 9.19).
‐ In all zones except the Sal zone, households spend more on energy products with
lower access to tree and forest resources. The amount spent decreased in higher
Household Tree Availability Classes (HTAC) (Figure 9.7).

197
Table 9.19. Cost of buying forest products used for cooking and heating.
Zone BDT/HH/year million BDT/year
Sundarban periphery 1,695 649
Coastal 3,979 3,744
Hill 3,210 2,794
Sal 2,842 11,261
Village 2,452 65,970
National 2,554 84,419
Figure 9.7. Cost of buying forest products used for cooking and heating across Household Tree Availability Classes (HTAC).
0
5000
10000
15000
20000
Sundarb…
Sundarb…
Sundarb…
Sundarb…
Coastal_1
Coastal_2
Coastal_3
Coastal_4
Hill_1
Hill_2
Hill_3
Hill_4
Sal_1
Sal_2
Sal_3
Sal_4
Villages_1
Villages_2
Villages_3
Villages_4
million BDT/year

198
Presumedamountofpurchasedtreeandforestproductsusedforenergy
Description
The difference between consumption and collection of tree and forest products used for
energy is the presumed amount of purchased energy products. This simplified metric
ignores that the household may benefit from the collection of fuelwood or leaves from
others at no cost.
Annually households purchase 8,946,504 tons of fuelwood from the market. For leaves,
except Sundarban periphery and Sal, households do not purchase from market (Table 9.20).
The reason that zones with more urbanized areas, such as the Sal and Village zones, have
lower purchased amounts may reflect that more gas and other sources of energy are
purchased in these areas.
Highlights
‐ About 82% of purchased fuelwood at the national level comes from Village zone.
‐ The Village zone has the highest surplus of leaves, i.e. after meeting the demand
for cooking and heating purposes, households here possess enough to be used for
other purposes.
Table 9.20. Presumed amount of purchased tree and forest products used for energy.
Zone Fuelwood Leaves Energy
(both fuelwood and leaves)
kg/HH/year t/year kg/HH/year t/year kg/HH/year t/year
Sundarban periphery 261.97 110,632 27.41 11,574 289.37 122,205
Coastal 351.51 364,602 ‐34.97 ‐36,270 316.54 328,332
Hill 347.26 333,173 ‐2.43 ‐2,335 344.83 330,839
Sal 189.23 826,423 2.72 11,870 191.95 838,294
Village 246.55 7,311,674 ‐5.41 ‐160,515 241.14 7,151,158
National 245.50 8,946,504 ‐4.82 ‐175,676 240.68 8,770,828
Note: Purchased Amount = Consumed Amount – Collected Amount. A negative sign means households have
surplus, which may be used for other purposes.

199
Totalannualincomefromtreesandforests
Description
Total annual income from trees and forests includes income from selling primary or processed
products (sections 9.1.4 and 9.2.3) and also income from other services (section 9.4). Total
national income from tree and forest is 302,812 million BDT/year. The largest contribution is
from the Village zone though it also has the lowest average annual income. A household in the
Sundarban periphery has three times higher annual income from tree and forests than the
national average (Table 9.21).
Nationally around 3.5% of a household’s annual income came from trees and forests (Table
9.22). Contribution from tree and forest to annual income is the highest in the Sundarban
periphery (9.0%) and the lowest in the Sal zone (2.6%). In addition, the percent of annual
income increased with increasing access to trees and forests (i.e. HTAC), as much as 15% in the
Sundarban periphery and 12% in the Hill (Appendix 9.2a).
Nationally, households belonging to the middle‐income group (3rd 60%) earned relatively high
income from trees and forests than other quintiles. Notable differences existed across zones
however. For instance, in the Sundarban periphery the top quintile earned at least 1.5 times
higher than any other quintile. This may be due to greater ability in this quintile to obtain
necessary investments, especially for fishery products. In the Sal zone, tree and forest income
has the lowest contribution, which may be due to relatively high level of urbanization (Figure
9.8). Households belonging to higher income classes earn more from tree and forest products,
which suggests those income levels are benefitting more financially from tree and forest
resources (Figure 9.9).
Highlights
‐ The total income from tree and forest is 1.29% of the 2017‐18’s national GNI measured
in current market price. The contribution reduced to 1.15% when fisheries products
are not considered.

200
‐ The Village zone alone contributes more than three‐fourths of the total national
forestry income (Table 9.21).
‐ A household in the Sundarban periphery earned the highest from trees and forests
than in other zones when fishery products are included (Table 9.21). When fishery
products are excluded, about three‐fourths of the income is reduced.
‐ At the national level, both average and total income reduces by around 11% when
fisheries products are not considered (Table 9.21).
‐ Households belonging to higher income classes earn more from tree and forest
products (Figure 9.9), though in terms of share to total income there do not exist any
clear pattern (Figure 9.8).
Table 9.21. Household’s total annual income from tree and forest products.
Zone Income1 Income excluding fisheries1
Average income
(BDT/HH/year)
Total income
(million
BDT/year)
Average income
(BDT/HH/year)
Total income
(million
BDT/year)
Sundarban periphery 29,275 11,216 6,893 2,641
Coastal 12,362 11,632 9,191 8,649
Hill 14,703 12,797 13,447 11,704
Sal 9,347 37,032 9,345 37,024
Village 8,554 230,135 7,791 209,601
National 9,160 302,812 8,156 269,6441Estimated by adding income from different tree and forest related activities (i.e. income from primary and
processed products, salary).
Zone Percentage of total annual income1
Sundarban periphery 9.02
Coastal 5.45
Hill 6.86
Sal 2.56
Village 3.40
National 3.52
1Estimated as the ratio of total tree and forest income and total annual income.
Table 9.22. Percentage of total annual income received by households from forest.
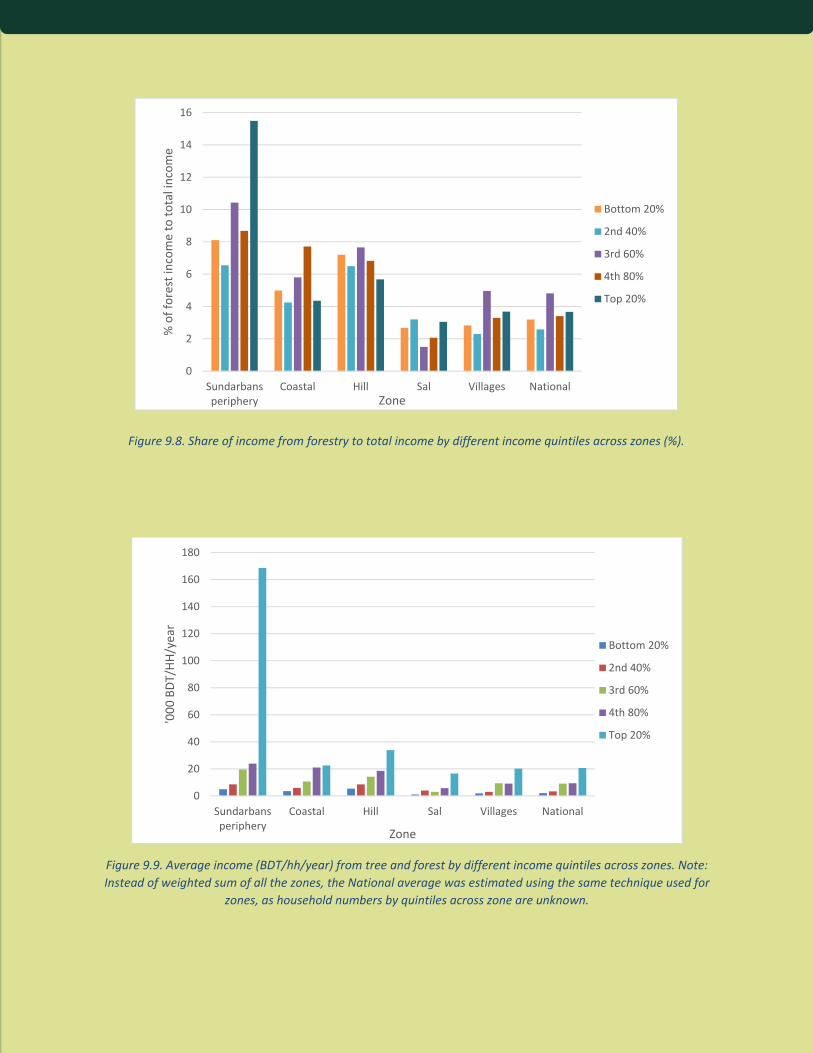
201
0
2
4
6
8
10
12
14
16
Sundarbansperiphery
Coastal Hill Sal Villages National
% of forest income to total income
Zone
Bottom 20%
2nd 40%
3rd 60%
4th 80%
Top 20%
Figure 9.8. Share of income from forestry to total income by different income quintiles across zones (%).
0
20
40
60
80
100
120
140
160
180
Sundarbansperiphery
Coastal Hill Sal Villages National
'000 BDT/HH/year
Zone
Bottom 20%
2nd 40%
3rd 60%
4th 80%
Top 20%
Figure 9.9. Average income (BDT/hh/year) from tree and forest by different income quintiles across zones. Note: Instead of weighted sum of all the zones, the National average was estimated using the same technique used for
zones, as household numbers by quintiles across zone are unknown.

202
Photo: Flowering of sal tree,
©Akhtar M.

203
Ahmed, Z. U., Z. T. Begum, M. A. Hassan, M. Khondker, S. Kabir, M. Ahmad, A. Ahmed, A. Rahman and E. Haque (2008). "Encyclopedia of flora and fauna of Bangladesh." Asiatic Society of Bangladesh, Dhaka.
Akhter, M., Shaheduzzaman M (2013). Forest Classification Systems in Bangladesh, UN‐REDD Programme, Bangladesh Forest Department, Food and Agriculture Organization of the United Nations.
Akter, A. and M. Zuberi (2009). "Invasive alien species in Northern Bangladesh: identification, inventory and impacts." International journal of biodiversity and conservation 1(5): 129‐134.
Allen, S. (1986). "Chemical analysis." Methods in plant ecology: 285‐344.
Ara, H., B. Khan and S. Uddin (2013). "Red data book of vascular plants of Bangladesh." Bangladesh National Herbarium, Dhaka 2: 1‐180.
Aziz, A. and A. Paul (2015). "Bangladesh Sundarbans: Present Status of the Environment and Biota." Diversity 7(3): 242.
BBS (2016). Statistical Yearbook of Bangladesh 2015, Government of the People's Republic of Bangladesh.
BFD (2016a). Emission factor database for the Land use, land‐use change, and forestry (LULUCF) sector of Bangladesh. Dhaka, Bangladesh Forest Department, Food and Agriculture Organization of the United Nations internal document: 114.
BFD (2016b). Quality assurance and quality control for the Bangladesh Forest Inventory. Dhaka, Bangladesh, Bangladesh Forest Department, Food and Agriculture Organization of the United Nations.
BFD (2016c). Field instructions for the Bangladesh Forest Inventory (Version 1.2), Bangladesh Forest Department, United States Forest Service, Food and Agriculture Organization of the United Nations.
BFD (2016d). Manual for Soil Measurements for the Bangladesh Forest Inventory. Dhaka, Bangladesh Forest Department, Food and Agriculture Organization of the United Nations.
BFD (2016e). The Bangladesh forest inventory design: Methodological approach. Dhaka, Bangladesh Forest Department, Food and Agriculture Organization of the United Nations: 74.
BFD (2016f). Zoning for tree and forest assessment in Bangladesh. Dhaka, Bangladesh Forest Department, Food and Agriculture Organization of the United Nations: 57.
BFD (2017a). Socioeconomic Field Instructions for the Enumerators of Bangladesh Forest Inventory. Dhaka, Bangladesh Forest Department, Food and Agriculture Organization of the United Nations: 1‐226.
BFD (2017b). Quality assurance and quality control for the socio‐economic component of the Bangladesh Forest Inventory. Dhaka, Bangladesh Fores Department, Food and Agriculture Organization of the United Nations: 20.
References

204
BFD (2018). Laboratory analysis of sub‐samples and development of allometric equation for Heritiera fomes Buch.‐Ham of the Sundarbans and tree species of Sal zone. Dhaka.
Bijaya, D. G. C. and J. Bhandari (2008). "Carbon Sequestration Potential and uses of Dendrocalamus strictus." IUFRO World Series Volume 27: 62.
BSGI (2016). Protocol for describing land features in Bangladesh Dhaka, Bangladesh Society of Geoinformatics, Bangladesh Forest Department and Food and Agriculture Organization of the United Nations.
Chakma, N. (2016). Proceedings of the Information sharing meeting on Bangladesh Forest Inventory implementation in the Chittagong Hill Tracts (Rangamati, Khagrachari and Bandarban hill district), Bangladesh Forest Department, Food and Agriculture Organization of the United Nations.
Chowdhury, N., L. Costello and N. Chakma (2016). Understanding tree and forest resource change in Bangladesh: A literature review to support the preparation of the socioeconomic survey. Dhaka, Bangladesh Forest Department, Food and Agriculture Organization of the United Nations: 54.
CIAT and WB (2017). Climate‐Smart Agriculture in Bangladesh. CSA Country Profiles for Asia Series. Washington, D.C., International Center for Tropical Agriculture (CIAT). World Bank: 28.
CITES. (2019). "CITES Trade Database." Retrieved 17 February 2019, from https://trade.cites.org/.
Corona, P. and M. Marchetti (2007). "Outlining multi‐purpose forest inventories to assess the ecosystem approach in forestry." Plant Biosystems 141(2): 243‐251.
Costello, L. and M. Henry (2016). Bangladesh Forest Inventory: Design. Dhaka, Bangladesh Forest Department, Food and Agriculture Organisation of the United Nations, USAID, SilvaCarbon.
Costello, L. and M. Piazza (2015). Proceedings from the training survey design and data management using Open Foris collect for NFI and carbon stock assessment in Bangladesh, Dhaka, Bangladesh, Bangladesh Forest Department, Food and Agriculture Organization of the United Nations.
Costello, L., M. Piazza, Z. Iqbal, B. Nur Siddiqui, R. Siddiqui and M. Henry (2016). Experiences in field missions to locate the plots of the 2005 National Forest Assessment of Bangladesh, Dhaka, Bangladesh, Bangladesh Forest Department, Food and Agriculture Organization of the United Nations.
Dasgupta, S., F. Akther Kamal, Z. Huque Khan, S. Choudhury and A. Nishat (2015). River salinity and climate change: evidence from coastal Bangladesh. WORLD SCIENTIFIC REFERENCE ON ASIA AND THE WORLD ECONOMY, World Scientific: 205‐242.
Dasgupta, S., M. M. Hossain, M. Huq and D. Wheeler (2014). Climate change, soil salinity, and the economics of high‐yield rice production in coastal Bangladesh, The World Bank.
Davidson, J. and S. Das (1985). "Eucalyptus in Bangladesh." Silviculture Division Bulletin(6).
de Foresta, H., A. Temu, D. Boulanger, H. Feuilly and M. Gauthier (2013). Towards the assessment of trees outside forests: a thematic report prepared in the Framework of the Global Forest Resources Assessment 2010, Food and Agriculture Organization of the United Nations.

205
de Melo, L. C., C. R. Sanquetta, A. P. Dalla Corte and F. Mognon (2015). "Methodological alternatives in the estimate of biomass for young individuals of bambusa genus." Bioscience Journal 31(3).
Di Gregorio, A. (2016). Land Cover Classification System, Advance Database Gateway, Software Version 3. Rome, Italy, Food and Agriculture Organization of the United Nations, UN‐REDD Programme.: 26.
Di Gregorio, A. (2013). Recommendations on the land and forest classification system of Bangladesh, Training workshop on Land cover classification in the context of REDD+ in Bangladesh UN‐REDD Programme, Food and Agriculture Organization of the United Nations, Dhaka Bangladesh.
Di Gregorio, A., M. Akhter and M. S. Islam (2014). Land cover classification systems in the context of REDD+ in Bangladesh: a study analysis using LCCS3. Dhaka, Food and Agricultural organization fot the United Nations: 46.
Donato, D. C., J. B. Kauffman and M. Stidham (2009). Protocols for Measuring & Reporting Carbon Stocks in Mangrove Forests, With Special Reference to Carbon Assessment for Sundarbans Reserve Forest, Bangladesh, U.S.D.A. Forest Service, Pacific Southwest Research Station, Northern Research Station, International Programs: 77.
Duncanson, L., W. Huang, K. Johnson, A. Swatantran, R. E. McRoberts and R. Dubayah (2017). "Implications of allometric model selection for county‐level biomass mapping." Carbon balance and management 12(1): 18.
FAO‐UNDP (1988). Bangladesh General Soil Type. Soil Resource Development Institute, Dhaka, Bangladesh.
FAO (2015a). Global Forest Resources Assessment 2015 ‐ Desk reference. Rome.
FAO (2015b). Knowledge reference for national forest assessment. Rome, Food and Agriculture Organization of the United Nations: 152.
FAO (2017a). Criteria and Indicators: A Tool for Enhancing Sustainable Forest Management from Policy to Practice.
FAO (2017b). Voluntary Guidelines on National Forest Monitoring. Rome, Food and Agriculture Organization of the United Nations.
FAO (2018a). Global Forest Resource Assessment 2020‐ Guidelines and specifications. Rome, Food and Agriculture Organization of the United Nations: 58.
FAO (2018b). Global Forest Resources Assessment 2020. Terms and definitions. Rome, Italy, FAO forestry department.
Faruque, M., M. Rahaman, M. Hoque, K. Ikeya, T. Amano, J. Han, T. Dorji and A. Omar (2015). "Present status of gayal (Bos frontalis) in the home tract of Bangladesh." Bangladesh Journal of Animal Science 44(1): 75‐84.
Franceschini, G., R. Jalal, M. S. Islam, Z. Iqbal, T. Aziz, A. Begum, S. B. Shewli, M. F. Shaunak, M. N. Jahan, S. Haque, M. A. Rahman, A. Hadi, T. Pramanik, M. Akhter, L. Costello, T. S. Udita and M. Henry (2016).

206
Production chain for land cover mapping in Bangladesh. Dhaka, Bangladesh, Bangladesh Forest Department, Food and Agricultural Organization of the United Nations, Dhaka, Bangladesh.
GED (2012). Perspective Plan of Bangladesh 2010‐2021 Making Vision 2021 a Reality, Government of the People’s Republic of Bangladesh.
GED (2015). Seventh Five Year Plan, FY2016 – FY2020, Accelerating Growth, Empowering Citizens, General Economics Division (GED), Planning Commission, Government of the People’s Republic of Bangladesh.
GFOI (2014). Integrating remote‐sensing and ground‐based observations for estimation of emissions and removals of greenhouse gases in forests: Methods and Guidance from the Global Forest Observations Initiative. Geneva, Switzerland, Group on Earth Observations.
GOB (2015). 7th Five year plan (2016‐20): Accelerating Growth, Empowering Citizens. G. E. Division. Dhaka, Bangladesh Planning commission: 726.
GoB (2016). National Forestry Policy 2016 (Final Draft). Dhaka: 21.
GoB (2017a). Bangladesh Country Investment Plan on Environment, Forestry and Climate Change 2016–2021. Dhaka, Bangladesh.
GoB (2017b). The socio‐economic survey design of the Bangladesh Forest Inventory. Dhaka, Bangladesh Forest Inventory, Forest Department, Ministry of Environment and Forest, Government of the People’s Republic of Bangladesh: 71.
GoB (2019). Land Representation System of Bangladesh (draft). Dhaka, Forest Department, Ministry of Environment, Forests and Climate Change, Government of the People’s Republic of Bangladesh.
Hadi, A. (2016). Proceedings of training on translation and harmonization of SRDI Land Use Map Legend into LCCS (v.3), Dhaka, Bangladesh Society of Geoinformatics, Bangladesh Forest Department, Food and Agriculture Organization of the United Nations.
Hadi, A. K., A. U., and Kamal, M. (2016). Protocol for describing land features in Bangladesh. Data collection field manual. Dhaka, Bangladesh Forest Department, Food and Agriculture Organization of the United Nations.
Harmon, M. E., C. W. Woodall, B. Fasth, J. Sexton and M. Yatkov (2011). "Differences between standing and downed dead tree wood density reduction factors: a comparison across decay classes and tree species." Res. Pap. NRS‐15. Newtown Square, PA: US Department of Agriculture, Forest Service, Northern Research Station. 40 p. 15: 1‐40.
Haub, C., L. Kleinewillinghöfer, V. Garcia Millan and A. Di Gregorio (2015). Protocol for land cover validation, EFTAS, Food and Agriculture Organization: 43.
Henry, M., M. Cifuentes Jara, M. Réjou‐Méchain, D. Piotto, J. M. Michel Fuentes, C. Wayson, F. Alice Guier, H. Castañeda Lombis, E. Castellanos López, R. Cuenca Lara, K. Cueva Rojas, J. Del Águila Pasquel, Á. Duque Montoya, J. Fernández Vega, A. Jiménez Galo, O. R. López, L. G. Marklund, F. Milla, J. de Jesús Návar Cahidez, E. O. Malavassi, J. Pérez, C. Ramírez Zea, L. Rangel García, R. Rubilar Pons, C. Sanquetta, C. Scott,

207
J. Westfall, M. Zapata‐Cuartas and L. Saint‐André (2015). "Recommendations for the use of tree models to estimate national forest biomass and assess their uncertainty." Annals of Forest Science 72(6): 769‐777.
Hijmans, R. J., S. E. Cameron, J. L. Parra, P. G. Jones and A. Jarvis (2005). "Very high resolution interpolated climate surfaces for global land areas." International Journal of Climatology 25(15): 1965‐1978.
Hjelm, B. (2015). Empirical models for estimating volume and biomass of poplars on farmland in Sweden, Department of Crop Production Ecology, Swedish University of Agricultural ….
Hossain, M. (2016). Improved National Tree Allometric Equation Database to Support Forest Monitoring and Assessment of Bangladesh. Dhaka, Bangladesh Forest Department, Food and Agriculture Organization of the United Nations, Forestry and Wood Technology Discipline, Khulna University, Khulna, Bangladesh.
Hossain, M. A. (2017). R‐script for Quality Assurance and Quality Checking of Bangladesh Forest Inventory Soil and Litter Data. Dhaka, Bangladesh, Food and Agriculture Organization of the United Nations.
Hossain, M. A., A. R. Anik, N. Chakma, K. Johnson, M. Henry, R. Jalal, O. Carrillo, C. Scott, L. Birigazzi and Z. Iqbal (2019). Estimation Procedures of the Bangladesh Forest Inventory. Dhaka, Bangladesh, Bangladesh Forest Department and Food and Agricultural Organization of the United Nations.
Hossain, M. A., S. Laurent and L. Birigazzi (2017). R‐script for Bangladesh Forest Inventory Data Analysis. Dhaka, Bangladesh, Food and Agriculture Organization of the United Nations.
Hossain, M. A., S. Laurent, G. Sola, L. Birigazzi and T. Aziz (2017). R‐script for Bangladesh Forest Inventory Data Quality Assurance and Quality Checking. Dhaka, Bangladesh, Food and Agriculture Organization of the United Nations.
Hossain, M. K. and A. R. Hoque (2013). Eucalyptus dilemma in Bangladesh, Institute of Forestry and Environmental Sciences, University of Chittagong.
Hossain, M. K. and M. K. Pasha (2004). "An account of the exotic flora of Bangladesh." J. Forestry and Environment 2: 99‐115.
Iqbal, Z., O. Kuegler, M. Saket, L. Rahman, R. Siddiqui, C. Scott, M. Al‐Amin, M. Akhter, B. Siddiqui, M. Rahman, R. Jalal, R. Mukul, L. Ravensback, L. Costello, T. Zālītis, R. Mohaiman and M. Henry (2016). The Bangladesh Forest Inventory Design: Methodological Approach. Dhaka, Food and Agricultural Organization of the United Nations: 74.
Islam, M. S., Z. Iqbal, G. Franceschini, R. Jalal, T. Aziz, A. Begum, S. B. Shewli, M. F. Shaunak, M. N. Jahan, S. Haque, M. Rahman, A. Hadi, M. A. T. Pramanik, M. Akhter, L. Costello, T. Udita, K. Z. Tasnim and M. Henry (2016). Legend for National Land Cover Map, Bangladesh Forest Department, Food and Agriculture Organization of the United Nations: 38.
IUCN. (2018). "The IUCN Red List of Threatened Species. Version 2018‐2." from http://www.iucnredlist.org.
Jalal, R., M. Z. Iqbal, M. Henry, G. Franceschini, M. S. Islam, M. Akhter, Z. T. Khan, M. A. Hadi, M. A. Hossain, M. G. Mahboob, T. S. Udita, T. Aziz, S. M. Masum, L. Costello, C. R. Saha, A. A. M. Chowdhury, A. Salam, F. Shahrin, F. R. Sumon, M. Rahman, M. A. Siddique, M. M. Rahman, M. N. Jahan, M. F. Shaunak, M. S.

208
Rahman, M. R. Islam, N. Mosca, R. d’Annunzio, S. Hira and A. d. Gregorio (2019). "Towards efficient land cover mapping: an overview of the national land representation system and land cover map 2015 of Bangladesh." IEEE JSTARS (in press).
Jenkins, J. C., D. C. Chojnacky, L. S. Heath and R. A. Birdsey (2003). "National‐scale biomass estimators for United States tree species." Forest science 49(1): 12‐35.
Johnson, K. D., R. Birdsey, J. Cole, A. Swatantran, J. O’Neil‐Dunne, R. Dubayah and A. Lister (2015). "Integrating LiDAR and forest inventories to fill the trees outside forests data gap." Environmental monitoring and assessment 187(10): 623.
Kengen, S. (1997). Forest valuation for decision‐making: lessons of experience and proposals for improvement, FAO Rome.
Khan, M., M. Rahman and M. Ali (2001). "Red data book of vascular plants of Bangladesh."
Köhl, M., S. S. Magnussen and M. Marchetti (2006). Sampling methods, remote sensing and GIS multiresource forest inventory, Springer Science & Business Media.
Komiyama, A., J. E. Ong and S. Poungparn (2008). "Allometry, biomass, and productivity of mangrove forests: A review." Aquatic Botany 89(2): 128‐137.
Korhonen, K. T. and O. Salmensuu (2014). Formulas for estimators and their variances in NFI.
Kumar, M. F., L. Costello, R. Mahamud, M. Henry and K. Johnson (2017). Bangladesh Forest Inventory Data Management Protocol. Dhaka, Bangladesh Forest Department, Food and Agriculture Organization of the United Nations.
Kumar, M. F., R. Mahamud, L. Costello, N. Sarkar, K. Jhonson, A. Hossain and M. Henry (2017). Field Manual on DGPS and RFID chip for Bangladesh Forest Inventory. Dhaka, Bangladesh, Bangladesh Forest Department, Food and Agriculture Organization of the United Nations.
Larrubia, C. J., K. Ross, B. Wolfslehner, R. Guldin and E. Rametsteiner (2017). Using criteria and indicators for sustainable forest management. A way to strengthen results‐based management of national forest programmes. FAO Forestry Policy and Institutions Working Paper; FAO: Rome, Italy.
Laurent, S. and M. A. Hossain (2017). R‐script for Data Corrections of Bangladesh Forest Inventory. Dhaka, Bangladesh, Food and Agriculture Organization of the United Nations.
Lobovikov, M., L. Ball, M. Guardia and L. Russo (2007). World bamboo resources: a thematic study prepared in the framework of the global forest resources assessment 2005, Food & Agriculture Org.
Magnussen, S. and D. Reed (2004). "Modeling for estimation and monitoring." Knowledge Reference for National Forest Assessments 111.
Mahmood, A. B. and M. H. Khan (2010). "Landslide vulnerability of Bangladesh hills and sustainable management options: a case study of 2007 landslide in Chittagong City." Messages v.

209
Mahmood, H., M. R. Siddique, L. Costello, L. Birigazzi, S. R. Abdullah, M. Henry, B. N. Siddiqui, T. Aziz, S. Ali and A. Al Mamun (2019a). "Allometric models for estimating biomass, carbon and nutrient stock in the Sal zone of Bangladesh." iForest‐Biogeosciences and Forestry 12(1): 69.
Mahmood, H., M. R. H. Siddique, S. Z. Islam, S. R. Abdullah, H. Matieu, M. Z. Iqbal and M. Akhter (2019b). "Applicability of semi‐destructive method to derive allometric model for estimating aboveground biomass and carbon stock in the Hill zone of Bangladesh." Journal of Forestry Research: 1‐11.
Mahmood, H., Siddique, M.R.H., Abdullah, S.M.R., Akhter, M. and Islam, S.M.Z. (2018). Training on Laboratory Analysis of the Samples used for Hill Zone Allometric Equation (AE), Bangladesh Forest Department, Food and Agricultural Organization of the United Nations.
Margalef, R. (1958). "Information theory in biology." General Systems Yearbook 3: 36‐71.
Marshall, P. L., G. Davis and V. M. LeMay (2000). Using line intersect sampling for coarse woody debris, Vancouver Forest Region.
Masiero, M., D. Pettenella, M. Boscolo, S. K. Barua, I. Animon and R. Matta (2019). Valuing forest ecosystem services‐ A training manual for planners and project developers. Rome, Italy, Food and Agriculture Organization of the United Nations: 218.
McRoberts, R. E., E. O. Tomppo and R. L. Czaplewski (2015). "Sampling designs for national forest assessments." Knowledge Reference for National Forest Assessments; FAO: Rome, Italy: 23‐40.
MoEF and FAO (2007). National forest and tree resources assessment 2005‐2007 Bangladesh. D. Altrell, M. Saket, L. Lyckebäck and M. Piazza. Dhaka, Bangladesh, Bangladesh Forest Department and Food and Agriculture Organization of the United Nations.
Pearson, T. R., S. L. Brown and R. A. Birdsey (2007). "Measurement guidelines for the sequestration of forest carbon." Gen. Tech. Rep. NRS‐18. Newtown Square, PA: US Department of Agriculture, Forest Service, Northern Research Station. 42 p. 18.
Picard, N., L. Saint André and M. Henry (2012). "Manual for building tree allometric equations: from the field to the prediction." Food and Agriculture Organization of the United Nations, Centre de Coopération Internationale en Recherche Agronomique, Rome.
Potapov, P., B. Siddiqui, Z. Iqbal, T. Aziz, B. Zzaman, A. Islam, A. Pickens, Y. Talero, A. Tyukavina and S. Turubanova (2017). "Comprehensive monitoring of Bangladesh tree cover inside and outside of forests, 2000–2014." Environmental Research Letters 12(10): 104015.
Rahman, L. M. (2016). Bangladesh National Conservation Strategy. Dhaka: 43.
Sarker, M. H., M. R. Akhand, S. M. M. Rahman and F. Molla (2016). "Mapping of Coastal Morphological Change of Bangladesh Using RS, GIS and GNSS Technology." Jounal of Remote Sensing and GIS 1(2).
Schnell, S., C. Kleinn and G. Ståhl (2015). "Monitoring trees outside forests: a review." Environmental monitoring and assessment 187(9): 600.
Scott, C. (2018). Estimation Using Ratio‐to‐Size Estimator Across Strata and Subpopulations.

210
Scott, C. T. and R. Bush (2009). Design tool for inventory and monitoring. In: McWilliams, Will; Moisen, Gretchen; Czaplewski, Ray, comps. Forest Inventory and Analysis (FIA) Symposium 2008; October 21‐23, 2008; Park City, UT. Proc. RMRS‐P‐56CD. Fort Collins, CO: US Department of Agriculture, Forest Service, Rocky Mountain Research Station. 7 p.
Shaheduzzaman, M. and M. Akhter (2013). Proceedings of the Training Workshop on Land Cover Classification in the context of REDD+ in Bangladesh. Dhaka, Bangladesh, Bangladesh Forest Department, Food and Agriculture Organization of the United Nations: 46.
Shannon, C. E. a. W., W. (1963). "The Mathematical Theory of Communities." University of Illinois Press, Urbana: pp. 111‐117).
Silvacarbon (2015). National forest inventory information needs workshop, Dhaka, Bangladesh, SilvaCarbon and United States Agency for International Development (USAID).
Simpson, E. H. (1949). "Measurement of diversity." Nature: 163‐688).
Stokes, A., A. Lucas and L. Jouneau (2007). "Plant biomechanical strategies in response to frequent disturbance: Uprooting of Phyllostachys nidularia (Poaceae) growing on landslide‐prone slopes in Sichuan, China." American Journal of Botany 94(7): 1129‐1136.
UN‐REDD (2012). Bangladesh REDD+ Readiness Roadmap, Draft 1.1, Bangladesh Forest Department, UN‐REDD Programme.
UN‐REDD (2017). Drivers of Deforestation and Forest Degradation in Bangladesh: Final report. Dhaka, UN‐REDD Bangladesh National Program.
UN‐REDD, F. (2015). Technical considerations for Forest Reference Emission Level and/or Forest Reference Level construction for REDD+under the UNFCCC.
UNFCCC (2009). 4/CP.15 Methodological guidance for activities relating to reducing emissions from deforestation and forest degradation and the role of conservation, sustainable management of forests and enhancement of forest carbon stocks in developing countries. FCCC/CP/2009/11/Add.1, Report of the Conference of the Parties on its fifteenth session, held in Copenhagen from 7 to 19 December 2009.
Vargas, R., D. Alcaraz‐Segura, R. Birdsey, N. A. Brunsell, C. O. Cruz‐Gaistardo, B. de Jong, J. Etchevers, M. Guevara, D. J. Hayes, K. Johnson, H. W. Loescher, F. Paz, Y. Ryu, Z. Sanchez‐Mejia and K. P. Toledo‐Gutierrez (2017). "Enhancing interoperability to facilitate implementation of REDD+: case study of Mexico." Carbon Management 8(1): 57‐65.
Zabala, N. (1990). "Silviculture of species, development of professional education in the forestry sector, Bangladesh." Institute of Forestry, Chittagong University, Bangladesh.

211
Concept and design
S.M. Rubaiot Abdullah (KU)
Dr. Mariam Akhter (FD / FAO)
Dr. M. Al‐Amin (CRPAR project
of FD)
Liam Costello (FAO)
Sourav Das (SUST)
Dr. Matieu Henry
Md. Belayet Hossain (FD)
Dr. Mahmood Hossain (KU)
Dr. Sirajul Hoque (DU)
Zaheer Iqbal (FD) Rashed Jalal
(FAO)
Dr. Olaf Kuegler (USFS/
SilvaCarbon)
Ruhul Mohaiman (CREL project
of FD)
Md. Nazmul Hasan (SRDI)
Md. Rakibul Hassan Mukul (FD)
Dr. Laskar Muqsudur Rahman
(FAO)
Mahmadur Rahman (CRPAR
project of FD)
Md. Motlubur Rahman (FD)
Dr. A. Z. M. Manzoor Rashid
(SUST)
Lars Ravensback (CRPAR project
of FD)
Dr. Khaled Misbahuzzaman
(IFESCU)
ANM Yasin Newaz (FD)
Mohamed Saket (CRPAR project
of FD)
Dr. Charles Scott (USFS/
SilvaCarbon)
Raihana Siddiqui (FD)
Baktiar Nur Siddiqui (FD)
Md. Main Uddin (IFESCU)
Dr. Sarder Nasir Uddin (BNH)
Toms Zalitis (FAO)
Data collection
For the land representation
system and land cover map:
Md. Modinul Ahsan (FD)
Mariam Akhter (FD)
Noor‐E‐Alam (CEGIS)
Shaikh Noor‐E_Alam (BUET)
Tariq Aziz (FD)
Afroza Begum (FD)
Liam Costello (FAO)
Remi d’Annunzio (FAO)
Premanondo Debnath (CEGIS)
Antonio Di Gregorio (FAO)
Gianluca Franceschini (FAO)
Abdul Hadi (BSGI)
Md. Rajib Hasan (CEGIS)
Matieu Henry (FAO)
Shrabanti Hira (FAO)
Mobarock Hossain (CEGIS)
Prof. Mohammed Abed Hossain
(BUET)
Zaheer Iqbal (FD)
Asma Islam (FD)
Mohammad Shahidul Islam
(CEGIS)
Mohammed Ruhul Islam (SRDI)
Mushfiqul Islam (CEGIS)
Md Nasrat Jahan (CEGIS)
Rashed Jalal (FAO)
Muhib Kabir (CEGIS)
Feroze Ahmed Kanak (CEGIS)
Md. Sanjid Islam Khan (CEGIS)
Dr. Md. Golam Mahboob (BARI)
Syed Mohammad Masum (SoB)
Md. Zohir Uddin Omor (CEGIS)
Husni Mobarak Prince (CEGIS)
Dr. Mahmudur Rahman
(SPARRSO)
Mahbubur Rahman (MoL)
Mizanur Rahman (CEGIS)
Mohammad Saidur Rahman
(CEGIS)
Saidur Rahman (CEGIS)
Saimunnahar Ritu (FAO)
Champa Rani Saha (FAO)
Dr. Abdus Salam (SPARRSO)
Ms. Farzana Shahrin (SRDI)
Mir Fahim Shaunak (CEGIS)
Shamima Begum Shewli (FD)
Abubakar Siddique (BBS)
Md. Fazle Reza Sumon (BIP)
Khan Zarin Tasnim (FAO)
Tasnuva Shabnam Udita (FAO)
For the biophysical inventory:
S.M. Rubaiot Abdullah (KU)
Imran Ahmed (FD)
Zahir Uddin Ahmed (FD)
Ahmad Ali (FD)
Syed Nazmul Ahsan (OMC)
Khondaker Mahfuj Ali (FD)
Md.Yonus Ali (FSTI)
Abu Sayem Md. Mahamud Anis
(FD)
Abul Kalam Azad (BFRI)
Mohammad Shamsul Azam (FD)
Tariq Aziz (FD)
Md. Babluzzaman (FD)
Md. Elmoon Bahar (FSTI)
Absar Uddin Bhuiyan (FD)
Luca Birigazzi (FAO)
Zico Biswas (FSTI)
Dipon Chakma (FD)
Nikhil Chakma (FAO)
Kalendra Chakma (FSTI)
Srimoy Chakma (FSTI)
Uhlamong Chowdhury (FD)
Md. Mizanur Rahman
Chowdhury (FD)
Tapan Chandra Das (FD)
Md. Saiful Islam Dewan (FD)
Md. Mahabub Ferdous (FD)
Shyamal Kumer Ghose (FD)
Contributors

212
Mohammed Hamid (FD)
Md. Abdul Hamid (FD)
S.M. Amir Hamza (FD)
Enamul Haq (FD)
Ishtiak Hasan (FD)
Nazmul Hasan (OMC)
Md. Elias Hossain (FD)
Md. Kamal Hossain (FD)
Sazzad Hossain (FD)
Md. Monir Hossain (FD)
Dr. Mahmood Hossain (KU)
Md. Mosharraf Hossain (FSTI)
Md. Belayet Hossain (FD)
Md. Akhter Hossain (CU)
Md. Delowar Hossain (FD)
Sheikh. Md. Johir Hossain
(Sthapati)
Rafsan Hussain (SUST)
Md. Zaheer Iqbal (FAO)
Md. Kamrul Islam (FD)
Saiful Islam (FD)
Mohammad Monirul Islam (FD)
Didarul Islam (FD)
Rabiul Islam (FD)
Md. Tariqul Islam (FD)
Sorowar Jahan (FD)
Rashed Jalal (FAO)
Md. Shahin Kabir (FD)
Md. Nazmul Kabir (FD)
Md. Kamruzzaman (FD)
Md. Rezaul Karim (FD)
Md. Shoeb Khan (FD)
Md. Abu Naser Khan (FD)
Pravash Chandra Khastogir (FD)
Md. Golam Kibria (SUST)
Mondal Falgoonee Kumar (FAO)
Abdul Lotif (FD)
Md. Mahedizzaman (FD)
Rajib Mahmud (FAO)
Md. Main Uddin (CU)
Shamim Al Mamun (FD)
Thoai Shoi Mong Marma (FSTI)
Md. Farid Meah (FD)
Md. Jhilon Miah (FD)
Md. Younus Miah (FD)
Md. Abdul Latif Miah (FD)
Md.Abu Wazid Musa (FSTI)
ANM Yasin Newaz (FD)
Md. Shahansha Nooshad (FD)
Touhidor Rahaman (FD)
Md. Anisur Rahman (FD)
Md. Atiqur Rahman (FD)
AZM Hasanur Rahman (FD)
Md. Saidur Rahman (FD)
Md. Thauhidur Rahman (FD)
Md. Shahinur Rahman (FD)
Syed Habibur Rahman (FD)
ATM Siddiqur Rahman (FSTI)
Md. Motlubur Rahman (FD)
Mohammad Sohal Rana (FD)
Md. Bazlur Rashid (FD)
Md. Mamunur Rashid (FD)
Md. Abdur Rauf (FD)
Mehedi Hassan Rony (FSTI)
Dr. Prantosh Chandra Roy (FD)
Champa Rani Saha (FAO)
Md. Sajjaduzzaman (FD)
Md. Salahuddin (FD)
Nandini Sarkar (FAO)
Md. Rafiquzzaman Shah (FD)
Md. Shahjahan Shajib (FSTI)
Md. Foseul Alam Shuvo (FSTI)
Frida Siddik (FAO)
Abu Bakar Siddique (FD)
Mohammad Raqibul Hasan
Siddique (KU)
Md. Shahadat Hossain Siddiqui
(FD)
Surja Kumar Singh (FD)
Abu Sufian (FD)
Md. Moslem Uddin (FD)
Md. Jasim Uddin (FD).
For the socio‐economic survey:
Aktaruzzaman (CNRS)
Farid Uddin Ahmed (Arrannayk
Foundation)
Lipi Akther (CNRS)
Mamataz Akther (CNRS)
A.S.M. Saiful Alam (CNRS)
Shamima Sultana Bonny (CNRS)
Golam Quddus Bhuiyan (FD)
Rubel Chakma (CNRS)
Rupantor Chakma (CNRS)
Nihad Chowdhury (FAO)
Babul Chandro Das (CNRS)
Zannatul Ferdous (CNRS)
Amrito lal Gupto (CNRS)
Umme Habiba (FD)
Ajoy Halder (CNRS)
Riazul Haq (CNRS)
Ashrafun Shikha Haque (CNRS)
Abu Hasan (CNRS)
Emdadul Haque (BBS)
Enamul Haque (FD)
Abu Hena (CNRS)
Alomgir Hossain (CNRS)
Ashraf Hossain (FD)
Modasser Hossain (CNRS)
Professor Dr. Syed Shahadat
Hossain (DU)
Hasan Iqbal (CNRS)
Aminul Islam (FD)
Anisul Islam (CNRS)
Azaharul Islam (CNRS)
Fakhrul Islam (CNRS)
Tanvir Islam (CNRS)
Professor Dr. Jashimuddin (CU)
Mostopa Jaman (CNRS)
Zohora Pradhan Jonaki (CNRS)
Abdul Khaleque (BBS)
Hajera Khatun (CNRS)
Sajeda Khatun (CNRS)
Rahat Mahmood (CNRS)
Akhter Marufa (FD)
Abdul Kadir Miah (BBS)
Alok Mistry (CNRS)
Lab keri Morong (CNRS)
Nasir Uddin Mostofa (CNRS)
Persia Nargis (SilvaCarbon)
Nazmoon Naher (CNRS)
MOHD. Abdul Quddus Ph.D.
(Arannayk Foundation)
Habibur Rahman (CNRS)
Mahububer Rahman (CNRS)
Professor Dr. Mahfuzur Rahman
(CU)
Mokleshur Rahman (CNRS)
Shofiur Rahman (CNRS)
Abdur Rashid (CNRS)
Hasan Rintu (CNRS)
Main Uddin (CU).
General:
Arun Bikash Chakma (Member
of Babuchara Union)
Gunendu Bikash Chakma
(CHTRC)

213
Nelson Chakma (Chairman of
Sajek Union)
Subarna Chakma (CHTRC)
Sontosh Jiban Chakma
(Chairman of Babuchara Union)
Sunil Bihari Chakma (Chairman
of Baghaichari Union)
Masud Hasan Chowdhury
(DATEX)
Goutam Dewan (Civil Society)
Md. Rafiqul Islam (DATEX)
Kajal Talukder (FD)
Data compilation writing and analysis Dr. Mariam Akhter (FD)
Md. Tariq Aziz (FD)
Dr. Asif Anik (FAO)
Nikhil Chakma (FAO)
Purnata Chakma (FAO)
Dr. Matieu Henry (FAO)
Md. Akhter Hossain (FAO)
Md. Zaheer Iqbal (FD)
Rashed Jalal (FAO)
Dr. Kristofer Johnson (FAO)
Mondal Falgoonee Kumar (FAO)
Rajib Mahmud (FAO)
Dr. Laskar Rahman (FAO)
Md. Saedur Rahman (FAO)
Tauhidur Rahman (FD)
Saimunnahar Ritu (FAO)
Nandini Sarker (FAO)
Nazrin Sultana (FAO)
Operational support Nasrin Akter (FAO)
Abdul Halim (FAO)
Md. Kamrul Hossain (FAO)
Md. Nozir Hossain (FAO)
Asma Parvin (FAO)
Md. Mahbubur Rahman (FAO)
Shabnam Sharmin (FAO)
Shuhala Ahsan (FAO)
Tamanna Tabassum (FAO)
Farah Tasnim (FAO)
Other expert support Illias Aminon (FAO)
Sepul Kanti Barua (FAO)
Luca Birigazzi (FAO)
Marco Boscolo (FAO)
Justin Green (USFS)
Ashraful Haque (SilvaCarbon)
Heather Hayden (USFS)
Delilah Jaworski (USFS)
Dr. Patrick Meyer (USAID)
Oswaldo Carrillo Negrete (FAO)
Persia Nargis (Silva Carbon)
Marco Piazzo (FAO)
Laurent Saint‐Andre INRA
Chip Scott (USFS)
Gael Sola (FAO)
Ricci Stefano (FAO)
Shahadat Shakil (USAID)
Roksana Sultana (SilvaCarbon)
Review From FD:
Dr. Mariam Akhter (FD)
Md. Tariq Aziz (FD)
Afroza Begum (FD)
Ariful Hoque Belal (FD)
Md. Amir Hossain Chowdhury
(FD)
Dr. Mohammad Zahirul Haque
(FD)
Dr. Md. Zaglul Hossain (FD)
Md. Zaheer Iqbal (FD)
Md. Aminul Islam (FD)
Md. Towfiqul Islam (FD)
Md. Basirul‐Al‐Mamun (FD)
Md. Rakibul Hasan Mukul (FD)
ANM Yasin Newaz (FD)
Hossain Mohammad Nishad
(FD)
Md. Sanaullah Patwary (FD)
Md. Motlubur Rahman (FD)
Tauhidur Rahman (FD)
Gobinda Roy (FD)
Mohammad Abdul Awal Sarker
(FD)
Md. Baktiar Nur Siddiqui (FD).
Other reviewers:
Farid U. Ahamed (Arannayk
Foundation)
Luca Birigazzi (FAO)
Javier Garcia‐Perez (Gamarra)
(FAO)
Md. Emdadul Haque (BBS)
Dr. Mahmood Hossain (Khulna
University)
Professor Dr. Syed Shahadat
Hossain (Dhaka University)
Mrs. Reshma Jesmin (BBS)
Myles McDonagh (World Bank)
Md. Abdul Kadir Miah (BBS)
Oswaldo Carrillo Negrete (FAO)
Dr. Mahammad Abdul Quddus
(Arannayk Foundation)
Dr. Md. Golam Rakkibu (Khulna
University)