Forest cover, extinction thresholds and time lags in woody plants (Myrtaceae) in the Brazilian...
23
ORIGINAL PAPER Forest cover, extinction thresholds and time lags in woody plants (Myrtaceae) in the Brazilian Atlantic Forest: resources for conservation Dary Moreira Gonc ¸alves Rigueira • Pedro Luı ´s Bernardo da Rocha • Eduardo Mariano-Neto Received: 26 June 2013 / Accepted: 9 October 2013 / Published online: 19 October 2013 Ó Springer Science+Business Media Dordrecht 2013 Abstract Efforts to conserve tropical forests could be strengthened based on ecological knowledge, such as extinction thresholds in ecological processes. Many studies of extinction thresholds associated with habitat reduction have focused on animals, generally at the patch scale. However, certain plant groups are very interesting models with which to study this type of relationship, such as Myrtaceae in Neotropical forests. Because trees are long-lived organisms, local extinctions in response to habitat loss may occur in different ways due to a time lag. In this study, our objective was to assess the occurrence of extinction thresholds at the landscape scale for Myrtaceae in a large biome and the pattern of species reduction in different tree size classes. We studied nine landscapes with different amounts of available habitat (between 5 and 55 % forest cover) in different parts of the Atlantic Forest in Bahia, Brazil, and in each landscape, we evaluated four plant classes based on tree circumference: saplings (CBH between 8 and 15 cm), young (CBH between 15 and 30 cm) adults (CBH C30 cm) and total (all individuals with CBH C8 cm). Landscapes with forest cover less than 25 % presented an approximately sixfold reduction in Myrtaceae total species richness compared with landscapes with forest cover greater than 40 %. We identified a relationship with a threshold between the amount of available habitat at the landscape level and Myrtaceae richness, with a reduction in total, sapling and D. M. G. Rigueira (&) Programa de Po ´s-Graduac ¸a ˜o em Ecologia e Biomonitoramento, Instituto de Biologia, Universidade Federal da Bahia, Rua Bara ˜o de Geremoabo, no. 147, Campus Universita ´rio de Ondina, Salvador, Bahia Cep 40170-290, Brazil e-mail: [email protected] P. L. B. da Rocha Departamento de Zoologia, Instituto de Biologia, Universidade Federal da Bahia, Rua Bara ˜o de Geremoabo, no. 147, Campus Universita ´rio de Ondina, Salvador, Bahia Cep 40170-290, Brazil e-mail: [email protected] E. Mariano-Neto Departamento de Bota ˆnica, Instituto de Biologia, Universidade Federal da Bahia, Rua Bara ˜o de Geremoabo, no. 147, Campus Universita ´rio de Ondina, Salvador, Bahia Cep 40170-290, Brazil e-mail: [email protected] 123 Biodivers Conserv (2013) 22:3141–3163 DOI 10.1007/s10531-013-0575-4
Transcript of Forest cover, extinction thresholds and time lags in woody plants (Myrtaceae) in the Brazilian...
ORI GIN AL PA PER
Forest cover, extinction thresholds and time lagsin woody plants (Myrtaceae) in the Brazilian AtlanticForest: resources for conservation
Dary Moreira Goncalves Rigueira • Pedro Luıs Bernardo da Rocha •
Eduardo Mariano-Neto
Received: 26 June 2013 / Accepted: 9 October 2013 / Published online: 19 October 2013� Springer Science+Business Media Dordrecht 2013
Abstract Efforts to conserve tropical forests could be strengthened based on ecological
knowledge, such as extinction thresholds in ecological processes. Many studies of
extinction thresholds associated with habitat reduction have focused on animals, generally
at the patch scale. However, certain plant groups are very interesting models with which to
study this type of relationship, such as Myrtaceae in Neotropical forests. Because trees are
long-lived organisms, local extinctions in response to habitat loss may occur in different
ways due to a time lag. In this study, our objective was to assess the occurrence of
extinction thresholds at the landscape scale for Myrtaceae in a large biome and the pattern
of species reduction in different tree size classes. We studied nine landscapes with different
amounts of available habitat (between 5 and 55 % forest cover) in different parts of the
Atlantic Forest in Bahia, Brazil, and in each landscape, we evaluated four plant classes
based on tree circumference: saplings (CBH between 8 and 15 cm), young (CBH between
15 and 30 cm) adults (CBH C30 cm) and total (all individuals with CBH C8 cm).
Landscapes with forest cover less than 25 % presented an approximately sixfold reduction
in Myrtaceae total species richness compared with landscapes with forest cover greater
than 40 %. We identified a relationship with a threshold between the amount of available
habitat at the landscape level and Myrtaceae richness, with a reduction in total, sapling and
D. M. G. Rigueira (&)Programa de Pos-Graduacao em Ecologia e Biomonitoramento, Instituto de Biologia, UniversidadeFederal da Bahia, Rua Barao de Geremoabo, no. 147, Campus Universitario de Ondina, Salvador,Bahia Cep 40170-290, Brazile-mail: [email protected]
P. L. B. da RochaDepartamento de Zoologia, Instituto de Biologia, Universidade Federal da Bahia, Rua Barao deGeremoabo, no. 147, Campus Universitario de Ondina, Salvador, Bahia Cep 40170-290, Brazile-mail: [email protected]
E. Mariano-NetoDepartamento de Botanica, Instituto de Biologia, Universidade Federal da Bahia, Rua Barao deGeremoabo, no. 147, Campus Universitario de Ondina, Salvador, Bahia Cep 40170-290, Brazile-mail: [email protected]
123
Biodivers Conserv (2013) 22:3141–3163DOI 10.1007/s10531-013-0575-4

young species below a threshold of 40 % forest cover, whereas adults had an extinction
threshold at 30 % forest cover. We discuss the differences among the categories of plants
associated with a time lag and the possibilities and limitations in applying these results in
environmental management.
Keywords Environmental management � Habitat loss � Local extinction � Long-
lived organisms � Species loss � Tropical Forest
Introduction
The use and occupancy of tropical areas by humans have been based on the replacement of
forested landscapes with anthropogenic environments (Wright and Muller-Landau 2006;
Tabarelli et al. 2010). This process has accelerated at an unprecedented rate over the last
decades (Millennium Ecosystem Assessment 2005). Between 1,980 and 2,000, approxi-
mately 288 million hectares (21 % of the existing forests) were impacted (FAO 2001). The
Brazilian Atlantic Forest biome harbors a disproportionate quantity of global biodiversity
(Myers et al. 2000) and represents one of the most threatened forested biomes of the world;
only 11.4–16 % of its original 150 million hectares remain, and more than 80 % of that is
in patches of less than 50 hectares (Ribeiro et al. 2009). Nevertheless, the deforestation rate
of this ecosystem remains high, estimated at 350 km2 per year (Fundacao SOS Mata
Atlantica and INPE 2008).
This alarming habitat loss leads to both the reduction of biodiversity through local
extinctions (Turner 1996; Fahrig 2001, 2003) and the loss of ecological processes and
ecosystem services associated with the integrity of these environments and their biological
populations. Estimates indicate that at least 15 ecosystem services, such as air quality
regulation and natural hazards protection, have been degraded due to the unsustainable use
of different global ecosystems (Millennium Ecosystem Assessment 2005). In response to
the loss and fragmentation of natural habitats, efforts toward the conservation of tropical
forests based on ecological knowledge have been promoted, such as the establishment of
ecological corridors and ecological restoration initiatives (Bawa et al. 2004, Pardini et al.
2005, Rodrigues et al. 2009).
Ecological studies and theoretical models that provide assessment and understanding of
the relationship between habitat reduction and species maintenance may provide a greater
ability to predict local extinctions due to deforestation (Primack and Rodrigues 2001), such
as extinction thresholds. The concept of thresholds is based on a nonlinear relationship
between an ecological response (for example, the number of species) and habitat reduction,
with a break point at a certain amount of available habitat (Toms and Lesperance 2003).
The extinction threshold model can be regarded as a modification of the island biogeog-
raphy model (MacArthur and Wilson 1967) but with different processes involved. The
island biogeography theory proposes a relationship between area (islands) and the number
of species based on resource availability, where larger areas (islands) are able to maintain a
greater number of species and a lower extinction probability. Furthermore, islands closer to
the mainland (source) could maintain greater richness due to the possibility of immigration
(MacArthur and Wilson 1967). Unlike the species-area relationship, the extinction
threshold model proposes a metapopulational relationship modulated by the amount of
available habitat in the landscape through the interaction between habitat reduction and
3142 Biodivers Conserv (2013) 22:3141–3163
123

structural changes in landscape geometry, with increased fragmentation and isolation; this
interaction prevents connectivity among patches of natural habitat, reduces the viability of
populations present in these environments, reduces the chances of recolonization, and
favors local extinctions (Andren 1994; Fahrig 2002, 2003).
Different levels of biological organization have been assessed in studies of extinction
thresholds (Swift and Hannon 2010), but more studies have focused on populations than on
biological communities. The occurrence of extinction thresholds in communities is still
controversial in the literature. Some authors indicate that finding evidence for extinction
thresholds in communities may not be feasible because the combination of specific
thresholds for each species can linearize the relationship between the amount of available
habitat and species richness (Hanski 1994). Another reason for the controversy is asso-
ciated with the characteristics of different species: environmental disturbances may
decrease the population of one group of species (specialists or forest species) but may favor
increases of another group of species (generalists or open area species) in the same
community, maintaining similar species richness values along the impact gradient (King
and Baker 2011).
The hypothesis of an extinction threshold associated with habitat loss is primarily
derived from computational models (Andren 1994; Fahrig 2001, 2002; Flather and Bevers
2002). Several empirical studies to assess this relationship have been performed, especially
in sub-tropical and temperate environments (Lindenmayer et al. 2005; Radford et al. 2005;
Schmidt and Roland 2006; Montoya et al. 2010). Recently, Pardini et al. (2010) conducted
a study of fragmentation thresholds with non-volant small mammals in the Atlantic Forest
of Sao Paulo in southeastern Brazil. In this study, the authors noted the importance of the
percent of available habitat (10, 30 and 50 %) and of patch size in the maintenance of
specialist species (Pardini et al. 2010). However, studies conducted at the landscape level
in tropical forests have primarily evaluated structural aspects of the landscape, such as
patch size and connectivity (Martensen et al. 2008; Santos et al. 2008; Faria et al. 2009;
Lopes et al. 2009), and few studies have assessed the influence of the amount of available
habitat.
Most of these studies have focused on animal species (Blois et al. 2002; Swift and
Hannon 2010). However, certain plant groups have certain characteristics that make them
relevant to the evaluation of the threshold model, among them the plant family Myrtaceae.
Myrtaceae is the fourth largest family of angiosperms in Brazil, represented by 23 genera
and approximately 1,030 species (Giulietti et al. 2005; Souza and Lorenzi 2005). Common
in rainforests and semi-deciduous forests in Brazil, Myrtaceae is one of the most important
groups of woody plants in the Atlantic Forest biome (Souza and Lorenzi 2005); and
particularly in this biome it is a typically forest-inhabiting, usually shade-tolerant group,
generally dispersed by animals, that is frequent in the understory of mature forests and
sensitive to anthropogenic change (Tabarelli and Peres 2002). Atlantic Forest is also an
endemism center for several groups of Neotropical Myrtaceae (Stehmann et al. 2009).
Their huge representation in the Atlantic Forest, either in abundance or richness, and their
biological characteristics cause local richness of some genera, such a Myrcia sensu lato, to
be a good indicator of the local diversity pattern in the biome (Murray-Smith et al. 2008).
Thus, this plant group represents a suitable biological model to assess the extinction
threshold in this landscape.
Adult individuals of tree species can remain in the landscape for a long time, even
following land use transformation (Metzger et al. 2009), and local extinctions of these
groups may occur generations after habitat loss and fragmentation in what is called a time
lag in the biological response (Tilman et al. 1996; Kuussaari et al. 2009). However, as their
Biodivers Conserv (2013) 22:3141–3163 3143
123

reproductive rates are drastically reduced, the effects of habitat loss and isolation on their
reproductive and dispersal capacities are expected to be observed as a decrease or absence
in the abundance of the youngest individuals (Tilman et al. 1996); thus, the threshold
pattern is expected to be observed earlier among those groups more recently established on
the landscape than among those groups with adults able to remain on the landscape for a
very long time following habitat loss.
Empirically, a test of the extinction threshold model is not trivial and requires a con-
tinuous gradient of landscapes with different quantities of available habitat and relatively
large habitat patches, enabling the inclusion of ecological processes relevant to the group;
this requirement increases the total area of the study (Swift and Hannon 2010). By
expanding the study area, various confounding variables that cannot be adequately con-
trolled are incorporated, for example, different matrix types, habitat quality, historical
factors, landscape structure, altitude, and latitude (Radford et al. 2005; Rhodes et al. 2008).
Thus, the extinction threshold due to habitat loss should be sufficiently strong to be
identified. The occurrence of a strong effect with an extinction threshold due to habitat loss
could permit its use in predictive models between species richness and habitat area at the
landscape scale, which is an easy quantification parameter for environmental management.
The Atlantic Forest is a large biome, represented by areas with different qualities and
habitats with different types of land use and occupation, both at the national and regional
levels. If the extinction threshold model is sufficiently strong to be identified at the
landscape scale, with different confounding variables occurring (e.g., different habitat and
matrix qualities), this could offer a simple and inexpensive method for decision making for
management purposes through the measurement of vegetation cover in the landscape. Our
objective in this study was to evaluate the influence of the amount of available habitat on
the pattern of species loss of woody plants of the family Myrtaceae in the Atlantic Forest of
Bahia, Brazil. Specifically, this study evaluated the following hypotheses: (i) Myrtaceae
species richness responds to the amount of available habitat in the landscape; (ii) the
decline in species number is non-linear, with an extinction threshold; and (iii) the pattern of
species loss is different among sapling, young and adult plants.
Methods
Study area and selection of sample landscapes
The study was conducted in nine 6 9 6 km2 landscapes, with each landscape having a
different proportion of forest cover (between 5 and 55 %), representing the total amount of
available habitat at the landscape level. The landscapes were sampled in the central and
coastal portions of the Atlantic Forest biome, in the state of Bahia in northeastern Brazil
(Fig. 1), a large region between latitudes 11�800 and 18�490 S and longitudes 21�240 and
40�080 W. This region has been characterized by an ancient process of use and occupation
since the sixteenth century, primarily based on selective logging and the replacement of
native vegetation with agriculture and livestock (Cavalcanti 2006). However, this process
was further intensified in the twentieth century, especially in the mid-1940s through the
1960s, through the destruction of extensive forest remnants and commercial logging
(Mendonca et al. 1994). The anthropogenic changes in the Atlantic Forest have shaped the
current structure and quality of the forest remnants, promoting isolation and transforming
most of these habitats into ‘‘islands’’ of secondary vegetation (Tabarelli et al. 2010).
3144 Biodivers Conserv (2013) 22:3141–3163
123

Fig. 1 Map of the study area in the state of Bahia, Brazil, showing the remnants of Atlantic Forest (grayareas) and the nine sampled landscapes (black squares). In the details side, sampled landscapes andindicating their respective percentages of forest habitat. In detail at bottom right, map of Brazil indicatingthe limits of the state of Bahia (white) and the magnified region in the main part of the figure
Biodivers Conserv (2013) 22:3141–3163 3145
123

The chosen landscape size, 6 9 6 km, appears to be suitable for including ecological
processes relevant to tropical forest trees, such as the dispersal of their propagules and
pollen, which are primarily restricted to relatively short distances (Condit et al. 1992;
Gressler et al. 2006) The sampled landscapes were chosen from a distribution along two
tracks of 1,500 6x6 km squares (36 km2 or 3,600 ha) that contains most of the Atlantic
Forest remnants in the state of Bahia. We used the forest cover map ‘‘Atlas dos Re-
manescentes Florestais da Mata Atlantica’’ (www.sosma.org.br and www.inpe.br), which
was constructed through the manual classification of satellite images taken in 2008
(Landsar and CBERS). From this map, we calculated the proportion of forest cover in the
6 9 6 km landscapes. They were then classified according to the proportion of forest cover
into classes of 5, 15, 20, 25, 30, 35, 40, 45 and 55 %. As theoretical and empirical studies
rarely observe extinction thresholds greater than 55–60 % forest cover (Swift and Hannon
2010), we did not evaluate landscapes with higher proportions.
Before proceeding with the random selection of the landscapes, we established selection
criteria to minimize the effects of four relevant variables that can be controlled via design:
two related to the forest quality (successional stage) and matrix (degree of permeability to
typical forest species) and two related to the quantitative indicators of forested habitat in
the surrounding landscape (habitat amount and presence of potential source areas).
Because richness and composition vary among forests in different successional stages
(Santos et al. 2008), we decided to include in the sample only landscapes with forests in
intermediate or advanced stages of succession, as proposed in the CONAMA Resolution
05/1994, from a Brazilian council of the environment (CONAMA 1994); by these defi-
nitions, we sampled only forest tracks with a mean canopy height of at least 8 m and only
rare presence of early successional plant groups.
As matrices (non-habitat) that are structurally similar to forests are more permeable to
typically forest organisms and can minimize the effects of habitat loss and fragmentation in
the landscape (Ewers and Didham 2006), we established in this study that the landscape
matrices should be composed of at least 80 % low-profile, anthropogenic vegetation, such
as pasture fields or upland crops/shrubs, and we excluded urban areas.
To avoid any possible effect of the surrounding area on the sampled landscape
(6 9 6 km) due to a larger area of forest and/or larger fragments (serving as a source area),
for each 6 9 6 km landscape, we established an 18 9 18 km square centered on the
landscape, and we used it to compute the percentage of vegetation cover and the area
occupied by the largest patch (Largest Patch Index—LPI—Fragstats 3.3). We excluded
landscapes for which the percentage of habitat cover and the LPI in the 18 9 18 km square
were greater than in the 6 9 6 km sampled landscape.
The landscapes that we analyzed were Ilheus—5.10 % (class 5 %), Presidente Tancredo
Neves—15.65 % (class 15 %), Itapetinga—20.02 % (class 20 %), Valenca—24.39 %
(class 25 %), Ubaıra—30.14 % (class 30 %), Nilo Pecanha—33.11 % (class 35 %),
Wenceslau Guimaraes—40.14 % (class 40 %), Camamu—45.01 % (class 45 %), and Ja-
guaripe—54.15 % (class 55 %).
After defining the sampled landscapes, we evaluated other variables (environmental and
landscape) that could influence richness in different landscapes but that we cannot control
in sampling design because it would not be feasible to select sufficient landscapes for this
study. These environmental and landscape variables were altitude, precipitation, proportion
of edge and core areas in the landscape (defining edge areas as 50 m from any boundary).
We also tested the spatial autocorrelation using a Mantel test between a geographical
distance matrix and a matrix of differences in species richness between pairs of landscapes.
3146 Biodivers Conserv (2013) 22:3141–3163
123

Sample plots and collection of biological data
Myrtaceae richness in each landscape was evaluated for a set of eight 10 9 25 m plots that
were randomly located inside each landscape, at a minimum distance of 50 m from any
forest edges. To locate each plot, we overlaid a grid of 100 cells (600 9 600 m each) on
the landscape and randomly selected eight cells that were at least partially covered with
forest. In each sampled plot, we also evaluated successional stage and estimated the canopy
height and the height of emergent trees using a 12 m pole.
We sampled circumference and estimated heights of all Myrtaceae with CBH C8 cm.
Branches were collected and returned to the FLORA laboratory (IBio/UFBA) for pro-
cessing. The Myrtaceae species were identified by specialist Marcos Eduardo G. Sobral
from the Federal University of Sao Joao del Rei (UFSJ) in Minas Gerais, Brazil and stored
in the collection of the Alexandre Leal Costa Herbarium of the Federal University of Bahia
(ALCB/IBio/UFBA). The collection of the botanical material was performed under the
authorization of collection 12023-1 IBAMA/ICMBio.
The plants were divided into four circumference classes that allowed inference
regarding groups of individuals that were established in different time periods in the
landscape: class 1—total richness (individuals with CBH C8 cm); class 2—saplings
(individuals with CBH between 8 and 15 cm); class 3—young (individuals with CBH
between 15 and 30 cm); and class 4—adults (individuals with CBH C30 cm).
Data analysis
The possible influences of uncontrolled environmental and landscape variables in this
study (altitude, rainfall, spatial correlation and the proportion of core and edge areas in
the landscape) on Myrtaceae species richness were evaluated using simple linear
regression.
To evaluate the existence of a threshold in the relationship between forest cover and
Myrtaceae richness, we compared models with and without thresholds. We used piecewise
regression models and generalized linear models (GLM), and we compared those models
via Akaike information criterion (AIC), we accepted as the most probable model the one
with the lowest AIC value and p \ 0.05. Models with AIC values with a difference of less
than two units were considered equally probable. Piecewise regression models are based on
fitting to the data one or more lines united by one or more ‘‘breakpoints’’ representing the
thresholds (Toms and Lesperance 2003). Piecewise models are considered suitable for
ecological studies that evaluate nonlinear relationships, such as thresholds, and are com-
monly used in those cases (Toms and Lesperance 2003; Ficetola and Denoel 2009; Swift
and Hannon 2010). In all models, we assumed a Poisson error distribution for the species
richness data. The significance of the threshold values was calculated using Davies tests,
based on the significance of the difference between the slopes of the fitted lines (Muggeo
2008).
To assure that the pattern found was not an artifact, we also build richness estimator
curves and calculate the expected richness for all areas, and we tested the effects of forest
cover over the estimated richness.
All analyses were performed in R 2.15 (R Development Core Team 2012) using the
packages ‘‘segmented’’ 0.2–8.4 (Muggeo 2012) for the piecewise regression, ‘‘vegan’’ for
the richness estimators curve, and ‘‘stats’’ for the GLM models.
Biodivers Conserv (2013) 22:3141–3163 3147
123

Results
Characterization of the sampled landscapes
Some landscapes had a predominance of pastures in the non-forested matrix (in the
landscapes with 30 and 20 % forest cover), whereas in others, small-scale or family
agriculture (40 and 25 %) or a mosaic of farmland with pastures (55, 45, 35, 15 and 5 %)
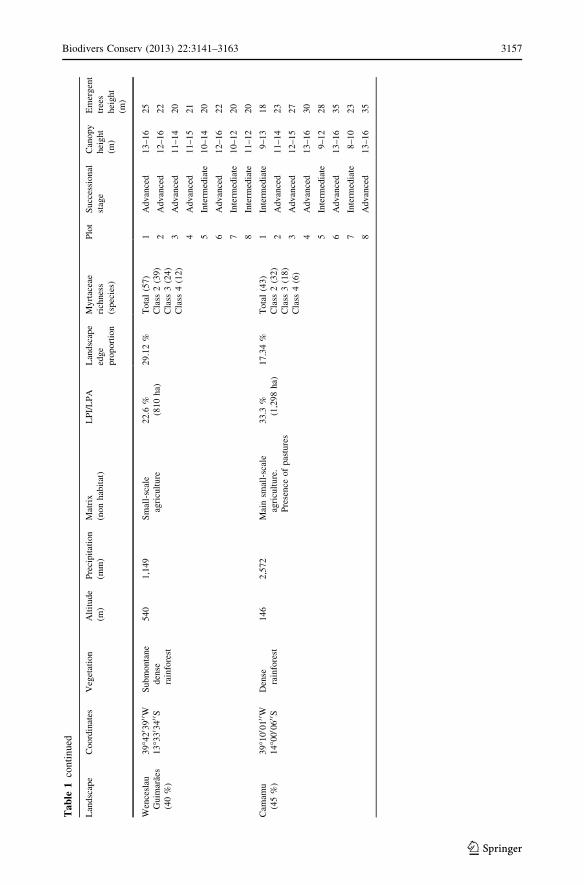
were common (Appendix Table 1).
We found no correlation between mean altitude and forest cover (p = 0.899) or
Myrtaceae richness. The annual average rainfall varied from 946 mm (20 %) to 2,572 mm
(45 %) (Appendix Table 1) and was not correlated with the available habitat amount
(p = 0.507). No spatial correlation was observed between the sampled landscapes and
richness (p = 0.323).
The largest patches were observed in the landscapes with greater forest cover (55 and
45 %); however, large patches were also observed in the landscapes with less forest cover
(30 and 20 %) (Appendix Table 1). We observed a significant decrease in maximum patch
size with decreasing forest cover in the landscape (p = 0.009). However, there was no
significant relationship between forest cover and the proportion of edge areas (p = 0.063)
or the proportion of core areas (p = 0.251).
Myrtaceae richness
We collected 470 individuals of Myrtaceae representing 11 genera and 174 species, including
268 individuals (57.02 %) with CBH between 8 and 15 cm (sapling), 134 (28.51 %) with
CBH between 15 and 30 cm (young), and 68 (14.47 %) with CBH greater than 30 cm (adult).
The two most representative genera for this family contributed 63.2 % of the total richness:
Eugenia with 75 species and Myrcia with 35 species (Appendix Table 2).
The highest values of richness for the sapling, young and total classes were obtained in
the three landscapes with the greatest forest cover: 55, 45 and 40 % forest cover with 40,
32 and 39 species (sapling), 13, 18 and 24 species (young) and 47, 43 and 57 species
(total), respectively. Among the adults, we found the highest richness in the landscapes
with 30 and 40 % forest cover (12 and 14 species) and otherwise similar values in the other
landscapes with greater than 25 % (between 6 and 7 species). For the landscapes with less
than 20 % forest cover, we found lower values: 2, 3 and 1 species (Appendix Table 1).
Richness estimator curves
Rarefaction curves by landscape showed that the landscapes with lower cover areas,
between 5 and 25 %, tends to reach an asymptote and also presented lower confidence
intervals. We did not attain an stabilization in landscapes with higher vegetation cover,
which also exhibits larger confidence intervals in rarefactions curves (Fig. 2). This results
probably indicates that we have a good survey on landscapes with vegetation cover lower
than 25 %, and we can expect even higher richness on landscapes above 40 %.
Threshold evaluation—piecewise regression
The piecewise models were the most probable (lower AIC and p \ 0.05) models in all
analyses. We identified breakpoints in the relationship between forest cover and species
3148 Biodivers Conserv (2013) 22:3141–3163
123

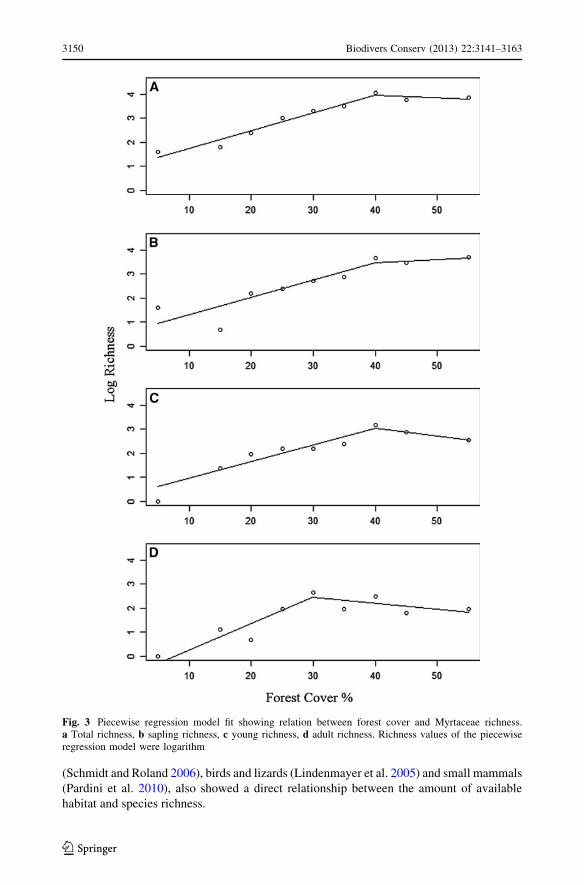
richness in all analyzed classes but with different values (Fig. 3). For total richness, the
breakpoint was 40.0 ± 2.6 % forest cover (p \ 0.000); for saplings, 40.1 ± 5.1 %
(p = 0.04); for young, 40.0 ± 4.1 % (p = 0.004); and for adults, 30.0 ± 4.1 %
(p = 0.009). The models using estimated total richness against forest cover showed the
same response as original total richness data (Fig. 4), with breakpoint at 40.0 ± 2.6 %
forest cover (p \ 0.000).
Discussion
Forest cover and species richness
From these results, we conclude that Myrtaceae species richness was greatly reduced in
landscapes with less forest cover. When including the standard deviations, we found that
there is a high probability of a threshold existing between 25 and 45 % forest cover at a
landscape level for all classes. Comparing the average Myrtaceae richness between a group
of three landscapes with greater forest cover (55, 45 and 40 %) and a group with less forest
cover (20, 15 and 5 %), we observed a 6.7-fold difference in total richness. We also did not
observe a significant relationship with any environmental variable, such as rainfall, alti-
tude, spatial correlation or core/edge proportion, but forest cover at the landscape level
seems to be a good predictor of Myrtaceae richness in the landscape. This study represents
an important empirical advance in knowledge regarding the extinction threshold theory
associated with habitat loss in tropical environments and is a pioneer work for Myrtaceae
and woody plants in tropical forests.
These results are consistent with those of Montoya et al. (2010), which showed that a
decrease in the amount of available habitat was correlated with a decrease in the probabilities
of tree species occurrence in Spain and with an increase in eventual species extinctions in
fragmented landscapes; however, these authors argued that the effects of habitat fragmen-
tation on tree species are weak relative to the effects of the amount of available habitat.
Empirical studies conducted with different taxa, such as fungi (Drinnan 2005), insects
Fig. 2 Rarefaction curves of the each landscape for Myrtaceae total richness. The percentage values in theright side represents the amount of available habitat in each landscapes
Biodivers Conserv (2013) 22:3141–3163 3149
123
(Schmidt and Roland 2006), birds and lizards (Lindenmayer et al. 2005) and small mammals
(Pardini et al. 2010), also showed a direct relationship between the amount of available
habitat and species richness.
Fig. 3 Piecewise regression model fit showing relation between forest cover and Myrtaceae richness.a Total richness, b sapling richness, c young richness, d adult richness. Richness values of the piecewiseregression model were logarithm
3150 Biodivers Conserv (2013) 22:3141–3163
123

The results also indicate that even human-altered landscapes with an intermediate level
of forest cover in the landscape (e.g., landscapes with 35–55 % forest cover) maintain
many more species than landscapes with lower forest cover (e.g., 5–20 %). As the com-
ponents of ecosystems interact and contribute to maintaining ecosystem functionality and
sustainability (Bennett et al. 2009), the decrease in the number of Myrtaceae species, one
of the most important families of woody plants in the Atlantic Forest (Souza and Lorenzi
2005; Stehmann et al. 2009), may represent a reduction in the availability of important
resources, especially for birds, monkeys, and bees, the primary dispersers and pollinators
for this family in Brazil (Tabarelli and Peres 2002; Tabarelli et al. 2004; Gressler et al.
2006; Oliveira et al. 2010), which may influence the maintenance of different biological
groups and ecological processes in these landscapes.
By doing rarefaction curves to assess whether the sampling effort conducted could
encompass an approximate number of species expected in each landscape, we observed
that the landscapes between 5 and 25 % of the habitat reached a stable platform, on the
other hand the landscapes with a greater amount of habitat did not stabilized. These results
reinforcing our view that the scenario of species loss that we found may have been
conservative in terms of breakpoint value or abrupt change in richness.
Studies that seek to evaluate the occurrence of extinction thresholds primarily use
species abundance (population level) as the response variable, with a focus on animal
groups (Swift and Hannon 2010). Some authors suggest that the occurrence of thresholds
for values of species richness in communities is unlikely (Hanski 1994; King and Baker
2011). As biological communities are generally composed of species that exhibit different
responses to environmental disturbances, the most sensitive species tend to be replaced by
less sensitive species but at different replacement rates; thus, no relationship between
environmental diversity and species richness would be observed (King and Baker 2011).
The family Myrtaceae in the Atlantic Forest consists of primarily forest species that are
the major component of understory surveys, typical understory trees, usually shade tol-
erant, generally dispersed by animals and sensitive to environmental changes (Silva and
Leitao-Filho 1982; Mori et al. 1983; Melo and Mantovani 1994; Guedes-Bruni et al. 1997;
Silva and Nascimento 2001; Tabarelli and Peres 2002). In a recent study, Montoya et al.
(2010) evaluated the occurrence of extinction thresholds for different tree species with
different biological characteristics. Of the eight studied species, only one (Fagus sylvatica)
showed an extinction threshold, with this species being strictly a forest species, more shade
tolerant and sensitive to anthropogenic changes than the other species evaluated (Montoya
Fig. 4 Piecewise regression model fit showing relation between forest cover and Myrtaceae estimated totalrichness. Estimated total richness value of the piecewise regression model was logarithm
Biodivers Conserv (2013) 22:3141–3163 3151
123
et al. 2010). Possibly the biological characteristics of the Myrtaceae as a whole in the
Atlantic Forest, allow this group to present such response to the amount of available
habitat. Considering that normally this group is one of the most representative woody plant
of the Atlantic Forests, our results indicate that the species of this family have substantially
reduced their representation in landscapes with small percentage of forest cover.
Habitat loss and time lag
We found different threshold values between the adult class and the other classes, and this
difference is most likely associated with the time lag of these groups facing habitat loss.
Trees can have time lag responses as some species have estimated life spans exceeding
100 years (Paltto et al. 2006). As the processes of habitat loss and fragmentation in the
Atlantic Forest of Bahia were more intensified in the last 40–60 years (Mendonca et al.
1994), it is possible that some of the present adults witnessed the process of deforestation.
These organisms with great longevity are capable of remaining on the landscape even after
it changes, responding slowly to this change (Metzger et al. 2009).
However, their reproductive rates are drastically reduced, as is their ability to disperse
and to recolonize other fragments in a severely fragmented landscape to maintain viable
populations (Tilman et al. 1996). In this way, the structure and richness of saplings and
young plants tends to reflect the current quality and configuration of the landscape.
Thus, different explanations are required for the observed patterns of species reduction
and the extinction thresholds among the size classes in this study. Most likely, the
reduction in the number of adults is associated with the non-replacement of this class,
representing a gap in the recruitment of new individuals; thus, adults remain in landscapes
even with low amounts of available habitat, and they have lower threshold values than the
other classes. Unlike the adult plants, the loss of saplings and young trees occurs early in
the land use gradient and is most likely related to decreased recruitment and the inability to
recolonize the landscape, indicating the real sensitivity of Myrtaceae species to habitat
loss. The absence of regenerating plants today will mean the absence of adult plants in the
future.
This higher sensitivity of saplings, especially of shade-tolerant species such as the
Myrtaceae plants in the Atlantic Forest, has been observed in another study also conducted
in the Atlantic Forest (Pardini et al. 2009). Another typical forest family, Sapotaceae, was
studied with the same sample design as in this study (Lima and Mariano-Neto, unpublished
data). This family has some characteristics similar to Myrtaceae, but it is composed pri-
marily of large trees. In that study, the plants were not divided into classes, and an
extinction threshold was found at 30 % habitat cover for the entire assemblage, with a
severe reduction in richness, as observed in Myrtaceae in this study. The lower threshold
value is most likely associated with a time lag because the individuals were not divided
into size classes.
Resources for conservation
The existence of extinction thresholds associated with habitat loss is a potential tool for
environmental management (Huggett 2005; Groffman et al. 2006; Rigueira 2011). Having
identified a threshold, it is possible to propose appropriate management of the landscape to
maintain or restore forest cover values above that threshold, which is more likely to retain a
3152 Biodivers Conserv (2013) 22:3141–3163
123
greater proportion of the species richness (Lindenmayer et al. 2005; Radford et al. 2005).
Despite this, the use of knowledge regarding extinction thresholds in conservation plans
has been criticized by some authors who emphasize the variability of the threshold values
obtained in different studies (Huggett 2005; Lindenmayer and Luck 2005). In an empirical
study conducted in Australia, the same species of marsupial was observed to have different
threshold values depending on the landscape studied, which indicated that such variation
might have occurred due to differences in habitat quality, demographic rates and different
types of land use and land cover on the landscape (Rhodes et al. 2008).
However, in this study, we observed consistent evidence that the entire Myrtaceae
assemblages were strongly reduced when forest cover was less than 25–30 %; most likely,
35–40 % forest habitat, whether natural or associated with agroforestry systems, is nec-
essary to maintain the great Myrtaceae diversity in the Atlantic Forest as well as in other
forest types. Therefore, the use of an easily obtained landscape metric, such as the amount
of available habitat, can be a good indication of the minimal forest proportion that must be
maintained in the landscape, ensuring high richness of major woody plant groups (and their
associated ecological processes) in the Atlantic Forest.
These results reveal a critical scenario for the Myrtaceae community of the Atlantic
Forest, especially following the recent revision of the principal Brazilian environmental
law: the Forest Code (Law 4.771/1965). In Brazil, all rural properties were divided into
three groups: agricultural land, legal reserves (LR) (natural habitat areas subjected to
sustainable management, with no clear cutting), and the areas close to rivers, dams, high
slopes and sensitive areas that are designated as permanent preservation areas (PPA). If
this law were enacted in Brazil, it is estimated that PPA would occupy 10 % of the total
area, that LR would be 20 % of the property in the Atlantic Forest, and that the total
forested areas would be approximately 30 % in all landscapes. Following other modi-
fications to the law (Law 12.651/2012), the forested areas were estimated to decrease to
include only the 20 % legally preserved habitat among the rural properties in the Atlantic
Forest biome. In addition, maintaining LR for small rural properties is no longer
required, which may represent a major loss of forests in those territories of this biome
that are composed primarily of this type of property. Thus, the conservation goals of the
new Forest Code would be very inefficient, considering that the minimal forest cover of
20 % represents a value that we found led to a severe reduction in Myrtaceae richness
and considering that 20 % is below the threshold observed for sapling, young and adult
species.
Our results showed that, on average, landscapes with high amounts of available habitat
(greater than 40 %) had greater than four times the number of species found on a landscape
with 20 % forest cover. Based on the precautionary principle, which is an important
principle for making environmental decisions given the uncertainties and limitations of
ecological data, a preventive margin related to potential and plausible threats should be
ensured (United Nations 1992). Based on the results of this study, it appears that protecting
only 20 % of the forest cover in the Atlantic Forest is not a preventive margin. For the
long-term conservation of biodiversity and ecosystem services, which depend upon both
the protection of natural habitats and on maintaining the integrity of the ecological pro-
cesses that sustain them, a conservation strategy that is based on minimal amounts of
available habitat for a representative group of the Atlantic Forest such as Myrtaceae may
Biodivers Conserv (2013) 22:3141–3163 3153
123
well ensure the conservation of multiples species, maintaining the important ecological
processes derived from the interactions among different species at the landscape scale.
Landscape metrics used, such as the amount of available habitat, for decision making in
environmental management, identifying priority areas for conservation and restoration can
be determined in a less costly way, based on satellite images (Banks-Leite et al. 2011).
This is, however, only one potential tool to be used by environmental managers. Inte-
grating different ecological concepts into a multi-scale perspective is crucial for the suc-
cessful conservation of the Atlantic Forest. As an example, Rigueira et al. (2013) propose a
hierarchical analysis based on three different spatial scales (regional, landscape and local)
based on the theories of ecological thresholds and the principles of landscape ecology,
ecological succession and the precautionary principle to evaluate the environmental fea-
sibility of requests for vegetation removal in the state of Bahia, Brazil.
Acknowledgments We thank the Foundation for Research Support of the State of Bahia (FAPESB)and the National Council for Scientific and Technological Development (CNPq) for funding this study(grants APP0049/2009, PNX0016/2009 and PPP0004/2010); the Coordination of Improvement of HigherEducation Personnel (CAPES) for the scholarship granted to Dary M. G. Rigueira; the Brazilian Instituteof Environment and Renewable Natural Resources (IBAMA) and the State Secretariat of the Environ-ment of Bahia (SEMA) for logistical support and for granting collection licenses; Rio Tinto andOdebrecht for the loan of the cars used in this research; Charbel N. El-Hani, Renata Pardini, MarceloTabarelli and Deborah Faria for contributions used in this work; Marcos E. G. Sobral for identifyingplants (Myrtaceae); Vito Muggeo for help with statistical analyses; Diogo Caribe de Sousa for his helpwith mapping; Nadia Roque for the support before and during the project; Maria Lenise Silva Guedesfor help with the screening and storage of the plants in the herbarium ALCB/UFBA; and the anonymousreviewers for their suggestions.
Appendix
See Tables 1 and 2.
3154 Biodivers Conserv (2013) 22:3141–3163
123

Ta
ble
1T
able
char
acte
riza
tion
of
the
landsc
apes
and
plo
tssa
mple
din
this
study
Lan
dsc
ape
Coord
inat
esV
eget
atio
nA
ltit
ude
(m)
Pre
cipit
atio
n
(mm
)
Mat
rix
(non
hab
itat
)
LP
I/L
PA
Lan
dsc
ape
edge
pro
port
ion
Myrt
acea
e
rich
nes
s
(spec
ies)
Plo
tS
ucc
essi
onal
stag
e
Can
opy
hei
ght
(m)
Em
ergen
t
tree
s
hei
ght
(m)
Ilheu
s(5
%)
39�0
60 0
000
W
14�4
40 1
000
S
Den
se
rain
fore
st
92
2,0
69
Mix
ed:
pre
sence
of
pas
ture
s,ag
ricu
lture
and
indust
rial
hub
5.0
2%
(180
ha)
28.8
0%
Tota
l(5
)
Cla
ss2
(5)
Cla
ss3
(1)
Cla
ss4
(1)
1In
term
edia
te10–12
20
2A
dvan
ced
11–14
30
3In
term
edia
te10–12
20
4In
term
edia
te10–12
22
5In
term
edia
te10–12
18
6In
term
edia
te11–14
22
7A
dvan
ced
11–14
23
8In
term
edia
te11–14
17
P.T
ancr
edo
Nev
es
(15
%)
39�1
80 5
700
W
13�2
30 2
400
S
Den
se
rain
fore
st
185
1,5
57
Mix
ed:
pre
sence
of
pas
ture
san
dsm
all-
scal
eag
ricu
lture
2.2
%
(79
ha)
52.6
0%
Tota
l(6
)
Cla
ss2
(2)
Cla
ss3
(4)
Cla
ss4
(3)
1In
term
edia
te8–10
17
2In
term
edia
te9–11
20
3In
term
edia
te6–8
15
4In
term
edia
te8–10
18
5A
dvan
ced
10–13
22
6In
term
edia
te8–12
20
7A
dvan
ced
10–14
22
8In
term
edia
te6–8
13
Itap
etin
ga
(20
%)
39�5
60 2
100
W
15�1
50 1
200
S
Sem
idec
iduous
fore
st
262
946
Pas
ture
s18.2
7%
(648
ha)
16.5
3%
Tota
l(1
1)
Cla
ss2
(9)
Cla
ss3
(7)
Cla
ss4
(2)
1A
dvan
ced
10–12
25
2In
term
edia
te10–12
25
3A
dvan
ced
11–15
25
4In
term
edia
te10–12
25
5In
term
edia
te8–10
20
6A
dvan
ced
9–12
22
7In
term
edia
te10–13
30
8A
dvan
ced
11–14
30
Biodivers Conserv (2013) 22:3141–3163 3155
123

Ta
ble
1co
nti
nued
Lan
dsc
ape
Coord
inat
esV
eget
atio
nA
ltit
ude
(m)
Pre
cipit
atio
n
(mm
)
Mat
rix
(non
hab
itat
)
LP
I/L
PA
Lan
dsc
ape
edge
pro
port
ion
Myrt
acea
e
rich
nes
s
(spec
ies)
Plo
tS
ucc
essi
onal
stag
e
Can
opy
hei
ght
(m)
Em
ergen
t
tree
s
hei
ght
(m)
Val
enca
(25
%)
39�1
10 2
700
W
13�1
90 5
100
S
Den
se
rain
fore
st
146
2,1
78
Sm
all-
scal
e
agri
cult
ure
6.8
9%
(248
ha)
41.6
8%
Tota
l(2
0)
Cla
ss2
(11)
Cla
ss3
(9)
Cla
ss4
(7)
1A
dvan
ced
11–14
25
2In
term
edia
te8–10
18
3In
term
edia
te8–11
20
4A
dvan
ced
12–14
22
5In
term
edia
te9–12
20
6In
term
edia
te10–12
19
7A
dvan
ced
12–15
25
8In
term
edia
te8–10
20
Ubaı
ra
(30
%)
39�4
00 1
300
W
13�0
70 1
800
S
Subm
onta
ne
den
se
rain
fore
st
792
1,1
72
Pas
ture
s26.1
1%
(936
ha)
33.8
6%
Tota
l(2
7)
Cla
ss2
(15)
Cla
ss3
(9)
Cla
ss4
(14)
1In
term
edia
te10–13
20
2A
dvan
ced
13–16
40
3A
dvan
ced
13–16
40
4A
dvan
ced
13–16
40
5A
dvan
ced
12–16
40
6A
dvan
ced
13–16
40
7A
dvan
ced
11–13
40
8In
term
edia
te10–12
30
Nil
oP
ecan
ha
(35
%)
39�1
10 4
600
W
13�3
80 5
600
S
Den
se
rain
fore
st
163
2,1
99
Mix
ed:
pre
sence
of
pas
ture
san
dsm
all-
scal
eag
ricu
lture
5.3
8%
(193
ha)
32.5
4%
Tota
l(3
3)
Cla
ss2
(18)
Cla
ss3
(11)
Cla
ss4
(7)
1In
term
edia
te11–13
22
2In
term
edia
te10–12
25
3A
dvan
ced
12–15
25
4A
dvan
ced
12–15
27
5A
dvan
ced
12–15
28
6A
dvan
ced
12–15
28
7A
dvan
ced
12–15
28
8A
dvan
ced
10–14
30
3156 Biodivers Conserv (2013) 22:3141–3163
123
Ta
ble
1co
nti
nued
Lan
dsc
ape
Coord
inat
esV
eget
atio
nA
ltit
ude
(m)
Pre
cipit
atio
n
(mm
)
Mat
rix
(non
hab
itat
)
LP
I/L
PA
Lan
dsc
ape
edge
pro
port
ion
Myrt
acea
e
rich
nes
s
(spec
ies)
Plo
tS
ucc
essi
onal
stag
e
Can
opy
hei
ght
(m)
Em
ergen
t
tree
s
hei
ght
(m)
Wen
cesl
au
Guim
arae
s
(40
%)
39�4
20 3
900
W
13�3
30 3
400
S
Subm
onta
ne
den
se
rain
fore
st
540
1,1
49
Sm
all-
scal
e
agri
cult
ure
22.6
%
(810
ha)
29.1
2%
Tota
l(5
7)
Cla
ss2
(39)
Cla
ss3
(24)
Cla
ss4
(12)
1A
dvan
ced
13–16
25
2A
dvan
ced
12–16
22
3A
dvan
ced
11–14
20
4A
dvan
ced
11–15
21
5In
term
edia
te10–14
20
6A
dvan
ced
12–16
22
7In
term
edia
te10–12
20
8In
term
edia
te11–12
20
Cam
amu
(45
%)
39�1
00 0
100
W
14�0
00 0
600
S
Den
se
rain
fore
st
146
2,5
72
Mai
nsm
all-
scal
e
agri
cult
ure
.
Pre
sence
of
pas
ture
s
33.3
%
(1,2
98
ha)
17.3
4%
Tota
l(4
3)
Cla
ss2
(32)
Cla
ss3
(18)
Cla
ss4
(6)
1In
term
edia
te9–13
18
2A
dvan
ced
11–14
23
3A
dvan
ced
12–15
27
4A
dvan
ced
13–16
30
5In
term
edia
te9–12
28
6A
dvan
ced
13–16
35
7In
term
edia
te8–10
23
8A
dvan
ced
13–16
35
Biodivers Conserv (2013) 22:3141–3163 3157
123

Ta
ble
1co
nti
nued
Lan
dsc
ape
Coord
inat
esV
eget
atio
nA
ltit
ude
(m)
Pre
cipit
atio
n
(mm
)
Mat
rix
(non
hab
itat
)
LP
I/L
PA
Lan
dsc
ape
edge
pro
port
ion
Myrt
acea
e
rich
nes
s
(spec
ies)
Plo
tS
ucc
essi
onal
stag
e
Can
opy
hei
ght
(m)
Em
ergen
t
tree
s
hei
ght
(m)
Jaguar
ipe
(55
%)
39�0
10 1
900
W
13�1
00 2
200
S
Den
se
rain
fore
st
61
1,9
37
Mai
npas
ture
s.
Pre
sence
of
smal
l-
scal
eag
ricu
lture
38.7
8%
(1,3
96
ha)
22.0
2%
Tota
l(4
7)
Cla
ss2
(40)
Cla
ss3
(13)
Cla
ss4
(7)
1A
dvan
ced
12–16
25
2In
term
edia
te10–13
23
3A
dvan
ced
10–14
25
4In
term
edia
te8–11
25
5A
dvan
ced
11–14
27
6In
term
edia
te9–12
25
7A
dvan
ced
12–16
30
8In
term
edia
te8–11
21
Landsc
ape
aco
unty
loca
ted
inth
est
ate
of
Bah
iaw
her
ew
asco
llec
ted
the
woody
pla
nts
,w
ith
the
tota
lhab
itat
amount
per
centa
ge
inth
ela
ndsc
ape;
Coord
inate
sre
pre
sents
the
geo
gra
phic
alco
ord
inat
es
(Dat
um
SA
D69)
inth
ece
nte
rpoin
tof
the
landsc
ape;
Veg
etati
on
type
of
landsc
ape
veg
etat
ion
bas
edon
the
clas
sifi
cati
on
of
the
Vel
oso
etal
.1991;
Alt
itude
the
mea
nal
titu
de
of
the
eight
plo
tssa
mple
d
inea
chla
ndsc
ape;
Pre
cipit
ati
on
annual
mea
nval
ue
inm
illi
met
ers
of
the
pre
cipit
atio
nobse
rved
inth
eco
unty
wher
elo
cate
dth
esa
mple
dla
ndsc
ape,
bas
edon
the
his
tori
cal
seri
esof
the
Bra
zili
an
Nat
ional
Wat
erA
gen
cy(A
NA
);M
atr
ixpre
dom
inan
tty
pe
of
hum
anuse
and
occ
upat
ion
obse
rved
innon-f
ore
sted
landsc
ape;
LP
I/L
PA
val
ue
that
indic
ates
the
pro
port
ion
of
the
landsc
ape
occ
upie
dby
the
larg
est
frag
men
t(L
PI)
and
its
size
(LP
A)
inhec
tare
s;L
andsc
ape
edge
pro
port
ion
the
hab
itat
pro
port
ion
inth
ela
ndsc
ape
loca
ted
ined
ge
area
(the
edge
dep
thar
e50
met
ers)
;M
yrta
ceae
rich
nes
s
num
ber
of
coll
ecte
dsp
ecie
sin
each
landsc
ape:
clas
s1
=to
tal
rich
nes
s,cl
ass
2=
spec
ies
rich
nes
sw
ith
CB
Hbet
wee
n8
cman
d15
cm,
clas
s3
=sp
ecie
sri
chnes
sw
ith
CB
Hbet
wee
n15
and
30
cm,
and
clas
s4
=sp
ecie
sri
chnes
sw
ith
CB
HC
30
cm;
Plo
tsa
mple
dplo
tnum
ber
of
each
landsc
ape;
Succ
essi
onal
stage
veg
etat
ion
qual
ity
wher
ew
asal
loca
ted
the
plo
t,bas
edon
CO
NA
MA
Res
olu
tion
05/9
4;
Canopy
hei
ght
the
appro
xim
ate
hei
ght
of
the
canopy
sam
ple
plo
t,es
tim
ated
wit
hth
e12
mpole
;E
mer
gen
ttr
ees
hei
ght
appro
xim
ate
hei
ght
of
the
tall
est
tree
sfo
und
inth
esa
mple
dplo
t,
esti
mat
edw
ith
the
12
mpole
3158 Biodivers Conserv (2013) 22:3141–3163
123
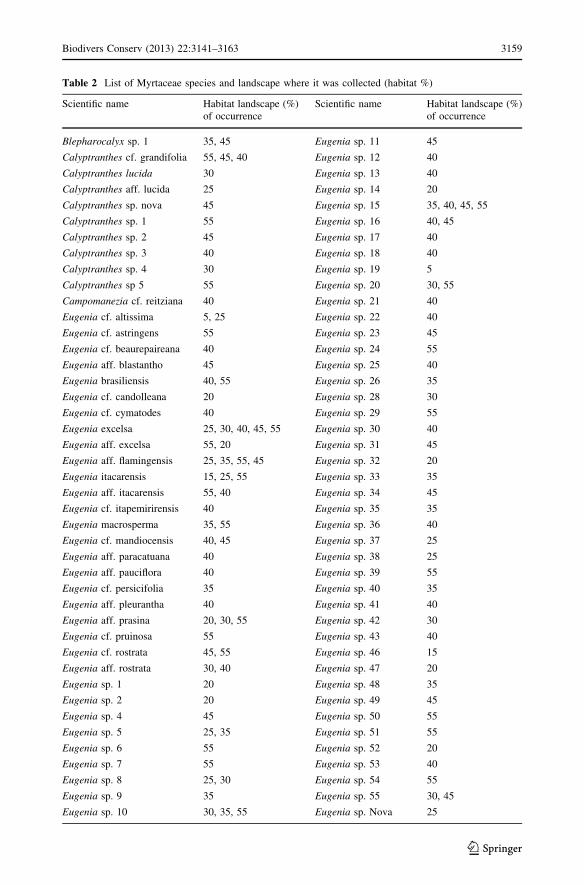
Table 2 List of Myrtaceae species and landscape where it was collected (habitat %)
Scientific name Habitat landscape (%)of occurrence
Scientific name Habitat landscape (%)of occurrence
Blepharocalyx sp. 1 35, 45 Eugenia sp. 11 45
Calyptranthes cf. grandifolia 55, 45, 40 Eugenia sp. 12 40
Calyptranthes lucida 30 Eugenia sp. 13 40
Calyptranthes aff. lucida 25 Eugenia sp. 14 20
Calyptranthes sp. nova 45 Eugenia sp. 15 35, 40, 45, 55
Calyptranthes sp. 1 55 Eugenia sp. 16 40, 45
Calyptranthes sp. 2 45 Eugenia sp. 17 40
Calyptranthes sp. 3 40 Eugenia sp. 18 40
Calyptranthes sp. 4 30 Eugenia sp. 19 5
Calyptranthes sp 5 55 Eugenia sp. 20 30, 55
Campomanezia cf. reitziana 40 Eugenia sp. 21 40
Eugenia cf. altissima 5, 25 Eugenia sp. 22 40
Eugenia cf. astringens 55 Eugenia sp. 23 45
Eugenia cf. beaurepaireana 40 Eugenia sp. 24 55
Eugenia aff. blastantho 45 Eugenia sp. 25 40
Eugenia brasiliensis 40, 55 Eugenia sp. 26 35
Eugenia cf. candolleana 20 Eugenia sp. 28 30
Eugenia cf. cymatodes 40 Eugenia sp. 29 55
Eugenia excelsa 25, 30, 40, 45, 55 Eugenia sp. 30 40
Eugenia aff. excelsa 55, 20 Eugenia sp. 31 45
Eugenia aff. flamingensis 25, 35, 55, 45 Eugenia sp. 32 20
Eugenia itacarensis 15, 25, 55 Eugenia sp. 33 35
Eugenia aff. itacarensis 55, 40 Eugenia sp. 34 45
Eugenia cf. itapemirirensis 40 Eugenia sp. 35 35
Eugenia macrosperma 35, 55 Eugenia sp. 36 40
Eugenia cf. mandiocensis 40, 45 Eugenia sp. 37 25
Eugenia aff. paracatuana 40 Eugenia sp. 38 25
Eugenia aff. pauciflora 40 Eugenia sp. 39 55
Eugenia cf. persicifolia 35 Eugenia sp. 40 35
Eugenia aff. pleurantha 40 Eugenia sp. 41 40
Eugenia aff. prasina 20, 30, 55 Eugenia sp. 42 30
Eugenia cf. pruinosa 55 Eugenia sp. 43 40
Eugenia cf. rostrata 45, 55 Eugenia sp. 46 15
Eugenia aff. rostrata 30, 40 Eugenia sp. 47 20
Eugenia sp. 1 20 Eugenia sp. 48 35
Eugenia sp. 2 20 Eugenia sp. 49 45
Eugenia sp. 4 45 Eugenia sp. 50 55
Eugenia sp. 5 25, 35 Eugenia sp. 51 55
Eugenia sp. 6 55 Eugenia sp. 52 20
Eugenia sp. 7 55 Eugenia sp. 53 40
Eugenia sp. 8 25, 30 Eugenia sp. 54 55
Eugenia sp. 9 35 Eugenia sp. 55 30, 45
Eugenia sp. 10 30, 35, 55 Eugenia sp. Nova 25
Biodivers Conserv (2013) 22:3141–3163 3159
123

Table 2 continued
Scientific name Habitat landscape (%)of occurrence
Scientific name Habitat landscape (%)of occurrence
Marlierea cf. levigata 5, 30 Myrcia sp. 16 55
Marlierea cf. neowiedeana 55 Myrcia sp. 17 30
Marlierea obumbrans 25 Myrcia sp. nova 30, 55
Marlierea cf. obversa 35, 55 Myrcia sp. nova 1 55
Marlierea cf. regeliana 30, 35 Myrcia sp. nova 2 40
Marlierea cf. rufa 40, 55 Myrciaria ferruginea 35, 40
Marlierea aff. silvatica 45 Myrciaria cf.floribunda
20, 25, 30, 40, 45, 55
Marlierea sp. 1 40 Myrciaria tenella 45
Marlierea sp. 2 30 Myrciaria sp. 1 30
Marlierea sp. 4 45 Myrciaria sp. nova 1 40
Marlierea sp. 5 45 Neomitranthes cf.glomerata
35, 40, 55
Marlierea sp. 6 40 Plinia cf. callosa 45
Marlierea sp. 7 55 Plinia aff. rara 45
Myrceugenia cf. miersiana 30 Plinia sp. 1 35
Myrcia cf. bergiana 35, 40 Plinia sp. 3 45
Myrcia aff. bicolor 40 Psidium aff.myrtoides
40
Myrcia aff. blanchetiana 40 Psidium sp. 1 45
Myrcia cf. calyptranthoides 40 Psidium sp. 2 20
Myrcia colpodes 35 Sp. 1 40
Myrcia cf. crocea 35, 45 Sp. 2 40
Myrcia cf. hirtiflora 5, 25 Sp. 3 40
Myrcia cf. micropetala 45 Sp. 4 40
Myrcia cf. neoblanchetiana 30, 40 Sp. 5 40
Myrcia pulchra 30, 40 Sp. 6 35
Myrcia cf. racemosa 30, 35, 40, 55 Sp. 7 45
Myrcia rethusa 30 Sp. 8 35, 45
Myrcia aff. rethusa 40, 55 Sp. 9 35
Myrcia silvatica 15, 25, 45, 55 Sp. 10 35
Myrcia splendens 5, 15, 25, 30, 35, 40,45, 55
Sp. 11 55
Myrcia cf. springiana 30 Sp. 12 55
Myrcia vittoriana 25, 35, 40, 45 Sp. 13 55
Myrcia aff. vittoriana 25, 35, 55 Sp. 14 55
Myrcia sp. 1 45 Sp. 15 45
Myrcia sp. 3 40 Sp. 16 35
Myrcia sp. 4 45 Sp. 17 25
Myrcia sp. 5 30 Sp. 18 45
Myrcia sp. 7 45 Sp. 20 25
Myrcia sp. 8 40 Sp. 22 45
Myrcia sp. 9 55 Sp. 23 15
Myrcia sp. 10 45 Sp. 25 40
3160 Biodivers Conserv (2013) 22:3141–3163
123

References
Andren H (1994) Effects of habitat fragmentation on birds and mammals in landscapes with differentproportions of suitable habitat: a review. Oikos 71:355–366
Banks-Leite C, Ewers RM, Kapos V, Martensen AC, Metzger JP (2011) Comparing species and measures oflandscape structure as indicators of conservation importance. J Appl Ecol 48:706–714
Bawa KS, Kress WJ, Nadkarni NM, Lele S (2004) Beyond paradise-meeting the challenges in tropicalbiology in the 21 st century. Biotropica 36:437–446
Bennett AF, Haslem A, Cheal DC, Clarke MF, Jones RN, Koehn JD, Lake PS, Lumsden LF, Lunt ID,Mackey BG, Nally RM, Menkhorst PW, New TR, Newell GR, O’Hara T, Quinn GP, Radford JQ,Robinson D, Watson JEM, Yen AL (2009) Ecological processes: a key element in strategies for natureconservation. Ecol Manage Restor 10:192–199
Cavalcanti C (2006) Opulencia vegetal, cobica insaciavel e a entropizacao da entropia: uma visao da historiasocioambiental da Mata Atlantica. In: Siqueira-Filho JA, Leme E (eds) Fragmentos da Mata Atlanticado Nordeste—biodiversidade, conservacao e suas bromelias. Andrea Jakobsson Estudio, Rio deJaneiro, pp 13–45
CONAMA (1994) Resolucao n805 que define vegetacao primaria e secundaria nos estagios inicial, medio eavancado de regeneracao da Mata Atlantica, a fim de orientar os procedimentos de licenciamento deatividades florestais no Estado da Bahia. Diario Oficial da Uniao 101:7912–7913
Condit R, Hubbell SP, Foster RB (1992) Recruitment near conspecific adults and the maintenance of treeand shrub diversity in a neotropical forest. Am Nat 140:261–286
de Blois S, Domon G, Bouchard A (2002) Landscape issues in plant ecology. Ecography 25:244–256Drinnan IN (2005) The search for fragmentation thresholds in a southern Sydney suburb. Biol Conserv
124:339–349Ewers RM, Didham RK (2006) Confounding factors in the detection of species responses to habitat frag-
mentation. Biol Rev 81:117–142Fahrig L (2001) How much habitat is enough? Biol Conserv 100:65–74Fahrig L (2002) Effect of habitat fragmentation on the extinction threshold: a synthesis. Ecol Appl
12:346–353Fahrig L (2003) Effects of habitat fragmentation on biodiversity. Annu Rev Ecol Evol Syst 34:487–515FAO—Food and Agriculture Organization of the United Nations (2001) State of the world’s forests. FAO,
RomeFaria D, Mariano-Neto E, Martini AMZ, Ortiz JV, Montingelli R, Rosso S, Paciencia MLB, Baumgarten J
(2009) Forest structure in a mosaic of rainforest sites: the effect of fragmentation and recovery afterclear cut. Forest Ecol Manag 257:2226–2234
Ficetola GF, Denoel M (2009) Ecological thresholds: an assessment of methods to identify abrupt changesin species-habitat relationships. Ecography 32:1075–1084
Flather CH, Bevers M (2002) Patchy reaction-diffusion and population abundance: the relative importanceof habitat amount and arrangement. Am Nat 159:40–56
Fundacao SOS Mata Atlantica and INPE (2008) Atlas dos remanescentes florestais da Mata Atlanticaperıodo 2000–2005. Fundacao SOS Mata Atlantica/Instituto Nacional de Pesquisas Espaciais, SaoPaulo
Giulietti AM, Harley RM, Queiroz LP, Wanderley MGL, van den Berg C (2005) Biodiversity and con-servation of plants in Brazil. Conserv Biol 19:632–639
Gressler E, Pizo MA, Morellato PC (2006) Polinizacao e dispersao de sementes de Myrtaceae no Brasil. RevBras Bot 29:509–530
Table 2 continued
Scientific name Habitat landscape (%)of occurrence
Scientific name Habitat landscape (%)of occurrence
Myrcia sp. 11 15 Sp. 26 40
Myrcia sp. 13 35 Sp. 27 55
Myrcia sp. 14 40 Sp. 28 35
Myrcia sp. 15 25, 30, 35, 45, 55 Sp. 29 55
Biodivers Conserv (2013) 22:3141–3163 3161
123

Groffman PM, Baron JS, Blett T, Gold AJ, Goodman I, Gunderson LH, Levinson BM, Palmer MA, PaerlHW, Peterson GD, Poff NL, Rejeski DW, Reynolds JF, Turner MG, Weathers KC, Wiens J (2006)Ecological thresholds: the key to successful environmental management or an important concept withno practical application? Ecosystems 9:1–13
Guedes-Bruni RR, Pessoa SVA, Kurtz BC (1997) Florıstica e estrutura do componente arbustivo-arboreo deum trecho preservado de floresta montana na Reserva Ecologica de Macae de Cima. In: Lima HC,Guedes-Bruni RR (eds) Serra de Macae de Cima: diversidade florıstica e conservacao em MataAtlantica. Instituto de Pesquisas Jardim Botanico do Rio de Janeiro, Rio de Janeiro, pp 127–136
Hanski I (1994) A practical model of metapopulation dynamics. J Anim Ecol 63:151–162Huggett AJ (2005) The concept and utility of ecological thresholds’ in biodiversity conservation. Biol
Conserv 124:301–310King RS, Baker ME (2011) An alternative view of ecological community threshold and appropriate analyses
for their detection: comment. Ecol Appl 21:2833–2839Kuussaari M, Bommarco R, Heikkinen RK, Helm A, Krauss J, Lindborg R, Ockinger E, Partel M, Pino J,
Roda F, Stefanescu C, Teder T, Zobel M, Steffan-Dewenter I (2009) Extinction debt: a challenge forbiodiversity conservation. Trends Ecol Evol 24:564–571
Lindenmayer DB, Luck G (2005) Synthesis: thresholds in conservation and management. Biol Conserv124:351–354
Lindenmayer DB, Fischer J, Cunningham RB (2005) Native vegetation cover thresholds associated withspecies responses. Biol Conserv 124:311–316
Lopes AV, Girao LC, Santos BA, Peres CA, Tabarelli M (2009) Long-term erosion of tree reproductive traitdiversity in edge-dominated Atlantic forest fragments. Biol Conserv 142:1154–1165
MacArthur RH, Wilson EO (1967) The theory of island biogeography. Princeton University Press, PrincetonMartensen AC, Pimentel RG, Metzger JP (2008) Relative effects of fragment size and connectivity on bird
community in the Atlantic Rain Forest: implications for conservation. Biol Conserv 141:2184–2192Melo MMF, Mantovani W (1994) Composicao florıstica e estrutura de trecho de Mata Atlantica de encosta
na Ilha do Cardoso (Cananeia, SP, Brasil). Bol Inst Bot 9:107–158Mendonca JR, de Carvalho AM, Mattos-Silva LA, Thomas WW (1994) 45 anos de desmatamento no sul da
Bahia, remanescentes da Mata Atlantica—1945(1960), 1974, 1990. Projeto Mata Atlantica Nordeste/CEPEC, Ilheus
Metzger JP, Martensen AC, Dixo M, Bernacci LC, Ribeiro MC, Teixeira AMG, Pardini R (2009) Time-lagin biological responses to landscape changes in a highly dynamic Atlantic Forest region. Biol Conserv142:1166–1177
Millennium Ecosystem Assessment (2005) Ecosystems and human well-being: biodiversity synthesis.World Resources Institute, Washington DC
Montoya D, Alburquerque FS, Rueda M, Rodrıguez MA (2010) Species’ response patterns to habitatfragmentation: do trees support the extinction threshold hypothesis? Oikos 119:1335–1343
Mori SA, Boom BM, Carvalino AM, Santos TS (1983) Ecological importance of Myrtaceae in an EasternBrazilian Wet Forest. Biotropica 15:68–70
Muggeo VMR (2008) Segmented: an R package to fit regression models with broken-line relationships.R News 8:20–25
Muggeo VMR (2012) The package segmented 0.2–8.4. http://www.R-project.org. Accessed 20 Apr 2012Murray-Smith C, Brummitt NA, Oliveira-Filho AT, Bachman S, Moat J, Lughadha EMN, Lucas EJ (2008)
Plant diversity hotspots in the Atlantic coastal forests of Brazil. Conserv Biol 23:151–163Myers N, Mittermeier RA, Mittermeier CG, da Fonseca GAB, Kent J (2000) Biodiversity hotspots for
conservation priorities. Nature 403:853–858Oliveira LC, Hankerson SJ, Dietz JM, Raboy BE (2010) Key tree species for the golden-headed lion tamarin
and implications for shade-cocoa management in southern Bahia, Brazil. Anim Conserv 13:60–70Paltto H, Norden B, Gotmark F, Franc N (2006) At which spatial and temporal scales does landscape context
aff.ect local density of Red Data Book and Indicator species? Biol Conserv 133:442–454Pardini R, de Souza SM, Braga-Neto R, Metzger JP (2005) The role of forest structure, fragment size and
corridors in maintaining small mammal abundance and diversity in an Atlantic forest landscape. BiolConserv 124:253–266
Pardini R, Faria D, Accacio GM, Laps RR, Mariano-Neto E, Paciencia MLB, Dixo M, Baumgarten J (2009)The challenge of maintaining Atlantic forest biodiversity: a multi-taxa conservation assessment ofspecialist and generalist species in an agro-forestry mosaic in southern Bahia. Biol Conserv142:1178–1190
Pardini R, Bueno AA, Gardner TA, Prado PI, Metzger JP (2010) Beyond the fragmentation thresholdhypothesis: regime shifts in biodiversity across fragmented landscapes. PLoS One 5:1–10
Primack RB, Rodrigues E (2001) Biologia da conservacao. Editora Planta, Parana
3162 Biodivers Conserv (2013) 22:3141–3163
123

R Development Core Team (2012) R: a language and environment for statistical computing. R Foundationfor Statistical Computing, Vienna
Radford JQ, Bennett AF, Cheers GJ (2005) Landscape-level thresholds of habitat cover for woodland-dependent birds. Biol Conserv 124:317–337
Rhodes JR, Callagham JG, McAlpine CA, de Jong C, Bowen ME, Mitchell DL, Lunney D, Possingham HP(2008) Regional variation in habitat–occupancy thresholds: a warning for conservation planning.J Appl Ecol 45:549–557
Ribeiro MC, Metzger JP, Martensen AC, Ponzoni FJ, Hirota MM (2009) The Brazilian Atlantic Forest: howmuch is left, and how is the remaining forest distributed? Implications for conservation. Biol Conserv142:1141–1153
Rigueira DMG (2011) Limiares ecologicos na economia pos-moderna. Ciencia Hoje 48:68–69Rigueira DMG, Coutinho SL, Pinto-Leite CM, Sarno VLC, Estavillo C, Chastinet CBA, Dias VS, Campos S
(2013) Perda de habitat, leis ambientais e conhecimento cientıfico: proposta de criterios para a ava-liacao de pedidos de supressao de vegetacao. Rev Caititu 1:01–22. doi:10.7724/caititu.2012.v1.n1.d03
Rodrigues RR, Lima RAF, Gandolfi S, Nave AG (2009) On the restoration of high diversity forests:30 years of experience in the Brazilian Atlantic Forest. Biol Conserv 142:1242–1251
Santos BA, Peres CA, Oliveira MA, Grillo A, Alves-Costa CP, Tabarelli M (2008) Drastic erosion infunctional attributes of tree assemblages in Atlantic Forest fragments of northeastern Brazil. BiolConserv 141:249–260
Schmidt BD, Roland J (2006) Moth diversity in a fragmented habitat: importance of functional groups andlandscape scale in the boreal forest. Ann Entomol Soc Am 99:1110–1120
Silva AF, Leitao-Filho HF (1982) Composicao florıstica e estrutura de um trecho de mata de encosta nomunicıpio de Ubatuba. Rev Bras Bot 5:43–52
Silva GC, Nascimento MT (2001) Fitossociologia de um remanescente de mata sobre tabuleiros no norte doestado do Rio de Janeiro (Mata do Carvao). Rev Bras Bot 24:51–62
Souza VC, Lorenzi H (2005) Botanica sistematica: guia ilustrado para identificacao das famılias de An-giospermas da flora brasileira, baseado em APG II. Instituto Plantarum, Sao Paulo
Stehmann JR, Forzza RC, Salino A, Sobral M, Costa DP, Kamino LHY (2009) Plantas da floresta atlantica.Instituto de Pesquisas Jardim Botanico do Rio de Janeiro, Rio de Janeiro 516p
Swift TL, Hannon SJ (2010) Critical thresholds associated with habitat loss: a review of the concepts,evidence, and applications. Biol Rev 85:35–53
Tabarelli M, Peres CA (2002) Abiotic and vertebrate seed dispersal in the Brazilian Atlantic forest:implications for forest regeneration. Biol Conserv 106:165–176
Tabarelli M, da Silva JMC, Gascon C (2004) Forest fragmentation, synergisms and the impoverishment ofneotropical forests. Biodivers Conserv 13:1419–1425
Tabarelli M, Aguiar AV, Ribeiro MC, Metzger JP (2010) Prospects for biodiversity conservation in theAtlantic Forest: lessons from aging human-modified landscapes. Biol Conserv 143:2328–2340
Tilman D, May RM, Lehman CL, Nowak MA (1996) Habitat destruction and the extinction debt. Nature371:65–66
Toms JD, Lesperance ML (2003) Piecewise regression: a tool for identifying ecological thresholds. Ecology84:2034–2041
Turner IM (1996) Species loss in fragments of tropical rain forest: a review of the evidence. J Appl Ecol33:200–209
United Nations (1992) Agenda 21: The UN programme of action from Rio. United Nations, New YorkVeloso HP, Rangel-Filho ALR, Lima JCA (1991) Classificacao da vegetacao brasileira, adaptada a um
sistema universal. IBGE/Departamento de Recursos Naturais e Estudos Ambientais, Rio de JaneiroWright SJ, Muller-Landau HC (2006) The future of tropical forest species. Biotropica 38:287–301
Biodivers Conserv (2013) 22:3141–3163 3163
123