Advanced modelling and preliminary psychophysical experiments for a free-hand haptic device
Upload
independentCategory
view
1download
0
MANAGED ESTIMATION OF PSYCHOPHYSICAL THRESHOLDSBart Vaerenberg1,2, Willemijn Heeren3, Paul J. Govaerts1,2
1 The Eargroup, Antwerp, Belgium2 Laboratory of Biomedical Physics, University of Antwerp, Belgium3 Leiden University Centre for Linguistics, Leiden, Holland
Corresponding author: Paul J. Govaerts, The Eargroup, Antwerp, Belgium, e-mail: [email protected]
Abstract
Objective: The estimation of perceptive thresholds is a basic element of psychoacoustics. One of the drawbacks of common-ly used adaptive algorithms is the lack of reliability when the behavioral response is not robust. To address this issue an adap-tive algorithm, TEMA (Threshold Estimation by Managed Algorithm), has been developed.
Design: TEMA seeks the 50% point on the psychometric curve based on an up-down staircase procedure. Internal controls and stochastic processes aim at enhancing the reliability. The development of TEMA is described, together with its validations with reference to common adaptive procedures. Both Monte Carlo simulations and real subject testing were performed to as-sess the psychoacoustic threshold in intonation perception tests and the number of stimulus presentations needed.
Study sample: A total of 29 adult listeners participated in the within-subjects comparison; 19 listeners had normal-hearing, the other 10 were hearing impaired (5 aided, 5 unaided).
Results: The results show that TEMA outperformed commonly used algorithms in non-robust responders, with a minimal cost in terms of test duration.
Conclusions: TEMA’s adaptive algorithm was shown to be significantly more resistant to gambling or cheating behavior and threshold drift than traditional, reversal-based algorithms. TEMA increases the accuracy of threshold estimation and the test reliability in non-robust responders. This makes TEMA applicable for automated threshold measurements in clinical settings.
EVALUACIÓN CONTROLADA DE LOS UMBRALES PSICOFÍSICOS
Resumen
Objetivo: La evaluación de los umbrales de percepción es un elemento básico de la psicoacústica. Uno de los defectos de los algoritmos adaptativos comúnmente utilizados es su falta de fiabilidad cuando las respuestas conductuales son imprecisas. Para resolver este problema, se ha elaborado un algoritmo adaptativo TEMA (Threshold Estimation by Managed Algorithm – algo-ritmo controlado de evaluación del umbral).
Método de concesión: El algoritmo TEMA busca el punto de 50% en la curva psicométrica señalada con ayuda del procedi-miento arriba-abajo. Para aumentar la fiabilidad se utilizó el control interno y el enfoque estocástico. Se describe el proceso de elaboración y validación del TEMA en lo relativo a los procedimientos adaptativos corrientes. Para evaluar los umbrales psi-coacústicos en las pruebas de percepción de la entonación y comprobar cuántas veces hay que presentar un estímulo, se lleva-ron a cabo simulaciones con el método Monte Carlo y pruebas en pacientes.
Prueba estudiada: Un grupo de 29 oyentes adultos participó en los estudios comparativos. 19 oyentes oían con normalidad, los 10 restantes sufrían hipoacusia (5 con prótesis, 5 sin prótesis).
Resultados: Los resultados obtenidos indican que el TEMA, al alargar insignificantemente la duración del estudio, demuestra su superioridad sobre los algoritmos comúnmente utilizados en el caso de respuestas débiles.
Conclusiones: Se ha demostrado que el algoritmo adaptativo TEMA es bastante más resistente a la colaboración deshonesta y los intentos de trampa y asegura una menor inestabilidad del umbral que los algoritmos tradicionales basados en procedimientos de vuelta atrás. El TEMA aumenta la precisión de evaluación del umbral de audición y la fiabilidad de la prueba en pacientes que no colaboran demasiado. Gracias a ello, el TEMA puede ser utilizado en las mediciones automatizadas en condiciones clínicas.
19© Journal of Hearing Science® · 2013 Vol. 3 · No. 3
Background
Different procedures have been developed over time to seek the perceptive threshold of a variety of sound fea-tures. The most common application in clinical practice is found in pure tone audiometry, a widely used evaluation of a listener’s hearing capacity. A popular method for con-ducting audiometry is the Hughson-Westlake procedure
УПРАВЛЯЕМАЯ ОЦЕНКА ПСИХОФИЗИЧЕСКИХ ПОРОГОВ
Изложение
Цель: Оценка порогов восприятия – это основной элемент психоакустики. Один из недостатков повсеместно используемых адаптационных алгоритмов – отсутствие достоверности в случаях, когда поведенческие ответы недостаточны. Чтобы решить эту проблему, разработан адаптационный алгоритм TEMA (Threshold Estimation by Managed Algorithm - управляемый алгоритм оценки порога).
Методика передачи: Алгоритм TEMA находит точку 50% на психометрической кривой, определенной с по-мощью процедуры верх-низ. Чтобы увеличить достоверность, использовано внутреннее управление и стоха-стический подход. Описан процесс разработки и валидации TEMA по отношению к обычным адаптационным процедурам. Проведены симуляции с помощью метода Монте- Карло и тесты на пациентах с целью оценки пси-хоакустических порогов в тестах восприятия интонации и проверки, сколько раз следует представить стимул.
Исследованный опыт: Группа 29 взрослых слушателей взяла участие в межиндивидуальных сравнительных исследованиях. У 19 слушателей был нормальный слух, у остальных 10 – тугоухость (5 протезированных, 5 непротезированных).
Результаты: Полученные результаты показывают, что TEMA, при незначительном увеличении времени иссле-дования, показывает превосходство над повсеместно использованными алгоритмами в случае слабых ответов.
Итоги: Доказано, что адаптационный алгоритм TEMA значительно более стойкий против недобросовестного сотрудничества и попыток обмана, а также он гарантирует меньшую нестабильность порога, чем традицион-ные алгоритмы, основанные на процедурах с возвратами. TEMA повышает точность оценки порога слышания и достоверность теста у плохо сотрудничающих пациентов. Благодаря этому TEMA пригодна для использова-ния при автоматизированных измерениях порогов в клинических условиях.
STEROWANA OCENA PROGÓW PSYCHOFIZYCZNYCH
Streszczenie
Cel: Ocena progów percepcji jest podstawowym elementem psychoakustyki. Jedną z wad powszechnie stosowanych algorytmów adaptacyjnych jest brak wiarygodności w przypadkach, gdy odpowiedzi behawioralne są niewyraźne. By rozwiązać ten problem opracowano algorytm adaptacyjny TEMA (Threshold Estimation by Managed Algorithm - sterowany algorytm oceny progu).
Metodyka nadania: Algorytm TEMA wyszukuje punkt 50% na krzywej psychometrycznej wyznaczonej przy pomocy proce-dury góra-dół. W celu zwiększenia wiarygodności zastosowano sterowanie wewnętrzne i podejście stochastyczne. Opisany jest proces opracowania i walidacji TEMA w odniesieniu do zwykłych procedur adaptacyjnych. W celu oceny progów psychoaku-stycznych w testach percepcji intonacji i sprawdzenia ile razy należy zaprezentować bodziec przeprowadzone zostały symula-cje metodą Monte Carlo oraz testy na pacjentach.
Badana próba: Grupa 29 dorosłych słuchaczy wzięła udział w śródosobniczych badaniach porównawczych. 19 słuchaczy mia-ło normalny słuch, u pozostałych 10 występował niedosłuch (5 protezowany, 5 nieprotezowany).
Wyniki: Uzyskane wyniki wskazują, że TEMA, przy nieznacznym wydłużeniu czasu badania, wykazuje wyższość nad powszech-nie stosowanymi algorytmami w przypadku słabych odpowiedzi.
Wnioski: Udowodniono, że algorytm adaptacyjny TEMA jest znacząco bardziej odporny na nierzetelną współpracę i próby oszustwa oraz zapewnia mniejszą niestabilność progu niż tradycyjne algorytmy oparte na procedurach z nawrotami. TEMA zwiększa dokładność oceny progu słyszenia i wiarygodność testu u pacjentów źle współpracujących. Dzięki temu TEMA na-daje się do zastosowania w zautomatyzowanych pomiarach progów w warunkach klinicznych.
or one of its modifications [1]. It uses a descending famil-iarization trial that starts at a level presumed to be well above threshold and decreases intensity in steps of 10 dB. Afterwards, a threshold is sought using ascending trials, increasing stimulus level by 5 dB steps. Usually the thresh-old is defined as the lowest intensity at which positive re-sponses were obtained in 50% of the trials. The definition of threshold as used in audiometry has lead to the fact that
Original articles • 19–31
20 © Journal of Hearing Science® · 2013 Vol. 3 · No. 3
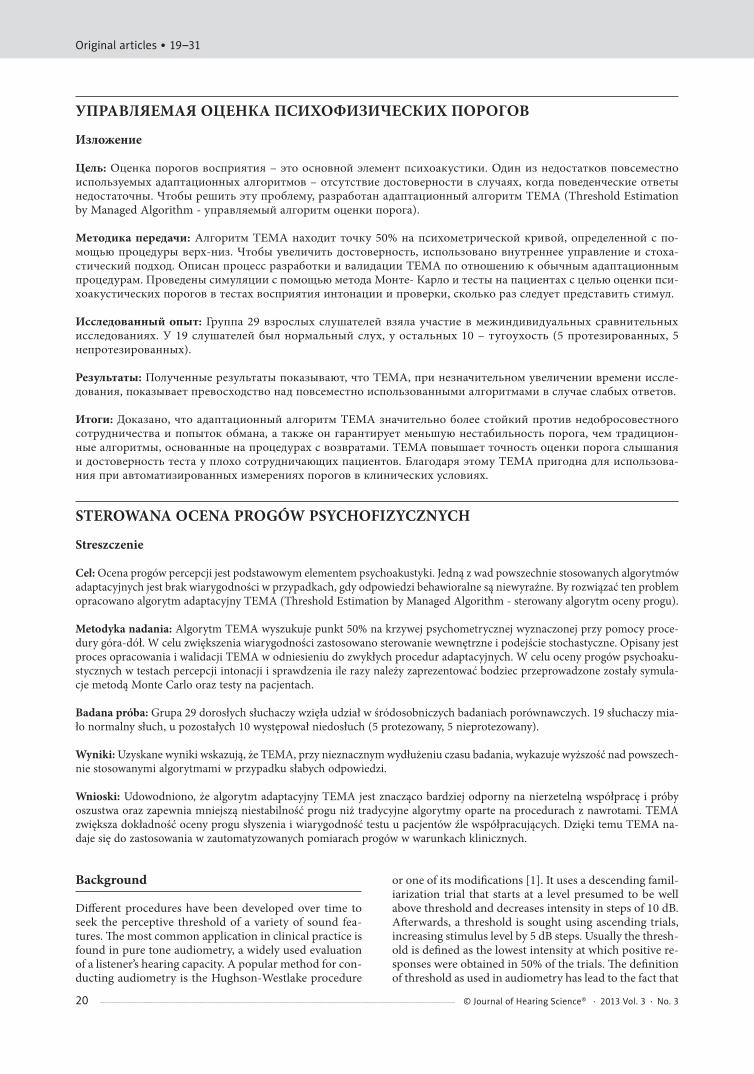
clinicians, in general, when speaking of auditory thresh-olds, naturally think of the stimulus level at which a sub-ject responds correctly in 50% of the trials.
The execution of the Hughson-Westlake and similar pro-cedures in clinical environments typically requires man-ual manipulation of the stimulus level by a competent tester, which is often time-consuming and subject to in-tra- and inter-tester variability. Many attempts have been made to automate this for all sorts of scientific and clin-ical settings, for instance with Békésy audiometry [2] or AMTAS [3]. These attempts are generally based on the principle of a stimulus level that is automatically adapted to the listener’s responses. Hence, the latter methods are called adaptive methods.
A listener’s response to stimuli that are presented at dif-ferent levels is typically probabilistic. It can be described by a psychometric function (e.g., cumulative Gaussian or logistic functions) showing that the probability of positive responses increases from 0% (or chance level, depending on the test task) to 100% with increasing stimulus inten-sity (Figure 1). The perceptive threshold, as defined by the presentation level that yields a positive response in 50% of presentations, is also referred to as the equilibrium point or just noticeable difference (JND).
Currently, three types of adaptive methods are being used in psychophysical research as well as in clinical practice: (i) parameter estimation by sequential testing (PEST; [4]), (ii) staircase procedures [5], and (iii) maximum likeli-hood estimation procedures (MLE) [6,7]. For more ex-tensive overviews and comparisons of adaptive methods in psychophysical research the reader is referred to Lev-itt [5], Treutwein [8], and Leek [9]. All adaptive proce-dures require choices to be made by the developer, with respect to stimulus selection, the initial stimulus level, step size, stop criterion, threshold estimation, etc. These choices and therefore all existing procedures have advan-tages and disadvantages, and discussions exist in the lit-erature as to which one is superior under which circum-stances (e.g., [8–11]). By choosing the right method for a particular experiment or setup, efficiency can be in-creased considerably.
Of the three types of methods mentioned earlier, up-down staircase procedures are commonly used and can be called the standard in the current art [12–14]. In up–down pro-cedures, the presentation level of any given stimulus de-pends on the participant’s response to one or more pre-ceding stimuli. In the 1-up/1-down procedure the stimulus level is decreased after one positive response, and increased after one negative response. The step size typically decreas-es as the test proceeds, and this can be either on a discrete or a continuous scale. A run is defined by one or more stimuli yielding the same response (either positive or neg-ative), and a reversal occurs when the direction changes from decreasing to increasing (i.e. the response changes from positive to negative), or vice versa. By gradually de-creasing the step size the stimulus level in a 1-up/1-down procedure converges to the 50% correct point, the partic-ipant’s threshold. Typically the test is terminated when a preset number of reversals is reached, and threshold esti-mation is done by averaging either the minima and max-ima of all runs or the mid-run estimates of every second run (Wetherill, 1963). Usually, the first reversals are dis-carded in this computation. In transformed n-up/m-down procedures the stimulus level is changed only after a cer-tain sequence of responses. For instance, the 1-up/2-down method increases the stimulus level after each incorrect re-sponse, but it only decreases the stimulus level after 2 con-secutive correct answers. The transformed procedures con-verge at other points along the psychometric function, such as 70.7% for the 1-up/2-down version (see [5], Table 1).
This paper introduces the TEMA (Threshold Estimation by Managed Algorithm) algorithm. It was developed for a new module of the Auditory Speech Sounds Evaluation (A§E) test [15] which was originally designed to assess speech sound detection, discrimination, and identification in hearing-impaired listeners. The A§E has now being extended with a cross-linguistically usable module that includes prosod-ic stimuli (pseudo-sentences and pseudo-words) and syn-thetic stimuli (harmonic complexes) to assess the coding of low frequency (<500 Hz) sound by the aided or unaided ear. These modules will be described in a separate publication.
Since it aims at being used in clinical practice, TEMA should be relatively short in duration, easy to understand for testers and participants, and place minimal require-ments on the participants’ memory load. In addition, it should either produce a result that is reliable or produce no result at all. In contrast to most scientific research methods, where results of high numbers of experiments are statisti-cally analyzed to draw conclusions, the outcome of a single experiment on an individual subject is clinically relevant, making reliability an important requirement. To address this requirement, TEMA aims at improving commonly used up-down procedures in the following aspects. 1) the arbitrariness of using a predefined number of reversals as a stop criterion and for threshold estimation, 2) the use of non-intuitive thresholds (e.g. 70%), and 3) the lack of detecting non-robust (misinformed, incapable, or malin-gering) responders. As such, the procedure should allow for completely automated appliance in clinical practice, without the need for a clinical professional to be present during the procedure to detect whether a subject has mis-understood instructions, shows unstable response behav-ior, or is determined to fake a poor result.
100908070605040302010
0Stimulus Level
Perce
nt Co
rrect
Figure 1. A typical psychometric function showing the probability of a correct response as a function of presentation level. The equilibrium point is defined as the point along the curve where 50% of the subject’s answers are correct. The stimulus level at this point is the subject’s threshold or JND
Vaerenberg et al. – Managed Estimation of Psychophysical Thresholds
21© Journal of Hearing Science® · 2013 Vol. 3 · No. 3

The following sections first describe the development and implementation of the new algorithm and then its valida-tion, followed by a discussion.
Algorithm development
Description of the algorithm
An adaptive staircase algorithm was developed to seek the perceptive threshold or JND of stimuli presented in a va-riety of tasks (yes/no, same/different, n-alternative forced/unforced choice).
Initialization
The algorithm was designed for use with discrete stim-ulus levels, but it can be applied to continuous stimu-lus domains if a desired precision is supplied. The term ‘level’ refers, in this context, not necessarily to intensi-ty level but to all possible level differences in the acous-tic features of the signal (like spectral level). The stimu-lus domain ranges from reference level (i.e. no stimulus present) to a maximum level that is chosen to reflect the
largest stimulus considered to be of interest. Discrete stim-ulus levels within this range are derived from the desired accuracy. They are ranked with rank 0, corresponding to the reference stimulus level, and rank M to the maximum level. The initial stimulus level is set to the median of all available ranks. If the median is not a valid level (i.e. when the number of available levels is even), the first valid lev-el greater than the median is selected. The step size s is expressed in terms of ranks. The initial step size is set to the highest integer less than one-fourth of the total num-ber of stimulus levels.
Stimulus selection
After a correct response the stimulus level is decreased by the step size, and after an incorrect response the stimulus level is increased by the step size. The selected stimulus level is never smaller than the minimum (i.e. reference) level and never larger than the maximum level. A reversal occurs when the subject’s response differs from the previ-ous response; note that responses to internal control stim-uli are ignored (see later).
Category N TEMA better Ratio REF better
Gamblers 4 3 1.6–16 0
Cheaters 8 8 ∞ 0
Category N Better algorithmThreshold Nr trials
N Diff N Diff
Perfects 6TEMA 0 0
2–98%REF 0 6
Normals 8TEMA 2 3–6% 0
27–108%REF 1 5% 8
Drifters 12TEMA 6 29–190% 0
14–88%REF 4 9–37% 12
Category N Algorithm Threshold Nr trials
NH 19TEMA 12 20
REF 13.5 18
HI 10TEMA 49 31
REF 34 21
Table 1. Summary of simulated and real subject results comparing the TEMA and the REF algorithm
TOP: results for Monte Carlo simulations in groups A (gamblers) and B (cheaters). The TEMA algorithm yielded sig-nificantly higher rejection rates (i.e. better “fraud detection”) in 3 out of 4 gambler configurations and in all 8 cheat-er configurations. The column headed “ratio” shows the range of the rejection rate for both algorithms (TEMA/REF). MID: results for Monte Carlo simulations in groups C (perfect responders), D (normal responders), and E (drifting re-sponders).The TEMA algorithm yielded more accurate thresholds in 2 out of 8 subjects with normal behavior and 6 out of 12 with drifting behavior. It yielded less accurate thresholds in 1 subject with normal and in 4 subjects with drifting behavior. The column headed “Diff” shows the range of the improvement or deterioration in threshold expressed as per-cent closer to or further from target. Likewise, the TEMA algorithm yielded longer test duration in all cases. The column headed “Diff” shows the range of the increase in trials compared to the reference algorithm. BOTTOM: Median results of real test subjects. The threshold differences were not statistically different for both algorithms. The number of trials required to find the threshold was significantly longer with the TEMA algorithm in hearing impaired subjects but not in normally hearing subjects.
Original articles • 19–31
22 © Journal of Hearing Science® · 2013 Vol. 3 · No. 3

Step size
After each reversal the step size is halved and rounded to the nearest integer, see equation (1).
(1) s=si × if s≥1, else s=1R
12( )
where s is the step size (integer), si is the initial step size, and R is the number of reversals. Once the step size drops below 1 it is set to 1.
The step size is recalculated after each trial. If the step size equals 1, it is ‘dithered’ with one or two levels with a chance of 1 in 3. This means that in one-third of the cases where the calculated step size yields 1, it is increased by either one or two units. Applying dither reduces the chance of a subject finding a pattern in the procedure.
Internal controls
Presentations at zero stimulus level (also called reference level) are included as internal controls. They serve to check that the listener is not misunderstanding the task, e.g., us-ing one response option only, and whether he or she is an-swering consistently, i.e. not just guessing. To not confuse the listener at the beginning of the task, internal controls are presented only if three or more responses have been re-corded. After that, the chance of an internal control (pref) is 0.5. In this way the chance of total absence of controls in an experiment halves with each trial. As soon as the first internal control has been presented, pref is determined ac-cording to equation (2), i.e. successive controls are present-ed with a chance relative to the ratio between false posi-tive responses and the number of controls presented so far:
(2) Pref = ,1+ F×N
C×6( )1+ N
2
where F is the number of false positive responses, N is the total number of presentations, and C is the number of in-ternal controls presented.
Figure 2 illustrates the regulation of internal control pres-entations for three false positive control ratios. When a
listener passes all internal controls the chance of anoth-er internal control being presented converges to zero. The chance of a control stimulus being presented increases when the number of false positives increases relative to the number of control presentations. The chance of a con-trol stimulus being presented decreases when the number of false positives decreases relative to the number of con-trols presented. For instance, when all responses to inter-nal controls are false positives, this chance converges to 1/3. When half of the presented controls are passed, chance converges to 1/6.
Correction of the answer ratio
After each response the ratio of correct to incorrect re-sponses is calculated for each stimulus level in search for the threshold level. During this calculation, a correction is made based on the number of false positive responses. The basic assumption behind this correction is that if a subject responds positively when no stimulus is present, the percentage of correct (i.e. positive) responses at stim-ulus level will also be affected by this behavior.
For a stimulus level to be a candidate threshold we assume that 50% (range 35–65%) of the stimuli at that level are de-tected. However, based on the ratio of false positive responses to the number of internal controls (rfp=F/C), we know if and how often the listener signals to detect a stimulus even when no stimulus is present at all. Therefore, the number of success-es at stimulus level is decreased with the number of successes that are presumed to be created by this behavior. This num-ber is based on the false positive ratio applied to half of the total count of the answers at this stimulus level (at absolute threshold, guessing will occur in only half of presentations, i.e. the ones where the listener does not detect the stimulus).
Depending on the number of alternatives that are availa-ble to the listener, the chance of answering correctly when guessing at stimulus level might be smaller than the chance of answering positively when the stimulus is zero. For that reason the successes to discard are divided by the inverse chance of success minus one. This is the ratio between the probability of generating a false positive response at reference level and the probability of answering correctly at the higher stimulus level, all in a total guess scenario.
The corrected ratio is calculated according to equation (3).
(3) r =
N2
1PN
rfp×S–
–1,
where r is the corrected ratio, S is the number of correct responses at the stimulus level, N is the total number of responses at the stimulus level, rfp is the ratio of false pos-itive responses to the number of internal controls, and p is the probability of success in the task.
Stop criteria and threshold estimation
After each trial the algorithm checks whether its stop cri-teria are met. The basic criterion is that a stimulus lev-el must exist where the percentage of correct responses is between 35% and 65%. Equation 3 is used for this cal-culation. This level is adopted as the threshold level, and can either be a single stimulus level or be derived from
0.60
0.50
0.40
0.30
0.20
0.10
0.000 5 10 15
Number of trials20 25
F/C=1F/C=0.5F/C=0
30Prob
abilit
y of in
tern
al co
ntro
l pre
sent
ation
Figure 2. Probability pref of an internal control (presenta-tion at reference level) as a function of the test progress (number of trials). The probability de-pends on the ratio of false positive answers to the number of controls already presented (F/C). The first three presentations are never internal controls. The fourth presentation has a chance of 0.5 of being an internal control, etc
Vaerenberg et al. – Managed Estimation of Psychophysical Thresholds
23© Journal of Hearing Science® · 2013 Vol. 3 · No. 3
two adjacent stimulus levels. Additional ‘adjacency’ cri-teria apply to the adjacent stimulus levels in both cases.
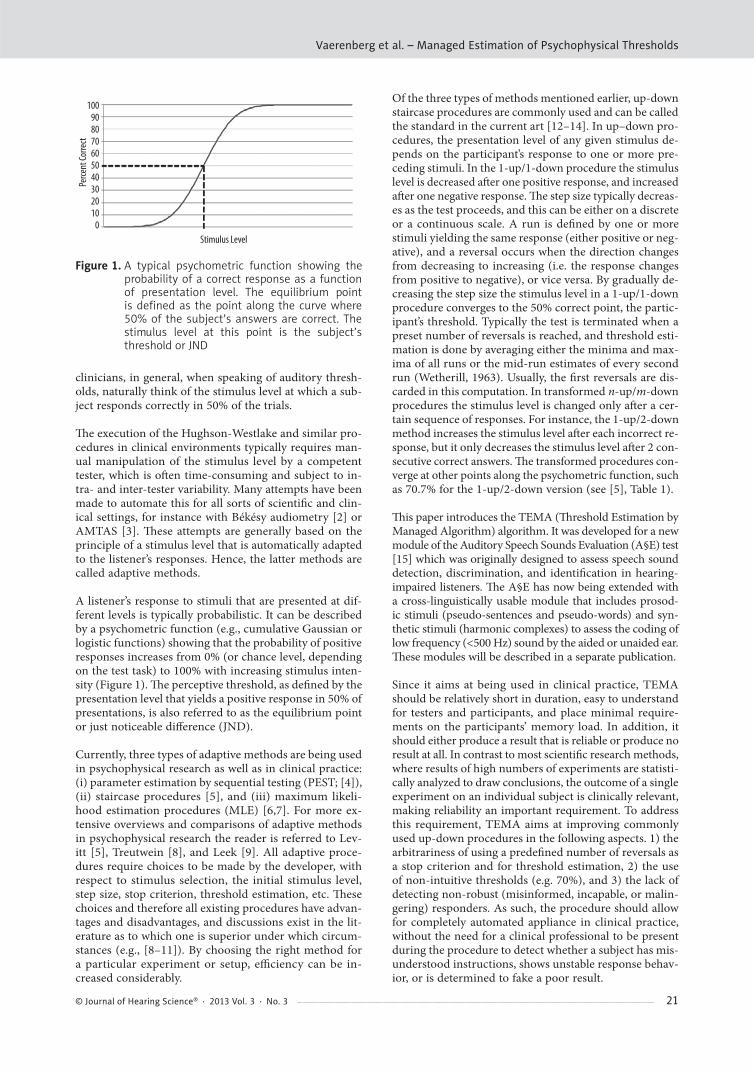
Single stimulus level (Figure 3A): To be a threshold candi-date, at least four responses have to be recorded at this lev-el and at least three at both the upper and lower adjacent levels. Therefore the threshold level cannot be the mini-mum (i.e. reference) or maximum level. If more than one stimulus level has responses that meet these criteria, the threshold is estimated at the stimulus level where the per-centage of correct responses is closest to 50%.
Adjacent Stimulus Levels (Figure 3B): Two adjacent stim-ulus levels must exist, each containing at least four re-sponses and where the upper one has more than 65% of answers correct and the lower one has less than 35% cor-rect answers. The threshold level then is the mean of the two levels. Above the upper level, at least three respons-es must have been recorded, except when the upper level is the maximum level. Below the lower level, at least 3 re-sponses must have been recorded, except when the lower level is the minimum level.
In both cases the whole set of answers given must meet additional criteria:(i) Above threshold level, the total number of incorrect
answers cannot be greater than the total number of correct answers.
(ii) The probability of attaining at least the number of cor-rect answers above threshold level through guessing is less than or equal to 10%. For this, the cumulative bi-nomial probability of the number of successes in the total number of responses above threshold is calculated.
(iii) The false positive ratio should be less than 35%.
There are three types of alternative stopping criteria:1. Maximum number of trials: When a preset number of
trials is exceeded the threshold is presumed to be non-existent. The default maximum is set arbitrarily to 100 trials.
2. Threshold above maximum level: When at least three an-swers are recorded at maximum stimulus level and the percentage of correct responses is less than 35%, the threshold is estimated to be somewhere above the max-imum level and therefore unknown.
3. Too many false positive responses: When at least ten an-swers are recorded at reference level and five or more of them are positive, the procedure is aborted and the threshold presumed to be non-existent.
Implementation of the algorithm
TEMA can be used in different test paradigms, e.g. a two-alternative discrimination task or a multiple-choice iden-tification task, etc. At present, it is being used to find JNDs with same-different discrimination and four-cate-gory identification tasks in the A§E 2009 prosodic test battery (developed by the Dual-Pro European consorti-um with an EC 7th Framework grant, for more informa-tion see http://otoconsult.com; details will be published in a separate paper). Through these tasks, thresholds for perception of low-frequency information in linguistically relevant contexts are measured. The same-different task is used for detecting intonation in sentences, which is rele-vant for discriminating between statements and questions. The identification task is used for assessing a subject’s per-ception of stress positions in words.
Since these tests use the TEMA algorithm in a 2-choice and a 4-choice test situation, which are typical clinical situations with specific consequences, we will briefly de-scribe them and demonstrate the effect of the algorithm. Both tasks use reference stimuli consisting of pseudo-lin-guistic tokens spoken by a female voice. The fundamental frequency of the reference stimuli was adjusted to 200 Hz using pitch synchronous overlap add (PSOLA) resynthe-sis as built into the program Praat (v 5.1, [16]). The ini-tial accuracy was set relatively high, which resulted in a large amount of available stimulus levels. After test-retest validation on 87 human subjects, the accuracy was de-creased based on the test-retest variability to shorten the test duration. This resulted in 22 stimulus levels, rang-ing from the 200 Hz reference to a 408 Hz maximum. Figure 4 shows how accuracy was kept constant at 0.5 semitones for levels up to 283 Hz, which is 6 semitones above the reference level. From there on, accuracy was decreased linearly and with respect to the stimulus lev-el. Based on the available stimulus levels, the TEMA al-gorithm set the initial level to 275 Hz and applied an in-itial step size of 5 levels.
Both the sentence intonation test (SI) and the word stress pattern test (WSP) feature a training mode, where the op-erator (audiologist) is able to present specific stimuli to the listener to get him or her acquainted with the task. It is important for the listener to be clearly instructed to only pay attention to intonation and to not use roving loudness cues to make decisions. The duration of the training is re-stricted to a maximum of 10 minutes.
Delta Responses Delta Responses
100918375675952453831241812
60
100918375675952453831241812
60
Figure 3. Histograms showing number of responses at different presentation levels (here displayed as the difference, Delta, between a reference sig-nal and the stimulus). Each black square rep-resents a positive response; each gray square represents a negative response. The lower line (Delta=0) depicts the responses to internal con-trols. TEMA estimates the JND as either a single stimulus level (A) or the average of two adja-cent stimulus levels (B)
A B
Original articles • 19–31
24 © Journal of Hearing Science® · 2013 Vol. 3 · No. 3

During the test mode, the TEMA algorithm selects stimuli ac-cording to its dithered 1-up/1-down procedure and presents them in a timely fashion with roving intensity. According to its internal control mechanism, control stimuli are present-ed in a probabilistic manner. After a false positive response, a buzz sounds to discourage the listener’s guessing behavior.
Word stress pattern test
The word stress pattern test is an identification task that uses three-syllable pseudo-words (see Figure 5, top). The listener is offered four response options: three of them are for indicating the presence of an intonation movement on one of the syllables, and the fourth gives the listener the opportunity to indicate that he or she does not perceive any intonation or is unsure of its position.
Sentence intonation test
The sentence intonation test is a discrimination task pre-sented in a same-different paradigm (see Figure 5, bottom). Four- to six-syllable pseudo-sentences are presented in two intervals separated by 500 ms. One of two stimuli is the 200 Hz reference stimulus. The other features a rising in-tonation on the final syllable with stimulus level (Δf) as size. Each pseudo-sentence has a fixed pitch accent on the second syllable so as to mimic the presence of a sentence accent. The listener is offered two response options, one of them for signaling that the stimuli are different and one for indicating that he or she does not perceive a difference.
Algorithm validation
The algorithm was validated through Monte Carlo sim-ulations as well as through listening tests with actual lis-teners. A traditional algorithm based on reversals was used as control.
Methods
Monte Carlo simulations
The TEMA algorithm was tested for performance and accu-racy using the Monte Carlo method. The response behavior of subjects with known thresholds was simulated by a com-puter algorithm based on pseudo-random sampling. In ad-dition, for comparative reasons a more traditional adaptive procedure was simulated as this is widely accepted as a valid
method for threshold estimation. The reference algorithm was chosen to be a standard 1-up/1-down procedure [5] us-ing an identical initial value and step size calculation. Simi-lar to the TEMA algorithm, this procedure results in conver-gence at the 50% correct point on the psychometric curve.
The reference algorithm was set to terminate when 10 re-versals had occurred and to estimate the threshold as the arithmetic mean of the last 4 reversal points. These settings were chosen because they appeared optimal for the simu-lated tasks in terms of accuracy and duration. This was es-tablished in a pilot analysis based on the real responses of 178 human listeners in 1036 experiments, which were fed to all possible methods for threshold estimation based on E out of T reversals, where T is the total number of rever-sals at which the stop criterion is met, and E is the num-ber of reversals that is used to estimate threshold. T was set to range from 4 to the number of reversals encountered in the experiment, and E was chosen to be an even num-ber ranging from 4 to T. The values T=10 and E=4 yield-ed the optimal trade-off between test duration and thresh-old estimation stability. An additional stop criterion was included to abort the procedure when 4 consecutive neg-ative responses were recorded at maximum stimulus lev-el, or 4 consecutive positive responses at reference level.
To compare the TEMA algorithm with the reference algo-rithm, five categories of subjects were defined, and the re-sponse behavior of subjects in each category was modeled to investigate its impact on threshold estimation:A. Pure gamblers. These subjects do not react consistent-
ly to different stimulus levels. Two settings were used: subjects either respond at random after each presen-tation, or think a stimulus is always present. In both cases the chance of a correct response is constant and equal to the inverse of the number of alternatives in the task. The psychometric function of these subjects has zero slope.
B. Cheaters. This category contains listeners who gain knowledge on the procedure being used and attempt to use this knowledge to manipulate threshold esti-mation. A number of configurations for each catego-ry was defined by adjusting the number of consecu-tive correct or incorrect answers.
C. Perfect listeners. These listeners consistently answer correctly when stimulus level is above threshold and incorrectly when it drops below threshold. The slope of their psychometric curve is infinite.
1.0
0.8
0.6
0.4
0.2
0.00 1 2 3 4 5
Stimulus Level (semitones above refrence)6 7 8 9 10 11 12
Accu
racy
(sem
itone
)
Figure 4. The stimulus domain (triangles) of both the Word Stress Pattern and the Sentence Intonation tests, showing the accuracy (spectral difference between stimulus and reference signals in semitones) as a function of stimulus level. The spectral difference between adjacent stimulus levels is 1 semitone at stimulus level = 12. It decreases linearly with decreasing stimu-lus levels until it reaches a con-stant value of 0.5 semitones for stimulus levels lower than 6
Vaerenberg et al. – Managed Estimation of Psychophysical Thresholds
25© Journal of Hearing Science® · 2013 Vol. 3 · No. 3

D. Normal listeners. To model normal response behavior a cumulative normal distribution function was sam-pled with a mean set to the assumed threshold and a standard deviation set to reflect the slope of each sub-ject’s psychometric function.
E. Listeners with threshold drift. These subjects show a drift of threshold during the procedure. This reflects phenomena such as in-procedure training and tempo-rary lapses. Several configurations were designed by varying initial threshold, the speed at which the drift from initial to target threshold took place, and the de-lay with which the threshold started drifting towards the target.
For each configuration the simulation was run 1,000 times on both the 2-alternative discrimination task and the 4-al-ternative identification task.
Categories A and B focus on threshold rejection (“no threshold found”) when subjects respond inconsistently or manipulatively. In an optimal situation, the algorithm should reject all cases. For each configuration, the rejec-tion rate was compared between the two algorithms by means of chi-square tests with Yates’ correction. The cut-off level of significance was set at 0.01.
Figure 5. Screenshots of the A§E three-choice identification task (top) and same/different discrimination task (bottom) using the TEMA algorithm. Each figure shows the presented signal(s) and scoring buttons (A), the sequence (B), and the histogram (C) of responses. Each black square/dot represents a positive response; each gray square/dot represents a negative response. The lower line (Delta=0) depicts the responses to internal controls. The dark gray squares/dots (arrows) are false positive responses
Delta
Identi�cation Results
Responsesn i m a n u
^ _ _ _ ^ _
_ _ _
_ _ ^ 208186167150135122111100
908375675952453831241812
60
180160140120100
80604020
01 2 3 4 5 6 7 8 9 10 11 12 13 14 15 16 17 18 19 20 21 22 23 24 25
Discrimination Results100
80
60
40
20
01 2 3 4 5 6 7 8 9 10 11 12 13 14 15 16 17 18 19 20 21
Delta Responses
208186167150135122111100
908375675952453831241812
60
n i m u m a n u n a n i m u m a n u n a
218
=
200≠
A
A
C
C
B
B
Original articles • 19–31
26 © Journal of Hearing Science® · 2013 Vol. 3 · No. 3

The other categories assess the algorithm’s accuracy and duration. In an optimal situation, the algorithm should find the exact threshold in as short a trajectory as pos-sible. The number of trials until the stop criterion was reached, as well as the threshold error (= estimated thresh-old – assumed threshold), were recorded for each simu-lated experiment. For each configuration, both variables were compared between the two algorithms by means of a t-test for independent samples. The cut-off level of sig-nificance was set at 0.01.
Real test subjects
The performance of the TEMA algorithm was also com-pared to that of the traditional method using actual listen-ers, from whom informed consent was obtained.
The same-different discrimination task was used (sentence intonation test) with low-pass filtered stimuli. In total, 29 adult listeners participated in the within-subjects compar-ison; 19 had normal hearing, the other 10 were hearing impaired (5 aided, 5 unaided). Each participant complet-ed the task twice: first the TEMA algorithm steered JND estimation, the second time the traditional 4-out-of-10 re-versals algorithm was used. As in the Monte Carlo sim-ulations, both JND estimation and test duration (i.e. the number of trials before the stop criterion was reached) were taken into account. A within-subject comparison was performed between the two algorithms for both variables by means of a Wilcoxon test for dependent samples. The cut-off level of significance was set at 0.01.
All statistics were performed using Statistica 7.0 software (StatSoft Inc, USA).
Results
Monte Carlo simulations
The results are given in Appendix 1 and summarized in Table 1. Gambling behavior was simulated in two config-urations (Table 1). The first setting generated a response from all available alternatives at random. The TEMA al-gorithm led to a threshold in 0.5% of the runs when two response alternatives were available, and in 12.0% of the runs when four alternatives were used. This is opposed to 38.6% and 93.3%, respectively, in simulations using the reference algorithm. In addition, simulations of the behavior of a subject who thinks a stimulus is always present and therefore never chooses the ‘I don’t know’ response yielded a threshold in 67.0% of the runs (4-al-ternative task) for the reference algorithm and 0.0% for the TEMA algorithm.
Simulations of cheating behavior were modeled in the most obvious way of tampering with an up-down proce-dure: by alternately answering correct and incorrect in a 1-up/1-down procedure a number of reversal points will eventually be reached, and the procedure will converge to threshold. In a task with multiple choices the only way for a subject to respond in such a fashion would be when the stimulus level is well above the subject’s actu-al threshold. This would correspond to malingering. In yes/no tasks, like clinical pure tone audiometry, however,
the subject could easily respond yes for a while, causing a simple 1-up/1-down procedure to select levels below the subject’s actual threshold, at which point the subject could start alternating responses without the need to de-tect a stimulus and still reach a predefined number of re-versals, causing the procedure to yield a threshold below the subject’s actual detection threshold. The number of consecutive correct or incorrect answers (reversal rate) and the number of presentations after which the subject gets wind of the underlying procedure (delay) was ad-justed to create different configurations. Whereas the ref-erence algorithm converged to threshold in 100% of the simulations under all configurations, the TEMA algorithm only did so in 7–29%.
The psychometric function with infinite slope, as in per-fect listeners, produced a threshold in all runs, using ei-ther algorithm. Assumed thresholds of 2, 30, and 175 Hz were simulated. Both algorithms estimated the exact same thresholds. The reference algorithm needed 12 trials on average to meet its stop criteria, whereas an average of 20 trials was observed when using the TEMA algorithm.
Simulations of normal subjects were conducted in multiple configurations. Thresholds of 15, 50, and 150 Hz were used, and different slopes were applied by adjusting the stand-ard deviation (σ) of the underlying normal distribution. Both algorithms showed similar and acceptable accuracy (error was less than 0.7 semitones). When simulating very mild slopes (σ=150 Hz), the TEMA algorithm rejected up to 50% of the thresholds, and a small increase in accuracy was observed in comparison with the reference algorithm. The TEMA algorithm on average required 29 trials to reach threshold estimation or rejection, whereas the reference al-gorithm converged to threshold after an average of 19 trials.
For the simulation of unstable psychometric functions, i.e. threshold drift, a number of parameters was used. The ini-tial threshold determined the mean of the underlying dis-tribution at the start of the simulation. A configurable step size (on a hertz scale) was used to vary the speed at which the drift from initial to target threshold took place. A de-lay was set to determine the number of trials after which the threshold started drifting towards the target. As with the simulations of the normal subjects, the standard devi-ation was varied to mimic different psychometric slopes. Significant gains in accuracy were observed when using the TEMA algorithm to simulate drift from 100 Hz to 20 Hz, starting after 10 trials with a decrease of threshold of 8 Hz per trial. This configuration led to estimation of a 24 Hz JND by the TEMA algorithm, whereas the refer-ence algorithm yielded 62 Hz. When drifting from 50 Hz to 10 Hz at 2 Hz per trial, the TEMA algorithm estimated a JND of 14 Hz, whereas the reference algorithm ceased at 25 Hz. Other configurations did not show a significant difference in accuracy between the algorithms.
Real test subjects
Figure 6A compares JNDs obtained using the TEMA algo-rithm and those obtained using the traditional one for both the normal hearing and the hearing impaired listeners. The median difference was 0 Hz for normal hearing listeners (p>0.05) and 3 Hz for hearing impaired listeners (p>0.05).
Vaerenberg et al. – Managed Estimation of Psychophysical Thresholds
27© Journal of Hearing Science® · 2013 Vol. 3 · No. 3

Figure 6B shows the difference between the average num-ber of trials needed to compute a threshold value with the TEMA algorithm in comparison with the traditional algo-rithm. The median difference was 5.7 trials for the normal hearing listeners (p=0.02) and 12.8 trials for the hearing impaired listeners (p<0.01).
Actual test durations varied between 1 and 6 minutes. Tak-ing into account that the average test time in clinical prac-tice is 6.5 seconds per trial (unpublished data based on 300 clinical test procedures), TEMA would increase the test duration by approximately 0.5 to 1.5 minutes.
Discussion
Psychophysical threshold estimation is an important pro-cedure in clinical and scientific practice. A perceptive threshold often distinguishes between normal or abnor-mal functioning; it is used to make therapeutic decisions, measure the effect of therapies or interventions, and to fol-low up the course of disease or the evolution of a patient.
Although threshold measurement is common practice in the daily routine, the accuracy and reliability of the proce-dures used are not often questioned. In some cases strict and systematic instructions have been introduced to reduce
the inter-tester variability. This for instance is the case for tone audiometry. But even then it is likely that these proce-dures are not entirely followed in everyday circumstances. Threshold estimations are time-consuming, and accuracy and reliability are related to the amount of time spent on the measurement. This is specifically the case when the test subject’s responses are not fully consistent and subject to the interpretation and judgment by the competent tester.
Automation may be a way to systematize threshold meas-urements, improve test quality, and save time. First at-tempts to automate threshold measurements coincide with the introduction of desktop computers more than 30 years ago. This has yielded useful algorithms with acceptable ac-curacy and reliability and with a good cost/efficacy ratio.
For several reasons explained in the introduction, we be-lieve it is worthwhile revisiting the existing algorithms and constructing a new one in an attempt to overcome some of their weaknesses and to optimize some of their features. This has led to the TEMA procedure, which was primari-ly developed to estimate the 50% point, i.e. the tradition-al threshold, for low-frequency (<500 Hz) perception in hearing impaired populations. It specifically addresses three challenges for up-down procedures that form the current standard of the art: the inherent arbitrariness of using a predefined number of reversals for threshold es-timation, the use of non-intuitive thresholds, e.g., at 70% of the psychometric curve, and guessing behavior of sub-jects in simple procedures.
For stimulus selection the TEMA algorithm uses an up-down staircase procedure, which is in principle the sim-plest of the three methods discussed in the introduction. The sole assumption underlying a staircase procedure is the monotonicity of the psychometric function. A possi-ble weakness is that the test subject may rely on expecta-tion of the next stimulus instead of on perception. In the TEMA algorithm, measures have been taken to actively discourage listeners from guessing as well as to diversify the selection of stimulus levels near the threshold.
The more popular methods of threshold estimation in psy-chophysical procedures do not converge at the 50% point along the psychometric curve, but generally at points over 70%. This has the advantage that they are more robust, i.e. have lower variance of the threshold estimate [17], but have the disadvantages that those locations may be considered less intuitive, and estimate a point along the psychomet-ric curve where upward and downward changes are more likely to be asymmetric. As TEMA was designed to esti-mate the 50% point (i.e. the traditional clinical threshold), a 1-up/1-down method was chosen. Alternative methods like the popular 1-up/n-down, however, have the addition-al advantage that they require n consecutive correct re-sponses for the stimulus level to be decreased, so picking responses randomly will make the staircase go up more than it goes down. In case of unreliable subjects, the stair-case will most likely hit its upper limit and the procedure will be aborted. In case of the 1-up/1-down method, the staircase does not feature such a preferred direction and will most likely stay within limits, even when subjects are responding randomly. To overcome this vulnerabili-ty to guessing, a commonly used solution is to increase
Figure 6. Summary statistics of the results with both algorithms in normal hearing and hearing im-paired real test subjects, showing the JND (A) and the number of trials (B) needed to conclude the test. NHref and NHTEMA: reference algorithm and TEMA in hearing subjects. HIref and HITEMA: reference algorithm and TEMA in hearing im-paired subjects. The box and whisker plots represent the median (square), quartile range (box), range (whiskers), and outliers (dots) for each group
120
100
80
60
40
20
0NH ref NH TEMA HI ref HI TEMA
JND
(Hz)
A
70
60
50
40
30
20
10
0NH ref NH TEMA HI ref HI TEMA
Num
ber o
f tria
ls
B
Original articles • 19–31
28 © Journal of Hearing Science® · 2013 Vol. 3 · No. 3

the number of observation intervals within trials. How-ever this approach not only increases the dependency on the subject’s memory, but also prolongs the test duration. As the A§E tests target both the hearing impaired popu-lation and very young children, they require an algorithm to support reliable threshold estimation in even the sim-plest of tasks like yes/no tasks and same/different tasks. For this reason the TEMA algorithm uses internal con-trols for detecting unreliable response behavior that can be used also in these kinds of tasks.
In adaptive methods, the procedure is traditionally stopped after a predetermined number of reversals have been reached, after which the threshold is calculated from an-other predefined number of these reversals. The prob-lem with the use of a predetermined number of reversals for threshold estimation is its inherent arbitrariness. No matter how optimally the stop criterion has been set in terms of reversals for a given test setup, it will be subop-timal for the individual subject. It is to be expected that in more experienced listeners, less reversals are needed for accurate threshold estimation than with more naïve listeners. As today’s computers allow for quick computa-tion, the TEMA algorithm uses more advanced methods for dynamically setting the stop criterion as well as for threshold estimation.
Performance of the TEMA algorithm was analyzed through Monte Carlo simulations in which it was compared to the current standard. Moreover, listening tests with actual lis-teners were also run to compare the two algorithms.
The Monte Carlo simulations showed that both algorithms give perfect results in “perfect” test subjects. In these cas-es, the TEMA algorithm needs more trials to estimate the JND. On average, however, this takes only a few ex-tra seconds.
In “normal” subjects, both simulated and real, the results between the two algorithms are highly comparable and very accurate (close to the assumed threshold in the simu-lated cases). The TEMA algorithm again needs more trials to estimate a JND, corresponding to a few extra seconds test time. To the extent that the test subject’s behavior ap-proaches a gambler’s behavior, the TEMA algorithm clear-ly excels in accuracy, at the cost of substantially more time to come to conclusions.
But most importantly, the simulations showed that TEMA is significantly more resistant to gambling or cheating be-havior and threshold drift than the traditional algorithm with reversals. As opposed to the traditional algorithm, ac-ceptance scores in the case of gambling or cheating sub-jects were much lower for TEMA than for the traditional algorithm, which we take as evidence for the higher reli-ability of the new algorithm.
In real subjects, TEMA also took somewhat longer. In hearing subjects, this was minimal. In the limited num-ber of hearing impaired subjects however, the difference with the reference procedure was more pronounced, with a median of 12 additional trials. There were 3 subjects out of 10 who needed more than 25 extra trials. These sub-jects also happened to be the ones showing the largest
threshold difference, with the threshold found by TEMA being 21, 25, and 42 Hz higher than by the reference al-gorithm. It seems reasonable to speculate that the refer-ence algorithm may have underestimated the threshold in these cases and that TEMA took more time to find a more accurate threshold. This would be in line with the Monte Carlo simulations. HI subjects show greater var-iability in JND when measured with TEMA than when measured with the reference algorithm. Although the HI sample size is small (10 subjects), and no significant dif-ference was found between the thresholds obtained with both algorithms, this may illustrate a diversity within this subject group that is not fully expressed using the refer-ence procedure, rather than an intrinsic variability caused by TEMA itself. This is supported by the test-retest vali-dation on 87 subjects which showed that the differences between test and retest TEMA thresholds are considera-bly smaller than the within-subject differences between TEMA and reference algorithm thresholds.
We believe this result to be of great clinical relevance. Gambling or cheating behavior exists in daily clinical practice. This is not only the case for some rare malin-gering subjects, but also for subjects who, with the best of intentions, consider a test situation as a personal exam and who have the desire to succeed and please the tester. In manual test procedures, the competent tester has the experience and capacity to judge the subject’s behavior and to correct it by giving feedback or additional train-ing and explanations. In automated procedures, howev-er, this judgment is lacking. Therefore the algorithm it-self should contain internal controls and other processes to reduce the risk of being misled by gambling and cheat-ing. Moreover, even if this type of behavior only influenc-es the test result in a minority of real subjects, it is a fact that treatment or intervention in this single subject does not depend on the group statistics, but merely on his or her own test result. As the outcome of a single experi-ment on an individual subject may have important clini-cal consequences, reliability of the result is of utmost im-portance. The downside of longer test durations appears to be limited to seconds. Both in the Monte Carlo sim-ulation and the real patients, the additional number of trials required by TEMA was in the order of 10. Taking into account that the average test time in clinical practice is 6.5 seconds per trial (unpublished data based on 300 clinical test procedures), TEMA would thus increase the test duration by approximately 0.5 to 1.5 minutes, which may be considered acceptable.
Conclusions
In conclusion, we believe that the TEMA is an adaptive al-gorithm allowing automatic threshold measurement with a number of advantages over other procedures. The trade-off is that it slightly lengthens the test time but it is argued that this is of limited clinical burden and that this is out-weighed largely by the gain in accuracy and test reliability.
Acknowledgements
The authors gratefully acknowledge the support and con-tributions by the members of the DUAL-PRO consor-tium: Otoconsult (Belgium), Neurelec (France), Del Bo
Vaerenberg et al. – Managed Estimation of Psychophysical Thresholds
29© Journal of Hearing Science® · 2013 Vol. 3 · No. 3

SIMULATION CATEGORY CONFIGURATION TESTREJECTED REJECTED
µ σ µ σ µ σ µ σRejec�on Performance
A1a Gambler Uses all op�ons WSP 99.5% 137.7 39.2 18.1 8.2 61.4% 152.2 46.2 16.7 7.3A1b Gambler Uses all op�ons SI 88.0% 62.6 50.1 33.3 19.8 6.7% 83.0 53.9 20.4 5.2A2a Gambler Thinks s�mulus is always present WSP 100.0% N/A N/A 19.2 7.2 33.0% 135.9 49.2 18.8 6.4A2b Gambler Thinks s�mulus is always present SI 100.0% N/A N/A 13.0 0.0 100.0% N/A N/A 7.0 0.0B1a Cheater reversalrate=1;delay=0 WSP 77.5% 78.5 29.7 26.9 7.1 0.0% 105.5 0.0 11.0 0.0B1b Cheater reversalrate=1;delay=0 SI 78.8% 78.5 33.1 33.6 14.6 0.0% 105.5 0.0 11.0 0.0B2a Cheater reversalrate=1;delay=3 WSP 70.6% 4.8 5.4 21.5 7.1 0.0% 9.0 0.0 14.0 0.0B2b Cheater reversalrate=1;delay=3 SI 73.7% 6.7 6.2 22.2 7.7 0.0% 9.0 0.0 14.0 0.0B3a Cheater reversalrate=2;delay=0 WSP 77.2% 111.4 33.1 27.2 8.0 0.0% 151.0 0.0 21.0 0.0B3b Cheater reversalrate=2;delay=0 SI 80.1% 116.6 37.1 32.8 17.8 0.0% 151.0 0.0 21.0 0.0B4a Cheater reversalrate=4;delay=0 WSP 86.2% 96.9 35.1 25.9 11.6 0.0% 113.0 0.0 41.0 0.0B4b Cheater reversalrate=4;delay=0 SI 92.9% 103.6 32.9 30.1 24.4 0.0% 113.0 0.0 41.0 0.0
Threshold AccuracyC1a Perfect threshold=30 WSP 0.0% 27.5 0.0 21.3 4.3 0.0% 27.5 0.0 13.0 0.0C1b Perfect threshold=30 SI 0.0% 27.5 0.0 21.8 4.8 0.0% 27.5 0.0 13.0 0.0C2a Perfect threshold=2 WSP 0.0% 3.0 0.0 14.4 2.3 0.0% 3.0 0.0 14.0 0.0C2b Perfect threshold=2 SI 0.0% 3.0 0.0 14.3 2.5 0.0% 3.0 0.0 14.0 0.0C3a Perfect threshold=175 WSP 0.0% 176.5 0.0 23.6 7.4 0.0% 176.5 0.0 12.0 0.0C3b Perfect threshold=175 SI 0.0% 176.5 0.0 23.7 7.2 0.0% 176.5 0.0 12.0 0.0D1a Normal threshold=50;stdev=10 WSP 0.0% 49.8 4.7 23.1 4.7 0.0% 50.1 4.5 17.2 3.2D1b Normal threshold=50;stdev=10 SI 0.0% 50.3 4.7 23.9 5.2 0.0% 50.0 4.4 17.1 3.1D2a Normal threshold=15;stdev=10 WSP 0.3% 14.3 4.9 23.1 4.8 0.0% 15.1 4.2 18.2 3.1D2b Normal threshold=15;stdev=10 SI 0.3% 15.0 4.9 23.6 4.9 0.0% 15.3 4.3 18.3 3.1D3a Normal threshold=150;stdev=70 WSP 2.1% 145.3 24.9 27.5 6.6 0.2% 145.1 21.4 20.1 4.0D3b Normal threshold=150;stdev=70 SI 4.1% 153.2 22.2 37.6 16.3 0.2% 146.0 21.2 20.1 3.8D4a Normal threshold=50;stdev=150 WSP 49.3% 57.4 30.3 32.0 10.0 0.6% 59.1 29.4 20.8 4.2D4b Normal threshold=50;stdev=150 SI 49.0% 58.9 31.3 43.4 21.4 0.4% 60.2 28.6 20.9 4.3E1a Dri� ini�al=100;target=20;stdev=20;step=-8;delay=10 WSP 0.6% 23.7 14.9 40.7 7.0 0.0% 61.4 24.0 24.0 5.6E1b Dri� ini�al=100;target=20;stdev=20;step=-8;delay=10 SI 1.0% 24.3 14.0 41.8 8.1 0.0% 61.9 23.5 24.1 5.2E2a Dri� ini�al=20;target=3;stdev=5;step=-2;delay=5 WSP 9.8% 6.0 2.4 20.5 4.1 2.0% 5.5 2.7 18.0 2.4E2b Dri� ini�al=20;target=3;stdev=5;step=-2;delay=5 SI 13.8% 6.7 3.1 21.7 5.1 1.9% 5.5 2.7 18.0 2.4E3a Dri� ini�al=50;target=70;stdev=30;step=5;delay=15 WSP 0.5% 61.3 13.5 29.3 7.5 0.0% 54.7 10.6 20.1 4.0E3b Dri� ini�al=50;target=70;stdev=30;step=5;delay=15 SI 0.1% 64.8 12.3 34.3 11.7 0.0% 54.7 11.0 20.2 4.0E4a Dri� ini�al=50;target=20;stdev=10;step=-5;delay=0 WSP 0.0% 20.5 5.2 25.3 4.6 0.0% 20.4 4.4 19.2 3.0E4b Dri� ini�al=50;target=20;stdev=10;step=-5;delay=0 SI 0.1% 20.9 5.1 25.9 5.2 0.0% 20.6 4.2 19.1 2.9E5a Dri� ini�al=50;target=10;stdev=5;step=-2;delay=0 WSP 0.0% 14.4 7.4 29.4 4.8 0.0% 24.8 5.3 16.4 2.4E5b Dri� ini�al=50;target=10;stdev=5;step=-2;delay=0 SI 0.0% 13.8 6.6 30.2 4.8 0.0% 25.2 5.0 16.1 2.2E6a Dri� ini�al=50;target=10;stdev=5;step=-1;delay=0 WSP 0.0% 35.5 6.4 23.0 5.5 0.0% 38.4 3.7 14.9 2.4E6b Dri� ini�al=50;target=10;stdev=5;step=-1;delay=0 SI 0.0% 34.8 8.0 24.9 9.2 0.0% 38.4 3.8 15.1 2.4
THR TRIALS THR TRIALSTEMA REF
Appendix 1. Results of the Monte Carlo simulations. For both algorithms each configuration was simulated 1000 times. Displayed are: Rejection ratio (REJECTED) and the percentage of experiments where no threshold was found. Threshold (THR) lists mean µ and standard deviation σ; number of trials (TRIALS) lists µ and standard deviation σ. Shaded fields are statistically significant (see text below for a summary).
1. Yantis PA. Puretone air-conduction threshold testing. In: Katz J (ed.), Handbook of Clinical Audiology, 4th ed. Baltimore; Wil-liams & Wilkins, 1994; 107–108.
2. Békésy GV. A new audiometer. Acta Oto-Laryngologica, 1947; 35(5/6): 411–22.
3. Margolis RH, et al. AMTAS®: Automated method for test-ing auditory sensitivity: validation studies. Int J Audiol, 2010; 49(3): 185–94.
4. Taylor MM, Creelman CD. PEST: Efficient estimates on prob-ability functions. J Acoust Soc Am, 1967; 41: 782–87.
5. Levitt H. Transformed up–down methods in psychoacoustics. J Acoust Soc Am, 1971; 49: 467–77.
6. Green DM. A maximum-likelihood method for estimat-ing thresholds in a yes–no task. J Acoust Soc Am, 1993; 93: 2096–150.
7. Grassi M, Soranzo A. MLP: A MATLAB toolbox for rapid and reliable auditory threshold estimation. Behavior Research Methods, 2009; 41(1): 20–28.
References:
8. Treutwein B. Adaptive psychophysical procedures. Vision Res, 1995; 35(17): 2503–22.
9. Leek MR. Adaptive procedures in psychophysical research. Perception & Psychophysics, 2001; 63(3): 1279–92.
10. Klein SA. Measuring, estimating, and understanding the psy-chometric function: A commentary. Perception & Psychophy-sics, 2001; 63(8): 1421–55.
11. Amitay S, Irwin A, Hawkey DJC, Cowan JA, Moore DR. A com-parison of adaptive procedures for rapid and reliable threshold assessment and training in naive listeners. J Acoust Soc Am, 2006; 119 (3): 1616–25.
12. Hopkins K, Moore BCJ. Development of a fast method for measuring sensitivity to temporal fine structure information at low frequencies. Int J Audiol, 2010; 49(2): 940–46.
13. Kaernbach C. Adaptive threshold estimation with unforced-choice tasks. Perception & Psychophysics, 2001; 63(8): 1377–88.
14. Sek A, Moore BCJ. Implementation of a fast method for meas-uring psychophysical tuning curves. Int J Audiol, 2011; 50(4): 237–42.
Tecnologia Per L’Ascolto (Italy), Universiteit Antwerpen (Belgium), Leiden University (Netherlands), CNRS-LPP (France), Paris XII (France), Ca Foscari Venezia (Italy), and University of Bucharest (Romania). This work was
supported by a grant from the European Commission (FP7-SME-222291 DUAL-PRO). BV received a PhD grant for this work from the IWT (agency for Innovation by Science and Technology), Baekeland-grant IWT090287.
Original articles • 19–31
30 © Journal of Hearing Science® · 2013 Vol. 3 · No. 3

15. Govaerts PJ, Daemers K, Yperman M, De Beukelaer C, De Saegher G et al. Auditory speech sounds evaluation (A§E): a new test to assess detection, discrimination and identifica-tion in hearing impairment. Cochlear Implants Int, 2006; 7(2): 92–106.
16. Boersma P. Praat, a system for doing phonetics by computer. Glot Int, 2001; 5(9/10): 341–45.
17. Green DM. Stimulus selection in adaptive psychophysical pro-cedures. J Acoust Soc Am, 1990; 87: 2662–74.
Vaerenberg et al. – Managed Estimation of Psychophysical Thresholds
31© Journal of Hearing Science® · 2013 Vol. 3 · No. 3
Copyright © 2022 FDOKUMEN