Managed Service Suite User's Guide - Yokogawa
605
Instruction Manual IM 43D07N10-01EN Managed Service Suite User’s Guide IM 43D07N10-01EN 6 th Edition
-
Upload
khangminh22 -
Category
Documents
-
view
3 -
download
0
Transcript of Managed Service Suite User's Guide - Yokogawa

Instruction Manual
IM 43D07N10-01EN
Managed Service Suite User’s Guide
IM 43D07N10-01EN 6th Edition

IM 43D07N10-01EN 6th Edition: Mar. 10, 2022-00
Introduction ___________________________________________________________ vi Purpose of this document _______________________________________________ vii Safety Precautions _____________________________________________________ viii Notational Conventions __________________________________________________ ix Copyrights and Trademarks ______________________________________________ xi 1. Overview _________________________________________________________ 1
1.1 Purpose of the system _______________________________________________________ 1 2. System Overview ___________________________________________________ 2
2.1 Deployment Pattern _________________________________________________________ 2 2.2 System architecture _________________________________________________________ 3 2.3 User Accounts _____________________________________________________________ 4 2.4 Assets ____________________________________________________________________ 5 2.5 Applications _______________________________________________________________ 6 2.6 Remote Access _____________________________________________________________ 7 2.7 Automations _______________________________________________________________ 8 2.8 File Transfer ______________________________________________________________ 10 2.9 Asset Inventory ___________________________________________________________ 11 2.10 Dynamic dashboards _____________________________________________________ 12 2.11 Mail Relay ______________________________________________________________ 13 2.12 Operational status and heartbeat ___________________________________________ 14 2.13 Integrations - ServiceNow _________________________________________________ 17
3. Before use _______________________________________________________ 18 4. Views and Layouts ________________________________________________ 19
4.1 List view _________________________________________________________________ 20 4.2 Detailed view _____________________________________________________________ 21 4.3 Site Component - Overview _________________________________________________ 22
Status menu ___________________________________________________________ 25 Applications menu _______________________________________________________ 26 Assets menu ___________________________________________________________ 27 Sessions ______________________________________________________________ 28 Authorizations menu _____________________________________________________ 29 Activity Log ____________________________________________________________ 30 Configurations menu _____________________________________________________ 31 Remote access _________________________________________________________ 33 File transfer ____________________________________________________________ 34
4.4 Center Component – Overview _______________________________________________ 35 4.5 Center component - Global-view _____________________________________________ 38
Sitemap _______________________________________________________________ 38 4.6 Center component - Site-view ________________________________________________ 39
Home menu ____________________________________________________________ 41 Dashboard menu ________________________________________________________ 42 Applications menu _______________________________________________________ 43 Assets menu ___________________________________________________________ 44 Alerts _________________________________________________________________ 45 Remote Access _________________________________________________________ 47 File Transfer ___________________________________________________________ 48
4.7 Center component - Dashboards _____________________________________________ 49 Compute assets ________________________________________________________ 50
Managed Service Suite User’s Guide

IM 43D07N10-01EN 6th Edition: Mar. 10, 2022-00
PLC/DCS assets ________________________________________________________ 53 Field assets ____________________________________________________________ 56 Network assets _________________________________________________________ 58 Environmental assets ____________________________________________________ 61 Security applications _____________________________________________________ 63 Asset Management Applications ____________________________________________ 66 Analyzer Management Application __________________________________________ 68 Dynamic dashboards _____________________________________________________ 71
4.8 Security applications _______________________________________________________ 72 Site-view ______________________________________________________________ 73 Center-view ____________________________________________________________ 88
4.9 Control applications ______________________________________________________ 101 Site-view _____________________________________________________________ 102 Center-view ___________________________________________________________ 107
4.10 Asset Management applications ___________________________________________ 111 Site-view _____________________________________________________________ 112 Center-view ___________________________________________________________ 118
4.11 Analyzer Management applications ________________________________________ 125 Site-view _____________________________________________________________ 126 Center-view ___________________________________________________________ 131
4.12 Compute assets ________________________________________________________ 137 Site-view _____________________________________________________________ 138 Center View ___________________________________________________________ 150
4.13 PLC/DCS assets ________________________________________________________ 171 Site-view _____________________________________________________________ 172 Center-view ___________________________________________________________ 179
4.14 Field assets ____________________________________________________________ 191 Site-view _____________________________________________________________ 191 Center-view ___________________________________________________________ 194
4.15 Network assets _________________________________________________________ 204 Site-view _____________________________________________________________ 205 Center-view ___________________________________________________________ 213
4.16 Environmental assets ____________________________________________________ 222 Site-view _____________________________________________________________ 223 Center-view ___________________________________________________________ 228
4.17 Remote settings ________________________________________________________ 230 RDP _________________________________________________________________ 231 VNC _________________________________________________________________ 238 SSH _________________________________________________________________ 240 Web _________________________________________________________________ 243
4.18 Sessions ______________________________________________________________ 245 Requests _____________________________________________________________ 246 Sessions _____________________________________________________________ 248
4.19 Activity Log ____________________________________________________________ 252 4.20 Authorizations __________________________________________________________ 254
Users ________________________________________________________________ 254 User details ___________________________________________________________ 255 Groups _______________________________________________________________ 258 Group details __________________________________________________________ 259 Object Permissions _____________________________________________________ 262 System Groups ________________________________________________________ 264
4.21 Remote Access _________________________________________________________ 265 Site-view _____________________________________________________________ 265 Center-view ___________________________________________________________ 267
4.22 User Menu _____________________________________________________________ 268 5. Common Operations ______________________________________________ 271
IM 43D07N10-01EN 6th Edition: Mar. 10, 2022-00
5.1 Site component __________________________________________________________ 271 Login to MSS __________________________________________________________ 271
5.2 Site Component - Common - Search & Filter __________________________________ 280 Search _______________________________________________________________ 280 Filter ________________________________________________________________ 281
5.3 Site component - Add an MSS user to the Site component _______________________ 283 5.4 Site component - Managing Permissions of a user or group _____________________ 285 5.5 Site component - Delete an MSS user from the Site component __________________ 288 5.6 Site Component - Onboarding applications to MSS _____________________________ 292
Security applications ____________________________________________________ 292 Control applications _____________________________________________________ 305 Asset Management applications ___________________________________________ 311 Analyzer Management applications ________________________________________ 317
5.7 Site component - Onboarding Assets to MSS __________________________________ 323 Compute assets _______________________________________________________ 324 PLC/DCS assets _______________________________________________________ 345 Field assets ___________________________________________________________ 351 Network assets ________________________________________________________ 352 Environmental assets ___________________________________________________ 358 Asset Discovery ________________________________________________________ 364 Field Asset Discovery ___________________________________________________ 371
5.8 Site component - Modifying assets/applications in MSS _________________________ 377 Modifying details of asset/applications ______________________________________ 378 Modifying Collection settings: _____________________________________________ 381 Modifying Monitor settings________________________________________________ 385 Testing connection & Modifying credentials __________________________________ 389 Modifying IP address field ________________________________________________ 393
5.9 Site component - Deleting assets ____________________________________________ 394 Uninstalling Windows Agent Installer _______________________________________ 396
5.10 Center component - Login ________________________________________________ 400 5.11 Site component - Modifying Language______________________________________ 401 5.12 Site Component – Setting Operational status ________________________________ 403 5.13 Site Component – Setting Heartbeat metric _________________________________ 406 5.14 Center Component – Exporting a dashboard ________________________________ 409
6. Remote Operations _______________________________________________ 412 6.1 Connecting Remotely to an asset ___________________________________________ 413
Permissions overview ___________________________________________________ 414 Creating an MSS Remote Access Profile ____________________________________ 417 Connecting to an asset through Request access ______________________________ 421 Connecting to an asset through Direct access ________________________________ 427 Connecting to an application through HTTP Remote access _____________________ 429
6.2 Managing Requests and Sessions ___________________________________________ 433 Requests _____________________________________________________________ 433 Sessions _____________________________________________________________ 437
6.3 Remote session Recordings ________________________________________________ 445 Live Session recording __________________________________________________ 445 Viewing and Downloading a Remote Session ________________________________ 447 Default settings of remote session recording _________________________________ 448
6.4 Remote Access Characteristics _____________________________________________ 449 Session Limits applied by the Asset ________________________________________ 449 SSH Shell ____________________________________________________________ 452 Web (HTTP) connection _________________________________________________ 453
6.5 Other Remote Operations __________________________________________________ 454 Performing Admin Actions ________________________________________________ 454 Printing a document ____________________________________________________ 460 Device Redirection _____________________________________________________ 464

IM 43D07N10-01EN 6th Edition: Mar. 10, 2022-00
Clipboard Operations ___________________________________________________ 465 Known Errors __________________________________________________________ 467
7. Automations ____________________________________________________ 468 7.1 MSS Automation Concepts _________________________________________________ 469 7.2 MSS Automations Architecture _____________________________________________ 472
Monitors ______________________________________________________________ 472 Automation Rules ______________________________________________________ 474 Alert service ___________________________________________________________ 475
7.3 Automation Rules Components _____________________________________________ 476 Triggers ______________________________________________________________ 477 Conditions ____________________________________________________________ 483 Actions _______________________________________________________________ 484
7.4 Adding an Automation _____________________________________________________ 488 7.5 Managing an Automation __________________________________________________ 492 7.6 Automation Alerts ________________________________________________________ 493 7.7 Sending email from Automations ____________________________________________ 496 7.8 Creating Automation rules for multiple assets _________________________________ 497 7.9 Built-in Automations ______________________________________________________ 498 7.10 Using Conditions in Automations __________________________________________ 499
Condition Types ________________________________________________________ 500 7.11 Troubleshooting an Automation ___________________________________________ 504
8. File Transfer _____________________________________________________ 507 8.1 File Transfer Permissions __________________________________________________ 507 8.2 Uploading Files to MSS ____________________________________________________ 508 8.3 Operations on uploaded file ________________________________________________ 515
Download Files from MSS ________________________________________________ 515 Sharing and unsharring files with other MSS users. ____________________________ 516 Modifying File Expiry Date________________________________________________ 518 Deleting a File _________________________________________________________ 520
8.4 Default File Transfer Settings _______________________________________________ 521 9. Asset Inventory __________________________________________________ 522
9.1 Custom Fields ___________________________________________________________ 522 Introduction ___________________________________________________________ 522 Field Types ___________________________________________________________ 522 Permissions ___________________________________________________________ 524 Adding Custom Fields ___________________________________________________ 525 Modifying Custom Fields _________________________________________________ 535 Deleting Custom Fields __________________________________________________ 544
10. Dynamic dashboards _____________________________________________ 548 10.1 Introduction ____________________________________________________________ 548
Dashboards ___________________________________________________________ 548 Widgets ______________________________________________________________ 549
10.2 Creating Dynamic dashboard _____________________________________________ 558 10.3 Dynamic Dashboard Operations ___________________________________________ 560
Sharing a Dynamic dashboard ____________________________________________ 561 Favoriting a Dynamic dashboard __________________________________________ 563 Copying a Dynamic dashboard ____________________________________________ 565 Deleting a Dynamic dashboard ____________________________________________ 566
10.4 Dashboard Widget Operations ____________________________________________ 568 Adding a Chart to Dashboard _____________________________________________ 569 Modifying the Size of a widget ____________________________________________ 571 Moving the widget inside a Dashboard ______________________________________ 572 Modify the contents of the widget __________________________________________ 573 Delete the widget from Dashboard _________________________________________ 574
11. Integrations _____________________________________________________ 576

IM 43D07N10-01EN 6th Edition: Mar. 10, 2022-00
11.1 ServiceNow ____________________________________________________________ 576 Integration Overview ____________________________________________________ 576 Integration specifications _________________________________________________ 578 Deployment architecture _________________________________________________ 579 Error handling _________________________________________________________ 581 Creating a ServiceNow alert from an Automation rule __________________________ 583 Syncing Between ServiceNow and MSS alert ________________________________ 587
Revision History ______________________________________________________ 590

<Introduction> vi
IM 43D07N10-01EN 6th Edition: Mar. 10, 2022-00
Introduction
This document provides instructions on using the Managed Service Suite (MSS) System. Please review this document before using the Application.
Refer to this document after the configuration of the settings required for the leased hardware and software and other required essentials as are necessary for the operation of the MSS system has been completed by Yokogawa engineer based on the contract.

<Purpose of document> vii
IM 43D07N10-01EN 6th Edition: Mar. 10, 2022-00
Purpose of this document
The document is intended for readers to familiarize themselves with MSS Software and help them perform day-to-day operations on the MSS system.

<Safety Precautions> viii
IM 43D07N10-01EN 6th Edition: Mar. 10, 2022-00
Safety Precautions
Notes on the Instruction Manual
Deliver the instruction manual to the end-user and ensure that the end-user keeps it in a convenient location so that it is readily accessible for reference. Be sure to read the instruction manual thoroughly and understand the content fully
before operating the product.
The instruction manual describes the functional details of the product and does not guarantee that the functions suit a customer’s purpose.
Reproducing or copying in part or whole, the information contained in the instruction manual without the prior consent of Yokogawa, is strictly prohibited.
The information in the instruction manual is subject to change without notice.
If you have any questions or notice any errors or omissions, please contact Yokogawa’s department responsible for preparing the instruction manual, Yokogawa’s sales department, or the sales representative where you purchased the product.
Product disclaimer
Yokogawa does not give any guarantee for the product except as provided in terms of the warranty.
Yokogawa shall not be liable for: any damage suffered by the customer or any third party as a result of the use of this product, or any damage or loss, direct or indirect, sustained by the customer or any third party as a result of a defect or malfunction of the product that Yokogawa cannot predict in advance.
Software products
Yokogawa does not give any guarantee for the software except as provided in terms of the warranty.
Be sure to use the software on the specified computer. If you want to use the software on any other computer, purchase the software for that computer separately.
Copying the software for any purpose other than making a backup copy is strictly prohibited.
Keep the DVD-R (original media) containing the software in a safe place.
Reverse compile, assemble, or reverse-engineering the software is strictly prohibited.
Transferring, sharing, or subleasing, in part or, the software to a third party for use by the third party without Yokogawa’s prior consent is strictly prohibited.

<Notational Conventions> ix
IM 43D07N10-01EN 6th Edition: Mar. 10, 2022-00
Notational Conventions
Marks, Symbols, and Brackets in the instruction manual
Marks, symbols, and brackets in the instruction manual indicate the following information. Marks and symbols commonly used in the instruction manual
Text surrounded by quotation marks (““) indicates a name Examples: “PC name” and “window name.”
A white triangle symbol (△) indicates a space character in a string entered by the user. Example: AL△PIC010△-SC
Brackets Used in Description of Key and Button Events
Text surrounded by brackets ([ ]) indicates keys on the keyboard or button names in windows and items displayed in windows in the descriptions of key and button events.
Example: To switch functions, press the [ESC] key.

<Notational Conventions> x
IM 43D07N10-01EN 6th Edition: Mar. 10, 2022-00
Signs used in the instruction manual
Signs in the instruction manual indicate the following information.
WARNING
The symbol indicates a warning.
Notes that describe when software or hardware is damaged, or a system failure occurs.
CAUTION
The symbol indicates a caution.
Notes that are needed to be understood the operation and functions.
SUPPLEMENT Notes contain additional information about the system or operation.
REFERENCE Notes link to the additional information about the topic in discussions.
Notes in green indicate that reference description can is accessible by clicking REFERENCE.
Notes in black indicate that the reference description is not accessible by clicking REFERENCE.
Figure notation
Figures in the instruction manual may be exaggerated, simplified, and partly omitted for convenience of explanation.
There may be some differences between the screen images in the instruction manual and the actual ones with regards to display position and letters (uppercase or lowercase) as far as they do not interfere with the functional understanding, operation, and monitoring. Furthermore, some displayed images are an example.

<Copyrights and Trademarks> xi
IM 43D07N10-01EN 6th Edition: Mar. 10, 2022-00
Copyrights and Trademarks
Copyrights Copyrights of the programs and the online manual running on the service platform belong
to Yokogawa. PDF security on the document prevents alterations of the online manual. You may print
out a hardcopy of the online manual. If you print out the online manual, use the manual only for using the product. If you use
the manual, make sure that it is consistent with the latest version and that its version number is consistent with that of the newest version on the service platform.
Copying, transferring, selling, or distributing the online manual to a third party (including distribution through a PC communication network) is prohibited.
Furthermore, registering or recording it on videotape or other media without the prior consent of Yokogawa is prohibited.
Trademarks
CENTUM, ProSafe, AAIMS are registered trademarks of Yokogawa Electric Corporation. PRM is a registered trademark of Yokogawa Electric Corporation in the United States and
Japan. Windows, Microsoft Edge are a registered trademark of Microsoft Corporation in the
United States and other countries. Firefox is a registered trademark of Mozilla Corporation in the United States and other
countries. Chrome is a registered trademark of Google Corporation and its subsidiaries and affiliates
in the United States and other countries. McAfee is a registered trademark of McAfee, Inc. in the United States and other countries. “FOUNDATION fieldbus” is a registered trademark of the FieldComm Group. “HART” is a registered trademark of the FieldComm Group. All other company names and product names appearing in this manual are trademarks
or registered trademarks of their respective companies. (R) and TM marks are not indicated in this manual.

<Overview> 1
IM 43D07N10-01EN 6th Edition: Mar. 10, 2022-00
1. Overview
1.1 Purpose of the system
The Managed Service Suite (MSS) is an asset management platform for industrial plant maintenance. It consists of maintenance support applications with data and user flow on flexible, reliable, and secure architecture.
It combines all relevant data concerning IT (Information Technology) assets, control, safety, field, and cybersecurity to create an integrated plant status overview that converts all information into usable insights. This integrated overview of plant status contributes to the efficient management of the plant.
MSS also provides Remote Management capabilities. It allows users to connect securely to any asset registered on the system from inside and outside the organization.
The MSS is offered based on a ‘Software as a Service’ (SaaS) model, which includes software licensing and delivery projects on a subscription basis and is fully managed by Yokogawa under the contract of OpreX Managed Service.

<System Overview> 2
IM 43D07N10-01EN 6th Edition: Mar. 10, 2022-00
2. System Overview
2.1 Deployment Pattern
The MSS platform is available in three different types of deployment patterns.
Table 2.1-1 MSS deployment patterns
Deployment pattern MSS Release
R1.5
Pattern 1 (Single Site) MSS Physical Server at Customer Single Site
No WAN connection required. MSS center and site component are deployed with hardware at customer site.
Pattern 2 (Multi Sites) MSS Data Center for multi sites
Facilities with multiple sites are separated by an L4 LAN/WAN. MSS center component is deployed in customer owned/managed data center and site component is done with hardware.
Pattern 3 (Yokogawa hosted) MSS Data Center hosted by Yokogawa
Facilities with multiple PCD networks (sites) separated by an L4 LAN/WAN. MSS center component is deployed in Yokogawa owned/managed data center and site component is done with hardware.
Figure 2.1-1 MSS deployment patterns
REFERENCE
For more information, please refer to the General Specifications Document
(GS 43D07N10-01EN)
SUPPLEMENT
MSS deployment and management is be done by Yokogawa.

<System Overview> 3
IM 43D07N10-01EN 6th Edition: Mar. 10, 2022-00
2.2 System architecture
The MSS platform consists of three main components.
① Center component.
② Site component.
③ Network Operations center (NOC)
Center Component:
The ‘MSS center component’ provides centralized access to the resources and visualizes activities across the plants. It communicates with multiple site servers to provide the information in real-time.
Center Component is the central location of access for user-to-system access; between a user in the office domain and a host system in the Process Control Domain (from now on called “PCD”). It also provides a central point for remotely connecting and consolidated reporting on assets in the PCD.
Site Component:
The ‘MSS sites component’ is the infrastructure (firewall and application hosting) and software solution installed at each managed Site. It manages IT and OT assets and is responsible for collecting data from them. It provides a secure tunnel from the PCD to the Center Component and can orchestrate various data flow for maintenance activities.
It also provides a firewall service for secure system-to-system communication between systems and services in the MSS and the PCD. It is usually deployed in a geographic location and communicates with the center component through a direct or a VPN connection.
Network Operations Center (NOC)
The NOC allows remote monitoring and maintenance of MSS. Every deployed instance of Site Component and Center Component are configured to forward monitoring data of each instance itself to NOC. E.g.: Monitoring MSS infrastructure like availability of hard disk space in Site and Center Component, verifying that backup is successful, etc.

<System Overview> 4
IM 43D07N10-01EN 6th Edition: Mar. 10, 2022-00
2.3 User Accounts
An MSS user requires an MSS user account to perform day-to-day activities on MSS. Both the ‘center server’ and ‘site server’ are accessed using the same MSS user account.
The behavior of user accounts on the Center component and Site component differs in the following aspects:
① Login behavior
② Permissions
③ Permission Scope
Login behavior:
MSS Site Component manages the MSS user accounts. A user can log in to a site only if the user’s account is allowed in the given MSS Site Component.
However, to access the MSS Center component, the MSS user account needs to be added to at least one of the MSS sites.
Permissions:
By default, a user can access all the features in the ‘Center component.’ However, an MSS user’s activities on the ‘Site component’ depend on the account’s permissions on the Site.
At Site, MSS administrator refers to an MSS user account with permissions to perform operations on the Site component.
Permission Scope:
There is only one instance of the center component per MSS deployment. However, there can be multiple instances of ‘Site components.’
The scope of all MSS users and administrators is set and is limited to a Site component. i.e., if there are 2 Sites, the user needs to be added to 2 sites separately.

<System Overview> 5
IM 43D07N10-01EN 6th Edition: Mar. 10, 2022-00
2.4 Assets
Assets are IT and OT resources that collect data and are monitored by MSS.
MSS R1.5 supports managing and monitoring of five types of assets:
Table 2.4-1 MSS Supported asset types
Asset Type Description Supported subtypes
Compute assets Servers/workstations assets that are in the PCD.
Windows assets
PLC/DCS assets Control systems in the PCD.
Yokogawa FCS (Field Control Station)
Yokogawa SCS (Safety Control Station)
Yokogawa AVR (Vnet Router)
Yokogawa BCV (Bus Converter)
Yokogawa WAC (Wide Area Communication Router)
Field assets Field assets, such as control valve positioner, transmitters that support HART or Foundation Fieldbus protocol.
Assets supported by Yokogawa PRM (Plant Resource Manager)
Network assets Hardware assets that deal with network routing in a PCD/ Datacenter.
Switch
Router
Firewall
Time Server
Environmental assets Performance Monitoring Devices that analyze environmental conditions of the site or plants.
Yokogawa ODU (Online Diagnosis Unit)
The asset exists both in the Center and Site components. It is added, managed, and controlled by the ‘Site component’ It becomes available in the ‘Center component for monitoring.

<System Overview> 6
IM 43D07N10-01EN 6th Edition: Mar. 10, 2022-00
2.5 Applications
Alongside assets, MSS can also monitor applications commonly used in OT. While MSS assets refer to physical or virtual systems, applications are computer programs that are designed to carry out a specific task other than one relating to operation of the computer/asset itself.
MSS R1.5 supports managing and monitoring of the following OT applications.
Table 2.5-1 MSS supported application types
Application Type Description Supported subtypes
Security applications Applications related to security of Datacenter such as Anti-virus and Patch Management.
McAfee policy Orchestrator
Windows Server Update Services
Control applications Information of CENTUM’s Station List and System Alarm and so on
Yokogawa Centum VP
Asset Management applications
Applications that directly monitor field assets (such as Transmitters, flow meter etc.)
Yokogawa PRM
Analyzer Management applications
Application that monitor, maintain, determine and improve the performance of on-line process analyzers
Yokogawa AAIMS

<System Overview> 7
IM 43D07N10-01EN 6th Edition: Mar. 10, 2022-00
2.6 Remote Access
One of the key functionalities of the MSS site and center components is the possibility to remotely access the assets added to site and center. MSS utilizes four protocols to provide remote access to assets:
① Remote Desktop Protocol (RDP)
② Virtual Network Computing (VNC)
③ Secure Shell (SSH)
④ Web Connection (Web)
With these three protocols, MSS users can remotely access an asset from the site or center component.
The architecture of Remote Access function is as follows:
Figure 2.6-1 Remote Access Architecture
Every Site component can connect remotely to the asset which has been onboarded on it. Users will be able to utilize this ability of Site component to login to the assets they need to access from both Site and Center component.
The remote connection can be made both within and outside Organization. Authorized external users such as Yokogawa help desk can also provide remote support by connecting to an asset if approved by customer. We will discuss the details in the upcoming sections.
SUPPLEMENT
No remote tool installations are required in user’s machine to perform secure remote operations in MSS.

<System Overview> 8
IM 43D07N10-01EN 6th Edition: Mar. 10, 2022-00
2.7 Automations
One of the defining features of MSS is its ability to collect data from various assets and applications in various sites. Such data from assets and applications contain various information ranging from performance metrics to configuration information.
The performance metrics gathered by MSS allows MSS user to monitor the health of an asset over time. Since MSS is built to handle and process thousands of assets at a given time, it becomes impractical for an MSS user to manually monitor such large-scale operations for issues.
To address this problem, MSS has introduced the concept of ‘Automations’. An MSS user can create an automation rule in MSS over a single or multiple asset. Such rule runs periodically and alerts the users in case of any anomalies.
An automation consists of following:
Figure 2.7-1 Automation architecture
An MSS Monitor periodically scans an asset and saves the state of an asset on the MSS Data Store. If an automation rule is defined on the asset, MSS applies the automation rule on the asset. An automation rule is made up of:
Table 2.7-1 Automation architecture components
Component Description
Site
Monitors MSS standard queries that are applied on an individual asset or application’s data and save its state.
Trigger Business rules that start automation rules over a set of objects.
Conditions Almost the same as triggers but are smarter and more advanced. A condition can have complex if/else or business rules.
Actions A method of alerting users when the trigger (and conditions) are met.
Center Automation Processor An MSS component that processes all automation rules. Match the data from Monitor with Trigger (and Conditions), and if they match, take Action.

<System Overview> 9
IM 43D07N10-01EN 6th Edition: Mar. 10, 2022-00
Alert service An MSS service that publishes alerts in Alert UI
Email service An email can be sent out after performing an action (such as creating an MSS alert) or sending out an email itself can be an action.
Alert UI Display alerts on the center screen.
Integrations ServiceNow A popular ITIL system used in Incident management.
SUPPLEMENT
An Automation runs on the Center component but is configured on Site Component.

<System Overview> 10
IM 43D07N10-01EN 6th Edition: Mar. 10, 2022-00
2.8 File Transfer
When a production application encounters an issue and requires support engineer or vendors to fix it, sharing applications logs is essential. However, extracting application logs securely from a PCD environment can be quite time consuming.
MSS provides an easy and secure way to share files and logs from PCD systems. The file can be uploaded from a PCD system to MSS over HTTPS (port 443).
These files can be shared with other MSS users within MSS or can be downloaded to another system for sharing with external parties.
Figure 2.8-1 File transfer workflow
For uploading a file from an asset seamlessly, MSS users can
① Remote into the asset from Site or Center Component,
② From asset, access Site Component in the OT Network
③ Upload the file to MSS Site Component
Once the file upload is completed successfully, the file is then synchronized from Site component to Center component. Users can now -
④ Download the file from Site component in a different machine in OT network or from Center component in IT network.
MSS also supports file upload to Center component. Any file uploaded in Center Component will be synced to Site Component as well. The feature can be used to copy files securely from IT layer to the asset by uploading files to Center Component and downloading the file from Site Component in the asset.

<System Overview> 11
IM 43D07N10-01EN 6th Edition: Mar. 10, 2022-00
2.9 Asset Inventory
During onboarding on an asset, MSS collects some basic information about the asset. This information is useful in configuring the asset.
However, alongside configuration, the information provided for the asset can be used by Automation rules to reference them.
Consider the following use case:
An Automation rule needs to create an Alert whenever a Compute asset reaches a threshold or 90%.
The automation should have the title of - Server 1 of type <Server> has reached CPU Utilization over 90%. Such variables in MSS are denoted by {{ attributes.asset.server }}. During the alert creation, Automation replaces the variable declared inside ‘{{ }}’ with corresponding value of asset.
However, the attribute ‘server’ is not available in during onboarding by default.
However, MSS users can achieve this use case by extending the asset property by using the ‘Custom fields’ feature of MSS.
By creating a ‘Custom field’ called ‘Server’ for Compute asset type, users can specify a value for this property at asset level.
Then, users can construct a message like-
CPU utilization of Compute Asset – Server 1 of type {{ attributes.asset.server }} has reached utilization over 90%.
If the server custom field of server has the value – ‘AD Server’, then during runtime, this will generate a message as:
Server 1 of type AD Server has reached CPU utilization over 90%
Figure 2.9-1 Extending Custom fields in MSS

<System Overview> 12
IM 43D07N10-01EN 6th Edition: Mar. 10, 2022-00
2.10 Dynamic dashboards
As a Remote monitoring solution, MSS collects a lot of data from assets. The importance of data depends on the role of individuals and teams within plant and organization.
Dashboards in MSS serves two important purposes.
① Visualization of data
② Enabling Collaboration between team members
In order to ensure that MSS users can remain focused on what’s important and relevant important amongst vast amounts of data, MSS allows users to create and configure Dynamic dashboards.
After a member creates a dynamic dashboard, they can share it with everyone in the organization. This allows teams to collaborate more effectively.
Figure 2.10-1 Dynamic Dashboards in MSS
SUPPLEMENT
Default dashboards provided by MSS and is available to all MSS users with View dashboard permissions.

<System Overview> 13
IM 43D07N10-01EN 6th Edition: Mar. 10, 2022-00
2.11 Mail Relay
MSS provides a secure way to send out emails to users within and outside the Organization from OT environment.
MSS offers email support through
Generating emails through Automations
Providing Mail Relay Service
Following diagram illustrates the Mail relay architecture of MSS.
Figure 2.11-1 MSS Mail Relay Architecture
An Automation rule triggers an email notification in Center and this email is relayed to the users based on configuration.
To relay emails from assets/applications in OT network, you can configure them to point to the IP address as Mail Relay server over the specified ports.
SUPPLEMENT
Yokogawa is responsible for setting up and managing Email Architecture of MSS for MSS Site and Center Component.

<System Overview> 14
IM 43D07N10-01EN 6th Edition: Mar. 10, 2022-00
2.12 Operational status and heartbeat
The following two properties indicate whether MSS is collecting data from assets/applications.
1. Operational status
2. Heartbeat, and
‘Operational status’ is a configurable property of an asset/application. MSS users with ‘edit permissions’ on an asset can set the status for it in Site component.
Table 2.12-1 Operational status in Site component
Icon Status Description
Operational The asset is active in production
Maintenance The asset is suspended temporarily for maintenance
Disposed The asset is no longer used in production is disposed
SUPPLEMENT
Field assets, which are monitored via PRM has a simple circle in List view.
Icon Status Description
N/A The asset doesn’t support Operational status
‘Heartbeat’ is a metric of asset/application that lets MSS users know if MSS can communicate successfully with the asset/application.
A heartbeat collector is a special data collector in MSS that collects heartbeat metric from the asset and determine the heartbeat status of the asset. MSS stores the heartbeat data for up to 30 days.
An asset in MSS can have three heartbeat statuses or indicators: ‘Up’( ), ‘Down’( ) and ‘Turned Off’( ).
A heartbeat status of ‘Up’ indicates that MSS is able to communicate with the device successfully.
If either MSS cannot communicate with device or if device is experiencing an issue with generating Heartbeat data, then the status will be ‘Down’.
A ‘Turned Off’ status indicates that MSS is not collecting heartbeat information from the asset.
Like other data collectors in MSS, heartbeat collector needs to be enabled to collect heartbeat metric from asset. Once enabled, heartbeat collector determines the heartbeat status by evaluating the metric data. If everything is working as expected, then the heartbeat status is set to ‘Up’, else it will be set to ‘Down’. In case the heartbeat collector is disabled, heartbeat status of the asset is set to ‘Turned Off’.
Assets such as Field asset, which are monitored through an intermediary (such as PRM), has different heartbeat indicators: ‘Up’( ), ‘Error’( ) and ‘Unknown’ ( ).
‘Up’ and ‘Error’ status correspond to ‘Up’ and ‘Down’ status of a regular asset. An unknown status is shown if the intermediary (PRM) doesn’t have any data collected from field asset.

<System Overview> 15
IM 43D07N10-01EN 6th Edition: Mar. 10, 2022-00
Since MSS collects data from multiple types of assets, it uses different protocols to determine the status.
Table 2.12-2 MSS heartbeat protocols for assets/applications
Asset Type Asset Subtype Protocol / Query
Compute Asset* WMI based ICMP
PLC/DCS Asset FCS, SCS, BCV, AVR, WAC
Yokogawa internal***
Field Asset HART/FF/Profibus** Yokogawa internal***
Network Asset Router, Switch, Firewall, Time Server
SNMP
Environmental Asset ODU Yokogawa internal***
Security Application McAfee ePO application Yokogawa internal***
Microsoft WSUS server Yokogawa internal***
Control Application Centum VP Yokogawa internal***
Asset Management Application PRM Yokogawa internal***
Analyzer Management Application AAIMS Yokogawa internal*** * Agent based Compute assets do not have the heartbeat data collector ** Field asset cannot be explicitly set as HART/FF/Profibus in MSS. This categorization is inherited from Asset Management Application such as PRM. *** The query and logic used to collect data from assets is designed by Yokogawa
Figure 2.12-1 Operational status and heartbeat in Site component
In Site component, users can Operational status and heartbeat status individually. In Center, the information is consolidated into a single status.

<System Overview> 16
IM 43D07N10-01EN 6th Edition: Mar. 10, 2022-00
Figure 2.12-2 Operational status and Heartbeat in Center component
Asset availability status icons
Table 2.12-3 Asset availability in Status icon
Icon Status
Healthy
Maintenance
Inventory
Error
Unknown
Table 2.12-4 Operational status/heartbeat in Center component
Operational status / Heartbeat Up Down Turned Off
Operational Healthy Error Unknown
Maintenance Maintenance Maintenance Maintenance
Disposed Inventory Inventory Inventory
Exceptions:
There are two exceptions to the above rule in MSS R1.5.
1. Agent based Compute asset: The Heartbeat status of Agent based Compute asset is always unknown as it doesn’t have any heartbeat collectors.
2. Field Asset: Heartbeat status of Field assets is populated from the field ‘PRM Status’ from PRM.

<System Overview> 17
IM 43D07N10-01EN 6th Edition: Mar. 10, 2022-00
2.13 Integrations - ServiceNow
As a Remote Monitoring Tool, MSS creates alerts in Center Component to notify MSS users about abnormal events on an asset. After notifying a user, the next step is resolving the issues.
While Alert View in Center Component does allow users to perform this operation, most organizations use ServiceNow, which is almost an industry standard, for Incident management.
MSS integrates with ServiceNow, to securely create incidents from OT assets using Automation rules. After creating an Incident, Center Component keeps track of all the incidents created in ServiceNow and syncs back their status to Alert view.
The synced alerts are read-only and can only be modified from ServiceNow.
Figure 2.13-1 MSS-ServiceNow Integration

<Before use> 18
IM 43D07N10-01EN 6th Edition: Mar. 10, 2022-00
3. Before use
In order to perform the operations listed in IM, please make sure to have:
① MSS user account with appropriate permissions.
② URL of site and center component.
③ A modern web browser.
The supported browsers’ versions are below and higher.
Table 2.13-1 MSS supported browsers
Supported Browser Version Supported for
Mozilla Firefox 89 Center & Site
Google Chrome 91 Center & Site
Microsoft chromium-based Edge 91 Center & Site

<Views and Layouts> 19
IM 43D07N10-01EN 6th Edition: Mar. 10, 2022-00
4. Views and Layouts
In this section, we explore various ‘Views’ in MSS and their ‘Layouts’ that are available in the MSS application. This section helps the reader to familiarize themselves with the MSS application.
Definition:
Views are MSS screens that display content. Usually, about a function. Layouts are the organization or arrangement of contents in a view.
There are two forms of views –
① Information view
② Functions view – deals with what data is rendered
Information view:
Information view refers to displaying information within MSS. It deals with how the data is rendered. There are two important information views that the users must familiarize themselves with:
① List view
② Detailed view
Functions view:
Functions view deals with what data is rendered. E.g.: Displaying a user data and Compute asset data.
The following function views are discussed from 4.3 Site Component - Overview to 4.22 User Menu
① Site component - Overview ② Center component – Overview ③ Center component – Global-view ④ Center component – Site-view ⑤ Center component – Dashboards ⑥ Security Applications (Site & Center) ⑦ Control Applications (Site & Center) ⑧ Asset Management Applications (Site & Center) ⑨ Analyzer Management Applications (Site & Center) ⑩ Compute assets (Site & Center) ⑪ PLC/DCS assets (Site & Center) ⑫ Field assets (Site & Center) ⑬ Network assets (Site & Center) ⑭ Environmental assets (Site & Center) ⑮ Remote settings ⑯ Sessions ⑰ Activity Log ⑱ Authorizations (Site manager) ⑲ Remote access ⑳ User menu

<Views and Layouts> 20
IM 43D07N10-01EN 6th Edition: Mar. 10, 2022-00
4.1 List view
List view deals with how the data is rendered. Below is a sample list view of Security applications from the Site component. Its layout consists of data-table and filter options.
Data table contains function specific list of items or objects, in this case – Security applications in a data-table. While-as filter options are used to filter or search the objects in the data-table.
Figure 4.1-1 Information view - Sample list view
data-table Filter

<Views and Layouts> 21
IM 43D07N10-01EN 6th Edition: Mar. 10, 2022-00
4.2 Detailed view
While the List view deals with the collection of items or objects, detailed view deals with the individual ones. Detailed view of an object is opened by clicking on an object from list view.
Detailed view’s layout consists of ‘interactive view’ and ‘functional sub-menu.’ ‘Interactive view’ refers to the core contents of the screen. ‘Functional sub-menus’ refers to the options or sub-menus an object has.
The output rendered in the interactive view depends on the sub-menu which is selected or currently active.
Figure 4.2-1 Information view – Sample detailed view
Interactive view
Functional sub-menu E.g.: application sub-menu or asset sub-menu

<Views and Layouts> 22
IM 43D07N10-01EN 6th Edition: Mar. 10, 2022-00
4.3 Site Component - Overview
Site Manager’s View consists of four layouts:
① Header
② Navigation
③ Contents
④ Footer
Figure 4.3-1 View & Layout of Site Component
3. Contents
4. Footer
1. Header
2
2. Navigation

<Views and Layouts> 23
IM 43D07N10-01EN 6th Edition: Mar. 10, 2022-00
Header:
A site component’s header is green in color. It consists of:
Table 4.3-1 Header Layout of Site Component
Layout Options Description
Header
Yokogawa Logo Users can return to the “Site component’s overview screen” from anywhere in the Application by clicking on the logo.
Site Manager (Text) A text denoting that user is in the Site component.
Site Name Name of the Site as registered in MSS
User Menu A simple user menu. It allows users to logout from the Site component.
Navigation:
The navigation bar consists of menus that can help the user navigate the Application. It consists of nine menus:
These nine menus can be categorized into two operational menus:
① Administrative actions menu
② User actions menu
Table 4.3-2 Navigation layout of Site Component
Layout Operational menu Menus Sub-menus
Navigation
Administrative actions menu
Status N/A
Applications
Security applications
Control applications
Asset Management applications
Analyzer Management applications
Assets
Compute assets
PLC/DCS assets
Field assets
Network assets
Environmental assets
Asset discovery
Field asset discovery
Sessions Requests
Sessions
Authorizations Users
Groups
Activity Log N/A
Configuration N/A
User actions menu Remote Access N/A
File Transfer N/A
An admin menu such as assets, sessions, etc., are available only to MSS administrators. Simultaneously, a ‘user menu’ such as Remote access is available to all MSS users. A divider separates them.

<Views and Layouts> 24
IM 43D07N10-01EN 6th Edition: Mar. 10, 2022-00
Figure 4.3-2 Operational menu of Site component
The administrative actions menu is intended for administrative purposes while user action menu is for user to perform day-to-day operations (such as connecting to an asset remotely). By default, an MSS user should have access to User action menu. But a user can be granted access to any of the administrative actions menu to perform administrative actions by assigning appropriate permissions.
Refer to Chapter 5.4 Site component - Managing Permissions of a user or group of a user for more information
Content:
Content is the active part of the Application. It doesn’t have a fixed view. However, based on the Menu or sub-menu selected, appropriate content is rendered.
Footer:
The footer contains a copyrights statement and a link to release notes of the product.
Administrative actions menu User action menu

<Views and Layouts> 25
IM 43D07N10-01EN 6th Edition: Mar. 10, 2022-00
Status menu
‘Status View’ is the home page of ‘Site component.’
Figure 4.3-3 Status menu of Site component
The contents of the status menu are simple. It consists of 2 different metrics at the Site:
① Onboarded devices:
② Active users

<Views and Layouts> 26
IM 43D07N10-01EN 6th Edition: Mar. 10, 2022-00
Applications menu
The application menu consists of three sub-menus
Security applications
Control applications
Asset Management Applications
Analyzer Management Applications
To know more about these options, please jump to the corresponding sections.
Figure 4.3-4 Applications menu of Site component
Applications menu

<Views and Layouts> 27
IM 43D07N10-01EN 6th Edition: Mar. 10, 2022-00
Assets menu
The assets menu consists of seven sub-menus.
① Compute assets
② PLC/DCS assets
③ Field assets
④ Network assets
⑤ Environmental assets
⑥ Asset discovery
⑦ Field Asset discovery
To know more about these options, please jump to the corresponding sections.
Figure 4.3-5 Assets menu of Site Component
Assets menu

<Views and Layouts> 28
IM 43D07N10-01EN 6th Edition: Mar. 10, 2022-00
Sessions
The sessions menu consists of two sub-menus.
① Requests
② Sessions
To know more about these options, please jump to the corresponding sections.
Figure 4.3-6 Sessions menu of Site-component
Sessions menu

<Views and Layouts> 29
IM 43D07N10-01EN 6th Edition: Mar. 10, 2022-00
Authorizations menu
Management of MSS users, who belong to the corresponding Site, is done here.
It consists of two sub-menus:
① Users
② Groups
Figure 4.3-7 Authorizations menu of Site component
Authorizations menu

<Views and Layouts> 30
IM 43D07N10-01EN 6th Edition: Mar. 10, 2022-00
Activity Log
Activity Log allows users and admins to track activities and changes occurring at the site component over a specific time. This menu is helpful for Site administrators to audit.
Figure 4.3-8 Activity Log of Site component
The available information for tracking includes:
Table 4.3-3 Information in Activity Log
Columns Description
Actor The MSS user/admin account performing an operation.
Category High-level action/activity performed by the actor.
Activity Specific action/activity performed by the actor.
Object The MSS object in the Site component on which the operation was performed.
Date & Time The time at which the operation was performed in UTC.
Activity

<Views and Layouts> 31
IM 43D07N10-01EN 6th Edition: Mar. 10, 2022-00
Configurations menu
The configuration menu
① provides configuration information about the logged-in Site,
② provides an interface to manage automations, and
③ provides configuration for the asset inventory
Figure 4.3-9 Site configuration in site component
The displayed information is read-only and consists of:
Table 4.3-4 Fields in the Site configuration
Options Description
Site name A custom label that is helpful for users to identify the site. E.g., Plant A or Site A
Site ID An autogenerated unique id used by the center server to identify and communicate with site component.
Site focal point The MSS user who has full administrative access and management responsibility of the site.
GPS coordinates The geographical location of the site. The values are in the form of latitudes and longitudes.
Time zone The time zone in which the physical site resides.
Language The primary language used in the site.
Customer The customer to whom the site component belongs. It has significance only if the deployment pattern is three.
Description The custom description provided by the site focal point about the site.
Configuration Site configuration contents

<Views and Layouts> 32
IM 43D07N10-01EN 6th Edition: Mar. 10, 2022-00
Figure 4.3-10 Automation in Site component
Automations can be created and managed from here. To know more about automation, refer to Chapter 7. Automations.
Figure 4.3-11 Asset configuration in Site component
Under Asset Configuration, users can manage Custom fields / field lists for all the assets/applications.
To know more about Asset Configuration, refer to Chapter 9. 9. Asset Inventory.
Configuration menu Automation contents
Configuration menu Asset configuration

<Views and Layouts> 33
IM 43D07N10-01EN 6th Edition: Mar. 10, 2022-00
Remote access
Remote access is a user action menu. It allows MSS users and admins to track activities related to status of ‘Remote access requests’ that were made at both center and site component. Remote access in site shows the remote requests by all users (filterable).
Figure 4.3-12 Remote access of Site component
The available information for tracking includes:
Table 4.3-5 Information in Remote access
Columns Description
Target asset The asset in Site Component on which a remote access session was initiated occurred.
Profile The profile that was used during the activity.
Request date Date and Time of the session request.
Status Status of the remote session request.
More details will be discussed in the upcoming sections.
Remote access

<Views and Layouts> 34
IM 43D07N10-01EN 6th Edition: Mar. 10, 2022-00
File transfer
File transfer is another user action menu. Through here, users can –
① Upload a file
② Download a file
③ Share the files with others
Figure 4.3-13 File transfer of Site component
To know more about File transfer, refer to Chapter 8. File Transfer
File Transfer

<Views and Layouts> 35
IM 43D07N10-01EN 6th Edition: Mar. 10, 2022-00
4.4 Center Component – Overview
Center Server shares a similar layout as the Site component. It also consists of:
① Header
② Navigation
③ Contents
④ Footer
While Site Server consists of only one view, the Center component has two views:
① Global view
② Site view.
Global view:
Figure 4.4-1 Global view of Center component
The global view provides the birds-eye view of the applications and acts as a way for users to navigate to the Site view.
The site view provides information about the activities of the selected Site. Global-View and Site view share the same headers and footers but differ in navigation and content layout.
3. Contents
1. Header
2. Navigation
4. Footer

<Views and Layouts> 36
IM 43D07N10-01EN 6th Edition: Mar. 10, 2022-00
Site view:
Figure 4.4-2 Site view of Center component
This section describes the shared header and footer. The next section describes the View specific layouts.
Header:
A center component’s header is blue. It consists of:
Table 4.4-1 Header Layout of Site Component
Layout Options Description
Header
Yokogawa Logo Users can return to the “Center component’s Global view” from anywhere in the Application by clicking on the logo.
Site Picker (Dropdown)
A dropdown lists. It lists all the available sites managed by the Center server.
User Menu A simple user menu. It allows users to view their information and logout from the Center component.
1. Header
2. Navigation
3. Content
4. Footer

<Views and Layouts> 37
IM 43D07N10-01EN 6th Edition: Mar. 10, 2022-00
Footer:
The footer contains a copyrights statement and a link to release notes of the product.
Release Notes:
Click on “Release notes” to access MSS bug fixes and release history.
Figure 4.4-3 MSS release notes
SUPPLEMENT
Release notes in “Site component” are the same as the Center component.

<Views and Layouts> 38
IM 43D07N10-01EN 6th Edition: Mar. 10, 2022-00
4.5 Center component - Global-view
Global view is a simple page that consists of one key feature. Site Map.
Sitemap
Site Map is the default “Home Page” of the Center server. It consists of:
① A world-map.
② ZOOM-IN, ZOOM-OUT, and RESET CONTROLS
Figure 4.5-1 Site map in Center component
A dot symbol ● on the Map represents an MSS Site. A label accompanies ● to help identify a site.
The color of the ● represents the status of communication of Site with the Center Server. With green ● representing Up-state and red ● representing Down-state. Users can navigate to “Site View” by clicking on these icons as well.
Sitemap

<Views and Layouts> 39
IM 43D07N10-01EN 6th Edition: Mar. 10, 2022-00
4.6 Center component - Site-view
Site-view provides the user with information on activities that occur on the Site in real-time. Each Site in MSS has a dedicated site view.
Users can navigate to Site view from Global-View in two ways:
① Selecting a site from the “Site Picker.”
② Clicking on the Site (● or ●) from the map
Figure 4.6-1 Navigating to Site-view
Click site click
Site Picker

<Views and Layouts> 40
IM 43D07N10-01EN 6th Edition: Mar. 10, 2022-00
Figure 4.6-2 Site-view navigation of Center server
Navigation menu:
The navigation bar consists of menus that can help the user navigate the site view. It consists of seven menus:
Table 4.6-1 Navigation layout of Site-view (Center component)
Layout Menus Sub-menus
Navigation
Home applications N/A
Dashboard Optional*
Applications
Security applications
Control applications
Asset management applications
Analyzer Management applications
Assets
Compute assets
PLC/DCS assets
Field assets
Network Assets
Environmental assets
Alerts N/A
Remote Access N/A
File Transfer N/A
* A dashboard which user has favorited. Please refer to Chapter 10.3.2 Favoriting a Dynamic dashboard
The next section explores these options.
Site contents
Selected site Navigation

<Views and Layouts> 41
IM 43D07N10-01EN 6th Edition: Mar. 10, 2022-00
Home menu
‘Home menu’ or ‘Home link’ is a simple link that redirects the user back to ‘Global View’ of ‘Center Component.’
Figure 4.6-3 Home menu in Site-view
Home

<Views and Layouts> 42
IM 43D07N10-01EN 6th Edition: Mar. 10, 2022-00
Dashboard menu
Dashboard Menu lists all available dashboards in MSS for the user in each site.
Figure 4.6-4 Dashboard menu in site view
The ‘Overview’ option is the home screen of the Site view. MSS R1.5 lists two types of dashboards.
① Default dashboards are basic operational dashboard that tracks the details of assets and application in a site. The charts in here are provided by MSS.
② Dynamic dashboards are dashboards created by MSS users to with charts specific to their user cases.
Chapter 4.7 Center component - Dashboards describes the dashboard screens in more detail.
Dashboard menu

<Views and Layouts> 43
IM 43D07N10-01EN 6th Edition: Mar. 10, 2022-00
Applications menu
‘Applications menu’ in Center contains granular information of all the actively monitored applications from the Site. Users can list the monitored applications and can drill down to detailed view to see information of an individual application.
In MSS R1.5, Application menu displays information on four types of assets:
1. Security applications
2. Control applications
3. Asset management applications
4. Analyzer management applications
Figure 4.6-5 Security applications view in the Application menu of Center Component
For more details, please refer to Chapter 4.8. Security applications to 4.11 Analyzer Management applications

<Views and Layouts> 44
IM 43D07N10-01EN 6th Edition: Mar. 10, 2022-00
Assets menu
‘Assets Menu’ contains granular information of all the actively monitored assets from the Site. It helps drill down to get asset level information.
Assets menu displays information on five types of assets:
① Compute assets
② PLC/DCS assets
③ Field assets
④ Network assets
⑤ Environmental assets
Figure 4.6-6 Assets menu in Center-view
Chapters 4.12 Compute assets ~ 4.16 Environmental assets describes the assets in detail
Assets menu

<Views and Layouts> 45
IM 43D07N10-01EN 6th Edition: Mar. 10, 2022-00
Alerts
Alerts menu contains a list of alerts that are triggered by an automation rule and read-only copies of incidents created in ServiceNow. Alerts menu is available only in the Center component.
Figure 4.6-7 Alerts menu in Center-view
The following information about an alert is provided immediately
Table 4.6-2 Information in Alerts
Columns Description
Alert The title of the automation alert and the trigger, which was the cause for the alert.
External ID ID of the ServiceNow incident.
Asset/Application The asset or application which triggered the alert.
Priority The priority set on the Automation alert.
Custodian The custodian of the asset.
State The current state of the alert.
Count Frequency of the alert during the analysis period.
Start date The date when the alert was registered for the first time during the analysis period.
More actions (⁝) The action menu used to change the status of an alert.
Alerts menu

<Views and Layouts> 46
IM 43D07N10-01EN 6th Edition: Mar. 10, 2022-00
SUPPLEMENT
MSS users’ needs to be aware of two properties when working with Alerts:
① Count Behavior
Whenever an automation rule triggers and the condition is “true,” the count is increased except if you change the state of an alert. E.g., If it is New, the count will continue to recur. If the “state” is modified to InProgress or Resolved, etc., and the alert is triggered again, a new alert with count ‘one’ will be started.
② Alert lookup
An alert lookup in MSS starts by providing a period to retrieve all the alerts. When an analysis period is specified, MSS looks up and lists all the alerts that were created from the start of the specified period.
Figure 4.6-8 Query for alert in Center component
In the above example, only Alert 2 and Alert 3 will be displayed despite Alert 1 having reported an alert during the specified period

<Views and Layouts> 47
IM 43D07N10-01EN 6th Edition: Mar. 10, 2022-00
Remote Access
Similar to Chapter 4.3.8 Remote access in Site component, Remote access in center component is also a user action menu and allows MSS users and admins to track activities related to the status of ‘Remote access requests’ that were made at the center component and site component by the current user.
Figure 4.6-9 Remote access of Center component
For more information about the table, please refer to Table 4.3-5 Information in Remote access and Chapter 6. Remote Operations.
Remote access

<Views and Layouts> 48
IM 43D07N10-01EN 6th Edition: Mar. 10, 2022-00
File Transfer
File transfer in Center-view has the same functions as site-view. Here, users can –
① Upload a file
② Download a file
③ Share the files with others
Figure 4.6-10 File transfer of Center component
To know more about File transfer, refer to Chapter 8. File Transfer
File Transfer

<Views and Layouts> 49
IM 43D07N10-01EN 6th Edition: Mar. 10, 2022-00
4.7 Center component - Dashboards
MSS collects data from numerous devices simultaneously in real-time. It provides multiple ‘operational dashboards’ and allows the consumption of a large amount of data from a central location.
End-users can freely specify the ‘period’ over which they can see the assets’ overall performance through “time picker.”
There are two kinds of dashboards provided by MSS.
① Default/System dashboards
② Dynamic dashboards
MSS by default, provides seven default dashboards, five asset-specific and two application-specific.
① Compute assets
② PLC/DCS assets
③ Field assets
④ Network assets
⑤ Environmental assets
⑥ Security applications
⑦ Asset Management applications
Figure 4.7-1 Default/System dashboards in Center Component
In addition, MSS users can create their own dashboards with various chart types across various data sets provided by MSS. These dashboards are referred to as Dynamic dashboards.
A Dynamic dashboard once created, can be shared with all the users in the organization for better collaboration.

<Views and Layouts> 50
IM 43D07N10-01EN 6th Edition: Mar. 10, 2022-00
Compute assets
From the dashboard menu in Center Component, click on the Overview submenu, and from the dashboard data table, click on ‘Compute Assets’ dashboard to navigate to the ‘Compute assets’ dashboard.
Figure 4.7-2 Compute assets dashboard
The dashboard of Compute assets is an ‘operational dashboard’ that tracks the details of Compute assets in a site. It summarizes the data over a selected period and visualizes it in an easy to consume manner—the time picker assists in specifying the period.
Dashboard categorizes the data into three groups: ① Count
② Statistics
③ Event description
Time picker
Count
Statistic
Event description
Compute assets dashboard

<Views and Layouts> 51
IM 43D07N10-01EN 6th Edition: Mar. 10, 2022-00
Count:
A total of six items are counted and displayed. Three of these are asset-related, and the other three are event-related. The windows event viewer is the source of the event-related count.
Table 4.7-1 Count layout of ‘Compute assets’ dashboard
Layout Options Description
Count
Number of compute assets This field represents the total number of ‘compute assets’ that are currently being monitored by the MSS System in the selected Site. The value of this field is the sum of ‘Total server assets’ and ‘Total workstation assets.’
Total server assets This field represents the total number of ‘Servers’ that are currently being monitored by the MSS System in the selected Site. Refer to Table 4.7-2 Supported ‘Compute assets’ to know which ‘Compute assets’ are classified as server assets.
Total workstation assets This field represents the total number of ‘workstations’ that are currently being monitored by the MSS System in the selected Site. Refer to Table 4.7-2 Supported ‘Compute assets’ to know which ‘Compute assets’ are classified as workstation assets.
Total security events This field represents the aggregated event logs from all the ‘compute assets’, collected from - ‘Windows Logs > Security’ from the event-viewer.
Total system events This field represents the aggregated event logs from all the ‘compute assets,’ collected from - ‘Windows Logs’> System from the event-viewer.
Total application events This field represents the aggregated event logs from all the ‘compute assets,’ collected from - ‘Windows Logs’> Application from the event-viewer.
Table 4.7-2 Supported ‘Compute assets’
Operating System Type Server Operating System Workstation Operating System
Windows
Windows Server 2008 R2 Windows 7
Windows Server 2012 R1 & R2 Windows 8
Windows Server 2016 Windows 10
Windows Server 2019
Statistics:
Compute Asset dashboard tracks the health of ‘Compute assets’ in a site by measuring four performance metrics.
Table 4.7-3 Statistics layout of ‘Compute assets’ dashboard
Layout Options Description
Statistics
Top 10/Host CPU Usage This field displays the top 10 hosts whose CPU usage highest over the selected period.
Top 10/Host Memory Usage This field displays the top 10 hosts whose memory usage (RAM) is highest over the selected period.
Top 10/Host Disk Usage This field displays the top 10 hosts whose disk usage is highest over the selected period.
Top 10/Event log IDs This field aggregates the most common events that are occurring throughout the Site and displays the top 10 of them.

<Views and Layouts> 52
IM 43D07N10-01EN 6th Edition: Mar. 10, 2022-00
Event description:
In the Event description field, users can get information about:
① Top Event IDs
② Critical Event IDs
Table 4.7-4 Event description layout of ‘Compute asset’ dashboard
Layout Options Subfield Description
Event description
Top Event IDs
Event ID The ID of the event in event-viewer.
Event Summary Description of the event.
Count Number of times the event has occurred across in the selected sites.
Critical Event IDs
Event ID The ID of the event in event-viewer.
Event Summary Description of the event.
Criticality Impact of the event. It takes values of – High, Medium or Low.
Asset Compute asset which reported the event.
REFERENCE
To find the events that are classified as ‘critical’ in MSS, please refer to https://docs.microsoft.com/en-us/windows-server/identity/ad-ds/plan/appendix-l--events-to-monitor

<Views and Layouts> 53
IM 43D07N10-01EN 6th Edition: Mar. 10, 2022-00
PLC/DCS assets
From the dashboard menu in Center Component, click on the Overview submenu, and from the dashboard data table, click on ‘PLC/DCS Assets’ dashboard to navigate to the ‘PLC/DCS assets’ dashboard.
Figure 4.7-3 PLC/DCS assets dashboard
Just like the Compute asset dashboard, PLC/DCS assets Dashboard is an ‘operational dashboard’ that tracks the details of PLC/DCS assets in a site. Dashboard categorizes the data into three groups:
① Asset count
② Asset performance statistics
③ Assets requiring attention
PLC / DCS assets dashboard Time picker
Asset count
Asset performance statistics
Assets requiring attention

<Views and Layouts> 54
IM 43D07N10-01EN 6th Edition: Mar. 10, 2022-00
Asset count:
A total of six items are counted and displayed here. All six of these are asset-related,
Table 4.7-5 Asset count layout of ‘PLC/DCS assets’ dashboard
Layout Options Description
Asset count
Number of PLC/DCS assets
This field represents the total number of ‘PLC/DCS assets’ that are currently being monitored by the MSS System in the selected Site. The value of this field is the sum of all other assets next to it.
Number of Field Control Stations (FCS)
This field represents the total number of control assets that are currently being monitored by the MSS System in the selected Site.
Number of Safety Control Stations (SCS)
This field represents the total number of safety assets that are currently being monitored by the MSS System in the selected Site.
Number of Vnet Routers (AVR)
This field represents the total number of dedicated Vnet routers assets that are currently being monitored by the MSS System in the selected Site.
Number of Bus Converters (BCV)
This field represents the total number of dedicated Bus Converters that are currently being monitored by the MSS System in the selected Site.
Number of WAC Routers (WAC)
This field represents the total number of dedicated WAC routers assets that are currently being monitored by the MSS System in the selected Site.
Asset performance statistics:
Here, two Key metrics of PLC/DCS assets are currently actively tracked:
① Top 10 / Asset CPU Load
② Top 10 / Asset VNET Load
Table 4.7-6 Asset performance statistics layout of ‘PLC/DCS assets’ dashboard
Layout Options Description
Asset performance statistics
Top 10/Asset CPU Load
This field displays the top 10 assets whose CPU load is highest over the selected period.
Top 10/Asset VNET Load
This field displays the top 10 assets whose VNET load is highest over the selected period.
Assets requiring attention:
MSS notifies the engineers if a PLC/DCS assets require immediate attention by tracking the:
① ‘Top 10 / Assets with high error counter.’
② ‘Top 10 / Assets with high output temperature.’
③ ‘Top 10 / Assets with high battery temperature.’

<Views and Layouts> 55
IM 43D07N10-01EN 6th Edition: Mar. 10, 2022-00
Table 4.7-7 Asset requiring attention layout of ‘PLC/DCS assets’ dashboard
Layout Options Subfield Description
Assets requiring attention
‘Top 10 / Assets with high error counter.’
Name Asset requiring attention.
Count ECC count. If the value is ‘0’, the assets can be ignored.
‘Tope 10/ Assets with high output temperature.’
Name Asset requiring attention.
HKU Position Position of House Keeping Unit (Left/Right) in PLC/DCS asset
Temperature Exhaust temperature of PLC/DCS asset
‘Tope 10/ Assets with high battery temperature.’
Name Asset requiring attention.
HKU Position Position of House Keeping Unit (Left/Right) in PLC/DCS asset
Temperature Battery areas temperature of PLC/DCS asset

<Views and Layouts> 56
IM 43D07N10-01EN 6th Edition: Mar. 10, 2022-00
Field assets
From the dashboard menu in Center Component, click on the Overview submenu, and from the dashboard data table, click on ‘Fields Assets’ dashboard to navigate to the ‘Field assets’ dashboard.
Figure 4.7-4 Field assets dashboard
Field Assets Dashboard is also an ‘operational dashboard’ that tracks the details of Field Assets in a site.
Dashboard categorizes the data into three groups.
① Device count
② Device distribution
③ Device alarms
Field assets dashboard
Time picker
Device count
Device distribution
Device alarms

<Views and Layouts> 57
IM 43D07N10-01EN 6th Edition: Mar. 10, 2022-00
Device count:
A total of six items are counted and displayed. Three of these represent information related to field assets, and the other three, an asset’s status based on NAMUR NE 107 specifications:
Table 4.7-8 Device count layout of ‘Field assets’ dashboard
Layout Options Description
Device count
Number of field assets This field provides the total number of field assets from all the registered PRM’s with MSS in the Site.
Number of healthy assets This field provides the number of Field Assets which have reported a healthy status to PRM.
Assets requiring maintenance
This field provides the number of Field Assets which have reported a ‘Maintenance Required’ status to PRM.
Assets reporting errors This field provides the number of Field Assets which have reported an ‘Error’ status to the PRM file.
HART devices This field provides the total number of HART devices from all the registered PRM’s with MSS in the Site.
Foundation Fieldbus devices This field provides the total number of FF devices from all the registered PRM’s with MSS in the Site.
Device distribution:
This section represents the consolidated distribution of all the field devices at the organization level across various categories.
Table 4.7-9 Device distribution layout of ‘Field assets’ dashboard
Layout Options Description
Device distribution
NE107 Status Distribution based on NAMUR status.
Top 10/Locations Distribution based on the physical location of the asset (E.g.: Unit).
Top 10/Models Distribution based on the model of the asset.
Top 10/Categories Distribution based on the type of asset. E.g., valves, transmitter, flow meter.
Device alarms:
In this section, users can see ‘Top alarms’ and ‘Top critical alarms’:
Table 4.7-10 Device alarms layout of ‘Field assets’ dashboard.’
Layout Options Subfield Description
Device alarms
Top alarms
Alarm message Name of the alarm
Count
Number. of times, an alarm has occurred on the asset. Multiple alarms, with the same alarm count, are grouped. It contains alarms which are categorized as critical and medium.
Top critical alarms
Alarm message Name of the alarm.
Count Number. of times, a critical alarm has occurred on the asset. Multiple critical alarms, with the same alarm count, are grouped. It contains alarms which are categorized as critical.
SUPPLEMENT
The classification of an alarm as “critical” is done by PRM and not MSS

<Views and Layouts> 58
IM 43D07N10-01EN 6th Edition: Mar. 10, 2022-00
Network assets
From the dashboard menu in Center Component, click on the Overview submenu, and from the dashboard data table, click on ‘Network Assets’ dashboard to navigate to the ‘Network assets’ dashboard.
Figure 4.7-5 Network assets dashboard
Network assets Dashboard is an ‘operational dashboard’ that tracks the details of network assets and syslog statistics in a site.
Dashboard categorizes the data into four groups:
① Count
② Asset performance statistics
③ Syslog statistics
④ Important syslog events
Network assets dashboard Time Picker
Count
Assets performance statistics
Syslog statistics
Important syslog events

<Views and Layouts> 59
IM 43D07N10-01EN 6th Edition: Mar. 10, 2022-00
SUPPLEMENT
Syslog server is generally a standard logging server used by network devices to write and store their logs. MSS maintains an internal Syslog server, to which all the onboarded network assets sends their logs to. The dashboard displays information from these logs.
Count:
A total of six items are counted and displayed. Five of these are related to assets and the one of it are related to syslog:
Table 4.7-11 Device count layout of ‘Network assets’ dashboard
Layout Options Description
Asset count
Number of Network Assets This field provides the total number of network assets that are currently being monitored by the MSS System in the selected Site
Number of Firewalls This field represents the total number of ‘firewall assets’ that are currently being monitored by the MSS System in the selected Site.
Number of Routers This field represents the total number of physical/virtual ‘routers’ that are currently being monitored by the MSS System in the selected Site.
Number of Switches This field represents the total number of physical/virtual ‘switches’ that are currently being monitored by the MSS System in the selected Site.
Number of Timeservers This field represents the total number of physical/virtual ‘NTP/Time Servers’ that are currently being monitored by the MSS System in the selected Site.
Total syslog events This field represents the total number of syslog events that MSS internal syslog server has recorded from the onboarded network devices in the selected Site.
Asset Performance Statistics:
Network asset dashboard tracks the health of ‘Network assets’ in a site by measuring two performance metrics.
Table 4.7-12 Statistics layout of ‘Network assets’ dashboard
Layout Options Description
Statistics Top 10/Host CPU Usage
This field displays the top 10 hosts whose CPU usage is highest over the selected period.
Top 10/Host Memory Usage This field displays the top 10 hosts whose memory usage (RAM) is highest over the selected period.
Syslog Statistics:
The information sent by asset to syslog servers includes a facility code and severity level. The information is aggregated over the specified time period, categorized and displayed.
Table 4.7-13 Syslog Statistics layout of ‘Network assets’ dashboard
Layout Options Description
Syslog Statistics Syslog Facilities
A facility code is used to specify the type of program that is logging the message.
Syslog Severities Alert specifies the type of message/notification reported by the network asset.

<Views and Layouts> 60
IM 43D07N10-01EN 6th Edition: Mar. 10, 2022-00
Important Syslog events:
A synopsis of Syslog events, with severity of level of 0 (emergency), 1 (alert), 2(critical), 3 (error) are displayed over the selected period.
REFERENCE
For more details on Syslog facility and Syslog Severity, please refer to:
https://www.ietf.org/rfc/rfc3164.txt

<Views and Layouts> 61
IM 43D07N10-01EN 6th Edition: Mar. 10, 2022-00
Environmental assets
From the dashboard menu in Center component, click on the ‘Overview’ submenu, and from the dashboard data table, click on ‘Environmental Assets’ dashboard to navigate to the ‘Environmental assets’ dashboard.
Environmental assets dashboard is an ‘operational dashboard’ that provides the details of environmental assets site.
In the dashboard, the data is categorized into two groups:
① Counts & averages
② Performance graphs
Environmental assets dashboard
Time picker
Count and averages
Performance graphs

<Views and Layouts> 62
IM 43D07N10-01EN 6th Edition: Mar. 10, 2022-00
Figure 4.7-6 Environmental assets dashboard
Counts & averages:
This section displays various information about ODU’s, and the averages of their KPI’s, in a site
Table 4.7-14 Count and averages layout of ‘Environmental assets’ dashboard
Layout Options Description
Counts & averages
Number of Environmental Assets
This field provides the total number of ODU assets in the MSS Site.
Average Temperature (0C) Temperature value of all the ODU’s Averaged per device over the analysis period.
Average Humidity (%RH) Humidity value of all the ODU’s Averaged per device over the analysis period.
Average Isolation (Ohm) Isolation value of all the ODU’s Averaged per device over the analysis period.
Average Dust (mg/m3) Dust value of all the ODU’s Averaged per device over the analysis period.
Average Corrosion (pt.) Corrosion value of all the ODU’s Averaged per device over the analysis period.
Performance graphs:
The five important metrics (Temperature, Humidity, Isolation, Dust, Corrosion) related to the ODU’s are visualized as line charts here over a period. Performance of all the ODU’s in the given site over the selected period are visualized here.

<Views and Layouts> 63
IM 43D07N10-01EN 6th Edition: Mar. 10, 2022-00
Security applications
From the dashboard menu in Center Component, click on the Overview submenu, and from the dashboard data table, click on ‘Security Applications’ dashboard to navigate to the ‘Security applications’ dashboard.
Figure 4.7-7 Security applications dashboard
Security applications dashboard is an ‘operational dashboard’ that tracks the details of the third-party applications which are integrated with MSS in a site. Particularly WSUS and McAfee ePolicy orchestrator.
In the dashboard, the data about the two applications is categorized into three groups:
① Counts
② Performance statistics
③ Assets requiring attention
Security applications dashboard
Time picker
Counts
Performance Statistics
Assets requiring attention

<Views and Layouts> 64
IM 43D07N10-01EN 6th Edition: Mar. 10, 2022-00
Counts:
A total of six items are counted and displayed here. Out of them, three are related to ePolicy Orchestrator and the remaining three are WSUS related.
Table 4.7-15 Asset count layout of ‘Security Applications’ dashboard
Layout Application Type Options Description
Asset count
WSUS application
Number of WSUS applications
This field provides the total number of WSUS servers that are registered at Site.
Approved patches to be installed
All approved patches in WSUS servers that are pending for installation on the Client Workstations.
Approved critical patches to be installed
All critical patches approved in WSUS servers that are pending installation on the servers.
McAfee ePolicy orchestrator
Number of McAfee ePO applications
This field provides the total number of registered servers of McAfee ePO at the Site.
Number of McAfee ePO client threats
Number of client threats reported to McAfee ePO server.
Number of McAfee ePO client events
Number of client events recorded by McAfee ePO servers.
SUPPLEMENT
Client threats are malicious code, viruses and active contents etc. that are reported from a user’s workstation or OT assets to an ePO server.
Client event logs contain information about the status of installed products, and information on each client and tasks, which are configured on the System and product.
Performance statistics:
Here a total of four critical statistics related to patches and definition are displayed
Table 4.7-16 Asset performance statistics layout of ‘Security applications’ dashboard
Layout Application Type Options Description
Asset performance
statistics
WSUS application
Approved patches pending installation
This field displays the top 10 approved patches pending installation over the selected period. They are ranked based on count.
Computers missing patches
This field displays the top 10 Computers missing patches over the selected period. They are ranked based on number of missing patches on them.
McAfee ePolicy orchestrator
McAfee client threats
This field displays the top 10 McAfee Client threats over the selected period. They are ranked based on count.
McAfee definitions This field displays the top 10 McAfee Client definitions over the selected period. They are ranked based on count.
MSS notifies engineers about critical patches and client events that require urgent action by tracking the missing critical patches and McAfee Client events:

<Views and Layouts> 65
IM 43D07N10-01EN 6th Edition: Mar. 10, 2022-00
Assets requiring attention:
Table 4.7-17 Asset requiring attention layout of ‘Security applications’ dashboard
Layout Options Subfield Description
Assets requiring attention
Computers missing critical patches
Computer Name Asset missing critical patches.
Count Number of missing patches.
Critical McAfee client events
Event ID Name of the critical McAfee client event.
Threat Name Are malicious code, viruses and active contents etc.
Count Number of Client events.

<Views and Layouts> 66
IM 43D07N10-01EN 6th Edition: Mar. 10, 2022-00
Asset Management Applications
From the dashboard menu in Center Component, click on the Overview submenu, and from the dashboard data table, click on ‘Asset Management Applications’ dashboard to navigate to the ‘Asset Management applications’ dashboard.
Figure 4.7-8 Asset Management applications dashboard
This dashboard is also an ‘operational dashboard’ that tracks the details of Asset Management applications in a site.
Dashboard categorizes the data into four groups.
① Device & alarm count
② Unacknowledged alarm trend
③ Latest alarms and events
④ Authorization info
Latest alarms and events
Device and alarm count
Unacknowledged alarm trend
Authorization info

<Views and Layouts> 67
IM 43D07N10-01EN 6th Edition: Mar. 10, 2022-00
Device & alarm count:
A total of five items are counted and displayed. Three of these represent information related to onboarded PRM and the field assets monitored by the PRMs:
Table 4.7-18 Device count layout of ‘Asset Management applications’ dashboard
Layout Options Description
Device and alarm count
Number of Connected PRM Applications
Total number of PRM applications onboarded in Site Component over the specified date range
Total number of Field Devices
Total number of Field devices onboarded from PRM over the specified period from the onboarded PRMs
Total number of Unhealthy Field Devices
Total number of onboarded Field devices that had an unhealthy status over the specified period
Total number of Alarms Total number of alarms registered in the onboarded PRMs over the specified time
Total number of Unacknowledged Alarms
Total number of unacknowledged alarms registered in the onboarded PRMs over the specified time
Unacknowledged alarm trend:
Trend of unacknowledged alarms reported by field devices over a maximum period of two years.
This layout contains a line graph of Time period vs Unacknowledged alarm count.
Latest alarms and events:
Table 4.7-19 Latest alarms and events layout of 'Asset Management applications' dashboard
Layout Options Description
Latest alarms and events
PRM server events Contains log generated by PRM server locally in event logs.
Authorization info:
Displays two data tables related to users and their activities.
Table 4.7-20 Authorization info of ‘Asset Management applications’ dashboard
Layout Options Description
Authorization info
Latest Authentication and Audit Logs
PRM related activities performed by them on the server using PRM applications.
User List List of users registered in PRM application
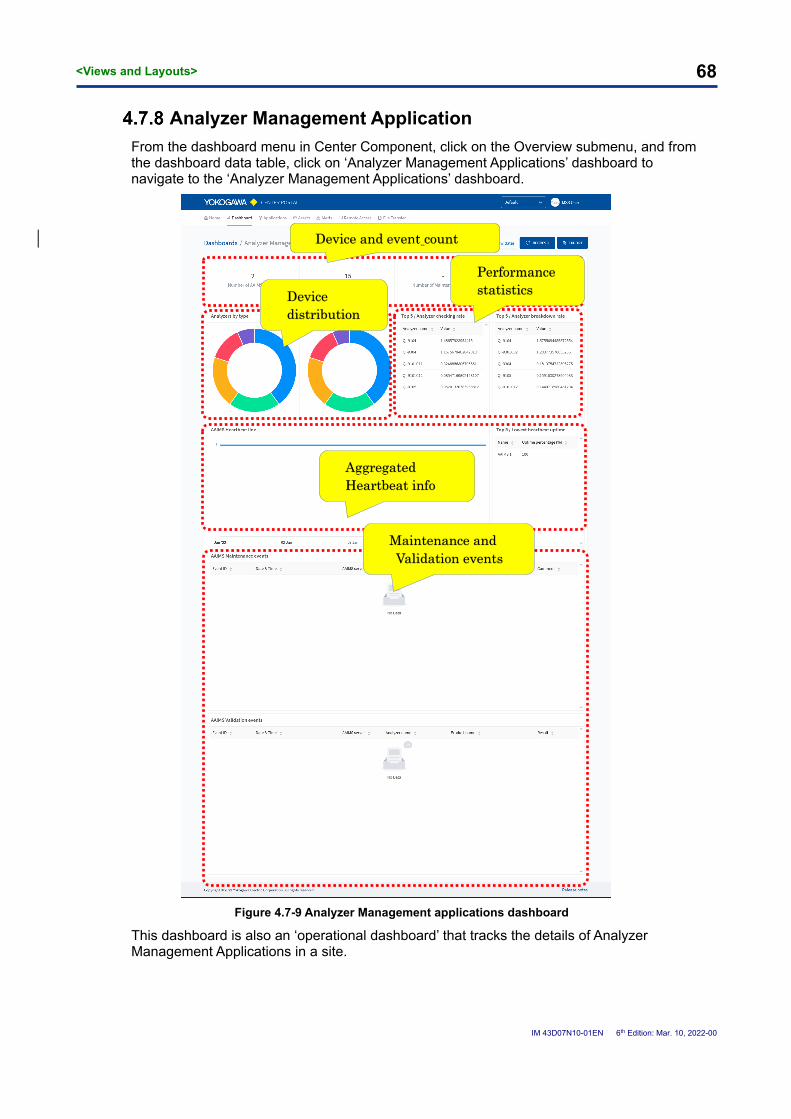
<Views and Layouts> 68
IM 43D07N10-01EN 6th Edition: Mar. 10, 2022-00
Analyzer Management Application
From the dashboard menu in Center Component, click on the Overview submenu, and from the dashboard data table, click on ‘Analyzer Management Applications’ dashboard to navigate to the ‘Analyzer Management Applications’ dashboard.
Figure 4.7-9 Analyzer Management applications dashboard
This dashboard is also an ‘operational dashboard’ that tracks the details of Analyzer Management Applications in a site.
Device and event count
Device distribution
Performance statistics
Aggregated Heartbeat info
Maintenance and Validation events

<Views and Layouts> 69
IM 43D07N10-01EN 6th Edition: Mar. 10, 2022-00
Dashboard categorizes the data into five groups.
① Device & event count.
② Device distribution.
③ Performance statistics.
④ Maintenance and Validation events.
⑤ Aggregated heartbeat info.
Device & event count:
A total of four items are counted and displayed. Two of these represent information related to onboarded AAIMS and the analyzers monitored by the AAIMS.
Table 4.7-21 Device count layout of ‘Analyzer management application’ dashboard
Layout Options Description
Device and event count
Number of AAIMS servers Total number of AAIMS applications onboarded in the Site Component of MSS
Number of Analyzers Sum of all the analyzers managed by all the onboarded AAIMS server
Number of Maintenance events
Total number of maintenance events reported by all the analyzers over the specified period
Number of Validation events Total number of validation events reported by all the analyzers over the specified period
Device distribution:
This section represents the consolidated distribution of all the Analyzers from the onboarded AAIMS servers.
Table 4.7-22 Device distribution layout of ‘Analyzer management application dashboard
Layout Options Description
Device distribution By type Distribution based on type of Analyzer. E.g.: Density, Conductivity etc.
By model Distribution based on model of analyzer.
Performance statistics:
Here, two key metrics of Analyzers are currently actively tracked:
① Top 5 / Analyzer checking rate.
② Top 5 / Analyzer breakdown rate.
Table 4.7-23 Asset performance statistics layout of ‘Analyzer management application’ dashboard
Layout Options Description
Performance statistics
Top 5 / Analyzer checking rate
This field displays the top 5 Analyzers based on their checking rate.
Top 5 / Analyzer breakdown rate
This field displays the top 5 Analyzers based on their breakdown rate.
Maintenance and validation events:
Users can get information about events that occurred on individual analyzers. They can see:
① Maintenance events.
② Validation events.

<Views and Layouts> 70
IM 43D07N10-01EN 6th Edition: Mar. 10, 2022-00
Table 4.7-24 Maintenance and validation events of ‘Analyzer management applications’ dashboard
Layout Options Subfield Description
Maintenance & Validation events
Maintenance events
Event ID The ID of the event in event-viewer.
Date & Time Time of the event
AAIMS server Onboarded AAIMS server
Analyzer name Device that reported the event
Event name Name of the event
Comment Description of the event
Validation events
Event ID The ID of the event in event-viewer.
Date & Time Description of the event.
AAIMS server Onboarded AAIMS server
Analyzer name Device that reported the event
Product name Source of the event
Result Result of validation
Aggregated heartbeat info:
This section contains:
a line chart which contains aggregated heartbeat information from all the onboarded applications over the specified time.
Top 5 devices which had the Lowest heartbeat uptime percentage.
Table 4.7-25 Aggregated heartbeat info of Analyzer management events
Layout Options Subfield Description
Aggregated heartbeat info
AAIMS heartbeat line
Line Chart The transition of the uptime percentage of all devices
Top 5 / Lowest heartbeat uptime
Name Name of the AAIMS application
Uptime percentage (%)
The uptime %age of the device

<Views and Layouts> 71
IM 43D07N10-01EN 6th Edition: Mar. 10, 2022-00
Dynamic dashboards
A Dynamic dashboard can be accessed in two ways.
① By navigating to Dashboard > Overview and clicking on the dashboard, or
② If the dashboard is favorited, it will be available as submenu and can be clicked.
Figure 4.7-10 Dynamic dashboard in MSS
Users can add new charts to the dashboard by clicking on ‘Edit’ button and selecting ‘+ Add’ button. They can select various types of charts against various types of datasets.
Figure 4.7-11 Dashboard widgets in MSS
Please refer to Chapter 10. Dynamic dashboard for more details on Dynamic dashboards.

<Views and Layouts> 72
IM 43D07N10-01EN 6th Edition: Mar. 10, 2022-00
4.8 Security applications
This section describes ‘Security applications’ in MSS. The ‘Security applications’ menu is available in both Site and Center components.
As discussed in Chapter 2.5 Applications, there are two Security related applications supported by R1.5:
① McAfee ePO application
② WSUS
In Site component from the menu navigate to Application > Security applications. Click on the asset to navigate to detailed view:
Figure 4.8-1 Navigating to Security applications
SUPPLEMENT
MSS maintains a local instance of these applications within itself. It is possible to integrate MSS internal applications with existing IT and OT applications by configuring Parent-Child relationships. For such configuration, please contact Yokogawa.

<Views and Layouts> 73
IM 43D07N10-01EN 6th Edition: Mar. 10, 2022-00
Site-view
Both the applications in Site, have four sub-menus.
① Asset settings
It provides information about the application.
② Monitor settings
Monitor related to the application.
③ Collection settings
It allows the user to view and configure the data collected from the application
④ Remote settings
It allows the user to manage remote profiles. Remote profiles contain configuration information that are used by MSS when initiating a remote connection to an asset.
Figure 4.8-2 Application submenu for Security applications

<Views and Layouts> 74
IM 43D07N10-01EN 6th Edition: Mar. 10, 2022-00
4.8.1.1 McAfee ePolicy Orchestrator
The latest anti-Virus definition files will be downloaded from Yokogawa NOC McAfee sources periodically. The definitions will be downloaded through the McAfee ePolicy Orchestrator server in MSS Center.
With ePO applications, Process Control Domain (PCD) hosts will be able to connect directly to the McAfee ePolicy Orchestrator in the MSS Site environment. After the configuration of the McAfee Endpoint Security clients will receive policies and definitions files from the McAfee ePolicy Orchestrator in the MSS Site setup.
Optionally, it is possible to deploy a dedicated McAfee ePolicy Orchestrator server in the PCD. The McAfee ePolicy Orchestrator server can be configured with the same or different configurations and policies as the MSS Site McAfee ePolicy Orchestrator. New anti-virus definitions are downloaded from the McAfee ePolicy Orchestrator in the MSS Site Setup. All McAfee Endpoint Security clients receive policies and definitions files from the McAfee ePolicy Orchestrator in the PCD.
Figure 4.8-3 ePO Deployment patterns in MSS
Through the McAfee ePolicy Orchestrator, all McAfee Endpoint Security clients receive their policies and definitions files for protecting their host against viruses and malware. A preconfigured task contains all settings for security and performance of the McAfee Endpoint Security client.
A McAfee ePolicy Orchestrator collects data through published API.
Navigate to Security application in Site Component from the Security applications list view:

<Views and Layouts> 75
IM 43D07N10-01EN 6th Edition: Mar. 10, 2022-00
Figure 4.8-4 Site component - Security application list-view
Asset settings:
Asset settings is the default view that loads on navigating to Security applications. In the Asset settings screen, users can:
① View and modify the provided information during Application Onboarding.
② Stop the collection of data by deleting the asset from the MSS site.
③ Change the credentials used to collect data from the application.
④ Set Operational status of the application.

<Views and Layouts> 76
IM 43D07N10-01EN 6th Edition: Mar. 10, 2022-00
Figure 4.8-5 Asset settings of McAfee ePolicy Orchestrator
The asset related fields available for view and modification are:
Table 4.8-1 Application information of a McAfee ePolicy Orchestrator*
Field Name Description
Application Name A label that allows users to identify the asset. MSS allows duplicate registration of names.
Role Application’s functionality. E.g., Security, Patching….
Custodian A registered MSS user. Someone who is responsible for the asset.
IP Address Application’s IP address.
Priority Importance of the asset.
Location The physical location of the asset. E.g.: building name or room name etc.
Description General information about the asset.
McAfee ePO API URL The URL, which is exposed by the McAfee ePO application. At the end of the URL, specify the port 8553
*Field information excluding any custom fields
Asset settings
Last updated
Delete asset Connect to asset
Operational status

<Views and Layouts> 77
IM 43D07N10-01EN 6th Edition: Mar. 10, 2022-00
CAUTION
The username and password used in McAfee ePO connection settings is that of application and not the server/asset.
CAUTION
For an application behind load balancer, one should pay attention to the IP address and the Application ePO API URL that is used. If the application load balancer’s IP is used in the IP address field, Remote connection might connect to same server or might not even work. In such scenarios, it is recommended to populate the IP of one of the application servers behind the load balancer in for a seamless remote access experience.
Monitor settings:
For details related to monitor, refer to Chapter 7.2.1 Monitors.
Figure 4.8-6 Monitor settings of McAfee ePO applications
Available monitors are:
Table 4.8-2 Monitors of McAfee ePO applications
Monitors
Client threats
Client management status
Client content version
Client product version
Client on access scan status
Client access protection status
Client last full scan date
Client events
Server audit logs

<Views and Layouts> 78
IM 43D07N10-01EN 6th Edition: Mar. 10, 2022-00
Collection settings:
In the Collection Settings screen, users can see all the data parameters that are available for collection by MSS.
Figure 4.8-7 Collection settings of McAfee ePolicy Orchestrator
The purpose of this screen is to view or configure the data collection parameter. Above Figure 4.8-7 Collection settings of McAfee ePolicy Orchestrator represents how to view and configure the parameters of the data collection.
Users can manage/collect the following data parameters of a McAfee ePolicy Orchestrator.
Table 4.8-3 Data collection parameters of McAfee ePolicy Orchestrator
Collection Type
Field Name Description
Inventory Agents
McAfee Agent is the client-side component that provides secure communication between McAfee ePolicy Orchestrator (McAfee ePO) and managed products.
Installed Products Details of the enterprise products available for installation.
Metrics
Product Agent The McAfee Agent is the distributed component of McAfee ePolicy Orchestrator (McAfee ePO).
Product Endpoint Security Platform
An endpoint protection platform (EPP) is an integrated suite of endpoint protection technologies—such as antivirus, data encryption, intrusion prevention, and data loss prevention—that detects and stops a variety of threats at the endpoint.
Product Endpoint Security Threat Prevention
Threat Prevention uses the content files packaged with the product to provide general security for your environment.
Product VirusScan Enterprise VirusScan Enterprise offers easily scalable protection, fast performance, and a mobile design to protect your environment from the following:
Collection settings

<Views and Layouts> 79
IM 43D07N10-01EN 6th Edition: Mar. 10, 2022-00
Viruses, worms and Trojan horses Access point violations and exploited buffer
overflows Potentially unwanted code and programs
Logs
Client Threats Client threats are malicious data (virus, logic bomb, worm) etc.
Client Events Client Event logs instead contain Information about the status of installed product information for each client and Tasks which are configured for the System and product.
Server Audit Logs Audit log has records providing information about who has accessed the system and what operations he or she has performed during a given period.
Operational status
Heartbeat MSS communication status with the ePO application
Individual collector collects the following data.
Table 4.8-4 Parameters collected from Inventory Collection
Collector Field Name Field Name Field Name Field Name
Agents
system_name system_serial_number last_communication agent_version
agent_hotfix_patch_version ip_address Tags managed_state
agent_guid
Installed Products
system_name system_serial_number family_disp_name product_version
node_name
Table 4.8-5 Parameters collected from Metrics Collection
Collector Field Name Field Name Field Name Field Name
Product Agent
system_name system_serial_number
agent_guid node_name
family_disp_name product_version hotfix product_version_
epoagent
language pestatus pcstatus enabled
dns_name last_known_tcpip epo_version
Product Endpoint Security Platform
system_name system_serial_number
agent_guid node_name
family_disp_name product_version language product_version_ endpointsecurityplatform
is_ap_client_debug_ logging_enabled
ap_event_filterlevel is_atp_client_debug_ logging_enabled
atp_event_filterlevel
is_client_activity_ logging_enabled
client_activity_log_ size_mb
client_debug_log_ size_mb
client_log_files_location
client_ui_access_level hotfix patch is_bo_client_debug_ logging_enabled
bo_event_filterlevel is_fw_client_debug_ logging_enabled
fw_event_filterlevel global_exclusion_ status
license_status is_ods_scanned_ file_logging_enabled
gti_proxy_type is_oas_client_debug_ logging_enabled
oas_event_filterlevel ods_event_filterlevel is_ods_client_debug_ logging_enabled
sp_additional_ compliance_status
s_pb_compliance_status is_sp_enabled sp_compliance_status is_send_events_toepo _enabled
engine_version is_time_based_ password_enabled
ui_password_changed
is_wp_client_debug_ logging_enabled
wp_event_filterlevel is_windows_application_ logging_enabled

<Views and Layouts> 80
IM 43D07N10-01EN 6th Edition: Mar. 10, 2022-00
Product Endpoint Security Threat Prevention
system_name system_serial_number
agent_guid node_name
family_disp_name product_version language product_version_ threatprevention
ap_additional_ compliance_status
a_pb_compliance_status
b_ap_enabled ap_compliance_status
avcmgr_additional_ compliance_status
avcm_compliance_days
avcmg_rb_compliance _status
am_core_content_date
avcmgr_compliance _status
content_version engine_version scan_using_amsi_hooks
enable_amsi_ observe_mode
tpamsi_supported_status
tpamsi_supported_ status_reason
v2_dat_version
bo_additional_ compliance_status
b_ob_compliance_status
exploit_prevention_ content_created
exploit_prevention_ content_version
b_bo_enabled bo_compliance_status
license_status sz_extra_dat_names
oas_additional_ compliance_status
oa_sb_compliance_status
b_oas_enabled oasgti_level
oas_compliance_status
ods_last_full_scan_date
ods_full_scan_gti_level
ods_full_average_ scan_duration
ods_last_quick_scan_date
ods_quick_average_ scan_duration
ods_quick_scan_gti_level
ods_additional_ compliance_status
od_sb_compliance_status
ods_compliance_status
ods_right_click_scan_gti level
ss_additional_ compliance_status
s_sb_compliance_status
ss_compliance_status b_script_scan_ enabled
hotfix
patch
Table 4.8-6 Parameters collected from Logs Collection
Collector Field Name Field Name Field Name Field Name
Client Threats
system_name system_serial_number
event_generated_time
node_name
event_time_local target_host_name threat_name threat_action_taken
event_id received_utc threat_handled threat_severity
threat_type agent_guid source_host_name source_ipv4
source_ipv6 source_mac source_url source_process_na
me
source_user_name source_file_name target_ipv4 target_ipv6
target_mac target_protocol target_port target_process_nam
e
target_user_name threat_category analyzer_engine_version
analyzer_detection_method
analyzer_dat_version
Client Events
system_name system_serial_number
event_generated_time
event_received_time
event_id event_severity event_version event_type
event_name
Server Audit Logs
user_name cmd_name success start_time
message Priority

<Views and Layouts> 81
IM 43D07N10-01EN 6th Edition: Mar. 10, 2022-00
Table 4.8-7 Parameters collected from Operational status Collection
Collector Field Name Field Name Field Name Field Name
Heartbeat ip_adress state reason heartbeat_type
protocol port_state port
Remote settings:
In ‘Remote settings’ page, users can create and manage an MSS remote access profile, which is essential in connecting to the McAfee ePO application.
Figure 4.8-8 Remote settings of ePolicy Orchestrator
For more details, please refer to Chapter 6. Remote Operations
Remote settings
Add remote access profile

<Views and Layouts> 82
IM 43D07N10-01EN 6th Edition: Mar. 10, 2022-00
4.8.1.2 Windows Server Update Services
PCD hosts can directly join the corresponding WSUS group on the MSS Site WSUS server. After this the PCD hosts will receive the applicable MS updates.
Optionally a secondary site specific WSUS server can be placed between the MSS Site setup and the PCD hosts. In this setup the secondary site specific WSUS server will first receive the updates from the MSS Site setup before the patches are distributed to the PCD hosts.
Most of the PCD host are running critical applications, which may only be switched off at a confirmed moment therefore WSUS will not automatically install the patches, it will only distribute the patches to each applicable host. The actual responsibility to install the patches is a site responsibility, which might be subcontracted to the MAC vendor.
Asset settings:
Asset settings is the default view that loads when navigated to the detailed view.
In the Asset settings screen, users can
① View and modify the provided information during Application Onboarding.
② Stop the collection of data by removing the application from the MSS site.
③ Change the credentials used to collect data from the asset.
④ Set Operational status of the asset.

<Views and Layouts> 83
IM 43D07N10-01EN 6th Edition: Mar. 10, 2022-00
Figure 4.8-9 Asset settings of WSUS
The asset related fields available for view and modification are:
Table 4.8-8 Application information of a WSUS application*
Field Name Description
Application Name A label that allows users to identify the asset. MSS allows duplicate registration of names.
Role Application’s functionality. E.g., Security, patching ….
Custodian A registered MSS user. Someone who is responsible for the asset.
IP Address Asset’s IP address.
Priority Importance of the asset.
Location The physical location of the asset. E.g.: building name or room name etc.
Description General information about the asset.
WSUS Database IP IP address of WSUS Database or Database cluster.
WSUS Database Port Port of WSUS over which SQL queries can be executed.
*Field information excluding any custom fields
CAUTION
The username and password used in Connection settings is that of application and not the server/asset.
Asset settings
Last updated
Delete asset
Connect to asset
Operational status

<Views and Layouts> 84
IM 43D07N10-01EN 6th Edition: Mar. 10, 2022-00
Monitor Settings
For details related to monitor, refer to Chapter 7.2.1 Monitors.
Figure 4.8-10 Monitor settings of Microsoft WSUS application
Available monitors are:
Table 4.8-9 Monitors of Microsoft WSUS application
Monitors
Server synchronization state
Server critical events
Client synchronization state
Client non installed approved updates
Client non installed critical approved updates

<Views and Layouts> 85
IM 43D07N10-01EN 6th Edition: Mar. 10, 2022-00
Collection settings:
In the Collection Settings screen, users can see all the data parameters that are available for collection by MSS.
Figure 4.8-11 Collection settings of WSUS
The purpose of this screen is to view or configure the collection data collection parameter.
Users can manage/collect the following data parameters from a WSUS.
Table 4.8-10 Data collection parameters of WSUS
Collection Type Field Name Description
Inventory Computer Servers and workstations managed by WSUS application.
Groups User-defined collections of Computer Groups.
Memberships Membership information of manages systems on WSUS.
Patches Available patches on WSUS.
Applicable Patches Applicable patches on WSUS.
Metrics Download status The download status of the Windows Patches.
Missing patches per computer Information about missing patches per computer.
Logs Events Event logs on WSUS application.
Operational status Heartbeat MSS communication status with WSUS application
Collection settings
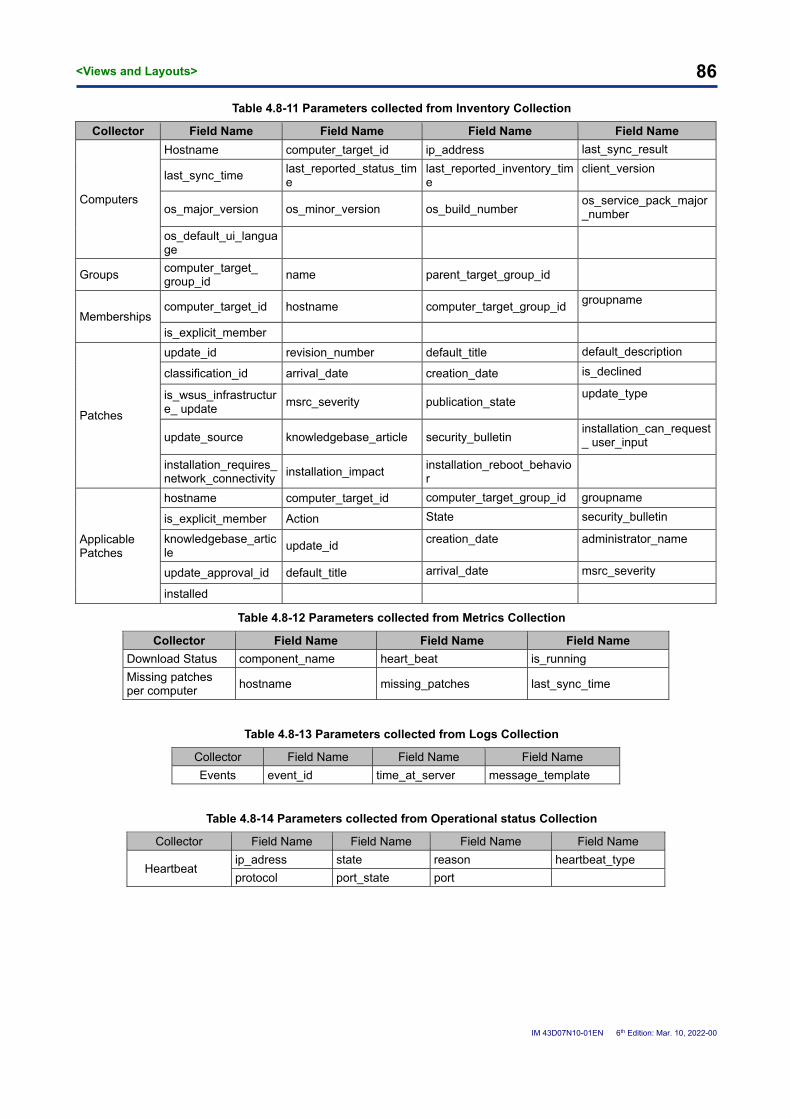
<Views and Layouts> 86
IM 43D07N10-01EN 6th Edition: Mar. 10, 2022-00
Table 4.8-11 Parameters collected from Inventory Collection
Collector Field Name Field Name Field Name Field Name
Computers
Hostname computer_target_id ip_address last_sync_result
last_sync_time last_reported_status_time
last_reported_inventory_time
client_version
os_major_version os_minor_version os_build_number os_service_pack_major _number
os_default_ui_language
Groups computer_target_ group_id
name parent_target_group_id
Memberships computer_target_id hostname computer_target_group_id
groupname
is_explicit_member
Patches
update_id revision_number default_title default_description
classification_id arrival_date creation_date is_declined
is_wsus_infrastructure_ update
msrc_severity publication_state update_type
update_source knowledgebase_article security_bulletin installation_can_request_ user_input
installation_requires_ network_connectivity
installation_impact installation_reboot_behavior
Applicable Patches
hostname computer_target_id computer_target_group_id groupname
is_explicit_member Action State security_bulletin
knowledgebase_article
update_id creation_date administrator_name
update_approval_id default_title arrival_date msrc_severity
installed
Table 4.8-12 Parameters collected from Metrics Collection
Collector Field Name Field Name Field Name
Download Status component_name heart_beat is_running
Missing patches per computer
hostname missing_patches last_sync_time
Table 4.8-13 Parameters collected from Logs Collection
Collector Field Name Field Name Field Name
Events event_id time_at_server message_template
Table 4.8-14 Parameters collected from Operational status Collection
Collector Field Name Field Name Field Name Field Name
Heartbeat ip_adress state reason heartbeat_type
protocol port_state port

<Views and Layouts> 87
IM 43D07N10-01EN 6th Edition: Mar. 10, 2022-00
Remote settings:
In the ‘Remote settings’ page, users can create and manage an MSS remote access profile, which is essential in connecting to the WSUS server.
Figure 4.8-12 Remote settings of WSUS
For more details, please refer to Chapter 6. Remote Operations
Remote settings
Add remote access profile

<Views and Layouts> 88
IM 43D07N10-01EN 6th Edition: Mar. 10, 2022-00
Center-view
4.8.2.1 McAfee ePolicy Orchestrator
The McAfee ePolicy Orchestrator in the MSS Center will be the primary server for all policies and configuration changes. The MSS Center McAfee ePolicy Orchestrator is connected to the Yokogawa SOC McAfee source for downloading the latest definitions files.
After Onboarding an ‘ePO Asset,’ users can monitor it remotely from MSS’s Center component through navigating to ‘Security Applications View.’
Figure 4.8-13 McAfee ePolicy Orchestrator - Navigating to ePO application in Center

<Views and Layouts> 89
IM 43D07N10-01EN 6th Edition: Mar. 10, 2022-00
Figure 4.8-14 Center-view of McAfee ePO application
The McAfee ePO application in the Center component contains five sub-menus.
Table 4.8-15 Property overview of McAfee ePO application in Center component
Group Property Contains
Application information
Overview Application information and key metrics.
Clients Servers/workstations managed by ePO application
Threats Threats reported for clients
Clients Events Events logged at threats
Server Events Events logged at Client events
Interactive view

<Views and Layouts> 90
IM 43D07N10-01EN 6th Edition: Mar. 10, 2022-00
Overview:
The overview provides a helpful snapshot of the McAfee ePO application immediately.
Figure 4.8-15 Overview of McAfee ePO application
The metrics summary shows the following values
Table 4.8-16 Overview of McAfee ePO application
Info Type Field Name Description
Heartbeat Uptime Percentage of time MSS was able to successfully communicate with the application
Overview
VirusScan Enterprise Content Coverage of McAfee Scan results.
Endpoint Security Threat Protection Coverage of Endpoint Security Threat Protection.
Threats last 24 hours Threats registered by McAfee in past 24 hrs.
Threats last 7 days Threats registered by McAfee in past 7 days.
Data summary
Name Name of the asset
Priority Priority of the asset set in Site component
Category Type of Security application
Custodian Custodian of the asset
Overview
Data summary

<Views and Layouts> 91
IM 43D07N10-01EN 6th Edition: Mar. 10, 2022-00
Clients:
MacAfee ePO distributes antivirus software to servers through an ePO agent. An ePO agent is installed on servers/workstations and the ePO server distributes security updates by communicating with the agent.
In the McAfee Client view, MSS users can see the servers/workstations managed by the ePO application and the following information.
Figure 4.8-16 Clients managed by McAfee ePO application
Table 4.8-17 McAfee Client information in MSS Center Component
Row Type Name Description
Main
System name Name of Server/Workstation monitored by the ePO Application
Status Information on nature of relationship between ePO application and Server/Workstation. Whether system is configured to be directly ‘managed’ by ePO or if the system is a ‘Standalone’ configuration.
Tags Tags specified on the ePO application for logical grouping.
IP Address IP address of the Server/Workstation
Last Communication
Timestamp of last communication received from ePO agent to ePO server
Sub Installed Products
Software agents related to ePO application installed on the server/workstation
Product Version Version of the installed Software
Clients

<Views and Layouts> 92
IM 43D07N10-01EN 6th Edition: Mar. 10, 2022-00
Threats: The McAfee ePO agent also scans the server/workstation on which it is installed in, for harmful threats such as viruses and known vulnerabilities. If it finds any, it reports them back to ePO application. Such threats reported to ePO application can be visualized in the ‘Threats sub-menu’.
The reported events are stored chronologically. You can specify a time period and get the list of threats reported over.
Figure 4.8-17 Threats reported by Clients to McAfee ePO application in Center Component
Table 4.8-18 Threat information registered in McAfee ePO application in Center Component
# Name Description
1. Date and time Timestamp of the threat registered on ePO application
2 System name Name of Server/Workstation that reported the threat
3. Threat type Type/class of threat as determined by McAfee ePO application
4. Threat name Name of the threat
5. Threat handled Specifies if the action taken by ePO application on threat was successful

<Views and Layouts> 93
IM 43D07N10-01EN 6th Edition: Mar. 10, 2022-00
Client Events: Any action to change or execute a file or program on a protected system causes Application Control to prevent the action and generate a corresponding event on the endpoint. When using the software in a standalone environment, you can review the event list using McAfee Agent.
All events for managed systems are sent to the McAfee ePO server. You can review and manage the generated events to monitor the status of the managed endpoints. Events are generated by the managed products, such as Endpoint Security (ENS), and passed to the McAfee Agent.
Solid core Events severity is classified as Info, Minor, Warning, Major, Critical, and Fatal. This classification is done based on the McAfee ePO common threat event severity, numbered from 1-7.
Figure 4.8-18 Client events in McAfee ePO application in Center Component
Table 4.8-19 Client events in McAfee ePO application in Center Component
# Name Description
1. Date and time Timestamp of the event registered on ePO application
2 System name Name of Server/Workstation that reported to ePO Server
3. Event type Type of the event that was generated on the client.
4. Event name Name of the event
5. Content version McAfee Agent Definition file/version
REFERENCE
To know more about events, refer to https://docs.mcafee.com/bundle/application-control-8.2.0-product-guide-windows/page/GUID-811E2477-4830-4A6B-8F19-DBE96007C5F6.html and for event-type, refer to https://docs.mcafee.com/bundle/application-control-8.2.0-product-guide-windows/page/GUID-70A19635-96CC-461C-A1F1-2E9D48CCEF1B.html

<Views and Layouts> 94
IM 43D07N10-01EN 6th Edition: Mar. 10, 2022-00
Server Events: Server events refer to windows events that occur on the Server on which ePO application is installed. MSS users can specify the time period and see the events occurred on the server.
Figure 4.8-19 Server events of McAfee ePO application in Center Component
Table 4.8-20 Server events in McAfee ePO application in Center Component
# Name Description
1. Date and time Timestamp of the event that occurred on ePO application server
2 User The user account that caused/triggered the event
3. Action The action performed on the system
4. Success Information about the Action, if it was successful or not
5. Event Message Description of the event

<Views and Layouts> 95
IM 43D07N10-01EN 6th Edition: Mar. 10, 2022-00
4.8.2.2 Windows Server Update Service
After Onboarding an WSUS application, users can monitor it remotely from MSS’s Center component through navigating to ‘Security Applications View.’
Figure 4.8-20 Center-view of WSUS application
The WSUS in the Center component contains only four sub-menus categorized into four groups.
Table 4.8-21 Submenus of WSUS application
Group Property Contains
Application information Overview Application information and key metrics.
Update Catalogue Updates List of patches available for installation or update.
List of Windows Computer Computers List of Computers managed by WSUS.
Events Server events Events on WSUS server related to WSUS activities
Interactive view WSUS application sub-menu

<Views and Layouts> 96
IM 43D07N10-01EN 6th Edition: Mar. 10, 2022-00
Overview:
The overview provides a helpful snapshot of the WSUS application immediately.
Figure 4.8-21 Overview of WSUS application
The metrics summary shows the following values
Table 4.8-22 Overview of WSUS application
Info Type Field Name Description
Heartbeat Uptime Percentage of time MSS was able to successfully communicate with the application
Overview
Computer Sync Status Sync status of ‘WSUS managed computers’ with WSUS application.
Approved Update Status Ration of available updates to approved updates.
Server Events Server events occurring on the WSUS related to patch activities.
Synchronization status Synchronization status of WSUS with MSS.
Data summary
Name Name of the asset
Priority Priority of the asset set in Site component
Category Type of Security application
Custodian Custodian of the asset
Data summary
Overview

<Views and Layouts> 97
IM 43D07N10-01EN 6th Edition: Mar. 10, 2022-00
Updates:
The Updates contains all available Windows updates from Microsoft provides a helpful snapshot of the WSUS application immediately.
Figure 4.8-22 Updates of WSUS application
Patch Type is used to filter on ‘only Security updates.’
The updates table consists of the following columns
Table 4.8-23 Patch Details available in WSUS
Row Type Field Name Description
Main
Title Name of the available update.
Classification Categorization of available update – Critical, Definition, etc.
KB Article Knowledge base article ID associated with the released update.
Bulletin Associated bulletin. Security bulletins are a way for users to know about security vulnerabilities, remediation strategies, and applicable updates for the affected software. The vendor publishes these.
Arrival date Date and time the update reached your WSUS Server.
Sub
Computer Name of the computer as registered in WSUS
Group Groups defined in WSUS server
Approval State Approval status of the update on the computer
Status Installation status of the update on the computer
Every update is expanded further to find a list of computers that show the status of the installation status.
Updates Patch Type Released Update

<Views and Layouts> 98
IM 43D07N10-01EN 6th Edition: Mar. 10, 2022-00
Computers:
Computers contain a list of computers that are managed by the WSUS server.
Figure 4.8-23 Computers of WSUS application
Table 4.8-24 Computers served by WSUS
Row Type Field Name Description
Main
Computers Name of the Computer
Sync status Sync between WSUS and WSUS client in Windows Server
Client version OS version of the Computer
Language Default Language of the Operating System
IP address IP Address of the Computer
Last communication Timestamp of last sync between WSUS and the computer
Sub
Update Knowledge base article ID associated with the released update.
Group Computer groups as defined in WSUS server
Bulletin Associated bulletin. Security bulletins are a way for users to know about security vulnerabilities, remediation strategies, and applicable updates for the affected software. The vendor publishes these.
Severity Severity of the patch
Approval State Approval status of the patch to be installed in the computer
Status Installation status of the update on the computer
Arrival Date Timestamp of the patch when it was downloaded to WSUS
On toggling computers drop-down, users can see a list of ‘Computer groups’ that are in Windows Service Update Server.
Computers Computer dropdown

<Views and Layouts> 99
IM 43D07N10-01EN 6th Edition: Mar. 10, 2022-00
Figure 4.8-24 Types of Computers in WSUS application
Server events:
Server events contain a Patch related events that occurred on the WSUS server over a time period.
Figure 4.8-25 Server events of WSUS application

<Views and Layouts> 100
IM 43D07N10-01EN 6th Edition: Mar. 10, 2022-00
Table 4.8-25 Server events on WSUS
Field Name Description
Date & Time Date and time of the event published
Event ID ID of the event related to WSUS
Event Message Title of the Event reported

<Views and Layouts> 101
IM 43D07N10-01EN 6th Edition: Mar. 10, 2022-00
4.9 Control applications
This section describes ‘Control applications’ in MSS. The ‘Control applications’ menu is available in both Site and Center components.
As discussed in Chapter 2.5 Applications, there is one asset management related applications supported by R1.5:
① Yokogawa Centum VP
In Site component from the menu navigate to Applications > Control applications. Click on the asset to navigate to detailed view:
Figure 4.9-1 Navigating to Control applications

<Views and Layouts> 102
IM 43D07N10-01EN 6th Edition: Mar. 10, 2022-00
Site-view
The applications in Site, have four sub-menus.
① Asset settings
It provides information about the application.
② Monitor settings
Monitor related to the application.
③ Collection settings
It allows the user to view and configure the data collection parameter from the application.
④ Remote settings
It allows the user to manage remote profiles. Remote profiles contain configuration information that are used by MSS when initiating a remote connection to an asset.
Figure 4.9-2 Applications submenu for Control applications

<2. Before Use> 103
IM 43D07N10-01EN 6th Edition: Mar. 10, 2022-00
4.9.1.1 Yokogawa Centum VP
Data of Centum VP is collected from HIS.
Figure 4.9-3 Data Collection architecture from CENTUM VP
Both Control applications and PLC/DCS assets collect data from FCS and SCS. Through PLC/DCS assets, MSS collects data related to hardware from HIS, while as from Control applications, it collects data related to a CENTUM Project.
Supplement
When registering a Control Application, it is recommended to register only the ‘representative HIS’ (HIS used to collect data) of a CENTUM project to avoid duplication of data.
Asset settings:
In the Asset settings screen, users can:
① View and modify the provided information during Application Onboarding.
② Stop the collection of data by removing the application from the MSS site.
③ Modify the Operational status of the asset/application.
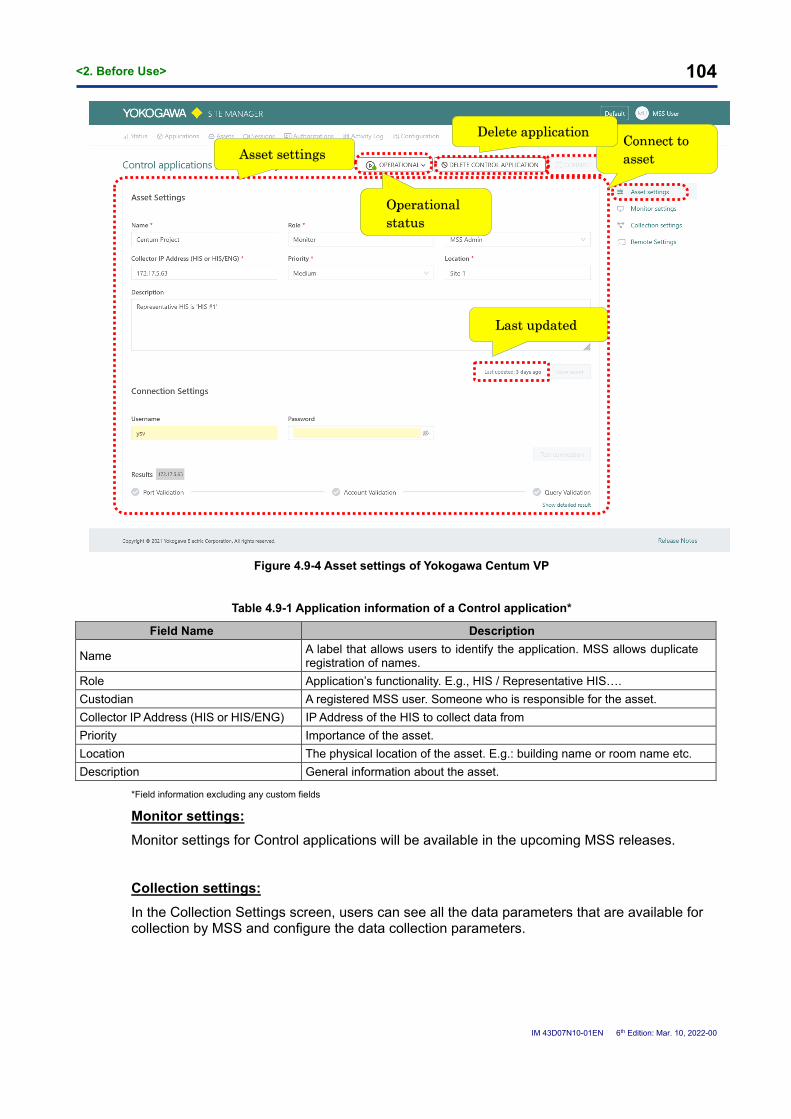
<2. Before Use> 104
IM 43D07N10-01EN 6th Edition: Mar. 10, 2022-00
Figure 4.9-4 Asset settings of Yokogawa Centum VP
Table 4.9-1 Application information of a Control application*
Field Name Description
Name A label that allows users to identify the application. MSS allows duplicate registration of names.
Role Application’s functionality. E.g., HIS / Representative HIS….
Custodian A registered MSS user. Someone who is responsible for the asset.
Collector IP Address (HIS or HIS/ENG) IP Address of the HIS to collect data from
Priority Importance of the asset.
Location The physical location of the asset. E.g.: building name or room name etc.
Description General information about the asset.
*Field information excluding any custom fields
Monitor settings:
Monitor settings for Control applications will be available in the upcoming MSS releases.
Collection settings:
In the Collection Settings screen, users can see all the data parameters that are available for collection by MSS and configure the data collection parameters.
Asset settings
Last updated
Connect to asset
Delete application
Operational status

<2. Before Use> 105
IM 43D07N10-01EN 6th Edition: Mar. 10, 2022-00
Figure 4.9-5 Collection settings of Control applications
MSS collects three kinds of data from a Centum Project.
Table 4.9-2 Data collection parameters of Control applications
Collection Type Field Name Description
Inventory Project Inventory Information of FCS/SCS in the Centum Project
Logs Historical Messages Activities of the Centum Project
Operational status
Heartbeat MSS communication status with the HIS
Individual collector collects the following data.
Table 4.9-3 Parameters collected from Inventory Collection
Collector Field Name Field Name Field Name Field Name
Project Inventory
domain station stn_name et_name
et_addr stn_code another_stn_name
Table 4.9-4 Parameters collected from Logs Collection
Collector Field Name Field Name Field Name Field Name
Historical Messages
time_stamp message_number message_type source
message last_date
Table 4.9-5 Parameters collected from Operational status Collection
Collector Field Name Field Name Field Name Field Name
Heartbeat ip_adress state reason heartbeat_type
Collection settings

<2. Before Use> 106
IM 43D07N10-01EN 6th Edition: Mar. 10, 2022-00
Remote settings:
In the ‘Remote settings’ page, users can create and manage an MSS remote access profile, which is essential in connecting to the HIS.
Figure 4.9-6 Remote settings of Control applications
For more details, please refer to Chapter 6. Remote Operations.
Remote settings
Add remote access profile

<2. Before Use> 107
IM 43D07N10-01EN 6th Edition: Mar. 10, 2022-00
Center-view 4.9.2.1 Yokogawa Centum VP
Details of a CENTUM Project as obtained from HIS can be viewed from Center Component.
After Onboarding an ‘Yokogawa Centum VP,’ users can monitor it remotely from MSS’s Center component through navigating to ‘Control Applications View.’
Figure 4.9-7 Yokogawa Centum VP - Navigating to Control application in Center
Figure 4.9-8 Yokogawa Centum VP - Center-view of Control application
Interactive view

<2. Before Use> 108
IM 43D07N10-01EN 6th Edition: Mar. 10, 2022-00
The Centum VP application in the Center component contains three sub-menus.
Table 4.9-6 Property overview of Yokogawa Centum VP application in Center component
Group Property Contains
Application information
Overview Uptime and Summary of the application
Project Inventory Domain and station information of the project
Historical Messages Activities in the Centum Project
Overview:
The overview provides an overview of the Yokogawa Centum VP application.
Figure 4.9-9 Overview of Control application
Data summary contains the values provided in Applications settings ‘(Table 4.9-1 Application information of a Control application*)’.
Overview
Data summary

<2. Before Use> 109
IM 43D07N10-01EN 6th Edition: Mar. 10, 2022-00
Project Inventory:
Project inventory contains the list of Stations from which HIS is gathering data from.
Figure 4.9-10 Project Inventory of Control application in Center Component
Historical messages:
Historical messages contain the alarms collected from the Control applications from all the HIS.

<2. Before Use> 110
IM 43D07N10-01EN 6th Edition: Mar. 10, 2022-00
Figure 4.9-11 Historical Messages of Control application in Center Component
On clicking an entry, more details of the alarm can be seen.
Figure 4.9-12 Detailed view of a Historical Message in Center Component

<2. Before Use> 111
IM 43D07N10-01EN 6th Edition: Mar. 10, 2022-00
4.10 Asset Management applications
This section describes ‘Asset Management applications’ in MSS. The ‘Asset Management applications’ menu is available in both Site and Center components.
As discussed in chapter 2.5 Applications, there are one asset management related applications supported by R1.5:
① Plant Resource Manager (PRM)
In Site component from the menu navigate to Application > Asset Management applications. Click on the asset to navigate to detailed view:
Figure 4.10-1 Navigating to Asset Management applications

<2. Before Use> 112
IM 43D07N10-01EN 6th Edition: Mar. 10, 2022-00
Site-view
PRM application in Site, has four sub-menus.
① Asset settings
It provides information about the application.
② Monitor settings*
Monitor parameters related to the application.
③ Collection settings
It allows the user to view and configure the data collected from the application
④ Remote settings
It allows the user to manage remote profiles. Remote profiles contain configuration information that are used by MSS when initiating a remote connection to an asset.
Figure 4.10-2 Application submenu for Asset management applications

<Views and Layouts> 113
IM 43D07N10-01EN 6th Edition: Mar. 10, 2022-00
4.10.1.1 Yokogawa Plant Resource Manager
PRM collects data from field assets.
Figure 4.10-3 Asset management application - Data collection architecture
Asset settings:
In the Asset settings screen, users can
① View and modify the provided information during Application Onboarding.
② Stop the collection of data by removing the application from the MSS site.
③ Modify the Operational Status of the asset.

<Views and Layouts> 114
IM 43D07N10-01EN 6th Edition: Mar. 10, 2022-00
Figure 4.10-4 Asset settings of Yokogawa PRM application
The asset related fields available for view and modification are:
Table 4.10-1 Application information of a PRM*
Field Name Description
Asset Name A label that allows users to identify the asset. MSS allows duplicate registration of names.
Role Application’s functionality. E.g., Security, patching ….
Custodian A registered MSS user. Someone who is responsible for the asset.
IP Address Asset’s IP address.
Priority Importance of the asset.
Location The physical location of the asset. E.g.: building name or room name etc.
Description General information about the asset.
*Field information excluding any custom fields
Asset settings
Last updated
Delete asset
Connect to asset
Operational status

<Views and Layouts> 115
IM 43D07N10-01EN 6th Edition: Mar. 10, 2022-00
Monitor settings:
In the monitor settings field screen, users can see and interact with all the available monitors.
Figure 4.10-5 Monitor settings of PRM
Available monitors are:
Table 4.10-2 Monitor information of a PRM
Monitor Name
Device Deleted
User logout
User login
Monitor settings

<Views and Layouts> 116
IM 43D07N10-01EN 6th Edition: Mar. 10, 2022-00
Collection settings:
In the Collection Settings screen, users can see all the data parameters that are available for collection by MSS.
Figure 4.10-6 Collection settings of PRM
The purpose of this screen is to view or configure the data collection parameter. Above Figure 4.10-6 Collection settings of PRM represents how to view and configure the parameters of the data collection.
Users can manage/collect the following data parameters of an Asset Management Applications.
Table 4.10-3 Data collection parameters of PRM
Collection Type Field Name Description
Inventory Users PRM User information
Connected Field assets Field devices monitored by PRM
Logs
Maintenance Events Field asset maintenance events
Diagnostic Events Field asset diagnostic events
Configuration Events Field asset configuration events
Collection settings
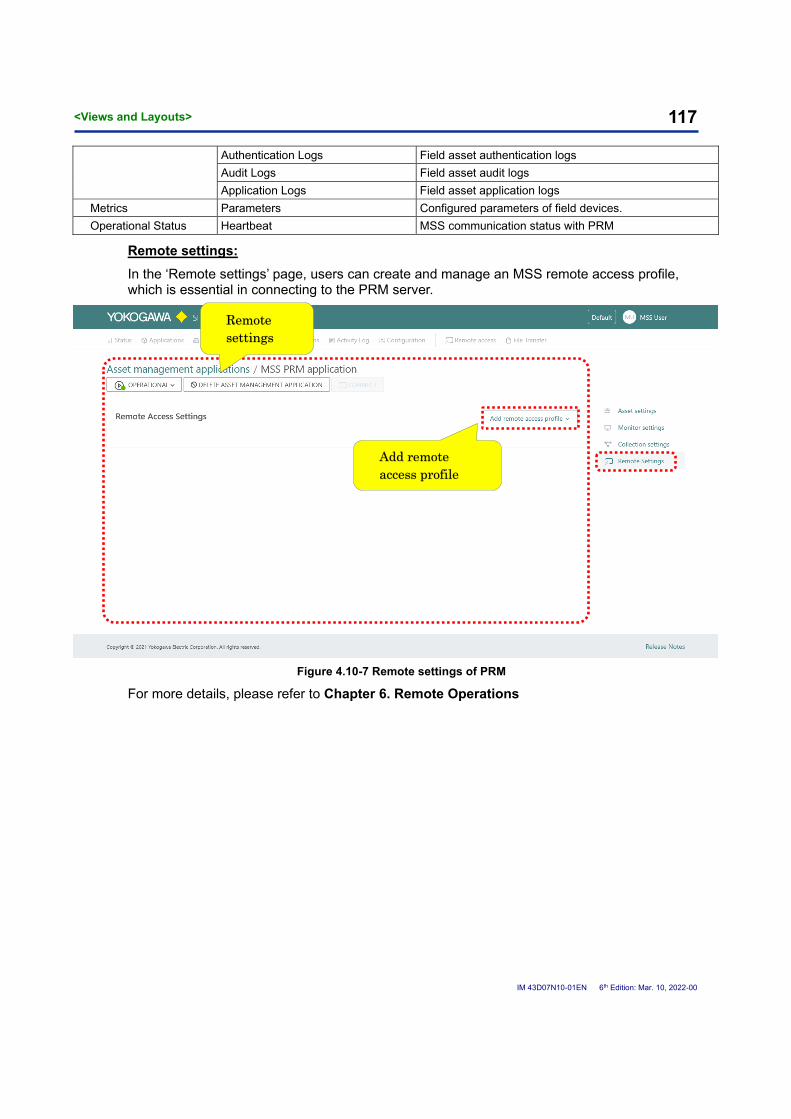
<Views and Layouts> 117
IM 43D07N10-01EN 6th Edition: Mar. 10, 2022-00
Authentication Logs Field asset authentication logs
Audit Logs Field asset audit logs
Application Logs Field asset application logs
Metrics Parameters Configured parameters of field devices.
Operational Status Heartbeat MSS communication status with PRM
Remote settings:
In the ‘Remote settings’ page, users can create and manage an MSS remote access profile, which is essential in connecting to the PRM server.
Figure 4.10-7 Remote settings of PRM
For more details, please refer to Chapter 6. Remote Operations
Remote settings
Add remote access profile

<Views and Layouts> 118
IM 43D07N10-01EN 6th Edition: Mar. 10, 2022-00
Center-view 4.10.2.1 Plant Resource Manager
Figure 4.10-8 Center-view of PRM application
The PRM application in the Center component contains nine sub-menus
Table 4.10-4 Property overview of PRM in Center component
Group Property Contains
Application information
Overview Application information and key metrics.
Field Assets List of field assets
Application Users List of users in PRM
Events
Diagnostic Events Field asset maintenance events
Maintenance Events Field asset diagnostic events
Configuration Events Field asset configuration events
Log
Activity Log PRM Activities
Application Log PRM Events
Authentication Log PRM Authentication events
Interactive view
PRM sub-menu

<Views and Layouts> 119
IM 43D07N10-01EN 6th Edition: Mar. 10, 2022-00
Overview:
The overview provides an overview of the Yokogawa PRM
Figure 4.10-9 Overview of Yokogawa PRM application
Data summary contains the values provided in Applications settings ‘(Table 4.10-1 Application information of a PRM)’
Overview
Data summary

<Views and Layouts> 120
IM 43D07N10-01EN 6th Edition: Mar. 10, 2022-00
Field assets:
Field assets from which PRM is collecting data from.
Figure 4.10-10 Field assets of Asset management application in Center Component
Diagnostic events:
Figure 4.10-11 Diagnostic events of Asset management application in Center Component

<Views and Layouts> 121
IM 43D07N10-01EN 6th Edition: Mar. 10, 2022-00
Maintenance events:
Figure 4.10-12 Maintenance events of Asset management application in Center Component
Configuration events:
Figure 4.10-13 Configuration events of Asset management application in Center Component

<Views and Layouts> 122
IM 43D07N10-01EN 6th Edition: Mar. 10, 2022-00
Activity Log:
Figure 4.10-14 Activity Log of Asset management application in Center Component

<Views and Layouts> 123
IM 43D07N10-01EN 6th Edition: Mar. 10, 2022-00
Application Log:
Figure 4.10-15 Application Log of Asset management application in Center Component

<Views and Layouts> 124
IM 43D07N10-01EN 6th Edition: Mar. 10, 2022-00
Authentication Log:
Figure 4.10-16 Authentication Log of Asset management application in Center Component
Application users:
Figure 4.10-17 Application users of Asset management application in Center Component

<Views and Layouts> 125
IM 43D07N10-01EN 6th Edition: Mar. 10, 2022-00
4.11 Analyzer Management applications
This section describes ‘Analyzer Management applications’ in MSS. The ‘Analyzer Management applications’ menu is available in both Site and Center components.
As discussed in chapter 2.5 Applications, there is one asset management related application supported by MSS in R1.5:
① AAIMS
In Site component from the menu navigate to Application > Analyzer Management applications. Click on the asset to navigate to detailed view:
Figure 4.11-1 Navigating to Analyzer Management Application in Site Component

<Views and Layouts> 126
IM 43D07N10-01EN 6th Edition: Mar. 10, 2022-00
Site-view
AAIMS Application in Site, has four sub-menus.
① Asset settings
It provides information about the application.
② Monitor settings
Monitor related to the application.
③ Collection settings
It allows the user to view and configure the data collected from the application.
④ Remote settings
It allows the user to manage remote profiles. Remote profiles contain configuration information that are used by MSS when initiating a remote connection to an asset.
Figure 4.11-2 Application submenu for AAIMS applications

<Views and Layouts> 127
IM 43D07N10-01EN 6th Edition: Mar. 10, 2022-00
4.11.1.1 Analyzer Management Application
Like PRM, An Analyzer Management Application collects data from various analyzers.
Figure 4.11-3 Analyzer management application - Data collection architecture
Asset settings:
In the Asset settings screen, users can
① View and modify the provided information during Application Onboarding.
② Stop the collection of data by removing the application from the MSS site.
③ Modify the Operational Status of the asset.

<Views and Layouts> 128
IM 43D07N10-01EN 6th Edition: Mar. 10, 2022-00
Figure 4.11-4 Asset settings of Yokogawa AAIMS application
The asset related fields available for view and modification are:
Table 4.11-1 Application information of an AAIMS application
Field Name Description
Asset Name A label that allows users to identify the asset. MSS allows duplicate registration of names.
Role Application’s functionality. E.g., Security, patching ….
Custodian A registered MSS user. Someone who is responsible for the asset.
IP Address Asset’s IP address.
Priority Importance of the asset.
Location The physical location of the asset. E.g.: building name or room name etc.
Description General information about the asset.
*Field information excluding any custom fields
Monitor settings:
MSS R1.5 does not support any Monitors for AAIMS application
Asset settings
Last updated
Delete application
Connect to application
Operational status

<Views and Layouts> 129
IM 43D07N10-01EN 6th Edition: Mar. 10, 2022-00
Collection settings:
In the Collection Settings screen, users can see all the data parameters that are available for collection by MSS.
Figure 4.11-5 Collection settings of AAIMS application
The purpose of this screen is to view or configure the data collection parameter. Above Figure 4.11-5 Collection settings of AAIMS application represents how to view and configure the parameters of the data collection.
Users can manage/collect the following data parameters of an Analyzer Management Applications.
Table 4.11-2 Data collection parameters of AAIMS application
Collection Type Field Name Description
Inventory Connected Analyzers Details of connected analyzers
Applications users AAIMS user information
Logs
Activity Log AAIMS activity log
Application Log AAIMS application log
Maintenance Events Analyzer maintenance events
Validation Events Analyzer validation events
Metrics Performance Performance rate of analyzers
Collection settings

<Views and Layouts> 130
IM 43D07N10-01EN 6th Edition: Mar. 10, 2022-00
Operational Status Heartbeat MSS communication status with AAIMS
Remote settings:
In the ‘Remote settings’ page, users can create and manage an MSS remote access profile, which is essential in connecting to the AAIMS server.
Figure 4.11-6 Remote settings of an AAIMS application
For more details, please refer to Chapter 6. Remote Operations
Remote settings
Add remote access profile

<Views and Layouts> 131
IM 43D07N10-01EN 6th Edition: Mar. 10, 2022-00
Center-view 4.11.2.1 Analyzer Management Application
Figure 4.11-7 Center-view of AAIMS application
The AAIMS application in the Center component contains eight sub-menus.
Table 4.11-3 Property overview of AAIMS in Center component
Group Property Contains
Application information
Overview Application information and key metrics.
Analyzers List of Analyzers
Application Users List of users in AAIMS
Performance Performance rate of analyzers
Events Maintenance Events Analyzer maintenance events
Validation Events Analyzer validation events
Log Activity Log AAIMS Activities
Application Log AAIMS Events
Interactive view
AAIMS sub-menu

<Views and Layouts> 132
IM 43D07N10-01EN 6th Edition: Mar. 10, 2022-00
Overview:
The overview provides an overview of the AAIMS.
Figure 4.11-8 Overview of Yokogawa AAIMS application
Data summary contains the values provided in Applications settings. ‘(Table 4.11-1 Application information of an AAIMS application)’.
Overview
Data summary

<Views and Layouts> 133
IM 43D07N10-01EN 6th Edition: Mar. 10, 2022-00
Analyzers:
Figure 4.11-9 Analyzers of Yokogawa AAIMS application
Maintenance Events:
Figure 4.11-10 Maintenance Events of Yokogawa AAIMS application

<Views and Layouts> 134
IM 43D07N10-01EN 6th Edition: Mar. 10, 2022-00
Validation Events:
Figure 4.11-11 Validation Events of Yokogawa AAIMS application
Performance:
Figure 4.11-12 Performance of Yokogawa AAIMS application

<Views and Layouts> 135
IM 43D07N10-01EN 6th Edition: Mar. 10, 2022-00
Activity Log:
Figure 4.11-13 Activity Log of Yokogawa AAIMS application
Application Log:
Figure 4.11-14 Application Log of Yokogawa AAIMS application

<Views and Layouts> 136
IM 43D07N10-01EN 6th Edition: Mar. 10, 2022-00
Application users:
Figure 4.11-15 Application Users of Yokogawa AAIMS application

<Views and Layouts> 137
IM 43D07N10-01EN 6th Edition: Mar. 10, 2022-00
4.12 Compute assets
This section describes ‘Compute assets’ in MSS. The ‘Compute assets’ menu is available in both Site and Center component.
The site component deals with controlling and managing the asset, while the Center component is responsible for visualizing the collected data.
A detailed view provides information about a Compute asset.
The layout of a detailed view consists of an ‘interactive view’ and ‘asset sub-menu.’
The interactive view is used by users to interact with the asset. While asset sub-menu consists of various options through which users can interact with it.
Figure 4.12-1 Detailed view of Compute asset
Detailed view of all other asset types in both Site and Center components have the same structure.
asset sub-menu
Interactive view

<Views and Layouts> 138
IM 43D07N10-01EN 6th Edition: Mar. 10, 2022-00
Site-view
An asset in Site component is essential for collecting data from the device. Hence, the options for an asset in Site revolve mostly around the data gathering aspects.
A compute asset in Site has four sub-menus.
① Asset settings
It provides information about the asset.
② Monitor settings
A monitor can be configured on the asset to alert the MSS users in case of specific events.
③ Collection settings
It allows the user to view and configure the data collected from the asset
④ Remote settings
It allows the user to manage remote profiles. Remote profiles contain configuration information that are used by MSS when initiating a remote connection to an asset.
There are two ways in which the Site component collects data from a Compute asset. Based on the data collection method, the assets are referred to as:
① Agent-based compute assets
② WMI based compute assets
Figure 4.12-2 List view of Compute assets

<Views and Layouts> 139
IM 43D07N10-01EN 6th Edition: Mar. 10, 2022-00
4.12.1.1 Agent-based compute asset
A compute asset, from which MSS collects data through an installed agent, called MSS agent, is an ‘agent-based Compute asset.’
Asset settings:
In the Asset settings screen, users can:
① View and modify the provided information during Asset Onboarding.
② Stop the collection of data by deleting the asset from the MSS site.
③ Set Operational status
Figure 4.12-3 Asset settings of agent-based compute asset
The fields related to asset that are available for viewing and modifications are:
Table 4.12-1 Asset settings of a Compute asset*
Field Name Description
Asset Name A label that allows users to identify the asset. MSS allows duplicate registration of names.
Role Asset’s role. E.g., HMI, file server….
Custodian A registered user who is responsible for the asset.
IP Address Asset’s IP address.
Priority Importance of the asset.
Location The physical location of the asset. E.g.: building name or room name etc.
Description General information about the asset.
*Field information excluding any custom fields
Asset settings
Last updated
Delete asset Connect to asset
Operational status

<Views and Layouts> 140
IM 43D07N10-01EN 6th Edition: Mar. 10, 2022-00
Monitor settings:
In the monitor settings field screen, users can see and interact with all the available monitors.
Figure 4.12-4 Monitor settings of agent-based Compute asset
Available monitors are:
Table 4.12-2 Monitor information of an agent-based Compute asset
Monitor Name
CPU average last 24 hours
CPU average last 7 days
CPU average last 2 hours
Total disk usage in %
Logical disk size available in bytes
Total disk size available in bytes
Total logical disk usage in %
Logical disk usage in %
Critical events last hour
Memory average last 24 hours
Memory average last 2 hours
Memory average last 7 days
asset sub-menu
Monitor settings

<Views and Layouts> 141
IM 43D07N10-01EN 6th Edition: Mar. 10, 2022-00
Collection settings:
In the Collection Settings screen, users can see all the data parameters that are available for collection by MSS.
Figure 4.12-5 Collection settings of agent-based Compute asset
The purpose of this screen is to:
① View or configure the data collection parameter. ② Download the ‘MSS Agent Installer’ via ‘Download agent installer.’
MSS agent needs to be downloaded and redeployed in case of any IP address changes. After modifying the Collection settings, such as enabling or disabling a data parameter, the MSS-agent needs to be downloaded and re-installed on the asset.
Collection settings
Download agent installer

<Views and Layouts> 142
IM 43D07N10-01EN 6th Edition: Mar. 10, 2022-00
Users can manage/collect the following data parameters of a Compute asset.
Table 4.12-3 Data collection parameters of Compute assets
Collection Type Field Name Description
Inventory CPU Assembled CPU info in the asset
Disks Assembled disk info in the asset
Domain A domain name if the asset is domain joined
Interfaces List of network interfaces on the OS
OS patches Applied patches history
OS Version The version of running OS
Software List of installed software on the OS
System System info. E.g., OS, memory
Users List of registered users on the OS
User Groups List of registered groups on the OS
Volumes Info of filesystem on the OS
Metrics CPU CPU usage
Memory Memory usage
Network Network traffic information
Process Information about running processes
Uptime System uptime information
Event Logs Application Windows event-log from ‘Application’
Security Windows event-log from ‘Security’
System Windows event-log from ‘System’

<Views and Layouts> 143
IM 43D07N10-01EN 6th Edition: Mar. 10, 2022-00
Remote settings:
In ‘Remote settings’ page, users can create and manage an MSS remote access profile, which is essential in connecting to the compute asset.
Figure 4.12-6 Remote settings of Compute asset
For more details, please refer to Chapter 6. Remote Operations
Remote settings
Add remote access profile

<Views and Layouts> 144
IM 43D07N10-01EN 6th Edition: Mar. 10, 2022-00
4.12.1.2 WMI Compute asset
A compute asset, from which MSS collects data over the network through WMI protocol, is a ‘WMI-based Compute asset.’
WMI Compute asset has some specific characteristics that distinguish it from its asset-based counterpart. This section describes some of them.
Asset settings:
Figure 4.12-7 Asset settings of WMI-based compute asset
The asset information here is same as Table 4.12-1 Asset settings of a Compute asset
In addition to asset information, the ‘interactive view’ contains ‘Connection settings.’ Test connectivity between Site component and asset using this option.
Asset settings Asset information
Connection settings

<Views and Layouts> 145
IM 43D07N10-01EN 6th Edition: Mar. 10, 2022-00
Monitor settings:
In the monitor settings field screen, users can see and interact with all the available monitors.
Figure 4.12-8 Monitor settings of WMI based Compute asset
Available monitors are:
Table 4.12-4 Monitor information of a Compute asset
Monitor
CPU average last 24 hours
CPU average last 7 days
CPU average last 2 hours
Total disk usage in %
Logical disk size available in bytes
Total disk size available in bytes
Total logical disk usage in %
Logical disk usage in %
Critical events last hour
Memory average last 24 hours
Memory average last 2 hours
Memory average last 7 days
Monitor settings
asset sub-menu

<Views and Layouts> 146
IM 43D07N10-01EN 6th Edition: Mar. 10, 2022-00
Collection settings:
In collection settings, there are few more columns compared to the 'agent-based asset.' These are required since the communication of MSS and asset happens over the network.
Figure 4.12-9 Collection settings of WMI-based compute asset
The additional fields are:
Collection settings New Fields

<Views and Layouts> 147
IM 43D07N10-01EN 6th Edition: Mar. 10, 2022-00
Table 4.12-5 Collection settings of WMI-based compute asset
Field Name Description
Last Run Time from the previous data collection execution task.
Next Run Time left until the execution of the data collection task. This value is displayed if the Collector is active.
Last Result It denotes the state of the previous task. It can have values of: Success Failed Not run
Interval The configured frequency in which the data collection occurs.
Status Status takes the value: enabled or disabled. It denotes if the WMI agent is collecting the specific data.
More actions (⁝) Configuring data collection settings.
More actions (⁝): The ⁝ icon defines more actions in Collection Settings. It has three actions
① 'Set interval.'.
② 'Run task now.'
③ 'Show Logs'
Set interval – specifies the users to select the period at which the Site manager should collect the data from the asset.
By default, the available values are:
1 hour
12 hours
24 hours
48 hours
However, users can set a custom interval in the units of an hour.
Run Task Now – instructs MSS to collect the logs immediately.
Show Logs – selecting this option provides you with the logs of the last action.

<Views and Layouts> 148
IM 43D07N10-01EN 6th Edition: Mar. 10, 2022-00
Figure 4.12-10 'More actions' of Compute asset collection settings
Run task now
Show logs
Set interval

<Views and Layouts> 149
IM 43D07N10-01EN 6th Edition: Mar. 10, 2022-00
Remote settings:
Remote Settings page here, is same as Agent-based compute assets. Users can create and manage a remote profile, which is essential in connecting to the compute asset.
Figure 4.12-11 Remote settings of Compute asset
For more details, please refer to Chapter 6. Remote Operations
Remote Access settings
Add remote access profile

<Views and Layouts> 150
IM 43D07N10-01EN 6th Edition: Mar. 10, 2022-00
Center View
After Onboarding a Compute asset, users can monitor it remotely from MSS's Center component through navigating to 'Compute Asset View.'
Figure 4.12-12 Center-view of Compute asset
The sub-menus of the Compute asset in the Center component are grouped logically into five groups:
Interactive view
Compute asset sub-menu

<Views and Layouts> 151
IM 43D07N10-01EN 6th Edition: Mar. 10, 2022-00
Table 4.12-6 Property overview of Compute assets in Center component
Group Property Contains
Asset information Overview Asset information and key metrics (current).
System Info Metadata of the system.
Driver information Disk Info Information on disks and partitions.
Network Interfaces Information about virtual and physical network interfaces.
Installed software Patches Information on installed patches.
Programs Information on installed programs.
Users & Groups Users Local or Active Directory (AD) users.
Groups Local groups or AD Security groups.
Activities
Event Log Information from event viewer.
Metrics Key metrics (current and historical).
Scheduled Tasks (agent-based only.)
Tasks scheduled in task scheduler.

<Views and Layouts> 152
IM 43D07N10-01EN 6th Edition: Mar. 10, 2022-00
4.12.2.1 Asset information
Asset information is a grouping of two layouts: Overview and System Info
Overview:
The overview provides a helpful snapshot of the compute asset immediately.
Figure 4.12-13 Overview of Compute asset
The heartbeat graph provides the uptime of asset over a last month. (WMI Only)
The metrics summary shows the following values
Table 4.12-7 Overview of Compute asset
Info Type Field Field Field Field
Overview Uptime CPU usages Swap usages Memory usages
Disk usages Inbound traffic last 24h
Outbound traffic last 24h
Overview
Data summary
Heartbeat
Metrics summary
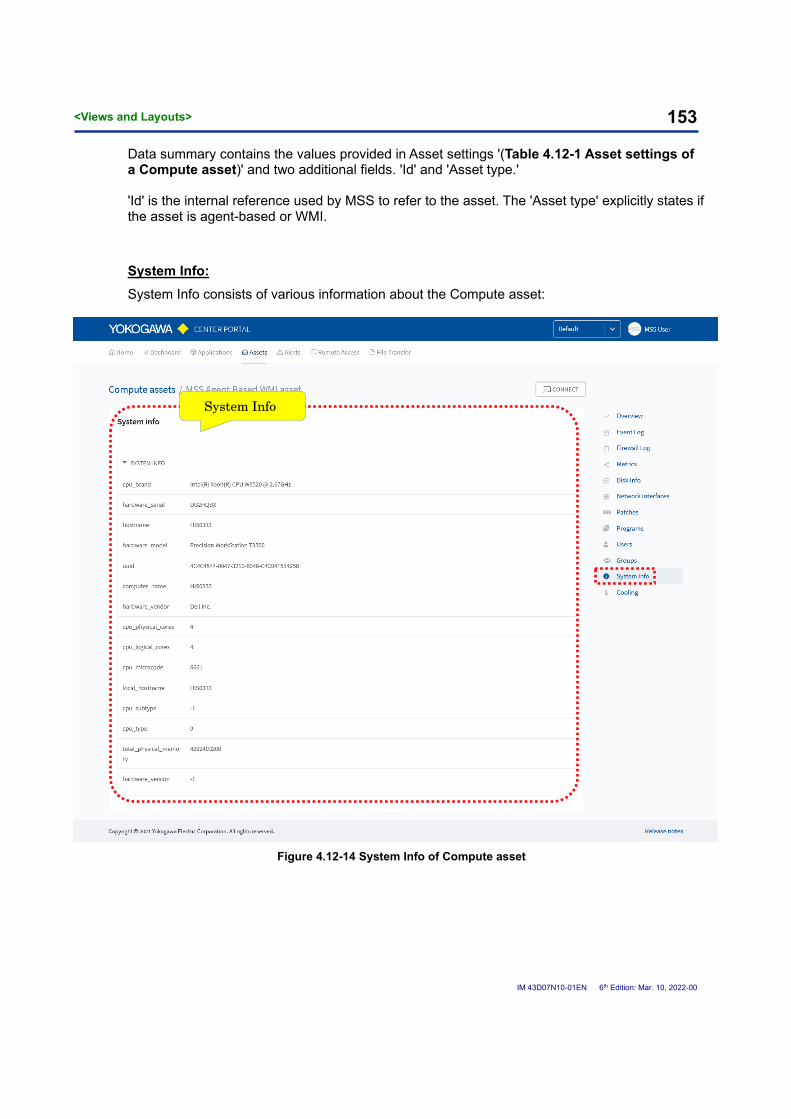
<Views and Layouts> 153
IM 43D07N10-01EN 6th Edition: Mar. 10, 2022-00
Data summary contains the values provided in Asset settings '(Table 4.12-1 Asset settings of a Compute asset)' and two additional fields. 'Id' and 'Asset type.'
'Id' is the internal reference used by MSS to refer to the asset. The 'Asset type' explicitly states if the asset is agent-based or WMI.
System Info:
System Info consists of various information about the Compute asset:
Figure 4.12-14 System Info of Compute asset
System Info

<Views and Layouts> 154
IM 43D07N10-01EN 6th Edition: Mar. 10, 2022-00
Table 4.12-8 System Info details of Compute asset
Info Type Field Field Field Field
SYSTEM INFO
cpu_microcode hardware_vendor cpu_logical_cores cpu_subtype
hardware_serial cpu_type cpu_physical_cores computer_name
hardware_model total_physical_memory hardware_version cpu_brand
local_hostname hostname uuid ---
OS INFO
build Name codename Platform
patch Minor version Major
Install_date --- --- ---
CPU INFO
model availability cpu_status number_of_cores
max_clock_speed logical_processors device_id processor_type
manufacturer --- --- ---
NT DOMAIN INFO
domain_controller _address
client_site_name domain_name dns_forest_name
domain_controller _name
dc_site_name name ---
VIDEO INFO driver_date model driver color_depth
series driver_version manufacturer ---

<Views and Layouts> 155
IM 43D07N10-01EN 6th Edition: Mar. 10, 2022-00
4.12.2.2 Drive information
Users can monitor critical drivers, such as:
① Disk Info.
② Network Interfaces.
③ Cooling
Disk Info:
Users can see all the disks configured in the Compute Asset. They can see useful information, such as:
① DEVICE ID
② BOOT PARTITION
③ FILE SYSTEM
④ SPACE
⑤ SIZE
⑥ Show details (Agent-based Compute asset only)
Figure 4.12-15 Disk info of Compute asset
MSS collects the disk data in real-time to ensure the accuracy of data. Click on the icon to see changes in the disk.
detail
Disk info

<Views and Layouts> 156
IM 43D07N10-01EN 6th Edition: Mar. 10, 2022-00
Figure 4.12-16 Disk info details of Compute asset
In Agent-based Compute assets, toggle 'Show Deleted Disks' to display information about the deleted disks.
Network Interfaces:
MSS lists all the virtual and physical network interfaces from the Compute assets.
Users can find information such as:
① INTERFACE
② STATUS
③ DESCRIPTION
④ ADDRESS
⑤ MASKS
⑥ TYPE
⑦ MAC
⑧ Show details
Disk info details

<Views and Layouts> 157
IM 43D07N10-01EN 6th Edition: Mar. 10, 2022-00
Figure 4.12-17 Network Interfaces of Compute asset
To know more changes that occur on an interface, click on the icon next to MAC. An info screen, which provides more information, is displayed.
Figure 4.12-18 Network interface details of Compute assets
Network Interfaces
Details
Network interface details

<Views and Layouts> 158
IM 43D07N10-01EN 6th Edition: Mar. 10, 2022-00
Cooling
If a Compute asset is Physical server, then its fan and temperature information can be collected.
Figure 4.12-19 Fan and Temperature status of Compute asset

<Views and Layouts> 159
IM 43D07N10-01EN 6th Edition: Mar. 10, 2022-00
4.12.2.3 Installed software
Users can view important software information such as patches and programs installed on the 'Compute asset.'
Patches:
Under the Patches section, users see a list of patches installed on the compute asset.
① HOTFIX ID
② INSTALLED BY
③ DESCRIPTION
④ INSTALLED ON
⑤ Show deleted patches
Figure 4.12-20 Patches of Compute assets
To know more changes that occur on an interface, click on the icon next to INSTALLED ON. An info screen, which provides more information, is displayed.
Installed Patches

<Views and Layouts> 160
IM 43D07N10-01EN 6th Edition: Mar. 10, 2022-00
Figure 4.12-21 Patches details of Compute assets
Programs:
Users can view what programs are installed on the Compute asset by navigating to programs sections:
Figure 4.12-22 Programs of Compute assets
Installed Programs
Patches details

<Views and Layouts> 161
IM 43D07N10-01EN 6th Edition: Mar. 10, 2022-00
To know more changes that occur on an interface, click on the icon next to VERSION. An info screen, which provides more information, is displayed.
Figure 4.12-23 Programs details of Compute assets
Programs details

<Views and Layouts> 162
IM 43D07N10-01EN 6th Edition: Mar. 10, 2022-00
4.12.2.4 Users & Groups
MSS also lists the local users and groups present in the compute asset.
CAUTION
If the onboarded compute asset is a Domain Controller (DC), then all the user accounts and groups from the active directory are collected and displayed herein Center Component. Make sure to check for any organizational security policies that prohibit exposing the list of Active Directory users.
Alternatively, you can also onboard the DC by specifying it not to collect data related to users and groups.
Users:
Users can view the local users (or AD users, if the compute asset is a domain controller), which are available on the Compute asset by navigating to users’ sections:
Figure 4.12-24 Users of Compute assets
To know more changes that occur on an interface, click on the icon next to UUID. An ‘info screen’, which provides more information, is displayed.
Users

<Views and Layouts> 163
IM 43D07N10-01EN 6th Edition: Mar. 10, 2022-00
Figure 4.12-25 Users details of Compute assets
Groups:
Users can view the local groups (or security groups, if the compute asset is a domain controller), which are available on the Compute asset by navigating to groups sections:
Figure 4.12-26 Groups of Compute assets
User details
Groups

<Views and Layouts> 164
IM 43D07N10-01EN 6th Edition: Mar. 10, 2022-00
To know more changes that occur on an interface, click on the icon next to COMMENT. An info screen, which provides more information, is displayed.
Figure 4.12-27 Groups details of Compute assets
Groups Details

<Views and Layouts> 165
IM 43D07N10-01EN 6th Edition: Mar. 10, 2022-00
4.12.2.5 Activities
Event Log:
Users can monitor the events occurring in the compute asset in real-time from the Event Log section.
Based on the selected period, users can see:
① Application events
② Security events
③ System events
Figure 4.12-28 Event log of Compute asset
To know more details about an event, click on it.
Event Log Time picker
Search

<Views and Layouts> 166
IM 43D07N10-01EN 6th Edition: Mar. 10, 2022-00
Figure 4.12-29 Event log details of a Compute asset
Event log details

<Views and Layouts> 167
IM 43D07N10-01EN 6th Edition: Mar. 10, 2022-00
Metrics:
Users can see whose average real-time statistics of:
① CPU usage
② Average memory
③ Disk usage
Based on the period specified in Time Picker, they can see periodic information about:
① Inbound traffic
② Outbound traffic
Figure 4.12-30 Metrics of a Compute asset
Metrics

<Views and Layouts> 168
IM 43D07N10-01EN 6th Edition: Mar. 10, 2022-00
Firewall logs:
Users can monitor the firewall activities on Compute asset in real-time from the Firewall Log section.
Figure 4.12-31 Firewall logs of Compute asset

<Views and Layouts> 169
IM 43D07N10-01EN 6th Edition: Mar. 10, 2022-00
Scheduled Tasks (Agent-based only):
MSS collects and displays information on currently scheduled tasks from an agent-based compute asset.
Figure 4.12-32 Scheduled tasks of a Compute task
Users can click on icon to see the detailed history of a task.
Scheduled Tasks

<Views and Layouts> 170
IM 43D07N10-01EN 6th Edition: Mar. 10, 2022-00
Figure 4.12-33 Scheduled tasks details of a Compute task
Scheduled Tasks details
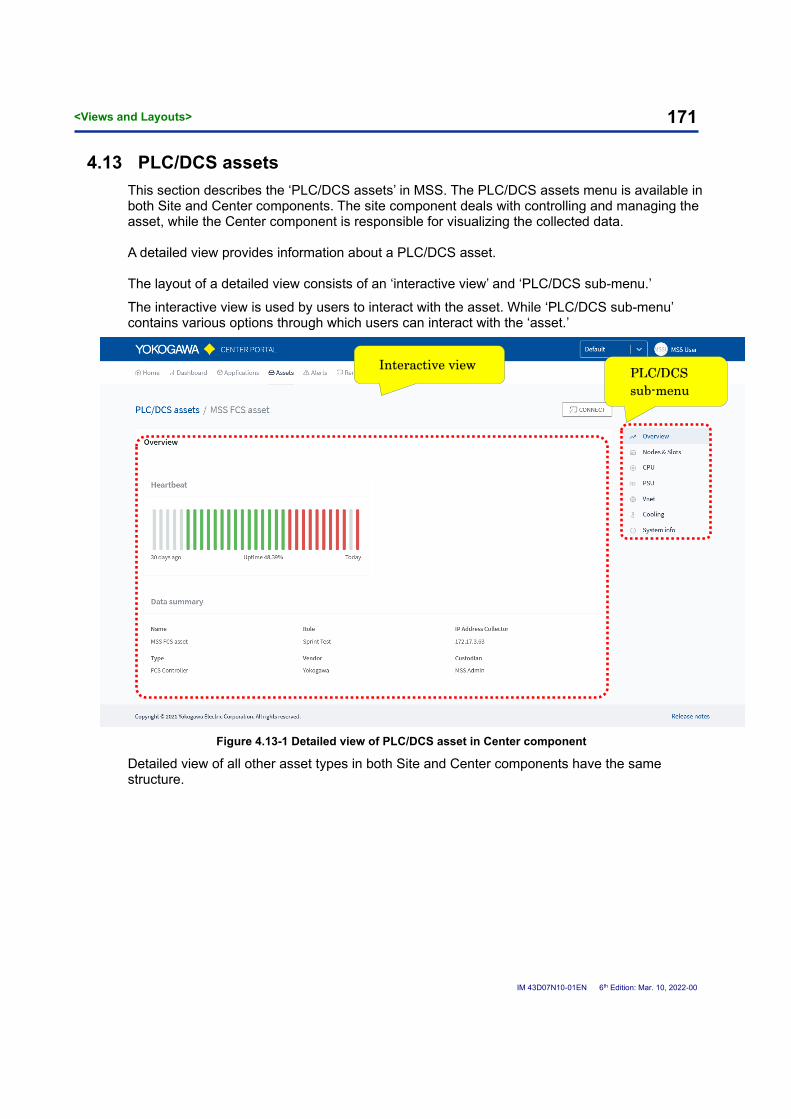
<Views and Layouts> 171
IM 43D07N10-01EN 6th Edition: Mar. 10, 2022-00
4.13 PLC/DCS assets
This section describes the ‘PLC/DCS assets’ in MSS. The PLC/DCS assets menu is available in both Site and Center components. The site component deals with controlling and managing the asset, while the Center component is responsible for visualizing the collected data.
A detailed view provides information about a PLC/DCS asset.
The layout of a detailed view consists of an ‘interactive view’ and ‘PLC/DCS sub-menu.’
The interactive view is used by users to interact with the asset. While ‘PLC/DCS sub-menu’ contains various options through which users can interact with the ‘asset.’
Figure 4.13-1 Detailed view of PLC/DCS asset in Center component
Detailed view of all other asset types in both Site and Center components have the same structure.
PLC/DCS sub-menu
Interactive view

<Views and Layouts> 172
IM 43D07N10-01EN 6th Edition: Mar. 10, 2022-00
Site-view
A PLC/DCS asset, in Site, has four options.
① Asset settings:
It provides information about the asset.
② Monitor settings
A monitor can be configured on the asset to alert the MSS users in case of specific events.
③ Collection settings
It allows the user to view and configure the data collected from the asset
④ Remote settings
It allows the user to manage remote profiles. Remote profiles contain configuration information that are used by MSS when initiating a remote connection to HIS.
Figure 4.13-2 PLC/DCS submenus in Site Component

<Views and Layouts> 173
IM 43D07N10-01EN 6th Edition: Mar. 10, 2022-00
MSS R1.5 can collect data from five types of Yokogawa Control Systems. Both share the same detailed view in Site.
① FCS (Field Control Station)
② SCS (Safety Control Station)
③ AVR (Vnet Router)
④ BCV (Bus Converter)
⑤ WAC (Wide Area Communication Router)

<Views and Layouts> 174
IM 43D07N10-01EN 6th Edition: Mar. 10, 2022-00
Asset settings:
Figure 4.13-3 Asset settings of PLC/DCS assets
In the ‘Asset Settings’ screen of PLC/DCS asset, users can:
① View and update the information of the asset
② Execute a connection test to verify the connectivity between MSS and asset.
The ‘Last updated’ field provides the time when the asset was last modified.
The asset related fields available for view and modification are:
Table 4.13-1 Asset settings fields of PLC/DCS asset*
Field Name Description
Asset Name A name for users to identify. MSS allows duplicate registration of titles.
Role Asset’s role. E.g., FCS, SCS….
Custodian A registered user. Someone responsible for the asset.
Collector IP Address (HIS or HIS/ENG)
The IP address of HIS, which facilitates data collection.
Priority Importance of the asset.
Connection Settings
Asset settings
Last updated

<Views and Layouts> 175
IM 43D07N10-01EN 6th Edition: Mar. 10, 2022-00
Location The physical location of the asset. E.g.: building name or room name etc.
Domain number Domain number of Vnet/IP station address.
Station number Station number of Vnet/IP station address.
Description General information about the asset.
Customized data fields Added asset inventory data fields includes integer, string, Boolean, IP address, user / group types.
*Field information excluding any custom fields
The data collection of PLC/DCS assets happens over the network through HIS. So, in addition to asset information, the ‘interactive view’ contains ‘Connection settings.’ Here, connection between MSS Site component and HIS is tested.
Monitor settings:
In the monitor settings field screen, users can see and interact with all the available monitors.
Figure 4.13-4 Monitor settings of PLC/DCS asset
Monitor settings

<Views and Layouts> 176
IM 43D07N10-01EN 6th Edition: Mar. 10, 2022-00
All PLC/DCS assets share same monitors Table 4.13-2 Monitor information of PLC/DCS asset
Monitor
CPU average last 24 hours
CPU average last 7 days
CPU average last 2 hours
Average VNET load last 24 hours
Average VNET load last 2 hours
Average VNET load last 7 days
Average air in temperature last 24 hours
Average air in temperature last 2 hours
Average air in temperature last 7 days
Average air out temperature last 24 hours
Average air out temperature last 2 hours
Average air out temperature last 7 days
Average battery temperature last 24 hours
Average battery temperature last 2 hours
Average battery temperature last 7 days
ECC error count right
ECC error count left
Collection Settings:
In the Collection Settings screen, users can see all the data parameters that are available for collection by MSS.
Figure 4.13-5 Collection settings of PLC/DCS assets
Collection Settings
‘FCS Collectors’ in PLC/DCS

<Views and Layouts> 177
IM 43D07N10-01EN 6th Edition: Mar. 10, 2022-00
MSS can manage/collect the following data parameters of a PLC/DCS asset.
Table 4.13-3 Data collection parameters of PLC/DCS assets
Collection Type Field Name Description
FCS/SCS/BCV Collector
CPU Processor module CPU usage information.
ECC Processor module error check and correct (ECC) memory error counter information.
HKU Module housing information. Temperature / voltage information. A House Keeping Unit (HKU) is standard hardware component.
VNET Control bus (Vnet, Vnet/IP) statistics. Control bus (Vnet) usage.
Revision Info Revision information of the asset
AVR VNET Control bus (Vnet, Vnet/IP) statistics. Control bus
(Vnet) usage.
Revision Info Revision information of the asset
WAC WAC Data from Wide Area Gateway
Revision Info Revision information of the asset
All Asset Collector Heartbeat Communication status of MSS with the asset
REFERENCE
For more details on the columns of Collection Settings, please refer to Table 4.13-3 Data collection parameters of PLC/DCS assets

<Views and Layouts> 178
IM 43D07N10-01EN 6th Edition: Mar. 10, 2022-00
Remote settings:
Like Compute assets, in Remote settings page, users can create and manage a remote access profile. This can be used to connecting to the HIS to perform remote operations on PLC/DCS assets.
Figure 4.13-6 Remote settings of PLC/DCS asset
For more details, please refer to Chapter 6. Remote Operations
Remote Access Settings
Add remote access profile

<Views and Layouts> 179
IM 43D07N10-01EN 6th Edition: Mar. 10, 2022-00
Center-view
After Onboarding a PLC/DCS asset, users can monitor it remotely from MSS’s center component through navigating to ‘PLC/DCS Asset View.’
Figure 4.13-7 Navigating to PLC/DCS asset in Center Component
There is a total of ten sub-menus available for interaction under PLC/DCS asset category: Below table shows the mapping between a PLC/DCS asset and the submenu available under it.
Table 4.13-4 Submenus in PLC/DCS assets
Menu FCS SCS AVR BCV WAC
Overview
Nodes and Slots
- - -
CPU
PSU
Vnet - - -
Cooling - -
System Info
WAN - - - -
COM - - - -
Safety - - - -
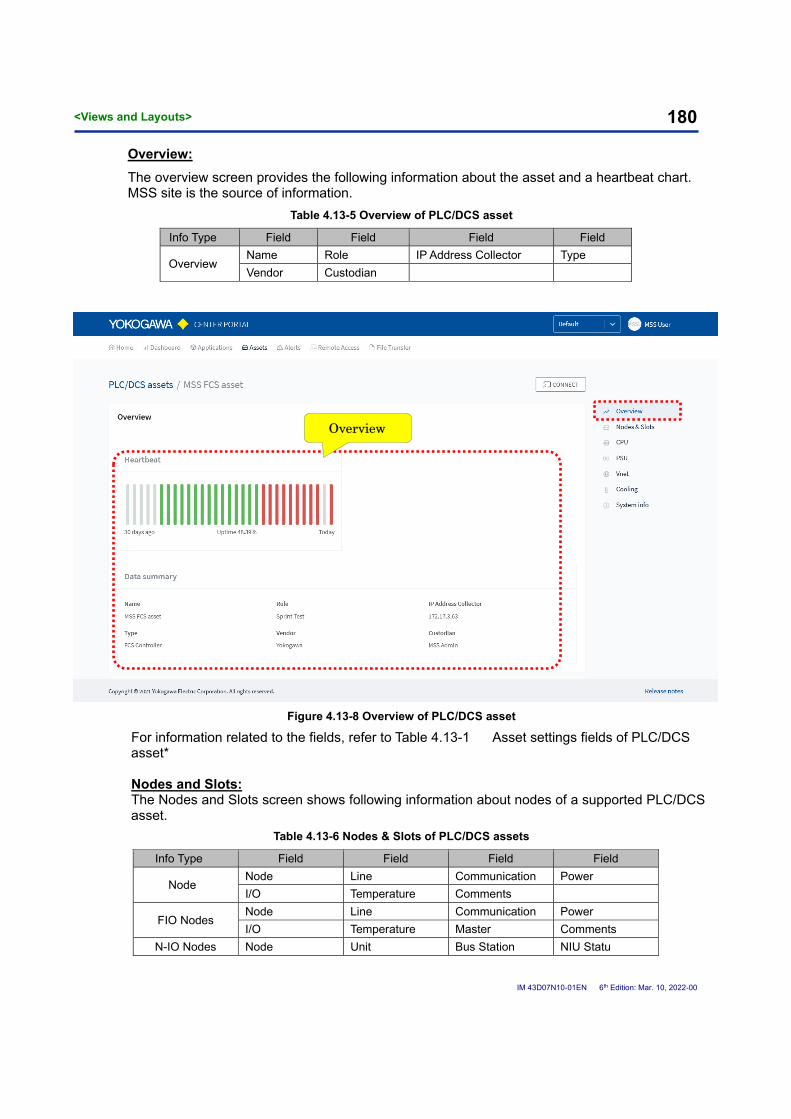
<Views and Layouts> 180
IM 43D07N10-01EN 6th Edition: Mar. 10, 2022-00
Overview:
The overview screen provides the following information about the asset and a heartbeat chart. MSS site is the source of information.
Table 4.13-5 Overview of PLC/DCS asset
Info Type Field Field Field Field
Overview Name Role IP Address Collector Type
Vendor Custodian
Figure 4.13-8 Overview of PLC/DCS asset
For information related to the fields, refer to Table 4.13-1 Asset settings fields of PLC/DCS asset* Nodes and Slots: The Nodes and Slots screen shows following information about nodes of a supported PLC/DCS asset.
Table 4.13-6 Nodes & Slots of PLC/DCS assets
Info Type Field Field Field Field
Node Node Line Communication Power
I/O Temperature Comments
FIO Nodes Node Line Communication Power
I/O Temperature Master Comments
N-IO Nodes Node Unit Bus Station NIU Statu
Overview

<Views and Layouts> 181
IM 43D07N10-01EN 6th Edition: Mar. 10, 2022-00
Maintenance Power I/O Diagnosis
Comment
All the nodes can be expanded to see details of the slot it contains.
Table 4.13-6 Slot subtypes of a Node
Slot
Slot Type Status Bus 1
Bus 2 Port 1 Port 2 Port 3
Port 4
Figure 4.13-7 Node and Slots of PLC/DCS asset (Regular Node)
Nodes & Slots

<Views and Layouts> 182
IM 43D07N10-01EN 6th Edition: Mar. 10, 2022-00
Figure 4.13-9 Node and Slots of PLC/DCS asset (NIO/FIO Node)
CPU: The screen provides details about CPU.
Table 4.13-7 CPU information of PLC/DCS assets
Info Type Field Field Field Field
CPU Card Status Position Status
ECC (Error Check and Correct memory)
Position Error Counter
CPU Load Minimum / Maximum / Average Percentage
CPU Inventory Position Card style Card Type Hardware Revision
Boot Revision Vehicle Revision

<Views and Layouts> 183
IM 43D07N10-01EN 6th Edition: Mar. 10, 2022-00
Figure 4.13-8 CPU of PLC/DCS asset

<Views and Layouts> 184
IM 43D07N10-01EN 6th Edition: Mar. 10, 2022-00
PSU: The PSU screen provides the following status.
Table 4.13-8 PSU in PLC/DCS asset
Info Type Field Field
PSU Card Status Position Status
Battery Status Position Status
Figure 4.13-9 PSU of PLC/DCS asset

<Views and Layouts> 185
IM 43D07N10-01EN 6th Edition: Mar. 10, 2022-00
Vnet: Vnet information screen. Pease refer to Table 4.13-7 Vnet of PLC/DCS asset for the information collected.
Figure 4.13-10 Vnet of PLC/DCS asset
Table 4.13-7 Vnet of PLC/DCS asset
Info Type Field Field Field Field
VNET
Load CWT_ovr DE_BEto DE_BRto
DE_Fifo DE_Hung DE_LVL DE_Mark
DE_Pari DE_SCTL DE_rtyE DE_rtry
RE_Crc RE_FUdr RE_Fovr RE_HapL
RE_RBNR RE_RUNT RE_Sum RE_fomt
RE_leng RX_BRCV RX_CWTO RX_Ntkn
Rx_AdSp Rx_AISp Rx_BB Rx_Busf
Rx_CNR Rx_Dtkn Rx_Hap Rx_Ihty
Rx_Mtkn Rx_Nt_M Rx_ReAd Rx_Scan
Rx_Time TE_Cand TE_Coll TE_Fudr
TE_Leng TE_MTfe TE_MTto TE_cals
MT_Ikki TM_RWTO TM_Scal TX_BRCV
Tx_BB Tx_Busf Tx_CNR Tx_Dtkn
Tx_HPAN Tx_lhty Tx_ReAd Tx_ReNt
Tx_TDR Tx_Time VE_Alu VE_DipP
VE_MM VE_SrmP VE_Swto Rsv

<Views and Layouts> 186
IM 43D07N10-01EN 6th Edition: Mar. 10, 2022-00
Cooling: The cooling screen provides the following metrics.
Table 4.13-80 Cooling in PLC/DCS assets
Info Type Field Field Field Field
Fan Status Position Status
Air Temperature Position Status
Battery Temperature Position Status
Temperature Position Air in Air Out Battery
Figure 4.13-11 Cooling of PLC/DCS asset

<Views and Layouts> 187
IM 43D07N10-01EN 6th Edition: Mar. 10, 2022-00
System Info:
System info consists of various information about the PLC/DCS asset:
Figure 4.13-11 System Info of PLC/DCS asset
Table 4.13-9 System Info details of PLC/DCS asset
Info Type Field Field Field Field
System
Generation Station Name Address User Task
Comm Load Ave Type Revision Database Type
Test mode Option Software Comm Load Cur Comment
Control status Comm I/O CPU Idle Time
System Info

<Views and Layouts> 188
IM 43D07N10-01EN 6th Edition: Mar. 10, 2022-00
WAN The WAN screen provides the following metrics.
Table 4.13-100 COM in PLC/DCS assets
Info Type Field Field Field Field
WAN Wac_Throughput Wac_Comm Load Cur Wac_Comm Lad Ave Wac_Configured Limit
Figure 4.13-10 WAN in PLC/DCS asset (WAC only)

<Views and Layouts> 189
IM 43D07N10-01EN 6th Edition: Mar. 10, 2022-00
COM: The cooling screen provides the following metrics.
Table 4.13-110 COM in PLC/DCS assets
Info Type Field Field
COM Card Status Position Status
Figure 4.13-11 COM info of PLC/DCS asset (BCV only)

<Views and Layouts> 190
IM 43D07N10-01EN 6th Edition: Mar. 10, 2022-00
Safety: The Safety screen provides the following status.
Table 4.13-8 Safety in PLC/DCS asset
Info Type Field Field Field Field
Safety Forcing Link Trans Lock Inter-SCS Comm. Lock Comm. I/O Lock
Safety Comm. Lock Safety Level
Figure 4.13-9 Safety of PLC/DCS asset

<Views and Layouts> 191
IM 43D07N10-01EN 6th Edition: Mar. 10, 2022-00
4.14 Field assets
This section describes monitoring field assets in MSS.
A plant has various field instruments such as – sensors, transmitters, flow meters. These devices use process automation protocols such as HART, FF, and Profibus to communicate their status to PRM. To monitor such field devices, MSS communicates with an intermediate, such as PRM, which can translate the field-specific protocols to web protocols.
Operations related to field assets in MSS depend on Asset Management applications. So, before monitoring a field asset, the PRM server needs to be onboarded in Asset Management applications.
REFERENCE
For more information about the Yokogawa PRM, please refer to PRM Instruction Manual:
https://web-material3.yokogawa.com/GS30B05A10-01EN.pdf
Site-view
A Field asset in the Site has two sub-menus.
① Asset settings:
It provides information about the asset.
② Monitor settings
A monitor can be configured on the asset to alert the MSS users in case of specific events.

<Views and Layouts> 192
IM 43D07N10-01EN 6th Edition: Mar. 10, 2022-00
Asset Settings:
Figure 4.14-1 Asset settings of Field assets (PRM) in Site component
In the ‘Asset Settings’ screen of Field asset, users can:
① View and update the information of the Field asset
The asset related fields available for view and modification are:
Table 4.14-1 Asset settings fields of Field assets*
Field Name Description
Asset Name A label that is used to identify a field asset in MSS. MSS allows duplicate registration of names. It is recommended to use the tag of Field asset as its name
Role Asset’s role.
Custodian A registered user. Someone responsible for the asset.
IP Address Optional field. Users can enter IP address of the PRM**
Priority Importance of the asset.
Location The physical location of the asset. E.g.: building name or room name etc.
Description General information about the asset.
*Field information excluding any custom fields
Asset settings PRM information

<Views and Layouts> 193
IM 43D07N10-01EN 6th Edition: Mar. 10, 2022-00
Monitor settings:
In the monitor settings field screen, users can see and interact with all the available monitors.
Figure 4.14-2 Monitor settings of PRM
Table 4.14-2 Monitor information of PRM
Monitor
Critical priority diagnostic events
Critical priority maintenance events
Namur State
CAUTION
After modifying and saving values in Asset settings and switching to and from Monitor settings, the Asset settings screen can reset and show the original value. In such cases, refresh the page to see the saved data.
Monitor settings

<Views and Layouts> 194
IM 43D07N10-01EN 6th Edition: Mar. 10, 2022-00
Center-view
In the Center-view, users can monitor individual field assets, from the detailed view of the ‘field asset.’
A field asset has seven sub-menus,
① Overview
② Diagnostic Events
③ Maintenance Events
④ Configuration Events
⑤ Alerts
⑥ Parameters
⑦ Data
Figure 4.14-3 ‘Detailed view’ of Field asset (Center component)
Alarms from field devices are classified in the following four types. As for the types of “Failure”, “Out of Specification”, “Maintenance Required” and “Check Function” comply with NAMUR NE 107. Alarm status standard provided by NAMUR (an international user association of automation technology in process industries
Interactive view Field asset sub-menu

<Views and Layouts> 195
IM 43D07N10-01EN 6th Edition: Mar. 10, 2022-00
Table 4.14-3 NAMUR alarm status
NE107 Status Symbol Description
Normal
Device is normal
Failure
High severity: signal invalid due to malfunction in the device, sensor, or actuator
Out of Specification
Medium severity: permissible ambient, or process conditions exceeded, or the measuring uncertainty of sensors or deviations from the set value in actuators is probably greater than expected
Maintenance Required
Low severity (advisory): although the signal is valid, the remaining life is nearly exhausted, or a function will soon be restricted due to operational conditions e.g. aging of a pH electrode
Check Function
Signal temporarily invalid (e.g. frozen) due to on-going work on the device

<Views and Layouts> 196
IM 43D07N10-01EN 6th Edition: Mar. 10, 2022-00
Overview:
The overview screen provides the following information about the field asset.
Table 4.14-4 Overview of Field asset
Field Name Description
Name Name of the asset in MSS
Location The physical location of the asset. E.g.: building name or room name etc.
Priority Importance of the asset.
ID ID of the field asset in MSS
Source PRM, the field device is registered in.
Asset type Asset Management application type
Role Role of the asset
Custodian An MSS registered user. Someone responsible for the source: PRM.
Wireless Device marked with Wireless capabilities in MSS
Asset description Information about the asset
Figure 4.14-4 Overview of the Field asset
Overview
Field asset navigation menu

<Views and Layouts> 197
IM 43D07N10-01EN 6th Edition: Mar. 10, 2022-00
Diagnostic Events:
See all the diagnostic events reported by the field device to PRM over a specified time.
Figure 4.14-5 Diagnostic events of a Field asset in Center component

<Views and Layouts> 198
IM 43D07N10-01EN 6th Edition: Mar. 10, 2022-00
Maintenance Events:
See all the maintenance events reported by the field device to PRM over a specified time.
Figure 4.14-6 Maintenance events of a Field asset in Center component

<Views and Layouts> 199
IM 43D07N10-01EN 6th Edition: Mar. 10, 2022-00
Configuration Events:
See all the configuration events reported by the field device to PRM over a specified time.
Figure 4.14-7 Configuration events of a Field asset in Center component

<Views and Layouts> 200
IM 43D07N10-01EN 6th Edition: Mar. 10, 2022-00
Alerts:
See all the alerts reported by the field device to PRM over a specified time.
Figure 4.14-8 Alerts of Field assets in Center component
On clicking the ‘alert,’ users can see more information about the alert.
Figure 4.14-9 Alert details of Field assets in Center component
Alerts
Alert details

<Views and Layouts> 201
IM 43D07N10-01EN 6th Edition: Mar. 10, 2022-00
Parameters:
Parameters refer to the configuration settings of Field devices. PRM records them over the life of the device.
Under parameter, users can see the dataset of all parameters of the user.
It is possible to track the dataset changes over the period’s lifetime (up to five times) on the device.
Figure 4.14-10 Parameters of the Field asset
Track the changes did overtime on the device by toggling ‘Show changes.’
Parameters

<Views and Layouts> 202
IM 43D07N10-01EN 6th Edition: Mar. 10, 2022-00
Figure 4.14-11 Parameter changes of the Field asset
Parameter changes

<Views and Layouts> 203
IM 43D07N10-01EN 6th Edition: Mar. 10, 2022-00
Data:
Under ‘Data,’ users can see the configuration and metadata of a field asset. The values presented here are device-specific and hence differ across the Field assets.
Figure 4.14-12 Data of Field asset
Data

<Views and Layouts> 204
IM 43D07N10-01EN 6th Edition: Mar. 10, 2022-00
4.15 Network assets
This section describes the ‘Network assets’ in MSS. The Network assets menu is available in both Site and Center components. The site component deals with controlling and managing the asset, while the Center component is responsible for visualizing the collected data.
A detailed view provides information about a Network asset.
The layout of a detailed view consists of an ‘interactive view’ and ‘network sub-menu.’
The interactive view is used by users to interact with the asset. While ‘network sub-menu’ contains various options through which users can interact with the ‘asset.’
Figure 4.15-1 Detailed View of Network Asset in Center component
Network sub-menu
Interactive view

<Views and Layouts> 205
IM 43D07N10-01EN 6th Edition: Mar. 10, 2022-00
Site-view
A Network asset, in Site, has four options.
① Asset settings:
It provides information about the asset.
② Monitor settings
A monitor can be configured on the asset to alert the MSS users in case of specific events.
③ Collection settings
It allows the user to view and configure the data collected from the asset
④ Remote settings
It allows the users to manage remote profiles, which are used to remotely access the asset from MSS site or center component.
MSS R1.5 can collect data from four types of Network assets. All of them share the same detailed view.
① Switch
② Router
③ Firewall
④ Time Server

<Views and Layouts> 206
IM 43D07N10-01EN 6th Edition: Mar. 10, 2022-00
Asset settings:
In the ‘Asset Settings’ screen of Network asset, users can:
View and update the information of the asset
Execute a connection test to verify the connectivity between MSS and asset.
The ‘Last updated’ field provides the time when the asset was last modified. The asset related fields available for view and modification are:
Figure 4.15-2 Asset settings of Network assets
Table 4.15-1 Asset settings fields of Network asset*
Field Name Description
Asset Name A name for users to identify. MSS allows duplicate registration of titles.
Role Asset’s role. E.g., a Network switch, router, firewall, switch.
Custodian A registered user. Someone responsible for the asset.
IP Address The IP address of the asset.
Asset settings
Asset information
Connection settings

<Views and Layouts> 207
IM 43D07N10-01EN 6th Edition: Mar. 10, 2022-00
Priority Importance of the asset.
Location The physical location of the asset. E.g.: building name or room name etc.
Brand Popular manufacturers of the network devices.
Model / Series Specific models of the network device.
Syslog host The IP or hostname of the asset from which the network logs are sent from the network device. (This value is used to determine the source of syslog)
Description General information about the asset.
*Field information excluding any custom fields
SUPPLEMENT
Difference between IP address and Syslog hosts:
MSS uses ‘IP address’ of the asset to communicate with the Network device while as syslog host is used to identify the network assets during data collection.
One of the main differences between the value in these fields are: who initiates the connection. For SNMP communications from MSS, MSS initiates a connection to the network device based on the value of provided IP address. While as for SNMP communications from network device to syslog sever, it’s the opposite. Here, a network device sends/pushes the logs from itself to MSS.
If a network device is behind a proxy/router or has multiple IP addresses, then the logs can be sent from an IP address which is different from the one configured.
In such cases, an MSS administrator can specify the device hostname or the alternative IP address, which MSS can use to map the incoming network logs to the network asset.
Syslog hosts field is mandatory to show the syslog data in Center component.
Data collection of Network assets happens over the network through SNMP protocol. Logs from the network assets are written to the MSS Syslog server.
So, in addition to asset information, the ‘interactive view’ contains ‘Connection settings.’ Here, users can provide the credentials through which MSS will collect data from the network devices.
SNMP protocol uses a concept known as ‘Community Strings’ to communicate securely with a network device. A ‘Community String’ or a ‘SNMP Community String’ is like a password and is essential in accessing statistics stored in a router and other network devices. There are three available versions of SNMP; v1, v2c, and v3.

<Views and Layouts> 208
IM 43D07N10-01EN 6th Edition: Mar. 10, 2022-00
Table 4.15-2 SNMP Authentication of Network asset
SNMP Version Required Fields
Options Description
v1 Community N/A
Secure text for accessing the n/w device v2c Community
v3
Security Level
No Auth or Privacy
Authentication Privacy level used for logging
Auth without Privacy
Auth with Privacy
Auth Protocol SHA Secure Hashing Algorithm
MD5 Message Direct Algorithm.
Username N/A
SNMP username of the asset
Password SNMP Password of the asset
SNMP configuration depends on the vendor and is different from vendor to vendor. Please refer to instructions from specific vendors while configuring the same.
CAUTION
If a network device has multiple network interfaces, the Network administrator is required to be aware of the network interface which is configured to write logs to the syslog server. This IP address or hostname needs to be entered in the field of ‘Syslog host’
SUPPLEMENT
SNMP v3 is the most secure and recommended method way to connect with the device. Please use the v1 and v2c only if the network device doesn’t support the v3.

<Views and Layouts> 209
IM 43D07N10-01EN 6th Edition: Mar. 10, 2022-00
MSS currently supports following Network assets
Table 4.15-3 MSS supported Network assets
Network Asset Brand Model
Router Generic Standard Router
Switch
Generic Standard Switch
Hirschman MACH104
MAR1040
Firewall Generic Standard Firewall
Time Server Generic Standard Timeserver
SUPPLEMENT
In case a non-supported network asset needs to be added MSS, please select the brand as Generic and Model as Standard <Network Asset>

<Views and Layouts> 210
IM 43D07N10-01EN 6th Edition: Mar. 10, 2022-00
Monitor settings:
In the monitor settings field screen, users can see and interact with all the available monitors.
Figure 4.15-3 Monitor settings of Network assets
Available monitors are:
Table 4.15-4 Monitor information of Network assets
Monitor
Interface admin state
Interface operational state
Interface speed
Vlan admin state
CPU average last 24 hours
CPU average last 2 hours
CPU average last 7 days
Memory average last 24 hours
Memory average last 2 hours
Memory average last 7 days
Average temperature last 7 days
Average temperature last 2 hours
Average temperature last 24 hours
Monitor settings
Monitor status changes

<Views and Layouts> 211
IM 43D07N10-01EN 6th Edition: Mar. 10, 2022-00
Collection settings:
In the Collection Settings screen, users can see all the data parameters that are available for collection by MSS.
Figure 4.15-4 Collection settings of Network assets
Collection Settings

<Views and Layouts> 212
IM 43D07N10-01EN 6th Edition: Mar. 10, 2022-00
Users can manage/collect the following data parameters of a Network asset.
Table 4.15-5 Data collection parameters of Network assets
Collection Type Field Name Description
Inventory Interfaces List of Physical and Virtual network ports.
Power Supplies List of Attached Power Supply units.
System Descriptive Information about the system.
VLAN’s* VLAN’s to which the asset belongs to.
Metrics** CPU & Memory CPU & Memory usage.
Interface Packets Information of network packets flowing through the device ports.
Temperature Temperature of the asset.
Uptime System uptime information.
Logs Syslog System level logs.
*VLAN’s are available only for routers and switches.
**Metrics are collected as snapshots at a specified interval
Note: Time server has 3 metrics items; “Clock info”, “Temperature” and “Uptime”
Remote settings:
In remote settings page, users can create and manage a remote profile. This is used to connecting to the Network asset.
Figure 4.15-5 Remote settings of Compute asset
For more details, please refer to Chapter 6. Remote Operations
Remote settings
Add remote access profile

<Views and Layouts> 213
IM 43D07N10-01EN 6th Edition: Mar. 10, 2022-00
Center-view
In the Center-view, users can see and monitor the onboarded network asset on from the ‘network asset.’
A field asset has seven sub-menus. The information is available inside the sub-menus on successful data collection from Site component.
① Overview
② Syslog (Only if syslog is enabled in collection settings)
③ Metrics
④ Network Interfaces
⑤ System
⑥ Vlans (Only for switch and router)
⑦ Time Service (Only for time server)
Figure 4.15-6 Detailed view of Network assets in Center component
Interactive view
Network sub-menu

<Views and Layouts> 214
IM 43D07N10-01EN 6th Edition: Mar. 10, 2022-00
Overview:
The overview provides a helpful snapshot of the network asset immediately.
Figure 4.15-7 Overview of Network asset
The metrics summary shows the following values
Table 4.15-6 Overview of Network asset
Info Type Field Field Field Field
Overview Uptime CPU usages Memory usages Temperature
Data summary contains the values provided in Asset settings ‘(
Table 4.15-1 Asset settings fields of Network asset)’
Overview
Data summary
Metrics summary

<Views and Layouts> 215
IM 43D07N10-01EN 6th Edition: Mar. 10, 2022-00
Syslog:
Users can monitor the events occurring in the network asset in real-time from the Syslog section.
Based on the selected period, users can see the logs logged by the network asset to the syslog server
Figure 4.15-8 Syslog of Network asset
Syslog
Time picker

<Views and Layouts> 216
IM 43D07N10-01EN 6th Edition: Mar. 10, 2022-00
To know more details about an event, click on it.
Figure 4.15-9 Syslog details of a Network asset
Table 4.15-7 Fields of Syslog Details
Field Name Description
Log details Description of the reported log from the network asset.
Date & Time Time at which the log was generated at asset.
Host The IP of Network asset. The value here is populated based on the entry of ‘host’ field in MSS site component.
Program The program in network asset which generated the log.
Source The IP address of the network asset.
Facility A facility code is used to specify the type of program that is logging the message.
Severity Severity specifies the type of message/notification reported by the network asset.
Priority Priority of the alert.
Syslog details

<Views and Layouts> 217
IM 43D07N10-01EN 6th Edition: Mar. 10, 2022-00
Metrics:
Users can see average real-time statistics of various metrics collected from network devices
Figure 4.15-10 Metrics of a Network Asset (Switch)
Metric details

<Views and Layouts> 218
IM 43D07N10-01EN 6th Edition: Mar. 10, 2022-00
Network interfaces:
The network interfaces of the devices can be seen here.
Figure 4.15-11 Network Interface submenu of network asset (switch)
To know the changes of the interface over the period, click on
Figure 4.15-12 Network Interface details of a network asset (switch)
Network interface settings
Click for details
Network interface details

<Views and Layouts> 219
IM 43D07N10-01EN 6th Edition: Mar. 10, 2022-00
System:
System provides us with the option to see power statistics and system information configured on the network device.
The system information here is different from the info provided from MSS. The source of this information is from the actual device.
Figure 4.15-13 System Info of Network Asset
System view

<Views and Layouts> 220
IM 43D07N10-01EN 6th Edition: Mar. 10, 2022-00
VLAN’s: (Switches and Routers only)
In VLAN, users can see all the available virtual networks of the network device.
Figure 4.15-14 VLAN details of Network assets (Switch and Router)
Each VLAN is associated with the Network port of the device. The changes over the port can be tracked by clicking on .
Figure 4.15-15 Vlan changes of Network assets (Switch and Router)
Vlan info
Click for details
Vlan details

<Views and Layouts> 221
IM 43D07N10-01EN 6th Edition: Mar. 10, 2022-00
Time Server (Time Services):
Figure 4.15-16 Time services of Network assets (time server only)
Time services setting

<Views and Layouts> 222
IM 43D07N10-01EN 6th Edition: Mar. 10, 2022-00
4.16 Environmental assets
Environmental assets collect ‘environment data’ in a plant and prevent failures caused by deterioration due to the environment. E.g.: Online Diagnostic Unit (ODU)
The Environmental assets menu is available in both Site and Center components. The site component deals with controlling and managing the asset, while the Center component is responsible for visualizing the collected data.
A detailed view provides information about an Environmental asset. The layout of a detailed view consists of an ‘interactive view’ and ‘env asset sub-menu.’
The interactive view is used by users to interact with the asset. While ‘env asset sub-menu’ contains various options through which users can interact with the ‘asset.’
Figure 4.16-1 Detailed View of Environmental asset in Center component
REFERENCE
For more details, please refer to https://www.yokogawa.com/solutions/services/asset-performance-monitoring/environment-monitoring-service/
Env asset sub-menu
Interactive view

<Views and Layouts> 223
IM 43D07N10-01EN 6th Edition: Mar. 10, 2022-00
Site-view
An Environmental asset, in Site, has four options.
① Asset settings:
It provides information about the asset.
② Monitor settings
A monitor can be configured on the asset to alert the MSS users in case of specific events.
③ Collection settings
It allows the user to view and configure the data collected from the asset
④ Remote settings
It allows the users to manage remote profiles, which are used to remotely access the asset from MSS site or center component.
MSS R1.5 can collect data from 1 type of Environmental asset - ODU.

<Views and Layouts> 224
IM 43D07N10-01EN 6th Edition: Mar. 10, 2022-00
Asset settings:
In the ‘Asset Settings’ screen of ODU asset, users can: ① View and update the information of the asset.
② Execute a connection test to verify the connectivity between MSS and asset. ③ Set Operational status of an asset.
Figure 4.16-2 Asset settings of ODU asset
The ‘Last updated’ field provides the time when the asset was last modified. The asset related fields available for view and modification are:
Table 4.16-1 Asset settings fields of ODU asset*
Field Name Description
Asset Name A name for users to identify. MSS allows duplicate registration of titles.
Role Asset’s role. E.g., an ODU.
Custodian A registered user. Someone responsible for the asset.
Collector IP Address (EWS or SENG) The IP address of HIS, which facilitates data collection.
Priority Importance of the asset.
Location The physical location of the asset. E.g.: building name or room name etc.
Description General information about the asset.
*Field information excluding any custom fields

<Views and Layouts> 225
IM 43D07N10-01EN 6th Edition: Mar. 10, 2022-00
Monitor settings:
In the monitor settings field screen, users can see and interact with all the available monitors.
Figure 4.16-3 Monitor settings of ODU asset
Available monitors are:
Table 4.16-2 Monitor information of ODU assets
Monitor
Average temperature last 2 hours
Average temperature last 24 hours
Average temperature last 7 days
Average humidity last 2 hours
Average humidity last 24 hours
Average humidity last 7 days
Average isolation last 2 hours
Average isolation last 24 hours
Average isolation last 7 days
Average contact last 2 hours
Average contact last 24 hours
Average contact last 7 days
Average dust last 2 hours
Average dust last 24 hours
Average dust last 7 days
Average corrosion last 2 hours
Average corrosion last 24 hours
Monitor settings
Monitor status changes

<Views and Layouts> 226
IM 43D07N10-01EN 6th Edition: Mar. 10, 2022-00
Average corrosion last 7 days
Collection settings:
In the Collection settings screen, users can see all the data parameters that are available for collection by MSS.
Figure 4.16-4 Collection settings of ODU
Users can manage/collect the following data parameters of an ODU.
Table 4.16-3 Data collection parameters of ODU assets
Collection Type Field Name Description
ODU Collector Sensor Information collected by Sensor in ODU.
Operational status Heartbeat Information about if MSS communicate with the asset

<Views and Layouts> 227
IM 43D07N10-01EN 6th Edition: Mar. 10, 2022-00
Remote Access Settings:
In remote settings page, users can create and manage a remote profile. An ODU cannot be accessed directly. However, from this screen, users can remote into a Compute asset (which can use telnet) to remote into ODU.
Figure 4.16-5 Remote settings of ODU
For more details, please refer to Chapter 6. Remote Operations
Remote settings
Add remote access profile

<Views and Layouts> 228
IM 43D07N10-01EN 6th Edition: Mar. 10, 2022-00
Center-view
In the Center-view, users can see and monitor the onboarded Environmental asset from the ‘Environmental asset.’
A field asset has two sub-menus. The information is available inside the sub-menus on successful data collection from Site component.
① Overview
② Metrics
Overview:
The overview provides a helpful snapshot of the Environmental asset immediately.
Figure 4.16-6 Overview of ODU asset
The metrics summary shows the following values.
Table 4.16-4 Overview of ODU asset
Info Type Field Field Field
Overview Temperature Humidity Isolation
Contact Dust Corrosion
Data summary contains the values provided in Asset settings ‘(Table 4.16-1 Asset settings fields of ODU asset)’
Overview
Metrics summary
Data summary

<Views and Layouts> 229
IM 43D07N10-01EN 6th Edition: Mar. 10, 2022-00
Metrics:
Users can see average real-time statistics of various metrics collected from Environmental assets.
Figure 4.16-7 Metrics of an ODU asset
Metrics

<Views and Layouts> 230
IM 43D07N10-01EN 6th Edition: Mar. 10, 2022-00
4.17 Remote settings
One of the key functions of MSS is Remote access. Once an asset is onboarded on MSS Site component, it can be accessed remotely through both MSS site and center component.
The process of remote login will be discussed in detail in the Chapter 6. Remote Operations
In this section, we discuss one of the pre-configuration items required for Remote Access - Remote settings.
The configuration discussed here is applicable to:
① Compute assets
② PLC/DCS assets
③ Network assets
④ Environmental assets
⑤ Security applications
⑥ Control applications
⑦ Asset Management applications
One of the key pre-requisites for remote access to asset is - Remote profile.
Remote profile is an MSS configurable form that stores remote login information and settings used in connecting to an asset.
E.g.: Username, Password, Screen Size etc.
MSS support remote connectivity through three different protocols:
① RDP (Remote Desktop Protocol)
② VNC (Virtual Network Computing)
③ SSH (Secure Shell)
We will explore these protocols in the next sections.

<Views and Layouts> 231
IM 43D07N10-01EN 6th Edition: Mar. 10, 2022-00
RDP
Remote Desktop Protocol is developed by Microsoft. RDP works by employing a Client-Server model. The system which initiates the RDP connection has an RDP client software while the other system, which is remotely accessed must run RDP server software.
MSS has built-in RDP client which is used when connecting to an MSS asset/application. Hence, there are no special software installations required at users’ machine to access an MSS asset/application through MSS.
Figure 4.17-1 Successful RDP Connection
Remote access by RDP has by far the most settings for the user to be set. To log in with all the default settings, only a couple fields are required (hostname, port, username, password), but the user has many optional settings that are listed below.
The available settings and fields of an RDP profile are as follows:

<Views and Layouts> 232
IM 43D07N10-01EN 6th Edition: Mar. 10, 2022-00
Figure 4.17-2 Remote Access Settings - RDP

<Views and Layouts> 233
IM 43D07N10-01EN 6th Edition: Mar. 10, 2022-00
Table 4.17-1 RDP Profile Settings
Settings Field Name Description
Connection settings
Name The hostname or IP address of the RDP server
Port The port where RDP server is listening on. This parameter is optional. If this is not specified, the standard port for RDP (3389) or Hyper-V's default port for VMConnect (2179) will be used, depending on the security mode selected.
Authentication and Security
Domain The domain to use when attempting authentication, if any. This parameter is optional.
Username The username to use to authenticate, if any. This parameter is optional.
Password The password to use when attempting authentication, if any. This parameter is optional.
Security Mode
Any Automatically select the security mode based on the security protocols supported by both the client and the server. This is the default.
Network Level Authentication
Network Level Authentication sometimes also referred to as "hybrid" or CredSSP (the protocol that drives NLA). This mode uses TLS encryption and requires the username and password to be given in advance. Unlike RDP mode, the authentication step is performed before the remote desktop session starts, avoiding the need for the Windows server to allocate significant resources for users that may not be authorized.
Network Level Authentication Extended
Extended Network Level Authentication. This mode is identical to NLA except that an additional "Early User Authorization Result" is required to be sent from the server to the client immediately after the NLA handshake is completed.
TLS Encryption
RDP authentication and encryption implemented via TLS (Transport Layer Security). Also referred to as RDSTLS, the TLS security mode is primarily used in load balanced configurations where the initial RDP server may redirect the connection to a different RDP server.
Hyper-V / VM Connect
Automatically select the security mode based on the security protocols supported by both the client and the server, limiting that negotiation to only the protocols known to be supported by Hyper-V / VMConnect.
RDP Encryption
Standard RDP encryption. This mode is generally only used for older Windows servers or in cases where a standard Windows login screen is desired. Newer versions of Windows have this mode disabled by default and will only accept NLA unless explicitly configured otherwise.
Disable authentication
If set to "true", authentication will be disabled. Note that this refers to authentication that takes place while connecting. Any authentication enforced by the server over the remote desktop session (such as a login dialog) will still take place. By default, authentication is enabled and only used when requested by the server.
Ignore Server Certificate
If set to "true", the certificate returned by the server will be ignored, even if that certificate cannot be validated. This is useful if you universally trust the server and your connection to the server, and you know that the server's

<Views and Layouts> 234
IM 43D07N10-01EN 6th Edition: Mar. 10, 2022-00
Settings Field Name Description
certificate cannot be validated (for example, if it is self-signed).
Session Recording Settings
Record Session Records all the remote sessions initiated using the profile
Exclude output The recorded sessions will not contain any visual graphics
Exclude mouse The recorded session will not contain the mouse pointer
Include keys Generates a transcript file with all the keystrokes entered during the remote session
Session Settings
Initial program The full path to the program to run immediately upon connecting. This parameter is optional.
Client name When connecting to the RDP server, MSS will normally provide its own hostname as the name of the client. If this parameter is specified, MSS will use its value instead.
Keyboard layout The server-side keyboard layout. This is the layout of the RDP server and has nothing to do with the keyboard layout in use on the client. The MSS client is independent of keyboard layout. The RDP protocol, however, is not independent of keyboard layout, and MSS needs to know the keyboard layout of the server in order to send the proper keys when a user is typing.
Time zone The time zone that the client should send to the server for configuring the local time display of that server. The format of the time zone is in the standard IANA key zone format, which is the format used in UNIX/Linux. This will be converted by RDP into the correct format for Windows.
Administrator console If set to "true", you will be connected to the console (admin) session of the RDP server.
Display Settings
Width The width of the display to request in pixels. This parameter is optional. If this value is not specified, the width of the connecting client display will be used instead.
Height The height of the display to request in pixels. This parameter is optional. If this value is not specified, the height of the connecting client display will be used instead.
DPI The desired effective resolution of the client display in DPI. This parameter is optional. If this value is not specified, the resolution and size of the client display will be used together to determine, heuristically, an appropriate resolution for the RDP session.
Color depth The color depth to request in bits-per-pixel. This parameter is optional. If specified, this must be either 8, 16, or 24. Regardless of what value is chosen here, if an update uses less than 256 colors, MSS will always send that update as a 256-color PNG.
Resize method The method to use to update the RDP server when the width or height of the client display changes. This parameter is optional. If this value is not specified, no action will be taken when the client display changes size. Possible values are: Display-update Uses the display update channel added with RDP 8.1 to

<Views and Layouts> 235
IM 43D07N10-01EN 6th Edition: Mar. 10, 2022-00
Settings Field Name Description
signal the server when the client display size has changed Reconnect: Automatically disconnects the RDP session when the client display size has changed, and reconnects with the new size
Device redirection
Support audio in console If set to "true", audio will be explicitly enabled in the console (admin) session of the RDP server.
Disable audio Audio is enabled by default in both the client and in libguac-client-rdp. If you are concerned about bandwidth usage, or sound is causing problems, you can explicitly disable sound by setting this parameter to "true".
Enable audio input If set to "true", audio input support (microphone) will be enabled, leveraging the standard "AUDIO_INPUT" channel of RDP. By default, audio input support within RDP is disabled.
Enable printing Printing is disabled by default, but with printing enabled, RDP users can print to a virtual printer that sends a PDF containing the document printed to the MSS client. Enable printing by setting this parameter to "true".
Redirect printer name The name of the redirected printer device that is passed through to the RDP session. This is the name that the user will see in, for example, the Devices and Printers control panel. If printer redirection is not enabled, this option has no effect.
Clipboard
Disable copying from remote desktop
If set to "true", text copied within the RDP session will not be accessible by the user at the browser side of the MSS session and will be usable only within the remote desktop. This parameter is optional. By default, the user will be given access to the copied text.
Disable pasting from client If set to "true", text copied at the browser side of the MSS session will not be accessible within the RDP session. This parameter is optional. By default, the user will be able to paste data from outside the browser within the RDP session.
Performance
Enable wallpaper If set to "true", enables rendering of the desktop wallpaper. By default, wallpaper will be disabled, such that unnecessary bandwidth need not be spent redrawing the desktop.
Enable theme If set to "true", enables use of windows theme and controls. By default, theming within RDP sessions is disabled.
Enable font smoothing If set to "true", text will be rendered with smooth edges. Text over RDP is rendered with rough edges by default, as this reduces the number of colors used by text, and thus reduces the bandwidth required for the connection.
Enable full window drag If set to "true", the contents of windows will be displayed as windows are moved. By default, the RDP server will only draw the window border while windows are being dragged.
Enable desktop composition If set to "true", graphical effects such as transparent windows and shadows will be allowed. By default, such effects, if available, are disabled.
Enable menu animations If set to "true", menu open and close animations will be

<Views and Layouts> 236
IM 43D07N10-01EN 6th Edition: Mar. 10, 2022-00
Settings Field Name Description
allowed. Menu animations are disabled by default.
Disable bitmap caching In certain situations, particularly with RDP server implementations with known bugs, it is necessary to disable RDP's built-in bitmap caching functionality. This parameter allows that to be controlled in an MSS session. If set to "true" the RDP bitmap cache will not be used.
Disable off-screen caching RDP normally maintains caches of regions of the screen that are currently not visible in the client in order to accelerate retrieval of those regions when they come into view. This parameter, when set to "true," will disable caching of those regions. This is usually only useful when dealing with known bugs in RDP server implementations and should remain enabled in most circumstances.
Disable glyph caching In addition to screen regions, RDP maintains caches of frequently used symbols or fonts, collectively known as "glyphs." As with bitmap and offscreen caching, certain known bugs in RDP implementations can cause performance issues with this enabled and setting this parameter to "true" will disable that glyph caching in the RDP session.
Remote Desktop Gateway
Gateway-hostname The hostname of the remote desktop gateway that should be used as an intermediary for the remote desktop connection. If omitted, a gateway will not be used.
Gateway-port The port of the remote desktop gateway that should be used as an intermediary for the remote desktop connection. By default, this will be "443".
Gateway-username The username of the user authenticating with the remote desktop gateway, if a gateway is being used. This is not necessarily the same as the user using the remote desktop connection.
Gateway-password The password to provide when authenticating with the remote desktop gateway, if a gateway is being used.
Gateway-domain The domain of the user authenticating with the remote desktop gateway, if a gateway is being used. This is not necessarily the same domain as the user using the remote desktop connection.
Remote App Remote application directory The working directory, if any, for the remote application. This parameter has no effect if RemoteApp is not in use.
Remote application Specifies the RemoteApp to start on the remote desktop. If supported by your remote desktop server, this application, and only this application, will be visible to the user. Windows requires a special notation for the names of remote applications. The names of remote applications must be prefixed with two vertical bars. For example, if you have created a remote application on your server for notepad.exe and have assigned it the name "notepad", you would set this parameter to: "||notepad".
Remote application arguments
The command-line arguments, if any, for the remote application. This parameter has no effect if RemoteApp is not in use.
Preconnection PDU / Hyper-V
RDP source ID The numeric ID of the RDP source. This is a non-negative integer value dictating which of potentially

<Views and Layouts> 237
IM 43D07N10-01EN 6th Edition: Mar. 10, 2022-00
Settings Field Name Description
several logical RDP connections should be used. This parameter is optional and is only required if the RDP server is documented as requiring it. If using Hyper-V, this should be left blank.
Preconnection BLOB (VM ID) An arbitrary string which identifies the RDP source - one of potentially several logical RDP connections hosted by the same RDP server. This parameter is optional, and is only required if the RDP server is documented as requiring it, such as Hyper-V. In all cases, the meaning of this parameter is opaque to the RDP protocol itself and is dictated by the RDP server. For Hyper-V, this will be the ID of the destination virtual machine.

<Views and Layouts> 238
IM 43D07N10-01EN 6th Edition: Mar. 10, 2022-00
VNC
VNC is a platform independent. There are clients for many GUI-based operating systems and Java. VNC by default uses TCP port 5900. The settings for the VNC profile are listed as follows:
Figure 4.17-3 Remote Access Settings - VNC

<Views and Layouts> 239
IM 43D07N10-01EN 6th Edition: Mar. 10, 2022-00
Table 4.17-2 VNC Profile Settings
Settings Field Name Description
Connection Settings
Name The hostname or IP address of the VNC server
Port
The port the VNC server is listening on. This parameter is optional. If this is not specified, the standard port for RDP (3389) or Hyper-V's default port for VMConnect (2179) will be used, depending on the security mode selected.
Authentication Settings
Username The username to use when attempting authentication, if any. This parameter is optional
Password The password to use when attempting authentication, if any. This parameter is optional.
Session Recording Settings
Record Session Records all the remote sessions initiated using the profile
Exclude output The recorded sessions will not contain any visual graphics
Exclude mouse The recorded session will not contain the mouse pointer
Include keys Generates a transcript file with all the keystrokes entered during the remote session
Display
Cursor
If set to "remote", the mouse pointer will be rendered remotely, and the local position of the mouse pointer will be indicated by a small dot. A remote mouse cursor will feel slower than a local cursor but may be necessary if the VNC server does not support sending the cursor image to the client.
Color depth
The color depth to request, in bits-per-pixel. This parameter is optional. If specified, this must be either 8, 16, 24, or 32. Regardless of what value is chosen here, if an update uses less than 256 colors, MSS will always send that update as a 256-color PNG.
Read only
Whether this connection should be read-only. If set to "true", no input will be accepted on the connection at all. Users will only see the desktop and whatever other users using that same desktop are doing. This parameter is optional.
Swap red/blue components
If the colors of your display appear wrong (blues appear orange or red, etc.), it may be that your VNC server is sending image data incorrectly, and the red and blue components of each color are swapped. If this is the case, set this parameter to "true" to work around the problem. This parameter is optional.
Clipboard
Disable copy from remote
If set to "true", text copied within the telnet session will not be accessible by the user at the browser side of the MSS session and will be usable only within the terminal. This parameter is optional. By default, the user will be given access to the copied text.
Disable paste from client
If set to "true", text copied at the browser side of the MSS session will not be accessible within the telnet session. This parameter is optional. By default, the user will be able to paste data from outside the browser within the terminal.
Encoding
The encoding to assume for the VNC clipboard. This parameter is optional. By default, the standard encoding ISO 8859-1 will be used. Only use this parameter if you are sure your VNC server supports other encodings beyond the standard ISO 8859-1.
Device Redirection
Audio server name
The name of the PulseAudio server to connect to. This will be the hostname of the computer providing audio for your connection via PulseAudio, most likely the same as the value given for the hostname parameter. If this parameter is omitted, the default PulseAudio device will be used
Enable audio If set to "true", audio support will be enabled, and a second connection for PulseAudio will be made in addition to the VNC connection. By default, audio support within VNC is disabled.

<Views and Layouts> 240
IM 43D07N10-01EN 6th Edition: Mar. 10, 2022-00
SSH
Secure Shell (SSH) is a cryptographic network protocol for operating network services securely over an unsecured network. Typical application includes remote command-line, login and remote command execution.
Figure 4.17-4 Successful SSH connection
The settings that can be selected and adjusted for the SSH profile are listed below:

<Views and Layouts> 241
IM 43D07N10-01EN 6th Edition: Mar. 10, 2022-00
Figure 4.17-5 Remote Access Settings - SSH
Table 4.17-3 SSH Profile Settings
Settings Field Name Description
Asset Details
Name The hostname or IP address of the SSH server MSS should connect to.
Port The port of SSH server is listening on, usually 22. This parameter is optional. If this is not specified, the default of 22 will be used.
Host key
The known hosts entry for the SSH server. This parameter is optional, and, if not provided, no verification of host identity will be done. If the parameter is provided the identity of the server will be checked against the data. The format of this parameter is that of a single entry from an OpenSSH known_hosts file.
Session Recording Settings
Record Session Records all the remote sessions initiated using the profile.
Exclude output The recorded sessions will not contain any visual graphics.
Exclude mouse The recorded session will not contain the mouse pointer.

<Views and Layouts> 242
IM 43D07N10-01EN 6th Edition: Mar. 10, 2022-00
Settings Field Name Description
Include keys Generates a transcript file with all the keystrokes entered during the remote session.
Authentication Settings
Username The username to use to authenticate, if any. This parameter is optional. If not specified, you will be prompted for the username upon connecting.
Password The password to use when attempting authentication, if any. This parameter is optional. If not specified, you will be prompted for your password upon connecting.
Passphrase
The passphrase to use to decrypt the private key for use in public key authentication. This parameter is not needed if the private key does not require a passphrase. If the private key requires a passphrase, but this parameter is not provided, the user will be prompted for the passphrase upon connecting.
Private key
The entire contents of the private key to use for public key authentication. If this parameter is not specified, public key authentication will not be used. The private key must be in OpenSSH format, as would be generated by the OpenSSH ssh-keygen utility.
Display Color scheme The color scheme to use for the terminal emulator used by SSH connections.
Clipboard
Disable copy from remote
If set to "true", text copied within the telnet session will not be accessible by the user at the browser side of the MSS session and will be usable only within the terminal. This parameter is optional. By default, the user will be given access to the copied text.
Disable paste from client
If set to "true", text copied at the browser side of the MSS session will not be accessible within the telnet session. This parameter is optional. By default, the user will be able to paste data from outside the browser within the terminal.
Terminal behavior Backspace key binding
This parameter controls the ASCII code that the backspace key sends to the remote system. Under most circumstances this should not need to be adjusted; however, if, when pressing the backspace key, you see control characters (often either ^? or ^H) instead of seeing the text erased, you may need to adjust this parameter. By default, the terminal sends ASCII code 127 (Delete) if this option is not set.

<Views and Layouts> 243
IM 43D07N10-01EN 6th Edition: Mar. 10, 2022-00
Web
While RDP, VNC and SSH allow users to connect to a system, Web protocol allows users to connect to only to a web application hosted on a system through HTTP or HTTPS. So, Web Remote access protocol is suitable for devices which expose a Web interface such as IIS, Apache Web server, Nginx etc.
Figure 4.17-6 Comparison of Web Protocols and other Protocols in MSS
Figure 4.17-7 Remote Access Settings - WEB

<Views and Layouts> 244
IM 43D07N10-01EN 6th Edition: Mar. 10, 2022-00
Table 4.17-4 ‘Web Remote Access’ Profile Settings
Settings Field Name Description
Asset Details
Name The name of the Web Remote Access Profile
URL URL of the web application to connect to
Limit Network Connectivity
Specifies the Connection scope of MSS If true, users can connect only to the IP address/URL’s that specified in Web profile’s URL filed and/or Host file
Host Settings Host file Allows admins to carry out local name resolution for assets in private network
Session Recording Settings
Record Session Records all the remote sessions initiated using the profile.
Exclude output The recorded sessions will not contain any visual graphics.
Exclude mouse The recorded session will not contain the mouse pointer.
Include keys Generates a transcript file with all the keystrokes entered during the remote session.
Clipboard
Disable copying from remote desktop
If set to "true", text copied within the telnet session will not be accessible by the user at the browser side of the MSS session and will be usable only within the terminal. This parameter is optional. By default, the user will be given access to the copied text.
Disable pasting from client
If set to "true", text copied at the browser side of the MSS session will not be accessible within the telnet session. This parameter is optional. By default, the user will be able to paste data from outside the browser within the terminal.

<Views and Layouts> 245
IM 43D07N10-01EN 6th Edition: Mar. 10, 2022-00
4.18 Sessions
This section describes ‘Sessions’ menu in MSS. This menu is available only in Site component.
When a user initiates a remote session to the asset from MSS, MSS creates a ‘session’.
In session, user can view and manage remote access requests and sessions of the assets, on which, they have access over. Based on the permissions assigned to the MSS user, they can view the requests made not just by themselves, but by other users as well.
The user can get information about the remote requests and sessions from its two sub-menus.
Figure 4.18-1 Sessions sub-menus in Site component
REFERENCE
For more details about Remote Operations, please refer to Chapter 6. Remote Operations

<Views and Layouts> 246
IM 43D07N10-01EN 6th Edition: Mar. 10, 2022-00
Requests
As discussed earlier, a request refers to a ‘session request’ that is created by an MSS user who doesn’t have permissions to directly access an MSS asset.
In the Requests view, the user can see a list of requests that were made by users over the assets.
A Request can be in any of the following states:
Table 4.18-1 Available states of a Remote Session ‘Request’
Status Description
Awaiting approval A new remote access request which is pending admin action
Approved An approved remote access request
Denied A remote access request which was denied by the administrator
Revoked An access request, which was initially approved, but later revoked
Expired An access request which has expired. No further operations can be performed on a revoked request.
Future approved An approved request, whose session start time is in future than current time
Figure 4.18-2 Requests view in Sessions
To get more information about the request, the user can click on it.

<Views and Layouts> 247
IM 43D07N10-01EN 6th Edition: Mar. 10, 2022-00
Figure 4.18-3 Information view of request
Table 4.18-2 Remote Request Approval window
Field Name Description
ID ID of the request
User The MSS user who requested access
Target asset The asset on which the access was requested
Start Time The time from which the session is valid
End Time The time until which the session is valid
Ticket / Call ID Information provided by the user to justify access to the asset. E.g.: Service-Now case number
Reason for connecting Information provided by the user to justify access to the asset. A short message from user to administrator
Message from administrator A short message from administrator after the action has been processed
Message to user A short message from administrator after the action has been processed

<Views and Layouts> 248
IM 43D07N10-01EN 6th Edition: Mar. 10, 2022-00
Sessions
In sessions, remote administrators can see the details of all the remote sessions.
A Session can be in one of the following states:
Table 4.18-3 Available States of a Remote ‘Session’
Status Description
Active A remote session is currently active by an MSS user or administrator.
Inactive The session is not in use.
Revoked An active remote session was revoked by MSS administrator.
Figure 4.18-4 Sessions menu in Site component
“By clicking on a session, view the details of the session
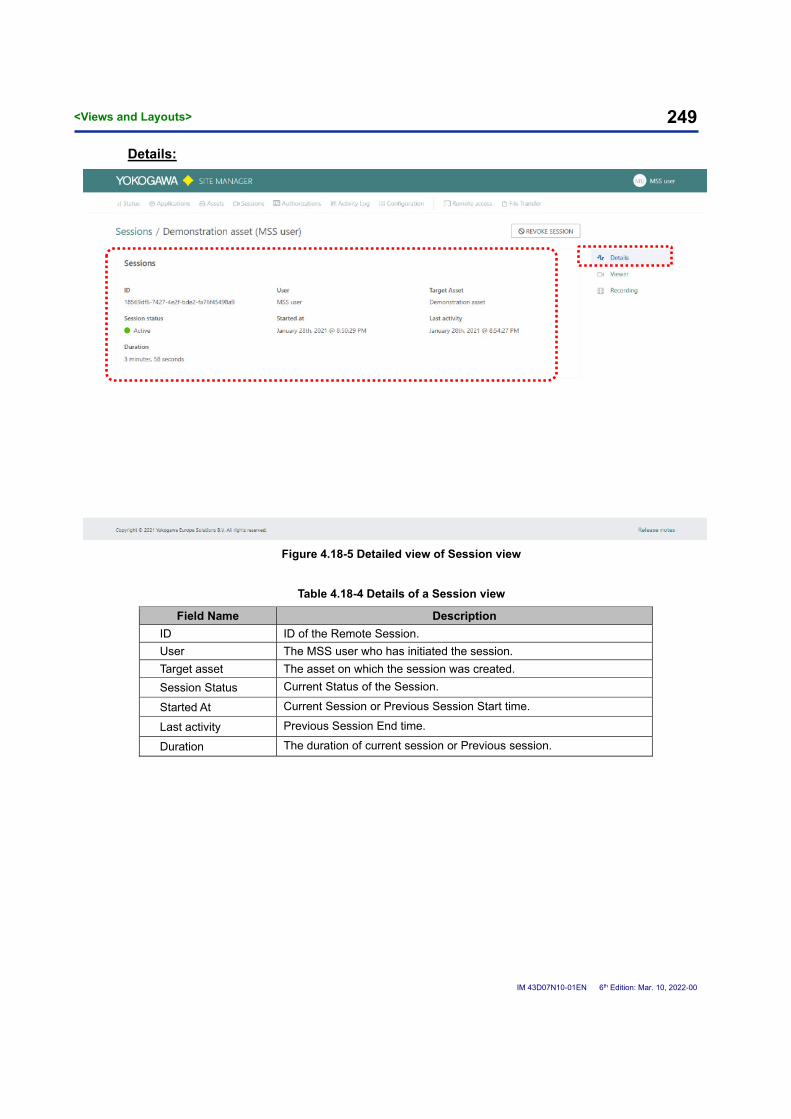
<Views and Layouts> 249
IM 43D07N10-01EN 6th Edition: Mar. 10, 2022-00
Details:
Figure 4.18-5 Detailed view of Session view
Table 4.18-4 Details of a Session view
Field Name Description
ID ID of the Remote Session.
User The MSS user who has initiated the session.
Target asset The asset on which the session was created.
Session Status Current Status of the Session.
Started At Current Session or Previous Session Start time.
Last activity Previous Session End time.
Duration The duration of current session or Previous session.

<Views and Layouts> 250
IM 43D07N10-01EN 6th Edition: Mar. 10, 2022-00
Viewer:
Figure 4.18-6 Viewer in a Session

<Views and Layouts> 251
IM 43D07N10-01EN 6th Edition: Mar. 10, 2022-00
Recording:
The recorded sessions can be downloaded from the ‘Recording’ view of the Session. To start the download, click on the ‘ Export’ button.
Figure 4.18-7 Recording in a session corresponding
For more information, please refer to 6.3.2 Viewing and Downloading a Remote Session

<Views and Layouts> 252
IM 43D07N10-01EN 6th Edition: Mar. 10, 2022-00
4.19 Activity Log
In ‘Activity Log’ administrators can see the details of all the activities performed by the users on an MSS site.
Figure 4.19-1 Activity Log of Site Component
A user can see following types of activities:
Table 4.19-1 List of Activities in Activity Log
Category Activity Name Description
User Authentication
User login User sign in activity.
User logout User sign out activity.
User Management
Create Providing permission for a user on an object.
Delete Removing permission for a user from an object.
User Import Adding a new MSS user to a site.
Asset Management
Create Onboarding a new asset to MSS site.
Update Modifying the information about the asset.
Delete Removing an asset from MSS site.

<Views and Layouts> 253
IM 43D07N10-01EN 6th Edition: Mar. 10, 2022-00
More details can be seen by clicking on ‘ ’ and ‘ ’ icon for:
Update activity of Asset management and Delete activity of both user management and asset management.
Figure 4.19-2 Activity Details of Update asset management activity

<Views and Layouts> 254
IM 43D07N10-01EN 6th Edition: Mar. 10, 2022-00
4.20 Authorizations
The authorizations menu in the Site component provides a way to manage the MSS users and groups at the Site level.
The authorizations menu consists of two sub-menus:
① Users
② Groups
Users
Navigate to ‘Users’ through Authorizations > Users
Figure 4.20-1 List-view of Users
The data table contains the following columns:
Table 4.20-1 Information on MSS user
Field Name Description
User First name and last name of the user account in Site.
Email address The email address of the registered user.
Status Status of the User: ‘Active’ or ‘Inactive.’
Last login Time since the user’s last login. If the user has never logged in, the status is ‘Never.’
To get more information about a single user, click on a user from the list to navigate to the detailed view of the user.
User list

<Views and Layouts> 255
IM 43D07N10-01EN 6th Edition: Mar. 10, 2022-00
User details
A user has four sub-menus that is accessible through the user side menu:
① User settings
② Groups
③ Permission
④ Object permissions
User settings:
This menu provides details of the MSS user. The values displayed in User settings are the same as Table 4.20-1 Information on MSS user. The additional User ID field is an internal reference Id used by MSS.
Figure 4.20-2 User settings of MSS Site user
User settings

<Views and Layouts> 256
IM 43D07N10-01EN 6th Edition: Mar. 10, 2022-00
Groups:
A user account can be part of an MSS group and inherit permissions from it.
In the groups view, MSS administrator can see where the user account belongs to and can manage user’s group settings. They can also add the user to another group by clicking on ‘ADD GROUP’.
Figure 4.20-3 Group view of MSS user
Permissions:
MSS administrators can manage the permissions of a user over a given site via the Permission view. Permission view consists of:
Authorizations
Applications
Assets
Discovery
Remote access – Connections
Remote access – Management
Remote access – Profile
File transfers
Monitors
Site configuration
Dashboards
Admin
Groups view

<Views and Layouts> 257
IM 43D07N10-01EN 6th Edition: Mar. 10, 2022-00
An MSS administrator can check or uncheck permissions here. This action controls the operations and activities the user can perform on a given site.
Figure 4.20-4 Permissions of an MSS user
Object permissions:
Refer to Chapter 4.20.5 Object Permissions for more details
Permissions

<Views and Layouts> 258
IM 43D07N10-01EN 6th Edition: Mar. 10, 2022-00
Groups
Navigate to ‘Groups through Authorizations > Groups
Figure 4.20-5 List-view of Groups
To get more information about a single group, click on it from the list to navigate to the detailed view of the group.
Group list

<Views and Layouts> 259
IM 43D07N10-01EN 6th Edition: Mar. 10, 2022-00
Group details
A group has four sub-menus that is accessible through the user side menu:
① Group settings
② Members
③ Permission
④ Object Permissions
Group Settings:
This sub-menu provides name of the group.
Figure 4.20-6 Group settings of MSS Site User
Group settings

<Views and Layouts> 260
IM 43D07N10-01EN 6th Edition: Mar. 10, 2022-00
Members:
In the Members view, MSS administrator can view the user accounts the group consists of. They can also add another user to the group by clicking on ‘ADD USER.
Figure 4.20-7 Members view of a Group
Permissions:
MSS administrators can manage the permissions of a user over a given site via the Permission view. The view consists of:
Authorizations
Applications
Assets
Discovery
Remote Access – Connections
Remote Access – Management
Remote Access – Profile
File Transfers
Monitors
Site Configuration
Dashboards
Admin

<Views and Layouts> 261
IM 43D07N10-01EN 6th Edition: Mar. 10, 2022-00
An MSS administrator can check or uncheck permissions here. This action controls the operations and activities the user can perform on a given site.
Figure 4.20-8 Permissions of an MSS user

<Views and Layouts> 262
IM 43D07N10-01EN 6th Edition: Mar. 10, 2022-00
Object Permissions
MSS offers global and object permissions for asset/application types that can be used to add permissions for specific objects to users or groups. (Used when you want to link only some Object privileges.)
Object Permissions enables users and groups to be assigned with authority to a specific asset or application. This allows users and groups to have more control to an asset or application compared to the default settings that comes upon creating a new users or groups.
Figure 4.20-9 Object Permissions of MSS User / Groups
SUPPLEMENT
Site administrators determine the access level of individual users and groups.
The following represents how the permissions are applied and works in MSS.
Permissions are across asset categories. The precedence is always
Group Permissions > User Permissions > Object Permissions.

<Views and Layouts> 263
IM 43D07N10-01EN 6th Edition: Mar. 10, 2022-00
Figure 4.20-10 Object Permissions hierarchy in MSS
If a user already is inheriting some permissions from users or groups, they can perform the operations on all the assets in the category. In this situation object permissions cannot be applied.
However, when user or group permissions are not assigned, Object permissions are used to allow the operations here.

<Views and Layouts> 264
IM 43D07N10-01EN 6th Edition: Mar. 10, 2022-00
System Groups
MSS 1.5 contains built-in System Groups. Like Regular Groups, System Groups allow its members to inherit permissions.
System Groups are used by Yokogawa Support engineers to troubleshoot system related issues and carry out periodic maintenance activities.
A System group cannot be deleted or edited from Site Component. Regular MSS user cannot be added/removed to/from System Groups as well. Management of System Groups are done internally from Yokogawa.
Figure 4.20-11 System Groups in Site Component
Every Site (version 1.5 and above) consists of three System Groups:
1. mss_site_full_admin – A member of this group is a Full admin and can perform all actions in MSS Site.
2. mss_site_readonly_admin – A member of this group is a Read only admin and can see all the contents of a Site.
A ‘read-only admin’ cannot use Remote access function. So, they cannot connect to an asset/application.
3. mss_site_support_admin – A member of this group can provide remote support.
A support admin can use Remote access function. So, they can provide asset/application support.
A User who inherits permissions from a System Group, can also perform allowed activities in Center in the corresponding group.

<Views and Layouts> 265
IM 43D07N10-01EN 6th Edition: Mar. 10, 2022-00
4.21 Remote Access
Remote Access is a User-Menu available to all users. It functions similar to 4.18.1 Requests.
However, the key difference is, requests provides “Approve” or “Deny” operations for administrators, while Remote Access provides view of requests for users.
Remote Access menu is available in both Center and Site component
Site-view
When a user navigates to Site-view, they can see the following information about all user requests.
Figure 4.21-1 Remote Access list of Site-view
Table 4.21-1 Table Columns of Remote Access
Field Name Description
Target asset The asset which was accessed remotely.
Profile The profile that was used in accessing the Target asset.
Request date The date on which the remote request was made.
Status Status of the Remote access request.

<Views and Layouts> 266
IM 43D07N10-01EN 6th Edition: Mar. 10, 2022-00
By clicking on a session, the user can access more information about a request.
Figure 4.21-2 Session details for users in Site component

<Views and Layouts> 267
IM 43D07N10-01EN 6th Edition: Mar. 10, 2022-00
Center-view
The options provided in center-view are like site-view.
The differences are:
① Center view doesn’t include “USER” filter
② The current user can connect to the asset from center view if the request was approved (note the icon on the far right).
Figure 4.21-3 Remote Access list of Center-view

<Views and Layouts> 268
IM 43D07N10-01EN 6th Edition: Mar. 10, 2022-00
4.22 User Menu
User menu is the option available for the signed-in user. It is available in the header of both Site and Center components.
Settings have two options:
① Sign out
② User settings
Figure 4.22-1 User menu in Site component
User menu

<Views and Layouts> 269
IM 43D07N10-01EN 6th Edition: Mar. 10, 2022-00
Figure 4.22-2 User menu in the Center component
By clicking on ‘Sign out’, user can sign out of MSS Site and Center component.
User menu

<Views and Layouts> 270
IM 43D07N10-01EN 6th Edition: Mar. 10, 2022-00
In the settings menu of Center component, users can see their info (like the information described in Table 4.20-1 Information on MSS user).
Figure 4.22-3 User settings in Center component
In Site-component, addition to these fields, it is possible to modify the language of MSS.
Figure 4.22-4 User settings of Site component
Settings
Language
Settings

<Remote Operations> 271
IM 43D07N10-01EN 6th Edition: Mar. 10, 2022-00
5. Common Operations In this chapter, we discuss some of the everyday operations that an MSS user and administrator can perform on MSS.
First, we discuss operations on the Site Component, and then we discuss the Center component.
5.1 Site component
Login to MSS
Logging into the Application is one of the basic operations in MSS. A typical MSS application follows the following five steps:
① Navigate to the Site component
② Provide your MSS login credentials
③ Configure Multi Factor Authentication*
④ Confirm terms and conditions
⑤ Confirm Login
CAUTION
Some MSS Deployments can be customized to opt out of Multi Factor Authentication. In such scenarios, users will not be presented with a QR Code for sign-in and users can skip this step.
Pre-requisites:
Make sure you have the
① URL of the Site component
② MSS username and password
③ Required permissions and authorizations to login to Site component
④ A Smartphone with Free OTP, Google Authenticator or ‘Microsoft Authenticator’ app
SUPPLEMENT
Site and Center component’s URL are required as a prerequisite to access MSS application. These URL’s are provided by YOKOGAWA, after MSS is deployed. Please refer to deployment documents provided by YOKOGAWA for the URL’s.

<Remote Operations> 272
IM 43D07N10-01EN 6th Edition: Mar. 10, 2022-00
REFERENCE
Google Play Store –
Free OTP: https://play.google.com/store/apps/details?id=org.fedorahosted.freeotp&hl=en&gl=US
Google Authenticator: https://play.google.com/store/apps/details?id=com.google.android.apps.authenticator2&hl=en&gl=US
Microsoft Authenticator: https://play.google.com/store/apps/details?id=com.azure.authenticator&hl=en&gl=US
Apple Store –
Free OTP: https://apps.apple.com/us/app/freeotp-authenticator/id872559395
Google Authenticator: https://apps.apple.com/us/app/google-authenticator/id388497605
Microsoft Authenticator
https://apps.apple.com/us/app/microsoft-authenticator/id983156458
Step 1: Navigate to the site component through any of the supported browsers to get to the site component’s login.
Figure 5.1-1 Login to Site component - Navigation

<Remote Operations> 273
IM 43D07N10-01EN 6th Edition: Mar. 10, 2022-00
Step 2: Provide your login details and click login
Figure 5.1-2 Login to Site component – Enter log in details

<Remote Operations> 274
IM 43D07N10-01EN 6th Edition: Mar. 10, 2022-00
Step 3: Scan the QR Code displayed in your Authenticator Application
Figure 5.1-3 Login to Site component - QR Code screen

<Remote Operations> 275
IM 43D07N10-01EN 6th Edition: Mar. 10, 2022-00
Step 4: In Your Mobile application, Open the Authenticator App and click on “⁝” menu and click on “+ Add account”
Figure 5.1-4 Microsoft Authenticator - Adding a New Account

<Remote Operations> 276
IM 43D07N10-01EN 6th Edition: Mar. 10, 2022-00
Step 5: Select ‘Other account’ (Google, Facebook, etc.)
Figure 5.1-5 Microsoft Authenticator - Choosing Account Type
Step 6: Click on ‘OR ENTER CODE MANUALLY’
Figure 5.1-6 Microsoft Authenticator - Switching from QR Code to Code

<Remote Operations> 277
IM 43D07N10-01EN 6th Edition: Mar. 10, 2022-00
SUPPLEMENT
It is recommended to enter the code manually over scanning QR code. Since scanning a QR code always creates an authenticator profile with ‘OpreX Managed Service Suite’. This leads to Authenticator overwriting the previous profile configured.
Step 7: Specify the Account Details and click ‘Finish’
Figure 5.1-7 Entering Application name is account name and code
SUPPLEMENT
Since every Site and Center require its own unique authentication profile, it is recommended to specify Account Name as – ‘MSS <Site Name / Center Name>’. This can help differentiate between the profiles of Center and multiple Sites.

<Remote Operations> 278
IM 43D07N10-01EN 6th Edition: Mar. 10, 2022-00
Step 8: Get the OTP from authenticator
Figure 5.1-8 OTP from Authenticator
Step 9: Enter the Code from authenticator in MSS and click ‘Submit’. Optionally, you can name your device
Figure 5.1-9 Entering OTP in MSS

<Remote Operations> 279
IM 43D07N10-01EN 6th Edition: Mar. 10, 2022-00
Step 10: Accept Terms & Conditions and click ‘Continue.’
Figure 5.1-10 Login to Site component - Accept Terms & Conditions
Step 11: Confirm Login
On successful login, the ‘Status’ menu of the Site component is shown
Figure 5.1-11 Login to Site component - Successful login
CAUTION
In case you would like to reset your password or setup a new device/reconfigure existing device with multi-factor authentication, please contact YOKOGAWA.

<Remote Operations> 280
IM 43D07N10-01EN 6th Edition: Mar. 10, 2022-00
5.2 Site Component - Common - Search & Filter
Searching & Filtering is a common operation performed both on Site and Center component. Both the operations are performed on a list view.
Search
Searching refers to finding a specific item or object from the data-table.
To search, input a search string in the search box of filter options. The searches are not case sensitive.
Figure 5.2-1 Searching in a list view by Hostname
Here our search string contained a part of the asset’s Hostname that we were looking for. So, we got four results.
However, we can search based on other fields apart from hostname as well. Usually we can search for items against different columns in our data-table if their corresponding filter menu exists.
Let’s search based on location.
Search box
Filter menus

<Remote Operations> 281
IM 43D07N10-01EN 6th Edition: Mar. 10, 2022-00
Figure 5.2-2 Searching in a list by other columns
Filter
Filter refers to narrowing down the items in the user list by applying a specific criterion.
The filter criteria are already populated as filters and are defined by MSS. Users can choose their criteria by applying any of the pre-defined criteria from filter menu.
Let’s apply a location filter to get the asset in Figure 5.2-2 Searching in a list by other columns
Figure 5.2-3 Filtering using a single filter
Multiple filters can be applied simultaneously as well.
If multiple filters are used within a filter menu, objects which meet at least one of the criteria are displayed

<Remote Operations> 282
IM 43D07N10-01EN 6th Edition: Mar. 10, 2022-00
Figure 5.2-4 Filter using multiple filters within the same filter option
If multiple filters are used across filter menus, objects which meet both criteria are displayed.
Adding a third filter - Type:
Figure 5.2-5 Filter using multiple filters across the filter options

<Remote Operations> 283
IM 43D07N10-01EN 6th Edition: Mar. 10, 2022-00
5.3 Site component - Add an MSS user to the Site component
Adding an MSS user is an administrative operation performed by an MSS Administrator (Site) or a Site Focal Point.
This operation made up of three steps:
① Initiate the user addition process from the ‘User list’ menu.
② Provide the details of the user account you want to add
③ Confirm the newly added user.
Pre-requisites:
Make sure you have the
① ‘Add user permissions’ to perform this operation.
② Yokogawa has provisioned the user account that is about to be added
Step 1: Initiate the user addition process from the ‘User list’ menu.
Navigate to Authorizations -> Users
Click on ‘ADD USER’
Figure 5.3-1 Add an MSS user to Site component - Initiating User addition process
ADD USER

<Remote Operations> 284
IM 43D07N10-01EN 6th Edition: Mar. 10, 2022-00
Step 2: Provide the details of the user account you want to add and click ‘Add.’
Figure 5.3-2 Add an MSS user to Site component - Providing User details
Step 3: Confirm the newly added user.
On successful addition, the Application displays a success notification and then navigates to a detailed view of the user.
Figure 5.3-3 Add an MSS user to Site component - Successful addition of user
Success notification User details
Add User Window Prompt

<Remote Operations> 285
IM 43D07N10-01EN 6th Edition: Mar. 10, 2022-00
5.4 Site component - Managing Permissions of a user or group
When you add a user to the site component for the first time, the account will not have any permissions assigned to it.
Let’s assign some permissions to the user account that we added in the previous section. To do so, we need to
① Navigate to the User details component
② In the Permissions menu, assign required permissions
③ Confirm the permissions
Pre-requisites:
Make sure you have the
① ‘View’ and ‘Update’ Permissions on Users.to perform this operation
SUPPLEMENT
The outlined operations are applicable to Groups as well.
Step 1: Navigate to User details component
If not already in User details view, then navigate to it:
Authorizations > Users and select the User account to manage.
Figure 5.4-1 Managing Permissions of an MSS user - Navigate to MSS user

<Remote Operations> 286
IM 43D07N10-01EN 6th Edition: Mar. 10, 2022-00
Step 2: In the Permissions menu, assign required permissions
To assign permissions, click on the appropriate checkbox. A notification is displayed on Success.
Figure 5.4-2 Managing Permissions of an MSS user - Assign a Permission
To remove permissions, click on an assigned permission checkbox to uncheck it. A notification is shown on Success.
Figure 5.4-3 Managing Permissions of an MSS user - Remove a Permission

<Remote Operations> 287
IM 43D07N10-01EN 6th Edition: Mar. 10, 2022-00
To make MSS user an MSS Site administrator, assign all permissions.
Figure 5.4-4 Managing Permissions of an MSS user - Promote an MSS user to MSS administrator on a
Site
Step 3: Confirm the permissions
The assigned permissions are reflected immediately. Once the MSS user logs in refreshes their existing screen, they will have access to all the menus and sub-menus.
Figure 5.4-5 Managing Permissions of an MSS user - Confirming access to Menus and sub-menus

<Remote Operations> 288
IM 43D07N10-01EN 6th Edition: Mar. 10, 2022-00
5.5 Site component - Delete an MSS user from the Site component
In MSS Site, deleting a user implies removing the user account from accessing the Site component. If the user account exists in other sites, the user can log in to those Sites without issues.
To delete an MSS user or an MSS administrator, we need to:
① Navigate to the User details component
② Delete the User account
③ Confirm the deletion
Pre-requisites:
Make sure that:
① You have ‘View’ and ‘Delete’ Permissions on Users.
② The user account is no longer any custodian of the asset.
Step 1: Navigate to User details component
If not already in User details view, then navigate to it:
Authorizations > Users and select the User account to manage.
REFERENCE:
Figure 5.4-1 Managing Permissions of an MSS user - Navigate to MSS user

<Remote Operations> 289
IM 43D07N10-01EN 6th Edition: Mar. 10, 2022-00
Step 2: Delete the User account
From the ‘User Interactive’ menu, click “DELETE USER.” Confirm the delete prompt by clicking “OK.”
Figure 5.5-1 Deleting an MSS user - Deleting the User account
Step 3: Confirm the deletion
Figure 5.5-2 Deleting an MSS user - User deleted notification
On deletion, the application redirects to the ‘User List’ screen. However, we see an empty user list in the above screenshot. This is since the MSS administrator deleted its own user account.
The next time the user tries to log in, they get an Access Denied message.

<Remote Operations> 290
IM 43D07N10-01EN 6th Edition: Mar. 10, 2022-00
Figure 5.5-3 Deleting an MSS user - Site component - Access Denied
CAUTION
The operation will fail in case the user account is linked to any asset as Custodian.
Figure 5.5-4 Deleting an MSS user - Delete Failure notification
WARNING
If the user account is deleted from all the site components, they will no longer be able to login to the Center component.
Figure 5.5-5 Deleting an MSS user - Center component - Access Denied
SUPPLEMENT
The deleted user account can be re-added back to the Site at any time by an administrator. To do so, add the user as the instructions provided in Chapter 5.3 Site component - Add an MSS user to the Site component.
To permanently delete an MSS user account, please contact Yokogawa

<Remote Operations> 291
IM 43D07N10-01EN 6th Edition: Mar. 10, 2022-00
CAUTION
When an MSS user account is deleted, its existing permissions are saved. If the user account is re-added, then make sure to check the permission level once again.

<Remote Operations> 292
IM 43D07N10-01EN 6th Edition: Mar. 10, 2022-00
5.6 Site Component - Onboarding applications to MSS
MSS integrates and supports visualizing data from various 3rd party applications.
Before MSS visualizes data from 3rd party applications, the application needs to be registered on MSS. So, onboarding an application is one of the everyday administrative tasks performed by MSS administrators.
Table 5.6-1 MSS supported Applications Types
Application Type Description
Security Applications
Applications related to the security of Datacenters such as Anti-virus and Patch Management.
Security applications
MSS R1.5 supports data collection from two types of Non-Yokogawa assets:
① McAfee ePO (McAfee ePolicy Orchestrator)
② WSUS (Windows Server Update Services)
5.6.1.1 Adding a McAfee ePolicy Orchestrator
Configuration steps to be performed for successfully adding ePO application in MSS:
① Obtain ePO application credentials.
② Initiate the onboarding process from ‘Security applications’
③ Select ‘McAfee ePolicy Orchestrator.’
④ Enter the details of the ePO
⑤ Test MSS application with ePO application with ePO credentials
⑥ Specify the data to be collected
⑦ Verify the application in the Site component
⑧ Verify the application in the Center component
Pre-requisites:
Make sure you have the
① IP Address of the application
② API URL of the application
③ Credentials of the application
④ Permission to ‘View’ and ‘Create’ McAfee ePO application on the Site component

<Remote Operations> 293
IM 43D07N10-01EN 6th Edition: Mar. 10, 2022-00
Step 1: Obtain ePO application credentials
Obtain the credentials that are required to onboard the asset on MSS.
Step 2: Initiate the onboarding process from Security applications
Navigate to Security applications and click “ADD APPLICATION.”
Figure 5.6-1 Adding a McAfee ePO - Initiate the Onboarding process
Step 3: Select ‘McAfee ePolicy Orchestrator’
Figure 5.6-2 Adding an ePO - select ePO

<Remote Operations> 294
IM 43D07N10-01EN 6th Edition: Mar. 10, 2022-00
Step 4: Enter the details of the application
Please refer to ‘Table 4.8-1 Application information of a McAfee ePolicy Orchestrator’ for details on input. Once completed, click the ‘Next step.’
Figure 5.6-3 Adding an ePO - Enter details of ePO
Step 5: Test MSS application with ePO application with ePO credentials
Figure 5.6-4 Adding an ePO - Providing credentials

<Remote Operations> 295
IM 43D07N10-01EN 6th Edition: Mar. 10, 2022-00
Figure 5.6-5 Adding an ePO -Successful Connection (Replace Image)
Step 6: Specify the parameters to be collected
After a successful connection, check the parameters that need to be collected from ePO.
Figure 5.6-6 Adding an ePO - Specifying ePO data collectors

<Remote Operations> 296
IM 43D07N10-01EN 6th Edition: Mar. 10, 2022-00
Step 7: Verify the asset in the Site component
After the success notification, use the search option from the Security Application list view, to locate the added asset easily.
Figure 5.6-7 Security application added confirmation dialog box
Figure 5.6-8 Adding an ePO - Verifying ePO in the Site component

<Remote Operations> 297
IM 43D07N10-01EN 6th Edition: Mar. 10, 2022-00
Step 8: Verify the application in the Center component
Login to the Center component and navigate to a detailed view of the Security applications.
Figure 5.6-9 Adding an ePO - Verifying ePO in the Center component

<Remote Operations> 298
IM 43D07N10-01EN 6th Edition: Mar. 10, 2022-00
5.6.1.2 Windows Server Update Services
This operation is split into the following steps:
① Obtain WSUS applications credentials
② Initiate the onboarding process from ‘Security applications’
③ Select ‘Widows Server Update Services’
④ Enter the details of WSUS
⑤ Test MSS application with WSUS application with WSUS credentials
⑥ Specify the data to be collected
⑦ Verify the application in the Site component
⑧ Verify the application in the Center component
Pre-requisites:
Make sure you have the
① IP Address of the application
② API URL of the application (and WSUS DB’s port number)
③ Credentials of the application
④ Permission to ‘View’ and ‘Create’ WSUS application on the Site component
Step 1: Obtain WSUS applications credentials
Obtain the credentials that are required to onboard the application on MSS.

<Remote Operations> 299
IM 43D07N10-01EN 6th Edition: Mar. 10, 2022-00
Step 2: Initiate the onboarding process from Security applications
Navigate to Security applications and click “ADD APPLICATION.”
Figure 5.6-10 Adding a WSUS - Initiate the Onboarding process
Step 3: Select ‘Windows Server Update Services’
Figure 5.6-11 Adding a WSUS - select WSUS

<Remote Operations> 300
IM 43D07N10-01EN 6th Edition: Mar. 10, 2022-00
Step 4: Enter the details of application
Please refer to ‘
Table 4.8-8 Application information of a WSUS application’ for details on input. Once completed, click the ‘Next step.’
Figure 5.6-12 Adding a WSUS - Enter details of WSUS

<Remote Operations> 301
IM 43D07N10-01EN 6th Edition: Mar. 10, 2022-00
Step 5: Test MSS application with WSUS application with WSUS credentials
Figure 5.6-13 Adding a WSUS - Providing credentials
Figure 5.6-14 Adding a WSUS - Successful Connection

<Remote Operations> 302
IM 43D07N10-01EN 6th Edition: Mar. 10, 2022-00
Step 6: Specify the parameters to be collected
After a successful connection, check the parameters that need to be collected from WSUS.
Figure 5.6-15 Adding an WSUS - Specifying WSUS data collectors

<Remote Operations> 303
IM 43D07N10-01EN 6th Edition: Mar. 10, 2022-00
Step 7: Verify the asset in the Site component
After the success notification, use the search option from the Security Application list view, to locate the added asset easily.
Figure 5.6-16 Success notification on adding WSUS application
Figure 5.6-17 Adding an WSUS - Verifying WSUS in the Site component

<Remote Operations> 304
IM 43D07N10-01EN 6th Edition: Mar. 10, 2022-00
Step 8: Verify the application in the Center component
Login to the Center component and navigate to a detailed view of the Security applications.
Figure 5.6-18 Adding a WSUS - Verifying WSUS in the Center component

<Remote Operations> 305
IM 43D07N10-01EN 6th Edition: Mar. 10, 2022-00
Control applications
MSS R1.5 supports data collection from one type of Yokogawa application:
① Centum VP (Yokogawa Centum VP)
5.6.2.1 Adding a Control application / Centum Project
Configuration steps to be performed for successfully adding Control application in MSS:
① Obtain HIS credentials.
② Initiate the onboarding process from ‘Control applications’
③ Select ‘Yokogawa CENTUM VP.’
④ Enter the details of the CENTUM Project
⑤ Test connectivity between MSS and application
⑥ Specify the data to be collected
⑦ Verify the application in the Site component
⑧ Verify the application in the Center component
Pre-requisites:
Make sure you have the
① IP Address of the HIS
② Account and Password to access HIS
③ Permissions to ‘view’ and ‘create’ Control application in the Site component
④ Permissions to ‘view’ Control application in Center component.

<Remote Operations> 306
IM 43D07N10-01EN 6th Edition: Mar. 10, 2022-00
Step 1: Obtain HIS application credentials
Obtain the credentials that are required to onboard the application on MSS.
Step 2: Initiate the onboarding process from Control applications
Navigate to Control applications and click “ADD CONTROL APPLICATION.”
Figure 5.6-19 Adding a Control application - Initiate the Onboarding process
Step 3: Select ‘Yokogawa Centum VP’
Figure 5.6-20 Adding a Control application – select Yokogawa Centum VP

<Remote Operations> 307
IM 43D07N10-01EN 6th Edition: Mar. 10, 2022-00
Step 4: Enter the details of the application
Please refer to ‘Table 4.9-1 Application information of a Control application*’ for details on input. Once completed, click the ‘Next step.’
Figure 5.6-21 Adding a Control application - Enter details of Centum Project
Step 5: Test connectivity between MSS and application
Figure 5.6-22 Adding a Control application - Providing credentials

<Remote Operations> 308
IM 43D07N10-01EN 6th Edition: Mar. 10, 2022-00
Figure 5.6-23 Adding a Control application - Successful Connection
Step 6: Specify the parameters to be collected
After a successful connection, check the parameters that need to be collected from Centum Project.
Figure 5.6-24 Adding a Control application - Specifying Control application data collectors

<Remote Operations> 309
IM 43D07N10-01EN 6th Edition: Mar. 10, 2022-00
Step 7: Verify the asset in the Site component
After the success notification, use the search option from the Control application list view, to locate the added asset easily.
Figure 5.6-25 Control application added confirmation dialog box
Figure 5.6-26 Adding a Control application - Verifying Control application in the Site component

<Remote Operations> 310
IM 43D07N10-01EN 6th Edition: Mar. 10, 2022-00
Step 8: Verify the application in the Center component
Login to the Center component and navigate to a detailed view of the Control applications
Figure 5.6-27 Adding a Control application - Verifying Control application in the Center component

<Remote Operations> 311
IM 43D07N10-01EN 6th Edition: Mar. 10, 2022-00
Asset Management applications
MSS R1.5 supports data collection from one type of Yokogawa application:
① Plant Resource Manager (Yokogawa PRM)
5.6.3.1 Adding an Asset Management application
Configuration steps to be performed for successfully adding Asset Management application in MSS:
① Obtain PRM credentials.
② Initiate the onboarding process from ‘Asset Management applications’
③ Select ‘Yokogawa PRM.’
④ Enter the details of the PRM
⑤ Test connectivity between MSS and PRM
⑥ Specify the data to be collected
⑦ Verify the application in the Site component
⑧ Verify the application in the Center component
Pre-requisites:
Make sure you have the
① IP Address of the PRM
② Database credentials of the PRM
③ Permission to ‘view’ and ‘create’ Asset Management application on the Site component
④ Permissions to ‘view’ Asset Management application in Center component. (for confirming in Center)

<Remote Operations> 312
IM 43D07N10-01EN 6th Edition: Mar. 10, 2022-00
Step 1: Obtain PRM credentials
Obtain the credentials that are required to onboard the application on MSS.
Step 2: Initiate the onboarding process from Asset Management applications
Navigate to Asset Management applications and click “ADD ASSET MANAGEMENT APPLICATION.”
Figure 5.6-28 Adding an Asset management application - Initiate the Onboarding process
Step 3: Select ‘Yokogawa Plant Resource Manager (PRM)`
Figure 5.6-29 Adding an Asset management application – select Yokogawa Plant Resource Manager
(PRM)

<Remote Operations> 313
IM 43D07N10-01EN 6th Edition: Mar. 10, 2022-00
Step 4: Enter the details of the application
Please refer to ‘Table 4.10-1 Application information of a PRM’ for details on input. Once completed, click the ‘Next step.’
Figure 5.6-30 Adding a Asset management applications - Enter details of PRM
Step 5: Test connectivity between MSS and application
Figure 5.6-31 Adding an Asset management application - Providing credentials

<Remote Operations> 314
IM 43D07N10-01EN 6th Edition: Mar. 10, 2022-00
Figure 5.6-32 Adding an Asset management application - Successful Connection
Step 6: Specify the parameters to be collected
After a successful connection, check the parameters that need to be collected from
Figure 5.6-33 Adding a Control application - Specifying PRM data collectors
On clicking on ‘Add new asset’, users will receive a success notification and will be redirected to ‘Collection settings’ submenu of PRM.

<Remote Operations> 315
IM 43D07N10-01EN 6th Edition: Mar. 10, 2022-00
Step 7: Verify the asset in the Site component
After the success notification, use the search option from the Asset Management application list view, to locate the added asset easily.
Figure 5.6-34 Asset management application added confirmation dialog box
Here, enable the parameters whose data needs to be collected.
Figure 5.6-35 Adding an Asset management application – Verifying in MSS Site component

<Remote Operations> 316
IM 43D07N10-01EN 6th Edition: Mar. 10, 2022-00
Step 7: Verify the application in the Center component
Login to the Center component and navigate to a detailed view of the Asset management applications
Figure 5.6-36 Adding an Asset Management application - Verifying application in the Center component

<Remote Operations> 317
IM 43D07N10-01EN 6th Edition: Mar. 10, 2022-00
Analyzer Management applications
MSS R1.5 supports data collection from one type of Yokogawa application:
① Analyzer Management application (Yokogawa AAIMS).
5.6.4.1 Adding an Analyzer Management application
Configuration steps to be performed for successfully adding Analyzer Management application in MSS:
① Obtain AAIMS credentials.
② Initiate the onboarding process from ‘Analyzer Management applications.
③ Select ‘Yokogawa AAIMS.’
④ Enter the details of the AAIMS.
⑤ Test connectivity between MSS and AAIMS.
⑥ Specify the data to be collected.
⑦ Verify the application in the Site component.
⑧ Verify the application in the Center component.
Pre-requisites:
Make sure you have the following:
① IP Address of the AAIMS.
② Permission to ‘view’ and ‘create’ Analyzer Management application on the Site component.
③ Permissions to ‘view’ Analyzer Management application in Center component. (for confirming in Center).

<Remote Operations> 318
IM 43D07N10-01EN 6th Edition: Mar. 10, 2022-00
Step 1: Obtain AAIMS credentials.
Obtain the credentials that are required to onboard the application on MSS.
Step 2: Initiate the onboarding process from Analyzer Management applications.
Navigate to Analyzer Management applications and click “ADD ANALYZER MANAGEMENT APPLICATION.”
Figure 5.6-37 Adding an Analyzer Management application - Initiate the Onboarding process
Step 3: Select ‘Yokogawa - Analyzer Management Application (AAIMS)`.
Figure 5.6-38 Adding an Analyzer management application – select Yokogawa AAIMS

<Remote Operations> 319
IM 43D07N10-01EN 6th Edition: Mar. 10, 2022-00
Step 4: Enter the details of the application.
Please refer to ‘Table 4.11-1 Application information of an AAIMS application’ for details on input. Once completed, click the ‘Next step.’
Figure 5.6-39 Adding an Analyzer management application – entering information
Step 5: Test connectivity between MSS and application.
Figure 5.6-40 Adding an Analyzer management application - Providing credentials

<Remote Operations> 320
IM 43D07N10-01EN 6th Edition: Mar. 10, 2022-00
Figure 5.6-41 Adding an Analyzer management application - Successful Connection
Step 6: Specify the parameters to be collected.
After a successful connection, check the parameters that need to be collected from.
Figure 5.6-42 Adding an Analyzer Management application - Specifying data collectors
Next, on clicking ‘Complete’, users will receive a success notification and will be redirected to ‘Data List view’ of AAIMS.

<Remote Operations> 321
IM 43D07N10-01EN 6th Edition: Mar. 10, 2022-00
Step 7: Verify the asset in the Site component.
After the success notification, use the search option from the Analyzer Management application list view, to locate the added application.
Figure 5.6-43 Analyzer management application added confirmation dialog box
Figure 5.6-44 Adding an Analyzer management application – Verifying in MSS Site component

<Remote Operations> 322
IM 43D07N10-01EN 6th Edition: Mar. 10, 2022-00
Step 8: Verify the application in the Center component.
Login to the Center component and navigate to a detailed view of the Analyzer management applications.
Figure 5.6-45 Adding an Analyzer Management application - Verifying application in the Center
component

<Remote Operations> 323
IM 43D07N10-01EN 6th Edition: Mar. 10, 2022-00
5.7 Site component - Onboarding Assets to MSS
Collecting data from assets for visualization and analysis is one of the critical functions of MSS.
A Site component is responsible for collecting data from the asset and send the data to the Center component for analysis. A Site component is actively listening for the data from the asset.
Before MSS can listen to data from the asset, the assets need to be registered on MSS. So, onboarding an asset to MSS is one of the common administrative tasks performed by MSS administrators.
MSS R1.5 supports collecting data from five types of assets:
Table 5.7-1 MSS supported Data asset Types
Asset Type Description
Servers and Workstations
IT resources in a plant or datacenter. These are referred to as ‘Compute assets’ in MSS
Control Systems Systems that coordinate and supervise an entire plant of many varying processes. These are referred to as “PLC/DCS systems” in MSS.
Field Devices Field devices refer to equipment inside the plant, such as Flowmeter, Control valve, and others. These are referred to as “Field assets” in MSS
Network Devices Critical network components in a datacenter. These devices are responsible communication of all the devices. Routers, Switches, Time Server and Firewall are collectively referred as ‘Network assets’ in MSS
Environmental devices
Performance Monitoring Devices that analyze environmental conditions of the site or plants.

<Remote Operations> 324
IM 43D07N10-01EN 6th Edition: Mar. 10, 2022-00
Compute assets
MSS R1.5 supports the onboarding of Windows assets in two ways.
Table 5.7-2 Types of Compute assets
Compute Asset Type Description
Agent-based Installing MSS agent on a Compute asset.
WMI based Querying Compute asset over the network.
REFERENCE
To know details about the supported Operating system for Compute asset, please refer to Table 4.7-2 Supported ‘Compute assets’
5.7.1.1 Adding an agent-based Compute asset
In agent-based onboarding, we generate, download, and install an MSS agent onto the Compute Asset. The agent facilitates the data collection by pushing the data to the MSS site-manager.
This operation is split into two main steps and multiple sub-steps:
The main steps are:
① Add the asset on MSS through the Site component
② Download and install the agent on the compute asset
③ Verify the access
Pre-requisites:
Make sure you have the
① IP Address of the asset
② Credentials with administrative access on the account
③ Permission to Add asset on the Site component

<Remote Operations> 325
IM 43D07N10-01EN 6th Edition: Mar. 10, 2022-00
Step 1-1: Navigate to Compute assets and click on ADD COMPUTE ASSET.
Figure 5.7-1 Add an agent-based Compute asset to MSS - Initiating the addition process
Step 1-2: Select Windows Asset - Agent
Figure 5.7-2 Add an agent-based Compute asset to MSS - Selecting Windows Asset - Agent
Asset menu
Asset type

<Remote Operations> 326
IM 43D07N10-01EN 6th Edition: Mar. 10, 2022-00
Step 1-3: Enter the details of Compute asset
Please refer to Table 4.12-1 Asset settings of a Compute asset for details on input. Once completed, click the ‘Next step.’
Figure 5.7-3 Add an agent-based Compute asset to MSS - Enter information about Windows asset
Step 1-4: Specify the appropriate data that needs to be collected from Asset collectors by checking them. Click on ‘Setup asset.’
Figure 5.7-4 Add an agent-based Compute asset to MSS - Specifying data in Collectors
Configuration details
Click for next step
Collector settings
Click for next step

<Remote Operations> 327
IM 43D07N10-01EN 6th Edition: Mar. 10, 2022-00
Step 1-5: Complete the setup of the agent-based compute asset
On Success, MSS displays a success notification.
Next, click on the ‘Download’ link to initiate the download of the MSS agent.
Figure 5.7-5 Add an agent-based Compute asset to MSS - Completing the asset setup
SUPPLEMENT
It is possible to skip the agent download now. For downloading the agent later, Please Refer to Chapter 5.7.1.1 Adding an agent-based Compute asset for more information.
Now, the asset has been successfully registered with MSS. To complete the onboarding, install the agent on the windows asset
Setup agent
Download agent installer
Asset added
Asset setup completion

<Remote Operations> 328
IM 43D07N10-01EN 6th Edition: Mar. 10, 2022-00
Step 2-1: Copy the MSS Agent in the Windows and Extract it.
Figure 5.7-6 Add an agent-based Compute asset to MSS - MSS agent folder contents
Step 2-2: Begin the installation process
To initiate the installation, double click - MSS Agent Installer
Figure 5.7-7 MSS agent installer wizard - requiring admin privileges

<Remote Operations> 329
IM 43D07N10-01EN 6th Edition: Mar. 10, 2022-00
SUPPLEMENT
Even with an administrative account, you might get the error in Figure 5.7-7 MSS agent installer wizard - requiring admin privileges. In such cases, right-click on the MSS installation and select ‘Run as Administrator’ to initiate the installation
From the Welcome Screen, click Next to proceed.
Figure 5.7-8 MSS agent installer wizard - Step 1 - Welcome Screen

<Remote Operations> 330
IM 43D07N10-01EN 6th Edition: Mar. 10, 2022-00
Step 2-3: Click Next in the ‘Confirm Installation’ to Proceed.
Figure 5.7-9 MSS agent installer wizard - Step 2 - Confirm installation

<Remote Operations> 331
IM 43D07N10-01EN 6th Edition: Mar. 10, 2022-00
Step 2-4: Read and accept the license agreement and click on ‘Next.’
Figure 5.7-10 MSS agent installer wizard - Step 3 - License agreement
Step 2-5: Confirm the installation path and click ‘Next’ to Proceed
Figure 5.7-11 MSS agent installer wizard - Step 4 - installation path

<Remote Operations> 332
IM 43D07N10-01EN 6th Edition: Mar. 10, 2022-00
Step 2-6: Specify MSS Site Settings
When you download the MSS Installer Agent, it contains a ‘config.json’ file, which contains all the required information for this specific asset.
If the configuration isn’t loaded, click on ‘Load Configuration’ to load the information directly from it.
Figure 5.7-12 MSS agent installer wizard - Step 5 - Specifying MSS Site Management settings
Step 2-7: Click ‘Next’ to begin the installation
Figure 5.7-13 MSS agent installer wizard - Step 6 - Agent installation in progress

<Remote Operations> 333
IM 43D07N10-01EN 6th Edition: Mar. 10, 2022-00
Step 2-8: Click ‘Close’ to exit after Successful Installation.
Figure 5.7-14 MSS agent installer wizard - Step 6 - Exit the agent installer
Step 2-9: Verify the successful installation on Compute asset.
Navigate to ‘Start > Services.’
Figure 5.7-15 MSS agent installation - Navigating to Services

<Remote Operations> 334
IM 43D07N10-01EN 6th Edition: Mar. 10, 2022-00
Look for the following four services:
① ‘mss-filebeat’
② ‘mss-metricbeat’
③ ‘mss-winlogbeat’
④ ‘mss-osqueryd’
Check that all the services are in the Running state and are set to start Automatically.
Figure 5.7-16 MSS agent installation – Verify running services

<Remote Operations> 335
IM 43D07N10-01EN 6th Edition: Mar. 10, 2022-00
Step 3-1: Verify that the data is being collected and visualized.
Login to the Center component and navigate to the detailed view of the Compute asset.
After some time, you should be able to see the information about the ‘Compute asset.’
Figure 5.7-17 Add an agent-based Compute asset to MSS - Verifying the Compute asset

<Remote Operations> 336
IM 43D07N10-01EN 6th Edition: Mar. 10, 2022-00
5.7.1.2 Adding a WMI based Compute asset
In WMI-based onboarding of a Compute asset, we do not install any agents on the Compute assets. Instead, we use the WMI interface to execute queries and collect data from the MSS Site-Manager.
This is done with the help of an MSS specific “WMI setting tool” on the target asset.
This operation is split into two main steps and multiple sub-steps:
The main steps are:
① Generate WMI credentials on the target Compute asset
② Add the asset on MSS through the Site component
③ Verify the access
SUPPLEMENT
*Step 1 needs to be performed if there are no existing WMI accounts on the target
Pre-requisites:
Make sure you have the
① IP Address of the asset
② Credentials with administrative access on the account
③ WMI setting tool
④ Permission to Add asset on the Site component
⑤ The target asset has port 135 and 161 open
⑥ The target asset should be in a network reachable by the MSS Site component
Step 1-1: Contact Yokogawa and obtain the ‘WMI setting tool.’
WMI setting tool is an MSS tool that assists the user in creating a WMI user account that is used to communicate with MSS.
It creates a local user account, which has the required permissions to carry out the communication between the asset and the MSS Site component.

<Remote Operations> 337
IM 43D07N10-01EN 6th Edition: Mar. 10, 2022-00
Step 1-2: Extract the onboarding script and navigate to executables.
Then, execute the MssWmiSettingsTool as an administrator.
Figure 5.7-18 Add a WMI Compute asset to MSS - Execute MssWmiSettingsTool
Step 1-3: Enter the details of the new WMI user account for MSS.
Enter the username and password of the new user that you would like to create. It is suggested that you follow some conventions while naming the user so that it can assist with account management and administration., ‘mss-wmi-user’
Make a note of the provided details.
Figure 5.7-19 Add a WMI Compute asset to MSS - Inside MssWmiSettingsTool

<Remote Operations> 338
IM 43D07N10-01EN 6th Edition: Mar. 10, 2022-00
Step 1-4: Create the WMI user account.
Click ‘Start’ to initiate the process.
On Success, the Success notification is displayed
Figure 5.7-20 Add a WMI Compute asset to MSS - Creating a WMI user
SUPPLEMENT
In case of any errors, the error message will be displayed under events.

<Remote Operations> 339
IM 43D07N10-01EN 6th Edition: Mar. 10, 2022-00
Figure 5.7-21 Add a WMI Compute asset to MSS - Failure to create a WMI user
Step 2-1: Navigate to Compute assets and click on ADD COMPUTE ASSET.
Figure 5.7-22 Add a WMI-based Compute asset to MSS - Initiating the addition process
Asset menu
Click to add asset

<Remote Operations> 340
IM 43D07N10-01EN 6th Edition: Mar. 10, 2022-00
Step 2-2: Select Windows Asset – WMI
Figure 5.7-23 Add a WMI-based Compute asset to MSS - Selecting Windows Asset - WMI
Step 2-3: Enter the details of Compute asset
Please refer to ‘Table 4.12-1 Asset settings of a Compute asset’ for details on input. Once completed, click the ‘Next step.’
Figure 5.7-24 Add a WMI-based Compute asset to MSS - Enter information about Windows asset
Choose WMI
Configuration details
Click to continue

<Remote Operations> 341
IM 43D07N10-01EN 6th Edition: Mar. 10, 2022-00
Step 2-4: Enter the details of the WMI user and click ‘Test Connection’
Figure 5.7-25 Add a WMI-based Compute asset to MSS - Enter information about WMI user
Step 2-5: WMI asset ‘Testing connection.’
WMI asset connection testing consists of three steps:
① WMI Port Validation
MSS attempts to connect to the asset over the network through port 135 and 161.
② Account Validation.
After a successful connection, MSS logs into the system using the provided credentials.
③ WMI Query Validation
After successful login, MSS executes a test WMI query to check if it can read the information about the asset.
If all these tests are successful, the three new steps in the Results sections will be marked as green.
Connection settings
Credentials details
Click to test

<Remote Operations> 342
IM 43D07N10-01EN 6th Edition: Mar. 10, 2022-00
Figure 5.7-26 Add a WMI-based Compute asset to MSS - Successful Test Connection
Test result
Click to continue

<Remote Operations> 343
IM 43D07N10-01EN 6th Edition: Mar. 10, 2022-00
Step 2-6: Define data collectors and Save asset
Check the appropriate data that needs to be collected from the asset. Click ‘Add new asset.’
Figure 5.7-27 Add a WMI-based Compute asset to MSS - Specifying Data to Collect
On completion, a successful notification will be displayed.
Figure 5.7-28 Success notification on WMI asset onboarding
Data collector settings
Click to add asset

<Remote Operations> 344
IM 43D07N10-01EN 6th Edition: Mar. 10, 2022-00
Step 3-1: Verify that the data is being collected and visualized.
Login to the Center component and navigate to a detailed view of the Compute asset. After some time, you should be able to see the information about the Compute asset.
Figure 5.7-29 Add an WMI-based Compute asset to MSS - Verifying the Compute asset
Detailed view of asset

<Remote Operations> 345
IM 43D07N10-01EN 6th Edition: Mar. 10, 2022-00
PLC/DCS assets
MSS R1.5 supports data collection five types of Yokogawa assets:
① Field Control System (FCS)
② Safety Control System (SCS)
③ Vnet Router (AVR)
④ Bus Converter (BCV)
⑤ Wide Area Communication Router (WAC)
MSS communicates with HIS (Human Interface Station) to identify activities on the PLC/DCS assets.
In this section, we will add a Yokogawa FCS to MSS site component. The provided steps are applicable for other PLC/DCS assets as well.
This operation is split into the following steps:
① Obtain the credentials for the asset from Yokogawa
② Initiate the onboarding process from PLC/DCS assets
③ Select ‘Yokogawa – Field Control Station’
④ Enter the details of the PLC/DCS asset
⑤ Enter the credentials and Test connection to the asset
⑥ Specify the data to be collected
⑦ Verify the asset in the Site component
⑧ Verify the asset in the Center component
Pre-requisites:
Make sure you have the
① IP Address of the HIS
② Credentials of the HIS
③ Domain and Station number
④ Permission to ‘View’ and ‘Add’ PLC/DCS asset on the Site component

<Remote Operations> 346
IM 43D07N10-01EN 6th Edition: Mar. 10, 2022-00
Step 1: Obtain the credentials for the asset from Yokogawa
Contact Yokogawa and obtain the credentials that are required to onboard the asset on MSS.
Step 2: Initiate the onboarding process from PLC/DCS assets
Navigate to PLC/DCS asset and click “ADD PLC/DCS asset.”
Figure 5.7-30 Adding an FCS - Initiate the Onboarding process
Asset menu
Click to add asset

<Remote Operations> 347
IM 43D07N10-01EN 6th Edition: Mar. 10, 2022-00
Step 3: Select ‘Yokogawa - Field Control Station (FCS)’
Figure 5.7-31 Adding an FCS - select FCS
Step 4: Enter the details of the PLC/DCS asset
Please refer to ‘Table 4.13-1 Asset settings fields of PLC/DCS asset’ for details on input. Once completed, click the ‘Next step.’
Figure 5.7-32 Adding an FCS - Enter details of FCS
Choose Yokogawa FCS
Asset configuration
Click to continue

<Remote Operations> 348
IM 43D07N10-01EN 6th Edition: Mar. 10, 2022-00
Step 5: Enter the credentials and Test connection with the asset
Figure 5.7-33 Adding an FCS - Providing credentials
Figure 5.7-34 Adding an FCS - Successful Connection
Credential information
Click to test
Test results
Click to continue

<Remote Operations> 349
IM 43D07N10-01EN 6th Edition: Mar. 10, 2022-00
Step 6: Specify the data to be collected
After a successful connection, check the data that needs to be collected from FCS. Please make sure to uncheck WAC.
Figure 5.7-35 Adding an FCS - Specifying FCS data collectors
Step 7: Verify the asset in the Site component
After the success notification, use the search option from the PLC/DCS list view, to locate the added asset easily.
Figure 5.7-36 Notification on Successful addition of FCS asset
Asset collector settings
Click to continue

<Remote Operations> 350
IM 43D07N10-01EN 6th Edition: Mar. 10, 2022-00
Figure 5.7-37 Adding an FCS - Verifying FCS in the Site component
Step 8: Verify the asset in the Center component
Login to the Center component and navigate to a detailed view of the PLC/DCS assets. After some time, you should be able to see the information about the FCS.
Figure 5.7-38 Adding an FCS - Verifying FCS in the Center component
Asset name
Asset info

<Remote Operations> 351
IM 43D07N10-01EN 6th Edition: Mar. 10, 2022-00
Field assets
Onboarding Field assets to MSS is done through Field asset discovery process.
After onboarding an Asset Management application, Chapter 5.6.3 Asset Management applications, please refer to steps provided in Chapter 5.7.7 Field Asset Discovery for the steps to onboard Field assets.

<Remote Operations> 352
IM 43D07N10-01EN 6th Edition: Mar. 10, 2022-00
Network assets
MSS R1.5 supports data collection from four types of network assets:
① Routers
② Switches
③ Firewall
④ Time Server
In this section, we will add a Cisco Switch to MSS site component. The provided steps are applicable for other network assets.
(such as Routers, Firewall and Time Servers etc.)
This operation is split into following steps:
① Navigate to ‘Network assets’ and click on “ADD NETWORK ASSET”.
② Select Network asset (Switch)
③ Enter the details of Network asset
④ Select a SNMP protocol to connect to the network asset.
⑤ Specify the appropriate data that needs to be collected from Asset collectors
⑥ Complete the setup of the Network asset
⑦ Add MSS Syslog Server details on Network asset
⑧ Verify the Asset data in Center component
Pre-requisites:
① IP Address of the asset
② Credentials with administrative access on the account or Community String
③ Permission to add asset on the Site component

<Remote Operations> 353
IM 43D07N10-01EN 6th Edition: Mar. 10, 2022-00
Step 1-1: Navigate to Network assets and click on ADD NETWORK ASSET.
Figure 5.7-39 Add a network asset to MSS - Initiating the addition process
Step 1-2: Select Switch
Figure 5.7-40 Add a Network asset to MSS - Selecting Switch
Asset menu
Click to add asset
Choose switch

<Remote Operations> 354
IM 43D07N10-01EN 6th Edition: Mar. 10, 2022-00
Step 1-3: Enter the details of Network asset
Please refer to ‘
Table 4.15-1 Asset settings fields of Network asset’ for details on input. Once completed, click the ‘Next step.’
Figure 5.7-41 Add a Network asset to MSS - Enter information about Switch
Refer to Table 4.15-3 MSS supported Network assets for supported brands and models
Asset configuration
Click to continue

<Remote Operations> 355
IM 43D07N10-01EN 6th Edition: Mar. 10, 2022-00
Step 1-4: From the dropdown – Version, select a SNMP protocol to connect to the network asset.
In this case, we will use SNMP v2c.and execute Test connection.
Figure 5.7-42 Testing connectivity with Network asset
Step 1-5: Specify the appropriate data that needs to be collected from Asset collectors by checking them. Click on ‘Next step.’
Figure 5.7-43 Add an agent-based Compute asset to MSS - Specifying data in Collectors
Connection settings
Connection test
Specify collector setting
Click to continue

<Remote Operations> 356
IM 43D07N10-01EN 6th Edition: Mar. 10, 2022-00
Step 1-6: Note the provided information regarding syslog and click on ‘Complete’ to complete the setup of the Network asset
Figure 5.7-44 Add a Network asset to MSS - Completing the asset setup
On Success, MSS displays the success notification.
Figure 5.7-45 Success Notification on Network asset addition
MSS provides the end user with the IP of the MSS syslog server.
Now, the network asset needs to be configured with the provided IP address so that MSS can start receiving network logs.
Step 1-7: Add MSS Syslog Server details on Network asset
The way to configure Syslog server varies based on asset type and models. We request you to refer to the instructions from the network vendor to carry out the same.
After the syslog server is configured on the asset, the data is available in the Center component for viewing.
Click to complete

<Remote Operations> 357
IM 43D07N10-01EN 6th Edition: Mar. 10, 2022-00
Step 1-8: Verify the Asset data in Center component
Figure 5.7-46 Verifying the added Network asset in Center Component

<Remote Operations> 358
IM 43D07N10-01EN 6th Edition: Mar. 10, 2022-00
Environmental assets
MSS R1.5 supports data collection of environmental assets through ODU.
The operations are performed on MSS over the network.
① Obtain the credentials for the asset from Yokogawa
② Initiate the onboarding process from Environmental assets
③ Select ‘Yokogawa – Online Diagnostic Unit (ODU)’
④ Enter the details of the ODU asset
⑤ Enter the ODU credentials and Test connection to the asset
⑥ Specify the data to be collected
⑦ Verify the asset in the Site component
⑧ Verify the asset in the Center component
Pre-requisites:
Make sure you have the
① IP Address of the ODU
② Credentials of the ODU
③ Permission to ‘View’ and ‘Add’ Environmental assets on the Site component

<Remote Operations> 359
IM 43D07N10-01EN 6th Edition: Mar. 10, 2022-00
Step 1: Obtain the credentials for the asset from Yokogawa
Obtain the credentials that are required to onboard the asset on MSS.
Step 2: Initiate the onboarding process from Environmental assets
Navigate to Environmental asset and click “ADD ENVIRONMENTAL ASSET.”
Figure 5.7-47 Adding an ODU - Initiate the Onboarding process

<Remote Operations> 360
IM 43D07N10-01EN 6th Edition: Mar. 10, 2022-00
Step 3: Select ‘Yokogawa - Online Diagnostic Unit (ODU)’
Figure 5.7-48 Adding an ODU - Selecting ODU
Step 4: Enter the details of ODU asset
Please refer to ‘Table 4.16-1 Asset settings fields of ODU asset’ for details on input. Once completed, click the ‘Next step.’
Figure 5.7-49 Adding an ODU - Enter the details

<Remote Operations> 361
IM 43D07N10-01EN 6th Edition: Mar. 10, 2022-00
Step 5: Enter the credentials of ODU and Test the connection with the asset
Figure 5.7-50 Adding an ODU - Enter the credentials
On Success, click ‘Next step’.
Figure 5.7-51 Adding an ODU - On successful test

<Remote Operations> 362
IM 43D07N10-01EN 6th Edition: Mar. 10, 2022-00
Step 6: Specify the data to be collected
After a successful connection, check the data that needs to be collected from ODU.
Figure 5.7-52 Adding an ODU - Specifying ODU data collectors
Step 7: Verify the asset in the Site component
After the success notification, you can locate the added asset in List view.
Figure 5.7-53 Success Notification on addition of Environmental asset

<Remote Operations> 363
IM 43D07N10-01EN 6th Edition: Mar. 10, 2022-00
Figure 5.7-54 Adding an ODU - Verifying ODU in the Site component
Step 8: Verify the application in the Center component
Login to the Center component and navigate to a detailed view of the Environmental assets.
Figure 5.7-55 Adding an ODU - Verifying ODU in the Center component

<Remote Operations> 364
IM 43D07N10-01EN 6th Edition: Mar. 10, 2022-00
Asset Discovery
Asset discovery is a function provided by MSS that lets the users add Compute assets easily.
Asset discovery scans the network for any available ‘Compute assets’ using the WMI protocol. It searches for assets that haven’t been added to MSS and list them for the administrator. The asset is added as a WMI asset on MSS.
This makes it easier for the MSS administrator to onboard.
5.7.6.1 Onboarding a Single asset
Onboarding a Compute asset using Asset discovery involves the following steps:
① Initiate the Asset discovery process
② Specify the range of IP addresses
③ Start the Asset discovery process
④ Select a discovered asset to onboard
⑤ Continue with adding the asset to MSS as WMI Compute asset
Pre-requisites:
Make sure you have the
① Credentials with administrative access on the account
② Permission to start ‘Asset discovery’ process
③ Permission to add Compute asset on the Site component
Additionally,
④ The Compute asset needs to be communicable over port TCP 135 and UDP 161.

<Remote Operations> 365
IM 43D07N10-01EN 6th Edition: Mar. 10, 2022-00
Step 1: Initiate the Asset discovery process
Figure 5.7-56 Asset discovery - Initiating the process
Step 2: Specify a range of IP addresses in IPv4
Click ‘Start’ to begin the ‘Asset discovery’ process
Figure 5.7-57 Asset discovery - specifying IP range
Asset menu
Click to discover
IP range
Click to start

<Remote Operations> 366
IM 43D07N10-01EN 6th Edition: Mar. 10, 2022-00
Step 3: Start the Asset discovery process
A notification is issued when the Asset discovery process begins. The time taken by the process depends on the
① Speed and bandwidth available in the network
② Specified IP range
Asset discovery of 172.17.54.1 - 172.17.54.10 is quicker than asset discovery of 172.17.54.1 - 172.17.54.255
Figure 5.7-58 Asset discovery - Asset discovery in-progress
SUPPLEMENT
In order to prevent Network clogging through asset discovery, MSS runs a discovery of ‘/24’ (Max 255 IP’s) at once.
Success Notification
Asset discovery in progress Notification

<Remote Operations> 367
IM 43D07N10-01EN 6th Edition: Mar. 10, 2022-00
Step 4: Select a discovered asset to onboard
Select any WMI asset from the list to onboard. And click on ‘Start onboarding’ to initiate the onboarding process
Figure 5.7-59 Asset discovery - after completion
Step 5: Continue with adding the asset to MSS as WMI Compute asset
Next, follow the instructions provided in WMI onboarding (5.7.1.2 Adding a WMI based Compute asset) to continue onboarding the compute asset.
Discovered asset
Click to onboard

<Remote Operations> 368
IM 43D07N10-01EN 6th Edition: Mar. 10, 2022-00
Figure 5.7-60 Asset discovery - Onboarding a single compute asset
WARNING
If a discovered asset has SNMP enabled. It cannot be onboarded in MSS R1.5 using the above method. To onboard them, please follow the instructions provided in the next section

<Remote Operations> 369
IM 43D07N10-01EN 6th Edition: Mar. 10, 2022-00
5.7.6.3 Onboarding multiple assets
Multiple assets can be onboarded to MSS through Asset discovery.
Onboarding a Compute asset using Asset discovery involves the following steps:
① Initiate the Asset discovery process
② Specify the range of IP addresses
③ Start the Asset discovery process
④ Select multiple discovered assets to onboard
⑤ Continue with adding the assets to MSS as WMI Compute asset
Pre-requisites and Steps 1-3 are the same as the previous section.
Step 4: Select multiple discovered assets to onboard
Figure 5.7-61 Asset discovery - selecting multiple assets / asset with SNMP enabled
Multiple asset
Click to onboard

<Remote Operations> 370
IM 43D07N10-01EN 6th Edition: Mar. 10, 2022-00
Step 5: Continue with adding the assets to MSS as WMI Compute asset
Follow the instructions provided in WMI onboarding (5.7.1.2 Adding a WMI based Compute asset) to continue onboarding the compute asset.
Figure 5.7-62 Asset discovery - Onboarding multiple assets

<Remote Operations> 371
IM 43D07N10-01EN 6th Edition: Mar. 10, 2022-00
Field Asset Discovery
Like Asset discovery, Field asset discovery function is provided by MSS to onboard Field assets easily.
Field asset discovery scans onboarded PRM and obtains the list of Field assets monitored in PRM. It then filters out already onboarded Field assets and presents a list that can be used for onboarding.
5.7.7.1 Onboarding a Single asset
Onboarding a field asset using Field Asset discovery involves the following steps:
① Navigate to Field asset discovery menu
② Select a discovered asset to onboard
③ Enter the details of the field asset
④ Verify the onboarded asset.
Pre-requisites:
Make sure you have the
① Onboarded PRMs under Asset Management application
② Permission to start ‘Field Asset discovery’ process
③ Permission to add Field asset on the Site component
④ Verify the onboarded asset
Step 1: Navigate to Field asset discovery menu
Figure 5.7-63 Field asset discovery – Navigating to Field asset discovery menu
Asset menu

<Remote Operations> 372
IM 43D07N10-01EN 6th Edition: Mar. 10, 2022-00
Step 2: Select a discovered asset to onboard
Select any Field asset from the list to onboard. And click on ‘Start onboarding’ to initiate the onboarding process
Figure 5.7-64 Field asset discovery – Starting onboarding
Step 3: Enter the details of the field asset
MSS auto populates the Name field with the Field asset tag applied on PRM. However, it can be changed if needed. Click on ‘Complete’.
Figure 5.7-65 Field asset discovery - Entering details
Discovered assets
Click to onboard

<Remote Operations> 373
IM 43D07N10-01EN 6th Edition: Mar. 10, 2022-00
On success, you will receive a notification.
Figure 5.7-66 Field asset discovery - Onboarding a single field asset
Step 4: Verify the onboarded asset.
In Site,
Figure 5.7-67 Field asset discovery - Verifying onboarded asset in Site component

<Remote Operations> 374
IM 43D07N10-01EN 6th Edition: Mar. 10, 2022-00
In Center,
Figure 5.7-68 Field asset discovery - Verifying onboarded asset in Center component

<Remote Operations> 375
IM 43D07N10-01EN 6th Edition: Mar. 10, 2022-00
5.7.7.2 Onboarding multiple assets
Multiple assets can be onboarded to MSS through Asset discovery.
Onboarding a Compute asset using Asset discovery involves the following steps:
① Navigate to Field asset discovery menu
② Select multiple discovered assets to onboard
③ Enter the details of the field asset individually
④ Verify the onboarded asset.
⑤ Select multiple discovered assets to onboard
Pre-requisites and Step 1, 4 and 5 are the same as the previous section.
Step 2: Select multiple discovered assets to onboard
Figure 5.7-69 Field asset discovery - selecting multiple assets to onboard
Multiple assets
Click to on board
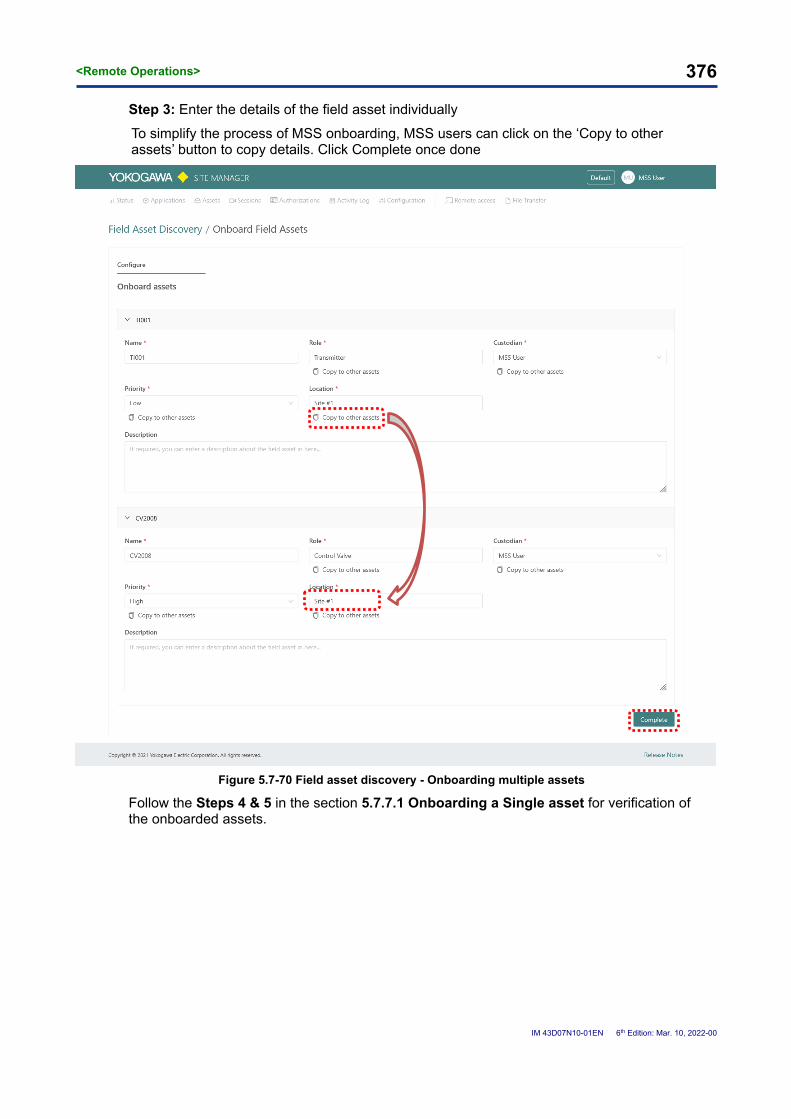
<Remote Operations> 376
IM 43D07N10-01EN 6th Edition: Mar. 10, 2022-00
Step 3: Enter the details of the field asset individually
To simplify the process of MSS onboarding, MSS users can click on the ‘Copy to other assets’ button to copy details. Click Complete once done
Figure 5.7-70 Field asset discovery - Onboarding multiple assets
Follow the Steps 4 & 5 in the section 5.7.7.1 Onboarding a Single asset for verification of the onboarded assets.

<Remote Operations> 377
IM 43D07N10-01EN 6th Edition: Mar. 10, 2022-00
5.8 Site component - Modifying assets/applications in MSS
After an asset has been onboarded, MSS allows most of its properties to be edited.
Primarily, four forms of information can be modified from assets:
① details of the asset/applications (in the MSS system).
② logs or metrics collected by MSS from the asset/application.
③ modifying Credentials / Testing Connection
④ enabling/disabling monitors of an asset
In this section, we discuss the steps involved in modifying
① Compute asset
② PLC/DCS asset
③ Field asset
④ Network asset
⑤ Environmental asset
⑥ Security applications
⑦ Control applications
⑧ Asset management applications

<Remote Operations> 378
IM 43D07N10-01EN 6th Edition: Mar. 10, 2022-00
Modifying details of asset/applications
Modifying details of the assets is done at ‘Asset settings’ in the detailed view of the asset.
The steps described in this section are applicable to:
Table 5.8-1 Applicable asset/application list - Modifying details of asset/application
Asset/Application Type Asset Subtype
Compute assets Agent-based
WMI-based
PLC/DCS assets
Field Control Station (FCS)
Safety Control Station (SCS)
Vnet Router (AVR)
Bus Converter (BCV)
Wide Area Communication Router (WAC)
Field assets Field instruments supported by Plant Resource Manager (PRM)
Network assets
Router
Switch
Firewall
Time Server
Environmental assets Online Diagnostic Unit (ODU)
Security applications McAfee ePO application
Microsoft WSUS application
Control applications Centum VP
Asset Management applications Plant Resource Manager (PRM)
However, for demonstration, ‘WMI-based Compute asset’ will be used.
From MSS R1.5, all custom fields on the asset can also be modified with the existing process (except IP address). For changing IP address, please refer to - 5.8.5 Modifying IP address field
Step 1: Navigate to the detailed view of asset
Navigate to Compute assets and click on the asset to modify.
Figure 5.8-1 Modifying asset details - Navigating to the asset

<Remote Operations> 379
IM 43D07N10-01EN 6th Edition: Mar. 10, 2022-00
Step 2: Make changes about the asset information in Asset settings
In the Asset settings of the detailed view, users can modify the information that describes the asset.
For more information on fields, please refer to:
Table 4.8-1 Application information of a McAfee ePolicy Orchestrator
Table 4.8-8 Application information of a WSUS application
Table 4.9-1 Application information of a Control application*
Table 4.10-1 Application information of a PRM
Table 4.11-1 Application information of an AAIMS application
Table 4.12-1 Asset settings of a Compute asset in case of Compute assets.
Table 4.13-1 Asset settings fields of PLC/DCS asset in case of PLC/DCS assets.
Table 4.14-1 Asset settings fields of Field assets in case of Field assets
Table 4.15-1 Asset settings fields of Network asset in case of Network assets.
Table 4.16-1 Asset settings fields of ODU asset in case of Environmental assets
Make the changes and click ‘Update asset.’
Figure 5.8-2 Modifying asset details - making changes in the asset

<Remote Operations> 380
IM 43D07N10-01EN 6th Edition: Mar. 10, 2022-00
Step 3: Verify the changes
On Success, MSS issues a successful notification and the ‘Last updated’ field resets.
Figure 5.8-3 Modifying asset details - verifying changes in the Site component
The Center component reflects the changes immediately as well.
Figure 5.8-4 Modifying asset details - verifying changes in the Center component
Success notification
Last updated

<Remote Operations> 381
IM 43D07N10-01EN 6th Edition: Mar. 10, 2022-00
Modifying Collection settings:
Changing data collectors of the assets is done at ‘Collection settings’ in the detailed view of the asset.
The steps described in this section are applicable to:
Table 5.8-2 Applicable asset list - modifying collection settings
Asset Type Asset Subtype
Compute assets Agent-based
WMI-based
PLC/DCS assets
Field Control Station (FCS)
Safety Control Station (SCS)
Vnet Router (AVR)
Bus Converter (BCV)
Wide Area Communication Router (WAC)
Network assets
Router
Switch
Firewall
Time Server
Environmental assets Online Diagnostic Unit (ODU)
Security applications McAfee ePO application
Microsoft WSUS application
Control applications Centum VP
Asset management applications Plant Resource Manager
Analyzer management applications
AAIMS application
However, for demonstration, a WMI-based compute asset is used.
REFERENCE
For more information on ‘Collection settings,’ please refer to ‘Collection settings’ available in
5.6.1 in case of Security applications
5.6.2 Control applications
5.6.3 Asset Management applications
5.6.4 Analyzer Management applications
5.7.1.1 & 5.7.1.2 in case of Compute assets
5.7.2 in case of PLC/DCS assets
5.7.3 in case of Field assets
5.7.4 in case of Network asset
5.7.5 in case of Environmental asset

<Remote Operations> 382
IM 43D07N10-01EN 6th Edition: Mar. 10, 2022-00
Step 1: Navigate to ‘Collection Settings’ view of assets
Figure 5.8-5 Modifying Collection settings - Collection Settings screen
List of collectors collecting data from asset
Status of Data collection

<Remote Operations> 383
IM 43D07N10-01EN 6th Edition: Mar. 10, 2022-00
Step 2: Disable the collectors to stop collecting data from
Click on the Status toggle to disable data collection of the asset. MSS Site component will stop data querying from these collectors over the network.
Figure 5.8-6 Modifying Collection settings - disabling data collection
In this case, the data of users and user groups from this asset will not be collected from now on.
CAUTION
The data collected so far by the data collector will still be visualized at the Center component.
Disable data collection

<Remote Operations> 384
IM 43D07N10-01EN 6th Edition: Mar. 10, 2022-00
Step 3: Re-download MSS agent (Only for ‘agent-based Compute asset’)
The data collection architecture of ‘agent-based Compute asset’ is different from the rest of the assets. While MSS ‘pulls’ the data from the asset over the network for all the assets, in case of agent-based, data is pushed from agent to MSS.
So, after disabling a data collector, re-download the MSS agent and re-install it on the asset again.
Figure 5.8-7 Modifying Collection settings - re-downloading MSS agent
For re-installing the MSS agent, please refer to Chapter 5.7.1.1 Adding an agent-based Compute asset.
Disable data collection

<Remote Operations> 385
IM 43D07N10-01EN 6th Edition: Mar. 10, 2022-00
Modifying Monitor settings
Enabling or disabling monitors of the assets is done at ‘Monitor settings’ in the detailed view of the asset.
MSS R1.5 supports monitors for the following asset types.
Table 5.8-3 MSS supported Monitor settings
Asset/Application Type Asset/Application Subtype
Compute assets Agent-based
WMI-based
PLC/DCS assets
Field Control Station (FCS)
Safety Control Station (SCS)
Vnet Router (AVR)
Bus Converter (BCV)
Wide Area Communication Router (WAC)
Field assets Field Instruments supported by Plant Resource Manager (PRM)
Network assets
Router
Switch
Firewall
Time Server
Environmental assets Online Diagnostic Unit (ODU)
Security applications McAfee ePO application
Microsoft WSUS application
Control applications CENTUM VP
Asset Management applications Plant Resource Manager (PRM)
However, for demonstration, a Field asset is used.

<Remote Operations> 386
IM 43D07N10-01EN 6th Edition: Mar. 10, 2022-00
Step 1: Navigate to the ‘Monitor Settings’ view of assets
Figure 5.8-8 Modifying Monitor settings - Monitor Settings screen
Step 2: Enable/Disable the monitor
Click on the Status toggle to change the monitoring state of the asset.
Figure 5.8-9 Modifying Monitor settings - Modifying monitor
Status of Monitors
Enable monitor
List of monitors available on the asset.
Status Change Confirmation
Automation Logs

<Remote Operations> 387
IM 43D07N10-01EN 6th Edition: Mar. 10, 2022-00
CAUTION
All automations that depend on the state saved by monitors will stop working on disabling a monitor.
Step 3: Inspect Monitor Log
Click on the log icon to navigate to monitor log to change the monitoring state of the asset. This view contains the information of about the generated monitor logs.
Figure 5.8-10 Monitor Log view
A State of OK indicates that the monitor logs were successfully generated.

<Remote Operations> 388
IM 43D07N10-01EN 6th Edition: Mar. 10, 2022-00
Step 4: Inspect Monitor Log details
To know more about the log, click on ‘Show details’ icon.
Figure 5.8-11 Monitor Log detailed view
This information is read as:
The monitor ‘Critical priority maintenance events’ analyzed the collected data from the asset for a duration of ‘Two hours’ from now and found that there were ‘0’ Critical priority maintenance events.
Supplement
The frequency of monitor log generation depends on the number of assets in MSS.
If there are 5 assets in MSS and all of them have monitors enabled, then the logs will be generated as follows:
Asset 1 > Asset 2 > Asset 3 > Asset 4 > Asset 5 > Asset 1 > …. > Asset 3 > …. > Asset 5 >
Similarly, if MSS has 50 assets, then the frequency of execution is:
Asset 1 > Asset 2 > Asset 3 > …. > Asset 50 > Asset 1 > Asset 2 > Asset 3 > … > Asset 50

<Remote Operations> 389
IM 43D07N10-01EN 6th Edition: Mar. 10, 2022-00
Testing connection & Modifying credentials
MSS requires an administrative credential to query an asset for data over the network.
A credential in MSS is made up of:
Table 5.8-4 Describing credentials
Name Description
Username Username of the account, which is used by MSS to query data. It can be ‘local’ or ‘domain.’
Password The password of the account
Domain Name Domain, the user account belongs to, in the datacenter. In case the account used is a local admin, leave the field empty
Modifying credentials of the assets is done at ‘Asset settings’ in the detailed view of the asset.
The steps described in this section are applicable to:
Table 5.8-5 Applicable asset/application list - Testing connection & Modifying credentials
Asset/Application Type Asset/Application Subtype
Compute assets Agent-based
WMI-based
PLC/DCS assets
Field Control Station (FCS)
Safety Control Station (SCS)
Vnet Router (AVR)
Bus Converter (BCV)
Wide Area Communication Router (WAC)
Network assets
Router
Switch
Firewall
Time Server
Environmental assets Online Diagnostic Unit (ODU)
Security applications McAfee ePO application
Microsoft WSUS application
Control applications Centum VP
Asset Management applications Plant Resource Manager (PRM)
However, for demonstration, Field asset (PRM) is used.
CAUTION
In case of Network asset, the definition of credentials depends on the SNMP protocol used.
In case of SNMP v1 and v2c, we use Community String and for v3, we use network asset’s username and password.
Please refer to 4.15 Network assets for more information

<Remote Operations> 390
IM 43D07N10-01EN 6th Edition: Mar. 10, 2022-00
Step 1: In the detailed view of the asset, locate ‘Connection Settings’:
The asset is already prefilled with a username. This username belongs to credentials that MSS is currently using for querying the asset.
Figure 5.8-12 Testing connection / modifying credentials - Connection settings
Pre-filled username

<Remote Operations> 391
IM 43D07N10-01EN 6th Edition: Mar. 10, 2022-00
Step 2: Testing the connection
Enter the password and click “Test connection.”
Successful communication with the asset is represented by the three green checks.
After every successful communication, the credentials used are auto saved.
Figure 5.8-13 Testing connection / modifying credentials - Successful test
SUPPLEMENT
This auto-saving behavior of MSS is used for modifying the credentials. Conduct a test with the new credentials. If successful, MSS will auto-save them.
Figure 5.8-14 Testing connection / modifying credentials - Successful notification
New Credential Confirmation

<Remote Operations> 392
IM 43D07N10-01EN 6th Edition: Mar. 10, 2022-00
There are cases when the tests fail. It might be due to network issues, permissions of the account, incorrect password, and others.
MSS provides an option to save the credentials despite a failed test. Use this option in case the test fails due to factors such as network failure and connection timeout.
Figure 5.8-15 Testing connection / modifying credentials - On failure
SUPPLEMENT
To accurately check if MSS is collecting data from an asset, navigate to Connection settings, and look for the number of data collectors with ‘Failed’ status.
Toggle Show

<Remote Operations> 393
IM 43D07N10-01EN 6th Edition: Mar. 10, 2022-00
Modifying IP address field
Modifying IP address field of an asset/application removes the stored credentials of the asset from MSS.
So, when an IP address field is modified, MSS expects credentials again.
Figure 5.8-16 Modifying IP Address field
Re-enter the credentials and click on ‘Save asset’ to save the new credentials.

<Remote Operations> 394
IM 43D07N10-01EN 6th Edition: Mar. 10, 2022-00
5.9 Site component - Deleting assets
Deleting an asset from the Site component refers to de-registering it from MSS.
This process of deleting the asset is the same for all the assets.
In this demonstration, we will use an Environmental asset (ODU)
Step 1: Navigate to the detailed view of an asset and click on ‘DELETE ASSET.’
Figure 5.9-1 Deleting an asset - Initiating asset deletion process

<Remote Operations> 395
IM 43D07N10-01EN 6th Edition: Mar. 10, 2022-00
Step 2: Confirm the deletion
Figure 5.9-2 Deleting an asset - Confirmation prompt
SUPPLEMENT
A deleted asset can be re-added with the same or different labels. Such re-added assets will be treated as new assets by MSS.

<Remote Operations> 396
IM 43D07N10-01EN 6th Edition: Mar. 10, 2022-00
Uninstalling Windows Agent Installer
For Agent based Compute assets, after removing it from MSS, the installed windows agent needs to be uninstalled from the local machine.
Prerequisites:
Uninstalling a Windows Agent is done through a PowerShell script.
In MSS R1.5, the PowerShell script is unsigned. So, to execute the script, the user needs to have appropriate privileges to execute an unsigned script.
So, both windows client and server OS should have an Execution Policy of ‘Unrestricted’ to carry out this operation.
To check your current execution policy, use the command - ‘Get-ExecutionPolicy’.
Figure 5.9-3 Uninstalling Agent installer from Windows - Check PowerShell Execution Policy
If the Execution Policy is something other than ‘Unrestricted’, use the following command to temporarily change it to ‘Unrestricted’ from administrative shell.
Set-ExecutionPolicy -Scope Process -ExecutionPolicy Unrestricted
Figure 5.9-4 Uninstalling Agent installer from Windows - Set Execution Policy
This will allow you to execute the Uninstaller script from the PowerShell prompt.

<Remote Operations> 397
IM 43D07N10-01EN 6th Edition: Mar. 10, 2022-00
Steps:
Step 1: Open “C:\Program Files\Yokogawa MSS Agent” with Explorer.
Figure 5.9-5 Uninstalling Agent installer from Windows - Agent uninstaller script
Step 2: Copy “uninstall-mss-agent-services.ps1” to a temporary folder.
Since Uninstaller deletes all the content including the PS script, copy the script to a different folder.
Figure 5.9-6 Uninstalling Agent installer from Windows - Copying uninstallation script
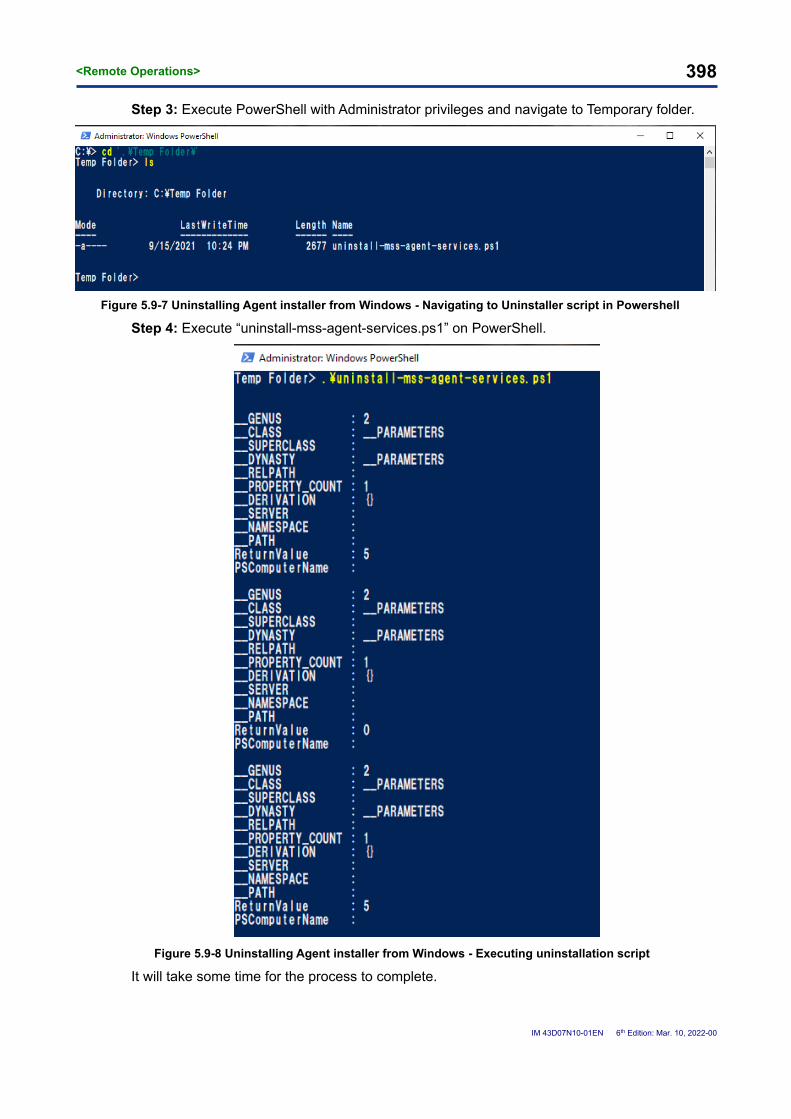
<Remote Operations> 398
IM 43D07N10-01EN 6th Edition: Mar. 10, 2022-00
Step 3: Execute PowerShell with Administrator privileges and navigate to Temporary folder.
Figure 5.9-7 Uninstalling Agent installer from Windows - Navigating to Uninstaller script in Powershell
Step 4: Execute “uninstall-mss-agent-services.ps1” on PowerShell.
Figure 5.9-8 Uninstalling Agent installer from Windows - Executing uninstallation script
It will take some time for the process to complete.

<Remote Operations> 399
IM 43D07N10-01EN 6th Edition: Mar. 10, 2022-00
Step 5: Verify the uninstallation by checking the folder and services.
Figure 5.9-9 Uninstalling Agent installer from Windows - Verifying agent uninstallation in file
In services, mss-winlogbeat, mss-osqueryd, mss-filebeat and mss-metricbeat services will be removed.
Figure 5.9-10 Uninstalling Agent installer from Windows - Verifying uninstallation in services
Step 6: Remove the asset from MSS.
Next remove the Agent based Compute asset from MSS.

<Remote Operations> 400
IM 43D07N10-01EN 6th Edition: Mar. 10, 2022-00
5.10 Center component - Login
Logging into the Application is one of the basic operations in MSS. This operation made up of five steps:
① Navigate to the Center component
② Provide your MSS login credentials
③ Configure Multi Factor Authentication*
④ Confirm terms and conditions
⑤ Confirm Login
Pre-requisites:
Make sure you have the following:
① URL of the Center component
② MSS username and password
③ Be added as an MSS user in at least one of the Site components
The procedure to login to Center is same as that of Site. Please follow the Step 1 to Step 10 in the 5.1.1 Login to MSS, but replace the URL of Site component with Center component.
On successful login, the only difference would be the login screen.
On successful login, the ‘Sitemap’ menu of the Center component is shown.
Figure 5.10-1 Login to Center component - Successful login

<Remote Operations> 401
IM 43D07N10-01EN 6th Edition: Mar. 10, 2022-00
5.11 Site component - Modifying Language
MSS R1.5 supports the following language support
① English
② Japanese
To switch the languages in which the site is being rendered:
Step 1: Navigate to user settings in Site component
Figure 5.11-1 Modifying Language - Navigating to User settings

<Remote Operations> 402
IM 43D07N10-01EN 6th Edition: Mar. 10, 2022-00
Step 2: Switch the language
Figure 5.11-2 Modifying Language - switching the language
Step 3: Confirm the changes.
Figure 5.11-3 Modifying Language - language rendered in alternate language
SUPPLEMENT
The changes applied at a site component is applied at user level. Center component and all other site components will be rendered in new language after the operation.
Change Language

<Remote Operations> 403
IM 43D07N10-01EN 6th Edition: Mar. 10, 2022-00
5.12 Site Component – Setting Operational status
Operational status of an asset can be set in Site component to instruct MSS to either collect the data or stop data collection.
For e.g.: When an asset is undergoing maintenance activities, it’s status can be updated in MSS as ‘maintenance’ so that MSS doesn’t trigger any alerts from associated automations.
Apart from ‘Field assets’, Operational status can be set for all other assets and applications.
To set Operational status, from Asset details menu,
Step 1: Click on ‘Operational’ status menu to see the list of available status.
Figure 5.12-1 Operational Status of an MSS asset/application

<Remote Operations> 404
IM 43D07N10-01EN 6th Edition: Mar. 10, 2022-00
Step 2: From the set of status, select the new status of the asset.
A success notification will be displayed on success.
Figure 5.12-2 Successful update of Operational status

<Remote Operations> 405
IM 43D07N10-01EN 6th Edition: Mar. 10, 2022-00
Step 3: Verify the state change in asset data-list view
Figure 5.12-3 Verifying the Operational status change in Site component
Step 4: Verify the status change in Center
Figure 5.12-4 Verifying the Operational status change in Center component

<Remote Operations> 406
IM 43D07N10-01EN 6th Edition: Mar. 10, 2022-00
5.13 Site Component – Setting Heartbeat metric
After an asset/application is onboarded onto MSS, the communication between MSS and asset/application happens in background. So, it becomes difficult to identify in case there is a breakdown of communication between MSS and asset/application.
To gain visibility into communication status, Heartbeat metric can be enabled on an MSS asset/application. On enabling the metric, MSS collects additional data and visualizes it for the users.
Heartbeat metric can be configured for all assets/applications apart from ‘Agent-based Compute asset’ and ‘Field assets’.
Step 1: In Site component, navigate to ‘Collection settings’ of an asset/application.
Figure 5.13-1 Collection settings of an asset/application

<Remote Operations> 407
IM 43D07N10-01EN 6th Edition: Mar. 10, 2022-00
Step 2: Enable/Disable the heartbeat collector
Figure 5.13-2 Changing the state of an asset/application collector
Step 3: Verify the state change in asset/application data-list view
Figure 5.13-3 Verifying the Heartbeat status in Site component

<Remote Operations> 408
IM 43D07N10-01EN 6th Edition: Mar. 10, 2022-00
Step 4: Verify the status change in Center.
Figure 5.13-4 Verifying the Operational status and heartbeat metrics change in Center component
Refer to Chapter 2.12 Operational status and heartbeat for more information.

<Remote Operations> 409
IM 43D07N10-01EN 6th Edition: Mar. 10, 2022-00
5.14 Center Component – Exporting a dashboard
MSS supports exporting the contents of a dashboard as a PDF file or PNG image. To export a dashboard:
Step 1: In Center component, navigate to detailed view of a dashboard, which needs to be exported, and locate the ‘Export’ button.
Figure 5.14-1 Exporting a Dashboard - Locating Export button

<Remote Operations> 410
IM 43D07N10-01EN 6th Edition: Mar. 10, 2022-00
Step 2: Click on the ‘Export’ button and select either ‘Save as Image’ or ‘Save as PDF’.
Figure 5.14-2 Exporting a dashboard - Selecting export format
Wait for some time as the request gets processed. Click ‘Save File’ on seeing the prompt.
Figure 5.14-3 Exporting a dashboard - Saving the file

<Remote Operations> 411
IM 43D07N10-01EN 6th Edition: Mar. 10, 2022-00
Step 3: Verify the contents.
Figure 5.14-4 Exporting a Dashboard - Verifying the Contents
CAUTION
If a dashboard has a widget which is scrollable. then the complete data of the widget will not be visible in the exported PDF.
Dashboard vs. Document
Figure 5.14-5 Exporting a Dashboard – ‘Dashboard vs. Document’ comparison

<Remote Operations> 412
IM 43D07N10-01EN 6th Edition: Mar. 10, 2022-00
6. Remote Operations
In this section, we discuss the details of remote operations that an MSS user and administrator can perform on MSS.
The discussion is in the following order:
Steps and process to connect to an asset remotely from MSS
Administrator actions to approve sessions
Remote session recordings
Characteristics of remote access
Various other remote operations

<Remote Operations> 413
IM 43D07N10-01EN 6th Edition: Mar. 10, 2022-00
6.1 Connecting Remotely to an asset
Depending on the permissions of the user, an MSS user can connect with an MSS asset in two ways
① Request access
② Direct access
Request access is a basic remote access method, available in MSS, which allows an MSS user to access an MSS asset by requesting for approval. A user creates an MSS access request providing some information such as duration and reason to connect to an asset. An MSS administrator can approve or reject the requests by reviewing them.
While as Direct access is an advanced remote access method available in MSS, which allows a user to connect to the asset any time without any approvals.
Table 6.1-1 Supported Remote Access Protocol for assets
Asset Type Connection
endpoint RDP VNC SSH
HTTP
Compute assets Windows host PLC/DCS assets HIS Collector - - -
Network assets Network asset - - - Security
applications Windows host - -
Control applications
HIS Collector - - -
Asset Management Applications
PRM - - -
Analyzer Management Applications
AAIMS - - -
WARNING
In case of any issues with remote connectivity, please contact Yokogawa

<Remote Operations> 414
IM 43D07N10-01EN 6th Edition: Mar. 10, 2022-00
Permissions overview
Before MSS user can access an MSS asset remotely, they need to be granted appropriate permissions. This section describes the permissions associated with Remote asset.
The permissions of remote access of all MSS assets are managed at MSS Site component. It also acts as a proxy when a remote access request is initiated from Center component.
An MSS user needs to be provided permissions at every Site before they can access the Remote access feature.
To grant remote access permissions over a user or group, follow the steps provided in Chapter 5.4 Site component - Managing Permissions of a user, and navigate to the permissions page.
Once in the detailed view of permission page, locate the following sections in Permissions:
Figure 6.1-1 Permissions related to Remote Access
Remote Access - Connections

<Remote Operations> 415
IM 43D07N10-01EN 6th Edition: Mar. 10, 2022-00
There are three category of permissions that are related to Remote Access.
① Connections
② Management
③ Profile

<Remote Operations> 416
IM 43D07N10-01EN 6th Edition: Mar. 10, 2022-00
6.1.1.1 Connections
Connections are the core permissions that govern the protocol, how, and from where an MSS user can access the asset from.
It is possible to allow or restrict the protocols that an MSS user can use through MSS to connect to an asset.
① RDP
② VNC
③ SSH
For More information about the protocol, please refer to the 4.21 Remote Access
The how refers to access method within MSS, a user may use to connect to an asset. There are two types of access methods:
① Request access
② Direct access
More details about these will be shared in the 6.1.3 Connecting to an asset through Request access and 6.1.4 Connecting to an asset through Direct access
Finally, the from where dictates the MSS component from where the user can access the asset.
① Site
② Center
6.1.1.2 Management
This section governs the administration and management of Remote Sessions by an MSS administrator.
① Requests
② Sessions
Having a request permission would allow an MSS administrator to approve remote connectivity requests made by MSS users through Request access.
Sessions permissions allow MSS administrators to monitor and revoke active remote sessions performed by the MSS user.
6.1.1.3 Remote profile
Remote profile is a data form that allows user to save their asset credentials and remote configuration information in MSS.
Checking this option enables the ‘Remote settings’ sub-menu on all assets level in Site component.
MSS (remote) administrators can allow the users to create remote profiles on their own by granting these permissions or can disable this feature in case they would like to manage the Remote profiles by themselves.

<Remote Operations> 417
IM 43D07N10-01EN 6th Edition: Mar. 10, 2022-00
Creating an MSS Remote Access Profile
Step 1: Navigate to ‘Remote Settings sub-menu’ of the asset. And select the protocol
Figure 6.1-2 Adding a remote access profile - Selecting protocol
Step 2: In the ‘Add remote access profile’ drop down menu, choose RDP.
Step 3: In the ‘Profile Form’, enter the details of the credentials and click ‘Save Profile’
Figure 6.1-3 Adding a remote access profile - Saving Profile info

<Remote Operations> 418
IM 43D07N10-01EN 6th Edition: Mar. 10, 2022-00
Step 4: Confirm the newly added profile.
Figure 6.1-4 Adding a remote access profile - Successful Profile creation
SUPPLEMENT:
Alternatively, the user can opt to create an empty profile without providing any credentials. In such cases, the credentials will be asked during the connection.

<Remote Operations> 419
IM 43D07N10-01EN 6th Edition: Mar. 10, 2022-00
Figure 6.1-5 Adding a remote access profile - Creating a profile without credentials

<Remote Operations> 420
IM 43D07N10-01EN 6th Edition: Mar. 10, 2022-00
Figure 6.1-6 Adding a remote access profile - Providing credentials during login
Figure 6.1-7 Adding a remote access profile - credentials persistence
SUPPLEMENT
Credentials provided in the login form are used only for accessing the remote asset. They are valid for one session and are required to be provided again in case of next login action.
In case it is desired that the credentials are required to persist, save the information in MSS profile or remember them in browser.

<Remote Operations> 421
IM 43D07N10-01EN 6th Edition: Mar. 10, 2022-00
Connecting to an asset through Request access
Request access is one of the methods through which an MSS user who has ‘Request access’ permissions can connect to an MSS asset.
An MSS user can make a request to an MSS administrator to access an asset over a specific period. An MSS administrator can review and approve/reject such access request.
The request access flow is as follows:
Figure 6.1-8 Request access flow
In this section, we will explore the steps involved with Remote access.
This operation made up of five steps:
① Initiate the connect to asset process by clicking on “CONNECT”.
② Select the profile that will be used to connect to the asset.
③ Provide the requested information if applicable and click “Request”
④ Wait for approval of the newly created request through
⑤ Connect to the asset by click on the "connect" icon
Pre-requisites:
① ‘Request access permissions’ in Site component
② The asset supports the protocol with which you would like to connect. Table 6.1-1 Supported Remote Access Protocol for assets provides the list of supported protocols.

<Remote Operations> 422
IM 43D07N10-01EN 6th Edition: Mar. 10, 2022-00
Step 1: Initiate the connect to asset process by clicking on “CONNECT”
Connect option is available from asset details view and asset list view.
Figure 6.1-9 Connect option from List view
Figure 6.1-10 Connect option from Detailed view

<Remote Operations> 423
IM 43D07N10-01EN 6th Edition: Mar. 10, 2022-00
Step 2: Select the profile that will be used to connect to the asset.
Figure 6.1-11 Connecting to an asset - Request access - Profile selection
SUPPLEMENT
Lock icon represents that the profile will be accessed with permission of “Request access”.
Step 3: Provide the requested information if applicable and click “Request”
Figure 6.1-12 Connecting to an asset - Request access - Providing information to admin

<Remote Operations> 424
IM 43D07N10-01EN 6th Edition: Mar. 10, 2022-00
Step 4: Wait for approval of Locate the newly created request
Click on CONNECT again and navigate to ‘Open requests’ to locate the new request.
A Remote Access request will be created with the status ‘Awaiting approval’. Currently the request is pending for approval from the administrator. The user can either contact the administrator or wait until the administrator reviews and approves the request.
Figure 6.1-13 Connecting to an asset - Request access - Awaiting approval
On successful approval, the status of the request will change to Approved/Future Approved.
The status will be shown as Future approved if the requested access start time hasn’t started yet.

<Remote Operations> 425
IM 43D07N10-01EN 6th Edition: Mar. 10, 2022-00
Step 5: Connect to the asset by click on the "connect" icon
An end user can click on the "connect" icon of the asset and to view the approved request
An approved request will have the following notification
Figure 6.1-14 Remote Request approved notification
Select the approved request and click on ‘Request’ to connect to the asset.
Figure 6.1-15 Connecting to an asset - Request access - Approved request

<Remote Operations> 426
IM 43D07N10-01EN 6th Edition: Mar. 10, 2022-00
Figure 6.1-17 Connecting to an asset - Request access – successful connection
Figure 6.1-16 Connecting to an asset - Request access - Successful RDP

<Remote Operations> 427
IM 43D07N10-01EN 6th Edition: Mar. 10, 2022-00
Connecting to an asset through Direct access
Direct access is one of the methods through which an MSS user who has Direct access permissions can connect to an MSS asset.
Direct access is the most powerful method available for an MSS user to access an asset. In this mode of access, a remote connection is made without waiting for approvals or an enforced time limit.
The direct access flow is as follows:
Figure 6.1-18 Direct access flow
Below steps outline the process of connecting to an MSS asset directly.
Step 1: Select the appropriate MSS Profile.
Figure 6.1-19 Connecting to an asset - Direct access - Profile selection

<Remote Operations> 428
IM 43D07N10-01EN 6th Edition: Mar. 10, 2022-00
Step 2: Click ‘CONNECT’ to access the asset
Figure 6.1-20 Connect to an asset - Direct access - Successful connection

<Remote Operations> 429
IM 43D07N10-01EN 6th Edition: Mar. 10, 2022-00
Connecting to an application through HTTP Remote access
Connecting remotely to an application through HTTP is slightly different from connecting to an asset through other protocols.
The main difference is, in HTTP access, authentication is carried out by the application, so MSS doesn’t require any credential to be stored within it.
In this section, we will explore the steps involved with HTTP Remote access.
This operation made up of three steps:
① Setup a Remote HTTP Profile.
② Initiate the request to connect to asset through Direct/Request Access.
③ Connect to the asset by click on the "Connect" icon.
Pre-requisites:
① ‘Request access permissions’ in Site component.
The asset supports the protocol with which you would like to connect. Table 6.1-1 Supported Remote Access Protocol for assets provides the list of supported protocols.
Step 1: Navigate to ‘Remote Settings sub-menu’ of the asset. And select the protocol
Figure 6.1-21 Adding a remote web profile - Selecting protocol

<Remote Operations> 430
IM 43D07N10-01EN 6th Edition: Mar. 10, 2022-00
Step 2: Setup a HTTP Remote Access Profile.
Provide the profile name and the application URL to connect to:
Figure 6.1-22 Setting up a Remote Web Profile
Alternatively, an IP address can be used as URL and the target host can be specified in hosts file.
Figure 6.1-23 Setting up a Remote Web Profile - Specifying Host entry
Note: In case there is no (private or public) DNS record to resolve the URL of the application but the IP address is known, the above method can be used to allow MSS to carry out the name resolution.

<Remote Operations> 431
IM 43D07N10-01EN 6th Edition: Mar. 10, 2022-00
Step 3: Initiate the connection with the remote profile.
Figure 6.1-24 Setting up a Remote Web Profile - Connecting to profile
Step 4: Connect to the web application.
MSS will launch a new browser and prepare a secure environment to render the application in. This can take up 30-60 seconds.
Figure 6.1-25 Setting up a Remote Web Profile - Establishing connection
On success, the application will be shown.

<Remote Operations> 432
IM 43D07N10-01EN 6th Edition: Mar. 10, 2022-00
Figure 6.1-26 Setting up a Remote Web Profile - Successfully connection

<Remote Operations> 433
IM 43D07N10-01EN 6th Edition: Mar. 10, 2022-00
6.2 Managing Requests and Sessions
Requests and Sessions are day-to-day ‘Admin operations’, that MSS (Remote) Administrators perform at an MSS Site.
Requests
Requests refer to MSS remote access requests that are raised by an MSS user to temporarily access an MSS asset.
Apart from being able to view existing requests, an MSS (Remote) administrator can perform the following operations:
① Approve a new request
② Deny a new request
③ Approve a denied request
④ Revoke an approved request
The MSS administrator needs to have the following ‘View’ and ‘Update’ permissions on “Requests” access to perform the operation.
Figure 6.2-1 Remote Access Permissions - Requests
Step 1: Navigate to ‘Requests’ list view from ‘Sessions menu’
Figure 6.2-2 Requests List view

<Remote Operations> 434
IM 43D07N10-01EN 6th Edition: Mar. 10, 2022-00
Handling New Requests
Step 2-A: Click on a request with the status ‘Awaiting approval’
Figure 6.2-3 Handling Requests - working with new request
Step 3-A: Click on ‘Approve’ or ‘Deny’ the request as appropriate
Figure 6.2-4 Handling Requests - Remote request approval screen

<Remote Operations> 435
IM 43D07N10-01EN 6th Edition: Mar. 10, 2022-00
Handling old requests
Step 2-B: Click on a “request” which was approved
Figure 6.2-5 Handling Requests - Revoking an approved request
Step 3-B: Click on “Revoke” to revoke the request
Figure 6.2-6 Handling Requests - Confirming a revoked request

<Remote Operations> 436
IM 43D07N10-01EN 6th Edition: Mar. 10, 2022-00
Step 2-B: Click on a ‘request’ which is denied.
Figure 6.2-7 Handling Requests - Approving a revoked request
Step 3-C: Click on ‘approve’ to approve the denied request
Figure 6.2-8 Handling requests - Confirming the newly approved request

<Remote Operations> 437
IM 43D07N10-01EN 6th Edition: Mar. 10, 2022-00
Sessions
Sessions refer to Remote sessions initiated by MSS users. An MSS (remote) administrator has access to all the remote sessions performed at an MSS Site level.
An MSS (remote) administrator can perform the following operations:
① View/Monitor session information (4.18.2 Sessions)
② Revoke active sessions.
③ Live View
④ Recording
To perform the above operations, the administrator needs to have View and Update permissions respectively.
Figure 6.2-9 Remote Access Permissions - Sessions
For Revoking a session
Step 1: Navigate to ‘Sessions’ list view and locate the active session.
Figure 6.2-10 Sessions list view

<Remote Operations> 438
IM 43D07N10-01EN 6th Edition: Mar. 10, 2022-00
Step 2: Click on the’ ‘ ; icon from ‘Session List view’ or navigate to Session Details and click on “REVOKE SESSION”
Figure 6.2-11 Revoking an active session from session list

<Remote Operations> 439
IM 43D07N10-01EN 6th Edition: Mar. 10, 2022-00
Figure 6.2-12 Revoking an active session from session details view
Step 3: Confirm the Revoke action by clicking on ‘OK’ from the confirmation prompt
Figure 6.2-13 Confirmation Prompt to Revoke a Session
On success, a success notification is displayed

<Remote Operations> 440
IM 43D07N10-01EN 6th Edition: Mar. 10, 2022-00
Figure 6.2-14 Notification on Successful Session revoke

<Remote Operations> 441
IM 43D07N10-01EN 6th Edition: Mar. 10, 2022-00
Step 4: Verify the Revoke action
Figure 6.2-15 Revoked session – detailed view
The user’s session will be closed with the below notification and their request will be revoked.
Figure 6.2-16 Revoked remote session - user notification

<Remote Operations> 442
IM 43D07N10-01EN 6th Edition: Mar. 10, 2022-00
Figure 6.2-17 Revoked session - list view
SUPPLEMENT:
In case a Remote session whose user has ‘Direct Access’ session is revoked, the MSS administrator needs to do additional activities to prevent further access to the asset.
On such action, the credentials of the MSS Profile of the user stored in MSS will be deleted. The Direct access user can still access the asset by re-entering appropriate credentials. To prevent a user with Direct access from accessing an asset, please remove the Direct access permissions of the user at the site component.

<Remote Operations> 443
IM 43D07N10-01EN 6th Edition: Mar. 10, 2022-00
Revoke all sessions:
It is possible for an MSS administrators can revoke all the active sessions at once. To do so,
Step 1: Navigate to Sessions List view, click on ‘REVOKE ALL SESSIONS’
Figure 6.2-18 Sessions List view - Revoking all sessions

<Remote Operations> 444
IM 43D07N10-01EN 6th Edition: Mar. 10, 2022-00
Step 2: Click ‘OK’ from the following confirmation prompt
Figure 6.2-19 Confirmation Prompt for Revoking All Sessions
On Success, a success notification is displayed
Figure 6.2-20 Success notification on Revoking all sessions

<Remote Operations> 445
IM 43D07N10-01EN 6th Edition: Mar. 10, 2022-00
6.3 Remote session Recordings
Every MSS Remote session, since MSS R1.5, can be recorded. The recorded session is stored for 30 days in MSS and is available for download by MSS users and administrators.
From a user session, it is possible to record the following information:
① Remote Screen
② Mouse cursor
③ Keystrokes
Live Session recording
To record a remote session, ensure that ‘Record session’ is enabled in a ‘remote profile.’
Figure 6.3-1 Enabling Session Recording
Connect to the asset from the ‘remote profile.’ A notification can be seen on the remote session, which is being recorded.
SUPPLEMENT
Refer to 6.1.2 Creating an MSS Remote Access Profile to know how to navigate to the profile screen

<Remote Operations> 446
IM 43D07N10-01EN 6th Edition: Mar. 10, 2022-00
Figure 6.3-2 Connecting to remote asset
Figure 6.3-3 Active session RDP recording

<Remote Operations> 447
IM 43D07N10-01EN 6th Edition: Mar. 10, 2022-00
Viewing and Downloading a Remote Session
Such active sessions can be viewed by other users and administrator in Site Component. Navigate to session to look for an active session.
Navigate to Sessions and click on ‘View live’ to see the remote session.
Figure 6.3-4 List view of sessions - Live & recording View
Navigate to viewer tab. MSS will stream the current remote session in real time.
After the session is completed, it is possible to still see the sessions by click on view session recording icon.
It is possible to view and download the recording

<Remote Operations> 448
IM 43D07N10-01EN 6th Edition: Mar. 10, 2022-00
Figure 6.3-5 Downloading the recording
CAUTION
Some downloaded videos, such as those that are vertically long, may not be playable with Windows standard movie player. It may be playable by other players such as VLC Media Player.
Default settings of remote session recording
Remote recording is disabled in MSS by default. A user needs to manually opt-in to record a remote session by enabling the feature in the MSS user Profile.
By default, MSS will keep a recorded session for 30 days.

<Remote Operations> 449
IM 43D07N10-01EN 6th Edition: Mar. 10, 2022-00
6.4 Remote Access Characteristics
In this chapter, we will discuss various characteristics of MSS Remote protocols.
Session Limits applied by the Asset
The maximum concurrent and default sessions are dictated by assets.
SSH
The default limit of SSH connections is usually 10 for Linux based system. However, depending on the individual configuration of asset, this limit might be different
VNC
The maximum active concurrent session in VNC is 2
RDP
The maximum active concurrent sessions in MSS RDP is
① ‘1’ in case of Windows Client Operating system such as Windows 10.
② ‘2’ in case of Windows Server Operating system such as Windows Server 2019
The maximum connections can be increased if dedicated remote terminal servers or with licenses.
If connection is made after maximum connection is reached, an active user is required to logoff.
CAUTION
The limits discussed here do not represent the limit of the MSS but the asset or SSH Client.
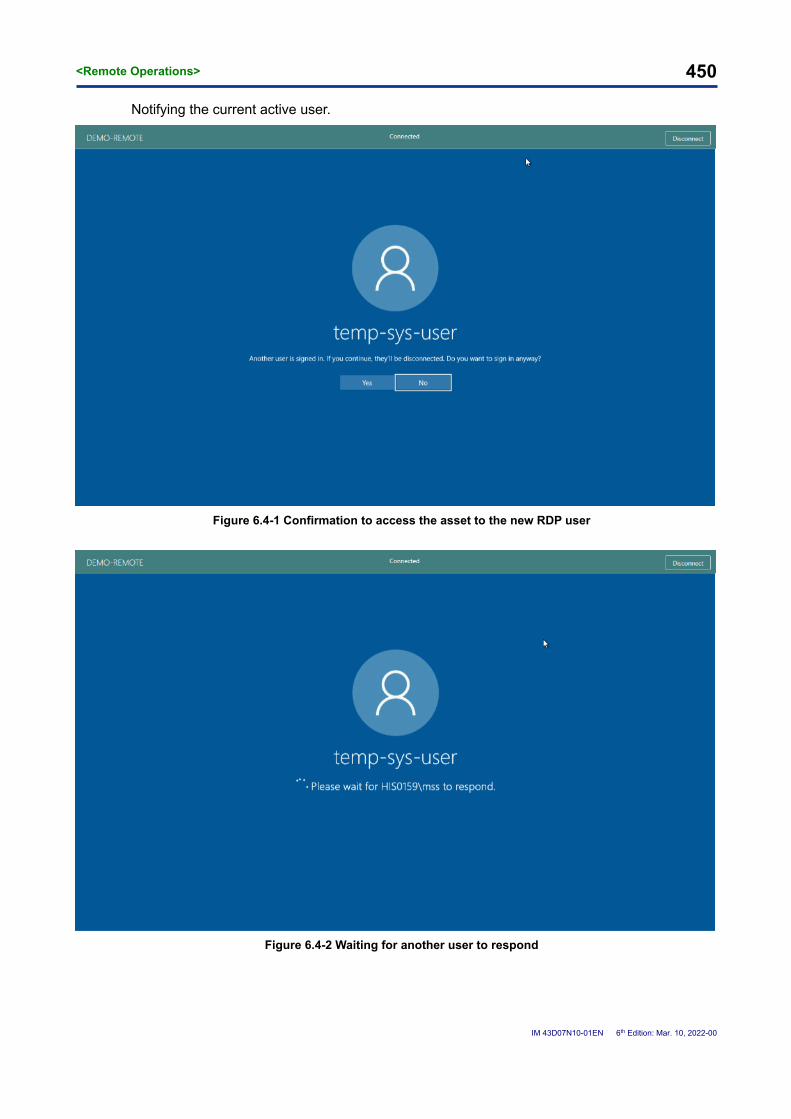
<Remote Operations> 450
IM 43D07N10-01EN 6th Edition: Mar. 10, 2022-00
Notifying the current active user.
Figure 6.4-1 Confirmation to access the asset to the new RDP user
Figure 6.4-2 Waiting for another user to respond

<Remote Operations> 451
IM 43D07N10-01EN 6th Edition: Mar. 10, 2022-00
Figure 6.4-3 Notification about the request to access to a new user

<Remote Operations> 452
IM 43D07N10-01EN 6th Edition: Mar. 10, 2022-00
SSH Shell
Using SSH, MSS users can connect remotely to Network assets via a terminal.
An SSH connection is established between an SSH client and an SSH server. When an SSH connection is initiated from MSS to a network server, MSS acts as an SSH client and the network asset acts as an SSH server.
The SSH experience of the user is determined by both MSS and the target network asset.
While MSS manages some of terminal configuration such as clipboard behavior, color scheme etc. most of the session configuration, such as Maximum number of sessions, is managed by the SSH server or the network asset itself.
In case any configuration changes related to SSH are to be performed, the changes need to be executed on the asset itself.
Usually, an asset will have the following terminals configured to be as default. Note that the actual terminal a user might connect to might differ based on its configuration.
Table 6.4-1 SSH Server default shells/terminals
Asset Type Shell
Windows Command Prompt
Network BASH
SUPPLEMENT
The recommended way to connect with a Compute asset is through RDP. However, SSH connections can be made to windows hosts. This is particularly useful when working with Windows Core servers.
An SSH server comes pre-installed from Windows 10 and Windows Server 2019 onwards. For the prior versions, SSH needs to be manually installed.
CAUTION
It is possible to add Linux systems and perform remote operations on them through SSH. However, only remote operations are officially supported. Other configurations such as data collection are not officially supported yet by MSS.
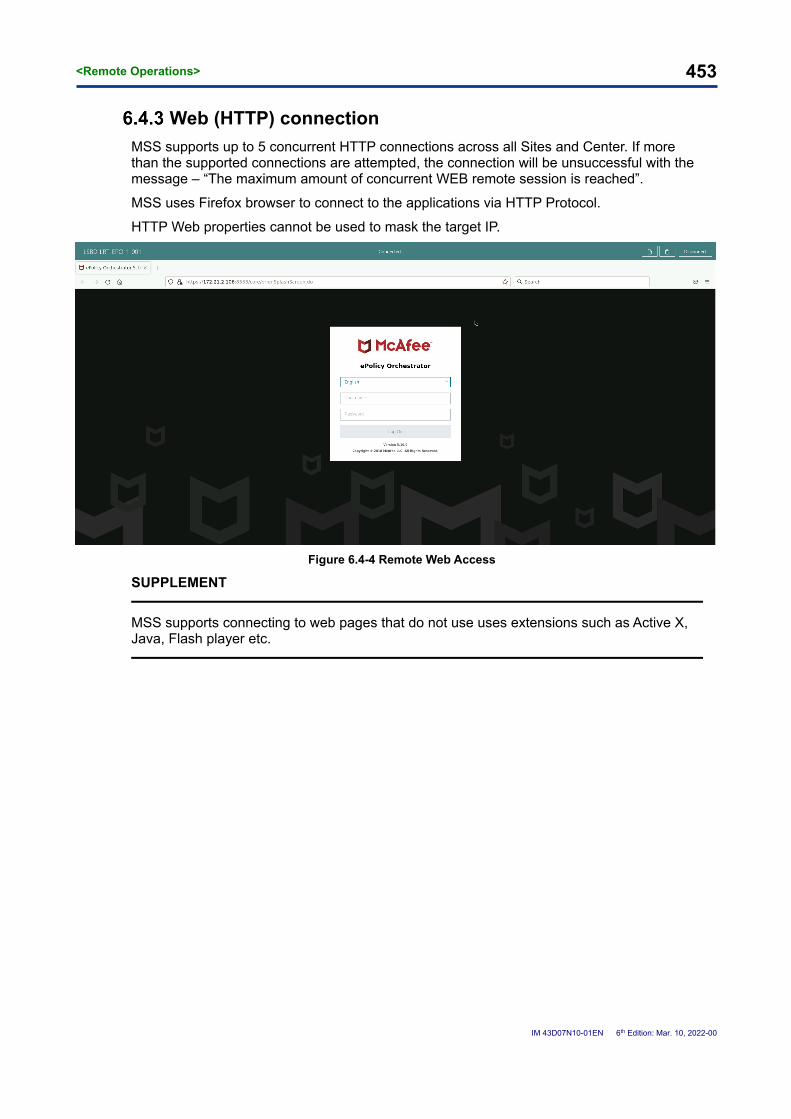
<Remote Operations> 453
IM 43D07N10-01EN 6th Edition: Mar. 10, 2022-00
Web (HTTP) connection
MSS supports up to 5 concurrent HTTP connections across all Sites and Center. If more than the supported connections are attempted, the connection will be unsuccessful with the message – “The maximum amount of concurrent WEB remote session is reached”.
MSS uses Firefox browser to connect to the applications via HTTP Protocol.
HTTP Web properties cannot be used to mask the target IP.
Figure 6.4-4 Remote Web Access
SUPPLEMENT
MSS supports connecting to web pages that do not use uses extensions such as Active X, Java, Flash player etc.

<Remote Operations> 454
IM 43D07N10-01EN 6th Edition: Mar. 10, 2022-00
6.5 Other Remote Operations
Performing Admin Actions
Depending on the permission level of the credentials used to connect to the asset, the user can perform limited tasks to high level administrative activities.
MSS administrators can use two methods to permit System/Windows/Application administrators to perform remote operations on an asset.
Allow the administrators to login to MSS with their own System Admin credentials
Create New user accounts with appropriate permissions and instruct the System administrators to connect using these.
MSS user with System admin access for an asset.
Instruct the user to follow the instructions provided in Chapter 6.1.2 Creating an MSS Remote Access Profile ~ 6.1.4 Connecting to an asset through Direct access to connect to the asset. In case an MSS administrator pre-configures an MSS profile, please follow from Chapter 6.1.3 Connecting to an asset through Request access or 6.1.4 Connecting to an asset through Direct access.
Once logged in, launch an application as an administrator:
Step 1: Right click on the application (in this case Command Prompt) you would like to run as administrator and select ‘Run as administrator’
Figure 6.5-1 Launching an application as administrator

<Remote Operations> 455
IM 43D07N10-01EN 6th Edition: Mar. 10, 2022-00
Step 2: Confirm the prompt
Figure 6.5-2 Confirming the admin action prompt
Step 3: The application has now been launched with Administrative privileges
Figure 6.5-3 Application launched as an administrator

<Remote Operations> 456
IM 43D07N10-01EN 6th Edition: Mar. 10, 2022-00
In case a user needs to access an asset temporarily to perform a specific operation. The above method is not suitable. In such cases, we recommend the alternative use-case.
① Set the permissions of MSS user in Site to ‘Request Access’
② Either create a dedicated user account in Active Directory as a Service Account or can create a local user account for the temp user to proxy through
Here, we will use a local user.
Step 1: Create a local MSS user
Figure 6.5-4 Creating a local user

<Remote Operations> 457
IM 43D07N10-01EN 6th Edition: Mar. 10, 2022-00
Step 2: Grant appropriate permissions to the user account (in this case RDP).
Figure 6.5-5 Adding the local user to administrative group
Step 3: Pre-Configure an MSS Profile with newly created account for the MSS user
Figure 6.5-6 Creating an MSS profile for the newly created local user

<Remote Operations> 458
IM 43D07N10-01EN 6th Edition: Mar. 10, 2022-00
Step 4: Once pre-configured, instruct the System administrator to either directly connect using the profile or create an access request
Figure 6.5-7 Accessing the asset with a pre-configured profile
Step 5: On Successful Login with the new account
Figure 6.5-8 Performing operations in asset with a pre-configured profile

<Remote Operations> 459
IM 43D07N10-01EN 6th Edition: Mar. 10, 2022-00
CAUTION
Admin operations can still be performed through the temp-sys-user account if the logged in user has knowledge about a user account with admin privileges
Figure 6.5-9 Prompt for temp-user to switch to an administrative account

<Remote Operations> 460
IM 43D07N10-01EN 6th Edition: Mar. 10, 2022-00
Printing a document
The action of Printing a document in MSS can be interpreted as generating a printable PDF version to be saved in the local machine. MSS allows documents to be printed from a remotely connected asset if the connection is made through RDP.
To print from an MSS asset, do the following:
Step 1: Navigate to MSS RDP Profile > Expand Extra Options and locate Device Redirection.
Figure 6.5-10 Configuring Remote Printer option

<Remote Operations> 461
IM 43D07N10-01EN 6th Edition: Mar. 10, 2022-00
Step 2: Configure the MSS User profile to support/supports printing
This is done by:
① Enabling Printing (required)
② Entering a label in the ‘Redirected Printer Name’ to easily distinguish the remote printer. Save the changes (optional)
Figure 6.5-11 Enabling print and providing a name for printer
Step 3: Access the asset with the profile and open the file that needs to be printed
Figure 6.5-12 Preparing the file to print

<Remote Operations> 462
IM 43D07N10-01EN 6th Edition: Mar. 10, 2022-00
Step 4: Proceed with Normal Printer operation. Locate the Printer configured in MSS
Figure 6.5-13 Accessing MSS printer from the remote asset
Step 5: Select “Save File” if promoted to save the file as a local download
Figure 6.5-14 Saving the printed document as PDF to local machine

<Remote Operations> 463
IM 43D07N10-01EN 6th Edition: Mar. 10, 2022-00
Step 6: Verify the PDF file that was just downloaded
Figure 6.5-15 Accessing the local pdf which was printed
Next, the pdf can be printed using local printer.

<Remote Operations> 464
IM 43D07N10-01EN 6th Edition: Mar. 10, 2022-00
Device Redirection
Various MSS remote protocols integrate various drivers for enhanced remote experience:
MSS R1.5 supports following device redirection
Table 6.5-1 Available drivers of remote asset for device redirection
Supported devices Description
Audio Allows audio from Remote asset to be played/recorded from local machine
Print Allows printing of a document from remote asset to local machine as PDF
The functionality is supported by following protocol
Table 6.5-2 Supported drivers across Protocols
Protocol Audio Print
RDP
VNC - SSH - - Web - -
CAUTION
For VNC, MSS R1.5 supports Audio Output, but not audio input

<Remote Operations> 465
IM 43D07N10-01EN 6th Edition: Mar. 10, 2022-00
Clipboard Operations
All remote protocols in MSS support Copy and Paste actions from and to Remote sessions.
Clipboard options are configured at Profile level and can be disabled as required by an MSS administrator.
Figure 6.5-16 Clipboard option in RDP Profile (under ‘Extra option’)
Figure 6.5-17 Clipboard option in VNC Profile
Figure 6.5-18 Clipboard option in SSH operations
Copying from the local machine to a remote machine
Step 1: After copying the content you need to paste to the remote machine, click on the ‘ ’ icon and paste the content inside it.
Figure 6.5-19 Clipboard option - Copying from the local machine to the remote machine’s clipboard

<Remote Operations> 466
IM 43D07N10-01EN 6th Edition: Mar. 10, 2022-00
Step 2: Paste the content to any application in the remote machine
Figure 6.5-20 Clipboard option - Pasting to the remote machine
Copying from the remote machine to the local machine
Step 1: After copying the content in the remote machine, click on the ‘ ’ icon and confirm that the Clipboard has been updated.
Figure 6.5-21 Clipboard option - Copying from the remote machine to the local machine
On Successful copy, the contents of Clipboard should be updated.

<Remote Operations> 467
IM 43D07N10-01EN 6th Edition: Mar. 10, 2022-00
Known Errors
The following are a list of known errors with connecting to Remote Desktop.
Table 6.5-3 Known errors with Remote Connectivity
Error Subcategory Error Message
UNSUPPORTED The operation requested is unimplemented.
SERVER_BUSY The server is busy and cannot service the request.
SERVER_ERROR An unexpected internal error occurred.
RESOURCE_NOT_FOUND The requested resource is not present.
RESOURCE_CONFLICT The resource is already in use and cannot be shared.
CLIENT_BAD_REQUEST The client made an invalid request.
CLIENT_UNAUTHORIZED The client is not logged in.
CLIENT_FORBIDDEN Access is denied, regardless of whether the client is logged in.
CLIENT_TIMEOUT The client took too long to respond
CLIENT_OVERRUN The submitted data is too large.
CLIENT_BAD_TYPE Data was submitted with an unsupported mime type.
CLIENT_TOO_MANY The client has already made too many requests for this or other resources.
UPSTREAM_ERROR The upstream server (beyond or tunnel) return an error
UPSTREAM_TIMEOUT The upstream server is not responding. In most cases, the upstream server is Remote desktop server

<Automations> 468
IM 43D07N10-01EN 6th Edition: Mar. 10, 2022-00
7. Automations
In this chapter, we discuss another core functionality and its related components of MSS - MSS Automations.
In MSS R1.5, MSS Automation is what equips MSS with monitoring and notification capabilities. However, due to adopting a highly flexible architectural approach, MSS users can customize it highly and apply it to various use cases.
In this chapter, we deep dive into MSS Automations.
We begin with introducing how MSS Automations works by discussing the:
MSS Automation Concepts.
MSS Automation Architecture.
Differences of MSS Automation over the Traditional approach.
And then, based on a use case, we will:
Create an Automation,
Configure an Automation, and
Delete an Automation.

<Automations> 469
IM 43D07N10-01EN 6th Edition: Mar. 10, 2022-00
7.1 MSS Automation Concepts
To understand MSS Automations, let’s begin with a simple scenario - we want to get notified whenever an asset’s CPU level exceeds the 90% during business hours.
To do so, let’s first redefine the above requirement to a use case:
When an asset’s CPU average is greater than 90%, and the time of change is between 8 AM to 8 PM, create an alert. Here, business hours are defined to be between 8 AM to 8 PM.
Next, let’s start breaking down the user case further:
When
‘an asset’s CPU average is greater than 90%,’
And the
‘time of change is between 8 AM to 8 PM,’
Then
‘create an alert.’
Generalizing the above statement, we can get:
When
’a specific event is triggered,’
And
‘it meets a condition,’
Then
‘do an action.’
Triggers, Conditions, and Actions. These are the three main components of ‘MSS automation.’
Figure 7.1-1 Automation Flow
Now that we know how to write an automation rule let explore what other components are required to make it work.
In our rule, we have specified that we want an alert when the CPU average is higher than 90% (and on meeting condition). However, the automation rule itself isn’t aware of what the threshold of the asset is.
To solve this problem, we need to introduce a database that contains information about the

<Automations> 470
IM 43D07N10-01EN 6th Edition: Mar. 10, 2022-00
asset's CPU values. This database is the ‘MSS data store.’
MSS uses ‘monitors’ to track the asset's CPU values and stores them in MSS data store. By comparing the CPU values, we can track their changes over time. Such changes can be treated as an ‘event,’ and the ‘MSS data store’ can be treated as an ‘event source.’
Figure 7.1-2 Automation with Event source
A Monitor saves CPU data over a specified period, such as 2 hrs., 24 hours, or 7 days. However, our automation rule needs to be triggered when the CPU value is over 90% and not when the entry is made. So, it becomes essential to look at the ‘state’ of the asset.
Now, we can configure our Automation rule to run depending on the ‘state’ of the asset. We can redefine our monitor's actions from collecting CPU data to saving asset’s state. Our Automation rules are now triggered only when the asset has a state of > 90% CPU.’
Figure 7.1-3 Automation with Event source and State
The next step is specifying conditions.
While every value greater of asset’s CPU greater than 90% now triggers our automation rule, we must create an alert only during business hours.
We need to check if the ‘time’ of the ‘event change’ is between ‘8 AM’ and ‘8 PM.’ ‘Conditions’ in Automation can be used to specify such checks.
Conditions are optional. It is possible to have more than zero, one, or many conditions per Automation. In cases where there is more than one condition, ‘OR,’ ‘AND’ or ‘NOT’ can be used to combine multiple cases. If they evaluate to TRUE, the ‘action’ is triggered.
The final step is specifying action.
The ‘Action’ step is relatively straightforward. Here, you configure what you want your Automation to do. In our use case, we want to create an alert.
Like Triggers, our automation rule itself cannot create an alert. So, it needs to call an external service to execute the action.

<Automations> 471
IM 43D07N10-01EN 6th Edition: Mar. 10, 2022-00
Figure 7.1-4 Automation with Entry State and Action
The use case described so far is how MSS automation work as well. In the next chapter, we explore the concepts discussed so far from an MSS architecture Point of View.

<Automations> 472
IM 43D07N10-01EN 6th Edition: Mar. 10, 2022-00
7.2 MSS Automations Architecture
A basic definition of ‘MSS automation’ is an ‘MSS feature’ that executes specific actions such as creating alerts based on various events such as states of assets and applications or Time.
In the previous section, we looked at the concept of Automation of a use-case in general. In this section, we apply it to MSS. We can explore the architecture of MSS using the same use-case in MSS - When an asset’s CPU average is higher than 90%, and the time of change is between 8 AM to 8 PM, create an alert.
‘MSS Automations’ implements the above use-case using 3 different components. They are:
① Monitors (Event Source).
② Automation rules (Automations), and.
③ Alert Service (Execution).
Monitors
Monitors, or MSS Monitors, are defined as MSS standard queries that are applied on an individual asset or application’s data and save its state.
Every monitor is associated with a data collector. Monitor, when enabled, is applied on the data collected from data collector.
MSS provides multiple monitors for assets and application which run on a specified interval on the collect data from the asset. Data collector in Site component collects data from monitors and stores it in the Center Component. MSS monitors run on Center component.
Figure 7.2-1 MSS Architecture - Monitor

<Automations> 473
IM 43D07N10-01EN 6th Edition: Mar. 10, 2022-00
MSS R1.5 supports monitors for the following asset types:
Table 7.2-1 MSS Supported Monitors
Asset Type Asset Subtype
Compute assets Agent-based
WMI-based
PLC/DCS assets
Field Control Station (FCS)
Safety Control Station (SCS)
Vnet Router (AVR)
Bus Converter (BCV)
Wide Area Communication Router (WAC)
Field assets Field assets
Network assets
Router
Switch
Firewall
Time Server
Environmental assets Online Diagnostic Unit (ODU)
Security applications McAfee ePolicy Orchestrator
Windows Server Update Services
Control applications Centum Project
Asset Management applications Plant Resource Manager (PRM)

<Automations> 474
IM 43D07N10-01EN 6th Edition: Mar. 10, 2022-00
Automation Rules
The automation rule allows MSS users to specify what action needs to be taken based on the specified asset’s state or event. MSS users can create it in the Site component. However, MSS processes the automation rule in the Center component.
An Automation rule consists of triggers, conditions, and actions.
Figure 7.2-2 MSS Architecture - Monitors, Automation Rules
‘Triggers’ are business rules that start automation rules over a set of objects.
‘Conditions’ are optional rules used to evaluate the automation rule further and determine whether to execute an action.
Finally, ‘Actions’ are the information defined in the Automation rule that specifies the operation that needs to be performed by MSS.
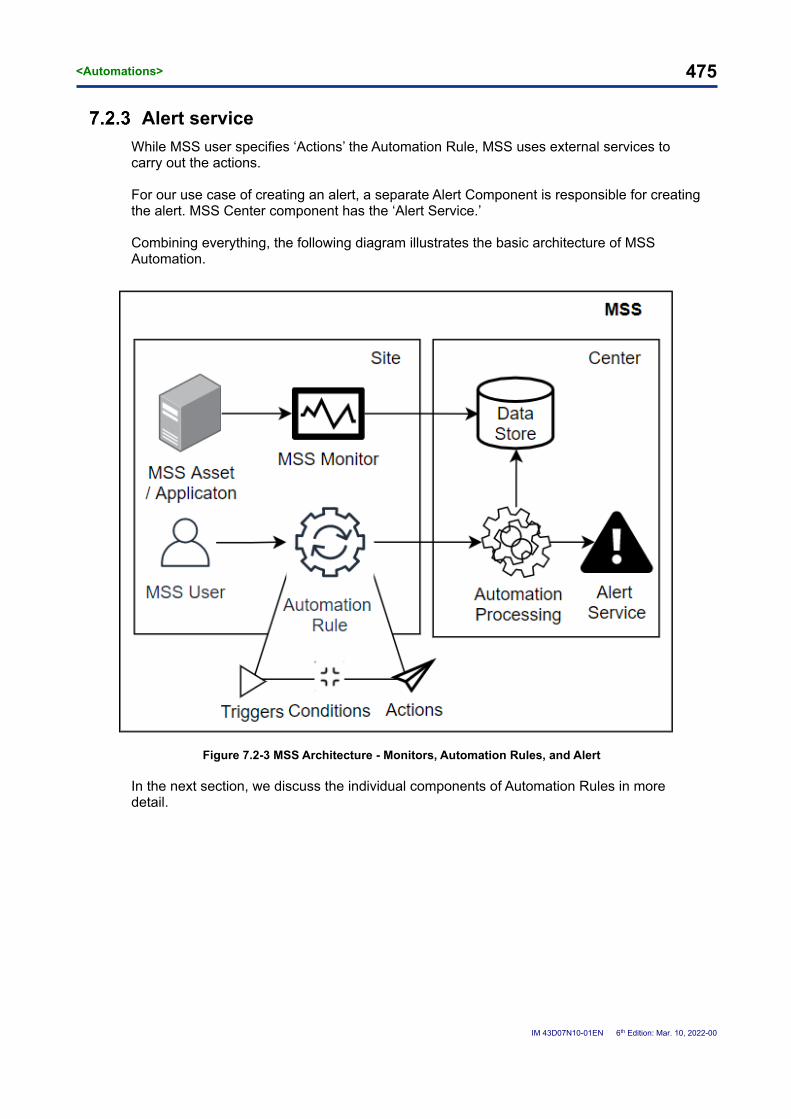
<Automations> 475
IM 43D07N10-01EN 6th Edition: Mar. 10, 2022-00
Alert service
While MSS user specifies ‘Actions’ the Automation Rule, MSS uses external services to carry out the actions.
For our use case of creating an alert, a separate Alert Component is responsible for creating the alert. MSS Center component has the ‘Alert Service.’
Combining everything, the following diagram illustrates the basic architecture of MSS Automation.
Figure 7.2-3 MSS Architecture - Monitors, Automation Rules, and Alert
In the next section, we discuss the individual components of Automation Rules in more detail.

<Automations> 476
IM 43D07N10-01EN 6th Edition: Mar. 10, 2022-00
7.3 Automation Rules Components
As discussed in the previous section, Automation Rules consists of three components:
① Triggers.
② Conditions, and
③ Actions.
Figure 7.3-1 Automation Components - Triggers, Conditions and Actions
In this section, we explore individual components in-depth:

<Automations> 477
IM 43D07N10-01EN 6th Edition: Mar. 10, 2022-00
Triggers
Triggers or ‘Automation triggers’ in MSS are business rules that start automation rules over a set of objects. For example,
A Functional rule:
If the CPU average is higher than 80%, then trigger an action.
Translates into:
Check from the last event record if a value is higher than 80%, for all the assets that this is true, continue.
Figure 7.3-2 Triggers in MSS Automations
Triggers are what start the processing of an automation rule. Every Automation rule has only one trigger. MSS supports five types of triggers:
Table 7.3-1 Supported trigger type
Field Name Values
Trigger type
Event range
State change
State change operator
Time
Time pattern

<Automations> 478
IM 43D07N10-01EN 6th Edition: Mar. 10, 2022-00
And each trigger can be configured uniquely:
Table 7.3-2 Available fields in Event range trigger
Field Name Values Description
Asset / Application (mss.id)
All applicable assets/applications
Applies automation rule to all assets on the site. Can be set by clicking on ‘All’
A single asset in site, selected from dropdown
An individual asset in MSS site on which the automation rule is applied.
Function
SUM Aggregates the value from the various event ranges to generate a single number, which can be compared with the ‘value’ field
MAX
MIN
AVG
Operator
‘Greater than’ (>)
Compares the asset's numeric value in the automation rule with the value specified in the ‘value’ field.
Greater than or equal to (>=)
Smaller than (<)
Smaller than or equal to (<=)
Equal to (==)
Not equal to (!=)
Entity Custom
The specific state of the asset which is being compared in the automation rule. Refer to
Table 7.3-7 MSS Supported entity values for a list of valid entities.
Value Custom Specifying threshold for invoking the automation rule
For HH:MM: SS Duration of the event/changes
Table 7.3-3 State change trigger
Field Name Values Description
Asset / Application (mss.id)
All applicable assets/applications
Applies automation rule to all assets on the site
A single asset in site, selected from dropdown
An individual asset in the MSS site on which the automation rule is applied
From Custom The initial state of the asset
To Custom The current state of the asset
Entity Custom
The specific state of the asset which is being compared in the automation rule. Refer to
Table 7.3-7 MSS Supported entity values for a list of valid entities.
For HH:MM: SS Duration of the event/changes
Use initial event Boolean Adds an empty event, which will trigger a state change if there is one event or all event values are the same.

<Automations> 479
IM 43D07N10-01EN 6th Edition: Mar. 10, 2022-00
Table 7.3-4 State change operator Trigger
Field Name Values Description
Asset / Application (mss.id)
All applicable assets/applications
Applies automation rule to all assets on the site
A single asset in site, selected from dropdown
An individual asset in the MSS site on which the automation rule is applied
Operator
‘Greater than’ (>)
Compares the asset's numeric value in the automation rule with the ‘value’ specified in the ‘value’ field.
Greater than or equal to (>=)
Smaller than (<)
Smaller than or equal to (<=)
Equal to (==)
Not equal to (!=)
Value Custom Specifying threshold for invoking the automation rule
Entity Custom
The specific state of the asset which is being compared in the automation rule. Refer to
Table 7.3-7 MSS Supported entity values for a list of valid entities.
For HH:MM: SS Duration of the event/changes
Use initial event Boolean Adds an empty event, which will trigger a state change if there is one event or all event values are the same.
Table 7.3-5 Time Trigger
Field Name Values Description
Time HH:MM: SS The timestamp of the event
Table 7.3-6 Time pattern trigger
Field Name Values Description
For HH:MM: SS Duration of the event/changes

<Automations> 480
IM 43D07N10-01EN 6th Edition: Mar. 10, 2022-00
Table 7.3-7 MSS Supported entity values
Asset Type Monitor Name Example
All Supported Assets / Applications
Heartbeat
Heartbeat.AverageUptimeOneHour Heartbeat.AverageUptimeOneHour
Heartbeat.AverageUptimeSixHours Heartbeat.AverageUptimeSixHours
Heartbeat.AverageUptimeTwentyFourHours
Heartbeat.AverageUptimeTwentyFourHours
Compute asset
CPU average
Compute.AverageCPU.TwoHours Compute.AverageCPU.TwoHours
Compute.AverageCPU.TwentyFourHours Compute.AverageCPU.TwentyFourHours
Compute.AverageCPU.SevenDays Compute.AverageCPU.SevenDays
Memory average
Compute.MemoryAverage.Percentage.TwoHours
Compute.MemoryAverage.Percentage.TwoHours
Compute.MemoryAverage.Percentage.TwentyFourHours
Compute.MemoryAverage.Percentage.TwentyFourHours
Compute.MemoryAverage.Percentage.SevenDays
Compute.MemoryAverage.Percentage.SevenDays
Logical disk used in percentage
Compute.DiskLogicalUsed.PCT.<asset’s drive letter>
Compute.DiskLogicalUsed.PCT.C:
Compute.DiskTotalUsedPercentage.total_disk_size.<asset’s drive letter>
Compute.DiskTotalUsedPercentage.total_disk_size.C:
Compute.DiskTotalUsedPercentage.total_free_size.<asset’s drive letter>
Compute.DiskTotalUsedPercentage.total_free_size.C:
Compute.DiskTotalUsedPercentage.used_percentage.<asset’s drive letter>
Compute.DiskTotalUsedPercentage.used_percentage.C:
Logical disk used in bytes
Compute.DiskLogicalFree.Bytes.<asset’s drive letter>
Compute.DiskLogicalFree.Bytes.C:
Compute.DiskLogicalTotalUsed.PCT Compute.DiskLogicalTotalUsed.PCT
Compute.DiskLogicalTotalFree.Bytes.<asset’s drive letter>
Compute.DiskLogicalTotalFree.Bytes.C:
Critical events Compute.Event.Critical.Count.OneHour.<event id>
Compute.Event.Critical.Count.OneHour.4625
Network asset
Network interface
Network.Interface.Speed.<interface id> Network.Interface.Speed.1
Network.Interface.AdminState.<interface id>
Network.Interface.AdminState.1
Network.Interface.OperationalState.<interface id>
Network.Interface.OperationalState.1
Network.Interface.Speed.<interface id> Network.Interface.Speed.1
CPU average
Network.Average.CPU.TwoHours Network.Average.CPU.TwoHours
Network.Average.CPU.TwentyFourHours Network.Average.CPU.TwentyFourHours
Network.Average.CPU.SevenDays Network.Average.CPU.SevenDays
Memory
Network.Memory.AveragePercentage.TwoHours
Network.Memory.AveragePercentage.TwoHours
Network.Memory.AveragePercentage.TwentyFourHours
Network.Memory.AveragePercentage.TwentyFourHours
Network.Memory.AveragePercentage.SevenDays
Network.Memory.AveragePercentage.SevenDays
Temperature
Network.Average.Temperature.TwoHours Network.Average.Temperature.TwoHours
Network.Average.Temperature.TwentyFourHours
Network.Average.Temperature.TwentyFourHours
Network.Average.Temperature.SevenDays
Network.Average.Temperature.SevenDays
VLAN Network.Vlan.AdminState.<interface id> Network.Vlan.AdminState.1
PLC/DCS assets
CPU average PLC.Average.CPU.TwoHours PLC.Average.CPU.TwoHours
PLC.Average.CPU.TwentyFourHours PLC.Average.CPU.TwentyFourHours

<Automations> 481
IM 43D07N10-01EN 6th Edition: Mar. 10, 2022-00
Asset Type Monitor Name Example
Network.Average.CPU.SevenDays Network.Average.CPU.SevenDays
ECC error counter (left / right)
PLC.EccError.Count.Right PLC.EccError.Count.Right
PLC.EccError.Count.Left PLC.EccError.Count.Left
Temperature (in / out / battery)
PLC.Average.TempAirIn.TwoHours PLC.Average.TempAirIn.TwoHours
PLC.Average.TempAirIn.TwentyFourHours
PLC.Average.TempAirIn.TwentyFourHours
PLC.Average.TempAirIn.SevenDays PLC.Average.TempAirIn.SevenDays
PLC.Average.TempAirOut.TwoHours PLC.Average.TempAirOut.TwoHours
PLC.Average.TempAirOut.TwentyFourHours
PLC.Average.TempAirOut.TwentyFourHours
PLC.Average.TempAirOut.SevenDays PLC.Average.TempAirOut.SevenDays
PLC.Average.TempBattery.TwoHours PLC.Average.TempBattery.TwoHours
PLC.Average.TempBattery.TwentyFourHours
PLC.Average.TempBattery.TwentyFourHours
PLC.Average.TempBattery.SevenDays PLC.Average.TempBattery.SevenDays
VNet load
PLC.Average.VnetLoad.TwoHours PLC.Average.VnetLoad.TwoHours
PLC.Average.VnetLoad.TwentyFourHours PLC.Average.VnetLoad.TwentyFourHours
PLC.Average.VnetLoad.SevenDays PLC.Average.VnetLoad.SevenDays
PRM
Audit Logs PRM.Audit.Logs.Device.Deleted.TwoHours
PRM.Audit.Logs.Device.Deleted.TwoHours
User Login PRM.Auth.Logs.UserLogin PRM.Auth.Logs.UserLogin
User Logout PRM.Auth.Logs.UserLogout PRM.Auth.Logs.UserLogout
Field assets
Diagnostic events
Field.Critical.Diagnostic.Events.Count.TwoHours
Field.Critical.Diagnostic.Events.Count.TwoHours,
Maintenance events
Field.Critical.Maintenance.Events.Count.TwoHours,
Field.Critical.Maintenance.Events.Count.TwoHours,
Namur State Field.Namur.State Field.Namur.State
Environmental asset
Average Temperature
EnvironmentalAsset.Average.Temperature.SevenDays,
EnvironmentalAsset.Average.Temperature.SevenDays
EnvironmentalAsset.Average.Temperature.TwentyFourHours,
EnvironmentalAsset.Average.Temperature.TwentyFourHours
EnvironmentalAsset.Average.Temperature.TwoHours,
EnvironmentalAsset.Average.Temperature.TwoHours
Average Contact
EnvironmentalAsset.Average.Contact.TwoHours
EnvironmentalAsset.Average.Contact.TwoHours
EnvironmentalAsset.Average.Contact.TwentyFourHours
EnvironmentalAsset.Average.Contact.TwentyFourHours
EnvironmentalAsset.Average.Contact.SevenDays
EnvironmentalAsset.Average.Contact.SevenDays
Average Corrosion
EnvironmentalAsset.Average.Corrosion.TwoHours
EnvironmentalAsset.Average.Corrosion.TwoHours
EnvironmentalAsset.Average.Corrosion.TwentyFourHours
EnvironmentalAsset.Average.Corrosion.TwentyFourHours
EnvironmentalAsset.Average.Corrosion.SevenDays
EnvironmentalAsset.Average.Corrosion.SevenDays
Dust
EnvironmentalAsset.Average.Dust.TwoHours
EnvironmentalAsset.Average.Dust.TwoHours
EnvironmentalAsset.Average.Dust.TwentyFourHours
EnvironmentalAsset.Average.Dust.TwentyFourHours
EnvironmentalAsset.Average.Dust.SevenDays
EnvironmentalAsset.Average.Dust.SevenDays

<Automations> 482
IM 43D07N10-01EN 6th Edition: Mar. 10, 2022-00
Asset Type Monitor Name Example
Humidity
EnvironmentalAsset.Average.Humidity.TwoHours
EnvironmentalAsset.Average.Humidity.TwoHours
EnvironmentalAsset.Average.Humidity.TwentyFourHours
EnvironmentalAsset.Average.Humidity.TwentyFourHours
EnvironmentalAsset.Average.Humidity.SevenDays
EnvironmentalAsset.Average.Humidity.SevenDays
Isolation
EnvironmentalAsset.Average.Isolation.TwoHours
EnvironmentalAsset.Average.Isolation.TwoHours
EnvironmentalAsset.Average.Isolation.TwentyFourHours
EnvironmentalAsset.Average.Isolation.TwentyFourHours
EnvironmentalAsset.Average.Isolation.SevenDays
EnvironmentalAsset.Average.Isolation.SevenDays
Security applications – ePO
Client Access Protection Status.
EPO.Client.AccessProtection.Status.<computer>
EPO.Client.AccessProtection.Status.EPO-CLIENT2,
Client Content Version
EPO.Client.Content.Version.<computer>
EPO.Client.Content.Version.EPO-CLIENT2
Client events EPO.Client.Events.Count.One.Hour.<computer>.<event-id>
EPO.Client.Events.Count.One.Hour.EPO-CLIENT2.2402
Management status
EPO.Client.Management.Status.<computer>
EPO.Client.Management.Status.EPO-CLIENT2,
Client Access Scan
EPO.Client.OnAccessScan.Status.<computer>
EPO.Client.OnAccessScan.Status.EPO-CLIENT2,
Client Product Version
EPO.Client.Product.Version.<computer> EPO.Client.Product.Version.EPO-CLIENT2
Client Threats Count
EPO.Client.Threats.Count.One.Hour.<computer>.<threat id>
EPO.Client.Threats.Count.One.Hour.EPO-CLIENT2.1119
Server Audit Logs
EPO.Server.Audit.Logs EPO.Server.Audit.Logs
Security applications – WSUS
Client Sync status
WSUS.Client.Sync.Status WSUS.Client.Sync.Status
Non-Installed Approved Critical Updates
NonInstalled.Approved.Critical.Updates.<update id>
NonInstalled.Approved.Critical.Updates.4b2783b4-4107-4c68-9d0f-f10a3f1b4874
Non-installed Approved Updates
WSUS.NonInstalled.Approved.Updates.<update id>,
WSUS.NonInstalled.Approved.Updates.4b2783b4-4107-4c68-9d0f-f10a3f1b4874,
Server Critical Events
WSUS.Server.CriticalEvents.<event id> WSUS.Server.CriticalEvents.147,
Control applications – Centum VP
Process annuciator alarm Centum.Process.Annunciator.Alarm.<alar
m id> Centum.Process.Annunciator.Alarm.1201
Process annuciator re-alarm
Process block alarm
Centum.Process.Block.Alarm.<alarm id> Centum.Process.Block.Alarm.1101 Process block re-alarm
System FCS alarm
Centum.System.FCS.Alarm.<alarm id> Centum.System.FCS.Alarm.0209

<Automations> 483
IM 43D07N10-01EN 6th Edition: Mar. 10, 2022-00
Conditions
Before executing an Action, it is possible to evaluate an Automation rule further by Conditions.
Conditions are almost the same as triggers but are smarter and more advanced. A condition can have complex if/else or business rules and possible data retrieval from internal or external sources. This split is necessary because triggers are relatively flat and straightforward in load, while conditions might be heavier on the evaluation.
Figure 7.3-3 Conditions in Automation
Conditions are optional and prevent further execution of automation rules unless all conditions are satisfied.
Automation can have ‘n’ number of conditions. An MSS user can combine them in various orders to refine and execute a specific action in a specific situation.
The fields available in conditions are mostly the same as triggers. However, there are some exclusive conditions such as Attributes, OR, AND, etc.

<Automations> 484
IM 43D07N10-01EN 6th Edition: Mar. 10, 2022-00
Actions
Actions are the operations performed by MSS after identifying an asset that matches the conditions/behavior described in triggers and Automation.
MSS R1.5 supports the following action - notify the user by creating an alert in Center Component.
Figure 7.3-4 Triggers in Automation
A trigger consists of the following fields:
Table 7.3-8 Information about trigger fields in Automation
Field Name Values Description
Action type Call service Call a Supported Service
Service
Create MSS alert Create an alert in MSS Center component
Create ServiceNow alert Creates an incident in a ServiceNow instance registered with the user
Send email notification Sends an email to the specified recipient
Supported Actions
Creation of an MSS alert - Creates an Alert in Alert view of MSS Center Component.
Table 7.3-9 Fields in 'Create MSS alert' action
Field Name Values Description
Priority
Low
Priority of the alert Medium
High
Title Custom Name of the alert

<Automations> 485
IM 43D07N10-01EN 6th Edition: Mar. 10, 2022-00
Assigned user/group
Use MSS Custodian from trigger
The user/group the alert will be assigned to Users
Groups
Asset / Application (mss.id)
Use MSS ID from trigger ID of the asset A single asset in site, selected from
dropdown
Message Custom Message inside the MSS alert
Send email notification to Custodian(s)
Boolean If enabled, MSS sends an email to the Custodian/s of the asset which triggered the alert.
Send email to custom receiver(s)
Boolean If enabled, one or more custom recipients can be specified so that MSS can send an email to a recipient other than Custodian.
Create ServiceNow alert – Creates an incident in Service Now, which can be tracked from Alert view in MSS Center Component.
Table 7.3-10 Fields in 'Create ServiceNow alert' action
Field Name Values Description
Title Custom Name of the alert/incident
Asset / Application (mss.id)
Use MSS ID from trigger ID of the asset A single asset in site, selected from
dropdown
ServiceNow Configuration
Select A ServiceNow instance integrated with MSS
Send email notification to Custodian(s)
Boolean If enabled, MSS sends an email to the Custodian/s of the asset which triggered the alert.
Send email to custom receiver(s)
Boolean If enabled, one or more custom recipients can be specified so that MSS can send an email to a recipient other than Custodian.
Send email notification – Sends an email to specified recipient.
Table 7.3-11 Fields in 'Send Email notification' action
Field Name Values Description
Subject Custom Subject of the email
Message Custom Message inside the MSS Subject
Send email notification to Custodians
Boolean If enabled, MSS sends an email to the Custodian/s of the asset which triggered the alert.
Send email to custom receiver(s)
Boolean If enabled, one or more custom recipients can be specified so that MSS can send an email to a recipient other than Custodian.
An automation rule that was created based on the discussed use-case would be as follows:

<Automations> 486
IM 43D07N10-01EN 6th Edition: Mar. 10, 2022-00
Triggers:
Figure 7.3-5 Trigger based on use-case
Conditions:
Figure 7.3-6 Conditions based on use-case

<Automations> 487
IM 43D07N10-01EN 6th Edition: Mar. 10, 2022-00
Actions:
Figure 7.3-7 Actions based on use-case

<Automations> 488
IM 43D07N10-01EN 6th Edition: Mar. 10, 2022-00
7.4 Adding an Automation
To add site-level automation, a user needs to have the ‘Create’ permission:
Figure 7.4-1 Permissions for working with Automations in Site component
Step 1: Navigate to Configuration menu -> Automations and click Add Automation.
Figure 7.4-2 Adding a new Automation

<Automations> 489
IM 43D07N10-01EN 6th Edition: Mar. 10, 2022-00
Step 2: In Add Automation screen, define the triggers and actions.
Click on ‘Submit’ after entering the data (conditions are optional).
Figure 7.4-3 Adding a new automation - defining triggers, conditions and actions

<Automations> 490
IM 43D07N10-01EN 6th Edition: Mar. 10, 2022-00
Step 3: Verify the newly added automation in Automation List view.
Figure 7.4-4 Adding a new automation - Success notification
SUPPLEMENT
When creating an automation that is applicable to all assets in the site, one can use a wildcard option ‘*’. In such cases, to identify the asset that created the alert, users can use - attribute property.
For e.g.: The message – “The Compute asset – ‘MSS WMI based compute asset’ has reported a CPU average of over 90%. ”, can be changed to:
“The {{ attributes.trigger.asset.type }} asset – ‘{{ attributes.trigger.asset.name }}’ has reported a CPU average of over 90%.”
In case user wants to know the current value of the asset, then can add the following line. “Current value is {{ attributes.trigger.current_value }}’. The following diagram illustrates the supported values that can be used.
trigger.id trigger.key trigger.type trigger.settings
trigger.settings.to trigger.settings.from trigger.settings.time trigger.settings.entity
trigger.previous_value trigger.current_value trigger.current_date trigger.from_value
trigger.to_value trigger.ge_tme trigger.asset_id trigger.previous_event
trigger.previous_event.id trigger.previous_event.value
trigger.previous_event.date
trigger.previous_event.attributes
trigger.current_event.id trigger.current_event.value
trigger.current_event.date
trigger.previous_event.attributes
trigger.entity_params trigger.asset trigger.asset.id trigger.asset.name
trigger.asset.role trigger.asset.type trigger.asset.domain trigger.asset.deleted
trigger.asset.location trigger.asset.priority trigger.asset.custodian trigger.asset.custodian.id
trigger.asset.custodian.name
trigger.asset.custodian.type
trigger.asset.created_at trigger.asset.ip_address
trigger.asset.model_name
trigger.asset.updated_at trigger.asset.description trigger.asset.compute_asset

<Automations> 491
IM 43D07N10-01EN 6th Edition: Mar. 10, 2022-00
CAUTION
If a ‘Condition’ or ‘Action’ is removed from an Automation, the validation message- ‘Please fill out all required fields’, continues to be shown even if the Automation form being valid.
Figure 7.4-5 Validation message in a valid Automation Rule form
In such cases, the ‘Submit’ button is also disabled. To overcome this issue, focus on an input field and un-focus it. The ‘Submit’ button will be re-enabled and the validation message will disappear.

<Automations> 492
IM 43D07N10-01EN 6th Edition: Mar. 10, 2022-00
7.5 Managing an Automation
To manage a site level automation, Navigate to ‘Configuration’ / ‘Automations’
Figure 7.5-1 Managing an Automation
Toggle the Status to disable the automation. And click on Delete to delete an automation.
An asset level automation has similar operations and can be accessed by: ‘Asset > Monitor settings’
CAUTION
MSS does not support copying an Automation rule in R1.5. Please create a new Automation rule instead of copying an existing rule.

<Automations> 493
IM 43D07N10-01EN 6th Edition: Mar. 10, 2022-00
7.6 Automation Alerts
After an automation is created, its monitoring can be done via Alerts menu in Center.
Figure 7.6-1 Automation alerts menu - Center Component
The automation alert is assigned in the name of Custodian or the user specified during creation of Automation by default.
To know more details about an alert, click on it.

<Automations> 494
IM 43D07N10-01EN 6th Edition: Mar. 10, 2022-00
Figure 7.6-2 Automation alerts menu - Automation information
An alert has the following states: A user can change the status of the alert based on the actions they have performed.
Table 7.6-1 Status of Automation Alerts
Status Name Description
New Alert has been newly created in MSS component.
Closed Alert has been handled by MSS user
Acknowledged An MSS user has begun investigating the alert
Scheduled Root cause has been identified, pending implementing the fix
Awaiting Evidence Investigation is in Progress. Waiting for more information from a dependent party
Resolved Fix has been applied to MSS

<Automations> 495
IM 43D07N10-01EN 6th Edition: Mar. 10, 2022-00
Figure 7.6-3 Automation alerts menu - Status of alerts

<Automations> 496
IM 43D07N10-01EN 6th Edition: Mar. 10, 2022-00
7.7 Sending email from Automations
Users have the option to send out an email when an action is triggered in Automation. An email can be sent out after performing an action (such as creating an MSS alert) or sending out an email itself can be an action.
Figure 7.7-1 Standalone email notification form
Figure 7.7-2 Sending email from an existing action (such as ServiceNow)
MSS can be configured to send out emails to asset's custodian and/or any other users or mail groups. To avoid clogging the email system with multiple emails, MSS limits sending out only one email per hour from an Automation rule.
There are two options available in MSS for sending out emails:
1. Send email notification to custodian(s)
2. Send email to custom receiver(s)
If 'Send email notification to custodian(s)' is enabled, MSS will send email to the custodian of asset. E.g.: Users or Groups
If 'Send email to custom receiver(s)' is enabled, users can specify recipients to whom email is sent out. There can be more than one recipient.

<Automations> 497
IM 43D07N10-01EN 6th Edition: Mar. 10, 2022-00
7.8 Creating Automation rules for multiple assets
Until now, we discussed creating an Automation rule with one asset. However, this approach is not feasible to monitor multiple assets in Site.
In such scenarios, it is possible to create a single automation rule that is applicable to multiple assets.
MSS provides a ‘wildcard operator’ to handle such scenarios. By specifying ‘All applicable assets/applications’, MSS automatically applies the automation rule to all onboarded assets.
By using template strings in action form, Template strings are a way of replacing a text in the message with Automation generates a human readable message and can provide latest data from server.
E.g.: To create alerts such as –
Alert created for ‘MSS Asset 1’. Current CPU threshold is 90%,
Alert created for ‘MSS Asset 2’. Current CPU threshold is 75%,
The text can be constructed with template strings as:
Alert created for ‘{{ attributes.trigger.asset.name }}’. Current CPU threshold is {{ attributes.trigger.current_value }}%
When MSS evaluates the automation rule and finds more than one asset meeting the criteria, it creates a separate alert for every asset and tracks it individually.
E.g., If an automation rule is configured to send out email, and two assets meet the requirements, then MSS sends out two emails instead of the default of - one.
Note:
An automation rule created to check the CPU usage might not be triggered if an PLC/DCS asset reaches high usage depending on the entity used. This is because, even though asset is set to - ‘All applicable assets/applications’, MSS applies an entity filter internally during evaluation.
If the entity used is - Compute.AverageCPU.TwoHours, Compute.AverageCPU.TwentyFourHours, Compute.AverageCPU.SevenDays, then only compute assets will be evaluated in this Automation rule.

<Automations> 498
IM 43D07N10-01EN 6th Edition: Mar. 10, 2022-00
7.9 Built-in Automations
For common workloads, MSS comes with some inbuilt automation rules. MSS Admins can enable them to achieve start monitoring.
MSS R1.5 supports following built-in automations:
Table 7.9-1 Built-in Automations List
Asset/Application Function
Compute Asset
CPU average usage last 24 hours
Critical Event
Logical disk average usage last 24 hours
Memory average usage last 24 hours
PLC/DCS Asset
Air in Temperature last 24 hours
Air out Temperature last 24 hours
Battery Temperature last 24 hours
CPU average usage last 24 hours
Error Count Left
Error Count Right
Vnet load average last 24 hours
ePO Application
Client Events last 1 hour
Client Last Full Scan
Client Threats last 1 hours
WSUS Application
Client Sync status
Critical Events
Non-Installed Approved updates
Non-Installed Critical Updates
Server Sync Status
Centum VP
Urgent System Applications alarms
Urgent System Maintenance error
Urgent System FCS alarms
PRM Device Deleted last two hours
Field asset
Critical Maintenance Events last 2 hours
Critical Diagnostic Events last 2 hours
NAMUR State
Heartbeat Average heartbeat value last 24 hours

<Automations> 499
IM 43D07N10-01EN 6th Edition: Mar. 10, 2022-00
7.10 Using Conditions in Automations
Conditions are rules specified in Automations on top of Triggers, that determine whether the Automation Action should be called.
While every Automation has only one Trigger, it can have unlimited Conditions.
Figure 7.10-1 Evaluation of Conditions in an Automation rule
Every Condition has an ID Associated with it: It starts with a prefix: C followed for an integer.
E.g.: The first condition has the ID of C0.
Figure 7.10-2 Conditions form in Automations
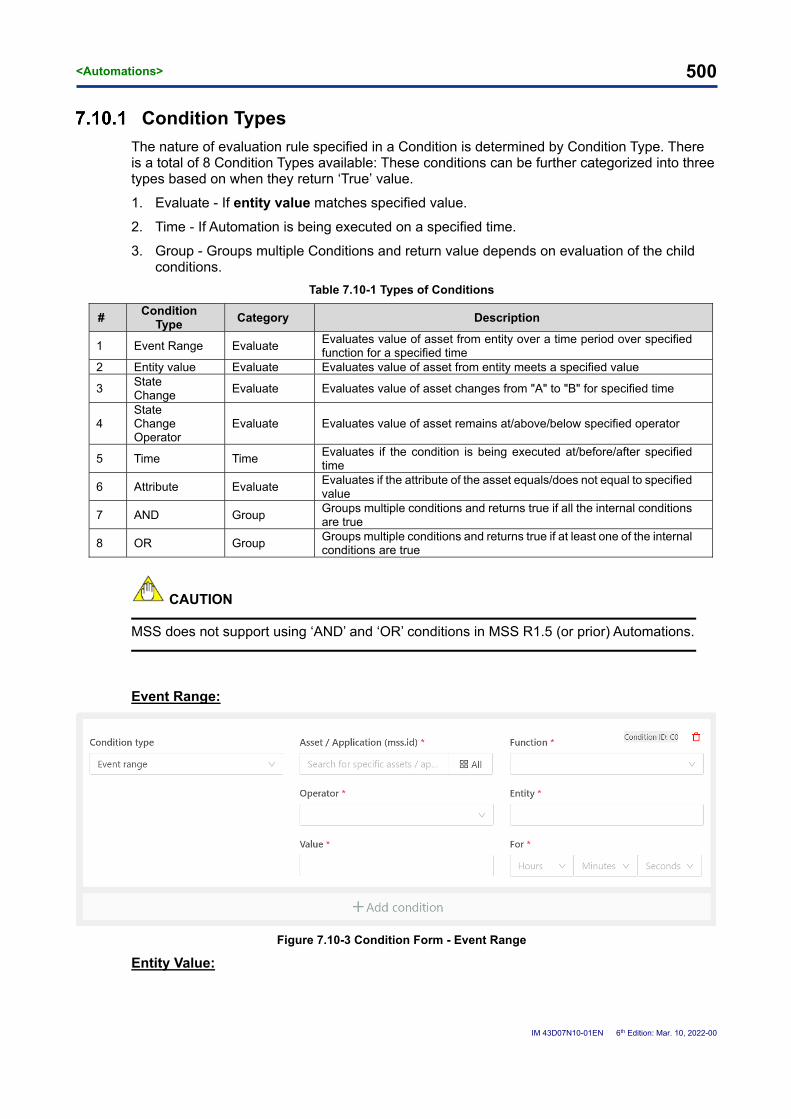
<Automations> 500
IM 43D07N10-01EN 6th Edition: Mar. 10, 2022-00
Condition Types
The nature of evaluation rule specified in a Condition is determined by Condition Type. There is a total of 8 Condition Types available: These conditions can be further categorized into three types based on when they return ‘True’ value.
1. Evaluate - If entity value matches specified value.
2. Time - If Automation is being executed on a specified time.
3. Group - Groups multiple Conditions and return value depends on evaluation of the child conditions.
Table 7.10-1 Types of Conditions
# Condition
Type Category Description
1 Event Range Evaluate Evaluates value of asset from entity over a time period over specified function for a specified time
2 Entity value Evaluate Evaluates value of asset from entity meets a specified value
3 State Change
Evaluate Evaluates value of asset changes from "A" to "B" for specified time
4 State Change Operator
Evaluate Evaluates value of asset remains at/above/below specified operator
5 Time Time Evaluates if the condition is being executed at/before/after specified time
6 Attribute Evaluate Evaluates if the attribute of the asset equals/does not equal to specified value
7 AND Group Groups multiple conditions and returns true if all the internal conditions are true
8 OR Group Groups multiple conditions and returns true if at least one of the internal conditions are true
CAUTION
MSS does not support using ‘AND’ and ‘OR’ conditions in MSS R1.5 (or prior) Automations.
Event Range:
Figure 7.10-3 Condition Form - Event Range
Entity Value:

<Automations> 501
IM 43D07N10-01EN 6th Edition: Mar. 10, 2022-00
Figure 7.10-4 Condition Form - Entity Value
State Change:
Figure 7.10-5 Condition Form - State Change
State Change Operator:
Figure 7.10-6 Condition Form - State Change Operator

<Automations> 502
IM 43D07N10-01EN 6th Edition: Mar. 10, 2022-00
Time:
Figure 7.10-7 Condition Form - Time
Attribute:
Figure 7.10-8 Condition Form - Attribute
AND:
Figure 7.10-9 Condition Form - AND

<Automations> 503
IM 43D07N10-01EN 6th Edition: Mar. 10, 2022-00
OR:
Figure 7.10-10 Condition Form – OR

<Automations> 504
IM 43D07N10-01EN 6th Edition: Mar. 10, 2022-00
7.11 Troubleshooting an Automation
In MSS R1.5, Automations has a log view that allows MSS users to look at the execution history of an Automation. This can help MSS users to understand more about the execution details of Automation and assist with troubleshooting any issues.
Users can access Automation logs by:
① Automation List view.
Figure 7.11-1 Troubleshooting an Automation - Automation Log in List view
② Show Logs button from the Automation view.
Figure 7.11-2 Troubleshooting an Automation - Navigating to Logs from Edit Automation view

<Automations> 505
IM 43D07N10-01EN 6th Edition: Mar. 10, 2022-00
An Automation rule is executed every minute. An automation log contains logs that were generated for the past day. So, a maximum of 1440 logs can be viewed.
In case there are a lot of logs and the disk is getting full, MSS removes the older logs earlier than 24 hours.
The log view consists of:
Figure 7.11-3 Troubleshooting an Automation - Automation Log in detailed view
① A Log selector – a timestamp field that contains information about the Automation execution alongside the status of execution (success/failure).
② Automation execution steps – the detailed steps performed by the Automation.
③ Show details – details of the execution step. Contains the data that Automation worked with.
Log Selector Automation Execution Steps
Show details

<Automations> 506
IM 43D07N10-01EN 6th Edition: Mar. 10, 2022-00
Figure 7.11-4 Troubleshooting an Automation - Automation Log entry
In case of failures, this helps provide some context about the nature of error.
Figure 7.11-5 Troubleshooting an Automation - Automation Log dialog

<File Transfer> 507
IM 43D07N10-01EN 6th Edition: Mar. 10, 2022-00
8. File Transfer
In this section, we discuss the details of operations that an MSS user and administrator can perform on MSS.
The discussion is in the following order:
① File Transfer Permissions
② How to do file transfer (Uploading and Downloading)
③ States of Files in MSS
④ File Transfer Policies
8.1 File Transfer Permissions
Following permissions are associated with ‘File Transfer’ operations. An MSS user needs to be assigned these permissions to perform File Transfer using MSS.
Figure 8.1-1 Permissions related to File Transfer
Table 8.1-1 Permission information of file Transfer
# Permission Description
1 Upload center Allows a user or group to upload files to Center component directly.
2 Upload site Allows a user or group to upload files to Site component directly.
3 Download center Allows a user or group to download files from Center component
4 Download site Allows a user or group to download files from Site component.
5 Share files Allows a user or group to share a file that has been uploaded by themselves.
6 Set expiration Allows a user or group to overwrite the default expiration date on an uploaded file

<File Transfer> 508
IM 43D07N10-01EN 6th Edition: Mar. 10, 2022-00
8.2 Uploading Files to MSS
A file once uploaded to MSS is available in both site and center.
Note: For this demonstration, we will use Site Component. The process is applicable to Center component as well.
CAUTION
Uploading Folders to MSS:
To upload folders, it is recommended to compress/zip into a single file. In case a Folder is directly uploaded by dropping it onto the drop zone, all the files inside it will be uploaded individually.
During a file upload, a file can be in 3 states. These states are denoted by an icon.
# Icon State Description
1 Uploading The file is currently being uploaded to Site / Center or is paused
2 Uploaded The file has been successfully uploaded in Site / Center and is available for Download
3
Pending Sync The file hasn’t been synced from Site / Center to Center / Site
Figure 8.2-1 File states in MSS
Step 1: Navigate to the ‘File Transfer’ menu in Site component.
Figure 8.2-2 File Transfer menu - navigation

<File Transfer> 509
IM 43D07N10-01EN 6th Edition: Mar. 10, 2022-00
Step 2: Initiate file upload to MSS by clicking on ‘Upload File’ Button or the ‘Drop zone’.
Figure 8.2-3 File Transfer Menu - File uploads
Step 3: Select the file to be uploaded from the explorer
Figure 8.2-4 File Transfer Menu - browsing files
Drop zone

<File Transfer> 510
IM 43D07N10-01EN 6th Edition: Mar. 10, 2022-00
Step 4: Confirm the upload in Site
Figure 8.2-5 File transfer menu - Successful File upload
Step 5: Verify that the file is synced on center as well. Make sure you are in appropriate site for the operation.
Figure 8.2-6 File transfer menu - Sync to Center

<File Transfer> 511
IM 43D07N10-01EN 6th Edition: Mar. 10, 2022-00
Uploading Multiple Files to MSS
MSS allows upload of more than 1 files at any time. Multiple files can be uploaded by
a. Selecting more than one file from the upload dialog
b. Add more files to queue while the current upload is in progress.
From the upload dialog, you can select multiple files.
Figure 8.2-7 File transfer menu - Selecting multiple files for upload
The selected files will be uploaded sequentially.

<File Transfer> 512
IM 43D07N10-01EN 6th Edition: Mar. 10, 2022-00
Figure 8.2-8 File transfer menu - Uploading multiple files
Figure 8.2-9 File transfer menu – Successful multi file upload
Pausing and Resuming Uploads:
During the upload process, MSS users can pause upload and resume it later.

<File Transfer> 513
IM 43D07N10-01EN 6th Edition: Mar. 10, 2022-00
Figure 8.2-10 File transfer menu - Pausing a file
On pausing a file, you can see the progress of current upload.
Figure 8.2-11 File transfer menu - Paused file during upload

<File Transfer> 514
IM 43D07N10-01EN 6th Edition: Mar. 10, 2022-00
You can resume the upload by clicking on icon in the file progress bar.
Figure 8.2-12 File transfer menu - Resuming a paused file
In case of multiple file uploads, pausing a file pauses the entire upload process.
CAUTION
A file paused in one browser tab/window cannot be accessible in another browser instance. In case a paused browser gets refreshed, the paused file is not available for resume.

<File Transfer> 515
IM 43D07N10-01EN 6th Edition: Mar. 10, 2022-00
8.3 Operations on uploaded file
Following operation can be performed on an uploaded file in MSS. These can be performed in both Center and/or Site. (Regardless of where the file was uploaded from).
① Downloading files
② Sharing files with other MSS users
③ Modifying file expiry date
④ Deleting files from MSS.
Download Files from MSS
To download a file, navigate to ‘File Transfer’ menu in Center or Site component.
In the menu, locate the file which needs to be downloaded and click on Download to initiate the download.
Figure 8.3-1 Downloading a File from MSS
The browser will begin its download of the file as per its configuration.

<File Transfer> 516
IM 43D07N10-01EN 6th Edition: Mar. 10, 2022-00
Sharing and unsharring files with other MSS users.
To share a file with another user, click on ‘actions menu’ (⁝) and select ‘share’.
Figure 8.3-2 Sharing a File in MSS
On successful share, the ‘shared’ icon in the data-table will have the icon and will be available to all other MSS users.
To verify, let’ s login as another MSS administrator and check for the shared file.
By applying a filter of ‘Shared’ and specifying the created date, we can see our uploaded file - ‘logo.svg’

<File Transfer> 517
IM 43D07N10-01EN 6th Edition: Mar. 10, 2022-00
Figure 8.3-3 Verifying a Shared Filed as another user in MSS
Similarly, click on ‘Unshare’ to stop sharing the file.
Figure 8.3-4 Unsharing a File from in MSS
MU – MSS User

<File Transfer> 518
IM 43D07N10-01EN 6th Edition: Mar. 10, 2022-00
Modifying File Expiry Date
By default, MSS deletes any uploaded file after 30 days. However, an MSS user can modify the expiry date to instruct the MSS to delete the file at a later or earlier file.
To modify the expiry date, click on ‘Set Expiry Date’ from ‘More actions’.
Figure 8.3-5 Modifying expiry date of a file
Choose a new expiry date. Any date from the next day is a valid choice.
SUPPLEMENT:
If a file is shared, then the expiry date can be modified by any or all MSS users.

<File Transfer> 519
IM 43D07N10-01EN 6th Edition: Mar. 10, 2022-00
Figure 8.3-6 Modifying expiry date of a file - Setting new expiry date
On success, the expiry date is modified.
Figure 8.3-7 Modifying expiry date of a file - Success notification

<File Transfer> 520
IM 43D07N10-01EN 6th Edition: Mar. 10, 2022-00
Deleting a File
To delete an uploaded file manually, select ‘Delete’ from ‘More actions (⁝)’.
Figure 8.3-8 Deleting a File from MSS
Figure 8.3-9 Deleting a File from MSS - Success Notification

<File Transfer> 521
IM 43D07N10-01EN 6th Edition: Mar. 10, 2022-00
8.4 Default File Transfer Settings
In this section, we will discuss the default settings applied on a file which has been uploaded to MSS.
Table 8.4-1 File Transfer Policies
# Policy Name Description Default value
1 File expiry Dictates when an upload file should be deleted from MSS.
30 days
2 File share Determines the default share permission of an uploaded file
Private
3 File size Upper limit of the size of the file that can be uploaded to MSS
20 GB
The settings are applied at Site level.
To change any of the default value of the below settings, please contact Yokogawa.

<Asset Inventory> 522
IM 43D07N10-01EN 6th Edition: Mar. 10, 2022-00
9. Asset Inventory
9.1 Custom Fields
Introduction
Every MSS asset has a pre-defined schema, which contains information about the asset.
When an asset is onboarded on to MSS, an MSS user is required to provide some information about the asset.
The information provided here is stored in the system and is made available for an MSS Automation. This ability to access the information about the custom field in automation make it easier while defining automation rules that span more than one asset.
For E.g.:, if there is an Automation rule that is applied to all the MSS assets to monitor CPU usage, by using the {{ attribute.asset.name }} syntax, one can create a rule to know the name of the asset that exceeded the set threshold.
In case MSS users would like to reference custom properties in MSS automation rules, they can extend the schema of an MSS asset by using through the ‘Custom fields’ feature of MSS.
Configurations and managing are made in the Site Manager and monitored for visualizing the data in Center Component.
MSS supports customs fields for all assets/applications.
Field Types
MSS R1.5 supports six types of fields.
Table 9.1-1 Custom fields in MSS R1.5
Field Type Description Supported Field Form
Integer This field accepts a valid integer value Form Field & List
String This field accepts any string values Form Field & List
Boolean A True/False switch Switch
IP address A field which accepts IPv4/IPv6 Form Field & List
User / Group A field list with all the MSS Users/Groups as option Preconfigured List
Date / Time A Simple Date picker Form Field
A field form refers to nature of the specified field.
1. Form Field: A form field is a regular input that allows users to type in some information. Users can enter a maximum of 250 characters.
2. Form List: A form list allows MSS Admins to specify a predefined set of options. Once defined, MSS users can select a value from one of the options.
3. Switch: A toggle button that allows users to specify ‘True’ of ‘False’. Valid only for Boolean Types.
4. Preconfigured List: A preconfigured list is like Form List; however, the options are generated by MSS system.
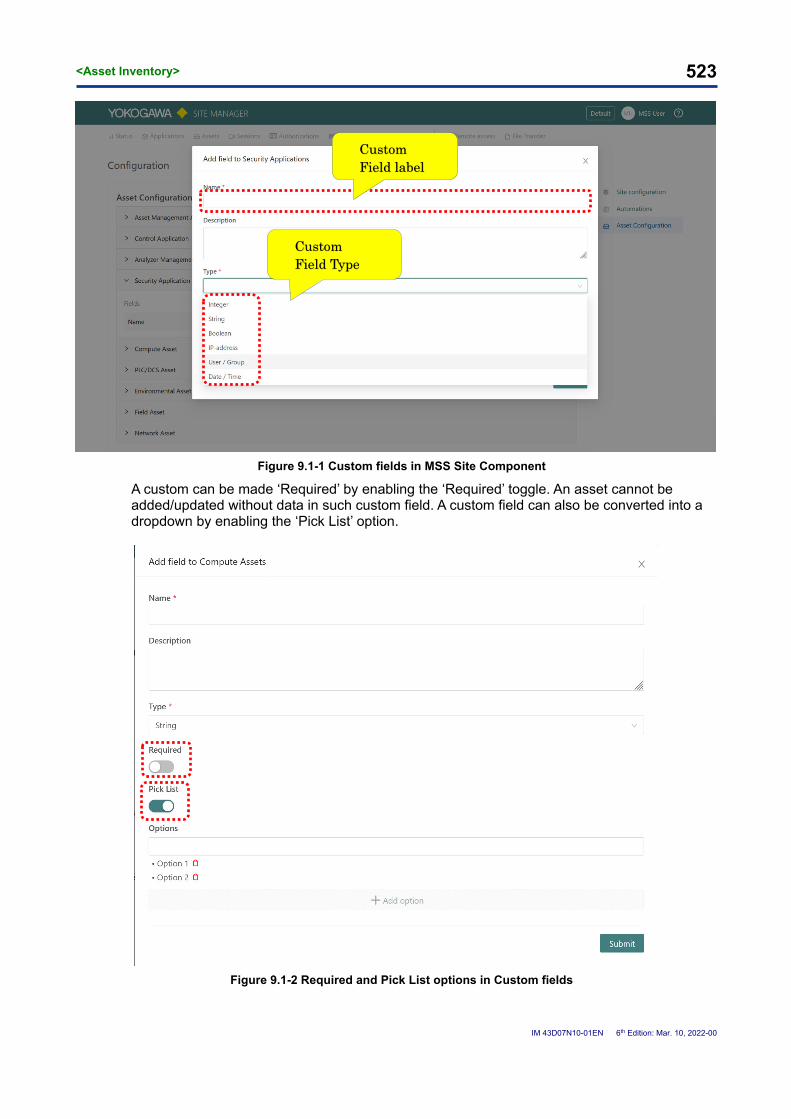
<Asset Inventory> 523
IM 43D07N10-01EN 6th Edition: Mar. 10, 2022-00
Figure 9.1-1 Custom fields in MSS Site Component
A custom can be made ‘Required’ by enabling the ‘Required’ toggle. An asset cannot be added/updated without data in such custom field. A custom field can also be converted into a dropdown by enabling the ‘Pick List’ option.
Figure 9.1-2 Required and Pick List options in Custom fields
Custom Field Type
Custom Field label

<Asset Inventory> 524
IM 43D07N10-01EN 6th Edition: Mar. 10, 2022-00
Permissions
In Order to perform Custom fields related operations, a user must have following permissions.
Figure 9.1-3 Permissions related to Custom fields
With ‘Configuration’ Permissions, user can view the ‘Custom fields’ options in Asset Configuration.
Figure 9.1-4 Custom Fields menu in Site Component

<Asset Inventory> 525
IM 43D07N10-01EN 6th Edition: Mar. 10, 2022-00
Adding Custom Fields
In this section, we will add a custom string field & a custom Number List to Compute asset.
Adding Custom String Field
Step 1: Navigate to Asset Configuration menu in Site Component.
Click on Configuration and select Asset Configuration sub menu.
s
Figure 9.1-5 Custom fields – Navigating to Asset Configuration
Step 2: Open the form to add a ‘Custom field’ for an asset.
Expand asset from ‘Asset Configuration’ (E.g. Compute asset), and click on ‘+ Add Field’
Configurations Menu

<Asset Inventory> 526
IM 43D07N10-01EN 6th Edition: Mar. 10, 2022-00
Figure 9.1-6 Custom fields - Adding a Custom field
Step 3: Enter the details of Custom field
In this case, we are creating a custom field with Name: ‘Custom String Field’ & Type: String. Click on Submit
Figure 9.1-7 Custom fields – Entering information about Custom Field
On Submit, you will get a confirmation notification.

<Asset Inventory> 527
IM 43D07N10-01EN 6th Edition: Mar. 10, 2022-00
Figure 9.1-8 Custom field - Adding a new Custom field

<Asset Inventory> 528
IM 43D07N10-01EN 6th Edition: Mar. 10, 2022-00
Step 4: Verify the addition of the custom field
while adding a new asset
Figure 9.1-9 Custom fields - Verifying a Custom field while adding a new asset
in an existing asset
Figure 9.1-10 Custom fields - Verifying a Custom field in an existing asset

<Asset Inventory> 529
IM 43D07N10-01EN 6th Edition: Mar. 10, 2022-00
Step 5: Enter a value inside custom field
Type a value and click ‘Update asset’.
Figure 9.1-11 Custom fields - Saving a value inside Custom field

<Asset Inventory> 530
IM 43D07N10-01EN 6th Edition: Mar. 10, 2022-00
Step 6: Login Center Component and verify the sync
Figure 9.1-12 Custom fields - Custom field value sync in Center Component
Adding Required Number List
Now, let’s add a number list and make it ‘required’.
Step 1: In ‘Add Custom field’ form, enter the details of the Field, set Type as ‘Integer’ and enable ‘Required’ switch
Figure 9.1-13 Custom field - Making a field required

<Asset Inventory> 531
IM 43D07N10-01EN 6th Edition: Mar. 10, 2022-00
Step 2: In the number list, set the type of field to ‘Integer’ and enable the ‘Pick List’ switch.
Add some options inside the pick list.
Figure 9.1-14 Custom fields - Adding options to a custom field list

<Asset Inventory> 532
IM 43D07N10-01EN 6th Edition: Mar. 10, 2022-00
Step 3: Verify the addition of the custom field
while adding a new asset
Figure 9.1-15 Custom fields - Verifying a Custom required list while adding a new asset
in an existing asset
Figure 9.1-16 Custom fields - Verifying a Custom required list in an existing asset

<Asset Inventory> 533
IM 43D07N10-01EN 6th Edition: Mar. 10, 2022-00
Step 4: Select a value in the Custom field list
Since the custom filed is a Required field, it needs to have a value before an asset can be updated.
Figure 9.1-17 Custom Fields - Updating a Custom Filed List with a value

<Asset Inventory> 534
IM 43D07N10-01EN 6th Edition: Mar. 10, 2022-00
Step 5: Verifying the value in Center Component
Figure 9.1-18 Custom fields - Verifying a Custom field list value in Center Component

<Asset Inventory> 535
IM 43D07N10-01EN 6th Edition: Mar. 10, 2022-00
Modifying Custom Fields
MSS supports following modification operations on Custom fields
Modifying information in a custom field
Switching Type of a custom field to other types/lists
Making a Custom Field Required / Optional
Adding/removing an Options to/from a field list
Step 1: Navigate to Asset Configuration menu in Site Component.
Click on Configuration and select Asset Configuration sub menu.
Figure 9.1-19 Custom fields – Navigating to Asset Configuration
Configuration Menu

<Asset Inventory> 536
IM 43D07N10-01EN 6th Edition: Mar. 10, 2022-00
Step 2: Expand the asset/application and identify the field to edit.
To edit a field, click on ‘᎒’ and click on ‘Edit’ button.
Figure 9.1-20 Custom fields - Editing a Custom field
Step 3: Inspect the ‘Edit custom field’ form
Figure 9.1-21 Custom fields – Edit form of Custom field

<Asset Inventory> 537
IM 43D07N10-01EN 6th Edition: Mar. 10, 2022-00
Modifying information in a custom field
Step 4A-1: You can modify Name, Description of a Custom field.
Figure 9.1-22 Custom fields - Editing information in a Custom field

<Asset Inventory> 538
IM 43D07N10-01EN 6th Edition: Mar. 10, 2022-00
Switching Type of a custom field to other types/lists
Step 4B-1: You can modify the Type of the field by selecting a different dropdown
Figure 9.1-23 Custom fields - Editing Custom field Type
Caution:
On changing the type of a Custom field, any value that users had specified before gets reset in Site and Center component.

<Asset Inventory> 539
IM 43D07N10-01EN 6th Edition: Mar. 10, 2022-00
Step 4B-2: By enabling ‘Pick List’, we can convert the Custom field into a Custom field List
Figure 9.1-24 Custom fields - Enabling the 'Pick List'
Making the Custom field Required
Step 4C-1: Make the Custom field ‘Required’ by enabling the ‘Required’ switch.
Figure 9.1-25 Custom fields - Making a Custom Field ‘Required’

<Asset Inventory> 540
IM 43D07N10-01EN 6th Edition: Mar. 10, 2022-00
Adding/Removing Option to a Custom field
Step 4D-1: Type the value of the option and click on ‘+ Add option’ to add a new option.
Figure 9.1-26 Custom fields - Adding options to Custom field
Step 4D-2: To Remove an added option, click on ‘ ’ button
Figure 9.1-27 Custom fields - Removing options from Custom fields

<Asset Inventory> 541
IM 43D07N10-01EN 6th Edition: Mar. 10, 2022-00
Step 5: Confirm the changes in asset in Site Component
Figure 9.1-28 Custom fields - Verifying edits in Custom fields
Figure 9.1-29 Custom fields - notification on successful edit

<Asset Inventory> 542
IM 43D07N10-01EN 6th Edition: Mar. 10, 2022-00
Figure 9.1-30 Custom fields - Verifying edits of Custom fields in asset

<Asset Inventory> 543
IM 43D07N10-01EN 6th Edition: Mar. 10, 2022-00
Step 6: Verify the changes in Center Component
Figure 9.1-31 Custom fields - Verifying value in Center Component

<Asset Inventory> 544
IM 43D07N10-01EN 6th Edition: Mar. 10, 2022-00
Deleting Custom Fields
Step 1: To delete a field, click on ᎒ and click on ‘Delete’ button.
Figure 9.1-32 Custom fields - Deleting a Custom field

<Asset Inventory> 545
IM 43D07N10-01EN 6th Edition: Mar. 10, 2022-00
Step 2: From confirmation prompt, click on ‘OK’
Figure 9.1-33 Custom fields - Confirmation prompt for deleting the Custom field
Figure 9.1-34 Custom fields - Deletion notification

<Asset Inventory> 546
IM 43D07N10-01EN 6th Edition: Mar. 10, 2022-00
Step 3: Verifying the deleted Custom field in Site Component
Figure 9.1-35 Custom fields - Verifying the deleted Custom field in Site Component

<Asset Inventory> 547
IM 43D07N10-01EN 6th Edition: Mar. 10, 2022-00
Figure 9.1-36 Custom fields - Verifying the Custom fields in Center Component

<Dynamic dashboards> 548
IM 43D07N10-01EN 6th Edition: Mar. 10, 2022-00
10. Dynamic dashboards
10.1 Introduction
Dashboards
MSS Center Component contains two types of dashboards.
① Default/System dashboards – Dashboards provided by the system
② Dynamic dashboards – Dashboards created by MSS users
The data in dashboard is Site & Permission specific. Users can see data at individual Site level and the numbers they see on the dashboard depends on the Permission they have on asset.
For e.g.: If there are a total of 100 Compute assets in Site A, and User A has access to 10 Compute asset (provided through object level), then the value of ‘Total number of Compute assets’ seen by both of them in the dashboard will be different.
An MSS admin (with full access) will see the value as 100, while an MSS user will see the value as 10.
Default dashboards
MSS provides following dashboards by default:
① Compute Assets
② PLC/DCS Assets
③ Field Assets
④ Network Assets
⑤ Environmental Assets
⑥ Security Applications
⑦ Asset Management Applications - PRM
⑧ Analyzer Management Applications - AAIMS
Dynamic dashboards
Apart from this, MSS users can create their own dashboard and share it with other MSS users. Users can customize a Dynamic dashboard with custom charts based on required data using widgets and share the dashboard globally.
Shared dashboards can be viewed by everyone in the Organization, but only the creator can modify them. There are no limits on how many dynamic dashboards can be created by a user.
SUPPLEMENT
Users cannot share dynamic dashboards to specific users in MSS R1.5. In case users see a lot of Dynamic dashboards in their screen, they can use favorite function of a dashboard as a filter to see only relevant dashboard.

<Dynamic dashboards> 549
IM 43D07N10-01EN 6th Edition: Mar. 10, 2022-00
Widgets
A dashboard widget or a ‘dashboard chart’ refers to a custom chart than an MSS user can create inside a dynamic dashboard.
A Chart can be drawn with either 1 axis or 2 axes. Users can specify the 1st axis through a widget property called ‘Data source’. The 2nd axis, if it is applicable, is always a time range.
MSS R1.5 supports eight types of charts.
Table 10.1-1 Widgets in Dynamic Dashboards
# Preview Chart Type Description
1.
Pie Circular statistical graphic, which is divided into slices to illustrate numerical proportion.
2.
Line Graphical representation of an asset's historical price action that connects a series of data points with a continuous line.
3
Column Graphical representation or visualization of measured data in the form of vertical rectangular bars or columns plotted along two axes.
4.
Bar Graph that presents categorical data with rectangular bars with heights or lengths proportional to the values that they represent.
5.
Progress A chart showing actual performance in comparison with a predetermined schedule or estimate of expected performance.
6.
Data table Display of information in tabular form, with rows and/or columns named.
7.
Number Chart that shows the list of numbers in a systematic order.
8.
Markdown Markup language for creating formatted text using a plain-text editor.

<Dynamic dashboards> 550
IM 43D07N10-01EN 6th Edition: Mar. 10, 2022-00
All dashboard widgets can be further customized with following options.
Table 10.1-2 Dynamic dashboards - Widget Fields
# Fields Description
1 Name Name of Chart
2 Data Source The data points that are visualized by the chart
3 Limit No. of assets/applications data points to be plotted
4 Sort Sorting order (Ascending/Descending)
5 Use custom date range Specifies the widget to use a date range overriding the dashboard Date range
6 Data Labels Specifies if the Data Label should be previewed in chart
7 Export Specifies if Chart can be exported by users to SVG/JPEG
8 Legend Specifies if Legend should be shown inside the widget
9 Zoom Specifies if the Zoom control should be present in Chart
10 Show header A toggle that can show/hide the name of the chart in preview
11 Markdown A field where Markdown can be specified for rendering
Table 10.1-3 Dynamic dashboards - Widget fields available per Chart
# Fields Pie Line Column Bar Progress Data table
Number Markdown
1 Name 🗸 🗸 🗸 🗸 🗸 🗸 🗸 🗸
2 Data Source 🗸 🗸 🗸 🗸 🗸 🗸 🗸 🗙
3 Limit 🗸 🗸 🗸 🗸 🗸 🗸 🗙 🗙
4 Sort 🗸 🗸 🗸 🗸 🗸 🗸 🗙 🗙
5 Use custom date range
🗸* 🗸 🗸* 🗸 🗸 🗸 🗸 🗙
6 Data Labels 🗸 🗸 🗸 🗸 🗙 🗙 🗙 🗙
7 Export 🗸 🗸 🗸 🗸 🗙 🗙 🗙 🗙
8 Legend 🗙 🗸 🗙 🗙 🗙 🗙 🗙 🗙
9 Zoom 🗙 🗸 🗙 🗙 🗙 🗙 🗙 🗙
10 Show header 🗙 🗙 🗙 🗙 🗙 🗙 🗸 🗸
11 Markdown 🗙 🗙 🗙 🗙 🗙 🗙 🗙 🗸
* Custom Date range option is associated with the widget but cannot be set by users.

<Dynamic dashboards> 551
IM 43D07N10-01EN 6th Edition: Mar. 10, 2022-00
Following table provides the Data Source available per ‘Chart Type’
Table 10.1-4 Dynamic dashboards - Data Sources based on Chart Type
# Chart Type Data Source
1
PIE
compute_assets.cpu_brand
2 compute_assets.cpu_logical_cores
3 compute_assets.cpu_manufacturer
4 compute_assets.cpu_microcode
5 compute_assets.cpu_physical_cores
6 compute_assets.disk_interface_type
7 compute_assets.disk_manufacturer
8 compute_assets.disk_model
9 compute_assets.domain_forest_name
10 compute_assets.domain_name
11 compute_assets.event_id
12 compute_assets.event_keyword
13 compute_assets.event_log_channel
14 compute_assets.event_severity
15 compute_assets.event_task_category
16 compute_assets.file_system_type
17 compute_assets.hardware_manufacturer
18 compute_assets.hardware_model
19 compute_assets.network_interface_manufacturer
20 compute_assets.os_build
21 compute_assets.os_codename
22 compute_assets.os_platform
23 compute_assets.os_version
24 compute_assets.software_name
25 compute_assets.software_publisher
26 field_assets.categories
27 field_assets.communication_types
28 field_assets.locations
29 field_assets.models
30 field_assets.ne107_status
31 field_assets.template_applied
32 field_assets.vendor
33 network_assets.hardware_location
34 network_assets.hardware_manufacturer
35 network_assets.hardware_model
36 network_assets.syslog_facility
37 network_assets.syslog_severity
38 network_assets.syslog_source
39 plc-dcs_assets.battery_status
40 plc-dcs_assets.controller_model
41 plc-dcs_assets.controller_type
42 plc-dcs_assets.cpu_status
43 plc-dcs_assets.psu_status
44 plc-dcs_assets.test_mode
45 security_applications.approved_patches_pending_installation
46 security_applications.computers_missing_patches

<Dynamic dashboards> 552
IM 43D07N10-01EN 6th Edition: Mar. 10, 2022-00
# Chart Type Data Source
47 security_applications.mcafee_client_threats
48 security_applications.mcafee_definitions
49 wfp_allowed_by_destination_ip
50 wfp_allowed_by_host
51 wfp_allowed_by_protocol
52 wfp_allowed_by_source_ip
53 wfp_dropped_by_destination_ip
54 wfp_dropped_by_host
55 wfp_dropped_by_protocol
56 wfp_dropped_by_source_ip
57 asset_applications.aaims.analyzers_by_model
58 asset_applications.aaims.analyzers_by_type
62
LINE
general_heartbeat.line
63 compute_assets.cpu_usage.line
64 compute_assets.disk_usage.line
65 compute_assets.heartbeat.line
66 compute_assets.incoming_bytes.line
67 compute_assets.memory_usage.line
68 compute_assets.outgoing_bytes.line
69 compute_assets.swap_usage.line
70 compute_assets_agentless.heartbeat.line
71 compute_assets.heartbeat.uptime
72 network_assets.cpu_usage.line
73 network_assets.heartbeat.line
74 network_assets.incoming_packets.line
75 network_assets.memory_usage.line
76 network_assets.outgoing_packets.line
77 network_assets.temperature.line
78 network_assets_firewall.heartbeat.line
79 network_assets_router.heartbeat.line
80 network_assets_switch.heartbeat.line
81 network_assets_timeserver.heartbeat.line
82 environmental_assets.contact
83 environmental_assets.corrosion
84 environmental_assets.dust
85 environmental_assets.humidity
86 environmental_assets.isolation
87 environmental_assets.temperature
88 environmental_assets.heartbeat.line
89 environmental_assets.heartbeat.uptime
90 plc-dcs_assets.battery-voltage.line
91 plc-dcs_assets.battery_temperature_2
92 plc-dcs_assets.cpu_load_average
93 plc-dcs_assets.cpu_load_minimum
94 plc-dcs_assets.cpu_load_maximum
95 plc-dcs_assets.input_temperature_2
96 plc-dcs_assets.output_temperature_2
97 plc-dcs_assets.cpu_usage.line

<Dynamic dashboards> 553
IM 43D07N10-01EN 6th Edition: Mar. 10, 2022-00
# Chart Type Data Source
98 plc-dcs_assets.error-count.line
99 plc-dcs_assets.heartbeat.line
100 plc-dcs_assets.input-voltage.line
101 plc-dcs_assets.scs_forcing_combined
102 plc-dcs_assets.scs_forcing_per_scs
103 plc-dcs_assets.vnet-load.line
104 plc-dcs_assets_avr.heartbeat.line
105 plc-dcs_assets_bcv.heartbeat.line
106 plc-dcs_assets_fcs.heartbeat.line
107 plc-dcs_assets_scs.heartbeat.line
108 plc-dcs_assets_wac.heartbeat.line
109 prm.heartbeat.line
110 prm-unacknowledged_alarms
111 security_applications.heartbeat.line
112 security_applications.mcafee_epo.heartbeat.line
113 security_applications_wsus.heartbeat.line
114 wfp_dropped_connections
115 asset_applications.aaims.heartbeat.line
116
COLUMN
compute_assets.cpu_brand
117 compute_assets.cpu_logical_cores
118 compute_assets.cpu_manufacturer
119 compute_assets.cpu_microcode
120 compute_assets.cpu_physical_cores
121 compute_assets.disk_interface_type
122 compute_assets.disk_manufacturer
123 compute_assets.disk_model
124 compute_assets.domain_forest_name
125 compute_assets.domain_name
126 compute_assets.event_id
127 compute_assets.event_keyword
128 compute_assets.event_log_channel
129 compute_assets.event_severity
130 compute_assets.event_task_category
131 compute_assets.file_system_type
132 compute_assets.hardware_manufacturer
133 compute_assets.hardware_model
134 compute_assets.network_interface_manufacturer
135 compute_assets.os_build
136 compute_assets.os_codename
137 compute_assets.os_platform
138 compute_assets.os_version
139 compute_assets.software_name
140 compute_assets.software_publisher
141 field_assets.categories
142 field_assets.communication_types
143 field_assets.locations
144 field_assets.models
145 field_assets.ne107_status

<Dynamic dashboards> 554
IM 43D07N10-01EN 6th Edition: Mar. 10, 2022-00
# Chart Type Data Source
146 field_assets.template_applied
147 field_assets.vendor
148 network_assets.hardware_location
149 network_assets.hardware_manufacturer
150 network_assets.hardware_model
151 network_assets.syslog_facility
152 network_assets.syslog_severity
153 network_assets.syslog_source
154 plc-dcs_assets.battery_status
155 plc-dcs_assets.controller_model
156 plc-dcs_assets.controller_type
157 plc-dcs_assets.cpu_status
158 plc-dcs_assets.psu_status
159 plc-dcs_assets.test_mode
160 security_applications.approved_patches_pending_installation
161 security_applications.computers_missing_patches
162 security_applications.mcafee_client_threats
163 security_applications.mcafee_definitions
164 asset_applications.aaims.analysers_by_model
165 asset_applications.aaims.analysers_by_type
166
BAR
compute_assets.usage_cpu
167 compute_assets.usage_disk
168 compute_assets.usage_memory
169 compute_assets.usage_swap
170 network_assets.usage_cpu
171 network_assets.usage_memory
172 plc-dcs_assets.cpu_load
173 plc-dcs_assets.vnet_load
174 wfp_allowed_by_destination_ip
175 wfp_allowed_by_host
176 wfp_allowed_by_protocol
177 wfp_allowed_by_source_ip
178 wfp_dropped_by_destination_ip
179 wfp_dropped_by_host
180 wfp_dropped_by_protocol
181 wfp_dropped_by_source_ip
182
PROGRESS
compute_assets.usage_cpu
183 compute_assets.usage_disk
184 compute_assets.usage_memory
185 compute_assets.usage_cpu
186 network_assets.usage_cpu
187 network_assets.usage_memory
188 plc-dcs_assets.cpu_load
189 plc-dcs_assets.vnet_load
190 wfp_allowed_by_destination_ip
191 wfp_allowed_by_host

<Dynamic dashboards> 555
IM 43D07N10-01EN 6th Edition: Mar. 10, 2022-00
# Chart Type Data Source
192 wfp_allowed_by_protocol
193 wfp_allowed_by_source_ip
194 wfp_dropped_by_destination_ip
195 wfp_dropped_by_host
196 wfp_dropped_by_protocol
197 wfp_dropped_by_source_ip
198
DATATABLE
general.all.heartbeat_uptime
206 compute_assets.event_ids
207 compute_assets.event_ids_critical
208 compute_assets.heartbeat_uptime
209 field_assets.alarms
210 field_assets.alarms_critical
211 network_assets.syslog_events
212 network_assets.heartbeat_uptime
213 plc-dcs_assets.battery_temperature
214 plc-dcs_assets.error_counter
215 plc-dcs_assets.input_temperature
216 plc-dcs_assets.output_temperature
217 plc-dcs_assets.heartbeat_uptime
218 plc-dcs_assets.not_ready_battery_status
219 plc-dcs_assets.not_ready_cpu_status
220 plc-dcs_assets.not_ready_psu_status
221 plc-dcs_assets.scs_safety_values
222 env_assets.heartbeat_uptime
223 prm.alarms_and_events
224 prm.audit_logs
225 prm.user_list
226 security_applications.computers_missing_critical_patches
227 security_applications.critical_mcafee_client_events
228 security_applications.heartbeat_uptime
229 asset_applications.aaims.breakdown_rate
230 asset_applications.aaims.checking_rate
232 asset_applications.aaims.heartbeat_uptime
233 asset_applications.aaims.maintenance_event_log
234 asset_applications.aaims.validation_event_log
235
NUMBER
compute_assets.agentless.heartbeat_uptime
236 compute_assets.heartbeat_uptime
237 compute_assets.asset_compute
243 compute_assets.assets_server
244 compute_assets.assets_workstation
245 compute_assets.events_application
246 compute_assets.events_security
247 compute_assets.events_system
248 environmental_assets.assets_environmental
249 environmental_assets.average_corrosion
250 environmental_assets.average_dust
251 environmental_assets.average_humidity
252 environmental_assets.average_isolation

<Dynamic dashboards> 556
IM 43D07N10-01EN 6th Edition: Mar. 10, 2022-00
# Chart Type Data Source
253 environmental_assets.average_temperature
254 environmental_assets.heartbeat_uptime
255 field_assets.asset_healthy
256 field_assets.assets_field
257 field_assets.assets_foundation_fieldbus
258 field_assets.assets_hart
259 field_assets.assets_reporting_errors
260 field_assets.assets_require_maintenance
261 general.heartbeat_uptime
262 network_assets.assets_firewall
263 network_assets.assets_network
264 network_assets.assets_router
265 network_assets.assets_switch
266 network_assets.assets_timeserver
267 network_assets.events_syslog
268 network_assets.firewall.heartbeat_uptime
269 network_assets.heartbeat_uptime
270 network_assets.router.heartbeat_uptime
271 network_assets.switch.heartbeat_uptime
272 network_assets.timeserver.heartbeat_uptime
273 plc-dcs_assets.assets_bcv
274 plc-dcs_assets.assets_control
275 plc-dcs_assets.assets_plc/dcs
276 plc-dcs_assets.assets_safety
277 plc-dcs_assets.assets_vnet
278 plc-dcs_assets.assets_wac
279 plc-dcs_assets.heartbeat_uptime
280 plc-dcs_assets.fcs.heartbeat_uptime
281 plc-dcs_assets.scs.heartbeat_uptime
282 plc-dcs_assets.bcv.heartbeat_uptime
283 plc-dcs_assets.wac.heartbeat_uptime
284 prm.alarms
285 prm.field_devices
286 prm.prm_applications
287 prm.unacknowledged_alarms
288 prm.unhealthy_field_devices
289 prm.heartbeat_uptime
290 security_applications.applications_mcafee
291 security_applications.applications_wsus
292 security_applications.approved_critical_patches_to_be_installed
293 security_applications.approved_patches_to_be_installed
294 security_applications.mcafee_epo_client_events
295 security_applications.mcafee_epo_client_threats
296 security_applications.heartbeat_uptime
297 security_applications.mcafee_epo.heartbeat_uptime
298 security_applications.wsus.heartbeat_uptime
299 asset_applications.aaims.connected_aaims
300 asset_applications.aaims.connected_analyzers

<Dynamic dashboards> 557
IM 43D07N10-01EN 6th Edition: Mar. 10, 2022-00
# Chart Type Data Source
301 asset_applications.aaims.maintenance_events
302 asset_applications.aaims.validation_events

<Dynamic dashboards> 558
IM 43D07N10-01EN 6th Edition: Mar. 10, 2022-00
10.2 Creating Dynamic dashboard Step 1: In Center Component, Navigate to Dashboard menu.
Click ‘Add Dashboard’ button.
Figure 10.2-1 Dynamic Dashboards – Adding a new dashboard
Step 2: Enter details of dashboard in the ‘Add Dashboard’ form and click on ‘Save’.
Figure 10.2-2 Dynamic dashboards - Enter information about the dynamic dashboard
Dashboard Menu
Add Dashboard button

<Dynamic dashboards> 559
IM 43D07N10-01EN 6th Edition: Mar. 10, 2022-00
Step 3: Confirm the newly created dashboard from the list and click on it to ‘open it’.
Figure 10.2-3 Dynamic dashboards – Confirming a newly created dashboard
Step 4: Click on the ‘Edit’ button to add widgets to the dashboard.
Figure 10.2-4 Dynamic dashboards - New Dynamic dashboard

<Dynamic dashboards> 560
IM 43D07N10-01EN 6th Edition: Mar. 10, 2022-00
SUPPLEMENT
To add charts inside the Dynamic dashboard, please refer to Modifying Dynamic dashboards/Adding a dashboard widget.
10.3 Dynamic Dashboard Operations You can perform the following operations on Dynamic dashboard.
Sharing dashboards Favoriting a dashboard Copying a dashboard Deleting a dashboard
Step 1*: From Dashboard List view, locate the Dynamic dashboard you would like to modify.
Figure 10.3-1 Dynamic dashboards - Identifying the Dynamic dashboard to share
Note: Steps in next sections start with ‘<Alphabet> - <Step Number>’. Step 1 is common for steps from 10.3.1 ~ 10.3.4.

<Dynamic dashboards> 561
IM 43D07N10-01EN 6th Edition: Mar. 10, 2022-00
Sharing a Dynamic dashboard Step A-2: Click on ‘⁝’ button and click ‘Edit’.
Figure 10.3-2 Dynamic dashboards - Editing a Dynamic dashboard
Step A-3: Enable ‘Share Dashboard’ to share the dashboard globally.
Figure 10.3-3 Dynamic dashboards - Sharing dashboard

<Dynamic dashboards> 562
IM 43D07N10-01EN 6th Edition: Mar. 10, 2022-00
Step A-4: On Success, you will see a Checkbox against the dashboard value.
Figure 10.3-4 Dynamic dashboards - Verifying a dashboard has been shared

<Dynamic dashboards> 563
IM 43D07N10-01EN 6th Edition: Mar. 10, 2022-00
Favoriting a Dynamic dashboard Favoriting a Dashboard allows you to quickly access it by making it available in the submenu. Step B-2: Click on the ‘ ’ icon to favorite a dashboard.
Figure 10.3-5 Dynamic dashboards - Favoriting a Dynamic dashboard

<Dynamic dashboards> 564
IM 43D07N10-01EN 6th Edition: Mar. 10, 2022-00
Step B-3: Verify that the dashboard has been favorited. On Success, ‘ ’ icon will be colored in ‘ ’. And the ‘Dynamic Dashboard Demo’ should appear on the dashboard submenu.
Figure 10.3-6 Dynamic dashboards - Verifying a favorite dashboard

<Dynamic dashboards> 565
IM 43D07N10-01EN 6th Edition: Mar. 10, 2022-00
Copying a Dynamic dashboard Step C-2: Click on ‘⁝’ button and click ‘Copy’.
Figure 10.3-7 Dynamic dashboards - Copying a Dynamic dashboard
Step C-3: Verify the Copy. A new dashboard is created with the same name but with Copy appended to it at the end.
Figure 10.3-8 Dynamic dashboards - Verifying a Copied dashboard

<Dynamic dashboards> 566
IM 43D07N10-01EN 6th Edition: Mar. 10, 2022-00
Deleting a Dynamic dashboard Step D-2: Click ‘Delete’ on the dashboard you want to delete.
Figure 10.3-9 Dynamic dashboards - Deleting a dashboard
Step D-3: Click ‘OK’ from the confirmation dialog.
Figure 10.3-10 Dynamic dashboards - Confirming the delete prompt

<Dynamic dashboards> 567
IM 43D07N10-01EN 6th Edition: Mar. 10, 2022-00
Step D-4: Verify the deletion.
Figure 10.3-11 Dynamic dashboards - Verify the deleted dashboard

<Dynamic dashboards> 568
IM 43D07N10-01EN 6th Edition: Mar. 10, 2022-00
10.4 Dashboard Widget Operations The users can perform following operations on a Dashboard widget:
Add a widget Modifying the size of a widget Moving the widget to a different grid Modify the contents of the widget Delete a widget.
Step 1: Navigate inside the dashboard on which you would like to perform Dashboard Operations and click ‘EDIT’.
Figure 10.4-1 Dynamic dashboards – Editing a Dashboard

<Dynamic dashboards> 569
IM 43D07N10-01EN 6th Edition: Mar. 10, 2022-00
Adding a Chart to Dashboard Step 2: Click on ‘+ ADD’ inside ‘Dashboard Edit Mode’.
Figure 10.4-2 Dynamic dashboards - Adding a new Widget
Step 3: From the Widget settings select the type of ‘chart’ you would like to create. Configure the widget with appropriate details. Click on ‘Save widget’.
Figure 10.4-3 Dynamic dashboards - Selecting a Chart

<Dynamic dashboards> 570
IM 43D07N10-01EN 6th Edition: Mar. 10, 2022-00
Step 4: Click on ‘SAVE’ to add the chart to Dashboard.
Figure 10.4-4 Dynamic dashboards - Adding a new Chart
CAUTION
When creating a ‘Line Chart widget’, the ‘Limit’ needs to be specified to get the continuous trend line of assets.
If limit is set to ‘3’ then the chart can show more than 3 assets, as the top ‘3’ values are counted. To see a data trend line of asset:
i. if chart needs to show data from specific assets – specify the assets to be seen in the ‘Assets’ field
ii. if chart needs to show data from all assets - set a very high value in ‘Limit’. (Preferable, a value greater than or equal to all the assets of asset category in MSS. E.g.; Total Compute assets are 3, set the value of ‘Limit’ to any value greater than or equal to 3).
Figure 10.4-5 Limitations of Line Chart widget

<Dynamic dashboards> 571
IM 43D07N10-01EN 6th Edition: Mar. 10, 2022-00
Modifying the Size of a widget Step 5: In ‘Dashboard Edit Mode’, look for the ‘corner’ icon on the widget.
Figure 10.4-6 Dynamic dashboards - Corners in a Dashboard chart
Step 6: Hold a ‘corner’ and drag the Widget to a desired size.
Figure 10.4-7 Dynamic dashboards - Expanding the size of a chart

<Dynamic dashboards> 572
IM 43D07N10-01EN 6th Edition: Mar. 10, 2022-00
Moving the widget inside a Dashboard Step 7: In ‘Dashboard Edit Mode’, hold the widget and drag it.
Figure 10.4-8 Dynamic dashboards - Moving a widget
Step 8: Drop the chart in a new desired inside the Dashboard grid.
Figure 10.4-9 Dynamic dashboards - Relocating the Dashboard widget

<Dynamic dashboards> 573
IM 43D07N10-01EN 6th Edition: Mar. 10, 2022-00
Modify the contents of the widget Step 9: Click on ‘ ’ icon in the widget to edit.
Figure 10.4-10 Dynamic dashboard - Editing a widget
Step 10: Make necessary changes and click on ‘Save widget’.
Figure 10.4-11 Dynamic dashboard - Modifying Dashboard Content

<Dynamic dashboards> 574
IM 43D07N10-01EN 6th Edition: Mar. 10, 2022-00
Step 11: Confirm the changes.
Figure 10.4-12 Dynamic dashboard - Verifying the Dashboard Changes
Delete the widget from Dashboard Step 12: Click on ‘ ’ icon.
Figure 10.4-13 Dynamic dashboard - Deleting a Widget

<Dynamic dashboards> 575
IM 43D07N10-01EN 6th Edition: Mar. 10, 2022-00
Step 13: Confirm the deletion.
Figure 10.4-14 Dynamic dashboard - Confirming the Deleted widget

<Integrations> 576
IM 43D07N10-01EN 6th Edition: Mar. 10, 2022-00
11. Integrations
11.1 ServiceNow
As a remote monitoring solution, MSS integrates with third party solutions, such as ServiceNow, for incident management.
To create an incident in ServiceNow, Customer needs to have a ServiceNow instance. Data Collection and Monitors should to enabled on an asset as well.
SUPPLEMENT:
Contact Yokogawa for integrating your MSS with ServiceNow.
Integration Overview
In this section, we will look at MSS components - that are involved in the integration.
① Automations
② Services
③ Views
Below diagram represents an overview of how the various components interact with each other on a high level.
Figure 11.1-1 MSS-ServiceNow Integration Overview

<Integrations> 577
IM 43D07N10-01EN 6th Edition: Mar. 10, 2022-00
11.1.1.1 Automations
‘Automations' is an 'MSS feature' that executes specific actions such as creating alerts based on various events such as states of assets and applications or Time.
If an MSS asset has experienced any irregularities such as error, high CPU utilization etc. an Automation rule captures it and calls the service to create an incident in ServiceNow.
SUPPLEMENT:
Automations can be further broken down into Monitors, Data Store etc. To understand them in detail, please refer to 7. Automations.
11.1.1.2 Services
A Service in MSS receives instructions from an MSS Automation rule and performs action. In this case, the action is to create an incident in ServiceNow.
Once an incident is created, it is made available in the 'Alert view'. Another MSS service tracks the changes until the incident is closed.
11.1.1.3 Views
After the incident is created, an alert is logged in MSS Center Component. Such alerts are Read Only and shows information logged in ServiceNow.
This makes it possible for MSS admins to view the changes done in ServiceNow from MSS.

<Integrations> 578
IM 43D07N10-01EN 6th Edition: Mar. 10, 2022-00
Integration specifications 11.1.2.1 Functions
Table 11.1-1 Functional Specifications of MSS-ServiceNow Integration
Requirement Specification Supported
Unlimited ServiceNow instances MSS supports integration with multiple ServiceNow instances.
Handling Customized ServiceNow MSS provides a JSON interface to map customer's customizations to MSS.
11.1.2.2 Properties
Table 11.1-2 Properties of MSS-ServiceNow integration
Property Description Value Configurable
Communication Period* The interval of time between successive sync attempts by MSS to ServiceNow
5 mins
No. of incidents updated No. of incidents/state changes synced back to MSS on every communication cycle
50 incidents
Security Credentials No. of ServiceNow credentials that can be stored per ServiceNow integration
1 account
'*' - Properties are configurable only during deployment and cannot be changed later

<Integrations> 579
IM 43D07N10-01EN 6th Edition: Mar. 10, 2022-00
Deployment architecture
ServiceNow can be integrated with MSS at 'Site component'. A single 'Site component' can be configured with multiple 'ServiceNow' instances.
Since MSS Site is deployed in an OT network, it usually cannot easily communicate with devices in the IT network. After configuring both ServiceNow and Automation at 'Site component', they are processed and executed in ‘Center component’. This ensures that no changes are required at network level for a secure integration.
Following diagram illustrates a high-level architecture of MSS integration with ServiceNow.
Figure 11.1-2 MSS-ServiceNow deployment architecture

<Integrations> 580
IM 43D07N10-01EN 6th Edition: Mar. 10, 2022-00
Figure 11.1-3 MSS-ServiceNow 1-to-1 deployment architecture (information flow)
Since MSS supports multiple 'Site components' and 'ServiceNow instances', a complex architecture would look something like this.
Figure 11.1-4 MSS-ServiceNow 1-to-Many deployment architecture

<Integrations> 581
IM 43D07N10-01EN 6th Edition: Mar. 10, 2022-00
Error handling
Since there are various components involved in the creation of an alert, it is very important to understand the potential point of failures in the workflow and how MSS is configured to handle them.
Error flow
Figure 11.1-5 MSS-ServiceNow error handling flow
Below are some of the possible reasons an alert might not be created in MSS from Automations.
Monitoring Related errors Monitoring related errors occur between MSS and asset.
Table 11.1-3 MSS-ServiceNow integration, known errors related to Monitoring
# Reason Description
1. Network errors MSS is not able to communicate with asset
2. Communication errors MSS can communicate with asset, but asset does not provide any data due to some configuration
3. Disabled monitor Monitor might not be enabled on asset
4. Wrong credentials MSS asset might be configured with incorrect credentials
Storing related errors Storing related errors occur within MSS between Site and Center Component.
Table 11.1-4 MSS-ServiceNow integration, known errors related to Storing
# Reason Description
1. Network errors MSS Site is not able to communicate with MSS Center
2. Disk errors Disk space on MSS Data store is full

<Integrations> 582
IM 43D07N10-01EN 6th Edition: Mar. 10, 2022-00
Evaluation related errors Evaluation related errors are logical errors that occur due to misconfigured logics.
Table 11.1-5 MSS-ServiceNow integration, known errors related to Evaluation
# Reason Description
1. Unspecified asset id Automation doesn't have information about asset id for evaluation
2. Human error The specified logic for evaluation is different from intended evaluation logic
3. Incorrect entity id The entity ID specified is different from the enabled monitor
Communication related errors Evaluation related errors occur between MSS and ServiceNow.
Table 11.1-6 MSS-ServiceNow integration, known errors related to Communication
# Reason Description
1. Incorrect Credentials Credentials specified for ServiceNow are incorrect
2. Not enough permissions Specified ServiceNow credentials do not have permissions to create an Incident
3. Misconfigured JSON schema
The specified JSON schema is incorrect
4. Misconfigured Host Specified host is URL instead of FQDN 5. Network Error Center Component cannot communicate with ServiceNow
Sync related errors Sync related errors occur between MSS and ServiceNow while updating the incident.
Table 11.1-7 MSS-ServiceNow integration, known errors related to Sync
# Reason Description
1. Network error Center Component cannot communicate with ServiceNow
2. Insufficient Permissions The account permissions used to sync with ServiceNow has been downgraded

<Integrations> 583
IM 43D07N10-01EN 6th Edition: Mar. 10, 2022-00
Creating a ServiceNow alert from an Automation rule
Pre-requisites:
In order to execute the steps provided in the below section, a ServiceNow instance must already be integrated with MSS. In case you do not see a ServiceNow instance, please contact Yokogawa.
You need to have permission to create an Automation rule to execute this step
Step 1. Create an Automation alert
The automation rule will be triggered every minute and will log an alert in ServiceNow for the specified asset / application.
Table 11.1-8 Specifications for Automation Rule to test MSS-ServiceNow integration
Action Field name Value
Triggers For 00:00:01
Actions
Action Type Call Service
Service Create ServiceNow alert
Title ServiceNow Integration test
Asset/Application(mss.id) (Any Compute asset)
ServiceNow Configuration (Your ServiceNow Configuration)
Impact 3
Urgency 3

<Integrations> 584
IM 43D07N10-01EN 6th Edition: Mar. 10, 2022-00
Figure 11.1-6: Creating an Automation rule

<Integrations> 585
IM 43D07N10-01EN 6th Edition: Mar. 10, 2022-00
Step 2: Verify the alert in Center Component
Log in to Center Component and navigate to 'Alerts'. You should be able to see the alert in question after a while.
Figure 11.1-7 Verifying the synced alert in Center Component
This is a read only copy and cannot be changed.
Make a note of the Incident ID and look for this incident in ServiceNow

<Integrations> 586
IM 43D07N10-01EN 6th Edition: Mar. 10, 2022-00
Step 3.3. Verify in ServiceNow Login to ServiceNow and search for the incident in Global search (Top-right corner of screen).
Figure 11.1-8 Verifying the created incident in ServiceNow

<Integrations> 587
IM 43D07N10-01EN 6th Edition: Mar. 10, 2022-00
Syncing Between ServiceNow and MSS alert
In this section, we will make changes in ServiceNow and see it sync back to MSS. We will resolve the case created in the previous section and confirm its closure.
Step 1: Close the Incident in ServiceNow
Set a Caller in incident and change the status to 'Closed'. In Resolution Information, set the a. Resolution code to Closed/Resolved by Caller b. Resolution notes to Closed
Click on 'Resolve' button
Figure 11.1-9 Updating/Closing the incident in ServiceNow
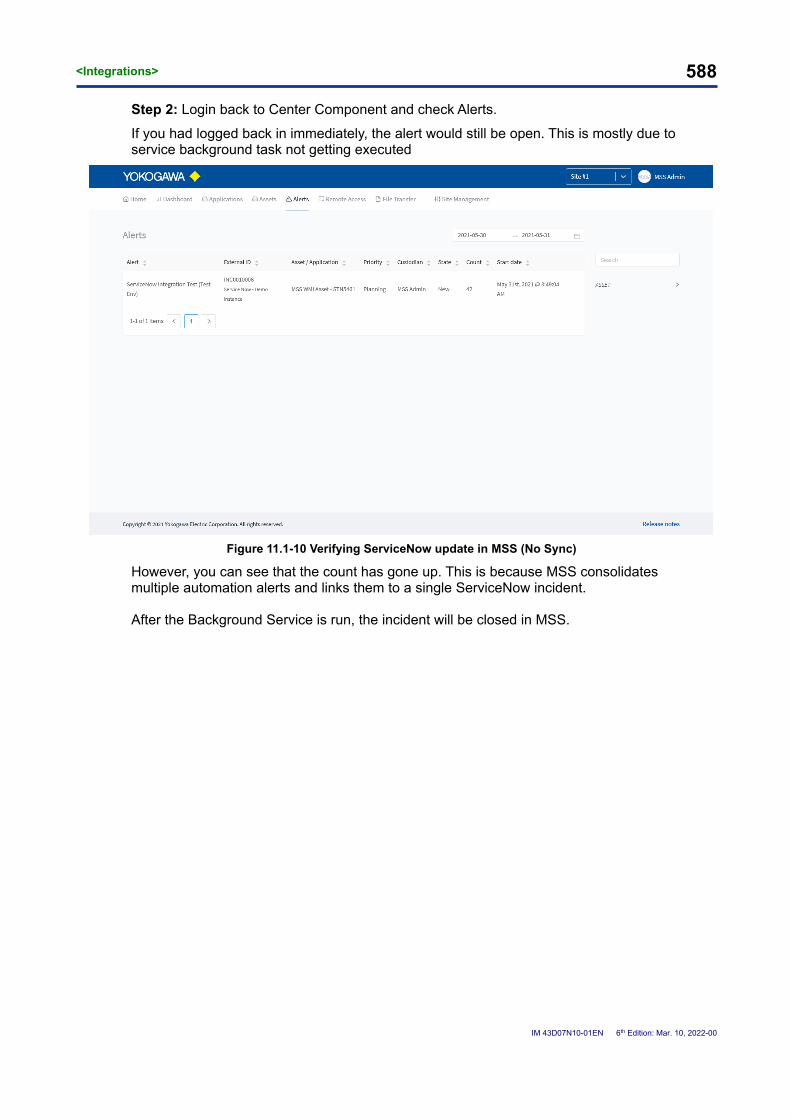
<Integrations> 588
IM 43D07N10-01EN 6th Edition: Mar. 10, 2022-00
Step 2: Login back to Center Component and check Alerts.
If you had logged back in immediately, the alert would still be open. This is mostly due to service background task not getting executed
Figure 11.1-10 Verifying ServiceNow update in MSS (No Sync)
However, you can see that the count has gone up. This is because MSS consolidates multiple automation alerts and links them to a single ServiceNow incident.
After the Background Service is run, the incident will be closed in MSS.
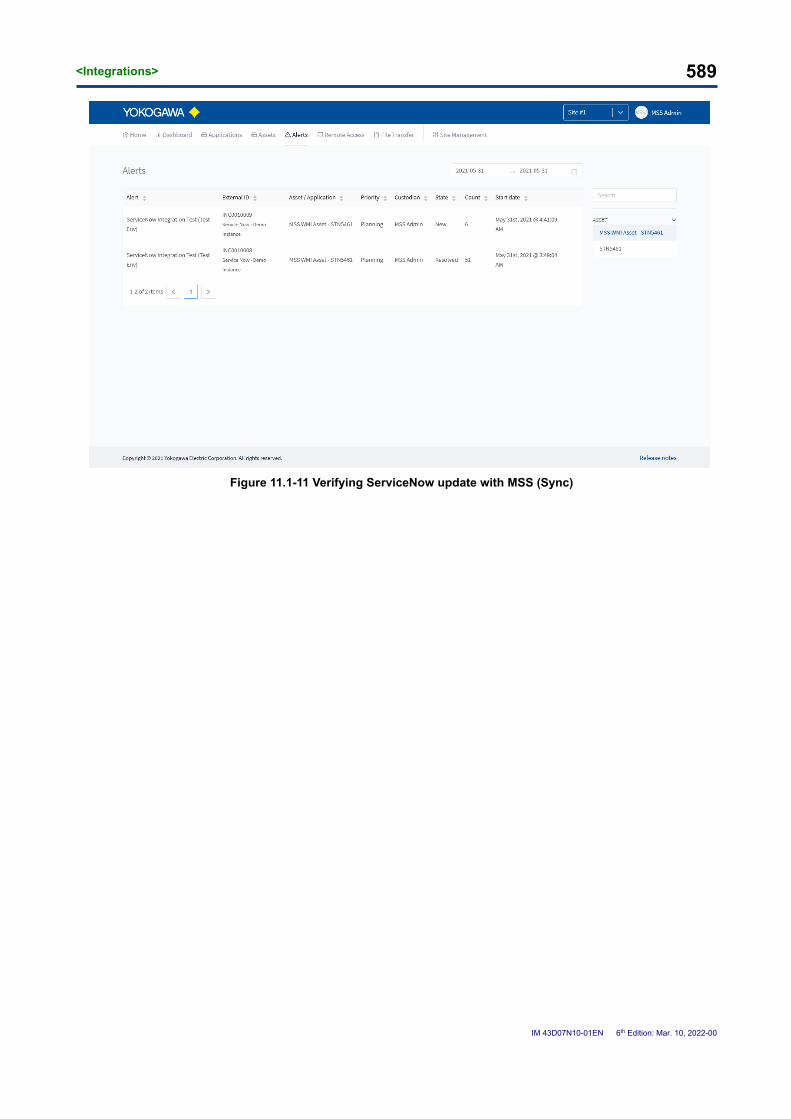
<Integrations> 589
IM 43D07N10-01EN 6th Edition: Mar. 10, 2022-00
Figure 11.1-11 Verifying ServiceNow update with MSS (Sync)

<Revision History> 590
IM 43D07N10-01EN 6th Edition: Mar. 10, 2022-00
Revision History
Title: Managed Service Suite User’s Guide
Manual No: IM 43D07N10-01EN Sep. 2020/1st Edition
Newly published
Dec. 2020/2nd Edition Update following chapter for MSS R1.1.
Chapter No Chapter Name
2.5 Remote access
4.3.3 Sessions Menu
4.3.5 Activity Log
4.3.7 Remote Access
4.7.s4 Network assets
4.11. Network assets
4.11.1 Site-view
4.11.2 Center-view
4.12. Remote Access
4.12.1 RDP
4.12.2 VNC
4.12.3 SSH
4.13 Sessions
4.14 Activity Log
4.15.3 Group
4.15.4 Group Details
4.16 Remote Access
4.16.1 Site-view
4.16.2 Center-view
5.6.4 Network assets
5.10 Site Component - Modifying Language
6 Remote Operations
6.1 Connecting remotely to an asset
6.1.1 Permissions
6.1.2 Direct Access
6.1.3 Request Access
6.2 Managing Sessions & Requests
6.2.1 Approving Requests
6.2.2 Declining Requests
6.2.3 Revoking Sessions
6.3 Monitoring remote activities
6.4 Other Operations
6.4.1 Admin Actions
6.4.2 Printing
6.4.3 Drivers

<Revision History> 591
IM 43D07N10-01EN 6th Edition: Mar. 10, 2022-00
Apr. 2021/3rd Edition Update following chapter for MSS R1.2.
Chapter No Chapter Name
2.5 Applications
2.7 Automations
2.8, 4.3.9, 4.6.7 File Transfer
4.7.5 Environmental assets
4.7.6 Security applications
4.8 Security applications
4.8.1 Site-view
4.8.2 Center-view
4.13 Environmental assets
4.14.1 Site-view
4.13.2 Center-view
4.17.5 Object Permissions
5.6 Site Component – Add an MSS user to the Site component
5.6.1 Security applications
5.7.5 Environmental assets
5.8.3 Modifying Monitor settings
6.5.5 Known errors
7 Automations
7.1 MSS Automation Concepts
7.2 MSS Automation Architecture
7.2.1 Monitors
7.2.2 Automation Rules
7.2.3 Actions
7.4 Adding an Automation
7.5 Managing an Automation
7.6 Automation Alerts
8 File Transfer
8.1 File Transfer Permissions
8.2 Uploading Files to MSS
8.3 Operations on uploaded file
8.3.1 Download Files from MSS
8.3.2 Sharing and unsharing files with other MSS users
8.3.3 Modifying File Expiry Date
8.3.4 Deleting a file
8.4 Default file transfer settings
Sep. 2021/4th Edition Update following chapter for MSS R1.3.
Chapter No Chapter Name
2.9 Asset Inventory
2.10 Dynamic dashboards
2.11 Mail Relay
2.12 Integrations – Service Now
8.2 Uploading Files to MSS
9 Asset Inventory
9.1 Custom Fields
9,1,1 Introductions

<Revision History> 592
IM 43D07N10-01EN 6th Edition: Mar. 10, 2022-00
Chapter No Chapter Name
9,1,2 Field Types
9.1.3 Permissions
9.1.4 Adding Custom Fields
9.1.5 Modifying Custom Fields
9.1.6 Deleting Custom Fields
10 Dynamic dashboards
10.1 Introduction
10.1.1 Dashboards
10.1.2 Widgets
10.2 Creating Dynamic Dashboards
10.3 Dynamic Dashboard Operations
10.3.1 Sharing a Dynamic Dashboard
10.3.2 Favoriting a Dynamic Dashboard
10.3.3 Copying a Dynamic Dashboard
10.3.4 Deleting a Dynamic Dashboard
10.4 Dashboard Widget Operations
10.4.1 Adding a Chart to Dashboard
10.4.2 Modifying the size of a widget
10.4.3 Moving a widget inside a Dashboard
10.4.4 Modifying the contents of the widget
10.4.5 Delete the widget from Dashboard
11 Integrations
11.1. ServiceNow
11.1.1 Integration Overview
11.1.2 Integration Specifications
11.1.3 Deployment Architecture
11.1.4 Error handling
11.1.5 Create a ServiceNow alert from an Automation Rule
11.1.6 Syncing between ServiceNow and MSS alert
Nov. 2021/5th Edition Update following chapter for MSS R1.4
Chapter No Chapter Name
2.12 Operational status and heartbeat
2.13 Integrations – ServiceNow
4.7.7 Asset Management application
4.9 Control applications
4.9.1 Site-view
4.9.2 Center-view
4.10. Asset Management application
4.10.1 Site-view
4.10.2 Center-view
5.6.2 Control Applications
5.6.3 Asset Management application
5.7.7 Field asset discovery
5.12 Site Component - Set Operational Status
5.13 Site Component - Enabling Heartbeat Metrics
7.7 Sending emails from Automations
7.8 Creating Automation rules for multiple assets

<Revision History> 593
IM 43D07N10-01EN 6th Edition: Mar. 10, 2022-00
7.9 Built-in Automations
Mar. 2022/6th Edition Following new chapter were added on MSS R1.5.
Chapter No Chapter Name
4.7.8 Analyzer Management application
4.10 Analyzer Management application
4.10.1 Site-view
4.10.2 Center-view
4.17..4 Web
4.20.6 System Groups
5.6.4 Analyzer Management applications
5.6.4.1 Adding an Analyzer Management application
5.14 Center Component – Exporting a dashboard
6.1.5 Connecting to an application through HTTP Remote access
6.4.3 Web (HTTP) Connection
7.10 Using Conditions in Automations
7.10.1 Condition Types
7.11 Troubleshooting an Automation