Sales Maximization through Service Tier Introduction Utilizing ...
Upload
khangminh22Category
view
2download
0
Utilizing Managed Pressure Casing Drilling in Depleted Reservoir Zones
Tarje Livik Naterstad
Petroleum Geoscience and Engineering
Supervisor: Sigbjørn Sangesland, IPT
Department of Petroleum Engineering and Applied Geophysics
Submission date: June 2014
Norwegian University of Science and Technology

i
NTNU
Norges teknisk-naturvitenskapelige
universitet
Fakultet for ingeniørvitenskap og teknologi
Faculty of Engineering and Technology
Studieprogram i Geofag og petroleumsteknologi
Study Programme in Earth Sciences and Petroleum Engineering
Institutt for petroleumsteknologi og anvendt geofysikk
Department of Petroleum Engineering and Applied Geophysics
HOVEDOPPGAVE/DIPLOMA THESIS/MASTER OF SCIENCE THESIS
Kandidatens navn/The candidate’s
name:
Tarje Livik Naterstad
Oppgavens tittel, norsk/Title of Thesis, Trykkstyrt foringsrørboring i
reservoarsoner med lavt trykk
Oppgavens tittel, engelsk/Title of Thesis, Utilizing Managed Pressure Casing Drilling in
Depleted Reservoir Zones
Utfyllende tekst/Extended text:
Background:
Drilling wells through depleted reservoirs and layered reservoirs with different pressure
regimes is a challenge using conventional drilling methods. It is believed that combining
Managed Pressure Drilling (MPD) and Casing/Liner Drilling (CD/LD) may provide a
method for drilling such wells from floating rigs in a safe and efficient manner. This thesis
will discuss status and further perspectives of Managed Pressure Casing Drilling (MPCD)
and how this combination may interact with other novel drilling techniques in order to further
improve drilling performance in harsh conditions.
Task:
a. Discuss the current state of MPD and CD/LD technology (tools and
equipment)
b. Describe typical challenges encountered when using MPD and CD/LD
c. Evaluate MPD & CD/LD, and the potential of combining the two techniques
d. Develop a hydraulic model applicable for MPD and CD/LD
e. Apply the hydraulic model on a case study in order to evaluate the
performance when using conventional drilling methods, MPD, CD/LD and
MPCD. Compare and discuss results

ii
Supervisor: Professor Sigbjørn Sangesland (NTNU)
Co-supervisor: Inge Manfred Carlsen & Jafar Abdollahi
(Weatherford Petroleum Consultants A/S)
Studieretning/Area of Specialization: Petroleum Engineering, Drilling
Technology
Fagområde/Combination of subject: Drilling Engineering
Tidsrom/Time Interval: January 14- June 10, 2014

iii
Summary
The last decade has seen the advent of new unconventional drilling methods, such
as Managed Pressure Drilling and Casing/Liner Drilling. It has been proven through
numerous field applications that both of these technologies bring value to drilling
operations when used in the appropriate situations. It is thought that a combination of
the two might yield additional benefits. Examples of candidates thought to benefit
from using this combination include:
Highly depleted reservoirs
Formations with very narrow mud windows
Consecutive layers with different pressure regimes
This thesis sets out to evaluate the benefits and limitations of combining these two
methods into a method dubbed Managed Pressure Casing Drilling, and if it enables
drilling wells that were previously thought undrillable. A hydraulic model was
developed, combined with field data pertaining to a developed field on the Norwegian
Continental Shelf, and used to model the pressure losses along a designed wellbore for
four different cases:
Conventional Drilling
Liner Drilling
Managed Pressure Drilling
Managed Pressure Casing Drilling
The case study shows that out of these alternatives, the designed well can only be
drilled using Managed Pressure Casing Drilling, though no consideration has been
made with regards to limitations in well section length in this scenario; torque and
drag, among others, are likely to limit the achievable well section length.
It has been found that the methods are complementary, provided that
modifications are made to certain rig components. Using a combination of the two
will lead to additional expenditures when constructing wells, but the findings in this
thesis indicate that such a combination will bring significant value to certain drilling
operations, provided careful candidate selection:
Drilling with liner or casing in static underbalance, along with precise pressure
management, may turn the increased Annular Friction Pressure associated with
Casing/Liner Drilling into an advantage in some situations
Reduced overbalance reduces the Rate of Penetration, stuck pipe, and
formation damage concerns usually associated with Casing/Liner Drilling
Reduces heave induced surge & swab pressure fluctuations when drilling
ahead from floaters
Allows drilling into highly depleted reservoirs and reservoirs with different
pressure regimes, opening up new opportunities in drilling
This thesis should be treated as an initial study. Suggestions with regards to future
work include, but is not limited to, studies pertaining to:

iv
The impact of overbalance on torque and drag
The equipment and systems modifications required to accommodate the
combination
The impact of reduced overbalance on smearing, as well as fluid and particle
invasion
Hydraulic models used for automatic Managed Pressure Drilling systems. New
models should be made to accommodate for:
o the reduced annular flow area associated with Casing/Liner Drilling
and the associated pressure losses
o Surge and swab when drilling from floaters
The economic benefits that may be gained by combining the two, preferably
by analyzing well construction reports from fields similar to the candidates
mentioned previously

v
Sammendrag
I løpet av de siste par tiår har boreindustrien begynt å ta i bruk nye og
innovative boremetoder, som for eksempel trykkstyrt boring og boring med
foringsrør. De individuelle fordelene tilknyttet bruk av disse nevnte metodene har blitt
demonstrert gjentatte ganger ved bruk i felt, men på grunn av kostnaden benyttes de
gjerne i spesifikke situasjoner. Man antar at man kan dra nytte av ytterligere fordeler
ved å kombinere disse to. Det antas at en slik kombinasjon kan være spesielt
fordelaktig ved bruk i følgende felttyper:
Meget trykkavlastede reservoarer
Formasjoner med svært trange slamvinduer
Etterfølgende formasjonslag med varierende trykkregimer
Hensikten med denne avhandlingen er å evaluere fordeler og begrensninger som
oppstår når man kombinerer disse to metodene, og om kombinasjonen kan bidra til et
paradigmeskifte i industrien mtp. hva som anses å være borbart. En hydraulisk modell
har blitt konstruert og kombinert med feltdata fra et felt på den norske
kontinentalsokkelen for å bygge opp vurderingsgrunnlaget. Denne har blitt benyttet til
å evaluere trykktapene langs en designet brønn for fire forskjellige tilfeller:
Konvensjonelle boremetoder
Foringsrørboring
Trykkstyrt boring
Kombinasjonen av de to sistnevnte: Trykkstyrt foringsrørboring
Denne vurderingen viser at det ikke er mulig å bore den designede brønnen med
andre metoder enn trykkstyrt foringsrørboring ut av de nevnte alternativene. Det har
ikke blitt tatt hensyn til begrensninger som måtte påvirke brønnseksjonslengde. I
realiteten vil sannsynligvis brønnseksjonslengdene begrenses vesentlig av moment og
vegg-til-vegg friksjon under boring.
I denne avhandlingen er det vist at metodene er komplementære, dersom riggen
modifiseres for å akkomodere utstyret. Dette vil medføre ekstrakostnader tilknyttet
boreoperasjoner, men det er også et potensial for betydelige besparelser og økte
inntekter tilknyttet feltutvikling, forutsatt at potensielle kandidater vurderes nøye i
forkant. I hovedsak kan man forvente å dra nytte de av de følgende fordelene:
Det går an å utnytte friksjonstapet i annulus, som er en følge av boring med
foringsrør, ved å bore i underbalanse med presis justering av baktrykk.
Økning i penetrasjonsrate, en reduksjon av tilfeller hvor strengen blir sittende
fast, samt redusert formasjonsskade i forhold til hva som normalt kan forventes
når man borer med foringsrør.
En reduksjon i trykkfluktuasjoner, som ofte kan observeres når det bores fra
flytere som følge av bølgebevegelse.

vi
Nye muligheter tilknyttet boring av meget trykkavlastede reservoarer og
formasjoner med svært trange slamvinduer, samt lagdelte reservoarer med
forskjellige trykkregimer.
Denne avhandlingen bør vurderes som et innledende studie. Forslag til videre arbeid
inkluderer, men er ikke begrenset til, å:
Studere om redusert overbalanse i brønnen påvirker moment og vegg-til-vegg
friksjon.
Vurdere hva slags modifikasjoner som må gjennomføres på rigg og øvrig
utstyr for å akkommodere trykkstyrt foringsrørboring.
Forske på hvordan redusert overbalanse påvirker «smearing», samt fluid og
partikkelinvasjon i formasjoner som bores.
Videreutvikle hydrauliske modeller som benyttes til automatisk trykkstyr
boring-operasjoner. Nye modeller bør utvikles for å ta høyde for:
o Reduksjonen i strømningsareal i annulus
o Trykkfluktuasjoner som følge av bølgebevegelse når det bores fra
flytere
Evaluere de økonomiske fordelene man kan dra nytte av ved å kombinere
metodene. Dette kan for eksempel gjøres ved å samle data fra brønnrapporter
fra brønner som har blitt boret i felt som passer beskrivelsen tidligere i
sammendraget.

vii
Acknowledgements
This thesis is the culmination of a five year study programme within the field of
Petroleum Engineering (with the Department of Petroleum Engineering and Applied
Geophysics) at the Norwegian University of Science & Technology. The work has
been done together with Weatherford Petroleum Consultants A/S, in their offices.
I would like to thank Weatherford Petroleum Consultants A/S and their employees for
providing material and office space, and for including me and my fellow students in
their everyday activities for the better part of a year. It has been a tremendous learning
experience!
I would also like to thank my supervisor at NTNU, Professor Sigbjørn Sangesland, for
helping define the assignment and for his guidance, and Henrik Sveinall with
Weatherford Norway for his valuable input. Special gratitude is directed towards my
thesis supervisors, Inge M. Carlsen and Dr. Jafar Abdollahi, Ph.D. at Weatherford
Petroleum Consultants A/S for their guidance, availability, interest and
encouragement.
I would like to thank my family for their love and support throughout the years, as
well as all of the friends I’ve made in Trondheim throughout these years. It is been an
exciting and enjoyable journey.

viii
Table of Contents
Summary .............................................................................................................. iii
Sammendrag ......................................................................................................... v
Acknowledgements .............................................................................................. vii
Abbreviations ........................................................................................................ xi
Nomenclature ...................................................................................................... xv
Definitions .......................................................................................................... xix
1 Introduction ..................................................................................................... 1
2 Technology ...................................................................................................... 3
2.1 Adopting New Technology ....................................................................................... 3
2.2 Flat Time ................................................................................................................. 5
3 Managed Pressure Drilling ............................................................................... 9
3.1 The Managed Pressure Drilling Method .................................................................. 13
3.2 Tools and Equipment ............................................................................................. 14
3.2.1 Rotating Control Device ............................................................................................................ 14
3.2.2 Chokes ...................................................................................................................................... 16
3.2.3 Non-Return Valves .................................................................................................................... 16
3.2.4 Down-Hole Annular Valves ....................................................................................................... 17
3.2.5 Coriolis Flow Meters ................................................................................................................. 17
3.2.6 Continuous Circulation System ................................................................................................. 17
3.2.7 Control System.......................................................................................................................... 17
3.3 Procedures and Practices ....................................................................................... 19
3.4 Value Added .......................................................................................................... 22
3.4.1 Downhole Information ............................................................................................................. 22
3.4.2 Drillability .................................................................................................................................. 23
3.4.3 Rate of Penetration................................................................................................................... 24
3.4.4 Stuck Pipe ................................................................................................................................. 24
3.4.5 Near-Wellbore Conditions ........................................................................................................ 25
3.4.6 Mud properties ......................................................................................................................... 27
3.5 Limitations............................................................................................................. 28
3.5.1 Expenditures ............................................................................................................................. 28
3.5.2 Floaters – Heave during connections ....................................................................................... 28
3.6 Summary ............................................................................................................... 29
4 Casing & Liner Drilling .................................................................................... 33

ix
4.1 Techniques and Enabling Technologies ................................................................... 33
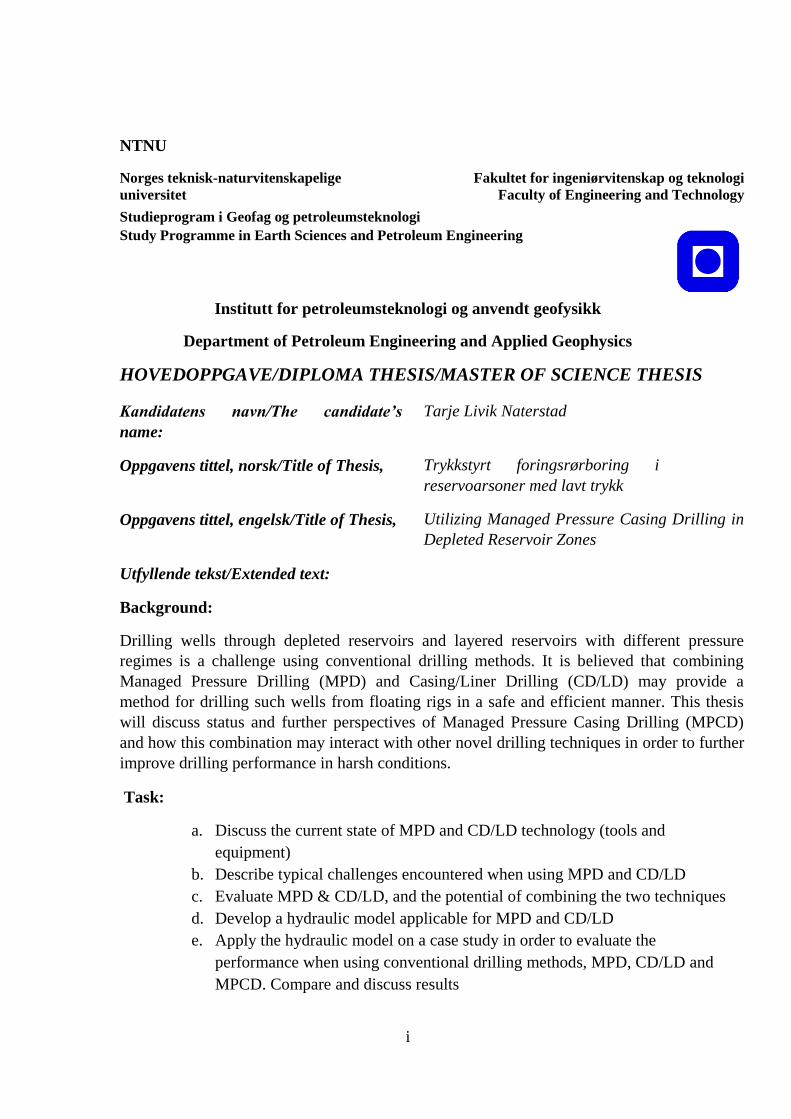
4.2 Procedures and Practices ....................................................................................... 37
4.3 Benefits ................................................................................................................. 39
4.3.1 Efficiency ................................................................................................................................... 39
4.3.2 Smear Effect ............................................................................................................................. 39
4.3.3 Wellbore Stability ..................................................................................................................... 41
4.3.4 Wellbore Cleaning .................................................................................................................... 42
4.3.5 Drilling with Losses ................................................................................................................... 45
4.4 Limitations............................................................................................................. 46
4.4.1 Torque, Drag and Friction ......................................................................................................... 46
4.4.2 Cementing ................................................................................................................................ 47
4.4.3 String Elongation and Vibrations .............................................................................................. 47
4.4.4 ROP ........................................................................................................................................... 48
4.4.5 Stuck Pipe ................................................................................................................................. 48
4.4.6 Surge & Swab ............................................................................................................................ 48
4.5 Health, Safety & Environment ................................................................................ 49
4.6 Summary ............................................................................................................... 50
5 Supporting Technologies ............................................................................... 53
5.1 Wired Drill Pipe...................................................................................................... 53
5.2 Along-String Measurements & Seismics While Drilling ............................................ 57
5.3 Concept Study: Liner Drilling with Expandable Systems ........................................... 58
5.3.1 Expansion Methods .................................................................................................................. 61
5.3.2 String Configuration .................................................................................................................. 63
5.3.3 Business Case ............................................................................................................................ 65
5.3.4 Discussion ................................................................................................................................. 66
6 Theoretical Background ................................................................................. 67
6.1 Drilling Hydraulics .................................................................................................. 67
6.1.1 Bottom Hole Pressure ............................................................................................................... 67
6.1.2 Flow regimes ............................................................................................................................. 69
6.1.3 Rheological Models .................................................................................................................. 70
6.1.4 Pressure Loss Equations ........................................................................................................... 78
6.2 Rock Mechanics ..................................................................................................... 80
6.3 Well Trajectory ...................................................................................................... 81
7 Case Study ..................................................................................................... 83
7.1 Case Description .................................................................................................... 83
7.2 Assumptions .......................................................................................................... 86
7.3 Results ................................................................................................................... 88
7.3.1 Overbalanced Drilling ............................................................................................................... 88
7.3.2 Liner Drilling .............................................................................................................................. 89
7.3.3 Managed Pressure Drilling ........................................................................................................ 89

x
7.3.4 Managed Pressure Casing Drilling ............................................................................................ 90
7.4 Discussion .............................................................................................................. 92
8 Discussion ...................................................................................................... 93
8.1 Combining MPD and LD/CD .................................................................................... 93
8.2 Managed Pressure Casing Drilling and Supporting Technologies .............................. 96
9 Conclusion ..................................................................................................... 97
9.1 Future Work .......................................................................................................... 99
10 Conversion Table ...................................................................................... 101
11 References ................................................................................................ 102
12 List of Figures ........................................................................................... 108
13 List of Tables ............................................................................................. 110
14 List of Appendix Figures ............................................................................ 111
Appendix A ............................................................................................................A
Appendix B ............................................................................................................. B
Appendix C ............................................................................................................. E
Appendix D .......................................................................................................... W
Appendix E .......................................................................................................... AA
Appendix F ........................................................................................................... BB
Appendix G .......................................................................................................... FF

xi
Abbreviations
AFP Annular Friction Pressure
API American Petroleum Institute
ASM Along-String Measurements
BHA Bottom Hole Assembly
BHP Bottom Hole Pressure
BOP Blowout Preventer
BP Backpressure
CBHP Constant Bottom Hole Pressure
CCS Continuous Control System
CD Casing Drilling
CFD Computational Fluid Dynamics
DG Dual Gradient Drilling
DLS Dog-leg Severity
ECD Equivalent Circulating Density
EMW Equivalent Mud Weight
EOWR End of Well Report
ERD Extended Reach Drilling
ETD Expandable Tubular Drilling
FEM Finite Element Method
FIT Formation Integrity Test
HPHT High Pressure High Temperature
HSE Health, Safety & Environment
LCM Lost Circulation Material
LD Liner Drilling

xii
LOT Leak-off Test
LWD Logging While Drilling
MODU Mobile Offshore Drilling Unit
MPCD Managed Pressure Casing Drilling
MPD Managed Pressure Drilling
MPT Mud Pulse Telemetry
MSL Mean Sea Level
MTBF Mean Time Between Failure
MWD Measurements While Drilling
NCS Norwegian Continental Shelf
NPT Non-Productive Time
NRV Non-Return Valve
OBD Overbalanced Drilling
PDM Positive Displacement Motor
PHAR Pipe-to-Hole Area Ratio
PI Productivity Index
PMCD Pressurized Mud Cap Drilling
POOH Pulling Out of Hole
PWD Pressure Measurements While Drilling
RCD Rotating Control Device
RKB Rotary Kelly Bushing
RIH Run in Hole
ROP Rate of Penetration
RPM Revolutions per Minute
RSS Rotary Steerable System
SG Specific Gravity

xiii
SPP Stand Pipe Pressure
SWD Seismics While Drilling
TD Target Depth
TRL Technology Readiness Level
TVD True Vertical Depth
UBO Underbalanced Drilling
WBE Well Barrier Element
WBS Wellbore Stability
WDP Wired Drill Pipe
WOB Weight on Bit

xiv
This page intentionally left blank

xv
Nomenclature
Nominator Unit Description
A
Bo Sm3/ m
3 Formation Oil Factor
cp,0 - Cuttings Concentration Ratio
D m Diameter
dbit m Bit Diameter
di m Inner Diameter
do m Outer Diameter
DLS o/30m Dog-Leg Severity
ECD Pa Equivalent Circulating Density
E m Horizontal Displacement in Eastern Direction
F - Ratio Factor
g m/s2
Gravity acceleration
h m Reservoir Layer Height
k m2 Permeability
K - Flow Consistency Index
Kfr Pa Drained Bulk Modulus
KL, contraction - Singularity Loss Contraction Coefficient
KL, expansion - Singularity Loss Expansion Coefficient
Ks Pa Bulk Modulus, Solid Material
L m Length
L m Length of Build-up
n - Flow Behavior Index
NRE - Reynolds Number
pffrac
Pa Fracture Pressure
phs Pa Hydrostatic Pressure
pwf Pa Flowing Well Pressure
pR Pa Reservoir Pressure
p Pa Pressure differential
pf Pa Pressure loss due to friction
q m3/s Fluid Flow Rate

xvi
Nominator Unit Description
qmud m3/s Mud Flow Rate
qo m3/s Oil Flow Rate
qsolids m3/s Rate of Produced Solids
re m Drainage Radius
rw m Well Radius
Q m3/s Fluid Flow Rate
R m Radius of Build-up
ROP m/hr Rate of Penetration
m/s Average Velocity
V m Vertical Displacement
W m Horizontal Displacement in Western Direction
Biot’s coefficient
Inclination at the start of a build-up section
Inclination at the end of a build-up section
Azimuth at the start of a build-up section
Azimuth at the end of a build-up section
s-1
Shear Rate
s-1
Shear Rate for Annular Flow
s-1
Shear Rate @ I RPM
s-1
Shear Rate for Pipe Flow
x m Elongation/contraction in x-direction
y m Elongation/contraction in y-direction
i Pa Viscometer Reading @ I RPM
o Pa*s Oil Viscosity
Pa*s Fluid Viscosity
eff Pa*s Effective Viscosity
pl Pa*s Plastic Viscosity
- Poisson’s Ratio
m2 Kinematic Viscosity
kg/m3 Density
mix kg/m3 Density of Mixed Solids and Fluids

xvii
Nominator Unit Description
mud kg/m3 Density of Mud
solids kg/m3 Density of Solids
h Pa Minor Horizontal Stress
H Pa Major Horizontal Stress
v Pa Vertical Stress
Pa Shear Stress
i Pa Shear Stress @ I RPM
y Pa Yield Stress
o Dog-Leg Angle

xviii
This page intentionally left blank

xix
Definitions
Annulus The void between the drill string / production tubing and
wellbore/casing.
Barrier A well construction element that prevents unintended flow
from producing layers into surrounding formations and/or
environment
Bit Balling The formation being drilled sticks to the bit, reducing bit
efficiency and ROP, and potentially increasing string
vibrations which may lead to component/string failure
Casing A casing is a piece of metal tubing that is secured at the
wellhead, and run all the way down to an appropriate depth.
Contingency A provision for a possible event or circumstance. In the case
of contingency casing, an intermediate casing intended to
bridge the gap between two casing size in case it becomes
necessary to set a casing earlier than originally intended.
Contractor Drilling contractor refers to those individuals or group of
individuals who own a drilling rig. Drilling contractors
contract their services mainly for drilling wells. Drilling
contractors also provide equipment, people and the expertise
to drill wells, which can be either offshore or onshore.
Dog-leg Severity A measure of the build-up rate in a well, quantified by well
inclination change / length of well, usually 30m.
Drill String In the context of this thesis, drill string can be understood as
a column/string consisting of connected drill pipe and/or
drilling tubulars (casing or liner) and/or BHA that transmits
torque and fluids downhole.
Hook Load The force pulling on the hook suspending the drill string.
Hook load is used to measure the force required to pull the
string out of the hole, or to estimate weight on bit during
string running operations or drilling.
Liner A liner is a casing string that is hanged off at the bottom of
the previous casing string, typically with an overlapping
section of 100m
Lost Circulation Usually occurs when the BHP exceeds the fracture strength
of a formation, or the formation is highly fractured, causing
drilling fluids to leak into the formation
Managed Pressure Drilling An advanced drilling technique where a well is drilled with
mud gradient as close to the pore pressure of the formation
as possible. Fluid influx while drilling is generally not
desired, though some is acceptable.

xx
Mud Window The difference between the formation pore/ collapse
pressure and fracture pressure.
Operator An individual, company or trust responsible for the
exploration, development and production of an oil or gas
well or lease.
Overbalanced Drilling A conventional drilling technique, where a well is drilled
with mud gradient greater than the pore pressure in the
formation. Fluid influx while drilling is not desired.
Pipe Stripping The act of putting drillpipe into a well under pressure past
annular seals
Service Company A company which provides services to the petroleum
exploration, development and production industry, but
which typically produces no hydrocarbons themselves.
Sub Any small component of the drill string
Telescope/Tapering Effect The diameter of each consecutive liner/casing gets
progressively smaller as consecutive casing strings are set
and cemented in place
Top Drive A device that rotates the drill string from the top. The top
drive consists of one or more electric motors, and is
suspended from the hook, making it free to move up and
down in the derrick.
Underbalanced Drilling An advanced drilling technique where a well is drilled with
mud gradient less than the pore pressure in the formation.
During drilling, the well takes a continuous influx of fluids
from the formation. The goal is to eliminate wellbore
damage caused by fluid invasion altogether if executed
successfully. Going into overbalance, even for a very short
period of time eliminates or severely reduces the magnitude
of this advantage.
Well Ballooning/Breathing A phenomenon occurring when a formation takes in drilling
fluids when the pumps are turned on, and returning the mud
to the wellbore when the pumps are shut off.

1
1 Introduction
Conventional drilling methods rely on relatively wide pore pressure and fracture
pressure margins (commonly referred to as the mud window) in order to reach Target
Depth (TD) in a safe and efficient manner. Drilling into severely depleted reservoirs,
however, usually means drilling through narrow mud windows, and is very
challenging or even impossible due to formation instability and associated operational
challenges. The narrower the mud window, the greater the risk of encountering lost
circulation events, hole collapse, loss of wellbore and blowouts, all of which may
place the rig crew, company's assets and surrounding environment in jeopardy.
Pressurized fluids contained in microscopic pores act as pressure support in rock
formations containing fluids. This aids in supporting the enormous weight of the rock
mass in the overburden; there is a natural relationship between pore pressure and
formation strength. As a producing reservoir is depleted, this pressure support
decreases over time, with the consequence of reducing the strength of the rock in the
reservoir; the mud window shrinks with increasing depletion.
The last decade or two has seen the advent of several novel drilling methods that are
well suited to negating the aforementioned challenges. Methods like Managed
Pressure Drilling (MPD) and Casing/Liner Drilling (CD/LD) are both known for
counteracting different aspects of the challenges mentioned, as has been documented
through numerous applications both on and off shore.
Important challenges ahead make it necessary to not just drill into, but also through
depleted reservoir layers and into formations situated underneath. Drilling into
formations with different pressure regimes, and indeed, unknown pressure regimes
poses challenges that may be insurmountable using any of the novel methods
mentioned above by themselves. Solving such challenges will allow the petroleum
industry to drill into reservoirs previously thought unreachable and increase their
hydrocarbon output. This has served as motivation for this thesis.
A solution to some aspects of this challenge may lie in blending these technologies.
Both MPD and CD/LD techniques have their unique advantages, but also their
respective limitations. Potential benefits of combining the two are evaluated in this
Master's Thesis, as well as the potential challenges involved. In order to evaluate the
viability of such a combination, a hydraulic model has been developed and applied by
performing a case study. The case is based on publically available information
gathered from an actual oil field on the Norwegian Continental Shelf (NCS).

2
Additional information has been gathered from open sources, published papers, books
and discussions with industry professionals.
This Master’s Thesis can be divided roughly into two parts:
1. The challenges involved as well as the different methods are presented
and described in detail along with supporting technologies in order to
provide a framework for the discussion.
2. These methods are evaluated alongside one another in order to identify
potential pitfalls and complementary properties. The thesis contains a
chapter describing the theoretical background of wellbore hydraulics,
basic rock mechanics and wellbore geometry, which have all been used
to develop a hydraulic model. The hydraulic model has been used to
perform a case study in an attempt to compare conventional drilling
methods with MPD, CD/LD, and a combination of MPD and CD/LD;
Managed Pressure Casing Drilling (MPCD).

3
2 Technology
2.1 Adopting New Technology
Oil and gas resource exploration, development and production are technology
intensive endeavors. The oil & gas industry is also one where safety is a serious
concern; there have been many incidents throughout history where oil and gas
activities have led to serious accidents causing the deaths of people and serious harm
to the surrounding environment. Macondo (Deepwater Horizon), Alexander Kielland
and Piper Alpha are but a few examples. Such accidents tend to have serious financial
and political consequences for the responsible parties. With this in mind, it is hardly
surprising that the industry tends to rely on tried and tested technology that experience
proves to be reliable. In the world of drilling, this usually means using methods that
has remained largely unchanged during the last century. This begs an important
question: Has the industry come up with better solutions than the ones commonly
used today? If so, why does the industry generally stick with the conventional
approach?
The Operator industry as a whole is not heavily involved in research compared to
other typical technology intensive industries, as is illustrated in Figure 2-1. Exceptions
from the norm do exist, such as Chevron, Shell and Statoil, which are heavily
involved in research projects. In general, it may seem as though the Service industry
has adopted the role of developing and testing technology. This arrangement has some
benefits in that the Operators may focus on their core business, which is finding and
extracting hydrocarbons, while the Service providers may focus on technology and
developing products for the Operators (Angus Warren, 2013).
It is in the Operators’ interest to adopt technologies which may aid in increasing
operational efficiency and safety while drilling, and productivity of the completed
fields. In spite of this fact, the rate of which new technologies are adopted and used in
field applications is lower than it could have been:
“The world’s first 3D seismic survey was undertaken by ExxonMobil in 1967,
but it was not until the mid-1980s that the technology became truly
mainstream.” “Horizontal drilling began in the USA in the mid-1970s, but it
wasn’t until the 1980s that steerable motors that could be controlled from the
surface were introduced – that allowed the real growth in horizontal drilling to
take place between 1990 and 2000 (Angus Warren, 2013).”

4
Figure 2-1: R&D expressed as percentage of sales or operating profit (Angus Warren, 2013)
There are several reasons as to why this is the case, some of which are listed below:
There is a significant risk related to utilizing new technologies which has not
been tested in the field.
o Due to the potential catastrophic consequences (both to the company
– politically and financially – , human lives and the environment), it is
natural that Operators, as the main responsible party, wishes to reduce
risk factors
Due to continuous outsourcing of research endeavors, the company and its
employees may not have the skills and knowledge required to properly
understand the risk factors involved with certain technologies, and so may err
on the side of caution
Pressure from investors may incentivize Operator companies and its
management to opt for the short-term advantage, rather than investing in long-
term financial benefit
Several technologies exist today which have the potential of increasing efficiency of
field development, as well as alleviate typical well control issues which may cause
accidents. Even in the case of technologies with a documented field record, some
Operators still seem somewhat apprehensive about using them for anything other than
a “last resort” solution. MPD is an example of such a technology.

5
2.2 Flat Time
Flat Time:
"A common term used by many operators, encompassing all times except
drilling ahead a new hole. This thus includes the planned normal
operations, trouble time, lost time and well downtime, […] and this also
includes tripping between drilling sequences and completion operations"
(Carlsen, et al., 2000).
The causes of Flat Time include, but are not limited to:
- Tripping
- Stuck Pipe incidents
- Fishing
- Well Control Events
- Waiting on Weather (WOW)
- Casing running/installation
- Formation evaluation
- Completions
Table 1 and Table 2 presents Flat Time data based on 250 wells world-wide in which
Mobil are/were either Operator or Partner. It has proven a challenge to find reliable
flat time estimates that are representative for conditions on the NCS.
Table 2 shows that non-scheduled events such as lost circulation or well control, DH
equipment failure and stuck pipe incidents, casing running & installation, tripping and
formation evaluation constitutes a significant amount of time lost annually on the
NCS. Figure 2-2 displays a breakdown of cost distribution of well operations on the
NCS. Considering today's rig rates - ranging from ~$280k USD to ~$600k USD per
day, depending on rig type, as of Aug. 2014, see Appendix A -, the discussions
regarding MPD, Wired Drill Pipe (WDP), Measurements While Drilling (MWD) and
Logging While Drilling (LWD), and the potential benefits these technologies have, it
seems apparent that there is a significant savings potential involved.
As can be seen from Table 1, running and installation of casing typically constitutes
12-21% of flat time, tripping 10-12%, and formation evaluation 5-18%. That is
between 20 and 38% of total drilling time in the North Sea.
Furthermore, stuck pipe incidents and fishing of equipment, lost circulation and/or
well control events, and issues with downhole equipment constitutes further 4 to 18%
of total drilling time.

6
Table 1: Flat Time of Total Time Drilling and Completion (Jenssen, et al., 2000)
Region Flat Time [%] Comment
Offshore Gulf of Mexico 82 Typical average for all wells
Offshore Equatorial Guinea 83
North Sea 75 Both UK and NCS
Deepwater Gulf of Mexico 75 Beyond 400 meter water depth
Onshore USA
(Texas, Louisiana) 65
Oil and Gas wells
Table 2: Flat Time - distribution of causes (Jenssen, et al., 2000)
Event, operation Flat Time range % of total Breakdown, comments
Non-scheduled events 12-25
Stuck pipe, fish: 2 - 12%
DH equipment : 2 - 9%
Lost circulation or well control:
1 - 3%
WOW, waiting: 0.5 - 3%
Cementing: 0.5 - 2%
Casing running/installation 12-21 Time consuming operation
Tripping 10-12 Reduced number of trips
needed
Formation Evaluation 5-18 Mainly logging (as required)
Completion 5-10 Strongly influenced by well and
completion type
The technologies discussed in this thesis will have the potential to reduce the time
spent conducting many of the operations mentioned in Table 2, some by eliminating
the source of Flat Time, for example running liner or casing while drilling, others
indirectly by reducing damage to downhole components and improving operational
efficiency.

7
Figure 2-2: Cost Distribution on the NCS (Osmunsen, et al., 2009)

8
This page intentionally left blank

9
3 Managed Pressure Drilling
Managed Pressure Drilling, according to the International Association of Drilling
Contractors (IADC), is defined as “an adaptive drilling process used to more
precisely control the annular pressure profile throughout the wellbore”. The
objectives are “to ascertain the down-hole pressure environment limits and to manage
the annular hydraulic pressure profile accordingly” (Hannegan, 2011).
"Basic to MPD planning and execution is the concept that it is an adaptive procedure
(Rehm, et al., 2008)." The general concept is to establish a closed-to-atmosphere
envelope, so that the Bottom-Hole Pressure (BHP) can be adjusted in a matter of
seconds to accommodate changes in formation characteristics, and thereby avoid the
influx of formation fluids and collapse of formation rocks.
When making up or breaking out connections, the circulation is halted and the pumps
are shut off. Under static conditions, the BHP is determined by the static mud column
alone (Eq. 3-1):
Eq. 3-1
When the rig pumps are turned on and the drilling fluids are circulating through the
drill string and wellbore, the dynamic BHP of a circulating system may be expressed
using the simple but fundamental pressure equation shown in Eq. 3-2 (Rehm, et al.,
2008):
Eq. 3-2
where
= The hydrostatic pressure exerted on the bottom by the
stationary drilling fluid column
= The Annular Friction Pressure (AFP) caused by the
circulating drilling fluid
The term expressed in Eq. 3-2 is also referred to as Equivalent
Circulating Density (ECD), which the American Petroleum Institute (API) defines as
"the effective density of the circulating fluid in the wellbore resulting from the sum of
the hydrostatic pressure imposed by the static fluid column and the friction pressure
(American Petroleum Institute, 2010)." It is also commonly referred to as Equivalent
Mud Weight (EMW). In order to compensate for AFP Loss, the mud pumps topside

10
must provide extra pressure in order to maintain circulation through the drill string, bit
and up the annulus (Thingbø, 2011).
Using a Rotary Control Device (RCD), which will be described in more detail further
on, or another similar pressure isolation device, enables operators to pressurize and
isolate the well by establishing a so-called Closed Loop System. Separating between
systems that are open to the atmosphere and systems that are closed to the atmosphere
is essential in order to properly define some of the advantages of MPD systems.
In a Closed Loop System, the well is pressurized by applying Backpressure (BP), .
Backpressure refers to the increased annular pressure generated using dedicated
pumps and chokes. During connections, the backpressure is usually used to
compensate for the lack of ECD induced while circulating. While drilling, the BP is
used to regulate the wellbore pressure. This can be used to maintain a constant
pressure at an arbitrary point in the well and/or to compensate for anticipated, as well
as sudden pressure changes along the well bore. Pressure fluctuations along the
wellbore may be caused by pipe movement, fluid losses and formation
inhomogeneities, to mention a few examples. Maintaining a closed pressure envelope
has the benefit that it prevents gases from leaking onto the rig deck, reducing the risk
of crew exposure, as well as unintended leaks into the environment. This, in turn,
reduces the risk of hydrocarbon ignition and resulting fire/explosion hazard (Rehm, et
al., 2008).
The BHP of wells drilled using closed-loop MPD systems is estimated by Eq. 3-3,
where the BHP is controlled by exploiting the AFP while circulating, and applying
additional BP to compensate for reduced circulation:
Eq. 3-3
In order to avoid taking unwanted fluid influx, commonly referred to as kicks, the
driller will always want to stay above the formation Pore Pressure, pp, while drilling.
However, the pore pressure is not necessarily the lower boundary for the BHP. The
formation wellbore stability pressure is a function of the magnitude and direction of
the maximum horizontal stress, ( ), well orientation in relation to , well
inclination, drilling fluid rheology, formation density, pore pressure, porosity and
permeability, as well as pumping rate, rotary speed and Rate of Penetration (ROP)
(Rehm, et al., 2008). The BHP should always remain above whichever of the pore
pressure and collapse pressure, , is the highest, and below the formation fracture
pressure,
Together, these boundaries constitute the drilling window, depicted in
Figure 3-2. Figure 3-1 shows how backpressure is applied when circulation is halted
to compensate for the lack of AFP loss. When circulating, the backpressure is dialed
back.

11
Figure 3-1: Constant Bottom-Hole Pressure MPD, Pressure Management (Weatherford
International)
In contrast to Overbalanced Drilling (OBD), MPD techniques commonly facilitates
the use of lower density drilling fluids, and relies on adjusting valves, chokes and
pumps to manipulate the bottom hole pressure. Using MPD techniques means that the
effective borehole pressure can be changed in a matter of seconds without having to
circulate in new mud. Setting contingency casing strings has traditionally been the
solution to most well control situations. Being able to dynamically change the
effective bottom-hole pressure and keeping it close to the pore pressure has the benefit
of enabling the casing points to be set deeper, which may allow the Operator to
eliminate casing strings, reducing the time spent on constructing the well (Rehm, et
al., 2008).
Reactive vs. Proactive MPD
Reactive MPD systems are set up as a contingency to quickly manage unintentional
and unexpected influx and pressure spikes should they arise. The well is otherwise
planned conventionally, using conventional hydraulic programs.
Proactive MPD systems use MPD tools and equipment actively in conjunction with
downhole sensors (where available) throughout the drilling process to manage the
bottom-hole pressure profile. As such, proactive setups are better suited to benefit
from the potential of MPD techniques.

12
Figure 3-2: The drilling window is the area between the fracture pressure and pore
pressure/well-bore stability (Rehm, et al., 2008).

13
3.1 The Managed Pressure Drilling Method
MPD is commonly referred to as being an ad hoc method; fit-for-purpose. Several
techniques using different equipment and methodologies may be applied, each
addressing different drilling-related challenges or hazards. Only one of them;
Constant Bottom Hole Pressure (CBHP) MPD is deemed relevant for this thesis.
Additional information on other techniques may be found in Appendix C. In some
cases, combinations of different techniques may be deployed in several stages during
the construction of a well.
The CBHP MPD technique aims to maintain a constant pressure at a fixed point in the
well by controlling the annular back pressure. Figure 3-3 shows the gradients resulting
from applying backpressure. CBHP is commonly used in order to avoid kicks or
losses in situations where the drilling window is narrow or unknown, but also when
dealing with fluctuating pressure situations and well breathing / ballooning
complications (Mæland, 2013).
Figure 3-3: CBHP MPD: Pressure Gradients (Phade, 2013)

14
3.2 Tools and Equipment
The following chapter provides a general description of the most common types of
tools used in MPD operations. A more comprehensive list of tools can be found in
Appendix C.
3.2.1 Rotating Control Device
The RCD is the heart of all MPD systems. It is designed to maintain a pressure-tight
barrier between the fluid returns and personnel on the rig floor/atmosphere, while
enabling circulation of drilling fluids by utilizing the continuous circulation system,
even while making connections or tripping. The RCD is a rotating packer that uses an
annular seal element or "stripper rubber," which is 1/2" to 7/8" diameter undersize to
the drill pipe and is force fit onto the pipe. In order to maintain a pressure-tight barrier
while tripping, pipe is stripped in or out through a number of lubricated seals. The
methods used to seal the annulus while stripping the pipe varies from system to
system.
The Passive RCD is the most common system in use. Passive RCD systems utilize the
buildup of annular pressure against the rubber element in order to seal the well. A
Weatherford BTR RCD is shown Figure 3-5, and is an example of a passive system.
As the packers or strippers are subjected to wear, they reach the point where they do
not seal tight at low pressures, and must be replaced. The most common mode of
failure for most passive RCD systems is leaks in the seals around the drill pipe or drill
collar at low pressures (Rehm, et al., 2008).
Active RCD (Figure 3-4) systems, or rotating annular preventers, are hydraulically
actuated packers. Instead of utilizing the annular pressures, the active RCD systems
are actuated by hydraulic rams that force the packer element against the spherical
head, where it packs off against the pipe. The active RCD is a more recent invention
and is a bigger and more complex piece of kit than the passive kind. It also requires
more free height above the BOP stack to install (Rehm, et al., 2008).
Figure 3-5 shows the preparation process of a Weatherford BTR RCD. The RCD is
situated at the top of the BOP, on top of the riser and below the tension ring,
suspended by cables. Pipe is run through the RCD as usual prior to activation. When
the RCD is put into operation the pressure seals are mounted in between stands of drill
pipe during a connection and stabbed in, allowing the well to be pressurized. Drill

15
pipe is stripped in through sealing elements from that point onwards1, which enables
the driller to maintain well pressure while running drill pipe.
Figure 3-4: Rotating Annular Preventer - Active RCD (Rehm, et al., 2008)
Using an RCD in a closed loop system will protect rig crew, equipment and
environment from typical Health, Safety and Environment (HSE) hazards. Gas leaks,
corrosive mud systems, shallow gas hazards and unexpected kicks are examples of
such hazards. In a 2010 study at the University of Texas, Austin, researchers
statistically linked RCD use with reducing well control events. They found "consistent
statistical evidence, across a variety of regression models and variable specifications,
that the use of RCDs decreases the incidence of blowouts" (Jablonowski, et al., 2010).
1 Conversation with Henrik Sveinall, Product and Service Line Manager at Secure Drilling Systems,
Weatherford, 28th
of February 2014

16
Figure 3-5: Weatherford Rotating Control Device Sealing process (Weatherford)
3.2.2 Chokes
The chokes used in MPD operations are separate from the well-control chokes. Since
the MPD choke system is under constant use, it is considered prudent to have a
separate, dedicated system for well control, even though the equipment is similar.
Failures are extremely rare; the normal operating failure occurs because of damage to
hydraulic system (Rehm, et al., 2008).
3.2.3 Non-Return Valves
The drill-pipe Non-Return Valve (NRV) is essential to any MPD operation. Wellbore
backpressure may force drilling fluids back up the drill pipe in certain situations,
particularly while making connections. The drilling fluids may contain solids
(cuttings, cavings, etc.) that have the potential of damaging drill string components,
such as the mud motor or MWD assembly. Returning cuttings may blow out the drill
pipe, which may lead to loss of pressure control. The purpose of the NRV is to
prevent flow from returning back up the drillpipe by only allowing flow in one
direction (Rehm, et al., 2008).

17
3.2.4 Down-Hole Annular Valves
Down-hole annular valves are used to control bottom-hole pressure while tripping
(commonly referred to as surge and swab), which can be a challenge using MPD. In
formations with very narrow mud windows, the ECD as a result of pumping while
pulling or running pipe may cause significant changes in the pressure regime, making
control of bottom-hole pressure challenging. By adjusting annular valves to regulate
the flow around the drill string, trips can be managed reducing the exposure to Non-
Productive Time (NPT) issues (Rehm, et al., 2008).
3.2.5 Coriolis Flow Meters
A Coriolis Flow Meter is an advanced piece of equipment designed to measure the
mass of fluid transported past a fixed point per unit of time. While drilling they are
usually used to measure the mass rate of returning drilling fluids, which enables the
driller or Drilling Control System (where applicable) to monitor discrepancies
between flow in and flow out, and thus detect kicks (Rehm, et al., 2008).
3.2.6 Continuous Circulation System
Continuous Circulation Systems (CCS) are designed to maintain flow through the drill
pipe and annulus while simultaneously making connections. The objective of using
such a system is to maintain constant ECD during a time where drilling fluids would
not normally circulate. These systems can be used with regular drill pipe.
While making connections, the upper tool joint is suspended in a pressurized chamber
containing two pipe rams and one blind ram. Pressurized mud circulates through the
CCS via two mud intakes connected directly to the chamber, as well as the flow outlet
connected to the top of the drill pipe. This arrangement allows circulation to be
maintained while making up and breaking connections (National Oilwell Varco).
Maintaining stable circulation while making connections helps avoid the pressure
spikes that occur when circulation is reinitialized, and may thus aid in reducing fluid
invasion and associated formation damage (Mæland, 2013).
3.2.7 Control System
An MPD Control System is designed to process input from sensors and flow meters
and adjust output parameters according to either a hydraulic model, or mass balance
(flow in vs. flow out of the well). Such a system can detect and compensate for even

18
minute pressure changes in the well, for example caused by unexpected fluid influx,
by controlling the backpressure choke manifold and pump system. The control system
can be set up to maintain constant pressure at any point in the well or to follow a well
program, has built-in safety alarms, manual interlocks between activities, and the
ability to reverse or undo steps in the operating procedures. It is self-checking, but it
can be interrupted at any stage, and the activity can be reversed by the operator
(Rehm, et al., 2008).
Figure 3-6 shows a flow chart describing how a Control System is implemented in the
signal chain in a rig-up, exemplified by Weatherford's Microflux Control System.
Examples of read-outs from Microflux with accompanying information can be found
in Figure 3-9.
Rig Pumps
Auxillary Pump
Pressure Sensor
StrokeCounter
Trip Tank
PS
+
Ble
ed O
ff
BOPStack
RCD
Kill
Lin
e
SC
ShakerCentrifuge
Rig Choke Manifold
Microflux Control Manifold
Mud-Gas Separator
Remote Data Aquisition
Figure 3-6: Flow schematic of a Weatherford automatic closed-loop circulating MPD
system. Reproduced from (Hannegan, 2011) to accommodate the format.

19
3.3 Procedures and Practices
Drilling a well using MPD often means going into static underbalance, with the
resulting loss of a well barrier as a consequence. NORSOK D-010 rev. 4 dictates the
formal well barrier requirements and well control action procedures applicable when
drilling under or at balance as well as completion operations, and can be found in
Appendix B.
In hydrocarbon exploration and exploitation, a well barrier is defined as an "envelope
of one or several well barrier elements preventing fluids from flowing unintentionally
from the formation into the wellbore, into another formation or to the external
environment". Furthermore, a Well Barrier Element (WBE) is defined as "a physical
element which in itself does not prevent flow but in combination with other WBE's
forms a well barrier" (Standards Norway (NORSOK), 2013).
In conventional drilling operations, the overbalanced static fluid column constitutes
the most important primary barrier. Under balanced or at balance operations involves
drilling with a static under balanced fluid column, thus negating the aforementioned
barrier. A passive barrier can be understood as a static element in the well that acts as
a safety barrier. Examples of passive barriers include casing, casing cement and the
in-situ formation (see Figure 3-8). The term Active barrier encompass all well
elements that have to be maintained or activated in order to function as a well barrier
element. Examples include BOPs and RCDs. The barrier envelope consists of a
combination of passive and active barriers, which must be carefully accounted for in
order to maintain well control while drilling, and to regain well control if lost. A
typical example of a well barrier schematic during underbalanced or at balance
operations can be seen in Figure 3-8.
Figure 3-7 shows a bowtie chart describing the causes and consequences of fluid
influx into the well. Shallow gas hazards, well kicks, loss of circulation and gas cut
mud are all things to avoid while drilling, as cause hazardous situations. When drilling
in overbalance, the choices are limited; the operator has to account for these
possibilities when planning the well and the crew has to compensate immediately if an
event is detected during drilling. This is usually done by shutting the Blowout
Preventer (BOP) and circulating in heavier mud. Displacing the old mud may take as
much as a day. When drilling at balance, such events are usually easily managed, as
the system detects kicks early, and compensates by adjusting the back pressure. The
well may be brought back under control in a few minutes. Automated control systems
adjust parameters in order to bring the well back under control and the Closed
Loop/RCD configuration enables the system to divert returns to avoid hazards on the

20
drill floor. The Managed Pressure Drilling method has a perfect safety record as of
2011 (Hannegan, 2011).
Figure 3-7: Possible causes and consequences of fluid influx (Weatherford International,
2012)

21
Figure 3-8: Well Barrier Schematic Example, Drilling and Tripping of String in UB Fluid
(Standards Norway (NORSOK), 2013)

22
3.4 Value Added
3.4.1 Downhole Information
Since the well can be connected to sophisticated monitoring systems (Control System,
CCS and flow meters) MPD systems enables the Operator to record significant
amount of information related to the pressure regime and formations being drilled
while drilling. Operational hazards can thus be detected sooner. Figure 3-9 shows a
snapshot of an operation conducted using Weatherford's Microflux Control System.
This is an example of the information feed provided when conducting MPD
operations using the appropriate equipment. The system displays a continuous feed of
flow in/flow out, measured BHP, Stand Pipe Pressure (SPP), ECD and choke
actuation, to name but a few of the quantified parameters. This enables the driller to
detect even minute changes in the pressure regime downhole in real time. These
systems can be used to perform Formation Integrity Tests (FIT) and Leak-Off Tests
(LOT) – which are used to determine the formation fracture gradients – with only a
brief stop of operations2. This reduced uncertainties while drilling, and allows the
driller to drill ahead through formation layers with high uncertainties pertaining to
pore and fracture/collapse pressures (such as reservoirs, both virgin and depleted).
2 Conversation with Henrik Sveinall, Product and Service Line Manager at Secure Drilling Systems,
Weatherford, 14th
of March 2014

23
Figure 3-9: Read-out from a live MPD operation using Weatherford's Microflux Control
System
3.4.2 Drillability
When drilling wells through complex formations in overbalance the tapering (or
telescope) effect is encountered. Conventionally, the diameter of the wellbore is
reduced in the section after a new casing string is set, as the bit has to fit through the
casing in order to drill ahead. Each successive string thus reduces the diameter of the
hole, which may eventually prevent the running of a production liner, if the wellbore
diameter is too narrow. Additionally, it is often necessary to set additional casing
strings, called contingency casing if wellbore instability problems are encountered.
MPD grants increased control over the BHP, and enables Operators to drill with
smaller margins and maintain BHP between pore pressure and fracture gradient
without setting the casing prematurely, enabling casing points to be set deeper. The
same property enables the Operator to drill through narrow mud windows, which is
prevalent in depleted and High Pressure High Temperature (HPHT) reservoirs, to
name two examples. This has the potential to eliminate contingency casing strings and
certain casing strings, allowing the Operator to drill wells that would be undrillable
using conventional techniques. This is exemplified in Figure 3-10; it can be observed
that the well drilled using MPD (right) has smaller casing dimensions than the one
drilled using OBD (left) right up until the high pressure reservoir is penetrated.

24
Figure 3-10: OBD casing program (left) vs. MPD casing program (right) (Montilva, et al.,
2012)
3.4.3 Rate of Penetration
The Chip Hold Down effect is observed when the bit fractures the exposed rock face.
Chip Hold Down refers to the hypothesis concerning the forces holding the cuttings
that have been fractured, broken or shorn off by the drill bit in place. In theory, this
prevents the cuttings from being separated from the formation and circulated out of
the hole with the rest of the solids. This effect can be described physically as a
combination of suction between the chip and formation and pressure differential
between the formation and the rockface at the bottom of the wellbore (pressure
exerted on the chip by the mud column). A reduced pressure differential has the
potential to reduce the forces acting on the cuttings. Thus, MPD has the potential to
improve the transport of cuttings away from the rock face. This may in turn improve
the ROP as the bit can cut through new rock rather than pulverizing old cuttings. An
added benefit is that it reduces the occurrence rate of phenomena like bit balling, and
improves bit life (Showers, et al., 2013).
3.4.4 Stuck Pipe
In drilling operations, the drill string is considered stuck if it cannot be freed from the
wellbore without damaging string or string components, or by exceeding the rig's

25
maximum hook load3. Differential sticking is a common problem while drilling wells
in overbalance and is, for most drilling organizations, the greatest drilling problem
worldwide in terms of time and financial cost (Rafique, 2008). Differential Sticking
typically occurs when high contact forces caused by low reservoir pressures, high well
bore pressures, or both, are exerted over a sufficiently large area of the drill string, as
shown in Figure 3-11. A consequence of using MPD techniques is a reduction in
differential pressures, and may thus reduce the occurrence of differential sticking
issues, or eliminate differential sticking altogether.
Figure 3-11: Differential Sticking (Rehm, et al., 2008)
3.4.5 Near-Wellbore Conditions
Porous formations contain certain amounts of clay. When exposed to water with high
activity, clay particles tend to swell. Water activity, , is a way of quantifying the
intensity of which water associates with certain non-aqueous constituents and solids
(Zumdahl, 2009). In the case of distilled water, . When diluted, the activity
decreases. Thus saline, for example, has a lower chemical activity than pure distilled
water and thus has a lower affinity for bonding with clay molecules.
3 Petrowiki. Stuck Pipe. [Online] [Cited: March 5, 2014.]
http://petrowiki.spe.org/Stuck_pipe.

26
Clay swelling may occur when drilling in overbalance due to mud filtrate invasion if
the mud's salt content is insufficient. Clay swelling causes the permeability of the
exposed rock to drop significantly by blocking the pore throats in the rock. Blockage
of pore throats may also be caused by solid particles that have been forced into the
rock’s pore system. In any case, both can be correlated to the magnitude of
overbalance in the well. This undesired effect is referred to as wellbore damage, and
is usually quantified as a skin factor4. The greater positive skin, the higher the
drawdown5 has to be in order to achieve the same production rate as a comparable
case with no skin or negative skin. This can be seen juxtaposed to the Ideal
Productivity Index ( ), which is commonly quantified by Eq. 3-4 (Dake, 2001):
Eq. 3-4
where
= Initial Pressure in the reservoir
= The pressure in the flowing well
= Pressure drop as a result of formation damage
q = Production Rate
As can be seen in Eq. 3-4, an increase in will reduce the producing flow rate of
a well at constant PI and drawdown ( . Due to limitations in flow metering in
topside facilities, this effect is typically best observed over time, as the production of a
low-productivity well will decrease earlier than a comparable high-productivity well,
maintaining plateau for a shorter period of time. In short, less skin yields greater
producing flow rate potential and higher ultimate recovery (Dake, 2001). Attempts to
mitigate wellbore damage induced while drilling is usually done post-completion by
the means of well stimulation efforts (e.g. acidizing), or as well intervention efforts
executed some time during the lifespan of the well. Such efforts are time consuming,
especially in subsea completed wells, and carry significant additional expenses
(Naterstad, 2013).
Any reduction in the degree of overbalance while drilling may have a positive effect
on inflow performance around the well by reducing the impact of drilling fluids and
drilling fluid solids on the surrounding formation. Some reservoir benefits may thus
be attained using MPD techniques (Ostroot, et al., 2007). Residual reservoir damage is
still likely to reduce production potential compared to similar wells drilled using
4 S=0 indicates no damage, S>0 indicates reduced inflow performance, S<0 indicates improved inflow
performance. 5 Drawdown: Difference between flowing well pressure and formation pore pressure

27
Underbalanced Drilling (UBO). Case studies imply that production improvements
using MPD methods can be as high as twice that of a comparable well drilled using
OBD, yielding additional 5% net revenue (Ostroot, et al., 2007).
3.4.6 Mud properties
Basic to MPD techniques is the ability to apply backpressure to the wellbore system.
As previously mentioned, this has some implications to the properties of the drilling
fluids; most importantly that of lower specific mud weight. Using a mud system with
lower specific mud weight allows the Operator to use less solids mixed with the
drilling fluids while drilling the well.
A common challenge when drilling slanted wells is that of avalanching. Avalanching
can be understood as the collapse of a bed of solids that has settled out of suspension,
which may congest the wellbore and cause stuck pipe incidents when the drill string is
pulled out of the wellbore (Skalle, 2012). This phenomenon is prevalent in medium
angle well sections (~30o to ~65o). Figure 3-12 illustrates the forces acting on the
solids both while stationary and while circulating. The slip velocity of the solids is
determined in part by the shape and density of the cuttings, and in part by the gel
effect, which is a property of non-Newtonian fluids (K&M Technologies, 2011). This
will be explained in further detail later in the thesis.
When applying MPD techniques, the risk of becoming stuck while drilling or tripping
is reduced due to less amounts of settling solids mixed into the drilling fluids, and the
associated reduction in occurrence of avalanching. In addition, there is some potential
for reduced formation damage, since there are less solids available to block the pores
in the reservoir rocks.
Figure 3-12: Cuttings behavior demonstration (K&M Technologies, 2011)

28
3.5 Limitations
3.5.1 Expenditures
While MPD operations carry certain benefits, they also carry additional expenditures.
MPD is not a part of the average rigs' arsenal; the equipment has to be installed when
required. Rigging up MPD equipment may take a few days; normal rig operations
have to be halted in the meantime. In addition, this kind of service is usually provided
by Service Companies, not by the Contractor (which operates the rig and employs and
trains the rig crew), meaning that specially trained crew has to be hired and
transported to the rig. Considering the rig rates shown in Table 12 in Appendix A, the
expenditures associated with rigging up and utilizing MPD equipment and techniques
may run in the millions of USD.
3.5.2 Floaters – Heave during connections
Between stands, during make-up and break-outs of connections, the drill string is
suspended in slips in the rotary table. When drilling from floaters, the drill string will
move up and down with the wave motion, along with the heave of the Mobile
Offshore Drilling Unit (MODU). Pipe movement induces transient pressure in the
wellbore. If the transient pressure increases the BHP, it is referred to as a pressure
surge; if transient pressure reduces the BHP, it is referred to as a pressure swab
(Rehm, et al., 2008). This occurs when running and pulling pipe respectively. Surge
and swab may cause unintended fluid influx, or lost circulation events (Rasmussen, et
al., 2007).
The magnitude of wave-induced surge and swab pressure is determined by several
parameters: fluid properties, fluid gelling properties, geometry of the wellbore and
pipe, velocity of the pipe, compressibility of the drilling fluid and wellbore, fluid
inertia, pipe distance of the bottom of the hole, drill bit and nozzle size, and pipe
elasticity and acceleration of the pipe (Rehm, et al., 2008).
Maintaining a stable BHP under these conditions requires the models and control
systems to account for all of the parameters mentioned above, and more. The pressure
fluctuations must be compensated for by actuation of the topside choke, which
requires precise prediction of magnitude and frequency of said fluctuations.

29
3.6 Summary
Field applications imply that the various MPD techniques have uses beyond that of
navigating through narrow mud windows. There is a significant cost savings potential
as, which is a result of reduced uncertainties and time saved performing certain
activities (Nauduri, et al., 2009):
Being able to more accurately control the pore pressure from the surface may
in many instances eliminate the need to circulate in new mud in order to
change the BHP
Extending casing points may allow the Operator to eliminate casing strings,
saving time tripping, and setting/cementing casing
Improved kick/loss detection and mitigation means less time spent on well
control events. Also, kicks occur less frequently due to reduced differential
pressures
Reduced differential pressures may also reduce the occurrence of certain stuck
pipe incidents
A disadvantage of using this method is that the back pressure is applied evenly over
the entire interval; increasing the BHP by applying additional BP will yield an
equivalent increase in uphole wellbore pressure. The riser pressure rating will restrict
the ability to safely apply backpressure, however. Table 3 shows a summary of some
potential advantages of utilizing CBHP MPD methods, while Table 4 shows a
summary of some potential disadvantages.

30
Table 3: MPD Summary Benefits
Property Potential Benefit Result Comment Cost HSE
Closed Loop
Circuit
Changes in flow
out of the well may
be detected almost
immediately
Reduces uncertainties
Kicks and losses
detected in a matter of
minutes
Contain formation
gas and downhole
liquids
Improve HSE
Less chance of
hazardous fluids
spilling onto rig floor
Perform FIT &
LOT tests while
drilling
Increased knowledge
about pressure
regimes
Less chance of
encountering
hazardous situations
Apply
backpressure
Adjust wellbore
pressure in a
matter of minutes
Reduce time spent on
well control events,
improve HSE
No need to circulate in
new mud
Smaller margins Drill narrow mud
windows
Continuous
Circulation
System
Avoid pressure
surges when
starting circulation,
maintain stable
borehole
conditions when
making
connections
Improve HSE, reduce
likelihood of losing
well
Improved borehole
quality, avoid
formation squeeze,
avoid lost circulation
Drilling closer
to balanced
conditions
(lower
pressure
differential
between
borehole and
formation)
Increase ROP Reduce rig
expenditures
Due to reduced "Chip
Hold Down" forces
Increase bit life
Reduce bit
expenditures and time
spent tripping string
out of hole
Less WOB, less
chance of "bit balling"
occurring, less wear on
bit
Minimize fluid
losses
Reduce mud
expenditures
Less likely to exceed
fracture pressure
during drilling
Reduce occurrence
of loss/kick events
Improve safety and
time spent managing
well control events Due to greater control
of pressure regime and
lower margins
Extend casing
points, set casings
deeper
Reduced number of
casing strings in well
Reduce formation
damage
Improve productivity,
reduce time spent
and/or improve
efficiency of cleanup
operations
A result of reduced
formation water and
particle invasion
Reduce occurrence
of differential
sticking issues
Reduce time spent
working string,
fishing, sidetracking,
and cost of tools left
downhole
Differential forces
acting on the string is
reduced

31
Table 4: MPD Summary Disadvantages
Property Potential
Disadvantages Result Comment
Cost HSE
Additional
Equipment
Needed
Additional rig-up
time required Lost time
Drilling has to be
halted while
equipment is installed
More deck space
required
May cause need for
additional supplies to
be brought in or
bigger rigs
May take up space
otherwise used for
storage of
consumables
Crew needs
training in using
equipment
Time spent training
crew
May cause HSE
concerns if training is
insufficient
Increased
complexity of
operations
Operations require
careful planning
More time spent
preparing for
operations
Apply
Backpressure
Ability to apply
backpressure
limited by riser
Applying sufficient
backpressure may be
challenging in certain
situations
Operations has to be
halted, and MW
increased
Backpressure is
applied evenly
along the wellbore
Increasing the BHP to
manage well control
events at the bottom
of the well may
instigate lost
circulation events
uphole

32
This page intentionally left blank

33
4 Casing & Liner Drilling
4.1 Techniques and Enabling Technologies
The terms Casing Drilling (CD) and Liner Drilling (LD) refer to the practices of
installing regular oil field tubulars while drilling. While drilling, drilling fluid is
circulated through the inside of the casing or inner string and up the annulus between
the casing and well bore. The original purpose of developing these methods was to
eliminate NPT associated with tripping and running of casing and liner. The wells are
drilled with casing replacing drill pipe in the drill string (or replacing the lower
sections of drill pipe in the case of LD), and are drilled and cased at the same time.
CD/LD is often used to drill through depleted reservoirs, poorly consolidated
formations, and weak zones preceding high-pressure zones where loss of circulation is
common, or there is a high probability of becoming stuck. It may be used to drill
entire wells, or individual intervals (Warren, et al., 2004). CD/LD systems come in
different configurations, mainly systems with non-retrievable and retrievable Bottom-
Hole Assemblies (BHA), an overview of which can be found in Table 5.
Non-retrievable BHA systems
Most of the wells drilled using casing or liner is drilled using systems with a non-
retrievable BHA, as they are both cheap and efficient. These systems have bits fixed
directly at the bottom of the drill string along with a float collar and the assembly is
run down hole and cemented in place without a BHA. In some cases, regular drill bits
have simply been welded directly onto the casing string and run downhole in order to
manage trouble zones (Eeck-Olsen, 2012). None of the string components are
retrieved to the surface, and logging is performed using wireline-mounted tools. The
bits are often drillable, so that it is possible to drill new sections through the existing
casing (Strickler, et al., 2005).
Non-retrievable systems require the top drive to rotate the string in order to deliver
power to the bit. If conditions indicate that the top drive may be unable to deliver the
power required to the bit in order to achieve a sufficient ROP, a single-run Positive
Displacement Mud Motor (PDM) may be included in the string, which is cemented
downhole along with the bit. A caveat with using PDMs is that it requires a certain
flow rate in order to stay within optimal parameters to avoid drilling problems such as
stick/slip and bit whirl. Also, PDMs are not drillable, so the advantage of being able to
drill through the shoe and bit is negated. Due to the cost of leaving such tools

34
downhole, Non-Retrievable systems typically have no trajectory control. Figure 4-1
shows simplified, but typical CD and LD systems with non-retrievable BHAs.
Casing String
Drill Pipe
Liner String
Figure 4-1: Casing Drilling and Liner Drilling technology concepts, non-retrievable BHAs
depicted.
Retrievable BHA systems
Components commonly included in directional drilling BHAs such as MWD/LWD
and Rotary Steerable Systems (RSS) represent a significant expenditure if lost. Due to
the cost incurred by leaving such tools downhole, systems with retrievable BHAs is
the only practical solution for drilling directional wells using CD/LD (Warren, et al.,
2004).
The configuration of Retrievable CD/LD systems differ from manufacturer to
manufacturer. They all have in common that a small diameter pilot string carrying the
BHA is run as an extension of the casing, providing trajectory control and logging
capabilities (if applicable). An underreamer (see Appendix D for supplementary
information) is mounted at the end of the casing/liner string to expand the hole in
order to run the liner. Some companies, such as Tesco, commonly use a wireline

35
retrievable system to retrieve the pilot string. Others, like Baker Hughes, run an inner
string through the entire casing/liner string. The latter may be considered more
dependable, as it may be easier to retrieve the pilot string if it becomes stuck6, but it
also carries additional weight, which is disadvantageous to wellbore-string friction
and torque7, especially in deviated wells. Common to both technologies is the use of a
Drill-lock Assembly (DLA), shown in Figure 4-2. A DLA is a pilot-string mounted
tool that is used to maintain a pressure-tight seal between the liner or casing string and
pilot string BHA. Before retrieving the BHA, the locks are actuated by a ball-drop and
released, freeing up the pilot string to be pulled out of the wellbore (Warren, et al.,
2005). This particular tool is designed by Tesco for use with wireline-retrievable
BHA-systems, thus the design may differ when used with an inner string.
Figure 4-2: Drill-lock Assembly (Warren, et al., 2005)
6 Wireline have a limited tensile strength, limiting the pulling capacity (Naterstad, 2013)
7 Conversation with Jafar Abdollahi, 25
th of April 2014

36
Table 5: An illustration of the different Casing/Liner Drilling systems
Casing Liner Casing Liner Liner
Non-Retrievable Systems
Surface Rotation Required (Top Drive) Surface Rotation (Top Drive) + Mud Motor
Retrievable Systems
N/A Bent Housing and RSS on pilot string
Wireline OnlyFull BHA capabilities on pilot string: RSS, Mud Motors, MWD,
LWD
BHA retrievable via Wireline
Inner String (BHA) detachable and
retrievable
Wireline or Drill Pipe
Means of retrieving BHA
N/A N/AWireline or Drill
Pipe
Directional capabilitiesFormation Evaluation

37
4.2 Procedures and Practices
When installing a liner, it is typically set with an overlap of 100m from the start of the
liner to the end of the last casing string8 in order to ensure a god seal. Liner
centralizers are run along the string in order to maintain annular clearance along the
liner. Insufficient clearance between the borehole wall and liner may have
consequences on the integrity of the following cementing job.
Minor modifications to the rig may be necessary in order to drill sections using liner
or casing. The top drive especially may be a point of concern; casing or liner strings
requires more power to rotate due to the increased diameter, and may thus require
installation of a top drive able to deliver more power (Warren, et al., 2004).
The pressure regime in fluid bearing zones may be unpredictable, and so to avoid
fluid losses or influx, it is standard practice to set a casing point a few meters prior to
penetrating the reservoir (see Figure 4-3). The mud weight must be chosen so that the
ECD falls within both the upper and the lower boundary. As seen in Figure 4-3, this
may cause the ECD to exceed the fracture pressure limit of the reservoir. Drilling with
liner or casing allows the driller to penetrate the reservoir without having to set the
casing above the producing zone9. A significant benefit of being able to safely
penetrate the reservoir without setting a casing point right above it is that it reduces
the uncertainties pertaining to the pore pressure regime in the reservoir. This is
exemplified in Figure 4-4; the previous casing point is set inside the reservoir.
8 Conversation with Jafar Abdollahi, 31st of January, 2014
9 Conversation with Jafar Abdollahi, 16
th of May, 2014
38
Figure 4-3: Previous interval drilled conventionally – Previous casing point set above
reservoir
Figure 4-4: Previous interval drilled with CD/LD – Previous casing point set in reservoir

39
4.3 Benefits
4.3.1 Efficiency
Central to the CD/LD concept is the fact that the string (and thus the casing/liner) is
always at the bottom during drilling, and every foot drilled is a foot gained in well
length. If the string becomes stuck, and attempts to release it are unsuccessful, the
inner string is pulled out (if the BHA is of the retrievable kind) before the casing/liner
is cemented in place. Once the cement is set, the driller may continue drilling ahead
according to the drilling program, though it may be necessary to use expandable
tubulars or contingencies in order to reach TD. Using CD/LD will thus reduce the
occurrence of incidents that may lead to the loss of the wellbore, and time consuming
sidetracks.
The same property reduces the amount of time spent tripping; when drilling with a
conventional drill string, the drill string has to be retrieved before the liner string is
run downhole and cemented in place. The time saved tripping increases with the
length of the well. Flat Time will increase somewhat where retrievable BHAs are
used, as the inner string has to be pulled out of the hole before cementing the liner is
place (Carlsen, et al., 2000).
Drilling occurs in an inherently harsh environment; during drilling, a conventional
drill string has a tendency to move erratically and vibrate violently. This occurs in part
due to the freedom of motion inherent to running a small pipe in a big hole, and in
part due to elasticity of the drill string which may cause stick/slip and rock removal-
related vibrations. As was mentioned in Chapter 2.2, equipment related trips are a
source of Flat Time, and equipment related damage often occurs as a direct result of
BHA vibrations (Mancini, et al., 2009). Liner and casing string are stiffer than
conventional drill pipe, which allows the drill string to move in a smooth continuous
motion while drilling. This reduces shocks, string vibrations and stick slip, and may
thus improve the Mean Time Between Failure (MTBF) and reduce the associated
equipment related trips and Flat Time.
4.3.2 Smear Effect
Chapter 3.4.5 describes how the permeability of the near-wellbore formation may be
negatively affected by water invasion. Since one of the consequences of using CD/LD
is a smaller annular flow area, the flow velocities are higher than conventionally
drilled wells at comparable flow. As will be explained later on, this may lead to
significantly higher AFP and a higher pressure differential if the flow rates are not
carefully controlled. It may thus be natural to assume that CD/LD may lead to greater

40
formation damage. Findings indicate that the opposite may be true in the case of
CD/LD; that using such techniques has a positive effect on formation damage
(Karimi, et al., 2011). The smear effect, or plastering effect, is an observed
phenomenon believed to affect boreholes being drilled with a narrow annular clearing.
It is believed that the wellbore wall is continuously troweled by the rotating casing or
liner, and that cuttings are crushed and smeared into fractures and pore spaces in the
borehole wall. This is illustrated in Figure 4-6. This may under certain conditions
create a high quality impermeable filter cake, and may serve to improve the stability
of the wellbore by strengthening the formation. The smear effect is also believed to
cure lost circulation scenarios and reduce formation damage (Moellendick, et al.,
2011).
A B C
Figure 4-5: The casing is being forced against the wellbore while drilling in A. B shows the
mud being forced into the formation along with pulverized cuttings, while C illustrates how
filter cake and cuttings are plastered against the wellbore wall, sealing the porous formation
(Karimi, et al., 2011).
This effect is not sufficiently documented, but circumstantial evidence such as a
reduction in cuttings returns when drilling with liner or casing suggests there is some
truth to the hypothesis. It is thought that the combined forces of high annular velocity
and pipe rotation creates an environment especially suitable for grinding and smearing
of cuttings into the formation, and that "The Plastering Effect" enables stress caging to
occur when the cuttings seal the fractures in the near wellbore formation wall.
Additional evidence for this effect has been found by taking sidewall core samples
that confirms that cuttings and filter cake has been pushed into the formation
(Moellendick, et al., 2011).

41
Figure 4-6: The rotating casing string smears cuttings into the formation, "plastering" the
wellbore (Schlumberger LTD.)
4.3.3 Wellbore Stability
Casing and liner drilling offer several unique aspects that may help mitigate wellbore
stability issues. Since the casing/liner is always at TD during drilling, the amount of
time spent tripping is reduced, and every foot drilled is a foot gained in well length. It
is generally accepted that most wellbore stability and stuck pipe issues arise during
tripping.
One of the most common issues while drilling is swab and surge pressure fluctuations
which can lead to well control incidents or lost circulation. The inability to circulate
the well from the bottom while tripping is another challenge, and can result in cuttings
settlement or stuck pipe while tripping in the BHA. Elimination of tripping leaves no
chance to instigate such issues. Moreover, by definition, there would be no need for
wash and ream procedures after reaching TD and before running casing (Moellendick,
et al., 2011).
Another beneficial aspect of CD/LD is that the openhole time is significantly reduced,
and there is no mechanical load on weak formations after the casing/liner has been
cemented in place. As the wellbore is cased off, reactive formations spend less time

42
exposed to aqueous fluids, which is another facet of the technology that aids in
improving wellbore stability; less time exposed to reactive shales leads to less issues
related to formation squeeze (Dokhani, et al., 2013).
The inherent stiffness of the casing/liner string means that the string moves in a
smooth, continuous motion while drilling compared to a string made up of
conventional drill pipe. The result is a less tortuous wellbore, with a reduced risk of
key-seating and stuck pipe incidents occurring as a result of mechanical friction
(Pritchard, 2010). The drill pipe and underreamer configuration of retrievable systems
add to this effect, generating a wellbore with a more circular profile. A geometric
comparison may be seen in Figure 4-7 (Moellendick, et al., 2011).
The smear effect discussed in the previous chapter has another interesting property;
that of stress caging. When the solid particles are troweled into the formation, they
may help strengthening the porous formation around the wellbore, and small fissures
and fractures may be sealed. This has the potential to increase the fracture strength of
the formation, increasing wellbore stability (Moellendick, et al., 2011).
Figure 4-7: Drilling with Casing/Liner (right) creates gauged wells (Moellendick, et al.,
2011)
4.3.4 Wellbore Cleaning
Removing cuttings from a well is mainly a matter of maintaining sufficiently high
flow rates to counteract the vertical slipping of cuttings in vertical sections, and to
counteract settling of solids in horizontal sections (Skalle, 2012).

43
In vertical sections, the flow rate and fluid parameters are the most important
parameters affecting wellbore cleaning. Maintaining a high enough flow rate ensures
that the axial fluid velocity is greater than the slip velocity of the solids. Slip velocity
is a measure of the minimum velocity needed to lift the solid particle upwards, and is
determined by the geometry of the solids and the fluid properties. In short, the goal is
to ensure that a sufficient amount of energy is transferred from the flowing drilling
fluid to the solid particles, to prevent a buildup of a cuttings bed (Skalle, 2012).
In horizontal sections, the importance of slip velocity is significantly reduced. The
amount of vertical travel is limited to a few inches compared to potentially thousands
of meters in vertical sections. Thus it becomes more important to make sure the solids
are "kicked up" from the solids bed that is bound to accumulate at the lower end of the
wellbore. As will be explained in the next section, proper cleaning of horizontal
sections is largely dependent on drill string RPM in addition to flow velocity, and to a
lesser degree, fluid properties (Skalle, 2012).
Drilling with a large diameter casing or liner results in a smaller annular flow area
between the string and wellbore. As can be seen in Eq. 4-1 the annular flow area,
, is directly correlated to the difference of the squares of the outer and inner
diameter of the well bore:
(
)
Eq. 4-1
Furthermore, the flow velocity, , is determined by the relationship between
the flow rate and annular flow area, as seen in Eq. 4-2:
Eq. 4-2
Thus, the flow velocity will be significantly higher in sections drilled using large
diameter casing or liner compared to regular drill string, provided that the flow rates
are comparable.
Pipe-to-Hole Area Ratio (PHAR) is a measure of the relative size of the pipe in
relation to the wellbore. This parameter is often used in order to determine the
appropriate pump rate and drill string RPM needed for achieving sufficient wellbore
cleaning in medium (~35o- ~60o) and high inclination wells (>60o) (K&M
Technologies, 2011).
PHAR is calculated using Eq. 4-3:
Eq. 4-3
Rh refers to the radius of the wellbore, and Rp refers to the radius of the pipe.

44
The hypothesis states that there is a relationship between the PHAR, the pump rate, as
well as drill string rotation required to maintain sufficient wellbore cleaning. Less drill
string rotation is required in order to maintain a viscous coupling, and thus good hole
cleaning, when drilling with a low PHAR, such as is the case when drilling with
casing or liner.
Figure 4-8 illustrates the rather limited effect pipe rotation alone has on the cuttings
bed, while Figure 4-9 illustrates the added effect of the viscous coupling. The green
color represents zones with low velocity flow, while the red color represents a zone of
high velocity flow.
The PHAR ratio of wells drilled using CD/LD systems will necessarily be lower than
a comparable conventionally drilled well. The fluid velocities will also be high around
the intervals of the strings exposed to the formation. Thus it is reasonable to assume
that wellbore cleaning in these intervals will be better than would be the case if the
well is drilled conventionally. Cleaning will still be a concern in the well sections
where the difference between the string diameter and well diameter is the greatest,
which is in the upper sections.
Figure 4-8: The effect of pipe rotation alone on the cuttings bed

45
Figure 4-9: The effect of the viscous couple on the cuttings bed
4.3.5 Drilling with Losses
Due to the small annular flow area, cuttings transport and ECD may be maintained
while circulating with a significantly lower flow rate compared to a conventional
drilling. This, combined with the Smear Effect, may provide a significant benefit
when drilling through high-loss formations, such as vugs, caverns and big fractures
where losses cannot be cured. Lower flow rates helps losing less mud, as well as
controlling ECD to better regulate the pressure differential between the string and the
formation.
The result is a significant improvement to HSE compared to conventional drilling, as
excessive fluid losses may bring the well into severe underbalance, which may lead to
loss of the well, kicks or blowouts. It is also beneficial with regards to Flat Time;
drilling is usually halted until the losses are cured. This may not be necessary when
drilling with liner or casing (Karimi, et al., 2011).

46
4.4 Limitations
4.4.1 Torque, Drag and Friction
Radius
Force
Radius
Torque
Figure 4-10: Torque Vector diagram
Torque and drag are very often limiting factors in Extended Reach Drilling (ERD).
Some of the parameters that have influence on the torque are (Thingbø, 2011):
The length of the drill string
The weight of the string
The radial and axial velocity
The well deviation
The friction factor
The increased diameter of liner and casing strings compared to conventional drill pipe
means that more torque is required in order to rotate the string as well as increased
drag forces acting on the string.
The Plastering Effect typically reduces the risk of getting stuck due to differential
sticking, lost circulation scenarios and formation collapse when using CD/LD. But
there is an additional risk of getting stuck while drilling with liner and casing due to
wall-to-wall friction and the inherent stiffness of the string; sensitivity to Dog-leg
Severity (DLS) is higher than with a conventional drill string. While it is possible to

47
achieve very high DLS10 with conventional drill strings, DLS exceeding 3.5o/30m
should be avoided11 when running casing and liner. It is assumed that the same
restrictions apply when drilling with liner and casing in order to limit wear and to
reduce downhole friction. Wellbore friction related stuck pipe issues may be reduced
by limiting wellbore tortuosity12, running casing/liner stabilization systems on the drill
string and by utilizing designer mud systems (Carlsen, et al., 2000).
Performing torque and drag calculations falls outside the scope of this thesis.
4.4.2 Cementing
Cement typically has higher viscosity and gel strength than conventional drilling
muds. The narrow annulus associated with CD/LD causes greater ECD while
cementing, which may lead to formation fracturing, causing cement losses and a
resulting insufficient cement job. This may also lead to loss of well control and
kick/loss cycles. Formation of micro-annuli due to cement channeling is a risk, as this
provides a flow path for hydrocarbons, resulting in the loss of a primary barrier. In
order to reduce the risk of channeling issues and formation of micro annuli, the casing
or liner string has to be fitted with centralizers, which helps with maintaining annular
clearance in deviated sections. On the upside, the reduced annular volume will lead to
reduced cementing costs (Carlsen, et al., 2000).
When running casing or liner conventionally a float valve is installed towards the end
of the string, which is designed to only allow flow in one direction. The purpose is to
prevent cement from flowing back into the string. Such devices may also be installed
in the string when using non-retrievable BHA CD/LD systems. When using
retrievable BHA systems, however, the valves have to be run downhole on a wireline,
coiled tubing or drill pipe after the inner string has been pulled out of the hole. This
has the potential to make cementing non-retrievable systems more time consuming.
4.4.3 String Elongation and Vibrations
Mud motors stalling cause an increase in fluid pressure on the inside of the drill string.
Because the diameter of casing and liner piping is much greater than drill pipe, they
tend to elongate more with increasing internal pressure. Drill string elongations
increases the compressive forces acting on the bit since the string is fixed at the top.
The increase in compressive forces acting on the bit increases the torque required to
10 Schlumberger's Archer High Build Rotary System is capable of achieving DLS of 18
o/30m
(Schlumberger LTD., 2014). 11
Conversation with Jafar Abdollahi, 25th
of April, 2014. 12
Reduced wellbore tortuosity is a property inherent to liner and casing drilling systems

48
rotate the bit, which increases the pressure drop across the motor, which further
increases the Weight on Bit (WOB). This effect has a tendency to cause additional
vibrations, and thus damage to downhole equipment (Strickler, et al., 2005).
4.4.4 ROP
The chip hold-down effect was mentioned when discussing MPD methods. The
increased AFP and ECD associated with CD/LD will increase the pressure acting on
the bottom hole, which may have a negative effect on ROP, and increase bit wear and
bit balling issues.
4.4.5 Stuck Pipe
The increased diameter of the casing or liner leads to additional torque and friction, as
has been stated earlier. A result of this fact is an increase in surface contact area
between the casing/liner and the formation, which, in turn, leads to an increase in the
forces acting on said area. Depending on the differential pressure between the
wellbore and formation, this may lead to an increase in differential sticking issues.
With that being said, the smear effect may counteract this to some extent.
There are factors involved when using CD/LD which may both alleviate and
aggravate causes of stuck pipe incidents. In sum, it would seem that the risk of
becoming differentially stuck, or stuck due to friction, is greater than when using
conventional methods.
4.4.6 Surge & Swab
Using CD/LD methods eliminates surge and swab concerns while tripping. Surge and
swab fluctuations can be much more of an issue while drilling, however. The string is
forced to move along with the MODU when the string is suspended in the slips, and
the string is still exposed to open formations in this situation; the reduced annular flow
area will increase the magnitude of the fluctuations caused by heave induced axial
string movement.

49
4.5 Health, Safety & Environment
Sufficient evidence exists to say that these technologies prevent fluid losses to some
extent. However, CD and LD are preventative measures. If the formation has already
fractured, the smear effect may alleviate fluid losses by sealing up already existing
fractures, but so far the phenomenon is too unpredictable for CD/LD to be used to
“repair” fractured wells.
When performing casing drilling, the ability to shear the string and seal the BOP when
encountering kicks may be a concern. Conventionally, BOPs are not suitable for
shearing casing tubulars. This is not a concern while using LD, at least not after the
liner string has passed the shear rams. Potential hazards should be identified prior to
running casing and liner strings.
As has been stated previously, tripping takes place in a sealed-off wellbore, and most
well control incidents takes place while tripping. Therefore, it is reasonable to assume
that using CD/LD has the potential to alleviate certain HSE concerns, especially when
drilling through formations in which fluid losses are expected, such as poorly
consolidated sandstone formations.

50
4.6 Summary
Summaries of important potential benefits with regards to HSE and cost, and some
potential disadvantages involved with using CD/LD systems can be seen in Table 6
and Table 7, respectively.
Table 6: CD/LD Summary Benefits
Property Potential Benefit Result Comment Cost HSE
Increased drill
string
diameter
Narrow annular
clearance
Higher flow
velocities
May be able to
increase BHP while
uphole pressure
remains unaffected
Improved cleaning
Casing/lining
hole while
drilling
Casing/liner
always at TD
Keep every foot
drilled Can drill until stuck
Eliminate tripping
in casing/liner
Little chance of well
control issues while
tripping
Eliminate surge/swab
during tripping
Time saved tripping
Limits exposure of
formation to drilling
fluids
Reduce wellbore
stability issues
Smear Effect
High quality mud
cake
Plastering
Reduced fluid losses Less chance of
kick/loss cycles
Increased formation
strength
Less chance of well
collapse
Increased
string stiffness
Reduces wellbore
tortuosity
Improves wellbore
quality
May also reduce stuck
pipe issues
Reduces string
vibrations
Improve equipment
life

51
Table 7: CD/LD Summary Disadvantages
Property Potential
Disadvantages Result Comment
Cost HSE
Increased Drill
String
Diameter
Narrow Annular
Clearance
Higher Flow
Velocities
Increased AFP, may
cause BHP to exceed
fracture pressure
Increased chip hold-
down forces –
Reduced ROP
Increased abrasive
effects on formation,
may cause washouts
Increased wear and
abrasion on
casing/liner
Reduced life
expectancy
Cementing issues
May cause cement
channeling and
forming of micro-
annuli
Surge and swab when
drilling from floaters
May be a problem
during drilling due to
axial string movement
Will increase torque
and drag
May lead to more
stuck pipe incidents
May require some
modifications to
rig equipment
Equipment must be
modified and
certified
Mounting sensors
on string
problematic
Getting along-string
data is a challenge
outside the BHA
Increased torque &
drag
Additional stuck pipe
challenges
May be necessary to
increase size of top
drive
Limits length of drilled
interval
Increased string
elongation
May cause stick/slip
issues
May result in damaged
downhole equipment

52
This page intentionally left blank

53
5 Supporting Technologies
5.1 Wired Drill Pipe
Conventionally, communication between the tools in a drill string and the facilities /
personnel situated topside is exchanged using Mud Pulse Telemetry (MPT). MPT subs
are mounted in the drill strings, and uses valves to modulate the flowing drilling
fluids, transmitting information by generating pressure pulses that may be detected
topside.
It is a fact that the industry is drilling ever deeper and moving into deeper waters in
the pursuit of promising prospects. As the need for downhole information has
increased along with this development, the following limitations of the MPT
technology have been identified:
Data transfer capacity of ~20 bits per second (bps) under optimal
conditions
Signal deteriorates as the length of the well increases (National Oilwell
Varco)
Signal transfer speed is limited by pressure wave propagation velocity
The integrity of the signal is dependent on continuity and circulation of
the mud column. Signal continuity is compromised when the pumps are
shut off, when the well is taking significant amounts of gas influx, and
in situations where the well is taking significant mud losses
The mud pulser may limit the use of Lost Circulation Material (LCM),
due to risk of clogging
The most commonly used Wired Drill Pipe technology, known as the IntelliServ
Broadband Networked Drillstring (shown in Appendix Figure 1 in Appendix C),
incorporates an integrated armored signal transfer circuit. The cable passes through
drilled holes in the connections, and ends in inductive coils that enable the signal to
pass from one joint to the next. These coils come into close contact with each other
when connections are made. The inductive nature of the coils means that they don't
have be in direct contact; insulating materials does not prevent the signal from being
passed from on coil to another. In spite of this, loss of signal strength will occur as the
signal passes over many joints of pipe. Therefore, battery-powered booster subs are
deployed every ~1500ft. These booster subs (also referred to as network nodes or
links) also provides connection points for Along-String Measurements (ASM). The
54
drill pipe is connected to the BHA tools by the means of an Interface Sub, enabling 2-
way communications between the BHA and topside facilities. The drillstring is
connected to surface servers via a data swivel housed in the top drive (Edwards, et al.,
2013).
WDP mitigates several of the shortcomings identified in relation to conventional
MPT:
Transfer capacity can be significantly higher : ~56kbps for the first
generation of NOV's IntelliServ system, while the second generation
has been reported to be able to sustain transfer rates of > 2Mbps
(National Oilwell Varco)
Signal transfer is near instantaneous (Hernandez, et al., 2010)
Signal is not subject to significant deterioration; signal integrity remains
independent of the continuity and circulation of the mud column
(National Oilwell Varco)
Some of the benefits of Wired Drill Pipes are inherent to the wired pipe system in
itself. Many, however, are specific to the MWD/LWD tools being used, and may vary
from one provider to the next (Edwards, et al., 2013):
The directional driller is able to control the trajectory of the well in real
time (National Oilwell Varco)
Engineers sitting in an Integrated Operations Center can monitor the
formation, mud and drilling parameters in real-time using networked
MWD/LWD tools, improving real-time understanding of the formation,
providing valuable data about production zones, downhole navigation
and well placement (Hernandez, et al., 2010)
Enables high-resolution annular pressure measurements, even in the
absence of flow, allowing for accurate ECD management and
Surge/Swab monitoring during tripping (Hernandez, et al., 2010)
Kicks and lost circulation events may be detected even in the absence of
flow (Hernandez, et al., 2010)
Well control events may be detected much earlier, allowing potentially
hazardous situations (such as shallow gas and water) to be mitigated in
a matter of minutes (Hernandez, et al., 2010)
Bottom-hole telemetry can be transmitted and received while the mud
pumps are turned off and in situations where severe mud losses are
encountered (Hernandez, et al., 2010)
Information is downloaded in real time, eliminating the need for return
trips to retrieve data (Hernandez, et al., 2010)

55
Real-time surveying help reduce the "cone of uncertainty", and allows
for more accurate well placement (less than one minute compared to six
minutes using MPT (National Oilwell Varco))
Improve ROP by accurate pressure measurements (Hernandez, et al.,
2010)
Less chance of plugging tools as the mudpulser may be eliminated
(National Oilwell Varco)
Enables data transmission even while drilling in nitrogen aerated mud
(CBM) (National Oilwell Varco)
May indirectly improve cost efficiency by reducing mud losses
(National Oilwell Varco)
Ability to monitor downhole tool status (bit gauge, wear status, etc.)
(Hernandez, et al., 2010)
If or when such systems are standardized for drilling operations, the need for down-
hole processing power and data storage may be significantly reduced (since
information can be sent topside for processing in a much more efficient manner), thus
yielding a potential reduction in tool cost and increase in reliability. (National Oilwell
Varco). In addition, WDP is considered suitable for through string operations, such as
through string logging (both gravity and tractor-driven), and ball/wiper/dart drops
(National Oilwell Varco).
Raw data access
Since the data transfer capacity using MPT is very limited, data recorded downhole
from logging tools are usually processed, compressed and stored in the tools before
being transferred topside in intermittent data bursts or retrieved from storage once the
tool is pulled out of the wellbore. This requires a certain amount of processing power
and storage (depending on the tool in question), adding to the complexity of the tools,
which may also affect reliability of the components in question. Using WDP enables
continuous exchange of raw data, which reduces the need for downhole processing
power and storage. Benefits include, but are not limited to:
Reduced tool cost
Less time spent running wireline
Less time spent tripping due to tool failure
Downhole imaging may help detecting wellbore stability problems in
real time
Higher test sampling rate (Edwards, et al., 2013)
Utilizing wired drill pipes also opens up for improved vibrations monitoring.
Excessive drill string vibrations are well known for damaging complex and expensive
drill string tools, such as MWD/LWD subs. Basic components such as drill pipes and

56
drill bits are also at risk of damage due to uncontrolled string vibrations. In addition,
string vibrations reduce the mechanical efficiency of the drill bit, as mechanical
energy is transformed into vibrations, "stealing" energy from the drill bit. This
phenomenon is known as vibrational founder. Thus, monitoring string vibrations can
yield greater operational efficiency in the form of improved ROP in addition to
improving bit life, as it enables the driller to adjust WOB and RPM of the drill string
accordingly (Hernandez, et al., 2010).
Measurements While Drilling / Logging While Drilling
Modern MWD/LWD methods enable drillers and engineers/physicists to procure
information continuously while drilling by running some of the most advanced and
expensive tools of the industry in the drilling string. Conventionally, the information
is sent topside via MPT. As previously mentioned, however, the data transfer capacity
of this system has its limitations, so the tools are also equipped with data storage
capacities, so that the data can be analyzed when tools are brought to the surface.
Using networked pipe with LWD/MWD tools may thus increase the amount of
information available at any point in time.

57
5.2 Along-String Measurements & Seismics While Drilling
Using networked pipe allows for distributing pressure and torque sensors, commonly
referred to as Along-String Measurements, as well as Seismics While Drilling (SWD)
sensors along the drill string. Such systems allow continuous monitoring of the
torque/drag situation in the wellbore and drill string, as well as ECD and kick (size
and migration) status. This in turn enables the identification and mitigation of well
control events before they reach critical mass, opens up the possibility of recording
one-way seismics, and transmitting the information topside. (Hernandez, et al., 2010)
Pressure and torque information can be used to avoid stick/slip, twist-offs and string
buckling while drilling, and can be used to accurately track kicks as they move up the
well. Potential advantages include less operational problems/expenses such as
downtime due to fishing, lost equipment and sidetracking. Accurate ECD monitoring
is especially useful when drilling slim hole, ERD wells and wells with a narrow mud
window to name a few applications. SWD can be used to evaluate the geology (rock
strength, consolidation, geomechanical stability, etc.) of the formations surrounding
the drill string as the well is drilled, increasing the crews' operational knowledge
about the downhole conditions. (Hernandez, et al., 2010)

58
5.3 Concept Study: Liner Drilling with Expandable Systems
Conventional drilling operations start with a borehole with a wide diameter which
becomes progressively narrower with depth. This happens due to the tapering effect
described in Chapter 3.4.2. The ideal is to drill monobore wells, where the well is
drilled with a constant diameter from top to bottom. Drilling with a constant diameter
(ideally around 9 ½" due ROP optimization concerns) may yield the cost saving
benefits shown in Table 8:
Table 8: Cost saving benefits of drilling monobore wells
Property Cost Saving Benefit
Reduced need for tools of different sizes Reduction in tool cost
Fewer concentric casing strings
Reduced casing expenditures
Allows reduction in size of BOP and drilling
riser
Less deck space needed for storage Reduced amounts of consumables needed
(fluids, casing, cement, etc.)
Smaller rigs
Less rock have to be removed in order to drill
the well
Less time spent drilling
Higher average ROP
Reduced need for cleaning and disposal of
cuttings
Increased diameter of the producing interval Increased production rates
Less steel left downhole Faster and less complicated Plugging and
Abandonment
Expandable tubulars is a well-established technology which enables drillers to get one
step further towards the ultimate goal of drilling monobore wells. Special deformable
tubes are run downhole, cemented and expanded to the previous casing strings inner
diameter using mechanical and hydraulic power while the cement is still setting.
Unlike conventional casing and liner, expandables allow drilling monobore diameter
wells.
Eq. 5-1 shows the relationship between producing oil flow rate, well radius and
pressure (Golan, et al., 1996). As can be observed, any increase in well diameter
would yield a positive impact on production rate:
( )
Eq. 5-1
In order to illustrate the benefits of maintaining the wellbore diameter in producing
intervals, Eq. 5-1 will be used to evaluate the increase in productivity potential
resulting from increasing well diameter by Eq. 5-2:

59
(
⁄ )
(
⁄ ) Eq. 5-2
A drainage radius of 400m was arbitrarily chosen. The results can be found in Table
9. As can be seen, the increase in flow rate potential may be substantial.
Table 9: Comparison of production potential as a function of wellbore diameter
Production Potential
5 in. vs 7 in. 5 in. vs 9 5/8 in. 7 in. vs 9 5/8 in.
re 400 m re 400 m re 400 m
rw,1 5 in rw,1 5 in rw,1 7 in
rw,2 7 in rw,2 9.625 in rw,2 9.625 in
qo,2/qo,1 1.042528396
qo,2/qo,1 1.086251
qo,2/qo,1 1.041939
q 4.25 % q 8.63 % q 4.19 %
Replacing the casing or liner while performing CD/LD with expandable tubulars may
be a step towards the goal of drilling monobore wells. The potential advantages of
such a system, Expandable Tubular Drilling (ETD), are numerous, some of which are
listed in Table 8. Paired with the inherent advantages associated with CD/LD which
are listed in Chapter 4, this may constitute a powerful tool to use in certain situations
(Kumar, et al., 2010).
A useful application of such a system would be as contingency tubular. Figure 5-1
shows a situation where LD has been used to penetrate a reservoir. At a point, a
formation hazard has caused the string to become stuck. When drilling using
conventional LD systems (left, Figure 5-1), the driller has the choice to drill ahead
with a smaller liner, reducing the producing well diameter. Alternatively, the well
may be drilled ahead using conventional drill pipe and reamers. After the well is
drilled, expandable tubulars may be installed and expanded. Utilizing ETD in such a
situation (right, Figure 5-1), instead of the aforementioned alternatives, is likely to
enable the driller to drill ahead while avoiding tapering of the wellbore, saving rig
time in the process.
Using ETD would not be without its challenges, however. The metals used in
expandable tubulars are softer and more flexible than conventional tubulars in order to
avoid tensile failure during expansion. The fact that the annular clearance is a lot
narrower when using liner or casing in place of drill pipe leads to several hydraulic
and mechanical challenges. These properties may lead to an increase in wear and
fatigue on the tubulars, which in turn may lead to pipe failure and complications
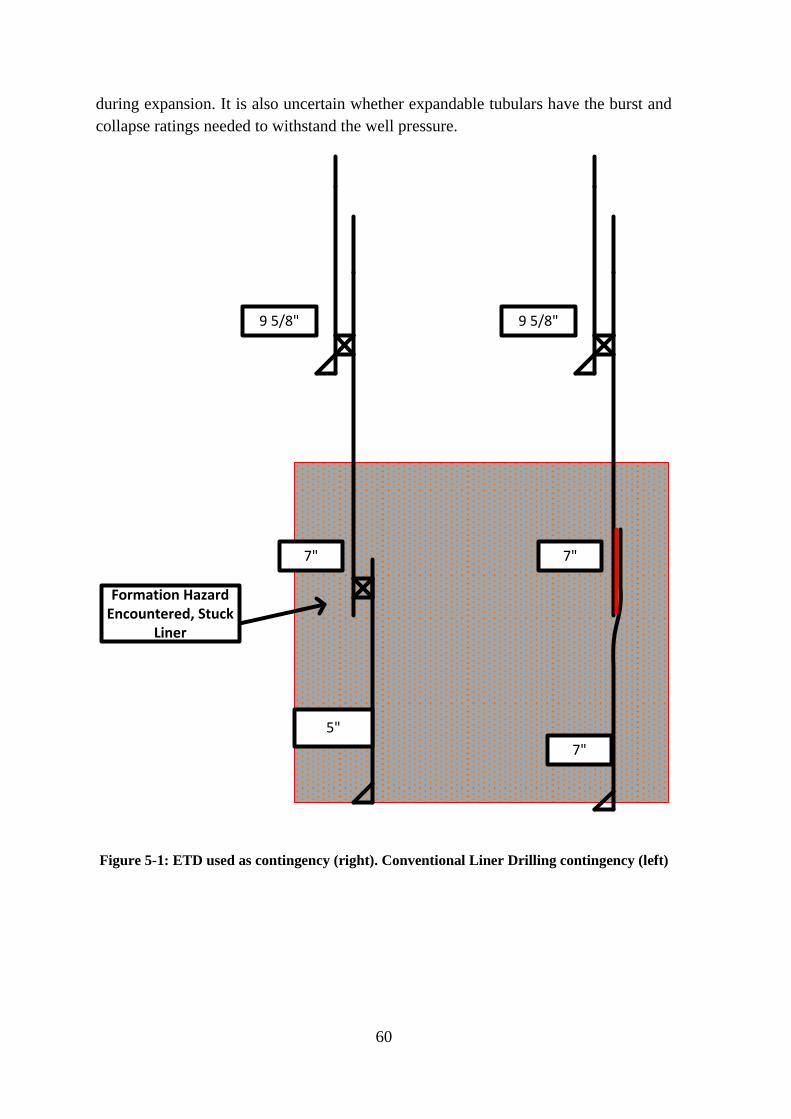
60
during expansion. It is also uncertain whether expandable tubulars have the burst and
collapse ratings needed to withstand the well pressure.
9 5/8"
7"
5"
9 5/8"
7"
7"
Formation Hazard Encountered, Stuck
Liner
Figure 5-1: ETD used as contingency (right). Conventional Liner Drilling contingency (left)

61
5.3.1 Expansion Methods
Expandable tubulars are usually mechanically expanded either top-down or bottoms-
up, with either a fixed-cone expansion tool or rolling cone expansion tool.
5.3.1.1 Fixed-Cone Expansion
When a fixed-cone expansion tool is used, the tool is mounted at the bottom of the
tubular string, expanding the string bottoms-up. The force required is typically
generated through hydraulic pressure behind the swage, sometimes supplemented by
tension in the string (Innes, et al., 2004)). The top of most expandable liner strings is
sealed against the base casing using expandable hanger joints with several elastomer
seals, and tapered towards the end. After expansion, the expansion cone folds together
and is pulled out of the hole. When drilling ahead, the shoe joint and aluminum
transition nose is drilled. During expansion, propagation forces expanding 13 3/8 in.
casing can approach 300,000lbs. The casing is typically expanded one stand at a time.
Fixed-cone expansion normally leads to a 4% reduction in tubular string length
(Gusevik, et al., 2002), and the wall thickness is reduced by 4-7% (Innes, et al., 2004).
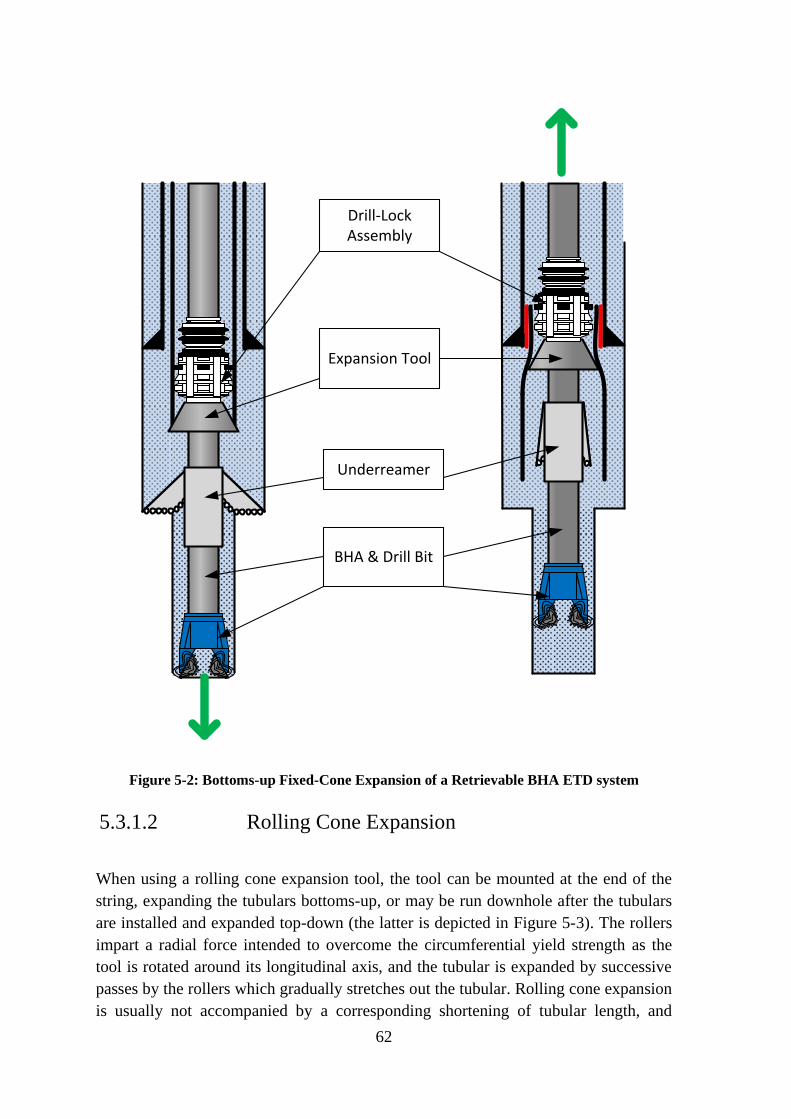
62
Drill-Lock Assembly
Expansion Tool
Underreamer
BHA & Drill Bit
Figure 5-2: Bottoms-up Fixed-Cone Expansion of a Retrievable BHA ETD system
5.3.1.2 Rolling Cone Expansion
When using a rolling cone expansion tool, the tool can be mounted at the end of the
string, expanding the tubulars bottoms-up, or may be run downhole after the tubulars
are installed and expanded top-down (the latter is depicted in Figure 5-3). The rollers
impart a radial force intended to overcome the circumferential yield strength as the
tool is rotated around its longitudinal axis, and the tubular is expanded by successive
passes by the rollers which gradually stretches out the tubular. Rolling cone expansion
is usually not accompanied by a corresponding shortening of tubular length, and

63
allows for tubular expansion with relatively low axial loads; axial loads typically
amount to 20% of equivalent fixed cone swage based expansions (Innes, et al., 2004).
The energy needed to expand the tubulars may be provided by the top drive, or by a
PDM, provided that the expansion tool is seated below the PDM in the BHA.
5.3.2 String Configuration
5.3.2.1 Non-retrievable BHA systems
When utilizing non-retrievable BHA CD/LD systems, the bit is fixed at the end of the
string along with the shoe. Bottom-up expansion could be executed using both fixed-
cone and rolling cone expansion tools. In that case, a drill string would have to be run
in hole and latched onto the expansion tool, and the drill bit assembly would have to
be disconnected before expansion is initiated. Alternatively, it might be plausible for
expansion to work by utilizing an e-line13 and an electrically powered jacking tool
latched onto the expansion tool in order to provide the axial force required. It is
uncertain whether tools capable of performing such a function exist today, or if the
equipment used is able to deliver sufficient power downhole.
Top-down expansion could be executed in much the same manner as bottoms-up
expansion, albeit with a rolling cone expansion tool. This method would look much
the same as expansion of conventional expandable tubulars look today.
5.3.2.2 Retrievable BHA systems
Expanding retrievable BHA expandable tubulars systems poses another set of
challenges. Some retrievable BHA systems have an underreamer fitted in the BHA
intended to expand the hole drilled by the pilot string. This method seems the most
preferable, due to the apparent lack of tubular contraction, and the energy required to
expand the tubulars.
When drilling with expandable tubulars, the hole must be reamed to a size
accommodating the expansion, while at the same time leaving enough room for a
proper cement job. This may cause a problem if no underreamers are available
capable of sufficient hole expansion. Examples of two typical dimensions of
expandable tubing and the associated wellbore expansion ratios needed are displayed
in Table 10. As is seen, these values far surpass those of available underreamers on
the market per 2012 (see Table 16 in Appendix D).
13 Wireline with an incorporated electrical conduit

64
Un
de
r-re
am
er
The underreamer is
deactivated, and the string is pulled back
The expansion tool is activated, and expands the
liner in steps while the string is run downhole
Underreamer
Drill-Lock Assembly
Expansion Tool
BHA & Drill Bit
Figure 5-3: Top-down Rolling Cone Expansion of a Retrievable BHA ETD system
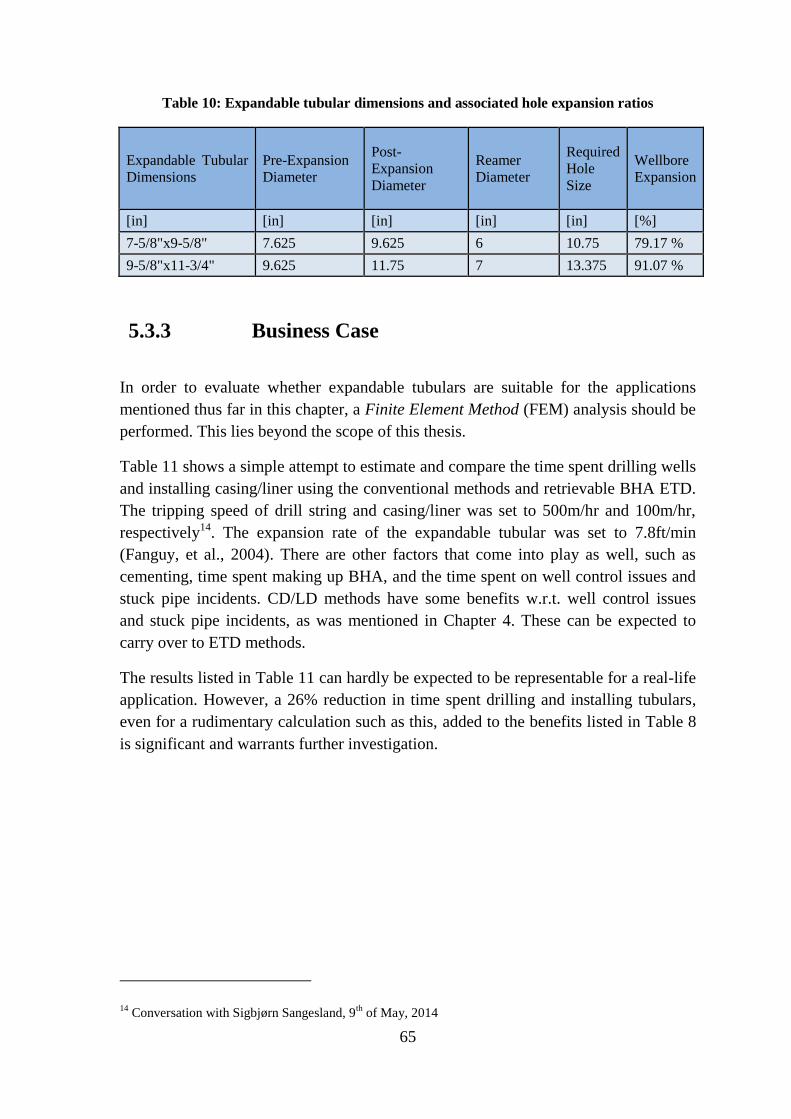
65
Table 10: Expandable tubular dimensions and associated hole expansion ratios
Expandable Tubular
Dimensions
Pre-Expansion
Diameter
Post-
Expansion
Diameter
Reamer
Diameter
Required
Hole
Size
Wellbore
Expansion
[in] [in] [in] [in] [in] [%]
7-5/8"x9-5/8" 7.625 9.625 6 10.75 79.17 %
9-5/8"x11-3/4" 9.625 11.75 7 13.375 91.07 %
5.3.3 Business Case
In order to evaluate whether expandable tubulars are suitable for the applications
mentioned thus far in this chapter, a Finite Element Method (FEM) analysis should be
performed. This lies beyond the scope of this thesis.
Table 11 shows a simple attempt to estimate and compare the time spent drilling wells
and installing casing/liner using the conventional methods and retrievable BHA ETD.
The tripping speed of drill string and casing/liner was set to 500m/hr and 100m/hr,
respectively14. The expansion rate of the expandable tubular was set to 7.8ft/min
(Fanguy, et al., 2004). There are other factors that come into play as well, such as
cementing, time spent making up BHA, and the time spent on well control issues and
stuck pipe incidents. CD/LD methods have some benefits w.r.t. well control issues
and stuck pipe incidents, as was mentioned in Chapter 4. These can be expected to
carry over to ETD methods.
The results listed in Table 11 can hardly be expected to be representable for a real-life
application. However, a 26% reduction in time spent drilling and installing tubulars,
even for a rudimentary calculation such as this, added to the benefits listed in Table 8
is significant and warrants further investigation.
14 Conversation with Sigbjørn Sangesland, 9
th of May, 2014

66
Table 11: Time to drill comparison between conventional methods and expandable liner
drilling
ROP 20 m/hr Expansion Rate 142.6464 m/hr Drill pipe tripping speed 500 m/hr Casing/Liner tripping speed 100 m/hr Length of interval 1000 m Length of well 3000 m
Conventional ETD
Time spent drilling 50 50 hrs
Time spent tripping drill pipe 6 6 hrs
Time spent tripping liner 30 0 hrs
Time spent expanding liner 0 7.010341656 hrs
Sum 86 63.01034166 hrs
5.3.4 Discussion
There seems to be a definite economic potential to using ETD. Initial evaluation
suggests that using a retrievable BHA mounted rolling cone expansion tool to expand
the tubular from the top down may be the most practical solution. The mechanics
involved in engaging, disengaging and retracting a BHA mounted rolling cone
expansion tool may be simpler and more reliable than a fixed cone expansion tool. In
addition, no hydraulic pressure is required behind the swage for force the tool
upwards, as the forces required to expand the tubulars are generated by flowing
drilling fluids much in the same manner as when using PDMs. Over a 1000m interval,
a 4% contraction would mean that the length of the tubulars is reduced by 40m. This
could mean the difference between setting the tubular shoe inside a reservoir, or
setting it above.

67
6 Theoretical Background
6.1 Drilling Hydraulics
During drilling operations, drilling fluids are pumped downhole from the rig and
circulated through the borehole. Drilling fluids play a major role in modern drilling
operations. The most important functions of drilling fluids are to serve as the primary
barrier during conventional drilling operations, and to remove cuttings from the well.
In addition, the drilling fluids help lubricate and cool the drill bit and BHA, as well as
conveying information between topside facilities and BHA via conventional MPT
systems.
Drilling fluids usually consist of an oil, - or water-base, with weight material and
other additives mixed in (Skalle, 2012).
6.1.1 Bottom Hole Pressure
When the pumps are shut down, the well is said to be under static conditions. True
stationary conditions can only be found in a lab, however, as the drilling fluids are
always subject to transient effects, even after the pumps are shut down and the fluids
have stopped circulating:
Solids settle over time
Temperature gradients affect the fluids and the formation
The properties of fluids and fluid additives may change due to temperature,
pressure, acidity and chemical reactions with downhole materials
These effects may all have an impact on the downhole conditions, and ultimately, the
BHP and pressure distribution along the wellbore. While they are worth discussing,
simplifications have to be made in order to make approximations and predictions.
Therefore, the following assumptions have been made:
Cuttings concentration remain constant after the pumps are shut down
Cuttings are evenly distributed in the well, even under static conditions
Fluid properties remain constant
The pressure loss resulting from transporting cuttings out of the well is
negligible

68
6.1.1.1 Static Conditions
Under static conditions, the BHP is defined by the height and density of the fluid
column (hydrostatic pressure), as shown in Eq. 6-1:
Eq. 6-1
Where: = drilling fluid density, g=acceleration due to gravity pull, and D= vertical
depth of the well.
Drilling successfully depends on transporting solids away from the borehole. The
fluid contains a certain amount of solids at any time, quantified by the parameter cp,0,
which is defined by Eq. 6-2:
Eq. 6-2
A well that has been at static conditions for a prolonged period of time will in practice
have cp,0 = 0, as the solids suspended in the fluid may have settled depending on the
rheology of the fluid and the geometry and density of the cuttings. The combined
density of mud and solids, , may be expressed by Eq. 6-3:
( ) Eq. 6-3
Substituting from Eq. 6-3 for into Eq. 6-1 yields Eq. 6-4:
( ( ) ) Eq. 6-4
6.1.1.2 Dynamic Conditions
The magnitude of the Annular Friction Pressure Loss depends on several parameters,
such as borehole geometry, flow regime and fluid characteristics, pipe rotation and
drillstring dynamics.
Hydraulic friction should be estimated as accurately as possible in order to (Thingbø,
2011):
Determine the right bit nozzle size in order to optimize ROP
Optimize cuttings transport to the surface
Determine the proper pump size
Estimate the annular pressure losses in order to stay within the mud window
Detect unforeseen changes in SPP due to change in the hydraulic circuit
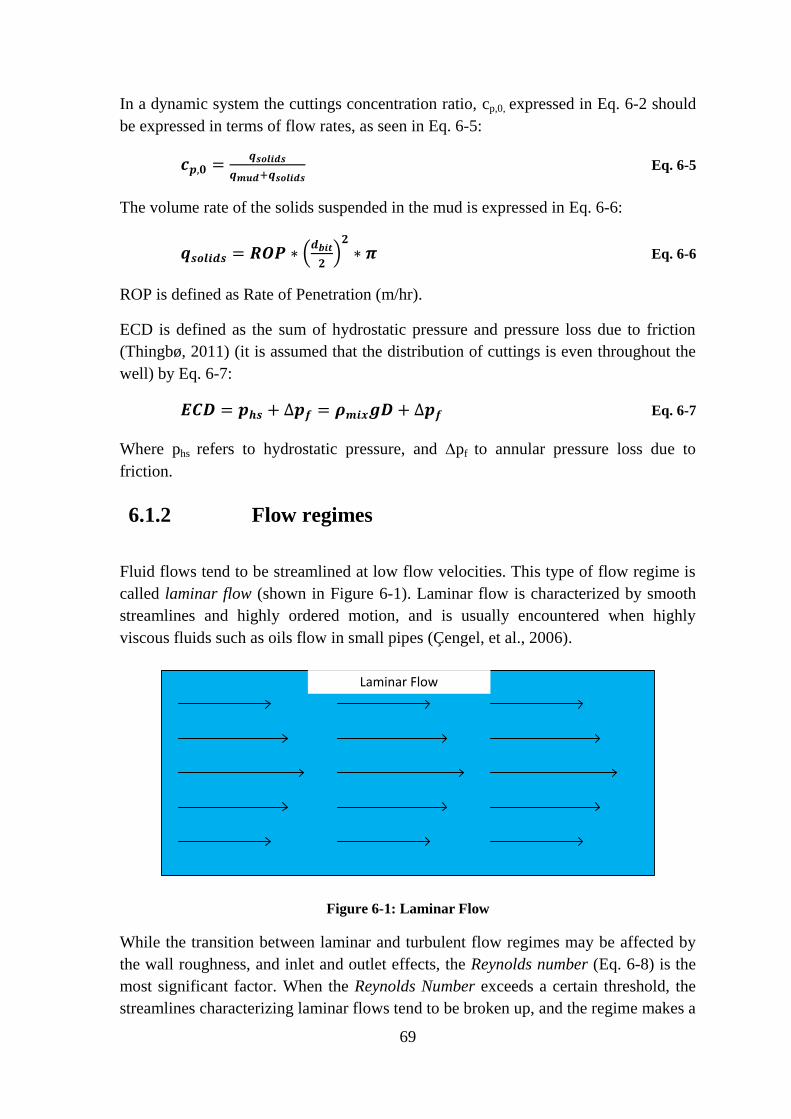
69
In a dynamic system the cuttings concentration ratio, cp,0, expressed in Eq. 6-2 should
be expressed in terms of flow rates, as seen in Eq. 6-5:
Eq. 6-5
The volume rate of the solids suspended in the mud is expressed in Eq. 6-6:
(
)
Eq. 6-6
ROP is defined as Rate of Penetration (m/hr).
ECD is defined as the sum of hydrostatic pressure and pressure loss due to friction
(Thingbø, 2011) (it is assumed that the distribution of cuttings is even throughout the
well) by Eq. 6-7:
Eq. 6-7
Where phs refers to hydrostatic pressure, and pf to annular pressure loss due to
friction.
6.1.2 Flow regimes
Fluid flows tend to be streamlined at low flow velocities. This type of flow regime is
called laminar flow (shown in Figure 6-1). Laminar flow is characterized by smooth
streamlines and highly ordered motion, and is usually encountered when highly
viscous fluids such as oils flow in small pipes (Çengel, et al., 2006).
Laminar Flow
Figure 6-1: Laminar Flow
While the transition between laminar and turbulent flow regimes may be affected by
the wall roughness, and inlet and outlet effects, the Reynolds number (Eq. 6-8) is the
most significant factor. When the Reynolds Number exceeds a certain threshold, the
streamlines characterizing laminar flows tend to be broken up, and the regime makes a

70
transition over to turbulent flow (Figure 6-2). Turbulent flows are characterized by
local velocity fluctuations and highly disordered motion. The transition from laminar
flow to turbulent flow does not happen suddenly. Rather, regions in the flow tend to
fluctuate between laminar and turbulent flows, before it becomes a fully developed
turbulent flow. Most flows may in practice be described as turbulent (Çengel, et al.,
2006).
Fluid flows are usually characterized as laminar for and fully turbulent
for . The interval covering is called transitional
flow, and is characterized by switching flow regimes. The transitional area will not be
covered further in this thesis; fluids will be characterized as either laminar or
turbulent (Bourgoyne, 1986).
The Reynolds Number is expressed for internal flow in a circular pipe by Eq. 6-8
(Çengel, et al., 2006):
Eq. 6-8
Where [
] [
],
[ ] [ ]
Turbulent Flow
Figure 6-2: Turbulent Flow
6.1.3 Rheological Models
Fluid characteristics have to be determined in order to be able to estimate pressure
losses in flows. Viscosity is a measure of a fluids resistance to flow (Çengel, et al.,
2006), and is expressed using the symbol (unit Pa*s) for dynamic viscosity, and
⁄ (unit
⁄ for kinematic viscosity. Viscosity plays an important role for
pressure losses and wellbore cleaning. A mathematical description of the viscous
forces of a fluid is called a rheological model (Thingbø, 2011).

71
Shear rate, ⁄ (unit ) expresses the "intensity of shearing action in the
pipe, or change of velocity between fluid layers across the flow path (Skalle, 2012)".
The rheological model used to describe a given fluid will usually have a significant
impact on the calculated behavior of said fluid, as depicted in Figure 6-3.
6.1.3.1 Newtonian Fluids
Newtonian fluids are characterized by having a linearly proportional relationship
between sheer stress and rate of deformation (Çengel, et al., 2006), and is the simplest
model used in drilling engineering. Shear stress for the Newtonian Model is defined
by Eq. 6-9 (Skalle, 2012):
Eq. 6-9
Due to the linear relationship between sheer stress and rate of deformation, the
viscosity may be expressed by Eq. 6-10 (Skalle, 2012):
Eq. 6-10
The shear rate for pipe flow is expressed by Eq. 6-11 (Skalle, 2012):
Eq. 6-11
And the corresponding shear rate for annular flow by Eq. 6-12 (Skalle, 2012):
Eq. 6-12
6.1.3.2 Non-Newtonian Fluids
The Newtonian fluid model is suitable for simple fluids like water. Most drilling
fluids, however, are too complex to be characterized by a single value for viscosity.
Such fluids does not usually exhibit a linear relationship between shear stress and
shear rate, and are called Non-Newtonian fluids. They may be divided further into
categories, depending on how the viscosity is affected by shear rate and how it
changes over time at constant shear rates:
The viscosity of shear-thinning, or pseudoplastic fluids decrease with increasing shear
rate, while that of shear-thickening, or dilatant fluids increase. The viscosity of
thixotropic fluids decrease over time at constant shear rates, while that of rheopectic
fluids increase.

72
For most cases it is satisfactory not to account for the thixotropic or rheopectic
behavior exhibited by drilling fluids, though significant errors may arise in systems
with numerous changes in flow direction and diameter. Most drilling fluids exhibit
typical non-Newtonian behavior (Bourgoyne, 1986). Drilling fluids are typically
pseudoplastic and thixotropic in nature (Skalle, 2012).
Bingham Plastic model
The Bingham Plastic rheological model is used to approximate the pseudoplastic
behavior of fluids, and is defined by Eq. 6-13 (Bourgoyne, 1986):
Eq. 6-13
A Bingham Plastic fluid will not flow until the shear stress, , exceeds a certain
threshold, namely the yield stress, . When , the change in shear stress is
proportional to the change in shear rate (shown in Figure 6-3). This proportionality
constant is called plastic viscosity, (Thingbø, 2011), and is defined by Eq. 6-14
(Skalle, 2012):
Eq. 6-14
The effective viscosity for pipe flow is defined in Eq. 6-15 (Skalle, 2012):
Eq. 6-15
The corresponding effective viscosity for annular flow is defined in Eq. 6-16 (Skalle,
2012):
Eq. 6-16
The shear rate for pipe flow is expressed by Eq. 6-17 (Skalle, 2012):
Eq. 6-17
And the corresponding shear rate for annular flow by Eq. 6-18 (Skalle, 2012):
Eq. 6-18

73
Power-Law Model
The Power-Law Model is another tool available to approximate the pseudoplastic
behavior of fluids. In contrast to the Bingham Plastic model, it does not account for
yield stress, but utilizes the flow behavior index and flow consistency index to
describe flow behavior (Bourgoyne, 1986). The Power-Law model is defined by Eq.
6-19 (Skalle, 2012):
| | Eq. 6-19
The Power-Law Model is dependent on the flow consistency index, K, and the flow-
behavior index, n. The latter is given by Eq. 6-20 (Lapeyrouse, 2002):
Eq. 6-20
represents a dilatant fluid, a Newtonian fluid, and a
pseudoplastic fluid. , used to calculate n (Eq. 6-20) and K (Eq. 6-21), refers to the
viscometer dial readings, at i RPM.
The flow consistency index, K, is defined by Eq. 6-21 (Bourgoyne, 1986):
Eq. 6-21
If and viscometer dial readings are unknown, they may be obtained from
the plastic viscosity and yield point as follows (Lapeyrouse, 2002):
Eq. 6-22
Eq. 6-23
The effective viscosity for pipe flow may be found by Eq. 6-24 (Skalle, 2012):
(
)
Eq. 6-24
The corresponding effective viscosity for annular flow may be found by Eq. 6-25
(Skalle, 2012):
(
)
Eq. 6-25
The shear rate for pipe flow is expressed by Eq. 6-26 (Skalle, 2012):
Eq. 6-26

74
And the corresponding shear rate for annular flow by Eq. 6-27 (Skalle, 2012):
Eq. 6-27
Herschel-Bulkley Model
The last of the popular Non-Newtonian Models is the Herschel-Bulkley Model, also
known as the Yield Power Law model. It is defined by Eq. 6-28 and combines the
Bingham Plastic and the Power Law models. The model rests on the assumptions that
the fluid is incompressible, and that the rheological parameters vs. pressure and
temperature are constant.
| | Eq. 6-28
Many drilling fluids with additives behave according to Herschel-Bulkley Model, and
it is widely utilized in the Oil & gas industry to model the hydraulics of drilling fluid.
However, the iterative methods used are too complex to be included in this thesis, and
will thus not be discussed in further detail.
Figure 6-3: The flow curves of four different rheological models of four different fluid
samples (Skalle, 2012)

75
6.1.3.3 Other Effects
Gel Effects
When circulation in the wellbore is halted, i.e. when the pumps are shut off, the
drilling fluids have a tendency to settle, and establish a gelled structure. This is very
much a time-dependent behavior. When the circulation is reinitialized, the gel
structure has to be broken up by applying shear stress. This results in spikes in the
BHP as the pumps go on-line, or the string is moved up or down in order to break up
the gel structure. The magnitude of the gelling effect varies from fluid to fluid; it is
often desirable for operators to add additives to the mud that will accelerate the
gelling effect, since gelling delays solid settling, and may thus be a benefit w.r.t.
wellbore cleaning (Skalle, 2012). This may be particularly beneficial in wells with
long deviated sections with angle < 600, to prevent avalanching. However, since the
calculations presented in the case study are based on the assumption that the fluids are
constantly circulating, the gel effect will be ignored.
Temperature Fluctuations
It is assumed that the impact of temperature over time on the results is negligible. This
is a simplification; liquid viscosity and yield stress of fluids, pressure wave
propagation velocity, fluid state and density are all factors that are dependent on
temperature (Stiff, 1970). Also, the additives may be affected, altering the fluids
properties as a fluid is exposed to high temperatures over time. Quantifying the impact
temperature fluctuations may have on this system lies beyond the scope of this thesis.
Pipe Eccentricity
It may be assumed that pressure drop due to friction in annular flow may, at least in
part, be correlated to the area exposed to flow and the geometry of the flow area.
While drilling, the position of the casing/liner will vary between the extreme positions
(examples shown in Figure 6-4) and anywhere in between depending on well
geometry, well trajectory, and drill string composition. Thus, the pressure profile of a
wellbore annulus will be affected by the eccentricity of the inner pipe. Properly
modelling the steady state wellbore hydraulics using the tools available for
conventional calculations is a challenge, and borders on the insurmountable if
transient conditions are taken into account. It is possible to simulate this behavior to
some degree of accuracy using Computational Fluid Dynamics (CFD) (Dokhani, et
al., 2013). Performing this kind of CFD simulations is beyond the scope of this thesis,

76
however, and it will be assumed that the drill string and all of its components is
perfectly centralized in the annulus.
Figure 6-4: Eccentricity of inner pipe exemplified
Singularity Losses
As fluids flow over valves, bends, tees, tool joints, sudden expansions and
contractions in the flow area, small pressure losses will accumulate. These kinds of
minor losses, commonly referred to as singularity losses, are determined
experimentally, and are largely dependent on geometry. Singularity losses over tool
joints have been included in the calculations performed for the case studies presented
in Chapter 7, using Eq. 6-29, Eq. 6-30 and Eq. 6-31 (Skalle, 2012):
Eq. 6-29
where
Eq. 6-30
and
(
)
Eq. 6-31
Calculating singularity losses along the entire well to any degree of accuracy is a
challenge that requires advanced tools like CFD to handle. The losses that are
predictable are assumed to be fairly minor, and are mainly related to constrictions and
expansions of the flow area where the diameter of the drill string changes.
Uncertainties include cave outs, washouts, variations in wellbore diameter due to
smoothness, and changes in wellbore trajectory due to tortuosity, to mention a few
examples. Therefore, aside from the pressure losses related to tool joints, calculations
on singularity losses will not be discussed or quantified in further detail.
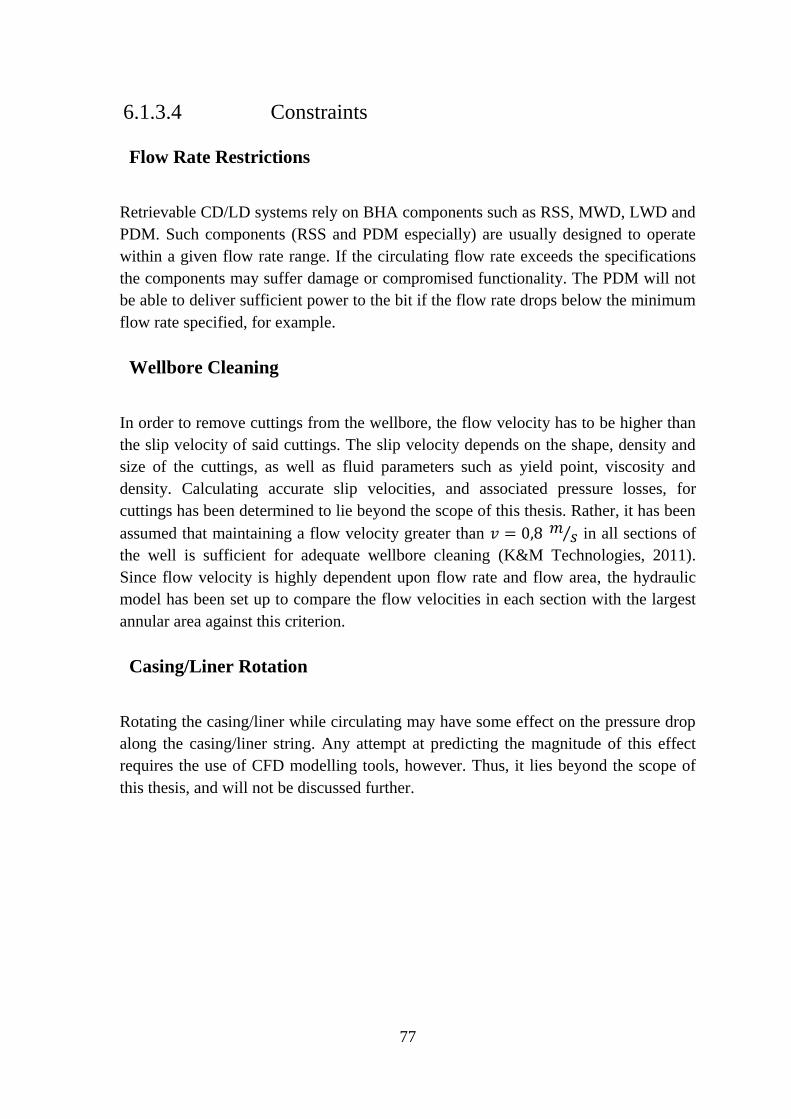
77
6.1.3.4 Constraints
Flow Rate Restrictions
Retrievable CD/LD systems rely on BHA components such as RSS, MWD, LWD and
PDM. Such components (RSS and PDM especially) are usually designed to operate
within a given flow rate range. If the circulating flow rate exceeds the specifications
the components may suffer damage or compromised functionality. The PDM will not
be able to deliver sufficient power to the bit if the flow rate drops below the minimum
flow rate specified, for example.
Wellbore Cleaning
In order to remove cuttings from the wellbore, the flow velocity has to be higher than
the slip velocity of said cuttings. The slip velocity depends on the shape, density and
size of the cuttings, as well as fluid parameters such as yield point, viscosity and
density. Calculating accurate slip velocities, and associated pressure losses, for
cuttings has been determined to lie beyond the scope of this thesis. Rather, it has been
assumed that maintaining a flow velocity greater than ⁄ in all sections of
the well is sufficient for adequate wellbore cleaning (K&M Technologies, 2011).
Since flow velocity is highly dependent upon flow rate and flow area, the hydraulic
model has been set up to compare the flow velocities in each section with the largest
annular area against this criterion.
Casing/Liner Rotation
Rotating the casing/liner while circulating may have some effect on the pressure drop
along the casing/liner string. Any attempt at predicting the magnitude of this effect
requires the use of CFD modelling tools, however. Thus, it lies beyond the scope of
this thesis, and will not be discussed further.

78
6.1.4 Pressure Loss Equations
6.1.4.1 Laminar Flow
The following subchapter will describe the pressure losses, , in pipe and annular
flow for different types of fluids. These equations have been used to estimate the
pressure losses that will occur during drilling with liner and casing, and demonstrate
the advantages of combining these technologies with MPD in order to navigate
through narrow mud windows.
The pressure losses for laminar pipe flows with Newtonian fluids, Bingham fluids and
Power Law fluids are defined in Eq. 6-32, Eq. 6-33 and Eq. 6-34 (Skalle, 2012):
Eq. 6-32
Eq. 6-33
(
)
Eq. 6-34
Annular flows are more challenging to model than pipe flows due to the more
complex flow areas (see Figure 6-5).
Flow in between two concentric pipes can be treated either as flow in true concentric
pipes, or in a simplified manner, as flow between two parallel plates. For narrow
annuli the deviation between true and parallel flow is highest, and here the losses may
become a large portion of total loss, significant errors are introduced (Skalle, 2012).
Other than a brief discussion on the significance of pipe eccentricity, the matter of
flow area geometry in annular flows lies beyond the scope of this thesis, and will not
be discussed in further detail. Equations for pressure loss estimation in annular flows
for the respective fluid models are available in Eq. 6-35, Eq. 6-36 and Eq. 6-37
(Skalle, 2012).
Eq. 6-35
Eq. 6-36
(
)
Eq. 6-37

79
v(d)
di
do
d
v(d)
Figure 6-5: Annular Fluid Flow
6.1.4.2 Turbulent Flow
Eq. 6-38, Eq. 6-39 and Eq. 6-40 describes turbulent fluid behavior for Newtonian,
Bingham Plastic and Power Law fluids, respectively (Skalle, 2012):
Eq. 6-38
Eq. 6-39
Eq. 6-40
In order to calculate the pressure loss for Power Law fluids, some additional
parameters are needed, namely (Eq. 6-41) and (Eq. 6-42). The hydraulic
diameter, , is expressed by equation Eq. 6-43.
Eq. 6-41
Eq. 6-42
Eq. 6-43

80
6.2 Rock Mechanics
Fracture Pressure
In order to account for the reduced pore pressure associated with depletion, certain
correlations have been included in this thesis in order to estimate the changes to the
drilling window.
Eq. 6-44 describes the relationship between the major horizontal stress, ,
, and
depletion (Fjær, et al., 2008):
Eq. 6-44
In this case, certain approximations have to be made, due to an incomplete dataset.
The parameter is called the Biot coefficient (Eq. 6-45) (Fjær, et al., 2008).
Eq. 6-45
In unconsolidated or weak rocks, is close to 1 (Fjær, et al., 2008).
is an elastic parameter, known as Poisson's ratio. It is a measure of lateral expansion
relative to longitudinal contraction (Eq. 6-46):
Eq. 6-46
y and x signifies elongation in the y and x-direction, respectively. For sandstones in
general, the Poisson ratio is assumed to be ~0.3 (Fjær, et al., 2008). This will largely
determine how the formation strength is affected by depletion, and a high Poisson
Ratio may extend the mud window significantly.
will be calculated using the aforementioned formulae in order to account for
depletion.
It is believed that the aforementioned Plastering Effect will serve to strengthen the
borehole to some extent, thus extending the drilling window. This phenomenon is well
documented through field observations and in core samples retrieved from wells
drilled using CD/LD (Moellendick, et al., 2011). While conducting research for this
thesis, no sources have been found that has made any attempt to quantify the
magnitude of this effect. Thus, no assumptions have been made in this regard.

81
6.3 Well Trajectory
Calculating the well trajectory is necessary in order to determine the horizontal and
vertical deviation of the well, and the resulting length of the well. This is used in order
to determine the pressure losses occurring both as a result of gravity and friction. The
Minimum Curvature Method (model shown in Figure 6-6) is the most common
method used in the industry, and is the one used in calculating the trajectory of the
well in question. The minimum curvature method is based on the assumption that the
wellpath can be approximated using two asymptotic straight line segments. A ratio
factor has to be applied in order to correct for bending between two stations of the
wellpath (NTNU Course TPG4185, 2012).
Figure 6-6: The minimum curvature model (Insert citation)
The Dog Leg-Angle, denoted , describes the change in inclination between two
stations, and is calculated by Eq. 6-47 (NTNU Course TPG4185, 2012):
Eq. 6-47
Where = angle at the start of a build-up section
= angle at the end of a build-up section

82
= azimuth at the start of a build-up section
= azimuth at the end of a build-up section
For the calculations performed in the case study, the azimuths and will always
be assumed to be zero, indicating that the directional sections of the well will all be
drilled in the same compass direction. Eq. 6-47 will not actually be used in the
calculations presented in the case study, as the well is plotted using the angle as a
criteria for calculating well trajectories. Rather, the DLS will be used to calculate the
length of the build-up section between two stations, L, by Eq. 6-48. This may then be
used together with Eq. 6-49 to find the radius of the build section (NTNU Course
TPG4185, 2012).
Eq. 6-48
Eq. 6-49
The ratio factor, F, is calculated using Eq. 6-50:
(
) (
) Eq. 6-50
Eq. 6-51 is used to calculate the vertical displacement for each wellbore section, :
Eq. 6-51
Eq. 6-52 describes the horizontal displacement of an inclined section of a well in the
northern direction, :
Eq. 6-52
Eq. 6-53 is used to calculate the horizontal displacement of an inclined section of a
well in the eastern direction, :
Eq. 6-53
In the case study, Eq. 6-53 will not be used for the sake of simplicity, as the azimuths
are both assumed to be zero (the sine of 0o equals zero).

83
7 Case Study
7.1 Case Description
It was decided early on that the drilling methods described in this thesis are suitable
for drilling through severely depleted reservoir zones, especially HPHT reservoirs,
and that the effects should be demonstrated by performing a case study.
Most of the published data sets found while conducting research for this thesis were
found to be incomplete or unsuitable. Eventually, it was decided to use data published
by Statoil, on the Kristin field. Kristin a gas-condensate HPHT field found straddling
block 6406 / 2 and 6506 /2, located in the south-west part of the Halten Bank in the
Norwegian part of the North Sea. It is located at a water depth of 370 meters
(Offshore Technology). For the purpose of this thesis, the upper reservoir has been set
at 4162m. The field came online in 2005, and is, per 2014, assumed to have been
depleted to such a degree that the drilling window has been completely closed.
Nevertheless, the field has been chosen to demonstrate how MPCD may be applied.
The pore pressure and fracture curves have been extrapolated from a pore pressure
and fracture gradient plot published by Statoil (shown in Figure 7-1), using a simple
freeware program called Plot Digitizer. Plot Digitizer is a Java program used to
digitize scanned plots of functional data, which is then converted into a table that can
be imported into Microsoft Excel15. An example of the process along with digitized
values is shown in Figure 7-2. In order to extrapolate the necessary data some
assumptions were made which were loosely based on published data. These
assumptions were then used to calibrate Plot Digitizer in order to retrieve the
appropriate data. The top of the upper reservoir was assumed to be situated at 4162m
TVD below the sea floor, and the mud weight was assumed to be 2,15SG (Cesium
Formate).
The data was cleaned up by deleting deviating points, and inserted into the hydraulic
model. A basic guide to how the model should be used can be found in Appendix G.
The resulting pressure regime can be seen in Figure 7-3. Basic rock mechanic
correlations were used to simulate depletion of the reservoir, an example of which can
be seen in Figure 7-4.
15 Sourceforge. Plot Digitizer. Sourceforge Web site. [Online] [Cited: May 6, 2014.]
http://plotdigitizer.sourceforge.net/
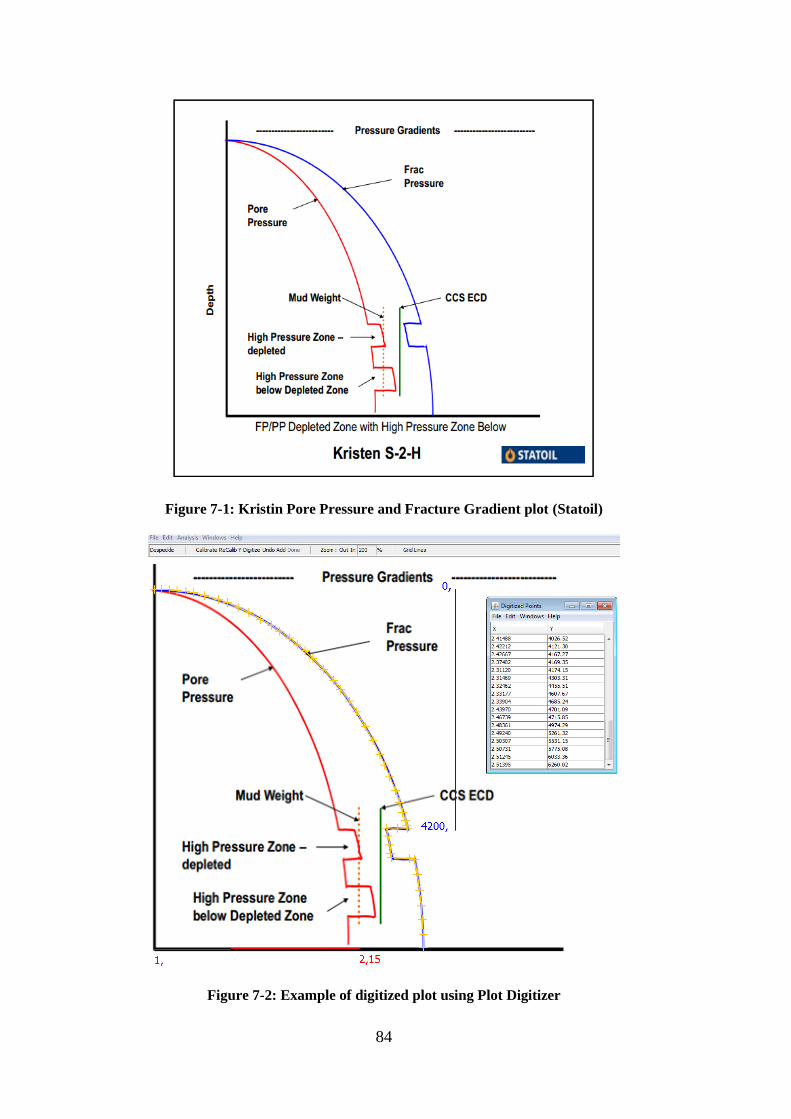
84
Figure 7-1: Kristin Pore Pressure and Fracture Gradient plot (Statoil)
Figure 7-2: Example of digitized plot using Plot Digitizer

85
Figure 7-3: The pressure regime of the formation in question

86
7.2 Assumptions
In lieu of adequate data, the pore pressure was reduced by 160bar in the upper
reservoir. The associated reduction in fracture pressure was computed using equations
listed in Chapter 6.2. The intention is to simulate depletion of the upper reservoir. The
resulting pressure regime is shown in Figure 7-4. Certain assumptions have been
made in order to compute these values:
Biot’s coefficient was assumed to be 0.95
The Poisson ratio was assumed to be 0.3
The upper reservoir starts at 4162m TVD, and ends at 4594m TVD. It is
assumed to be homogeneous, perfectly horizontal and flat, with a uniform
thickness
The lower reservoir starts at 5030m TVD and ends at 5485m TVD. It is
assumed to be homogeneous, perfectly horizontal and flat, with a uniform
thickness
Figure 7-4: The pressure regime after 160 bar depletion
Figure 7-5 shows the wellbore trajectory used to compute the pressure losses along
the wellbore. The well has been designed so that it is drillable using the MPCD
technique due to the challenging pressure regime of the reservoirs. It was also decided
that this was the most appropriate way to make a basis of comparison between the
different techniques.

87
Figure 7-5: Wellbore trajectory, Case 1
The following assumptions have been made in order to compute the pressure losses
along the well:
The density of the cuttings of both overburden rock, reservoir rock and the
rock of the intermediate interval is assumed to have a uniform density of =
2700 kg/m3
The input parameters were changed to reflect drilling operations using other
techniques (OBD, LD, MPD). Apart from altering the mud weight in cases, all
other parameters are identical. Supplementary tables can be found in Appendix
F.
The fluid models used are assumed to be valid
The ROP is assumed to be constant at 30 m/hr
In order to maintain sufficient wellbore cleaning, the minimum fluid velocity is
assumed to be v = 0.8 m/s
Solids distribution is assumed to be perfectly homogenous along the wellbore
Pressure effects caused by suspended and transported solids, pipe rotation,
wellbore tortuosity, changes in wellbore geometry, temperature fluctuations,
and more is assumed to be negligible
The fluids are assumed to behave according to the Bingham Plastic rheology
model
The flows are assumed to be laminar in nature when Re < 2100, and turbulent
if Re > 2100
Safety margins of 1% for MPD techniques and 5% for OBD techniques are
assumed to be sufficient

88
7.3 Results
7.3.1 Overbalanced Drilling
Figure 7-6 shows the pressure regime resulting from drilling the well in overbalance.
Supplementary information is shown in Table 17 in Appendix F. When drilling in
overbalance, the static mud weight must be higher than the pore pressure, in order to
contain the reservoir fluids while making connections. Though the mud weight may
allow drilling through the reservoir, the predicted ECD exceeds the fracture pressure
of the formation from the moment entering the reservoir. Drilling into such a situation
may lead to severe loss situations, which in turn may lead to kicks if the driller is
unable to compensate for the lost fluids. Though it is possible to drill wells while
taking losses, doing so on a consistent basis is not advisable. The productivity of the
upper reservoir (which is still producing in this case) is likely to suffer as a result due
to fluid loss and fracturing, and it seems likely that the drilling process may be slowed
down by stuck pipe issues and other operational challenges. In the worst possible
scenario, drilling with losses may lead to kick/loss cycles, and lead to a blowout.
Figure 7-6: Wellbore pressure profile – drilling in Overbalance

89
7.3.2 Liner Drilling
Figure 7-7 shows the pressure regime resulting from drilling with liner.
Supplementary information is shown in Table 18 in Appendix F. In this case, as with
drilling using OBD, the ECD causes the wellbore pressure to exceed the fracture
pressure of the formation from the moment of entering the reservoir, with very similar
consequences as those outlined above. Though the plastering effect may increase the
fracture strength of the formation, and thus mitigate fluid losses, the conditions under
which plastering occurs are not well understood. The 5% safety margin exceeds the
fracture pressure of the upper reservoir to the magnitude of ~80bar. It is highly
probable that this would lead to serious losses: Drilling cannot be recommended in
this case. The mud window is simply too narrow.
Figure 7-7: Wellbore pressure profile – drilling using Liner Drilling
7.3.3 Managed Pressure Drilling
Figure 7-8 shows the pressure profile resulting from drilling the well at balance
(MPD). Supplementary information is shown in Table 19 in Appendix F. Contrary to
the two previous examples, drilling through the upper reservoir seems possible to
accomplish without encountering losses. There is no need to remain in static

90
overbalance, thus it may be possible to drill safely through the reservoir while
remaining within the drilling window by exploiting the ECD and backpressure. The
pressure is maintained while making connections by utilizing a continuous circulating
device, as described in Chapter 3. Once the reservoir has been drilled through, the
driller has to POOH and set a casing or liner; there seems to be a serious risk of
entering an underbalanced state if drilling proceeds. Thus, it is not safe to drill further.
Figure 7-8: Wellbore pressure profile – drilling using MPD
7.3.4 Managed Pressure Casing Drilling
Figure 7-9 shows the wellbore pressure profile resulting from drilling using the
MPCD technique described in this thesis. Supplementary information is shown in
Table 20 in Appendix F. The figure shows that the wellbore pressure stays within the
mud window throughout the entire interval. Thus, it may be possible to drill through
both reservoirs in one trip.
The likelihood of being able to drill such a well without encountering stuck pipe
incidents or other critical issues is very small, however. As can be seen in Table 20,
the liner string is 3167m long, and the drilled interval is more than 3200m long. In
general, it is not advisable to plan well sections longer than 1500-2000m when using

91
liner drilling16. The restrictions are mainly related to torque and drag issues, but also
the amount of time the wellbore is exposed to fluids and varying pressure regimes. As
time passes, the probability of well control problems or stuck pipe issues occurring
increases.
Figure 7-9: Wellbore pressure profile – drilling using MPCD
16 Conversation with Jafar Abdollahi, 16th of May, 2014

92
7.4 Discussion
It has been mentioned that these results are based on several assumptions. The validity
of these assumptions may be subjected to scrutiny, and rightly so. Making such
assumptions was considered vital, however; going deeper into the matter lies beyond
the scope of this thesis.
The field consists of:
A depleted layer with a very narrow mud window
Consecutive layers with very different pore pressure regimes (high pore
gradient)
All of which were stipulated as being particularly challenging and of interest in the
introduction chapter.
These results give clear indications as to the potential of the method: That MPCD can
be used to solve the challenges mentioned, by exploiting the AFP, and maintaining
precise control of the BHP in the process. Using the method may also increase the
profitability of certain drilling operations being performed today by reducing drilling
expenditures. Making attempts to quantify this potential gain is a matter for further
research, however.

93
8 Discussion
8.1 Combining MPD and LD/CD
Combining complementary technologies may result in a system that is greater than the
sum of its parts, preserving each technology’s unique advantages while eliminating
some of their weaknesses. Many of the conventional drilling problems still remain
while using CD/LD. In fact, many of them are aggravated by the narrow annular
clearance, and the impact this has on ECD, stuck pipe issues and formation
ballooning. In addition, the ROP is likely to be reduced as well, due to increased chip
hold-down pressures. MPD with drillpipe also suffers from some of the same
challenges as conventional drilling; the ability to generate ECD is limited by pumping
capacity and flow rate restrictions of BHA components (Stone, et al., 2006). When
drilling in overbalance, ECD may be more of an issue than a benefit as it reduces the
available mud window due to the requirement of maintaining static overbalance.
When drilling at balance, the ECD may be exploited to increase the BHP without
affecting the uphole wellbore pressure. Using pumps that are able to generate
sufficient pressure is critical in order to achieve this goal.
Figure 3-5 shows operating procedures for a Weatherford RCD. In order to maintain a
good seal while drilling with liner, the sealing “spear” must be stabbed in after the
liner have passed. In the case of Casing Drilling, the RCD must be redesigned in order
to maintain a seal around the casing string at all times. It is likely that the increased
size of the casing would cause extra wear on the seal. This is likely not an issue if
drilling using a drilling liner, as the sealing spear is, in most cases, stabbed in after the
liner has passed the RCD and BOP. This depends on the MD of the well, and the
length of the well section that is planned.
Perhaps the biggest challenges the Operator has to face when using CD/LD are the
associated AFP and increased torque resulting from rotating the string. AFP is deemed
an issue if it is a requirement to remain in static overbalance, as care must be taken not
to exceed the formation’s fracture pressure. If LD/CD is combined with MPD, it is
possible to maintain a static underbalance while actively using the increased AFP to
remain at balance in lower wellbore section while keeping the uphole wellbore
pressure below the fracture gradient. While doing this, however, there is a risk of
washing out poorly consolidated formations, as the AFP is largely determined by flow
velocity, and this trait may incentivize higher flow rates. Drilling operations
conducted using MPCD techniques is likely to reduce overbalance issues
conventionally associated with CD/LD, such as wellbore ballooning/breathing and
differential sticking. This may allow the driller to navigate very narrow mud windows

94
while reducing mud costs at the same time17. This is exemplified further in the case
study.
Thus far, it is obviously beneficial to maintain circulation at all times in order to
utilize MPCD to its full potential. When the casing/liner is at target depth, the back
pressure may be increased to compensate for the loss of ECD as the circulation system
is disconnected in order to prepare for cementing and the inner string is POOH. A
caveat is that increasing backpressure will increase the pressure uniformly along the
wellbore. A possible consequence is that the uphole pressure, which was so carefully
maintained below the fracture limit while drilling, may increase past the fracture limit,
leading to losses.
Continuous pumping is critical to maintaining a stable ECD: Auxiliary pumps are
needed in case of pump failure while drilling. Drilling with MPCD relies on
maintaining a high ECD at any point in time during drilling.
Figure 8-1 shows an overview of how a depleted HPHT reservoir such as that shown
in Figure 7-1 may be penetrated using current and future methods. It is assumed that
the upper reservoir is heavily depleted, but is still drillable using conventional
methods.
Option 1: The well is drilled conventionally, and a casing point is set above the
upper reservoir (often 9 5/8” casing). The next interval (in this case 7”)
is then drilled until losses are encountered or the zone has been
penetrated. The upper reservoir is then drilled using a 6” openhole
solution.
Option 2: The upper reservoir is penetrated initially using Liner Drilling using 9
5/8” liner. Conventional drilling is used to drill through the reservoir
layer and into the shale, and 7” casing is set. From there on, the well is
drilled through the intermediate shale layer and lower reservoir using
conventional drilling, and completed with an openhole solution.
Option 3: The reservoir is penetrated initially using Liner Drilling with 9 5/8”
liner, setting the casing point inside the upper reservoir. MPCD is then
used to drill through the upper reservoir, the intermediate shale layer,
and the lower reservoir.
Option 4: MPCD with 9 5/8” liner is used to drill through the overburden, upper
reservoir and into the intermediate shale layer. The well may then be
drilled conventionally through the intermediate shale layer and into the
lower reservoir using 8 ½” casing.
17 Since designer muds are often used to achieve specific fluid properties

95
Conventional
Depleted Reservoir
Shale Zone
Non-Depleted Reservoir
Liner Drilling Liner Drilling MPCD
Conventional 6" Openhole
Conventional 7"7" MPCD
9 5/8"Conventional
7"
Conventional 6" Openhole
Conventional 7"9 5/8"
9 5/8"9 5/8"
Current Future
Option 1 Option 2 Option 3 Option 4
Figure 8-1: Drilling procedures using the different methods
Out of the four options, Options 3 and 4 are far superior. Fewer well sections are
drilled, and the diameters of the producing intervals are higher. Of these, Option 4
seems preferable, as the diameter of the well section penetrating the depleted zone is
higher than in Option 3, yielding greater productivity.

96
8.2 Managed Pressure Casing Drilling and Supporting
Technologies
Using liner or casing in place of drill pipe in the drill string carries certain
disadvantages which are not mitigated by using MPCD; so far it seems reasonable to
assume that the pressure regime in the annulus surrounding the casing/liner is
somewhat erratic and unpredictable. Local deviations in wellbore geometry and
symmetry may potentially have a significant impact on the pressure losses for
example. Therefore, it seems as though this method may benefit significantly from
additional pressure monitoring, which may be achieved by improving
communications with the BHA. This may be achieved using WDP, as described in
Chapter 5. For systems that use a continuous inner string, communications with BHA
may be improved greatly. The benefit of using pressure monitoring nodes distributed
along with the signal booster subs along the string would be negated to some degree;
these are dimensioned to work with drill string, not LD/CD.
ASM and SWD are not currently available in the liner part of the drill string. The
casing/liner is exposed to so much abrasive wear and stress that it is very likely that
the equipment would be damaged or rendered useless shortly after being exposed to
open formation during drilling. ASM would still be available when using LD, from
just above the liner interval and further up the string. This would be useful in order to
quantify the total pressure losses over the liner string.

97
9 Conclusion
The main purpose of this thesis was to evaluate the possible benefits and limitations
related to using MPD and CD/LD methods separately, and if they may be combined
and used to open up new opportunities to develop particularly challenging oil and gas
fields.
Managed Pressure Casing Drilling
MPD and CD/LD are complementary technologies, and can be combined,
provided modifications are made to certain pieces of equipment to
accommodate the closed loop and bigger diameter string.
The findings in this thesis indicate that using MPCD can be advantageous,
provided careful candidate selection. In particular, the method seems well
suited to drilling wells with very challenging pore pressure regimes, such as
layered reservoirs with different pore pressures and heavily depleted
reservoirs. This is supported by the case study
The advantages of MPD and CD/LD are well known. It is indicated that combining
the two yields additional benefits, while preserving the individual benefits of the two
separate technologies:
Drilling with liner or casing in static underbalance, along with precise pressure
management, may turn the increased AFP into an advantage in some situations
Reduced overbalance reduces ROP, stuck pipe, and formation damage
concerns usually associated with CD/LD
Reduces heave induced surge & swab pressure fluctuations when drilling
ahead from floaters
Hydraulic Model
The hydraulic model was built and applied successfully. It is generalized, apart
from a few parameters concerning the depths of reservoir layers and casing
points, and can be used as a learning tool, and/or for the initial evaluation of
pressure losses along a well.
Case Study
The findings in the case study indicate that MPCD is an enabling technology.
Though the well design used in the case study is prohibitively long, the well
likely can’t be drilled without encountering fluid losses or fluid influx, or
without severe well tapering, using any of the other stipulated alternatives.
98
Concept Study: Expandable Tubular Drilling
ETD may enable drilling of monobore wells
Initial evaluation suggests that there is potential for reducing well construction
costs, and increasing productivity of the final product by using ETD.
The evaluation suggests that top-down expansion using a retrievable BHA
mounted rotary expansion tool may be beneficial compared to the stipulated
alternatives.

99
9.1 Future Work
Managed Pressure Casing Drilling
Further studies should be made in order to understand the impact of combining
the methods. Suggestions include:
o Evaluate whether adding MPD to the equation has any impact on the
torque and drag, and if it enables drilling longer well sections than
would be possible without it.
o Evaluate systems and equipment modifications required to
accommodate MPCD
Further attempts to quantify the benefits of combining technologies should be
made. In order to do this, it is suggested that:
o Statistics should be gathered from End of Well Reports (EOWR) from
wells that have been drilled in conditions that would make them good
candidates for MPCD. Interesting parameters include problems
encountered, why drilling was successful/ why it was not, time spent,
cost of consumables, and more.
o Construct realistic scenarios using MPCD based on EOWRs, evaluate
and quantify time spent on drilling the wells, and compare to statistics.
Evaluate expenditures.
The significance of the smear effect should be studied further, with special
emphasis on whether the decreased pressure differential resulting from
combining CD/LD with MPD will affect the phenomenon
Model surge and swab as a result from heave (floaters) when using casing/liner
in the drill string, and develop models for MPD systems that may be used to
counteract the resulting pressure fluctuations.
Use CFD to model the pressure losses resulting from the reduced annular flow
area along the string, and incorporate findings into hydraulic models used for
automatic MPD systems. Impact of pipe rotation should also be incorporated.
Evaluate formation damage resulting from using MPCD compared to CD/LD
and MPD.
o Further studies into the effect of smearing and reduced overbalance on
fluid and particle invasion and clay swelling should be made.
Redesign RCD and CCS in order to allow for the use of CD/LD
100
Wired Drill Pipe
Evaluate possibility of fitting conductor cables and induction coils, along with
battery subs and pressure sensors to tubulars
Hydraulic Model
The hydraulic model could be developed further in and of itself, or as a part of
a greater model.
o Other pressure related effects could be implemented, such as cuttings
related pressure losses, the effect of pipe rotation, transient effects and
more
o Accommodations for the Herschel Bulkley model can be made
Expandable drilling liner
Evaluate burst and collapse parameters in order to determine if it is advisable
to use expandable tubulars in drilling applications by using FEM.
Evaluate wear and fatigue parameters in order to determine whether the current
expandable tubulars can be used for drilling applications
Design expansion tools for use in the BHA

101
10 Conversion Table
Measurement S.I. Unit Field Unit Conversion Factor
Distance m ft 1 m = 3.28084 ft
Diameter m in 1 m = 39.3701 in.
Pressure Pa psi 1 Pa = 0.000145037738 psi
Weight kg lbs 1 kg = 2.20462 pounds
Acceleration m/s2 ft/s2 1 m/s2 = 3.28084 ft/s2
Flow Rate m3/s GPM 1 m3/s = 15852 GPM
Viscosity Pa*s cP 1 Pa*s = 1000cP
Density kg/m3 lbm/ft3 1 kg/m3 = 0.0624279606 lbm/ft3

102
11 References
American Petroleum Institute. 2010. Isolating Potential Flow Zones During Well
Construction. Washington D.C., USA : American Petroleum Institute, 2010. API RP
65 Part 2.
Angus Warren. 2013. Why companies avoid new oil and gas technology. Warren
Business Consulting Web site. [Online] April 30, 2013. [Cited: March 2, 2014.]
http://warrenbusinessconsulting.com/articles/why-companies-avoid-new-oil-and-gas-
technology-2/.
Bakersfield Bit & Tools. Gaugemaster Disposable Underreamer. Bakersfield Bit &
Tools Web site. [Online] [Cited: April 29, 2014.]
http://bakersfieldbitandtool.com/index.cfm?fuseaction=page&page_id=5001.
Birkeland, Trygve. 2009. Automated Well Control Using MPD Approach, Master's
Thesis. Stavanger, Norway : University of Stavanger, 2009.
Bourgoyne, A.T., Chenevert, M.E., Millheim, K.K., et.al. 1986. Applied Drilling
Engineering. Richardson, Texas, USA : Society of Petroleum Engineers, 1986. ISBN
978-1-5563-001-0.
Carlsen, Inge Manfred, Sangesland, Sigbjørn and Jenssen, Hans Peter. 2000.
Efficient deepwater Development - a Drilling and Completion Technology
Perspective. Trondheim, Norway : SINTEF Petroleum Research, 2000.
Çengel, Yunus and Cimbala, John M. 2006. Fluid Mechanics, Fundamentals and
Applications, Second Edition. New York, NY, USA : McGraw-Hill Education, 2006.
ISBN 978-007-128421-9.
Dake, L.P. 2001. The Practice of Reservoir Engineering. s.l. : Elsevier Science &
Technology, 2001. ISBN 978-0-444-50671-9.
Dokhani, Vahid, et al. 2013. SPE 166103: Evaluation of Annular Pressure Losses
while Casing Drilling. New Orleans, Louisiana, USA : Society of Petroleum
Engineers, 2013.
Edwards, Stephen T., et al. 2013. IADC/SPE 163560: A Summary of Wired Drill
Pipe Field Trials and Deployments in BP. Amsterdam, The Netherlands :
International Association of Drilling Contractors & Society of Petroleum Engineers,
2013.
Eeck-Olsen, Johann. 2012. Lectures held in the course TPG 4125 at Norwegian
University of Science & Technology. 2012.

103
Fanguy, Charles, Mueller, Dan T. and Doherty, Dale R. 2004. SPE 90923:
Improved Method of Cementing Solid Expandable Tubulars. Houston, Texas, USA :
Society of Petroleum Engineers, 2004.
Fjær, Erling, et al. 2008. Petroleum Related Rock Mechanics, 2nd Edition.
Trondheim, Norway : Elsevier Science & Technology, 2008. ISBN 978-0-444-50260-
5.
Golan, Michael and Whitson, Curtis H. 1996. Well Performance. Trondheim,
Norway : Tapir Akademisk Forlag, 1996. ISBN 0-13-946609-6.
Gusevik, Rune and Merritt, Randy. 2002. SPE 77612: Reaching Deep reservoir
Tragets using solid Expandable Tubulars. San Antonio, Texas, USA : Society of
Petroleum Engineers, 2002.
Hannegan, Don M. 2011. OTC21208: Managed Pressure Drilling Applications on
Offshore HPHT Wells. Houston, Texas, USA : Offshore Technology Conference,
2011.
—. 2011. SPE 146644: MPD - Drilling Optimization Technology, Risk Management
Tool, or Both? Denver, Colorado, USA : Society of Petroleum Engineers, 2011.
Hernandez, Maximo and Long, Roy. 2010. The Evolution and Potential of
Networked Pipe. Journal of Petroleum Technology. Monthly, 2010, Vol. 62, 4.
Innes, Gareth, Metcalfe, Paul and Hillis, David. 2004. IADC/SPE 88022: Next
Generation Expandable Liner Applications. Kuala Lumpur, Malaysia : International
Association of Drilling Contractors & Society of Petroleum Engineers, 2004.
Jablonowski, C.J and Podio, A.L. 2010. SPE 133019: The impact of Rotating
Control Devices on the Incidence of Blowouts: A Case Study for Onshore Texas, USA.
Port of Spain, Trinidad : Society of Petroleum Engineers, 2010.
Jahns, Carolin. 2012. Wellbore Applications of an Active Underreamer. Freiberg,
Germany : Technische Universität Bergakademie Freiberg, 2012.
Jenssen, Hans Peter, Carlsen, Inge Manfred and Sangesland, Sigbjørn. 2000.
Deepwater drilling, completion and intervention; Failures and root causes for Flat
Time assessments. Trondheim, Norway : SINTEF Petroleum Research, 2000.
K&M Technologies. 2011. Lecture held on wellbore cleaning in the course TPG4215
at the Norwegian University of Science and Technology. Trondheim, Norway : s.n.,
2011.
Karimi, Moji, et al. 2011. IADC/SPE 148564: A Review of Casing Drilling
Advantages to Reduce Lost Circulation, Augment Wellbore Strengthening, Improve
Wellbore stability, and Mitigate Drilling-induced Formation Damage. Muscat,

104
Oman : International Association of Drilling Contractors & Society of Petroleum
Engineers, 2011.
Kumar, Nitesh, et al. 2010. IADC/SPE 128175: Mono diameter Expandable Drilling
Liner Applications in Deepwater Drilling. New Orleans, Louisiana, USA :
International Association of Drilling Contractors & Society of Petroleum Engineers,
2010.
Lapeyrouse, N.M. 2002. Formulas and Calculations for Drilling, Production and
Workover. USA : Elsevier Science & Technology, 2002. ISBN 0-7506-7452-0.
Mancini, Stefano, et al. 2009. IADC/SPE 119260: Drill string Vibration Mitigation
During Simultaneous Drilling and Hole Enlargement. Amsterdam, The Netherlands :
International Association of Drilling Contractors & Society of Petroleum Engineers,
2009.
Moellendick, Eric and Karimi, Moji. 2011. AADE-11-NTCE-64: How Casing
Drilling Improves Wellbore Stability. Houston, Texas, USA : American Association
of Drilling Engineers, 2011.
Montilva, J., Mota, J. and Billa, R. 2012. Onshore MPD system enables lower mud
weights for challenging wells. Drilling Contractor. [Online] April 24, 2012. [Cited:
May 19, 2014.] www.drillingcontractor.org/onshore-mpd-system-enables-lower-mud-
weights-for-challenging-wells-15662.
Mæland, Maren. 2013. Managed Pressure Drilling - The Solaris Prospect - HPHT
Exploration Well. Trondheim, Norway : Norwegian University of Science and
Technology, 2013.
Naterstad, T. L. 2013. Subsea Well Intervention Operations on the Norwegian
Continental Shelf. Trondheim, Norway : s.n., 2013.
National Oilwell Varco. Drilling Pressure Control: Continuous Circulation System.
National Oilwell Varco Web site. [Online] [Cited: February 12, 2014.]
http://www.nov.com/drilling/drilling_pressure_control/continuous_circulation_system
s.aspx.
—. Telemetry Drill Strings - Intelliserv Network. [Online] [Cited: February 21, 2014.]
http://nov.com/IntelliServ/.
—. Telemetry Drill Strings - Intelliserv Network - Featured Articles - Real Time is of
the Essence. [Online] [Cited: February 21, 2014.]
http://nov.com/uploadedFiles/Business_Groups/Downhole/IntelliServ/Electronic_Res
ources_tabbed/Featured_Articles/Oil%20Gas%20Agenda%20Article.pdf.

105
—. Telemetry Drill Strings - Intelliserv Network - High Volume Drilling -
Consistently Cost Efficient. [Online] [Cited: February 21, 2014.]
Nauduri, Sagar, Medley, George H. and Schubert, Jerome J. 2009. IADC/SPE
122276: MPD: Beyond Narrow Pressure Windows. San Antonio, Texas :
International Association of Drilling Contractors & Society of Petroleum Engineers,
2009.
NTNU Course TPG4185. 2012. TPG4185: High Deviation Drilling, Directional
Drilling Textbook. Trondheim, Norway : Norwegian University of Science &
Technology, 2012.
Offshore Media Group. 2013. The Norwegian Continental Shelf 2014. Stavanger :
Offshore.no, 2013.
Offshore Technology. Kristin Deepwater Project, Norway. offshore-technology.com.
[Online] [Cited: April 25, 2014.] http://www.offshore-
technology.com/projects/kristin/.
Osmunsen, Petter, Tveterås, Ragner and Roll, Kristin Helene. 2009. Drilling
Productivity on the Norwegian Continental Shelf. Stavanger, Norway : University of
Stavanger, 2009.
Ostroot, Kent, et al. 2007. OTC 18561: Comparison and Advantages of
underbalanced and Managed-Pressure Drilling Techniques: When Should Each Be
Applied? Houston, Texas, USA : Offshore Technology Conference, 2007.
Petrowiki. Casing Design. Petrowiki. [Online] SPE International. [Cited: April 24,
2014.] http://petrowiki.spe.org/Casing_design.
Phade, Anish. 2013. Heave Compensated Managed Pressure Drilling: Lab
Experiments, Master Thesis. Trondheim, Norway : Norwegian University of Science
and Technology, 2013.
Pritchard, David M. 2010. Mitigating Drilling Hazards with Technologies (Part 3 of
DHM Series). Berkeley, California, USA : University of California Berkeley, 2010.
Rafique, Mahmood Ahmad. 2008. SPE 114186: Underbalanced Drilling: "Remedy
for Formation-Damage, Lost-Circulation, and Other Related Conventional-Drilling
Problems". Bakersfield, California, USA : Society of Petroleum Engineers, 2008.
Rasmussen, Olve Sunde and Sangesland, Sigbjørn. 2007. IADC/SPE 108346:
Evaluation of MPD Methods for Compensation of Surge-and-Swab Pressures in
Floating Drilling Operations. Galveston, Texas, USA : International Association of
Drilling Contractors & Society of Petroleum Engineers, 2007.

106
Rehm, Bill, et al. 2008. Managed Pressure Drilling (Gulf Drilling). Houston, Texas,
USA : Gulf Publishing Company, 2008. ISBN 1-933762-24-1.
Schlumberger LTD. 2014. PowerDrive Archer High Build Rate Rotary Steerable
System. Schlumberger Web Site. [Online] Schlumberger Limited, 2014. [Cited: April
25, 2014.]
http://www.slb.com/services/drilling/drilling_services_systems/directional_drilling/po
werdrive_family/powerdrive_archer.aspx?t=2.
—. TTDirect LD Liner-While-Drilling Service. Schlumberger Web Site. [Online]
[Cited: March 11, 2014.]
http://slb.com/services/drilling/drilling_services_systems/casing_drilling/liner_while_
drilling.aspx.
Showers, Danny, et al. 2013. IADC/SPE 164567: Accelerating Field Development
and Production via Managed Pressure Drilling. San Antonio, Texas, USA :
International Association of Drilling Contractors & society of Petroleum Engineers,
2013.
Skalle, Pål. 2012. Drilling Fluid Engineering. Trondheim, Norway : Ventus
Publishing AS, 2012. ISBN 978-87-403-0253-0.
Standards Norway (NORSOK). 2013. NORSOK D-010: Well Integrity in Drilling
and Well Operations, rev 4. Lysaker, Norway : Standards Norway, 2013. NORSOK
D-010.
Stiff, Henry A. 1970. SPE 3154: Interpolating or Extrapolating Drilling Fluid
Viscosities to Reference Temperatures. s.l. : Society of Petroleum engineers, 1970.
Stone, Charles R., Medley, George H. and Reynolds, Patrick B. B. 2006. Blending
Technologies: MPD, casing drilling can eliminate intermediate casing string. Drilling
Contractor. Bimonthly, 2006, May/June.
Strickler, Robert, et al. 2005. IADC/SPE 92195: Casing Directional Drilling Using
a Rotary Steerable System. Amsterdam, The Netherlands : International Association
of Drilling Contractors & Society of Petroleum Engineers, 2005.
Thingbø, Kjersti Selstad. 2011. Optimization of Hydraulic Program for Liner
Drilling, Master Thesis. Trondheim, Norway : Norway Science & Tech, 2011.
Warren, Tommy M., Houtchens, Bruce D. and Madell, Garret. 2005. SPE 79914:
Directional Drilling With Casing. s.l. : Society of Petroleum Engineers, 2005.
Warren, Tommy, Tessari, Robert and Houtches, Bruce. 2004. OTC 16564: Casing
Drilling with Retrievable Drilling Assemblies. Houston, Texas, USA : Offshore
Technology Conference, 2004.

107
Weatherford International. Constant Bottomhole Pressure. Weatherford
International Web site. [Online] Weatherford International. [Cited: January 20, 2014.]
http://www.weatherford.com/ECMWEB/groups/web/documents/weatherfordcorp/wft
021445.pdf.
Zumdahl, Steven S. 2009. Chemical Principles, 6th Edition. Belmont, CA, USA :
Brooks/Cole, 2009. 978-0-538-73456-1.

108
12 List of Figures
FIGURE 2-1: R&D EXPRESSED AS PERCENTAGE OF SALES OR OPERATING PROFIT (ANGUS WARREN, 2013) . 4
FIGURE 2-2: COST DISTRIBUTION ON THE NCS (OSMUNSEN, ET AL., 2009) ................................................... 7
FIGURE 3-1: CONSTANT BOTTOM-HOLE PRESSURE MPD, PRESSURE MANAGEMENT (WEATHERFORD
INTERNATIONAL) .................................................................................................................................. 11
FIGURE 3-2: THE DRILLING WINDOW IS THE AREA BETWEEN THE FRACTURE PRESSURE AND PORE
PRESSURE/WELL-BORE STABILITY (REHM, ET AL., 2008). .................................................................... 12
FIGURE 3-3: CBHP MPD: PRESSURE GRADIENTS (PHADE, 2013) ................................................................... 13
FIGURE 3-4: ROTATING ANNULAR PREVENTER - ACTIVE RCD (REHM, ET AL., 2008) .................................... 15
FIGURE 3-5: WEATHERFORD ROTATING CONTROL DEVICE SEALING PROCESS (WEATHERFORD) ................ 16
FIGURE 3-6: FLOW SCHEMATIC OF A WEATHERFORD AUTOMATIC CLOSED-LOOP CIRCULATING MPD
SYSTEM. REPRODUCED FROM (HANNEGAN, 2011) TO ACCOMMODATE THE FORMAT. .................... 18
FIGURE 3-7: POSSIBLE CAUSES AND CONSEQUENCES OF FLUID INFLUX (WEATHERFORD INTERNATIONAL,
2012) .................................................................................................................................................... 20
FIGURE 3-8: WELL BARRIER SCHEMATIC EXAMPLE, DRILLING AND TRIPPING OF STRING IN UB FLUID
(STANDARDS NORWAY (NORSOK), 2013) ............................................................................................ 21
FIGURE 3-9: READ-OUT FROM A LIVE MPD OPERATION USING WEATHERFORD'S MICROFLUX CONTROL
SYSTEM ................................................................................................................................................. 23
FIGURE 3-10: OBD CASING PROGRAM (LEFT) VS. MPD CASING PROGRAM (RIGHT) (MONTILVA, ET AL.,
2012) .................................................................................................................................................... 24
FIGURE 3-11: DIFFERENTIAL STICKING (REHM, ET AL., 2008) ........................................................................ 25
FIGURE 3-12: CUTTINGS BEHAVIOR DEMONSTRATION (K&M TECHNOLOGIES, 2011) ................................. 27
FIGURE 4-1: CASING DRILLING AND LINER DRILLING TECHNOLOGY CONCEPTS, NON-RETRIEVABLE BHAS
DEPICTED. ............................................................................................................................................. 34
FIGURE 4-2: DRILL-LOCK ASSEMBLY (WARREN, ET AL., 2005) ....................................................................... 35
FIGURE 4-3: PREVIOUS INTERVAL DRILLED CONVENTIONALLY – PREVIOUS CASING POINT SET ABOVE
RESERVOIR ........................................................................................................................................... 38
FIGURE 4-4: PREVIOUS INTERVAL DRILLED WITH CD/LD – PREVIOUS CASING POINT SET IN RESERVOIR .... 38
FIGURE 4-5: THE CASING IS BEING FORCED AGAINST THE WELLBORE WHILE DRILLING IN A. B SHOWS THE
MUD BEING FORCED INTO THE FORMATION ALONG WITH PULVERIZED CUTTINGS, WHILE C
ILLUSTRATES HOW FILTER CAKE AND CUTTINGS ARE PLASTERED AGAINST THE WELLBORE WALL,
SEALING THE POROUS FORMATION (KARIMI, ET AL., 2011). ............................................................... 40
FIGURE 4-6: THE ROTATING CASING STRING SMEARS CUTTINGS INTO THE FORMATION, "PLASTERING" THE
WELLBORE (SCHLUMBERGER LTD.) ...................................................................................................... 41
FIGURE 4-7: DRILLING WITH CASING/LINER (RIGHT) CREATES GAUGED WELLS (MOELLENDICK, ET AL.,
2011) .................................................................................................................................................... 42
FIGURE 4-8: THE EFFECT OF PIPE ROTATION ALONE ON THE CUTTINGS BED ............................................... 44
FIGURE 4-9: THE EFFECT OF THE VISCOUS COUPLE ON THE CUTTINGS BED ................................................ 45
FIGURE 4-10: TORQUE VECTOR DIAGRAM .................................................................................................... 46
FIGURE 5-1: ETD USED AS CONTINGENCY (RIGHT). CONVENTIONAL LINER DRILLING CONTINGENCY (LEFT)
............................................................................................................................................................. 60
FIGURE 5-2: BOTTOMS-UP FIXED-CONE EXPANSION OF A RETRIEVABLE BHA ETD SYSTEM......................... 62
FIGURE 5-3: TOP-DOWN ROLLING CONE EXPANSION OF A RETRIEVABLE BHA ETD SYSTEM ....................... 64
FIGURE 6-1: LAMINAR FLOW ......................................................................................................................... 69
FIGURE 6-2: TURBULENT FLOW ..................................................................................................................... 70
FIGURE 6-3: THE FLOW CURVES OF FOUR DIFFERENT RHEOLOGICAL MODELS OF FOUR DIFFERENT FLUID
SAMPLES (SKALLE, 2012) ...................................................................................................................... 74

109
FIGURE 6-4: ECCENTRICITY OF INNER PIPE EXEMPLIFIED ............................................................................. 76
FIGURE 6-5: ANNULAR FLUID FLOW .............................................................................................................. 79
FIGURE 6-6: THE MINIMUM CURVATURE MODEL (INSERT CITATION) ......................................................... 81
FIGURE 7-1: KRISTIN PORE PRESSURE AND FRACTURE GRADIENT PLOT (STATOIL) ...................................... 84
FIGURE 7-2: EXAMPLE OF DIGITIZED PLOT USING PLOT DIGITIZER ............................................................... 84
FIGURE 7-3: THE PRESSURE REGIME OF THE FORMATION IN QUESTION ..................................................... 85
FIGURE 7-4: THE PRESSURE REGIME AFTER 160 BAR DEPLETION ................................................................. 86
FIGURE 7-5: WELLBORE TRAJECTORY, CASE 1 ............................................................................................... 87
FIGURE 7-6: WELLBORE PRESSURE PROFILE – DRILLING IN OVERBALANCE ................................................. 88
FIGURE 7-7: WELLBORE PRESSURE PROFILE – DRILLING USING LINER DRILLING ......................................... 89
FIGURE 7-8: WELLBORE PRESSURE PROFILE – DRILLING USING MPD ........................................................... 90
FIGURE 7-9: WELLBORE PRESSURE PROFILE – DRILLING USING MPCD ......................................................... 91
FIGURE 8-1: DRILLING PROCEDURES USING THE DIFFERENT METHODS ...................................................... 95

110
13 List of Tables
TABLE 1: FLAT TIME OF TOTAL TIME DRILLING AND COMPLETION (JENSSEN, ET AL., 2000) .......................... 6
TABLE 2: FLAT TIME - DISTRIBUTION OF CAUSES (JENSSEN, ET AL., 2000) ..................................................... 6
TABLE 3: MPD SUMMARY BENEFITS .............................................................................................................. 30
TABLE 4: MPD SUMMARY DISADVANTAGES ................................................................................................. 31
TABLE 5: AN ILLUSTRATION OF THE DIFFERENT CASING/LINER DRILLING SYSTEMS .................................... 36
TABLE 6: CD/LD SUMMARY BENEFITS ........................................................................................................... 50
TABLE 7: CD/LD SUMMARY DISADVANTAGES ............................................................................................... 51
TABLE 8: COST SAVING BENEFITS OF DRILLING MONOBORE WELLS ............................................................ 58
TABLE 9: COMPARISON OF PRODUCTION POTENTIAL AS A FUNCTION OF WELLBORE DIAMETER .............. 59
TABLE 10: EXPANDABLE TUBULAR DIMENSIONS AND ASSOCIATED HOLE EXPANSION RATIOS ................... 65
TABLE 11: TIME TO DRILL COMPARISON BETWEEN CONVENTIONAL METHODS AND EXPANDABLE LINER
DRILLING .............................................................................................................................................. 66
TABLE 12: RIG RATE OVERVIEW ON THE NCS, ALL PRICES IN USD/D (OFFSHORE MEDIA GROUP, 2013) ....... A
TABLE 13: WELL CONTROL ACTION PROCEDURES (STANDARDS NORWAY (NORSOK), 2013) ....................... D
TABLE 14: COMMONLY USED BIT SIZE THAT WILL PASS THROUGH API CASING (PETROWIKI) ..................... W
TABLE 15: COMMONLY USED BIT SIZES THAT WILL PASS THROUGH API CASING (CONTINUED) (PETROWIKI)
............................................................................................................................................................... X
TABLE 16: ILLUSTRATION OF UNDERREAMER OPENING SIZE ON TODAY'S MARKET (JAHNS, 2012) .............. Z
TABLE 17: SUPPLEMENTARY INPUT AND OUTPUT PARAMETERS FOR FIGURE 7-6 (OBD) ............................BB
TABLE 18: SUPPLEMENTARY INPUT AND OUTPUT PARAMETERS FOR FIGURE 7-7 (LD) ............................... CC
TABLE 19: SUPPLEMENTARY INPUT AND OUTPUT PARAMETERS FOR FIGURE 7-8 (MPD)........................... DD
TABLE 20: SUPPLEMENTARY INPUT AND OUTPUT PARAMETERS FOR FIGURE 7-9 (MPCD) ......................... EE

111
14 List of Appendix Figures
APPENDIX FIGURE 1: S-135 QUALITY WIRED DRILL PIPE SPECIFICATIONS (NATIONAL OILWELL VARCO) ... E
APPENDIX FIGURE 2: POWER CHOKE SECTION .............................................................................................. G
APPENDIX FIGURE 3: M-I SWACO 10K SUPER CHOKE AND CHOKE PLATES ..................................................... I
APPENDIX FIGURE 4: AUTO SUPER CHOKE ....................................................................................................... J
APPENDIX FIGURE 5: HCV VALVE..................................................................................................................... K
APPENDIX FIGURE 6: INSIDE BOP NRV ............................................................................................................ L
APPENDIX FIGURE 7: RETRIEVABLE NRV ........................................................................................................ N
APPENDIX FIGURE 8: DDV TRIP SEQUENCE .................................................................................................... O
APPENDIX FIGURE 9: QUICK TRIP VALVE. ....................................................................................................... Q
APPENDIX FIGURE 10: ECD TOOL (COURTESY OF WEATHERFORD INTERNATIONAL LTD.) ............................. T
APPENDIX FIGURE 11: ECD TOOL DATA (COURTESY OF WEATHERFORD INTERNATIONAL LTD. ................... U
APPENDIX FIGURE 12: THE BASIS OF THE CORIOLIS METER IS TWIN PARALLEL TUBES. (COURTESY OF
YOKOGAWA.) ......................................................................................................................................... V
APPENDIX FIGURE 13: AN EXAMPLE OF AN UNDERREAMER (BAKERSFIELD BIT & TOOLS) ............................ Y
APPENDIX FIGURE 14: OVERVIEW OF THE HYDRAULIC MODEL .................................................................... FF
APPENDIX FIGURE 15: NUMBERED OVERVIEW OF THE HYDRAULIC MODEL ............................................... GG
APPENDIX FIGURE 16: INPUT AND OUTPUT PARAMETERS ............................................................................. II
APPENDIX FIGURE 17: WELLBORE PARAMETERS ............................................................................................ II
APPENDIX FIGURE 18: CALCULATIONS ........................................................................................................... JJ
APPENDIX FIGURE 19: FLUID PARAMETERS ................................................................................................... JJ
APPENDIX FIGURE 20: CASING POINT CALCULATIONS, USED FOR GRAPHICAL REPRESENTATIONS.............. JJ
APPENDIX FIGURE 21: PRESSURE DROP CALCULATIONS............................................................................... KK
APPENDIX FIGURE 22: RESERVOIR PARAMETERS .......................................................................................... KK
APPENDIX FIGURE 23: LIST PARAMETERS ...................................................................................................... LL
APPENDIX FIGURE 24: GRAPHICAL REPRESENTATION OF THE WELL TRAJECTORY ........................................ LL
APPENDIX FIGURE 25: GRAPHICAL REPRESENTATION OF THE PRESSURE REGIMES .................................. MM


A
Appendix A
Table 12: Rig rate overview on the NCS, all prices in USD/d (Offshore Media Group, 2013)
Name Owner Customer Contract to Semisubmersible Drillship Jack-up
Bideford Dolphin Dolphin Statoil jan.17 418000
Borgland Dolphin Dolphin Rig Manag. No. jan.17 530000
Bredford Dolphin Dolphin Lundin may.16 442000
COSLInnovator
COSL Drilling
Euro Statoil jun.20 335000
COSLPioneer
COSL Drilling
Euro Statoil aug.14 320000
COSLPromoter
COSL Drilling
Euro Statoil jun.20 335000
Deepsea Atlantic Odfjell Drilling Statoil aug.14 490000
Deepsea Bergen Odfjell Drilling Statoil jun.17 339000
Island Innovator Island Offshore Lundin mar.15 Private
Leiv Eriksson Ocean Rig Rig Manag. No. mar.16 545000
Maersk Giant Maersk Drilling Talisman aug.14 private
Maersk Guardian Maersk Drilling Lundin jun.14 private
Maersk Innovator Maersk Drilling ConocoPhilips mar.17 private
Maersk Inspirer Maersk Drilling Statoil okt.14 private
Maersk Gallant Maersk Drilling ConocoPhilips/Statoil jun.16 312000
Ocean Vanguard Diamond Statoil apr.15 354000
Polar Pioneer Transocean Statoil mai.14 519000
Rowan Gorilla VI Rowan Drilling ConocoPhilips jul.17 350000
Rowan Norway Rowan Drilling ConocoPhilips jul.16 350000
Rowan Stavanger Rowan Drilling Talisman/Lundin feb.14 350000
Scarabeo 5 Saipem Statoil sep.17 399000
Scarabeo 8 Saipem ENI Norge jul.17 460000
Songa Dee Songa Offshore Statoil jul.16 423000
Songa Delta Songa Offshore Statoil jul.16 448000
Songa Enabler Songa Offshore Statoil sep.23 450000
Songa Encourage Songa Offshore Statoil jul.23 450000
Songa Endurance Songa Offshore Statoil feb.23 428000
Songa Equinox Songa Offshore Statoil nov.22 428000
Songa Trym Songa Offshore Statoil jul.15 365000
Statoil Cat J1+2 TBA Statoil mar.24 private
Stena Don Stena Drilling Statoil mar.17 400000
Transocean Arctic Transocean Statoil aug.15 418000
Transocean Barents Transocean Det norske jun.14 570000
Transocean Leader Transocean Statoil apr.15 409000
Transocean Searcher Transocean BG jun.15 394000
Transocean Spitsbergen Transocean Statoil jul.15 500000
Transocean Winner Transocean Lundin/Marathon jan.15 487000
West Alpha Seadrill ExxonMobil apr.16 476000
West Elara Seadrill Statoil apr.17 358000
West Epsilon Seadrill Statoil des.17 283000
West Hercules Seadrill Statoil des.16 495000
West Linus Seadrill ConocoPhilips mai.19 361000
West Navigator Seadrill Shell jul.14 609000
West Venture Seadrill Statoil jun.15 435000
XL Enhanced I Maersk Drilling Total sep.18 377000
XL Enhanced II Maersk Drilling Det norske jan.20 377000
XL Enhanced III Maersk Drilling Statoil jul.19 397000

B
Appendix B
The content of Appendix B is copied in its entirety from NORSOK D-010 rev. 4, and
fit to the format of this thesis.
13.3 Well barrier acceptance criteria
13.3.1 General well barrier acceptance criteria in underbalanced and
managed pressure drilling
The following apply:
a) All WBEs shall be rated to withstand the maximum differential pressure
expected for planned operation mode (UBD or MPD) including a predefined
safety factor.
b) A complete list of possible leak paths shall be made.
c) A risk assessment shall be done to assess common WBEs. As a minimum, well
type (new/re-entry), status, certifying frequency, visual/mechanical surveillance
and probability and consequence of failure of each elements should be
addressed.
d) A system/equipment acceptance plan shall be made prior to installation
13.3.3 Well barrier acceptance criteria for managed pressure drilling
The primary well barrier in MPD operations is maintained by a statically
underbalanced fluid column with applied surface pressure. The BHP is controlled by
means of a closed loop surface system and equipment providing back-pressure.
a) The RCD shall be installed above the drilling BOP.
b) A dedicated MPD choke manifold shall be used to control the wellbore
pressure and reduce the pressure at surface to acceptable levels before entering
the separation equipment or the shakers. A manual MPD choke system is not
accepted as a part of the primary well barrier.
c) Plugging, erosion or wash-outs of surface equipment shall not impact the
ability to maintain well control.
d) The surface system shall be selected and dimensioned to handle the anticipated
fluid/solids, including formation fluids if potential exists for influx removal
with MPD.

C
e) Snubbing facilities shall be used in all pipe light scenarios. Alternatively, the
well can be brought into hydrostatic overbalance or a qualified isolation WBE
can be placed down hole prior to any probable pipe light scenarios.
f) During any tripping operation, the ability shall be in place to measure either
positive backpressure if the RCD is installed, or verify level of liquid in the
annulus when the RCD is not installed.
g) The BHP shall be kept at a level that prevents continuous influx of formation
fluid into the well. The BHP shall be above maximum confirmed
pore/reservoir pressure (including safety margin to account for expected
variations in BHP). The pressure can be confirmed by pressure measurement
or interpreted from well signals.
The secondary well barrier for MPD is the same as for conventional drilling.
h) A stab-in safety valve for the pipe in use shall be available on the rig floor.
i) A drilling BOP shall be installed for MPD operations
j) j) MPD manifold and flow path shall be independent of rig choke manifold, so
the rig choke manifold is always available for well control operations.
To ensure that the wellbore pressure does not exceed the formation integrity, the
following apply:
k) A minimum kick tolerance shall be specified. Based on the MPD system’s
capability of recognizing small influxes and minimizing influx volumes, the
kick tolerance can be smaller than for conventional operations.
l) The open hole wellbore pressure range "drilling window" shall as a minimum
be such that the MPD system is proved capable of operating within the
window for both planned operations and selected predefined contingencies,
which shall be based on criticality and frequency of occurrence. As a minimum
loss of rig power, choke plugging, change of RCD element and switch between
MPD and well control mode (and vice versa) shall be included.
m) Stop criteria for lack of kick margin and/or being out of operating range shall
be made. A contingency plan shall be in place and include actions to be taken
if this occurs.
n) If the minimum formation stress is lower than the maximum estimated pore
pressure in the section, it shall be documented that the risk of fracturing the
formation is acceptable, and contingency plans for potential scenarios shall be
made.

D
13.4 Well barrier elements acceptance criteria
There are no additional requirements to what is described in section 15.
13.5 Well control action procedures and drills
13.5.1 Well control action procedures
Main operational risks shall be identified and contingency procedures shall be made,
reflecting the actual equipment to be used and the well specific data. The following
table describes incident scenarios for which well control action procedures should be
available. This list is not comprehensive and additional scenarios may be included
based on the planned activities.
Table 13: Well control action procedures (Standards Norway (NORSOK), 2013)
1. Bottom hole or surface pressure and/or flow
rates detected which could lead to the pressure
rating of the RCD (static or dynamic) or the
capacity of the surface separation equipment
being exceeded
2. NRV failure, influx into work string during
making connection or tripping in live well
6
3. Leak in common WBE; casing
4. Leak in common WBE; casing cement
5. Leak in common WBE; WH, HP-riser and BOP
6. Gain while: drilling, displacing to overbalance
fluid, and with pipe out of hole
MPD only
7. Erosion or wash out of choke Consider the case where isolation for
repair of the choke cannot be achieved
8. Leaks at surface RCD, flowlines, manifold etc.
9. Plugging at surface Choke, flowmeter etc.
10. Work string failure, washout or twist-off Consider pipe light scenario and
contribution from additional NRVs in the
drillstring. Evaluate risk for pipe failure
based on well path/dog leg severity
11. Emergency shut-in UBD only
12. Emergency well kill and bullheading Including
criteria for shut-in
13. Lost circulation, on bottom and out of hole
14. H2S in the well
15. Loss of rig power
16. Simultaneous kick and loss situation
17. Stuck pipe
18. Failure of method to hold dynamic
backpressure during connections
19. Rig movement
20. Rig/platform alarm with mustering

E
Appendix C
Appendix Figure 1: S-135 Quality Wired Drill Pipe specifications (National Oilwell
Varco)

F
Pressurized Mud Cap Drilling
PCMD is best suited when there is a high risk of lost circulation, like many places in
the Asia Pacific region where cavernous voids encountered during drilling result in
huge fluid losses. An RCD is used to seal off the annulus, but pressures above the
operating limit of the RCD can be experienced. To avoid this problem, a light and
expendable fluid, like seawater with the appropriate additives, is used to drill the
problem zone. This increases ROP, while the drilling fluid along with the cuttings will
be forced into the lost circulation zone. By adding a predetermined column height of
heavy mud in the annulus in addition to surface backpressure no fluid is returned to
surface from the annulus. Well control is thus maintained even if substantial fluid
losses occur. It can be discussed whether this technique is a proactive or reactive one,
as wells often are drilled conventionally until the problem zone is encountered, thus
placing it in the latter category (Birkeland, 2009).
Dual Gradient Drilling
Dual Gradient Drilling (DGD) introduces the idea of drilling using two different
pressure gradients in the well; one between the rig and the wellhead, and one between
the wellhead and TD. DGD may be accomplished in several ways:
Injecting lower density fluids, such as nitrogen or sea water, downhole
through the riser
By utilizing mud returns systems to pump returns topside or regulate
the mud level in the riser
The objective is to manipulate the BHP without circulating in new drilling fluids. The
method is especially useful in Deep Water applications, as the heavy mud column in
the riser may be replaced by a lower density fluid, reducing the BHP, and may thus
contribute to reducing formation damage and fluid losses when drilling through deep
formations with low fracture gradients (Mæland, 2013).
Returns Flow Control MPD
The objective of using the Returns Flow Control (commonly referred to as HSE
MPD) MPD technique is to drill with a closed loop system, minimizing the risk of
getting hazardous materials on deck. Such materials may include unexpected
hydrocarbons (kicks) and corrosive mud systems, and presents a risk to the health and
safety of the deck crew and to the environment. Maintaining a closed loop mud
system is achieved by using an RCD and an NRV. This technique is especially

G
applicable when drilling through HPHT formations. Otherwise, HSE MPD is
conducted using conventional drilling programs and components (Hannegan, 2011).
Additional Tools and Systems
The information that follows is copied in its entirety from (Rehm, et al., 2008), and fit
to the format of this thesis.
Chokes
Power Choke The Power Choke SC models use a cylinder-type choke gate that moves forward to
choke against a seat (Appendix Figure 2). The trim is pressure balanced to allow
smooth operation. When closed, the choke gate sets against the seat to form a leak-
tight seal. Choke operation is by an air-operated hydraulic pump. Normal operation is
a hydraulic motor that operates a worm gear, although an electric motor is available.
The hydraulic motor is rated for 1200–3000 starts and stops per hour to allow
continuous precise choke operation. A manual override is on all worm gear drives.
Appendix Figure 2: Power Choke Section
The control panel contains the pump stroke counters, hydraulic pump, annular and
drill-pipe pressure gauges, control handle, choke position indicator, and pump-speed
controller, which controls the opening and closing speed. Chokes are available in
5000-, 10,000-, 15,000-, and 20,000-psi operating pressure models. Drilling chokes
for MPD operations are available in 2-in. and 3-in. sizes. Operation is with a handle

H
for “open” and “close.” The operator controls the choke movement. Unless
moved, the choke remains in a fixed position. During MPD operations, the choke
maintains a fixed “orifice” unless changed by the operator. Opening and shutting
during pump changes are controlled by the choke operator. Failure is extremely rare
and generally relates to the inability to seal tightly on a pressure test. The normal
operating failure is because of damage to the air or hydraulic system. Because of the
worm drive operating system, the choke operating failure mode is always in the last
fixed position. The Power Choke has been extensively used in MPD operations. A
computer control system that automatically maintains the proper back pressure based
on feedback to a proprietary software system is used by Secure Drilling (see Chapter 4
in (Rehm, et al., 2008)) for control during MPD operations.
Swaco Super Choke The Swaco Super Choke has two 11⁄4-in.-thick lapped tungsten carbide plates with
half-moon openings. The front plate is fixed and the rear plate rotates against it to
fully open when the openings in the plates are aligned and closed when they are out of
phase. Well pressure behind the rotating plate and the lapped seal on the plates allow
the choke to close and seal tightly (Appendix Figure 3). The half-moon openings,
when in phase, have an area slightly less than 2 in.2. The choke movement is by an
air-operated hydraulic pump. Normal operation is a set of hydraulic rams turning the
choke plate through a rack and pinion system. Manual pump operation is available if
the air supply fails. The choke can also be operated manually by lever.
The control panel contains the pump stroke counters, hydraulic pump, annular and
drill-pipe pressure gauges, control handle, choke position indicator, and a needle valve
that controls the opening and closing speed. Chokes are available in 10,000-, 15,000-,
and 20,000-psi operating pressures. All chokes are rated as 2-in. chokes. Operation is
with a handle for opening and closing. The operator controls the choke movement.
Unless moved, the choke remains in a fixed position. During MPD operations, the
choke maintains a fixed “orifice,” unless changed by the operator. Opening and
shutting during pump changes is controlled by the choke operator. Failure is
extremely rare and generally relates to the inability to seal tightly on a pressure test.
The normal operating failure is because of damage to the air or hydraulic system.
Because of the rack and pinion operating system, choke operating failure mode is
always in the last fixed position.

I
Appendix Figure 3: M-I SWACO 10K Super Choke and choke plates
Swaco Auto Super Choke The Auto Choke is suited to MPD operations because it holds the annular pressure
constant. The shuttle closes bubble tight on a metal-to-Teflon seal (Appendix Figure
4). The Auto Choke is a completely different choke from the Super Choke. The Auto
Choke has a tungsten carbide sliding shuttle in a sleeve directly operated by hydraulic
pressure. Pressure set at the console works against the operating area on the shuttle,
which is balanced by the well pressure. The casing pressure transmitter is a piston
shuttle providing direct pressure to the control panel sensor. The response of the
choke to pressure changes is rapid. Choke movement is directly controlled by the
hydraulic balance between the well-bore pressure and the hydraulic pressure setting.
Normal operation is with an air-operated hydraulic pump. Alternate operation is with
a manual hydraulic pump. The control panel contains the set-point indicator, set-point
control, pump stroke counters, hydraulic pump, and annular and drill-pipe pressure
gauges. This choke is available in 10,000-psi operating pressure and is rated as a 3-in.
choke.

J
Appendix Figure 4: Auto Super Choke
The Auto Choke normally is set in the auto mode, which maintains the casing
pressure at a preset value. No further action is required by the operator as long as the
preset casing pressure is not to be changed. The Auto Choke can also be operated in a
manual mode with the operator controlling the casing pressure (Appendix Figure 4).
Failure is rare, with most problems relating to seal tightness on a pressure test. In case
of low air pressure, the hydraulic pump can be operated manually. If the hydraulic
control lines are cut, the choke goes to the open position.
Drill-Pipe Non-return Valves
The drill-pipe non-return valve (NRV) is essential to any MPD operation. MPD
operations often require annulus back pressure. Looking at the U-tube principle so
commonly discussed in well-control activities, it is evident that any positive
unbalance in the annulus forces drilling fluid back up the drill pipe. The drilling fluid
may carry cuttings that plug the motor or MWD or, in the worst case, blow out the
drill pipe. The non-return valve, or one-way valve in the drill pipe, was originally
called a float. That term is still in use in older literature and some of the equipment
descriptions in catalogs. Within the last several years, the term non-return valve, or
NRV, has replaced float as a primary descriptor of the drill-pipe one-way valve.

K
Basic Piston-Type Float The primary line of defense against backflow problems has been the type-G Baker
float, also called a piston float. The piston NRV has a simple piston driven closed by a
spring that looks a bit like an engine valve stem. Drilling fluid pressure forces the
valve open against the spring when circulating; and when the pump is turned off, the
spring and any well-bore pressure force the valve closed. This type of NRV has
proven very reliable and rugged. Failures of this valve have been rare and generally
the result of no maintenance or very high-volume pumping of an abrasive fluid. The
valve is housed in a special sub above the bit, and it is common and prudent for
critical wells to use dual NRVs. The primary two problems with the type-G float are
that it blocks the drill pipe for wire line and the use of the float blocks back pressure
or shut-in drill-pipe pressure from a well kick. As long as the NRV is located just
above the bit, it limits the need to pass a wire line. The shut-in pressure problem is
overcome by slowly increasing the pump pressure until it levels out, indicating that
the valve is open and the pressure is the equivalent of shut-in pressure.
Hydrostatic Control Valve The hydrostatic control valve (HCV) is a subsea version of the bit float valve used in
dual-gradient drilling (Appendix Figure 5). It is used to hold up a column of drilling
fluid in the drill pipe to avoid the U-tube effect when the pump is turned off. This
would be the equivalent pressure of a full column of mud in the riser minus the
pressure of an equivalent column of seawater, regardless of the depth of the hole. The
HCV does not restrict the use of an NRV at the bit to prevent backflow and plugging.
The HCV is a longer tool than the type-G float, to accommodate the spring calibrated
to hold the piston closed against the equivalent pressure of a full column of drilling
fluid in the riser. See Chapter 8, Section 8.5.2 in (Rehm, et al., 2008), for further
discussion and a different design of the tool.
Appendix Figure 5: HCV Valve

L
Inside BOP (Pump-Down Check Valve) The inside BOP is an older tool, from the generation of the piston float. The inside
BOP is designed as a pump-down tool seated in a sub above the bottom-hole assembly
and acting as a check valve against upward flow. The original use of the inside BOP
was during a period when there were objections to running an NRV at the bit because
of the chance of increasing lost circulation. It is now used as a backup to the bit float.
The inside BOP requires a sub in the drill string and inside clearance to run. The sub
often, or normally, is run above the collars or bottom-hole assembly. Once run, it is
not retrievable and blocks the drill string above the collars (Appendix Figure 6).
Appendix Figure 6: Inside BOP NRV

M
Retrievable NRV or Check Valve (Weatherford) The retrievable NRV is an improvement over the older inside BOP, since it can be
pulled without making a pipe trip to the surface. There are two versions:
1. The wire-line retrievable dart valve is a reliable system that sets in a sub
but does not allow access below it (Appendix Figure 7).
2. The retrievable check valve is a flapper-type NRV. The valve leaves an
opening for balls or wire-line passage through the valve.
Down-Hole Annular Valves
Casing Isolation Valve A significant problem in MPD is maintaining control of bottomhole pressure on a trip.
The basis of the MPD system is that it is closely balanced between flow into the well
bore and lost circulation. The ECD as a result of pumping versus being static and
pulling pipe versus running pipe goes through critical pressure changes. This makes it
difficult to control bottom-hole pressure during trips. Trips can be managed by the use
of a casing isolation valve (CIV), stripping, snubbing, or killing the well. All of these
solutions pose technical or cost and NPT problems.
Advantages The CIV offers the most positive solution to the MPD problem of trips. With a casing
isolation valve, the pipe is stripped up into the casing until the bit is above the valve.
The casing isolation valve is then closed, trapping any pressure below it, which allows
the trip to
continue in a normal mode without stripping or killing the well. The well bore below
the CIV comes to equilibrium with the reservoir pressure. So, in a high-pressure well,
to limit pressure buildup below the valve caused by gas migration, the valve needs to
be set as deep as practical. This also has the advantage of limiting stripping distance
up to the valve level.

N
Appendix Figure 7: Retrievable NRV
Constraints The CIV requires a size larger casing to allow space for the valve element to retract
and clear the bit. There are also reasonable differential pressure limits, typically in the
range of 4000 psi. Extreme bent housings (> 3–4°) with stabilizers, used in
directional drilling, may damage the face of the valve.
Drilling Down-Hole Deployment Valve The drilling down-hole deployment valve (DDV™; Weatherford) is a casing isolation
valve run as an integral part of casing that is to be set above the formation of interest.
The design profile of the tool allows for installation in standard casing programs: The
outside diameter (OD) is such that the DDV tool can be installed inside consecutive
standard casing strings, and the ID allows for full bore passage. The tool is operated
from the surface by an umbilical containing two hydraulic control lines, which are run
external to the casing, exiting the casing hanger through a penetrating wellhead, or by
using a flanged side port. With the DDV tool installed and the casing landed, the
equipment on the surface is a small footprint hydraulic control unit. The valve
mechanism itself is a curved, saddle-type flapper, which lands on a matched metal
seat to provide the seal. The curved flapper in the open position fits flat against the
outer casing string. The tool is run into the well as part of the casing, with the flapper
in the locked open position. It is protected during the run-in and drilling by a seal
mandrel equipped with a debris barrier (Appendix Figure 8). This allows the casing to
be cemented in place conventionally with the flapper fully protected. With the flapper

O
in the open position, the well operator has full bore access for operations such as
cement cleanout, drilling, running a liner, perforating, and well completion. When
making a trip out of the hole, the pipe is stripped out until the bit is just above the
DDV valve. Then, the flapper on the DDV valve is closed by the application of
pressure to the “close” control line. Pressure from the control line moves the seal
mandrel upward, allowing the flapper to move into the closed position. This isolates
the upper part of the hole from pressure below. The upper annular pressure is bled off,
and the pipe tripped normally.
Going back in the hole, the pipe or tubing is run in to just above the valve. The rams
are closed and the upper well bore is pressured up to equal to the annulus below the
DDV valve and fluid pumps through the valve. At this point, hydraulic pressure is
applied to the “open” line, driving down the protective seal mandrel and opening
the valve. It is important to note that the tool is not pressure equalized, but the DDV
tool is a power-open, power closed device. The pressure must be equalized before
opening.
Advantages • The well pressure is isolated below the DDV tool once it is closed.
Since there is no pressure at the surface, conventional tripping is
feasible.
• The well remains in an underbalanced or balanced condition while
tripping.
• Tripping time is significantly less than with any other pressurized or
flowing well-bore system.
• No mud density changes are required.
• Minimal footprint and surface equipment are used while drilling.
• It allows for deployment through the BOP stack of long complex
assemblies.
Appendix Figure 8: DDV trip sequence

P
Limits • The DDV should not be used on a long-term basis (for production). It
contains elastomeric seals that can deteriorate over time when exposed
to well effluent.
• The hole size or previous casing needs to be a size larger.
• Pressure limits on the tool must be considered.
• The umbilical cord must be protected during cementing, which may
limit pipe reciprocation.
Quick Trip Valve
The quick trip valve (QTV™), Halliburton's version of the casing isolation valve, is run
as an integral part of a standard casing string. The valve does not require a larger
casing string but, in the open position, restricts the ID of the casing string (Appendix
Figure 9). The operation of the QTV is totally mechanical, and it can be run at any
depth. To open the valve, the upper annulus is pressured up to the same pressure as
below the QTV. A slight overpressure cracks open the valve and acts on the surface
like the beginning of a leak-off test. The drill bit acts as the running tool. Pushing
through the flapper, it opens the valve. Carried on the gauge shoulder of the drill bit is
the engaging sleeve. As the bit passes though the valve, a detent pulls the engaging
sleeve off the bit and the ring locks the flapper open. The engaging ring also acts as a
debris shield and seals the flapper against the wall of the casing sub. To close the
valve, the bit is pulled through the engaging sleeve, which catches on the shoulder on
the bit gauge and is pulled free. As the bit clears the valve flapper, it closes and seals
the lower well bore.

Q
Appendix Figure 9: Quick trip valve.
Advantages • The valve is totally mechanical and can be run at any depth.
• The well pressure below a closed QTV tool is isolated from the surface.
• The well remains in an underbalanced or balanced condition while
tripping.
• Tripping time is significantly less than with any other pressurized or
flowing well-bore system.
• No mud density changes are required.
• No surface equipment is required.
• Long assemblies can be run into the hole through the BOP stack with
no danger from well pressures.
• It can be left in the hole at the end of drilling and completion.
Limits • There is an internal restriction in the casing.
• Pressure limits on the tool must be considered.

R
ECD Reduction Tool
The ECD reduction tool (ECD RT™; Weatherford) is a turbine pump down-hole tool
that produces a dual gradient in the annulus when the mud pump is operating. As
such, it is properly both an ECD reduction tool and a dual-gradient system tool. The
concepts of dual gradients and how they reduce annular and bottom-hole pressure are
discussed in Chapter 8 in (Rehm, et al., 2008). Dual-gradient drilling in the case of
this tool is accomplished by “boosting” an upper section of the annulus mud
column.
Unique Considerations
The ECD tool works in the opposite direction from the “impressed annulus-pressure
” systems. The ECD tool reduces the pressure in the annulus instead of impressing a
pressure. The result of this is that a slightly heavier mud density could be used with
this tool than with the impressed-pressure techniques. This results in being able to
navigate through narrow drilling windows by widening the downhole pressure
margins. Dual-gradient operations have an ongoing problem with the U-tube effect.
When the mud pump is turned off, the system wants to U-tube to equilibrium. While
utilizing the dual-gradient concept, the ECD RT tool does not cause a U-tube effect,
because the static mud density is similar in both the drill pipe and annulus. Several
early references indicated a 450-psi (3100 kPa) reduction in annular pressure at 600-
gpm (2300 Lpm) flow rate. The ECD RT was designed and developed jointly by BP
and Weatherford to provide a low-cost, easy to install and use, tool for ECD
reduction.
Advantages • It requires no drill rig modification or surface footprint. It can be added
to the drill string on a short trip.
• No on-site operator is required.
• It can reduce spikes in equivalent mud-weight values associated with
making connections. The result is a more constant well-bore pressure
profile, whether drilling ahead (pumps on/circulating) or making a
connection (pump off/not circulating).
• In extended-reach wells, it could reduce the ECD problem between the
toe and the heel of the well by boosting the drilling fluid in the long
reach section.
• It does not affect mud-pulse MWD signals.
• The tool is open to wire-line operations.
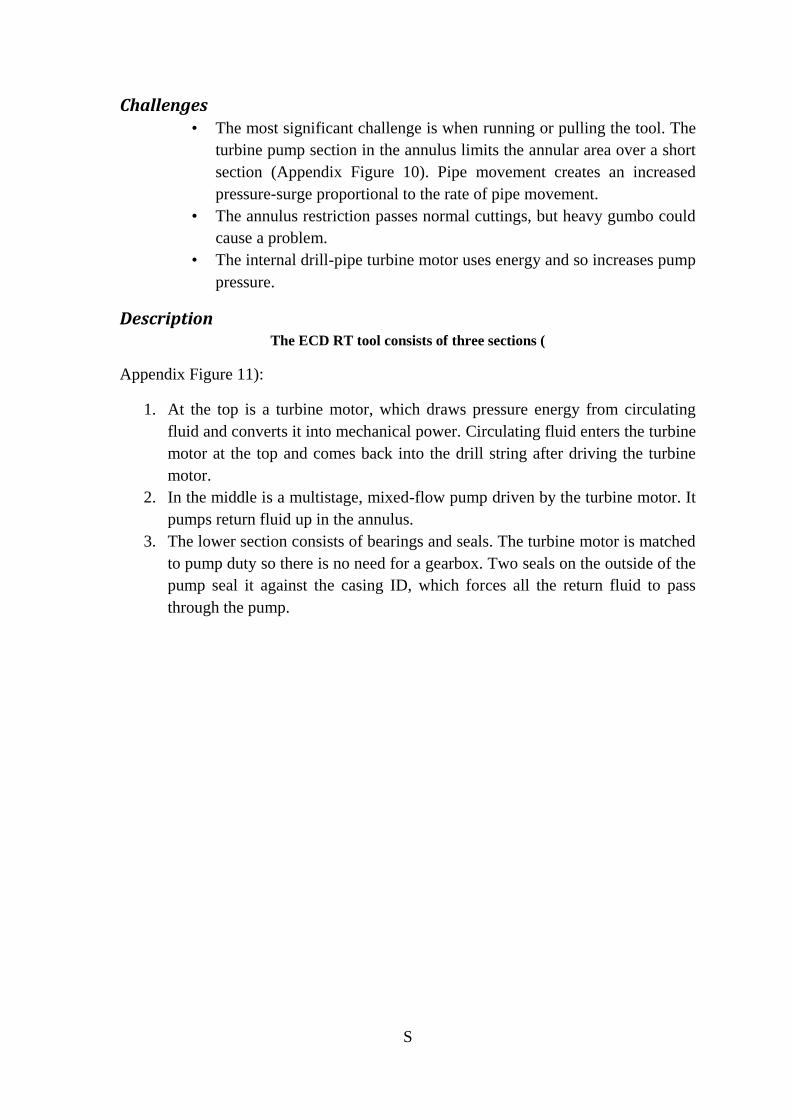
S
Challenges • The most significant challenge is when running or pulling the tool. The
turbine pump section in the annulus limits the annular area over a short
section (Appendix Figure 10). Pipe movement creates an increased
pressure-surge proportional to the rate of pipe movement.
• The annulus restriction passes normal cuttings, but heavy gumbo could
cause a problem.
• The internal drill-pipe turbine motor uses energy and so increases pump
pressure.
Description The ECD RT tool consists of three sections (
Appendix Figure 11):
1. At the top is a turbine motor, which draws pressure energy from circulating
fluid and converts it into mechanical power. Circulating fluid enters the turbine
motor at the top and comes back into the drill string after driving the turbine
motor.
2. In the middle is a multistage, mixed-flow pump driven by the turbine motor. It
pumps return fluid up in the annulus.
3. The lower section consists of bearings and seals. The turbine motor is matched
to pump duty so there is no need for a gearbox. Two seals on the outside of the
pump seal it against the casing ID, which forces all the return fluid to pass
through the pump.

T
Appendix Figure 10: ECD tool (courtesy of Weatherford International Ltd.)
Coriolis Flowmeter
The flowmeter is an important part of flow measurement in some MPD operations.
Since the Coriolis meter is new to drilling operations, the following description is
included as part of the general background for surface equipment. The flowmeter
discussed in Chapter 4 in (Rehm, et al., 2008) is the Emerson Micromotion Coriolis
Meter. The Coriolis meter depends on a flowing mass deflecting a tube. Typically this
is shown as a U-tube (Appendix Figure 12), and this is the configuration shown in
Chapter 4 in (Rehm, et al., 2008). The Coriolis meter is a very accurate method of
measuring drilling fluids since they contain drill cuttings that tend to interfere with
other types of flowmeters. The meter measures and calculates:

U
• Mass flow.
• Volumetric flow.
• Density.
• Temperature.
Appendix Figure 11: ECD tool data (Courtesy of Weatherford International Ltd.
Following is a simple general description of how the system works. For a more
precise description and the mathematical concepts, see the references under Coriolis
Meter.
1. Dual parallel flow tubes, U-tubes, are oscillated in opposition to each other at
their natural frequency by a magnet and coil.
2. Magnet and coil assemblies are mounted on the inlet and outlet side of the
parallel flow tubes with the magnets on one tube and the coils on the other.
3. The vibration of the tubes (Appendix Figure 12) causes the coil output to be a
sine wave that represents the motion of one tube relative to the other.
4. When there is no flow, the sine waves from the input and output coils coincide.
5. The Coriolis Effect from a mass flow through the inlet side of the tubes resists
the vibration. The Coriolis Effect from the mass flow through the outlet side of
the tubes adds to the vibration.
6. The phase difference between the signal from the input and output sides is
used to calculate mass flow.
7. Frequency change from the natural frequency indicates density change.
Increasing mass decreases frequency.
8. Volume flow is mass flow divided by density.
9. Direct temperature measurement is used to correct for temperature changes.

V
Appendix Figure 12: The basis of the Coriolis meter is twin parallel tubes. (Courtesy of
Yokogawa.)

W
Appendix D
Table 14: Commonly used bit size that will pass through API casing (Petrowiki)

X
Table 15: Commonly used bit sizes that will pass through API casing (continued)
(Petrowiki)
Underreamers
An underreamer is a drill string mounted tool used to enlarge a wellbore past its
original drilled size. The tool is typically actuated hydraulically or mechanically,
extending arms carrying drill cutters intended to enlarge the hole. An example of such
a tool can be seen in Appendix Figure 13.

Y
Appendix Figure 13: An example of an underreamer (Bakersfield Bit & Tools)

Z
Table 16: Illustration of underreamer opening size on today's market (Jahns, 2012)
Company
Underreamer
Name
Body
Diameter
[in]
Standard Opening
Diameter [in] Enlargement [%]
Baker Hughes
GaugePro
XPR
Expandable
Reamer
8 1/2 9 7/8 16
10 5/8 12 1/4 15
12 1/4 14 3/4 20
14 1/2 17 1/2 20
16 1/2 20 21
18 1/8 22 21
Halliburton
XRTM
Reamer
borehole
Enlargement
Tool
8 1/4 9 - 12 1/4 9 to 48
10 1/4 11 - 15 3/4 7 to 53
12 13 1/2, 14, 14 3/4, 16,
17 1/2, 18 1/4
12, 16, 23, 33, 46,
52
14 1/4 14 1/2 - 20 1/2 2 to 44
15 3/4 17 1/2 - 22 11 to 40
Schlumberger
Rhino XS
Hydraulically
Expandable
Reamer
7 1/4 8, 9 10 to 23
8 9, 10 1/4 12,5 to 27
9 1/4 10 1/4, 11 3/4 25 to 56
10 11, 12 1/2 25 to 57
10 3/8 11 3/4, 13 1/2 25 to 58
10 5/8 13, 15 25 to 59
13 14 1/2, 16 25 to 60
14 1/4 15 3/4, 18 1/4 25 to 61
16 17 1/2 - 20 9 to 25
17 1/2 21 1/2 - 22 23 to 26
Weatherford Riptide Ⓡ
8 1/4 9, 9 7/8 20
10 1/4 11 3/4, 12 1/4, 13 20
11 3/4 14 3/4 25
14 1/4 17 1/2 23
15 3/4 20 - 22 27 to 40

AA
Appendix E
Flow Diverter Valve
Drill String mounted Flow Diverter Valves may be used in order to reduce the
significance of flow rate related issues caused by the narrow hydraulic diameter in the
annulus; certain components in the BHA, such as RSS assemblies and mud motors
The purpose of such a valve is to divert a part of the flow above the liner to the
surrounding annulus, thus reducing the flow rate around the liner exposed to the
formation.
Such valves are usually actuated by ball-drop or RFID-tagging, and serves to divert a
portion of the flow to the surrounding annular space, while the rest is routed
downhole. If such a valve is mounted above the liner string, the flow rate is reduced
between the liner string and open hole. As is demonstrated in Chapter 6, there is a
close correlation between borehole diameter and annular friction loss, and it may thus
be safely assumed that a reduction in flow rate will cause a reduction in AFP.

BB
Appendix F
Case Study Calculations
Table 17: Supplementary input and output parameters for
Figure 7-6 (OBD)
Input Parameters
Mud weight mud 1835 kg/m^3
Plastic Viscosity pl 0.024 Pas
Yield Stress y 6 Pa
Rate of Penetration ROP 30 m/hr
Pumping Rate Q 2400 lpm
Sea Water Depth MSL 360 m
Length of Liner String Lls 0 m
Length of Drilled Interval Ldrilled 3217.142857 m
Length of Well MD 7357.142857 m
True Vertical Depth (RKB) TVD 5445.063545 m
Bit Size dbit 8.5 inches
Cuttings Density cuttings 2700 kg/m^3
Cuttings Volume Rate qcuttings 1.098288461 m^3/h
Depletion 160 bar
Biot Coefficient 0.95
Poisson's Ratio 0.3
Back Pressure bar
Safety Margins 5 %
Newtonian pann 89 bar
Bingham Plastic pann 77 bar
Power-Law pann 104 bar
Force Turbulent Flow? No
Cuttings transport (v>0.8m/s) Wellbore Cleaning OK!
Top of Reservoir Layer dr,top 4162 m
Bottom of Reservoir Layer dr,bot 4594.25 m
Flow Regime Bingham Plastic
Static Bottom-Hole Pressure pBHP, static 1049 bar

CC
pBHP, dynamic 1126 bar
pBHP, dynamic 2.108282054 SG
Table 18: Supplementary input and output parameters for Figure 7-7 (LD)
Input Parameters
Mud weight mud 1835 kg/m^3
Plastic Viscosity pl 0.024 Pas
Yield Stress y 6 Pa
Rate of Penetration ROP 30 m/hr
Pumping Rate Q 2400 lpm
Sea Water Depth MSL 360 m
Length of Liner String Lls 3167.142857 m
Length of Drilled Interval Ldrilled 3222.142857 m
Length of Well MD 7362.142857 m
True Vertical Depth (RKB) TVD 5446.60863 m
Bit Size dbit 8.5 inches
Cuttings Density cuttings 2700 kg/m^3
Cuttings Volume Rate qcuttings 1.098288461 m^3/h
Depletion 160 bar
Biot Coefficient 0.95
Poisson's Ratio 0.3
Back Pressure bar
Safety Margins 5 %
Newtonian pann 303 bar
Bingham Plastic pann 244 bar
Power-Law pann 342 bar
Force Turbulent Flow? No
Cuttings transport (v>0.8m/s) Wellbore Cleaning OK!
Top of Reservoir Layer dr,top 4162 m
Bottom of Reservoir Layer dr,bot 4594.25 m
Flow Regime Bingham Plastic
Static Bottom-Hole Pressure
pBHP, static 1049 bar
pBHP, dynamic 1293 bar
pBHP, dynamic 2.420270021 SG

DD
Table 19: Supplementary input and output parameters for Figure 7-8 (MPD)
Input Parameters
Mud weight mud 1650 kg/m^3
Plastic Viscosity pl 0.024 Pas
Yield Stress y 6 Pa
Rate of Penetration ROP 30 m/hr
Pumping Rate Q 2400 lpm
Sea Water Depth MSL 360 m
Length of Liner String Lls 0 m
Length of Drilled Interval Ldrilled 3217.142857 m
Length of Well MD 7357.142857 m
True Vertical Depth (RKB) TVD 5445.063545 m
Bit Size dbit 8.5 inches
Cuttings Density cuttings 2700 kg/m^3
Cuttings Volume Rate qcuttings 1.098288461 m^3/h
Depletion 160 bar
Biot Coefficient 0.95
Poisson's Ratio 0.3
Back Pressure 45 bar
Safety Margins 1 %
Newtonian pann 72 bar
Bingham Plastic pann 78 bar
Power-Law pann 91 bar
Force Turbulent Flow? No
Cuttings transport (v>0.8m/s) Wellbore Cleaning OK!
Top of Reservoir Layer dr,top 4162 m
Bottom of Reservoir Layer dr,bot 4594.25 m
Flow Regime Bingham Plastic
Static Bottom-Hole Pressure
pBHP, static 944 bar
pBHP, dynamic 1022 bar
pBHP, dynamic 1.912659153 SG

EE
Table 20: Supplementary input and output parameters for Figure 7-9 (MPCD)
Input Parameters
Mud weight mud 1640 kg/m^3
Plastic Viscosity pl 0.024 Pas
Yield Stress y 6 Pa
Rate of Penetration ROP 30 m/hr
Pumping Rate Q 2400 lpm
Sea Water Depth MSL 360 m
Length of Liner String Lls 3167.142857 m
Length of Drilled Interval Ldrilled 3222.142857 m
Length of Well MD 7362.142857 m
True Vertical Depth (RKB) TVD 5446.60863 m
Bit Size dbit 8.5 inches
Cuttings Density cuttings 2700 kg/m^3
Cuttings Volume Rate qcuttings 1.098288461 m^3/h
Depletion 160 bar
Biot Coefficient 0.95
Poisson's Ratio 0.3
Back Pressure 45 bar
Safety Margins 1 %
Newtonian pann 268 bar
Bingham Plastic pann 230 bar
Power-Law pann 311 bar
Force Turbulent Flow? No
Cuttings transport (v>0.8m/s) Wellbore Cleaning OK!
Top of Reservoir Layer dr,top 4162 m
Bottom of Reservoir Layer dr,bot 4595 m
Flow Regime Bingham Plastic
Static Bottom-Hole Pressure
pBHP, static 939 bar
pBHP, dynamic 1169.25900211085 bar
pBHP, dynamic 2.18834376 SG

FF
Appendix G
Notes on using the hydraulic model
The model has been set up so that it should be relatively easy to use for anyone with a
background in drilling engineering. Different people may, however, have different
ideas about how things should look and be organized. In addition, the model is fairly
complicated, with a lot of calculation steps. Therefore, it is prudent to provide a
simple explanation of how the model should be used.
The Excel sheet is color coded for easy comprehension:
Red cells indicates input parameters
Yellow cells are drop-down boxes, which means that there are restrictions on
the values one can use
Green cells are important output parameters. These mostly pertain to pressure
losses along the well for a given interval
Light blue cells are generally used for calculations (except from where
pressure gradients and depths are implemented in the sheet), and should not be
interfered with.
Appendix Figure 14: Overview of the hydraulic model

GG
Appendix Figure 15: Numbered overview of the hydraulic model
In order to provide an overview of the model, each section has been numbered.
1. Shown in Appendix Figure 16. Drilling parameters such as mud weight, ROP,
depths, pump rate, etc. are inserted here. The user must also insert reservoir
related parameters, such as reservoir layer depth, biot coefficient and
depletion. Output parameters provided for the user include pressure drops
along the wellbore for different rheological models and BHP. The user have
the option of forcing turbulent flow if he or she wishes and may chose the
rheological model to be used (Bingham Plastic is the default). A control
function has been set up to give feedback to the user if the fluid velocity drops
below v = 0.8 m/s in any section of the well.
2. Shown in Appendix Figure 17. Input parameters pertaining to the wellbore
trajectory and diameter goes here. The model uses the information from the
yellow boxes at the top to calculate casing setting points, and inclination
change along with build-up rate (DLS) to calculate the length of build-up
sections.
3. Shown in Appendix Figure 18. This part of the model is used to calculate
everything that may be extrapolated from the information provided thus far,
such as wellbore trajectory, flow velocities, flow regimes, etc. This part of the
model should not be interfered with.
4. Shown in Appendix Figure 19. These cells calculate additional fluid
parameters that are used in pressure loss calculations. These should not be
interfered with.
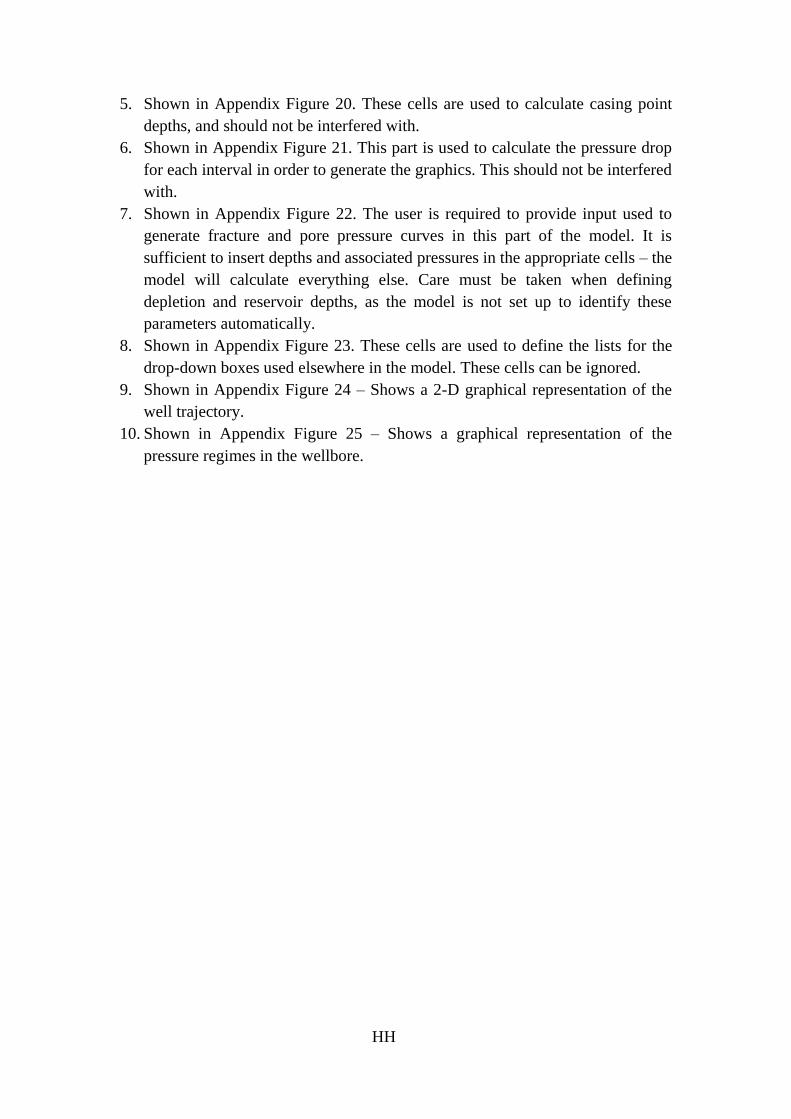
HH
5. Shown in Appendix Figure 20. These cells are used to calculate casing point
depths, and should not be interfered with.
6. Shown in Appendix Figure 21. This part is used to calculate the pressure drop
for each interval in order to generate the graphics. This should not be interfered
with.
7. Shown in Appendix Figure 22. The user is required to provide input used to
generate fracture and pore pressure curves in this part of the model. It is
sufficient to insert depths and associated pressures in the appropriate cells – the
model will calculate everything else. Care must be taken when defining
depletion and reservoir depths, as the model is not set up to identify these
parameters automatically.
8. Shown in Appendix Figure 23. These cells are used to define the lists for the
drop-down boxes used elsewhere in the model. These cells can be ignored.
9. Shown in Appendix Figure 24 – Shows a 2-D graphical representation of the
well trajectory.
10. Shown in Appendix Figure 25 – Shows a graphical representation of the
pressure regimes in the wellbore.

II
Appendix Figure 16: Input and output parameters
Appendix Figure 17: Wellbore parameters

JJ
Appendix Figure 18: Calculations
Appendix Figure 19: Fluid parameters
Appendix Figure 20: Casing point calculations, used for graphical representations

KK
Appendix Figure 21: Pressure drop calculations
Appendix Figure 22: Reservoir parameters

LL
Appendix Figure 23: List parameters
Appendix Figure 24: Graphical representation of the well trajectory

MM
Appendix Figure 25: Graphical representation of the pressure regimes
Copyright © 2022 FDOKUMEN