Sales Maximization through Service Tier Introduction Utilizing ...
12
Sales Maximization through Service Tier Introduction Utilizing LP Model and AHP-based After Sales Pursuit Strategy Selection Pebbles Quimpo, Patrick Santos, Marien Tagaban and Rex Aurelius C. Robielos School of Industrial Engineering and Engineering Management Mapua University Intramuros, Manila, Philippines [email protected], [email protected], [email protected], [email protected] Abstract This study aims to use available company data on annual sales from after sales service subscriptions in countries within the Asia Pacific region. It is also aimed to identify optimal solution in maximizing the annual sales through service tiers introduction using the Linear Programming approach. To realize the optimal solution, this study intends to utilize Analytical Hierarchy Process (AHP) in prioritizing the different alternatives for after sales pursuit strategy implementation per country. The set of criteria was determined using the predictive analytics approach. It was concluded that the annual sales per country in the Asia Pacific region is largely influenced by the number of customer subscriptions. The result of this study is applicable to the proposal being made to meet the company goal of increasing service adoption through service tiers introduction to increase the annual sales of at least 15% in Asia Pacific. Since the number of customer subscription has a positive effect on increasing annual sales, the outcome of the AHP-based after sales pursuit strategy implementation may be used by the company as a customized approach in capturing the targeted sales per country. Keywords Tier Introduction, Sales Optimization, Linear Programming, Pursuit Strategy Selection, Analytical Hierarchy Process Model 1. Introduction The business sector of After Sales Service is known for its special characteristics such as economic dependency, high margins, growth and innovation potential, long service cycles as well as intensive and long-term customer contact (Dombrowski & Malorny, 2017). Likewise, a volatile and therefore poorly predictable demand concerning the offered services, a high degree of individuality and non-standardized customer orders are among the biggest challenges in the After Sales Service (Dombrowski, Engel & Schulze, 2011) . The After Sales Service of producing companies must face these challenges and customer's requirements (e.g. prevention of the downtimes). Moreover, short reaction times are demanded at the highest quality requirements of Customer Service and Spare parts delivery (Bruhn et al., 2013). The after sales services complement the products bought from the company with a long-term vision of taking care of the customers’ prized assets with a potential of ten to twenty years servicing period. The after sales services can be categorized into Spare Parts service, Customer Service, and Accessories Business (Dombrowski & Engel, 2013). The Spare Parts Service covers the areas of demand forecasting, spare part production, spare part distribution and spare parts management. The areas of maintenance, repair, overhaul, trainings, instructions and installation are parts of the Customer Service (Dombrowski, Engel & Schulze, 2011). The Accessories Business focuses on the areas of merchandise, equipment and individualization of products. Within the scope of this paper, the focus is on the overall after-sales service sector (Misra, 2010). Seeing the huge potential in the after-sales service sector, a number of producing companies explored various means to capture this business opportunity through profit maximization. And one of the approaches used to prove that it is feasible to achieve profit maximization is by using Linear Programming. Linear programming, or linear optimization, is a mathematical method to Proceedings of the 2nd African International Conference on Industrial Engineering and Operations Management Harare, Zimbabwe, December 7-10, 2020 © IEOM Society International 2080
-
Upload
khangminh22 -
Category
Documents
-
view
1 -
download
0
Transcript of Sales Maximization through Service Tier Introduction Utilizing ...
Sales Maximization through Service Tier Introduction Utilizing LP Model and AHP-based After Sales Pursuit
Strategy Selection
Pebbles Quimpo, Patrick Santos, Marien Tagaban and Rex Aurelius C. Robielos School of Industrial Engineering and Engineering Management
Mapua University Intramuros, Manila, Philippines
[email protected], [email protected], [email protected], [email protected]
Abstract This study aims to use available company data on annual sales from after sales service subscriptions in countries within the Asia Pacific region. It is also aimed to identify optimal solution in maximizing the annual sales through service tiers introduction using the Linear Programming approach. To realize the optimal solution, this study intends to utilize Analytical Hierarchy Process (AHP) in prioritizing the different alternatives for after sales pursuit strategy implementation per country. The set of criteria was determined using the predictive analytics approach. It was concluded that the annual sales per country in the Asia Pacific region is largely influenced by the number of customer subscriptions. The result of this study is applicable to the proposal being made to meet the company goal of increasing service adoption through service tiers introduction to increase the annual sales of at least 15% in Asia Pacific. Since the number of customer subscription has a positive effect on increasing annual sales, the outcome of the AHP-based after sales pursuit strategy implementation may be used by the company as a customized approach in capturing the targeted sales per country. Keywords Tier Introduction, Sales Optimization, Linear Programming, Pursuit Strategy Selection, Analytical Hierarchy Process Model 1. Introduction The business sector of After Sales Service is known for its special characteristics such as economic dependency, high margins, growth and innovation potential, long service cycles as well as intensive and long-term customer contact (Dombrowski & Malorny, 2017). Likewise, a volatile and therefore poorly predictable demand concerning the offered services, a high degree of individuality and non-standardized customer orders are among the biggest challenges in the After Sales Service (Dombrowski, Engel & Schulze, 2011) . The After Sales Service of producing companies must face these challenges and customer's requirements (e.g. prevention of the downtimes). Moreover, short reaction times are demanded at the highest quality requirements of Customer Service and Spare parts delivery (Bruhn et al., 2013).
The after sales services complement the products bought from the company with a long-term vision of taking care of the customers’ prized assets with a potential of ten to twenty years servicing period. The after sales services can be categorized into Spare Parts service, Customer Service, and Accessories Business (Dombrowski & Engel, 2013). The Spare Parts Service covers the areas of demand forecasting, spare part production, spare part distribution and spare parts management. The areas of maintenance, repair, overhaul, trainings, instructions and installation are parts of the Customer Service (Dombrowski, Engel & Schulze, 2011). The Accessories Business focuses on the areas of merchandise, equipment and individualization of products. Within the scope of this paper, the focus is on the overall after-sales service sector (Misra, 2010).
Seeing the huge potential in the after-sales service sector, a number of producing companies explored various means to capture this business opportunity through profit maximization. And one of the approaches used to prove that it is feasible to achieve profit maximization is by using Linear Programming. Linear programming, or linear optimization, is a mathematical method to
Proceedings of the 2nd African International Conference on Industrial Engineering and Operations Management Harare, Zimbabwe, December 7-10, 2020
© IEOM Society International 2080
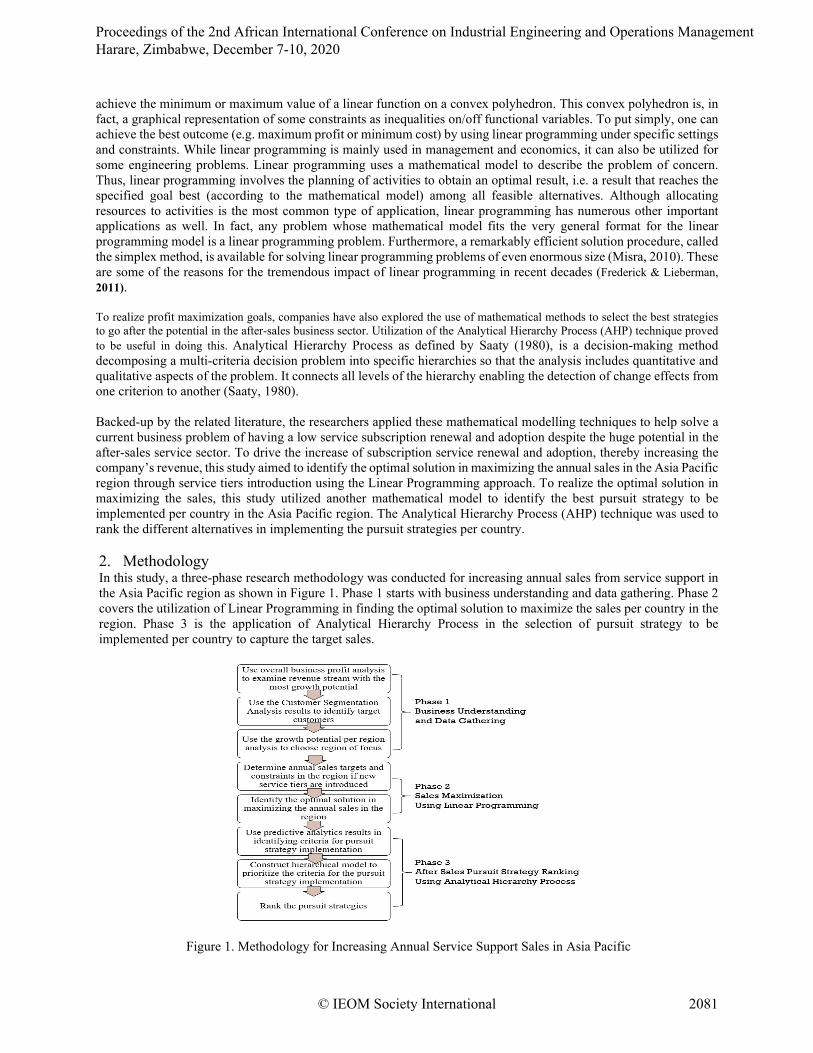
achieve the minimum or maximum value of a linear function on a convex polyhedron. This convex polyhedron is, in fact, a graphical representation of some constraints as inequalities on/off functional variables. To put simply, one can achieve the best outcome (e.g. maximum profit or minimum cost) by using linear programming under specific settings and constraints. While linear programming is mainly used in management and economics, it can also be utilized for some engineering problems. Linear programming uses a mathematical model to describe the problem of concern. Thus, linear programming involves the planning of activities to obtain an optimal result, i.e. a result that reaches the specified goal best (according to the mathematical model) among all feasible alternatives. Although allocating resources to activities is the most common type of application, linear programming has numerous other important applications as well. In fact, any problem whose mathematical model fits the very general format for the linear programming model is a linear programming problem. Furthermore, a remarkably efficient solution procedure, called the simplex method, is available for solving linear programming problems of even enormous size (Misra, 2010). These are some of the reasons for the tremendous impact of linear programming in recent decades (Frederick & Lieberman, 2011). To realize profit maximization goals, companies have also explored the use of mathematical methods to select the best strategies to go after the potential in the after-sales business sector. Utilization of the Analytical Hierarchy Process (AHP) technique proved to be useful in doing this. Analytical Hierarchy Process as defined by Saaty (1980), is a decision-making method decomposing a multi-criteria decision problem into specific hierarchies so that the analysis includes quantitative and qualitative aspects of the problem. It connects all levels of the hierarchy enabling the detection of change effects from one criterion to another (Saaty, 1980). Backed-up by the related literature, the researchers applied these mathematical modelling techniques to help solve a current business problem of having a low service subscription renewal and adoption despite the huge potential in the after-sales service sector. To drive the increase of subscription service renewal and adoption, thereby increasing the company’s revenue, this study aimed to identify the optimal solution in maximizing the annual sales in the Asia Pacific region through service tiers introduction using the Linear Programming approach. To realize the optimal solution in maximizing the sales, this study utilized another mathematical model to identify the best pursuit strategy to be implemented per country in the Asia Pacific region. The Analytical Hierarchy Process (AHP) technique was used to rank the different alternatives in implementing the pursuit strategies per country. 2. Methodology In this study, a three-phase research methodology was conducted for increasing annual sales from service support in the Asia Pacific region as shown in Figure 1. Phase 1 starts with business understanding and data gathering. Phase 2 covers the utilization of Linear Programming in finding the optimal solution to maximize the sales per country in the region. Phase 3 is the application of Analytical Hierarchy Process in the selection of pursuit strategy to be implemented per country to capture the target sales.
Figure 1. Methodology for Increasing Annual Service Support Sales in Asia Pacific
Proceedings of the 2nd African International Conference on Industrial Engineering and Operations Management Harare, Zimbabwe, December 7-10, 2020
© IEOM Society International 2081

Phase 1: Business Understanding and Data Gathering The ‘business understanding and data gathering’ process utilized the actual data on orders, actual sales, and product registration provided by the Marketing and Business Development group in the company. This set of data was analyzed to identify the region with the most growth potential, together with another company provided data showing the results of the business profit analysis and customer segmentation analysis that’s been done on the Executive level. The business profit analysis result was used to examine revenue stream with the most growth potential while the customer segmentation analysis was used to identify the target customers. This study also utilized information in the related literature on the after sales sector having high profit margins, profit optimization using linear programming, and selecting the best marketing strategy using AHP. This was done to determine feasibility of increasing service support sales in Asia Pacific by introducing new support tiers to the customers. Phase 2: Sales Maximization Using Linear Programming The ‘sales maximization using linear programming’ covered the process of transforming the business problem into a linear programming model and identifying the constraints based on the annual sales target per country per region. These constraints were presented in a constraint table. This process also included identifying the decision variables and utilizing Microsoft Solver to solve for the optimal solution of maximizing the annual sales in the region. Phase 3: After Sales Pursuit Strategy Ranking Using Analytical Hierarchy Process The ‘after sales pursuit strategy ranking using Analytical Hierarchy Process’ covers the method of selecting the best strategy to capture the new service tier market. This utilized the AHP to rank current pursuit strategies implemented per country. The criteria and sub-criteria used in the AHP model came from the predictive analytics results which was done in the previous study. The weights per criteria were then assigned. A survey using pairwise comparison between alternatives was created and sent out to the Marketing and Business Development group. This survey was aimed to assess the weights of alternative per criteria and sub criteria. Both the weight per criteria and the weights of alternative per criteria/sub criteria were used by the AHP model to come up with a ranking or a prioritized pursuit strategy per country. 3. Results 3.1. Phase 1: Business Understanding and Data Gathering As part of the company’s overall business profit analysis, growth potential in the different kinds of business model was examined. The different kinds of business, which are the company’s revenue streams, consist of KOB1 (new business/new customers), KOB2 (expansion of existing business), and KOB3 (maintenance of existing businesses). As seen in Figure 2, the result of the business profit analysis pointed to KOB3 as the business sector with the highest growth potential of more than 50% margin compared to KOB1 and KOB2. Therefore, it is necessary to secure the profits gained by the KOB3. Seeing that potential in the after-sales service sector, another company-driven study was conducted to segment customers according to their strategic importance and budget allocation. This put focus on the two types of customers: (1) Customers with budget but do not see value in the services that the company provide (2) Customers who do not have budget but see value in the services that the company provide, as seen in Figure 2. Understanding the types of customer benefits the company in several strategic ways as it enables them to tailor their approaches such as customer retention to continuously engage Customer Segment 1 and service adoption to capture Customer Segment 2. As this study aims to maximize sales through new service tiers introduction, the chosen target was Customer Segment 2.
Figure 2. Kind of Business and Customer Segment Distribution
Proceedings of the 2nd African International Conference on Industrial Engineering and Operations Management Harare, Zimbabwe, December 7-10, 2020
© IEOM Society International 2082
The cost schemes targeted to Customer Segment 2 is shown in Table 1. The 0.8P scheme is the price of Tier 2, where P is the average price per country, based on the available features that will be provided to the customers. The 0.6P scheme is the price of Tier 3 based on the available features that will be provided to the customers. The service features to be provided according to Tier are pre-defined by the Marketing group in the company as approved by the Executives, is shown in Table 2.
Table 1. Cost Scheme per Tier (where P is the average price per country)
Service Tier Description Cost Scheme Tier 1 Premium Service P Tier 2 Essential Service 0.8P Tier 3 Basic Service 0.6P
Table 2. Available Features per Tier
Service Features Tier1
Premium Tier2 Essential
Tier3 Basic
Feature 1 Feature 1.1 Feature 1.2 Feature 1.3 Feature 1.4 Feature 1.5 Feature 1.6 Feature 1.7 Feature 1.8
Feature 2 Feature 3 Feature 4 Feature 5 Feature 6 Feature 7 Feature 8 Feature 9
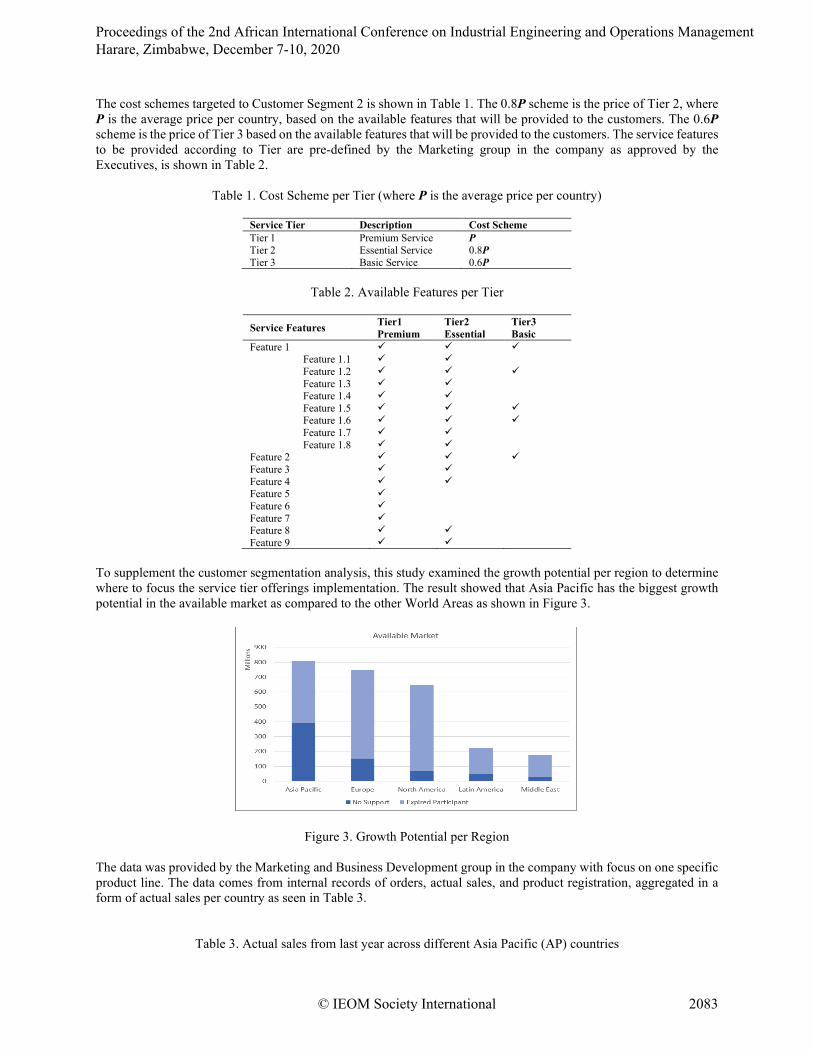
To supplement the customer segmentation analysis, this study examined the growth potential per region to determine where to focus the service tier offerings implementation. The result showed that Asia Pacific has the biggest growth potential in the available market as compared to the other World Areas as shown in Figure 3.
Figure 3. Growth Potential per Region
The data was provided by the Marketing and Business Development group in the company with focus on one specific product line. The data comes from internal records of orders, actual sales, and product registration, aggregated in a form of actual sales per country as seen in Table 3.
Table 3. Actual sales from last year across different Asia Pacific (AP) countries
Proceedings of the 2nd African International Conference on Industrial Engineering and Operations Management Harare, Zimbabwe, December 7-10, 2020
© IEOM Society International 2083
Asia Pacific Countries
Ratio of Average Price of Country to Region
Previous Year Total Baseline Sales ($)
China 1.09 66,232,557 India 1.21 27,127,742 Australia 0.84 14,084,618 Taiwan 1.26 10,322,627 South Korea 0.88 10,041,036 Brunei 0.75 1,234,974 Malaysia 0.97 6,483,586 Japan 0.60 4,915,789 Singapore 0.76 4,845,039 Thailand 0.88 3,784,571 Indonesia 0.62 3,150,889 Philippines 0.77 1,665,701 New Zealand 0.58 1,385,997 Vietnam 0.69 1,275,804 Pakistan 0.59 662,617 Myanmar 0.67 390,393 Bangladesh 2.12 384,977
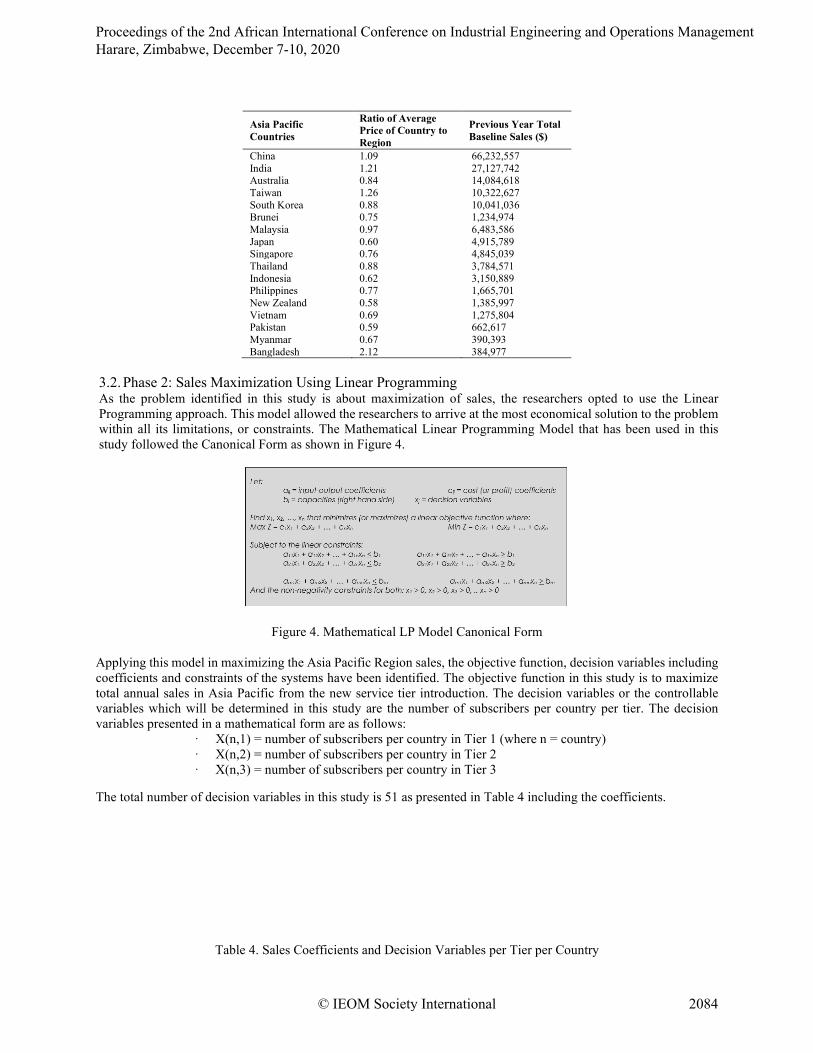
3.2. Phase 2: Sales Maximization Using Linear Programming As the problem identified in this study is about maximization of sales, the researchers opted to use the Linear Programming approach. This model allowed the researchers to arrive at the most economical solution to the problem within all its limitations, or constraints. The Mathematical Linear Programming Model that has been used in this study followed the Canonical Form as shown in Figure 4.
Figure 4. Mathematical LP Model Canonical Form
Applying this model in maximizing the Asia Pacific Region sales, the objective function, decision variables including coefficients and constraints of the systems have been identified. The objective function in this study is to maximize total annual sales in Asia Pacific from the new service tier introduction. The decision variables or the controllable variables which will be determined in this study are the number of subscribers per country per tier. The decision variables presented in a mathematical form are as follows:
· X(n,1) = number of subscribers per country in Tier 1 (where n = country) · X(n,2) = number of subscribers per country in Tier 2 · X(n,3) = number of subscribers per country in Tier 3
The total number of decision variables in this study is 51 as presented in Table 4 including the coefficients.
Table 4. Sales Coefficients and Decision Variables per Tier per Country
Proceedings of the 2nd African International Conference on Industrial Engineering and Operations Management Harare, Zimbabwe, December 7-10, 2020
© IEOM Society International 2084
Asia Pacific Countries Tier 1 Tier 2 Tier 3 China 1.09 * X(a, 1) 0.87 * X(a, 2) 0.65 * X(a, 3) India 1.21 * X(b, 1) 0.97 * X(b, 2) 0.73 * X(b, 3) Australia 0.84 * X(c, 1) 0.67 * X(c, 2) 0.50 * X(c, 3) Taiwan 1.26 * X(d, 1) 1.01 * X(d, 2) 0.76 * X(d, 3) South Korea 0.88 * X(e, 1) 0.70 * X(e, 2) 0.53 * X(e, 3) Brunei 0.75 * X(f, 1) 0.60 * X(f, 2) 0.45 * X(f, 3) Malaysia 0.97 * X(g, 1) 0.77 * X(g, 2) 0.58 * X(g, 3) Japan 0.60 * X(h, 1) 0.48 * X(h, 2) 0.36 * X(h, 3) Singapore 0.76 * X(i, 1) 0.61 * X(i, 2) 0.46 * X(i, 3) Thailand 0.88 * X(j, 1) 0.70 * X(j, 2) 0.53 * X(j, 3) Indonesia 0.62 * X(k, 1) 0.50 * X(k, 2) 0.37 * X(k, 3) Philippines 0.77 * X(l, 1) 0.61 * X(l, 2) 0.46 * X(l, 3) New Zealand 0.58 * X(m, 1) 0.47 * X(m, 2) 0.35 * X(m, 3) Vietnam 0.69 * X(n, 1) 0.55 * X(n, 2) 0.41 * X(n, 3) Pakistan 0.59 * X(o, 1) 0.47 * X(o, 2) 0.35 * X(o, 3) Myanmar 0.67 * X(p, 1) 0.54 * X(p, 2) 0.40 * X(p, 3) Bangladesh 2.12 * X(q, 1) 1.69 * X(q, 2) 1.27 * X(q, 3)
The constraints or the targets in this study, expressed as linear equations, are as follows:
· Constraint 1: >=10% annual sales increase per country · Constraint 2: Total sales for Tier 1 per Country 80% to 95% of last year’s sales · Constraint 3: Total sales for Tier2 per Country >=2.5% of last year’s sales · Constraint 4: Total sales for Tier3 per Country >=2.5% of last year’s sales · Constraint 5: Total sales for Asia Pacific region >= 115% of last year’s sales · Constraint 6: Non-negativity: Z, X(a, 1)... X(q, 3) > 0
The total number of constraints in this study is 87 as presented in Table 5 and Table 6.
Table 5. Constraints Table (in $)
Asia Pacific Countries
Last year Sales (Masked)
>=10% annual sales increase per country
Total sales for Tier 1 per Country 80% to 95% of last year’s sales
Total sales for Tier 1 per Country 80% to 95% of last year’s sales
Total sales for Tier2 per Country >=2.5% of last year’s sales
Total sales for Tier3 per Country >=2.5% of last year’s sales
China 66,232,557 72,855,812 62,920,929 52,986,045 1,655,814 1,655,814 India 27,127,742 29,840,516 25,771,355 21,702,193 678,194 678,194 Australia 14,084,618 15,493,080 13,380,387 11,267,694 352,115 352,115 Taiwan 10,322,627 11,354,889 9,806,495 8,258,101 258,066 258,066 South Korea 10,041,036 11,045,139 9,538,984 8,032,829 251,026 251,026 Brunei Darussalam 1,234,974 1,358,472 1,173,226 987,979 30,874 30,874 Malaysia 6,483,586 7,131,945 6,159,407 5,186,869 162,090 162,090 Japan 4,915,789 5,407,368 4,669,999 3,932,631 122,895 122,895 Singapore 4,845,039 5,329,543 4,602,787 3,876,031 121,126 121,126 Thailand 3,784,571 4,163,029 3,595,343 3,027,657 94,614 94,614 Indonesia 3,150,889 3,465,978 2,993,345 2,520,712 78,772 78,772 Philippines 1,665,701 1,832,271 1,582,416 1,332,561 41,643 41,643 New Zealand 1,385,997 1,524,597 1,316,698 1,108,798 34,650 34,650 Vietnam 1,275,804 1,403,384 1,212,014 1,020,643 31,895 31,895 Pakistan 662,617 728,878 629,486 530,093 16,565 16,565 Myanmar 390,393 429,432 370,873 312,314 9,760 9,760 Bangladesh 384,977 423,475 365,728 307,982 9,624 9,624
Table 6. Total sales for Asia Pacific Region Constraint
Total Asia Pacific Sales from Last Year 157,988,917 Total sales for Asia Pacific Region >= 115% of last year’s sales 181,687,254
Using the simplex algorithm function of the MS-Solver, the LP model results generated are shown in Table 7 and Table 8. Based for the results, the targets are achievable, given that the
Proceedings of the 2nd African International Conference on Industrial Engineering and Operations Management Harare, Zimbabwe, December 7-10, 2020
© IEOM Society International 2085
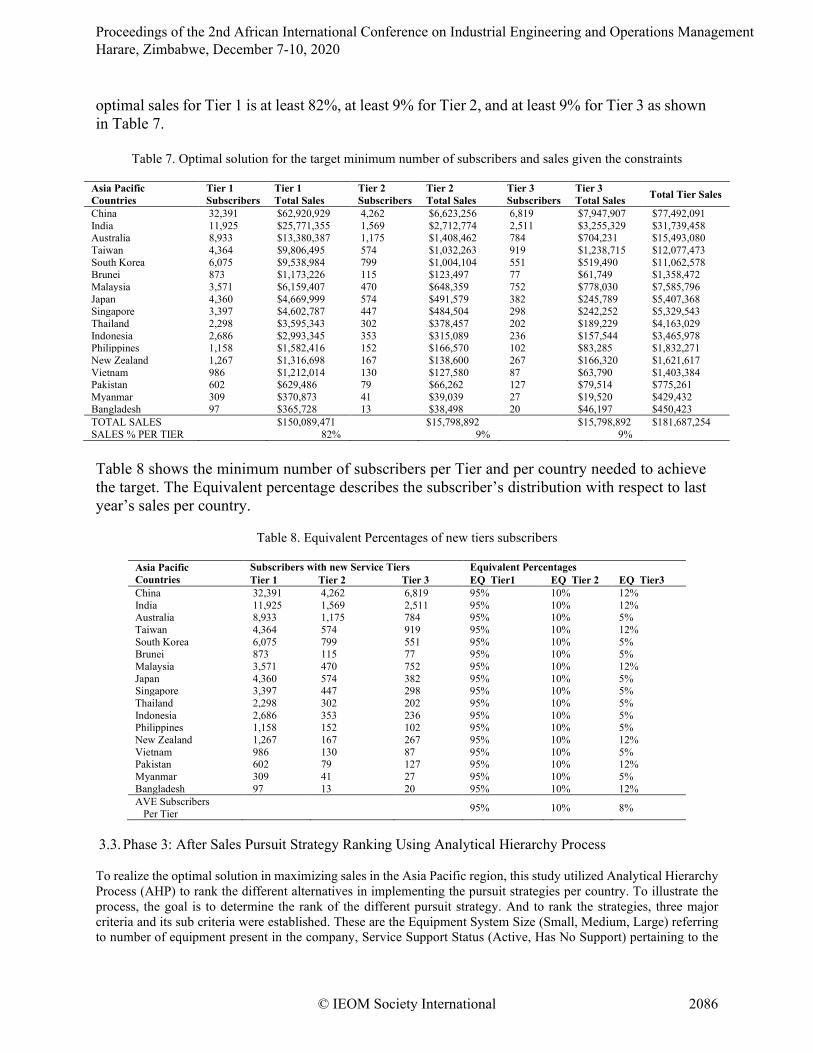
optimal sales for Tier 1 is at least 82%, at least 9% for Tier 2, and at least 9% for Tier 3 as shown in Table 7.
Table 7. Optimal solution for the target minimum number of subscribers and sales given the constraints
Asia Pacific Countries
Tier 1 Subscribers
Tier 1 Total Sales
Tier 2 Subscribers
Tier 2 Total Sales
Tier 3 Subscribers
Tier 3 Total Sales Total Tier Sales
China 32,391 $62,920,929 4,262 $6,623,256 6,819 $7,947,907 $77,492,091 India 11,925 $25,771,355 1,569 $2,712,774 2,511 $3,255,329 $31,739,458 Australia 8,933 $13,380,387 1,175 $1,408,462 784 $704,231 $15,493,080 Taiwan 4,364 $9,806,495 574 $1,032,263 919 $1,238,715 $12,077,473 South Korea 6,075 $9,538,984 799 $1,004,104 551 $519,490 $11,062,578 Brunei 873 $1,173,226 115 $123,497 77 $61,749 $1,358,472 Malaysia 3,571 $6,159,407 470 $648,359 752 $778,030 $7,585,796 Japan 4,360 $4,669,999 574 $491,579 382 $245,789 $5,407,368 Singapore 3,397 $4,602,787 447 $484,504 298 $242,252 $5,329,543 Thailand 2,298 $3,595,343 302 $378,457 202 $189,229 $4,163,029 Indonesia 2,686 $2,993,345 353 $315,089 236 $157,544 $3,465,978 Philippines 1,158 $1,582,416 152 $166,570 102 $83,285 $1,832,271 New Zealand 1,267 $1,316,698 167 $138,600 267 $166,320 $1,621,617 Vietnam 986 $1,212,014 130 $127,580 87 $63,790 $1,403,384 Pakistan 602 $629,486 79 $66,262 127 $79,514 $775,261 Myanmar 309 $370,873 41 $39,039 27 $19,520 $429,432 Bangladesh 97 $365,728 13 $38,498 20 $46,197 $450,423 TOTAL SALES $150,089,471 $15,798,892 $15,798,892 $181,687,254 SALES % PER TIER 82% 9% 9%
Table 8 shows the minimum number of subscribers per Tier and per country needed to achieve the target. The Equivalent percentage describes the subscriber’s distribution with respect to last year’s sales per country.
Table 8. Equivalent Percentages of new tiers subscribers
Asia Pacific Countries
Subscribers with new Service Tiers Equivalent Percentages Tier 1 Tier 2 Tier 3 EQ_Tier1 EQ_Tier 2 EQ_Tier3
China 32,391 4,262 6,819 95% 10% 12% India 11,925 1,569 2,511 95% 10% 12% Australia 8,933 1,175 784 95% 10% 5% Taiwan 4,364 574 919 95% 10% 12% South Korea 6,075 799 551 95% 10% 5% Brunei 873 115 77 95% 10% 5% Malaysia 3,571 470 752 95% 10% 12% Japan 4,360 574 382 95% 10% 5% Singapore 3,397 447 298 95% 10% 5% Thailand 2,298 302 202 95% 10% 5% Indonesia 2,686 353 236 95% 10% 5% Philippines 1,158 152 102 95% 10% 5% New Zealand 1,267 167 267 95% 10% 12% Vietnam 986 130 87 95% 10% 5% Pakistan 602 79 127 95% 10% 12% Myanmar 309 41 27 95% 10% 5% Bangladesh 97 13 20 95% 10% 12% AVE Subscribers Per Tier
95% 10% 8%
3.3. Phase 3: After Sales Pursuit Strategy Ranking Using Analytical Hierarchy Process To realize the optimal solution in maximizing sales in the Asia Pacific region, this study utilized Analytical Hierarchy Process (AHP) to rank the different alternatives in implementing the pursuit strategies per country. To illustrate the process, the goal is to determine the rank of the different pursuit strategy. And to rank the strategies, three major criteria and its sub criteria were established. These are the Equipment System Size (Small, Medium, Large) referring to number of equipment present in the company, Service Support Status (Active, Has No Support) pertaining to the
Proceedings of the 2nd African International Conference on Industrial Engineering and Operations Management Harare, Zimbabwe, December 7-10, 2020
© IEOM Society International 2086
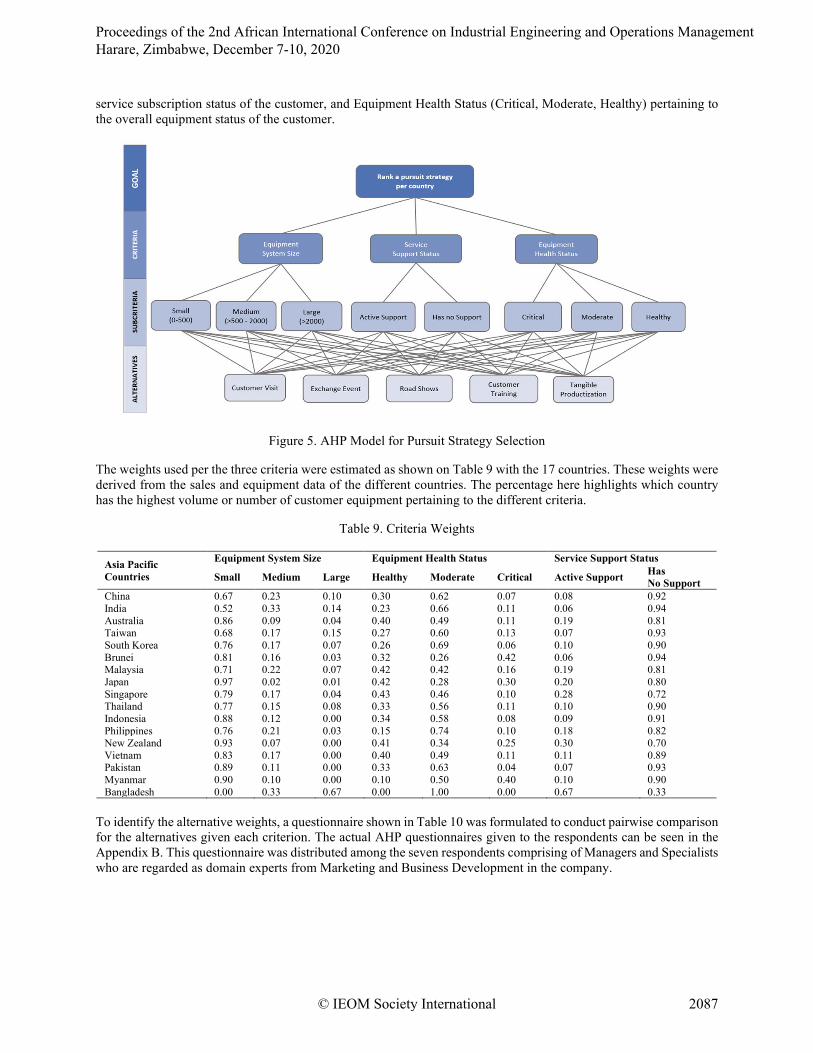
service subscription status of the customer, and Equipment Health Status (Critical, Moderate, Healthy) pertaining to the overall equipment status of the customer.
Figure 5. AHP Model for Pursuit Strategy Selection
The weights used per the three criteria were estimated as shown on Table 9 with the 17 countries. These weights were derived from the sales and equipment data of the different countries. The percentage here highlights which country has the highest volume or number of customer equipment pertaining to the different criteria.
Table 9. Criteria Weights
Asia Pacific Countries
Equipment System Size Equipment Health Status Service Support Status
Small Medium Large Healthy Moderate Critical Active Support Has No Support
China 0.67 0.23 0.10 0.30 0.62 0.07 0.08 0.92 India 0.52 0.33 0.14 0.23 0.66 0.11 0.06 0.94 Australia 0.86 0.09 0.04 0.40 0.49 0.11 0.19 0.81 Taiwan 0.68 0.17 0.15 0.27 0.60 0.13 0.07 0.93 South Korea 0.76 0.17 0.07 0.26 0.69 0.06 0.10 0.90 Brunei 0.81 0.16 0.03 0.32 0.26 0.42 0.06 0.94 Malaysia 0.71 0.22 0.07 0.42 0.42 0.16 0.19 0.81 Japan 0.97 0.02 0.01 0.42 0.28 0.30 0.20 0.80 Singapore 0.79 0.17 0.04 0.43 0.46 0.10 0.28 0.72 Thailand 0.77 0.15 0.08 0.33 0.56 0.11 0.10 0.90 Indonesia 0.88 0.12 0.00 0.34 0.58 0.08 0.09 0.91 Philippines 0.76 0.21 0.03 0.15 0.74 0.10 0.18 0.82 New Zealand 0.93 0.07 0.00 0.41 0.34 0.25 0.30 0.70 Vietnam 0.83 0.17 0.00 0.40 0.49 0.11 0.11 0.89 Pakistan 0.89 0.11 0.00 0.33 0.63 0.04 0.07 0.93 Myanmar 0.90 0.10 0.00 0.10 0.50 0.40 0.10 0.90 Bangladesh 0.00 0.33 0.67 0.00 1.00 0.00 0.67 0.33
To identify the alternative weights, a questionnaire shown in Table 10 was formulated to conduct pairwise comparison for the alternatives given each criterion. The actual AHP questionnaires given to the respondents can be seen in the Appendix B. This questionnaire was distributed among the seven respondents comprising of Managers and Specialists who are regarded as domain experts from Marketing and Business Development in the company.
Proceedings of the 2nd African International Conference on Industrial Engineering and Operations Management Harare, Zimbabwe, December 7-10, 2020
© IEOM Society International 2087

Table 10. Sample AHP Questionnaire
Indicators 9 8 7 6 5 4 3 2 1 2 3 4 5 6 7 8 9 Indicators Customer Visit 9 8 7 6 5 4 3 2 1 2 3 4 5 6 7 8 9 Exchange Event Customer Visit 9 8 7 6 5 4 3 2 1 2 3 4 5 6 7 8 9 Road Shows Customer Visit 9 8 7 6 5 4 3 2 1 2 3 4 5 6 7 8 9 Customer Training Customer Visit 9 8 7 6 5 4 3 2 1 2 3 4 5 6 7 8 9 Tangible Productization Exchange Event 9 8 7 6 5 4 3 2 1 2 3 4 5 6 7 8 9 Road Shows Exchange Event 9 8 7 6 5 4 3 2 1 2 3 4 5 6 7 8 9 Customer Training Exchange Event 9 8 7 6 5 4 3 2 1 2 3 4 5 6 7 8 9 Tangible Productization
The researchers emphasize that the respondents have provided their individual assessments and that these were collated and converted into a collective decision for each of the listed pairwise comparison indicators through their geometrical average. [6] The scale ranges from one to nine where one signifies that the two elements are equally important. On the other hand, the number nine implies that one element is extremely important over the other in a pairwise matrix. The scale and the value of importance is described in Table 11.
Table 11. AHP Scale
Importance Definition of Importance 1 Equally Important 2 Equally to Moderately Important 3 Moderately Important 4 Moderately to Strongly Important 5 Strongly Important 6 Strongly to Very Strongly Important 7 Very Strongly Important 8 Very Strongly to Extremely Important 9 Extremely Important
The pairwise comparison matrix will be established through the calculation of Eigenvalue and Eigenvector. As it is important to assess the consistency of the comparison matrix, a less than 10% consistency ratio will be observed in the study. The (1) Eigenvalue, (2) Eigenvector, and (3) Consistency Ratio formula are presented below.
Eigenvalue: (1)
Eigenvector: (A-λ max I) X =0 (2) Consistency Ratio: CR= CI / RI (3)
To come up with the AHP results, an AHP Microsoft Excel template was used and less than 10% consistency ratio was observed as Saaty suggests and if exceeds beyond that the results may be too inconsistent to be reliable. In the overall result of the AHP model in ranking strategies, researchers started with top 5 high sales countries (China, India, Taiwan, Australia, Taiwan, and South Korea) from the linear model, to show sample results.
As shown in Figure 6, the comparison graph, the highest bar indicates highest rank. Introduction of tangible service is the first strategy for all the five countries, followed by Customer site visit for Australia and South Korea. For India and Taiwan, its Company Exchange and their 3rd rank is customer site visit. 3rd rank for Australia and South Korea followed by Company Exchange. The 4th and last rank is similar for all countries, Road shows and Customer Trainings. The company’s five pursuit strategies currently implemented equally across countries in the Asia Pacific region. With this study, utilizing AHP proved that the approach in implementing these pursuit strategies may be customized per country based on the suggested ranking as shown in Table 12.
Proceedings of the 2nd African International Conference on Industrial Engineering and Operations Management Harare, Zimbabwe, December 7-10, 2020
© IEOM Society International 2088

Table 12. Ranking of Pursuit Strategies per Country
Pursuit Strategy China China Rank India India
Rank Australia Australia Rank Taiwan Taiwan
Rank South Korea
South Korea Rank
Customer Site Visit 17.7% 2 17.2% 3 19.9% 2 17.5% 3 17.8% 2 Company Exchange 17.5% 3 17.9% 2 15.8% 3 17.7% 2 17.2% 3 Road Shows 14.8% 4 15.0% 4 13.6% 4 14.9% 4 14.7% 4 Customer Training 8.9% 5 8.5% 5 10.6% 5 8.7% 5 9.2% 5 Introduce Tangible services 41.2% 1 41.5% 1 40.1% 1 41.2% 1 41.1% 1
Figure 6. Comparison graph of the top 5 countries
4. Discussion Phase 1 results gave us the context of the business problem which is to maximize the annual sales with the introduction of the new service tiers, capturing KOB3 in a Customer Segment 2 market, and focusing in Asia Pacific region. Based from the data gathered and results, Asia Pacific has the most growth potential in terms subscribers with existing products but do not have support features. This is because the nature of the products that the company provide is easy-to-use, highly reliable, and stand-alone which means that once configured and set up, the customers can run their operations with minimal to no support. Hence, in most situation customers find the service support, as an add-on and not as a necessity. While having quality products attract customers, it is common for the company to encounter challenges in increasing the profit and encouraging the customers to get or continue with their service support subscriptions. One way to attract customers is to introduce a tiered pricing strategy. A tiered pricing strategy is used by companies to provide products and services at different price points by limiting or expanding the features/functionalities corresponding to each tier price. The most used approach in the industry is the 3-Tier strategy, namely Basic, Standard, and Premium, because of its simplicity and ease of implementation, hence, applied in this study.
The results of the linear programming proved that the maximization of sales can be achieved if the company's total target for Tier 1 sales is at a minimum 82% while the remaining 18% is equally divided between Tier 2 and Tier 3. The 82% projected total sales of Tier 1 is equivalent to 95% of Tier 1 customers in the existing scheme. This means that there is no expected sales growth or there could even be a shrink in the customer base for Tier 1 as it is projected to have a 5% customer shift to either Tier 2 or Tier 3 support. Although this seemed to be a net loss, this event is a normal occurrence and is justifiable given that the introduction of new service tiers will give customers more options and flexibility to adopt a more practical and suitable service feature offering. The sales growth will be realized from the new tiers, with approximately 10% of the annual sales target for Tier 2 and ~8% for Tier 3. These are achievable targets and is only equivalent to 2.93% sales of the total $808M of the available market. This means that the Marketing and Business Development group should focus and implement strategies to maintain current Tier 1 customers and use the pursuit strategies to capture new customers for Tier 2 and Tier 3.
Across the five countries in the Asia Pacific, Introduction of Tangible Services is the top priority approach as tangible services show and provide the immediate value of the service product that the company offers. An example of tangible service is System Monitoring and Analytics, it provides capability for customers to get insights about their equipment regarding the performance and health status. It enables them act proactively without waiting for a system issue or accident to happen. With the observed result for the top 5 countries, it can also be similar with the remaining 12 countries. The 2nd approach, which is Customer Site Visit, varies per country. China, Australia, and South Korea prefer site visit because the largest percentage of their equipment or systems are out of support. Local company
Proceedings of the 2nd African International Conference on Industrial Engineering and Operations Management Harare, Zimbabwe, December 7-10, 2020
© IEOM Society International 2089
engineering sites are also present in these regions and it allows them to have personal touchpoints to establish trust and effective collaboration. Furthermore, it allows them to address specific service-related concerns. While India and Taiwan it’s their 3rd rank approach. Company Exchange is their 2nd priority as it allows them to be exposed to the various products of the other sectors of the industry that may support their other needs which is typical to specialized industries while it’s the 3rd approach for China, Australia and South Korea. Road Shows and Customer Training is the 4th and 5th ranked approach and it is consistent across countries. It shows that these rapidly growing countries prefer service product experience and personal touchpoints, rather than product training and brand awareness as offered by customer trainings and road shows. This preference has been observed as well by the domain experts working with the different country sales partners. Road Shows and Customer Training are value add on but not required or important. It shows that applying this Decision Analysis AHP model provides better insight to the Marketing and Development group. At present the process is to sort the largest number of equipment and the lowest health score to minimize the effort in pursuit strategies, however they are missing other factors that drives the customer to purchase support services. It’s critical they look at the whole picture and other factors that affects the customer’s decision. With the results, it is evident that utilizing mathematical modelling serves to better evaluate and improve decision making. It provides critical inputs to their strategies in achieving their goals with certainty. Mathematical decision helps to rationalize the sifting of information and the balancing of alternatives inherent in any decision with its efficiency and accuracy. 5. Conclusion This study proved that in order to meet the company’s annual sales target of at least 10% increase per country and 15% increase in the Asia Pacific region, service tiers can be introduced by maximizing the annual total sales using Linear Programming. Utilizing AHP also proved that the approach in implementing pursuit strategies should not be treated equally and ranking can be customized per country based on the given criteria. The Linear Programming and Analytical Hierarchy Process models generated from this study can be implemented and monitored for adoption effectiveness. And after some time, use these models for the other world areas and product lines in the company. For future optimization studies, it is recommended to incorporate external factors and customer feedback to improve the models. LP and AHP should become an essential analysis and decision-making tools in a company. Model-based decision is important for its accuracy and objectivity. Qualitative decisions like subjective estimation, intuition, and trial and error are commonly used by companies. It is an eye-opening concern that such decision-making approach is not widely used, thus, policy makers in the companies should start to shift to model-based decision-making styles (Maurya et al., 2016). References Anas Al-Dawalibi, Ibrahim H. Al-Dali, Bandar A. Alkhayyal (2020). Best marketing strategy selection using
fractional factorial design with analytic hierarchy process. Elsevier Journal, ScienceDirect. Bruhn, M., Hepp, M., Hadwich, K. Vom Produkthersteller zum Serviceanbieter. In: Bruhn M, Hadwich K,editors.
Interaktive Wertschöpfung durch Dienstleistungen. Wiesbaden: Springer; 2015. p. 133-146. Dombrowski U, Engel C, Schulze S. Changes and challenges in the after sales service due to the electric mobility.
Int Conference on Service Operations and Logistics and Informatics (SOLI); 2011. Dombrowski U, Engel C. After Sales Strategies for the Original Equipment Manufacturer of Electric Mobiles. In:
Nee AYC, Song B, Ong SH, editors. 20th CIRP Conference LCE. Singapore: Springer Verlag; 2013. p. 347-352.
Dombrowski, U., & Malorny, C. (2017). Service Planning as Support Process for a Lean After Sales Service. Procedia CIRP, 64, 324-329. doi:10.1016/j.procir.2017.03.080
Frederick, H.S. and Lieberman, J.G.: Introduction to Operations Research, McGraw-Hill, Operations research - 1214 pages, 2001.
Misra, R.B.: Numerical Analysis for solution of ordinary differential equations, Lambert Academic Publishers, Saarbrücken (Germany), 2010, ISBN 978-3-8433-8489-6
Proceedings of the 2nd African International Conference on Industrial Engineering and Operations Management Harare, Zimbabwe, December 7-10, 2020
© IEOM Society International 2090
Neil T. Awit (2019). Utilization of analytic hierarchy process (AHP)- Based Goal programming (GP) model in the optimization of Digital advertising portfolio
Saaty, T. L. The Analytic Hierarchy Process, New York: McGraw-Hill, Inc., 1980. Vishwa Nath Maurya, Ram Bilas Misra, Peter K Anderson, Kamlesh Kumar Shukla (2016). Profit Optimization
Using Linear Programming Model: A Case Study of Ethiopian Chemical Company. American Journal of Biological and Environmental Statistics.
Biographies Rex Aurelius C. Robielos is the Dean of the School of Industrial Engineering and Engineering Management at Mapua University. Before joining Mapua, he was Section Manager of Operations Research Group, Analog Devices General Trias. He has a BS in Applied Mathematics from the University of the Philippines Los Baños, and a Diploma and MS in Industrial Engineering from the University of the Philippines Diliman. He is pursuing Ph.D in Industrial Management (candidate) at National Taiwan University of Science and Technology in Taiwan. He is the current Secretary of Human Factors and Ergonomics Society of the Philippines and Director of the Philippine Institute of Industrial Engineers and Operations Research Society of the Philippines.
Proceedings of the 2nd African International Conference on Industrial Engineering and Operations Management Harare, Zimbabwe, December 7-10, 2020
© IEOM Society International 2091