Learning Motivation-Achievement Theory Utilizing Deductive ...

Urban Growth Simulation: Utilizing a multidimensional methodology
Bogart Yail Márquez and Alejandro Brugués-Rodríguez
El Colegio de la Frontera Norte
{bogart,abrugues}@colef.mx
ABSTRACT
This research is focused on identifying and
describing important factors that influence
urban growth in the city of Tijuana as well
as their social development and economical
implications. A multidimensional
methodology is used together with a number
of techniques for describing and predicting
urban growth in order to analyze social and
economical factors that exist in the
municipality of Tijuana.
KEYWORDS
Modernization, social simulation, social
sciences, complex systems.
1 INTRODUCTION
The main goal of this research is to
identify and describe a number of
important characteristics that influence
urban growth in social, economic, and
environmental aspects and to create a
model that can predict urban growth.
Urban simulation has for many years
remained a relevant field of research.
Developing a simulation involves many
aspects; simulation in the social sciences
is viewed as a third way of doing
science, in contrast to induction and
deduction. Simulations are a versatile
tool and often used in the social sciences
[1].
SocSim corresponds to computer
simulations of social phenomena
utilizing any simulation technique and
often employing simplified models of
the social entities, e.g. cellular automata,
objects that are only capable of
elementary interactions [2].
This project makes use of different
SocSim techniques in order to produce
an urban systems simulation, integrating
their development, control, and
direction. The techniques used include
cellular automata, multi-agent systems,
and dynamic systems based on the
theoretical contributions of Systems
Theory and System Dynamics. This
setup in a multi-platform configuration
enables the acquisition of meaningful
data at different levels of a complex
system such as the urban growth of
Tijuana city.
2 MODELING OF COMPLEX
SOCIAL SYSTEMS
The analysis of Complex Social System
(CAS) is the study of high levels of
natural abstractions and artificial
systems that are generally
implementable in traditional analysis
techniques [3]. Microscopic patterns
emerge from non-linear dynamics and
the lower-level (microscopic) system
interactions of adaptive agents. The
emerging patters are more than the sum
of the existing parts; therefore, the
traditional non-reductionist methodology
describes how the microscopic patterns
emerge. On the contrary, holistic and
totalistic methodologies research the
application of motions that make use of
simple rules and adaptive agent
interactions that lead to emergence from
INTERNATIONAL JOURNAL ON NEW COMPUTER ARCHITECTURES AND THEIR APPLICATIONS (IJNCAA) 2(3): 470-480
THE SOCIETY OF DIGITAL INFORMATION AND WIRELESS COMMUNICATIONS, 2012 (ISSN: 2220-9085)
470

a bottom-up point of view [4]. A few
modeling methods developed and used
for this purpose include cellular
automata (CA), agent-based models
(ABM), artificial neural networks
(ANN), genetic algorithms (GA), and
learning classification systems (LCS)
[4].
When referring to social systems, certain
basic characteristics in the organizations
must be present. One of these
characteristics is that the consequents of
social systems are probabilistic and non-
deterministic. Moreover, human
behavior can never be entirely
predictable as people are complex
beings; consequently, management
cannot wait for consumers, providers,
regulatory agencies and others to have a
predictable behavior [5].
Organizations are seen as systems within
systems. Said systems are complex,
producing a whole that cannot be
understood by analyzing the individual
parts. The organization should be studies
as a system characterized by all the
essential properties for any social
systems [6].
• Component independence: A
change in one of the parts of the system
will have an effect on the others. The
internal and external interactions of the
system reflect the different levels of
control and autonomy.
• Homeostasis or firm state: The
organization can achieve a firm state
only when two requirements are met,
unidirectionality and progress.
Unidirectionality means that regardless
of changes in the organization, the same
established results or conditions are met.
Progress leading to the desired outcome
is a process degree found within the
limits established as tolerable.
• Borders or limits: It is the line
that defines what is within and what is
outside the system, it need not be
physical. A border consists in a closed
line around selected variables among
those that possess greater exchange (of
energy, information) with the system.
• Morphogenesis: the
organizational system, different from
other mechanical systems and even from
biological systems, has the capacity to
modify its basic structures. This is
identified by Buckley [7] as its main
distinctive characteristic.
On the part of social behavior, it tends to
conform to the members of the group,
producing cooperation and self-
organization [8]. An organization,
according to Ross Ashby [9], spans a
multitude of definitions due to its
corresponding undertakings, in relation
to computation and the brain, and it is
becoming increasingly important. The
central concept is to provide
“conditionality”. In this manner,
organizational theory is a coexisting part
of functional theory of more than one
variable.
Contrasting with the “conditional” is the
“non-conditional”, therefore the opposite
of the “organization” must be, as the
mathematical theory shows, the concept
of “reduction potential” (also called
“separability”). This occurs, in
mathematical form, when what appears
to be a multivariable function is
demonstrated, on closer inspection, that
the parts’ actions are not conditioned by
the value of other parts. In mechanical
form (hardware), it presents itself when
what appears to be a test machine
composed of two or more submachines,
each submachine acts independent of
each other. The matter of
“conditionality” and its inverse
“reducibility” can be approached by a
number of mathematical and logical
methods. In its generality and ideal
INTERNATIONAL JOURNAL ON NEW COMPUTER ARCHITECTURES AND THEIR APPLICATIONS (IJNCAA) 2(3): 470-480
THE SOCIETY OF DIGITAL INFORMATION AND WIRELESS COMMUNICATIONS, 2012 (ISSN: 2220-9085)
471

applicability to complex behavior lies
the fact that it is applicable to anything
defined in the states. Its application does
not require linearity, continuity, metrics,
or a specified order. In this calculation,
the degree of conditionality can be
measured and analyzed; it is distributed
between the factors and interactions in a
way that is parallel to Fisher’s method in
variance analysis but without needing
metrics in the variables, only the
frequency in which the many
combinations occur. Just as Fisher’s
conception in variance analysis outputs
complex relations that can exist between
the variations in a metric, McGIll and
Garner’s conception of uncertainty
analysis provide a better understanding
on dealing with the complexities of the
relations when the variables are not
measurable [9].
In a social system there exists the
questions of what are the behaviors of
individuals in agglomerations (cities,
groups or networks) and why do people
show such behavior. In a published
study by Helbing [10], these types of
behaviors are explained. It is stated that
cooperation is crucial to society since it
permits the creation of common benefits
that one isolated individual could
establish on their own. These common
benefits are shared infrastructures to the
social institutions. Notwithstanding, the
contribution of public goods establishes
a dilemma, as these benefits are shared
by everyone, there exists the temptation
to do as little as possible and reap the
most rewards. In consequence, it has
brought about the pollution and
exploitation of nature and the problem of
sustainable social benefits [10].
Considering there is an entire gamma of
phenomena that exists within an
organization, the full addressing in a
technological plane results impractical
due to the large scale and complexity
that it incurs. The full range can only be
used little by little; the homomorphisms
of everything that is complex are
referred to by Ashby as “abstract theory”
or “general principles”. This theory
provides a panoramic view that allows
exploring this vast field without losing
sight and aiding with decision making
[9].
Moreover, Prokopenko explains every
component that leads a system to be self-
organizing, stating that science studies
the general phenomena of systems
composed of many simple elements that
interact in a nontrivial way. In these
times, the analysis of systems with a
great deal of components that interact in
a trivial way are explained with the help
of statistics [11].
The dynamics of complex systems can
be summed up in the following way:
1) Complex systems are “open” and
receive a regular supply of energy,
information, and/or material from the
environment;
2) A great, but not too great, set of
components that interact in a non-trivial
manner;
3) Non-trivial interactions lead to
internal limitations, to the rupture of
symmetry in the behavior of individual
components—which emerges in
collaboration with the global behavior;
4) The system is now more
organized that before, since it is self-
organizing.
5) This coordination can be
expressed as detectable patterns by an
external observer or as structures that
transmit new properties to the systems.
New behaviors “emerge” from the
system;
6) The emergent coordination and
properties can result from response of
INTERNATIONAL JOURNAL ON NEW COMPUTER ARCHITECTURES AND THEIR APPLICATIONS (IJNCAA) 2(3): 470-480
THE SOCIETY OF DIGITAL INFORMATION AND WIRELESS COMMUNICATIONS, 2012 (ISSN: 2220-9085)
472

specimens to environmental pressure, in
which case it can be said that the system
shows adaptation;
7) When adaptation is achieved
through generations in the population, it
is said that the system has evolved;
8) In coordination with the
emergent properties give way to greater
scale. These sets of interdependent
components with emergent properties
can be observed as coherent entities at a
lower resolution than necessary for these
components.
Organization theory presents complexity
as an objective property of an
organization, for example, a degree of
centralization and formalization. It is
considered an objective characteristic of
an organization’s structure, defined and
measured in terms of the number of
constituting parts, diversity and its
relations. In the decade of the 90s,
complexity also turned into complex
organizational behavior, with slight
changes in unity or the established level,
capable of giving way to what is known
as “complex” [12].
3 FIELD OF STUDY
3.1 Urban Growth
Urban growth for cities in developing
countries differs from that of cities in
developed countries since in the later
growth can be more effectively managed
due to the enforcement of public policies
which are generally focused on
protecting natural resources and the
population’s wellbeing, a model for
development which is not as well
implemented in the former.
Tijuana is the focus of this study,
a Mexican city located in the state of
Baja California which was officially
founded on July 11, 1889. It is the most
populous city in the state and ranks 4th
in national importance. It is located
170km west of the state capital and
borders to the south the city of San
Diego, California.
“Its orography consists of a
series of elevations which form small
plateaus and hills that gently descend to
the sea. Due to the rocky nature of the
terrain, agricultural activities are
hindered. Some of the most important
elevated landforms are cerro Colorado,
with an elevation of 500 meters; cerro
Gordo, with an elevation of 1,100
meters; and the cerros Consuelo and
Grande located in the center of the
municipality, with an elevation of 900
meters. The slopes of hills and glens are
the cause of problems such as floods that
affect the urban infraestructure during
the rainy season” [13].
Currently, Tijuana is one of
Mexico’s most demographically
dynamic border cities due to the large
number of immigrants it receives every
year. This situation has made Tijuana
one of Mexico’s fastest growing cities as
it receives the most number of
immigrants [14]
3.2 Historical background of
Tijuana’s urban growth
The current Tijuana inhabitants is faced
with a social problem historically
created . For its existence, this city has
displayed an accelerated rate of growth
when compare with other Mexican
cities.
Tijuana’s urban growth is due to
economic and social factors, both
internal and external. Some of the
growth’s external drivers were: the
declaration of the National Prohibition
Act, known informally as the Volstead
Act, in 1917; consequently, the
INTERNATIONAL JOURNAL ON NEW COMPUTER ARCHITECTURES AND THEIR APPLICATIONS (IJNCAA) 2(3): 470-480
THE SOCIETY OF DIGITAL INFORMATION AND WIRELESS COMMUNICATIONS, 2012 (ISSN: 2220-9085)
473

construction of the Agua Caliente
racetrack and casinos in Tijuana in
response to the demand from the US.
Other external factors included the
establishment of the naval base in San
Diego and the tourist benefits enjoyed
after the Second World War [15].
Figure 1. Tijuana geographical location.
As for internal factors, irregular
settlements have constantly burdened the
city of Tijuana throughout its history.
One of the first settlements of this type
was formed by workers that were
supposedly involved in the construction
of Puente Mexico (Mexico Bridge), after
some time this settlement became known
as colonia Mexico which now had public
services such as electricity and there
were even attempts to structure road
layout. During this time a portion of 836
hectares from Tijuana ranch was
designated and equipped with public
services in order to cope with the
growing demand for land by the
population. These were the first steps
towards urbanization of the area;
however, during the decade of the 50’s
the city is once more faced with urban
issues as it is unable to manage the
excessive rate of growth, which is
mainly caused by migration flows. From
the south came scores of people drawn
by the job opportunities that existed in
the United States; from the north were
the deportees. This inflow of people
created an overwhelming demand for
housing.
Problems were dealt with as they came,
very little to no long term planning was
done to account for potable water,
sewage, or supply and distribution
routes. In an effort to improve the city,
the Tijuana state commission of public
services (CESPT for the Spanish name,
Comisión Estatal de Servicios Públicos
de Tijuana) was created in 1966. The
main goal of this institution was to
create a plan that would satisfy the city’s
existing needs. Predictably, the
implemented solutions for potable water
satisfied the needs temporary as the
growth of the city overwhelmed the
supply in a few years.
By the decade of the 70’s, the urban
sprawl occupied a surface of
approximately 6,500 hectares, most of
which was situated on rough terrain. The
city’s growth was unevenly distributed
with respect to population density as
with construction. While in the
downtown area the density swelled
irrationally, in the lower income areas
development was very disperse, taking
up large amounts of land. As growth
went unchecked, settlements came to
occupy geographically risky areas such
as stream beds and slopes, in some
extreme cases with inclinations of more
than 40%. Urbanization in these areas
was very discouraging due to high costs;
more suitable areas for urban settlements
could be found to the east and southeast
of the city.
Even though there have been many
public policies dealing with urban
development, all proved inadequate to
cope with the exceptionally high
increase in demand that the city
underwent since the 40’s.
Additionally the actual city size is a
problem itself, the last Urban
INTERNATIONAL JOURNAL ON NEW COMPUTER ARCHITECTURES AND THEIR APPLICATIONS (IJNCAA) 2(3): 470-480
THE SOCIETY OF DIGITAL INFORMATION AND WIRELESS COMMUNICATIONS, 2012 (ISSN: 2220-9085)
474
Development Plan [16], identify more
than 34,350 hectares of urban uses by
2008, two years later the population
census report more than 1,5 millions of
inhabitants in the municipality[14]. This
are combined with an low density urban
development pattern mostly based is
single family units [16] .
In the Presently, the urban planning is
getting close to meeting the demand for
housing and managing the supply and
demand of usable land while minimizing
the degradation of natural resources. The
public policies dictating urban
development that are in effect must be
evaluated periodically so that they may
be adjusted to the city’s needs and
means.
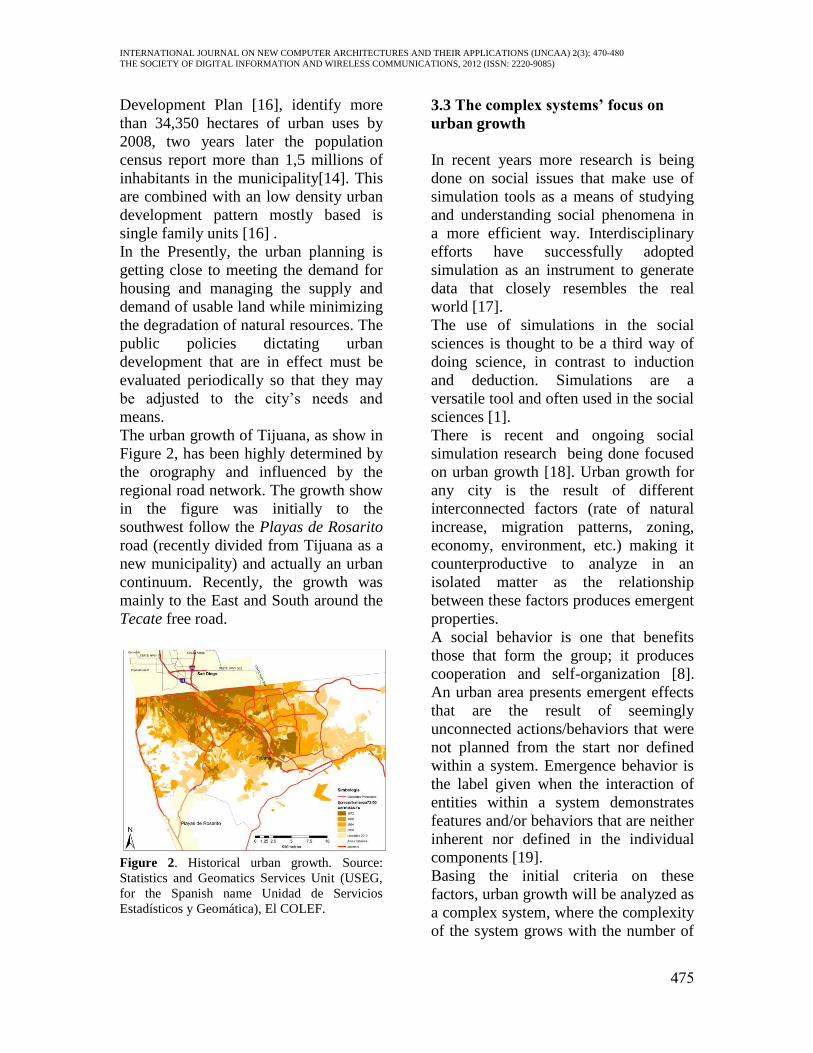
The urban growth of Tijuana, as show in
Figure 2, has been highly determined by
the orography and influenced by the
regional road network. The growth show
in the figure was initially to the
southwest follow the Playas de Rosarito
road (recently divided from Tijuana as a
new municipality) and actually an urban
continuum. Recently, the growth was
mainly to the East and South around the
Tecate free road.
Figure 2. Historical urban growth. Source:
Statistics and Geomatics Services Unit (USEG,
for the Spanish name Unidad de Servicios
Estadísticos y Geomática), El COLEF.
3.3 The complex systems’ focus on
urban growth
In recent years more research is being
done on social issues that make use of
simulation tools as a means of studying
and understanding social phenomena in
a more efficient way. Interdisciplinary
efforts have successfully adopted
simulation as an instrument to generate
data that closely resembles the real
world [17].
The use of simulations in the social
sciences is thought to be a third way of
doing science, in contrast to induction
and deduction. Simulations are a
versatile tool and often used in the social
sciences [1].
There is recent and ongoing social
simulation research being done focused
on urban growth [18]. Urban growth for
any city is the result of different
interconnected factors (rate of natural
increase, migration patterns, zoning,
economy, environment, etc.) making it
counterproductive to analyze in an
isolated matter as the relationship
between these factors produces emergent
properties.
A social behavior is one that benefits
those that form the group; it produces
cooperation and self-organization [8].
An urban area presents emergent effects
that are the result of seemingly
unconnected actions/behaviors that were
not planned from the start nor defined
within a system. Emergence behavior is
the label given when the interaction of
entities within a system demonstrates
features and/or behaviors that are neither
inherent nor defined in the individual
components [19].
Basing the initial criteria on these
factors, urban growth will be analyzed as
a complex system, where the complexity
of the system grows with the number of
INTERNATIONAL JOURNAL ON NEW COMPUTER ARCHITECTURES AND THEIR APPLICATIONS (IJNCAA) 2(3): 470-480
THE SOCIETY OF DIGITAL INFORMATION AND WIRELESS COMMUNICATIONS, 2012 (ISSN: 2220-9085)
475

constituents (different components,
states, or aspects) and the number of
links. Links are entities that are difficult
to quantify since they exist at different
levels, different dimensions and can be
of different types.
4 METHODOLOGY
4.1 Proposed methodology
A viable methodology for complex
social simulation must be designed
based on the specific needs of the social
issue to be modeled [20]. The urban
growth phenomenon has
interdisciplinary facets and qualities that
align with the definitions of complexity.
For this reason, undergoing simulations
in this field leads to the study of
complex systems, emergence, and multi-
level analysis. Simulations are used to
test models that analyze the relevant
processes involved in a city’s urban
growth. According to Camagni, the
concept of a city is based on a process of
generalization that starts at the historical
and geographical existence of cities that
leads to consider the city a significant
entity in its entirety and its theorization
as a socioeconomically autonomous
entity [21].
The applied methodology consists of
different mathematical theories that
generate a new approach to designing
computer simulation architectures. It
gives an interpretation of the different
levels found in complex systems, as well
as the emergent properties that result
from the structure of the different levels.
An added benefit is the ability to
compare properties, processes, and
relationships that exist between the
artificial and real system.
4.2 Methodology implementation
Existing classifications, as defined by
urban researchers, involve multiple
levels/layers depending on their
interactions and the different structures.
The following representation, named
“Camagni’s nuptial cake”, shows three
layers/levels (international, regional, and
local) and a variety of structures
(hierarchies); every layer is interrelated
forming a network at each level. In a
very similar way, cities connect to each
other forming a complex network of
relationships.
Figure 3. The Urban Growth Layers.
Starting with these assumptions, the first
step is to analyze the social system, its
existing relationships and determine la
system’s layers. At this point is when the
issues to be resolved are identified, their
relevance to each level is described
within a physical frame, and the
system’s input and output variables are
determined. Based on Camagni’s nuptial
cake design, only three levels will be
considered, macro, meso, and micro
[22].
5 IMPLEMENTED MODEL
5.1 Macro level
Metrics must be defined to measure the
system’s performance as well as the goal
INTERNATIONAL JOURNAL ON NEW COMPUTER ARCHITECTURES AND THEIR APPLICATIONS (IJNCAA) 2(3): 470-480
THE SOCIETY OF DIGITAL INFORMATION AND WIRELESS COMMUNICATIONS, 2012 (ISSN: 2220-9085)
476

functions. Based on gathered data on
what affects Tijuana’s growth, the input
data was defined, selecting a statistically
valid sample number and formatted to be
easily processed. The goal is to
understand the system by experimenting
with approximations of the physical flow
of entities that are observed to occur in
the real system.
Figure 4. Urban growth conform a dynamic
system.
At this level, a preliminary structure of
the model can be constructed that
integrates the system’s variables and
performance metrics, introducing
assumptions and simplifications when
needed. Urban growth theories can be
integrated to this setup, as well as
mechanisms that can formulate
predictions and identify emergent
behavior in the analyzed interactions
taking place in the urban sprawl.
The first variables to consider are the
city’s total population as well as related
factors such as migration and birth rate.
These factors are analyzed at a macro
level, captured by a top-down model.
Dynamic systems are used in order to
achieve the production of such a model.
Dynamic systems allow the
representation of all the elements, the
relationships between the structures of
the resulting system and their evolution
over time [23]. Depending on the results,
mathematical equations can be derived
based on the relationships that exist in
the macro-level model.
5.2 Meso level
In order to determine the meso level of
the system, the actors’ actions within
their environment and the relationships
among those actions are specified. The
data analysis is divided into 573 zones
called AGEBs. “Urban AGEBs delimit a
part or the total of a location with a
population of 2500 or more, they may
also represent the whole of a
municipality seat, regardless of the
population number. Urban AGEBs are
usually groups of 25 to 50 blocks; rural
AGEBs represent farm lands with
populations below 2500 and are labeled
as rural communities for operational
purposes” [14]. Actually, regardless this
criteria, the peripheral urbanization are
incorporated as a new AGEB’s.
The information for the modeled was
compiled from databases of the national
institute of statistics and geography
(INEGI from the Spanish name, Instituto
Nacional de Estadística y Geografía)
[14] and integrated into a geographic
information system (GIS). These
systems aid in generating, classifying,
and formatting of the required data
layers, making it more convenient to edit
the different thematic maps’
information. These maps quantify the
special structure in order to visualize and
interpret the different areas and special
patterns of Tijuana.
Each AGEB as associate with
quantitative information for the most
important variables that are being
considered, these being residential and
migratory population; employment
centers and services; land zoning and the
indicator for residential construction.
In the phase of defining the objects,
attributes, and methods in the chosen
paradigm, it is when an agent algorithm
INTERNATIONAL JOURNAL ON NEW COMPUTER ARCHITECTURES AND THEIR APPLICATIONS (IJNCAA) 2(3): 470-480
THE SOCIETY OF DIGITAL INFORMATION AND WIRELESS COMMUNICATIONS, 2012 (ISSN: 2220-9085)
477
is adapted and implemented [24]. An
urban growth simulation are originated
from employment centers and services,
the direction of growth then varies
depending on real estate, utilities and
transportation network.
In the simulation, an initial migration
group settling on the outskirts of the city
can be observed, forming an irregular
settlement due to the lower cost of land
for that area. A few settlements begin
emerging bordering the initial ones;
however, there is a possibility that given
time some settlers will move to more
attractive, comfortable areas. The cost of
transportation is determined by the
distance from employment centers and
services.
The use of agents in the social sciences
can be an invaluable tool as it has been
used successfully in the field of soft
computing for tasks such as decision
making and prediction with a non-linear
perspective [25].
5.3 Micro level
At the micro level, only the zoning is
modeled, for which the Clarke model is
used [26]. This model requires specific
data and it simulates the transformation
of non-urban cells into urban cells as a
time function with respect to a series of
discrete, binary valued norms (urban or
non-urban). It also has the capability of
describing the different rates of growth,
emphasizing of a few types of growth.
For example, it is able to determine the
probability of a city having more
fragmented patterns of expansion,
something that differentiates cities from
developed and developing countries.
The implementation of this model in
many practical case studies has given
very satisfactory results in long term
simulations [27].
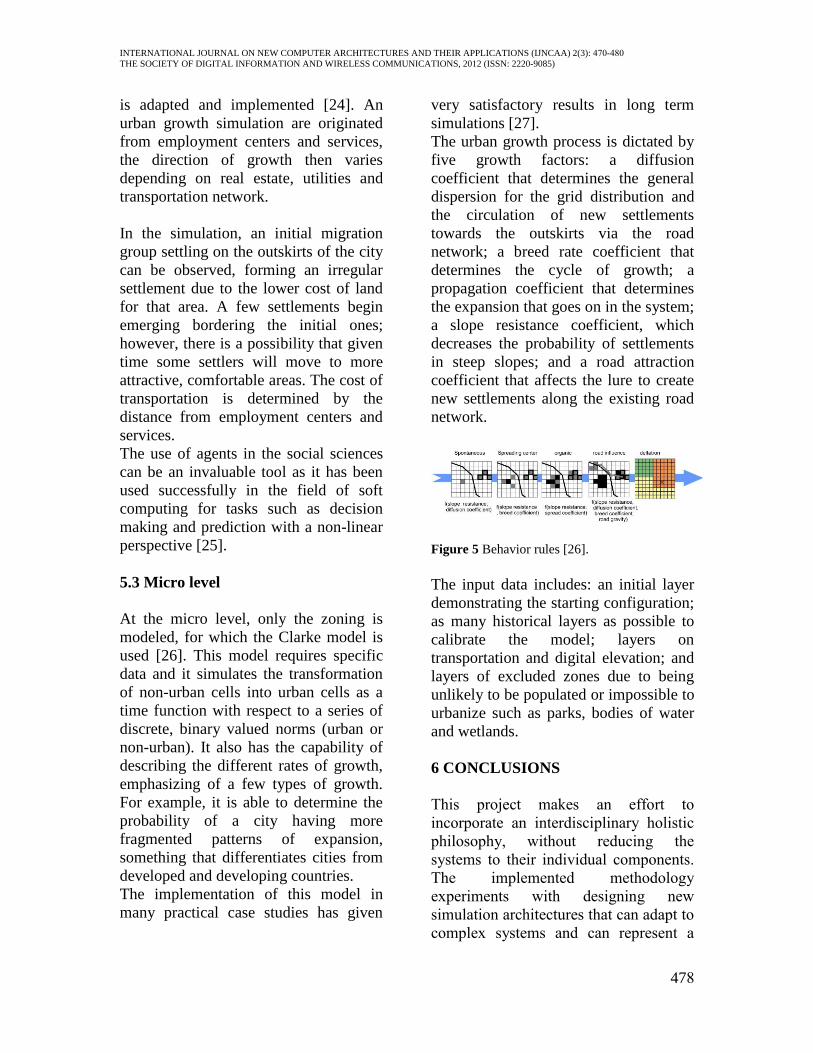
The urban growth process is dictated by
five growth factors: a diffusion
coefficient that determines the general
dispersion for the grid distribution and
the circulation of new settlements
towards the outskirts via the road
network; a breed rate coefficient that
determines the cycle of growth; a
propagation coefficient that determines
the expansion that goes on in the system;
a slope resistance coefficient, which
decreases the probability of settlements
in steep slopes; and a road attraction
coefficient that affects the lure to create
new settlements along the existing road
network.
Figure 5 Behavior rules [26].
The input data includes: an initial layer
demonstrating the starting configuration;
as many historical layers as possible to
calibrate the model; layers on
transportation and digital elevation; and
layers of excluded zones due to being
unlikely to be populated or impossible to
urbanize such as parks, bodies of water
and wetlands.
6 CONCLUSIONS
This project makes an effort to
incorporate an interdisciplinary holistic
philosophy, without reducing the
systems to their individual components.
The implemented methodology
experiments with designing new
simulation architectures that can adapt to
complex systems and can represent a
INTERNATIONAL JOURNAL ON NEW COMPUTER ARCHITECTURES AND THEIR APPLICATIONS (IJNCAA) 2(3): 470-480
THE SOCIETY OF DIGITAL INFORMATION AND WIRELESS COMMUNICATIONS, 2012 (ISSN: 2220-9085)
478

general theory of collective behavior as
well as the formation of structures.
The combination of different
techniques can be helpful in modeling
and simulating social behavior in urban
areas. This helps improve our knowledge
on social complexity. With this study,
making use of multiple levels, it is
intended to analyze the differences
between layers and later be able to
connect them all into a single system.
The previously generated
simulations show signs of the existence
of emergent behavior in interactions be-
tween actors in their environment. They
also show a close approximation of the
relationships between the levels of the
system as they exist in their real-life
counterparts and as they are modeled in
the simulation.
Three levels with different
techniques were used, dynamic systems,
agents, and cellular automatons. As
future work, the design of the agents is
being improved since a cellular
automaton could be considered a simple
agent, and a dynamic system could be
represented as an agent at a macro level,
as the result of the existing relations at
that level.
7 REFERENCES
1. Axelrod, R. Advancing the Art of Simulation
in the Social Sciences. 1997.
2. Davidsson, P., Agent Based Social
Simulation: A Computer Science View
Journal of Artificial Societies and Social
Simulation 2002. vol 5.
3. Yin, Y., A Research Framework for
Complex Control Systems. International
Journal of Advancements in Computing
Technology, 2011. 3(5): p. 257-266.
4. Brownlee, J., Complex Adaptive Systems,
2007, Complex Intelligent Systems
Laboratory, Centre for Information
Technology Research, Faculty of
Information Communication Technology,
Swinburne University of Technology:
Melbourne, Australia.
5. Márquez, B.Y., et al. A Distributed Agency
Methodology Applied to Complex Social
Systems. in 13th International Conference
on Enterprise Information Systems (ICEIS).
2011. Beijing: Enterprise Information
Systems.
6. Yolles, M., Organizations as Complex
Systems: An Introduction to Knowledge
Cybernetics, in Managing the Complex2006,
Information Age Publishing: Greenwich,
Connecticut, USA. p. 866.
7. Boulding, K., General Systems Theory The
Skeleton of Science Management Science,
1956. 6(3): p. 127-139.
8. Jaffe, K. and L. Zaballa, Co-Operative
Punishment Cements Social Cohesion.
Journal of Artificial Societies and Social
Simulation, 2010. 13: p. 4.
9. Ashby, R., Principles of the self-organizing
system. E:CO Special Double Issue, 2004. 6:
p. 102-126.
10. Helbing, D., W. Yu, and H. Rauhut, Self-
organization and emergence in social
systems. Modeling the coevolution of social
environments and cooperative behavior.
2009.
11. Prokopenko, M., F. Boschetti, and A.J.
Ryan, An information-theoretic primer on
complexity, self-organization, and
emergence. Complex., 2009. 15(1): p. 11-
28.
12. Fioretti, G. and B. Visser, A cognitive
interpretation of organizational complexity.
E:CO Special Double Issue, 2004. 6: p. 11-
23.
13. GobBC. Orografía. 2012; Available from:
http://www.bajacalifornia.gob.mx/.
14. INEGI, Instituto Nacional de Estadística y
Geografía. 2010.
15. Rosquillas-Navarro, A.H. and L.H.
Mendoza-Garcilazo, Herramientas de
Evaluación de Riesgo para Diágnostico de
Areas Urbanas contra Desastres Sísmicos,
H.A.d. Tijuana, Editor 2001.
16. IMPLAN, Instituto Metropolitano de
Planeación de Tijuana, Programa de
Desarrollo Urbano del Centro de Poblacion
de Tijuana 2010-2030, 2010.
17. Gilbert, N. and K.G. Troitzsch, Simulation
for the social scientist. 2 ed, ed. M.
Keynes2005: Open University Press.
18. Klüver, C. and J. Klüver, Introduction:
social-cognitive complexity, computational
models and theoretical frames. Comput.
INTERNATIONAL JOURNAL ON NEW COMPUTER ARCHITECTURES AND THEIR APPLICATIONS (IJNCAA) 2(3): 470-480
THE SOCIETY OF DIGITAL INFORMATION AND WIRELESS COMMUNICATIONS, 2012 (ISSN: 2220-9085)
479

Math. Organ. Theory, 2012. 18(2): p. 145-
152.
19. Boschetti, F. and R. Gray, A Turing Test for
Emergence, in Advances in Applied Self-
organizing Systems, Springer, Editor 2008,
Springer London: London. p. 349-364.
20. Cioffi-Revilla, C., A Methodology for
Complex Social Simulations. Journal of
Artificial Societies and Social Simulation,
2010. 13(1): p. 7.
21. Camagni, R., Urban Economics, in
Investigaciones regionales, Nº. 5 2004:
Alcalá de Henares. p. 235-237.
22. Marquez, B.Y., et al. Distributed agencies
applied to complex social systems, a multi-
dimensional approach in Next Generation
Information Technology (ICNIT), 2011 The
2nd International Conference on. 2011.
Gyeongju.
23. Marquez, B.Y., et al. On the Modeling of a
Sustainable System for Urban Development
Simulation Using Data Mining and
Distributed Agencies. in 2nd International
Conference on Software Engineering and
Data Mining 2010. Chengdu, China: IEEE.
24. De Leon, F.D., M. Felsen, and U. Wilensky.
NetLogo Urban Suite - Tijuana Bordertowns
model. Center for Connected Learning and
Computer-Based Modeling, Northwestern
University, Evanston, IL 2007.
25. Gilbert, N., Computational social science:
Agent-based social simulation, in Agent-
based modelling and simulation, D. Phan
and F. Amblard, Editors. 2007, Bardwell:
Oxford. p. 115-134.
26. Clarke, K., S. Hoppen, and L. Gaydos, A
self-modifying cellular automaton model of
historical urbanization in the San Francisco
Bay area, in Environment and Planning B:
Planning and Design1997. p. 247 – 261.
27. Ding, Y.-C. and Y.-K. Zhang, The
Simulation of Urban Growth Applying
Sleuth Ca Model to the Yilan Delta in
Taiwan. Journal Alam Bina, Jilid 09, No:
01, 2007., 2007.
INTERNATIONAL JOURNAL ON NEW COMPUTER ARCHITECTURES AND THEIR APPLICATIONS (IJNCAA) 2(3): 470-480
THE SOCIETY OF DIGITAL INFORMATION AND WIRELESS COMMUNICATIONS, 2012 (ISSN: 2220-9085)
480
Copyright © 2022 FDOKUMEN