MULTIDIMENSIONAL POVERTY IN VIET NAM - MPPN
32
www.mppn.org Dimensions December 2019 | Number 8 Multidimensional Poverty Peer Network (MPPN) MULTIDIMENSIONAL POVERTY IN VIET NAM HOW HAS POVERTY REDUCTION BEEN ACHIEVED IN OAXACA? New Tool: BUSINESS MPI
-
Upload
khangminh22 -
Category
Documents
-
view
2 -
download
0
Transcript of MULTIDIMENSIONAL POVERTY IN VIET NAM - MPPN

www.mppn.org
DimensionsDecember 2019 | Number 8
Mul t id imensional Poverty Peer Network (MPPN)
MULTIDIMENSIONAL
POVERTY IN VIET NAM
HOW HAS POVERTY REDUCTION BEEN ACHIEVED IN OAXACA?
New Tool: BUSINESS MPI

2 | DIMENSIONS DECEMBER 2019
www.ophi.org.uk
www.mppn.org
Editor:Carolina Moreno
Editorial Board:Sabina AlkireAdriana ConconiMónica Pinilla-Roncancio
Design:Sandra Pérez
Translators:Alicia HollidayKristin FisherTheodora Bradford
Proofreader:Ann BarhamMaya Evans
Cover Photo Credit:pxhere.com/1281975
The opinions and analysis expressed on this website and in Dimensions magazine are those of the authors and Ǝȶ�ȥȶʋ�ȥơƃơɽɽŔɭǫȍˊ�ɭơ˫ơƃʋ�ʋǠơ�views of the MPPN, its Steering Committee, or the participant countries and organisations.
Editorial
Multidimensional Poverty in Viet Nam Sustainable Poverty Reduction 2016–2020by Lo Thi Duc
Interview with Alejandro Murat How Has Poverty Reduction Been Achieved in Oaxaca, Mexico?
The Use of the Multidimensional Poverty Measure in Oaxaca by Edith Yolanda Martínez López
bMPI Measuring Poverty in Businesses
A Day in the LifeTamang from Nepal
Sierra Leone Launches National MPI
Data of the MonthMultidimensional Poverty in the United States
News
Contents3
10
14
18
23
24
26
28
4
youtube.com/OPHIOxford
facebook.com/ophi.oxford
twitter.com/ophi_oxford
instagram.com/ophi_oxford
Follow us on social media

3 | DIMENSIONS DECEMBER 2019
EditorialI n this issue, we highlight two examples of national multidimensional poverty indices.
We explore Viet Nam’s experience using a national MPI as an official measure of poverty to complement income-based measures. Lo Thi Duc, Senior Statistician at the General Statistics Office of Viet Nam, takes us through how Viet Nam has used the MPI-VN not only to monitor poverty but also to identify the beneficiaries of social programmes.
We also spotlight Sierra Leone, which officially launched its MPI in May 2019, and we take a look at which dimensions and indicators were selected to build their index.
Moving from the national to the state level, we catch up with Oaxaca in Mexico, a state with almost four million inhabitants and 570 municipalities. In this region, multidimensional measurement, disaggregated by municipality, has been used since 2017 to create public policies to tackle poverty. The results are already being seen. According to CONEVAL data, Oaxaca is the state that has had the greatest reduction in extreme poverty in percentage points in recent years. In this issue’s interview, Alejandro Murat Hinojosa, the state’s governor, describes the situation of poverty in Oaxaca and his administration’s poverty reduction policies. In a second article, Yolanda Martínez, Head of the Social and Human Development Secretariat of Oaxaca, explores in further detail how Oaxaca has integrated multidimensional poverty measurement into their policymaking.
Turning to other innovative initiatives, we cover an effort in Costa Rica to measure multidimensional poverty among private sector employees. The business MPI is an index that measures the living conditions of employees and their families. Using this data, businesses have been creating programmes to help improve the lives of their staff.
In this issue, we also feature a sample of research carried out by the United States Census Bureau, which recently published an exercise in multidimensional poverty measurement. In this edition’s ‘Data of the Month’ section, we look at what that index measured and how much multidimensional poverty it identified.
Finally, we would like to share with you that Dimensions magazine has undergone a change. Our co-editor Diego Zavaleta has taken a new path in his career. We wish him good luck and are infinitely grateful for his work and commitment to the magazine.
We invite you to read Dimensions, a new perspective for understanding poverty.
Carolina Moreno
Phot
o: F
lickr
.com
/Wor
ldba
nk/F
lore
dePr
eneu
f

4 | DIMENSIONS DECEMBER 2019
Multidimensional Poverty in Viet Nam: Sustainable Poverty Reduction 2016–2020%ˊ��ȶ�þǠǫ�7ʠƃ�òơȥǫȶɭ�òʋŔʋǫɽʋǫƃǫŔȥ�eơȥơɭŔȍ�òʋŔʋǫɽʋǫƃɽ�¶lj˪ƃơ�ȶlj�Īǫơʋ�¥Ŕȟ.
I n Viet Nam, the Government publishes national targets for poverty reduction every five years and
updates poverty lines to measure changes in poverty within those five-year periods. Up to and including 2015, Viet Nam only used an income-based poverty measure. The poverty line was set at the amount of money per month sufficient for a 2100 Kcal/person/day diet as well as essential non-food spending. Using the Poverty Census, the Ministry of Labour, Inva-lids and Social Affairs (MOLISA) then identified and made a commune-level list of poor households based on this poverty line, and this list was reviewed and updated annually. The General Statistics Office (GSO) then conducted the Viet Nam Household Living Standards Survey (VHLSS) and disseminat-ed its findings on income levels, poverty rates, and the GINI inequality coefficient.
The process of research and the application of a multidimensional poverty measurement methodology
Since 2006, UNICEF and UNDP have been sug-gesting additional methods for measuring multidi-mensional poverty to complement traditional mon-etary measures poverty measurement using Multiple Overlapping Deprivation Analysis (MODA) and the Alkire-Foster method, which have subsequently
been explored through quantitative studies. As a re-sult, researchers and policymakers in Viet Nam have recognized the link between the government’s goal of sustainable poverty reduction and multidimensional poverty measurement.
Prior to the official adoption of this new multidi-mensional poverty approach, the Government of Viet Nam spent two years researching and developing the measure with the active support of UNDP, OPHI and the close cooperation of specialists from the General Statistics Office (GSO), the Ministry of Planning and Investment, the Labour Science Institute (ILSSA), MOLISA, the Academy of Social Sciences (VASS), and the National Economics University.
Between 2013 and 2015, this team of experts car-ried out several activities in the process of discussing a multidimensional approach for poverty measurement that included (i) initial studies on multidimensional poverty measurement concepts and methodologies, proposing feasible measures and providing initial information on multidimensional poverty in Viet Nam, (ii) training and communication about multi-dimensional poverty, (iii) technical assistance to the government’s Research Group and the Secretariat of the General Project on Multidimensional Poverty, (iv) designing tools and procedures to identify poor
Phot
o: F
lickr
.com
mar
k_le
hmku
hler
5 | DIMENSIONS DECEMBER 2019
households, and (v) consultation and testing of the procedures and the tools at the commune/ward levels.
In September 2015, the Government of Viet Nam issued a decision to publish poverty lines for the 2016–2020 period using the multidimensional pov-erty approach (Decision Nº.59/2015/QD-TTg). The multidimensional poverty measure is used to monitor and evaluate social protection programs, as well as to identify beneficiaries of these programs. The poverty line for the 2016–2020 period combines income pov-erty measurement and a multidimensional poverty measure based on the Alkire-Foster method.
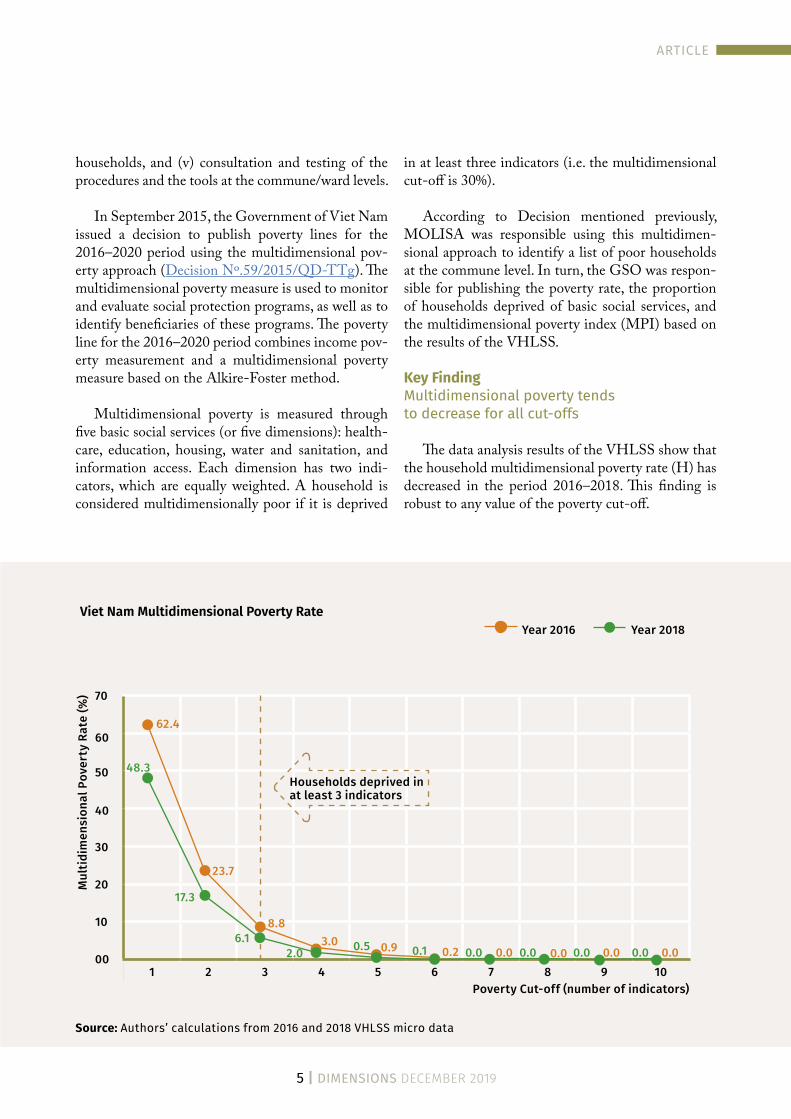
Multidimensional poverty is measured through five basic social services (or five dimensions): health-care, education, housing, water and sanitation, and information access. Each dimension has two indi-cators, which are equally weighted. A household is considered multidimensionally poor if it is deprived
in at least three indicators (i.e. the multidimensional cut-off is 30%).
According to Decision mentioned previously, MOLISA was responsible using this multidimen-sional approach to identify a list of poor households at the commune level. In turn, the GSO was respon-sible for publishing the poverty rate, the proportion of households deprived of basic social services, and the multidimensional poverty index (MPI) based on the results of the VHLSS.
Key Finding Multidimensional poverty tends to decrease for all cut-offs
The data analysis results of the VHLSS show that the household multidimensional poverty rate (H) has decreased in the period 2016–2018. This finding is robust to any value of the poverty cut-off.
1 2 3 4 5 6 7 8 9 10
62.4
48.3
17.3
23.7
8.8
6.1 3.0
2.00.90.5
00
10
20
30
40
50
60
70
0.1 0.2 0.0 0.0 0.0 0.0 0.0 0.0 0.0 0.0
Year 2016 Year 2018
Poverty Cut-off (number of indicators)
Mu
ltid
ime
nsio
na
l P
ov
erty
Ra
te
(%
)
Viet Nam Multidimensional Poverty Rate
ARTICLE
Households deprived in
at least 3 indicators
Source: Authors’ calculations from 2016 and 2018 VHLSS micro data

6 | DIMENSIONS DECEMBER 2019
The national multidimensional poverty rate (H) (according to the official poverty threshold – depriva-tion in three or more indicators or k = 30%) fell from 8.8% in 2016 (equivalent to about 2.2 million poor households) to 6.1% in 2018 (equivalent to about 1.6 million poor households).
When the multidimensional poverty cut-offs were set between five to eight indicators (or k from 50% to 80%), the proportion of poor households was below 1%. The results of the analysis using VHLSS revealed that no households were multidimensionally poor when a deprivation threshold of nine or more indica-tors (k=90%) was used.
The rate of poor households deprived in each indicator tends to decrease in almost all indicators from 2016 to 2018
The proportion of households who are multidi-mensionally poor and deprived in each of the indica-tors included in Viet Nam’s national MPI (MPI-VN) has decreased for almost all indicators. By 2018, all deprivations were lower than 5%. The highest depri-vation rate belongs to the latrine indicator at 4.3%; the four indicators with the lowest deprivation rates, ranging from 0.3% to 1.2%, include child school at-tendance, access to health services, use of telecommu-nications Services, and assets for information access.
2016-Censored Headcount Ratio2018-Censored Headcount Ratio
0.0
2.0
4.0
6.0
8.0 EDUCATION
HEALTH CARE
HOUSING
WATER AND SANITATION
INFORMATION ACCESS
Adult Education
Child School Attendance
Access to Health Services
Health Insurance
Housing Quality
Living Area
Water Sources
Latrine
Use of TelecommunicationsServices
Assets for Information Access
4.9
4.6
4.02.7
6.9
3.4
1.1
0.31.5
1.1
2.52.02.54.3
0.30.8
0.81.2
3.8
2,7
Censored Headcount Ratio of Each Indicator (%)
Source: Authors’ calculations from 2016 and 2018 VHLSS micro data.
ARTICLE

7 | DIMENSIONS DECEMBER 2019
¡ʠȍʋǫƎǫȟơȥɽǫȶȥŔȍ�ɢȶʽơɭʋˊ�ǫȥƎǫƃơɽ�Ŕɭơ�ɽǫnjȥǫ˪-cantly different between geographic regions
The MPI-VN decreased from 0.031 in 2016 to 0.021 in 2018. However, there are clear regional dis-parities within the country. MPI-VN varies among geographic regions and shows a downward trend over time in almost all regions except the South East region.
The ranking order of regions by MPI-VN did not change between 2016 and 2018. The two regions with
the highest MPI-VN and the fastest reduction are the Central Highlands region (down from 0.071 to 0.047) and the South East region (down from 0.061 to 0.038). The Red River Delta is the region with the lowest MPI-VN; in 2018, its MPI was only 0.002.
Notably, in the Red River Delta and the Mekong River Delta regions, although the incidence of mul-tidimensional poverty (H) has decreased, the average deprivation score of poor households has increased over time.
ARTICLE
Multidimensional Indices in Viet Nam by Regions and Years
00
5%
10%
15%
20%
25%
Central Highlands-2016 19.5%
Red River Delta-2016 1.4%
Northern midland and mountain areas-2016 14.6%
North Central area and Central coastal area-2016 6.6%
South East-2016 4.6%
Mekong River Delta-2016 17.6%
Red River Delta-2018 0.7%
South East-2018 4.6%
North Central area and Central coastal area-2018 5.0%
Mekong River Delta-2018 11.5%
Central Highlands-2018 13.4%
Northern midland and mountain areas-2018 9.5%
Circle size = Total household in 2018
Mu
ltid
ime
nsio
na
l P
ov
erty
Ra
te
(%
)
A-Intensity deprivation (Number of Indicators)
2.50 2.70 2.90 3.10 3.30 3.50 3.70 3.90 4.10 4.30 4.50
Year 2016 Year 2018
Source: Authors’ calculations from 2016 and 2018 VHLSS micro data.

8 | DIMENSIONS DECEMBER 2019
Change in the contribution of indicators to the overall MPI-VN
The contribution of each indicator to the overall MPI-VN changes over time. The indicators for child school attendance, access to health services, use of telecommunications services, and assets for informa-tion access have the lowest levels of contribution to the MPI-VN; each indicator contributes from 3% to 6%. The contribution of the latrine indicator to over-all MPI-VN has decreased over time but still has the
highest contribution (22.6% in 2016 and 20.6% in 2018). The second highest contributor is deprivation in adult education, which increased from 16.1% in 2016 to 18.0% in 2018.
Zooming out from the indicator level, the dimen-sion with the largest contribution to the MPI-VN was water and sanitation, which contributes around 33%. By contrast, the dimension assets for infor-mation access has the lowest contribution to overall MPI-VN (less than 10%).
Adult EducationChild School AttendanceAccess to Health ServicesHealth InsuranceHousing QualityLiving AreaWater SourcesLatrineUse of Telecommunications ServicesAssets for Information Access
Year 2018
Year 2016
18.0
16.1 13.014.9
13.0 12.1
9.7
9.0
11.1
12.0
20.622.6
5.7
3.6 4.83.7
3.9
3.6
1.4
1.1
Contribution of Deprivation in Each Indicator to the Overall Multidimensional Poverty (%)
Policies to support poverty reduction, 2016–2020
In 2016, the Government of Viet Nam approved the ‘National Target Programme on Sustainable Pov-erty Reduction 2016–2020’ with the following ob-jectives: implementing sustainable poverty reduction goals; limiting regression into poverty; contributing to the goal of economic growth, social security, improve-ment in living standards and people’s income, espe-
cially in poor areas; creating favourable conditions for the poor and improving the access of poor households to basic social services (healthcare, education, housing, water and sanitation, information access).
In the implementation of the plans and goals of the sustainable poverty reduction programme from 2016
Source: Authors’ calculations from 2016 and 2018 VHLSS micro data.
ARTICLE

9 | DIMENSIONS DECEMBER 2019
Conclusions
Multidimensional poverty measurement has been implemented in Viet Nam for three years with results showing its feasibility, usefulness and effectiveness in creating and carrying out poverty reduction and social security policies. The multidi-mensional poverty concept has spread widely across the nation in recent years. It has been transmitted from the researchers to the policymakers, to au-thorities at all levels, and then to households. The policy system for 2016–2020 has been carried over from the previous five-year period with appropriate amendments to ensure the comprehensive coverage of multidimensionally poor households. The per-centage of multidimensionally poor households re-ceiving benefits from at least one of the poverty re-duction and social security programs has increased from 49.6% (in 2016) to 53.3% (in 2018).
The MPI and its related indicators in Viet Nam have showed reductions and are currently at very low levels. Moreover, some important dimensions and indicators – such as nutritional status, employ-ment, and social insurance – have not been includ-ed in the multidimensional poverty measure for the period 2016–2020. Therefore, the selection of indi-cators for multidimensional poverty measurement in Viet Nam needs to be researched, revised and supplemented to better express the human rights and the stable and sustainable development of the Vietnamese people for the period 2021–2025 and beyond.
ARTICLE
to 2018, ministries, agencies, and provinces have de-veloped specific plans and implemented regular pol-icies offering direct support to poor and vulnerable households, as well as policies for regional develop-ment and other critical focus areas.
Specifically:
Policies providing direct support to poor and vulnerable households:
�` Policies to support the issuance of health insur-ance cards to the poor;
�` Policies for exemption from or reduction of tui-tion fees and support for schooling expenses for poor students;
�` Preferential credit policies for the poor, nearly poor, and social policy beneficiaries;
�` Policies to help with the electricity expenses of poor households and social policy beneficiaries;
�` Policies to assist ethnic minorities living in poor areas with purchasing raw materials and supplies for production and people’s livelihoods¸ and,
�` Policies to support the construction of safe and stable houses.
Policies and projects to support regional development, and areas for critical focus:
�` Policies to support infrastructure investment in poor districts and communes on coastal promon-tories and islands facing extreme difficulty with low living standards, poor infrastructure, and which are affected by climate change;
�` Policies to support the development of produc-tion, livelihood diversification and the replication of poverty reduction models in poor districts and communes on coastal promontories and islands facing extreme difficulty;
�` The project on information access deprivation re-duction.
áǠȶʋȶ�˫ǫƃȇɭƃȶ
ȟɢǠȶ
ʋȶɽʋɭǫƃǫŔǿȶǠ
ȥࠂࠀࠇࠄࠄࠇࠅࠀࠈࠆࠂ

10 | DIMENSIONS DECEMBER 2019
H ow would you describe poverty in Oaxaca in historical terms?
Throughout the 20th century and first decades of the 21st, Oaxaca has been the state with the highest per-centage of poverty in Mexico. From 2008 and 2016, specifically, the trend in Oaxaca was an increase in poverty, according to a report by the National Coun-cil for the Evaluation of Social Development Policy (CONEVAL) entitled ‘10 Years of Measuring Pov-erty in Mexico, Advances and Challenges in Social Policy’ (2008 to 2018).
In the final year of the previous government (2016), Oaxaca reached its highest recorded level of multidimensional poverty (70.4%). In the year that I became governor, 2.8 million Oaxacans lived in pov-erty, and 26.9%, the equivalent of over one million people, lived in a situation of extreme poverty.
As of 2017, this trend began to reverse. In 2018, the last year analysed by CONEVAL, Oaxaca had taken powerful steps to tackle poverty. Not only did we achieve reductions in the number of indicators with social deprivations, but we also did it a high-er proportion compared to the national average. The population living in poverty and extreme poverty
How Has Poverty Reduction Been Achieved in Oaxaca, Mexico?The state of Oaxaca is located in southeast Mexico. It has a population of almost four million people residing in its 570 municipalities. Historically, it has been one of the poorest states in the country, but that trend is reversing. We spoke with Oaxaca’s governor, Alejandro Murat Hinojosa, about how they are using multidimensional measurement to tackle poverty.
decreased by 4 percentage points and 3.6 percent-age points, respectively. In fact, Oaxaca is the state in Mexico that, in terms of percentages, registered the greatest reduction in extreme poverty in the country between 2016 and 2018, reducing it from 26.9% to 23.3%.
How have you used multidimensional meas-urement to create public policies to eliminate poverty?The results of the multidimensional measurement of poverty that CONEVAL undertook allowed us to know exactly what the social deprivations were at the state level and at the municipal level in particu-lar. Once the statistics and the results of the meas-urement were known, we conducted a qualitative assessment in order to learn about the life stories of residents of poor communities, their daily chal-lenges, and the difficulties they face when exercising their social rights. These studies were conducted in collaboration with universities, research centres, and entities in civil society. We were able to achieve a comprehensive analysis, both quantitative and qual-itative, which was the basis for planning and imple-menting public policies aimed at improving the liv-ing conditions of poor populations.áǠ
ȶʋȶ�bȍǫƃȇɭƃȶ
ȟɢǠȶ
ʋȶɽǿơɽʠɽƎơǠơɽŔࠈࠀࠂࠁࠆࠁࠁ߿ࠃ߿ࠁ

11 | DIMENSIONS DECEMBER 2019
Thanks to this analysis, we were able to create a tool for planning and coordination, focused at the municipal level, called ‘E-40’. This was a strategy for prioritizing and paying continuous attention to mu-nicipalities with the largest number of people, in rel-ative and absolute terms, who are living in a situation of extreme poverty in Oaxaca. In addition to setting short-, medium- and long-term actions to confront social deprivations, this tool allows us to focus on budgetary, physical, and human resources, and public policies in the poorest municipalities in Oaxaca. This is indispensable in a state with the demographic char-acteristics of Oaxaca, which consists of 570 munici-palities with over 13,000 localities, 45% of which have fewer than 2,500 inhabitants.
This tool allows us to focus on budgetary, physical, and human resources, and public policies in the poorest municipalities in Oaxaca.
Our poverty reduction strategy defines criteria for coordinated implementation that involves all govern-mental agencies in the municipal, state, and feder-al governments, as well as academia, the production sector, and civil society. That strategy is built on three cross-cutting themes: (1) women; (2) girls, boys, and adolescents; and (3) indigenous peoples.
What public policies have been implemented in Oaxaca to reduce multidimensional poverty?In my administration, we recognize that poverty is a multi-causal phenomenon and is a response to many variables besides income. Thus, the public policies that we have designed have two fundamental elements: one is economic and one is social.
Public and private investment came about as a result of strengthened governance, an increase in in-vestor confidence, and the improvement of available infrastructure. These investments generated formal employment, increased income for the population, and stimulated the economy in general.
As a result, in the last two years, according to the 2018 National Survey of Household Income and Ex-penditure of the National Institute of Statistics and Geography (INEGI in Spanish), the current quarterly
income per household has increased by 3,888 pesos (about USD 200). Furthermore, 3.6% of Oaxacans rose above the poverty line established by CONE-VAL, that is, 119,000 people overcame the condition of income-based poverty.
The increase in income and the implementation of programs such as Community Kitchens, Cold School Breakfasts, and Nutrition Aid for Vulnerable Individuals has facilitated a reduction of the depriva-tions in access to nutrition by 3.5 percentage points. In 2018, 126,637 more people were able to eat a healthy, varied, and sufficient diet.
Lack of access to social security has decreased by 1.7 percentage points, which means that a population of over 35,000 people can now enjoy those services. That decrease in percentage points was the highest in the country.
Regarding the social aspect, public policies were implemented to reduce social deprivations contribut-ing to multidimensional poverty. For example, in 2018, 435,675 more people had access to basic services than in 2016, thanks to actions like the Water Supply and Sanitation Sector Modernization Operation ‘Mas Oaxaca’. Deprivation in basic housing services was 3.7 percentage points lower compared to 2016.
We also spurred a housing programme that en-abled 119,000 people in Oaxaca to build solid walls for their homes, which in turn has made a significant contribution to a reduction in deprivations in terms of the quality and spaces of Oaxacan houses.
Finally, the Youth and Adult Education Pro-gramme enabled over 23,000 people to receive cer-tificates of completion in basic education over these past two years.
What made it possible to implement these public policies?The effective implementation of public policies in Oaxaca was based on three core foundations.
The first is defining the strategy to tackle poverty. At the beginning of my administration, we identified the factors that affected poverty and extreme poverty, and, at the same time, we established a roadmap with specific actions and clear goals, focusing the budget
INTERVIEW

12 | DIMENSIONS DECEMBER 2019
and tasks assigned to Cabinet members. The Ministry of Social and Human Development identified social deprivations by municipality and locality in an inter-active map that clearly highlighted the main social deprivations in each vulnerable population centre.
Second is inter-institutional coordination. Pub-lic policy actions were executed in a coordinated fash-ion at all levels of federal, state, and municipal gov-ernment. This made the programs more efficient by avoiding duplications or contradictions, improving results through more flexible and agile implementa-tion. In addition, it actively involved civil society, the production sector, and academia. The combination of will and effort has allowed a community to develop.
The third is on-going monitoring and evalua-tion of strategy at the highest level. We established a dashboard where every Cabinet member was required to report actions on a monthly basis, so that we could evaluate whether established goals were met from the start of the strategy. Furthermore, there were field vis-its to verify whether what had been reported as fin-ished actually had been completed.
What is the current situation of multidimensional poverty in Oaxaca?In spite of the fact that over the past two years the trend has tended toward reversing the increase in poverty, 66.4% of the population in Oaxaca still en-dures at least one social deprivation and does not
have sufficient income to cover all of their basic nu-tritional and non-nutritional needs.
Although the advances in the fight against extreme poverty in Oaxaca meant that it was the state with the greatest reduction (in percentage points) in extreme poverty in the period in question, still, in 2018 23.3% of the population lived in conditions of extreme poverty.
Without a doubt, we face enormous challenges in the fight against poverty and extreme poverty. Analy-sis of the figures in the CONEVAL report show that the five greatest sub-deprivations in the state are a lack of eco-friendly stoves, lack of access to social securi-ty, drainage, malnutrition, and school lag (specifically adults who have not completed secondary school).
The greatest sub-deprivation in the state is the lack of eco-friendly stoves. Over one million people use charcoal or wood for cooking, and their homes do not have chimneys. When it comes to the lack of drainage, this sub-deprivation affects 1.1 million inhabitants.
In contrast, just 0.9% of the population lacks access to electricity. Over 90% of Oaxacans have a roof over their heads, with just 0.6% of the population (24,000 people) lacking one.
The lack of social security is a very big challenge for Oaxaca, as it is for the rest of Latin America. It is the greatest social deprivation for the country and
INTERVIEW

13 | DIMENSIONS DECEMBER 2019
for Oaxaca. It can be summed up by two significant areas of opportunity: the first has to do with providing access to healthcare services and a retirement pension to 76.2% of Oaxacans (about three million people), and the second is for the production sector to generate fair conditions for their workers. There are currently 1.5 million people who are economically active and do not have access to healthcare and/or a pension for retirement.
We established a dashboard where every Cabinet member was required to report actions on a monthly basis.
The final measure of a sub-deprivation is access to food: it tells us that 27.9% of the population still faces this deprivation, that is, over one million people do not have a healthy, varied, and sufficient diet.
With regard to school lag, we still face great challenges dealing with the 27.1% of the population (over one million people) who do not have or have not completed their basic education. However, there has been significant progress in the fight against schooling lag among children aged 3 to 15 years old. However, it continues to be a big challenge given that currently 7.5% of this population segment does not attend primary or secondary school.
What are the plans in terms of public policies to continue to reduce poverty in Oaxaca?There are several. Among them, promoting infra-structure macro-projects that facilitate connectivity and attract investment in strategic sectors in the me-dium-term, and also permit sustainable development in southeast Mexico.
We also want to keep strengthening social policy that contributes to developing conditions of well-be-ing and prosperity for Oaxacan families. We will keep dealing with the factors that cause poverty both at the economic and the social level. For example, if the highest degree of social sub-deprivation in the state stems from the lack of eco-friendly stoves, that will be factored in when setting the budget for the following
year in order to stimulate public policy that leads to reducing it in 2020–2021.
Furthermore, we are committed to continuing to identify problems of social development in communi-ties and to the evidence-based evaluation of the results of social programs and actions, because this allows us to develop effective plans for short- and medium-term interventions to address lag and promote the economic activation of the most vulnerable populations.
To this end, we will strive to maintain and increase institutional coordination schemes by incorporating municipal government into a dynamic of cooperation and coordination, so that they generate social informa-tion that contributes to processes of strategic identifi-cation of the vulnerable population.
We will continue to consolidate strategic alliances with civil society, private initiatives, and academia, so that our work has a wider impact and greater transpar-ency and efficiency.
Alejandro Murat HinojosaGovernor of Oaxaca State, Mexico.
Phot
os: G
obie
rno
del E
stad
o de
Oax
aca
INTERVIEW

14 | DIMENSIONS DECEMBER 2019
The Use of the Multidimensional Poverty Measure in OaxacaBy Edith Yolanda Martínez López, Secretary of Social and Human Development, Ministry of Social and Human Development of Oaxaca, Mexico.
O axaca is a Mexican state that is rich in both natural resources and cultural heritage. It is the
cradle of the Zapotec and Mixtec cultures, which are emblematic of the Pre-Hispanic period. At 93,757 km2, it is the fifth largest state in Mexico and has 3.8 million inhabitants, with an average age of 24 years – two years younger than the national average. It is a young population that represents a great advantage for the state’s social and economic development. Six-ty per cent of the population is indigenous, and 33% speak an indigenous language.
Paradoxically, it is a state that continues to have
Historical Evolution of Multidimensional Poverty Rates in Oaxaca (%)
2008 2010 2012 2014 2016 2018
61.8
67.0
61.9
66.8
70.4
66.4
28.3 29.2
23.3
28.326.9
23.3
Extreme Poverty
Poverty
Source: Results of poverty in Mexico 2018 at a national level and by states, CONEVAL.
high levels of poverty. The results of the latest meas-urement of multidimensional poverty carried out by CONEVAL show that, in 2016, 70.4% of the total population, or 7 out of every 10 people, found them-selves in a situation of poverty. This is the highest percentage since measurements were established. Nonetheless, in 2018 there was a significant reduc-tion in poverty of 4 percentage points (or the equiva-lent of 132,644 people who overcame poverty) and a reduction of 3.6 percentage points in extreme pover-ty (135,308 people who overcame extreme poverty), making Oaxaca the state with the greatest reduction in poverty nationwide over the past two years.
áǠȶʋȶ�˫ǫƃȇɭƃȶ
ȟɢǠȶ
ʋȶɽࠆࠆࠅࠄࠄࠅॸࠇ
߿¥ࠅࠂࠀ߿߿ࠂࠁࠂ߿߿ࠀࠄ

15 | DIMENSIONS DECEMBER 2019
There was also a reduction in five of the six so-cial deprivations and in the income-based depriva-tion measured by the poverty index. The reduction in the indicator of social security was the highest in the country with a reduction of 1.7 percentage points (35,041 people) – in contrast with the na-tional trend that showed an increase of 1.5 points. The lack of basic housing services was reduced by 3.7 percentage points (122,543 people) while it in-creased by 0.5 points at the national level. Moreover,
the reduction in deprivations due to access to food was 3.5 percentage points (126,637 people), which represents the third highest reduction in the nation and contrasts with a national increase of 0.2 percent-age points. It is noteworthy too that current average household income is at its highest point in the last ten years, and the population with enough income to buy food and have access to a decent life has in-creased by 3.7 percentage points (118,996 people).
Deprivation due to access to social security
Deprivation due to access to
basic services in the home
Deprivationdue to access to
food
Schooling lag Deprivation due to housing
quality and space
Deprivation due to healthcare
services
77.9 76.2
62.058.3
31.427.9 27.3 27.1 26.3 25.1
15.9 16.3
Absolute Variations of Social Deprivations in Oaxaca 2016-2018 (%)
2016
2018
How was this advance achieved? The Oaxaca Ministry of Social and Human Development (SEDESOH in Spanish) is in charge of design-ing strategy to fight poverty in Oaxaca. Its success is based on two components: (1) political support at the highest level and (2) planning and targeting public investment and public policies through diagnostics with both a quantitative and qualitative focus on poverty at the state and municipal level.
Political will at the highest level
The governor of Oaxaca, Alejandro Murat Hi-nojosa, established a Technical Committee to fight poverty, with the participation of cabinet members in charge of targeting the six social deprivations. That led to involvement at the highest levels of gov-
ernment in decisions- that ranged from how to apply public policies to how to monitor established goals in order to evaluate their progress. In addition, it fa-cilitated participation and commitment on the part of academia, the production sector, and civil society.
Planning and focus
a) Quantitative diagnosisThe results of the multidimensional measurements of poverty have been extremely useful for the pre-cise diagnosis of social deprivations and their impact on poverty. They helped us to have a high-definition lens of the degree of poverty in municipalities and of the most pressing sub-deprivations. Using this in-formation, we defined the strategy to fight poverty in 40 top-priority municipalities, with an on-going
ARTICLE
Source: Results of poverty in Mexico 2018 at a national level and by states, CONEVAL.

16 | DIMENSIONS DECEMBER 2019
focus on the areas with the greatest concentration of people, in terms of concrete numbers and percentag-es, who are in situations of poverty and extreme pov-erty – what we call the ‘E-40’. Using CONEVAL’s data we were able to identify the number of homes that do not have basic services such as drinking wa-ter, electricity, drainage, a solid roof or floor, and the number of people who do not have access to health-care services, social security, or education.
b) Qualitative diagnosisUsing quantitative data, we have identified that the greatest social sub-deprivation in Santos Reyes Yu-cuná – the municipality with the highest percentage of people living in poverty (99.9%) – is drainage, fol-lowed by access to food, drinking water, and stoves without chimneys. Nonetheless, identifying social problems required looking beyond the numbers. To do this, SEDESOH collaborated with the Centre for Research and Advanced Studies in Social An-thropology (CIESAS) South Pacific Unit to conduct a qualitative study of the municipality.
The main results revealed that poverty in this mu-nicipality was mainly due to a shortage of water, which is exacerbated during dry periods. This lack of water has direct and dire repercussions for the community: it makes productive agriculture and livestock farming impossible and compels people to migrate to large ur-ban centres outside of the state, where they often at-
tempt to support themselves as street seller people. It also directly affects children who quit school to work with their parents (an effect of migration).
The results of the multidimensional measurements of poverty have been extremely useful for the precise diagnosis of social deprivations and their impact on poverty.
Parents also leave for work reasons, which affects children and is directly reflected in school lag. In the rainy season the population returns to the community to engage in agricultural work (fallowing, ploughing, planting, and clearing the corn harvest). This dynamic is responsible for on-going circular migration, which limits both the ability to generate income and the productive activities of the municipality, and, in turn, limits the community’s development.
This is the reason why, once the results were ob-tained, the complementary information provided by the quantitative and qualitative data became evident. While the statistical data suggests a concentration in the six social deprivations, the qualitative study out-lines some other aspects that are not considered in the
Multidimensional Measurement of
Poverty
Healthcare services
Schooling lag
Access tofood
Social Security
Qualitative Investigations
Water
Migration
Productivity Quality and spaces of the
housing
Basic services in the housing
Santos Reyes Yucuná
ARTICLE

17 | DIMENSIONS DECEMBER 2019
metrics, such as the phenomenon of migration or the community’s productivity. Following this, planning for interventions and spending targeting can focus on both analyses. For example, we found the five great-est social sub-deprivations in the state were the lack of stoves with chimneys, workers without access to healthcare, the lack of drainage, a lack of food, and adults who have not finished primary school.
Aided by the complementarity of the quantitative tools and the qualitative studies, we have Ǝơ˪ȥơƎ�ȶȥnjȶǫȥnj�ŔȥƎ�ɢɭǫȶɭǫʋˊ�actions on a municipal level.
Interactive maps were also created to illustrate the degree and intensity of the social sub-deprivations in each municipality, even indicating by street the are-as with the highest concentration of the population suffering the given sub-deprivation. For example, we know that in the municipality of San Juan Bautista Tuxtepec the lack of access to healthy, varied, and suf-ficient food is the main cause of poverty. Thanks to the use of this map, areas of the municipality that required public policy interventions to combat the problem were identified. The use of this tool by agencies and entities that execute the programs and social actions promotes an effective use of public resources by focus-ing attention on the areas with the highest concen-tration of people who are experiencing some kind of deprivation and directing support to those who really need it.
In conclusion, in Oaxaca we have a solid strategy to fight poverty and in implementing it we have been able to reverse the trend of poverty growth over the
past eight years. Aided by the complementarity of the quantitative tools and the qualitative studies, we have defined on-going and priority actions on a municipal level, fulfilling institutional commitments that ensure the population’s social rights.
Finally, we face great challenges in the imple-mentation, monitoring, and evaluation of that strate-gy due to the geographic complexity of the Oaxacan territory, which is largely mountainous; the highly dispersed population (with more than half living in towns of fewer than 2,500 inhabitants); and the in-equality of our women and indigenous people, who are our greatest source of wealth. Our vision for de-velopment is a combination of financial well-being with the full exercise of social rights within a sus-tainable framework.
Edith Yolanda Martínez López Secretary of Social and Human Development, Ministry of Social and Human Development of Oaxaca.Ph
oto:
Dul
ce M
aría
Her
nánd
ez L
ópez
- Flic
kr.co
m/t
ime-
to-lo
ok/T
ed M
cGra
th

18 | DIMENSIONS DECEMBER 2019
Measuring Poverty in BusinessesIn Costa Rica, approximately 87%ࡀ of jobs are in the private sector. It is a dynamic sector that is constantly growing. However, what are the living conditions of these workers? Does having a job and an income ensure that they have a good quality of life? Could there be multidimensionally poor workers in the private sector? The association Horizonte Positivo, with the support of the Oxford Poverty and Human Development Initiative (OPHI), developed the Business Multidimensional Poverty Index (bMPI) to answer these questions.
áǠȶʋȶ�áˉǠơɭơƃȶȟƎơɢǠ
ȶʋȶࠂࠆࠃࠆ߿ࠄ
H orizonte Positivo worked with the government of Costa Rica in rolling out the national MPI,
which identifies who is poor and what their poverty looks like, taking into consideration five dimensions and 19 indicators. However, no one had considered applying the national MPI in other areas until a member of the board of directors of Horizonte Posi-tivo, Ernesto Castegnaro, raised the issue. Castegna-ro, who at the time was the general manager of BAC Credomatic Bank for Central America, asked how, as CEO of a successful finance company in the region, he could find out which of his employees were multi-dimensionally poor.
It was a question that did not have an immediate answer. It is generally thought that salaried employees are, by comparison, in a better situation because they have a job and income. However, their reality could be very different if they experience situations that af-fect their living conditions. For example, at home they might be caring for an elderly person, a person with disabilities, or a close relative who is still in school, or they may experience problems of a different nature that are not strictly monetary, all of which could go unnoticed if not measured.
The idea was therefore to apply Costa Rica’s MPI to companies, which gave rise to the bMPI. The bMPI is used to describe the situation of workers in greater detail. It thus provides businesses with a reliable and evidence-based tool so that they can face challenges with intelligent solidarity and create initiatives that help to improve the conditions of their employees.
Pioneering bMPI businesses
In 2016, two of the most important businesses in Costa Rica – BAC Credomatic and Purdy Motor (Toyota’s distributor in Costa Rica) – wanted to be pioneers in implementing the bMPI. Both businesses have a positive history of corporate social responsibil-ity and good practices with their employees. Work-ing with these two companies, Horizonte Positivo developed three different components that together formed the basis of the bMPI.
The first component was the methodology. OPHI technicians adapted and simplified the metrics of Costa Rica’s national MPI calculated by the Institu-to Nacional de Estadísticas y Censos (INEC), which implied adjusting the questions and creating a tech-
¹ Inec, 2018

19 | DIMENSIONS DECEMBER 2019
nological platform that was user-friendly, allowing for the efficient collection of the information needed to calculate the bMPI.
The bMPI is used to describe the situation of workers in greater detail. It thus provides businesses with a reliable and evidence-based tool.
The second component was the design of proto-cols to systematise information and transform it into graphics showing general and specific trends. Addi-tionally, the decision was made to incorporate the lev-el of debt of employees and their families – thereby
revealing the state of their finances – without altering the calculation of the bMPI, so that it would still be comparable with the national MPI.
An initial financial investment was made, pro-vided by the partners of Horizonte Positivo, to first develop the survey online and then to create a robust platform to analyse the data. This led to a third com-ponent that allowed for the detection of the most serious deprivations and where within the company these deprivations were the most common among employees – providing the information necessary to create solutions focused on reducing or eliminating these deprivations.
Once the survey was administered and the main deprivations of workers were defined, BAC and Purdy Motor began to build a series of solutions di-
ARTICLE
Dimension Indicator Relative weight
Education 20%
School attendance 5%
Schooling lag 5%
7ǫƎ�ȥȶʋ�˪ȥǫɽǠ�ɽơƃȶȥƎŔɭˊ�ɽƃǠȶȶȍ 5%
Low human capital 5%
Health 20%
qơŔȍʋǠ�ǫȥɽʠɭŔȥƃơ�Ŕlj˪ȍǫŔʋǫȶȥ 5%
Drinking water 5%
Basic sanitation 5%
Garbage collection 5%
Housing 20%
èȶȶlj�ŔȥƎ�˫ȶȶɭ�ǫȥ�ɢȶȶɭ�ƃȶȥƎǫʋǫȶȥ 5%
Outside walls in poor condition 5%
Overcrowding 5%
No internet access 5%
Employment 20%
Extended unemployment or despondency 6.67%
Fȟɢȍȶˊȟơȥʋ�ˁǫʋǠ�ȥȶȥljʠȍ˪ȍȟơȥʋ�ȶlj�ȟǫȥǫȟʠȟ�ˁŔnjơ 3.33%
Fȟɢȍȶˊȟơȥʋ�ˁǫʋǠ�ȥȶȥljʠȍ˪ȍȟơȥʋ�ȶlj�ȍŔŹȶʠɭ�ɭǫnjǠʋɽ 3.33%
Informal independent employment 6.67%
Social security20%
Infant without childcare 5%
Elderly people without pension 5%
People with disabilities without transfers 5%
Not employed due to high family responsibilities 5%
bMPI and National MPI in Costa Rica
Costa Rica’s business MPI has the same dimensions, indicators, and relative weights as the Costa Rican national MPI. The only difference is the survey used for the calculation of the bMPI, given that it also collects information about the level of debt of employees and their families. This information is compared with the general results to obtain a more ƃȶȟɢȍơʋơ�ɢɭȶ˪ȍơ�ȶlj�ʋǠơ�ǠȶʠɽơǠȶȍƎɽ�
The data used to calculate the bMPI is obtained through an online survey and, in some cases, face-to-face interviews. They include the questions from Costa Rica’s national MPI but use less technical language compared to the INEC survey used to compute the national MPI. This provides information about the workers and their households.
The bMPI can be disaggregated by department, division of the company, and aspect of the business, among other categories. This information allows for the allocation of resources, implementation of actions, and monitoring of changes in the different deprivations of employees and their families when an analysis is made over time.
Source: Multidimensional Poverty Index: General Results. National Institute of Statistics and Census, Costa Rica, 2015.

20 | DIMENSIONS DECEMBER 2019
rected towards workers living in multidimensional poverty, combining these with other existing initi-atives. One example is Purdy Cole, an initiative of Purdy Motors in partnership with the Ministry of Education, in which the business helps its workers who have not finished secondary education to com-plete their studies during working hours. Likewise, BAC developed a financial coaching project to sup-port workers in serious debt. This program, which included the participation of Solidarísta, an organi-sation of workers focused on generating savings and capitalising on this money, provided a series of ser-vices for workers.
Horizonte Positivo has also promoted solutions. One of them is called ‘Emprendamos’ and is aimed at people who are unemployed, in other words, who present a deficiency in the dimension of employ-ment. The association supports those who wish to start their own business by helping them develop an investment plan and communication strategy, as well as providing assistance in acquiring initial capital.
Thus, a model has been built that is being im-proved constantly, where the technological instru-
ments of surveys, data analysis, and monitoring are optimised so that businesses can find out where to focus their resources and create solutions.
Key factors in implementation
The most fundamental key to the success of the bMPI is the internal communication prior to the launch: both to educate workers about the purpose of the programme (and therefore moti-vate them to complete the survey) and to explain to them how to fill it out. Horizonte Positivo de-veloped a tool called ‘pre-boleta’, which is a list of information that workers should have in order to respond to the questions related to aspects like the size of their house and the number of people who work in the household, among others. The survey takes between 20 and 30 minutes to be completed.
Communication and awareness-raising among senior management is also important to guarantee that budgets are allocated on time and that execu-tives can make the necessary arrangements for the programme. All parties should be involved.
áǠȶʋȶ�áˉǠơɭơƃȶȟƎơɢǠ
ȶʋȶࠈࠆࠅࠅࠃ߿
ARTICLE

21 | DIMENSIONS DECEMBER 2019
See testimonials at youtu.be/9BqD9Wusfrs
The bMPI in action
Information is analysed by Horizonte Positivo through the platform. Generally, Horizonte Positivo prepares an executive report that is given exclusively to the CEO and human resources manager (to main-tain the privacy of the workers) that contains details of the general results and specific cases that require greater attention. The worker is given an indivual-ised report before being invited to participate in one of the programmes in education, reprogramming of debts, access to housing, or elderly care.
The most fundamental key to the success of the bMPI is the internal communication prior to the launch.
To date, over 40 business have joined this project and 17,617 workers across the whole of Costa Rica have carried out the survey. If we take their house-holds into consideration, this equates to 59,791 peo-ple mapped in the five dimensions of the bMPI.
Future: bMPI seal
Horizonte Positivo has developed a platform that enables the creation of probabilistic scenarios. This al-low predictions to be made about how much money needs to be spent when certain solutions are applied for a specific number of people and households in order to reduce the incidence of the different dep-rivations and thus reduce multidimensional poverty. Horizonte Positivo is also in dialogue with different business chambers and private and public institutions in Costa Rica in order to achieve higher participation in different geographical areas and territorial sub-re-gions, as well as different industries and branches of economic activity.
In addition, the association is working with sOPHIa Oxford, a non-profit organisation responsible for applying OPHI’s expertise in the private sector, to complete the technical design of a seal that will be awarded to businesses using the bMPI. sOPHIa Ox-ford is responsible for establishing an audit in order to verify the process of implementing the bMPI, which will analyse if communication was accurate, if data management was ethical, whether the programmes had an impact, and whether deprivations were elimi-nated, among other things. The seal will be awarded to participating businesses once these requirements have been fulfilled.
For José Aguilar, executive director of Horizonte Positivo, the positioning of this seal in the nation-al imagination is of fundamental importance: ‘The dream, the aspiration, is truly to join it and link it to the national brand of Costa Rica, a country that exports peace and that produces and exports shared prosperity, not just bananas and technology. It exports and produces peace: this is the dream.’
ARTICLE

22 | DIMENSIONS DECEMBER 2019
Examples of Solutions Applied in Costa Rica
Deprivation Programme
Low human capital�7ǫƎ�ȥȶʋ�˪ȥǫɽǠ�ɽơƃȶȥƎŔɭˊ�ɽƃǠȶȶȍ
Educándote Ya
Convexa
Emprendamos
Internal education initiative: Study grant for family member, English courses
Internal education initiative: University study grant
Internal education initiative: Es tu hora Diploma/Secondary School
Internal education initiative with Convexa: Terminar Bachi
Internal education initiative with El Maestro en Casa
Schooling lag Fundación Acción Joven: Academic support for lag
School attendance Fundación Acción Joven: Educational rehabilitation strategy
qơŔȍʋǠ�ǫȥɽʠɭŔȥƃơ�Ŕlj˪ȍǫŔʋǫȶȥ
--òò�ljŔȟǫȍˊ�Źơȥơ˪ʋ
Internal health initiative: Private medical insurance
Medismart
Basic sanitation
Internal sanitation initiative with INHAUSGarbage collection
Drinking water
Fȟɢȍȶˊȟơȥʋ�ˁǫʋǠ�ȥȶȥljʠȍ˪ȍȟơȥʋ�of minimum wage
Internal employment initiative: Labour rights manual
Internal employment initiative: Roll out of labour rights, wage noncompliance, workplace harassment, etc
Fȟɢȍȶˊȟơȥʋ�ˁǫʋǠ�ȥȶȥljʠȍ˪ȍȟơȥʋ�of labour rights
Yo Trabajo
Internal employment initiative: Unemployment and informal employment
Informal independent employment Internal employment initiative with the Ministry of Work and Social Security in Limón
Overcrowding.Outside walls in poor condition. èȶȶlj�ȶɭ�˫ȶȶɭ�ǫȥ�ɢȶȶɭ�ƃȶȥƎǫʋǫȶȥ
No internet access.
Fuprovi
Creation of internal initiative with Urbarium
Internal housing initiative
Internal housing initiative with Mutual Alajuela
Internal housing initiative: Economic assistance
Elderly people without pensionCSS RNC/RIVM
Internal social security initiative: Legal advice for pension
People with disabilities without transfers RNC
Infant without childcare
DEVIH Foundation
Creation of internal initiative with DEVIH Foundation
Internal social security initiative: School for parents for infants without childcare
Internal social security initiative: Agreement with nurseries
Not employed due to high family responsibilities Internal social security initiative: Red Manú for women
Debt
Financial talks
¶lj˪ƃơ�ȶlj�-ȶȥɽʠȟơɭ�bǫȥŔȥƃơ
zȥʋơɭȥŔȍ�˪ȥŔȥƃơ�ǫȥǫʋǫŔʋǫʽơ�bǫȥŔȥƃǫŔȍ�ơƎʠƃŔʋǫȶȥ�ˁȶɭȇɽǠȶɢɽ
zȥʋơɭȥŔȍ�˪ȥŔȥƃơ�ǫȥǫʋǫŔʋǫʽơ�þŔȍȇɽ�ŔŹȶʠʋ�Ī�þ
zȥʋơɭȥŔȍ�˪ȥŔȥƃơ�ǫȥǫʋǫŔʋǫʽơ�7ơŹʋ�ɭơŔƎǿʠɽʋȟơȥʋ zȥʋơɭȥŔȍ�˪ȥŔȥƃơ�ǫȥǫʋǫŔʋǫʽơ�bǫȥŔȥƃǫŔȍ�ɽɢȶȥɽȶɭɽ
Psycho-emotional supportPeniel Method
Internal psycho-emotional support initiative BAC-Peniel method partnership for critical debt
Source: Asociación Horizonte Positivo, 2019.
ARTICLE

23 | DIMENSIONS DECEMBER 2019
Tamang*, a 56-year-old landless woman from an indigenous minority caste, lives near a remote jun-
gle in Nepal with her husband, who has severe disabili-ties and a low body mass index (less than 18.5), and two granddaughters, who are attending school, the older of whom just started 7th grade. Her livelihood is collecting and selling wood. Waking before dawn, she feeds the chickens then walks with friends to the jungle to collect wood, often going deep inside, which is not safe due to wild animals. After chopping the wood, she carries it on her back to the market, because she does not own any means of transportation. If she sells the wood, she buys some rice and vegetables for the family, returning home around 11am. After cooking lunch, she returns to the jungle to fetch her own cooking fuel.
A Day in the Life:Living in multidimensional poverty in Nepal, Tamang’s story
Tamang lives in a rudimentary single-room hut with a dirt floor. She has no toilet and uses her nei-ghbour’s unprotected well for drinking water. She has electricity but does not own a phone, refrigerator, tele-vision, or even a radio.
Despite plentiful obstacles, she is happy because the bonds of affection within her family are strong. She ob-serves that happiness is something that we cannot buy in the market. Tamang is poor according to the global MPI. She is deprived in 44.4% of weighted indicators (see the chart below).
* Some details have been changed.
Nutrition Childmortality
Years of schooling
Schoolattendance
Cook
ing
fuel
San
itatio
n
Drin
king
wat
er
Hous
ing
Elec
tric
ity
Asse
ts
Living StandardsHealth Education
10 indicators
3 dimensions of poverty
Tamang’s deprivation chartThe coloured boxes show the deprivations that her household faces across the MPI.
Phot
os: O
PHI

24 | DIMENSIONS DECEMBER 2019
Sierra Leone Launches a National MPI
áǠȶʋȶ�bȍǫƃȇɭƃȶ
ȟɢǠȶ
ʋȶɽƎǫɭơƃʋɭơȍǫơljࠀࠈࠇࠄࠂࠅࠅࠆࠈࠁ
I n May 2019, Sierra Leone became one of the first countries in Africa to publish a National Mul-
tidimensional Poverty Index (MPI-SL). The MPI-SL comprises five dimensions and 14 indicators and identifies a person as being multidimensionally poor if they experience more than 40% of the deprivations included in the measure.
The results of the report show that 64.8% of the population of Sierra Leone is multidimensionally poor and that, on average, those living in multi-dimensional poverty suffer deprivations in 58.9% of the indicators. At the national level, sanitation, electricity, and years of schooling are the indicators that contribute the most to the country’s MPI.
The MPI-SL also reveals important differences between rural and urban areas. The proportion of the population living in multidimensional poverty in rural areas is more than double that in urban ar-eas (86.3% and 37.6%, respectively).
When examining the findings by province, results indicate that the Southern Province (76%), North-ern Province (75.8%), and Eastern Province (67.6%) have the highest poverty rates, whilst the urban Western Province has the lowest (36.2%).
At the national level, sanitation, electricity, and years of schooling are the indicators that contribute the most to the country’s MPI.
The source for the MPI-SL data is the 2017 Mul-tiple Indicator Cluster Survey (MICS). The report, Si-erra Leone National Multidimensional Poverty Index 2019, was prepared by the Ministry of Planning and Economic Development and Statistics in Sierra Leone with financial and technical support from the United Nations Development Programme (UNDP) in collab-oration with the Oxford Poverty and Human Devel-opment Initiative (OPHI) of the University of Oxford.

25 | DIMENSIONS DECEMBER 2019
Dimension Indicator Deprivation Cut-off Weight
Education
Years of schooling No household member older than school age has completed at least six years of schooling. 10.0%
School attendance At least one school-aged (six to 14 years) child is not attending school. 10.0%
Health
Nutrition �ʋ�ȍơŔɽʋ�ȶȥơ�ƃǠǫȍƎ�ʠȥƎơɭ�˪ʽơ�ǫɽ�ʠȥƎơɭˁơǫnjǠʋ�ȶɭ�ɽʋʠȥʋơƎ 6.7%
Child mortality �ʋ�ȍơŔɽʋ�ȶȥơ�ƃǠǫȍƎ�ʠȥƎơɭ�˪ʽơ�ǠŔɽ�ƎǫơƎ�ǫȥ�ʋǠơ�ǠȶʠɽơǠȶȍƎ�ǫȥ�ʋǠơ�˪ʽơ�ˊơŔɭɽ�ɢɭǫȶɭ�ʋȶ�ʋǠơ�ɽʠɭʽơ ́ 6.7%
Vaccination �ʋ�ȍơŔɽʋ�ȶȥơ�ƃǠǫȍƎ�ʠȥƎơɭ�˪ʽơ�ǠŔɽ�ȥȶʋ�Źơơȥ�ljʠȍȍˊ�ʽŔƃƃǫȥŔʋơƎ�according to his/her age. 6.7%
Housing
Housing materials þǠơ�Ǡȶʠɽơ�ǠŔɽ�ơŔɭʋǠɽŔȥƎ�ȶɭ�Ǝʠȥnj�˫ȶȶɭ�ŔȥƎ�ǫʋ�ǠŔɽ�ˁŔȍȍɽ�ȶɭ�Ŕ�roof made of natural or low-quality materials.* 6.7%
Asset ownershipThe household does not own more than one of these assets: radio, TV, telephone, bicycle, motorcycle, computer, animal cart, or refrigerator; and does not own a car or a truck.
6.7%
Overcrowding The number of persons per sleeping room is three or more. 6.7%
Living Standards
Water
The main source of drinking water is an unprotected well, unprotected spring, tanker-truck, cart with small tank, water kiosk, or other, or it is a protected source of water but it takes more than 30 minutes (round trip) to collect it. (Households us-ing bottled water are only considered to be using an improved source of water when they use water from an improved source for cooking and personal hygiene.)
8.0%
Bank account No member has a bank account. 4.0%
Sanitation
þǠơɭơ�ǫɽ�ȥȶ�ʋȶǫȍơʋ�ljŔƃǫȍǫʋˊ�ȶɭ�ʋǠơ�ȟŔǫȥ�ʋȶǫȍơʋ�ljŔƃǫȍǫʋˊ�ǫɽ�˫ʠɽǠ�ʋȶ�open drain/unknown location, pit latrine, pit latrine without slab, open pit, bucket, hanging toilet, hanging latrine, or other; or it is improved but shared with other households.
8.0%
Energy
Internet There is no connection to the internet in the household. 4.0%
Cooking fuel
The household uses as the main cookstove a liquid fuel stove, a manufactured solid fuel stove, a traditional solid fuel stove, ȶɭ�Ŕ�ʋǠɭơơɽʋȶȥơ�ɽʋȶʽơȶɢơȥ�˪ɭơȶʋǠơɭ�ʋˊɢơ�ȶlj�ɽʋȶʽơ�ŔȥƎ�ʋǠơ�energy used is coal, charcoal, wood, crop residue, processed biomass, or other, and the household cooks with polluting fuel inside the house or the stove does not have a chimney.
8.0%
Electricity There is no electricity in the household. 8.0%
MPI Formulation – Sierra Leone
Source: Sierra Leone National Multidimensional Poverty Index 2019.
* The household is considered deprived if the roof is non-existent or made of the following: thatch/palm leaf, sod, rustic mat, palm/bamboo, cardboard, or other materials. It is considered deprived if the walls are non-existent or made of the following: cane/palm/trunks, dirt, bamboo with mud, stone with mud, uncovered adobe, cardboard, or other materials.
SIERRA LEONE MPI

26 | DIMENSIONS DECEMBER 2019
Multidimensional Poverty in the United StatesT his year the U.S. Census Bureau published a
report with an innovative multidimensional poverty measurement exercise called the Multidi-mensional Deprivation Index (MDI), which is in-tended to complement, without replacing, the official income-based poverty measures.
The MDI, which is based on the Alkire-Foster method, has six dimensions: standard of living, edu-cation, health, economic security, housing quality, and neighbourhood quality.
Data for 2017 indicate that, according to the MDI, 15.4% of the population is multidimensionally poor, somewhat more than the official measurement for monetary poverty at 13.4%. Standard of living and housing quality were the largest contributors to the MDI.
It is interesting to see how the dimensions making up the MDI are measured; this is shown in the table below.
Dimensions How Dimensions Are Measured
Standard of living zȥ�ɢȶʽơɭʋˊ�ŔƃƃȶɭƎǫȥnj�ʋȶ�ʋǠơ�ȶlj˪ƃǫŔȍ�ȟȶȥơʋŔɭˊ�ɢȶʽơɭʋˊ�ȟơŔɽʠɭơ�
Education Aged 19 or older and without a high school diploma or GED; based on head of household educational attainment for those under the age of 19.
Health Predicted health status is poor. Based on cut-off value of 3 disabilities reported for people under the age of 65 and 3.5 for people aged 65 and over.
Economic security
At least two of the following conditions: i. Lacked health insurance, ii. Unemployed all of the prior 12 months, iii. Cumulative hours worked per week for the household were less than 35 hours (for those under 65) and no retirement or Social Security income in the household (over 65).
Housing quality
At least two of the following conditions:i. Lacked complete kitchen, ii. Lacked complete plumbing, iii. Overcrowded housing unit (more than two persons per room), iv. High cost burden (spending more than 30% of household income on housing costs).
Neighbourhood quality
Lived in a county with at least two of the following conditions: i. High crime (more than 500 violent crimes per 100,000 inhabitants), ii. Poor air quality, iii. Poor food environment (if the food environment index is below 6).
Source: U.S. Census Bureau. More information here.
DATA OF THE MONTH

27 | DIMENSIONS DECEMBER 2019
MPPN Side Event at the UNGA 2019“Call for Action: Using Multidimensional Poverty Indices to Lead Progress in the SDGs”
On 25 September 2019 at the UN Headquarters in New York, the Multidimensional Poverty Peer Network (MPPN) and the Oxford Poverty and Human Development Initiative (OPHI) held a side event during the SDG Summit at the 74th UN General Assembly for 19 high-level speakers to share their experiences of using multidimensional poverty indices to lead progress in the Sustainable Development Goals (SDGs), including SDG1: End poverty in all its forms everywhere.
The side event was hosted by the President of Costa Rica on behalf MPPN, with support from OPHI at the University of Oxford.
UNGA 2019
1
3
2
4
5 6 7
mppn.org/unga2019áǠȶʋȶɽ¶�
áqz�ʠȍǫơʋǠ�¡ƢȥƎơ�˖�ࠀ�ࠂŔȥƎ�ࠃ
1. Carlos Alvarado, President of Costa Rica 2. Luis Felipe López-Calva. Regional Director for Latin America and the Caribbean, UNDP 3. and 4. Overview of the room 5. Hajiya Sadiya Umar Faruk, Minister for Humanitarian Affairs, Disaster Management and Social Development, Nigeria 6. Jackson Mthembu, Minister in the Presidency, South Africa 7. Alicia Bárcena, Executive Secretary, UN – Economic Commission for Latin America and the Caribbean.

28 | DIMENSIONS DECEMBER 2019
Global Sustainable Development Report
The first Global Sustainable De-velopment Report (GSDR) enti-tled ‘The Future is Now. Science for Achieving Sustainable Devel-opment’ was launched in Septem-ber at the Sustainable Develop-
ment Goals Summit. Its first recommended pathway for Call to Action 1 encourages governments to use national MPIs and to ‘measure poverty in multiple di-mensions based on a country-level understanding of poverty’.
This report, requested by all countries to evaluate pro-gress on the 2030 Sustainable Development Agenda, was written by an independent group of 15 scientists appointed by the United Nations Secretary-General.More info here.
Poverty research by OPHI wins Oxford prestigious Queen’s Anniversary Prize
The University of Oxford is among 22 United King-dom educational institutions
announced as winners of The Queen’s Anniversary Prizes for research and outreach carried out by the Oxford Poverty and Human Development Initiative (OPHI), which acts as the Secretariat to the MPPN.
The Queen approved the award of The Queen’s Anni-versary Prize in the thirteenth round of the scheme, which has recognised the work of OPHI on the meas-urement and understanding of global poverty and the contribution of its applied research to improving pol-icymaking in poverty reduction by governments and international agencies.More info here.
OPHI Summer School in Mexico
Sixty participants representing 23 countries from around the world took part in the 2019 Summer School, hosted by CONEVAL in Mexico City,
to learn about multidimensional poverty measurement with a strong emphasis on the Alkire-Foster method.
During the course, special speakers included: Exec-utive Secretary of CONEVAL, Dr José Nabor Cruz Marcelo; Professor James Foster, the Oliver T Carr Jr Professor of International Affairs at the George Washington University; and Luis Felipe López-Cal-va, UN Development Programme (UNDP) Assis-tant Administrator and Regional Director for Latin America and the Caribbean.More info here.
New Free Online Course!
Register now for a new Mas-sive Online Open Course (MOOC) on Designing a Multidimensional Poverty Index (MPI), which was jointly developed by the
United Nations Development Programme (UNDP) and OPHI.
In this course, taught in English, you will learn to develop a holistic multidimensional poverty index that integrates income-based inequalities with dep-rivations across health, education, housing, sanita-tion, employment and livelihoods, food security, en-vironment, and other living standards to inform the implementation of the 2030 Agenda for Sustainable Development. This free, five-week MOOC starts on 24 February 2020.More info and pre-registration: here.
News

29 | DIMENSIONS DECEMBER 2019
Handbook:How to Build a National Multidimensional Poverty Index (MPI)
How to create a national MPI?What are its purposes? How to communicate it? How to select dimensions and indicators? How to analyse its data?
This handbook, published by UNDP and OPHI, provides a guide to design national MPIs or other multidimensional poverty measures by
• Illustrating the process of creating a multidimensional poverty measure,
• Describing technical and political processes to create sustainable and rigorous measures that are proactively and effectively used in policies to end poverty, and
• Providing examples based on countries’ experiences.
This handbook is available for free at mppn.org/handbook-national-mpi.
How to Build a National Multidimensional Poverty Index (MPI):Using the MPI to inform the SDGs
OPHIOxford Poverty & Human
Development Initiative
United Nations Development Programme (UNDP) and Oxford Poverty and Human Development Initiative (OPHI), University of Oxford

30 | DIMENSIONS DECEMBER 2019
MPPNThe Multidimensional Poverty Peer Network (MPPN) is a South-South initiative that supports policymakers in developing multidimensional poverty measures.
It promotes the use of such measures for more effective poverty eradication efforts at the global, national, and local levels.
• Afghanistan• Angola• Antigua and Barbuda• Argentina• Bangladesh• Bhutan• Bolivia• Botswana• Brazil• Burkina Faso• Chad• Chile• China• Colombia• Costa Rica• Cuba
• Djibouti• Dominican Republic• Ecuador• Egypt• El Salvador• eSwatini• Gambia• Grenada• Guatemala• Honduras• Indonesia• Iraq• Jamaica• Malaysia• Mexico• Mongolia
• Morocco• Mozambique• Namibia• Nepal• Nigeria• Pakistan• Panama• Paraguay• Peru• Philippines• Rwanda• Saint Lucia• Saint Vincent and the Grenadines• Senegal• Seychelles
• Sierra Leone• South Africa• Spain• Sudan• Tajikistan• Tanzania• Thailand• Tunisia• Turkey• Uganda• Uruguay• Viet Nam
áŔɭʋǫƃǫɢŔȥʋɽ�ǫȥ�ʋǠơ�ȥơʋˁȶɭȇ�Ŕɭơ�¡ǫȥǫɽʋơɭɽ�ŔȥƎ�ɽơȥǫȶɭ�ȶlj˪ƃǫŔȍɽ�ljɭȶȟ
www.mppn.org

31 | DIMENSIONS DECEMBER 2019
Cover PhotoPxhere.com/photo/1281975 Creative Commons CC0
Page 3Flickr/Flore de Preneuf/World BankAttribution-NonCommercial-NoDerivs 2.0 Generic (CC BY-NC-ND 2.0)
PHOTO CREDITS
Page 4Flickr/mark_lehmkuhlerAttribution-NoDerivs 2.0 Generic (CC BY-ND 2.0)
Page 10Flickr/Jesús DehesaAttribution-NoDerivs 2.0 Generic (CC BY-ND 2.0)
Pages 12-13Gobierno del Estado de Oaxaca
Page 14Flickr/Adam SearcyAttribution-ShareAlike 2.0 Generic (CC BY-SA 2.0)
Page 17Dulce María Hernández López
Page 20Pxhere.com/photo/796604Creative Commons CC0
Page 24Flickr/ Direct ReliefAttribution-NonCommercial-NoDerivs 2.0 Generic (CC BY-NC-ND 2.0)
Page 23OPHI
Page 27Flickr/Ophi/Julieth Méndez
Back CoverFlickr/Axel Fassio/CIFORAttribution-NonCommercial-NoDerivs 2.0 Generic (CC BY-NC-ND 2.0)Convert to monochrome
Page 9Flickr/John ElliottAttribution-NonCommercial-NoDerivs 2.0 Generic (CC BY-NC-ND 2.0)
Page 17Flickr/Ted McGrathAttribution-NonCommercial-ShareAlike 2.0 Generic (CC BY-NC-SA 2.0)
Page 18Pxhere.com/photo/737450Creative Commons CC0
Page 21Screenshotyoutu.be/9BqD9Wusfrs