Viet Nam HIV/AIDS Estimates and Projections 2007-2012
50
VIET NAM HIV/AIDS ESTIMATES AND PROJECTIONS 2007 - 2012 Ha Noi 4/2009 MINISTRY OF HEALTH – VIET NAM ADMINISTRATION OF HIV/AIDS CONTROL 43
-
Upload
khangminh22 -
Category
Documents
-
view
0 -
download
0
Transcript of Viet Nam HIV/AIDS Estimates and Projections 2007-2012

VIET NAM HIV/AIDSESTIMATES AND PROjECTIONS
2007 - 2012
ha Noi 4/2009
MINISTRY OF HEALTH – VIET NAM ADMINISTRATION OF HIV/AIDS CONTROL 43

THIS RePORT wAS MADe POSSIBLe UNDeR THe LeADeRSHIP Of THe MOH
1. Trinh Quan Huan, MD, PhD - Vice Minister of Health2. Nguyen Thanh Long, MD, PhD - Viet Nam Administration of HIV/AIDS Control3. Pham Duc Manh, MD, PhD - Viet Nam Administration of HIV/AIDS Control4. Phan Thi Thu Huong, MD, MPH - Viet Nam Administration of HIV/AIDS Control
AGeNCIeS AND INSTITUTIONS INVOLVeD
1. National Institute of Hygiene and Epidemiology (NIHE)- Nguyen Tran Hien, MD, PhD- Nguyen Anh Tuan, MD, PhD
2. Viet Nam Administration of HIV/AIDS Control (VAAC)- Nguyen Thanh Long, MD, PhD - Phan Thi Thu Huong, MD, MPH - Vo Hai Son, MD- Le Tong Giang, BS
3. Regional Pasteur Institutes, Provincial AIDS Committees
4. Family Health International (FHI)- Stephen J. Mills, PhD- Tran Vu Hoang, MD, MSc
5. East-West Center (EWC)- Tim Brown, PhD- Wiwat Peerapatanapokin, MD, PhD
6. UNAIDS Viet Nam- Vladanka Andreeva, DDS, MPH
7. World Health Organization (WHO)- Masaya Kato, MD- Zhao Pengfei, MD
8. US Centers for Disease Control and Prevention (CDC)- Linh-Vi Nguyen Le, MA
9. US Agency of International Development (USAID)- Nguyen Duc Duong, MSc
10. Members of the Monitoring and Evaluation Technical Working Group
DATA ANALYSIS AND RePORT PRePAReD BY
Tran Vu Hoang, MD, MScMasaya Kato, MDLinh-Vi Nguyen Le, MA
This report is published by Family Health International (FHI/Vietnam) with funding from the U.S. President’s Emergency Plan for AIDS Relief (PEPFAR) through the United States Agency for International Development (USAID), under USAID Cooperation Agreement No. 486-A-00-06-00009-00.
During the last 20 years since the first case of HIV detected in 1990, Viet Nam has endeavored to provide comprehensive interventions targeting the HIV epidemic and care and treatment services for people living with HIV and AIDS. As of December 2008, a reported 138,000 people nationwide are living with HIV, 29,500 of which are suffering from AIDS, and 41,000 lives have been lost from AIDS related illnesses. However, more concerning is evidence that suggests the HIV infection rate is higher than the number of cases presently reported and managed.
Despite notable past successes, HIV/AIDS prevention and control in Viet Nam continues to demand a multifaceted approach. While the overall national incidence rate shows signs of decline, new infections continue to be detected, concentrating in high risk populations such as injecting drug users, female sex workers and their clients, and men who have sex with men. The increasing number of HIV infected people needing antiretroviral therapy in all provinces across the country is becoming a great challenge for the health sector specifically and society in general.
To support HIV/AIDS program planning, the Ministry of Health has carried out HIV/AIDS estimates and projections since 2003 based on recommendations of the UN Reference Group on Estimates, Modeling and Projections. Results from the 2003 estimates and projections provided a foundation for the National Strategy on HIV/AIDS Prevention and Control in Viet Nam up to 2010, with a Vision to 2020.
In 2007 and 2008, the Viet Nam Administration of HIV/AIDS Control (VAAC) in the Ministry of Health collaborated with national and international partners to conduct a second round of Estimates and Projections in Viet Nam in 2007-2008, which optimized the use of existing data to obtain updated HIV epidemiologic data. This report was prepared with the intention of providing colleagues with information on the process and methodologies of estimates and projections, as well as the most updated data on HIV/AIDS in Viet Nam to 2012. It is my pleasure to present this report on behalf of the Ministry of Health, and it is my hope that the report will serve as a reference for HIV/AIDS programming in Viet Nam.
I would like to thank the experts, Ministry of Health officials, and members of the technical working group from the following organizations not only for their invaluable support of this project, but also for their contribution to HIV/AIDS prevention and control in Viet Nam: VAAC and other Ministry of Health departments, the National Institute of Hygiene and Epidemiology, UNAIDS, WHO, PEPFAR, FHI, and East-West Center, among other organizations not named here.
Ha Noi, April 18, 2009
Trinh Quan Huan, MD, PhD Vice Minister of Health
PREfaCE
VIET NAM HIV/AIDS ESTIMATES AND PROJECTIONS 2007 – 2012 45

COnTEnTS
EXECuTIVE SuMMARY 49Key Outcomes and Discussion 49National HIV infection estimates 49HIV estimates for most at risk populations 50ART needs and its impact on the epidemic 50Data Use and Limitations 51Future Estimates and Projections 52
CHAPTER I: INTRODUCTION 53
CHAPTER II: DEVELOPING HIV/AIDS EPIDEMIOLOGICAL MODELS 55
CHAPTER III: ASSUMPTIONS ON POPULATION SIZES, SEROPREVALENCE AND COVERAGE OF TREATMENT PROGRAMS 58Population size estimates 58Estimating HIV seroprevalence in each population 60Estimating the number of people living with HIV and ART and PMTCT needs 62
CHAPTER IV: CACULATING HIV INCIDENCE, PREVALENCE AND TRENDS FOR VIET NAM USING THE UNAIDS ESTIMATION AND PROJECTION PACKAGE (EPP) AND SPECTRUM 64
CHAPTER V: RESULTS 66
CHAPTER VI: CONCLUSIONS FROM THE 2007 HIV/AIDS ESTIMATES AND PROJECTIONS PROCESS 77
CHAPTER VII: RECOMMENDATIONS 79
CHAPTER VIII: RECOMMENDATIONS ON IMPROVING QUALITY AND SUPPLEMENTING DATA FOR EPIDEMIC REVIEW AND ASSESSMENT 80
APPENDIX 81Appendix I: Low estimates of population sizes used in HIV/AIDS Estimates and Projections
1990 - 2012 in Viet Nam 81Appendix II: High estimates of population sizes used in HIV/AIDS Estimates and Projections
1990 - 2012 in Viet Nam 82Appendix III: HIV prevalence among IDUs 1990 - 2012 by cluster of provinces 83Appendix IV: HIV prevalence among FSWs 1990 - 2012 by cluster of provinces 85Appendix V: HIV prevalence among clients of FSWs 1990 - 2012 by cluster of provinces 87Appendix VI: Summary data of HIV/AIDS estimates and projections 89
46 VIET NAM HIV/AIDS ESTIMATES AND PROJECTIONS 2007 – 2012

GRaPHS
graph 1: Number of people living with HIV in Viet Nam 1990 - 2012: Low, medium and high scenarios (includes adults and children) 66
graph 2: HIV incidence among adults (age 15 - 49, per 100,000 people) 1990 - 2007: Low, medium and high scenarios 67
graph 3: Number of annual deaths caused by AIDS among people 15 years and older in Viet Nam 1990 - 2012: Impact of ARV treatment program 67
graph 4: Number of people living with HIV in Viet Nam 1990 - 2012 with and without widespread ART programs 68
graph 5: Prevalence of HIV infection as percent of population living with HIV in Viet Nam 1990 - 2012: Low, medium and high scenarios (includes adults and children) 69
graph 6: Prevalence of HIV infection in adults (age 15 - 49) in Viet Nam 1990 - 2012: Disaggregated by sex 69
graph 7: Number of adults age 15 and older living with HIV in need of ARV treatment in Viet Nam 1990 - 2012: Low, medium and high scenarios 70
graph 8: Number of adults age 15 and older living with HIV by sex and male/female ratio in Viet Nam 1990 - 2012 70
graph 9: Number of pregnant women infected with HIV in Viet Nam 1990 - 2012: Low, medium and high scenarios 71
graph 10: Number of children (age 0 - 14) living with HIV in Viet Nam 1990 - 2012: Low, medium and high scenarios 71
graph 11: Number of new infections averted with prevention of mother to child transmission in Viet Nam by 2007 72
graph 12: HIV prevalence among IDUs in Viet Nam 1990 - 2012: National prevalence and prevalence in focus regions 73
graph 13: HIV prevalence among FSWs in Viet Nam 1990 - 2012: National prevalence and prevalence in focus regions 73
graph 14: HIV prevalence among clients of sex workers in Viet Nam 1990 - 2012: National prevalence and prevalence in focus regions 74
graph 15: HIV prevalence among MSM in Viet Nam 1990 - 2012: National prevalence and prevalence in focus regions 75
graph 16: HIV/AIDS estimates and projections in Viet Nam in 2003 and 2007 76
VIET NAM HIV/AIDS ESTIMATES AND PROJECTIONS 2007 – 2012 47

aCROnYMS
AIDS Acquired Immune Deficiency Syndrome AIM AIDS Impact Model ANC Antenatal Care ARV Antiretrovirus ART Antiretroviral Therapy CDC US Centers for Disease Control and Prevention DFID UK Department for International Development DOlISA Department of Labor, Invalids and Social Affairs EPP UNAIDS Estimation and Projection Package EWC East-West Center FHI Family Health International FSW Female Sex Worker HIV Human Immunodeficiency Virus IBBS HIV/STI Integrated Biological and Behavioral Surveillance IDu Injecting Drug User MOH Ministry of Health MOlISA Ministry of Labor, Invalids and Social Affairs MSM Men who have Sex with Men NIHE National Institute of Hygiene and Epidemiology PEPFAR US President’s Emergency Plan for AIDS Relief PlHIV People Living with HIV PMTCT Prevention of Mother to Child Transmission STI Sexually Transmitted Infection TWg Technical Working Group uNAIDS The Joint United Nations Programme on HIV/AIDS uSAID US Agency for International Development VAAC Viet Nam Administration of HIV/AIDS Control VCT Voluntary Counseling and Testing WHO World Health Organization
48 VIET NAM HIV/AIDS ESTIMATES AND PROJECTIONS 2007 – 2012

A second round of estimates and projections was conducted in 2007 to estimate future burden and impacts of HIV/AIDS in order to inform national programs anticipating prevention and care needs in Viet Nam. Similar to the 2003 estimates and projections process, seroprevalence data, population size estimates, and pertinent data from ad hoc studies were entered into the Estimation and Projection Package (EPP) Version 3.0 R9 to generate low, medium, and high scenarios of the HIV epidemic. The epidemic curves generated by EPP were then combined with antiretroviral therapy (ART) and prevention of mother to child (PMTCT) data into a second modeling program, SPECTRUM Version 3.14, for further estimates of prevalence, treatment needs, and AIDS related mortality, among other important data presented in this report. National and region-specific outcomes were generated for the 1990-2012 period in Viet Nam and apply to both the general and high risk populations nationwide.
KeY OUTCOMeS AND DISCUSSION
National HIV infection estimates
The medium scenario shows an estimated 220,000 people nationwide infected with HIV in 2007, which is 0.26% of Viet Nam’s adult and children population. With new infections and increased access to antiretroviral (ARV) treatment, which prolongs life for those infected, the number of people living with HIV is expected to increase to 254,000 (0.29%) in 2010 and 280,000 (0.31%) in 2012. However, incidence rates have declined over time, peaking in 2000 at 67 new infections per 100,000 people and dropping to 39 per 100,000 people by 2007. HIV continues to infect more men than women. The number of men living with HIV in 2007 was 3.0 times higher than women, although the ratio will decrease to 2.6 by 2012 as a result of increased transmission from infected men to their wives and regular sex partners. Children less than 15 years old make up a small number of PLHIV, with 3,750 infected in 2007. However, their number infected will proportionately increase substantially to 5,700 in 2012, necessitating immediate availability of early infant diagnosis in order to provide them needed timely care and treatment. PMTCT must be expanded to prevent more children from becoming infected as the number of pregnant women increases from 4,100 in 2007 to 4,800 in 2012. In 2007, less than 40% of infected pregnant women received ARV prophylaxis or treatment.
EXECUTIvE SUMMaRY
VIET NAM HIV/AIDS ESTIMATES AND PROJECTIONS 2007 – 2012 49
HIV estimates for most at risk populations
National HIV prevalence among injecting drug users (IDU) is projected to stabilize at 30% in the 2007 to 2012 period. HIV infection stabilizes also in the provinces and cities with older epidemics, including Can Tho, Ho Chi Minh City, and Quang Ninh, but at rates surpassing the national average, at 45%, 55% and 56%, respectively. Stabilizing rates do not mean prevention programs can be scaled back. On the contrary, they indicate ongoing transmission needing to be stopped by effective prevention measures. There is evidence also of rapidly rising prevalence in newer epidemics among IDUs in the northwestern provinces of Viet Nam where intensified intervention is critical before rates reach the same level as in urban centers and older epidemics.
Female sex workers (FSW) are the second highest infected risk population with national rates slightly increasing from 9% in 2007 to 9.3% in 2012. Similar to the IDU population, rates for urban centers, including Can Tho, Ho Chi Minh City, and Hai Phong, are higher than the national average by 2012. Research in these provinces has shown high levels of injecting drug use among FSWs and that HIV infection in this group is closely associated with drug injection practices. Prevention targeting FSWs must be comprehensive and include injecting drug use interventions, as well as care and treatment for those infected.
Leveling HIV infection rates are also seen for clients of sex workers and men who have sex with men (MSM). A stabilizing 2% prevalence among sex clients from 2007 implies a steady rate of new infections, with the exception of the northwest provinces and Can Tho, where prevalence will continue to increase over time and in An Giang and Ha Noi where the reverse is observed and rates are decreasing. Likewise, national prevalence for MSM will remain 2% in the 2007-2012 period, although more studies on this population are needed since data used for estimates and projections is limited to a few MSM studies in a couple of urban cities. Given many uncertainties around the MSM population size and social networks in Viet Nam, and with experiences from other countries, HIV spread in MSM may unexpectedly reach high prevalence in a very short period. High prevalence in Ho Chi Minh City (5.4%) and Ha Noi (3.8%) should be evidence enough for national programs to establish interventions to monitor and reach MSM with safe practices messages and care. The same can be said of sex clients, whose lower prevalence is overshadowed by the fact that the large number of men in this population poses substantial transmission risks of HIV and STIs to their partners.
ART needs and its impact on the epidemic
A projected 65,500 infected adults will need access to ARV treatment in 2010. If 75% of these adults receive ARV treatment by 2012, the number of AIDS related deaths would rapidly decline. For instance, without access to ARVs, the number of deaths would have
50 VIET NAM HIV/AIDS ESTIMATES AND PROJECTIONS 2007 – 2012

been 11,300 instead of 7,860 in 2007. It is important to note also that the life prolonging effect of ART causes prevalence rates to remain high, so more people will be in need of HIV care and treatment. Continued scale-up of care and treatment services is required to support the growing number of people in need of ART support.
DATA USe AND LIMITATIONS
Estimates and Projections is not a straightforward process and relies as much on technical program input as it does on existing data. The Viet Nam Technical Working Group (TWG) on HIV Estimates and Projections undertook careful and in-depth review and validation of surveillance data to generate epidemic curves, but incomplete and poor quality surveillance data, combined with limited program data, increase uncertainty of the trends. Nonetheless, more data points for each population (i.e., general male, general female, IDU, FSW, MSM, sex clients) and cluster (provinces grouped together based on epidemic likeness and geographic closeness) were available in the 2007 estimates and projections than in the 2003 process. As a result, in the 2007 process, appropriate adjustments could be made to sentinel surveillance data, and the generated national epidemic curve differed from the estimates from 2003. Specifically, from the 2007 process, national HIV prevalence in 2010 is 0.29%, whereas the 2003 process estimated 0.54%.
There is potential data disagreement between the HIV/AIDS Estimates and Projections report and official provincial prevalence reports for those provinces which are their own clusters in EPP, such as Hai Phong, Ha Noi, Ho Chi Minh City, Can Tho, An Giang, etc. Sentinel surveillance is the main source of prevalence data for both provincial reports and Estimates and Projections. Adjustments were made to sentinel surveillance data entered into EPP based on the TWG’s review of sentinel surveillance methodologies to minimize inaccuracy caused by known sampling errors. Adjustment factors varied, but an example is adjusting trends higher or lower based on reliability of community and center-based sentinel surveillance data, or based on the prevalence obtained through the Integrated Biological and Behavioral Surveillance, which had data utilized more scientifically rigorous methodologies to ensure that the study sample represents the study population and which controlled for study biases in the analysis.
The final set of results is a product of consensus among the researchers, technical programs, and administrators of HIV/AIDS programs in the Ministry of Health and its bilateral and multilateral partners. National estimates and projections are useful for monitoring the movement of HIV throughout Viet Nam’s diverse populations and geographic regions over time. Yet the estimates and projections cannot be used alone to show program impact without supplemental evidence from prevention, care, and treatment program data. Further analysis of Viet Nam’s epidemic using the Asian Epidemic Model and GOALS
VIET NAM HIV/AIDS ESTIMATES AND PROJECTIONS 2007 – 2012 51

Model would benefit the programs since these models are tailored to Asian epidemics and can provide additional program cost-benefit analysis in addition to epidemic curve generation. For any modeling activity, whether using EPP or AEM, there needs to be intensified, coordinated effort to improve surveillance and program data quality and obtain population size estimates for high risk groups, as these are key factors for reliable estimates in Viet Nam.
fUTURe eSTIMATeS AND PROjeCTIONS
A third round of Viet Nam estimates and projections will take place in 2009 and use updated versions of EPP and SPECTRUM. The timing coincides with the second round of Integrated Biological and Behavioral Surveillance, which will provide valuable input data to more accurately generate epidemic curves and assess program impact. Plans are also underway to collect population size estimates, which would significantly increase the certainty and confidence in the results.
52 VIET NAM HIV/AIDS ESTIMATES AND PROJECTIONS 2007 – 2012

Chapter IInTRODUCTIOn
Past HIV/AIDS estimates and projections in Viet Nam have provided invaluable data on the epidemic and future burden of HIV for program planning and evaluation. The 2003 HIV/AIDS estimates and projections process based on case reporting and sentinel surveillance data showed the number of people living with HIV climbing from 121,000 in 2000 to 215,000 in 2003 and 263,000 in 2005. Since that time, Viet Nam has rapidly scaled up HIV prevention, care and treatment programs. International bilateral and multilateral aid agencies have injected large amounts of technical and financial assistance with the goal of curtailing new HIV infections, largely concentrated in high risk groups. The continued investment in HIV prevention demands updated estimates and projections to better inform policy decisions and program planning and determine the level of impact that interventions have had on national HIV infection rates.
The 2007 estimates and projections process shares the same objectives as the 2003 round: to produce the best scientific and reliable current estimate for HIV infections and to project future trends that are realistic and consistent with available data. The process is both a critical data analysis activity using the most up-to-date HIV modeling software and a consensus building exercise with key stakeholders. With the quality and availability of data varying across programs and regions, assumptions must be made for geographic and population-specific prevalence data used to ascertain HIV infection levels and trends. Adjustments to prevalence measured in the surveillance system were determined through careful review of primary data and triangulation of multiple sources. HIV sentinel surveillance data were analyzed for consistency and representativeness and corroborated with ad-hoc studies and facility-based data. Since evidence-based population size estimates were still unavailable at the time of analysis, current governmental estimates of injecting drug user and commercial sex worker population sizes were used to project the low scenario of HIV and multiplied by factors calculated from projects’ mapping exercises of most-at-risk populations for the high scenario. For populations less closely studied in Viet Nam, including men who have sex with men (MSM) and male clients of sex workers, published data from neighboring countries, such as Thailand, with similar epidemics in the Southeast Asian region were used.
Applying the same assumptions and criteria across years helps ensure reliable rates and trends. Yet whether or not past adjustment factors are still applicable to today’s epidemic is a concern which data reviewers could not address alone. Reaching informed consensus between the observed data as analyzed by researchers, the government
VIET NAM HIV/AIDS ESTIMATES AND PROJECTIONS 2007 – 2012 53
of Viet Nam, and the international community for both input and output data was critical. The Viet Nam Technical Working Group on HIV Estimates and Projections was established to bring together as many of the key stakeholders as possible, including the Viet Nam Administration of HIV/AIDS Control (VAAC), the National Institute of Hygiene and Epidemiology (NIHE), and bilateral and multilateral partners, to review and analyze datasets. Feedback from a wider audience within the government of Viet Nam and among the international community were sought to ensure the estimates and projection results reflect the epidemic observed on the ground.
This report presents results from the 2007 round of estimates and projections for the 1990-2012 period in Viet Nam, along with the data sources and assumptions used to generate these estimates, which resulted from a thorough process of data review, analysis, and stakeholder buy-in. Data review and cleaning commenced in June 2007, computer generation of estimates were completed in March 2008, and stakeholder review and consensus required an additional year. The outcomes presented in the report apply to both the general and high risk populations nationwide. Data specific to each cluster of provinces and cities are included in the Appendices.
54 VIET NAM HIV/AIDS ESTIMATES AND PROJECTIONS 2007 – 2012
Chapter IIDEvELOPInG HIv/aIDS EPIDEMIOLOGICaL
MODELs
As was done in the 2003 estimates and projections process, two scenarios were prepared for the 2007 process, namely a low scenario and a high scenario. The decision to prepare two scenarios was made because of uncertainties around the population sizes of high risk groups in Viet Nam. The medium scenario was calculated by averaging the low and high scenarios.
In each scenario, the country was divided into 17 geographical regions, also known as clusters. (There were 11 clusters in the 2003 process.) The criteria for establishing clusters remained similar to the 2003 process. Provinces and cities that had similar epidemiological patterns and which were geographically contiguous were grouped into the same cluster. In the 2007 round, with more data available, closer attention was paid than in 2003 to ensuring that all provinces in a cluster had similar epidemic start times and epidemiological patterns in the various surveillance populations, requiring more clusters than were used in 2003.
Because data for men who have sex with men (MSM) is limited, one cluster with three sub-populations was used for the MSM epidemic nationwide. The three subpopulations include MSM in Ha Noi, MSM in Ho Chi Minh City and MSM in other provinces and cities, where the few prevalence measurements available indicate much lower prevalence than in the two largest cities.
In each scenario and for every cluster (except those clusters established for the MSM population), HIV infections were calculated for five key populations as follow:
Injecting drug users (IDUs). Although there is some evidence showing declining risky injecting behavior, 2006 sentinel surveillance data show HIV prevalence remaining high among IDUs in many provinces, e.g., 65% in Hai Phong and 55% in Quang Ninh. In most clusters, a single IDU epidemic was used. However, with new injecting drug users entering the population, several provinces showed evidence of two IDU sub-epidemics: one among older IDUs who have injected drugs over a long period of time, starting in the mid 1990s, and another more recent epidemic among a younger group who recently started injecting. In clusters where there was evidence of this in the data, two IDU epidemics were fit.
VIET NAM HIV/AIDS ESTIMATES AND PROJECTIONS 2007 – 2012 55
Female sex workers (FSWs). Multiple sex partners and other sexually transmitted diseases put these women at higher risk of HIV infection. HIV prevalence among FSWs are over 10% in many provinces and cities and continue to rise in other provinces. In Ho Chi Minh City, where injecting drug use by FSWs is strongly associated with their HIV status, HIV infections were calculated for two distinct FSW sub-groups: injecting and non-injecting FSWs.
Clients of female sex workers. Besides placing themselves at elevated risk for HIV, men who visit sex workers accelerate the spread of HIV to other populations. In Viet Nam, IDUs and clients of FSWs spread HIV/STI to their regular sex partners, such as their wives or girlfriends not engaging in sex work or injecting drug use.
General population of males who are not currently IDUs or clients of FSWs. Often men do not remain injecting drug users or clients of sex workers permanently. However, if they contract HIV before stopping injecting or visiting sex workers, then they contribute to HIV in the current general male population. This component of the projections therefore includes former IDUs or former clients of FSWs, some of who are HIV positive and add to the HIV prevalence in the general male population.
General population of females. This includes women not currently engaged in injecting or sexual risk behaviors. This population also includes former FSWs and partners of high risk males, a number of who already are infected and contribute to the HIV prevalence among pregnant women.
56 VIET NAM HIV/AIDS ESTIMATES AND PROJECTIONS 2007 – 2012

Regional and provincial/city clusters used for HIV/AIDS estimates and projections in Viet Nam
Northwest
North Plateau
Northeast
Central Coast
Red River Delta
North Central
High Plateau
Southeast
Mekong River Delta
Thai Nguyen
Hanoi
Quang Ninh
Hai Phong
Khanh Hoa
Ho Chi Minh City
An Giang
Can Tho
Bac Kan
Tuyen Quang
Phu Tho
Yen BaiLao Cai
Lai Chau
Son La
Ha Tinh
Quang Binh Quang Tri
Thua Thien Hue
Kon Tum
Gia Lai
Dak Lak
Thanh Hoa
Vinh Phuc
Ha Giang
Thai Nguyen
Cao Bang
Lang Son
Bac GiangQuang Ninh
Hai DuongThai Binh
Nam Dinh
Ha Nam
Ninh Binh
Da Nang
Quang Nam
Quang Ngai
Lam Dong Binh Phuoc
Tay NinhLong An
Dong Thap
An Giang
Kien Giang
Ca Mau Bac Lieu
Can Tho Soc Trang
Binh Dinh
Phu Yen
Khanh Hoa
Ninh Thuan
Binh Thuan
Dong NaiBa Ria Vung Tau
Binh Duong
Tien GiangBen Tre
Tra VinhVinh Long
Ho Chi Minh City
Hung Yen
Hai Phong
Hoa Binh
Ha Noi
Bac Ninh
Nghe An
VIET NAM HIV/AIDS ESTIMATES AND PROJECTIONS 2007 – 2012 57

Chapter IIIaSSUMPTIOnS On POPULaTIOn SIZES, SEROPREvaLEnCE anD COvERaGE Of TREaTMEnT PROGRaMS
Population size estimates
For the low scenario, the following assumptions were made about the size of each of the key populations:
Injecting drug users (IDUs). MOLISA reported numbers of drug users in 2006 were applied to the low scenario. An estimated 85% of the MOLISA reported drug users practice injecting drug use.
In some clusters (Ho Chi Minh City, Khanh Hoa and the Central Coast), epidemiological data showed two epidemics among injectors - an older epidemic in the mid 1990s and a newer epidemic starting in the late 1990s. This explains the fall and subsequent rise in surveillance data for IDUs in those clusters. Integrated Biological and Behavioral Surveillance (IBBS) data were used to determine the proportion of older injectors (who had injected for 5 years or longer). This percentage was multiplied with the total number of IDUs to obtain the number of injectors from the older epidemic.
Female sex workers (FSWs). MOLISA estimates in 2006 were used as the low value. Clients of female sex workers. There are no studies with reliable data on the
prevalence of general male population in Viet Nam. Similar to the 2003 estimates and projections round, 5% of male aged 15-49 are assumed to be current clients of female sex workers for the low scenario.
Men who have sex with men (MSM). There is also no direct estimate on the size of the MSM population in Viet Nam. Studies in Asia suggest that 1% to 3% of the male population 15 or older has practiced same-sex behavior in the last year. Because Ha Noi and Ho Chi Minh City are the principal economic, social, and cultural centers in Viet Nam, the number of MSM in these provinces are thought to be much higher than in other provinces. For the low scenario, it was assumed that 1% of male 15 years or older in Ha Noi and Ho Chi Minh City are MSM. In other provinces, this figure is 0.5%.
General male population (including former IDUs and clients of FSWs). The size of this general male population was calculated by subtracting the low estimate of the number of current IDUs, the low estimate of clients of sex workers and the low
58 VIET NAM HIV/AIDS ESTIMATES AND PROJECTIONS 2007 – 2012
estimate of MSM from the total male population 15 years or older. For Ho Chi Minh City, Khanh Hoa and the Central Coast clusters, IDUs from the mid 1990s epidemic who were still alive were also subtracted from the general male population.
General female population. The number of general women was calculated by subtracting the low estimate of the number of current sex workers from the total number of women 15 years or older.
For the high scenario, the following assumptions were made about the size of each of the key populations:
Injecting drug users (IDUs). The high estimate was obtained by applying a multiplier to MOLISA estimates for individual provinces and cities. The multiplier, which varies by province, was determined by examining data from activities which mapped IDUs in projects supported by the World Bank and DFID (mapping data in 2007 were available for 32 provinces and cities). The numbers of IDUs from these sources were compared with those from MOLISA to define the multiplier. Because World Bank and DFID intervention services target mainly “hot-spots”, where IDUs are concentrated, the services are estimated to reach 60% to 70% of the IDU population in the provinces. Given the uncertainty of coverage data and to provide a slightly higher estimate, an assumption was applied across all clusters that World Bank and DFID supported projects sites reach 50% of all IDUs. For example, DFID outreach workers reported having contacted approximately 1,753 IDUs in Lang Son, which when assuming 50% coverage, yields an estimate of 3,506 IDUs (1753 x 2) for the whole province. The mapping-based estimate is 3.6 (3,506 ÷ 977) times higher than the MOLISA reported 977 IDUs in Lang Son, so 3.6 is the multiplier for the medium scenario and 6.2 for the high scenario in this province.
Female sex workers (FSWs). MOLISA estimates were tripled for the high estimates of FSWs.
Clients of sex workers. The high estimate was set at 10% of adult males in the 15-49 age group.
Men who have sex with men (MSM). The high size estimates for MSM were established at 3% in Ha Noi and Ho Chi Minh City and 1.5% in other provinces.
General male population (including former IDUs and clients of FSWs). As in the low scenario, this was calculated by subtracting the high estimate of the number of current clients, the high estimate of the number of current IDUs and high estimate of MSM size from the total male population 15 years or older .
General female population. The number of general women was calculated by subtracting the high estimate of the number of current sex workers from the total female population15 years or older.
VIET NAM HIV/AIDS ESTIMATES AND PROJECTIONS 2007 – 2012 59

estimating HIV seroprevalence in each population
HIV sentinel surveillance data is the primary data source for trends used in the 2007 estimates and projections process. Sentinel surveillance data collected up to 2007 in 40 provinces were reviewed and examined carefully through field visits and discussions with surveillance staff. Gaps, outliers and epidemiological improbable trends in sentinel surveillance data were identified during this process and used as exclusion criteria during data review and cleaning. Based on information provided by local surveillance staff, the following criteria were applied during data cleaning:
- All data points with a sample size smaller than 30 were excluded. - Samples which excluded previously known HIV positive participants were
rejected. Sentinel surveillance data extracted from VCT records were excluded. In certain provinces and cities, using VCT data may underestimate the prevalence among risk groups since people who already know their positive status do not visit VCT sites. On the other hand, prevalence may be overestimated in other provinces or cities where ARV program has been scaled up and VCT clinics serve as screening points or where those with risk behavior are being actively encouraged to seek screening as part of prevention efforts.
- Samples were removed if it was unclear who was included in the surveillance group or if methods applied did not capture correct members of risk populations. For example, hotel/restaurant-based FSW samples were excluded because it was clear in many provinces that low risk women who did not sell sex were being captured at high numbers in the surveillance samples.
- Samples collected in prisons were eliminated because of the possibility of their inclusion of individuals from other provinces and the inability to verify the samples’ sources.
- Also considered to have affected the validity of HIV trend data is the inconsistency in sampling methods over time. If the change in sampling method show significant influence on the surveillance data for any year, that data point was excluded. Decisions on these exclusions were made through discussions with provincial surveillance staff and the technical working group.
Other data sources such as HIV case reporting, VCT data and other cross-sectional studies were used to validate sentinel surveillance data.
According to the national sentinel surveillance protocol, half of the IDU and FSW samples should be collected in rehabilitation centers (also known as 05, 06 centers) and half from the community. These sampling designs may be biased in reflecting overall HIV prevalence in these groups because the proportion of FSWs or IDUs who have resided or are residing in rehabilitation centers is not necessarily 50%. IBBS data derived
60 VIET NAM HIV/AIDS ESTIMATES AND PROJECTIONS 2007 – 2012
from community-based samples and estimated population sizes were used to make adjustments to the proportions in community and rehabilitation centers. Specifically, IBBS results for the proportion of FSWs and IDUs reported to have ever been in the rehabilitation centers and the HIV prevalence rates among these groups were used to determine the weights for adjustments.
The following are estimates of the prevalence rates among each population used in the 2007 HIV/AIDS estimates and projections process:
Injecting drug users (IDUs). Prevalence trends were calculated from the combined rehabilitation center and community sentinel surveillance. The prevalence was then adjusted downward by 6% in Ha Noi, 5% in Hai Phong, 15% in Quang Ninh, 17% in An Giang, 7% in Can Tho and 11% in other provinces based on the relative proportions in rehabilitation camps and community in the IBBS sample. In Ho Chi Minh City, carefully reviewed and adjusted trends among IDUs from the Analysis and Advocacy project (A2) were applied with no further adjustment.
Female sex workers (FSWs). Because prevalence rates among the sex worker population as a whole (both community and rehabilitation center) were not sufficiently reliable, trend data from rehabilitation centers alone were used with a downward adjustment of HIV prevalence by 16%. The adjustment factor was calculated as follow: the IBBS prevalence for all provinces (omitting An Giang because of its unique epidemic among FSW) at 13.72% for street-based sex workers (SSW) and 4.44% for karaoke-based sex workers (KSW) were multiplied with the proportion of SSW and KSW (55.6% and 44.4% respectively) in the IBBS sample, producing a weighted average prevalence of 9.60%. The adjustment factor was then obtained by dividing this average prevalence rate by the expected center-based prevalence.
Clients of sex workers. Prevalence rates among male STI patients were used as prevalence among clients of sex workers, and these were adjusted downward by 20% (multiplied by 0.8). This was based upon reviews of models in Ho Chi Minh City and Thailand comparing the prevalence rates in STI patients with estimated prevalence in clients.
Men who have sex with men (MSM). Because sentinel surveillance data are not available for this group, four ad hoc study data points were put together to generate the HIV trend for this group in Ho Chi Minh City with downward adjustment of 30%. IBBS data showed that prevalence among MSM was approximately 70% of the unadjusted prevalence. The IBBS used a more reliable and representative sampling method, called respondent driven sampling, than the ad hoc studies, which used convenient sampling methods more likely to capture visible and groups at higher risk of HIV infection without any adjustment. These MSM prevalence points were further adjusted for prevalence rates among MSM in Ha Noi and in other provinces.
VIET NAM HIV/AIDS ESTIMATES AND PROJECTIONS 2007 – 2012 61

The adjustment factors were calculated using the ratio between the general male population HIV prevalence in Ho Chi Minh City to the general male population prevalence in other provinces. In Ha Noi, the adjustment factor was calculated using the ratio between MSM prevalence in Ho Chi Minh City and Ha Noi in IBBS.
General female population. Sentinel surveillance data for urban pregnant women were used since most sentinel sites were urban. The technical working group reviewed and screened data collection forms in many provinces and cities to identify data actually collected from rural areas. A review of PMTCT data across two years in Ho Chi Minh City, where district-level data were available, showed that HIV prevalence for rural pregnant women is approximately one-half of the urban prevalence. Based on this observed ratio, but also through examining effects of different urban/rural prevalence ratio on the outputs (e.g. the female / male ratio and the number of HIV infected children needing treatment), the prevalence ratio of the urban to rural pregnant women was adjusted to 0.70. Subsequently, based on age structures of HIV among women at ANC and in the general population, a downward adjustment of 0.62 was applied to the prevalence for the general female population which combined both urban and rural data. Finally, these values were used to calculate overall prevalence in general female weighted for sizes of urban and rural females.
For the general male population, ideally one would like to apply the military recruit prevalence to males in the 15 years of age or older age range. However, this would introduce double counting since some of these military recruits may be current clients of sex workers or injecting drug users who are already counted in the populations outlined above. Therefore, prevalence was not directly estimated for this group. Instead, turnover rates, or the average duration of time an individual engages in high risk activities, were determined for IDUs and clients of FSWs, who upon leaving these risk groups contribute to the prevalence rate in the general male population. The UNAIDS Estimation and Projection Package turnover feature was then used to calculate the number of HIV positive ex-IDUs and ex-clients in the general male population.
estimating the number of people living with HIV and ART and PMTCT needs
In Viet Nam since 2005, there has been rapid scale-up of care and ARV treatment programs for HIV infected people. Starting from 2,670 cases receiving treatment in 2005, as many as 16,212 infected persons received treatment at the end of 2007 (according to data from VAAC). In the 2007 HIV/AIDS estimates and projections process, it was assumed that by 2012, about 75% of adults (age 15 and older) in need of treatment would have access to ARV treatment and that around 55% of adults in need of 2nd line ARV treatment regimen would be given 2nd line ARV treatment.
62 VIET NAM HIV/AIDS ESTIMATES AND PROJECTIONS 2007 – 2012

It was also assumed that 2,300 children will receive ART by 2010 and 3,000 children by 2012. For input data on the number of ARV drugs used to prevent mother to child transmission between 2002 to 2007, values were estimated through triangulating historical data and anecdotal information from VAAC and the MOH led multi-agency PMTCT subcommittee and from annual reports generated by the US President’s Emergency Plan for AIDS Relief (PEPFAR) and Supply Chain Management System project, which procures and delivers ARVs to PEPFAR funded clinics. It was also assumed that 63% and 75% of HIV positive pregnant women will receive ARVs to prevent mother to child transmission in 2010 and 2012 respectively and that the use of two drug combination (ZDV + single dose NVP) and three drug combination (HAART for those who are eligible) will gradually replace the use of single dose nevirapine.
VIET NAM HIV/AIDS ESTIMATES AND PROJECTIONS 2007 – 2012 63
Chapter IvCaCULaTInG HIv InCIDEnCE, PREvaLEnCE anD TREnDS fOR vIET naM USInG THE UnaIDS ESTIMaTIOn anD PROJECTIOn PaCKaGE (EPP) anD SPECTRUM
Once prevalence trends were finalized, they were entered into the UNAIDS Estimation and Projection Package 2007 edition (EPP, Version 3.0 R9), and two sets of projections were prepared: the low scenario and the high scenario. The prevalence trends for each population groups in each of the 17 clusters were entered into EPP as separate projections. EPP then combined these individual projections in order to calculate the national adult population HIV prevalence curve for Viet Nam.
The adult population HIV prevalence in Viet Nam exported from EPP, together with other data (e.g. adult and pediatric ARV treatment, PMTCT), were then entered into SPECTRUM (Version 3.14), developed by USAID/Health Policy Initiative, to calculate the historical and future HIV incidence, numbers of people living with HIV, AIDS deaths, numbers orphaned by AIDS, and needs for ARV treatment and PMTCT. SPECTRUM, a computer program with the AIDS Impact Model (AIM) built in, projects both epidemiological and social impacts of HIV/AIDS from input data on HIV prevalence and treatment coverage1. Assumptions about other HIV/AIDS characteristics can also be entered for variables such as the survival period from HIV infection to AIDS death, age and sex distribution of infections, and the rate of perinatal transmission.
For Viet Nam, adult prevalence estimates obtained from EPP were key input data for estimating HIV incidence and projecting future impact. Since incidence rates fluctuate over time with changing levels of program coverage, HIV incidence could be best estimated up to 2007. Input data from EPP included also the estimated number of AIDS patients on ART projected to increase in the next 5 years, as described earlier. Population statistics from the General Statistics Office of Viet Nam were used to adjust population sizes set in SPECTRUM. Default values were used where data is unavailable for Viet Nam. Figure 1 shows a visual of data inputs and outputs generated by AIM.
1 USAID/Health Policy. AIM: A computer program for making HIV/AIDS projections and examining the demographic and social impacts of AIDS
64 VIET NAM HIV/AIDS ESTIMATES AND PROJECTIONS 2007 – 2012

Cove
rage
of
seco
nd
line A
RT
Treat
men
t co
sts/2
nd
line A
RV
Failu
re of
fis
t lin
e AR
V
figu
re 1
: AIM
dia
gram
Impa
ct of
HIV
on fe
rtilit
y
Avail
abilit
y of P
CRPr
ogre
ssio
n fro
m ne
ed fo
r tre
atm
ent t
o AID
S dea
th
with
out t
reat
men
t
Cove
rage
of co
trim
oxaz
olefor
child
ren
PMTC
T trea
tmen
t cov
erage
PMTC
T tre
atm
ent e
ffica
cy
Infan
t fee
ding d
istrib
ution
Brea
stfee
ding
tran
smiss
ion
......
......
..
......
......
..
......
......
.. Birth
s
0-4
New
HIV
New
HIV
in
fect
ions
5-9
10-1
4
15-1
9
45-4
9
50-5
4
80+
Tota
l ferti
lity r
ate
Age d
istrib
utio
n of f
ertil
ity
Non-
AIDS
life e
xpec
tanc
y
Adult
prev
alenc
e or
incide
nce
Mode
l life
table
Age a
nd se
x dist
ribut
ion
on in
fectio
n
Effec
t of H
IV
on TB
Prog
ress
ion fr
om ne
w in
fecti
on to
need
for
treat
men
tCo
vera
geof
fist li
ne AR
T
Treat
men
t cos
ts/1s
t lin
e ARV
, OI, n
utrit
ion
supp
lemen
ts
Mor
talit
y on
seco
nd lin
e ART
- % 15
-19 w
omen
ne
ver m
arrie
d- %
mar
ried w
omen
in
mon
ogam
ous
union
s
Tota
l Tre
atm
ent
Costs
Non-AIDS orphans
Non-AIDS deaths
Asymptomatic HIV
AIDS Deaths
In need of treatment
AIDSorphans
Receiving fist line ART
Receiving second line ART
VIET NAM HIV/AIDS ESTIMATES AND PROJECTIONS 2007 – 2012 65
Chapter vRESULTS
High scenario Low scenario Medium scenario400,000
350,000
300,000
250,000
200,000
150,000
100,000
50,000
0
Num
ber o
f HIV
Infe
ctio
ns
1990 1992 1994 1996 1998 2000 2002 2004 2006 2008 2010 2012
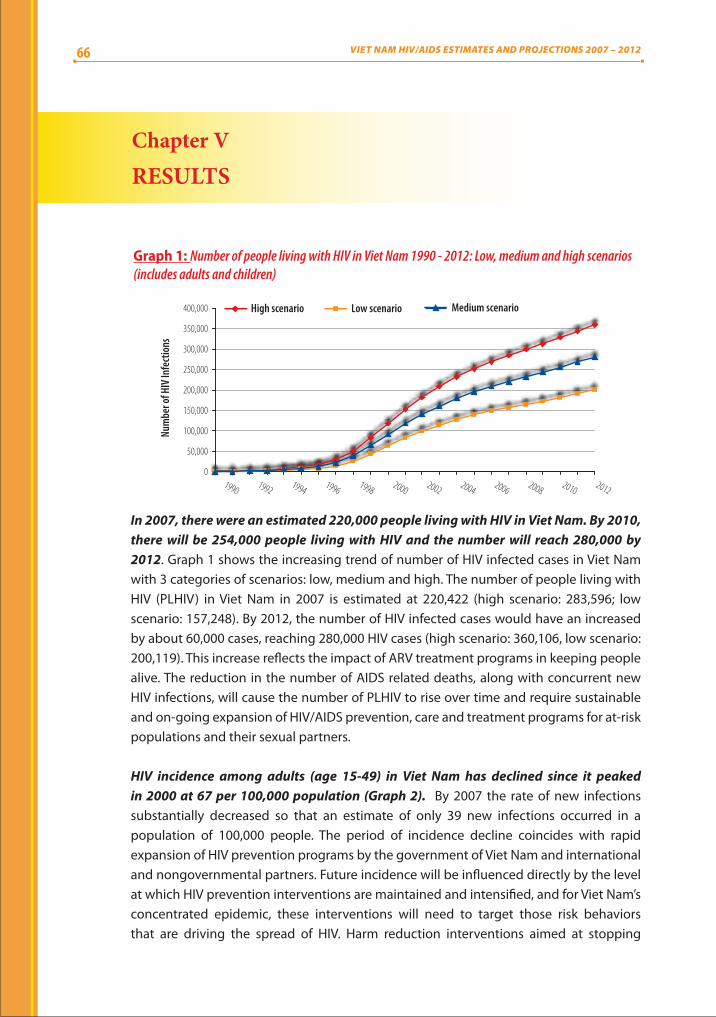
Graph 1: Number of people living with HIV in Viet Nam 1990 - 2012: Low, medium and high scenarios (includes adults and children)
In 2007, there were an estimated 220,000 people living with HIV in Viet Nam. By 2010, there will be 254,000 people living with HIV and the number will reach 280,000 by 2012. Graph 1 shows the increasing trend of number of HIV infected cases in Viet Nam with 3 categories of scenarios: low, medium and high. The number of people living with HIV (PLHIV) in Viet Nam in 2007 is estimated at 220,422 (high scenario: 283,596; low scenario: 157,248). By 2012, the number of HIV infected cases would have an increased by about 60,000 cases, reaching 280,000 HIV cases (high scenario: 360,106, low scenario: 200,119). This increase reflects the impact of ARV treatment programs in keeping people alive. The reduction in the number of AIDS related deaths, along with concurrent new HIV infections, will cause the number of PLHIV to rise over time and require sustainable and on-going expansion of HIV/AIDS prevention, care and treatment programs for at-risk populations and their sexual partners.
HIV incidence among adults (age 15-49) in Viet Nam has declined since it peaked in 2000 at 67 per 100,000 population (Graph 2). By 2007 the rate of new infections substantially decreased so that an estimate of only 39 new infections occurred in a population of 100,000 people. The period of incidence decline coincides with rapid expansion of HIV prevention programs by the government of Viet Nam and international and nongovernmental partners. Future incidence will be influenced directly by the level at which HIV prevention interventions are maintained and intensified, and for Viet Nam’s concentrated epidemic, these interventions will need to target those risk behaviors that are driving the spread of HIV. Harm reduction interventions aimed at stopping
66 VIET NAM HIV/AIDS ESTIMATES AND PROJECTIONS 2007 – 2012
HIV I
ncid
ence
(%)
100.0
90.0
80.0
70.0
60.0
50.0
40.0
30.0
20.0
10.0
0.01990 1991 1992 1993 1994 1995 1996 1997 1998 1999 2000 2001 2002 2003 2004 2005 2006 2007
High
Low
Average
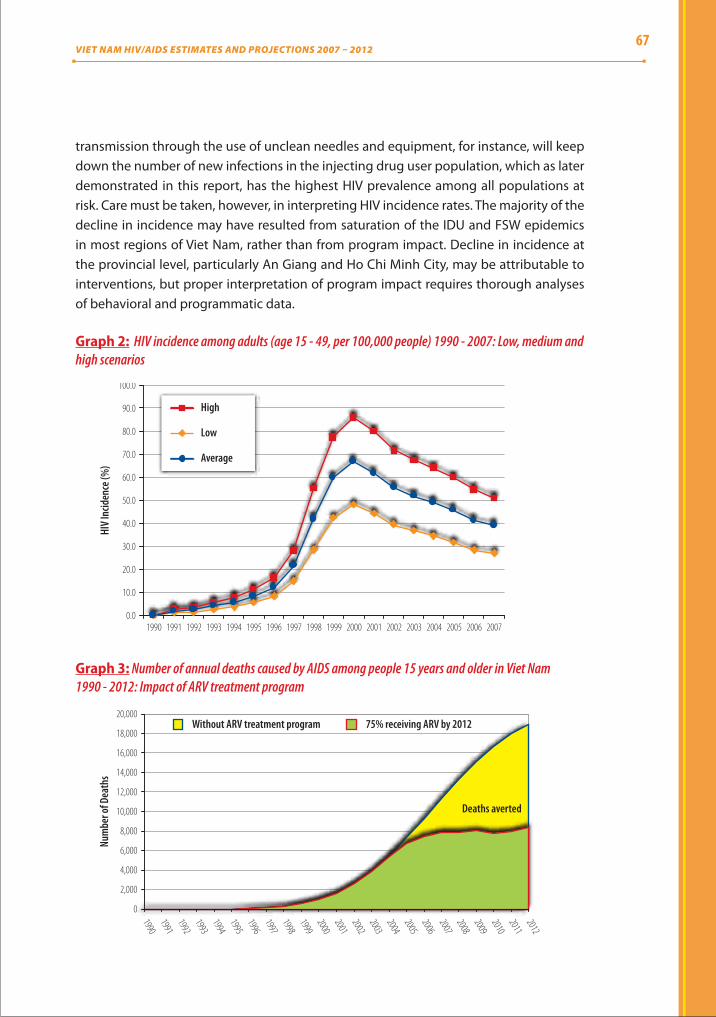
Graph 2: HIV incidence among adults (age 15 - 49, per 100,000 people) 1990 - 2007: Low, medium and high scenarios
transmission through the use of unclean needles and equipment, for instance, will keep down the number of new infections in the injecting drug user population, which as later demonstrated in this report, has the highest HIV prevalence among all populations at risk. Care must be taken, however, in interpreting HIV incidence rates. The majority of the decline in incidence may have resulted from saturation of the IDU and FSW epidemics in most regions of Viet Nam, rather than from program impact. Decline in incidence at the provincial level, particularly An Giang and Ho Chi Minh City, may be attributable to interventions, but proper interpretation of program impact requires thorough analyses of behavioral and programmatic data.
19901991199219931994199519961997199819992000200120022003200420052006200720082009201020112012
20,000
18,000
16,000
14,000
12,000
10,000
8,000
6,000
4,000
2,000
0
Without ARV treatment program 75% receiving ARV by 2012
Deaths averted
Num
ber o
f Dea
ths
Graph 3: Number of annual deaths caused by AIDS among people 15 years and older in Viet Nam 1990 - 2012: Impact of ARV treatment program
VIET NAM HIV/AIDS ESTIMATES AND PROJECTIONS 2007 – 2012 67
The number of deaths caused by AIDS will rapidly decline during 2007-2012 with continued scale-up of HIV/AIDS treatment. Assuming that 75% of adults who are in need of treatment will be given ARV drugs in Viet Nam in 2012, the rapid scale-up of ART programs will result in a projected large number of AIDS related deaths averted, as shown by the shaded area in Graph 5. In 2007 there were about 7,860 deaths caused by AIDS. If there had been no ARV treatment program available in Viet Nam, this number would have been around 11,300 people (Graph 3). However, the number of deaths will depend greatly on the actual coverage and quality of HIV/AIDS treatment services.
300,000
250,000
200,000
150,000
100,000
50,000
01990
19921994
19961998
20002002
20042006
20082010
2012
With ARVWithout ARV
Num
ber o
f HIV
Infe
ctio
ns
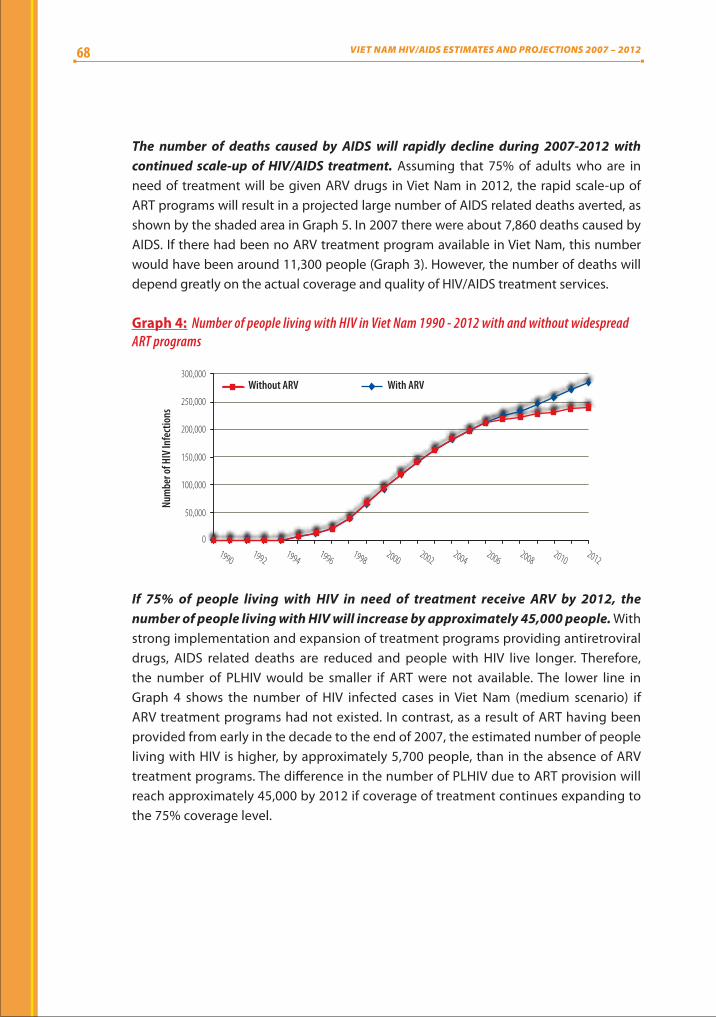
Graph 4: Number of people living with HIV in Viet Nam 1990 - 2012 with and without widespread ART programs
If 75% of people living with HIV in need of treatment receive ARV by 2012, the number of people living with HIV will increase by approximately 45,000 people. With strong implementation and expansion of treatment programs providing antiretroviral drugs, AIDS related deaths are reduced and people with HIV live longer. Therefore, the number of PLHIV would be smaller if ART were not available. The lower line in Graph 4 shows the number of HIV infected cases in Viet Nam (medium scenario) if ARV treatment programs had not existed. In contrast, as a result of ART having been provided from early in the decade to the end of 2007, the estimated number of people living with HIV is higher, by approximately 5,700 people, than in the absence of ARV treatment programs. The difference in the number of PLHIV due to ART provision will reach approximately 45,000 by 2012 if coverage of treatment continues expanding to the 75% coverage level.
68 VIET NAM HIV/AIDS ESTIMATES AND PROJECTIONS 2007 – 2012

The estimated HIV seroprevalence among the Vietnamese population in 2007 was 0.26%. The projected HIV seroprevalence in Viet Nam will be 0.29% in 2010 and 0.31% in 2012. Similar to the number of HIV infected cases, HIV prevalence in the community will continue to increase in the coming years. The estimated prevalence among the Vietnamese population (all ages) meets the target prevalence of below 0.30% among the general population by 2010, an objective established in the National Strategy for HIV/AIDS Prevention and Control in Viet Nam up to 2010. However, attention should be paid to the fact that the 0.29% prevalence rate could only be reached with sustained and strengthened implementation of intervention programs. Graph 5 shows that the number of HIV infected people (and the overall seroprevalence) will continue to grow, highlighting the need to continue providing and expanding comprehensive intervention programs to contain the epidemic.
The estimated prevalence in adults (age 15-49), as opposed to both adult and children, will be 0.44% in 2010 and 0.47% in 2012 in the medium scenario for both men and women (Graph 6). The prevalence in male adults will reach 0.66% in 2012, which will be 2.5 fold higher than that of female adults (0.27%).
0.450.4
0.35
0.3
0.25
0.2
0.15
0.10
0.05
01990 1992 1994 1996 1998 2000 2002 2004 2006 2008 2010 2012
Prev
alen
ce of
HIV
(%)
High scenario Low scenario Medium scenario
Graph 5: Prevalence of HIV infection as percent of population living with HIV in Viet Nam 1990 - 2012: Low, medium and high scenarios (includes adults and children)
19901991
19921993
19941995
19961997
19981999
20002001
20022003
20042005
20062007
20082009
20102011
2012
0.7
0.6
0.5
0.4
0.3
0.2
0.1
0
Prev
alen
ce of
HIV
(%)
Male Female Both male and female
Graph 6: Prevalence of HIV infection in adults (age 15 - 49) in Viet Nam 1990 - 2012: Disaggregated by sex
VIET NAM HIV/AIDS ESTIMATES AND PROJECTIONS 2007 – 2012 69

There will be 65,500 HIV infected adults (15 years and older) needing ARV treatment by 2010. Graph 7 shows the number of PLHIV (15 years and older) in need of treatment and care in Viet Nam in low, medium, and high scenarios. Approximately 65,000 HIV infected people will be in need of treatment by 2010 and 82,000 people by 2012. This will require a growing workforce and more resources to meet the high demands for drugs, supplies and equipment to treat HIV and related infections in Viet Nam over long durations. With the rapid increase in the number of people in need of treatment and assuming treatment coverage for 75% of people needing ART, there is unquestionable need to expand HIV screening, detection and management. VCT clinics are currently available in focus provinces and cities. Yet in order to reach the target of providing treatment for 75% of people in need, VCT services must be established in more provinces and cities as treatment facilities are expanded.
High scenario Low scenario Medium scenario
1990 1992 1994 1996 1998 2000 2002 2004 2006 2008 2010 2012
140,000
120,000
100,000
80,000
60,000
40,000
20,000
0
Num
ber n
eedi
ng A
RV
Graph 7: Number of adults age 15 and older living with HIV in need of ARV treatment in Viet Nam 1990 - 2012: Low, medium and high scenarios
200,000 18
16
14
12
10
8
6
4
2
0
150,000
100,000
50,000
0
Num
ber o
f HIV
Infe
ctio
ns
Female Male/Female ratioMale
19901991
19921993
19941995
19961997
19981999
20002001
20022003
20042005
20062007
20082009
20102011
2012
Graph 8: Number of adults age 15 and older living with HIV by sex and male/female ratioin Viet Nam 1990 - 2012
70 VIET NAM HIV/AIDS ESTIMATES AND PROJECTIONS 2007 – 2012

The ratio between HIV infected male adults and HIV infected female adults will gradually decrease in the coming period. In 2007, the number of male adults (age 15 and older) living with HIV was 3.0 times higher than the number of female adults. However, the male/female ratio will gradually decrease to 2.6 by 2012 with approximately 198,000 HIV infected male adults and 76,700 HIV infected female adults (Graph 8). One of the reasons for the increase in women living with HIV is transmission from HIV infected males to their regular sex partner. This is also demonstrated in Graph 9, which shows the estimated number of HIV positive pregnant women in Viet Nam between 1990 and 2012. At the same time, it should also be noted that men continue to account for a major proportion of the number of PLHIV and new HIV infections.
19901991
19921993
19941995
19961997
19981999
20002001
20022003
20042005
20062007
20082009
20102011
2012
6,000
5,000
4,000
3,000
2,000
1,000
0
Num
ber o
f HIV
Infe
ctio
ns
High scenario Low scenario Medium scenario
Graph 9: Number of pregnant women infected with HIV in Viet Nam 1990 - 2012: Low, medium and high scenarios
High scenario Low scenario Medium scenario7,000
6,000
5,000
4,000
3,000
2,000
1,000
0
Num
ber o
f HIV
Infe
ctio
ns
19901991
19921993
19941995
19961997
19981999
20002001
20022003
20042005
20062007
20082009
20102011
2012
Graph 10: Number of children (age 0 - 14) living with HIV in Viet Nam 1990 - 2012: Low, medium and high scenarios
The number of HIV positive pregnant women in Viet Nam will continue to increase to about 4,800 women by 2012. Of these, the number of women needing prevention of mother to child HIV transmission (PMTCT) services is approximately 4,100. This situation highlights the need for expanded prophylactic interventions to prevent mother to child infection, with VCT and sex partner counseling services playing an important role in identifying women in need of PMTCT services.
VIET NAM HIV/AIDS ESTIMATES AND PROJECTIONS 2007 – 2012 71

By 2010, a projected 5,100 children will be living with HIV/AIDS. This figure will increase to 5,700 by 2012 (Graph 10). Compared with the 3,750 children living with HIV in 2007, these estimates suggest a significant increase in the number of children who will need care and treatment services in the next five years. WHO issued new recommendations in 2008 to provide ARV treatment to all children with confirmed HIV infection whose age is 12 months or less regardless of their immunological or clinical condition. While implementation of the new recommendations will require investments to make early infant diagnosis available, it is estimated that a significant proportion of children living with HIV will require ARV treatment.
Similar to ARV treatment programs, PMTCT programs have prevented a cumulative 500 infections at the end of 2007, as shown in graph 11.
2001 2002 2003 2004 2005 2006 2007
600
500
400
300
200
100
0
Cumulative
Non - cumulative
Estimated infections averted with PMTCT
Infe
ctio
ns av
erte
d
Graph 11: Number of new infections averted with prevention of mother to child transmission in Viet Nam by 2007
During 2007 - 2012, HIV prevalence among IDUs stabilizes yet remains at a high 30% rate. Graph 12 shows HIV trends among IDUs nationally and in several focus cities and provinces. Seroprevalence at the national level is approximately 30% and appears to stabilize through to 2012. However, in certain provinces and cities, HIV prevalence among IDUs remains at very high levels (Quang Ninh 56%, Ho Chi Minh City 55%, Can Tho 45% by the year 2012). In addition, the epidemic among IDUs in the Northwestern region (including Son La, Lai Chau, Dien Bien and Thanh Hoa) is rapidly rising even though its onset came later than in other regions. Unless comprehensive intervention measures are soon scaled up, the epidemic in the Northwestern region may mirror those in large urban cities and rapidly rise. In addition, ad hoc studies suggest alarming high HIV rates among IDUs in Son La, but which were not included in the development of the epidemiological model for IDUs in this region because HIV sentinel surveillance is not conducted, and data therefore not available, in Son La.
72 VIET NAM HIV/AIDS ESTIMATES AND PROJECTIONS 2007 – 2012

Approximately 9% of FSWs across the country were living with HIV in 2007, and there will be a slight increase to 9.3% by 2012. Graph 12 shows the general prevalence among FSWs in Viet Nam and in several focus provinces and cities. Despite the relatively stable national prevalence rate, the province-specific trends for FSWs are either remaining at high levels (in Hai Phong, Ho Chi Minh City and Can Tho) or increasing in the coming years (as in the Northwestern area or in the Red River delta). IBBS and other survey data show that high HIV infection among FSWs is closely associated with drug injecting practices. Unfortunately, except for HCMC, data is insufficient to model separately the epidemics among drug-injecting FSWs. The provinces and cities with high HIV prevalence among FSWs should continue to carry out ad hoc studies and improve surveillance to track and address drug use in this population.
1990 1992 1994 1996 1998 2000 2002 2004 2006 2008 2010 2012
70
60
50
40
30
20
10
0
Prev
alen
ce of
HIV
(%)
Can ThoHa Noi
North WestHCMC - Young IDUsHCMC - Ex-IDUs
Quang NinhNational prevalence
Graph 12: HIV prevalence among IDUs in Viet Nam 1990 - 2012: National prevalence and prevalence in focus regions
1990 1992 1994 1996 1998 2000 2002 2004 2006 2008 2010 2012
60
50
40
30
20
10
0
Prev
alen
ce of
HIV
(%)
Hai PhongCan Tho Ha Noi
North West The Red river deltaHCMC - CSWs without drug useHCMC - CSW with injectingNational prevalence
Graph 13: HIV prevalence among FSWs in Viet Nam 1990 - 2012: National prevalence and prevalence in focus regions
VIET NAM HIV/AIDS ESTIMATES AND PROJECTIONS 2007 – 2012 73

An estimated 2% of clients of FSWs were living with HIV in 2007. The rate stabilizes through the next 5 years (Graph 14), implying a constant rate of new infections among clients. Although there is increasing prevalence in a few provinces and cities, particularly in the Northwestern region and Can Tho, the trend decreases in other provinces, including An Giang and Ha Noi. Such declines must be interpreted cautiously since they were projected using sentinel surveillance data for STI patients and therefore may not accurately reflect the true prevalence in the client population. Also, it should be noted that while the prevalence in this group may only be of order 2%, the large number of clients of sex workers in the population, estimated at 7.5% of adult men, will result in large numbers of sex clients becoming infected with HIV. These men pose a substantial risk of transmission of HIV and STIs also to their regular sex partners, requiring strong prevention efforts targeting clients of sex workers.
HIV prevalence among MSM in Viet Nam remains at 2% during 2007 - 2012. HIV prevalence among MSM in Ho Chi Minh City and Ha Noi, at 5.4% and 3.8%, respectively, are higher than the national. Other provinces and cities have rates stabilizing around 1%. It should be noted, however, that very few studies have been conducted to obtain prevalence rates for MSM, who are not included in the HIV sentinel surveillance system in Viet Nam. The estimates and projections for this group therefore may not reflect the real situation, which may be either more or less serious. Given increasing prevalence among MSM in other parts of Asia, surveillance and risk behavioral monitoring of these men should be expanded alongside strengthened prevention efforts.
Can Tho Ha Noi
North WestAn GiangHo Chi Minh City
Quang NinhNational prevalence
5
4
3
2
1
0
Prev
alen
ce of
HIV
(%)
1990 1992 1994 1996 1998 2000 2002 2004 2006 2008 2010 2012
Graph 14: HIV prevalence among clients of sex workers in Viet Nam 1990 - 2012: National prevalence and prevalence in focus regions
74 VIET NAM HIV/AIDS ESTIMATES AND PROJECTIONS 2007 – 2012

7
6
5
4
3
2
1
0
Prev
alen
ce of
HIV
(%)
Ha Noi HCMCNational Prevalence Other provinces/cities
19901991
19921993
19941995
19961997
19981999
20002001
20022003
20042005
20062007
20082009
20102011
2012
Graph 15: HIV prevalence among MSM in Viet Nam 1990 - 2012: National prevalence and prevalence in focus regions
A comparison of results from the two HIV/AIDS estimates and projections rounds, in 2003 and 2007, in Viet Nam is presented in Graph 16. The 2007 process resulted in a HIV infections number which is 70,000 less than the number produced in 2003. There are various possible explanations for this difference:
Prevention and intervention programs have either stabilized or reduced the prevalence rate in a number of provinces and cities. This explanation is based on two factors: 1) the prevalence rate has not increased (but has decreased) in many provinces, cities and regions, or among different groups; 2) since 2004, HIV interventions have been widely implemented in Viet Nam under the leadership of the Ministry of Health in collaboration with international partners, including PEPFAR, World Bank, DFID, and GFATM.
Data inputs used for the 2007 estimates and projections process were more complete and comprehensive than those used in the 2003 process. Sentinel surveillance data collected up to 2006 were used for this estimates and projections process (while in the 2003 process, sentinel surveillance data were available only up to 2002). The more comprehensive data available in this round allowed the technical working group to make more appropriate adjustments. For instance, results from studies using a more random sample of sex workers were available for adjusting sentinel surveillance data to produce trends that are closer to the real prevalence among FSWs.
Population sizes varied between the two rounds. Programmatic data available in 2007 were used to adjust MOLISA population size estimates. The overall curve for 2007 is lower, indicating that adjustments to both the prevalence and population sizes had affected the estimated national curve.
Software packages, i.e. EPP and SPECTRUM, were upgraded between the two rounds.
VIET NAM HIV/AIDS ESTIMATES AND PROJECTIONS 2007 – 2012 75

The true cause for data discrepancy between the two HIV/AIDS estimates and projections rounds is difficult to pinpoint given multiple factors involved. It is most likely that all are contributing factors and that effective HIV intervention programs have played a substantial role in reducing incidence.
400,000
350,000
300,000
250,000
200,000
150,000
100,000
50,000
01990
19921994
19961998
20002002
20042006
20082010
2007 estimation and projection 2003 estimation and projection
Num
ber o
f HIV
Infe
ctio
n
Graph 16: HIV/AIDS estimates and projections in Viet Nam in 2003 and 2007
76 VIET NAM HIV/AIDS ESTIMATES AND PROJECTIONS 2007 – 2012

Chapter vICOnCLUSIOnS fROM THE 2007 HIv/aIDS ESTIMaTES anD PROJECTIOnS PROCESS
1. By 2007, there were 220,000 people living with HIV and AIDS in Viet Nam. By 2010, there will be 254,000 people living with HIV and AIDS, and this number will reach 280,000 by 2012.
2. The national HIV prevalence (including adults and children) will be 0.29% in 2010 and will rise to 0.3% by 2012. Adult HIV prevalence (age 15 - 49) is estimated at 0.44% in 2010 and 0.47% in 2012. HIV prevalence will reach 0.66% in male adults 0.27% in female adults in 2012.
3. HIV incidence among adults (age 15 - 49) peaked in 2000 at 67 new infections per 100,000 people. After this peak, incidence rates steadily decline to 39 per 100,000 people in 2007, giving evidence to the success of prevention efforts.
4. There will be approximately 65,500 people living with HIV (15 years and older) in need of ARV treatment in 2010.
5. Care and treatment programs in Viet Nam have had positive impact. If expanded to reach 75% of those in need, appropriate care and treatment services which include ARV therapy will reduce the number of annual deaths by 10,600 by 2012.
6. However, because HIV/AIDS treatment prolongs life, a rise in the number of people living with HIV is expected. Human and financial resource needs for ART in the next 5 years will be much greater.
7. The male/female HIV infection ratio will gradually decrease, reaching 2.5 by 2012. This suggests more HIV spread from infected IDUs and clients to their spouses or regular sex partners. Men will continue to account for the majority of PLHIV and new HIV infections.
8. There will be 4,800 HIV positive pregnant women in 2012, of which 4,200 will need
PMTCT services.
VIET NAM HIV/AIDS ESTIMATES AND PROJECTIONS 2007 – 2012 77

9. Among high risk populations, IDUs have the highest HIV rates. Overall prevalence among this group stabilizes, but will remain at a high 30% in the coming years. In a number of provinces, cities, and regions, HIV prevalence rates among IDUs will increase.
10. Approximately 9% of FSWs will be living with HIV in 2007 and 9.3% in 2012. The
HIV epidemic among FSWs will stabilize, although there will be an increase in HIV infection among FSWs in certain provinces and cities, especially where FSWs inject drugs. Injecting drug practice among FSWs remains a key factor for HIV infection in provinces and cities with high HIV prevalence among FSWs.
11. Approximately 2% of MSM will be living with HIV from 2007 to 2017. Despite the low prevalence, the large number of men in this group will significantly affect the HIV trend in Viet Nam. It should also be noted that this is based on much more limited data than trends in the other groups, so there may be a rapid upward HIV trend among MSM in certain regions of Viet Nam.
12. Although the HIV epidemic among high risk populations across the country has begun to stabilize, the number of new infections caused by transmission from high risk men to their spouses or regular sex partners will steadily rise.
13. In the Northwestern region, in spite of insufficient data, the HIV epidemic, rising
from the IDU HIV epidemic, is projected to increase rapidly in all groups.
14. There are multiple explanations for the differences in the results from the 2003 and 2007 HIV/AIDS estimates and projections processes, including the effect of widely implemented intervention programs, difference in size estimates, more complete and comprehensive data available in 2007, and improvements made to the modeling software packages.
78 VIET NAM HIV/AIDS ESTIMATES AND PROJECTIONS 2007 – 2012

Chapter vIIRECOMMEnDaTIOnS
1. Estimates and projections should be regularly updated as prevention, care and treatment programs change over time and new and improved sentinel surveillance data and size estimates become available. Updated estimates and projections are needed for effective HIV/AIDS planning and policy development.
2. With new HIV infections still occurring, evidence-based comprehensive HIV prevention programs need to be intensified and scaled up, particularly interventions targeting most-at-risk populations, including:a. Prevention programs for high risk groups (IDUs, FSWs, clients of sex workers,
and MSM). Although trends are stabilizing among at-risk groups, prevalence remains at high rates, implying ongoing transmission between high risk individuals and to their spouses or other sexual partners. Attention must be paid to areas such as the Northwestern region where late epidemic onsets with rapid increase in prevalence are seen. More resources should be allocated for these regions. Provision of condoms and clean needles and syringes are effective prevention measures among high risk groups, especially when implemented as part of comprehensive harm reduction programs. Drug treatment programs to reduce drug injecting frequency can also prove to be effective HIV prevention among IDUs.
b. Prevention of STI transmission from high risk males (IDUs, MSM, and clients of sex workers) to their spouses and regular sex partners should be prioritized to reduce HIV transmission and serious health consequences of STI infection.
3. Advance preparation of infrastructure and resources to provide care and treatment for HIV and related opportunistic infections is required for the growing number of people in need, which will increase greatly by 2012. Care and treatment programs should be scaled up in more provinces and cities in order to achieve national targets and reach the number of averted deaths as presented in this report.
4. An estimated 3,460 women were in need of PMTCT in 2007, and yet coverage was low, with only 38% of HIV infected pregnant women estimated to have received ARV prophylaxis or treatment. Expansion of comprehensive PMTCT programs and sufficient allocation of resources for HIV testing and counseling services are needed for women attending antenatal care.
VIET NAM HIV/AIDS ESTIMATES AND PROJECTIONS 2007 – 2012 79

Chapter vIIIRECOMMEnDaTIOnS On IMPROvInG QUaLITY anD SUPPLEMEnTInG DaTa fOR EPIDEMIC REvIEW anD aSSESSMEnT
1. Improve data quality of Viet Nam HIV sentinel surveillance by: - Ensuring strict adherence to the sentinel surveillance protocol, with attention
paid to unified sampling methods, correct sentinel site selection, and proper identification of subjects.
- Increasing monitoring and technical assistance during field implementation.- Conducting regular training courses on monitoring and field supervision for
provincial staff.
2. Review sentinel surveillance sites and consider including other provinces and cities with observed dynamic changes in the HIV epidemic.
3. Conduct systematic size estimation of high risk populations in Viet Nam, including IDUs, FSWs, clients of sex workers and MSM. Data from MOLISA and program mapping currently is used for HIV estimates and projections. However, sound scientific methods should be applied to verify, monitor and/or analyze changes in the sizes of at-risk populations in a systematic manner.
4. Conduct studies among the male population at large and among clients of sex workers to: - Determine the proportion of men who visit sex workers.- Determine HIV prevalence among clients of sex workers.
5. Continue expanding MSM study sites.
6. Data from the first round of IBBS was broadly applied in the 2007 HIV/AIDS estimates and projections process. Yet having been collected at only one point in time, IBBS data cannot produce trends for risk behaviors and new infections. Data from the second round of IBBS will be important to update the epidemic status and produce future estimates and projections.
7. Routine programmatic data should be more frequently reviewed and summarized to
monitor the epidemic and assess coverage of prevention, care and treatment programs. Measures should be applied to ensure routine reporting data quality (especially for ART and PMTCT data), including clear indicator definitions, standardizing reporting procedures, data management trainings, facilitative supervision and data verification activities.
80 VIET NAM HIV/AIDS ESTIMATES AND PROJECTIONS 2007 – 2012

appendix
APP
eND
IX I:
Low
est
imat
es o
f pop
ulat
ion
size
s us
ed in
HIV
/AID
S es
tim
ates
and
Pro
ject
ions
199
0 - 2
012
in V
iet N
am
CluS
TERS
TOTA
lM
AlE
uRBA
N FE
MAl
ERu
RAl
FEM
AlE
IDuS
ClIE
NTS O
F FS
WS
FSW
SM
SM
North
Wes
t5,4
15,36
22,5
97,01
530
0,061
2,336
,478
27,49
613
8,863
1,564
13,88
6
North
Plat
eau
3,277
,001
1,589
,727
244,1
291,3
39,52
99,3
0384
,605
1,245
8,460
North
East
2,962
,081
1,431
,515
175,0
411,2
66,10
04,9
2776
,002
896
7,600
Thai
Ngu
yen
800,8
5039
0,202
94,13
528
7,825
5,366
20,93
030
02,0
93
Hai P
hong
1,244
,300
604,3
2822
1,446
378,5
473,5
9732
,165
1,000
3,217
Quan
g Nin
h76
1,465
382,9
3517
3,277
181,4
061,1
9120
,324
300
2,032
Red R
iver D
elta
7,963
,991
3,810
,972
425,0
133,4
91,00
912
,997
202,3
261,4
4120
,233
North
Cent
ral
1,753
,898
854,9
1812
3,730
724,5
4054
245
,262
379
4,526
Cent
ral C
oast
4,455
,802
2,182
,635
604,0
211,5
39,23
11,1
7811
5,557
1,401
11,55
6
Khan
h Hoa
744,8
2336
6,706
140,6
3121
4,890
502
19,43
855
01,9
44
High
Plat
eau
3,045
,212
1,527
,240
422,4
941,0
03,90
21,2
7480
,874
1,341
8,087
Sout
h Eas
t5,0
04,48
32,4
66,66
370
9,632
1,678
,033
3,718
130,7
082,6
6013
,071
An G
iang
1,505
,387
727,2
1017
0,100
563,8
001,0
9038
,534
800
3,853
Can T
ho90
5,594
411,4
0623
4,203
234,3
4293
621
,817
708
2,182
Mek
ong R
iver D
elta
9,615
,020
4,640
,502
810,7
243,8
86,29
94,2
9024
5,756
2,874
24,57
6
Ha N
oi2,2
63,84
81,0
94,54
664
8,121
432,9
3215
,777
59,06
01,6
0011
,812
Ho Ch
i Min
h City
4,281
,478
1,990
,335
1,819
,111
310,8
0717
,049
107,0
7810
,000
21,41
6
VIET NAM HIV/AIDS ESTIMATES AND PROJECTIONS 2007 – 2012 81
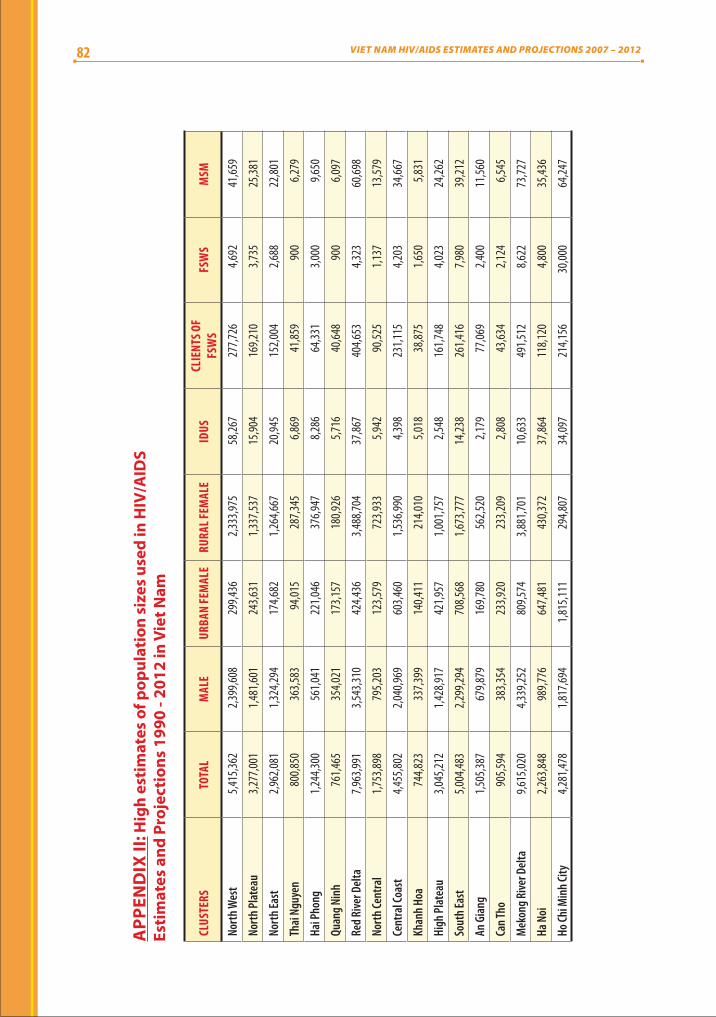
CluS
TERS
TOTA
lM
AlE
uRBA
N FE
MAl
ERu
RAl F
EMAl
EID
uSCl
IENT
S OF
FSW
SFS
WS
MSM
North
Wes
t5,4
15,36
22,3
99,60
829
9,436
2,333
,975
58,26
727
7,726
4,692
41,65
9
North
Plat
eau
3,277
,001
1,481
,601
243,6
311,3
37,53
715
,904
169,2
103,7
3525
,381
North
East
2,962
,081
1,324
,294
174,6
821,2
64,66
720
,945
152,0
042,6
8822
,801
Thai
Ngu
yen
800,8
5036
3,583
94,01
528
7,345
6,869
41,85
990
06,2
79
Hai P
hong
1,244
,300
561,0
4122
1,046
376,9
478,2
8664
,331
3,000
9,650
Quan
g Nin
h76
1,465
354,0
2117
3,157
180,9
265,7
1640
,648
900
6,097
Red R
iver D
elta
7,963
,991
3,543
,310
424,4
363,4
88,70
437
,867
404,6
534,3
2360
,698
North
Cent
ral
1,753
,898
795,2
0312
3,579
723,9
335,9
4290
,525
1,137
13,57
9
Cent
ral C
oast
4,455
,802
2,040
,969
603,4
601,5
36,99
04,3
9823
1,115
4,203
34,66
7
Khan
h Hoa
744,8
2333
7,399
140,4
1121
4,010
5,018
38,87
51,6
505,8
31
High
Plat
eau
3,045
,212
1,428
,917
421,9
571,0
01,75
72,5
4816
1,748
4,023
24,26
2
Sout
h Eas
t5,0
04,48
32,2
99,29
470
8,568
1,673
,777
14,23
826
1,416
7,980
39,21
2
An G
iang
1,505
,387
679,8
7916
9,780
562,5
202,1
7977
,069
2,400
11,56
0
Can T
ho90
5,594
383,3
5423
3,920
233,2
092,8
0843
,634
2,124
6,545
Mek
ong R
iver D
elta
9,615
,020
4,339
,252
809,5
743,8
81,70
110
,633
491,5
128,6
2273
,727
Ha N
oi2,2
63,84
898
9,776
647,4
8143
0,372
37,86
411
8,120
4,800
35,43
6
Ho Ch
i Min
h City
4,281
,478
1,817
,694
1,815
,111
294,8
0734
,097
214,1
5630
,000
64,24
7
APP
eND
IX II
: Hig
h es
tim
ates
of p
opul
atio
n si
zes
used
in H
IV/A
IDS
esti
mat
es a
nd P
roje
ctio
ns 1
990
- 201
2 in
Vie
t Nam
82 VIET NAM HIV/AIDS ESTIMATES AND PROJECTIONS 2007 – 2012

CluS
TERS
1990
1991
1992
1993
1994
1995
1996
1997
1998
1999
2000
2001
2002
Ha N
oi0.0
0.10.1
0.20.4
0.71.4
2.54.3
7.311
.516
.721
.8
North
Wes
t0.0
0.00.0
0.00.0
0.00.1
0.10.3
0.61.2
2.24.0
North
Plat
eau
0.00.1
0.10.2
0.30.6
0.91.4
2.33.5
5.27.5
10.2
North
East
0.00.2
0.30.5
0.71.0
1.52.2
3.24.7
6.89.7
13.1
Thai
Ngu
yen
0.10.2
0.40.6
1.01.6
2.64.1
6.29.3
13.3
17.9
22.7
Hai P
hong
0.00.0
0.00.0
0.10.3
1.77.7
26.5
50.9
60.4
62.1
62.1
Quan
g Nin
h0.0
0.00.0
0.00.0
0.00.2
6.347
.355
.955
.855
.855
.6
Red R
iver D
elta
0.10.1
0.20.4
0.71.2
2.23.9
6.610
.314
.618
.721
.8
North
Cent
ral
0.00.0
0.00.0
0.00.0
0.42.0
6.814
.017
.317
.817
.7
Cent
ral C
oast
0.20.6
1.22.5
4.67.2
9.511
.514
.116
.817
.918
.017
.7
Khan
h Hoa
0.92.4
5.910
.514
.517
.019
.221
.926
.131
.236
.139
.441
.1
High
Plat
eau
0.10.2
0.61.8
5.111
.318
.021
.622
.822
.922
.722
.522
.3
Sout
h Eas
t0.0
0.00.1
0.52.4
7.913
.615
.315
.415
.315
.215
.115
.1
Mek
ong R
iver D
elta
0.00.0
0.10.2
0.41.1
2.96.8
12.9
18.6
21.7
22.8
22.9
An G
iang
0.10.1
0.20.4
0.81.5
2.84.9
8.212
.517
.020
.622
.8
Can T
ho0.0
0.00.0
0.00.0
0.10.3
1.23.6
9.821
.935
.042
.3
Ho Ch
i Min
h City
0.51.4
3.46.6
9.611
.312
.314
.220
.133
.647
.352
.553
.1
APP
eND
IX II
I: H
IV p
reva
lenc
e am
ong
IDU
s 19
90 -
2012
by
clus
ter
of p
rovi
nces
(1)
VIET NAM HIV/AIDS ESTIMATES AND PROJECTIONS 2007 – 2012 83

CluS
TERS
2003
2004
2005
2006
2007
2008
2009
2010
2011
2012
Ha N
oi26
.129
.030
.831
.832
.432
.632
.832
.933
.033
.1
North
Wes
t6.4
8.911
.012
.413
.313
.814
.114
.414
.714
.9
North
Plat
eau
13.0
15.8
18.1
19.7
21.0
21.7
22.2
22.5
22.7
22.9
North
East
16.7
19.9
22.6
24.4
25.4
25.7
25.1
24.2
22.8
21.2
Thai
Ngu
yen
27.0
30.5
33.1
34.8
36.0
36.7
37.1
37.4
37.6
37.8
Hai P
hong
61.9
61.7
61.6
61.5
61.6
61.7
61.8
61.9
62.0
62.1
Quan
g Nin
h55
.655
.655
.655
.755
.755
.855
.955
.855
.855
.9
Red R
iver D
elta
23.8
25.0
25.5
25.8
26.0
26.1
26.2
26.3
26.4
26.4
North
Cent
ral
17.2
16.8
16.1
15.7
15.4
15.1
14.8
14.5
14.3
14.0
Cent
ral C
oast
17.2
16.5
15.7
14.8
14.0
13.3
12.7
12.1
11.7
11.4
Khan
h Hoa
41.1
39.3
36.9
34.7
33.0
31.6
30.5
29.6
29.0
28.5
High
Plat
eau
22.1
22.0
22.0
22.1
22.2
22.2
22.3
22.3
22.4
22.4
Sout
h Eas
t15
.115
.115
.215
.315
.415
.415
.515
.515
.515
.5
Mek
ong R
iver D
elta
22.7
22.4
22.1
22.0
21.9
21.9
21.9
22.0
22.0
22.1
An G
iang
23.6
23.3
22.3
20.7
18.9
17.1
15.2
13.6
12.0
10.7
Can T
ho44
.745
.445
.545
.545
.545
.645
.645
.745
.845
.8
Ho Ch
i Min
h City
52.2
51.0
49.8
48.6
47.5
46.6
45.8
45.2
44.7
44.3
APP
eND
IX II
I: H
IV p
reva
lenc
e am
ong
IDU
s 19
90 -
2012
by
clus
ter
of p
rovi
nces
(2)
84 VIET NAM HIV/AIDS ESTIMATES AND PROJECTIONS 2007 – 2012

CluS
TERS
1990
1991
1992
1993
1994
1995
1996
1997
1998
1999
2000
2001
2002
Ha N
oi0.0
0.00.0
0.10.1
0.20.6
1.32.8
5.17.8
10.0
11.2
North
Wes
t0.0
0.00.0
0.00.1
0.10.2
0.30.5
0.91.5
2.43.6
North
Plat
eau
0.00.0
0.00.0
0.00.1
0.10.2
0.30.5
0.91.4
2.2
North
East
0.00.0
0.00.0
0.00.1
0.10.4
0.91.6
2.53.0
3.5
Thai
Ngu
yen
0.00.0
0.00.0
0.00.0
0.00.0
0.40.4
0.71.1
1.8
Hai P
hong
0.00.0
0.00.0
0.00.1
0.21.0
3.49.2
16.4
20.4
21.6
Quan
g Nin
h0.0
0.00.0
0.00.0
0.00.0
0.40.8
1.11.8
2.52.5
Red R
iver D
elta
0.00.0
0.00.0
0.10.1
0.20.3
0.50.9
1.62.6
4.2
North
Cent
ral
0.00.0
0.00.0
0.00.0
0.00.0
0.00.0
0.00.3
0.3
Cent
ral C
oast
0.00.0
0.00.0
0.00.0
0.00.0
0.10.2
0.20.4
0.5
Khan
h Hoa
0.00.0
0.00.0
0.00.0
0.20.4
1.02.2
3.43.8
3.9
High
Plat
eau
0.00.0
0.00.0
0.00.1
0.20.3
0.81.3
1.92.3
2.5
Sout
h Eas
t0.0
0.00.0
0.00.0
0.10.3
0.71.3
2.02.5
2.72.8
Mek
ong R
iver D
elta
0.00.0
0.10.2
0.30.5
0.71.2
1.82.6
3.54.4
5.2
An G
iang
0.00.0
0.00.2
0.61.5
3.56.6
9.210
.610
.810
.810
.7
Can T
ho0.2
0.20.3
0.50.8
1.32.1
3.55.4
7.810
.413
.115
.4
Ho Ch
i Min
h City
0.00.0
0.00.0
0.00.1
0.51.2
2.12.6
2.72.8
2.8
APP
eND
IX IV
: HIV
pre
vale
nce
amon
g fS
ws
1990
- 20
12 b
y cl
uste
r of
pro
vinc
es (1
)
VIET NAM HIV/AIDS ESTIMATES AND PROJECTIONS 2007 – 2012 85

APP
eND
IX IV
: HIV
pre
vale
nce
amon
g fS
ws
1990
- 20
12 b
y cl
uste
r of
pro
vinc
es (2
)
CluS
TERS
2003
2004
2005
2006
2007
2008
2009
2010
2011
2012
Ha N
oi11
.812
.112
.112
.212
.212
.312
.312
.312
.312
.3
North
Wes
t5.0
6.57.7
8.69.1
9.59.7
9.89.9
10.0
North
Plat
eau
3.44.6
5.86.7
7.47.9
8.18.2
8.48.4
North
East
3.63.7
3.63.7
3.73.7
3.73.8
3.73.7
Thai
Ngu
yen
2.83.8
5.16.7
7.98.7
9.29.7
9.810
.0
Hai P
hong
21.8
21.8
21.9
21.9
21.9
22.0
22.0
22.0
22.0
22.0
Quan
g Nin
h2.8
2.82.7
2.73.0
2.92.8
2.82.8
2.7
Red R
iver D
elta
6.28.3
10.1
11.7
12.6
13.1
13.6
13.8
13.8
13.8
North
Cent
ral
0.30.3
0.50.8
0.81.3
1.52.0
2.73.3
Cent
ral C
oast
0.80.9
0.91.0
1.11.0
1.11.1
1.01.1
Khan
h Hoa
4.03.9
4.14.0
3.94.0
4.04.1
4.03.9
High
Plat
eau
2.62.6
2.62.6
2.62.7
2.62.6
2.72.6
Sout
h Eas
t2.8
2.92.9
2.92.9
2.92.9
2.92.9
2.9
Mek
ong R
iver D
elta
5.76.2
6.46.5
6.66.7
6.76.8
6.86.8
An G
iang
10.4
10.2
9.99.8
9.59.2
9.08.8
8.58.3
Can T
ho17
.118
.318
.819
.419
.619
.619
.819
.719
.819
.8
Ho Ch
i Min
h City
2.92.9
3.03.0
3.13.1
3.13.2
3.23.2
86 VIET NAM HIV/AIDS ESTIMATES AND PROJECTIONS 2007 – 2012
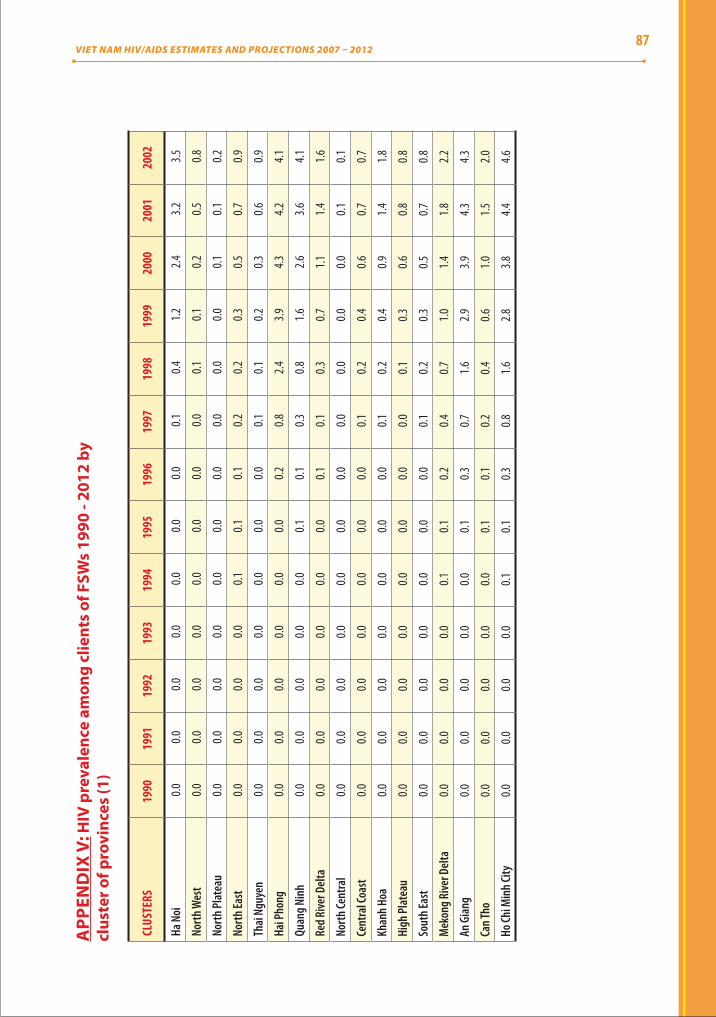
CluS
TERS
1990
1991
1992
1993
1994
1995
1996
1997
1998
1999
2000
2001
2002
Ha N
oi0.0
0.00.0
0.00.0
0.00.0
0.10.4
1.22.4
3.23.5
North
Wes
t0.0
0.00.0
0.00.0
0.00.0
0.00.1
0.10.2
0.50.8
North
Plat
eau
0.00.0
0.00.0
0.00.0
0.00.0
0.00.0
0.10.1
0.2
North
East
0.00.0
0.00.0
0.10.1
0.10.2
0.20.3
0.50.7
0.9
Thai
Ngu
yen
0.00.0
0.00.0
0.00.0
0.00.1
0.10.2
0.30.6
0.9
Hai P
hong
0.00.0
0.00.0
0.00.0
0.20.8
2.43.9
4.34.2
4.1
Quan
g Nin
h0.0
0.00.0
0.00.0
0.10.1
0.30.8
1.62.6
3.64.1
Red R
iver D
elta
0.00.0
0.00.0
0.00.0
0.10.1
0.30.7
1.11.4
1.6
North
Cent
ral
0.00.0
0.00.0
0.00.0
0.00.0
0.00.0
0.00.1
0.1
Cent
ral C
oast
0.00.0
0.00.0
0.00.0
0.00.1
0.20.4
0.60.7
0.7
Khan
h Hoa
0.00.0
0.00.0
0.00.0
0.00.1
0.20.4
0.91.4
1.8
High
Plat
eau
0.00.0
0.00.0
0.00.0
0.00.0
0.10.3
0.60.8
0.8
Sout
h Eas
t0.0
0.00.0
0.00.0
0.00.0
0.10.2
0.30.5
0.70.8
Mek
ong R
iver D
elta
0.00.0
0.00.0
0.10.1
0.20.4
0.71.0
1.41.8
2.2
An G
iang
0.00.0
0.00.0
0.00.1
0.30.7
1.62.9
3.94.3
4.3
Can T
ho0.0
0.00.0
0.00.0
0.10.1
0.20.4
0.61.0
1.52.0
Ho Ch
i Min
h City
0.00.0
0.00.0
0.10.1
0.30.8
1.62.8
3.84.4
4.6
APP
eND
IX V
: HIV
pre
vale
nce
amon
g cl
ient
s of
fSw
s 19
90 -
2012
by
clus
ter o
f pro
vinc
es (1
)
VIET NAM HIV/AIDS ESTIMATES AND PROJECTIONS 2007 – 2012 87

APP
eND
IX V
: HIV
pre
vale
nce
amon
g cl
ient
s of
fSw
s 19
90 -
201
2 by
cl
uste
r of p
rovi
nces
(2)
CluS
TERS
2003
2004
2005
2006
2007
2008
2009
2010
2011
2012
Ha N
oi3.5
3.43.3
3.33.2
3.23.1
3.13.1
3.1
North
Wes
t1.3
1.82.2
2.52.6
2.72.7
2.72.7
2.7
North
Plat
eau
0.20.3
0.40.5
0.50.5
0.50.5
0.60.6
North
East
1.11.3
1.51.6
1.61.6
1.61.5
1.41.3
Thai
Ngu
yen
1.42.0
2.73.3
3.94.2
4.54.6
4.74.8
Hai P
hong
3.93.7
3.63.4
3.23.1
2.92.7
2.62.4
Quan
g Nin
h4.3
4.44.3
4.34.3
4.34.3
4.34.3
4.3
Red R
iver D
elta
1.61.7
1.71.7
1.71.7
1.71.7
1.71.7
North
Cent
ral
0.10.2
0.20.3
0.40.5
0.70.9
1.21.6
Cent
ral C
oast
0.70.7
0.70.7
0.70.7
0.70.7
0.70.7
Khan
h Hoa
1.92.0
2.02.0
2.12.1
2.12.1
2.12.1
High
Plat
eau
0.80.9
0.90.9
0.90.9
0.90.9
0.90.9
Sout
h Eas
t0.9
0.90.9
0.90.8
0.80.8
0.80.8
0.7
Mek
ong R
iver D
elta
2.42.6
2.72.8
2.82.8
2.92.9
2.92.9
An G
iang
4.24.0
3.93.7
3.63.5
3.33.2
3.13.0
Can T
ho2.5
2.83.1
3.23.3
3.43.4
3.43.4
3.5
Ho Ch
i Min
h City
4.64.6
4.54.5
4.54.5
4.54.5
4.54.5
88 VIET NAM HIV/AIDS ESTIMATES AND PROJECTIONS 2007 – 2012

Num
ber o
f PlH
IV (A
ll ag
es, M
ale a
nd Fe
mal
e)20
0020
0120
0220
0320
0420
0520
0620
0720
0820
0920
1020
1120
12
High
118,6
0215
2,045
181,3
9720
8,017
231,5
7025
1,800
268,8
9928
3,596
298,5
8131
2,704
327,7
7934
4,532
360,1
06
Low
63,50
482
,390
98,88
111
3,752
126,9
1813
8,192
147,9
0715
7,248
164,2
6217
2,409
180,9
9419
0,795
200,1
19
Med
ium
91,05
311
7,218
140,1
3916
0,885
179,2
4419
4,996
208,4
0322
0,422
231,4
2224
2,557
254,3
8726
7,664
280,1
13
Num
ber o
f PlH
IV
(All
ages
, Mal
e)20
0020
0120
0220
0320
0420
0520
0620
0720
0820
0920
1020
1120
12
High
96,42
512
2,634
145,1
5316
6,496
185,4
1620
0,153
213,8
5722
3,903
235,8
9924
5,484
255,7
6626
5,750
275,7
70
Low
42,69
355
,039
65,63
475
,552
83,83
791
,369
97,91
910
3,562
107,6
9011
2,533
117,6
4712
1,025
125,4
61
Med
ium
69,55
988
,837
105,3
9412
1,024
134,6
2714
5,761
155,8
8816
3,733
171,7
9517
9,009
186,7
0719
3,388
200,6
16
Num
ber o
f PlH
IV
(All
ages
, Fem
ale)
2000
2001
2002
2003
2004
2005
2006
2007
2008
2009
2010
2011
2012
High
22,17
729
,410
36,24
441
,522
46,15
451
,647
55,04
259
,693
62,68
267
,219
72,01
378
,782
84,33
5
Low
20,81
127
,351
33,24
738
,200
43,08
246
,824
49,98
853
,686
56,57
259
,876
63,34
769
,771
74,65
8
Med
ium
21,49
428
,381
34,74
639
,861
44,61
849
,236
52,51
556
,690
59,62
763
,548
67,68
074
,277
79,49
7
Num
ber o
f PlH
IV (A
ge
15+,
Mal
e and
Fem
ale)
2000
2001
2002
2003
2004
2005
2006
2007
2008
2009
2010
2011
2012
High
117,7
7715
0,854
179,7
9920
6,009
229,1
4024
8,947
265,5
2627
9,643
294,0
9930
7,775
322,4
6533
8,882
354,2
15
Low
62,75
081
,296
97,41
611
1,911
124,6
8013
5,590
144,8
5115
3,702
160,1
8816
7,901
176,1
1718
5,588
194,6
70
Med
ium
90,26
411
6,075
138,6
0815
8,960
176,9
1019
2,269
205,1
8921
6,673
227,1
4423
7,838
249,2
9126
2,235
274,4
43
Male/
Fem
ale ra
tio of
PlH
IV
(Age
15+,
Mal
e/Fe
mal
e)20
0020
0120
0220
0320
0420
0520
0620
0720
0820
0920
1020
1120
12
High
4.41
4.23
4.07
4.08
4.10
3.95
3.97
3.84
3.86
3.75
3.65
3.46
3.35
Low
2.07
2.03
1.99
2.00
1.97
1.98
1.99
1.96
1.93
1.91
1.89
1.76
1.70
Med
ium
3.24
3.13
3.03
3.04
3.03
2.97
2.98
2.90
2.90
2.83
2.77
2.61
2.53
APP
eND
IX V
I: Su
mm
ary
data
of H
IV/A
IDS
esti
mat
es a
nd p
roje
ctio
ns (1
)VIET NAM HIV/AIDS ESTIMATES AND PROJECTIONS 2007 – 2012
89

APP
eND
IX V
I: Su
mm
ary
data
of H
IV/A
IDS
esti
mat
es a
nd p
roje
ctio
ns (2
)
HIV
prev
alen
ce (%
, All
ages
, Mal
e and
Fem
ale)
2000
2001
2002
2003
2004
2005
2006
2007
2008
2009
2010
2011
2012
High
0.153
0.193
0.227
0.257
0.282
0.303
0.319
0.332
0.345
0.356
0.369
0.383
0.395
Low
0.082
0.105
0.124
0.141
0.155
0.166
0.175
0.184
0.190
0.196
0.204
0.212
0.220
Med
ium
0.118
0.149
0.176
0.199
0.218
0.234
0.247
0.258
0.267
0.276
0.286
0.297
0.308
HIV p
reva
lenc
e (%
, Age
15
- 49,
Mal
e and
Fem
ale)
2000
2001
2002
2003
2004
2005
2006
2007
2008
2009
2010
2011
2012
High
0.270
0.330
0.390
0.430
0.470
0.490
0.510
0.530
0.540
0.550
0.570
0.580
0.600
Low
0.140
0.180
0.210
0.240
0.260
0.270
0.280
0.290
0.300
0.300
0.310
0.320
0.330
Med
ium
0.205
0.255
0.300
0.335
0.365
0.380
0.395
0.410
0.420
0.425
0.440
0.450
0.465
HIV
prev
alen
ce
(%, A
ge 15
- 49,
Mal
e)20
0020
0120
0220
0320
0420
0520
0620
0720
0820
0920
1020
1120
12
High
0.440
0.540
0.620
0.690
0.750
0.780
0.810
0.830
0.850
0.860
0.880
0.890
0.910
Low
0.190
0.240
0.280
0.310
0.340
0.360
0.370
0.380
0.380
0.390
0.400
0.400
0.410
Med
ium
0.315
0.390
0.450
0.500
0.545
0.570
0.590
0.605
0.615
0.625
0.640
0.645
0.660
HIV
prev
alen
ce
(%, A
ge 15
- 49,
Fem
ale)
2000
2001
2002
2003
2004
2005
2006
2007
2008
2009
2010
2011
2012
High
0.100
0.130
0.150
0.170
0.190
0.200
0.210
0.220
0.230
0.240
0.260
0.270
0.280
Low
0.090
0.120
0.140
0.160
0.170
0.180
0.190
0.200
0.210
0.220
0.220
0.240
0.250
Med
ium
0.095
0.125
0.145
0.165
0.180
0.190
0.200
0.210
0.220
0.230
0.240
0.255
0.265
AIDS
dea
th (A
ll ag
es,
Mal
e and
fem
ale)
2000
2001
2002
2003
2004
2005
2006
2007
2008
2009
2010
2011
2012
High
1,307
2,109
3,285
4,870
6,827
8,716
9,957
10,90
610
,019
10,31
69,8
8710
,126
10,60
8
Low
714
1,149
1,776
2,614
3,644
4,457
4,559
4,402
5,528
5,474
5,418
5,630
5,869
Med
ium
1,011
1,629
2,531
3,742
5,236
6,587
7,258
7,654
7,774
7,895
7,653
7,878
8,239
90 VIET NAM HIV/AIDS ESTIMATES AND PROJECTIONS 2007 – 2012

APP
eND
IX V
I: Su
mm
ary
data
of H
IV/A
IDS
esti
mat
es a
nd p
roje
ctio
ns (3
)
Cum
ulat
ive AI
DS de
ath (
All
ages
, Mal
e and
fem
ale)
2000
2001
2002
2003
2004
2005
2006
2007
2008
2009
2010
2011
2012
High
3,061
5,170
8,455
13,32
520
,152
28,86
838
,824
49,73
059
,749
70,06
579
,952
90,07
810
0,686
Low
1,640
2,790
4,566
7,180
10,82
415
,282
19,84
124
,242
29,77
135
,244
40,66
246
,291
52,16
0
Med
ium
2,351
3,980
6,511
10,25
315
,488
22,07
529
,333
36,98
644
,760
52,65
560
,307
68,18
576
,423
PlHI
V (A
ge 15
+) in
nee
d of
ARV
trea
tmen
t20
0020
0120
0220
0320
0420
0520
0620
0720
0820
0920
1020
1120
12
High
6,225
10,23
515
,938
23,23
631
,811
41,21
251
,159
61,72
773
,111
86,05
710
0,111
115,1
7513
0,007
Low
2,959
4,991
7,948
11,80
016
,392
21,50
627
,044
33,30
540
,628
48,03
755
,540
63,36
371
,086
Med
ium
4,592
7,613
11,94
317
,518
24,10
231
,359
39,10
247
,516
56,87
067
,047
77,82
689
,269
100,5
47
HIV+
pre
gnan
t wom
en
in n
eed
of A
RV fo
r PM
TCT
2000
2001
2002
2003
2004
2005
2006
2007
2008
2009
2010
2011
2012
High
1,738
2,227
2,661
2,943
3,161
3,421
3,494
3,655
3,687
3,836
3,999
4,147
4,321
Low
1,632
2,072
2,441
2,708
2,955
3,093
3,164
3,269
3,313
3,393
3,487
3,656
3,813
Med
ium
1,685
2,150
2,551
2,826
3,058
3,257
3,329
3,462
3,500
3,615
3,743
3,902
4,067
VIET NAM HIV/AIDS ESTIMATES AND PROJECTIONS 2007 – 2012 91
BỘ Y TẾCỤC PHÒNG, CHỐNG HIV/AIDS
135/3 Núi Trúc, Ba Đình, Hà Nội, Việt NamTel: (84-4) 736 7128, Fax: (84-4) 846 5732
E-mail: [email protected].
www.vaac.gov.vn/