Descending Projections from Extrastriate Visual Cortex ...
19
Cerebral Cortex November 2011;21:2620--2638 doi:10.1093/cercor/bhr048 Advance Access publication April 6, 2011 Descending Projections from Extrastriate Visual Cortex Modulate Responses of Cells in Primary Auditory Cortex Matthew I. Banks 1 , Daniel J. Uhlrich 2 , Philip H. Smith 2 , Bryan M. Krause 3 and Karen A. Manning 2 1 Department of Anesthesiology, 2 Department of Neuroscience and 3 Neuroscience Training Program, University of Wisconsin, Madison, WI 53706, USA Address correspondence to Dr Matthew I. Banks, Department of Anesthesiology, University of Wisconsin, 1300 University Avenue, Room 4605, Madison, WI 53706, USA. Email: [email protected]. Primary sensory cortical responses are modulated by the presence or expectation of related sensory information in other modalities, but the sources of multimodal information and the cellular locus of this integration are unclear. We investigated the modulation of neural responses in the murine primary auditory cortical area Au1 by extrastriate visual cortex (V2). Projections from V2 to Au1 terminated in a classical descending/modulatory pattern, with highest density in layers 1, 2, 5, and 6. In brain slices, whole-cell recordings revealed long latency responses to stimulation in V2L that could modulate responses to subsequent white matter (WM) stimuli at latencies of 5--20 ms. Calcium responses imaged in Au1 cell populations showed that preceding WM with V2L stimulation modulated WM responses, with both summation and suppression observed. Modulation of WM responses was most evident for near- threshold WM stimuli. These data indicate that corticocortical projections from V2 contribute to multimodal integration in primary auditory cortex. Keywords: calcium imaging, cortical column, layer 5, neocortex, patch clamping Introduction Sensory cortical columns integrate information arising from diverse sources. Current theories of sensory awareness suggest that neocortex is constantly comparing observed sensory information with what is expected based on experience, context, and information from other sensory modalities (Engel et al. 2001; Hawkins and Blakeslee 2005; Bar 2009). In this model, modulation of sensory responses to external ‘‘bottom- up’’ inputs by internal ‘‘top-down’’ processes is a key compo- nent of sensory awareness, but how this modulation occurs within the circuitry of neocortex is unclear. We investigated this integration in murine brain slices using electrophysiolog- ical recordings and calcium imaging of neural activity in the primary auditory cortical area Au1 in response to white matter (WM) stimuli and modulatory stimuli applied to a descending projection to Au1. Afferent input terminals within a cortical column are segregated according to their source, allowing information flowing up and down the cortical hierarchy to contact cells and subcellular regions in a lamina-specific manner. In primary sensory cortex, thalamocortical afferents arising from specific thalamic nuclei (lemniscal thalamocortical fibers) terminate with highest density in layer 4 and deep layer 3 (Frost and Caviness 1980; Scheel 1988; Huang and Winer 2000), contact- ing dendrites of cells with somata in layers 3--6 (Mitani et al. 1985; Hefti and Smith 2000; Cruikshank et al. 2002). Descend- ing afferents and afferents from nonspecific thalamus eschew the granular layer and terminate with highest density in layers 1, 2, 5, and 6 (Ryugo and Killackey 1974; Herkenham 1980; Galaburda and Pandya 1983; Arnault and Roger 1990; Clerici and Coleman 1990; Felleman and Van Essen 1991; Rouiller et al. 1991; Shi and Cassell 1997; Huang and Winer 2000; Linke and Schwegler 2000), forming a termination zone complementary to ascending afferents. Some individual cells, such as large layer 5 pyramidal cells, are positioned to integrate directly afferent input from both sources, while other cells may participate in this integration via local circuits. Multimodal integration is an important example of co- ordination between cortical areas as stimuli arising in the natural world typically activate multiple sensory systems either concurrently or in sequence. The influence of visual in- formation on auditory processing has long been recognized. For example, visual cues from a speaker effectively ‘‘amplify’’ speech sounds in noisy backgrounds (Sumby and Pollack 1954), silent lipreading activates auditory cortical areas in humans (Calvert et al. 1997), and conflicting visual information can alter speech perception (McGurk and MacDonald 1976). All these cases are examples of visual sensory input establishing an expectation for subsequent auditory sensory stimulation, an expectation that is likely mediated by descending cross-modal cortical connections. The sites of multisensory integration have attracted renewed interest in the last several years (Ghazanfar and Schroeder 2006; Macaluso 2006; Driver and Noesselt 2008), and accumulating evidence suggests that primary sensory cortex is an important locus (Fu et al. 2003; Ghazanfar et al. 2005; Murray et al. 2005; Lakatos et al. 2007, 2009; Martuzzi et al. 2007; Kayser et al. 2008; Liang et al. 2008). In auditory cortex, it has been shown that somatosensory or visual stimuli can modulate responses to the auditory stimuli, and this modulation can be facilitative or suppressive depending on the individual neuron and the context (Ghazanfar et al. 2005; Bizley et al. 2007; Kayser et al. 2007, 2008; Lakatos et al. 2007). Extrastriate visual cortex (V2) in rodents has been shown to play a key role in coordinating multisensory integration (Hirokawa et al. 2008), and previous reports demonstrate that V2 projects to primary auditory cortex in rats, gerbils, and ferrets (Miller and Vogt 1984; Budinger et al. 2006; Bizley et al. 2007; Smith et al. 2010). Here, we show that neurons in V2 project to Au1 in mice in a pattern typical of descending cortical projections, with dense labeling in supragranular and infragranular layers. We also provide evidence that these projections are preserved in brain slices, enabling us to test their function using a calcium imaging technique in which fluorescence signals are monitored simultaneously in dozens of individually identified cells. Stimulation of the WM in neocortical brain slices has been Ó The Author 2011. Published by Oxford University Press. All rights reserved. For permissions, please e-mail: [email protected] Downloaded from https://academic.oup.com/cercor/article/21/11/2620/277575 by guest on 13 January 2022
-
Upload
khangminh22 -
Category
Documents
-
view
2 -
download
0
Transcript of Descending Projections from Extrastriate Visual Cortex ...
Cerebral Cortex November 2011;21:2620--2638
doi:10.1093/cercor/bhr048
Advance Access publication April 6, 2011
Descending Projections from Extrastriate Visual Cortex Modulate Responses of Cells inPrimary Auditory Cortex
Matthew I. Banks1, Daniel J. Uhlrich2, Philip H. Smith2, Bryan M. Krause3 and Karen A. Manning2
1Department of Anesthesiology, 2Department of Neuroscience and 3Neuroscience Training Program, University of Wisconsin,
Madison, WI 53706, USA
Address correspondence to Dr Matthew I. Banks, Department of Anesthesiology, University of Wisconsin, 1300 University Avenue, Room 4605,
Madison, WI 53706, USA. Email: [email protected].
Primary sensory cortical responses are modulated by the presenceor expectation of related sensory information in other modalities,but the sources of multimodal information and the cellular locus ofthis integration are unclear. We investigated the modulation ofneural responses in the murine primary auditory cortical area Au1by extrastriate visual cortex (V2). Projections from V2 to Au1terminated in a classical descending/modulatory pattern, withhighest density in layers 1, 2, 5, and 6. In brain slices, whole-cellrecordings revealed long latency responses to stimulation in V2Lthat could modulate responses to subsequent white matter (WM)stimuli at latencies of 5--20 ms. Calcium responses imaged in Au1cell populations showed that preceding WM with V2L stimulationmodulated WM responses, with both summation and suppressionobserved. Modulation of WM responses was most evident for near-threshold WM stimuli. These data indicate that corticocorticalprojections from V2 contribute to multimodal integration in primaryauditory cortex.
Keywords: calcium imaging, cortical column, layer 5, neocortex, patchclamping
Introduction
Sensory cortical columns integrate information arising from
diverse sources. Current theories of sensory awareness suggest
that neocortex is constantly comparing observed sensory
information with what is expected based on experience,
context, and information from other sensory modalities (Engel
et al. 2001; Hawkins and Blakeslee 2005; Bar 2009). In this
model, modulation of sensory responses to external ‘‘bottom-
up’’ inputs by internal ‘‘top-down’’ processes is a key compo-
nent of sensory awareness, but how this modulation occurs
within the circuitry of neocortex is unclear. We investigated
this integration in murine brain slices using electrophysiolog-
ical recordings and calcium imaging of neural activity in the
primary auditory cortical area Au1 in response to white matter
(WM) stimuli and modulatory stimuli applied to a descending
projection to Au1.
Afferent input terminals within a cortical column are
segregated according to their source, allowing information
flowing up and down the cortical hierarchy to contact cells and
subcellular regions in a lamina-specific manner. In primary
sensory cortex, thalamocortical afferents arising from specific
thalamic nuclei (lemniscal thalamocortical fibers) terminate
with highest density in layer 4 and deep layer 3 (Frost and
Caviness 1980; Scheel 1988; Huang and Winer 2000), contact-
ing dendrites of cells with somata in layers 3--6 (Mitani et al.
1985; Hefti and Smith 2000; Cruikshank et al. 2002). Descend-
ing afferents and afferents from nonspecific thalamus eschew
the granular layer and terminate with highest density in layers
1, 2, 5, and 6 (Ryugo and Killackey 1974; Herkenham 1980;
Galaburda and Pandya 1983; Arnault and Roger 1990; Clerici
and Coleman 1990; Felleman and Van Essen 1991; Rouiller et al.
1991; Shi and Cassell 1997; Huang and Winer 2000; Linke and
Schwegler 2000), forming a termination zone complementary
to ascending afferents. Some individual cells, such as large layer
5 pyramidal cells, are positioned to integrate directly afferent
input from both sources, while other cells may participate in
this integration via local circuits.
Multimodal integration is an important example of co-
ordination between cortical areas as stimuli arising in the
natural world typically activate multiple sensory systems either
concurrently or in sequence. The influence of visual in-
formation on auditory processing has long been recognized.
For example, visual cues from a speaker effectively ‘‘amplify’’
speech sounds in noisy backgrounds (Sumby and Pollack 1954),
silent lipreading activates auditory cortical areas in humans
(Calvert et al. 1997), and conflicting visual information can alter
speech perception (McGurk and MacDonald 1976). All these
cases are examples of visual sensory input establishing an
expectation for subsequent auditory sensory stimulation, an
expectation that is likely mediated by descending cross-modal
cortical connections. The sites of multisensory integration have
attracted renewed interest in the last several years (Ghazanfar
and Schroeder 2006; Macaluso 2006; Driver and Noesselt
2008), and accumulating evidence suggests that primary
sensory cortex is an important locus (Fu et al. 2003; Ghazanfar
et al. 2005; Murray et al. 2005; Lakatos et al. 2007, 2009;
Martuzzi et al. 2007; Kayser et al. 2008; Liang et al. 2008). In
auditory cortex, it has been shown that somatosensory or visual
stimuli can modulate responses to the auditory stimuli, and this
modulation can be facilitative or suppressive depending on the
individual neuron and the context (Ghazanfar et al. 2005; Bizley
et al. 2007; Kayser et al. 2007, 2008; Lakatos et al. 2007).
Extrastriate visual cortex (V2) in rodents has been shown to
play a key role in coordinating multisensory integration
(Hirokawa et al. 2008), and previous reports demonstrate that
V2 projects to primary auditory cortex in rats, gerbils, and
ferrets (Miller and Vogt 1984; Budinger et al. 2006; Bizley et al.
2007; Smith et al. 2010).
Here, we show that neurons in V2 project to Au1 in mice in
a pattern typical of descending cortical projections, with dense
labeling in supragranular and infragranular layers. We also
provide evidence that these projections are preserved in brain
slices, enabling us to test their function using a calcium imaging
technique in which fluorescence signals are monitored
simultaneously in dozens of individually identified cells.
Stimulation of the WM in neocortical brain slices has been
� The Author 2011. Published by Oxford University Press. All rights reserved.
For permissions, please e-mail: [email protected]
Dow
nloaded from https://academ
ic.oup.com/cercor/article/21/11/2620/277575 by guest on 13 January 2022
shown previously to activate cells throughout the cortical
depth but in a horizontally restricted manner, with the
dimensions of this horizontal spread comparable to those of
a cortical column (Contreras and Llinas 2001). We show that
activation of V2 modulates responses of neurons in Au1 to WM
stimuli. This modulation primarily appears as summation but in
some cases can be suppressive, suggesting that inputs from V2
can activate both excitatory and inhibitory processes to control
columnar information flow in Au1.
Materials and Methods
All experimental protocols conformed to American Physiological
Society/National Institutes of Health (NIH) guidelines and were
approved by the University of Wisconsin Animal Care and Use
Committee.
Anterograde Labeling In VivoMale and female mice (postnatal days 60--160) were premedicated for
pain and intraoperative swelling with ketoprofen (5 mg/kg), anesthe-
tized with isoflurane (1--1.5% in 100% O2), and placed in a stereotaxic
apparatus (Kopf Instruments). Adequacy of anesthesia was determined
by response to toe pinch. Body temperature was maintained with
a heating pad (Equine Right Spot). The dorsal surface of the skull was
exposed via a midline skin incision and small craniotomies drilled to
allow access to underlying extrastriate cortex.
To study visual cortical projections to auditory cortex, biotinylated
dextran amine (BDA; molecular weight 10 000; Sigma-Aldrich) injec-
tions were made into medial (V2M) and lateral (V2L) extrastriate visual
cortex. Higher order extrastriate cortex surrounds primary visual
cortex, and the medial and lateral extrastriate regions have long been
identified as separate regions (Heumann et al. 1977). Studies suggest
the presence of distinct subregions within mouse medial and lateral
extrastriate cortex (Caviness 1975; Wagor et al. 1980; Olavarria and
Montero 1989; Wang and Burkhalter 2007); however, the number and
relative position of these areas within the visual cortical hierarchy
remain unclear. The stereotaxic coordinates and the terminology of
Franklin and Paxinos (2008) were used. V2L corresponds roughly to
regions V3 and V2 described by Wagor et al. (1980) and the
rostrolateral, anterolateral, lateral, and posterior regions described by
Wang and Burkhalter (2007). V2M is further subdivided by Franklin and
Paxinos (2008) into a medial and lateral portion, but these were
considered together as V2M for the purposes of this study. V2M
corresponds roughly to the posteromedial region described by Wagor
et al. (1980) and the ventromedial regions and part of V2 described by
Wang and Burkhalter (2007). For V2L injections, a craniotomy was
drilled between 2.5 and 4.5 mm caudal to bregma and 3--3.5 mm lateral
to the midline. For V2M injections, a craniotomy was drilled between
2.5 and 4.5 mm caudal to bregma and 1.5 mm lateral to the midline.
There was considerable variability in the distance between lambda and
bregma landmarks in these mice. Successfully placed injections were
confirmed histologically.
A glass electrode (outer tip diameter of 20--30 lm) filled with 6%
BDA in saline was visually guided to the exposed surface of the cortex
and manually advanced 500 lm into the brain. BDA was injected
iontophoretically (5--7 lA anodal current: 7 s on, 7 s off) for 10--15 min.
The electrode was left in place for an additional 10 min and withdrawn.
Postinjection ProcessingThe wound was sutured and treated with a broad spectrum antibiotic
and lidocaine and the animal monitored daily for signs of discomfort or
infection. Ketoprofen (5 mg/kg q12 h intraperitoneally) was adminis-
tered postoperatively for pain. Five to 7 days after surgery, animals were
deeply anesthetized with sodium pentobarbital (90 mg/kg) and
perfused intracardially with 100--200 mL of 0.9% phosphate-buffered
saline (PBS) followed by 300--500 mL of a 3% paraformaldehyde/1%
glutaraldehyde solution in 0.1 M sodium phosphate buffer (pH 7.4).
Brain tissue was processed using methods described previously
(Smith et al. 2010). The tissue was refrigerated for 1 h and the brain
removed and placed in the same fixative overnight. Coronal sections
(70 lm thick) were made using a vibrating microtome, and the tracer
was visualized using the diaminobenzidene-nickel/cobalt intensifica-
tion method (Adams 1981). Sections were rinsed in phosphate buffer
and inspected with a light microscope to determine whether the gross
injection had successfully labeled axons in auditory cortex. Some of the
sections containing terminals were selected to be processed for electron
microscopy (EM). Sections not selected for EM were mounted on slides
and dehydrated. Half of these sections were stained with cresyl violet
and coverslipped, while the other half were coverslipped unstained.
High--molecular weight BDA (10 000) is primarily an anterograde
marker that yields fine labeling of abundant numbers of axons and
terminals (Reiner et al. 2000). Nevertheless, retrograde labeling in
locations distant to the injection site can occur. Following 2 BDA
injections in V2L and 2 injections in V2M, all 4 of which were confined
to layers 2--6 and did not invade the underlying WM, we observed
dozens of retrogradely labeled cells in visual cortex, but only 2 faintly
labeled cells in Au1 and no retrogradely labeled cells were observed in
the thalamus or brainstem regions. Thus, while we cannot completely
rule out the possibility of some retrograde labeling of axons in the data
presented, such labeling is unlikely to affect these findings significantly.
Those sections selected for EM analysis were fixed in 0.5% osmium
tetroxide, rinsed in buffer, and dehydrated through a series of graded
alcohols and propylene oxide. Sections were then placed in unaccel-
erated Epon--Araldite resin and transferred into a fresh batch of
unaccelerated resin overnight. The sections were then embedded and
flat mounted between weighted coated slides and allowed to cure. The
portion of the embedded section containing the auditory cortex was
isolated from the rest of the section and mounted on a beam capsule. A
camera lucida drawing of the flat mounted tissue was made noting the
locations of the labeled axons/terminals and nearby fiduciary struc-
tures. Thin sections of 70--80 nm were then cut and mounted on grids.
GABA Postembedding Immunogold LabelingAn affinity-isolated c-aminobutyric acid (GABA) antibody conjugated to
bovine serum albumin (BSA; Sigma-Aldrich, Catalog No. A2052) was
used to evaluate the GABAergic nature of cortical structures. The thin
section, mounted on a nickel grid, was carefully immersed in solution A
(0.745 g Tris buffer, 0.9 g NaCl, 0.1 mL Triton X in 100 mL dH2O, pH
7.6) and 5% BSA for 30 min then in solution A and 1% BSA for 5 min
then in solution A and 1% BSA containing the GABA antibody at 1:250
dilution at room temperature overnight. The following day the section
was rinsed in solution A and 1% BSA twice for 5 min and once for 30
min then rinsed in solution B (0.688 g Tris buffer, 0.9 g NaCl, 0.1 mL
Triton X in 100 mL dH2O, pH 8.2) for 5 more minutes. The section was
then immersed in the secondary antibody (goat anti-rabbit immuno-
globulin G with attached 15 nm gold particles) diluted 1:25 in solution
B (pH 8.2) for 1 h and rinsed twice in solution A and twice in distilled
water. After that they were fixed in 8% glutaraldehyde, rinsed in
distilled water, and then counterstained with uranyl acetate and lead
citrate and rinsed again. Sections were examined using a Philips CM120
electron microscope. For control sections, the primary antibody step
was eliminated.
Analysis of Axon Projection and Terminal Distribution, LightMicroscopyCare was taken to ensure that injections did not spread to the
underlying WM. In cases in which the injection site was observed to
have involved the WM, the experiments were rejected and the data not
analyzed further. As an additional check, we observed no cell bodies
labeled in the auditory or visual thalamus following any of the included
injections. Labeled axons were plotted by means of a camera lucida
attachment under dark field or bright field optics on a Leitz Orthoplan
microscope. All labeled axon processes in a section of tissue were
incorporated. High-power (3313) camera lucida reconstructions were
then digitally scanned and final figures prepared using Adobe Photoshop.
Primary auditory cortex is defined anatomically by its distinctive
cytoarchitecture as well as its strong input into intermediate layers
from the ventral medial geniculate nucleus of the thalamus. Based on
previous studies in mouse (Caviness 1975; Wree et al. 1983; Stiebler
Cerebral Cortex November 2011, V 21 N 11 2621
Dow
nloaded from https://academ
ic.oup.com/cercor/article/21/11/2620/277575 by guest on 13 January 2022

et al. 1997; Cruikshank et al. 2001) and its homology to the rat (Zilles
and Wree 1985; Roger and Arnault 1989), primary auditory cortex in
mouse is characterized histologically by its thickness and the relatively
specific differentiation of its cortical layers including a thick and dense
granule cell layer, in contrast to adjacent auditory cortical regions.
Anatomically defined primary auditory cortex includes the (histolog-
ically defined) area Au1 designated by Franklin and Paxinos (2008),
whose terminology is used here. Anatomically defined primary auditory
cortex corresponds roughly to physiologically defined regions AAF and
A1 described by Stiebler et al. (1997), but unfortunately the
correspondence between anatomically defined and physiologically
defined subregions is unclear (e.g., there is no generally accepted
anatomical subregion corresponding to A1). Because our imaging and
electrophysiological recording experiments were performed in brain
slices, we refer to the targeted region by its anatomical moniker, that is,
Au1, which we could actually confirm post hoc, rather than its
physiological moniker, that is, A1, which we would have no way of
confirming absent prior electrophysiological recordings in vivo.
To evaluate the distribution of labeled terminals, a high-power
(31000) camera lucida drawing of a narrow strip of primary auditory
cortex was made from the cortical surface to the WM below layer 6. All
en passant and en terminaux swellings on labeled axons in this cortical
strip were represented on the drawing. Cortical layer boundaries were
then added to the drawings, and the number of terminals in each
cortical layer was counted.
Analysis of Axon Terminals and Their Postsynaptic Targets, EMFor analyzing BDA-labeled axon terminals in auditory cortex arising
from V2L, the following procedure was established. A given thin section
was manually scanned at 310 000. After identifying a labeled synaptic
terminal, based on the presence of vesicles presynaptically and
a postsynaptic thickening of the membrane apposed to the terminal,
a photo of the terminal was taken at 329 000 and its exact location
noted on a 3200 camera lucida drawing that had been made of the
block face prior to sectioning. Using the 329 000 image, measurements
of the labeled terminal and its postsynaptic target were made for each
synapse using The NIH Image/J 1.60 software. Other terminal features
were also noted.
In GABA immunogold--labeled material, the ‘‘background’’ gold
particle density was calculated for each thin section to account for
possible processing differences between sections. Axon terminals or
their postsynaptic targets were considered GABAergic if their particle
density exceeded the mean gold particle density of the background by
5 times. Background density was measured over non-GABAergic
structures such as blood vessel lumens, glial cells, etc.
Retrograde Labeling In VivoTo determine the boundaries of auditory cortex in brain slice
experiments, in some animals layer 5 cells in auditory cortex projecting
to inferior colliculus (IC) were retrogradely labeled by injecting
fluorescent microspheres into IC (Katz et al. 1984; Christophe et al.
2005). Injections into IC were large and invaded all subdivisions of the
central nucleus as well as the external cortex, which should label layer
5 pyramidal cells throughout auditory cortex (Herbert et al. 1991;
Doucet et al. 2003). Surgical techniques were identical to those
described above for BDA injections, except the craniotomy was located
immediately posterior to lambda 1.25 mm off the midline. A glass
electrode (outer tip diameter of 20--30 lm) was loaded with ~1 lL red
fluorescent beads (Lumaflor) suspended in distilled water. The
electrode was visually guided to the exposed surface of the IC and
manually advanced 500 lm into the brain. The beads were injected via
pressure injection (Picospriter, 10--20 psi, 5--20 ms, 10--20 pulses over
1--2 min). The electrode was left in place for an additional 5 min and
withdrawn. The wound was sutured and animals recovered as for BDA
injections above. Tissue was harvested for brain slice experiments >48h after gross injections.
Brain Slice PreparationMale and female CBA/J mice (postnatal days 21--48) were decapitated
under isoflurane anesthesia, and the brains were extracted and
immersed in artificial cerebrospinal fluid (ACSF; composed of [in mM]
126 NaCl, 26 NaHCO3, 1.8 KCl, 2.1 CaCl2, 1.4 MgSO4, 1.2 KH2PO4, and
10 glucose) at 0--4 �C. Slices (450 lm) were obtained from both
hemispheres using standard techniques. We observed that the most
consistent responses to V2L stimulation were observed in slices cut
~15 degrees off the coronal plane, with the dorsal edge of the slice
caudal to the ventral edge. Slices were maintained in ACSF saturated
with 95% O2/5% CO2 at 24 �C for >1 h before transfer to the recording
chamber, which was perfused at 3 mL/min with ACSF at 34 �C. Au1 and
V2L were identified based on their position relative to the rhinal sulcus,
midline, and hippocampus, as in previous studies (Metherate and
Cruikshank 1999; Cruikshank et al. 2002; Paxinos and Franklin 2003;
Verbny et al. 2006), and these locations were confirmed post hoc by
fixing slices, staining with cresyl violet, and examining via light
microscopy. In some experiments, identifying the boundary between
V2L and auditory cortex was aided by prelabeling layer 5 pyramidal
cells in auditory cortex with fluorescent latex microspheres injected
into IC as described above (Christophe et al. 2005). Labeling was
restricted to a band of cells in layer 5 that ran dorsoventrally for
a distance of approximately 1--2 mm, consistent with known
projections of layer 5 cells of auditory cortex to IC (Herbert et al.
1991; Doucet et al. 2003) and the published location of auditory cortex
(Paxinos and Franklin 2003). In these slices, the location of V2L was
inferred by the abrupt cessation of labeled cells at the border of
auditory and visual cortical areas. Cortical layers were identified by
depth relative to the pial surface (Cruikshank et al. 2002; Verbny et al.
2006). We further used the tissue appearance under bright field
illumination to identify the approximate borders between cortical
layers. Layers 4 and 5B had a relatively dark appearance compared with
the light colored bands of layers 3, 5A, and 6.
Anterograde Labeling In VitroBiocytin (1% in ACSF) was loaded into a glass pipette (1.7 mm outer
diameter, tip diameter 5--10 lm) and applied to layers 3 and 5 in V2L via
pressure injection (5--10 psi, 0.1 s, 3 pulses). The boundaries of V2L
were determined from a published stereotaxic atlas (Franklin and
Paxinos 2008). Following injections, slices were held at room
temperature in ACSF bubbled with 95% O2/5% CO2 for 4 h, then fixed
overnight in 4% paraformaldehyde. Slices were then processed for
biocytin staining. Fixed slices were washed in 0.01 M PBS, then
incubated in 0.5% H2O2 in PBS, then rinsed again for 30 min in 0.01 M
PBS. Slices were then incubated overnight in the secondary antibody to
the avidin--biotin--horseradish peroxidase (HRP) complex (ABC Kit,
Vector Labs) in PBS with 0.3% Triton X-100 and 2% BSA. On the second
day, the slices were rinsed in 0.1 M PBS, and the HRP was reacted using
0.04% diaminobenzidine with dimethyl sulfoxide (DMSO) and nickel/
cobalt intensification. A 0.01% H2O2 in 0.1 M PBS was then added for 15
min, then the slices were rinsed for 40 min in PBS and mounted on
slides and allowed to air-dry. The mounted sections were then stained
with cresyl violet and coverslipped.
Extracellular Electrophysiological RecordingsExtracellular field potentials were recorded using patch pipettes
fabricated from borosilicate glass (KG-33; 1.7 mm outer diameter; 1.1
mm inner diameter; Garner Glass) using a Flaming--Brown 2-stage puller
(P-87; Sutter Instruments). The tips of the pipettes were broken under
visual control to an outer tip diameter of 10--15 lm and had open-tip
resistances of 0.5 MX when filled with ACSF. Data were amplified
(MultiClamp-700A; Molecular Devices), low-pass filtered (10 kHz),
digitized (20 kHz; DigiData 1322A; Molecular Devices), and recorded
using pClamp version 9.2 (Molecular Devices).
Patch-Clamp ElectrophysiologyCells were visualized using a video camera (Oly110; Olympus)
connected to the upright microscope (Olympus BX60-WI) with a long
working-distance water-immersion objective (Olympus 340, 0.9
numerical aperture (N.A.)) and differential interference contrast optics.
In some experiments, we chose cells that responded to stimulation in
WM or V2L with [Ca] transients. In these cases, the cell was identified
2622 Extrastriate Modulation of Activity in Au1 d Banks et al.
Dow
nloaded from https://academ
ic.oup.com/cercor/article/21/11/2620/277575 by guest on 13 January 2022
under fluorescence microscopy and then localized for patch-clamp
recording using simultaneous light and fluorescence microscopy before
switching to differential interference contrast (DIC). In other experi-
ments, cells were selected based on their location and healthy
appearance under DIC optics. Patch pipettes were fabricated from
borosilicate glass as for extracellular recordings. Tip shape and diameter
were adjusted to give open-tip resistances of 2--4 MX so that access
resistances of <20 MX may be readily achieved. Pipettes were filled
with (mM) KGluc 140, NaCl 10, ethyleneglycol-bis(2-aminoethylether)-
N,N,N#,N#-tetra acetic acid 0.1, MgATP 2, 4-(2-hydroxyethyl)-1-
piperazineethanesulfonic acid 10, pH 7.2. Pipettes were mounted
and positioned using an integrated, motorized 4-dimensional
translation system (Siskiyou Inc.). Tight-seal whole-cell recordings
were obtained as described previously (Merriam et al. 2005).
Electrophysiological signals were recorded as for extracellular data
above.
Fiber StimulationAfferents were activated using pairs of tungsten electrodes (0.1 MX, 75lm diameter; FHC Inc.) cemented together at tip separations of ~50--200 lm with dental acrylic and wax. Stimuli were applied to the WM
just deep to the imaged area in auditory cortex. In extracellular
recordings of local field potentials (LFPs; not shown), these stimuli
activated a vertical strip of tissue from layer 6 to layer 1 and this
activation was restricted to ~250 lm on either side of the electrode in
the lateral (i.e., horizontal dimension), similar to previous reports
(Contreras and Llinas 2001). A second set of stimulating electrodes was
placed in V2L in layer 5. Stimuli (100 ls, 10--250 lA) were applied using
constant current stimulus isolation units (A365, WPI Inc.) and consisted
of either single pulses or brief trains (2--20 pulses, 40 Hz).
Ca Imaging: Cell LoadingCells were loaded with the membrane-permeant form of the calcium-
indicator dye Oregon Green BAPTA-1 (OGB-1 acetoxymethyl (AM)
ester form; Invitrogen) using the multicell bolus loading technique
(Stosiek et al. 2003; Kerr et al. 2005). In this technique, pressure
injection of the dye at high concentration into the tissue preferentially
labels neurons (vs. glial cells) in a spherical area ~100--200 lm in
diameter. Intracellular fluorescence rises to a stable level within an
hour and remains stable for > 4 h after reaching this plateau. Multiple
sequential injections in the slice allowed for a series of imaging
experiments to be performed in the same slice over a 10-h period.
Imaging data presented here represent responses of cells in layers 3--6;
however, the majority of cells were imaged in layer 5. Specific loading
details are as follows. OGB-1 AM was dissolved in DMSO containing 20%
pluronic acid to a dye concentration of 5 mM. Loading pipettes were
fabricated from borosilicate glass (KG-33; 1.7 mm outer diameter, 1.1
mm inner diameter; Garner Glass) using a Flaming--Brown 2-stage puller
(P-87; Sutter Instruments). Pipettes had outer tip diameters of ~2 lmand were filled with <1 lL of the dye solution. The solution was applied
to the tissue using pressure injection (Picospitzer II; General Valve;
5--10 psi, 1--10 s pulses over 1--2 min) at a depth of 50 lm. After
injection, the location of the injection site was recorded using captured
still images and the pipette retracted from the tissue. Four or 5
injections were typically made over a period of 30--60 min. An
additional 30--60 min were allowed for background dye to be washed
away and intracellular fluorescence to stabilize.
Ca Imaging: Data CollectionA spinning disk confocal microscope (Olympus BX-61 DSU) with
excitation filter 480--510 nm and emission filter 495--595 nm (Chroma
U-N41026/C67083) and a 340 (Olympus LUMPlanFL/IR, N.A. = 0.8,
field of view diameter = 200 lm), 320 (Olympus UMPlanFL, N.A. = 0.5,
field of view diameter = 400 lm), or 310 (Olympus UMPlanFL, N.A. =0.3, field of view diameter = 800 lm) water-immersion objective was
used for imaging experiments. Images were captured at 10--50
frames/s with a cooled CCD camera (Hamamatsu C9100) using
SimplePCI software (v6.1; Hamamatsu Corp.). Typically, data were
collected for 20--60 s in a 3-condition sequence in which stimuli were
applied to the WM, then to V2L, and then to V2L and WM in
combination, with 5--10 s between stimuli.
Ca Imaging: Data AnalysisIndividual cellswere localizedwithin the cortical layers by comparison to
bright field still images and their activity measured as change in relative
fluorescence (%DF/F) over time. Using this technique, we could identify
typically 70--100 cells at340 in an imaged field. Cells from this population
were targeted for further analysis by computing a responsemap for each
stimulus event—the difference between the average image florescence
during the 2 s following the stimulus and the average image florescence
2 s before the stimulus. Areas of increased florescence identified in this
way almost always corresponded to labeled cells identified in the average
images from the full movie. This initial preselection process was liberal;
any cell in which a response was detected (see below) to even a single
stimulus event was selected for further analysis. More stringent
quantitative criteria described belowwere applied to identify responsive
cells, which comprised roughly one-third of the preselected sample.
Fluorescence signals from identified cells were analyzed using
custom software written in Matlab (Mathworks). Responses to afferent
stimulation were detected as follows. A peak detection algorithm
calculated the difference in amplitude of the fluorescence signal
between 2 windows separated by a user-defined time period (typically
1 s) and compared this difference with the standard deviation (SD) of
the difference signal calculated over the previous 2 s. The algorithm
detected a peak when the difference signal exceeded its SD by a factor
of 2-fold for at least 0.2 s. If no peak was detected within a response
window of 2 s following afferent stimulation, the magnitude of the
fluorescence signal corresponding to this ‘‘failure’’ was calculated as the
mean fluorescence signal within that response window.
To determine whether stimulation in V2L modulates the responses of
cells to WM stimulation, we compared quantitatively the responses to
paired stimulation (RPr) versus WM alone (RWM). Because we typically
recorded only 3 or 4 responses to each stimulus in a given cell, using
paired t-tests corrected for multiple comparisons for >1400 cells leads
to an overly conservative estimate for the number of significantly
affected cells. Instead, we employ a local false discovery rate method
originally described by Efron (2004) that is particularly well suited to
large-scale multiple hypothesis testing. We computed the ratio of the
paired response to the WM response for each cell (RPr/RWM), yielding
an estimate of this data distribution based on our population of 1417
cells. The null hypothesis for each cell is that this ratio would be unity,
that is, there is no difference between RPr and RWM. Any deviation from
unity is due to 2 sources of variability: 1) trial-by-trial variability in the
WM response and 2) a significant effect of the preceding V2L stimulus
on the WM response. We wish to separate these 2 sources of variability
so that we can estimate the proportion of cells whose WM responses
are significantly affected by V2L stimulation. Our assumption is that
ratios close to unity are not significant, while those far from unity are
significant; the question is where to draw the line. The local false
discovery rate method takes the ratio of the observed data distribution,
which is a mixture of the significant data points and an underlying null
distribution (the latter representing the WM trial-by-trial variability), to
an estimate of the null distribution. Those responses whose frequency
of observation is far more common in the data distribution than in the
null distribution are considered significant.
We compared the number of cases in each bin of the data distribution
with the number of cases in that bin of the null distribution. Bins for
which the number of observed data cases was more than 5 times that
expected from the null distribution were considered to be significant;
cells whose magnitude of RPr/RWM lie within that bin were flagged in the
plots of Figure 13B,C. The critical value of the ratio, here chosen to be
0.2, is an upper bound on the percentage of cells identified as significant
that are in fact not (false positives). This misidentification arises due to
the overlap of the 2 distributions; for example, in Figure 13A, the first
significant bin to the left of unity has a number of null observations as
well, which would be falsely identified as significant. This can also work
the other way; for example, in the next bin closer to unity, there are
likely a number of significant cells that did not fall within the criterion
for significance. (Note that this criterion does not imply that 20% of the
entire data set would be expected to be falsely identified as significant.)
Cerebral Cortex November 2011, V 21 N 11 2623
Dow
nloaded from https://academ
ic.oup.com/cercor/article/21/11/2620/277575 by guest on 13 January 2022
To estimate the null distribution, we used the responses to WM
stimulation alone as follows. For each cell with NTrial WM responses (or
failures), we took all combinations of NTrial/2 responses and computed
all permutations of the ratio of the means of these subsets. For example,
if there were 4 responses, R1, R2, R3, R4, we computed mean(R1, R2)/
mean(R3, R4), mean(R1, R3)/mean(R2, R4), etc. The null distribution was
composed of all these ratio values. For the null distribution, we only
included cells for which there were at least 4 WM responses and in
which there was a detected WM response (i.e. non-failure) on at least
one trial (327 of 1417 cells). The estimated null distribution matched
closely the central portion (i.e., the portion centered on unity ratio) of
the observed data distribution (see Results and Fig. 13A), consistent
with our intuition that those cells with ratios close to unity are not
significantly affected by V2L stimulation, while those cells in the tails
are significantly affected.
Responses to paired WM and V2L stimulation (RPaired) were
compared with responses to WM stimulus alone (RWM) by computing
the difference RPaired – RWM. Values <0 indicated suppression of the
response to WM by V2L stimulation, while values >0 indicated
summation of responses to V2L and WM stimulation.
Solutions and DrugsAll reagents not specified above were obtained from Sigma-Aldrich.
Digital Processing of ImagesDigitized light-level photomicrographs were acquired with a Spot
camera (Diagnostic Instruments) mounted on a Nikon Eclipse E600
microscope using a 340 oil objective, dark field illumination or bright
field illumination with Nomarski optics. The final figures were prepared
using Adobe Photoshop, and tonal adjustments were applied across the
entire image (curves, contrast, and unsharp mask functions) with no
further manipulations.
Results
Projections from V2 to Au1 in Mouse—In Vivo and InVitro Anterograde Labeling
Previous studies have suggested that in rats, extrastriate visual
cortex sends a projection to primary auditory cortex (Miller
and Vogt 1984; Smith et al. 2010). We confirmed that an
equivalent projection is observed in mice using anterograde
labeling studies in vivo and in vitro.
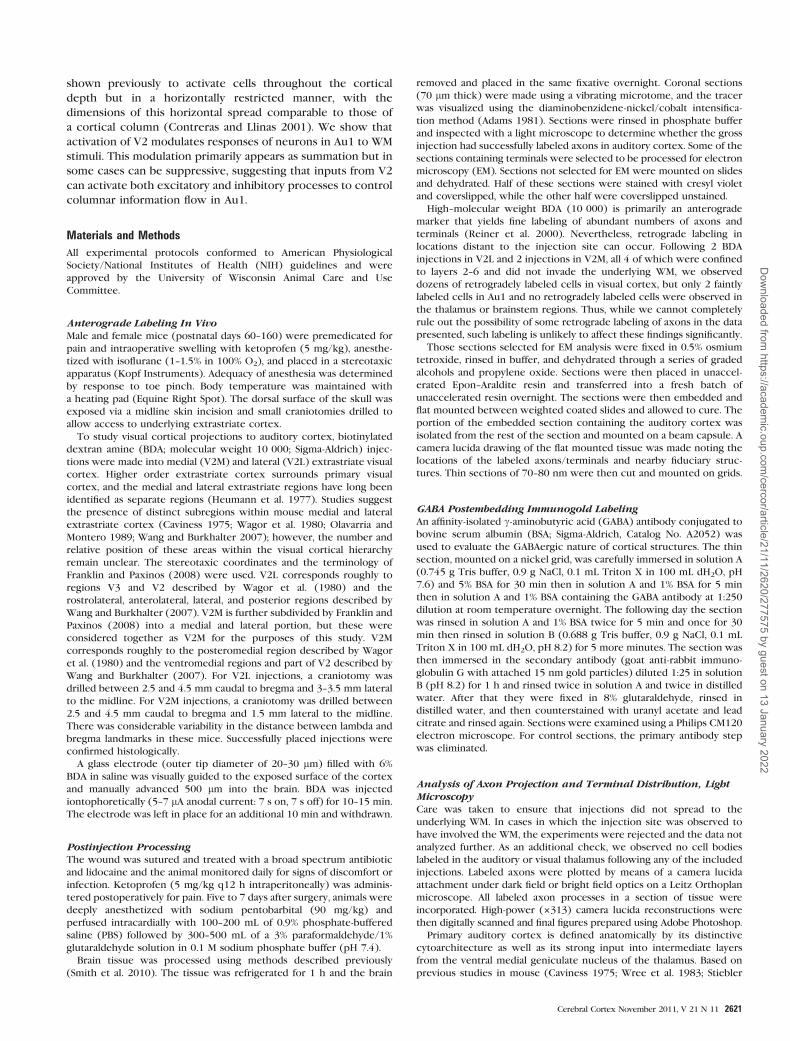
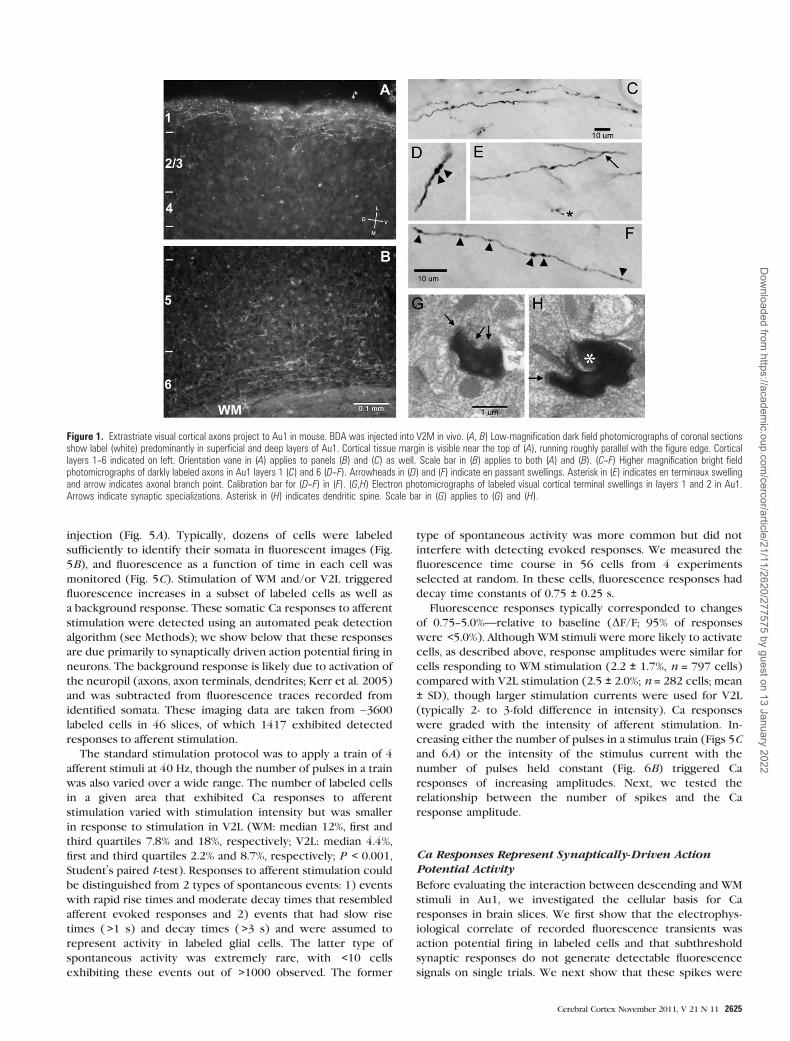
We made injections of BDA into extrastriate visual cortical
areas both medial (V2M; n = 2) and lateral (V2L; n = 2) to
primary visual cortex in vivo (Fig. 1). As previously described in
rat (Miller and Vogt 1984), labeled visual cortical axons were
found in Au1 primarily in superficial and deep layers (Fig. 1A,B).
Closer inspection of these axons (Fig. 1C--F) revealed both en
passant (Fig. 1D,F, arrowheads) and en terminaux (Fig. 1E,
asterisk) swellings. Labeled swellings observed with the
electron microscope (Fig. 1G,H) form synapses on small
dendrites and dendritic spines. In a small population (n = 9)
of these swellings inspected at the electron microscopic level
in tissue labeled with a GABA antibody (not shown), most (8/9)
were presynaptic to GABA immunonegative structures, sug-
gesting that the projection from V2 terminates primarily on
non-GABAergic dendrites, consistent with our previous find-
ings (Smith et al. 2010).
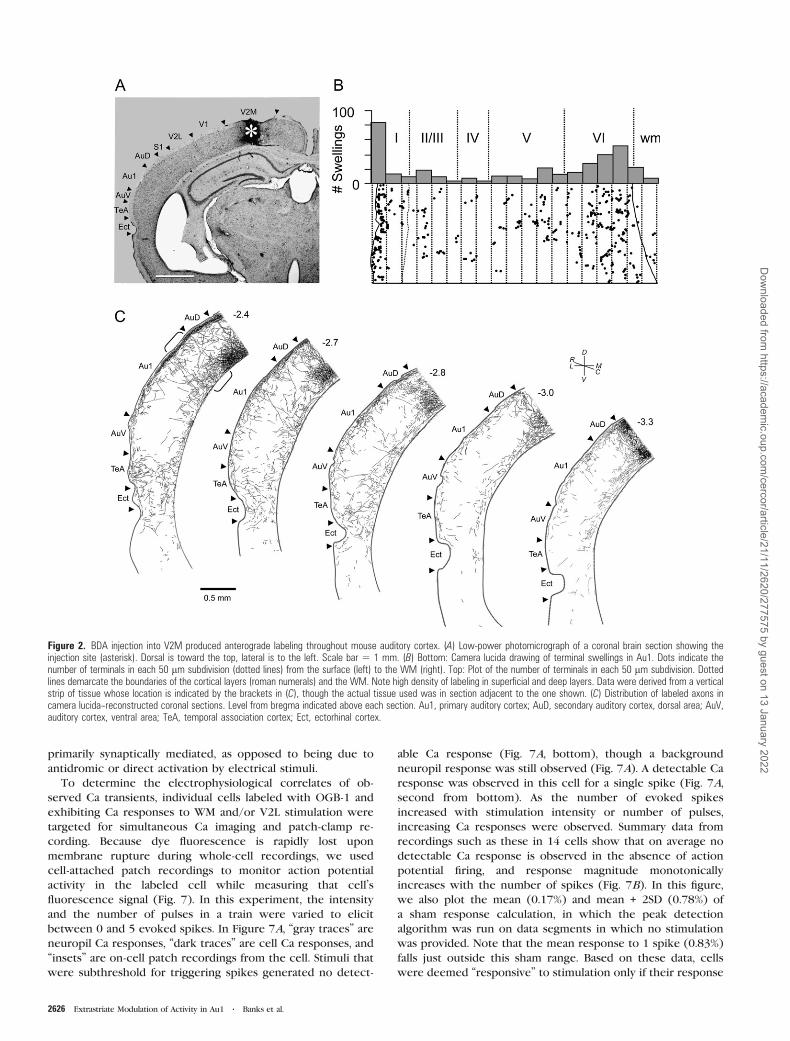
A more quantitative evaluation of these terminals is seen in
Figures 2 and 3. Figure 2A shows an injection site localized to
V2M (asterisk). The distribution of axonal swellings across
layers in a strip of primary auditory cortex (Fig. 2C, brackets)
resulting from this injection is shown in Figure 2B. The
majority of terminals are concentrated in layers 1 (29.6% of
total terminals) and 6 (43.4%) with the fewest in layers 4 (3.6%)
and 2/3 (8.0%). The layer 1 terminals are concentrated in the
superficial half of the layer. Figure 2C illustrates that the visual
cortical innervation extends for a considerable distance
rostrocaudally and that the inputs extend into other cortical
areas as well.
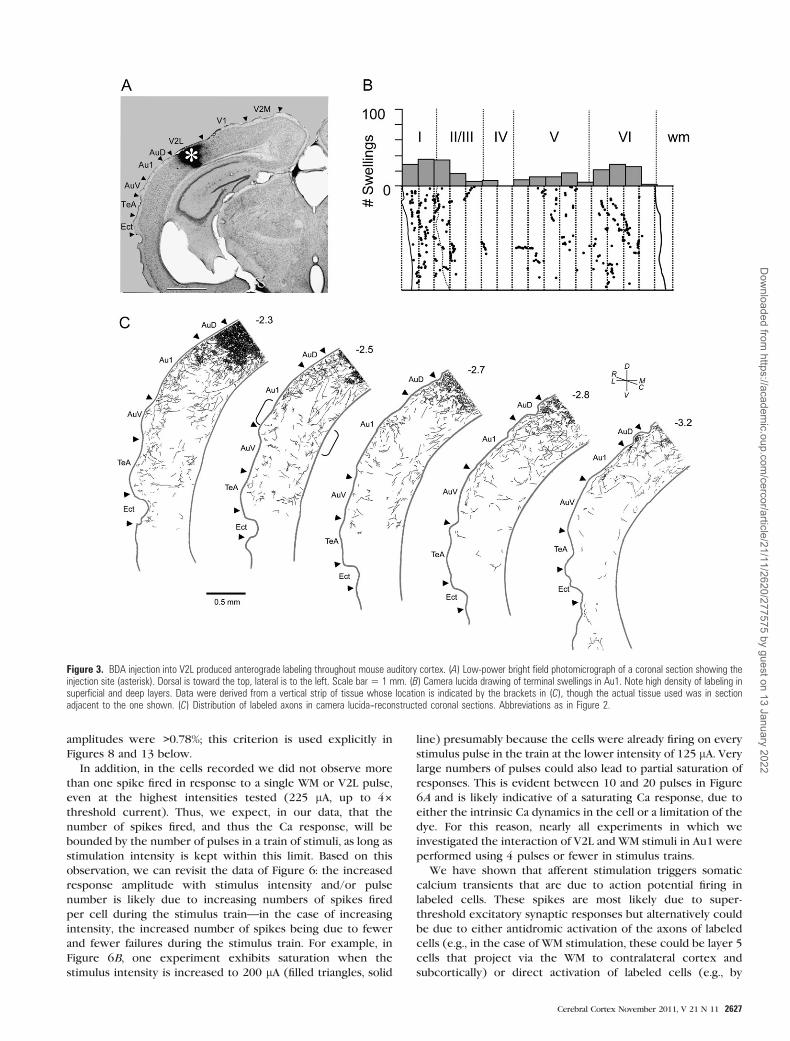
A similar injection confined to V2L (Fig. 3A, asterisk) also
labels corticocortical inputs to Au1. The distribution of
labeled corticocortical axons (Fig. 3C) extends across the
auditory cortical laminas rostrocaudally but largely avoids
layer 4. The terminal distribution of this projection is similar
in some ways to the V2M input with the majority of terminals
concentrated in layers 1 (29.7%) and 6 (29.7%) and the fewest
in layer 4 (2.6%). However, unlike the projection from V2M,
terminals originating in V2L are distributed throughout layer 1
and in addition provide a moderately strong innervation of
layers 2 and 5. Thus, medial and lateral extrastriate visual
cortical inputs to primary auditory cortex are in the form of
a feedback connection (Felleman and Van Essen 1991) with
terminals ending primarily in superficial and deep layers.
Following injections into V2, numerous retrogradely labeled
cells were observed in V1 and in the other V2 area (e.g., in
V2M for a V2L injection), but we almost never observed
retrogradely labeled cells in Au1 (2 cells in 1 injection and
none in 3 other injections). Thus, the connection from V2 to
Au1 does not appear to be reciprocal. The 2 retrogradely labeled
cells in Au1 were labeled lightly with no evidence of labeled axon
collaterals in Au1. Thus, the terminal distributions in auditory
cortex reflect the projection from V2 without contamination by
terminals originating in retrogradely labeled cells.
These experiments indicated that visual cortical cells and
their auditory cortical projections and terminations could be
located at nearly the same rostrocaudal level, suggesting that
a coronal brain slice should contain intact connections from
visual to auditory cortex. In practice, we found that a section
15 degrees off of coronal, with the dorsal surface of the slice at
a more caudal level, preserved the connections from V2L to
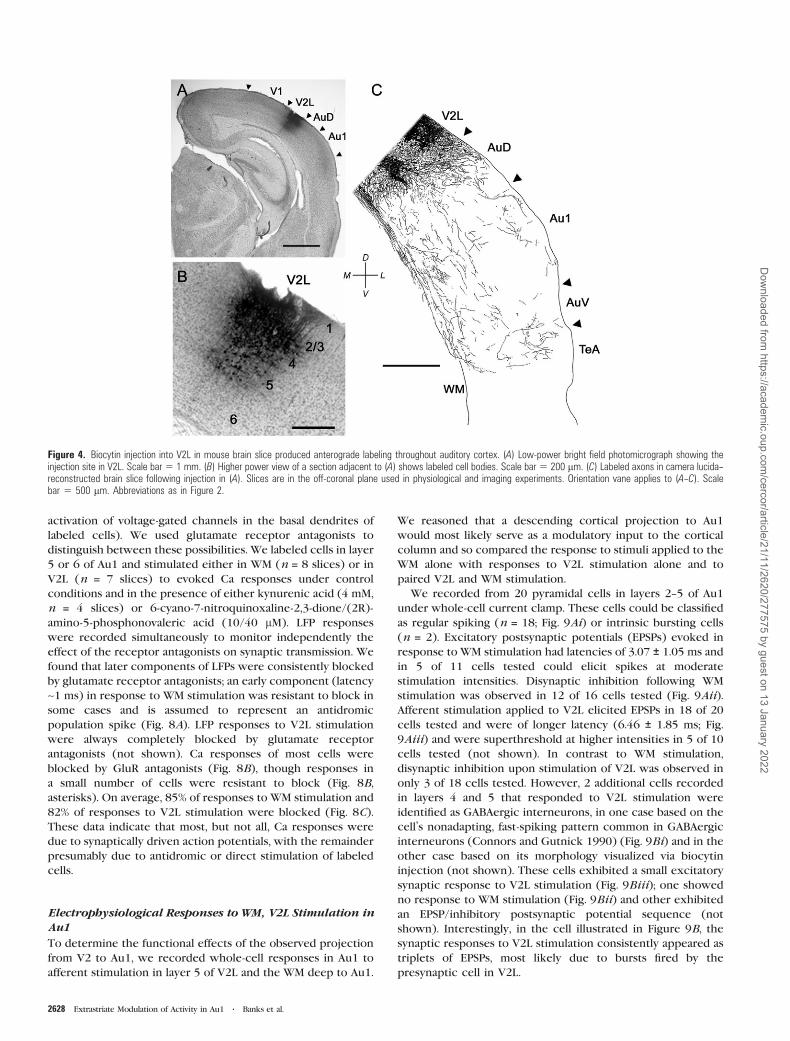
Au1 most consistently. To verify this, we made biocytin
injections into V2L in these off-coronal brain slices containing
Au1 (Fig. 4). Gross injections into V2L (Fig. 4A,B) labeled cell
bodies and axons that projected to Au1 (Fig. 4C). Also note
that in 5 slices in which gross injections into V2L were
performed, only one retrogradely labeled cell in Au1 was
observed, consistent with the results of gross injections in vivo
presented above, though numerous such cells were observed
in V1 and V2M. Thus, as in other species where at best a weak
reciprocal projection from Au1 to V2L has been reported
(Miller and Vogt 1984; Falchier et al. 2002; Rockland and Ojima
2003; Budinger et al. 2006; Bizley et al. 2007; Hall and Lomber
2008; Meredith et al. 2009), this connection is likely to be
minor in the mouse.
Monitoring Activity in Au1 Using Calcium Imaging
We have presented anatomical evidence for a descending
cortical projection from V2 to Au1. We next used calcium
imaging and electrophysiological techniques to determine the
functional effect of this projection on cells in Au1 by
monitoring responses to stimuli applied to the WM alone or
in combination with stimulation in V2L. Data from
electrophysiological recordings will be presented below.
Neurons in layers 3--6 of Au1were labeledwith themembrane-
permeable form of the calcium dye OGB-1 using pressure
2624 Extrastriate Modulation of Activity in Au1 d Banks et al.
Dow
nloaded from https://academ
ic.oup.com/cercor/article/21/11/2620/277575 by guest on 13 January 2022
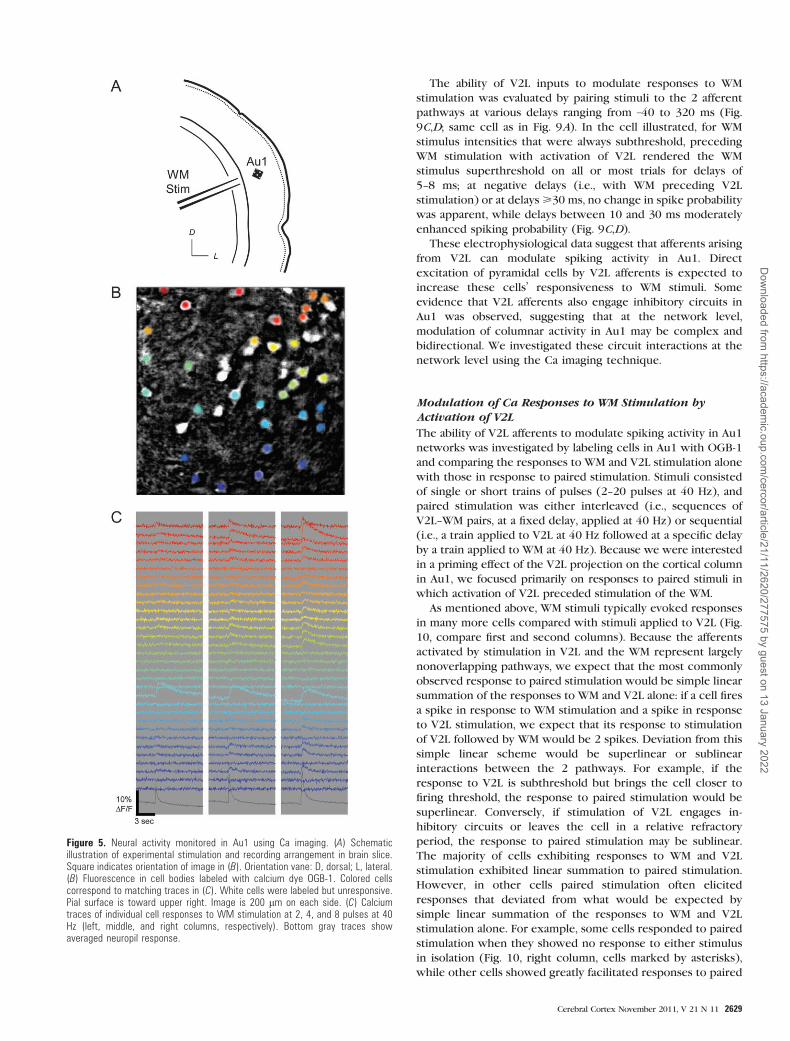
injection (Fig. 5A). Typically, dozens of cells were labeled
sufficiently to identify their somata in fluorescent images (Fig.
5B), and fluorescence as a function of time in each cell was
monitored (Fig. 5C). Stimulation of WM and/or V2L triggered
fluorescence increases in a subset of labeled cells as well as
a background response. These somatic Ca responses to afferent
stimulation were detected using an automated peak detection
algorithm (see Methods); we show below that these responses
are due primarily to synaptically driven action potential firing in
neurons. The background response is likely due to activation of
the neuropil (axons, axon terminals, dendrites; Kerr et al. 2005)
and was subtracted from fluorescence traces recorded from
identified somata. These imaging data are taken from ~3600labeled cells in 46 slices, of which 1417 exhibited detected
responses to afferent stimulation.
The standard stimulation protocol was to apply a train of 4
afferent stimuli at 40 Hz, though the number of pulses in a train
was also varied over a wide range. The number of labeled cells
in a given area that exhibited Ca responses to afferent
stimulation varied with stimulation intensity but was smaller
in response to stimulation in V2L (WM: median 12%, first and
third quartiles 7.8% and 18%, respectively; V2L: median 4.4%,
first and third quartiles 2.2% and 8.7%, respectively; P < 0.001,
Student’s paired t-test). Responses to afferent stimulation could
be distinguished from 2 types of spontaneous events: 1) events
with rapid rise times and moderate decay times that resembled
afferent evoked responses and 2) events that had slow rise
times ( >1 s) and decay times ( >3 s) and were assumed to
represent activity in labeled glial cells. The latter type of
spontaneous activity was extremely rare, with <10 cells
exhibiting these events out of >1000 observed. The former
type of spontaneous activity was more common but did not
interfere with detecting evoked responses. We measured the
fluorescence time course in 56 cells from 4 experiments
selected at random. In these cells, fluorescence responses had
decay time constants of 0.75 ± 0.25 s.
Fluorescence responses typically corresponded to changes
of 0.75--5.0%—relative to baseline (DF/F; 95% of responses
were <5.0%). Although WM stimuli were more likely to activate
cells, as described above, response amplitudes were similar for
cells responding to WM stimulation (2.2 ± 1.7%, n = 797 cells)
compared with V2L stimulation (2.5 ± 2.0%; n = 282 cells; mean
± SD), though larger stimulation currents were used for V2L
(typically 2- to 3-fold difference in intensity). Ca responses
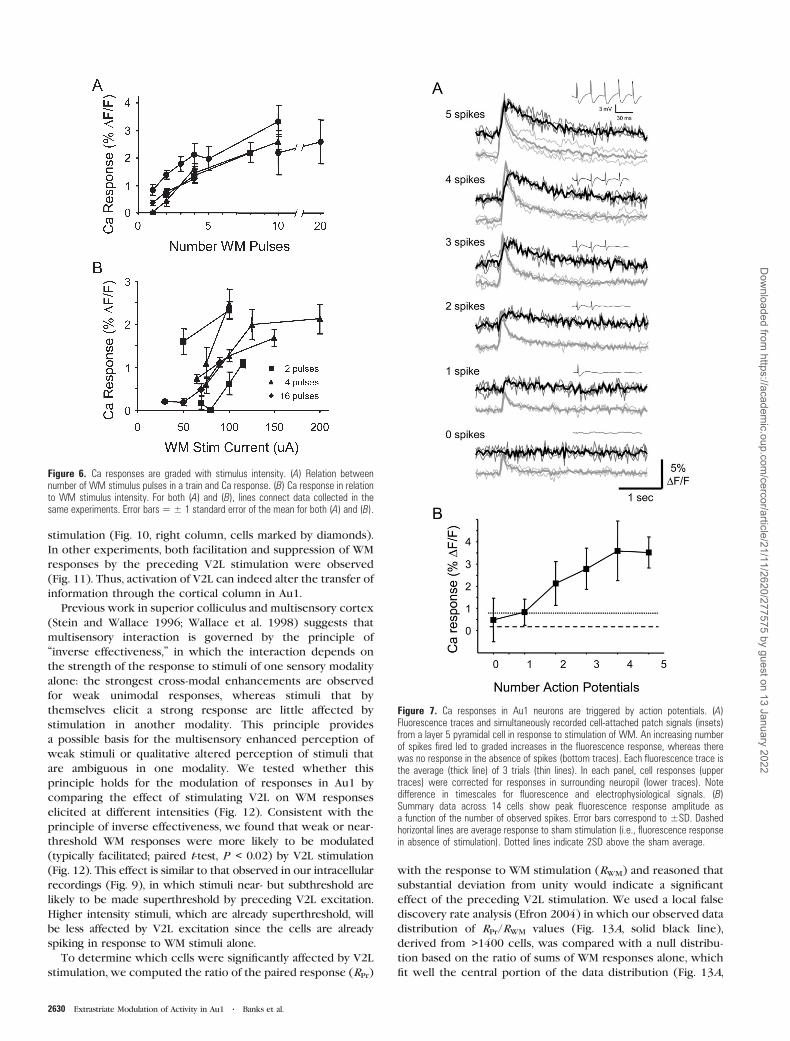
were graded with the intensity of afferent stimulation. In-
creasing either the number of pulses in a stimulus train (Figs 5C
and 6A) or the intensity of the stimulus current with the
number of pulses held constant (Fig. 6B) triggered Ca
responses of increasing amplitudes. Next, we tested the
relationship between the number of spikes and the Ca
response amplitude.
Ca Responses Represent Synaptically-Driven ActionPotential Activity
Before evaluating the interaction between descending and WM
stimuli in Au1, we investigated the cellular basis for Ca
responses in brain slices. We first show that the electrophys-
iological correlate of recorded fluorescence transients was
action potential firing in labeled cells and that subthreshold
synaptic responses do not generate detectable fluorescence
signals on single trials. We next show that these spikes were
Figure 1. Extrastriate visual cortical axons project to Au1 in mouse. BDA was injected into V2M in vivo. (A, B) Low-magnification dark field photomicrographs of coronal sectionsshow label (white) predominantly in superficial and deep layers of Au1. Cortical tissue margin is visible near the top of (A), running roughly parallel with the figure edge. Corticallayers 1--6 indicated on left. Orientation vane in (A) applies to panels (B) and (C) as well. Scale bar in (B) applies to both (A) and (B). (C--F) Higher magnification bright fieldphotomicrographs of darkly labeled axons in Au1 layers 1 (C) and 6 (D--F). Arrowheads in (D) and (F) indicate en passant swellings. Asterisk in (E) indicates en terminaux swellingand arrow indicates axonal branch point. Calibration bar for (D--F) in (F). (G,H) Electron photomicrographs of labeled visual cortical terminal swellings in layers 1 and 2 in Au1.Arrows indicate synaptic specializations. Asterisk in (H) indicates dendritic spine. Scale bar in (G) applies to (G) and (H).
Cerebral Cortex November 2011, V 21 N 11 2625
Dow
nloaded from https://academ
ic.oup.com/cercor/article/21/11/2620/277575 by guest on 13 January 2022
primarily synaptically mediated, as opposed to being due to
antidromic or direct activation by electrical stimuli.
To determine the electrophysiological correlates of ob-
served Ca transients, individual cells labeled with OGB-1 and
exhibiting Ca responses to WM and/or V2L stimulation were
targeted for simultaneous Ca imaging and patch-clamp re-
cording. Because dye fluorescence is rapidly lost upon
membrane rupture during whole-cell recordings, we used
cell-attached patch recordings to monitor action potential
activity in the labeled cell while measuring that cell’s
fluorescence signal (Fig. 7). In this experiment, the intensity
and the number of pulses in a train were varied to elicit
between 0 and 5 evoked spikes. In Figure 7A, ‘‘gray traces’’ are
neuropil Ca responses, ‘‘dark traces’’ are cell Ca responses, and
‘‘insets’’ are on-cell patch recordings from the cell. Stimuli that
were subthreshold for triggering spikes generated no detect-
able Ca response (Fig. 7A, bottom), though a background
neuropil response was still observed (Fig. 7A). A detectable Ca
response was observed in this cell for a single spike (Fig. 7A,
second from bottom). As the number of evoked spikes
increased with stimulation intensity or number of pulses,
increasing Ca responses were observed. Summary data from
recordings such as these in 14 cells show that on average no
detectable Ca response is observed in the absence of action
potential firing, and response magnitude monotonically
increases with the number of spikes (Fig. 7B). In this figure,
we also plot the mean (0.17%) and mean + 2SD (0.78%) of
a sham response calculation, in which the peak detection
algorithm was run on data segments in which no stimulation
was provided. Note that the mean response to 1 spike (0.83%)
falls just outside this sham range. Based on these data, cells
were deemed ‘‘responsive’’ to stimulation only if their response
Figure 2. BDA injection into V2M produced anterograde labeling throughout mouse auditory cortex. (A) Low-power photomicrograph of a coronal brain section showing theinjection site (asterisk). Dorsal is toward the top, lateral is to the left. Scale bar 5 1 mm. (B) Bottom: Camera lucida drawing of terminal swellings in Au1. Dots indicate thenumber of terminals in each 50 lm subdivision (dotted lines) from the surface (left) to the WM (right). Top: Plot of the number of terminals in each 50 lm subdivision. Dottedlines demarcate the boundaries of the cortical layers (roman numerals) and the WM. Note high density of labeling in superficial and deep layers. Data were derived from a verticalstrip of tissue whose location is indicated by the brackets in (C), though the actual tissue used was in section adjacent to the one shown. (C) Distribution of labeled axons incamera lucida--reconstructed coronal sections. Level from bregma indicated above each section. Au1, primary auditory cortex; AuD, secondary auditory cortex, dorsal area; AuV,auditory cortex, ventral area; TeA, temporal association cortex; Ect, ectorhinal cortex.
2626 Extrastriate Modulation of Activity in Au1 d Banks et al.
Dow
nloaded from https://academ
ic.oup.com/cercor/article/21/11/2620/277575 by guest on 13 January 2022
amplitudes were >0.78%; this criterion is used explicitly in
Figures 8 and 13 below.
In addition, in the cells recorded we did not observe more
than one spike fired in response to a single WM or V2L pulse,
even at the highest intensities tested (225 lA, up to 43
threshold current). Thus, we expect, in our data, that the
number of spikes fired, and thus the Ca response, will be
bounded by the number of pulses in a train of stimuli, as long as
stimulation intensity is kept within this limit. Based on this
observation, we can revisit the data of Figure 6: the increased
response amplitude with stimulus intensity and/or pulse
number is likely due to increasing numbers of spikes fired
per cell during the stimulus train—in the case of increasing
intensity, the increased number of spikes being due to fewer
and fewer failures during the stimulus train. For example, in
Figure 6B, one experiment exhibits saturation when the
stimulus intensity is increased to 200 lA (filled triangles, solid
line) presumably because the cells were already firing on every
stimulus pulse in the train at the lower intensity of 125 lA. Verylarge numbers of pulses could also lead to partial saturation of
responses. This is evident between 10 and 20 pulses in Figure
6A and is likely indicative of a saturating Ca response, due to
either the intrinsic Ca dynamics in the cell or a limitation of the
dye. For this reason, nearly all experiments in which we
investigated the interaction of V2L and WM stimuli in Au1 were
performed using 4 pulses or fewer in stimulus trains.
We have shown that afferent stimulation triggers somatic
calcium transients that are due to action potential firing in
labeled cells. These spikes are most likely due to super-
threshold excitatory synaptic responses but alternatively could
be due to either antidromic activation of the axons of labeled
cells (e.g., in the case of WM stimulation, these could be layer 5
cells that project via the WM to contralateral cortex and
subcortically) or direct activation of labeled cells (e.g., by
Figure 3. BDA injection into V2L produced anterograde labeling throughout mouse auditory cortex. (A) Low-power bright field photomicrograph of a coronal section showing theinjection site (asterisk). Dorsal is toward the top, lateral is to the left. Scale bar 5 1 mm. (B) Camera lucida drawing of terminal swellings in Au1. Note high density of labeling insuperficial and deep layers. Data were derived from a vertical strip of tissue whose location is indicated by the brackets in (C), though the actual tissue used was in sectionadjacent to the one shown. (C) Distribution of labeled axons in camera lucida--reconstructed coronal sections. Abbreviations as in Figure 2.
Cerebral Cortex November 2011, V 21 N 11 2627
Dow
nloaded from https://academ
ic.oup.com/cercor/article/21/11/2620/277575 by guest on 13 January 2022
activation of voltage-gated channels in the basal dendrites of
labeled cells). We used glutamate receptor antagonists to
distinguish between these possibilities. We labeled cells in layer
5 or 6 of Au1 and stimulated either in WM (n = 8 slices) or in
V2L (n = 7 slices) to evoked Ca responses under control
conditions and in the presence of either kynurenic acid (4 mM,
n = 4 slices) or 6-cyano-7-nitroquinoxaline-2,3-dione/(2R)-
amino-5-phosphonovaleric acid (10/40 lM). LFP responses
were recorded simultaneously to monitor independently the
effect of the receptor antagonists on synaptic transmission. We
found that later components of LFPs were consistently blocked
by glutamate receptor antagonists; an early component (latency
~1 ms) in response to WM stimulation was resistant to block in
some cases and is assumed to represent an antidromic
population spike (Fig. 8A). LFP responses to V2L stimulation
were always completely blocked by glutamate receptor
antagonists (not shown). Ca responses of most cells were
blocked by GluR antagonists (Fig. 8B), though responses in
a small number of cells were resistant to block (Fig. 8B,
asterisks). On average, 85% of responses to WM stimulation and
82% of responses to V2L stimulation were blocked (Fig. 8C).
These data indicate that most, but not all, Ca responses were
due to synaptically driven action potentials, with the remainder
presumably due to antidromic or direct stimulation of labeled
cells.
Electrophysiological Responses to WM, V2L Stimulation inAu1
To determine the functional effects of the observed projection
from V2 to Au1, we recorded whole-cell responses in Au1 to
afferent stimulation in layer 5 of V2L and the WM deep to Au1.
We reasoned that a descending cortical projection to Au1
would most likely serve as a modulatory input to the cortical
column and so compared the response to stimuli applied to the
WM alone with responses to V2L stimulation alone and to
paired V2L and WM stimulation.
We recorded from 20 pyramidal cells in layers 2--5 of Au1
under whole-cell current clamp. These cells could be classified
as regular spiking (n = 18; Fig. 9Ai) or intrinsic bursting cells
(n = 2). Excitatory postsynaptic potentials (EPSPs) evoked in
response to WM stimulation had latencies of 3.07 ± 1.05 ms and
in 5 of 11 cells tested could elicit spikes at moderate
stimulation intensities. Disynaptic inhibition following WM
stimulation was observed in 12 of 16 cells tested (Fig. 9Aii).
Afferent stimulation applied to V2L elicited EPSPs in 18 of 20
cells tested and were of longer latency (6.46 ± 1.85 ms; Fig.
9Aiii) and were superthreshold at higher intensities in 5 of 10
cells tested (not shown). In contrast to WM stimulation,
disynaptic inhibition upon stimulation of V2L was observed in
only 3 of 18 cells tested. However, 2 additional cells recorded
in layers 4 and 5 that responded to V2L stimulation were
identified as GABAergic interneurons, in one case based on the
cell’s nonadapting, fast-spiking pattern common in GABAergic
interneurons (Connors and Gutnick 1990) (Fig. 9Bi) and in the
other case based on its morphology visualized via biocytin
injection (not shown). These cells exhibited a small excitatory
synaptic response to V2L stimulation (Fig. 9Biii); one showed
no response to WM stimulation (Fig. 9Bii) and other exhibited
an EPSP/inhibitory postsynaptic potential sequence (not
shown). Interestingly, in the cell illustrated in Figure 9B, the
synaptic responses to V2L stimulation consistently appeared as
triplets of EPSPs, most likely due to bursts fired by the
presynaptic cell in V2L.
Figure 4. Biocytin injection into V2L in mouse brain slice produced anterograde labeling throughout auditory cortex. (A) Low-power bright field photomicrograph showing theinjection site in V2L. Scale bar 5 1 mm. (B) Higher power view of a section adjacent to (A) shows labeled cell bodies. Scale bar 5 200 lm. (C) Labeled axons in camera lucida--reconstructed brain slice following injection in (A). Slices are in the off-coronal plane used in physiological and imaging experiments. Orientation vane applies to (A--C). Scalebar 5 500 lm. Abbreviations as in Figure 2.
2628 Extrastriate Modulation of Activity in Au1 d Banks et al.
Dow
nloaded from https://academ
ic.oup.com/cercor/article/21/11/2620/277575 by guest on 13 January 2022
The ability of V2L inputs to modulate responses to WM
stimulation was evaluated by pairing stimuli to the 2 afferent
pathways at various delays ranging from –40 to 320 ms (Fig.
9C,D; same cell as in Fig. 9A). In the cell illustrated, for WM
stimulus intensities that were always subthreshold, preceding
WM stimulation with activation of V2L rendered the WM
stimulus superthreshold on all or most trials for delays of
5--8 ms; at negative delays (i.e., with WM preceding V2L
stimulation) or at delays>30 ms, no change in spike probability
was apparent, while delays between 10 and 30 ms moderately
enhanced spiking probability (Fig. 9C,D).
These electrophysiological data suggest that afferents arising
from V2L can modulate spiking activity in Au1. Direct
excitation of pyramidal cells by V2L afferents is expected to
increase these cells’ responsiveness to WM stimuli. Some
evidence that V2L afferents also engage inhibitory circuits in
Au1 was observed, suggesting that at the network level,
modulation of columnar activity in Au1 may be complex and
bidirectional. We investigated these circuit interactions at the
network level using the Ca imaging technique.
Modulation of Ca Responses to WM Stimulation byActivation of V2L
The ability of V2L afferents to modulate spiking activity in Au1
networks was investigated by labeling cells in Au1 with OGB-1
and comparing the responses to WM and V2L stimulation alone
with those in response to paired stimulation. Stimuli consisted
of single or short trains of pulses (2--20 pulses at 40 Hz), and
paired stimulation was either interleaved (i.e., sequences of
V2L--WM pairs, at a fixed delay, applied at 40 Hz) or sequential
(i.e., a train applied to V2L at 40 Hz followed at a specific delay
by a train applied to WM at 40 Hz). Because we were interested
in a priming effect of the V2L projection on the cortical column
in Au1, we focused primarily on responses to paired stimuli in
which activation of V2L preceded stimulation of the WM.
As mentioned above, WM stimuli typically evoked responses
in many more cells compared with stimuli applied to V2L (Fig.
10, compare first and second columns). Because the afferents
activated by stimulation in V2L and the WM represent largely
nonoverlapping pathways, we expect that the most commonly
observed response to paired stimulation would be simple linear
summation of the responses to WM and V2L alone: if a cell fires
a spike in response to WM stimulation and a spike in response
to V2L stimulation, we expect that its response to stimulation
of V2L followed by WM would be 2 spikes. Deviation from this
simple linear scheme would be superlinear or sublinear
interactions between the 2 pathways. For example, if the
response to V2L is subthreshold but brings the cell closer to
firing threshold, the response to paired stimulation would be
superlinear. Conversely, if stimulation of V2L engages in-
hibitory circuits or leaves the cell in a relative refractory
period, the response to paired stimulation may be sublinear.
The majority of cells exhibiting responses to WM and V2L
stimulation exhibited linear summation to paired stimulation.
However, in other cells paired stimulation often elicited
responses that deviated from what would be expected by
simple linear summation of the responses to WM and V2L
stimulation alone. For example, some cells responded to paired
stimulation when they showed no response to either stimulus
in isolation (Fig. 10, right column, cells marked by asterisks),
while other cells showed greatly facilitated responses to paired
Figure 5. Neural activity monitored in Au1 using Ca imaging. (A) Schematicillustration of experimental stimulation and recording arrangement in brain slice.Square indicates orientation of image in (B). Orientation vane: D, dorsal; L, lateral.(B) Fluorescence in cell bodies labeled with calcium dye OGB-1. Colored cellscorrespond to matching traces in (C). White cells were labeled but unresponsive.Pial surface is toward upper right. Image is 200 lm on each side. (C) Calciumtraces of individual cell responses to WM stimulation at 2, 4, and 8 pulses at 40Hz (left, middle, and right columns, respectively). Bottom gray traces showaveraged neuropil response.
Cerebral Cortex November 2011, V 21 N 11 2629
Dow
nloaded from https://academ
ic.oup.com/cercor/article/21/11/2620/277575 by guest on 13 January 2022
stimulation (Fig. 10, right column, cells marked by diamonds).
In other experiments, both facilitation and suppression of WM
responses by the preceding V2L stimulation were observed
(Fig. 11). Thus, activation of V2L can indeed alter the transfer of
information through the cortical column in Au1.
Previous work in superior colliculus and multisensory cortex
(Stein and Wallace 1996; Wallace et al. 1998) suggests that
multisensory interaction is governed by the principle of
‘‘inverse effectiveness,’’ in which the interaction depends on
the strength of the response to stimuli of one sensory modality
alone: the strongest cross-modal enhancements are observed
for weak unimodal responses, whereas stimuli that by
themselves elicit a strong response are little affected by
stimulation in another modality. This principle provides
a possible basis for the multisensory enhanced perception of
weak stimuli or qualitative altered perception of stimuli that
are ambiguous in one modality. We tested whether this
principle holds for the modulation of responses in Au1 by
comparing the effect of stimulating V2L on WM responses
elicited at different intensities (Fig. 12). Consistent with the
principle of inverse effectiveness, we found that weak or near-
threshold WM responses were more likely to be modulated
(typically facilitated; paired t-test, P < 0.02) by V2L stimulation
(Fig. 12). This effect is similar to that observed in our intracellular
recordings (Fig. 9), in which stimuli near- but subthreshold are
likely to be made superthreshold by preceding V2L excitation.
Higher intensity stimuli, which are already superthreshold, will
be less affected by V2L excitation since the cells are already
spiking in response to WM stimuli alone.
To determine which cells were significantly affected by V2L
stimulation, we computed the ratio of the paired response (RPr)
with the response to WM stimulation (RWM) and reasoned that
substantial deviation from unity would indicate a significant
effect of the preceding V2L stimulation. We used a local false
discovery rate analysis (Efron 2004) in which our observed data
distribution of RPr/RWM values (Fig. 13A, solid black line),
derived from >1400 cells, was compared with a null distribu-
tion based on the ratio of sums of WM responses alone, which
fit well the central portion of the data distribution (Fig. 13A,
Figure 7. Ca responses in Au1 neurons are triggered by action potentials. (A)Fluorescence traces and simultaneously recorded cell-attached patch signals (insets)from a layer 5 pyramidal cell in response to stimulation of WM. An increasing numberof spikes fired led to graded increases in the fluorescence response, whereas therewas no response in the absence of spikes (bottom traces). Each fluorescence trace isthe average (thick line) of 3 trials (thin lines). In each panel, cell responses (uppertraces) were corrected for responses in surrounding neuropil (lower traces). Notedifference in timescales for fluorescence and electrophysiological signals. (B)Summary data across 14 cells show peak fluorescence response amplitude asa function of the number of observed spikes. Error bars correspond to ±SD. Dashedhorizontal lines are average response to sham stimulation (i.e., fluorescence responsein absence of stimulation). Dotted lines indicate 2SD above the sham average.
Figure 6. Ca responses are graded with stimulus intensity. (A) Relation betweennumber of WM stimulus pulses in a train and Ca response. (B) Ca response in relationto WM stimulus intensity. For both (A) and (B), lines connect data collected in thesame experiments. Error bars5± 1 standard error of the mean for both (A) and (B).
2630 Extrastriate Modulation of Activity in Au1 d Banks et al.
Dow
nloaded from https://academ
ic.oup.com/cercor/article/21/11/2620/277575 by guest on 13 January 2022

dotted black line; see Methods). In the tails of the distributions,
the data and null curves diverge, reflecting cells whose WM
responses were altered by the preceding V2L stimulation,
either via suppression (RPr/RWM � 1) or summation (RPr/RWM
� 1). We chose as a significance criterion a 5-fold difference in
observation frequency for the data versus the null distribution
(Fig. 13A; gray filled area); cells with values of RPr/RWM in these
bins were considered to be significantly affected by preceding
V2L stimulation. Based on this method, we estimate that
significant interactions between V2L and WM stimuli were
observed in 248 of 1417 cells, with 61 cells exhibiting
suppression and 187 cells exhibiting summation.
The interactions between V2L and WM stimuli in Au1 and the
stronger effects near threshold are summarized in Figure 13B,C,
which plots the difference RPair – RWM as a function of WM
response amplitude (Fig. 13B) and V2L response amplitude (Fig.
13C) for the same population of cells. Included in this figure are
those cells whose Ca responses were DF/F > 0.78%, which in our
Ca spike data above represented the threshold for detected spike-
evoked responses (Fig. 7). Cells with significant effects of V2L
stimulation by the test illustrated in Figure 13A are marked with
black circles. All other cells are marked with gray circles. Values of
RPair – RWM < 0 indicate suppression of the WM response by the
preceding V2L stimulation. Values of RPair – RWM > 0 indicate
a positive contribution (summation) of the V2L response to the
paired response. This contribution can result in sublinear, linear,
or superlinear summation, depending on the magnitude of the
V2L response (see below). Two important aspects of the data can
be gleaned from the plot in Figure 13B. First, suppression of WM
responses occurs less often than summation. Second, the largest
positive values of RPair – RWM are clustered at small or zero WM
responses, consistent with the greatest effect of V2L stimulation
being on sub- or near-threshold WM responses.
To interpret values of RPair – RWM in terms of responses to V2L,
we show these difference values as a function of V2L response
amplitude (Fig. 13C). As in Figure 13B, points below the line RPair –
RWM = 0 indicate V2L-mediated suppression of the WM response.
All points above the dashed line indicate summation of V2L and
WM responses. Points clustered along the identity line indicate
linear summation, that is, RPair = RWM + RV2. Points above this line
indicate superlinear summation, that is, facilitation of the WM
response by the preceding V2L stimulus, and points below this
line, but above the horizontal 0 line, indicate sublinear summation.
Many data points cluster on the identity line, indicating that linear
summation is common. Most of the cells exhibiting superlinear
summation cluster near zero on the horizontal axis, indicating
that V2L stimulation tends to facilitate many cells’ responses to
WM stimulation even when the cells exhibit zero or small
response to V2L alone. This is consistent with our observation
using whole-cell recordings that responses to V2L tended to be
subthreshold. Similarly, most of the cells exhibiting negative
values of RPair – RWM exhibit small or zero V2L responses,
suggesting that V2L activation can engage inhibitory circuits in
Au1 with no or little direct excitation of affected cells.
The tendency of the largest effects of paired stimulation to
occur in cells with small WM responses is best illustrated in the
cumulative amplitude plots of Figure 13D. Here, we rank-ordered
the data from the entire population of 1417 cells according to
increasing WM response amplitude. Each point on the cumulative
amplitude curve represents the response amplitude for the cell at
that point summed with all the response amplitudes of the cells
below that point. For example, point 10 of the WM curve is the
Figure 8. Ca responses in Au1 neurons are primarily synaptically mediated. (A) LFPrecordings in layer 5 in response toWMstimulation (43 40Hz, 100lA) before (Ctrl), during(K Acid), and after (Recov) synaptic blockade with 4 mM kynurenic acid. (B) Correspondingfluorescence traces from experiment illustrated in (A). Responses in all but 2 of these cellswere blocked (asterisks), and the effect reversed within 20 min (right column). Traces atbottom illustrate neuropil response. (C) Summary data from 8 experiments using eitherkynurenic acid (n 5 4) or 6-cyano-7-nitroquinoxaline-2,3-dione/(2R)-amino-5-phosphono-valeric acid (n5 4) to block excitatory synaptic transmission in response toWM stimulation(68 cells) and from 7 experiments using 6-cyano-7-nitroquinoxaline-2,3-dione/(2R)-amino-5-phosphonovaleric acid to block responses to V2L stimulation (28 cells). Error bars are SD.Horizontal lines are mean of sham analysis (dashed line, i.e., responses detection algorithmrun on data segments in which no stimulus was applied) and shammeanþ 2SD (solid line).
Cerebral Cortex November 2011, V 21 N 11 2631
Dow
nloaded from https://academ
ic.oup.com/cercor/article/21/11/2620/277575 by guest on 13 January 2022
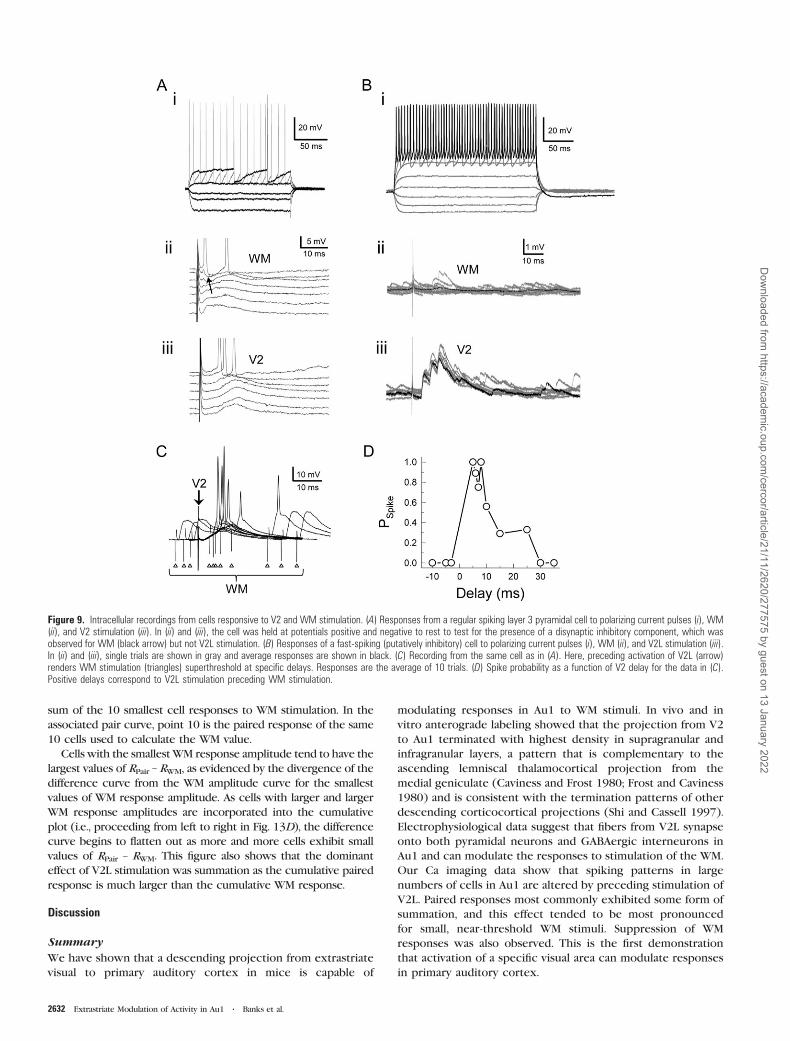
sum of the 10 smallest cell responses to WM stimulation. In the
associated pair curve, point 10 is the paired response of the same
10 cells used to calculate the WM value.
Cells with the smallestWM response amplitude tend to have the
largest values of RPair – RWM, as evidenced by the divergence of the
difference curve from the WM amplitude curve for the smallest
values of WM response amplitude. As cells with larger and larger
WM response amplitudes are incorporated into the cumulative
plot (i.e., proceeding from left to right in Fig. 13D), the difference
curve begins to flatten out as more and more cells exhibit small
values of RPair – RWM. This figure also shows that the dominant
effect of V2L stimulation was summation as the cumulative paired
response is much larger than the cumulative WM response.
Discussion
Summary
We have shown that a descending projection from extrastriate
visual to primary auditory cortex in mice is capable of
modulating responses in Au1 to WM stimuli. In vivo and in
vitro anterograde labeling showed that the projection from V2
to Au1 terminated with highest density in supragranular and
infragranular layers, a pattern that is complementary to the
ascending lemniscal thalamocortical projection from the
medial geniculate (Caviness and Frost 1980; Frost and Caviness
1980) and is consistent with the termination patterns of other
descending corticocortical projections (Shi and Cassell 1997).
Electrophysiological data suggest that fibers from V2L synapse
onto both pyramidal neurons and GABAergic interneurons in
Au1 and can modulate the responses to stimulation of the WM.
Our Ca imaging data show that spiking patterns in large
numbers of cells in Au1 are altered by preceding stimulation of
V2L. Paired responses most commonly exhibited some form of
summation, and this effect tended to be most pronounced
for small, near-threshold WM stimuli. Suppression of WM
responses was also observed. This is the first demonstration
that activation of a specific visual area can modulate responses
in primary auditory cortex.
Figure 9. Intracellular recordings from cells responsive to V2 and WM stimulation. (A) Responses from a regular spiking layer 3 pyramidal cell to polarizing current pulses (i), WM(ii), and V2 stimulation (iii). In (ii) and (iii), the cell was held at potentials positive and negative to rest to test for the presence of a disynaptic inhibitory component, which wasobserved for WM (black arrow) but not V2L stimulation. (B) Responses of a fast-spiking (putatively inhibitory) cell to polarizing current pulses (i), WM (ii), and V2L stimulation (iii).In (ii) and (iii), single trials are shown in gray and average responses are shown in black. (C) Recording from the same cell as in (A). Here, preceding activation of V2L (arrow)renders WM stimulation (triangles) superthreshold at specific delays. Responses are the average of 10 trials. (D) Spike probability as a function of V2 delay for the data in (C).Positive delays correspond to V2L stimulation preceding WM stimulation.
2632 Extrastriate Modulation of Activity in Au1 d Banks et al.
Dow
nloaded from https://academ
ic.oup.com/cercor/article/21/11/2620/277575 by guest on 13 January 2022
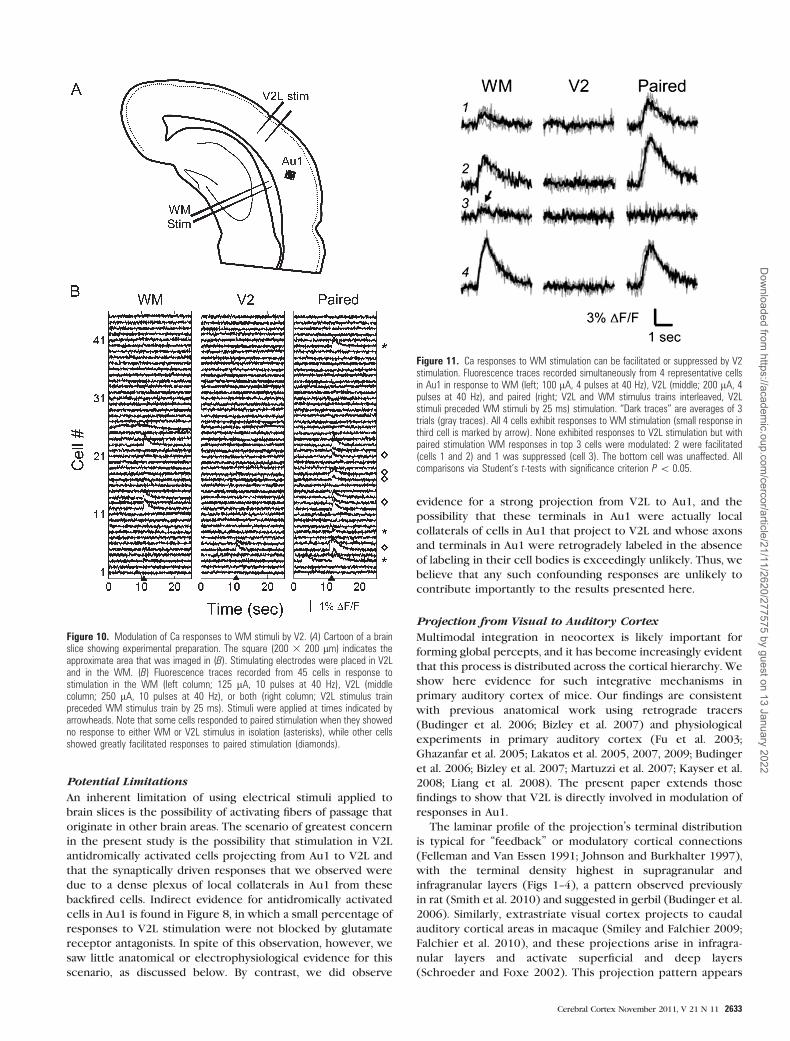
Potential Limitations
An inherent limitation of using electrical stimuli applied to
brain slices is the possibility of activating fibers of passage that
originate in other brain areas. The scenario of greatest concern
in the present study is the possibility that stimulation in V2L
antidromically activated cells projecting from Au1 to V2L and
that the synaptically driven responses that we observed were
due to a dense plexus of local collaterals in Au1 from these
backfired cells. Indirect evidence for antidromically activated
cells in Au1 is found in Figure 8, in which a small percentage of
responses to V2L stimulation were not blocked by glutamate
receptor antagonists. In spite of this observation, however, we
saw little anatomical or electrophysiological evidence for this
scenario, as discussed below. By contrast, we did observe
evidence for a strong projection from V2L to Au1, and the
possibility that these terminals in Au1 were actually local
collaterals of cells in Au1 that project to V2L and whose axons
and terminals in Au1 were retrogradely labeled in the absence
of labeling in their cell bodies is exceedingly unlikely. Thus, we
believe that any such confounding responses are unlikely to
contribute importantly to the results presented here.
Projection from Visual to Auditory Cortex
Multimodal integration in neocortex is likely important for
forming global percepts, and it has become increasingly evident
that this process is distributed across the cortical hierarchy. We
show here evidence for such integrative mechanisms in
primary auditory cortex of mice. Our findings are consistent
with previous anatomical work using retrograde tracers
(Budinger et al. 2006; Bizley et al. 2007) and physiological
experiments in primary auditory cortex (Fu et al. 2003;
Ghazanfar et al. 2005; Lakatos et al. 2005, 2007, 2009; Budinger
et al. 2006; Bizley et al. 2007; Martuzzi et al. 2007; Kayser et al.
2008; Liang et al. 2008). The present paper extends those
findings to show that V2L is directly involved in modulation of
responses in Au1.
The laminar profile of the projection’s terminal distribution
is typical for ‘‘feedback’’ or modulatory cortical connections
(Felleman and Van Essen 1991; Johnson and Burkhalter 1997),
with the terminal density highest in supragranular and
infragranular layers (Figs 1--4), a pattern observed previously
in rat (Smith et al. 2010) and suggested in gerbil (Budinger et al.
2006). Similarly, extrastriate visual cortex projects to caudal
auditory cortical areas in macaque (Smiley and Falchier 2009;
Falchier et al. 2010), and these projections arise in infragra-
nular layers and activate superficial and deep layers
(Schroeder and Foxe 2002). This projection pattern appears
Figure 10. Modulation of Ca responses to WM stimuli by V2. (A) Cartoon of a brainslice showing experimental preparation. The square (200 3 200 lm) indicates theapproximate area that was imaged in (B). Stimulating electrodes were placed in V2Land in the WM. (B) Fluorescence traces recorded from 45 cells in response tostimulation in the WM (left column; 125 lA, 10 pulses at 40 Hz), V2L (middlecolumn; 250 lA, 10 pulses at 40 Hz), or both (right column; V2L stimulus trainpreceded WM stimulus train by 25 ms). Stimuli were applied at times indicated byarrowheads. Note that some cells responded to paired stimulation when they showedno response to either WM or V2L stimulus in isolation (asterisks), while other cellsshowed greatly facilitated responses to paired stimulation (diamonds).
Figure 11. Ca responses to WM stimulation can be facilitated or suppressed by V2stimulation. Fluorescence traces recorded simultaneously from 4 representative cellsin Au1 in response to WM (left; 100 lA, 4 pulses at 40 Hz), V2L (middle; 200 lA, 4pulses at 40 Hz), and paired (right; V2L and WM stimulus trains interleaved, V2Lstimuli preceded WM stimuli by 25 ms) stimulation. ‘‘Dark traces’’ are averages of 3trials (gray traces). All 4 cells exhibit responses to WM stimulation (small response inthird cell is marked by arrow). None exhibited responses to V2L stimulation but withpaired stimulation WM responses in top 3 cells were modulated: 2 were facilitated(cells 1 and 2) and 1 was suppressed (cell 3). The bottom cell was unaffected. Allcomparisons via Student’s t-tests with significance criterion P\ 0.05.
Cerebral Cortex November 2011, V 21 N 11 2633
Dow
nloaded from https://academ
ic.oup.com/cercor/article/21/11/2620/277575 by guest on 13 January 2022

to be common across sensory modalities, as somatosensory
input to auditory cortex in monkeys generates current sinks
in infragranular and supragranular layers (Lakatos et al. 2007),
and a reciprocal feedback projection arises from belt and
parabelt auditory areas to V1 and V2 (Falchier et al. 2002;
Rockland and Ojima 2003; Hall and Lomber 2008). These
descending projections are complementary to the lemniscal
thalamic projection from the medial geniculate (Romanski
and LeDoux 1993; Cruikshank et al. 2002; Kimura et al. 2003)
but overlap projections from extralemnical thalamic nuclei
(Linke and Schwegler 2000; Kimura et al. 2003; Smith et al.
2010). The functional implications of these projection
patterns are discussed below.
Ca Responses in Au1
The Ca imaging technique that we employed has been used
successfully both in vivo and in vitro to monitor neural activity
in cortical circuits (Stosiek et al. 2003; Kerr et al. 2005). As in
these previous studies, labeled cells were predominantly
neurons. In 14 whole-cell and on-cell patch-clamp recordings
from labeled cells, we never observed a cell that did not fire an
action potential in response to synaptic stimulation of sufficient
intensity or in response to depolarizing current injection. We
did occasionally observe cells whose Ca response to synaptic
stimulation was much slower than other cells and/or which
exhibited slow spontaneous Ca transients, and these cells were
assumed to be glial cells, as reported previously (Kerr et al.
2005). However, they represented ~0.1% of the total cells
observed with Ca responses.
We show that Ca responses to afferent stimulation were
primarily due to synaptically driven action potentials. In on-cell
recordings from labeled cells, we could detect Ca responses to
afferent stimulation on single trials reliably when cells fired
single action potentials but not when stimuli were subthresh-
old. In a minority of cells, averaged responses revealed small,
subthreshold Ca responses, presumably representing Ca
transients in response to activation of voltage- or ligand-gated
channels by depolarizing EPSPs. Using glutamate receptor
antagonists, we show that spikes in response to afferent
stimulation were primarily synaptically driven, with Ca
responses blocked in >80% of cells. Responses in cells that
were resistant to blockade of glutamate receptors most likely
could be explained by 1 of 2 possibilities: either incomplete
block of synaptic glutamate receptors in those cells or spiking
due to antidromic activation or direct stimulation of dendritic
processes. The latter possibilities are not surprising for WM
stimuli as corticothalamic and corticofugal cells send their
axons through the WM to reach their targets. In our experi-
ments, LFP responses to WM stimulation often had a short
latency component that was not blocked by glutamate receptor
antagonists, and antidromic responses to WM stimulation were
observed (though were rare, especially at low stimulus
intensities). In contrast, antidromic activation of cells in Au1
by stimulation in V2L is unexpected, as the projection from
Au1 to V2L is reported to be weak (Mascagni et al. 1993; Shi
and Cassell 1997), and we observed only a single retrogradely
labeled cell in Au1 after injecting biocytin into V2L in vitro,
though numerous cells were observed in V2M and V1. In 22
whole-cell recordings from cells in Au1, we observed an
antidromic response to V2L stimulation only once, and LFP
responses to V2L stimulation were completely blocked by
glutamate receptor antagonists. It should be noted that our
electrophysiological data indicate that most responses to V2L
stimulation are subthreshold, indicating that if resistant cells
were being activated antidromically, the overall percentage of
cells exhibiting antidromic responses is much smaller than
suggested by these Ca imaging results, in which only
superthreshold responses are monitored.
Modulation of Au1 Responses by Visual Stimuli
We have shown that preceding activation of V2L could alter
subsequent responses to WM stimuli. In our electrophysiolog-
ical experiments, we show that the optimal timing for
activation of V2L relative to the WM was 5--10 ms, similar to
the difference in synaptic delay between the 2 inputs (Fig. 10).
This is consistent with previous studies that showed that
heteromodal stimuli are most effective at modulating responses
if they precede or overlap auditory stimuli (Ghazanfar et al.
2005; Bizley et al. 2007; Lakatos et al. 2007; Kayser et al. 2008).
These previous studies have also shown that heteromodal
stimuli can either enhance or suppress auditory responses
depending on the specific relative timing, consistent with our
observation of bidirectional modulation of responses to WM
stimuli by stimulation of V2L; in most cases, responses to V2L
Figure 12. Facilitation by V2 stimulation is more effective for small WM responses. (A) Fluorescence traces recorded from 4 representative cells simultaneously in Au1 inresponse to WM (first and third columns), paired V2L--WM (second and fourth columns) stimulation for 2 different WM stimulation intensities: 75 lA (first and second columns)and 100 lA (third and fourth columns). V2L stimulation intensity was identical in both cases (200 lA). Four pulses each were applied to WM and V2L, at 0 ms delay. Note thatfor the lower WM stimulation intensity, all 4 cells exhibit facilitation in response to paired stimulation, but for the higher WM stimulation intensity, this is true only for cells 1 and2. (B) Summary of all recordings from the experiment in (A) (mean ± standard error of the mean; n 5 30 cells) showing the difference between response amplitude (%DF/F) topaired stimulation versus WM alone. Note greater facilitation (i.e., greater difference) for smaller WM stimulation intensity.
2634 Extrastriate Modulation of Activity in Au1 d Banks et al.
Dow
nloaded from https://academ
ic.oup.com/cercor/article/21/11/2620/277575 by guest on 13 January 2022
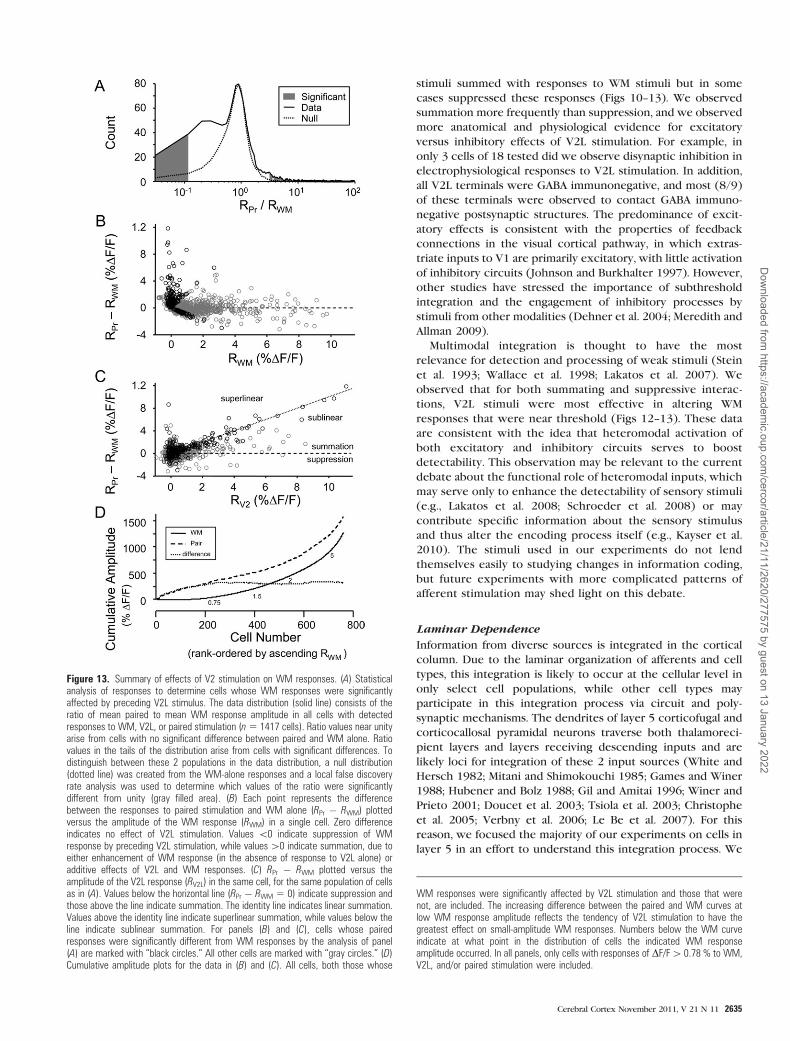
stimuli summed with responses to WM stimuli but in some
cases suppressed these responses (Figs 10--13). We observed
summation more frequently than suppression, and we observed
more anatomical and physiological evidence for excitatory
versus inhibitory effects of V2L stimulation. For example, in
only 3 cells of 18 tested did we observe disynaptic inhibition in
electrophysiological responses to V2L stimulation. In addition,
all V2L terminals were GABA immunonegative, and most (8/9)
of these terminals were observed to contact GABA immuno-
negative postsynaptic structures. The predominance of excit-
atory effects is consistent with the properties of feedback
connections in the visual cortical pathway, in which extras-
triate inputs to V1 are primarily excitatory, with little activation
of inhibitory circuits (Johnson and Burkhalter 1997). However,
other studies have stressed the importance of subthreshold
integration and the engagement of inhibitory processes by
stimuli from other modalities (Dehner et al. 2004; Meredith and
Allman 2009).
Multimodal integration is thought to have the most
relevance for detection and processing of weak stimuli (Stein
et al. 1993; Wallace et al. 1998; Lakatos et al. 2007). We
observed that for both summating and suppressive interac-
tions, V2L stimuli were most effective in altering WM
responses that were near threshold (Figs 12--13). These data
are consistent with the idea that heteromodal activation of
both excitatory and inhibitory circuits serves to boost
detectability. This observation may be relevant to the current
debate about the functional role of heteromodal inputs, which
may serve only to enhance the detectability of sensory stimuli
(e.g., Lakatos et al. 2008; Schroeder et al. 2008) or may
contribute specific information about the sensory stimulus
and thus alter the encoding process itself (e.g., Kayser et al.
2010). The stimuli used in our experiments do not lend
themselves easily to studying changes in information coding,
but future experiments with more complicated patterns of
afferent stimulation may shed light on this debate.
Laminar Dependence
Information from diverse sources is integrated in the cortical
column. Due to the laminar organization of afferents and cell
types, this integration is likely to occur at the cellular level in
only select cell populations, while other cell types may
participate in this integration process via circuit and poly-
synaptic mechanisms. The dendrites of layer 5 corticofugal and
corticocallosal pyramidal neurons traverse both thalamoreci-
pient layers and layers receiving descending inputs and are
likely loci for integration of these 2 input sources (White and
Hersch 1982; Mitani and Shimokouchi 1985; Games and Winer
1988; Hubener and Bolz 1988; Gil and Amitai 1996; Winer and
Prieto 2001; Doucet et al. 2003; Tsiola et al. 2003; Christophe
et al. 2005; Verbny et al. 2006; Le Be et al. 2007). For this
reason, we focused the majority of our experiments on cells in
layer 5 in an effort to understand this integration process. We
Figure 13. Summary of effects of V2 stimulation on WM responses. (A) Statisticalanalysis of responses to determine cells whose WM responses were significantlyaffected by preceding V2L stimulus. The data distribution (solid line) consists of theratio of mean paired to mean WM response amplitude in all cells with detectedresponses to WM, V2L, or paired stimulation (n5 1417 cells). Ratio values near unityarise from cells with no significant difference between paired and WM alone. Ratiovalues in the tails of the distribution arise from cells with significant differences. Todistinguish between these 2 populations in the data distribution, a null distribution(dotted line) was created from the WM-alone responses and a local false discoveryrate analysis was used to determine which values of the ratio were significantlydifferent from unity (gray filled area). (B) Each point represents the differencebetween the responses to paired stimulation and WM alone (RPr � RWM) plottedversus the amplitude of the WM response (RWM) in a single cell. Zero differenceindicates no effect of V2L stimulation. Values \0 indicate suppression of WMresponse by preceding V2L stimulation, while values[0 indicate summation, due toeither enhancement of WM response (in the absence of response to V2L alone) oradditive effects of V2L and WM responses. (C) RPr � RWM plotted versus theamplitude of the V2L response (RV2L) in the same cell, for the same population of cellsas in (A). Values below the horizontal line (RPr � RWM 5 0) indicate suppression andthose above the line indicate summation. The identity line indicates linear summation.Values above the identity line indicate superlinear summation, while values below theline indicate sublinear summation. For panels (B) and (C), cells whose pairedresponses were significantly different from WM responses by the analysis of panel(A) are marked with ‘‘black circles.’’ All other cells are marked with ‘‘gray circles.’’ (D)Cumulative amplitude plots for the data in (B) and (C). All cells, both those whose
WM responses were significantly affected by V2L stimulation and those that werenot, are included. The increasing difference between the paired and WM curves atlow WM response amplitude reflects the tendency of V2L stimulation to have thegreatest effect on small-amplitude WM responses. Numbers below the WM curveindicate at what point in the distribution of cells the indicated WM responseamplitude occurred. In all panels, only cells with responses of DF/F[ 0.78 % to WM,V2L, and/or paired stimulation were included.
Cerebral Cortex November 2011, V 21 N 11 2635
Dow
nloaded from https://academ
ic.oup.com/cercor/article/21/11/2620/277575 by guest on 13 January 2022

found that both regular spiking and intrinsically bursting
pyramidal cells in layer 5 received excitatory input from V2L.
Our experiments were not designed to determine the laminar
dependence of responses in Au1 to V2L stimulation as the
majority of imaging experiments were performed with a high-
power (340) objective whose limited field of view did not
allow comparisons across layers. It was interesting that we
could observe responses to V2L stimulation in all layers tested
(layers 3--6), suggesting that the influence of this projection is
widespread within the column, even though the projection
exhibits a strong laminar dependence. Indeed, experiments in
vivo have shown a strong heteromodal response in supragranular
layers with latency and amplitude comparable to the response in
infragranular layers (Schroeder and Foxe 2002; Lakatos et al.
2007). Future experiments with lower power objectives and
more standardized stimulation protocols will allow us to map the
laminar dependence of the strength of this modulation.
Functional Implications
The complementary ascending and descending projections to
sensory neocortex are postulated to underlie comparisons of
expected and observed sensory events, with descending
projections carrying predicted activity based on context,
experience, and inputs from other modalities and ascending
connections carrying current sensory input (Hawkins and
Blakeslee 2005; Bar 2009). Thus, descending cortical inputs
could prime the column for expected ascending information
and could generate distinct responses should the inputs match
or diverge from expectations. We have shown that this
integration process is complex and nonlinear. It is most
effective at near-threshold stimuli for both summing or
facilitative modulation and suppressive modulation. These
observations raise the intriguing possibility that descending
projections do not simply pre-excite the cortical column and
enhance responses regardless of the layer and cell type. Mixed
facilitative and suppressive as well as subtype-specific effects of
V2L stimulation could change the participation of selected cells
and circuits within the column in response to ascending input.
Such changes in network composition could have broad
implications for subsequent processing of the sensory input
and the motor patterns that the stimulus triggers. For example,
facilitation of cells whose primary outputs are subcortical and
engage motor circuits while suppression of cells whose
primary outputs are corticocortical may decrease response
latency to multimodal inputs of particular behavioral relevance.
Such bidirectional modulation may also impact the relative
importance of corticocortical versus corticothalamocortical
pathways, which arise from distinct cell types within the
cortical column (Hallman et al. 1988; Kasper et al. 1994; Lee
and Sherman 2010). Demonstrating the existence of such
specificity awaits future experiments.
Funding
National Institutes of Health (Bethesda, MD) (DC006013 to
M. I. B.); Department of Anesthesiology (233-DS71 to M. I. B.)
and School of Medicine and Public Health (233-PRJ39MN to
D. J. U.), University of Wisconsin, Madison, WI.
Notes
The authors thank Yakov Verbny (Associate Researcher, Department of
Anesthesiology), Nima Ghitani (Research Assistant, Neuroscience
Training Program), and Anna Kowalkowski (Research Specialist,
Department of Anatomy) for technical support on this project.
Conflicts of Interest : None declared.
References
Adams JC. 1981. Heavy metal intensification of DAB-based HRP reaction
product. J Histochem Cytochem. 29(6):775.
Arnault P, Roger M. 1990. Ventral temporal cortex in the rat:
connections of secondary auditory areas Te2 and Te3. J Comp
Neurol. 302(1):110--123.
Bar M. 2009. The proactive brain: memory for predictions. Philos Trans
R Soc Lond B Biol Sci. 364(1521):1235--1243.
Bizley JK, Nodal FR, Bajo VM, Nelken I, King AJ. 2007. Physiological and
anatomical evidence for multisensory interactions in auditory
cortex. Cereb Cortex. 17(9):2172--2189.
Budinger E, Heil P, Hess A, Scheich H. 2006. Multisensory processing via
early cortical stages: connections of the primary auditory cortical
field with other sensory systems. Neuroscience. 143(4):1065--1083.
Calvert GA, Bullmore ET, Brammer MJ, Campbell R, Williams SC,
McGuire PK, Woodruff PW, Iversen SD, David AS. 1997. Activation
of auditory cortex during silent lipreading. Science.
276(5312):593--596.
Caviness VS, Jr. 1975. Architectonic map of neocortex of the normal
mouse. J Comp Neurol. 164(2):247--263.
Caviness VS, Jr, Frost DO. 1980. Tangential organization of thalamic
projections to the neocortex in the mouse. J Comp Neurol.
194(2):335--367.
Christophe E, Doerflinger N, Lavery DJ, Molnar Z, Charpak S, Audinat E.
2005. Two populations of layer V pyramidal cells of the mouse
neocortex: development and sensitivity to anesthetics. J Neuro-
physiol. 94(5):3357--3367.
Clerici WJ, Coleman JR. 1990. Anatomy of the rat medial geniculate
body: I. Cytoarchitecture, myeloarchitecture, and neocortical
connectivity. J Comp Neurol. 297(1):14--31.
Connors BW, Gutnick MJ. 1990. Intrinsic firing patterns of diverse
neocortical neurons. Trends Neurosci. 13(3):99--104.
Contreras D, Llinas R. 2001. Voltage-sensitive dye imaging of neo-
cortical spatiotemporal dynamics to afferent activation frequency.
J Neurosci. 21(23):9403--9413.
Cruikshank SJ, Killackey HP, Metherate R. 2001. Parvalbumin and calbindin
are differentially distributed within primary and secondary subregions
of the mouse auditory forebrain. Neuroscience. 105(3):553--569.
Cruikshank SJ, Rose HJ, Metherate R. 2002. Auditory thalamocortical
synaptic transmission in vitro. J Neurophysiol. 87(1):361--384.
Dehner LR, Keniston LP, Clemo HR, Meredith MA. 2004. Cross-modal
circuitry between auditory and somatosensory areas of the cat
anterior ectosylvian sulcal cortex: a ’new’ inhibitory form of
multisensory convergence. Cereb Cortex. 14(4):387--403.
Doucet JR, Molavi DL, Ryugo DK. 2003. The source of corticocollicular
and corticobulbar projections in area Te1 of the rat. Exp Brain Res.
153(4):461--466.
Driver J, Noesselt T. 2008. Multisensory interplay reveals crossmodal
influences on ’sensory-specific’ brain regions, neural responses, and
judgments. Neuron. 57(1):11--23.
Efron B. 2004. Large-scale simultaneous hypothesis testing: the choice
of a null hypothesis. J Am Stat Assoc. 99(465):96--104.
Engel AK, Fries P, Singer W. 2001. Dynamic predictions: oscillations and
synchrony in top-down processing. Nat Rev Neurosci. 2(10):704--716.
Falchier A, Clavagnier S, Barone P, Kennedy H. 2002. Anatomical
evidence of multimodal integration in primate striate cortex. J
Neurosci. 22(13):5749--5759.
Falchier A, Schroeder CE, Hackett TA, Lakatos P, Nascimento-Silva S,
Ulbert I, Karmos G, Smiley JF. 2010. Projection from visual areas V2
and prostriata to caudal auditory cortex in the monkey. Cereb
Cortex. 20(7):1529--1538.
Felleman DJ, Van Essen DC. 1991. Distributed hierarchical processing in
the primate cerebral cortex. Cereb Cortex. 1(1):1--47.
Franklin KBJ, Paxinos G. 2008. The mouse brain in stereotaxic
coordinates. Amsterdam: Academic Press.
2636 Extrastriate Modulation of Activity in Au1 d Banks et al.
Dow
nloaded from https://academ
ic.oup.com/cercor/article/21/11/2620/277575 by guest on 13 January 2022
Frost DO, Caviness VS Jr. 1980. Radial organization of thalamic
projections to the neocortex in the mouse. J Comp Neurol.
194(2):369--393.
Fu KMG, Johnston TA, Shah AS, Arnold L, Smiley J, Hackett TA,
Garraghty PE, Schroeder CE. 2003. Auditory cortical neurons
respond to somatosensory stimulation. J Neurosci. 23(20):7510--7515.
Galaburda AM, Pandya DN. 1983. The intrinsic architectonic and
connectional organization of the superior temporal region of the
rhesus monkey. J Comp Neurol. 221(2):169--184.
Games KD, Winer JA. 1988. Layer V in rat auditory cortex: projections
to the inferior colliculus and contralateral cortex. Hear Res.
34(1):1--25.
Ghazanfar AA, Maier JX, Hoffman KL, Logothetis NK. 2005. Multisensory
integration of dynamic faces and voices in rhesus monkey auditory
cortex. J Neurosci. 25(20):5004--5012.
Ghazanfar AA, Schroeder CE. 2006. Is neocortex essentially multisen-
sory? Trends Cogn Sci. 10(6):278--285.
Gil Z, Amitai Y. 1996. Properties of convergent thalamocortical and
intracortical synaptic potentials in single neurons of neocortex.
J Neurosci. 16(20):6567--6578.
Hall AJ, Lomber SG. 2008. Auditory cortex projections target the
peripheral field representation of primary visual cortex. Exp Brain
Res. 190(4):413--430.
Hallman LE, Schofield BR, Lin CS. 1988. Dendritic morphology and axon
collaterals of corticotectal, corticopontine, and callosal neurons in
layer V of primary visual cortex of the hooded rat. J Comp Neurol.
272(1):149--160.
Hawkins J, Blakeslee S. 2005. On intelligence. New York: Henry Holt
& Co.
Hefti BJ, Smith PH. 2000. Anatomy, physiology, and synaptic responses
of rat layer V auditory cortical cells and effects of intracellular
GABA(A) blockade. J Neurophysiol. 83(5):2626--2638.
Herbert H, Aschoff A, Ostwald J. 1991. Topography of projections from
the auditory cortex to the inferior colliculus in the rat. J Comp
Neurol. 304(1):103--122.
Herkenham M. 1980. Laminar organization of thalamic projections to
the rat neocortex. Science. 207(4430):532--535.
Heumann D, Leuba G, Rabinowicz T. 1977. Postnatal development of
the mouse cerebral neocortex. II. Quantitative cytoarchitectonics of
visual and auditory areas. J Hirnforsch. 18(6):483--500.
Hirokawa J, Bosch M, Sakata S, Sakurai Y, Yamamori T. 2008. Functional
role of the secondary visual cortex in multisensory facilitation in
rats. Neuroscience. 153(4):1402--1417.
Huang CL, Winer JA. 2000. Auditory thalamocortical projections in
the cat: laminar and areal patterns of input. J Comp Neurol.
427(2):302--331.
Hubener M, Bolz J. 1988. Morphology of identified projection neurons
in layer 5 of rat visual cortex. Neurosci Lett. 94(1--2):76--81.
Johnson RR, Burkhalter A. 1997. A polysynaptic feedback circuit in rat
visual cortex. J Neurosci. 17(18):7129--7140.
Kasper EM, Larkman AU, Lubke J, Blakemore C. 1994. Pyramidal
neurons in layer 5 of the rat visual cortex. I. Correlation among cell
morphology, intrinsic electrophysiological properties, and axon
targets. J Comp Neurol. 339(4):459--474.
Katz LC, Burkhalter A, Dreyer WJ. 1984. Fluorescent latex microspheres
as a retrograde neuronal marker for in vivo and in vitro studies of
visual cortex. Nature. 310(5977):498--500.
Kayser C, Logothetis NK, Panzeri S. 2010. Visual enhancement of the
information representation in auditory cortex. Curr Biol.
20(1):19--24.
Kayser C, Petkov CI, Augath M, Logothetis NK. 2007. Functional
imaging reveals visual modulation of specific fields in auditory
cortex. J Neurosci. 27(8):1824--1835.
Kayser C, Petkov CI, Logothetis NK. 2008. Visual modulation of neurons
in auditory cortex. Cereb Cortex. 18(7):1560--1574.
Kerr JN, Greenberg D, Helmchen F. 2005. Imaging input and output of
neocortical networks in vivo. Proc Natl Acad Sci U S A.
102(39):14063--14068.
Kimura A, Donishi T, Sakoda T, Hazama M, Tamai Y. 2003. Auditory
thalamic nuclei projections to the temporal cortex in the rat.
Neuroscience. 117(4):1003--1016.
Lakatos P, Chen CM, O’Connell MN, Mills A, Schroeder CE. 2007.
Neuronal oscillations and multisensory interaction in primary
auditory cortex. Neuron. 53(2):279--292.
Lakatos P, Karmos G, Mehta AD, Ulbert I, Schroeder CE. 2008.
Entrainment of neuronal oscillations as a mechanism of attentional
selection. Science. 320(5872):110--113.
Lakatos P, O’Connell MN, Barczak A, Mills A, Javitt DC, Schroeder CE.
2009. The leading sense: supramodal control of neurophysiological
context by attention. Neuron. 64(3):419--430.
Lakatos P, Shah AS, Knuth KH, Ulbert I, Karmos G, Schroeder CE. 2005.
An oscillatory hierarchy controlling neuronal excitability and
stimulus processing in the auditory cortex. J Neurophysiol.
94(3):1904--1911.
Le Be JV, Silberberg G, Wang Y, Markram H. 2007. Morphological,
electrophysiological, and synaptic properties of corticocallosal
pyramidal cells in the neonatal rat neocortex. Cereb Cortex.
17(9):2204--2213.
Lee CC, Sherman SM. 2010. Drivers and modulators in the central
auditory pathways. Front Neurosci. 4:79.
Liang M, van Leeuwen TM, Proulx MJ. 2008. Propagation of brain
activity during audiovisual integration. J Neurosci. 28(36):
8861--8862.
Linke R, Schwegler H. 2000. Convergent and complementary projec-
tions of the caudal paralaminar thalamic nuclei to rat temporal and
insular cortex. Cereb Cortex. 10(8):753--771.
Macaluso E. 2006. Multisensory processing in sensory-specific cortical
areas. Neuroscientist. 12(4):327--338.
Martuzzi R, Murray MM, Michel CM, Thiran JP, Maeder PP, Clarke S,
Meuli RA. 2007. Multisensory interactions within human primary
cortices revealed by BOLD dynamics. Cereb Cortex.
17(7):1672--1679.
Mascagni F, McDonald AJ, Coleman JR. 1993. Corticoamygdaloid and
corticocortical projections of the rat temporal cortex: a Phaseolus
vulgaris leucoagglutinin study. Neuroscience. 57(3):697--715.
McGurk H, MacDonald J. 1976. Hearing lips and seeing voices. Nature.
264(5588):746--748.
Meredith MA, Allman BL. 2009. Subthreshold multisensory processing
in cat auditory cortex. Neuroreport. 20(2):126--131.
Meredith MA, Allman BL, Keniston LP, Clemo HR. 2009. Auditory
influences on non-auditory cortices. Hear Res. 258(1--2):64--71.
Merriam EB, Netoff TI, Banks MI. 2005. Bistable network behavior of
layer interneurons in auditory cortex. J Neurosci. 25(26):6175--6186.
Metherate R, Cruikshank SJ. 1999. Thalamocortical inputs trigger
a propagating envelope of gamma-band activity in auditory cortex in
vitro. Exp Brain Res. 126(2):160--174.
Miller MW, Vogt BA. 1984. Direct connections of rat visual cortex with
sensory, motor, and association cortices. J Comp Neurol.
226(2):184--202.
Mitani A, Shimokouchi M. 1985. Neuronal connections in the primary
auditory cortex: an electrophysiological study in the cat. J Comp
Neurol. 235(4):417--429.
Mitani A, Shimokouchi M, Itoh K, Nomura S, Kudo M, Mizuno N. 1985.
Morphology and laminar organization of electrophysiologically
identified neurons in the primary auditory cortex in the cat. J
Comp Neurol. 235(4):430--447.
Murray MM, Molholm S, Michel CM, Heslenfeld DJ, Ritter W, Javitt DC,
Schroeder CE, Foxe JJ. 2005. Grabbing your ear: rapid auditory-
somatosensory multisensory interactions in low-level sensory
cortices are not constrained by stimulus alignment. Cereb Cortex.
15(7):963--974.
Olavarria J, Montero VM. 1989. Organization of visual cortex in the
mouse revealed by correlating callosal and striate-extrastriate
connections. Vis Neurosci. 3(1):59--69.
Paxinos G, Franklin KBJ. 2003. The mouse brain in stereotaxic
coordinates. 2nd ed.. San Diego (CA): Academic Press.
Reiner A, Veenman CL, Medina L, Jiao Y, Del MN, Honig MG. 2000.
Pathway tracing using biotinylated dextran amines. J Neurosci
Methods. 103(1):23--37.
Rockland KS, Ojima H. 2003. Multisensory convergence in calcarine
visual areas in macaque monkey. Int J Psychophysiol. 50(1--2):19--26.
Cerebral Cortex November 2011, V 21 N 11 2637
Dow
nloaded from https://academ
ic.oup.com/cercor/article/21/11/2620/277575 by guest on 13 January 2022

Roger M, Arnault P. 1989. Anatomical study of the connections of the
primary auditory area in the rat. J Comp Neurol. 287(3):339--356.
Romanski LM, LeDoux JE. 1993. Organization of rodent auditory cortex:
anterograde transport of PHA-L from MGv to temporal neocortex.
Cereb Cortex. 3(6):499--514.
Rouiller EM, Simm GM, Villa AE, De Ribaupierre Y, De Ribaupierre F.
1991. Auditory corticocortical interconnections in the cat: evidence
for parallel and hierarchical arrangement of the auditory cortical
areas. Exp Brain Res. 86(3):483--505.
Ryugo DK, Killackey HP. 1974. Differential telencephalic projections of
the medial and ventral divisions of the medial geniculate body of the
rat. Brain Res. 82(1):173--177.
Scheel M. 1988. Topographic organization of the auditory thalamocort-
ical system in the albino rat. Anat Embryol. 179(2):181--190.
Schroeder CE, Foxe JJ. 2002. The timing and laminar profile of
converging inputs to multisensory areas of the macaque neocortex.
Brain Res Cogn Brain Res. 14(1):187--198.
Schroeder CE, Lakatos P, Kajikawa Y, Partan S, Puce A. 2008. Neuronal
oscillations and visual amplification of speech. Trends Cogn Sci.
12(3):106--113.
Shi CJ, Cassell MD. 1997. Cortical, thalamic, and amygdaloid projections
of rat temporal cortex. J Comp Neurol. 382(2):153--175.
Smiley JF, Falchier A. 2009. Multisensory connections of monkey
auditory cerebral cortex. Hear Res. 258(1--2):37--46.
Smith PH, Manning KA, Uhlrich DJ. 2010. Evaluation of inputs to rat
primary auditory cortex from the suprageniculate nucleus and
extrastriate visual cortex. J Comp Neurol. 518(18):3679--
3700.
Stein BE, Meredith MA, Wallace MT. 1993. The visually responsive
neuron and beyond: multisensory integration in cat and monkey.
Prog Brain Res. 95:79--90.
Stein BE, Wallace MT. 1996. Comparisons of cross-modality integration
in midbrain and cortex. Prog Brain Res. 112:289--299.
Stiebler I, Neulist R, Fichtel I, Ehret G. 1997. The auditory cortex of the
house mouse: left-right differences, tonotopic organization and
quantitative analysis of frequency representation. J Comp Physiol A
Sens Neural Behav Physiol. 181(6):559--571.
Stosiek C, Garaschuk O, Holthoff K, Konnerth A. 2003. In vivo two-
photon calcium imaging of neuronal networks. Proc Natl Acad Sci
U S A. 100(12):7319--7324.
Sumby WH, Pollack I. 1954. Visual contribution to speech intelligibility
in noise. J Acoust Soc Am. 26(2):212--215.
Tsiola A, Hamzei-Sichani F, Peterlin Z, Yuste R. 2003. Quantitative
morphologic classification of layer 5 neurons from mouse primary
visual cortex. J Comp Neurol. 461(4):415--428.
Verbny YI, Erdelyi F, Szabo G, Banks MI. 2006. Properties of a population
of GABAergic cells in murine auditory cortex weakly excited by
thalamic stimulation. J Neurophysiol. 96(6):3194--3208.
Wagor E, Mangini NJ, Pearlman AL. 1980. Retinotopic organization of
striate and extrastriate visual cortex in the mouse. J Comp Neurol.
193(1):187--202.
Wallace MT, Meredith MA, Stein BE. 1998. Multisensory integration in the
superior colliculus of the alert cat. J Neurophysiol. 80(2):1006--1010.
Wang Q, Burkhalter A. 2007. Area map of mouse visual cortex. J Comp
Neurol. 502(3):339--357.
White EL, Hersch SM. 1982. A quantitative study of thalamocortical and
other synapses involving the apical dendrites of corticothalamic
projection cells in mouse SmI cortex. J Neurocytol. 11(1):137--157.
Winer JA, Prieto JJ. 2001. Layer V in cat primary auditory cortex (AI):
cellular architecture and identification of projection neurons. J
Comp Neurol. 434(4):379--412.
Wree A, Zilles K, Schleicher A. 1983. A quantitative approach to
cytoarchitectonics. VIII. The areal pattern of the cortex of the
albino mouse. Anat Embryol (Berl). 166(3):333--353.
Zilles K, Wree A. 1985. Cortex: areal and laminar structure. In: Paxinos
G, editor. The rat nervous system. Sydney (Australia): Academic
Press. p. 375--415.
2638 Extrastriate Modulation of Activity in Au1 d Banks et al.
Dow
nloaded from https://academ
ic.oup.com/cercor/article/21/11/2620/277575 by guest on 13 January 2022