02 - MP VA Projections
155
-
Upload
khangminh22 -
Category
Documents
-
view
1 -
download
0
Transcript of 02 - MP VA Projections


Document ControlProf. A.K. Gosain
Dr. Sandhya Rao
Ms. Anamika Arora
Ms. Shradha Ganeriwala
Ms. Ankush Mahajan
Mr. V. Elangovan
Disclaimer“The data and information used for preparing this report have been sourced from secondary sources including state government departments and officials, published sources of Government of India, and climate change assessment made by the consultants. While due care has been taken to ensure authenticity of the data and other information used, any inadvertent wrong data or information used is regretted. We are not liable to any legal or penal responsibilities arising from this and also from the use of this report by anyone.


Preface
The study to assess the climate change risks and vulnerabilities of Madhya Pradesh was taken up under the collaborative project of the Ministry of Environment, Forest & Climate Change, Swiss Agency for Development & Cooperation, United Nations Development Programme (UNDP) and Government of Madhya Pradesh on Strengthening State Strategies for Climate Actions, understanding that Adaptation is the State’s key concern with respect to Climate Change.
Realizing that Vulnerability Assessment (VA) would support in formulating robust adaptation strategies for climate actions and in integrating climate change concerns in sub-national planning processes, the State Government agreed to undertake this study. This study incorporates recent advancements in climate science and the latest emission scenarios adopted by the Intergovernmental Panel on Climate Change (IPCC) in its 5th Assessment report.
Two key challenges before embarking on such a comprehensive State Level assessment was ensuring participation from stakeholders and collecting requisite data from different sectors for different timelines. Uncertainties and constraints of modelling, availability of data across sectors and different timelines, projections for different time scales etc. added to the complexities.
Nevertheless, I believe, a genuine effort has been made to overcome these aspects and meaningful inferences have been drawn from the Vulnerability Assessment study. Translating this academic activity into informed practices and establishing this as connect between science, policy and actions would be the task ahead for us. I am aware that there are ample scopes for further improvement and refinement of this report as the knowledge is ever evolving.
Despite all the barriers and limitations, I am sure that this report will serve the purpose of looking at the Climate Change related developmental issues in a congruent manner. I thank MoEFCC, SDC, EPCO and UNDP for taking up this study for Madhya Pradesh.
Anupam Rajan,Principal Secretary
IAS
Department of Environment Government of Madhya Pradesh
Mantralaya, Vallabh Bhawan, Bhopal-462004 (MP.)Tel. : (0755) 2460038
Anupam RajanDirector General
Environment Planning and Coordination Organisation (EPCO) Bhopal


Environment Planning &Coordination Organisation (An Autonomous organisation, under Govt. of M.P.)Paryavaran Parisar, E-5 Sector, Arera Colony,
Message
The impacts of climate change are increasingly being felt around the world. In the context of Madhya Pradesh, it may become a major environmental threat to the State’s development progress in the coming decades as it could have adverse impacts on food security, natural resources, human health and economic activities. With most of the population dependent on the climate sensitive sectors such as agriculture and forestry for livelihood, any adverse climatic impacts on these sectors will undermine the development efforts of the State. Hence, it becomes imperative to first develop a better scientific understanding of the climate change risks, vulnerability & associated impacts. In this context, I hope that the current vulnerability assessment study is an important milestone towards enhancing the understanding of climate change and its impacts on the key sectors which would assist the policymakers and other stakeholders in developing a range of adaptation options in the future.
I appreciate SKMCCC and UNDP for taking this initiative in developing this vulnerability assessment report.
P.NarahariExecutive Director
P.NarahariExecutive Director


Acknowledgement
The “Climate Change Vulnerability Assessment Report for Madhya Pradesh” represents a collaborative effort, made possible by the input and feedback received from experts in the field of climate change and from National and State Level Government partners working on issues to combat climate change. This report has undertaken climate change vulnerability assessment of select sectors of Water, Forest, Agriculture & Health for the state of Madhya Pradesh. The main purpose of vulnerability assessment is to identify and prioritize the regions and sectors which are likely to be adversely impacted by climate change so as to enable development of adaptation practices and strategies to help mainstream the climate change in to the broader developmental programs and projects. The report has been prepared under the project “Strengthening State Strategies for Climate Actions” being implemented by UNDP in partnership with MoEFCC and supported by Swiss Agency for Development and Cooperation (SDC).
UNDP extends special thanks to Mr. Ravi Shankar Prasad (IAS), Joint Secretary, MoEFCC, Mr. Anupam Rajan (IAS), Principal Secretary, Environment Department, Govt. of Madhya Pradesh, for their insights and guidance.
UNDP take this opportunity to also thank Mr. P. Narahari (IAS), Executive Director, Environmental Planning and Coordination Organisation (EPCO), Govt. of Madhya Pradesh, for his guidance and support in finalising the report. This report could not have completed in this form without the support of Mr. Lokendra Thakkar, Coordinator, SKMCCC, EPCO, Government of Madhya Pradesh.
Special thanks to the staff of Madhya Pradesh State Knowledge Management Centre on Climate Change (SKMCCC) Saransh Bajpai, Pratik Barapatre, Ramratan Simaiya, Ravi Shah and Raashee Abhilashi for their inputs and support in finalizing the report.
UNDP acknowledges the key role played by UNDP State and National teams for leading the process and hosting a number of workshops and meetings which facilitated collaboration and partnerships.
UNDP acknowledges the work of the key authors of the report Professor A.K.Gosain, IIT Delhi and Dr. Sandhya Rao, Integrated Natural Resource Management Consultants (INRM) and her team in carrying out the vulnerability assessment study and report writing.


Table of Contents
Observed Climate of Madhya Pradesh
Introduction 1
Data And Methodology 4
Current Climate Variability and Trend 4
Climate Change Projections and Trend 4
Analysis of Current Climate And Climate Variability 7
Observed Temperature Analysis 7
Annual and Seasonal Observed Temperature Statistics 7
Observed Temperature Trends 19
Observed Rainfall Analysis 23
Annual and Seasonal Observed Rainfall Statistics 25
Observed Rainfall Trends 32
Annual Rainfall Distribution Analysis 35
1 Day Maximum Rainfall Analysis 36
Rainfall Intensity Analysis 37
Historical Indices of Climate Extremes 39
Summary of Observed Climate Data 49
IPCC AR5 Climate Change Scenarios-Madhya Pradesh
Analysis of the Climate Change Scenarios 54
Brief on RCM (Regional Climate Model) 55
CSIRO CCAM 55
Rossby Centre Regional Atmospheric Model, RCA4 55
REMO (MPI-CSC, Hamburg, Germany) 55
Temperature Projections for Madhya Pradesh 56
Analysis of Projected Maximum Temperature 56
Analysis of Projected Minimum Temperature 63
Precipitation Projections for Madhya Pradesh 69
Analysis of Projected Precipitation 69
Projected Future Indices of Climate Extremes 75
Summary - Projected Climate Scenarios for Madhya Pradesh 88
Appendix I 92
1
2

List of Figures
ii
Figure 1 : Weather grid locations for the state of Madhya Pradesh 6
Figure 2 : Long term monthly average, maximum and minimum temperature for Madhya Pradesh (1951-2013) 16
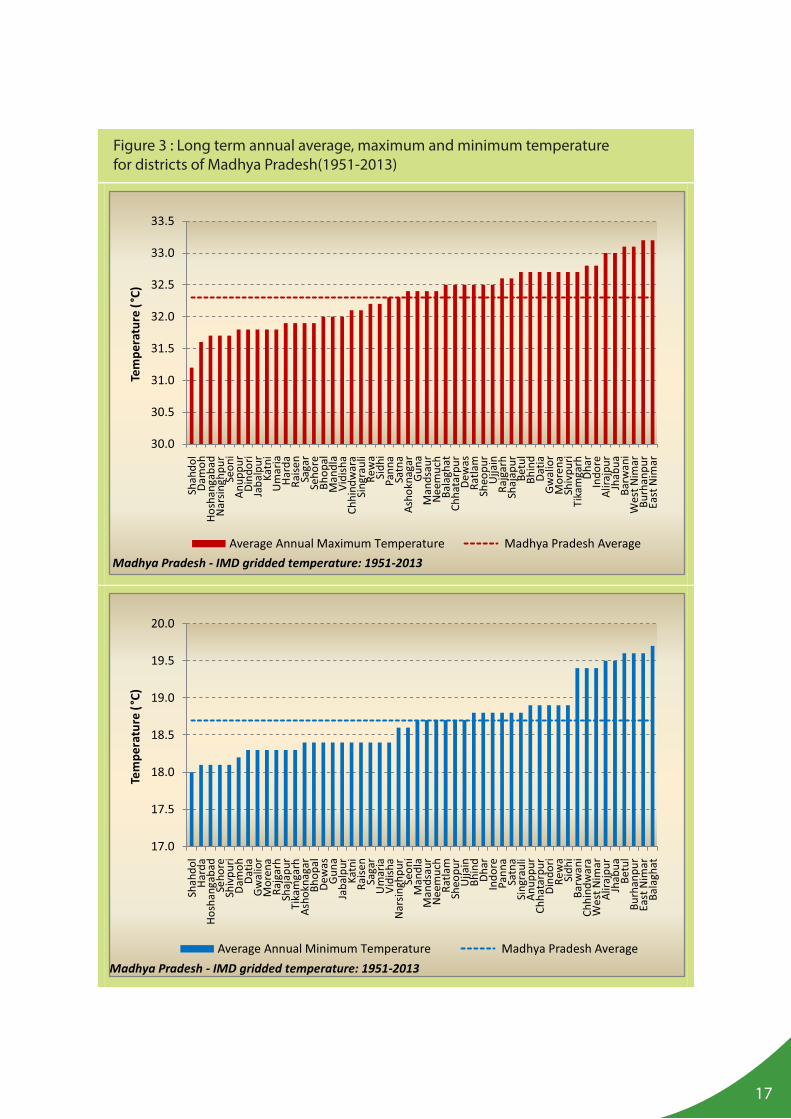
Figure 3 : Long term annual average, maximum and minimum temperature for districts of Madhya Pradesh (1951-2013) 17
Figure 4 : Spatial variation in observed average annual and seasonal maximum and minimum temperature for Madhya Pradesh (1951-2013) 18
Figure 5 : Observed average annual maximum and minimum temperature of Madhya Pradesh (1951-2013) 19
Figure 6 : Spatial variation in observed annual and seasonal maximum and minimum temperature trend 20
Figure 7 : Spatial variation in observed average annual and seasonal rainfall for Madhya Pradesh (1951-2013) 30
Figure 8 : Characteristics of long term average monthly rainfall for Madhya Pradesh (1951-2013) 31
Figure 9 : Long term average annual rainfall for Madhya Pradesh districts (1951-2013) 32
Figure 10 : Characteristics of observed annual rainfall and number of rainy days for Madhya Pradesh 33
Figure 11 : Spatial variation in observed annual and seasonal precipitation trend for Madhya Pradesh (1951-2013) 34
Figure 12 : Frequency of scanty, deficient, normal and excess years of annual rainfall - Madhya Pradesh and its districts (1951-2013) 35
Figure 13 : 1 Day maximum rainfall for Madhya Pradesh (1951-2013) 36
Figure 14 : Average frequency of intensity of daily rainfall events for Madhya Pradesh (1951-2013) 38
Figure 15 : Number of districts showing specific trends in climate extremes indices in Madhya Pradesh districts (1951-2013) 48
Figure 16 : Characteristics of projected annual and seasonal maximum temperature for IPCC AR5 RCP4.5 scenario 57
Figure 17 : Characteristics of simulated projected annual and seasonal maximum temperature for IPCC AR5 RCP8.5 scenario 58
Figure 18 : Spatial representation of projected changes in annual and seasonal maximum temperature for IPCC AR5 RCP4.5 scenario 61
Figure 19 : Spatial representation of projected changes in annual and seasonal maximum temperature for IPCC AR5 RCP8.5 scenario 62
Figure 20 : Characteristics of simulated annual minimum temperature for IPCC AR5 RCP4.5 scenario 64

Figure 21 : Characteristics of simulated annual minimum temperature for IPCC AR5 RCP8.5 scenario 65
Figure 22 : Spatial representation of projected changes in annual and seasonal minimum temperature for IPCC AR5 RCP4.5 scenario 67
Figure 23 : Spatial representation of projected changes in annual and seasonal minimum temperature for IPCC AR5 RCP8.5 scenario 68
Figure 24 : Characteristics of simulated annual precipitation for IPCC AR5 RCP4.5 scenario 70
Figure 25 : Characteristics of simulated annual precipitation for IPCC AR5 RCP8.5 scenario 71
Figure 26 : Spatial representation of projected changes in annual and seasonal precipitation for IPCC AR5 RCP4.5 scenario 73
Figure 27 : Spatial representation of projected changes in annual and seasonal precipitation for IPCC AR5 RCP8.5 scenario 74
Figure 28 : Spatial representation of absolute temperature extremes indices for Madhya Pradesh (IPCC AR5 RCP4.5 and RCP8.5 scenarios) 79
Figure 29 : Spatial representation of percentile temperature extremes indices for Madhya Pradesh (IPCC AR5 RCP4.5 and RCP8.5 scenarios) 81
Figure 30 : Spatial representation of temperature duration indices for Madhya Pradesh (IPCC AR5 RCP4.5 and RCP8.5 scenarios) 83
Figure 31 : Spatial representation of precipitation absolute and percentile indices for Madhya Pradesh (IPCC AR5 RCP4.5 and RCP8.5 scenarios) 84
Figure 32 : Spatial representation of precipitation threshold and duration indices for Madhya Pradesh (IPCC AR5 RCP4.5 and RCP8.5 scenarios) 88
Figure 33 : Characteristics of absolute temperature extremes indices for districts of Madhya Pradesh (IPCC AR5 RCP4.5 and RCP8.5 scenarios) 100
Figure 34 : Characteristics of percentile temperature extremes indices for districts of Madhya Pradesh (IPCC AR5 RCP4.5 and RCP8.5 scenarios) 104
Figure 35 : Characteristics of duration temperature extremes indices for districts of Madhya Pradesh (IPCC AR5 RCP4.5 and RCP8.5 scenarios) 108
Figure 36 : Characteristics of absolute precipitation extremes indices for districts of Madhya Pradesh (IPCC AR5 RCP4.5 and RCP8.5 scenarios) 110
Figure 37 : Characteristics of percentile precipitation extremes indices for districts of Madhya Pradesh (IPCC AR5 RCP4.5 and RCP8.5 scenarios) 112
Figure 38 : Characteristics of duration precipitation extremes indices for districts of Madhya Pradesh (IPCC AR5 RCP4.5 and RCP8.5 scenarios) 114
Figure 39 : Characteristics of threshold precipitation extremes indices for districts of Madhya Pradesh (IPCC AR5 RCP4.5 and RCP8.5 scenario) 116
Figure 40 : Characteristics of other precipitation extremes indices for districts of Madhya Pradesh (IPCC AR5 RCP4.5 and RCP8.5 scenario) 118
iii

List of Tables
iv
Table 1 : Meta data of Climate Variability and Climate Change Projection data used for Madhya Pradesh 5
Table 2 : Observed Temperature Statistics for Madhya Pradesh (1951-2013) 9
Table 3 : Summary of temperature trend for Madhya Pradesh and its districts (1951-2013) 21
Table 4 : Observed Rainfall Statistics for Madhya Pradesh (1951-2013) 24
Table 5 : Precipitation Trend for Madhya Pradesh and its districts 34
Table 6 : List of Climate Extremes Indices 40
Table 7 : Temperature and precipitation extreme indices trend summary for districts of Madhya Pradesh 42
Table 8 : Overview of Representative Concentration Pathways (RCPs) adopted by IPCC AR5 54
Table 9 : List of CORDEX models 55
Table 10 : Change in daily maximum temperature (°C) w.r.t. BL (1981-2010) as simulated by South Asia CORDEX for Madhya Pradesh (IPCC AR5 RCP4.5 scenario) 91
Table 11 : Change in daily maximum temperature (°C) wrt BL (1981-2010) as simulated by South Asia CORDEX for Madhya Pradesh (IPCC AR5 RCP8.5 scenario) 92
Table 12 : Change in daily minimum temperature (°C) wrt BL (1981-2010) as simulated by South Asia CORDEX for Madhya Pradesh (IPCC AR5 RCP4.5 scenario) 94
Table 13 : Change in daily minimum temperature ( °C) wrt BL (1981-2010) as simulated by South Asia CORDEX for Madhya Pradesh (IPCC AR5 RCP8.5 scenario) 95
Table 14 : Change in precipitation (%) wrt BL (1981-2010) as simulated by South Asia CORDEX for Madhya Pradesh (IPCC AR5 RCP4.5 scenario) 97
Table 15 : Change in precipitation (%) wrt BL (1981-2010) as simulated by South Asia CORDEX for Madhya Pradesh (IPCC AR5 RCP8.5 scenario) 100
Table 16 : Trend in Temperature Extremes Indices for districts of Madhya Pradesh (IPCC AR5 RCP4.5 scenario) 120
Table 17 : Trend in Temperature Extremes Indices for districts of Madhya Pradesh (IPCC AR5 RCP8.5 scenario) 123
Table 18 : Trend in Precipitation Extremes Indices for districts of Madhya Pradesh (IPCC AR5 RCP4.5 scenario) 126
Table 19 : Trend in Precipitation Extremes Indices for districts of Madhya Pradesh (IPCC AR5 RCP8.5 scenario) 129

Abbreviations
Abbreviation Definition
% Percent
° Degree
°C Degree Centigrade
BL Baseline
CC Climate Change
CCAM Cubic Conformal Atmospheric Model
CDD Consecutive Dry Days
CLM Climate Limited-Area Model
CORDEX Coordinated Regional Climate Downscaling Experiment
COSMO Consortium for Small-Scale Modelling
COSMO-CLM COSMO Climate Limited-Area Model
CSC Climate Service Center
CSDI Cold Spell Duration Indicator
CSIRO Commonwealth Scientific And Industrial Research Organisation
CV Coefficient of Variation
CWD Consecutive Wet Days
DTR Diurnal Temperature Range
EC End-Century
ESM Earth System Model
ETCCDI Expert Team on Climate Change Detection And Indices
GCAM Global Change Assessment Model
GCM General Circulation Model
IITM Idian Institute of Tropical Meteorology
IMD Indian Meteorological Department
INRM Integrated Natural Resources Management
IPCC Intergovernmental Panel on Climate Change
JF January, February
JJAS June, July, August, September
kg Kilogram
LPA Long Period Average
m Meter
v

MAM March, April, May
MC Mid-Century
mm Millimetre
MPI Max Planck Institute
OND October, November, December
PRCPTOT Wet-Day Precipitation
R Rainfall
R10mm Heavy Precipitation Days
R20mm Very Heavy Precipitation Days
R95p Very Wet Day Precipitation
R99p Extremely Wet Day Precipitation
RCM Regional Climate Models
RCP Representative Concentration Pathway
RR Daily Rainfall
RX1day 1-Day Maximum Precipitation
RX5day 5-Day Maximum Precipitation
SDII Simple Daily Intensity Index
SMHI Swedish Meteorological And Hydrological Institute
sq. km Square Kilometre
SRES Special Report On Emission Scenarios
SW South West
TN Temperature - Minimum
TN10p Cool Nights
Tn90p Warm Nights
TNn Minimum Of Night Time Temperature
TNx Maximum Of Night Time Temperature
Tx Temperature - Maximum
TX10p Cool Days
TX90p Warm Days
TXn Minimum of Day Time Temperature
TXx Maximum of Day Time Temperature
WCRP World Climate Research Programme
WSDI Warm Spell Duration Indicator
vi

This technical report assesses the historical climate variability and trends in mean climate (maximum temperature, minimum temperat-ure and precipitation) and climate indices of extremes in the Indian State of Madhya Pradesh and its 50 districts over the period 1951-2013 (63 years), using historical gridded observations from the India Meteorological Department (IMD). Rainfall data grid resolution is 0.25°x0.25° while temperature data grid resolution is 1°x1° which has been used.
The CORDEX South Asia modelled climate data on precipitation, maximum temperature, minimum temperature and another 21 climate extremes indices have been analysed for Madhya Pradesh State and its 50 districts for baseline, BL (1981-2010), mid-century, MC (2021-2050) and end-century, EC (2071-2100) periods. Climate change projections for precipitation, maximum temperature and minimum temperature have been analysed while trend analysis has been carried out on the climate extremes indices for the State and its districts. The change in climate extremes indices towards MC (2021-2050) and EC (2071-2100) with respect to BL (1981-2010) has also been analysed. Trend tests are run at 10% level of significance to indicate the presence of statistical significant trends over the period of years. Climate grid-resolutions for the climate projection are 0.5°x0.5° (50km x 50km). Three Regional Climate Models (RCM) namely REMO (from MPI), RCA4 (from SMHI) and CCAM (from CSIRO) - for IPCC AR5 climate scenarios-RCP4.5 (moderate emission scenario) and RCP8.5 (a scenario of comparatively high greenhouse gas emissions) have been used to calculate the ensemble mean for precipitation, maximum temperature, minimum temperature and climate extremes indices data for both IPCC AR5 RCP4.5 and RCP8.5 scenarios. Ensemble mean is chosen to reduce model related uncertainties and ensemble mean climate is
closer to observed climate than any individual model.
The summary of the climate data analysis done for Madhya Pradesh State and its districts is as follows:
Observed Climate Data Analysis
Maximum and Minimum Temperature
• IMD gridded daily temperature data from 1951-2013 (63 years) has been used for the analysis. Mean annual maximum temperature for Madhya Pradesh is 32.3°C with a range varying from 31.0°C – 33.5°C. The highest value attained for maximum temperature (37.9°C) is in the pre monsoon season (MAM) while its lowest maximum value (27.1°C) is attained in winter season.
• Mean annual minimum temperature is 18.7°C with a range varying from 17.7°C – 19.8°C. Minimum temperature attains its mean highest value (23.9°C) during monsoon season (JJAS), while it attains its mean lowest value (10.7°C) in winter season.
• For annual maximum temperature the highest value is attained for district East Nimar while the lowest value is attained for district Shahdol for the period 1951-2013 (63 years).
• For annual minimum temperature the highest value is attained for district Balaghat while the lowest value is attained for district Shahdol for the period 1951-2013 (63 years).
• The variability in minimum temperat-ure across the districts is marginally higher than the maximum tempera-ture. However, temporal variation in minimum temperature across the districts of Madhya Pradesh is also low as is evident from the CV values and
Executive Summary
vii

varies from 2% in the Southern districts to 3% in the Northern part of the State.
• Trend analysis shows that positive trend for annual maximum temperature and annual minimum temperature are statistically not significant (with greater than 90% confidence level) for Madhya Pradesh State.
• Annual maximum temperature shows statistically significant positive trend for 9 districts namely, Anuppur, Balaghat, Dindori, Harda, Mandsaur, Narsinghpur, Neemuch, Sehore, Seoni while annual minimum temperature shows statistic-ally significant positive trend for 18 districts.
Precipitation
• Average annual rainfall of Madhya Pradesh State is 1027.3 mm with a range varying from 531.9 mm-1681.1 mm over the 63 years period (1951-2013).Amongst all districts, Hoshanga-bad receives the maximum average annual rainfall while Barwani receives the least. It is observed that the average rainfall decreases from east to west.
• The mean south west monsoon (JJAS months) rainfall contributes the maximum to annual rainfall amounting to approximately 91% for Madhya Pradesh State. Contribution of Pre-monsoon (March, April and May) rainfall on average is 1.8%, contribution of post-monsoon (October, November and December) rainfall in annual rainfall is about 5% and winter rainfall (January, February) contribution is 2%.
• For the period 1951-2013 both annual rainfall and rainy days shows negative trend for Madhya Pradesh State. The negative trend for annual rainfall is statistically not significant while the negative trend for rainy days is statistically significant.
• Districts namely, Ashoknagar, Bhind, Datia, Dindori, East Nimar, Gwalior, Hoshangabad and Morena show significant negative trend in annual rainfall.
• Out of 63 years rainfall analysis, Madhya Pradesh received normal rainfall in 48 years, 8 years had excess rainfall and 7 years received deficit rainfall. Alirajpur district receives the maximum number of 20 years of excess rainfall while Jhabua district has maximum of 22 deficient years of rainfall as compared to the other districts of Madhya Pradesh. Umaria and Seoni districts have maximum of 45 years of normal rainfall.
• The maximum (316.3 mm) and minimum (93.9 mm) annual one day maximum rainfall for Madhya Pradesh State has been recorded on 2007, 7th August and 1966, 30th July respectively.
• 1 day maximum rainfall shows positive trend for the State over the period 1951-2013 and the positive trend is statistically not significant
• August received the highest amount of one day maximum rainfall (41%) followed by July (32%), September (17%) and June and October 5%. Thus about 95% of 1 day maximum rainfall is received in JJAS (monsoon) months in the period of analysis (1951-2013).
• Annual average number of rainy days (when daily rain >=2.5 mm) for period 1951-2013 in Madhya Pradesh State is 69 days and varies from 47 days to 90 days. Light to rather heavy rainfall (2.5 ≤ R ≤ 64.4) events is 68 on average and ranges from 46 to 87 days. Similarly, days when there are heavy rainfall (64.4 < R ≤ 124.4 mm) events is 1 on average and ranges from 0 to 2 days, and very heavy to extremely heavy rainfall (R>
viii

indicating overall warming up for Madhya Pradesh districts.
Precipitation Extremes Indices:
• Absolute indices: Maximum 1 day and maximum 5 day precipitation show positive trend for majority of the districts over the period 1951-2013. However, trend is significant positive for 11 districts for maximum 1 day precipitation and 2 districts for maximum 5 day precipitation. This implies that the intensity of the rainfall has increased for some of the districts of Madhya Pradesh over the period 1951-2013.
• Percentile indices: Very wet day precipitation (R95p) and extremely wet day precipitation (R99p) show positive trend for majority of the districts. However, trend is significant positive for 3 districts only for very wet day precipitation and 6 districts for extremely wet day precipitation. They also show significant negative trend for some of the districts.
• Duration indices: Consecutive dry days are rising for most of the districts. However, trend is statistically significant for 10 districts. Consecutive wet days are falling for 49 districts of Madhya Pradesh. However, trend is statistically significant for 16 districts. This implies drought like situation for the State.
• Threshold indices: Heavy and very heavy precipitation days (R10mm and R20mm) show negative trend, i.e, they are declining for most of the districts of Madhya Pradesh; however the decline is statistically significant for 14 and 7 districts respectively.
• Other indices: Precipitation show negative trend, i.e., they are declining for 41 districts of Madhya Pradesh; however the decline is statistically
124.4 mm) days is negligible.
• Over the 63 years period districts namely, Mandla and Anuppur have the maximum number of total rainy days while Neemuch and Mandsaur has the least number of total rainy days.
Climate Extremes Indices using observed Climate
Temperature Extremes Indices:
• Absolute indices: Maximum of day time temperature (TXx) and minimum of night time temperature (TNn) show positive trend for all the districts. However, TXx and TNn show significant positive trend for 32 districts and 21 districts respectively implying rise in temperatures for these Madhya Pradesh districts. Maximum of night time temperature (TNx) and minimum of day time temperature (TXn) show negative trend for all the districts. TNx and TXn show significant negative trend for 19 districts and 28 districts r e s p e c t i v e l y i m p l y i n g f a l l i n temperatures for these districts.
• Percentile indices: Cool nights (TN10P) and cool days (TX10P) show negative trend while warm nights (TN90P) and warm days (TX90P) show positive trend for the districts, however the trend is statistically significant for majority of the districts for cool nights and warm days. This implies overall warming up for Madhya Pradesh districts, this calls for additional irrigation for crops and higher energy demand for cooling.
• Duration indices: Warmspell duration indicator (WSDI) shows positive trend for all the districts, however the positive trend is statistically significant for 21 districts. Cold spell duration indicator (CSDI) shows negative trend for all the districts, however the negative trend is statistically significant for 30 districts,
ix

century is higher than that of mid-century.
• The projected increase in maximum temperature towards MC does not show significant variation across the districts of Madhya Pradesh for both IPCC AR5 RCP4.5 and RCP8.5 scenarios.
• The projected increase in maximum temperature towards EC varies from 1.8°C in Alirajpur to 2.2°C in Shivpuri district for IPCC AR5 RCP4.5 scenario and 3.9°C in Barwani and West Nimar to 4.6°C in Singrauli and Ashoknagar districts of Madhya Pradesh for IPCC AR5 RCP8.5 scenario.
• Highest maximum temperature increa-se is projected in pre monsoon season (MAM) for IPCC AR5 RCP4.5 and RCP8.5 scenarios towards MC and EC for Madhya Pradesh State as compared to the other seasons.
• For both IPCC AR5 RCP4.5 and RCP8.5 scenarios, increase in annual and seasonal maximum temperature is projected for Madhya Pradesh and its d i s t r i c t s t o w a r d s M C a n d E C . However,IPCC AR5 RCP8.5 scenario shows higher increase than that of IPCC AR5 RCP4.5 scenario.
Projected Minimum Temperature
• Average annual minimum temperature for IPCC AR5 RCP4.5 scenario is projected to increase by about 1.4°C towards mid-century and by 2.6°C towards end - century while for IPCC AR5 RCP8.5 scenario it is projected to increase by about 1.8°C towardsmid-century and 5.3°C towards end - century for Madhya Pradesh State. Thus projected temperature increase towards EC is higher than that of MC.
• The projected increase in minimum temperature towards EC varies from 2.4°C in Ashoknagar to 2.8°C in East
significant for districts namely, Ashoknagar, Bhind, Datia, Dindori, East Nimar, Gwalior, Hoshangabad and Morena while for the other districts it is not significant over the period 1951-2010. Average precipitation on wet days (Simple Daily Intensity Index) show positive trend for majority of the districts. However SDII show significant positive trend for 4 districts namely, Alirajpur, Betul, Rewa and Satna (implying that annual rainfall intensity has increased over the period for these districts). Statistically significant negative trend is observed for 6 districts namely, Bhind, Datia, Gwalior, Morena, Sheopur and Shivpuri.
Projected Climate Data Analysis The CORDEX South Asia modelled climate data on precipitation, maximum temperature, minimum temperature and 21 climate extremes indices have been analysed for Madhya Pradesh State and its 50 districts for baseline (BL, 1981-2010), mid-century (MC, 2021-2050) and end-century (EC, 2071-2100). Ensemble mean of 10 RCMs at a spatial resolution of 50kmx50km has been used. The CORDEX South Asia simulations with the models indicate an all-round warming over the study area. Projected increase in temperature and precipitation towards end-century is higher than that towards mid-century. The summary for three time periods-BL, MC and EC is as follows:
Projected Maximum Temperature
• Average annual maximum temperature for IPCC AR5 RCP4.5 scenario is projected to increase by about 1.3°C towards mid-century and by 2.0°C towards end-century while for IPCC AR5 RCP8.5 scenario it is projected to increase by about 1.6°C towards mid-century and 4.3°C towards end-century for Madhya Pradesh State. Thus projected temperature increase in end-
x

and Sagar show the projected decrease in annual rainfall towards MC and EC with respect to BL for IPCC AR5 RCP4.5 scenario.
• Districts in the Indore division namely, Barwani, West Nimar, Burhanpur and Indore show the highest projected increase (20%-25%) in annual rainfall towards EC while the Eastern districts of Madhya Pradesh namely, Shahdol, Umaria, Jabalpur and Katni show the projected decrease in annual rainfall towards MC and EC with respect to BL for IPCC AR5 RCP8.5 scenario.
• In pre monsoon season (MAM) and post monsoon season (OND) rainfall decrease is projected towards MC while in winter season (JF) highest rainfall increase is projected towards MC and EC for Madhya Pradesh State for IPCC AR5 RCP4.5 scenario.
• In winter season (JF) andpost monsoon season (OND) rainfall decrease is projected towards MC while in winter season (JF) highest rainfall increase is projected towards EC as compared to BL for Madhya Pradesh State for IPCC AR5 RCP8.5 scenario.
Climate Extremes Indices using Projected Climate
Temperature Extreme Indices
• The most representative temperature ex tremes indices that showed significant positive trends for more than half of the districts thus the State for IPCC AR5 RCP4.5 scenario for BL and MC are the maximum of day time temperature, maximum of night time temperature, minimum of night time temperature, warm nights, warm days and warm spell duration indicator. Indices that showed significant negative trends are cool nights, cool
Nimar district for IPCC AR5 RCP4.5 scenario and 5.0°C in Ashoknagar and Damoh districts to 5.7°C in East Nimar district of Madhya Pradesh for IPCC AR5 RCP8.5 scenario.
• Highest minimum temperature increa-se is projected in monsoon season (JJAS) for IPCC AR5 RCP4.5 scenario and pre monsoon season (MAM) and monsoon season (JJAS) for RCP8.5 scenario for both MC and EC for Madhya Pradesh State as compared to the other seasons.
• For IPCC AR5 RCP4.5 and RCP8.5 scenario, minimum temperature show higher projected increase than the maximum temperature towards MC and EC for Madhya Pradesh.
Projected Precipitation • Average annual rainfall for IPCC AR5
RCP4.5 scenario is projected to decrease marginally by about 0.1% towards mid-century and increase by about 4.4% towards end-century while for IPCC AR5 RCP8.5 scenario it is projected to increase marginally by about 0.2% towards mid-century and 5.8% towards end-century for the State. Thus the percentage of the projected rainfall increase is very low towards MC and EC for both the climate scenarios.
• Districts in the South West belonging to Narmadapuram and Indore divisions namely, Barwani, Burhanpur, Jhabua, West Nimar, Dhar, Indore, East Nimar, Alirajpur, Betul, Dewas and Harda show highest projected increase in rainfall as compared to the other districts of Madhya Pradesh towards MC and EC with respect to BL. While some of the districts in the East belonging to Jabalpur and Shahdol divisions namely, Jabalpur, Umaria, Katni, Damoh, Shahdol, Narsinghpur, Mandla, Dindori
xi

scenarios. The model results do not show any consistency in the trend of rainfall indices - for some districts the trend is positive while for others it’s negative.
• Annual precipitation is projected to increase towards MC and EC as compared to BL for majority of the districts for the IPCC AR5 RCP4.5 and RCP8.5 scenar ios. The average precipitation on wet days is expected to decrease for most of the districts towards MC and EC as compared to BL for both the IPCC AR5 climate scenarios.
• Very wet days precipitation and extremely wet days precipitation are projected to decrease towards MC and increase towards EC compared to BL for majority of the districts for IPCC AR5 RCP4.5 scenario. However, these indices are projected to increase for majority of the districts towards MC and EC compared to BL for IPCC AR5 RCP8.5 scenario implying that rainfall intensity would increase in the future for the districts.
• Heavy precipitation days are projected to increase while very heavy precipitati-on days are projected to decrease for majority of the districts towards MC and EC compared to BL for the districts for both the IPCC AR5 climate scenarios.
In light of these consistent temporal trends of warming and increasing precipitation in Madhya Pradesh with large geographic variation, the indicators that have been identified should be further evaluated and assessed for their health impact. Geographical differences in climate trends may be of use in informing policy and resource allocation for climate change adaptation.
days and cold spell duration indicator. Thus there is a warming up scenario for the State of Madhya Pradesh.
• The most representative temperature ex tremes indices that showed significant positive trends for more than half of the districts thus the State for IPCC AR5 RCP8.5 scenario for BL, MC and EC are the minimum of day time temperature, minimum of night time temperature, warm nights, warm days and warm spell duration indicator. Indices that showed significant negative trends are cool nights towards MC. Thus there is a warming up scenario for the State of Madhya Pradesh.
• Cool night’s phenomena do not occur for 15 districts of the State for IPCC AR5 RCP4.5 scenario and for all districts for IPCC AR5 RCP8.5 scenario towards EC.
• Cold Spell Duration Indicator (CSDI) phenomena do not occur (value exceeds the threshold) for all the districts of the State towards MC and EC, for both the IPCC AR5 climate scenarios.
• Percentage of warm days and warm nights is projected to increase while percentage of cool days and cool nights is projected to decrease for all the districts towards MC and EC in comparison to BL implying warming up for both the IPCC AR5 climate scenarios .
• Decrease (cool days and cool nights) / increase (warm days and warm nights) in frequency of these indices towards EC is higher than that of MC which implies higher warming towards EC than MC compared to BL.
Precipitation Extreme Indices
• None of the precipitation extreme indices show significant trends for the majority of the districts of Madhya Pradesh for both IPCC AR5 climate
xii

identified (e.g. using statistical tests) by changes in the mean and/or the variability of its properties and that persists for an extended period, typically decades or longer” (IPCC,
22007 ). Anthropogenic climate change is generally defined as a change in climate which is attributed directly or indirectly to human activity that alters the composition of the global atmosphere (e.g. increase in greenhouse gases due to fossil fuel emissions) or surface characteristics (e.g. deforestation) and which is in addition to natural climate variability observed over comparable time periods.
At all India level mean annual temperature is reported to have increased by 0.6 °C over the
3last century (IMD, 2010 ), and the monsoon rainfall is reported to have declined over the last three decades of the 20th century (Kulkarni
4 5et al 2012 , Krishnan et al 2013 ) over many parts of the country. A number of studies point to an increasing trend in the observed frequency of heavy precipitation events
6 7(Christensen et al. 2013 ; Rajeevan et al. 2008 ; 8 9Krishnamurthy et al. 2009 ; Sen Roy 2009 ;
IntroductionClimate in a narrow sense is usually defined as the average weather, or more rigorously, as the statistical description in terms of the mean and variability of relevant quantities (such as temperature and precipitation) over a period of time ranging from months to thousands or
1millions of years . The classical period for averaging these variables is 30 years, as defined by the World Meteorological Organization. The relevant c l imate parameters include temperature, precipitation and wind. Climate variability refers to variations in the mean state of the climate parameters such as temperature, monthly rainfall, etc. and other statistics (such as standard deviation, statistics of extremes, etc.) of the climate on all temporal and spatial scales beyond that of individual weather events. Variability may be due to natural internal processes within the climate system (internal variability), or to variations in natural (e.g. solar and volcanic) external forcing (external variability).
Climate Change is generally defined as “a change in the state of the climate that can be
1Climate Change 2007: Working Group I: The Physical Science Basis, https://www.ipcc.ch/publications_and_data/ar4/wg1/en/annex1sglossary-a-d.html2Climate Change 2007: Synthesis Report – An Assessment of the Intergovernmental Panel on Climate Change. Adapted by IPCC Plenary XXVII (Valencia, Spain, 12-17 November 2007)3Climate Profile of India, Met Monograph No. Environment Meteorology-01/2010, Government of India, Ministry of Earth Sciences, India Meteorological Department4Kulkarni Ashwini (2012) Weakening of Indian summer monsoon rainfall in warming environment, Theoretical and Applied Climatology, 109, August 2012, DOI:10.1007/s00704-012-0591-4, 447-4595Krishnan R, Sabin TP, Ayantika DC, Kitoh A, Sugi M, Murakami H, Turner AG, Slingo JM, Rajendran K (2013) Will the South Asian monsoon overturning circulation stabilize any further? Climate Dynamics. 40:187–211. doi:10.1007/s00382-012-1317-06Christensen, J.H., K. Krishna Kumar, E. Aldrian, S.-I. An, I.F.A. Cavalcanti, M. de Castro, W. Dong, P. Goswami, A. Hall, J.K. Kanyanga, A. Kitoh, J. Kossin, N.-C. Lau, J. Renwick, D.B. Stephenson, S.-P. Xie and T. Zhou, 2013: Climate Phenomena and their Relevance for Future Regional Climate Change. In: Climate Change 2013: The Physical Science Basis. Contribution of Working Group I to the Fifth Assessment Report of the Intergovernmental Panel on Climate Change [Stocker, T.F., D. Qin, G.-K. Plattner, M. Tignor, S.K. Allen, J. Boschung, A. Nauels, Y. Xia, V. Bex and P.M. Midgley (eds.)]. Cambridge University Press, Cambridge, United Kingdom and New York, NY, USA7Rajeevan, M., J. Bhate, and A. K. Jaswal, 2008: Analysis of variability and trends of extreme rainfall events over India using 104 years of gridded daily rainfall data. Geophys. Res. Lett.,35, doi: 10.1029/2008gl0351438Krishnan R, Sabin TP, Ayantika DC, Kitoh A, Sugi M, Murakami H, Turner AG, Slingo JM, Rajendran K (2013) Will the South Asian monsoon overturning circulation stabilize any further? Climate Dynamics. 40:187–211. doi:10.1007/s00382-012-1317-0
Observed Climate of Madhya Pradesh
1

As the concerns on climate change impacts keep on increasing, the use of climate change projections is becoming increasingly essential on all sectors that deal with weather, water and climate.
It is a challenge to transform the vast amount of data produced in climate models into information that is suitable and relevant for climate change impact studies. While annual, seasonal and monthly mean values of temperature, precipitation and other common variables provide essential and indispensable information regarding the climate and how it may change, they are typically not directly linked to climate impacts. During the last few years, the need for information more directly linked to impacts has resulted in a wide range of climate extremes indices.
Climate extremes indices are developed in a simplified way to communicate more complex climate change impact relations. Mean temperature and precipitation sums can be seen as (simple) climate indices, and the same applies for various measures of climate extremes. The power of the climate index concept, however, is strikingly illustrated with the more complex climate indices that incorporate information on the sensitivity of a specific system, such as exposure time,
13 threshold levels of event intensity etc.
10 Pattanaik and Rajeevan 2010 ) over different parts of the country, and a decreasing trend in
11light rainfall events (Goswami et al. 2006 ) and moderate to heavy rainfall events (Krishnan et al. 20135). Further, the newly developed representative concentration pathways (RCPs) under the Coupled Model Inter-comparison Project 5 (CMIP5) based projections suggest that under the high emission scenarios the mean warming in India could increase to 1.7 -2 °C by 2030s and 3.3 to 4.8 °C by 2080s relative to the preindustrial times; and the all-India precipitation could increase by 4 to 5% by 2030s and 6 to 14% towards the end of the century (2080s) compared to the 1961–1990
12 baseline.
The issue of climate change raises a wide range of burning questions related to the impacts of climate change and adaptation needs. The demand is rapidly growing for practical information on climate projections and the impacts that can be expected in light of them, in different geographical regions and on different sectors. Until now, most of the general knowledge on climate and weather impacts is based on the experience of earlier experienced events, weather observations, forecasts and reanalyses of historical data. The use of climate model results is much less common. The latter are, however, the principle means of gaining insights on climate change that lies ahead of us.
9Sen Roy, S, 2009: A spatial analysis of extreme hourly precipitation patterns in India, Int. J. Climatol., 29, 345-35510Pattanaik, D. R., and M. Rajeevan, 2010: Variability of extreme rainfall events over India during southwest monsoon season.
Meteorol. Appl.,17, 88–10411Goswami, B. N., Venugopal, V., Sengupta, D., Madhusoodanan, M. S., and Prince, K. Xavier. (2006). Increasing Trend of Extreme
Rain Events Over India in a Warming Environment, Science, 1 December. 314: 1442-144512Chaturvedi, RK; Joshi, J; Jayaraman, M; Bala, G; Ravindranath, NH, 2012, Multi-model climate change projections for India under
representative concentration pathways, Current Science, 103(7)791-80213Gunn Persson, Lars Bärring, Erik Kjellström, Gustav Strandberg and Markku Rummukainen, 2007, Climate indices for vulnerability
assessments, SMHI, RMK No. 111,
http://www.smhi.se/polopoly_fs/1.805!Climate%20indices%20for%20vulnerability%20assessments.pdf
2

has been made for temperature and precipitation, as well as extreme climate events for the state of Madhya Pradesh under IPCC AR5 moderate and high emission scenarios of RCP4.5 and RCP8.5 towards mid- and end-century.
This report analyses the historical trends and variability in temperature, precipitation and the extremes of drought and floods, over the state of Madhya Pradesh and its districts, over the period 1951-2013. Further, based on the newly developed regionally downscaled projections from CORDEX simulations, analysis
3

Climate Change Projections and TrendThe CORDEX South Asia modelled data on precipitation, maximum temperature, minimum temperature and another 21 climate extremes indices have been analysed for Madhya Pradesh State and its 50 districts for baseline, BL (1981-2010), mid-century, MC (2021-2050) and end-century, EC (2071-2100). Climate change projections for precipitation, maximum temperature and minimum temperature have been analysed, while trend analysis has been carried out on the climate extremes indices for the State of Madhya Pradesh. The change in climate extremes indices towards MC (2021-2050) and EC (2071-2100) with respect to BL (1981-2010) has also been analysed. Trend tests are run at 10% level of significance to indicate the presence of statistical significant trends over the period of years. Grid-resolutions for the climate projection are 0.5°x0.5° and 108 weather grids data for temperature and precipitation have been used. Climate data from three Regional Climate Models (RCM) of REMO (from MPI), RCA4 (from SMHI) and CCAM (from CSIRO) for IPCC AR5 climate scenarios of RCP4.5 (moderate emission scenario) and RCP8.5 (a scenario of comparatively high greenhouse gas emissions) has been used to calculate the ensemble mean for precipitation, maximum temperature, minimum temperature and climate extremes indices data for both IPCC AR5 RCP4.5 and RCP8.5 scenarios.
Current Climate Variability and Trend
The high resolution (0.25°x0.25° latitude and longitude) daily gridded rainfall data set for 438 precipitation grids provided by Indian Meteorological Department (IMD) for the Madhya Pradesh region for a period of 63 years (1951–2013) for precipitation, and 1.0°x1.0° latitude and longitude daily gridded temperature datasets for 26 temperature grids, spanning over 63 years (1951-2013) for maximum and minimum temperature (Rajeevan et al. 2006) has been used to calculate the variability and trend in precipitation and temperature respectively. Annual, seasonal and monthly mean values of precipitation along with 10 precipitation extremes indices for Madhya Pradesh and its districts have been analysed for the time period 1951-2013 (63 years). Similarly annual, season-al and monthly mean values of maximum temperature, minimum temperature along with 11 climate extremes indices for Madhya Pradesh and its districts have been analysed for the time period 1951-2013 (63 years).
Trends of annual and seasonal maximum and minimum temperature and rainfall variability is studied using the non-parametric Mann-Kendall test, while the increasing or decreasing slope of trends in the time series is determined
14by using Sen’s method (Sen, 1968 ).
14 Sen, P.K., 1968. “Estimates of the regression coefficient based on Kendall's Tau”. J. Am. Stat. Assoc., 63, 1379-1389
Data and Methodology
4

The details of the data used for observed and climate change analysis of Madhya Pradesh and its 50 districts is given in Table 1. The corresponding locations of the grids are shown in Figure 1.
Table 1: Meta data of Climate Variability and Climate Change Projection data used for Madhya Pradesh
No Variable Data Source Period Grid resolution(°) and number of grids
1 Observed Maximum Temperature, Minimum Temperature and Climate extremes indices
IMD, Pune (http://imd.gov.in/)
1951-2013 (63 years)
1° x 1°(26 grids)
2 Observed Precipitation and Climate extremes indices
0.25° x 0.25°(438 grids)
3 Projected Maximum Temperature, Minimum Temperature, Precipitation and Climate extremes indices
CORDEX South Asia, IITM Pune (IPCC AR5 climate scenarios-RCP4.5 and RCP8.5) 3 RCMs (Regional Climate Models)*:· SMHI-RCA4 (Rossby
Centre regional atmospheric model version 4, Swedish Meteorological and Hydrological Institute(SMHI), Sweden)
· CSIRO-CCAM-1391M (CSIRO Marine and Atmospheric Research, Melbourne, Australia)
· MPI-CSC-REMO2009 (Climate Service Centre, Hamburg, Germany)
1981-2010 (BL), 2021-2050 (MC), 2071-2100 (EC)
0.5° x 0.5°(108 grids)
*Climate data from multiple GCM driven CORDEX-Asia Regional Climate simulations have been used to derive ensemble mean for the analysis
5

Figure 1 : Weather grid locations for the state of Madhya Pradesh
The long term trends in observed seasonal precipitation and temperature over Madhya Pradesh and its districts using IMD data at daily time scales has been analysed to arrive at current baseline climatology. Summary is presented in the following paragraphs.
6

temperature (37.9°C) is in the pre-monsoon season (MAM) while its lowest maximum value (27.1°C) is attained in winter season. It is also seen that for annual maximum temperature the highest value is attained for district East Nimar while the lowest value is attained for district Shahdol for the period 1951-2013 (63 years).
In JF season Northern districts namely, Morena, Bhind and Gwalior show relatively lower temperature while during JJAS season they show relatively higher temperature than the other districts of the State. The OND season temperature in South Western districts of the State in divisions of Indore and Ujjain is relatively higher than that of the other parts (Figure 4). Across the MAM season not much variability is observed amongst the districts.
Mean annual minimum temperature is 18.7°C with a range varying from 17.7°C – 19.8°C. Minimum temperature attains its mean highest value (23.9°C) during monsoon season (JJAS), while it attains its mean lowest value (10.7°C) in winter season. The spatial variation in seasonal temperature can be seen from Figure 4. The variability in temperature is highest in the winter season as is also evident from the Coefficient of variation (CV) value given in Table 2. It is also seen that for annual minimum temperature the highest value is attained for district Balaghat while the lowest value is attained for district Shahdol for the period 1951-2013 (63 years).
Madhya Pradesh in Central India has a subtropical climate. Like most of north India it has a hot dry summer (April-June) followed by monsoon rains (July-September) and a cool and relatively dry winter. During the summer season, the temperature reaches more than 45 degree Celsius. The average rainfall decreases from east to west. The south-eastern districts have the heaviest rainfall, some places receiving as much as 2,150 mm (84.6 in), while the western and north-western districts receive 1,000 mm (39.4 in) or less. Winters are very short. Winters start in the mid November and lasts up to the mid February. Impact of winters is just negligible. Rainfall also occurs during the winters due to western disturbances. Usually we can't find extreme temperatures in Madhya Pradesh but still one can experience every season here like summers with heat waves, winters with cold waves and monsoon with
15 heavy rainfall.
Observed Temperature Analysis
Annual and Seasonal Observed Tem-perature Statistics
The observed maximum and minimum temperature for the period 1951-2013 (63 years) shows a spatial and temporal variability, as shown in Table 2.Mean annual maximum temperature for Madhya Pradesh is 32.3°C with a range varying from 31.0°C– 33.5°C. It is evident from Table 2 and Figure 2 that the highest value attained for maximum
15 http://www.madhya-pradesh-tourism.com/travel-guide/climate-weather.html
Analysis of Current Climate and Climate Variability
7

districts (Figure 4).
Temporal variability in minimum temperature across the districts is marginally higher than the maximum temperature. However, temporal variation in minimum temperature across the districts of Madhya Pradesh is also low as is evident from the CV values and varies from 2% in the Southern districts to 3% in the Northern part of the State (Figure 4).
Temporal variability in minimum temperature across the districts is marginally higher than the maximum temperature. However, temporal variation in minimum temperature across the districts of Madhya Pradesh is also low as is evident from the CV values and varies from 2% in the Southern districts to 3% in the Northern part of the State (Figure 4).
In JF season Northern districts show relatively lower temperature while during JJAS season they show relatively higher temperature than the other districts of the State. The OND season temperature in South Western districts of the State namely, Alirajpur, Balaghat, Barwani, Betul, Burhanpur, Chhindwara, East Nimar, Jhabua and West Nimar is relatively higher than that of the other districts (Figure 4). Across the MAM season not much variability is observed amongst the districts.
There is not much temporal variation observed across the districts of Madhya Pradesh in maximum temperature as is evident from the mean maximum temperature and very low CV values (1% to 2%). However, temporal variability in Northern districts of the State is little higher as compared to the Southern
8
16A statistical measure of the dispersion of data points in a data series around the mean. The coefficient of variationrepresents the ratio of the standard deviation to the mean, and it is a useful statistic for comparing the degree of variation from one data series to another, even if the means are drastically different from each other. The advantage of the CV is that it is unitless. This allows CVs to be compared to each other in ways that other measures, like standard deviations or root mean squared residuals, cannot be. Distributions with CV < 1 are considered low-variance, while those with CV > 1 are considered high-variance.

Table 2: Observed Temperature Statistics for Madhya Pradesh (1951-2013)
Maximum Temperature Minimum Temperature
State/District Periods Average (°C)
Range (°C)
CV Average(°C)
Range (°C)
CV
Madhya Pradesh Annual 32.3 31-33.5 0.02 18.7 17.7-19.8 0.02
Winter (JF) 27.1 24.8-30.1 0.04 10.7 9-12.7 0.08
Pre Monsoon (MAM) 37.9 35.9-40.3 0.02 21.6 20.1-23.5 0.03
Monsoon (JJAS) 32.7 30.7-34.7 0.03 23.9 22.8-24.8 0.02
Post Monsoon (OND) 29.6 27.1-31.7 0.03 14.1 12.4-16.2 0.06
Alirajpur Annual 33.0 31.9-34.1 0.01 19.5 18.5-20.6 0.02
Winter (JF) 29.2 27.3-31.5 0.03 12.4 10.6-14.4 0.07
Pre Monsoon (MAM) 38.1 36.4-39.9 0.02 22.1 21-23.8 0.03
Monsoon (JJAS) 32.1 30.6-34.5 0.02 23.7 22.9-24.8 0.02
Post Monsoon (OND) 31.6 29.7-33.6 0.03 16.1 14.3-17.8 0.06
Anuppur Annual 31.8 30.4-33 0.02 18.9 18.2-20 0.02
Winter (JF) 27.0 24.5-29.6 0.03 11.6 10-13.1 0.07
Pre Monsoon (MAM) 37.5 35.4-39.9 0.03 21.7 20.6-23.4 0.03
Monsoon (JJAS) 32.1 30.2-33.7 0.02 23.8 23.1-24.6 0.02
Post Monsoon (OND) 28.7 26.6-30.4 0.03 14.5 12.8-16.5 0.06
Ashoknagar Annual 32.4 30.9-33.8 0.02 18.4 17.4-19.6 0.03
Winter (JF) 26.4 24.3-30.1 0.04 9.8 7.9-12 0.09
Pre Monsoon (MAM) 38.1 35.9-40.8 0.02 21.4 19.6-23.5 0.04
Monsoon (JJAS) 33.2 30.8-35.4 0.03 24.1 23.1-24.9 0.02
Post Monsoon (OND) 29.6 26-32 0.03 13.5 11.8-15.7 0.07
Balaghat Annual 32.5 31.4-33.7 0.01 19.7 18.9-20.6 0.02
Winter (JF) 28.7 26.5-31.3 0.03 13.0 11.4-14.6 0.06
Pre Monsoon (MAM) 38.5 36.4-40.6 0.02 22.8 21.5-24.4 0.03
Monsoon (JJAS) 32.0 30.4-33.5 0.02 23.8 22.8-24.5 0.02
Post Monsoon (OND) 29.6 27.8-31.7 0.03 15.4 13.9-17.9 0.06
Barwani Annual 33.1 32.1-34.1 0.01 19.4 18.6-20.5 0.02
Winter (JF) 30.0 28.3-32.3 0.03 13.0 11.4-15 0.06
Pre Monsoon (MAM) 38.7 37.2-40.4 0.02 22.5 21.4-23.9 0.03
Monsoon (JJAS) 31.9 30.2-33.6 0.02 23.0 22.4-23.9 0.02
Post Monsoon (OND) 31.2 29.4-33.2 0.03 15.9 13.6-17.9 0.06
Betul Annual 32.7 31.7-33.9 0.01 19.6 18.7-20.5 0.02
Winter (JF) 29.4 27.5-32.1 0.03 13.4 11.8-15.2 0.06
Pre Monsoon (MAM) 38.8 37.1-40.7 0.02 23.0 21.5-24.5 0.03
Monsoon (JJAS) 31.7 30-33.3 0.02 23.2 22.4-24.4 0.02
Post Monsoon (OND) 30.1 28.3-32.5 0.03 15.5 13.4-17.7 0.06
9

Maximum Temperature Minimum Temperature
State/District Periods Average (°C)
Range (°C)
CV Average(°C)
Range (°C)
CV
Bhind Annual 32.7 31.2-34 0.02 18.8 17.9-20 0.02
Winter (JF) 24.3 21.8-27.9 0.05 8.7 6.9-10.9 0.10
Pre Monsoon (MAM) 37.9 34.9-40.7 0.03 21.3 19.4-23.7 0.04
Monsoon (JJAS) 35.5 33.3-38.5 0.02 25.9 24.9-26.9 0.02
Post Monsoon (OND) 29.3 25.4-30.6 0.03 13.3 11.8-15.1 0.06
Bhopal Annual 32.0 30.5-33.3 0.02 18.4 17.4-19.6 0.03
Winter (JF) 27.0 24.7-30.4 0.04 10.5 8.6-12.8 0.09
Pre Monsoon (MAM) 37.9 35.9-40.3 0.02 21.6 20-23.6 0.03
Monsoon (JJAS) 32.0 30-33.9 0.03 23.5 22.6-24.2 0.02
Post Monsoon (OND) 29.4 26.6-31.9 0.03 13.8 11.9-16 0.07
Burhanpur Annual 33.2 32.2-34.2 0.01 19.6 18.7-20.5 0.02
Winter (JF) 29.9 27.9-32.4 0.03 13.2 11.5-15.2 0.06
Pre Monsoon (MAM) 39.0 37.5-40.7 0.02 22.9 21.7-24.1 0.03
Monsoon (JJAS) 32.1 30.3-33.9 0.02 23.2 22.5-24.4 0.02
Post Monsoon (OND) 30.9 29-33.3 0.03 15.7 13.6-17.8 0.06
Chhatarpur Annual 32.5 31-33.6 0.02 18.9 17.9-20.2 0.03
Winter (JF) 25.9 23-29.4 0.04 10.0 8.1-12.2 0.09
Pre Monsoon (MAM) 38.2 35.8-40.7 0.02 21.6 20.3-24.1 0.03
Monsoon (JJAS) 33.8 31.4-36 0.03 24.8 23.1-25.7 0.02
Post Monsoon (OND) 29.3 26.1-31.2 0.03 14.0 12.5-16 0.06
Chhindwara Annual 32.1 31.1-33.3 0.01 19.4 18.5-20.3 0.02
Winter (JF) 28.6 26.6-31.3 0.03 13.2 11.6-15.2 0.06
Pre Monsoon (MAM) 38.1 36.2-40.2 0.02 22.6 20.9-24.4 0.03
Monsoon (JJAS) 31.3 29.7-32.8 0.02 23.0 21.6-24 0.02
Post Monsoon (OND) 29.4 27.5-31.7 0.03 15.3 13.7-17.7 0.06
Damoh Annual 31.6 30.1-32.7 0.02 18.2 17.4-19.7 0.03
Winter (JF) 26.4 24-29.5 0.04 10.4 8.7-12.5 0.08
Pre Monsoon (MAM) 37.4 35.4-39.8 0.02 21.2 19.9-23.4 0.04
Monsoon (JJAS) 31.9 29.6-33.8 0.03 23.5 21.8-24.3 0.02
Post Monsoon (OND) 28.6 26.1-30.6 0.03 13.5 11.9-15.8 0.07
Datia Annual 32.7 31.2-33.7 0.02 18.3 17.2-19.6 0.03
Winter (JF) 25.2 22.6-29 0.05 8.7 6.6-11.1 0.10
Pre Monsoon (MAM) 38.0 35.5-41 0.02 21.0 19.4-23.4 0.04
Monsoon (JJAS) 34.7 32.3-37.3 0.03 25.2 23.9-26.3 0.02
Post Monsoon (OND) 29.4 25.8-31.1 0.03 12.9 11.5-15 0.07
10

Maximum Temperature Minimum Temperature
State/District Periods Average (°C)
Range (°C)
CV Average(°C)
Range (°C)
CV
Dewas Annual 32.5 31.3-33.6 0.02 18.4 17.4-19.2 0.02
Winter (JF) 28.3 26-30.7 0.03 10.8 9-12.8 0.08
Pre Monsoon (MAM) 38.3 36.6-40.4 0.02 21.4 20-22.7 0.03
Monsoon (JJAS) 32.0 30.3-33.8 0.03 23.2 22.4-24.1 0.02
Post Monsoon (OND) 30.2 28.2-32.6 0.03 14.0 12-16.2 0.06
Dhar Annual 32.8 31.4-33.8 0.01 18.8 17.9-19.9 0.02
Winter (JF) 28.7 26.5-31.1 0.03 11.3 9.7-13.4 0.08
Pre Monsoon (MAM) 38.2 36.5-40.2 0.02 21.8 20.7-23.3 0.03
Monsoon (JJAS) 32.0 30.4-34 0.03 23.3 22.4-24.1 0.02
Post Monsoon (OND) 30.9 28.9-33 0.03 14.8 12.9-16.8 0.06
Dindori Annual 31.8 30.4-33 0.02 18.9 18.2-20 0.02
Winter (JF) 27.0 24.5-29.6 0.03 11.6 10-13.1 0.07
Pre Monsoon (MAM) 37.5 35.4-39.9 0.03 21.7 20.6-23.4 0.03
Monsoon (JJAS) 32.1 30.2-33.7 0.02 23.8 23.1-24.6 0.02
Post Monsoon (OND) 28.7 26.6-30.4 0.03 14.5 12.8-16.5 0.06
East Nimar Annual 33.2 32.2-34.2 0.01 19.6 18.7-20.5 0.02
Winter (JF) 29.9 27.9-32.4 0.03 13.2 11.5-15.2 0.06
Pre Monsoon (MAM) 39.0 37.5-40.7 0.02 22.9 21.7-24.1 0.03
Monsoon (JJAS) 32.1 30.3-33.9 0.02 23.2 22.5-24.4 0.02
Post Monsoon (OND) 30.9 29-33.3 0.03 15.7 13.6-17.8 0.06
Guna Annual 32.4 30.9-33.8 0.02 18.4 17.4-19.6 0.03
Winter (JF) 26.4 24.3-30.1 0.04 9.8 7.9-12 0.09
Pre Monsoon (MAM) 38.1 35.9-40.8 0.02 21.4 19.6-23.5 0.04
Monsoon (JJAS) 33.2 30.8-35.4 0.03 24.1 23.1-24.9 0.02
Post Monsoon (OND) 29.6 26-32 0.03 13.5 11.8-15.7 0.07
Gwalior Annual 32.7 31.2-33.7 0.02 18.3 17.2-19.6 0.03
Winter (JF) 25.2 22.6-29 0.05 8.7 6.6-11.1 0.10
Pre Monsoon (MAM) 38.0 35.5-41 0.02 21.0 19.4-23.4 0.04
Monsoon (JJAS) 34.7 32.3-37.3 0.03 25.2 23.9-26.3 0.02
Post Monsoon (OND) 29.4 25.8-31.1 0.03 12.9 11.5-15 0.07
Harda Annual 31.9 30.7-33 0.02 18.1 17.1-19.1 0.02
Winter (JF) 27.5 25.3-30.2 0.03 10.5 8.7-12.6 0.08
Pre Monsoon (MAM) 37.7 35.9-39.9 0.02 21.2 19.8-22.7 0.03
Monsoon (JJAS) 31.4 29.9-33.3 0.03 22.9 22-23.8 0.02
Post Monsoon (OND) 29.4 27.3-31.7 0.03 13.4 11.5-15.6 0.07
11

Maximum Temperature Minimum Temperature
State/District Periods Average (°C)
Range (°C)
CV Average(°C)
Range (°C)
CV
Hoshangabad Annual 31.7 30.6-32.9 0.02 18.1 17.2-19 0.02
Winter (JF) 27.3 25-29.9 0.03 10.6 8.8-12.7 0.08
Pre Monsoon (MAM) 37.6 35.7-39.7 0.02 21.2 19.7-22.6 0.03
Monsoon (JJAS) 31.3 29.8-33.1 0.03 22.9 22.2-23.8 0.02
Post Monsoon (OND) 29.2 27.2-31.5 0.03 13.6 11.7-15.6 0.07
Indore Annual 32.8 31.4-33.8 0.01 18.8 17.9-19.9 0.02
Winter (JF) 28.7 26.5-31.1 0.03 11.3 9.7-13.4 0.08
Pre Monsoon (MAM) 38.2 36.5-40.2 0.02 21.8 20.7-23.3 0.03
Monsoon (JJAS) 32.0 30.4-34 0.03 23.3 22.4-24.1 0.02
Post Monsoon (OND) 30.9 28.9-33 0.03 14.8 12.9-16.8 0.06
Jabalpur Annual 31.8 30.2-32.9 0.02 18.4 17.4-19.7 0.02
Winter (JF) 26.5 24-29.5 0.04 10.3 8.5-12.1 0.08
Pre Monsoon (MAM) 37.6 35.7-40 0.02 21.2 19.8-23.1 0.03
Monsoon (JJAS) 32.4 30.1-34.3 0.03 23.9 22.4-24.8 0.02
Post Monsoon (OND) 28.7 26.5-30.6 0.03 13.5 12.1-15.7 0.07
Jhabua Annual 33.0 31.9-34.1 0.01 19.5 18.5-20.6 0.02
Winter (JF) 29.2 27.3-31.5 0.03 12.4 10.6-14.4 0.07
Pre Monsoon (MAM) 38.1 36.4-39.9 0.02 22.1 21-23.8 0.03
Monsoon (JJAS) 32.1 30.6-34.5 0.02 23.7 22.9-24.8 0.02
Post Monsoon (OND) 31.6 29.7-33.6 0.03 16.1 14.3-17.8 0.06
Katni Annual 31.8 30.2-32.9 0.02 18.4 17.4-19.7 0.02
Winter (JF) 26.5 24-29.5 0.04 10.3 8.5-12.1 0.08
Pre Monsoon (MAM) 37.6 35.7-40 0.02 21.2 19.8-23.1 0.03
Monsoon (JJAS) 32.4 30.1-34.3 0.03 23.9 22.4-24.8 0.02
Post Monsoon (OND) 28.7 26.5-30.6 0.03 13.5 12.1-15.7 0.07
Mandla Annual 32.0 30.6-33.2 0.02 18.7 18-19.9 0.02
Winter (JF) 27.6 25.1-30.3 0.04 11.6 10.2-13.2 0.07
Pre Monsoon (MAM) 37.9 35.7-40.3 0.02 21.7 20.3-23.5 0.03
Monsoon (JJAS) 31.8 29.8-33.5 0.02 23.5 22.2-24.3 0.02
Post Monsoon (OND) 29.0 27.2-31 0.03 14.2 12.7-16.4 0.06
Mandsaur Annual 32.4 30.9-33.7 0.02 18.7 17.4-20 0.03
Winter (JF) 26.5 24.5-29.9 0.04 10.2 8.5-12.8 0.10
Pre Monsoon (MAM) 37.7 35.5-40.3 0.02 21.7 19.9-24.1 0.04
Monsoon (JJAS) 33.1 31.4-35.4 0.03 24.1 23.1-25 0.02
Post Monsoon (OND) 30.0 27-32.5 0.03 14.1 12-16.3 0.07
12

Maximum Temperature Minimum Temperature
State/District Periods Average (°C)
Range (°C)
CV Average(°C)
Range (°C)
CV
Morena Annual 32.7 31-34 0.02 18.3 17-19.7 0.03
Winter (JF) 24.3 22.5-27.8 0.05 8.2 6.4-10.5 0.11
Pre Monsoon (MAM) 37.6 34.4-40.8 0.03 20.6 18.6-23.4 0.04
Monsoon (JJAS) 35.6 33.3-38.6 0.02 25.7 24.7-26.7 0.02
Post Monsoon (OND) 29.3 25.2-31.1 0.03 12.7 11.2-14.6 0.07
Narsinghpur Annual 31.7 30.4-32.9 0.02 18.6 17.6-19.7 0.02
Winter (JF) 27.4 25-30 0.04 11.3 9.7-13.1 0.07
Pre Monsoon (MAM) 37.6 35.4-39.9 0.02 21.6 20-23.4 0.03
Monsoon (JJAS) 31.4 29.5-33 0.03 23.3 22.1-24.1 0.02
Post Monsoon (OND) 28.9 27-31 0.03 14.0 12.2-16.2 0.07
Neemuch Annual 32.4 30.9-33.7 0.02 18.7 17.4-20 0.03
Winter (JF) 26.5 24.5-29.9 0.04 10.2 8.5-12.8 0.10
Pre Monsoon (MAM) 37.7 35.5-40.3 0.02 21.7 19.9-24.1 0.04
Monsoon (JJAS) 33.1 31.4-35.4 0.03 24.1 23.1-25 0.02
Post Monsoon (OND) 30.0 27-32.5 0.03 14.1 12-16.3 0.07
Panna Annual 32.3 30.9-33.4 0.02 18.8 17.8-19.9 0.02
Winter (JF) 25.8 22.9-29.2 0.04 10.0 8.1-11.8 0.08
Pre Monsoon (MAM) 38.1 35.9-40.5 0.02 21.6 20-23.7 0.03
Monsoon (JJAS) 33.7 31.3-35.9 0.02 24.9 23.3-25.7 0.02
Post Monsoon (OND) 29.1 26.4-30.9 0.03 13.8 12.3-16 0.06
Raisen Annual 31.9 30.5-33 0.02 18.4 17.4-19.8 0.03
Winter (JF) 26.8 24.3-29.8 0.04 10.4 8.4-12.6 0.09
Pre Monsoon (MAM) 37.8 35.8-40.3 0.02 21.4 19.8-23.5 0.04
Monsoon (JJAS) 32.1 29.9-33.8 0.03 23.7 22.4-24.4 0.02
Post Monsoon (OND) 29.2 26.3-31.3 0.03 13.8 11.9-16 0.07
Rajgarh Annual 32.6 31.2-33.8 0.02 18.3 17.4-19.3 0.02
Winter (JF) 27.6 25.4-30.9 0.04 10.2 8.6-12.3 0.09
Pre Monsoon (MAM) 38.4 36.3-40.6 0.02 21.3 19.7-23.1 0.03
Monsoon (JJAS) 32.5 30.6-34.4 0.03 23.5 22.9-24.4 0.02
Post Monsoon (OND) 30.2 27.3-32.6 0.03 13.7 12-15.8 0.07
Ratlam Annual 32.5 31.1-33.4 0.02 18.7 17.8-19.8 0.02
Winter (JF) 27.7 25.6-30.7 0.04 10.9 9.4-13.1 0.08
Pre Monsoon (MAM) 37.8 35.8-40.1 0.02 21.6 20.2-23.5 0.03
Monsoon (JJAS) 32.2 30.6-34.4 0.03 23.4 22.6-24.3 0.02
Post Monsoon (OND) 30.5 28.1-32.5 0.03 14.5 12.9-16.6 0.06
13

Maximum Temperature Minimum Temperature
State/District Periods Average (°C)
Range (°C)
CV Average(°C)
Range (°C)
CV
Rewa Annual 32.2 30.8-33.2 0.02 18.9 18.1-19.9 0.02
Winter (JF) 25.3 22.4-28.3 0.04 9.8 8.1-11.2 0.08
Pre Monsoon (MAM) 37.8 35.7-40.3 0.02 21.4 19.9-23.4 0.03
Monsoon (JJAS) 34.0 31.8-36 0.02 25.2 23.5-26.1 0.02
Post Monsoon (OND) 28.9 26.3-30.7 0.03 14.0 12.3-16.1 0.06
Sagar Annual 31.9 30.5-33 0.02 18.4 17.4-19.8 0.03
Winter (JF) 26.8 24.3-29.8 0.04 10.4 8.4-12.6 0.09
Pre Monsoon (MAM) 37.8 35.8-40.3 0.02 21.4 19.8-23.5 0.04
Monsoon (JJAS) 32.1 29.9-33.8 0.03 23.7 22.4-24.4 0.02
Post Monsoon (OND) 29.2 26.3-31.3 0.03 13.8 11.9-16 0.07
Satna Annual 32.3 30.9-33.4 0.02 18.8 17.8-19.9 0.02
Winter (JF) 25.8 22.9-29.2 0.04 10.0 8.1-11.8 0.08
Pre Monsoon (MAM) 38.1 35.9-40.5 0.02 21.6 20-23.7 0.03
Monsoon (JJAS) 33.7 31.3-35.9 0.02 24.9 23.3-25.7 0.02
Post Monsoon (OND) 29.1 26.4-30.9 0.03 13.8 12.3-16 0.06
Sehore Annual 31.9 30.7-33 0.02 18.1 17.1-19.1 0.02
Winter (JF) 27.5 25.3-30.2 0.03 10.5 8.7-12.6 0.08
Pre Monsoon (MAM) 37.7 35.9-39.9 0.02 21.2 19.8-22.7 0.03
Monsoon (JJAS) 31.4 29.9-33.3 0.03 22.9 22-23.8 0.02
Post Monsoon (OND) 29.4 27.3-31.7 0.03 13.4 11.5-15.6 0.07
Seoni Annual 31.7 30.4-32.9 0.02 18.6 17.6-19.7 0.02
Winter (JF) 27.4 25-30 0.04 11.3 9.7-13.1 0.07
Pre Monsoon (MAM) 37.6 35.4-39.9 0.02 21.6 20-23.4 0.03
Monsoon (JJAS) 31.4 29.5-33 0.03 23.3 22.1-24.1 0.02
Post Monsoon (OND) 28.9 27-31 0.03 14.0 12.2-16.2 0.07
Shahdol Annual 31.2 29.8-32.3 0.02 18.0 17.2-19.1 0.02
Winter (JF) 25.5 23.1-28.3 0.04 9.9 8.2-11.3 0.08
Pre Monsoon (MAM) 36.7 34.7-39.3 0.03 20.6 19.1-22.6 0.03
Monsoon (JJAS) 32.3 30.1-34.2 0.02 23.8 22.4-24.8 0.02
Post Monsoon (OND) 28.0 25.6-29.8 0.03 13.2 11.7-15.1 0.06
Shajapur Annual 32.6 31.2-33.8 0.02 18.3 17.4-19.3 0.02
Winter (JF) 27.6 25.4-30.9 0.04 10.2 8.6-12.3 0.09
Pre Monsoon (MAM) 38.4 36.3-40.6 0.02 21.3 19.7-23.1 0.03
Monsoon (JJAS) 32.5 30.6-34.4 0.03 23.5 22.9-24.4 0.02
Post Monsoon (OND) 30.2 27.3-32.6 0.03 13.7 12-15.8 0.07
14

Maximum Temperature Minimum Temperature
State/District Periods Average (°C)
Range (°C)
CV Average(°C)
Range (°C)
CV
Sheopur Annual 32.5 30.8-33.9 0.02 18.7 17.4-20.5 0.03
Winter (JF) 25.3 23.5-28.9 0.04 9.5 7.7-12.2 0.10
Pre Monsoon (MAM) 37.5 34.8-40.5 0.03 21.6 19.6-24.7 0.04
Monsoon (JJAS) 34.4 32.3-37.2 0.03 25.0 23.9-26.1 0.02
Post Monsoon (OND) 29.5 25.5-31.8 0.03 13.7 11.9-15.9 0.07
Shivpuri Annual 32.7 31.1-33.9 0.02 18.1 16.7-19.4 0.03
Winter (JF) 25.2 23.4-28.9 0.05 8.4 6.6-11.1 0.11
Pre Monsoon (MAM) 37.9 35.3-40.8 0.03 20.7 18.6-23.2 0.04
Monsoon (JJAS) 34.8 32.5-37.5 0.02 25.1 24-26 0.02
Post Monsoon (OND) 29.5 25.7-31.5 0.03 12.6 10.8-15 0.08
Sidhi Annual 32.2 30.8-33.2 0.02 18.9 18.1-19.9 0.02
Winter (JF) 25.3 22.4-28.3 0.04 9.8 8.1-11.2 0.08
Pre Monsoon (MAM) 37.8 35.7-40.3 0.02 21.4 19.9-23.4 0.03
Monsoon (JJAS) 34.0 31.8-36 0.02 25.2 23.5-26.1 0.02
Post Monsoon (OND) 28.9 26.3-30.7 0.03 14.0 12.3-16.1 0.06
Singrauli Annual 32.1 30.5-33.2 0.02 18.8 17.7-19.9 0.02
Winter (JF) 25.3 23-28.3 0.04 10.0 8-11.5 0.08
Pre Monsoon (MAM) 37.5 35.6-39.8 0.02 21.0 19.1-22.9 0.03
Monsoon (JJAS) 33.9 31.6-35.4 0.02 25.0 23.7-26 0.02
Post Monsoon (OND) 28.6 26.2-30.5 0.03 14.1 12.8-16.3 0.06
Tikamgarh Annual 32.7 31.2-33.7 0.02 18.3 17.2-19.6 0.03
Winter (JF) 25.2 22.6-29 0.05 8.7 6.6-11.1 0.10
Pre Monsoon (MAM) 38.0 35.5-41 0.02 21.0 19.4-23.4 0.04
Monsoon (JJAS) 34.7 32.3-37.3 0.03 25.2 23.9-26.3 0.02
Post Monsoon (OND) 29.4 25.8-31.1 0.03 12.9 11.5-15 0.07
Ujjain Annual 32.5 31.1-33.4 0.02 18.7 17.8-19.8 0.02
Winter (JF) 27.7 25.6-30.7 0.04 10.9 9.4-13.1 0.08
Pre Monsoon (MAM) 37.8 35.8-40.1 0.02 21.6 20.2-23.5 0.03
Monsoon (JJAS) 32.2 30.6-34.4 0.03 23.4 22.6-24.3 0.02
Post Monsoon (OND) 30.5 28.1-32.5 0.03 14.5 12.9-16.6 0.06
Umaria Annual 31.8 30.2-32.9 0.02 18.4 17.4-19.7 0.02
Winter (JF) 26.5 24-29.5 0.04 10.3 8.5-12.1 0.08
Pre Monsoon (MAM) 37.6 35.7-40 0.02 21.2 19.8-23.1 0.03
Monsoon (JJAS) 32.4 30.1-34.3 0.03 23.9 22.4-24.8 0.02
Post Monsoon (OND) 28.7 26.5-30.6 0.03 13.5 12.1-15.7 0.07
15

Maximum Temperature Minimum Temperature
State/District Periods Average (°C)
Range (°C)
CV Average(°C)
Range (°C)
CV
Vidisha Annual 32.0 30.5-33.3 0.02 18.4 17.4-19.6 0.03
Winter (JF) 27.0 24.7-30.4 0.04 10.5 8.6-12.8 0.09
Pre Monsoon (MAM) 37.9 35.9-40.3 0.02 21.6 20-23.6 0.03
Monsoon (JJAS) 32.0 30-33.9 0.03 23.5 22.6-24.2 0.02
Post Monsoon (OND) 29.4 26.6-31.9 0.03 13.8 11.9-16 0.07
West Nimar Annual 33.1 32.1-34.1 0.01 19.4 18.6-20.5 0.02
Winter (JF) 30.0 28.3-32.3 0.03 13.0 11.4-15 0.06
Pre Monsoon (MAM) 38.7 37.2-40.4 0.02 22.5 21.4-23.9 0.03
Monsoon (JJAS) 31.9 30.2-33.6 0.02 23.0 22.4-23.9 0.02
Post Monsoon (OND) 31.2 29.4-33.2 0.03 15.9 13.6-17.9 0.06
Figure 2 : Long term monthly average, maximum and minimum temperature forMadhya Pradesh(1951-2013)
16
30.0
30.5
31.0
31.5
32.0
32.5
33.0
33.5
Shah
do
lD
amo
hH
osh
anga
bad
Nar
sin
ghp
ur
Seo
ni
An
up
pu
rD
ind
ori
Jab
alp
ur
Kat
ni
Um
aria
Har
da
Rai
sen
Saga
rSe
ho
reB
ho
pal
Man
dla
Vid
ish
aC
hh
ind
war
aSi
ngr
auli
Rew
aSi
dh
iPa
nn
aSa
tna
Ash
okn
agar
Gu
na
Man
dsa
ur
Nee
mu
chB
alag
hat
Ch
hat
arp
ur
Dew
asR
atla
mSh
eop
ur
Ujja
inR
ajga
rhSh
ajap
ur
Bet
ul
Bh
ind
Dat
iaG
wal
ior
Mo
ren
aSh
ivp
uri
Tika
mga
rhD
har
Ind
ore
Alir
ajp
ur
Jhab
ua
Bar
wan
iW
est
Nim
arB
urh
anp
ur
East
Nim
ar
Tem
pe
ratu
re (
°C)
Average Annual Maximum Temperature Madhya Pradesh Average
Madhya Pradesh - IMD gridded temperature: 1951-2013
17.0
17.5
18.0
18.5
19.0
19.5
20.0
Shah
do
lH
ard
aH
osh
anga
bad
Seh
ore
Shiv
pu
riD
amo
hD
atia
Gw
alio
rM
ore
na
Raj
garh
Shaj
apu
rTi
kam
garh
Ash
okn
agar
Bh
op
alD
ewas
Gu
na
Jab
alp
ur
Kat
ni
Rai
sen
Saga
rU
mar
iaV
idis
ha
Nar
sin
ghp
ur
Seo
ni
Man
dla
Man
dsa
ur
Nee
mu
chR
atla
mSh
eop
ur
Ujja
inB
hin
dD
har
Ind
ore
Pan
na
Satn
aSi
ngr
auli
An
up
pu
rC
hh
atar
pu
rD
ind
ori
Rew
aSi
dh
iB
arw
ani
Ch
hin
dw
ara
Wes
t N
imar
Alir
ajp
ur
Jhab
ua
Bet
ul
Bu
rhan
pu
rEa
st N
imar
Bal
agh
at
Tem
pe
ratu
re (
°C)
Average Annual Minimum Temperature Madhya Pradesh Average
Madhya Pradesh - IMD gridded temperature: 1951-2013
Figure 3 : Long term annual average, maximum and minimum temperature for districts of Madhya Pradesh(1951-2013)
17

Figure 4 : Spatial variation in observed average annual and seasonal maximum and minimum temperature for Madhya Pradesh (1951-2013)
18

19
shows statistically significant positive trend for 9 districts namely, Anuppur, Balaghat, Dindori, Harda, Mandsaur, Narsinghpur, Neemuch, Sehore and Seoni while annual minimum temperature shows statistically significant positive trend for 18 districts as can be observed (Table 3 and Figure 6).
• Significant negative trend is observed during winter season (JF) in all the districts while in pre monsoon (MAM), monsoon season (JJAS) and post monsoon (OND) season most of the districts show positive trend with spatially varying significance. In pre monsoon (MAM) season some of the districts falling in Indore, Ujjain, Chambal and Jabalpur divisions show significant positive trend in maximum temperature. In post monsoon (OND) season some of the districts of Narmadapuram, Jabalpur, Shahdol and Rewa divisions show significant positive trend in maximum temperature (Figure 6).
• The variation in post monsoon most of the districts show a significant rise in minimum temperature (Figure 6).
Observed Temperature TrendsTrend tests have been carried out to analyse the presence of statistical significant trends over the period of years. Annual average maximum and minimum temperature trends for the state of Madhya Pradesh shown is shown in Figure 5. The spatial variation in annual and seasonal maximum and minimum temperature trends for the districts of Madhya Pradesh (1951-2013) is shown in Figure 6. Trend summary of annual maximum and minimum temperature for the State is shown in Table 3.
Trend analysis for maximum and minimum temperature for Madhya Pradesh and its districts (1951-2013) from Table 3, Figure 5 and Figure 6 are summarized as follows:
• Positive trend in both mean annual maximum temperature and mean annual minimum temperature is observed for Madhya Pradesh State and the change per year is negligible (Figure 5).
• Trend analysis shows that the positive trend for annual maximum temperature and minimum temperature are statistically not significant for Madhya Pradesh State. However, annual maximum temperature
Figure 5 : Observed average annual maximum and minimum temperature of Madhya Pradesh(1951-2013)

y = 0.006x + 18.492
16.5
17.0
17.5
18.0
18.5
19.0
19.5
20.0
19
51
19
53
19
55
19
57
19
59
19
61
19
63
19
65
19
67
19
69
19
71
19
73
19
75
19
77
19
79
19
81
19
83
19
85
19
87
19
89
19
91
19
93
19
95
19
97
19
99
20
01
20
03
20
05
20
07
20
09
20
11
20
13
Tem
pe
ratu
re(°
C)
Average Annual Minimum Temperature
Linear (Average Annual Minimum Temperature)
Madhya Pradesh - IMD gridded temperature: 1951-2013
Figure 5 : Observed averageannual maximum and minimum temperature of Madhya Pradesh(1951-2013)
Figure 6 : Spatial variation in observed annual and seasonal maximum and minimum temperature trend
20

State/District Annual Maximum Temp
Annual Minimum Temp
Annual Maximum Temperature (°C/63 years)
Annual Minimum Temperature (°C/63 years)
Madhya Pradesh 0.36 0.33
Alirajpur 0.22 0.36
Anuppur 0.57 0.20
Ashoknagar 0.35 0.66
Balaghat 0.46 0.21
Barwani 0.23 0.00
Betul 0.36 0.14
Bhind 0.14 0.38
Bhopal 0.42 0.49
Burhanpur 0.34 -0.07
Chhatarpur 0.24 0.26
Chhindwara 0.29 0.34
Damoh 0.28 0.48
Datia 0.37 0.45
Dewas 0.43 0.08
Figure 6 : Spatial variation in observed annual and seasonal maximum and minimum temperature trend
Thus, it can be concluded that there is significant variation in annual maximum and minimum temperature over the period 1951-2013 (63 years) for Madhya Pradesh.
Table 3: Summary of temperature trend for Madhya Pradesh and its districts (1951-2013)
21

State/District Annual Maximum Temp
Annual Minimum Temp
Annual Maximum Temperature (°C/63 years)
Annual Minimum Temperature (°C/63 years)
Dhar 0.32 0.07
Dindori 0.57 0.20
East Nimar 0.34 -0.07
Guna 0.35 0.66
Gwalior 0.37 0.45
Harda 0.56 0.27
Hoshangabad 0.43 0.40
Indore 0.32 0.07
Jabalpur 0.39 0.26
Jhabua 0.22 0.36
Katni 0.39 0.26
Mandla 0.41 0.29
Mandsaur 0.68 1.01
Morena 0.20 0.93
Narsinghpur 0.51 0.47
Neemuch 0.68 1.01
Panna 0.35 -0.03
Raisen 0.27 0.60
Rajgarh 0.40 0.47
Ratlam 0.45 0.41
Rewa 0.38 -0.08
Sagar 0.27 0.60
Satna 0.35 -0.03
Sehore 0.56 0.27
Seoni 0.51 0.47
Shahdol 0.45 0.28
Shajapur 0.40 0.47
Sheopur 0.43 1.27
Shivpuri 0.29 0.96
Sidhi 0.38 -0.08 Singrauli 0.15 -0.25 Tikamgarh 0.37 0.45 Ujjain 0.45 0.41 Umaria 0.39 0.26 Vidisha 0.42 0.49 West Nimar 0.23 0.00
Positive Significant trend Negative Significant trend No Change
Positive Non-significant trend Negative Non-significant trend NA
22

23
from east to west. The south-eastern districts namely Dindori, Anuppur, Jabalpur, Balaghat, Mandla and Hoshangabad have the heaviest rainfall, while the western and northern districts receive 1,000 mm or less (Figure 7). The coefficient of variation in annual rainfall lies in the range of 0.18 to 0.34 (18% to 34%) across the districts of Madhya Pradesh thus marginal variability is observed across the districts.
From Table 4 and Figure 8 it can be seen that the mean south west monsoon (June, July, August and September months) rainfall contributes the maximum to annual rainfall amounting to approximately 91% for Madhya Pradesh State. Contribution of pre-monsoon (March, April and May) rainfall on average is 1.8%, contribution of post-monsoon (October, November and December) rainfall in annual rainfall is about 5% and winter rainfall (January, February) contribution is 2%. The spatial variation in seasonal rainfall can be seen from Figure 7. In JF, MAM and OND season not much variability is observed across the districts of Madhya Pradesh. In JJAS season South Eastern parts of Madhya Pradesh receive higher rainfall as compared to the other parts.
The coefficient of variation (inter annual variation in rainfall) is relatively low during JJAS season as rainfall variability is least during these months very high during the other three seasons due to higher variability in rainfall during these months. However, CV of monsoon rainfall is estimated to increase from east to west (Table 4 and Figure 7).
Observed Rainfall AnalysisInformation on spatial and temporal variations of rainfall is essential in understanding the hydrological balance on a global or regional scale. The distribution of precipitation is also impor tant for water management in agriculture, power generation and drought-monitoring. In India, rainfall received during the southwest monsoon season (June– September) is crucial for its economy. Real-time monitoring of rainfall distribution on a daily basis is required to evaluate the progress and status of monsoon and to initiate necessary action to control drought/flood situations.
Annual and Seasonal Observed Rainfall Statistics
Table 4 illustrates the summary of observed rainfall statistics;-average, range and coefficient of variation (CV) of annual and seasonal rainfall for Madhya Pradesh and its districts. Figure 7 depicts spatial variation in annual rainfall mean and its CV values for Madhya Pradesh districts. Monthly average rainfall summary of Madhya Pradesh over 1951-2013 (63 years) is represented in Figure 8. District wise average annual rainfall is shown in Figure 9.
Average annual rainfall of Madhya Pradesh State is 1027. 3 mm with a range varying from 531.9 mm-1681.1 mm over the 63 years period (1951-2013). Amongst all districts, Hoshanga-bad receives the maximum average annual rainfall while Barwani receives the least. It is observed that the average rainfall decreases

Table 4: Observed Rainfall Statistics for Madhya Pradesh (1951-2013)
District/State Season Average Rainfall (mm)
Range (mm) Inter-annual variation
Contribution to Annual Rainfall (%)
Madhya Pradesh Annual 1027.3 531.9-1681.1 0.3 Winter (JF) 20.8 0-100.3 1.2 2.0
Pre Monsoon (MAM) 18.2 0.3-109.6 1.2 1.8
Monsoon (JJAS) 937.7 453.1-1563.4 0.3 91.3
Post Monsoon (OND) 50.6 0.1-242.8 1.0 4.9
Alirajpur Annual 934.2 405.2-1565 0.3 Winter (JF) 4.0 0-41 1.7 0.4
Pre Monsoon (MAM) 8.1 0-68.9 1.7 0.9
Monsoon (JJAS) 875.6 343.5-1536 0.3 93.7
Post Monsoon (OND) 46.6 0-165.8 0.9 5.0
Anuppur Annual 1259.0 797.9-1844 0.2 Winter (JF) 37.7 0-153.8 1.0 3.0
Pre Monsoon (MAM) 50.2 4.3-191.4 0.8 4.0
Monsoon (JJAS) 1104.0 665.5-1676 0.2 87.7
Post Monsoon (OND) 67.2 1.2-250.8 0.8 5.3
Ashoknagar Annual 947.4 427.3-1672 0.3 Winter (JF) 18.1 0-98.5 1.3 1.9
Pre Monsoon (MAM) 9.5 0-54.1 1.2 1.0
Monsoon (JJAS) 876.2 338.7-1572 0.3 92.5
Post Monsoon (OND) 43.7 0-309.3 1.3 4.6
Balaghat Annual 1300.0 558.3-2283 0.3 Winter (JF) 31.2 0-163.3 1.2 2.4
Pre Monsoon (MAM) 27.7 1-117.4 1.0 2.1
Monsoon (JJAS) 1167.0 528.9-2169 0.3 89.8
Post Monsoon (OND) 74.3 0.3-361.9 0.9 5.7
Barwani Annual 739.3 378.9-1299 0.3 Winter (JF) 4.0 0-28.7 1.4 0.5
Pre Monsoon (MAM) 8.5 0-62.6 1.2 1.1
Monsoon (JJAS) 678.1 359.3-1250 0.3 91.7
Post Monsoon (OND) 48.7 0-188.7 0.9 6.6
Betul Annual 1104.0 535-1749 0.2
Winter (JF) 20.1 0-132.7 1.3 1.8
Pre Monsoon (MAM) 21.5 0.1-118.4 1.1 1.9
Monsoon (JJAS) 993.4 528-1579 0.3 90.0
Post Monsoon (OND) 69.5 0.1-247 0.8 6.3
Bhind Annual 746.2 350.2-1240 0.3
Winter (JF) 20.5 0-99.5 1.2 2.7
Pre Monsoon (MAM) 15.2 0.4-68.8 1.0 2.0
Monsoon (JJAS) 664.5 288-1033 0.3 89.1
24

District/State Season Average Rainfall (mm)
Range (mm) Inter-annual variation
Contribution to Annual Rainfall (%)
Post Monsoon (OND) 46.0 0-246.3 1.3 6.2
Bhopal Annual 1129.0 626.6-1722 0.2
Winter (JF) 20.4 0-126.4 1.3 1.8
Pre Monsoon (MAM) 16.7 0-122.2 1.3 1.5
Monsoon (JJAS) 1038.0 436.5-1633 0.2 91.9
Post Monsoon (OND) 53.2 0-321.9 1.1 4.7
Burhanpur Annual 882.4 450-1408 0.2
Winter (JF) 7.0 0-32.9 1.4 0.8
Pre Monsoon (MAM) 15.7 0-124.9 1.3 1.8
Monsoon (JJAS) 796.0 437-1215 0.2 90.2
Post Monsoon (OND) 63.6 0.1-218.2 0.8 7.2
Chhatarpur Annual 1047.0 523-1738 0.2
Winter (JF) 29.5 0-126.6 1.0 2.8
Pre Monsoon (MAM) 16.4 0-65.5 0.9 1.6
Monsoon (JJAS) 952.9 430.5-1686 0.3 91.0
Post Monsoon (OND) 48.0 0-218.8 1.1 4.6
Chhindwara Annual 1159.0 768.4-1767 0.2
Winter (JF) 27.7 0-176.9 1.1 2.4
Pre Monsoon (MAM) 29.2 0.4-133.3 0.9 2.5
Monsoon (JJAS) 1028.0 637.5-1629 0.2 88.7
Post Monsoon (OND) 74.5 0.7-365.3 1.0 6.4
Damoh Annual 1125.0 562.6-1778 0.2
Winter (JF) 29.0 0-111.7 1.0 2.6
Pre Monsoon (MAM) 16.9 0-83.3 1.0 1.5
Monsoon (JJAS) 1033.0 391.4-1627 0.3 91.8
Post Monsoon (OND) 46.6 0-234.2 1.1 4.1
Datia Annual 830.7 446-1347 0.3
Winter (JF) 20.3 0-110.5 1.3 2.4
Pre Monsoon (MAM) 14.5 0-98.7 1.1 1.7
Monsoon (JJAS) 751.5 288.8-1097 0.3 90.5
Post Monsoon (OND) 44.5 0-235.3 1.3 5.4
Dewas Annual 1011.0 529-1795 0.3
Winter (JF) 10.2 0-62.1 1.4 1.0
Pre Monsoon (MAM) 11.0 0-82.7 1.5 1.1
Monsoon (JJAS) 941.5 522.9-1733 0.3 93.1
Post Monsoon (OND) 48.1 0-205.4 1.0 4.8
Dhar Annual 841.9 397.2-1489 0.3
Winter (JF) 4.2 0-32.7 1.6 0.5
Pre Monsoon (MAM) 7.3 0-74.5 1.5 0.9
Monsoon (JJAS) 785.1 381.5-1454 0.3 93.3
Post Monsoon (OND) 45.4 0-171.9 0.9 5.4
25

District/State Season Average Rainfall (mm)
Range (mm) Inter-annual variation
Contribution to Annual Rainfall (%)
Dindori Annual 1245.0 505.4-1846 0.2
Winter (JF) 38.4 0-127.9 0.9 3.1
Pre Monsoon (MAM) 39.7 2.6-174.7 0.9 3.2
Monsoon (JJAS) 1104.0 441.7-1690 0.2 88.7
Post Monsoon (OND) 63.5 0.1-268.2 0.8 5.1
East Nimar Annual 1002.0 592.3-1645 0.3
Winter (JF) 9.1 0-64.4 1.5 0.9
Pre Monsoon (MAM) 13.3 0-95.8 1.4 1.3
Monsoon (JJAS) 927.3 530.5-1558 0.3 92.5
Post Monsoon (OND) 52.4 0.6-184.7 0.9 5.2
Guna Annual 970.0 496.5-1530 0.3
Winter (JF) 16.6 0-90.1 1.2 1.7
Pre Monsoon (MAM) 15.0 0-92.2 1.3 1.5
Monsoon (JJAS) 895.3 327.6-1506 0.3 92.3
Post Monsoon (OND) 43.1 0-360.8 1.4 4.4
Gwalior Annual 829.9 485.9-1426 0.2
Winter (JF) 19.7 0-101.9 1.2 2.4
Pre Monsoon (MAM) 15.4 0.2-102.2 1.1 1.9
Monsoon (JJAS) 749.2 305.6-1163 0.2 90.3
Post Monsoon (OND) 45.6 0-233.9 1.3 5.5
Harda Annual 1179.0 554.4-1905 0.3
Winter (JF) 12.6 0-64.9 1.3 1.1
Pre Monsoon (MAM) 13.5 0-107.2 1.6 1.1
Monsoon (JJAS) 1098.0 511.5-1864 0.3 93.1
Post Monsoon (OND) 54.9 0-219.5 1.0 4.7
Hoshangabad Annual 1315.0 795.9-2167 0.3
Winter (JF) 20.0 0-91.1 1.1 1.5
Pre Monsoon (MAM) 19.2 0-135.1 1.2 1.5
Monsoon (JJAS) 1218.0 743.3-1981 0.3 92.6
Post Monsoon (OND) 56.9 0-272.8 1.0 4.3
Indore Annual 944.4 443.2-1937 0.3
Winter (JF) 7.1 0-38.4 1.4 0.8
Pre Monsoon (MAM) 11.1 0-68.3 1.2 1.2
Monsoon (JJAS) 870.9 420.4-1849 0.3 92.2
Post Monsoon (OND) 55.4 0-383.5 1.1 5.9
Jabalpur Annual 1277.0 640.8-2043 0.2
Winter (JF) 32.6 0-118.5 0.9 2.6
Pre Monsoon (MAM) 23.7 0.7-110.8 1.0 1.9
Monsoon (JJAS) 1167.0 510.4-1837 0.3 91.4
Post Monsoon (OND) 53.0 0-350.9 1.1 4.2
Jhabua Annual 850.0 407.3-1612 0.3
26

District/State Season Average Rainfall (mm)
Range (mm) Inter-annual variation
Contribution to Annual Rainfall (%)
Winter (JF) 3.1 0-45.5 2.2 0.4
Pre Monsoon (MAM) 7.6 0-67.9 1.9 0.9
Monsoon (JJAS) 799.4 340.9-1477 0.4 94.0
Post Monsoon (OND) 40.0 0-144.3 0.9 4.7
Katni Annual 1120.0 514.3-1847 0.3
Winter (JF) 34.9 0-147 1.0 3.1
Pre Monsoon (MAM) 17.3 0-78.7 1.1 1.5
Monsoon (JJAS) 1020.0 361.5-1609 0.3 91.1
Post Monsoon (OND) 47.9 0.1-200.2 1.0 4.3
Mandla Annual 1310.0 526.9-2024 0.2
Winter (JF) 39.2 0-136.2 0.9 3.0
Pre Monsoon (MAM) 33.2 0.5-135.4 0.9 2.5
Monsoon (JJAS) 1171.0 484-1852 0.2 89.4
Post Monsoon (OND) 65.9 0.2-320.9 0.9 5.0
Mandsaur Annual 855.3 425.5-1483 0.3
Winter (JF) 6.7 0-35.2 1.3 0.8
Pre Monsoon (MAM) 11.7 0-91.5 1.3 1.4
Monsoon (JJAS) 792.6 354-1440 0.3 92.7
Post Monsoon (OND) 44.4 0-219.2 1.3 5.2
Morena Annual 749.8 391.7-1225 0.3
Winter (JF) 18.9 0-79.8 1.1 2.5
Pre Monsoon (MAM) 15.2 0.2-81.2 1.1 2.0
Monsoon (JJAS) 679.2 296.5-1146 0.3 90.6
Post Monsoon (OND) 36.4 0-154.6 1.2 4.9
Narsinghpur Annual 1179.0 656.3-1841 0.2
Winter (JF) 29.4 0-112.7 0.9 2.5
Pre Monsoon (MAM) 23.3 0.4-124.2 1.0 2.0
Monsoon (JJAS) 1072.0 610.9-1816 0.2 90.9
Post Monsoon (OND) 55.1 0-356.8 1.1 4.7
Neemuch Annual 836.8 382.1-1395 0.3
Winter (JF) 6.7 0-48.8 1.5 0.8
Pre Monsoon (MAM) 12.9 0.1-88.3 1.2 1.5
Monsoon (JJAS) 777.6 351-1366 0.3 92.9
Post Monsoon (OND) 39.6 0-223.2 1.4 4.7
Panna Annual 1079.0 576.2-1753 0.3
Winter (JF) 33.9 0-151.8 1.1 3.1
Pre Monsoon (MAM) 15.4 0.4-68.2 1.0 1.4
Monsoon (JJAS) 983.8 373.9-1668 0.3 91.2
Post Monsoon (OND) 45.7 0.1-217.8 1.1 4.2
Raisen Annual 1187.0 773-2014 0.2
Winter (JF) 20.5 0-134.2 1.3 1.7
27

District/State Season Average Rainfall (mm)
Range (mm) Inter-annual variation
Contribution to Annual Rainfall (%)
Pre Monsoon (MAM) 15.2 0.1-98.4 1.3 1.3
Monsoon (JJAS) 1102.0 556.8-1773 0.2 92.8
Post Monsoon (OND) 49.4 0-224.6 1.0 4.2
Rajgarh Annual 976.6 475.8-1662 0.3
Winter (JF) 14.1 0-84.3 1.2 1.4
Pre Monsoon (MAM) 13.4 0-87.4 1.2 1.4
Monsoon (JJAS) 904.7 452.9-1627 0.3 92.6
Post Monsoon (OND) 44.4 0-234.2 1.2 4.5
Ratlam Annual 916.6 444.4-1689 0.3
Winter (JF) 6.1 0-33.9 1.4 0.7
Pre Monsoon (MAM) 8.7 0-58.1 1.3 0.9
Monsoon (JJAS) 854.8 408-1638 0.3 93.3
Post Monsoon (OND) 47.0 0-235.2 1.1 5.1
Rewa Annual 1028.0 582.8-1553 0.2
Winter (JF) 30.4 0-159.1 1.1 3.0
Pre Monsoon (MAM) 18.8 0.1-123.5 1.2 1.8
Monsoon (JJAS) 934.1 529.9-1410 0.2 90.9
Post Monsoon (OND) 44.5 0-169.6 0.9 4.3
Sagar Annual 1156.0 577-1858 0.2
Winter (JF) 27.1 0-122.5 1.1 2.3
Pre Monsoon (MAM) 17.7 0.3-88.1 1.0 1.5
Monsoon (JJAS) 1062.0 555.1-1734 0.3 91.9
Post Monsoon (OND) 49.5 0-272.4 1.1 4.3
Satna Annual 1034.0 579.4-1502 0.2
Winter (JF) 34.5 0-165.1 1.1 3.3
Pre Monsoon (MAM) 18.6 0.3-62.8 0.9 1.8
Monsoon (JJAS) 935.3 426.2-1394 0.2 90.5
Post Monsoon (OND) 46.0 0.5-199.4 1.0 4.4
Sehore Annual 1145.0 633.3-1812 0.2
Winter (JF) 16.8 0-90.2 1.3 1.5
Pre Monsoon (MAM) 15.5 0-116.8 1.3 1.4
Monsoon (JJAS) 1063.0 597-1760 0.2 92.8
Post Monsoon (OND) 49.8 0-245.1 1.1 4.3
Seoni Annual 1236.0 504.5-1987 0.2
Winter (JF) 33.8 0-139 1.0 2.7
Pre Monsoon (MAM) 35.3 0.8-199.4 1.1 2.9
Monsoon (JJAS) 1102.0 487.8-1825 0.2 89.2
Post Monsoon (OND) 65.3 0.3-346.4 1.0 5.3
Shahdol Annual 1160.0 650.7-1856 0.2
Winter (JF) 35.5 0-134.8 1.0 3.1
Pre Monsoon (MAM) 27.2 0.5-150.4 1.1 2.3
28

District/State Season Average Rainfall (mm)
Range (mm) Inter-annual variation
Contribution to Annual Rainfall (%)
Monsoon (JJAS) 1051.0 590.4-1668 0.2 90.6
Post Monsoon (OND) 46.7 0.1-173.8 0.8 4.0
Shajapur Annual 971.5 493.8-1774 0.3 Winter (JF) 12.2 0-61.5 1.2 1.3
Pre Monsoon (MAM) 12.6 0-103.9 1.4 1.3
Monsoon (JJAS) 900.4 481-1736 0.3 92.7
Post Monsoon (OND) 46.3 0-222.2 1.1 4.8
Sheopur Annual 840.2 449.5-1347 0.3 Winter (JF) 14.6 0-80.7 1.1 1.7
Pre Monsoon (MAM) 27.4 0-143 1.1 3.3
Monsoon (JJAS) 757.8 336.7-1242 0.3 90.2
Post Monsoon (OND) 40.5 0-168.3 1.0 4.8
Shivpuri Annual 862.6 494.6-1374 0.2 Winter (JF) 19.0 0-149.6 1.4 2.2
Pre Monsoon (MAM) 14.0 0-103.1 1.2 1.6
Monsoon (JJAS) 788.0 358.4-1237 0.2 91.4
Post Monsoon (OND) 41.6 0-298.3 1.3 4.8
Annual 1109.0 556.7-1708 0.2 Winter (JF) 32.6 0-122.8 1.0 2.9
Pre Monsoon (MAM) 27.1 0.2-261.9 1.4 2.4
Monsoon (JJAS) 1003.0 501.1-1521 0.2 90.4
Post Monsoon (OND) 46.3 0-155.4 0.8 4.2
Singrauli Annual 1032.0 633.9-1511 0.2 Winter (JF) 29.2 0-112.5 0.9 2.8
Pre Monsoon (MAM) 28.3 0-248.3 1.3 2.7
Monsoon (JJAS) 926.5 595.5-1366 0.2 89.8
Post Monsoon (OND) 48.0 0.1-126.7 0.7 4.7
Tikamgarh Annual 936.9 394.9-1459 0.3 Winter (JF) 24.8 0-119.9 1.1 2.6
Pre Monsoon (MAM) 14.4 0-80.2 1.0 1.5
Monsoon (JJAS) 853.4 342.7-1374 0.3 91.1
Post Monsoon (OND) 44.3 0-299.3 1.2 4.7
Annual 921.6 464.2-1827 0.3 Winter (JF) 8.9 0-50.4 1.3 1.0
Pre Monsoon (MAM) 12.2 0-74.9 1.3 1.3
Monsoon (JJAS) 851.9 442.3-1770 0.3 92.4
Post Monsoon (OND) 48.7 0-263.4 1.1 5.3
Annual 1122.0 665.6-1826 0.2 Winter (JF) 39.4 0-147.8 0.9 3.5
Pre Monsoon (MAM) 23.7 0.3-154.9 1.2 2.1
Monsoon (JJAS) 1010.0 548.4-1627 0.2 90.0
Sidhi
Ujjain
Umaria
29
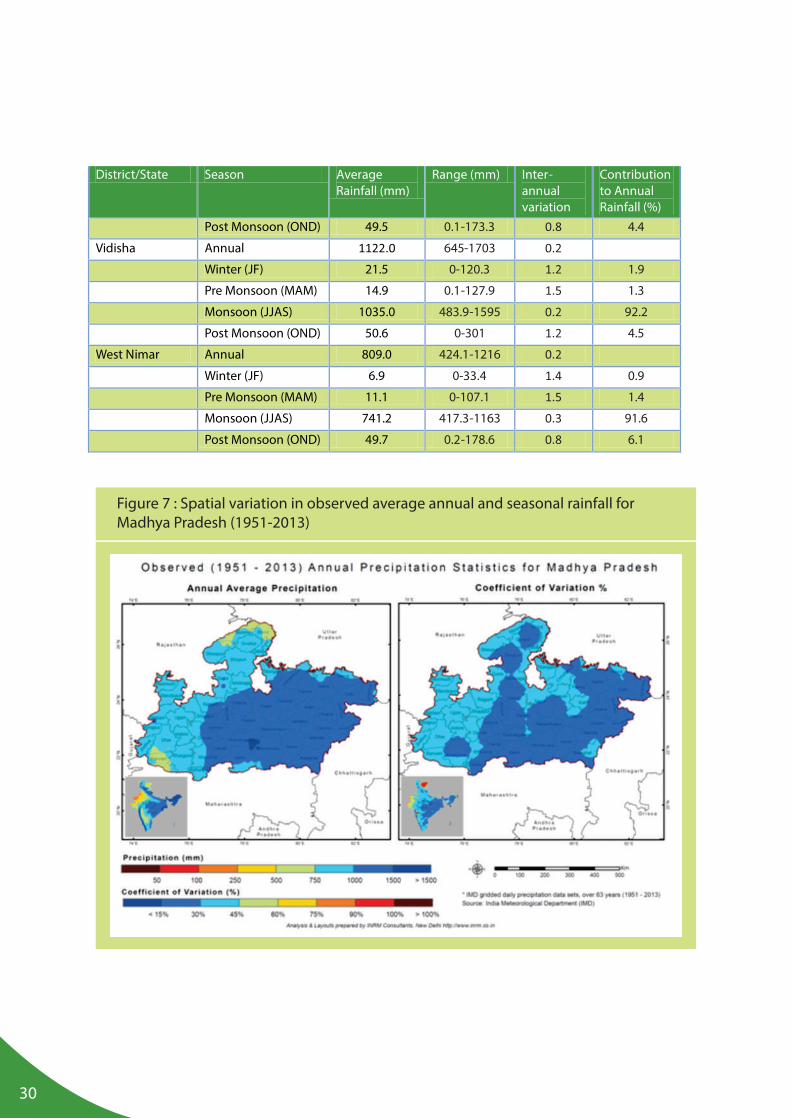
District/State Season Average Rainfall (mm)
Range (mm) Inter-annual variation
Contribution to Annual Rainfall (%)
Post Monsoon (OND) 49.5 0.1-173.3 0.8 4.4
Vidisha Annual 1122.0 645-1703 0.2
Winter (JF) 21.5 0-120.3 1.2 1.9
Pre Monsoon (MAM) 14.9 0.1-127.9 1.5 1.3
Monsoon (JJAS) 1035.0 483.9-1595 0.2 92.2
Post Monsoon (OND) 50.6 0-301 1.2 4.5
West Nimar Annual 809.0 424.1-1216 0.2
Winter (JF) 6.9 0-33.4 1.4 0.9
Pre Monsoon (MAM) 11.1 0-107.1 1.5 1.4
Monsoon (JJAS) 741.2 417.3-1163 0.3 91.6
Post Monsoon (OND) 49.7 0.2-178.6 0.8 6.1
Figure 7 : Spatial variation in observed average annual and seasonal rainfall for Madhya Pradesh (1951-2013)
30

Jan Feb Mar Apr May Jun Jul Aug Sep Oct Nov Dec
Average (mm) 11.5 9.3 7.2 3.4 7.6 121.7 310.7 329.6 175.7 33.6 9.9 7
0
50
100
150
200
250
300
350
Rai
nfa
ll (m
m)
Madhya Pradesh - IMD gridded rainfall: 1951-2013
Figure 7 : Spatial variation in observed average annual and seasonal rainfall for Madhya Pradesh (1951-2013)
Figure 8 : Characteristics of long term average monthly rainfall for Madhya Pradesh(1951-2013)
31

32
0
200
400
600
800
1000
1200
1400
1600
1800
2000
Bar
wan
iB
hin
dM
ore
na
Wes
t N
imar
Gw
alio
rD
atia
Nee
mu
chSh
eop
ur
Dh
arJh
abu
aM
and
sau
rSh
ivp
uri
Bu
rhan
pu
rR
atla
mU
jjain
Alir
ajp
ur
Tika
mga
rhIn
do
reA
sho
knag
arG
un
aSh
ajap
ur
Raj
garh
East
Nim
arD
ewas
Rew
aSi
ngr
auli
Satn
aC
hh
atar
pu
rPa
nn
aB
etu
lSi
dh
iK
atn
iU
mar
iaV
idis
ha
Dam
oh
Bh
op
alSe
ho
reSa
gar
Ch
hin
dw
ara
Shah
do
lH
ard
aN
arsi
ngh
pu
rR
aise
nSe
on
iD
ind
ori
An
up
pu
rJa
bal
pu
rB
alag
hat
Man
dla
Ho
shan
gab
ad
Rai
nfa
ll (m
m)
Average Annual Rainfall (mm)
Madhya Pradesh - IMD gridded rainfall: 1951-2013
Figure 9 : Long term averageannual rainfall forMadhya Pradesh districts (1951-2013)
production, water resources management and overall economy of the State.
In the view of the above, a number of studies have attempted to investigate the trend of climatic variables at the country scale, regional scale and at the individual stations. Recently, L S
17Rathore et. al. (2013 ) examined the trends for monthly, seasonal and annual rainfall series over the States of India and observed significant long term trends over some of the States during southwest monsoon season. This clearly indicated regional variation in the rainfall trends over India. However, there is no study that has examined trends in the rainfall or related indices at district level in Madhya Pradesh.
Observed Rainfall TrendsThe rainfall received in an area is an important factor in determining the amount of water available to meet various demands, such as agricultural, industrial, domestic water supply and for hydroelectric power generation. Global climate change may influence long-term rainfall patterns impacting the availability of water, along with the danger of increasing occurrences of droughts and floods. The southwest (SW) monsoon, which brings about 91% of the total rainfall over the state, is critical for the availability of fresh water for drinking and irrigation. Changes in climate over Madhya Pradesh, particularly the SW monsoon, would have a significant impact on agricultural
17Rathore, L.S., Attri, S.D. and Jaswal, A.K, 2013. “State Level Climate Change Trends in India”. Met. Monograph Environmental Meteorology No 2/2013, pp. 1-147

33
statistically significant. Thus, assuming that rainfall has not declined but rainy days have declined it implies that the intensity of rainfall has increased over the period for the State.
• 10 districts of Madhya Pradesh show positive non significant trend in rainfall while 40 districts show negative trend in rainfall. The statistical significance varies for the districts as can be seen. However, all the districts except Sheopur show negative trend in rainy days. Districts namely, Ashoknagar, Bhind, Datia, Dindori, East Nimar, Gwalior, Hoshanga-bad and Morena show significant negative trend in annual rainfall as seen from Figure 11 and Table 5.
• In pre monsoon (MAM) and monsoon (JJAS) season positive non significant trend in rainfall is observed in certain parts of Madhya Pradesh while in winter (JF) and post monsoon (OND) season negative non significant trend in rainfall is observed in majority of the districts.
Figure 10 gives the summary of observed annual rainfall (mm) and number of rainy days for Madhya Pradesh for the period 1951-2013 (63 years). The spatial variation in trend in annual and seasonal rainfall for the districts is shown in Figure 11. Trend summary for Madhya Pradesh and its districts is shown in Table 5. Trend tests are run at 10% level of significance to indicate the presence of statistical significant trends over the period of years. Since rainfall does not follow a linear pattern, non-parametric trend using Man-
18Kendall rank statistics has been determined.
Trend analysis results for annual rainfall and rainy days for Madhya Pradesh and its districts (1951-2013) from Figure 10, Figure 11 and Table 5 are summarized as follows:
• From Figure 10, it can be inferred that for the period 1951-2013 both annual rainfall and rainy days shows negative trend for Madhya Pradesh State. The negative trend for annual rainfall is statistically not significant while the negative trend for rainy days is
18A climate time series is generally not statistically independent but is comprised of patterns of persistence, cycles or trends. For such time series, Mann-Kendall method is used to test for trends over time. It has been widely used to test for randomness against trend in hydrology and climatology. It makes no assumptions about the distribution of the data or the linearity of any trends and also takes care of the extreme values.
y = -1.2x + 1,065.2y = -0.1x + 72.1
19
51
19
54
19
57
19
60
19
63
19
66
19
69
19
72
19
75
19
78
19
81
19
84
19
87
19
90
19
93
19
96
19
99
20
02
20
05
20
08
20
11
0
20
40
60
80
100
120
140
160
180
2000
500
1000
1500
2000
2500
3000
19
51
19
54
19
57
19
60
19
63
19
66
19
69
19
72
19
75
19
78
19
81
19
84
19
87
19
90
19
93
19
96
19
99
20
02
20
05
20
08
20
11
No
of
rain
y d
ays
Rai
nfa
ll (m
m)
YearRainfall Rainy Days
Madhya Pradesh - IMD gridded rainfall: 1951-2013
Figure 10 : Characteristics of observed annual rainfall and number of rainy days for Madhya Pradesh
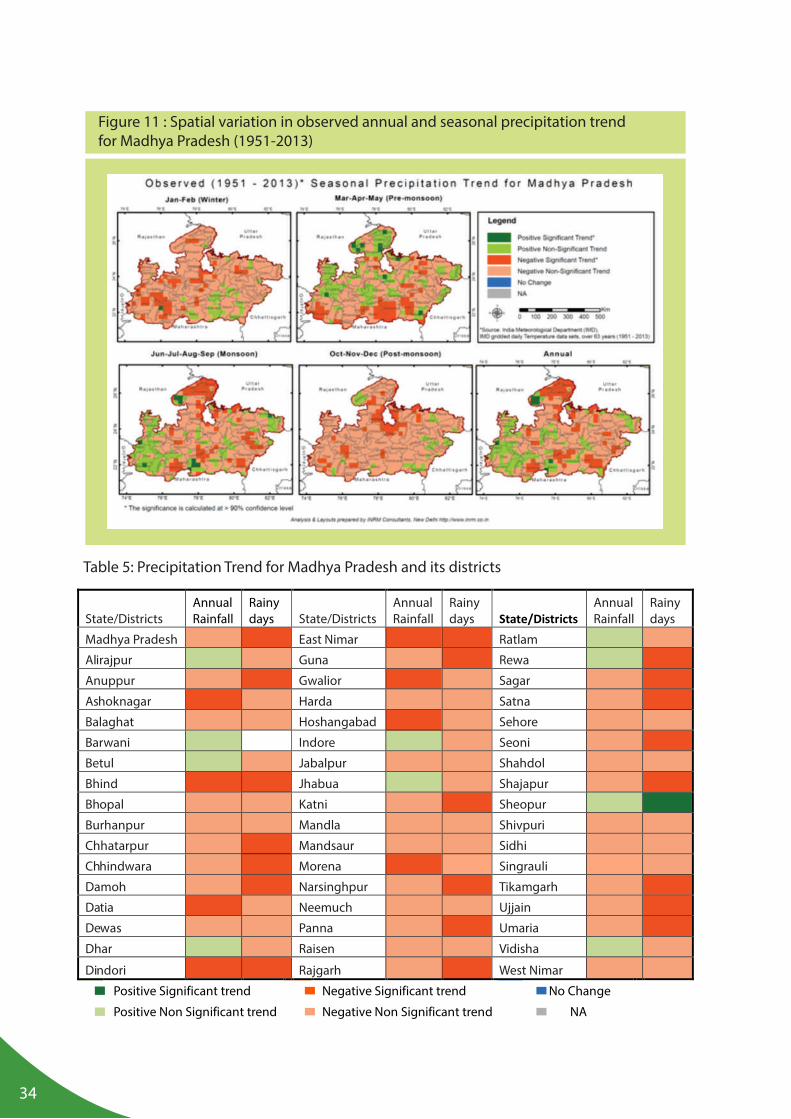
34
State/Districts Annual Rainfall
Rainy days State/Districts
Annual Rainfall
Rainy days State/Districts
Annual Rainfall
Rainy days
Madhya Pradesh East Nimar Ratlam
Alirajpur Guna Rewa
Anuppur Gwalior Sagar
Ashoknagar Harda Satna
Balaghat Hoshangabad Sehore
Barwani Indore Seoni
Betul Jabalpur Shahdol
Bhind Jhabua Shajapur
Bhopal Katni Sheopur
Burhanpur Mandla Shivpuri
Chhatarpur Mandsaur Sidhi
Chhindwara Morena Singrauli
Damoh Narsinghpur Tikamgarh
Datia Neemuch Ujjain
Dewas Panna Umaria
Dhar Raisen Vidisha
Dindori Rajgarh West Nimar
Positive Significant trend
Negative Significant trend
No Change
Positive Non Significant trend Negative Non Significant trend NA
Figure 11 : Spatial variation in observed annual and seasonal precipitation trend for Madhya Pradesh (1951-2013)
Table 5: Precipitation Trend for Madhya Pradesh and its districts
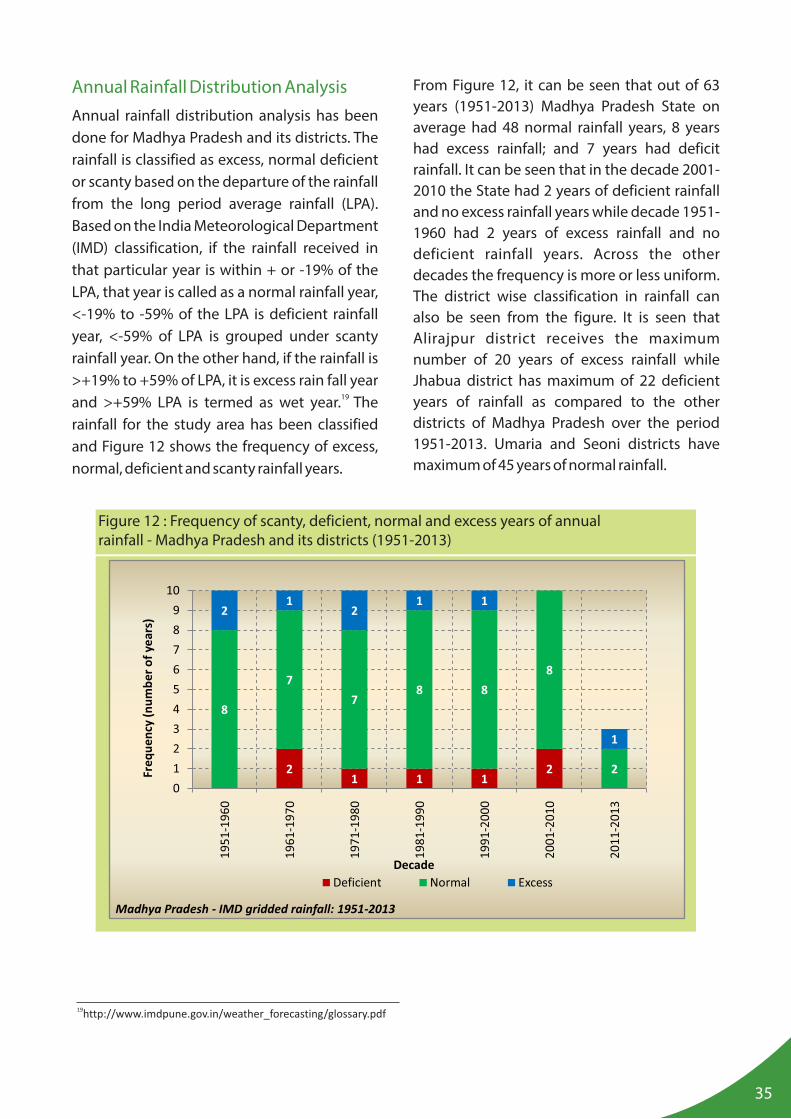
35
From Figure 12, it can be seen that out of 63 years (1951-2013) Madhya Pradesh State on average had 48 normal rainfall years, 8 years had excess rainfall; and 7 years had deficit rainfall. It can be seen that in the decade 2001-2010 the State had 2 years of deficient rainfall and no excess rainfall years while decade 1951-1960 had 2 years of excess rainfall and no deficient rainfall years. Across the other decades the frequency is more or less uniform. The district wise classification in rainfall can also be seen from the figure. It is seen that Alirajpur district receives the maximum number of 20 years of excess rainfall while Jhabua district has maximum of 22 deficient years of rainfall as compared to the other districts of Madhya Pradesh over the period 1951-2013. Umaria and Seoni districts have maximum of 45 years of normal rainfall.
Annual Rainfall Distribution AnalysisAnnual rainfall distribution analysis has been done for Madhya Pradesh and its districts. The rainfall is classified as excess, normal deficient or scanty based on the departure of the rainfall from the long period average rainfall (LPA). Based on the India Meteorological Department (IMD) classification, if the rainfall received in that particular year is within + or -19% of the LPA, that year is called as a normal rainfall year, <-19% to -59% of the LPA is deficient rainfall year, <-59% of LPA is grouped under scanty rainfall year. On the other hand, if the rainfall is >+19% to +59% of LPA, it is excess rain fall year
19 and >+59% LPA is termed as wet year. The rainfall for the study area has been classified and Figure 12 shows the frequency of excess, normal, deficient and scanty rainfall years.
21 1 1
2
8
7
78 8
8
2
21
21 1
1
0
1
2
3
4
5
6
7
8
9
10
19
51
-19
60
19
61
-19
70
19
71
-19
80
19
81
-19
90
19
91
-20
00
20
01
-20
10
20
11-
20
13
Fre
qu
en
cy (
nu
mb
er
of
year
s)
Decade
Deficient Normal Excess
Madhya Pradesh - IMD gridded rainfall: 1951-2013
Figure 12 : Frequency of scanty, deficient, normal and excess years of annual rainfall - Madhya Pradesh and its districts (1951-2013)
19http://www.imdpune.gov.in/weather_forecasting/glossary.pdf

0
10
20
30
40
50
60
70U
mar
iaSh
ahd
ol
An
up
pu
rC
hh
ind
war
aD
ind
ori
Seo
ni
Sin
grau
liC
hh
atar
pu
rD
ewas
Nar
sin
ghp
ur
Seh
ore
Shaj
apu
rSh
ivp
uri
Sid
hi
Bet
ul
Dh
arH
osh
anga
bad
Rai
sen
Sheo
pu
rA
sho
knag
arB
alag
hat
Bu
rhan
pu
rEa
st N
imar
Man
dla
Man
dsa
ur
Saga
rSa
tna
Tika
mga
rhB
ho
pal
Gw
alio
rH
ard
aIn
do
reJa
bal
pu
rN
eem
uch
Pan
na
Wes
t N
imar
Bar
wan
iB
hin
dD
amo
hG
un
aK
atn
iM
ore
na
Raj
garh
Rew
aU
jjain
Dat
iaR
atla
mV
idis
ha
Jhab
ua
Alir
ajp
ur
Fre
qu
en
cy (
nu
mb
er
of
year
s)
Scanty Deficient Normal Excess
Madhya Pradesh - IMD gridded rainfall: 1951-2013
Figure 12 : Frequency of scanty, deficient, normal and excess years of annual rainfall - Madhya Pradesh and its districts (1951-2013)
y = 0.7x + 154.3
0
50
100
150
200
250
300
350
19
51
19
54
19
57
19
60
19
63
19
66
19
69
19
72
19
75
19
78
19
81
19
84
19
87
19
90
19
93
19
96
19
99
20
02
20
05
20
08
20
11
Rai
nfa
ll (m
m)
Year1 day maximum rainfall (mm) Linear (1 day maximum rainfall (mm))
Madhya Pradesh - IMD gridded rainfall: 1951-2013
Figure 13 : 1 Day maximum rainfall for Madhya Pradesh (1951-2013)
1 Day Maximum Rainfall Analysis
Figure 13 show the 1 day maximum rainfall amount as line graph for Madhya Pradesh State. It can be seen that 1 day maximum rainfall shows positive trend for the State over the period 1951-2013 and the positive trend is statistically not significant.
36

37
Jun, 5%
Jul, 32%
Aug, 41%
Sep, 17%
Oct, 5%
Distribution of 1 day annual maximum rainfall
Madhya Pradesh - IMD gridded rainfall: 1951-2013
Figure 13 : 1 Day maximum rainfall for Madhya Pradesh (1951-2013)
number of rainy days (when daily rain >=2.5 mm) for period 1951-2013 in Madhya Pradesh State is 69 days and varies from 47 days to 90 days. Light to rather heavy rainfall (2.5 ≤�R ≤�64.4) events is 68 on average and ranges from 46 to 87 days. Similarly, days when there are heavy rainfall (64.4 < R ≤�124.4 mm) events is 1 on average and ranges from 0 to 2 days, and very heavy to extremely heavy rainfall (R> 124.4 mm) days is negligible.
Figure 14 gives the decadal average frequency of intensity of rainfall events for Madhya Pradesh as well as the intensity of rainfall events for its districts over the period (1951-2013). Rainfall days in the range 2.5 ≤�R ≤�64.4mm are the maximum in the period 1951-1960 amongst all decades. Thus, overall number of rainy days is the maximum in the period 1951-1960 compared to the other decades.
The maximum (316.3 mm) and minimum (93.9 mm) annual one day maximum rainfall for Madhya Pradesh State has been recorded on
th th2007, 7 August and 1966, 30 July respectively.
It can be seen from Figure 13 that August received the highest amount of one day maximum rainfall (41%) followed by July (32%), September (17%) and June and October (5%) Thus about 95% of 1 day maximum rainfall is received in JJAS (monsoon) months in the period of analysis (1951-2013).
Rainfall Intensity Analysis
Intensity of daily rainfall analysis has been done based on daily rainfall data of Madhya Pradesh from 1951-2013. Daily rainfall has been grouped into three categories according to IMD classification of rainfall, 2.5≤�R ≤�64.4 (Light to rather heavy rainfall), 64.4< R ≤�124.4 (heavy rainfall), and R>124.4 (very heavy to extremely heavy rainfall).19 Annual average

38
73
69 6967 67
63
69
1
1 11 1
1
2
0.0
7
0.0
8
0.1
7
0.1
4
0.1
4
0.1
5
0.2
5
56
58
60
62
64
66
68
70
72
74
76
19
51
-19
60
19
61
-19
70
19
71
-19
80
19
81-
19
90
19
91
-20
00
20
01
-20
10
20
11
-20
13Fr
eq
ue
ncy
(A
vera
ge n
o o
f ra
iny
day
s)
2.5 ≤�R ≤�64.4 mm (Light to rather heavy rainfall)
64.4 < R ≤�124.4 mm (Heavy rainfall)
R > 124.4 mm (Very heavy to extremely heavy rainfall)
Decade
Madhya Pradesh - IMD gridded rainfall: 1951-2013
50 52 55
55 56
56
56 57
57 58 59
59 60
60
60 61
61 62
62 63 64
64
64 65 66 67 71
71 72
72 73 74
74
74
74
74 75 76 77
77 79
79
79 84 86 90
90 91 92
92
0
10
20
30
40
50
60
70
80
90
100
Nee
mu
chM
and
sau
rM
ore
na
Ujja
inB
hin
dR
atla
mA
liraj
pu
rG
wal
ior
Dat
iaB
arw
ani
Wes
t N
imar
Jhab
ua
Sheo
pu
rSh
ivp
uri
Dh
arIn
do
reSh
ajap
ur
Bu
rhan
pu
rR
ajga
rhG
un
aTi
kam
garh
Ash
okn
agar
East
Nim
arD
ewas
Har
da
Bh
op
alC
hh
atar
pu
rV
idis
ha
Seh
ore
Sid
hi
Dam
oh
Satn
aR
ewa
Pan
na
Saga
rR
aise
nK
atn
iN
arsi
ngh
pu
rSi
ngr
auli
Ho
shan
gab
adB
etu
lU
mar
iaJa
bal
pu
rSh
ahd
ol
Ch
hin
dw
ara
Din
do
riB
alag
hat
Seo
ni
An
up
pu
rM
and
la
Fre
qu
en
cy (
Ave
rage
no
of
rain
y d
ays)
2.5 ≤�R�≤�64.4�mm�(Light�to�rather�heavy�rainfall)64.4 < R ≤�124.4�mm�(Heavy rainfall)
R > 124.4 mm (Very heavy to extremely heavy rainfall)
Madhya Pradesh - IMD gridded rainfall: 1951-2013
The intensity of rainfall events for the districts can also be seen from Figure 14. Over the 63 years period districts namely, Mandla and Anuppur have the maximum number of total rainy days while Neemuch and Mandsaur has the least number of total rainy days as compared to the other districts of Madhya Pradesh.
Figure 14: Average frequency of intensity of daily rainfall events for Madhya Pradesh (1951-2013)

39
area with diverse climatic conditions. Objective here is to describe temporal and spatial trends in various extreme indicators and their sensitivity to climate change and to demonstrate geographic differences in indicator trends in Madhya Pradesh districts.
Table 6 gives the list of precipitation and temperature extreme indices used for the trend analysis of the Madhya Pradesh districts. These indices were developed by the World Climate Research Programme’s Expert Team on Climate Change Detection and Indices (ETCCDI). Both temperature and precipitation indicators can be broadly classified into four different categories based on the method of calculation: (1) Percentile based indices: The percentile-based temperature extreme indices represent the highest (90th) and lowest (10th) deciles for maximum and minimum temperature. The percentile-based indices for precipitation include the upper first and fifth percentile. Percentile thresholds are more evenly distributed in space and meaningful for every region; (2) Threshold indices are defined as the number of days on which a temperature or precipitation value falls above or below a percentile threshold. These thresholds were set to assess moderate extremes that typically occur a few times every year rather than high impact, once-in-a-decade weather events; (3) Absolute indices represent maximum or minimum values within a month; (4) Duration indices define periods of extreme weather and (5) other indices include indices of annual precipitation total (PRCPTOT), and simple daily intensity index (SDII). They do not fall into any of the above categories but may still be of
23interest .
Historical Indices of Climate ExtremesIndices representing climate extremes are developed to communicate more complex climate change impact relations in a simplified way. Mean temperature and precipitation sums can be seen as simple climate extremes indices, and the same applies for various measures of climate extremes. The power of the climate extremes index concept, however, is strikingly illustrated with the more complex climate extremes indices that incorporate information on the sensitivity of a specific system, such as exposure time, threshold levels of event
20intensity etc.
A total of 21 indices are considered to be the core indices. They are based on daily temperature values or daily precipitation amount. Some are based on fixed thresholds and some are based on thresholds that vary from location to location (thresholds are typically defined as a percentile of the relevant
21data series). RClimDex (1.0) which is designed to provide a user friendly interface to compute indices of climate extremes has been used to derive the relevant indices for Madhya Pradesh. Most of the indices are defined in terms of counts of days crossing the thresholds which are derived as the percentile (variable thresholds). Since percentile thresholds are expressions of anomalies relative to the local climate, the value of the thresholds is site specific. Indices calculated using variable threshold are most suitable for spatial comparisons, because they sample same part of temperature/precipitation) distributions at
22 each site.
Madhya Pradesh is a geographically diverse
2 0 htt p : / / w w w. s m h i . s e / p o l o p o l y _ fs / 1 . 8 0 5 ! C l i m ate % 2 0 i n d i c e s % 2 0 fo r % 2 0 v u l n e ra b i l i t y % 2 0 a s s e s s m e nt s . p d f21http://cccma.seos.uvic.ca/ETCCDI/software.shtml 22Trends in Precipitation Extremes over India.U. R. Joshi and M. Rajeevan. 2006, Research Report No: 3/2006, National Climate Centre. India Meteorological Department, 23http://sheridan.geog.kent.edu/pubs/2012-AQAH.pdf

40
may vary at different places (Shimla may be experiencing hot days when maximum temperature exceeds 30 °C, but for Churu in Rajasthan, it may be 45 °C which may be hot day). In order to make the relative threshold based on the prevailing climate parameter,
thpercentile method is adapted. 10 percentile thvalue is the lower threshold and 90 percentile
value is the upper threshold. For Maximum thtemperature 10 percentile value gives cold
thday and 90 percentile value means hot days. The thresholds are calculated based on the baseline period of 1981-2010.
Percentile: In statistics, a percentile is the value of a variable below which a certain percent of observations fall. To calculate percentiles, sort
nthe data so that x is the smallest value, and x is 1
the largest, with n = total number of observations.
thx is the pi percentile of the data set where: pi = i
100 * i/(n+1).
Percentile is used to calculate the variable threshold. Example: Frequency of maximum temperature > 40 °C, gives the number of days where the maximum temperature is above 40 °C. 40 °C is an absolute threshold value and this
Index Descriptive Name Definition Units
Absolute indices
TXx Maximum of Day time Temperature
Monthly maximum value of daily maximum temperature °C
TNx Maximum of Night time Temperature
Monthly maximum value of daily minimum temperature °C
TXn Minimum of Day time Temperature
Monthly minimum value of daily maximum temperature °C
TNn Minimum of Night time Temperature
Monthly minimum value of daily minimum temperature °C
DTR Diurnal temperature range
Daily maximum temperature - Daily minimum temperature °C
Percentile indices
TN10p Cool nights
%
TX10p Cool days %
TN90p Warm nights
%
TX90p Warm days Annual Percentage of days where maximum temperature is more than 90th percentile of base period
%
Duration Indices
WSDI Warm spell Annual count of days with at least 6 consecutive days, when maximum temperature is greater than the threshold (calculated as 90th percentile of base period maximum temperature)
Days
CSDI Cold spell Annual count of days with at least 6 consecutive days, when minimum temperature is less than the threshold (calculated as 10th percentile of base period minimum temperature)
Days
Table 6: List of Climate Extremes Indices
Temperature extremes indices: TX is the daily maximum temperature; TN is daily minimum temperature;
Annual Percentage of days where minimum temperature is less than 10th percentile of base periodAnnual Percentage of days where maximum temperature is less than 10th percentile of base period
Annual Percentage of days where minimum temperature is more than 90th percentile of base period
Precipitation extremes indices: RR is the daily rainfall rate. A wet day is defined when RR>= 1mm and a dry day when RR<1mm. All indices are calculated annually from January to December.

41
Index Descriptive Name Definition Units
RX1day 1 - day maximumprecipitation
Highest precipitation amount in one-day period Mm
RX5day
Mm
Percentile Indices
R95p Very wet day precipitation
Mm
R99p Extremely wet day precipitation
Annual total precipitation when precipitation is greater than thethThreshold (calculated as 99 percentile of base period
precipitation)
Mm
Duration Indices
CDD
Maximum length of dry spell (consecutive days with precipitation less than 1mm)
Days
CWD
Maximum number of consecutive wet days Days
Threshold Indices
R10mm Heavy precipitation days
Annual count of days when precipitation is greater than 10 mm Days
R20mm Very heavy precipitation days
Annual count of days when precipitation is greater than 20 mm Days
Other Indices
PRCPTOT Wet-day precipitation
Annual total precipitation from wet days Mm
SDII Simple daily intensity index
Average precipitation on wet days mm/day
5 - day maximum precipitation
Consecutive dry days
Consecutive wet days
Annual total precipitation when precipitation is greater than the Threshold (calculated as 95th percentile of base period precipitation)
Highest precipitation amount in five-day period
trends over the period of years, i.e. only those districts trend will be considered as statistically significant whose confidence level is greater than or equal to 90%.
Table 7 gives the temperature and precipitation extreme indices trend for Madhya Pradesh districts (1951-2013). Figure 15 gives the overall climate extremes indices summary for the districts of Madhya Pradesh.
The IMD gridded temperature and rainfall data of Madhya Pradesh districts has been analysed for 21 cl imate extremes indices (11 temperature and 10 precipitation extremes indices) for periods 1951-2013 (63 years). The annual value of the climate extremes indices have been used for the trend analysis. Trend tests are run at 10% level of significance to indicate the presence of statistical significant
Absolute Indices

42
Table 7: Temperature and precipitation extreme indices trend summary for districts of Madhya Pradesh
Temperature extremes indices
TXx
TNx
TX
n
TN
n
D
TR
TN10
P
TX10
P
TN90
P
TX90
P
WSD
I
CSD
I
Absolute indices
Percentile indices
Duration Indices
Districts
Alirajpur
Anuppur
Ashoknagar
Balaghat
Barwani
Betul
Bhind
Bhopal
Burhanpur
Chhatarpur
Chhindwara
Damoh
Datia
Dewas
Dhar
Dindori

43
Hoshangabad
Narsinghpur
East Nimar
Guna
Gwalior
Harda
Indore
Jabalpur
Jhabua
Katni
Mandla
Mandsaur
Morena
Neemuch
Panna
Raisen
Rajgarh
Ratlam
Rewa
Sagar
Satna

44
Positive Significant trendPositive Non Significant trend
Sehore
Seoni
Shahdol
Shajapur
Sheopur
Shivpuri
Sidhi
Singrauli
Tikamgarh
Ujjain
Umaria
Vidisha
West Nimar
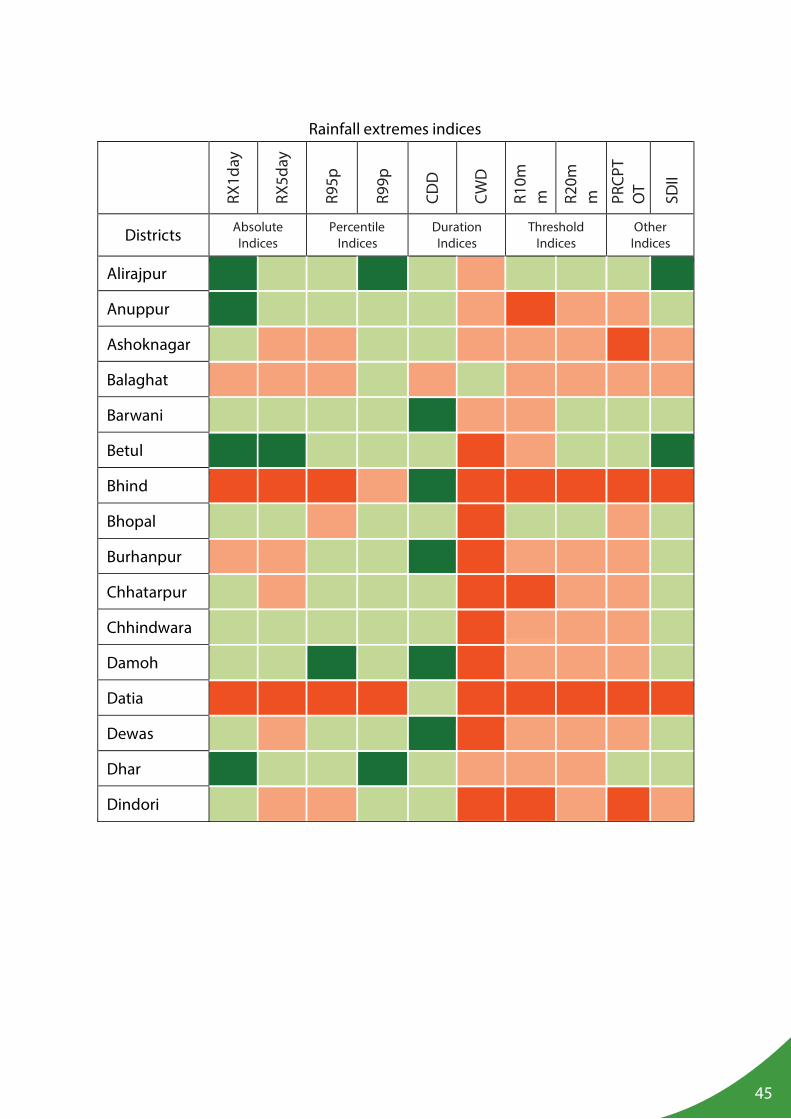
45
Rainfall extremes indices
RX1d
ay
RX
5day
R9
5p
R99p
CDD
CWD
R10m
m
R20m
m
Districts
Absolute Indices
Percentile Indices
Duration Indices
Threshold Indices
Alirajpur
Anuppur
Ashoknagar
Balaghat
Barwani
Betul
Bhind
Bhopal
Burhanpur
Chhatarpur
Chhindwara
Damoh
Datia
Dewas
Dhar
Dindori
PRCP
TO
T
SDII
Other Indices

46
East Nimar
Guna
Gwalior
Harda
Hoshangabad
Indore
Jabalpur
Jhabua
Katni
Mandla
Mandsaur
Morena
Narsinghpur
Neemuch
Panna
Raisen
Rajgarh
Ratlam
Rewa
Sagar
Satna

Negative Significant trend
No Change
Negative Non Significant trend
NA
Sehore
Seoni
Shahdol
Shajapur
Sheopur
Shivpuri
Sidhi
Singrauli
Tikamgarh
Ujjain
Umaria
Vidisha
West Nimar
47

48
-50 -46 -42 -38 -34 -30 -26 -22 -18 -14 -10 -6 -2 2 6 10 14 18 22 26 30 34 38 42 46 50
TXx
TNx
TXn
TNn
DTR
TN10P
TX10P
TN90P
TX90P
WSDI
CSDI
Significant trend Non Significant trend
No of districts with positive trendNo of districts with negative trend
Temperature Indices
-50 -46 -42 -38 -34 -30 -26 -22 -18 -14 -10 -6 -2 2 6 10 14 18 22 26 30 34 38 42 46 50
RX1day
RX5day
R95p
R99p
CDD
CWD
R10mm
R20mm
PRCPTOT
SDII
Significant trend Non Significant trend
No of districts with positive trendNo of districts with negative trend
Rainfall Indices
Figure 15 : Number of districts showing specific trends in climate extremes indices in Madhya Pradesh districts (1951-2013)

49
• Absolute indices: Maximum 1 day and maximum 5 day precipitation show positive trend for majority of the districts over the period 1951-2013. However, trend is significant positive for 11 districts for maximum 1 day precipitation and 2 districts for maximum 5 day precipitation. This implies that the intensity of the rainfall has increased for some of the districts of Madhya Pradesh over the period 1951-2013 (Table 7).
• Percent i le indices : Ver y wet day precipitation (R95p) and extremely wet day precipitation (R99p) show positive trend for majority of the districts. However, trend is significantly positive for 3 districts only for very wet day precipitation and 6 d i s t r i c t s f o r e x t r e m e l y w e t d a y precipitation. They also show significant negative trend for some of the districts. The names of the significant districts can be seen from Table 7.
• Duration indices: Consecutive dry days are rising for most of the districts. However, trend is statistically significant for 10 districts. Consecutive wet days are falling for 49 districts of Madhya Pradesh. However, trend is statistically significant for 16 districts. This implies drought like situation for the State.
• Threshold indices: Heavy and very heavy precipitation days (R10mm and R20mm) show negative trend, i.e., they are declining for most of the districts of Madhya Pradesh; however the decline is statistically significant for 14 and 7 districts respectively.
• Other indices: Precipitation show negative trend, i.e., they are declining for 41 districts of Madhya Pradesh; however the decline is statistically significant for districts namely, Ashoknagar, Bhind, Datia, Dindori, East Nimar, Gwalior, Hoshangabad and Morena while for the other districts it is not significant over the period 1951-2010.
Summary of analysis for indices of climate extremes for Madhya Pradesh districts (1951-2013) is given in the following paragraphs:
Indices of Temperature Extremes:
• Absolute indices: Maximum of day time temperature (TXx) and minimum of night time temperature (TNn) show positive trend for all the districts. However, TXx and TNn show significant positive trend for 32 districts and 21 districts respectively implying rise in temperatures for these Madhya Pradesh districts. Maximum of night time temperature ( TNx) and minimum of day time temperature (TXn) show negative trend for all the districts. TNx and TXn show significant negative trend for 19 districts and 28 districts respectively implying fall in temperatures for these districts. DTR (Diurnal Temperat-ure range) shows mixed trend for all districts, however the trend is statistically not significant.
• Percentile indices: Cool nights (TN10P) and cool days (TX10P) show negative trend while warm nights (TN90P) and warm days (TX90P) show positive trend for the districts, however the trend is statistically significant for majority of the districts for cool nights and warm days as can be seen from Table 7. This implies overall warming up for Madhya Pradesh districts, this calls for additional irrigation for crops and higher energy demand for cooling.
• Duration indices: Warmspell duration indicator (WSDI) shows positive trend for all the districts, however the positive trend is statistically significant for 21 districts. Cold spell duration indicator (CSDI) shows negative trend for all the districts, however the negative trend is statistically significant for 30 districts, indicating overall warming up for Madhya Pradesh districts.
Indices of Precipitation Extremes:

50
• The variability in minimum temperature across the districts is marginally higher than the maximum temperature. However, t e m p o r a l v a r i a t i o n i n m i n i m u m temperature across the districts of Madhya Pradesh is also low as is evident from the CV values and varies from 2% in the Southern districts to 3% in the Northern part of the State.
• Trend analysis shows that positive trend for annual maximum temperature and annual minimum temperature are statistically not significant (with greater than 90% confidence level) for Madhya Pradesh State.
• Annual maximum temperature shows statistically significant positive trend for 9 districts namely, Anuppur, Balaghat, Dindori, Harda, Mandsaur, Narsinghpur, Neemuch, Sehore, Seoni while annual minimum temperature shows statistically significant positive trend for 18 districts.
• Average annual rainfall of Madhya Pradesh State is 1027.3 mm with a range varying from 531.9 mm-1681.1 mm over the 63 years period (1951-2013). Amongst all districts, Hoshangabad receives the maximum average annual rainfall while Barwani receives the least. It is observed that the average rainfall decreases from east to west.
• The mean south west monsoon (JJAS months) rainfall contributes the maximum to annual ra infa l l amount ing to approximately 91% for Madhya Pradesh State. Contribution of Pre-monsoon (March, April and May) rainfall on average is 1.8%, contribution of post-monsoon (October, November and December) rainfall in annual rainfall is about 5% and winter rainfall (January, February) contribution is 2%.
Average precipitation on wet days (Simple Daily Intensity Index) show positive trend for majority of the districts. However, SDII show significant positive trend for 4 districts namely, Alirajpur, Betul, Rewa and Satna (implying that annual rainfall intensity has increased over the period for these districts). Statistically significant negative trend is observed for 6 districts namely, Bhind, Datia, Gwalior, Morena, Sheopur and Shivpuri.
Summary of Observed Climate Data
Summary of observed temperature and rainfall for Madhya Pradesh (1951-2013):
O b s e r v e d M a x i m u m a n d M i n i m u m Temperature
• IMD gridded daily temperature data from 1951-2013 (63 years) has been used for the analys is . M ean annual maximum temperature for Madhya Pradesh is 32.3°C with a range varying from 31.0°C – 33.5°C. The highest value attained for maximum temperature (37.9°C) is in the pre monsoon season (MAM) while its lowest maximum value (27.1°C) is attained in winter season.
• Mean annual minimum temperature is 18.7°C with a range varying from 17.7°C – 19.8°C. Minimum temperature attains its mean highest value (23.9°C) during monsoon season (JJAS), while it attains its mean lowest value (10.7°C) in winter season.
• For annual maximum temperature the highest value is attained for district East Nimar while the lowest value is attained for district Shahdol for the period 1951-2013 (63 years).
• For annual minimum temperature the highest value is attained for district Balaghat while the lowest value is attained for district Shahdol for the period 1951-2013 (63 years).

51
1951-2013 in Madhya Pradesh State is 69 days and varies from 47 days to 90 days. Light to rather heavy rainfall (2.5 ≤�R ≤�64.4) events is 68 on average and ranges from 46 to 87 days. Similarly, days when there are heavy rainfall (64.4 < R ≤�124.4 mm) events is 1 on average and ranges from 0 to 2 days, and very heavy to extremely heavy rainfall (R> 124.4 mm) days is negligible.
• Over the 63 years period districts namely, Mandla and Anuppur have the maximum number of total rainy days while Neemuch and Mandsaur has the least number of total rainy days.
Temperature Extremes Indices:
• Absolute indices: Maximum of day time temperature (TXx) and minimum of night time temperature (TNn) show positive trend for all the districts. However, TXx and TNn show significant positive trend for 32 districts and 21 districts respectively implying rise in temperatures for these Madhya Pradesh districts. Maximum of night time temperature ( TNx) and minimum of day time temperature (TXn) show negative trend for all the districts. TNx and TXn show significant negative trend for 19 districts and 28 districts respectively implying fall in temperatures for these districts.
• Percentile indices: Cool nights (TN10P) and cool days (TX10P) show negative trend while warm nights (TN90P) and warm days (TX90P) show positive trend for the districts, however the trend is statistically significant for majority of the districts for cool nights and warm days. This implies overall warming up for Madhya Pradesh districts, this calls for additional irrigation for crops and higher energy demand for cooling.
• For the period 1951-2013, both annual rainfall and rainy days shows negative trend for Madhya Pradesh State. The negative trend for annual rainfall is statistically not significant while the negative trend for rainy days is statistically significant.
• Districts namely, Ashoknagar, Bhind, Datia, D i n d o r i , E a s t N i m a r , G w a l i o r , H o s h a n g a b a d a n d M o re n a s h ow significant negative trend in annual rainfall.
• Out of 63 years rainfall analysis, Madhya Pradesh received normal rainfall in 48 years, 8 years had excess rainfall and 7 years received deficit rainfall. Alirajpur district receives the maximum number of 20 years of excess rainfall while Jhabua district has maximum of 22 deficient years of rainfall as compared to the other districts of Madhya Pradesh. Umaria and Seoni districts have maximum of 45 years of normal rainfall.
• The maximum (316.3 mm) and minimum (93.9 mm) annual one day maximum rainfall for Madhya Pradesh State has been recorded on 2007, 7th August and 1966, 30th July respectively.
• 1 day maximum rainfall shows positive trend for the State over the period 1951-2013 and the positive trend is statistically not significant
• August received the highest amount of one day maximum rainfall (41%) followed by July (32%), September (17%) and June and October (5%) Thus about 95% of 1 day maximum rainfall is received in JJAS (monsoon) months in the period of analysis (1951-2013).
• Annual average number of rainy days (when daily rain >=2.5 mm) for period

52
rising for most of the districts. However, trend is statistically significant for 10 districts. Consecutive wet days are falling for 49 districts of Madhya Pradesh. However, trend is statistically significant for 16 districts. This implies drought like situation for the State.
• Threshold indices: Heavy and very heavy precipitation days (R10mm and R20mm) show negative trend, i.e., they are declining for most of the districts of Madhya Pradesh; however the decline is statistically significant for 14 and 7 districts respectively.
• Other indices: Precipitation show negative trend, i.e., they are declining for 41 districts of Madhya Pradesh; however the decline is statistically significant for districts namely, Ashoknagar, Bhind, Datia, Dindori, East Nimar, Gwalior, Hoshanga-bad and Morenawhile for the other districts it is not significant over the period 1951-2010. Average precipitation on wet days (Simple Daily Intensity Index) show positive trend for majority of the districts. However, SDII show significant positive trend for 4 districts namely, Alirajpur, Betul, Rewa and Satna (implying that annual rainfall intensity has increased over the period for these districts). Statistically significant negative trend is observed for 6 districts namely, Bhind, Datia, Gwalior, Morena, Sheopur and Shivpuri.
• Duration indices: Warmspell duration indicator (WSDI) shows positive trend for all the districts, however the positive trend is statistically significant for 21 districts. Cold spell duration indicator (CSDI) shows negative trend for all the districts, however the negative trend is statistically significant for 30 districts, indicating overall warming up for Madhya Pradesh districts.
Precipitation Extremes Indices:
• Absolute indices: Maximum 1 day and maximum 5 day precipitation show positive trend for majority of the districts over the period 1951-2013. However, trend is significant positive for 11 districts for maximum 1 day precipitation and 2 districts for maximum 5 day precipitation. This implies that the intensity of the rainfall has increased for some of the districts of Madhya Pradesh over the period 1951-2013.
• Percent i le indices : Ver y wet day precipitation (R95p) and extremely wet day precipitation (R99p) show positive trend for majority of the districts. However, trend is significantly positive for 3 districts only for very wet day precipitation and 6 d i s t r i c t s f o r e x t r e m e l y w e t d a y precipitation. They also show significant negative trend for some of the districts.
• Duration indices: Consecutive dry days are

53
in global general circulation models (GCMs) to provide estimates for the full suite of greenhouse gases and their potential impacts on climate change. Since then, there has been greater understanding of possible future greenhouse gas emissions and climate change as well as considerable improvements in the general circulation models. The IPCC, therefore, developed a new set of emissions scenarios. The process by which these new scenarios are being produced differs from earlier scenario development.
The new process aims to both shorten the time required to develop and apply new scenarios, and to ensure better integration between socio - economic driving forces, changes in the climate system, and the vulnerability of natural and human systems. Rather than starting with socio - economic scenarios that give rise to alternative greenhouse gas emissions, the new scenarios take alternative futures in global greenhouse gas and aerosol concentrations as their starting point. These are called Representative Concentration Pathways
24(RCPs) . The Representative Concentration Pathways (RCP) are based on selected scenarios from four modelling teams/models working on integrated assessment modelling, climate modelling, and modelling and analysis of impacts.
RCPs are four greenhouse gas trajectories adopted by the IPCC for its fifth Assessment Report (AR5). The four RCPs; RCP2.6, RCP4.5, RCP6, and RCP8.5, are named after a possible range of radioactive forcing values in the year 2100. Table 8 gives the overview of four RCPs.
The CORDEX South Asia modelled climate data on precipitation, maximum temperature, minimum temperature and 21 climate extremes indices have been analysed for Madhya Pradesh State and its 50 districts for baseline (BL, 1981-2010), mid-century (MC, 2021-2050) and end-century (EC, 2071-2100). Projected change in climate for precipitation, maximum temperature and minimum temperature has been assessed while trend analysis has been done on the climate extremes indices for the study area. Trend tests are run at 10% level of significance to indicate the presence of statistical significant trends over the period of analysis. Resolution of the projected climate data is at a grid-spacing of 0.5°x0.5° for IPCC AR5 scenarios, namely, RCP8.5 (a scenario of comparatively high greenhouse gas emissions and does not include climate policy interventions) and RCP4.5 (moderate emission scenario and assume climate policy intervention to transform associated reference scenarios). Ensemble mean of 3 regional climate models (RCM), namely, REMO (from MPI), RCA4 (from SMHI) and CCAM (from CSIRO) has been used for the analysis. Ensemble mean is chosen to reduce model related uncertainties and ensemble mean climate is closer to observed climate than any individual model.
Representative Concentration Pathways (RCPs)
The IPCC scenarios provide a mechanism to assess the potential impacts on climate change. Global emission scenarios were first developed by the IPCC in 1992 and were used
15 http://www.madhya-pradesh-tourism.com/travel-guide/climate-weather.html
IPCC AR5 Climate Change Scenarios-Madhya Pradesh

54
Table 8: Overview of Representative Concentration Pathways (RCPs) adopted by IPCC Ar5
RCP Description IA Model Publication – IA Model
RCP8.5
RCP6
RCP4.5
RCP2.6
Rising radiative forcing pathway leading to 8.5 W/m2 in 2100.
2Stabilization without overshoot pathway to 6 W/m at stabilization after 2100
2Stabilization without overshoot pathway to 4.5 W/m at stabilization after 2100
Peak in radiative forcing at ~ 3 W/m2 before 2100 and decline
MESSAGE
AIM
GCAM (MiniCAM)
IMAGE
Riahi et al. (2007), Rao&Riahi (2006)
Fujino et al. (2006), Hijioka et al. (2008)
Smith and Wigley (2006),Clarke et al. (2007), Wise et al. (2009)
van Vuuren et al. (2006; 2007)
Source: http://sedac.ipcc-data.org/ddc/ar5_scenario_process/RCPs.html
(RCPs). Initially 50 km grid spacing has been selected, favouring engagement of wider community.
Analysis of the Climate Change Scenarios
The CORDEX South Asia climate data on precipitation, maximum and minimum temperature have been analysed for Madhya Pradesh and its districts for baseline (1981-2010), mid-century (2021-2050) and end-century (2071-2100) for IPCC AR5 climate scenarios-RCP4.5 (moderate emission scenario) and RCP8.5 (a scenario of comparati-vely high greenhouse gas emissions) using multi model ensemble of the three RCMs (( REMO (from MPI), RCA4 (from SMHI) and CCAM (from CSIRO)). The CORDEX South Asia simulations with the models indicate an all-round warming over the study area. Projected temperature increase towards EC is higher than that of MC. For IPCC AR5 RCP4.5 and RCP8.5 scenario, minimum temperature show higher projected increase than the maximum temperature towards MC and EC for Madhya Pradesh. However, IPCC AR5 RCP8.5 scenario shows higher increase than that of IPCC AR5 RCP4.5 scenario.
In contrast to the IPCC AR4 SRES scenarios, RCPs represent pathways of radioactive forcing and not detailed socioeconomic narratives or scenarios. Central to the process is the concept that any single radiative forcing pathway can result from a diverse range of socioeconomic and technological development scenarios. There are four RCP scenarios: RCP2.6, RCP4.5, RCP6.0 and RCP8.5 – these scenarios are formulated such that they represent the full range of stabilization, mitigation and baseline emission scenarios available in the literature
25(Hibbard et al., 2011 ). The naming convention reflects socio - economic pathways that reach a specific radioactive forcing by the year 2100. For example, RCP8.5 leads to a radiative forcing of 8.5 Wm-2 by 2100. Coordinated Regional climate Downscaling Experiment (CORDEX) is a WCRP - sponsored program to organize an international coordinated framework to produce an improved generation of regional climate change projections world-wide for input into impact and adaptation studies within the AR5 timeline and beyond. CORDEX produces an ensemble of multiple dynamical a n d s t a t i s t i c a l d o w n s c a l i n g m o d e l s considering multiple forcing GCMs from the CMIP5 archive, for the newly developed Representative Concentration Pathways
25Hibbard, K. A., Van Vurren, D. P. and Edmonds, J., A primer on the representative concentration pathways (RCPs) and the coordination between the climate and integrated assessment modeling communities.CLIVAR Exchanges, 2011, 16, 12-15

55
not very sensitive to the driving GCMs and simulates similar precipitation climatology when driven by different GCMs. At the same time the driving GCMs produce very disperse precipitation climatology with a large spread across the GCMs which is substantially reduced by RCA4. Similar evaluation for near-surface temperature shows good simulation of near-surface temperature. Downscaling of the individual GCMs, on average, shows a large-scale cold bias that is also reflected in the ensemble mean
REMO (MPI-CSC, Hamburg, Germany)REMO (CSC, Hamburg, Germany) – regional model (50km) driven by a global model - MPI-ESM-LR, 1951-2100 projected future climate changes in temperature are similar between regional and global ensembles. List of CORDEX models and their details are given in Table 9.
Brief on RCM (Regional Climate Model)
CSIRO CCAM
CSIRO (Commonwealth Scientific and Industrial Research Organisation) CCAM (Cubic Conformal Atmospheric Model 805) RCM (Regional Climate Model) from CSIRO Marine and Atmospheric Research, Melbourne, Australia is a dynamically downscaled model from the GFDLSST reanalysis Climate Model output to 50 km resolution.
Rossby Centre Regional Atmospheric Model, RCA4
Eight atmosphere-ocean general circulation models (AOGCMs) from the fifth phase of the Coupled Model Intercomparison Project (CMIP5) were downscaled over the Asia-
26CORDEX domain (Jones et al. 2011 ) at the Rossby Centre (SMHI), Sweden by a regional climate model, RCA4. From individual simulations in terms of precipitation, RCA4 is
Asia CORDEX RCMs RCM GCM Boundary Condition
Institute Scenario Resolution Daily time period
CCAM Ensemble (Mean)
ACCESS1-0_CSIRO-CCAM-1391M
CCAM ACCESS1-0 CSIRO RCP4.5,RCP8.5 0.5X0.5 1970-2099
CCAM CNRM CSIRO RCP4.5,RCP8.5 0.5X0.5 1970-
2099
CCAM MPI-ESM-LR CSIRO RCP4.5,RCP8.5 0.5X0.5 1970-2099
SMHI-RCA4 Ensemble(Mean)
SMHI-RCA4
CNRM SMHI RCP4.5,RCP8.5 0.5X0.5 1951-2100
SMHI-RCA4
GFDL SMHI RCP4.5,RCP8.5 0.5X0.5 1951-2100
SMHI-RCA4
IHEC-EC SMHI RCP4.5,RCP8.5 0.5X0.5 1951-2100
CNRM-CM5_CSIRO-CCAM-1391MMPI-ESM-LR_CSIRO-CCAM-1391M
CNRM-CERFACS-CNRM-CM5_SMHI-RCA4
NOAA-GFDL-GFDL-ESM2M_SMHI-RCA4ICHEC-EC-EARTH_SMHI-RCA4
Table 9: List of CORDEX models
26Jones C, Giorgi F, Asrar G (2011) The coordinated regional downscaling experiment: CORDEX. an international downscaling link to CMIP5. CLIVAR exchanges 16:34-40

56
Asia CORDEX RCMs RCM GCM Boundary Condition
Institute Scenario Resolution Daily time period
IPSL-CM5A-MR_SMHI-RCA4
SMHI-RCA4 IPSL-CM5A SMHI RCP4.5,RCP8.5 0.5X0.5 1951-2100
SMHI-RCA4 MIRCO SMHI 0.5X0.5
SMHI-RCA4 MPI-M SMHI RCP4.5,RCP8.5 0.5X0.5
REMO2009
MPI-M MPI-CSC RCP4.5,RCP8.5 0.5X0.5
MIROC-MIROC5_SMHI-RCA4MPI-M-MPI-ESM-LR_SMHI-RCA4
MPI-M-MPI-ESM-LR_MPI-CSC-REMO2009
REMO2009
1951-21001951-2100
1951-2100
State towards MC and EC with respect to BL are also shown for both IPCC AR5 RCP4.5 and RCP8.5 scenarios. The spatial representation of projected changes in annual and seasonal mean maximum temperature for Madhya Pradesh for IPCC AR5 RCP4.5 and RCP8.5 scenarios is shown in Figure 18 and Figure 19 respectively. Summary of the projected change in maximum temperature for IPCC AR5 RCP4.5 and RCP 8.5 scenarios is as follows:
• Average annual maximum temperature for IPCC AR5 RCP4.5 scenario is projected to increase by about 1.3°C towards mid-century and by 2.0°C towards end-centurywhile for IPCC AR5 RCP8.5 scenario it is projected to increase by about 1.6°C towards mid-century and 4.3°C towards end-century for Madhya Pr a d e s h S t a t e . T h u s , p ro j e c t e d temperature increase in end-century is higher than that of mid-century.
• The projected increase in maximum temperature towards MC do not show significant variation across the districts of Madhya Pradesh for both IPCC AR5 RCP4.5 and RCP8.5 scenarios as shown in Figure 18 and Figure 19.
Ensemble mean has been derived using 10 RCM model runs with multiple driving GCMs and the same has been used for further analysis.
Temperature Projections for Madhya Pradesh
Analysis of Projected Maximum TemperatureEnsemble mean of the CORDEX South Asia climate data for IPCC AR5 RCP4.5 and RCP8.5 scenarios for Madhya Pradesh State and its districts for the annual and seasonal maximum temperature has been analysed. The projected annual and seasonal maximum temperatures changes towards MC and EC with respect to BL for Madhya Pradesh and its districts for IPCC AR5 RCP4.5 and RCP8.5 scenarios are given in the Appendix I Table 10 and Table 11 respectively.
Figure 16 and Figure 17 show change in annual maximum temperature towards MC and EC with respect to BL for Madhya Pradesh State and its districts for IPCC AR5 RCP4.5 and RCP8.5 scenarios. Same has also been depicted as line graph Madhya Pradesh State and as bar graph for the districts. The seasonal changes for the

57
• Highest maximum temperature increase is projected in pre monsoon season (MAM) for IPCC AR5 RCP4.5 and RCP8.5 scenarios towards MC and EC for Madhya Pradesh State as compared to the other seasons (Figure 16 and Figure 17).
• For both IPCC AR5 RCP4.5 and RCP8.5 scenarios, increase in annual and seasonal maximum temperature is projected for Madhya Pradesh and its districts towards MC and EC. However, IPCC AR5 RCP8.5 scenario shows higher increase than that of IPCC AR5 RCP4.5 scenario.
• The projected increase in maximum temperature towards EC varies from 1.8°C in Alirajpur to 2.2°C in Shivpuri district for IPCC AR5 RCP4.5 scenario and 3.9°C in Barwani and West Nimar to 4.6°C in Singrauli and Ashoknagar districts of Madhya Pradesh for IPCC AR5 RCP8.5 scenario as shown in Figure 16 and Figure 17.
• Districts in the North and the East of Madhya Pradesh shows the highest projected maximum temperature increase towards EC for IPCC AR5 RCP4.5 scenario as shown in Figure 18.
0.0
0.5
1.0
1.5
2.0
2.5
Alir
ajp
ur
Bar
wan
iD
har
East
Nim
arH
ard
aIn
do
reJh
abu
aU
jjain
Wes
t N
imar
Bal
agh
atB
etu
lB
urh
anp
ur
Ch
hin
dw
ara
Dam
oh
Dew
asG
un
aH
osh
anga
bad
Man
dsa
ur
Nee
mu
chR
aise
nR
ajga
rhR
atla
mSe
ho
reSe
on
iSh
ajap
ur
Vid
ish
aA
nu
pp
ur
Ash
okn
agar
Bh
ind
Bh
op
alC
hh
atar
pu
rD
atia
Din
do
riG
wal
ior
Jab
alp
ur
Kat
ni
Man
dla
Mo
ren
aN
arsi
ngh
pu
rR
ewa
Saga
rSa
tna
Shah
do
lSh
eop
ur
Shiv
pu
riSi
dh
iSi
ngr
auli
Tika
mga
rhU
mar
iaPa
nn
a
Tem
pe
ratu
rech
ange
fro
m B
L to
MC
(°C
)
Avg. maximum temperature State Avg. maximum temperatureRCP4.5
Projected change (BL to MC) in annual maximum temperature
Figure 16 : Characteristics of projected annual and seasonal maximum temperature for IPCC AR5 RCP4.5 scenario

0.0
0.5
1.0
1.5
2.0
2.5A
liraj
pu
rB
arw
ani
Bu
rhan
pu
rD
har
Jhab
ua
Wes
t N
imar
Bet
ul
Dew
asEa
st N
imar
Har
da
Ind
ore
Man
dsa
ur
Rat
lam
Shaj
apu
rU
jjain
An
up
pu
rB
alag
hat
Ch
hin
dw
ara
Dam
oh
Din
do
riG
un
aH
osh
anga
bad
Man
dla
Nee
mu
chR
aise
nR
ajga
rhSe
ho
reSe
on
iV
idis
ha
Ash
okn
agar
Bh
ind
Bh
op
alC
hh
atar
pu
rG
wal
ior
Jab
alp
ur
Kat
ni
Nar
sin
ghp
ur
Pan
na
Rew
aSa
gar
Satn
aSh
ahd
ol
Sheo
pu
rSi
dh
iSi
ngr
auli
Tika
mga
rhU
mar
iaD
atia
Mo
ren
aSh
ivp
uri
Tem
pe
ratu
rech
ange
fro
m B
L to
EC
(°C
)
Avg. maximum temperature State Avg. maximum temperatureRCP4.5
Projected change (BL to EC) in annual maximum temperature
0.0
0.5
1.0
1.5
2.0
2.5
3.0
3.5
Annual JF MAM JJAS OND
Tem
pe
ratu
re c
han
ge f
rom
BL
(°C
)
MC Change wrt BL (°C) EC Change wrt BL (°C)RCP4.5
Projected change wrt BL in annual and seasonal maximum temperature for Madhya Pradesh State
Figure 16 : Characteristics of projected annual and seasonal maximum temperature for IPCC AR5 RCP4.5 scenario
58

0.0
0.5
1.0
1.5
2.0
2.5
3.0
Alir
ajp
ur
Bar
wan
iB
urh
anp
ur
Dh
arEa
st N
imar
Ind
ore
Jhab
ua
Rat
lam
Ujja
inW
est
Nim
arB
alag
hat
Bet
ul
Dew
asG
un
aH
ard
aH
osh
anga
bad
Man
dsa
ur
Nee
mu
chR
ajga
rhSe
ho
reSe
on
iSh
ajap
ur
Vid
ish
aA
nu
pp
ur
Ash
okn
agar
Bh
ind
Bh
op
alC
hh
atar
pu
rC
hh
ind
war
aD
amo
hD
atia
Din
do
riG
wal
ior
Jab
alp
ur
Kat
ni
Man
dla
Nar
sin
ghp
ur
Rai
sen
Rew
aSa
gar
Shah
do
lSh
eop
ur
Sid
hi
Sin
grau
liTi
kam
garh
Um
aria
Mo
ren
aPa
nn
aSa
tna
Shiv
pu
ri
Tem
pe
ratu
rech
ange
fro
m B
L to
MC
(°C
)
Avg. maximum temperature State Avg. maximum temperatureRCP8.5
Projected change (BL to MC) in annual maximum temperature
0.0
0.5
1.0
1.5
2.0
2.5
3.0
3.5
4.0
4.5
5.0
Bar
wan
iW
est
Nim
arA
liraj
pu
rB
urh
anp
ur
Dh
arJh
abu
aIn
do
reR
atla
mU
jjain
Dew
asEa
st N
imar
Man
dsa
ur
Nee
mu
chB
etu
lH
ard
aSe
ho
reSh
ajap
ur
Bh
ind
Ch
hat
arp
ur
Ch
hin
dw
ara
Dam
oh
Gw
alio
rH
osh
anga
bad
Kat
ni
Mo
ren
aPa
nn
aR
aise
nR
ajga
rhR
ewa
Satn
aSe
on
iSh
eop
ur
Um
aria
An
up
pu
rB
alag
hat
Bh
op
alD
atia
Din
do
riG
un
aJa
bal
pu
rM
and
laN
arsi
ngh
pu
rSa
gar
Shah
do
lSh
ivp
uri
Sid
hi
Tika
mga
rhV
idis
ha
Ash
okn
agar
Sin
grau
li
Tem
pe
ratu
rech
ange
fro
m B
L to
EC
(°C
)
Avg. maximum temperature State Avg. maximum temperatureRCP8.5RCP8.5
Projected change (BL to EC) in annual maximum temperature
RCP8.5
Figure 17 : Characteristics of simulated projected annual and seasonal maximum temperature for IPCC AR5 RCP8.5 scenario
59

0.0
1.0
2.0
3.0
4.0
5.0
6.0
7.0
Annual JF MAM JJAS OND
Tem
pe
ratu
re c
han
ge f
rom
BL
(°C
)
MC Change wrt BL (°C) EC Change wrt BL (°C)RCP8.5
Projected change wrt BL in annual and seasonal maximum temperature for Madhya Pradesh State
Figure 17 : Characteristics of simulated projected annual and seasonal maximum temperature for IPCC AR5 RCP8.5 scenario
60

Figure 18 : Spatial representation of projected changes in annual and seasonal maximum temperature for IPCC AR5 RCP4.5 scenario
61

Figure 19 : Spatial representation of projected changes in annual and seasonal maximum temperature for IPCC AR5 RCP8.5 scenario
62
63
RCP8.5 scenario it is projected to increase by about 1.8°C towards mid-century and 5.3°C towards end - century for Madhya Pradesh State. Thus projected temperature increase towards EC is higher than that of MC.
• The projected increase in minimum temperature towards MC do not show significant variation across the districts of Madhya Pradesh for both IPCC AR5 RCP4.5 and RCP8.5 scenarios as shown in Figure 20 to Figure 23.
• The projected increase in minimum temperature towards EC varies from 2.4°C in Ashoknagar to 2.8°C in East Nimar district for IPCC AR5 RCP4.5 scenario and 5.0°C in Ashoknagar and Damoh districts to 5.7°C in East Nimar district of Madhya Pradesh for IPCC AR5 RCP8.5 scenario as shown in Figure 20 and Figure 21.
• Highest minimum temperature increase is projected in monsoon season (JJAS) for IPCC AR5 RCP4.5 scenario and pre monsoon season (MAM) and monsoon season (JJAS) for RCP8.5 scenario for both MC and EC for Madhya Pradesh State as compared to the other seasons. (Figure 20 and Figure 21).
• For both IPCC AR5 RCP4.5 and RCP8.5 scenarios, increase in annual and seasonal minimum temperature is projected for Madhya Pradesh and its districts towards MC and EC. However, IPCC AR5 RCP8.5 scenario shows higher increase than that of IPCC AR5 RCP4.5 scenario.
Analysis of Projected Minimum Temperature
Ensemble mean of the CORDEX South Asia climate data for IPCC AR5 RCP4.5 and RCP8.5 scenarios for Madhya Pradesh State and its districts for the annual and seasonal minimum temperature has been analysed. The projected annual and seasonal minimum temperature changes towards MC and EC with respect to BL for Madhya Pradesh and its districts for IPCC AR5 RCP4.5 and RCP8.5 scenarios are given in the Appendix I Table 12 and Table 13 respectively.
Figure 20 and Figure 21 show change in annual minimum temperature towards MC and EC with respect to BL for Madhya Pradesh State and its districts for IPCC AR5 RCP4.5 and RCP8.5 scenarios. Same has also been depicted as line graph for Madhya Pradesh State and as bar graph for the districts. The seasonal changes for the State towards MC and EC with respect to BL are also shown for both IPCC AR5 RCP4.5 and RCP8.5 scenarios. The spatial representation of projected changes in annual and seasonal mean minimum temperature for Madhya Pradesh for IPCC AR5 RCP4.5 and RCP8.5 scenarios is shown in Figure 22 and Figure 23 respectively. Summary of the projected change in minimum temperature for Madhya Pradesh for IPCC AR5 RCP4.5 and RCP8.5 scenarios is as
follows:
• Average annual minimum temperature for IPCC AR5 RCP4.5 scenario is projected to increase by about 1.4°C towards mid - century and by 2.6°C towards end - century while for IPCC AR5

0.0
0.5
1.0
1.5
2.0
2.5
3.0A
nu
pp
ur
Ash
okn
agar
Ch
hat
arp
ur
Dam
oh
Gw
alio
rN
arsi
ngh
pu
rN
eem
uch
Pan
na
Rai
sen
Raj
garh
Saga
rSh
ahd
ol
Sid
hi
Sin
grau
liTi
kam
garh
Um
aria
Vid
ish
aA
liraj
pu
rB
alag
hat
Bet
ul
Bh
ind
Bh
op
alC
hh
ind
war
aD
atia
Dew
asD
ind
ori
Gu
na
Har
da
Ho
shan
gab
adIn
do
reJa
bal
pu
rK
atn
iM
and
laM
and
sau
rM
ore
na
Rew
aSa
tna
Seh
ore
Seo
ni
Shaj
apu
rSh
eop
ur
Shiv
pu
riB
arw
ani
Bu
rhan
pu
rD
har
East
Nim
arJh
abu
aR
atla
mU
jjain
Wes
t N
imar
Tem
pe
ratu
rech
ange
fro
m B
L to
EC
(°C
)
Avg. minimum temperature State Avg. minimum temperatureRCP4.5
Projected change (BL to MC) in annual minimum temperature
0.0
0.5
1.0
1.5
2.0
2.5
3.0
Ash
okn
agar
Ch
hat
arp
ur
Dam
oh
Pan
na
Saga
rSh
ahd
ol
An
up
pu
rB
ho
pal
Gu
na
Gw
alio
rJa
bal
pu
rM
and
sau
rN
arsi
ngh
pu
rN
eem
uch
Rai
sen
Raj
garh
Rew
aSa
tna
Shaj
apu
rSi
dh
iSi
ngr
auli
Tika
mga
rhU
mar
iaV
idis
ha
Bal
agh
atB
etu
lB
hin
dC
hh
ind
war
aD
atia
Dew
asD
ind
ori
Ho
shan
gab
adK
atn
iM
and
laM
ore
na
Rat
lam
Seh
ore
Seo
ni
Sheo
pu
rSh
ivp
uri
Ujja
inA
liraj
pu
rB
arw
ani
Dh
arH
ard
aIn
do
reJh
abu
aW
est
Nim
arB
urh
anp
ur
East
Nim
ar
Tem
pe
ratu
rech
ange
fro
m B
L to
EC
(°C
)
Avg. minimum temperature State Avg. minimum temperatureRCP4.5
Projected change (BL to EC) in annual minimum temperature
Figure 20 : Characteristics of simulated annual minimum temperature for IPCC AR5 RCP4.5 scenario
64

0.0
0.5
1.0
1.5
2.0
2.5
3.0
3.5
Annual JF MAM JJAS OND
Tem
pe
ratu
re c
han
ge f
rom
BL
(°C
)
MC Change wrt BL (°C) EC Change wrt BL (°C)RCP4.5
Projected change wrt BL in annual and seasonal minimum temperature for Madhya Pradesh State
0.0
0.5
1.0
1.5
2.0
2.5
3.0
An
up
pu
rA
sho
knag
arC
hh
atar
pu
rD
amo
hJa
bal
pu
rN
arsi
ngh
pu
rN
eem
uch
Pan
na
Rai
sen
Raj
garh
Saga
rSh
ahd
ol
Shaj
apu
rSi
dh
iSi
ngr
auli
Um
aria
Vid
ish
aA
liraj
pu
rB
alag
hat
Bet
ul
Bh
op
alC
hh
ind
war
aD
ewas
Din
do
riG
un
aG
wal
ior
Har
da
Ho
shan
gab
adIn
do
reK
atn
iM
and
laM
and
sau
rR
atla
mR
ewa
Satn
aSe
ho
reSe
on
iSh
ivp
uri
Tika
mga
rhU
jjain
Bar
wan
iB
hin
dB
urh
anp
ur
Dat
iaD
har
East
Nim
arJh
abu
aM
ore
na
Sheo
pu
rW
est
Nim
ar
Min
Te
mp
ch
ange
fro
m B
L to
MC
(°C
)
Avg. minimum temperature State Avg. minimum temperatureRCP8.5
Projected change (BL to MC) in annual minimum temperature
Figure 20 : Characteristics of simulated annual minimum temperature for IPCC AR5 RCP4.5 scenario
Figure 21 : Characteristics of simulated annual minimum temperature for IPCC AR5 RCP8.5 scenario
65

0.0
1.0
2.0
3.0
4.0
5.0
6.0A
sho
knag
arD
amo
hM
and
sau
rN
eem
uch
Raj
garh
Saga
rSh
ajap
ur
Bh
op
alC
hh
atar
pu
rG
un
aN
arsi
ngh
pu
rR
aise
nR
atla
mTi
kam
garh
Vid
ish
aA
nu
pp
ur
Bar
wan
iB
hin
dG
wal
ior
Jab
alp
ur
Jhab
ua
Pan
na
Seh
ore
Seo
ni
Shah
do
lSh
eop
ur
Shiv
pu
riU
jjain
Alir
ajp
ur
Bal
agh
atC
hh
ind
war
aD
atia
Dew
asD
har
Ho
shan
gab
adM
ore
na
Rew
aSa
tna
Sid
hi
Sin
grau
liU
mar
iaB
etu
lD
ind
ori
Ind
ore
Kat
ni
Man
dla
Wes
t N
imar
Har
da
Bu
rhan
pu
rEa
st N
imar
Min
Te
mp
ch
ange
fro
m B
L to
EC
(°C
)
Avg. minimum temperature State Avg. minimum temperatureRCP8.5
Projected change (BL to EC) in annual minimum temperature
0.0
1.0
2.0
3.0
4.0
5.0
6.0
7.0
Annual JF MAM JJAS OND
Tem
pe
ratu
re c
han
ge f
rom
BL
(°C
)
MC Change wrt BL (°C) EC Change wrt BL (°C)RCP8.5
Projected change wrt BL in annual and seasonal minimum temperature for Madhya Pradesh State
Figure 21 : Characteristics of simulated annual minimum temperature for IPCC AR5 RCP8.5 scenario
66

Figure 22 : Spatial representation of projected changes in annual and seasonal minimum temperature for IPCC AR5 RCP4.5 scenario
67

Figure 23 : Spatial representation of projected changes inannual and seasonal minimum temperature for PCC AR5 RCP8.5 scenario
68

69
towards MC and EC for both the climate scenarios.
• Districts in the South West belonging to Narmadapuram and Indore divisions namely, Barwani, Burhanpur, Jhabua, West Nimar, Dhar, Indore, East Nimar, Alirajpur, Betul, Dewas and Harda show highest projected increase in rainfall as compared to the other districts of Madhya Pradesh towards MC and EC with respect to BL. While some of the districts in the East belonging to Jabalpur and Shahdol divisions namely, Jabalpur, Umaria, Katni, Damoh, Shahdol, Narsinghpur, Mandla, Dindori and Sagar show the projected decrease in annual rainfall towards MC and EC with respect to BL for IPCC AR5 RCP4.5 scenario (Figure 24 and Figure 26).
• Districts in the Indore division namely, Barwani, West Nimar, Burhanpur and Indore show the highest projected increase (20%-25%) in annual rainfall towards EC while the Eastern districts of Madhya Pradesh namely, Shahdol, Umaria, Jabalpur and Katni show the projected decrease in annual rainfall towards MC and EC with respect to BL for IPCC AR5 RCP8.5 scenario (Figure 27).
• In pre monsoon season (MAM) and post monsoon season (OND) rainfall decrease is projected towards MC while in winter season (JF) highest rainfall increase is projected towards MC and EC for Madhya Pradesh State for IPCC AR5 RCP4.5 scenario (Figure 24 and Figure 26).
• In winter season (JF) and post monsoon season (OND) rainfall decrease is projected towards MC while in winter season (JF) highest rainfall increase is projected towards EC as compared to BL for Madhya Pradesh State for IPCC AR5 RCP8.5 scenario (Figure 25 and Figure 27).
Precipitation Projections for Madhya Pradesh Analysis of Projected Precipitation
Ensemble mean of the CORDEX South Asia climate data for IPCC AR5 RCP4.5 and RCP8.5 scenarios for Madhya Pradesh State and its districts for the annual precipitation has been analysed. The projected annual and seasonal precipitation changes towards MC and EC with respect to BL for Madhya Pradesh and its districts for IPCC AR5 RCP4.5 and RCP8.5 scenarios are given in the Appendix I Table 14 and Table 15 respectively.
Figure 24 and Figure 25 for RCP8.5 show percentage change in annual rainfall towards MC and EC with respect to BL for Madhya Pradesh State and its districts for IPCC AR5 RCP4.5 and RCP8.5 scenarios. Same has also been depicted as line graph for Madhya Pradesh State and as bar graph for the districts. The seasonal changes for the State towards MC and EC as compared to BL are also shown for both IPCC AR5 RCP4.5 and RCP8.5 scenarios. The spatial representation of projected changes in annual and seasonal precipitation for Madhya Pradesh for IPCC AR5 RCP4.5 and RCP8.5 scenarios is shown in Figure 26 and Figure 27 respectively. Summary of the projected change in precipitation for Madhya Pradesh for IPCC AR5 RCP4.5 and RCP8.5 scenarios is as follows:
• Average annual rainfall for IPCC AR5 RCP4.5 scenario is projected to decrease marginally by about 0.1% towards mid-century and increase by about 4.4% towards end-century while for IPCC AR5 RCP8.5 scenario it is projected to increase marginally by about 0.2% towards mid-century and 5.8% towards end-century for the State. Thus, the percentage of the projected rainfall increase is very low

-15
-10
-5
0
5
10
15
20
25
30P
ann
aSa
tna
Dat
iaC
hh
atar
pu
rK
atn
iG
wal
ior
Tika
mga
rhSh
ivp
uri
Dam
oh
Um
aria
Shah
do
lR
ewa
Jab
alp
ur
Bh
ind
Saga
rSi
dh
iM
and
sau
rA
nu
pp
ur
Mo
ren
aN
eem
uch
Gu
na
Din
do
riSh
eop
ur
Ash
okn
agar
Vid
ish
aM
and
laSi
ngr
auli
Nar
sin
ghp
ur
Rai
sen
Raj
garh
Bal
agh
atB
ho
pal
Seo
ni
Rat
lam
Shaj
apu
rU
jjain
Ch
hin
dw
ara
Ho
shan
gab
adSe
ho
reB
urh
anp
ur
Alir
ajp
ur
Jhab
ua
Bet
ul
Dew
asH
ard
aEa
st N
imar
Dh
arB
arw
ani
Ind
ore
Wes
t N
imar
Ch
ange
(%
)
Change (%) in rainfall State Change (%) in rainfallRCP4.5
Projected change (BL to MC) in annual rainfall
-10
-5
0
5
10
15
20
25
30
Jab
alp
ur
Um
aria
Kat
ni
Dam
oh
Shah
do
lN
arsi
ngh
pu
rM
and
laD
ind
ori
Saga
rSi
dh
iA
nu
pp
ur
Pan
na
Rai
sen
Rew
aSa
tna
Ch
hat
arp
ur
Sin
grau
liSe
on
iSh
ivp
uri
Gw
alio
rV
idis
ha
Bal
agh
atM
ore
na
Tika
mga
rhD
atia
Ho
shan
gab
adR
ajga
rhSh
ajap
ur
Sheo
pu
rM
and
sau
rB
hin
dB
ho
pal
Ch
hin
dw
ara
Ash
okn
agar
Ujja
inG
un
aR
atla
mSe
ho
reN
eem
uch
Har
da
Bet
ul
Dew
asA
liraj
pu
rEa
st N
imar
Ind
ore
Dh
arW
est
Nim
arJh
abu
aB
urh
anp
ur
Bar
wan
i
Ch
ange
(%
)
Change (%) in rainfall State Change (%) in rainfallRCP4.5
Projected change (BL to EC) in annual rainfall
Figure 24 : Characteristics of simulated annual precipitation for IPCC AR5 RCP4.5 scenario
70

-60
-40
-20
0
20
40
60
80
100
Annual JF MAM JJAS OND
Ch
ange
(%
)
MC Change wrt BL (%) EC Change wrt BL (%)RCP4.5
Projected change wrt BL in annual and seasonal precipitation for Madhya Pradesh State
-10
-5
0
5
10
15
Um
aria
Kat
ni
Shah
do
lJa
bal
pu
rD
amo
hN
eem
uch
Satn
aN
arsi
ngh
pu
rPa
nn
aD
ind
ori
Rew
aSi
dh
iA
nu
pp
ur
Man
dsa
ur
Ch
hat
arp
ur
Shiv
pu
riM
and
laR
aise
nG
wal
ior
Sheo
pu
rM
ore
na
Bh
ind
Ho
shan
gab
adSa
gar
Sin
grau
liSe
on
iD
atia
Tika
mga
rhV
idis
ha
Gu
na
Bal
agh
atR
ajga
rhB
ho
pal
Ash
okn
agar
Ch
hin
dw
ara
Seh
ore
Shaj
apu
rR
atla
mH
ard
aB
etu
lU
jjain
East
Nim
arD
ewas
Alir
ajp
ur
Bu
rhan
pu
rD
har
Jhab
ua
Bar
wan
iW
est
Nim
arIn
do
re
Ch
ange
(%
)
Change (%) in rainfall State Change (%) in rainfallRCP 8.5
Projected change (BL to MC) in annual rainfall
Figure 24 : Characteristics of simulated annual precipitation for IPCC AR5 RCP4.5 scenario
Figure 25 : Characteristics of simulated annual precipitation for IPCC AR5 RCP8.5 scenario
71

-10
-5
0
5
10
15
20
25
30Sh
ahd
ol
Um
aria
Jab
alp
ur
Kat
ni
Dam
oh
Nar
sin
ghp
ur
Man
dla
Saga
rSi
dh
iM
and
sau
rA
nu
pp
ur
Satn
aR
aise
nV
idis
ha
Din
do
riSe
on
iPa
nn
aSi
ngr
auli
Bal
agh
atR
ewa
Raj
garh
Gu
na
Nee
mu
chR
atla
mA
sho
knag
arH
osh
anga
bad
Ch
hat
arp
ur
Shaj
apu
rU
jjain
Bh
op
alSh
ivp
uri
Tika
mga
rhC
hh
ind
war
aSh
eop
ur
Seh
ore
Gw
alio
rA
liraj
pu
rD
atia
Har
da
Mo
ren
aB
hin
dD
har
East
Nim
arJh
abu
aD
ewas
Bet
ul
Bar
wan
iW
est
Nim
arB
urh
anp
ur
Ind
ore
Ch
ange
(%
)
Change (%) in rainfall State Change (%) in rainfallRCP 8.5
Projected change (BL to EC) in annual rainfall
-20
0
20
40
60
80
100
Annual JF MAM JJAS OND
Ch
ange
(%
)
MC Change wrt BL (%) EC Change wrt BL (%)RCP8.5
Projected change wrt BL in annual and seasonal precipitation for Madhya Pradesh State
Figure 25 : Characteristics of simulated annual precipitation for IPCC AR5 RCP8.5 scenario
72

Figure 26 : Spatial representation of projected changes in annual and seasonal precipitation for IPCC Ar5 RCP4.5 scenario
73

Figure 27 : Spatial representation of projected changes inannual and seasonal precipitation for IPCC AR5 RCP8.5 scenario
74
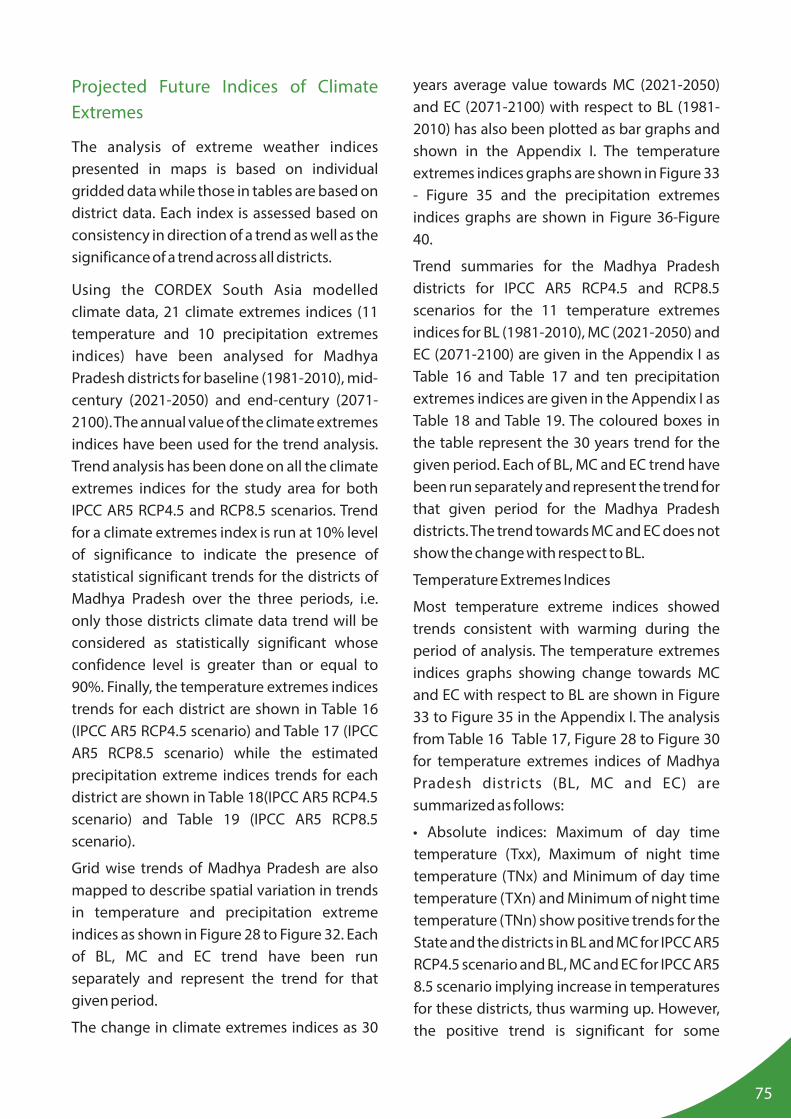
75
years average value towards MC (2021-2050) and EC (2071-2100) with respect to BL (1981-2010) has also been plotted as bar graphs and shown in the Appendix I. The temperature extremes indices graphs are shown in Figure 33 - Figure 35 and the precipitation extremes indices graphs are shown in Figure 36-Figure 40.
Trend summaries for the Madhya Pradesh districts for IPCC AR5 RCP4.5 and RCP8.5 scenarios for the 11 temperature extremes indices for BL (1981-2010), MC (2021-2050) and EC (2071-2100) are given in the Appendix I as Table 16 and Table 17 and ten precipitation extremes indices are given in the Appendix I as Table 18 and Table 19. The coloured boxes in the table represent the 30 years trend for the given period. Each of BL, MC and EC trend have been run separately and represent the trend for that given period for the Madhya Pradesh districts. The trend towards MC and EC does not show the change with respect to BL.
Temperature Extremes Indices
Most temperature extreme indices showed trends consistent with warming during the period of analysis. The temperature extremes indices graphs showing change towards MC and EC with respect to BL are shown in Figure 33 to Figure 35 in the Appendix I. The analysis from Table 16 Table 17, Figure 28 to Figure 30 for temperature extremes indices of Madhya Pradesh districts (BL, MC and EC) are summarized as follows:
• Absolute indices: Maximum of day time temperature (Txx), Maximum of night time temperature (TNx) and Minimum of day time temperature (TXn) and Minimum of night time temperature (TNn) show positive trends for the State and the districts in BL and MC for IPCC AR5 RCP4.5 scenario and BL, MC and EC for IPCC AR5 8.5 scenario implying increase in temperatures for these districts, thus warming up. However, the positive trend is significant for some
Projected Future Indices of Climate Extremes
The analysis of extreme weather indices presented in maps is based on individual gridded data while those in tables are based on district data. Each index is assessed based on consistency in direction of a trend as well as the significance of a trend across all districts.
Using the CORDEX South Asia modelled climate data, 21 climate extremes indices (11 temperature and 10 precipitation extremes indices) have been analysed for Madhya Pradesh districts for baseline (1981-2010), mid-century (2021-2050) and end-century (2071-2100). The annual value of the climate extremes indices have been used for the trend analysis. Trend analysis has been done on all the climate extremes indices for the study area for both IPCC AR5 RCP4.5 and RCP8.5 scenarios. Trend for a climate extremes index is run at 10% level of significance to indicate the presence of statistical significant trends for the districts of Madhya Pradesh over the three periods, i.e. only those districts climate data trend will be considered as statistically significant whose confidence level is greater than or equal to 90%. Finally, the temperature extremes indices trends for each district are shown in Table 16 (IPCC AR5 RCP4.5 scenario) and Table 17 (IPCC AR5 RCP8.5 scenario) while the estimated precipitation extreme indices trends for each district are shown in Table 18(IPCC AR5 RCP4.5 scenario) and Table 19 (IPCC AR5 RCP8.5 scenario).
Grid wise trends of Madhya Pradesh are also mapped to describe spatial variation in trends in temperature and precipitation extreme indices as shown in Figure 28 to Figure 32. Each of BL, MC and EC trend have been run separately and represent the trend for that given period.
The change in climate extremes indices as 30

76
IPCC AR5 RCP8.5 scenario (Figure 29). Cool days show negative non-significant trend towards MC and EC for the districts for IPCC AR5 RCP8.5 scenario.
• Duration indices: Cold spell duration indicator (CSDI) in BL show negative trend for all the districts of the State with trend being statistically significant for 41 districts. However, towards MC and EC, CSDI phenomena do not occur (value exceeds the threshold) for all the districts of the State for both the IPCC AR5 climate scenarios. Warm spell duration Indicator (WSDI) shows significant positive trend in BL, MC and EC for the State and majority of its districts for both IPCC AR5 RCP4.5 and RCP8.5 scenarios. However towards EC, IPCC AR5 RCP4.5 scenario starts stabilizing and the projected WSDI trend for the districts though is positive but not significant (Figure 30).
From Figure 35, it can be seen that cold spell duration indicator is projected to decrease and warm spell duration indicator is projected to increase for all the districts towards MC and EC compared to BL implying warming up over Madhya Pradesh districts.
Precipitation Extreme Indices
Rainfall and intensity of rainfall are projected to increase marginally towards MC and EC for Madhya Pradesh region. The scenario towards MC and EC is projected to change as compared to BL scenario. The precipitation extremes indices graphs showing change towards MC and EC with respect to BL average values are shown in Figure 36 to Figure 40 in the Appendix I. The results from Table 18, Table 19 and Figure 31 and Figure 32 for precipitation extreme indices of Madhya Pradesh districts (BL, MC and EC) are summarized as follows:
• Absolute indices: For IPCC AR5 RCP4.5 scenario, 1 day maximum precipitation and
districts while for others it is non-significant as can be seen from Figure 28. These indices behave differently towards the EC for IPCC AR5 RCP4.5 scenario and show negativenon-significant trend for some of the districts. Towards EC, TXx and TNx start stabilizing for entire districts of the State for IPCC AR5 RCP8.5 scenario.
Absolute indices values towards MC and EC are increasing as compared to BL for both the cl imate scenarios, implying that the temperature is projected to increase for the districts of Madhya Pradesh resulting overall warming up (Figure 33).
• Percentile indices: For IPCC AR5 RCP4.5 scenario, cool nights (TN10P) and cool days (TX10P) show significant negative trend while warm nights (TN90P) and warm days (TX90P) show significant positive trend for the State and the districts. However towards EC cool days and cool nights, warm days and warm nights start stabilizing. Though the percentage of warm days and warm nights is projected to increase and percentage of cool days and cool nights is projected to decrease towards MC and EC as compared to BL for all the districts, the trend is not significant for these percentile indices towards EC (Figure 29 and Figure 34). Decrease (cool days and cool nights) / increase (warm days and warm nights) in frequency of these indices towards EC is higher than that of MC which implies higher warming towards EC than MC.
For IPCC AR5 RCP8.5 scenario, cool nights and cool days show significant negative trend for Madhya Pradesh State and the districts in BL and MC while warm nights and warm days show significant positive trend in BL, MC and EC. However, towards EC cool nights start stabilizing for IPCC AR5 RCP8.5 scenario. Cool nights phenomena do not occur (exceeds the threshold) for entire districts of the State for

77
• Duration indices: Consecutive wet days (CWD) is projected to have statistically significant positive trend for districts namely, Tikamgarh, Ujjain and West Nimar towards EC for RCP4.5 scenario, for districts Balaghat, Bhopal, Mandla, Morena, Rewa and Seoni towards MC and for 7 districts namely, Balaghat, Betul, Chhindwara, Dewas, Dindori, Indore and Mandla towards EC for RCP8.5 scenario. While consecutive dry days (CDD) is projected to have statistically significant negative trend for 9 districts namely Ashoknagar, Bhind, Chhatarpur, Morena, Panna, Sagar, Sehore, Shivpuri and Vidisha towards MC for RCP8.5 scenario.
Consecutive dry days and consecutive wet days are projected to increase for some of the districts while decrease for others towards MC and EC as compared to BL, for both the IPCC AR5 climate scenarios (Figure 38).
• Threshold indices: For IPCC AR5 RCP4.5 and RCP8.5 scenarios, heavy and very heavy precipitation days (R10mm and R20mm) have projected positive trend for majority of the districts towards MC and EC which is also statistically not significant. (Figure 32).
Heavy precipitation days are projected to increase while very heavy precipitation days are projected to decrease for majority of the districts towards MC and EC compared to BL for the districts for both the IPCC AR5 climate scenarios (Figure 39).
• Other indices: For IPCC AR5 RCP4.5 and RCP8.5 scenarios, towards MC and EC most of the districts are projected to show positive non-significant trend for annual total precipitation. However, towards MC RCP4.5 scenario, positive trend in rainfall is statistically significant for 5 districts namely, Betul, Burhanpur, East Nimar, Harda and West Nimar (Table 18).
5 day maximum precipitation show negative trend for most of the districts of Madhya Pradesh in the baseline. However, for 1 day and 5 day maximum precipitation the negative trend is statistically significant for 4 and 8 districts respectively. Towards MC and EC, they are projected to show positive trend for most of the districts of the State and the districts with significant positive trend are Betul, Chhindwara, Hoshangabad and Seoni as shown in Figure 31. For IPCC AR5 RCP8.5 scenario, towards MC and EC no consistency in trend is projected for these indices. For some districts the trend is positive while for others it is negative.
However, 1 day maximum precipitation and 5 day maximum precipitation are projected to increase for some of the districts while decrease for others towards MC and EC compared to BL implying that rainfall intensity would increase/decrease in the future for the districts. Towards end-century increase is projected to be the highest for district namely Betul compared to the baseline RCP8.5 climate scenario (Figure 36).
• Percentile indices: For IPCC AR5 RCP4.5 and RCP 8.5 scenarios, ver y wet days precipitation (R95p) and extremely wet days precipitation (R99p) have projected mixed trend for MC and EC which is also statistically not significant.
Very wet days precipitation and extremely wet days precipitation are projected to decrease towards MC and increase towards EC compared to BL for majority of the districts for IPCC AR5 RCP4.5 scenario. However, these indices are projected to increase for majority of the districts towards MC and EC compared to BL for IPCC AR5 RCP8.5 scenario implying that rainfall intensity would increase in the future for the districts (Figure 37) .

78
towards EC for most of the districts of the State.
Annual precipitation is projected to increase towards MC and EC as compared to BL for majority of the districts for the IPCC AR5 RCP4.5 a n d R C P 8 . 5 s c e n a r i o s . T h e a v e r a g e precipitation on wet days is expected to decrease for most of the districts towards MC and EC as compared to BL for both the IPCC AR5 climate scenarios (Figure 40).
• For IPCC AR5 RCP4.5 scenario, average precipitation on wet days (Simple Daily Intensity Index) is projected to have positive trend towards MC and EC for most of the districts of the State, however, the trend in SDII is statistically significant towards MC and EC for 4 and 10 districts respectively. For IPCC AR5 RCP8.5 scenario, average precipitation on wet days (Simple Daily Intensity Index) is projected to show positive non significant trend towards MC while negative non significant trend

Figure 28 : Spatial representation of absolute temperature extremes indices for Madhya Pradesh (IPCC AR5 RCP4.5 and RCP8.5 scenarios)
79

IPCC Ar5 RCP 8.5 scenario
Figure 28 : Spatial representation of absolute temperature extremes indices forMadhya Pradesh (IPCC AR5 RCP4.5 and RCP8.5 scenarios)
80

IPCC AR5 RCP4.5 scenario
Figure 29 : Spatial representation of percentile temperature extremes indices forMadhya Pradesh (IPCC AR5 RCP4.5 and RCP8.5 scenarios)
81

IPCC Ar5 RCP 8.5 scenario
Figure 29 : Spatial representation of percentile temperature extremes indices forMadhya Pradesh (IPCC AR5 RCP4.5 and RCP8.5 scenarios)
82

IPCC AR5 RCP4.5 scenario
IPCC Ar5 RCP 8.5 scenario
Figure 30 : Spatial representation of temperature duration indices for Madhya Pradesh (IPCC AR5 RCP4.5 and RCP8.5 scenarios)
83

IPCC AR5 RCP4.5 scenario
Figure 31 : Spatial representation of precipitation absolute and percentile indices for Madhya Pradesh (IPCC AR5 RCP4.5 and RCP8.5 scenarios) IPCC
84

IPCC Ar5 RCP 8.5 scenario
Figure 31 : Spatial representation of precipitation absolute and percentile indices for Madhya Pradesh (IPCC AR5 RCP4.5 and RCP8.5 scenarios)
85

IPCC AR5 RCP4.5 scenario
Figure 32 : Spatial representation of precipitation threshold and duration indices for Madhya Pradesh (IPCC AR5 RCP4.5 and RCP8.5 scenarios)
86

IPCC Ar5 RCP 8.5 Scenario
Figure 32 : Spatial representation of precipitation threshold and duration indices for Madhya Pradesh (IPCC AR5 RCP4.5 and RCP8.5 scenarios)
87

88
Madhya Pradesh for IPCC AR5 RCP8.5 scenario.
• Highest maximum temperature increase is projected in pre monsoon season (MAM) for IPCC AR5 RCP4.5 and RCP8.5 scenarios towards MC and EC for Madhya Pradesh State as compared to the other seasons.
• For both IPCC AR5 RCP4.5 and RCP8.5 scenarios, increase in annual and seasonal maximum temperature is projected for Madhya Pradesh and its districts towards MC and EC. However, IPCC AR5 RCP8.5 scenario shows higher increase than that of IPCC AR5 RCP4.5 scenario.
Projected Minimum Temperature
• Average annual minimum temperature for IPCC AR5 RCP4.5 scenario is projected to increase by about 1.4°C towards mid-century and by 2.6°C towards end while for IPCC AR5 RCP8.5 scenario it is projected to increase by about 1.8°C towards mid-century and 5.3°C towards end - century for Madhya Pradesh State. Thus, projected temperature increase towards EC is higher than that of MC.
• The projected increase in minimum temperature towards EC varies from 2.4°C in Ashoknagar to 2.8°C in East Nimar district for IPCC AR5 RCP4.5 scenario and 5.0°C in Ashoknagar and Damoh districts to 5.7°C in East Nimar district of Madhya Pradesh for IPCC AR5 RCP8.5 scenario.
• Highest minimum temperature increase is projected in monsoon season (JJAS) for IPCC AR5 RCP4.5 scenario and pre monsoon season (MAM) and monsoon season (JJAS) for RCP8.5 scenario for both MC and EC for Madhya Pradesh State as compared to the other seasons.
• For IPCC AR5 RCP4.5 and RCP8.5 scenario, minimum temperature show higher projected increase than the maximum
Summary - Projected Climate Scenarios for Madhya Pradesh
Projected Climate Data Analysis
The CORDEX South Asia modelled climate data on precipitation, maximum temperature, minimum temperature and 21 climate extremes indices have been analysed for Madhya Pradesh State and its 50 districts for baseline (BL, 1981-2010), mid-century (MC, 2021-2050) and end-century (EC, 2071-2100). Ensemble mean of 10 RCMs at a spatial resolution of 50kmx50km has been used. The CORDEX South Asia simulations with the models indicate an all-round warming over the study area. Projected increase in temperature and precipitation towards end-century is higher than that is towards mid-century. The summary for three time periods-BL, MC and EC is as follows:
Projected Maximum Temperature
• Average annual maximum temperature for IPCC AR5 RCP4.5 scenario is projected to increase by about 1.3°C towards mid-century and by 2.0°C towards end-century while for IPCC AR5 RCP8.5 scenario it is projected to increase by about 1.6°C towards mid-century and 4.3°C towards end-century for Madhya Pradesh State. Thus, projected temperature increase in end-century is higher than that of mid-century.
• The projected increase in maximum temperature towards MC does not show significant variation across the districts of Madhya Pradesh for both IPCC AR5 RCP4.5 and RCP8.5 scenarios.
• The projected increase in maximum temperature towards EC varies from 1.8°C in Alirajpur to 2.2°C in Shivpuri district for IPCC AR5 RCP4.5 scenario and 3.9°C in Barwani and West Nimar to 4.6°C in Singrauli and Ashoknagar districts of

89
season (JF) highest rainfall increase is projected towards MC and EC for Madhya Pradesh State for IPCC AR5 RCP4.5 scenario.
• In winter season (JF) and post monsoon season (OND) rainfall decrease is projected towards MC while in winter season (JF) highest rainfall increase is projected towards EC as compared to BL for Madhya Pradesh State for IPCC AR5 RCP8.5 scenario.
Climate Extremes Indices using Projected Climate
Temperature Extreme Indices
• The most representative temperature extremes indices that showed significant positive trends for more than half of the districts thus, the State for IPCC AR5 RCP4.5 scenario for BL and MC are the maximum of day time temperature, maximum of night time temperature, minimum of night time temperature, warm nights, warm days and warm spell duration indicator. Indices that showed significant negative trends are cool nights, cool days and cold spell duration indicator. Thus, there is a warming up scenario for the State of Madhya Pradesh.
• The most representative temperature extremes indices that showed significant positive trends for more than half of the districts. Thus the State for IPCC AR5 RCP8.5 scenario for BL, MC and EC are the minimum of day time temperature, minimum of night time temperature, warm nights, warm days and warm spell duration indicator. Indices that showed significant negative trends are cool nights towards MC. Thus, there is a warming up scenario for the State of Madhya Pradesh.
• Cool night’s phenomena do not occur for 15 districts of the State for IPCC AR5 RCP4.5 scenario and for all districts for IPCC AR5 RCP8.5 scenario towards EC.
• Cold Spell Duration Indicator (CSDI)
temperature towards MC and EC for Madhya Pradesh.
Projected Precipitation
• Average annual rainfall for IPCC AR5 RCP4.5 scenario is projected to decrease marginally by about 0.1% towards mid-century and increase by about 4.4% towards end-century while for IPCC AR5 RCP8.5 scenario it is projected to increase marginally by about 0.2% towards mid-century and 5.8% towards end-century for the State. Thus, the percentage of the projected rainfall increase is very low towards MC and EC for both the climate scenarios.
• Districts in the South West belonging to Narmadapuram and Indore divisions namely, Barwani, Burhanpur, Jhabua, West Nimar, Dhar, Indore, East Nimar, Alirajpur, Betul, Dewas and Harda show highest projected increase in rainfall as compared to the other districts of Madhya Pradesh towards MC and EC with respect to BL. While some of the districts in the East belonging to Jabalpur and Shahdol divisions namely, Jabalpur, Umaria, Katni, Damoh, Shahdol, Narsinghpur, Mandla, Dindori and Sagar show the projected decrease in annual rainfall towards MC and EC with respect to BL for IPCC AR5 RCP4.5 scenario.
• Districts in the Indore division namely, Barwani, West Nimar, Burhanpur and Indore show the highest projected increase (20%-25%) in annual rainfall towards EC while the Eastern districts of Madhya Pradesh namely, Shahdol, Umaria, Jabalpur and Katni show the projected decrease in annual rainfall towards MC and EC with respect to BL for IPCC AR5 RCP8.5 scenario.
• In pre monsoon season (MAM) and post monsoon season (OND) rainfall decrease is projected towards MC while in winter

90
average precipitation on wet days is expected to decrease for most of the districts towards MC and EC as compared to BL for both the IPCC AR5 climate scenarios.
• Very wet days precipitation and extremely wet days precipitation are projected to decrease towards MC and increase towards EC compared to BL for majority of the districts for IPCC AR5 RCP4.5 scenario. However, these indices are projected to increase for majority of the districts towards MC and EC compared to BL for IPCC AR5 RCP8.5 scenario implying that rainfall intensity would increase in the future for the districts.
• Heavy precipitation days are projected to increase while very heavy precipitation days are projected to decrease for majority of the districts towards MC and EC compared to BL for the districts for both the IPCC AR5 climate scenarios.
In light of these consistent temporal trends of warming and increasing precipitation in Madhya Pradesh with large geographic variation, the indicators that have been identified should be further evaluated and assessed for their health impact. Geographical differences in climate trends may be of use in informing policy and resource allocation for climate change adaptation.
phenomena do not occur (value exceeds the threshold) for all the districts of the State towards MC and EC, for both the IPCC AR5 climate scenarios.
• Percentage of warm days and warm nights is projected to increase while percentage of cool days and cool nights is projected to decrease for all the districts towards MC and EC in comparison to BL implying warming up for both the IPCCAR5 climate scenarios .
• Decrease (cool days and cool nights) / increase (warm days and warm nights) in frequency of these indices towards EC is higher than that of MC which implies higher warming towards EC than MC compared to BL.
Precipitation Extreme Indices
• None of the precipitation extreme indices show significant trends for the majority of the districts of Madhya Pradesh for both IPCC AR5 climate scenarios. The model results do not show any consistency in the trend of rainfall indices- for some districts the trend is positive while for others it’s negative.
• Annual precipitation is projected to increase towards MC and EC as compared to BL for majority of the districts for the IPCC AR5 RCP4.5 and RCP8.5 scenarios. The

Appendix I
Annual JF (Winter) MAM (Pre Monsoon)
JJAS (Monsoon) OND (Post monsoon)
District MC-BL EC-BL MC-BL EC-BL MC-BL EC-BL MC-BL EC-BL MC-BL EC-BL
Madhya Pradesh
1.3 2.0 1.7 2.3 1.9 3.1 0.7 1.4 1.3 1.5
Alirajpur 1.2 1.8 1.7 2.5 1.4 2.5 0.8 1.4 1.3 1.5
Anuppur 1.4 2.0 1.8 2.2 2.1 3.2 0.9 1.6 1.2 1.5
Ashoknagar 1.4 2.1 1.8 2.6 2.0 3.3 0.7 1.4 1.3 1.5
Balaghat 1.3 2.0 1.6 2.0 1.9 3.0 0.8 1.6 1.2 1.4
Barwani 1.2 1.8 1.6 2.3 1.4 2.5 0.8 1.3 1.2 1.4
Betul 1.3 1.9 1.7 2.2 1.8 3.0 0.8 1.5 1.3 1.4
Bhind 1.4 2.1 1.8 2.6 2.0 3.4 0.8 1.4 1.4 1.6
Bhopal 1.4 2.1 1.8 2.4 1.9 3.2 0.7 1.4 1.2 1.4
Burhanpur 1.3 1.8 1.7 2.2 1.6 2.6 0.7 1.3 1.3 1.4
Chhatarpur 1.4 2.1 1.8 2.5 2.1 3.4 0.8 1.4 1.3 1.5
Chhindwara 1.3 2.0 1.6 2.0 2.0 3.2 0.8 1.5 1.2 1.4
Damoh 1.3 2.0 1.7 2.3 2.1 3.4 0.8 1.5 1.3 1.5
Datia 1.4 2.2 1.9 2.8 2.0 3.3 0.9 1.5 1.4 1.6
Dewas 1.3 1.9 1.7 2.3 1.7 2.9 0.7 1.4 1.2 1.3
Dhar 1.2 1.8 1.7 2.4 1.4 2.5 0.8 1.4 1.2 1.4
Dindori 1.4 2.0 1.7 2.1 2.1 3.2 0.9 1.6 1.2 1.4
East Nimar 1.2 1.9 1.6 2.2 1.7 2.8 0.7 1.4 1.3 1.4
Guna 1.3 2.0 1.8 2.6 1.9 3.3 0.8 1.4 1.4 1.6
Gwalior 1.4 2.1 1.8 2.7 1.9 3.3 0.8 1.5 1.4 1.6
Harda 1.2 1.9 1.6 2.2 1.8 3.0 0.7 1.4 1.3 1.4
Hoshangabad 1.3 2.0 1.6 2.2 2.0 3.2 0.8 1.5 1.2 1.4
Indore 1.2 1.9 1.6 2.2 1.6 2.8 0.7 1.3 1.2 1.3
Jabalpur 1.4 2.1 1.8 2.3 2.1 3.3 0.8 1.6 1.2 1.5
Jhabua 1.2 1.8 1.7 2.4 1.3 2.4 0.7 1.3 1.3 1.5
Katni 1.4 2.1 1.9 2.3 2.1 3.3 0.9 1.5 1.2 1.5
Mandla 1.4 2.0 1.6 2.1 2.0 3.1 0.9 1.6 1.2 1.4
Mandsaur 1.3 1.9 1.6 2.4 1.6 2.8 0.8 1.3 1.3 1.5
Morena 1.4 2.2 1.7 2.6 2.0 3.3 0.8 1.5 1.4 1.6
Narsinghpur 1.4 2.1 1.7 2.2 2.0 3.2 0.8 1.5 1.2 1.4
Neemuch 1.3 2.0 1.6 2.4 1.6 2.8 0.8 1.4 1.2 1.4
Panna 1.5 2.1 1.9 2.4 2.0 3.3 0.8 1.4 1.3 1.5
Raisen 1.3 2.0 1.7 2.3 1.9 3.2 0.7 1.4 1.3 1.4
Rajgarh 1.3 2.0 1.8 2.4 1.8 3.1 0.8 1.4 1.3 1.4
Ratlam 1.3 1.9 1.6 2.4 1.6 2.7 0.8 1.4 1.3 1.5
Rewa 1.4 2.1 1.9 2.4 2.1 3.3 0.7 1.4 1.4 1.6
Table 10: Change in daily maximum temperature (°C) w.r.t. BL (1981-2010) as simulated by South Asia Cordex for Madhya Pradesh(IPCC AR5 RCP4.5 scenario)
91

Annual JF (Winter) MAM (Pre Monsoon)
JJAS (Monsoon) OND (Post monsoon)
District MC-BL EC-BL MC-BL EC-BL MC-BL EC-BL MC-BL EC-BL MC-BL EC-BL
Sagar 1.4 2.1 1.7 2.3 2.0 3.4 0.8 1.5 1.3 1.5
Satna 1.4 2.1 1.9 2.4 2.0 3.2 0.9 1.5 1.4 1.6
Sehore 1.3 2.0 1.7 2.3 1.8 3.1 0.8 1.5 1.3 1.4
Seoni 1.3 2.0 1.6 2.1 2.0 3.2 0.8 1.6 1.1 1.4
Shahdol 1.4 2.1 1.8 2.2 2.1 3.2 0.9 1.6 1.2 1.5
Shajapur 1.3 1.9 1.7 2.4 1.7 3.0 0.8 1.4 1.2 1.4
Sheopur 1.4 2.1 1.8 2.7 1.9 3.2 0.8 1.5 1.4 1.6
Shivpuri 1.4 2.2 1.9 2.7 1.9 3.2 0.8 1.4 1.4 1.6
Sidhi 1.4 2.1 1.9 2.4 2.1 3.3 0.7 1.4 1.3 1.5
Singrauli 1.4 2.1 1.9 2.4 2.1 3.4 0.7 1.5 1.3 1.6
Tikamgarh 1.4 2.1 1.9 2.6 2.0 3.4 0.8 1.4 1.4 1.6
Ujjain 1.2 1.9 1.7 2.4 1.6 2.8 0.8 1.3 1.2 1.4
Umaria 1.4 2.1 1.9 2.3 2.1 3.2 0.9 1.5 1.3 1.5
Vidisha 1.3 2.0 1.8 2.4 2.0 3.3 0.8 1.4 1.3 1.5
West Nimar 1.2 1.8 1.7 2.3 1.5 2.5 0.7 1.3 1.2 1.3
Data Source: CORDEX South Asia RCM: Multi Model Ensemble Mean
Annual JF (Winter) MAM (Pre Monsoon)
JJAS (Monsoon) OND (Post monsoon)
District MC-BL EC-BL MC-BL EC-BL MC-BL EC-BL MC-BL EC-BL MC-BL EC-BL
Madhya Pradesh
1.6 4.3 2.0 4.6 2.4 6.2 1.1 3.3 1.4 3.6
Alirajpur 1.4 4.0 2.0 4.9 1.9 5.0 1.1 3.3 1.3 3.7
Anuppur 1.7 4.5 2.0 4.6 2.5 7.0 1.2 3.5 1.4 3.5
Ashoknagar 1.7 4.6 2.1 4.8 2.5 6.6 1.1 3.6 1.3 3.6
Balaghat 1.6 4.5 1.9 4.5 2.3 6.7 1.1 3.4 1.4 3.6
Barwani 1.5 3.9 2.0 4.6 1.8 5.1 1.1 3.0 1.4 3.5
Betul 1.6 4.3 2.0 4.6 2.3 6.3 1.1 3.3 1.4 3.6
Bhind 1.7 4.4 2.2 4.6 2.6 6.5 1.2 3.6 1.5 3.6
Bhopal 1.7 4.5 2.1 4.7 2.4 6.3 1.1 3.4 1.3 3.5
Burhanpur 1.5 4.0 2.0 4.6 2.0 5.4 1.0 3.0 1.4 3.5
Chhatarpur 1.7 4.4 2.1 4.6 2.6 6.6 1.1 3.5 1.4 3.5
Chhindwara 1.7 4.4 1.9 4.5 2.4 6.5 1.1 3.3 1.3 3.5
Damoh 1.7 4.4 2.0 4.5 2.6 6.6 1.2 3.5 1.4 3.6
Datia 1.7 4.5 2.3 4.8 2.5 6.4 1.2 3.7 1.4 3.6
Dewas 1.6 4.2 1.9 4.6 2.1 5.8 1.1 3.3 1.2 3.4
Dhar 1.5 4.0 2.0 4.7 1.8 5.1 1.1 3.2 1.3 3.5
Dindori 1.7 4.5 1.9 4.5 2.5 6.9 1.2 3.4 1.4 3.5
Table 11: Change in daily maximum temperature (°C) wrt BL (1981-2010) as simulated by South Asia Cordex for Madhya Pradesh(IPCC AR5 RCP8.5 scenario)
92

Annual JF (Winter) MAM (Pre Monsoon)
JJAS (Monsoon) OND (Post monsoon)
District MC-BL EC-BL MC-BL EC-BL MC-BL EC-BL MC-BL EC-BL MC-BL EC-BL
East Nimar 1.5 4.2 2.0 4.6 2.1 5.9 1.1 3.1 1.4 3.5
Guna 1.6 4.5 2.1 4.8 2.5 6.4 1.1 3.6 1.4 3.7
Gwalior 1.7 4.4 2.3 4.7 2.5 6.3 1.2 3.6 1.5 3.6
Harda 1.6 4.3 2.0 4.6 2.2 6.3 1.1 3.2 1.4 3.6
Hoshangabad 1.6 4.4 2.0 4.6 2.4 6.5 1.2 3.4 1.3 3.5
Indore 1.5 4.1 1.9 4.6 2.1 5.4 1.1 3.2 1.2 3.4
Jabalpur 1.7 4.5 2.0 4.6 2.6 6.7 1.2 3.4 1.4 3.6
Jhabua 1.5 4.0 2.0 4.7 1.8 5.1 1.0 3.1 1.4 3.6
Katni 1.7 4.4 2.1 4.6 2.5 6.5 1.2 3.4 1.4 3.5
Mandla 1.7 4.5 1.9 4.5 2.5 6.7 1.2 3.4 1.4 3.6
Mandsaur 1.6 4.2 2.0 4.6 2.1 5.3 1.1 3.4 1.3 3.6
Morena 1.8 4.4 2.2 4.5 2.5 6.3 1.2 3.6 1.5 3.6
Narsinghpur 1.7 4.5 2.0 4.6 2.5 6.6 1.2 3.4 1.3 3.5
Neemuch 1.6 4.2 2.0 4.5 2.1 5.3 1.1 3.5 1.3 3.5
Panna 1.8 4.4 2.2 4.6 2.5 6.5 1.1 3.4 1.5 3.5
Raisen 1.7 4.4 2.0 4.6 2.4 6.4 1.1 3.4 1.3 3.6
Rajgarh 1.6 4.4 2.0 4.7 2.3 6.1 1.1 3.4 1.3 3.6
Ratlam 1.5 4.1 1.9 4.7 2.0 5.2 1.1 3.3 1.3 3.7
Rewa 1.7 4.4 2.2 4.6 2.6 6.6 1.1 3.3 1.6 3.6
Sagar 1.7 4.5 2.0 4.5 2.6 6.7 1.2 3.6 1.3 3.6
Satna 1.8 4.4 2.2 4.6 2.5 6.4 1.2 3.4 1.5 3.6
Sehore 1.6 4.3 1.9 4.6 2.3 6.1 1.2 3.4 1.3 3.5
Seoni 1.6 4.4 1.9 4.5 2.5 6.7 1.2 3.5 1.3 3.5
Shahdol 1.7 4.5 2.0 4.6 2.6 6.7 1.2 3.4 1.4 3.5
Shajapur 1.6 4.3 2.0 4.6 2.2 5.8 1.1 3.4 1.2 3.5
Sheopur 1.7 4.4 2.2 4.7 2.4 6.1 1.2 3.7 1.5 3.6
Shivpuri 1.8 4.5 2.2 4.8 2.4 6.3 1.1 3.6 1.4 3.6
Sidhi 1.7 4.5 2.2 4.7 2.6 6.7 1.1 3.3 1.5 3.6
Singrauli 1.7 4.6 2.1 4.7 2.6 7.2 1.1 3.3 1.5 3.6
Tikamgarh 1.7 4.5 2.2 4.7 2.5 6.6 1.2 3.6 1.4 3.6
Ujjain 1.5 4.1 1.9 4.7 2.0 5.4 1.1 3.3 1.2 3.5
Umaria 1.7 4.4 2.1 4.7 2.6 6.6 1.2 3.4 1.5 3.6
Vidisha 1.6 4.5 2.0 4.7 2.5 6.5 1.1 3.5 1.3 3.6
West Nimar 1.5 3.9 2.0 4.6 1.9 5.2 1.1 3.1 1.3 3.4
Data Source: CORDEX South Asia RCM: Multi Model Ensemble Mean
93

Annual JF (Winter) MAM (Pre Monsoon)
JJAS (Monsoon) OND (Post monsoon)
District MC-BL EC-BL MC-BL EC-BL MC-BL EC-BL MC-BL EC-BL MC-BL EC-BL
Table 12: Change in daily minimum temperature (°C) wrt BL (1981-2010) as simulated by South Asia Cordex for Madhya Pradesh(IPCC AR5 RCP4.5 scenario)
Madhya 1.4 2.6 1.6 2.6 1.5 2.7 1.5 2.9 1.0 1.9
Pradesh
Alirajpur 1.4 2.7 1.8 3.0 1.5 2.8 1.6 3.0 1.0 2.0
Anuppur 1.3 2.5 1.5 2.3 1.4 2.5 1.6 3.1 0.9 1.8
Ashoknagar 1.3 2.4 1.7 2.8 1.3 2.5 1.4 2.7 1.0 1.9
Balaghat 1.4 2.6 1.7 2.5 1.6 2.8 1.6 3.1 0.9 1.9
Barwani 1.5 2.7 1.7 2.7 1.6 2.9 1.6 3.2 1.0 1.9
Betul 1.4 2.6 1.7 2.5 1.7 3.1 1.7 3.2 0.8 1.7
Bhind 1.4 2.6 1.5 2.6 1.4 2.5 1.5 2.9 1.2 2.1
Bhopal 1.4 2.5 1.7 2.7 1.5 2.8 1.4 2.8 1.0 1.9
Burhanpur 1.5 2.8 1.7 2.6 1.7 3.2 1.6 3.3 0.9 1.8
Chhatarpur 1.3 2.4 1.6 2.6 1.5 2.7 1.4 2.7 1.1 2.0
Chhindwara 1.4 2.6 1.6 2.4 1.6 2.9 1.5 3.0 0.9 1.8
Damoh 1.3 2.4 1.6 2.5 1.4 2.6 1.4 2.7 1.0 1.9
Datia 1.4 2.6 1.6 2.8 1.5 2.6 1.4 2.8 1.1 2.0
Dewas 1.4 2.6 1.6 2.6 1.6 3.0 1.5 2.9 1.0 1.9
Dhar 1.5 2.7 1.7 2.7 1.6 2.9 1.6 3.0 1.0 1.9
Dindori 1.4 2.6 1.7 2.5 1.4 2.6 1.6 3.1 1.0 1.9
East Nimar 1.5 2.8 1.7 2.6 1.7 3.2 1.6 3.2 1.0 1.9
Guna 1.4 2.5 1.7 2.9 1.3 2.5 1.4 2.7 1.0 2.0
Gwalior 1.3 2.5 1.6 2.8 1.4 2.6 1.4 2.8 1.2 2.1
Harda 1.4 2.7 1.7 2.6 1.6 3.0 1.7 3.2 0.9 1.8
Hoshangabad 1.4 2.6 1.6 2.5 1.5 2.8 1.6 3.1 0.9 1.8
Indore 1.4 2.7 1.7 2.6 1.7 3.1 1.5 3.0 1.0 1.9
Jabalpur 1.4 2.5 1.6 2.5 1.4 2.6 1.5 2.9 0.9 1.9
Jhabua 1.5 2.7 1.7 2.8 1.4 2.7 1.6 3.0 1.0 2.1
Katni 1.4 2.6 1.6 2.5 1.4 2.6 1.5 2.9 1.0 2.0
Mandla 1.4 2.6 1.6 2.4 1.4 2.7 1.6 3.1 1.0 1.9
Mandsaur 1.4 2.5 1.7 2.8 1.5 2.7 1.5 2.7 1.1 2.0
Morena 1.4 2.6 1.5 2.7 1.3 2.4 1.5 3.0 1.2 2.1
Narsinghpur 1.3 2.5 1.6 2.5 1.4 2.6 1.5 2.8 0.9 1.8
Neemuch 1.3 2.5 1.6 2.7 1.3 2.5 1.5 2.7 1.1 2.0
Panna 1.3 2.4 1.5 2.5 1.5 2.6 1.4 2.7 1.0 1.9
Raisen 1.3 2.5 1.7 2.6 1.5 2.7 1.4 2.9 0.9 1.8
Rajgarh 1.3 2.5 1.6 2.7 1.4 2.7 1.4 2.7 0.9 1.9
Ratlam 1.5 2.6 1.8 2.9 1.5 2.8 1.6 2.9 1.1 2.0
Rewa 1.4 2.5 1.5 2.5 1.5 2.7 1.4 2.8 1.1 2.0
Sagar 1.3 2.4 1.6 2.6 1.4 2.6 1.4 2.8 0.9 1.8
Satna 1.4 2.5 1.5 2.5 1.5 2.7 1.4 2.7 1.1 2.0
94

Annual JF (Winter) MAM (Pre Monsoon)
JJAS (Monsoon) OND (Post monsoon)
District MC-BL EC-BL MC-BL EC-BL MC-BL EC-BL MC-BL EC-BL MC-BL EC-BL
Sehore 1.4 2.6 1.6 2.6 1.5 2.9 1.4 2.8 1.0 1.9
Seoni 1.4 2.6 1.6 2.4 1.5 2.7 1.5 3.0 0.9 1.8
Shahdol 1.3 2.4 1.5 2.4 1.4 2.6 1.5 2.9 1.0 1.8
Shajapur 1.4 2.5 1.6 2.7 1.5 2.8 1.4 2.7 1.0 1.9
Sheopur 1.4 2.6 1.6 2.8 1.3 2.4 1.5 3.0 1.2 2.1
Shivpuri 1.4 2.6 1.6 2.8 1.4 2.5 1.5 2.8 1.1 2.0
Sidhi 1.3 2.5 1.5 2.3 1.4 2.6 1.4 2.8 1.0 1.9
Singrauli 1.3 2.5 1.5 2.4 1.4 2.6 1.4 2.9 1.0 1.9
Tikamgarh 1.3 2.5 1.5 2.6 1.4 2.6 1.3 2.6 1.1 1.9
Ujjain 1.5 2.6 1.7 2.8 1.5 2.8 1.6 2.9 1.0 1.9
Umaria 1.3 2.5 1.5 2.4 1.5 2.7 1.5 2.9 1.0 1.9
Vidisha 1.3 2.5 1.7 2.7 1.4 2.7 1.4 2.8 1.0 1.9
West Nimar 1.5 2.7 1.6 2.6 1.7 3.2 1.6 3.1 1.0 1.9
Data Source: CORDEX South Asia RCM: Multi Model Ensemble Mean
Annual JF (Winter) MAM (Pre Monsoon)
JJAS (Monsoon) OND (Post monsoon)
District MC-BL EC-BL MC-BL EC-BL MC-BL EC-BL MC-BL EC-BL MC-BL EC-BL
Madhya 1.8 5.3 1.7 4.9 2.1 5.5 1.9 6.0 1.4 4.2Pradesh
Alirajpur 1.8 5.3 1.9 5.5 2.1 5.3 2.0 5.8 1.3 4.4
Anuppur 1.7 5.2 1.5 4.7 2.0 5.6 1.9 6.3 1.3 3.8
Ashoknagar 1.7 5.0 1.9 5.0 1.9 5.1 1.8 5.7 1.3 4.1
Balaghat 1.8 5.3 1.7 5.1 2.1 5.8 2.0 6.2 1.4 4.0
Barwani 1.9 5.2 1.7 5.1 2.2 5.5 2.1 5.8 1.3 4.4
Betul 1.8 5.4 1.7 4.9 2.3 6.0 2.1 6.6 1.2 3.8
Bhind 1.9 5.2 1.8 4.8 2.0 5.2 2.0 6.0 1.6 4.6
Bhopal 1.8 5.1 1.7 4.9 2.1 5.3 1.8 5.9 1.3 4.0
Burhanpur 1.9 5.6 1.6 5.1 2.4 6.0 2.1 6.6 1.3 4.2
Chhatarpur 1.7 5.1 1.8 4.7 2.1 5.5 1.8 5.8 1.5 4.3
Chhindwara 1.8 5.3 1.6 4.8 2.2 5.8 1.9 6.2 1.3 3.9
Damoh 1.7 5.0 1.6 4.7 2.0 5.3 1.8 5.7 1.3 4.0
Datia 1.9 5.3 2.0 5.0 2.1 5.3 1.9 5.9 1.5 4.5
Dewas 1.8 5.3 1.6 4.9 2.2 5.7 1.9 6.1 1.4 4.2
Dhar 1.9 5.3 1.8 5.2 2.2 5.5 2.0 5.8 1.3 4.4
Dindori 1.8 5.4 1.6 4.9 2.0 5.7 1.9 6.3 1.4 4.0
East Nimar 1.9 5.7 1.6 5.1 2.4 6.2 2.1 6.7 1.4 4.3
Guna 1.8 5.1 1.9 5.2 1.9 5.0 1.8 5.7 1.4 4.2
Table 13: Change in daily minimum temperature ( °C) wrt BL (1981-2010) as simulated by South Asia Cordex for Madhya Pradesh(IPCC AR5 RCP8.5 scenario)
95

Annual JF (Winter) MAM (Pre Monsoon)
JJAS (Monsoon) OND (Post monsoon)
District MC-BL EC-BL MC-BL EC-BL MC-BL EC-BL MC-BL EC-BL MC-BL EC-BL
Gwalior 1.8 5.2 2.0 4.9 2.0 5.3 1.9 6.0 1.6 4.6
Harda 1.8 5.5 1.6 5.1 2.3 5.9 2.1 6.6 1.3 4.1
Hoshangabad 1.8 5.3 1.6 4.9 2.2 5.7 2.0 6.4 1.3 4.0
Indore 1.8 5.4 1.7 5.0 2.3 5.8 2.0 6.1 1.3 4.2
Jabalpur 1.7 5.2 1.6 4.8 2.0 5.5 1.9 6.0 1.3 4.1
Jhabua 1.9 5.2 1.8 5.4 2.0 5.2 2.0 5.5 1.4 4.5
Katni 1.8 5.4 1.6 4.8 2.1 5.6 1.9 6.2 1.4 4.2
Mandla 1.8 5.4 1.6 4.9 2.1 5.7 2.0 6.2 1.4 4.1
Mandsaur 1.8 5.0 1.9 5.2 2.0 5.0 1.9 5.6 1.4 4.3
Morena 1.9 5.3 1.9 4.8 1.9 5.1 2.0 6.2 1.6 4.5
Narsinghpur 1.7 5.1 1.6 4.8 2.0 5.4 1.8 5.9 1.3 3.9
Neemuch 1.7 5.0 1.9 5.0 1.9 4.9 1.9 5.7 1.5 4.2
Panna 1.7 5.2 1.7 4.7 2.1 5.6 1.8 5.9 1.4 4.3
Raisen 1.7 5.1 1.7 4.9 2.1 5.4 1.9 6.1 1.3 3.9
Rajgarh 1.7 5.0 1.7 5.0 2.0 5.1 1.8 5.7 1.3 4.1
Ratlam 1.8 5.1 1.9 5.3 2.1 5.1 2.0 5.6 1.4 4.3
Rewa 1.8 5.3 1.7 4.7 2.2 5.8 1.9 6.2 1.5 4.3
Sagar 1.7 5.0 1.6 4.7 2.0 5.2 1.8 5.9 1.2 3.8
Satna 1.8 5.3 1.7 4.7 2.1 5.7 1.8 6.0 1.5 4.3
Sehore 1.8 5.2 1.7 4.9 2.2 5.5 1.8 5.9 1.4 4.1
Seoni 1.8 5.2 1.6 4.9 2.1 5.5 1.9 6.0 1.3 3.9
Shahdol 1.7 5.2 1.6 4.6 2.1 5.6 1.9 6.2 1.4 4.0
Shajapur 1.7 5.0 1.7 4.9 2.0 5.1 1.8 5.6 1.4 4.1
Sheopur 1.9 5.2 1.9 5.1 1.9 5.0 2.1 6.1 1.6 4.5
Shivpuri 1.8 5.2 1.9 5.0 1.9 5.1 1.9 5.9 1.5 4.3
Sidhi 1.7 5.3 1.6 4.6 2.1 5.7 1.8 6.1 1.5 4.2
Singrauli 1.7 5.3 1.6 4.6 2.1 5.8 1.8 6.3 1.4 4.1
Tikamgarh 1.8 5.1 1.8 4.8 2.0 5.3 1.8 5.7 1.4 4.3
Ujjain 1.8 5.2 1.8 5.1 2.1 5.2 2.0 5.8 1.3 4.2
Umaria 1.7 5.3 1.6 4.7 2.1 5.7 1.9 6.2 1.4 4.1
Vidisha 1.7 5.1 1.7 4.9 2.0 5.3 1.8 5.9 1.4 4.0
West Nimar 1.9 5.4 1.6 5.0 2.4 5.9 2.1 6.2 1.4 4.3
Data Source: CORDEX South Asia RCM: Multi Model Ensemble Mean
96

Annual JF (Winter) MAM (Pre Monsoon)
JJAS (Monsoon) OND (Post monsoon)
District MC-BL EC-BL MC-BL EC-BL MC-BL EC-BL MC-BL EC-BL MC-BL EC-BL
Table 14: Change in precipitation (%) wrt BL (1981-2010) as simulated by South Asia Cordex for Madhya Pradesh (IPCC AR5 RCP4.5 scenario)
Madhya -0.1 4.4 24.7 74.2 -44.3 47.0 2.4 2.7 -22.7 7.9
Pradesh
Alirajpur 7.8 13.2 132.0 160.0 -51.2 61.2 9.7 11.4 -13.5 22.4
Anuppur -3.4 0.0 7.5 78.8 -33.4 30.1 -0.3 -2.7 -27.0 8.4
Ashoknagar -2.4 6.2 71.6 45.9 -11.6 81.2 -0.4 5.6 -28.4 1.5
Balaghat 0.6 3.2 28.3 128.3 -41.6 24.7 3.2 0.5 -21.6 11.3
Barwani 12.6 24.0 23.1 30.8 -62.4 31.2 16.1 22.7 -6.2 36.3
Betul 9.6 12.3 65.7 171.6 -48.6 45.3 10.8 9.0 4.7 33.3
Bhind -4.9 5.5 -10.6 -1.8 -22.6 19.4 1.3 9.5 -43.7 -21.0
Bhopal 0.8 5.6 74.6 66.2 -58.3 76.5 3.1 3.8 -28.4 12.5
Burhanpur 7.2 21.9 49.0 100.0 -55.2 31.1 9.6 19.7 -3.1 37.1
Chhatarpur -7.8 0.6 37.0 20.0 -58.8 3.5 -6.3 0.8 -23.5 -4.6
Chhindwara 5.1 6.1 58.6 185.1 -40.2 43.6 6.5 2.3 -4.5 25.3
Damoh -6.5 -4.2 20.6 92.5 -57.9 15.7 -5.6 -7.1 -11.2 15.8
Datia -8.6 4.3 19.2 24.4 -24.1 68.5 -3.8 7.6 -46.1 -26.3
Dewas 10.1 12.3 42.7 49.3 -55.2 81.4 13.9 9.9 -24.4 22.6
Dhar 12.5 17.1 67.5 55.0 -54.9 59.9 15.7 15.7 -16.4 21.8
Dindori -2.7 -1.4 7.7 108.5 -42.0 20.0 0.0 -3.8 -26.0 10.3
East Nimar 11.5 15.0 45.5 69.7 -51.5 63.2 14.6 13.2 -14.2 19.6
Guna -2.8 7.1 65.0 73.3 -31.0 104.2 -0.3 6.6 -34.5 -2.5
Gwalior -7.3 2.3 3.4 17.0 -24.5 77.4 -2.9 4.4 -40.5 -20.7
Harda 11.2 11.5 65.3 101.4 -51.9 77.2 13.7 9.4 -13.0 18.0
Hoshangabad 5.7 4.4 42.6 114.9 -54.1 72.9 7.5 1.2 -8.0 19.1
Indore 13.0 16.8 52.8 54.7 -56.9 75.0 16.3 13.8 -17.8 39.1
Jabalpur -5.3 -6.7 13.3 105.5 -40.5 10.0 -4.1 -10.3 -14.1 16.4
Jhabua 9.5 20.3 121.4 139.3 -62.6 30.8 11.4 18.9 -0.2 32.0
Katni -7.8 -4.7 -13.5 73.8 -46.1 23.9 -6.1 -7.6 -18.0 10.0
Mandla -1.9 -2.2 15.6 110.2 -38.0 25.1 0.6 -5.2 -24.2 10.3
Mandsaur -3.6 5.4 70.7 114.6 -15.6 201.6 -1.6 4.0 -26.5 -3.7
Morena -3.2 3.6 -6.7 21.1 -18.6 44.1 0.2 3.9 -28.2 -4.5
Narsinghpur -0.6 -2.6 38.0 156.5 -54.4 18.1 0.8 -6.3 -10.1 23.1
Neemuch -3.1 7.9 42.9 188.6 15.4 250.0 -0.8 6.4 -29.7 -5.5
Panna -8.7 0.0 13.3 63.3 -64.3 20.0 -7.2 -0.9 -22.7 1.8
Raisen 0.2 0.0 36.4 64.6 -53.7 48.2 1.8 -2.4 -12.5 15.1
Rajgarh 0.3 5.1 52.9 72.1 -57.8 98.9 3.7 3.4 -34.6 6.6
Ratlam 1.4 7.3 120.6 138.2 -43.1 103.9 3.8 5.3 -24.7 9.3
Rewa -5.6 0.4 -30.6 18.4 -47.1 19.1 -1.9 0.7 -33.7 -8.5
Sagar -3.8 -1.1 48.9 66.7 -52.6 29.9 -3.2 -3.9 -9.5 21.3
Satna -8.7 0.5 -21.0 35.5 -62.3 35.2 -6.2 -0.3 -27.9 1.5
97

Annual JF (Winter) MAM (Pre Monsoon)
JJAS (Monsoon) OND (Post monsoon)
District MC-BL EC-BL MC-BL EC-BL MC-BL EC-BL MC-BL EC-BL MC-BL EC-BL
Sehore 6.2 7.4 49.4 51.7 -55.6 89.4 9.2 5.5 -24.6 12.3
Seoni 1.3 1.9 32.7 125.9 -28.2 31.8 3.4 -1.5 -15.4 12.1
Shahdol -6.3 -3.5 -16.3 51.0 -32.5 35.5 -3.1 -5.7 -27.7 -0.6
Shajapur 2.0 5.2 66.7 74.6 -61.3 82.9 5.4 3.0 -32.4 11.5
Sheopur -2.6 5.3 38.9 75.9 -17.0 206.4 -0.6 4.8 -25.0 -9.6
Shivpuri -6.8 2.2 35.2 33.8 -11.1 105.6 -3.9 3.2 -36.1 -16.7
Sidhi -3.7 -0.6 -24.8 53.9 -2.8 47.2 -0.6 -1.1 -33.7 -8.3
Singrauli -1.0 1.4 -18.9 49.0 2.5 25.8 2.3 0.8 -31.6 -3.8
Tikamgarh -6.9 4.0 64.2 19.8 -51.6 4.2 -4.8 4.4 -30.1 -1.7
Ujjain 3.3 7.0 95.8 93.8 -59.2 75.4 6.9 4.8 -30.5 11.7
Umaria -6.5 -4.9 -15.3 65.0 -40.9 25.0 -4.0 -7.3 -23.8 2.4
Vidisha -2.1 3.1 76.9 55.1 -43.8 65.7 -0.7 1.4 -21.2 10.4
West Nimar 13.0 20.2 24.5 39.6 -57.8 55.3 16.7 18.2 -12.7 32.6
Data Source: CORDEX South Asia RCM: Multi Model Ensemble Mean
Annual JF (Winter) MAM (Pre Monsoon)
JJAS (Monsoon) OND (Post monsoon)
District MC-BL EC-BL MC-BL EC-BL MC-BL EC-BL MC-BL EC-BL MC-BL EC-BL
Madhya 0.2 5.8 -3.4 79.8 23.5 9.4 0.4 3.8 -6.1 19.0
Pradesh
Alirajpur 9.1 12.5 -8.0 352.0 0.8 53.7 8.0 8.0 28.8 54.7
Anuppur -3.1 0.9 1.3 12.5 15.9 24.3 -1.5 1.3 -23.0 -10.4
Ashoknagar 1.4 5.1 -21.6 147.3 91.3 27.5 1.4 1.9 -4.1 22.2
Balaghat 0.9 2.7 32.4 23.4 31.3 -10.9 1.9 2.6 -22.1 4.8
Barwani 10.4 20.1 -51.3 192.3 -2.4 -1.2 10.1 16.1 23.1 61.8
Betul 6.3 18.8 49.3 85.1 8.0 -16.5 4.5 15.8 27.1 62.4
Bhind -1.9 15.3 -37.2 15.0 11.3 56.5 3.6 17.8 -34.5 -3.9
Bhopal 1.3 8.2 -28.2 164.8 14.8 2.6 0.6 5.1 12.5 35.0
Burhanpur 9.2 21.2 12.2 138.8 -3.8 -21.2 8.0 17.1 25.6 70.8
Chhatarpur -2.6 5.5 -14.0 90.0 1.8 1.8 -1.5 3.3 -14.9 20.5
Chhindwara 1.5 10.1 44.8 62.1 21.4 -14.5 0.5 8.1 5.3 37.2
Damoh -4.9 -3.2 17.8 70.1 39.0 -13.2 -5.4 -6.4 -9.9 27.9
Datia -0.5 12.6 -21.8 69.2 20.4 46.3 3.6 13.7 -30.5 -3.1
Dewas 8.8 18.5 -30.7 129.3 6.2 28.3 7.6 14.8 26.9 47.6
Dhar 10.1 17.2 -40.0 227.5 -4.9 26.1 9.4 13.5 27.6 48.9
Dindori -3.5 1.6 12.8 23.1 23.5 0.0 -2.3 2.1 -25.3 -6.0
East Nimar 8.3 17.5 -4.5 128.8 13.5 -5.3 7.3 14.5 19.5 49.5
Guna 0.8 3.6 -18.3 183.3 60.6 16.9 0.7 1.6 -2.2 10.9
Table 15: Change in precipitation (%) wrt BL (1981-2010) as simulated by South Asia Cordex for Madhya Pradesh(IPCC AR5 RCP8.5 scenario)
98

Annual JF (Winter) MAM (Pre Monsoon)
JJAS (Monsoon) OND (Post monsoon)
District MC-BL EC-BL MC-BL EC-BL MC-BL EC-BL MC-BL EC-BL MC-BL EC-BL
Gwalior -2.3 12.3 -28.4 44.3 24.5 41.5 1.5 13.0 -29.6 1.6
Harda 4.8 13.8 23.6 137.5 14.2 -1.2 3.4 11.2 20.5 42.2
Hoshangabad -1.0 5.1 23.4 93.6 14.4 -22.1 -2.5 2.8 12.2 31.4
Indore 12.6 25.8 -43.4 169.8 2.1 36.8 11.1 21.4 41.0 68.7
Jabalpur -7.2 -6.9 20.3 35.2 50.0 -29.5 -8.0 -8.3 -14.4 9.4
Jhabua 10.2 18.0 -7.1 321.4 -15.9 23.1 9.2 12.8 33.8 76.4
Katni -7.8 -5.9 5.7 28.4 40.0 -23.9 -8.0 -7.3 -17.5 7.7
Mandla -2.4 -1.3 18.4 25.9 49.5 -11.5 -1.8 -1.1 -24.8 -4.9
Mandsaur -3.1 0.0 -7.3 190.2 81.3 109.4 -3.4 -3.7 -7.3 17.3
Morena -2.2 14.9 -28.9 28.9 6.8 42.4 0.9 14.7 -24.3 13.2
Narsinghpur -3.7 -2.9 39.1 75.0 30.4 -30.4 -4.7 -4.9 -4.1 20.8
Neemuch -4.4 4.0 -20.0 140.0 117.3 165.4 -4.5 1.0 -13.0 14.7
Panna -3.7 2.2 12.2 63.3 33.9 -6.1 -3.3 0.2 -14.9 23.7
Raisen -2.4 1.3 -5.1 99.0 5.5 -18.9 -2.7 -1.8 1.0 32.1
Rajgarh 1.2 2.9 -26.5 179.4 43.3 17.8 0.6 0.2 5.8 13.8
Ratlam 4.6 4.7 -5.9 285.3 28.4 71.6 4.3 0.5 4.9 28.2
Rewa -3.3 2.7 -14.3 17.0 38.2 27.2 -1.5 2.7 -25.9 -2.6
Sagar -1.0 -0.7 2.2 106.7 44.5 -8.8 -1.6 -4.7 -0.5 41.5
Satna -4.3 0.9 -4.8 26.6 41.0 16.4 -3.3 -0.3 -21.6 9.2
Sehore 2.8 10.8 -23.6 119.1 6.3 7.7 1.8 7.9 18.9 36.5
Seoni -0.7 1.8 22.4 33.3 42.9 -13.6 -0.6 1.1 -14.8 8.8
Shahdol -7.3 -7.4 -13.3 17.3 29.9 26.9 -5.8 -7.4 -26.9 -18.1
Shajapur 3.2 6.0 -25.4 185.7 10.8 23.4 2.7 2.9 11.1 22.9
Sheopur -2.3 10.5 -11.1 90.7 57.4 85.1 -1.5 9.4 -14.4 10.1
Shivpuri -2.6 8.3 -21.1 97.2 61.1 40.7 -0.8 7.1 -20.9 8.8
Sidhi -3.2 -0.3 -14.2 36.2 39.4 87.3 -1.4 -0.7 -26.8 -13.5
Singrauli -0.8 2.4 -16.1 32.2 18.2 89.9 1.1 1.8 -20.1 -9.7
Tikamgarh -0.5 8.5 -16.0 140.7 2.1 9.5 0.8 5.7 -12.9 24.7
Ujjain 6.5 8.1 -25.0 222.9 -2.3 29.2 6.7 4.4 8.6 28.7
Umaria -8.1 -7.0 -6.7 20.2 27.7 -0.5 -7.2 -7.1 -25.1 -10.9
Vidisha -0.1 1.5 -17.9 153.8 41.0 0.0 -0.6 -2.0 2.0 28.2
West Nimar 10.7 21.0 -37.7 150.9 9.9 -1.9 9.8 17.3 27.7 59.8
Data Source: CORDEX South Asia RCM: Multi Model Ensemble Mean
99

Temperature Extremes Indices graphs
IPCC AR5 RCP4.5 scenario
0.0
0.5
1.0
1.5
2.0
2.5
3.0
3.5
4.0
4.5
5.0
Alir
ajp
ur
An
up
pu
rA
sho
knag
arB
alag
hat
Bar
wan
iB
etu
lB
hin
dB
ho
pal
Bu
rhan
pu
rC
hh
atar
pu
rC
hh
ind
war
aD
amo
hD
atia
Dew
asD
har
Din
do
riEa
st N
imar
Gu
na
Gw
alio
rH
ard
aH
osh
anga
bad
Ind
ore
Jab
alp
ur
Jhab
ua
Kat
ni
Man
dla
Man
dsa
ur
Mo
ren
aN
arsi
ngh
pu
rN
eem
uch
Pan
na
Rai
sen
Raj
garh
Rat
lam
Rew
aSa
gar
Satn
aSe
ho
reSe
on
iSh
ahd
ol
Shaj
apu
rSh
eop
ur
Shiv
pu
riSi
dh
iSi
ngr
auli
Tika
mga
rhU
jjain
Um
aria
Vid
ish
aW
est
Nim
ar
Tem
pe
ratu
re c
han
ge (
0 C)
Change from BL to MC Change from BL to EC
Maximum of Day time Temperature
IPCC AR5 RCP 4.5 Scenario
0.0
0.5
1.0
1.5
2.0
2.5
3.0
3.5
4.0
Alir
ajp
ur
An
up
pu
rA
sho
knag
arB
alag
hat
Bar
wan
iB
etu
lB
hin
dB
ho
pal
Bu
rhan
pu
rC
hh
atar
pu
rC
hh
ind
war
aD
amo
hD
atia
Dew
asD
har
Din
do
riEa
st N
imar
Gu
na
Gw
alio
rH
ard
aH
osh
anga
bad
Ind
ore
Jab
alp
ur
Jhab
ua
Kat
ni
Man
dla
Man
dsa
ur
Mo
ren
aN
arsi
ngh
pu
rN
eem
uch
Pan
na
Rai
sen
Raj
garh
Rat
lam
Rew
aSa
gar
Satn
aSe
ho
reSe
on
iSh
ahd
ol
Shaj
apu
rSh
eop
ur
Shiv
pu
riSi
dh
iSi
ngr
auli
Tika
mga
rhU
jjain
Um
aria
Vid
ish
aW
est
Nim
ar
Tem
pe
ratu
re c
han
ge (
0 C)
Change from BL to MC Change from BL to EC
Maximum of Night time Temperature
IPCC AR5 RCP 4.5 Scenario
Figure 33 : Characteristics of absolute temperature extremes indices for districts of Madhya Pradesh (IPCC AR5 RCP4.5 and RCP8.5 scenarios)
100

0.0
0.5
1.0
1.5
2.0
2.5
3.0
3.5
4.0
4.5
Alir
ajp
ur
An
up
pu
rA
sho
knag
arB
alag
hat
Bar
wan
iB
etu
lB
hin
dB
ho
pal
Bu
rhan
pu
rC
hh
atar
pu
rC
hh
ind
war
aD
amo
hD
atia
Dew
asD
har
Din
do
riEa
st N
imar
Gu
na
Gw
alio
rH
ard
aH
osh
anga
bad
Ind
ore
Jab
alp
ur
Jhab
ua
Kat
ni
Man
dla
Man
dsa
ur
Mo
ren
aN
arsi
ngh
pu
rN
eem
uch
Pan
na
Rai
sen
Raj
garh
Rat
lam
Rew
aSa
gar
Satn
aSe
ho
reSe
on
iSh
ahd
ol
Shaj
apu
rSh
eop
ur
Shiv
pu
riSi
dh
iSi
ngr
auli
Tika
mga
rhU
jjain
Um
aria
Vid
ish
aW
est
Nim
ar
Tem
pe
ratu
re c
han
ge (
0 C)
Change from BL to MC Change from BL to ECMinimum of Day time Temperature
IPCC AR5 RCP 4.5 Scenario
0.0
0.5
1.0
1.5
2.0
2.5
3.0
3.5
4.0
4.5
5.0
Alir
ajp
ur
An
up
pu
rA
sho
knag
arB
alag
hat
Bar
wan
iB
etu
lB
hin
dB
ho
pal
Bu
rhan
pu
rC
hh
atar
pu
rC
hh
ind
war
aD
amo
hD
atia
Dew
asD
har
Din
do
riEa
st N
imar
Gu
na
Gw
alio
rH
ard
aH
osh
anga
bad
Ind
ore
Jab
alp
ur
Jhab
ua
Kat
ni
Man
dla
Man
dsa
ur
Mo
ren
aN
arsi
ngh
pu
rN
eem
uch
Pan
na
Rai
sen
Raj
garh
Rat
lam
Rew
aSa
gar
Satn
aSe
ho
reSe
on
iSh
ahd
ol
Shaj
apu
rSh
eop
ur
Shiv
pu
riSi
dh
iSi
ngr
auli
Tika
mga
rhU
jjain
Um
aria
Vid
ish
aW
est
Nim
ar
Tem
pe
ratu
re c
han
ge (
0C
)
Change from BL to MC Change from BL to EC
Minimum of Night time Temperature
IPCC AR5 RCP 4.5 Scenario
Figure 33 : Characteristics of absolute temperature extremes indices for districts of Madhya Pradesh (IPCC AR5 RCP4.5 and RCP8.5 scenarios)
101

IPCC AR5 RCP8.5 scenario
0.0
0.5
1.0
1.5
2.0
2.5
3.0
3.5
4.0
4.5
5.0
Alir
ajp
ur
An
up
pu
rA
sho
knag
arB
alag
hat
Bar
wan
iB
etu
lB
hin
dB
ho
pal
Bu
rhan
pu
rC
hh
atar
pu
rC
hh
ind
war
aD
amo
hD
atia
Dew
asD
har
Din
do
riEa
st N
imar
Gu
na
Gw
alio
rH
ard
aH
osh
anga
bad
Ind
ore
Jab
alp
ur
Jhab
ua
Kat
ni
Man
dla
Man
dsa
ur
Mo
ren
aN
arsi
ngh
pu
rN
eem
uch
Pan
na
Rai
sen
Raj
garh
Rat
lam
Rew
aSa
gar
Satn
aSe
ho
reSe
on
iSh
ahd
ol
Shaj
apu
rSh
eop
ur
Shiv
pu
riSi
dh
iSi
ngr
auli
Tika
mga
rhU
jjain
Um
aria
Vid
ish
aW
est
Nim
ar
Tem
pe
ratu
re c
han
ge (
0C
)
Change from BL to MC Change from BL to EC
Maximum of Day Time Temperature
IPCC AR5 RCP 8.5 Scenario
0.0
0.5
1.0
1.5
2.0
2.5
3.0
3.5
4.0
4.5
Alir
ajp
ur
An
up
pu
rA
sho
knag
arB
alag
hat
Bar
wan
iB
etu
lB
hin
dB
ho
pal
Bu
rhan
pu
rC
hh
atar
pu
rC
hh
ind
war
aD
amo
hD
atia
Dew
asD
har
Din
do
riEa
st N
imar
Gu
na
Gw
alio
rH
ard
aH
osh
anga
bad
Ind
ore
Jab
alp
ur
Jhab
ua
Kat
ni
Man
dla
Man
dsa
ur
Mo
ren
aN
arsi
ngh
pu
rN
eem
uch
Pan
na
Rai
sen
Raj
garh
Rat
lam
Rew
aSa
gar
Satn
aSe
ho
reSe
on
iSh
ahd
ol
Shaj
apu
rSh
eop
ur
Shiv
pu
riSi
dh
iSi
ngr
auli
Tika
mga
rhU
jjain
Um
aria
Vid
ish
aW
est
Nim
ar
Tem
pe
ratu
re c
han
ge (
0 C)
Change from BL to MC Change from BL to EC
Maximum of Night Time Temperature
IPCC AR5 RCP 8.5 Scenario
Figure 33 : Characteristics of absolute temperature extremes indices for districts of Madhya Pradesh (IPCC AR5 RCP4.5 and RCP8.5 scenarios)
102

0.0
1.0
2.0
3.0
4.0
5.0
6.0
7.0
8.0
Alir
ajp
ur
An
up
pu
rA
sho
knag
arB
alag
hat
Bar
wan
iB
etu
lB
hin
dB
ho
pal
Bu
rhan
pu
rC
hh
atar
pu
rC
hh
ind
war
aD
amo
hD
atia
Dew
asD
har
Din
do
riEa
st N
imar
Gu
na
Gw
alio
rH
ard
aH
osh
anga
bad
Ind
ore
Jab
alp
ur
Jhab
ua
Kat
ni
Man
dla
Man
dsa
ur
Mo
ren
aN
arsi
ngh
pu
rN
eem
uch
Pan
na
Rai
sen
Raj
garh
Rat
lam
Rew
aSa
gar
Satn
aSe
ho
reSe
on
iSh
ahd
ol
Shaj
apu
rSh
eop
ur
Shiv
pu
riSi
dh
iSi
ngr
auli
Tika
mga
rhU
jjain
Um
aria
Vid
ish
aW
est
Nim
ar
Tem
pe
ratu
re c
han
ge (
0C
)
Change from BL to MC Change from BL to EC
Minimum of Day Time Temperature
IPCC AR5 RCP 8.5 Scenario
0.0
1.0
2.0
3.0
4.0
5.0
6.0
7.0
8.0
Alir
ajp
ur
An
up
pu
rA
sho
knag
arB
alag
hat
Bar
wan
iB
etu
lB
hin
dB
ho
pal
Bu
rhan
pu
rC
hh
atar
pu
rC
hh
ind
war
aD
amo
hD
atia
Dew
asD
har
Din
do
riEa
st N
imar
Gu
na
Gw
alio
rH
ard
aH
osh
anga
bad
Ind
ore
Jab
alp
ur
Jhab
ua
Kat
ni
Man
dla
Man
dsa
ur
Mo
ren
aN
arsi
ngh
pu
rN
eem
uch
Pan
na
Rai
sen
Raj
garh
Rat
lam
Rew
aSa
gar
Satn
aSe
ho
reSe
on
iSh
ahd
ol
Shaj
apu
rSh
eop
ur
Shiv
pu
riSi
dh
iSi
ngr
auli
Tika
mga
rhU
jjain
Um
aria
Vid
ish
aW
est
Nim
ar
Tem
pe
ratu
re c
han
ge (
0C
)
Change from BL to MC Change from BL to EC
Minimum of Night Time Temperature
IPCC AR5 RCP 8.5 Scenario
Figure 33 : Characteristics of absolute temperature extremes indices for districts of Madhya Pradesh (IPCC AR5 RCP4.5 and RCP8.5 scenarios)
103

IPCC AR5 RCP4.5 scenario
-10.5
-10.0
-9.5
-9.0
-8.5
-8.0
Alir
ajp
ur
An
up
pu
rA
sho
knag
arB
alag
hat
Bar
wan
iB
etu
lB
hin
dB
ho
pal
Bu
rhan
pu
rC
hh
atar
pu
rC
hh
ind
war
aD
amo
hD
atia
Dew
asD
har
Din
do
riEa
st N
imar
Gu
na
Gw
alio
rH
ard
aH
osh
anga
bad
Ind
ore
Jab
alp
ur
Jhab
ua
Kat
ni
Man
dla
Man
dsa
ur
Mo
ren
aN
arsi
ngh
pu
rN
eem
uch
Pan
na
Rai
sen
Raj
garh
Rat
lam
Rew
aSa
gar
Satn
aSe
ho
reSe
on
iSh
ahd
ol
Shaj
apu
rSh
eop
ur
Shiv
pu
riSi
dh
iSi
ngr
auli
Tika
mga
rhU
jjain
Um
aria
Vid
ish
aW
est
Nim
ar
Day
s(%
)
Change from BL to MC Change from BL to EC
Cool nights - Annual % of days where minimum temperature < 10th percentile of base period
IPCC AR5 RCP 4.5 Scenario
-10.0
-9.0
-8.0
-7.0
-6.0
-5.0
-4.0
-3.0
-2.0
-1.0
0.0
Alir
ajp
ur
An
up
pu
rA
sho
knag
arB
alag
hat
Bar
wan
iB
etu
lB
hin
dB
ho
pal
Bu
rhan
pu
rC
hh
atar
pu
rC
hh
ind
war
aD
amo
hD
atia
Dew
asD
har
Din
do
riEa
st N
imar
Gu
na
Gw
alio
rH
ard
aH
osh
anga
bad
Ind
ore
Jab
alp
ur
Jhab
ua
Kat
ni
Man
dla
Man
dsa
ur
Mo
ren
aN
arsi
ngh
pu
rN
eem
uch
Pan
na
Rai
sen
Raj
garh
Rat
lam
Rew
aSa
gar
Satn
aSe
ho
reSe
on
iSh
ahd
ol
Shaj
apu
rSh
eop
ur
Shiv
pu
riSi
dh
iSi
ngr
auli
Tika
mga
rhU
jjain
Um
aria
Vid
ish
aW
est
Nim
ar
Day
s(%
)
Change from BL to MC Change from BL to EC
Cool days - Annual % of days where maximum temperature < 10th percentile of base period
IPCC AR5 RCP 4.5 Scenario
Figure 34 : Characteristics of percentile temperature extremes indices for districts of Madhya Pradesh (IPCC AR5 RCP4.5 and RCP8.5 scenarios)
104

0
10
20
30
40
50
60
70
80
Alir
ajp
ur
An
up
pu
rA
sho
knag
arB
alag
hat
Bar
wan
iB
etu
lB
hin
dB
ho
pal
Bu
rhan
pu
rC
hh
atar
pu
rC
hh
ind
war
aD
amo
hD
atia
Dew
asD
har
Din
do
riEa
st N
imar
Gu
na
Gw
alio
rH
ard
aH
osh
anga
bad
Ind
ore
Jab
alp
ur
Jhab
ua
Kat
ni
Man
dla
Man
dsa
ur
Mo
ren
aN
arsi
ngh
pu
rN
eem
uch
Pan
na
Rai
sen
Raj
garh
Rat
lam
Rew
aSa
gar
Satn
aSe
ho
reSe
on
iSh
ahd
ol
Shaj
apu
rSh
eop
ur
Shiv
pu
riSi
dh
iSi
ngr
auli
Tika
mga
rhU
jjain
Um
aria
Vid
ish
aW
est
Nim
ar
Day
s(%
)
Change from BL to MC Change from BL to EC
Warm Nights- Annual % of days where minimum temperature > 90th percentile of base period
IPCC AR5 RCP 4.5 Scenario
0
5
10
15
20
25
30
35
40
45
50
Alir
ajp
ur
An
up
pu
rA
sho
knag
arB
alag
hat
Bar
wan
iB
etu
lB
hin
dB
ho
pal
Bu
rhan
pu
rC
hh
atar
pu
rC
hh
ind
war
aD
amo
hD
atia
Dew
asD
har
Din
do
riEa
st N
imar
Gu
na
Gw
alio
rH
ard
aH
osh
anga
bad
Ind
ore
Jab
alp
ur
Jhab
ua
Kat
ni
Man
dla
Man
dsa
ur
Mo
ren
aN
arsi
ngh
pu
rN
eem
uch
Pan
na
Rai
sen
Raj
garh
Rat
lam
Rew
aSa
gar
Satn
aSe
ho
reSe
on
iSh
ahd
ol
Shaj
apu
rSh
eop
ur
Shiv
pu
riSi
dh
iSi
ngr
auli
Tika
mga
rhU
jjain
Um
aria
Vid
ish
aW
est
Nim
ar
Day
s(%
)
Change from BL to MC Change from BL to EC
Warm Days- Annual % of days where maximum temperature > 90th percentile of base period
IPCC AR5 RCP 4.5 Scenario
Figure 34 : Characteristics of percentile temperature extremes indices for districts of Madhya Pradesh (IPCC AR5 RCP4.5 and RCP8.5 scenarios)
105

IPCC AR5 RCP 8.5 scenario
-10.2
-10.0
-9.8
-9.6
-9.4
-9.2
-9.0
-8.8
-8.6
Alir
ajp
ur
An
up
pu
rA
sho
knag
arB
alag
hat
Bar
wan
iB
etu
lB
hin
dB
ho
pal
Bu
rhan
pu
rC
hh
atar
pu
rC
hh
ind
war
aD
amo
hD
atia
Dew
asD
har
Din
do
riEa
st N
imar
Gu
na
Gw
alio
rH
ard
aH
osh
anga
bad
Ind
ore
Jab
alp
ur
Jhab
ua
Kat
ni
Man
dla
Man
dsa
ur
Mo
ren
aN
arsi
ngh
pu
rN
eem
uch
Pan
na
Rai
sen
Raj
garh
Rat
lam
Rew
aSa
gar
Satn
aSe
ho
reSe
on
iSh
ahd
ol
Shaj
apu
rSh
eop
ur
Shiv
pu
riSi
dh
iSi
ngr
auli
Tika
mga
rhU
jjain
Um
aria
Vid
ish
aW
est
Nim
ar
Day
s(%
)
Change from BL to MC Change from BL to EC
Cool nights - Annual % of days where minimum temperature < 10th percentile of base period
IPCC AR5 RCP 8.5 Scenario
-12.0
-10.0
-8.0
-6.0
-4.0
-2.0
0.0
Alir
ajp
ur
An
up
pu
rA
sho
knag
arB
alag
hat
Bar
wan
iB
etu
lB
hin
dB
ho
pal
Bu
rhan
pu
rC
hh
atar
pu
rC
hh
ind
war
aD
amo
hD
atia
Dew
asD
har
Din
do
riEa
st N
imar
Gu
na
Gw
alio
rH
ard
aH
osh
anga
bad
Ind
ore
Jab
alp
ur
Jhab
ua
Kat
ni
Man
dla
Man
dsa
ur
Mo
ren
aN
arsi
ngh
pu
rN
eem
uch
Pan
na
Rai
sen
Raj
garh
Rat
lam
Rew
aSa
gar
Satn
aSe
ho
reSe
on
iSh
ahd
ol
Shaj
apu
rSh
eop
ur
Shiv
pu
riSi
dh
iSi
ngr
auli
Tika
mga
rhU
jjain
Um
aria
Vid
ish
aW
est
Nim
ar
Day
s(%
)
Change from BL to MC Change from BL to EC
Cool days - Annual % of days where maximum temperature < 10th percentile of base period
IPCC AR5 RCP 8.5 Scenario
Figure 34 : Characteristics of percentile temperature extremes indices for districts of Madhya Pradesh (IPCC AR5 RCP4.5 and RCP8.5 scenarios)
106

0
10
20
30
40
50
60
70
80
90
100
Alir
ajp
ur
An
up
pu
rA
sho
knag
arB
alag
hat
Bar
wan
iB
etu
lB
hin
dB
ho
pal
Bu
rhan
pu
rC
hh
atar
pu
rC
hh
ind
war
aD
amo
hD
atia
Dew
asD
har
Din
do
riEa
st N
imar
Gu
na
Gw
alio
rH
ard
aH
osh
anga
bad
Ind
ore
Jab
alp
ur
Jhab
ua
Kat
ni
Man
dla
Man
dsa
ur
Mo
ren
aN
arsi
ngh
pu
rN
eem
uch
Pan
na
Rai
sen
Raj
garh
Rat
lam
Rew
aSa
gar
Satn
aSe
ho
reSe
on
iSh
ahd
ol
Shaj
apu
rSh
eop
ur
Shiv
pu
riSi
dh
iSi
ngr
auli
Tika
mga
rhU
jjain
Um
aria
Vid
ish
aW
est
Nim
ar
Day
s(%
)
Change from BL to MC Change from BL to EC
Warm Nights- Annual % of days where minimum temperature > 90th percentile of base period
IPCC AR5 RCP 8.5 Scenario
0
10
20
30
40
50
60
70
80
90
Alir
ajp
ur
An
up
pu
rA
sho
knag
arB
alag
hat
Bar
wan
iB
etu
lB
hin
dB
ho
pal
Bu
rhan
pu
rC
hh
atar
pu
rC
hh
ind
war
aD
amo
hD
atia
Dew
asD
har
Din
do
riEa
st N
imar
Gu
na
Gw
alio
rH
ard
aH
osh
anga
bad
Ind
ore
Jab
alp
ur
Jhab
ua
Kat
ni
Man
dla
Man
dsa
ur
Mo
ren
aN
arsi
ngh
pu
rN
eem
uch
Pan
na
Rai
sen
Raj
garh
Rat
lam
Rew
aSa
gar
Satn
aSe
ho
reSe
on
iSh
ahd
ol
Shaj
apu
rSh
eop
ur
Shiv
pu
riSi
dh
iSi
ngr
auli
Tika
mga
rhU
jjain
Um
aria
Vid
ish
aW
est
Nim
ar
Day
s(%
)
Change from BL to MC Change from BL to EC
Warm Days- Annual % of days where maximum temperature > 90th percentile of base period
IPCC AR5 RCP 8.5 Scenario
Figure 34 : Characteristics of percentile temperature extremes indices for districts of Madhya Pradesh (IPCC AR5 RCP4.5 and RCP8.5 scenarios)
107

IPCC AR5 RCP4.5 scenario
0
20
40
60
80
100
120
140
160
Alir
ajp
ur
An
up
pu
rA
sho
knag
arB
alag
hat
Bar
wan
iB
etu
lB
hin
dB
ho
pal
Bu
rhan
pu
rC
hh
atar
pu
rC
hh
ind
war
aD
amo
hD
atia
Dew
asD
har
Din
do
riEa
st N
imar
Gu
na
Gw
alio
rH
ard
aH
osh
anga
bad
Ind
ore
Jab
alp
ur
Jhab
ua
Kat
ni
Man
dla
Man
dsa
ur
Mo
ren
aN
arsi
ngh
pu
rN
eem
uch
Pan
na
Rai
sen
Raj
garh
Rat
lam
Rew
aSa
gar
Satn
aSe
ho
reSe
on
iSh
ahd
ol
Shaj
apu
rSh
eop
ur
Shiv
pu
riSi
dh
iSi
ngr
auli
Tika
mga
rhU
jjain
Um
aria
Vid
ish
aW
est
Nim
ar
Co
un
t (D
ays)
Change from BL to MC Change from BL to EC
Warm Spell - Annual count of days with at least 6 consecutive days when max temp > 90th percentile of base max temp
IPCC AR5 RCP 4.5 Scenario
-8
-7
-6
-5
-4
-3
-2
-1
0
Alir
ajp
ur
An
up
pu
rA
sho
knag
arB
alag
hat
Bar
wan
iB
etu
lB
hin
dB
ho
pal
Bu
rhan
pu
rC
hh
atar
pu
rC
hh
ind
war
aD
amo
hD
atia
Dew
asD
har
Din
do
riEa
st N
imar
Gu
na
Gw
alio
rH
ard
aH
osh
anga
bad
Ind
ore
Jab
alp
ur
Jhab
ua
Kat
ni
Man
dla
Man
dsa
ur
Mo
ren
aN
arsi
ngh
pu
rN
eem
uch
Pan
na
Rai
sen
Raj
garh
Rat
lam
Rew
aSa
gar
Satn
aSe
ho
reSe
on
iSh
ahd
ol
Shaj
apu
rSh
eop
ur
Shiv
pu
riSi
dh
iSi
ngr
auli
Tika
mga
rhU
jjain
Um
aria
Vid
ish
aW
est
Nim
ar
Co
un
t (D
ays)
Change from BL to MC Change from BL to EC
Cold Spell - Annual count of days with at least 6 consecutive days when min temp < 10th percentile of base min temp
IPCC AR5 RCP 4.5 Scenario
Figure 35 : Characteristics of duration temperature extremes indices for districts of Madhya Pradesh (IPCC AR5 RCP4.5 and RCP8.5 scenarios)
108

IPCC AR5 RCP 8.5 scenario
0
50
100
150
200
250
300
350
Alir
ajp
ur
An
up
pu
rA
sho
knag
arB
alag
hat
Bar
wan
iB
etu
lB
hin
dB
ho
pal
Bu
rhan
pu
rC
hh
atar
pu
rC
hh
ind
war
aD
amo
hD
atia
Dew
asD
har
Din
do
riEa
st N
imar
Gu
na
Gw
alio
rH
ard
aH
osh
anga
bad
Ind
ore
Jab
alp
ur
Jhab
ua
Kat
ni
Man
dla
Man
dsa
ur
Mo
ren
aN
arsi
ngh
pu
rN
eem
uch
Pan
na
Rai
sen
Raj
garh
Rat
lam
Rew
aSa
gar
Satn
aSe
ho
reSe
on
iSh
ahd
ol
Shaj
apu
rSh
eop
ur
Shiv
pu
riSi
dh
iSi
ngr
auli
Tika
mga
rhU
jjain
Um
aria
Vid
ish
aW
est
Nim
ar
Co
un
t (D
ays)
Change from BL to MC Change from BL to EC
Warm Spell - Annual count of days with at least 6 consecutive days when max temp > 90th percentile of base max temp
IPCC AR5 RCP 8.5 Scenario
-8
-7
-6
-5
-4
-3
-2
-1
0
Alir
ajp
ur
An
up
pu
rA
sho
knag
arB
alag
hat
Bar
wan
iB
etu
lB
hin
dB
ho
pal
Bu
rhan
pu
rC
hh
atar
pu
rC
hh
ind
war
aD
amo
hD
atia
Dew
asD
har
Din
do
riEa
st N
imar
Gu
na
Gw
alio
rH
ard
aH
osh
anga
bad
Ind
ore
Jab
alp
ur
Jhab
ua
Kat
ni
Man
dla
Man
dsa
ur
Mo
ren
aN
arsi
ngh
pu
rN
eem
uch
Pan
na
Rai
sen
Raj
garh
Rat
lam
Rew
aSa
gar
Satn
aSe
ho
reSe
on
iSh
ahd
ol
Shaj
apu
rSh
eop
ur
Shiv
pu
riSi
dh
iSi
ngr
auli
Tika
mga
rhU
jjain
Um
aria
Vid
ish
aW
est
Nim
ar
Co
un
t (D
ays)
Change from BL to MC Change from BL to EC
Cold Spell - Annual count of days with at least 6 consecutive days when min temp < 10th percentile of base min temp
IPCC AR5 RCP 8.5 Scenario
Figure 35 : Characteristics of duration temperature extremes indices for districts of Madhya Pradesh (IPCC AR5 RCP4.5 and RCP8.5 scenarios)
109

Precipitation Extremes Indices graphs
IPCC AR5 RCP4.5 scenario
-20
-15
-10
-5
0
5
10
15
20
25
30
Alir
ajp
ur
An
up
pu
rA
sho
knag
arB
alag
hat
Bar
wan
iB
etu
lB
hin
dB
ho
pal
Bu
rhan
pu
rC
hh
atar
pu
rC
hh
ind
war
aD
amo
hD
atia
Dew
asD
har
Din
do
riEa
st N
imar
Gu
na
Gw
alio
rH
ard
aH
osh
anga
bad
Ind
ore
Jab
alp
ur
Jhab
ua
Kat
ni
Man
dla
Man
dsa
ur
Mo
ren
aN
arsi
ngh
pu
rN
eem
uch
Pan
na
Rai
sen
Raj
garh
Rat
lam
Rew
aSa
gar
Satn
aSe
ho
reSe
on
iSh
ahd
ol
Shaj
apu
rSh
eop
ur
Shiv
pu
riSi
dh
iSi
ngr
auli
Tika
mga
rhU
jjain
Um
aria
Vid
ish
aW
est
Nim
ar
Ch
ange
s in
1 d
ay m
axim
um
pre
cip
itat
ion
(m
m)
Change from BL to MC Change from BL to EC
1-day maximum precipitation
IPCC AR5 RCP 4.5 Scenario
-40
-30
-20
-10
0
10
20
30
40
50
60
Alir
ajp
ur
An
up
pu
rA
sho
knag
arB
alag
hat
Bar
wan
iB
etu
lB
hin
dB
ho
pal
Bu
rhan
pu
rC
hh
atar
pu
rC
hh
ind
war
aD
amo
hD
atia
Dew
asD
har
Din
do
riEa
st N
imar
Gu
na
Gw
alio
rH
ard
aH
osh
anga
bad
Ind
ore
Jab
alp
ur
Jhab
ua
Kat
ni
Man
dla
Man
dsa
ur
Mo
ren
aN
arsi
ngh
pu
rN
eem
uch
Pan
na
Rai
sen
Raj
garh
Rat
lam
Rew
aSa
gar
Satn
aSe
ho
reSe
on
iSh
ahd
ol
Shaj
apu
rSh
eop
ur
Shiv
pu
riSi
dh
iSi
ngr
auli
Tika
mga
rhU
jjain
Um
aria
Vid
ish
aW
est
Nim
ar
Ch
ange
s in
5 d
ay m
axim
um
pre
cip
itat
ion
(m
m)
Change from BL to MC Change from BL to EC
5-day maximum precipitation
IPCC AR5 RCP 4.5 Scenario
Figure 36 : Characteristics of absolute precipitationextremes indices for districts of Madhya Pradesh (IPCC AR5 RCP4.5 andRCP8.5 scenarios)
110

IPCC AR5 RCP 8.5 scenario
-20
-15
-10
-5
0
5
10
15
20
25
30
Alir
ajp
ur
An
up
pu
rA
sho
knag
arB
alag
hat
Bar
wan
iB
etu
lB
hin
dB
ho
pal
Bu
rhan
pu
rC
hh
atar
pu
rC
hh
ind
war
aD
amo
hD
atia
Dew
asD
har
Din
do
riEa
st N
imar
Gu
na
Gw
alio
rH
ard
aH
osh
anga
bad
Ind
ore
Jab
alp
ur
Jhab
ua
Kat
ni
Man
dla
Man
dsa
ur
Mo
ren
aN
arsi
ngh
pu
rN
eem
uch
Pan
na
Rai
sen
Raj
garh
Rat
lam
Rew
aSa
gar
Satn
aSe
ho
reSe
on
iSh
ahd
ol
Shaj
apu
rSh
eop
ur
Shiv
pu
riSi
dh
iSi
ngr
auli
Tika
mga
rhU
jjain
Um
aria
Vid
ish
aW
est
Nim
ar
Ch
ange
s in
1 d
ay m
axim
um
pre
cip
itat
ion
(m
m)
Change from BL to MC Change from BL to EC
1-day maximum precipitation
IPCC AR5 RCP 8.5 Scenario
-40
-30
-20
-10
0
10
20
30
40
50
60
Alir
ajp
ur
An
up
pu
rA
sho
knag
arB
alag
hat
Bar
wan
iB
etu
lB
hin
dB
ho
pal
Bu
rhan
pu
rC
hh
atar
pu
rC
hh
ind
war
aD
amo
hD
atia
Dew
asD
har
Din
do
riEa
st N
imar
Gu
na
Gw
alio
rH
ard
aH
osh
anga
bad
Ind
ore
Jab
alp
ur
Jhab
ua
Kat
ni
Man
dla
Man
dsa
ur
Mo
ren
aN
arsi
ngh
pu
rN
eem
uch
Pan
na
Rai
sen
Raj
garh
Rat
lam
Rew
aSa
gar
Satn
aSe
ho
reSe
on
iSh
ahd
ol
Shaj
apu
rSh
eop
ur
Shiv
pu
riSi
dh
iSi
ngr
auli
Tika
mga
rhU
jjain
Um
aria
Vid
ish
aW
est
Nim
ar
Ch
ange
s in
5 d
ay m
axim
um
pre
cip
itat
ion
(m
m)
Change from BL to MC Change from BL to EC
5-day maximum precipitation
IPCC AR5 RCP 8.5 Scenario
Figure 36 : Characteristics of absolute precipitation extremes indices for districts of Madhya Pradesh (IPCC AR5 RCP4.5 andRCP8.5 scenarios)
111

IPCC AR5 RCP4.5 scenario
-80
-60
-40
-20
0
20
40
60
80
100
120
Alir
ajp
ur
An
up
pu
rA
sho
knag
arB
alag
hat
Bar
wan
iB
etu
lB
hin
dB
ho
pal
Bu
rhan
pu
rC
hh
atar
pu
rC
hh
ind
war
aD
amo
hD
atia
Dew
asD
har
Din
do
riEa
st N
imar
Gu
na
Gw
alio
rH
ard
aH
osh
anga
bad
Ind
ore
Jab
alp
ur
Jhab
ua
Kat
ni
Man
dla
Man
dsa
ur
Mo
ren
aN
arsi
ngh
pu
rN
eem
uch
Pan
na
Rai
sen
Raj
garh
Rat
lam
Rew
aSa
gar
Satn
aSe
ho
reSe
on
iSh
ahd
ol
Shaj
apu
rSh
eop
ur
Shiv
pu
riSi
dh
iSi
ngr
auli
Tika
mga
rhU
jjain
Um
aria
Vid
ish
aW
est
Nim
ar
Ch
ange
s in
pre
cip
itat
ion
, rf
>95
p (
mm
)
Change from BL to MC Change from BL to EC
Very wet day precipitation - Annual total rain when RR>95th percentile of base amount
IPCC AR5 RCP 4.5 Scenario
-60
-40
-20
0
20
40
60
80
100
120
Alir
ajp
ur
An
up
pu
rA
sho
knag
arB
alag
hat
Bar
wan
iB
etu
lB
hin
dB
ho
pal
Bu
rhan
pu
rC
hh
atar
pu
rC
hh
ind
war
aD
amo
hD
atia
Dew
asD
har
Din
do
riEa
st N
imar
Gu
na
Gw
alio
rH
ard
aH
osh
anga
bad
Ind
ore
Jab
alp
ur
Jhab
ua
Kat
ni
Man
dla
Man
dsa
ur
Mo
ren
aN
arsi
ngh
pu
rN
eem
uch
Pan
na
Rai
sen
Raj
garh
Rat
lam
Rew
aSa
gar
Satn
aSe
ho
reSe
on
iSh
ahd
ol
Shaj
apu
rSh
eop
ur
Shiv
pu
riSi
dh
iSi
ngr
auli
Tika
mga
rhU
jjain
Um
aria
Vid
ish
aW
est
Nim
ar
Change from BL to MC Change from BL to EC
Extremely wet day precipitation - Annual total rain when RR>99th percentile of base amount
IPCC AR5 RCP 4.5 Scenario
Figure 37 : Characteristics of percentile precipitation extremes indices for districts of Madhya Pradesh (IPCC AR5 RCP4.5 and RCP8.5 scenarios)
112

IPCC AR5 RCP 8.5 scenario
-80
-60
-40
-20
0
20
40
60
80
100
120
Alir
ajp
ur
An
up
pu
rA
sho
knag
arB
alag
hat
Bar
wan
iB
etu
lB
hin
dB
ho
pal
Bu
rhan
pu
rC
hh
atar
pu
rC
hh
ind
war
aD
amo
hD
atia
Dew
asD
har
Din
do
riEa
st N
imar
Gu
na
Gw
alio
rH
ard
aH
osh
anga
bad
Ind
ore
Jab
alp
ur
Jhab
ua
Kat
ni
Man
dla
Man
dsa
ur
Mo
ren
aN
arsi
ngh
pu
rN
eem
uch
Pan
na
Rai
sen
Raj
garh
Rat
lam
Rew
aSa
gar
Satn
aSe
ho
reSe
on
iSh
ahd
ol
Shaj
apu
rSh
eop
ur
Shiv
pu
riSi
dh
iSi
ngr
auli
Tika
mga
rhU
jjain
Um
aria
Vid
ish
aW
est
Nim
ar
Ch
ange
s in
pre
cip
itat
ion
, rf
>95
p (
mm
)
Change from BL to MC Change from BL to EC
Very wet day precipitation - Annual total rain when RR>95th percentile of base amount
IPCC AR5 RCP 8.5 Scenario
-60
-40
-20
0
20
40
60
80
100
120
Alir
ajp
ur
An
up
pu
rA
sho
knag
arB
alag
hat
Bar
wan
iB
etu
lB
hin
dB
ho
pal
Bu
rhan
pu
rC
hh
atar
pu
rC
hh
ind
war
aD
amo
hD
atia
Dew
asD
har
Din
do
riEa
st N
imar
Gu
na
Gw
alio
rH
ard
aH
osh
anga
bad
Ind
ore
Jab
alp
ur
Jhab
ua
Kat
ni
Man
dla
Man
dsa
ur
Mo
ren
aN
arsi
ngh
pu
rN
eem
uch
Pan
na
Rai
sen
Raj
garh
Rat
lam
Rew
aSa
gar
Satn
aSe
ho
reSe
on
iSh
ahd
ol
Shaj
apu
rSh
eop
ur
Shiv
pu
riSi
dh
iSi
ngr
auli
Tika
mga
rhU
jjain
Um
aria
Vid
ish
aW
est
Nim
arCh
ange
s in
pre
cip
itat
ion
, rf
>99
p (
mm
)
Change from BL to MC Change from BL to EC
Extremely wet day precipitation - Annual total rain when RR>99th percentile of base amount
IPCC AR5 RCP 8.5 Scenario
Figure 37 : Characteristics of percentile precipitation extremes indices for districts of Madhya Pradesh (IPCC AR5 RCP4.5 and RCP8.5 scenarios)
113
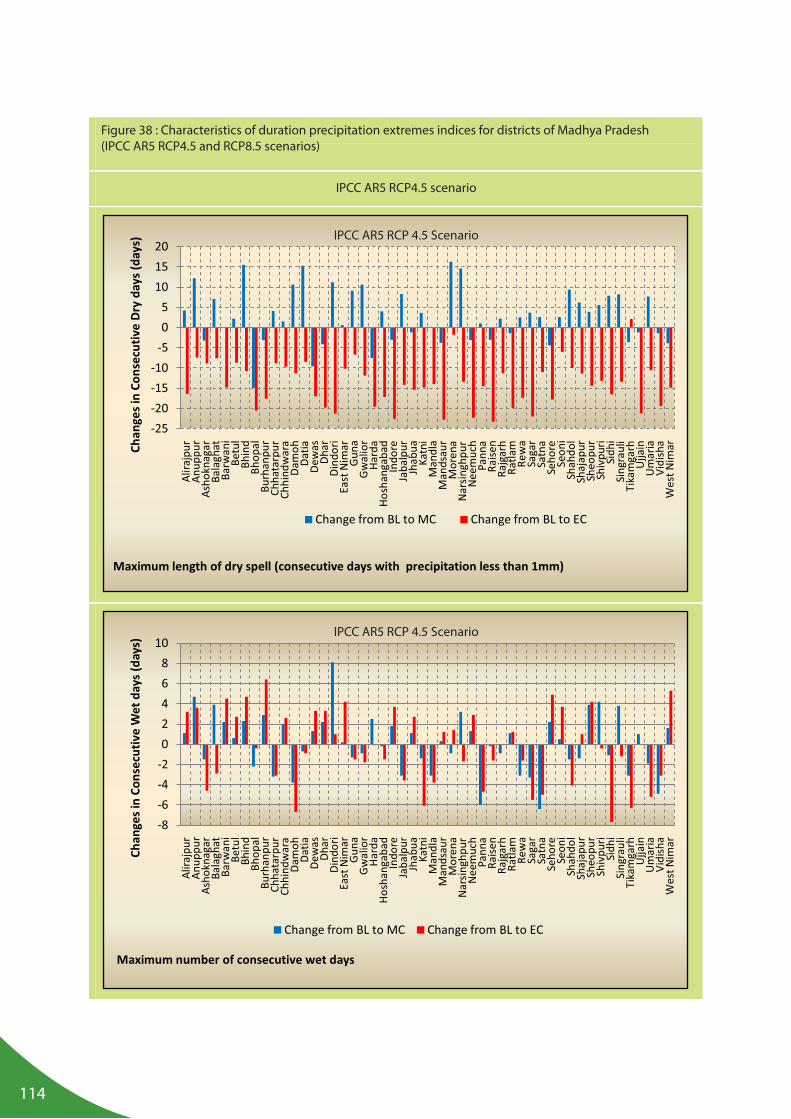
IPCC AR5 RCP4.5 scenario
-25
-20
-15
-10
-5
0
5
10
15
20
Alir
ajp
ur
An
up
pu
rA
sho
knag
arB
alag
hat
Bar
wan
iB
etu
lB
hin
dB
ho
pal
Bu
rhan
pu
rC
hh
atar
pu
rC
hh
ind
war
aD
amo
hD
atia
Dew
asD
har
Din
do
riEa
st N
imar
Gu
na
Gw
alio
rH
ard
aH
osh
anga
bad
Ind
ore
Jab
alp
ur
Jhab
ua
Kat
ni
Man
dla
Man
dsa
ur
Mo
ren
aN
arsi
ngh
pu
rN
eem
uch
Pan
na
Rai
sen
Raj
garh
Rat
lam
Rew
aSa
gar
Satn
aSe
ho
reSe
on
iSh
ahd
ol
Shaj
apu
rSh
eop
ur
Shiv
pu
riSi
dh
iSi
ngr
auli
Tika
mga
rhU
jjain
Um
aria
Vid
ish
aW
est
Nim
arCh
ange
s in
Co
nse
cuti
ve D
ry d
ays
(day
s)
Change from BL to MC Change from BL to EC
Maximum length of dry spell (consecutive days with precipitation less than 1mm)
IPCC AR5 RCP 4.5 Scenario
-8
-6
-4
-2
0
2
4
6
8
10
Alir
ajp
ur
An
up
pu
rA
sho
knag
arB
alag
hat
Bar
wan
iB
etu
lB
hin
dB
ho
pal
Bu
rhan
pu
rC
hh
atar
pu
rC
hh
ind
war
aD
amo
hD
atia
Dew
asD
har
Din
do
riEa
st N
imar
Gu
na
Gw
alio
rH
ard
aH
osh
anga
bad
Ind
ore
Jab
alp
ur
Jhab
ua
Kat
ni
Man
dla
Man
dsa
ur
Mo
ren
aN
arsi
ngh
pu
rN
eem
uch
Pan
na
Rai
sen
Raj
garh
Rat
lam
Rew
aSa
gar
Satn
aSe
ho
reSe
on
iSh
ahd
ol
Shaj
apu
rSh
eop
ur
Shiv
pu
riSi
dh
iSi
ngr
auli
Tika
mga
rhU
jjain
Um
aria
Vid
ish
aW
est
Nim
ar
Ch
ange
s in
Co
nse
cuti
ve W
et
day
s (d
ays)
Change from BL to MC Change from BL to EC
Maximum number of consecutive wet days
IPCC AR5 RCP 4.5 Scenario
Figure 38 : Characteristics of duration precipitation extremes indices for districts of Madhya Pradesh (IPCC AR5 RCP4.5 and RCP8.5 scenarios)
114

IPCC AR5 RCP 8.5 scenario
-20
-15
-10
-5
0
5
10
15
20
Alir
ajp
ur
An
up
pu
rA
sho
knag
arB
alag
hat
Bar
wan
iB
etu
lB
hin
dB
ho
pal
Bu
rhan
pu
rC
hh
atar
pu
rC
hh
ind
war
aD
amo
hD
atia
Dew
asD
har
Din
do
riEa
st N
imar
Gu
na
Gw
alio
rH
ard
aH
osh
anga
bad
Ind
ore
Jab
alp
ur
Jhab
ua
Kat
ni
Man
dla
Man
dsa
ur
Mo
ren
aN
arsi
ngh
pu
rN
eem
uch
Pan
na
Rai
sen
Raj
garh
Rat
lam
Rew
aSa
gar
Satn
aSe
ho
reSe
on
iSh
ahd
ol
Shaj
apu
rSh
eop
ur
Shiv
pu
riSi
dh
iSi
ngr
auli
Tika
mga
rhU
jjain
Um
aria
Vid
ish
aW
est
Nim
arCh
ange
s in
Co
nse
cuti
ve D
ry d
ays
(day
s)
Change from BL to MC Change from BL to EC
Maximum length of dry spell (consecutive days with precipitation less than 1mm)
IPCC AR5 RCP 8.5 Scenario
-8
-6
-4
-2
0
2
4
6
8
10
Alir
ajp
ur
An
up
pu
rA
sho
knag
arB
alag
hat
Bar
wan
iB
etu
lB
hin
dB
ho
pal
Bu
rhan
pu
rC
hh
atar
pu
rC
hh
ind
war
aD
amo
hD
atia
Dew
asD
har
Din
do
riEa
st N
imar
Gu
na
Gw
alio
rH
ard
aH
osh
anga
bad
Ind
ore
Jab
alp
ur
Jhab
ua
Kat
ni
Man
dla
Man
dsa
ur
Mo
ren
aN
arsi
ngh
pu
rN
eem
uch
Pan
na
Rai
sen
Raj
garh
Rat
lam
Rew
aSa
gar
Satn
aSe
ho
reSe
on
iSh
ahd
ol
Shaj
apu
rSh
eop
ur
Shiv
pu
riSi
dh
iSi
ngr
auli
Tika
mga
rhU
jjain
Um
aria
Vid
ish
aW
est
Nim
ar
Ch
ange
s in
Co
nse
cuti
ve W
et
day
s (d
ays)
Change from BL to MC Change from BL to EC
Maximum number of consecutive wet days
IPCC AR5 RCP 8.5 Scenario
Figure 38 : Characteristics of duration precipitation extremes indices for districts of Madhya Pradesh (IPCC AR5 RCP4.5 and RCP8.5 scenarios)
115

IPCC AR5 RCP4.5 scenario
-6
-4
-2
0
2
4
6
8
Alir
ajp
ur
An
up
pu
rA
sho
knag
arB
alag
hat
Bar
wan
iB
etu
lB
hin
dB
ho
pal
Bu
rhan
pu
rC
hh
atar
pu
rC
hh
ind
war
aD
amo
hD
atia
Dew
asD
har
Din
do
riEa
st N
imar
Gu
na
Gw
alio
rH
ard
aH
osh
anga
bad
Ind
ore
Jab
alp
ur
Jhab
ua
Kat
ni
Man
dla
Man
dsa
ur
Mo
ren
aN
arsi
ngh
pu
rN
eem
uch
Pan
na
Rai
sen
Raj
garh
Rat
lam
Rew
aSa
gar
Satn
aSe
ho
reSe
on
iSh
ahd
ol
Shaj
apu
rSh
eop
ur
Shiv
pu
riSi
dh
iSi
ngr
auli
Tika
mga
rhU
jjain
Um
aria
Vid
ish
aW
est
Nim
arCh
ange
s in
fre
qu
en
cy, r
f>1
0m
m (
day
s)
Change from BL to MC Change from BL to EC
Heavy Precipitation days-Annual count of days when Rain > 10mm
IPCC AR5 RCP 4.5 Scenario
-4
-3
-2
-1
0
1
2
3
4
Alir
ajp
ur
An
up
pu
rA
sho
knag
arB
alag
hat
Bar
wan
iB
etu
lB
hin
dB
ho
pal
Bu
rhan
pu
rC
hh
atar
pu
rC
hh
ind
war
aD
amo
hD
atia
Dew
asD
har
Din
do
riEa
st N
imar
Gu
na
Gw
alio
rH
ard
aH
osh
anga
bad
Ind
ore
Jab
alp
ur
Jhab
ua
Kat
ni
Man
dla
Man
dsa
ur
Mo
ren
aN
arsi
ngh
pu
rN
eem
uch
Pan
na
Rai
sen
Raj
garh
Rat
lam
Rew
aSa
gar
Satn
aSe
ho
reSe
on
iSh
ahd
ol
Shaj
apu
rSh
eop
ur
Shiv
pu
riSi
dh
iSi
ngr
auli
Tika
mga
rhU
jjain
Um
aria
Vid
ish
aW
est
Nim
ar
Ch
ange
s in
fre
qu
en
cy, r
f>2
0m
m (
day
s)
Change from BL to MC Change from BL to EC
Very Heavy Precipitation days -Annual count of days when Rain > 20mm
IPCC AR5 RCP 4.5 Scenario
Figure 39 : Characteristics of threshold precipitation extremes indices for districts of Madhya Pradesh (IPCC AR5 RCP4.5 and RCP8.5 scenario)
116

IPCC AR5 RCP 8.5 scenario
-4
-2
0
2
4
6
8
10
Alir
ajp
ur
An
up
pu
rA
sho
knag
arB
alag
hat
Bar
wan
iB
etu
lB
hin
dB
ho
pal
Bu
rhan
pu
rC
hh
atar
pu
rC
hh
ind
war
aD
amo
hD
atia
Dew
asD
har
Din
do
riEa
st N
imar
Gu
na
Gw
alio
rH
ard
aH
osh
anga
bad
Ind
ore
Jab
alp
ur
Jhab
ua
Kat
ni
Man
dla
Man
dsa
ur
Mo
ren
aN
arsi
ngh
pu
rN
eem
uch
Pan
na
Rai
sen
Raj
garh
Rat
lam
Rew
aSa
gar
Satn
aSe
ho
reSe
on
iSh
ahd
ol
Shaj
apu
rSh
eop
ur
Shiv
pu
riSi
dh
iSi
ngr
auli
Tika
mga
rhU
jjain
Um
aria
Vid
ish
aW
est
Nim
ar
Ch
ange
s in
fre
qu
en
cy, r
f>1
0m
m (
day
s)
Change from BL to MC Change from BL to EC
Heavy Precipitation days-Annual count of days when Rain > 10mm
IPCC AR5 RCP 8.5 Scenario
-4
-3
-2
-1
0
1
2
3
4
Alir
ajp
ur
An
up
pu
rA
sho
knag
arB
alag
hat
Bar
wan
iB
etu
lB
hin
dB
ho
pal
Bu
rhan
pu
rC
hh
atar
pu
rC
hh
ind
war
aD
amo
hD
atia
Dew
asD
har
Din
do
riEa
st N
imar
Gu
na
Gw
alio
rH
ard
aH
osh
anga
bad
Ind
ore
Jab
alp
ur
Jhab
ua
Kat
ni
Man
dla
Man
dsa
ur
Mo
ren
aN
arsi
ngh
pu
rN
eem
uch
Pan
na
Rai
sen
Raj
garh
Rat
lam
Rew
aSa
gar
Satn
aSe
ho
reSe
on
iSh
ahd
ol
Shaj
apu
rSh
eop
ur
Shiv
pu
riSi
dh
iSi
ngr
auli
Tika
mga
rhU
jjain
Um
aria
Vid
ish
aW
est
Nim
ar
Ch
ange
s in
fre
qu
en
cy, r
f>2
0m
m (
day
s)
Change from BL to MC Change from BL to EC
Very Heavy Precipitation days -Annual count of days when Rain > 20mm
IPCC AR5 RCP 8.5 Scenario
Figure 39 : Characteristics of threshold precipitation extremes indices for districts of Madhya Pradesh (IPCC AR5 RCP4.5 and RCP8.5 scenario)
117

IPCC AR5 RCP4.5 scenario
-10
-5
0
5
10
15
20
25
Alir
ajp
ur
An
up
pu
rA
sho
knag
arB
alag
hat
Bar
wan
iB
etu
lB
hin
dB
ho
pal
Bu
rhan
pu
rC
hh
atar
pu
rC
hh
ind
war
aD
amo
hD
atia
Dew
asD
har
Din
do
riEa
st N
imar
Gu
na
Gw
alio
rH
ard
aH
osh
anga
bad
Ind
ore
Jab
alp
ur
Jhab
ua
Kat
ni
Man
dla
Man
dsa
ur
Mo
ren
aN
arsi
ngh
pu
rN
eem
uch
Pan
na
Rai
sen
Raj
garh
Rat
lam
Rew
aSa
gar
Satn
aSe
ho
reSe
on
iSh
ahd
ol
Shaj
apu
rSh
eop
ur
Shiv
pu
riSi
dh
iSi
ngr
auli
Tika
mga
rhU
jjain
Um
aria
Vid
ish
aW
est
Nim
ar
Ch
ange
s in
pre
cip
itat
ion
(%
)
Change from BL to MC Change from BL to EC
Annual total precipitation from wet days
IPCC AR5 RCP 4.5 Scenario
-1.5
-1.0
-0.5
0.0
0.5
1.0
1.5
Alir
ajp
ur
An
up
pu
rA
sho
knag
arB
alag
hat
Bar
wan
iB
etu
lB
hin
dB
ho
pal
Bu
rhan
pu
rC
hh
atar
pu
rC
hh
ind
war
aD
amo
hD
atia
Dew
asD
har
Din
do
riEa
st N
imar
Gu
na
Gw
alio
rH
ard
aH
osh
anga
bad
Ind
ore
Jab
alp
ur
Jhab
ua
Kat
ni
Man
dla
Man
dsa
ur
Mo
ren
aN
arsi
ngh
pu
rN
eem
uch
Pan
na
Rai
sen
Raj
garh
Rat
lam
Rew
aSa
gar
Satn
aSe
ho
reSe
on
iSh
ahd
ol
Shaj
apu
rSh
eop
ur
Shiv
pu
riSi
dh
iSi
ngr
auli
Tika
mga
rhU
jjain
Um
aria
Vid
ish
aW
est
Nim
ar
Ave
rage
pre
cip
itat
ion
on
we
t d
ays
(mm
/day
)
Change from BL to MC Change from BL to EC
Simple Daily Intensity Index
IPCC AR5 RCP 4.5 Scenario
Figure 40 : Characteristics of other precipitation extremes indices for districts of Madhya Pradesh (IPCC AR5 RCP4.5 and RCP8.5 scenario)
118

IPCC Ar5 RCP 8.5 scenario
-10
-5
0
5
10
15
20
25
Alir
ajp
ur
An
up
pu
rA
sho
knag
arB
alag
hat
Bar
wan
iB
etu
lB
hin
dB
ho
pal
Bu
rhan
pu
rC
hh
atar
pu
rC
hh
ind
war
aD
amo
hD
atia
Dew
asD
har
Din
do
riEa
st N
imar
Gu
na
Gw
alio
rH
ard
aH
osh
anga
bad
Ind
ore
Jab
alp
ur
Jhab
ua
Kat
ni
Man
dla
Man
dsa
ur
Mo
ren
aN
arsi
ngh
pu
rN
eem
uch
Pan
na
Rai
sen
Raj
garh
Rat
lam
Rew
aSa
gar
Satn
aSe
ho
reSe
on
iSh
ahd
ol
Shaj
apu
rSh
eop
ur
Shiv
pu
riSi
dh
iSi
ngr
auli
Tika
mga
rhU
jjain
Um
aria
Vid
ish
aW
est
Nim
ar
Ch
ange
s in
pre
cip
itat
ion
(%
)
Change from BL to MC Change from BL to EC
Annual total precipitation from wet days
IPCC AR5 RCP 8.5 Scenario
-1.5
-1.0
-0.5
0.0
0.5
1.0
1.5
Alir
ajp
ur
An
up
pu
rA
sho
knag
arB
alag
hat
Bar
wan
iB
etu
lB
hin
dB
ho
pal
Bu
rhan
pu
rC
hh
atar
pu
rC
hh
ind
war
aD
amo
hD
atia
Dew
asD
har
Din
do
riEa
st N
imar
Gu
na
Gw
alio
rH
ard
aH
osh
anga
bad
Ind
ore
Jab
alp
ur
Jhab
ua
Kat
ni
Man
dla
Man
dsa
ur
Mo
ren
aN
arsi
ngh
pu
rN
eem
uch
Pan
na
Rai
sen
Raj
garh
Rat
lam
Rew
aSa
gar
Satn
aSe
ho
reSe
on
iSh
ahd
ol
Shaj
apu
rSh
eop
ur
Shiv
pu
riSi
dh
iSi
ngr
auli
Tika
mga
rhU
jjain
Um
aria
Vid
ish
aW
est
Nim
arAve
rage
pre
cip
itat
ion
on
we
t d
ays
(mm
/day
)
Change from BL to MC Change from BL to ECSimple Daily Intensity Index
IPCC AR5 RCP 8.5 Scenario
Figure 40 : Characteristics of other precipitation extremes indices for districts of Madhya Pradesh (IPCC AR5 RCP4.5 and RCP8.5 scenario)
119

120
Table 16: Trend in Temperature Extremes Indices for districts of Madhya Pradesh (IPCC Ar5 RCP4.5 scenario)

121
Narsinghpur

122

123

124
Narsinghpur

125

126

127
Narsinghpur

128

129

130
Narsinghpur
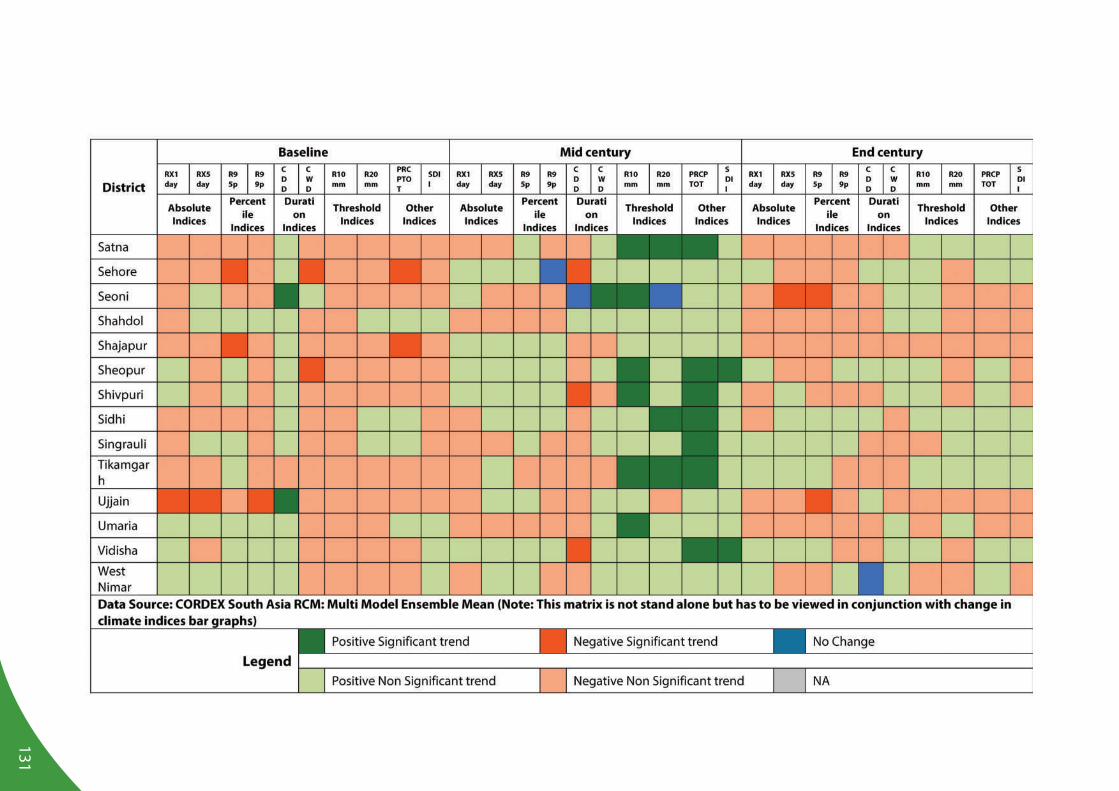
131