Aboriginal Population Projections New South Wales 2006-2021
116
The NSW Aboriginal Affairs Plan (2003-2012) MARCH 2009 ABORIGINAL POPULATION PROJECTIONS NEW SOUTH WALES 2006 TO 2021
-
Upload
independent -
Category
Documents
-
view
0 -
download
0
Transcript of Aboriginal Population Projections New South Wales 2006-2021

The NSW Aboriginal Affairs Plan (2003-2012)
MARCH 2009
ABORIGINAL POPULATION PROJECTIONSNEW SOUTh WALES 2006 TO 2021
NSW Department of Aboriginal Affairs Aboriginal Population Projections, NSW, 2006-2021 i
© NSW Department of Aboriginal Affairs, 2009 ISBN: 9780958597111 (pbk.) Dewey Number: 306.40899915
National Library of Australia Cataloguing-in-Publication entry: Author: Dr. Khalidi, Noor Ahmad. Title: Aboriginal population projections, New South Wales, 2006 to 2021 / Noor A. Khalidi. Publisher: NSW Department of Aboriginal Affairs, 2009. ISBN: 9780958597111 (pbk.) Subjects: Aboriginal Australians--New South Wales--Population --Statistics. Torres Strait Islanders--New South Wales--Population --Statistics. Population forecasting--New South Wales--Statistics. Other Authors/Contributors: NSW Department of Aboriginal Affairs.
This work is copyright under the Copyright Act 1968. However, use of the projected data, reproduction or quotation of any part of this publication is allowed, given in all cases the NSW Department of Aboriginal Affairs and the author Dr. Noor A. Khalidi must be acknowledged as the source. Disclaimer: The views expressed in this publication are those of the author and do not necessarily represent the views of the NSW Department of Aboriginal Affairs. INQUIRIES: For further information and inquiries regarding this publication contact: NSW Department of Aboriginal Affairs Level 13, Tower B, Centennial Plaza 280 Elizabeth St SURRY HILLS NSW 2010 Telephone: (02) 9219 0700 Facsimile: (02) 9219 0790 Produced for the NSW Department of Aboriginal Affairs by: Khalidi Research and Development Email: [email protected] Telephone: 0414566174

NSW Department of Aboriginal Affairs Aboriginal Population Projections, NSW, 2006-2021 ii
TABLE OF CONTENTS FOREWORD ......................................................................................................................................................... IV ACKNOWLEDGEMENTS ................................................................................................................................... V ABSTRACT ........................................................................................................................................................... VI PROJECTION METHODOLOGY ....................................................................................................................... 1 BASE DATA AND ASSUMPTIONS ..................................................................................................................... 1
WHO IS AN ABORIGINAL PERSON? ......................................................................................................................... 1 BASE POPULATION ................................................................................................................................................ 1 FERTILITY LEVEL AND PATTERN ........................................................................................................................... 3 MORTALITY LEVEL AND PATTERN ........................................................................................................................ 3 MIGRATION LEVEL AND PATTERN ......................................................................................................................... 5
Aboriginal births to non-Aboriginal mothers ................................................................................................... 5 Inter-state migration ......................................................................................................................................... 5
REGIONAL PROJECTIONS ....................................................................................................................................... 7 Map 1: NSW Two Ways Together Regional Geography ................................................................................. 7
PROJECTION RESULTS STATE LEVEL ....................................................................................................... 11 POPULATION SIZE, VITAL RATES AND CHANGE .................................................................................................. 11 AGE STRUCTURE ................................................................................................................................................. 13 SEX COMPOSITION ............................................................................................................................................... 15
REGIONAL PROJECTIONS .............................................................................................................................. 16 REGIONAL SUMMARY .......................................................................................................................................... 16 1. CENTRAL COAST REGION ........................................................................................................................ 18
Map 2: Central Coast Region ......................................................................................................................... 18 2. COASTAL SYDNEY REGION ................................................................................................................... 201
Map 3: Coastal Sydney Region ...................................................................................................................... 22 3. HUNTER REGION ........................................................................................................................................ 24
Map 4: Hunter Region.................................................................................................................................... 25 4. ILLAWARRA REGION ................................................................................................................................. 27
Map 5: Illawarra Region ................................................................................................................................ 28 5. NEW ENGLAND NORTH-WEST REGION ................................................................................................. 30
Map 6: New England North-West Region ..................................................................................................... 31 6. NORTH COAST REGION ............................................................................................................................. 33
Map 7: North Coast Region ........................................................................................................................... 34 7. NSW MID-WESTERN REGION ................................................................................................................... 36
Map 8: NSW Mid-Western Region ................................................................................................................ 37 8. RIVERINA-MURRAY REGION ................................................................................................................... 39
Map 9: Riverina-Murray Region .................................................................................................................... 40 9. SOUTH-EAST REGION ................................................................................................................................ 42
Map 10: South-East Region ........................................................................................................................... 43 10. WESTERN AND SOUTH-WEST SYDNEY REGION ............................................................................... 45
Map 11: Western and South-West Sydney Region ........................................................................................ 46 11. WESTERN NSW REGION .......................................................................................................................... 48
Map 12: Western NSW Region...................................................................................................................... 49 EXPLANATORY NOTES .................................................................................................................................... 51
PROJECTION METHOD.......................................................................................................................................... 51 ESTIMATES OF FERTILITY .................................................................................................................................... 51
Indirect estimation of age-specific fertility rates ............................................................................................ 53 Basis of method and its rationale ................................................................................................................... 53
ESTIMATES OF MORTALITY ................................................................................................................................. 55 ABS Indigenous life tables………………………………………………………………………………..………….55
SOME DEFINITIONS .............................................................................................................................................. 56 Live birth ........................................................................................................................................................ 56 Age-specific fertility rates .............................................................................................................................. 56 Natural increase ............................................................................................................................................. 56
NSW Department of Aboriginal Affairs Aboriginal Population Projections, NSW, 2006-2021 iii
Net interstate migration .................................................................................................................................. 56 Population growth .......................................................................................................................................... 56 Total fertility rate ........................................................................................................................................... 56 Death .............................................................................................................................................................. 56 Age-specific death rates ................................................................................................................................. 56 The crude death rate ....................................................................................................................................... 56 Aboriginal death ............................................................................................................................................. 57 Infant death .................................................................................................................................................... 57 Infant mortality rate ....................................................................................................................................... 57 Life table ........................................................................................................................................................ 57 Life expectancy .............................................................................................................................................. 57 Abridged life tables ........................................................................................................................................ 57 Experimental Iindigenous life tables .............................................................................................................. 57 The sex ratio ................................................................................................................................................... 57 Average household size ................................................................................................................................. 57 Estimated resident population (ERP) ............................................................................................................. 58 Household ...................................................................................................................................................... 58 Household estimate ........................................................................................................................................ 58
REFERENCES ...................................................................................................................................................... 59 APPENDICES: POPULATION PROJECTIONS BY SINGLE YEARS OF AGE AND SEX ..................... 61
APPENDIX 1: NSW .............................................................................................................................................. 61 APPENDIX 2: CENTRAL COAST REGION .............................................................................................................. 65 APPENDIX 3: COASTAL SYDNEY REGION ............................................................................................................ 69 APPENDIX 4: HUNTER REGION ............................................................................................................................ 73 APPENDIX 5: ILLAWARRA REGION ...................................................................................................................... 77 APPENDIX 6: MID-WESTERN NSW REGION ....................................................................................................... 81 APPENDIX 7: NEW ENGLAND NORTH-WEST REGION .......................................................................................... 85 APPENDIX 8: NORTH COAST REGION .................................................................................................................. 89 APPENDIX 9: RIVERINA-MURRAY REGION ........................................................................................................ 93 APPENDIX 10: SOUTH EAST REGION .................................................................................................................... 97 APPENDIX 11: WESTERN AND SOUTH WEST SYDNEY REGION .......................................................................... 101 APPENDIX 12: WESTERN NSW REGION............................................................................................................. 105

NSW Department of Aboriginal Affairs Aboriginal Population Projections, NSW, 2006-2021 iv
FOREWORD
With a view to meeting the urgent need for demographic data for future years, I am pleased to present this report which provides projections of the Aboriginal population from 2006 to 2021 for Two Ways Together regions. The 2006 ABS Census of Population and Housing provides valuable information about the current demographic characteristics and composition of the Aboriginal population. Available data show that the Aboriginal population is growing faster than the rest of the population and that the distribution of Aboriginal people across different regions and centres is changing. It is important that the regional trends be projected forward to assist in anticipating future service needs, formulating appropriate policy, planning service infrastructure and support strategies and planning service delivery responses, particularly those which emphasise early intervention. However, current ABS experimental estimates and projections of the Aboriginal population for NSW do not go beyond 2009. The projections in this report were constructed by Dr. Noor A. Khalidi, an experienced demographer, who has been closely involved in Australian Aboriginal affairs during the last 22 years. The report builds on work produced by Dr. Khalidi for the NSW Aboriginal Housing Office which provides Aboriginal population projections by five year age groups for the six Aboriginal Housing Office regions and for regions defined in terms of the Accessibility/Remoteness Index of Australia (ARIA). This current report extends the work to Two Ways Together regions, incorporates ABS revisions to Aboriginal population estimates and life tables and includes single year age groups. Two Ways Together partner agencies as well as other agencies and data users may find the detailed projections useful for a range of planning and related tasks. Jody Broun Director General NSW Department of Aboriginal Affairs

NSW Department of Aboriginal Affairs Aboriginal Population Projections, NSW, 2006-2021 v
ACKNOWLEDGEMENTS Peter Damcevski, Allan Jenner and Kai-Lin Sze from the Australian Bureau of Statistics (ABS), Sydney Office, provided the bulk of the census based data without which this work could not have been completed. Patrick Corr, Director, Demography Program, ABS Head Office in Canberra, provided Experimental Aboriginal Resident Population data used in these projections and the most recent estimates of Aboriginal life expectancies. Michelle Gourley, Senior Data Analyst, Aboriginal and Torres Strait Islander Health and Welfare Unit at the Australian Institute of Health and Welfare (AIHW) in Canberra provided valuable data used in this work. The report was produced in collaboration with the NSW Aboriginal Housing Office.
NSW Department of Aboriginal Affairs Aboriginal Population Projections, NSW, 2006-2021 vi
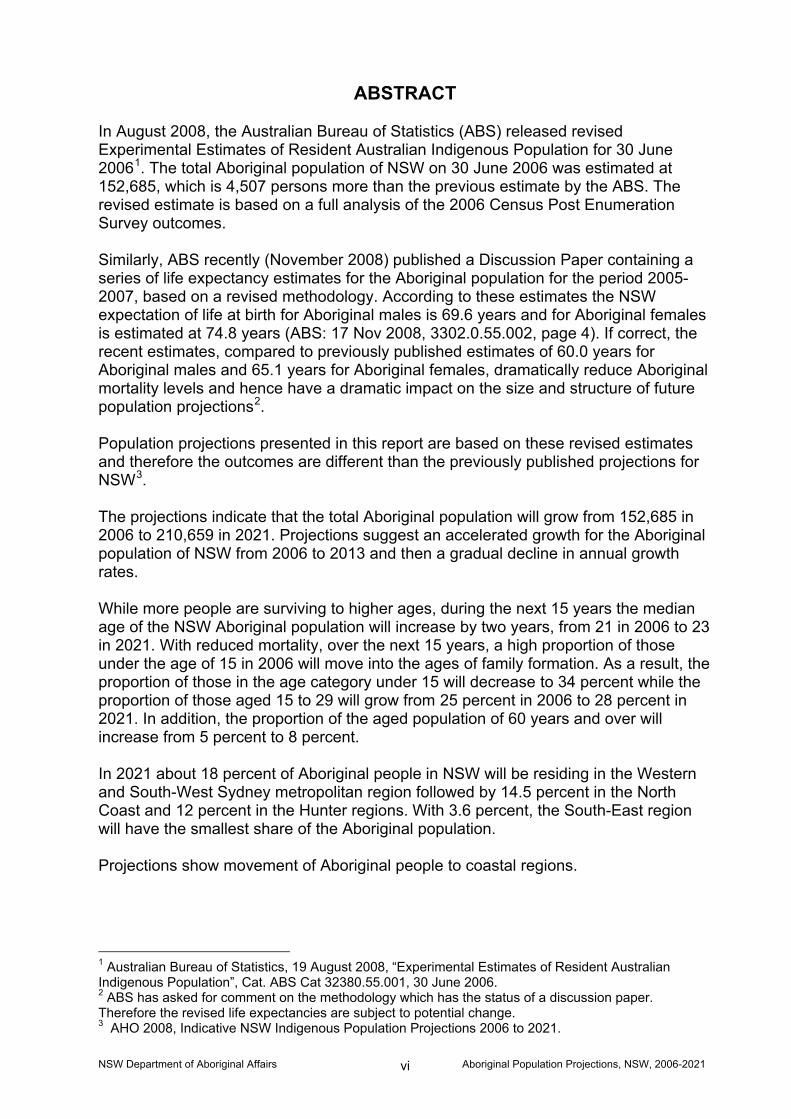
ABSTRACT In August 2008, the Australian Bureau of Statistics (ABS) released revised Experimental Estimates of Resident Australian Indigenous Population for 30 June 20061. The total Aboriginal population of NSW on 30 June 2006 was estimated at 152,685, which is 4,507 persons more than the previous estimate by the ABS. The revised estimate is based on a full analysis of the 2006 Census Post Enumeration Survey outcomes. Similarly, ABS recently (November 2008) published a Discussion Paper containing a series of life expectancy estimates for the Aboriginal population for the period 2005-2007, based on a revised methodology. According to these estimates the NSW expectation of life at birth for Aboriginal males is 69.6 years and for Aboriginal females is estimated at 74.8 years (ABS: 17 Nov 2008, 3302.0.55.002, page 4). If correct, the recent estimates, compared to previously published estimates of 60.0 years for Aboriginal males and 65.1 years for Aboriginal females, dramatically reduce Aboriginal mortality levels and hence have a dramatic impact on the size and structure of future population projections2. Population projections presented in this report are based on these revised estimates and therefore the outcomes are different than the previously published projections for NSW3. The projections indicate that the total Aboriginal population will grow from 152,685 in 2006 to 210,659 in 2021. Projections suggest an accelerated growth for the Aboriginal population of NSW from 2006 to 2013 and then a gradual decline in annual growth rates. While more people are surviving to higher ages, during the next 15 years the median age of the NSW Aboriginal population will increase by two years, from 21 in 2006 to 23 in 2021. With reduced mortality, over the next 15 years, a high proportion of those under the age of 15 in 2006 will move into the ages of family formation. As a result, the proportion of those in the age category under 15 will decrease to 34 percent while the proportion of those aged 15 to 29 will grow from 25 percent in 2006 to 28 percent in 2021. In addition, the proportion of the aged population of 60 years and over will increase from 5 percent to 8 percent. In 2021 about 18 percent of Aboriginal people in NSW will be residing in the Western and South-West Sydney metropolitan region followed by 14.5 percent in the North Coast and 12 percent in the Hunter regions. With 3.6 percent, the South-East region will have the smallest share of the Aboriginal population. Projections show movement of Aboriginal people to coastal regions.
1 Australian Bureau of Statistics, 19 August 2008, “Experimental Estimates of Resident Australian Indigenous Population”, Cat. ABS Cat 32380.55.001, 30 June 2006. 2 ABS has asked for comment on the methodology which has the status of a discussion paper. Therefore the revised life expectancies are subject to potential change. 3 AHO 2008, Indicative NSW Indigenous Population Projections 2006 to 2021.

NSW Department of Aboriginal Affairs Aboriginal Population Projections, NSW, 2006-2021 1
PROJECTION METHODOLOGY
Population projections are carried out through a standard cohort-component method. The procedure carries out a single-year projection of population by age and sex, based on initial male and female populations in five-year age groups and assumed changes in fertility, mortality and migration. (See explanatory notes for a description of the technique). Projections are carried out at the total NSW State level as well as by the NSW Two Ways Together Regions. Two Ways Together regions are collections of whole of Local Government Areas; hence, the census data are easily obtainable for them. To provide data more closely aligned with the administrative regions of some partner agencies population projections for the Two Ways Together region Illawarra/South-East have been constructed separately for Illawarra and for South-East sub-regions.
BASE DATA AND ASSUMPTIONS Who is an Aboriginal person? The term ‘Aboriginal’ in this report refers to persons of Aboriginal or Torres Strait Islander descent. It is used throughout the report unless referring to the title of a publication or heading of a source table which includes the term ‘Indigenous’, which carries the same meaning in the present context. Publications and tables by the ABS, for example, use the term ‘Indigenous’. The 2006 Census outcomes were used as the basis for projections. The population census question asks 'Is the person of Aboriginal or Torres Strait Islander Origin?' A definition of an Aboriginal or Torres Strait Islander person was given in a High Court judgement in the case of Commonwealth v Tasmania (1983) 46 ALR 625. This definition states that an Aboriginal or Torres Strait Islander is a person of Aboriginal or Torres Strait Islander descent who identifies as an Aboriginal or Torres Strait Islander and is accepted as such by the community in which he or she lives. The census question measures the descent concept although some respondents will interpret the question to mean both descent and identification. It does not take account of the third part of the definition, community acceptance.
Base Population The most recent Census of Population and Housing was conducted by the ABS on 8 August 2006. Australia's first national census was held in 1911, and since 1961 a census has been taken every five years, the frequency specified in the Census and Statistics Act 1905. The objective of the census is to count the number of people in Australia on Census Night, identifying their key characteristics and those of the dwellings in which they live. Following changes to the Australian Constitution as a result of the 1967 Referendum, Aboriginal and Torres Strait Islander peoples were included in official estimates of the

NSW Department of Aboriginal Affairs Aboriginal Population Projections, NSW, 2006-2021 2
Australian population. As a consequence, from the 1971 Census onwards, the ABS has developed and improved strategies to count the Aboriginal population throughout Australia. Using ABS CDATA Online services, Aboriginal population data on place of usual residence from the 2006 Census counts have been compiled by Two Ways Together regions4. Meanwhile, ABS has produced Experimental Estimates of Resident Australian Indigenous Population at 30 June 2006, including data by age and sex. When producing these estimates the ABS adjusts the Census numbers to take account of factors such as unknown Aboriginal status, undercount and difference in reference periods. Based on these adjustments, the estimated resident Aboriginal population of NSW at 30 June 2006 was 152,685 persons. This compares to the census count of 138,508 persons on 8 August 2006, an increase of 10.2 percent. TABLE 1: ESTIMATED RESIDENT ABORIGINAL POPULATION IN FIVE-YEAR AGE GROUPS,
AT 30 JUNE 2006, NSW
Age-Groups Total Males Females Total Males Females 0-4 19,105 9,853 9,252 12.5% 12.9% 12.1% 5-9 19,367 9,965 9,402 12.7% 13.1% 12.3%
10-14 19,885 10,173 9,712 13.0% 13.3% 12.7% 15-19 16,398 8,589 7,809 10.7% 11.3% 10.2% 20-24 12,623 6,500 6,123 8.3% 8.5% 8.0% 25-29 9,875 4,872 5,003 6.5% 6.4% 6.5% 30-34 10,051 4,810 5,241 6.6% 6.3% 6.9% 35-39 9,921 4,674 5,247 6.5% 6.1% 6.9% 40-44 8,993 4,190 4,803 5.9% 5.5% 6.3% 45-49 7,632 3,652 3,980 5.0% 4.8% 5.2% 50-54 6,060 2,969 3,091 4.0% 3.9% 4.0% 55-59 4,600 2,215 2,385 3.0% 2.9% 3.1% 60-64 3,112 1,545 1,567 2.0% 2.0% 2.0% 65-69 2,119 991 1,128 1.4% 1.3% 1.5% 70-74 1,436 659 777 0.9% 0.9% 1.0% 75-79 833 330 503 0.5% 0.4% 0.7% 80+ 675 242 433 0.4% 0.3% 0.6% Total 152,685 76,229 76,456 100.0% 100.0% 100.0%
Source: ABS Experimental Estimated Resident Australian Indigenous Population, Cat 3238.0.55.001 19 Aug 2008
On 30 June 2006, the estimated resident Aboriginal population of NSW constituted 29.5 percent of the total Aboriginal population of Australia and 2.24 percent of the total NSW population. These estimates at the NSW level by age and sex were then used to adjust the TWT Regional counts compiled from original census figures. The adjusted TWT regional counts for the Aboriginal population, cross-referenced to other data from the 2006 Census such as Children Ever Born by Age Groups of Mothers and Place of Usual
4 Two Ways Together Report on Indicators 2007, Department of Aboriginal Affairs, April 2008.

NSW Department of Aboriginal Affairs Aboriginal Population Projections, NSW, 2006-2021 3
Residence 5 years before the Census formed the basis of projections presented in this publication.
Fertility Level and Pattern Two different approaches were examined to determine the level and age pattern of Aboriginal fertility in NSW. First, data on registered births to Aboriginal women by age for years 2004, 2005 and 2006 were used to provide estimates of the level and pattern of Aboriginal fertility (direct estimation method). This is also called Period Fertility. Secondly, estimates of the level and pattern of Aboriginal fertility in NSW were obtained by applying an indirect method of fertility estimation using census data on number of women by age groups by number of children ever born. The results of these two estimation methods were then compared to ascertain the fertility rate of Aboriginal women in NSW. Comparing the two methods of fertility estimation, the results suggest that Aboriginal birth registration data in NSW are still not complete enough to provide a basis for reliable fertility estimates. Therefore, the results of the indirect fertility estimates based on census outcomes seem to be more reliable and are used in these projections. By applying indirect techniques of fertility estimation using data on number of mothers by age groups by number of Children Ever Born from Census 2006 and Census 1996, two very consistent sets of age-specific fertility rates and the corresponding total fertility rates for 1996 and 2006 were obtained, which show a marginal increase in Aboriginal women’s total fertility rate from 2.57 in 1996 to 2.61 in 2006. However, in the absence of other evidence, the observed increase in fertility rates is not significant enough to warrant a further increase or decline in NSW Aboriginal fertility rates during the projection years. A description of the methods of fertility estimation used in this paper is included in the explanatory notes.
Mortality Level and Pattern A key component of the Aboriginal population estimation or projection process is the use of mortality levels, usually measured by the expectations of life at birth, and age-sex pattern of mortality, usually taken from Aboriginal life tables. In these projections:
levels of mortality were taken from the most recent ABS discussion paper on methods of calculating life expectancies for Indigenous people (ABS: 17 Nov 2008, 3302.0.55.002, page 4),
age patterns of mortality were taken from the ABS estimated Indicative Indigenous Life Table for 1996-2001.
According to the above mentioned ABS Discussion Paper, the NSW expectation of life at birth for Aboriginal males, for the period 2005-2007, is estimated at 69.6 years and for Aboriginal females is estimated at 74.8 years (ABS: 17 Nov 2008, 3302.0.55.002, page 4). Compared to previously published estimates of life expectancies of 60.0 years for Aboriginal males and 65.1 years for Aboriginal females (ABS 2006, Deaths Australia 3302.0, page 77) the recent estimates, if correct, dramatically reduce
NSW Department of Aboriginal Affairs Aboriginal Population Projections, NSW, 2006-2021 4
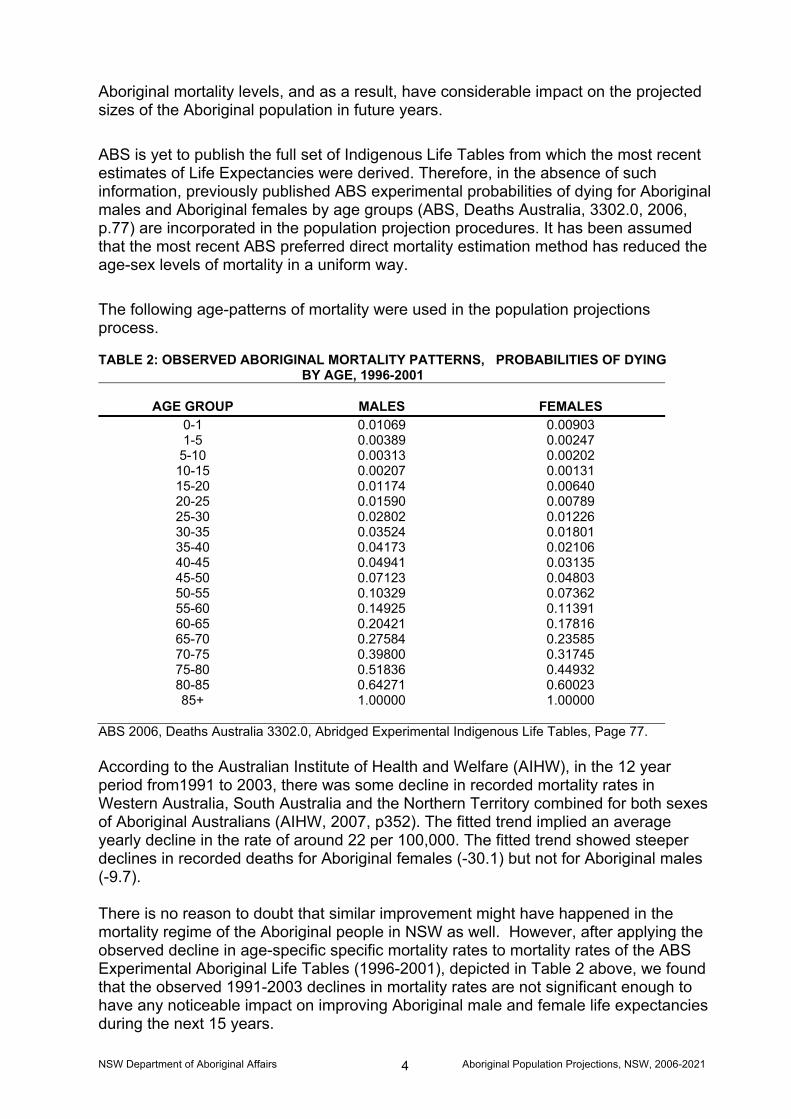
Aboriginal mortality levels, and as a result, have considerable impact on the projected sizes of the Aboriginal population in future years. ABS is yet to publish the full set of Indigenous Life Tables from which the most recent estimates of Life Expectancies were derived. Therefore, in the absence of such information, previously published ABS experimental probabilities of dying for Aboriginal males and Aboriginal females by age groups (ABS, Deaths Australia, 3302.0, 2006, p.77) are incorporated in the population projection procedures. It has been assumed that the most recent ABS preferred direct mortality estimation method has reduced the age-sex levels of mortality in a uniform way. The following age-patterns of mortality were used in the population projections process. TABLE 2: OBSERVED ABORIGINAL MORTALITY PATTERNS, PROBABILITIES OF DYING
BY AGE, 1996-2001
AGE GROUP
MALES
FEMALES 0-1 0.01069 0.00903 1-5 0.00389 0.00247
5-10 0.00313 0.00202 10-15 0.00207 0.00131 15-20 0.01174 0.00640 20-25 0.01590 0.00789 25-30 0.02802 0.01226 30-35 0.03524 0.01801 35-40 0.04173 0.02106 40-45 0.04941 0.03135 45-50 0.07123 0.04803 50-55 0.10329 0.07362 55-60 0.14925 0.11391 60-65 0.20421 0.17816 65-70 0.27584 0.23585 70-75 0.39800 0.31745 75-80 0.51836 0.44932 80-85 0.64271 0.60023 85+ 1.00000 1.00000
ABS 2006, Deaths Australia 3302.0, Abridged Experimental Indigenous Life Tables, Page 77. According to the Australian Institute of Health and Welfare (AIHW), in the 12 year period from1991 to 2003, there was some decline in recorded mortality rates in Western Australia, South Australia and the Northern Territory combined for both sexes of Aboriginal Australians (AIHW, 2007, p352). The fitted trend implied an average yearly decline in the rate of around 22 per 100,000. The fitted trend showed steeper declines in recorded deaths for Aboriginal females (-30.1) but not for Aboriginal males (-9.7). There is no reason to doubt that similar improvement might have happened in the mortality regime of the Aboriginal people in NSW as well. However, after applying the observed decline in age-specific specific mortality rates to mortality rates of the ABS Experimental Aboriginal Life Tables (1996-2001), depicted in Table 2 above, we found that the observed 1991-2003 declines in mortality rates are not significant enough to have any noticeable impact on improving Aboriginal male and female life expectancies during the next 15 years.

NSW Department of Aboriginal Affairs Aboriginal Population Projections, NSW, 2006-2021 5
Similar conclusions were reached by other researchers in the past. In an article published in the Medical Journal of Australia, Ian T Ring and David Firman conclude that “since the 1970s indigenous infant mortality rates have been declining, but life expectancy has not changed because of continued high adult mortality rates”. 5 Consequently, it is assumed the continuation of the above observed decline during the projection years (2006-2021) will not have any significant impact on the size of the projected populations.
Migration Level and Pattern In the absence of international migration, and apart from the effects of births and deaths, the size, age and sex distribution of the total Aboriginal population of NSW is affected by two types of population influx: Aboriginal births to non-Aboriginal mothers and inter-state migration. The 2001 and 2006 Censuses returns did not show any significant evidence of population influx due to change of identification. As such, change of identification is not considered a factor in these projections.
Aboriginal births to non-Aboriginal mothers The average number of registered births to non-Aboriginal mothers (i.e., whose fathers are Aboriginal) during the years 2004, 2005 and 2006 was 1,238 (ABS, Births Australia 2004, 2005 & 2006 publications). As the observed fertility level and pattern of non-Aboriginal mothers differ to those of Aboriginal mothers, it was decided not to combine the two fertility levels and patterns. Doing so would have resulted in incorrect low estimates of fertility rates for Aboriginal mothers. As such, it was decided to treat Aboriginal births to non-Aboriginal mothers as a special type of population influx, which will affect the size of the population under the age of one year during the projected years. In estimating the size of paternal fertility during the projected years, age-specific fertility rates of non-Aboriginal mothers were applied to the estimates of Aboriginal male population by age groups 5 years older than mothers as Aboriginal fathers were more than 3 years older than the mothers.
Inter-state migration Data from the 2006 Census shows that inter-state migration continues to impact on the size of the NSW Aboriginal population in a negative way, at a very similar level to the previous Census results. Annually, on average around 1,198 Aboriginal people are migrating to other states, about 52 percent of them females, and in return only 812 are migrating to NSW from other States and Territories, again 52 percent of them are females. The net annual migration for the NSW Aboriginal population is thus -355 persons (See Table 3).
5

NS
W D
epar
tmen
t of A
borig
inal
Affa
irs
A
borig
inal
Pop
ulat
ion
Pro
ject
ions
, NS
W, 2
006-
2021
6
TA
BLE
3: P
LAC
E O
F U
SUA
L R
ESID
ENC
E O
N C
ENSU
S N
IGH
T A
ND
PLA
CE
OF
USU
SAL
RES
IDEN
CE
5 YE
AR
S A
GO
C
ENSU
S 20
06, C
OU
NT
OF
AB
OR
IGIN
AL
PER
SON
S A
GED
5 Y
EAR
S A
ND
OVE
R
Pl
ace
of U
sual
Res
iden
ce o
f Cen
sus
Nig
ht (p
erso
ns)
Plac
e of
Usu
al R
esid
ence
5
year
s ag
o N
SW
V
ic
Qld
S
A
WA
Ta
s N
T A
CT
Oth
er
Terr
itorie
s To
tal
Tota
l
P
erso
ns
Dep
artu
res
Sam
e ad
dres
s 58
190
1185
4 50
090
1079
2 22
919
7494
32
746
1531
14
5 19
5761
Sam
e SL
A
2402
4 39
67
1431
2 27
41
8739
30
74
2568
12
6 17
59
568
N
SW
2379
9 96
8 35
16
297
331
186
206
461
24
2978
8 59
89
Vic
642
5530
51
8 19
1 18
4 16
0 99
20
0
7344
Qld
21
13
562
3019
3 29
1 39
3 19
5 61
8 15
1 3
3451
9
SA
199
219
249
5195
17
0 55
35
2 22
0
6461
WA
23
7 19
0 40
7 24
9 12
128
83
530
27
0 13
851
Ta
s 12
1 18
7 25
3 52
91
26
68
35
18
0 34
25
N
T 23
9 16
5 83
3 46
1 44
1 33
61
26
44
0 83
42
AC
T 34
4 64
18
7 26
28
18
44
76
3 3
1477
Oth
er T
errit
orie
s 37
0
0 0
6 0
0 0
0 43
Ove
rsea
s 28
3 16
1 32
0 28
93
34
22
22
0
963
N
ot s
tate
d 12
86
360
1544
29
2 73
9 11
3 33
4 25
0
4693
Not
sta
ted
9771
23
31
8697
19
65
5488
77
4 39
72
215
10
3322
3
Tota
l 12
1285
26
558
1111
19
2258
0 51
750
1488
7 47
652
3425
20
2 39
9458
Tota
l Arr
ival
s 42
15
-1
774
Net
Mig
ratio
n pe
r yea
r
-3
55
(a) I
nclu
des
pers
ons
who
sta
ted
that
they
live
d at
a d
iffer
ent a
ddre
ss 5
yea
rs a
go b
ut d
id n
ot s
tate
that
add
ress
. (b
) Inc
lude
s pe
rson
s w
ho d
id n
ot s
tate
whe
ther
they
wer
e us
ually
resi
dent
at a
diff
eren
t add
ress
5 y
ears
ago
.
Cel
ls in
this
tabl
e ha
ve b
een
rand
omly
adj
uste
d to
avo
id th
e re
leas
e of
con
fiden
tial d
ata.
NSW Department of Aboriginal Affairs Aboriginal Population Projections, NSW, 2006-2021 7
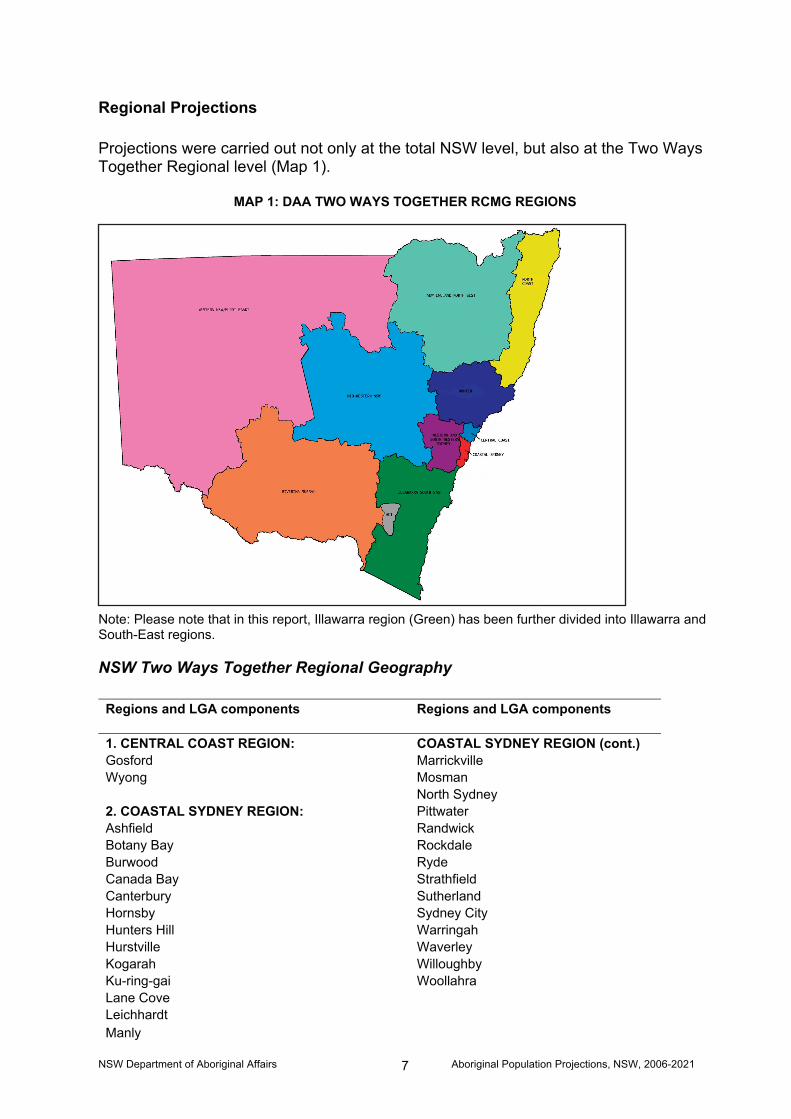
Regional Projections Projections were carried out not only at the total NSW level, but also at the Two Ways Together Regional level (Map 1).
MAP 1: DAA TWO WAYS TOGETHER RCMG REGIONS
Note: Please note that in this report, Illawarra region (Green) has been further divided into Illawarra and South-East regions.
NSW Two Ways Together Regional Geography Regions and LGA components Regions and LGA components 1. CENTRAL COAST REGION: COASTAL SYDNEY REGION (cont.) Gosford Marrickville Wyong Mosman North Sydney 2. COASTAL SYDNEY REGION: Pittwater Ashfield Randwick Botany Bay Rockdale Burwood Ryde Canada Bay Strathfield Canterbury Sutherland Hornsby Sydney City Hunters Hill Warringah Hurstville Waverley Kogarah Willoughby Ku-ring-gai Woollahra Lane Cove Leichhardt
NSW Department of Aboriginal Affairs Aboriginal Population Projections, NSW, 2006-2021 8
Manly 3. HUNTER REGION: RIVERINA-MURRAY REGION (cont.) Cessnock Murray Dungog Murrumbidgee Gloucester Narrandera Great Lakes Temora Lake Macquarie Tumbarumba Maitland Tumut Muswellbrook Urana Newcastle Wagga Wagga Port Stephens Wakool Singleton Upper Hunter 7. NORTH COAST REGION: Ballina 4. ILLAWARRA REGION: Bellingen Kiama Byron Shellharbour Clarence Valley Shoalhaven Coffs Harbour Wingcarribee Greater Taree Wollongong Kempsey Kyogle 5. SOUTH EAST REGION: Lismore Bega Valley Nambucca Bombala Port Macquarie-Hastings Boorowa Richmond Valley Cooma-Monaro Tweed Eurobodalla
Goulburn Mulwaree 8. NEW ENGLAND / NORTHWEST REGION:
Harden Armidale Dumaresq Palerang Glen Innes Severn Queanbeyan Gunnedah Snowy River Guyra Upper Lachlan Gwydir Yass Valley Inverell Young Liverpool Plains Moree Plains 6. RIVERINA-MURRAY REGION: Narrabri Albury Tamworth Regional Balranald Tenterfield Berrigan Uralla Bland Walcha Carrathool Conargo 9. WESTERN NSW REGION: Coolamon Bourke Cootamundra Brewarrina Corowa Broken Hill Deniliquin Central Darling Greater Hume Cobar Griffith Coonamble Gundagai Unincorporated Area Hay Walgett Jerilderie Wentworth Junee Leeton Lockhart

NSW Department of Aboriginal Affairs Aboriginal Population Projections, NSW, 2006-2021 9
10. WESTERN AND SOUTH WESTERN SYDNEY REGION:
11. MID-WESTERN REGION:
Auburn Bathurst Regional Bankstown Blayney Baulkham Hills Bogan Blacktown Cabonne Blue Mountains Cowra Camden Dubbo Campbelltown Forbes Fairfield Gilgandra Hawkesbury Lachlan Holroyd Lithgow Liverpool Mid-Western Regional Parramatta Narromine Penrith Oberon Wollondilly Orange Parkes Warren Warrumbungle Weddin Wellington
In order to carry out projections at regional levels the following data and assumptions were applied:
1. As discussed before, the 2006 Census “Place of Usual Residence” data adjusted by NSW Estimates of Resident Population at 30 June 2006 by age and sex were used as the basis of the population estimates at regional levels.
2. Assumptions regarding fertility and mortality at the total NSW level were applied
at regional level projections.
3. Migration data at these geographic levels are based the census question about place of usual residence 5 years ago. A cross-tabulation of the 2006 census place of usual residence data with place of usual residence 5 years ago was obtained for each region and from these cross-tabulations number of net migration for each region was estimated (Table 4).
4. Wherever there is a reference to migration in the regional projections, they also
include paternal fertility which is treated as a special type of population influx. State level paternal fertility data were pro-rata adjusted at regional levels.

NS
W D
epar
tmen
t of A
borig
inal
Affa
irs
Abo
rigin
al P
opul
atio
n P
roje
ctio
ns, N
SW
, 200
6-20
21
10
TA
BLE
4: N
SW A
BO
RIG
INA
L PO
PULA
TIO
N M
IGR
ATI
ON
AN
ALY
SIS
BY
TWT
REG
ION
S
REG
ION
S
5 ye
ar
In-
Mig
rant
s
5 ye
ar
Out
-M
igra
nts
Net
-M
igra
tion
REG
ION
S
Usu
al
Res
iden
t of
Sam
e R
egio
n 20
01
Usu
al
Res
iden
t O
ther
R
egio
n in
N
SW 2
001
Usu
al
Res
iden
t O
ther
St
ate
2001
To
tal I
n-M
igra
nts
Usu
al
Res
iden
t 20
01 N
ot
Stat
ed
Tota
l Pop
n fiv
e ye
ars
of
age
and
over
200
6
Usu
al
Res
iden
t of
Sub
ject
R
egio
n in
20
01
Livi
ng
othe
r NSW
re
gion
s in
20
06
Usu
al
Res
iden
t of
Su
bjec
t R
egio
n in
20
01
Livi
ng
othe
r St
ates
20
06
Tota
l O
ut-
Mig
rant
s
2001
to
2006
five
ye
ar N
et-
Mig
ratio
n
Ann
ual
Net
M
igra
tion
Adj
A
nnua
l N
et
Mig
ratio
n (%
) C
entra
l Coa
st
4256
.0
841.
0 14
7.0
988.
0 36
6.0
6598
.0
535.
0 17
7.0
712.
0 27
6.0
55.2
54
.6
0.15
C
oast
al S
ydne
y
7513
.0
1144
.0
434.
0 15
78.0
93
2.0
1160
1.0
1267
.0
544.
0 18
11.0
-2
33.0
-4
6.6
-46.
1 -0
.13
Hun
ter
1056
9.0
1422
.0
312.
0 17
34.0
99
7.0
1503
4.0
1007
.0
459.
0 14
66.0
26
8.0
53.6
53
.0
0.15
Ill
awar
ra
6003
.0
718.
0 20
0.0
918.
0 53
8.0
8377
.0
667.
0 31
6.0
983.
0 -6
5.0
-13.
0 -1
2.9
-0.0
4 S
outh
Eas
t 31
36.0
52
4.0
277.
0 80
1.0
403.
0 51
41.0
41
9.0
280.
0 69
9.0
102.
0 20
.4
20.2
0.
06
Mid
-Wes
tern
NS
W
1095
1.0
1347
.0
260.
0 16
07.0
13
61.0
15
526.
0 15
11.0
52
5.0
2036
.0
-429
.0
-85.
8 -8
4.9
-0.2
4 N
ew E
ngla
nd/N
orth
wes
t 92
69.0
95
8.0
383.
0 13
41.0
10
13.0
12
964.
0 96
4.0
656.
0 16
20.0
-2
79.0
-5
5.8
-55.
2 -0
.16
Nor
th C
oast
12
649.
0 15
89.0
72
5.0
2314
.0
1726
.0
1900
3.0
1113
.0
905.
0 20
18.0
29
6.0
59.2
58
.6
0.17
R
iver
ina-
Mur
ray
53
80.0
59
5.0
478.
0 10
73.0
74
2.0
8268
.0
544.
0 54
0.0
1084
.0
-11.
0 -2
.2
-2.2
-0
.01
Wes
tern
NS
W
5776
.0
472.
0 22
7.0
699.
0 61
4.0
7788
.0
859.
0 36
8.0
1227
.0
-528
.0
-105
.6
-104
.5
-0.2
9 W
este
rn a
nd S
outh
Wes
t S
ydne
y
1787
8.0
1559
.0
459.
0 20
18.0
23
09.0
24
223.
0 22
83.0
92
5.0
3208
.0
-119
0.0
-238
.0
-235
.5
-0.6
6 N
SW
9239
0.5
1116
9.0
3902
.0
1507
1.0
1100
1.0
1345
23.0
11
169.
0 56
95.0
16
864.
0 -1
793.
0 -3
58.6
-3
54.8
1.
00
NSW
Adj
uste
d 91
411.
4 11
050.
6 38
60.7
14
911.
3 10
884.
4 13
3097
.5
1105
0.6
5634
.7
1668
5.3
-177
4.0
-358
.6
1.
00

NSW Department of Aboriginal Affairs Aboriginal Population Projections, NSW, 2006-2021 11
PROJECTION RESULTS STATE LEVEL
Population Size, Vital Rates and Change Table 5 presents a summary of projection indicators. It shows that the total Aboriginal population of NSW will grow from 152,685 in 2006 to 210,659 in 2021, implying an average annual growth rate of 2.1 percent per year during the next 15 years. In comparison, the annual growth rate of the total NSW population in 2006 was estimated to have been 0.9 percent (ABS, March 2007, Cat. No. 2914.0.55.002). TABLE 5: SUMMARY INDICATORS, ABORIGINAL POPULATION PROJECTIONS BY SEX,
2006 TO 2021, NSW Absolute Numbers Annual Vital Rates (per 1000) Males Females Total Males Females Total 2006 Population 76,229 76,456 152,685 2006 Births 1,564 1,444 3,008 20.5 18.9 19.7 2006 Deaths 368 289 657 4.8 3.8 4.3 2006 Migrants(1) 416 463 879 5.5 6.1 5.8 2006 Growth 1,612 1,618 3,230 21.1 21.2 21.2 2006 Median Age 19.7 21.7 20.6 2006 Sex Ratio 99.7
2009 Population 81,312 81,559 162,871 2009 Births 1,710 1,584 3,294 21.3 19.6 20.4 2009 Deaths 389 305 694 4.8 3.8 4.3 2009 Migrants(1) 416 463 879 5.2 5.7 5.5 2009 Growth 1,738 1,741 3,479 21.6 21.6 21.6 2009 Median Age 20.3 22.0 21.1 2009 Sex Ratio 99.7
2011 Population 84,924 85,172 170,096 2011 Births 1,824 1,689 3,514 21.7 20.1 20.9 2011 Deaths 412 325 736 4.9 3.9 4.4 2011 Migrants(1) 416 463 879 5.0 5.5 5.2 2011 Growth 1,829 1,828 3,656 21.8 21.7 21.7 2011 Median Age 20.8 22.0 21.1 2011 Sex Ratio 99.7
2016 Population 94,678 94,901 189,580 2016 Births 2,094 1,939 4,033 22.4 20.7 21.5 2016 Deaths 487 386 873 5.2 4.1 4.7 2016 Migrants(1) 416 463 879 4.4 4.9 4.7 2016 Growth 2,023 2,016 4,039 21.6 21.5 21.5 2016 Median Age 21.9 23.1 22.5 2016 Sex Ratio 99.8
2021 Population 105,244 105,415 210,659 2021 Births 2,339 2,165 4,504 22.5 20.8 21.6 2021 Deaths 580 467 1,048 5.6 4.5 5.0 2021 Migrants(1) 416 463 879 4.0 4.4 4.2 2021 Growth 2,174 2,161 4,335 20.9 20.7 20.8 2021 Median Age 22.7 24.0 23.3 2021 Sex Ratio 99.8
2006-2021
Average Annual Growth Rate
2.2% 2.1% 2.1% (1) Migrants include net inter-state migration and parental fertility, Aboriginal births to non-Aboriginal mothers.

NSW Department of Aboriginal Affairs Aboriginal Population Projections, NSW, 2006-2021 12
Table 5 also shows that, the annual birth rate of the NSW Aboriginal population in 2006 is estimated at almost 20 per 1000 population. As a result of these projections, this rate is estimated at almost 22 per 1000 in 2021. A constant fertility rate of 2.61 has been assumed during these projections with age-specific fertility rates for Aboriginal women of child bearing ages. The change in the annual birth rate of the population is mainly due to the changes in age structure of the Aboriginal population. Until the release of a Discussion Paper by ABS on methods of calculating life expectancies for Aboriginal people (ABS: 17 Nov 2008, 3302.0.55.005) which indicates that the Aboriginal mortality is not as high as it was believed to be, the annual death rate of the NSW Aboriginal population in 2006 was estimated at around 8 per 1000 population. However, assuming the recent estimates of life expectancies by ABS are correct, the death rate of the Aboriginal population in NSW in 2006 is estimated at 4.3 per 1000 population, almost half the previous estimates. A constant mortality regime has been assumed during these projections. The change in the annual death rates of the population, as depicted in Table 5, is mainly due to the changes in age structure of the Aboriginal population as more people move into the ages with higher mortality rates. Unless positive changes occur in Aboriginal mortality rates in future years, particularly at adult ages, the projections indicate that Aboriginal death rates will gradually increase from 4.3 per 1000 in year 2006 to 5.0 per 1000 in year 2021. The impact of reduced mortality estimates is pronounced in higher population growth rates right from the starting year of the projection period. Constant levels of fertility combined with reduced death rates resulted in a revised estimate of the base year’s average annual rate of population growth from 1.6 percent to 2.1 percent for year 2006. Projection outcomes show that, the rate of annual population growth seems to be increasing, from 2.12 percent in 2006 to 2.18 percent in 2013 and then will start to decrease to 2.08 percent in year 2021 (Chart 1).
As a result, Aboriginal population doubling time will be reduced from an estimated 33 years in 2006 to 32 years in 2013 and then will increase to almost 34 years in the year
2006 2008 2010 2012 2014 2016 2018 2020
2.02 2.04 2.06 2.08
2.1 2.12 2.14 2.16 2.18
Chart 1: Projected Annual Aboriginal PopulationGrowth Rates (%), NSW 2006-2021

NSW Department of Aboriginal Affairs Aboriginal Population Projections, NSW, 2006-2021 13
2021. In comparison, population doubling time of the total NSW population in 2006 was 78 years.
Age Structure Projection results indicate a slow maturing process for the Aboriginal age structure in NSW. Table 7 shows that over 38 percent of the NSW Aboriginal population are currently in the age category of “under 15 years”. There are more males than females aged 29 years or less and fewer males than females aged 30 years or more. This has resulted in the male Aboriginal population having a median age of 16 compared to 20 years for females. Over the next 15 years, a high proportion of the younger group will survive to the higher ages. As a result, with constant assumptions of fertility levels, the proportion of those below the age of 15 years will decrease to 34 percent while the proportion of those 15 to 29 years will grow from 25 percent in 2006 to 28 percent in 2021. Similarly, the proportion of the population aged 60 years and over will increase from 5 percent to 8 percent. Furthermore, with the continuation of high fertility levels, the Aboriginal population of NSW will remain a relatively young population with two years increase in median age of the population from 20.6 years in 2006 to 23.3 years in 2021. Changes in the age structure of the Aboriginal population will likely to have considerable implications on new demands for health services. TABLE 6: CHANGES IN AGE COMPOSITION, 2006 & 2021
Broad 2006 2006 2006 2021 2021 2021 Age Groups Males Females Total Males Females Total
Population Numbers 0-14 29,991 28,366 58,357 36,480 34,924 71,404 15-29 19,961 18,935 38,896 30,374 29,039 59,412 30-59 22,510 24,747 47,257 31,181 32,468 63,649 60+ 3,767 4,408 8,175 7,209 8,984 16,194
All Ages 76,229 76,456 152,685 105,244 105,415 210,659 Percent Distribution 0-14 39% 37% 38% 35% 33% 34% 15-29 26% 25% 25% 29% 28% 28% 30-59 30% 32% 31% 30% 31% 30% 60+ 5% 6% 5% 7% 9% 8%
All Ages 100% 100% 100% 100% 100% 100% Median Age 19.7 21.7 20.6 22.7 24.0 23.3
The above changes in the NSW Aboriginal population age structure are graphically depicted in the Age Pyramids in Chart 2 and Chart 3.

NSW Department of Aboriginal Affairs Aboriginal Population Projections, NSW, 2006-2021 14
Chart 2 shows that Aboriginal fertility started increasing about 25 years ago and has been constant at a high level for the last 15 years. Chart 2 also shows that not many Aboriginal people have survived to ages over 60 years.
CHART 2
Males Females
In comparison, Chart 3 shows that in year 2021, as a result of high Aboriginal fertility during the last 25 years, the proportion of those aged 25-39 years will increase, and improved survival chances will result in higher proportions of people in aged categories. CHART 3
Males Females
Detailed projection results by single and five years of age and sex are presented in Appendices to this report.
Aboriginal Population, NSW, 2006Age Groups
80+ 75-79 70-74 65-69 60-64 55-59 50-54 45-49 40-44 35-39 30-34 25-29 20-24 15-19 10-14
0-4 5-9
Aboriginal Population, NSW, 2021
80+ 75-79 70-74 65-69 60-64 55-59 50-54 45-49 40-44 35-39 30-34 25-29 20-24 15-19 10-14
0-45-9
Age Groups

NSW Department of Aboriginal Affairs Aboriginal Population Projections, NSW, 2006-2021 15
Sex Composition It was assumed that the observed 2006 sex ratio of birth of 108 males per 100 females will continue into the future. However, the overall population sex ratio of the Aboriginal population will remain very balanced - the sex ratio of almost 100 males per 100 females in 2006 will remain so in 2021 as well. Not withstanding the overall balanced sex ratios, considerable differences exist in sex composition of the population by various age groups (Chart 4). With high sex ratios of 106 and 105 there are more male children under the age of 15 in year 2006 as well as the projected year 2021. However, there are and will be more females in older ages. It appears that sex ratios steadily decrease to 85 and 80 for the age group 60 years and over. Either more males out-migrate or more females survive to older ages. Perhaps a combination of the two factors is in process.
0
20
40
60
80
100
120
Males to 100 Fem
ales
0-14 15-29 30-59 60+Broad Age groups
Chart 4: NSW Indigenous Population Projections, Sex Ratios, 2006 and 2021
Sex Ratios 2006 Sex Ratios 2021

NSW Department of Aboriginal Affairs Aboriginal Population Projections, NSW, 2006-2021 16
REGIONAL PROJECTIONS
Regional Summary A summary of the regional level projections is presented in Table 7 bellow. The table shows that in 2021 about 18 percent of Aboriginal people in NSW will be residing in Western and South-West Sydney metropolitan region, followed by 14.5 percent in the North Coast and 12 percent in the Hunter regions. With 3.6 percent, the South-East region will have the smallest share of the Aboriginal population. Table 7 also shows regional population gains and losses over the next 15 years. Projections show a clear movement of Aboriginal people to coastal regions. With 3 percent average annual growth rate, Central Coast Region is the fastest growing region followed by Illawarra Region with 2.7 percent, Hunter Region with 2.6 percent and North coast Region with 2.4 percent average annual growth rates during the next 15 years. It appears that Hunter region will increase its share of the Aboriginal population by 0.8 percent followed by Central Coast by 0.6 percent and Illawarra and North Coast regions by 0.5 percent each. The biggest loss, on the other hand, appears to be in the region with the largest share of the Aboriginal population, Western and South-West Sydney (- 0.7 percent) followed by Mid-Western NSW Region (-0.5 percent) and New England North-West Region (-0.4percent). TABLE 7: ABORIGINAL POPULATION PROJECTIONS 2006-2021, TWT REGIONAL UMMARY
TWT REGIONS
2006
2009
2011
2016
2021
% NSW 2006
% NSW 2021
Change in
State's Share
Average Annual Growth
Rate 1. CENTRAL COAST REGION Male 3,574 3,923 4,172 4,847 5,581 4.7% 5.3% 0.6% 3.0% Female 3,556 3,909 3,909 4,840 5,580 4.7% 5.3% 0.6% 3.0% Total 7,130 7,831 8,331 9,687 11,161 4.7% 5.3% 0.6% 3.0% 2. COASTAL SYDNEY REGION Males 6,318 6,726 6,994 7,633 8,223 8.3% 7.8% -0.5% 1.8% Females 6,270 6,676 6,676 7,598 8,205 8.2% 7.8% -0.4% 1.8% Total 12,588 13,402 13,940 15,231 16,428 8.2% 7.8% -0.4% 1.8% 3. HUNTER REGION Males 8,481 9,183 9,685 11,046 12,526 11.1% 11.9% 0.8% 2.6% Females 8,484 9,194 9,194 11,060 12,536 11.1% 11.9% 0.8% 2.6% Total 16,965 18,377 19,384 22,107 25,062 11.1% 11.9% 0.8% 2.6% 4. ILLAWARRA REGION Males 4,725 5,141 5,435 6,226 7,081 6.2% 6.7% 0.5% 2.7% Females 4,758 5,178 5,178 6,262 7,115 6.2% 6.7% 0.5% 2.7% Total 9,483 10,319 10,909 12,488 14,196 6.2% 6.7% 0.5% 2.7% 5. MID-WESTERN NSW REGION Males 8,987 9,459 9,805 10,778 11,857 11.8% 11.3% -0.5% 1.8% Females 8,835 9,317 9,317 10,637 11,706 11.6% 11.1% -0.5% 1.9% Total 17,822 18,776 19,473 21,415 23,563 11.7% 11.2% -0.5% 1.9%

NSW Department of Aboriginal Affairs Aboriginal Population Projections, NSW, 2006-2021 17
TWT REGIONS
2006
2009
2011
2016
2021
% NSW 2006
% NSW 2021
Change in
State's Share
Average Annual Growth
Rate 6. NEW ENGLAND NW REGION Males 7,436 8,151 8,151 8,981 9,906 9.8% 9.4% -0.3% 1.9% Females 7,587 7,995 7,995 9,104 10,013 9.9% 9.5% -0.4% 1.8% Total 15,023 15,846 16,440 18,085 19,919 9.8% 9.5% -0.4% 1.9% 7. NORTH COAST REGION Males 10,652 11,431 11,991 13,539 15,268 14.0% 14.5% 0.5% 2.4% Females 10,753 11,539 12,100 13,644 15,362 14.1% 14.6% 0.5% 2.4% Total 21,405 22,970 24,091 27,183 30,630 14.0% 14.5% 0.5% 2.4% 8. RIVERINA-MURRAY REGION Males 4,634 4,915 5,118 5,682 6,316 6.1% 6.0% -0.1% 2.1% Females 4,589 4,868 5,069 5,626 6,250 6.0% 5.9% -0.1% 2.1% Total 9,223 9,783 10,187 11,308 12,565 6.0% 6.0% -0.1% 2.1% 9. SOUTH-EAST REGION Males 2,875 3,043 3,161 3,490 3,863 3.8% 3.7% -0.1% 2.0% Females 2,700 2,870 2,870 3,326 3,704 3.5% 3.5% 0.0% 2.1% Total 5,575 5,913 6,153 6,816 7,568 3.7% 3.6% -0.1% 2.0% 10. WESTERN AND SOUTH-WEST SYDNEY REGION Males 14,410 15,140 15,689 17,251 18,991 18.9% 18.0% -0.9% 1.8% Females 14,040 14,822 14,822 16,998 18,772 18.4% 17.8% -0.6% 1.9% Total 28,450 29,962 31,084 34,248 37,763 18.6% 17.9% -0.7% 1.9% 11. WESTERN NSW REGION Males 4,505 4,784 4,986 5,548 6,164 5.9% 5.9% -0.1% 2.1% Females 4,515 4,756 4,756 5,431 5,989 5.9% 5.7% -0.2% 1.9% Total 9,020 9,540 9,919 10,979 12,153 5.9% 5.8% -0.1% 2.0% NSW (1) Males 76,229 81,312 84,924 94,678 105,244 100.0% 100.0% 0.0% 2.2% Females 76,456 81,559 85,172 94,901 105,415 100.0% 100.0% 0.0% 2.1% Total 152,685 162,871 170,096 189,580 210,659 100.0% 100.0% 0.0% 2.1% (1) Total NSW may not add to the sum of the regions as it also includes data for Not Further Defined (NFD) areas including any unincorporated areas.
NSW Department of Aboriginal Affairs Aboriginal Population Projections, NSW, 2006-2021 18
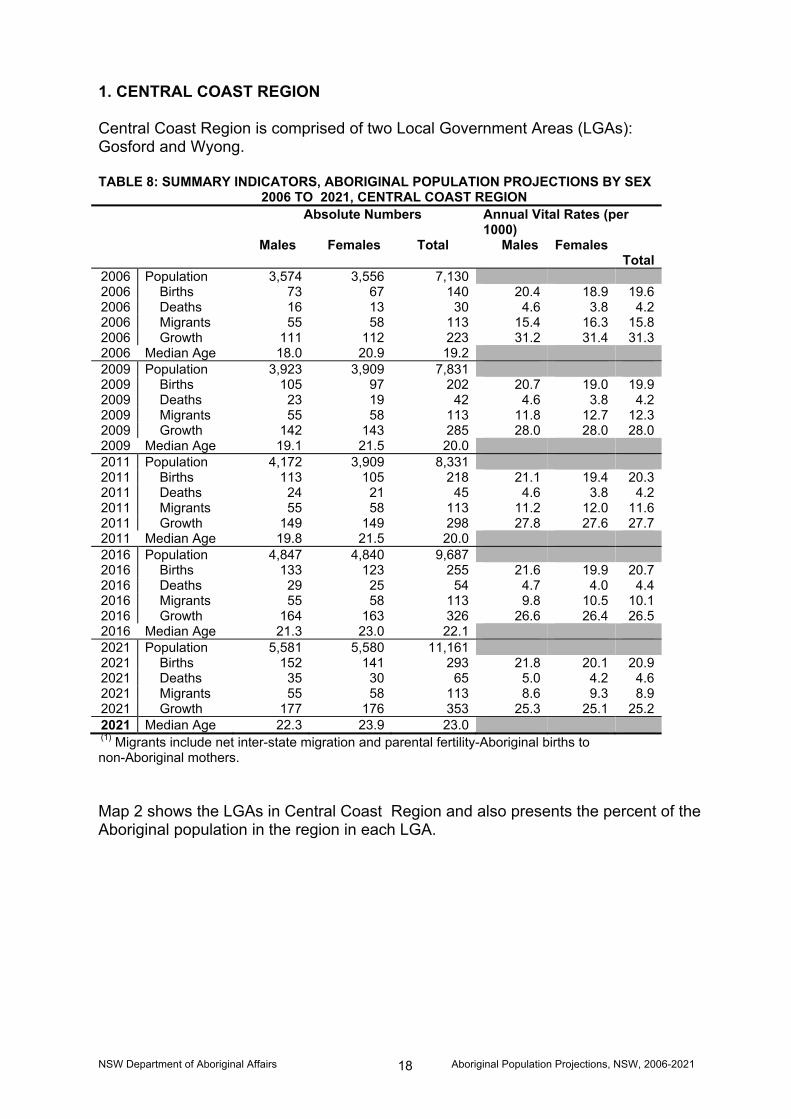
1. CENTRAL COAST REGION Central Coast Region is comprised of two Local Government Areas (LGAs): Gosford and Wyong. TABLE 8: SUMMARY INDICATORS, ABORIGINAL POPULATION PROJECTIONS BY SEX 2006 TO 2021, CENTRAL COAST REGION Absolute Numbers Annual Vital Rates (per
1000) Males Females Total Males Females
Total2006 Population 3,574 3,556 7,130 2006 Births 73 67 140 20.4 18.9 19.62006 Deaths 16 13 30 4.6 3.8 4.22006 Migrants 55 58 113 15.4 16.3 15.82006 Growth 111 112 223 31.2 31.4 31.32006 Median Age 18.0 20.9 19.2 2009 Population 3,923 3,909 7,831 2009 Births 105 97 202 20.7 19.0 19.92009 Deaths 23 19 42 4.6 3.8 4.22009 Migrants 55 58 113 11.8 12.7 12.32009 Growth 142 143 285 28.0 28.0 28.02009 Median Age 19.1 21.5 20.0 2011 Population 4,172 3,909 8,331 2011 Births 113 105 218 21.1 19.4 20.32011 Deaths 24 21 45 4.6 3.8 4.22011 Migrants 55 58 113 11.2 12.0 11.62011 Growth 149 149 298 27.8 27.6 27.72011 Median Age 19.8 21.5 20.0 2016 Population 4,847 4,840 9,687 2016 Births 133 123 255 21.6 19.9 20.72016 Deaths 29 25 54 4.7 4.0 4.42016 Migrants 55 58 113 9.8 10.5 10.12016 Growth 164 163 326 26.6 26.4 26.52016 Median Age 21.3 23.0 22.1 2021 Population 5,581 5,580 11,161 2021 Births 152 141 293 21.8 20.1 20.92021 Deaths 35 30 65 5.0 4.2 4.62021 Migrants 55 58 113 8.6 9.3 8.92021 Growth 177 176 353 25.3 25.1 25.22021 Median Age 22.3 23.9 23.0
(1) Migrants include net inter-state migration and parental fertility-Aboriginal births to non-Aboriginal mothers. Map 2 shows the LGAs in Central Coast Region and also presents the percent of the Aboriginal population in the region in each LGA.

NSW Department of Aboriginal Affairs Aboriginal Population Projections, NSW, 2006-2021 19
MAP 2: CENTRAL COAST REGION
NSW Department of Aboriginal Affairs Aboriginal Population Projections, NSW, 2006-2021 19
MAP 2: CENTRAL COAST REGION
Local Government Area (LGA) by Indigenous Status (INGP)Counting: Persons, Place of Usual ResidenceAboriginal in Local Government AreasData Source: 2006 Census of Population and Housing
Key:

NSW Department of Aboriginal Affairs Aboriginal Population Projections, NSW, 2006-2021 20
PROJECTED POPULATION AGE PYRAMIDS - CENTRAL COAST REGION
Males Females
5 Year Age Groups (see data Appendix 2)
Indigenous Population Projection, NSW Central Coast, 2021A
ge-G
roup
s
18
16
14
12
10
8
6
4
2
0
Indigenous Population Projection, NSW Central Coast 2016
Age
-Gro
ups
18
16
14
12
10
8
6
4
2
0
Indigenous Population Projection, NSW Central Coast, 2011
Age
-Gro
ups
18
16
14
12
10
8
6
4
2
0
Indigenous Population, NSW Central Coast Region, 2006
Age
Gro
ups
18
16
14
12
10
8
6
4
2
0

NSW Department of Aboriginal Affairs Aboriginal Population Projections, NSW, 2006-2021 21
2. COASTAL SYDNEY REGION Coastal Sydney Region is comprised of the following LGAs: Ashfield, Botany Bay, Burwood, Canada Bay, Canterbury, Hornsby, Hunters Hill, Hurstville, Kogarah, Ku-ring-gai, Lane Cove, Leichhardt, Manly, Marrickville, Mosman, North Sydney, Pittwater, Randwick, Rockdale, Ryde, Strathfield, Sutherland, Sydney City, Warringah, Waverley, Willoughby and Woollahra. TABLE 9: SUMMARY INDICATORS, ABORIGINAL POPULATION PROJECTIONS BY SEX 2006 TO 2021, COASTAL SYDNEY REGION
Projection Absolute Numbers Annual Vital Rates
(per 1000) Year Indices Males Females Total Males Females Total
2006 Population 6,318 6,270 12,588 2006 Births 148 137 285 23.5 21.8 22.7 2006 Deaths 29 24 52 4.6 3.8 4.2 2006 Migrants(1) 26 30 56 4.1 4.8 4.4 2006 Growth 146 143 289 23.0 22.9 22.9 2006 Median Age 25.7 27.9 26.8 2009 Population 6,726 6,676 13,402 2009 Births 105 97 202 20.7 19.0 19.9 2009 Deaths 23 19 42 4.6 3.8 4.2 2009 Migrants(1) 26 30 56 11.8 12.7 12.3 2009 Growth 142 143 285 28.0 28.0 28.0 2009 Median Age 25.7 27.9 26.8 2011 Population 6,994 6,676 13,940 2011 Births 113 105 218 21.1 19.4 20.3 2011 Deaths 24 21 45 4.6 3.8 4.2 2011 Migrants(1) 26 30 56 11.2 12.0 11.6 2011 Growth 149 149 298 27.8 27.6 27.7 2011 Median Age 25.8 27.9 26.8 2016 Population 7,633 7,598 15,231 2016 Births 133 123 255 21.6 19.9 20.7 2016 Deaths 29 25 54 4.7 4.0 4.4 2016 Migrants(1) 26 30 56 9.8 10.5 10.1 2016 Growth 164 163 326 26.6 26.4 26.5 2016 Median Age 26.1 28.0 27.0 2021 Population 8,223 8,205 16,428 2021 Births 152 141 293 21.8 20.1 20.9 2021 Deaths 35 30 65 5.0 4.2 4.6 2021 Migrants(1) 26 30 56 8.6 9.3 8.9 2021 Growth 177 176 353 25.3 25.1 25.2 2021 Median Age 26.1 27.6 26.8
(1) Migrants include net inter-state migration and parental fertility - Aboriginal births to non-Aboriginal mothers.
Map 3 shows LGA components of Coastal Sydney Region and also the percent of the Aboriginal people in the region in each LGA.

NSW Department of Aboriginal Affairs Aboriginal Population Projections, NSW, 2006-2021 22
MAP 3: COASTAL SYDNEY REGION
NSW Department of Aboriginal Affairs Aboriginal Population Projections, NSW, 2006-2021 22
MAP 3: COASTAL SYDNEY REGION
Local Government Area (LGA) by Indigenous Status (INGP) and usual address indicatorCounting: Persons, Place of Usual ResidenceNon-Indigenous: At home in Local Government AreasData Source: 2006 Census of Population and Housing

NSW Department of Aboriginal Affairs Aboriginal Population Projections, NSW, 2006-2021 23
PROJECTED POPULATION AGE PYRAMIDS – COASTAL SYDNEY REGION
Males Females
5 Year Age Groups (see data Appendix 3)
Indigenous Projections, Coastal Sydney Region, 2016Ag
e-G
roup
s18
16
14
12
10
8
6
4
2
0
Indigenous Projections, Coastal Sydney Region, 2016
Age-
Gro
ups
18
16
14
12
10
8
6
4
2
0
Indigenous Projections, Coastal Sydney region, 2011
Age-
Gro
ups
18
16
14
12
10
8
6
4
2
0
Indigenous Population, NSW Coastal Sydney Region, 2006
Age
-Gro
ups
18
16
14
12
10
8
6
4
2
0
NSW Department of Aboriginal Affairs Aboriginal Population Projections, NSW, 2006-2021 24
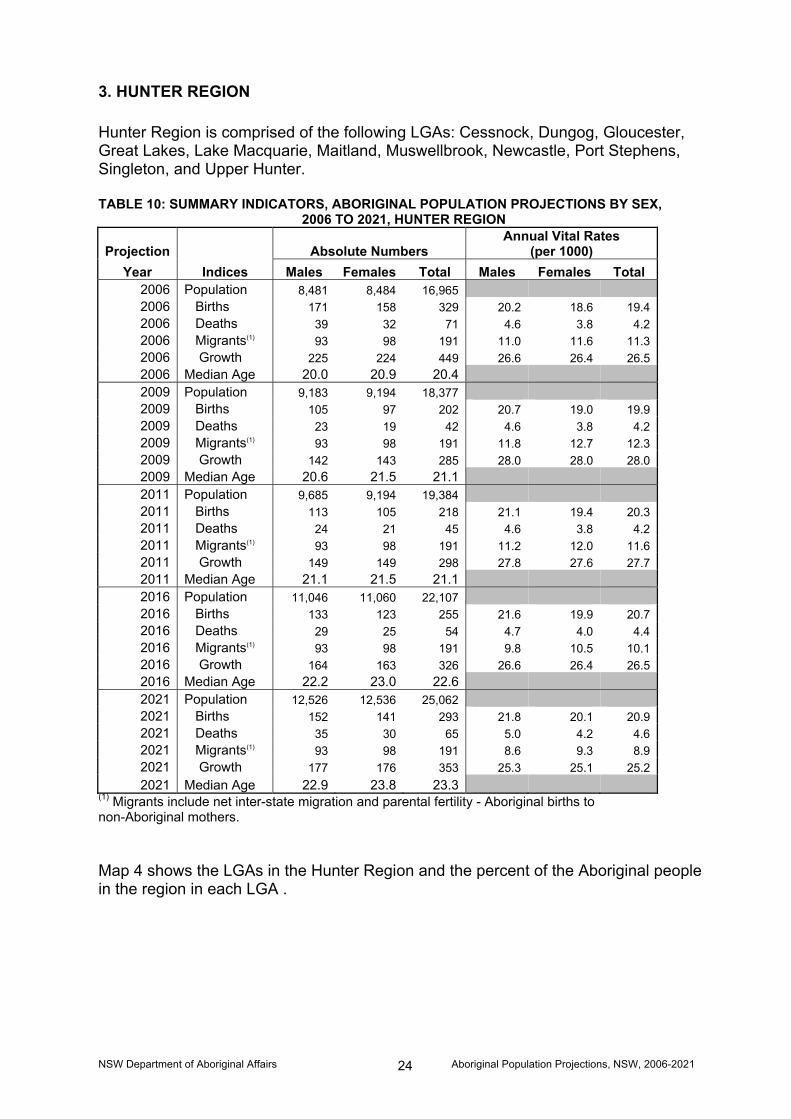
3. HUNTER REGION Hunter Region is comprised of the following LGAs: Cessnock, Dungog, Gloucester, Great Lakes, Lake Macquarie, Maitland, Muswellbrook, Newcastle, Port Stephens, Singleton, and Upper Hunter. TABLE 10: SUMMARY INDICATORS, ABORIGINAL POPULATION PROJECTIONS BY SEX,
2006 TO 2021, HUNTER REGION
Projection Absolute Numbers Annual Vital Rates
(per 1000) Year Indices Males Females Total Males Females Total
2006 Population 8,481 8,484 16,965 2006 Births 171 158 329 20.2 18.6 19.4 2006 Deaths 39 32 71 4.6 3.8 4.2 2006 Migrants(1) 93 98 191 11.0 11.6 11.3 2006 Growth 225 224 449 26.6 26.4 26.5 2006 Median Age 20.0 20.9 20.4 2009 Population 9,183 9,194 18,377 2009 Births 105 97 202 20.7 19.0 19.9 2009 Deaths 23 19 42 4.6 3.8 4.2 2009 Migrants(1) 93 98 191 11.8 12.7 12.3 2009 Growth 142 143 285 28.0 28.0 28.0 2009 Median Age 20.6 21.5 21.1 2011 Population 9,685 9,194 19,384 2011 Births 113 105 218 21.1 19.4 20.3 2011 Deaths 24 21 45 4.6 3.8 4.2 2011 Migrants(1) 93 98 191 11.2 12.0 11.6 2011 Growth 149 149 298 27.8 27.6 27.7 2011 Median Age 21.1 21.5 21.1 2016 Population 11,046 11,060 22,107 2016 Births 133 123 255 21.6 19.9 20.7 2016 Deaths 29 25 54 4.7 4.0 4.4 2016 Migrants(1) 93 98 191 9.8 10.5 10.1 2016 Growth 164 163 326 26.6 26.4 26.5 2016 Median Age 22.2 23.0 22.6 2021 Population 12,526 12,536 25,062 2021 Births 152 141 293 21.8 20.1 20.9 2021 Deaths 35 30 65 5.0 4.2 4.6 2021 Migrants(1) 93 98 191 8.6 9.3 8.9 2021 Growth 177 176 353 25.3 25.1 25.2 2021 Median Age 22.9 23.8 23.3
(1) Migrants include net inter-state migration and parental fertility - Aboriginal births to non-Aboriginal mothers. Map 4 shows the LGAs in the Hunter Region and the percent of the Aboriginal people in the region in each LGA .
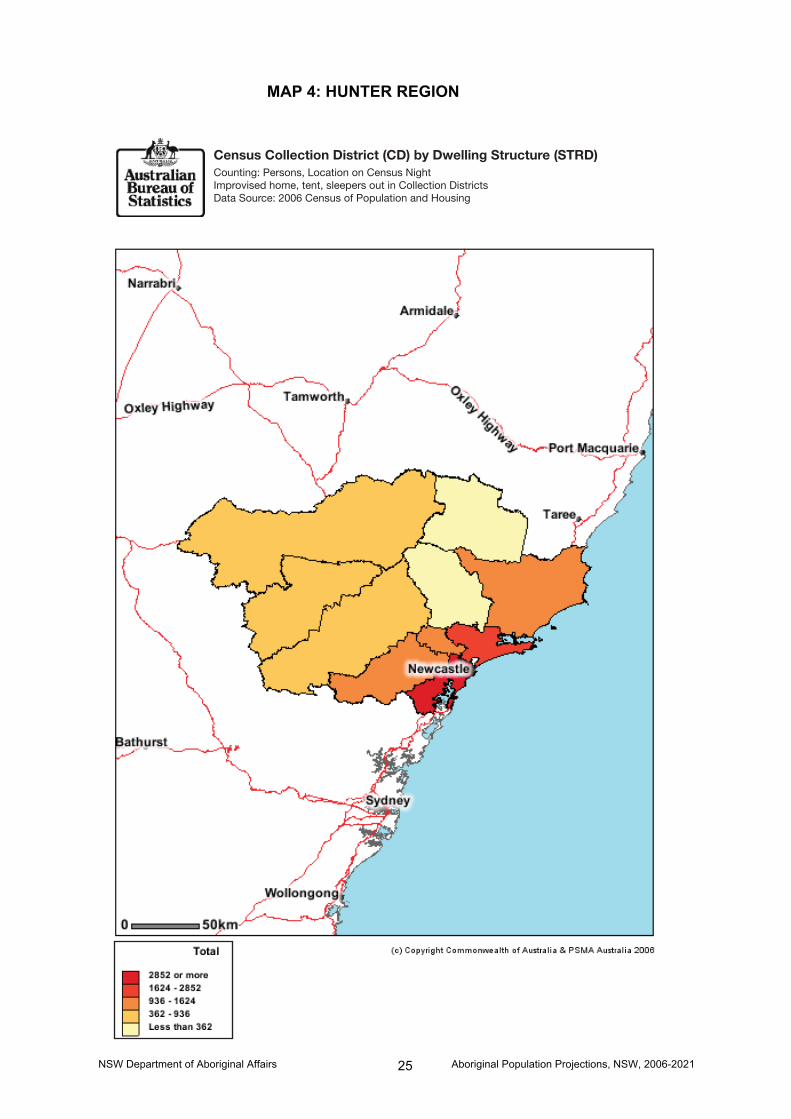
NSW Department of Aboriginal Affairs Aboriginal Population Projections, NSW, 2006-2021 25
MAP 4: HUNTER REGION
NSW Department of Aboriginal Affairs Aboriginal Population Projections, NSW, 2006-2021 25
MAP 4: HUNTER REGION
Census Collection District (CD) by Dwelling Structure (STRD)Counting: Persons, Location on Census NightImprovised home, tent, sleepers out in Collection DistrictsData Source: 2006 Census of Population and Housing

NSW Department of Aboriginal Affairs Aboriginal Population Projections, NSW, 2006-2021 26
PROJECTED POPULATION AGE PYRAMIDS – HUNTER REGION
Males Females
5 Year Age Groups (see data Appendix 4)
Indigenous Projections, NSW Hunter Region, 2021Ag
e-G
roup
s18
16
14
12
10
8
6
4
2
0
Indigenous Projections, NSW Hunter Region, 2016
Age-
Gro
ups
18
16
14
12
10
8
6
4
2
0
Indigenous Projections, NSW Hunter Region, 2011
Age
-Gro
ups
18
16
14
12
10
8
6
4
2
0
Indigenous Population, NSW Hunter Region, 2006
Age
-Gro
ups
18
16
14
12
10
8
6
4
2
0

NSW Department of Aboriginal Affairs Aboriginal Population Projections, NSW, 2006-2021 27
4. ILLAWARRA REGION Illawarra Region is comprised of the following LGAs: Kiama, Shellharbour, Shoalhaven, Wingcarribee and Wollongong. Note that Illawarra region is a sub-region of the Illawarra/South East Two Ways Together region. TABLE 11: SUMMARY INDICATORS, ABORIGINAL POPULATION PROJECTIONS BY SEX,
2006 TO 2021, ILLAWARRA REGION
Projection Absolute Numbers Annual Vital Rates
(per 1000) Year Indices Males Females Total Males Females Total
2006 Population 4,725 4,758 9,483 2006 Births 95 87 182 20.1 18.4 19.2 2006 Deaths 22 18 39 4.6 3.8 4.2 2006 Migrants(1) 60 65 125 12.7 13.7 13.2 2006 Growth 133 135 268 28.2 28.3 28.2 2006 Median Age 18.4 20.8 19.5 2009 Population 5,141 5,178 10,319 2009 Births 105 97 202 20.7 19.0 19.9 2009 Deaths 23 19 42 4.6 3.8 4.2 2009 Migrants(1) 60 65 125 11.8 12.7 12.3 2009 Growth 142 143 285 28.0 28.0 28.0 2009 Median Age 19.0 20.8 19.8 2011 Population 5,435 5,178 10,909 2011 Births 113 105 218 21.1 19.4 20.3 2011 Deaths 24 21 45 4.6 3.8 4.2 2011 Migrants(1) 60 65 125 11.2 12.0 11.6 2011 Growth 149 149 298 27.8 27.6 27.7 2011 Median Age 19.3 20.8 19.8 2016 Population 6,226 6,262 12,488 2016 Births 133 123 255 21.6 19.9 20.7 2016 Deaths 29 25 54 4.7 4.0 4.4 2016 Migrants(1) 60 65 125 9.8 10.5 10.1 2016 Growth 164 163 326 26.6 26.4 26.5 2016 Median Age 20.6 21.8 21.2 2021 Population 7,081 7,115 14,196 2021 Births 152 141 293 21.8 20.1 20.9 2021 Deaths 35 30 65 5.0 4.2 4.6 2021 Migrants(1) 60 65 125 8.6 9.3 8.9 2021 Growth 177 176 353 25.3 25.1 25.2 2021 Median Age 21.0 22.1 21.5
(1) Migrants include net inter-state migration and parental fertility - Aboriginal births to non-Aboriginal mothers. Map 5 shows the LGS in Illawarra Region and indicates the percent of the Aboriginal people in the region in each LGA.

NSW Department of Aboriginal Affairs Aboriginal Population Projections, NSW, 2006-2021 28
MAP 5: ILLAWARRA REGION
NSW Department of Aboriginal Affairs Aboriginal Population Projections, NSW, 2006-2021 28
MAP 5: ILLAWARRA REGION
Local Government Area (LGA) by Indigenous Status (INGP)Counting: Persons, Place of Usual ResidenceAboriginal in Local Government AreasData Source: 2006 Census of Population and Housing

NSW Department of Aboriginal Affairs Aboriginal Population Projections, NSW, 2006-2021 29
PROJECTED POPULATION AGE PYRAMIDS – ILLAWARRA REGION
Males Females
5 Year Age Groups (see data Appendix 5)
Indigenous Projections, Illawarra Region, 2016
Age-
Gro
ups
18
16
14
12
10
8
6
4
2
0
Indigenous Projections, Illawarra Region, 2011
Age-
Gro
ups
18
16
14
12
10
8
6
4
2
0
Indigenous projections, NSW Illawarra Region, 2021A
ge-G
roup
s18
16
14
12
10
8
6
4
2
0
Indigenous Population, NSW Illawarra Region, 2006A
ge-G
roup
s
18
16
14
12
10
8
6
4
2
0

NSW Department of Aboriginal Affairs Aboriginal Population Projections, NSW, 2006-2021 30
5. NEW ENGLAND NORTH-WEST REGION New England North-West Region is comprised of the following LGAs: Armidale Dumaresq, Glen Innes Severn, Gunnedah, Guyra, Gwydir, Inverell, Liverpool Plains, Moree Plains, Narrabri, Tamworth Regional, Tenterfield, Uralla, and Walcha. TABLE 12: SUMMARY INDICATORS, ABORIGINAL POPULATION PROJECTIONS BY SEX,
2006 TO 2021, NEW ENGLAND NORTH-WEST REGION
Projection Absolute Numbers Annual Vital Rates
(per 1000) Year Indices Males Females Total Males Females Total
2006 Population 7,436 7,587 15,023 2006 Births 150 139 289 20.2 18.3 19.3 2006 Deaths 34 29 63 4.6 3.8 4.2 2006 Migrants(1) 31 35 66 4.2 4.6 4.4 2006 Growth 148 145 293 19.8 19.1 19.5 2006 Median Age 19.1 21.1 19.9 2009 Population 7,851 7,995 15,846 2009 Births 105 97 202 20.7 19.0 19.9 2009 Deaths 23 19 42 4.6 3.8 4.2 2009 Migrants(1) 31 35 66 11.8 12.7 12.3 2009 Growth 142 143 285 28.0 28.0 28.0 2009 Median Age 19.9 21.7 20.7 2011 Population 8,151 7,995 16,440 2011 Births 113 105 218 21.1 19.4 20.3 2011 Deaths 24 21 45 4.6 3.8 4.2 2011 Migrants(1) 31 35 66 11.2 12.0 11.6 2011 Growth 149 149 298 27.8 27.6 27.7 2011 Median Age 20.5 21.7 20.7 2016 Population 8,981 9,104 18,085 2016 Births 133 123 255 21.6 19.9 20.7 2016 Deaths 29 25 54 4.7 4.0 4.4 2016 Migrants(1) 31 35 66 9.8 10.5 10.1 2016 Growth 164 163 326 26.6 26.4 26.5 2016 Median Age 22.1 23.5 22.8 2021 Population 9,906 10,013 19,919 2021 Births 152 141 293 21.8 20.1 20.9 2021 Deaths 35 30 65 5.0 4.2 4.6 2021 Migrants(1) 31 35 66 8.6 9.3 8.9 2021 Growth 177 176 353 25.3 25.1 25.2 2021 Median Age 23.3 24.9 24.1
(1) Migrants include net inter-state migration and parental fertility - Aboriginal births to non-Aboriginal mothers.
Map 6 shows the LGAs in New England and North-West Region. The map also shows the percent of Aboriginal people in the region in each LGA.

NSW Department of Aboriginal Affairs Aboriginal Population Projections, NSW, 2006-2021 31
MAP 6: NEW ENGLAND NORTH-WEST REGION
NSW Department of Aboriginal Affairs Aboriginal Population Projections, NSW, 2006-2021 31
MAP 6: NEW ENGLAND NORTH-WEST REGION
Local Government Area (LGA) by Indigenous Status (INGP)Counting: Persons, Place of Usual ResidenceAboriginal in Local Government AreasData Source: 2006 Census of Population and Housing

NSW Department of Aboriginal Affairs Aboriginal Population Projections, NSW, 2006-2021 32
PROJECTED POPULATION AGE PYRAMIDS – New England North-West Region
Males Females
5 Year Age Groups (see data Appendix 7)
Indigenous Projections, NSW NewEngland North-West, 2021
Age-
Gro
ups
18
16
14
12
10
8
6
4
2
0
Indigenous Projections, NSW NewEngland North-West, 2016
Age
-Gro
ups
18
16
14
12
10
8
6
4
2
0
Indigenous Projections, NSW NewEngland North-West, 2011
Age-
Gro
ups
18
16
14
12
10
8
6
4
2
0
Indigenous Population, NSW New England North-West, 2006A
ge G
roup
s
18
16
14
12
10
8
6
4
2
0

NSW Department of Aboriginal Affairs Aboriginal Population Projections, NSW, 2006-2021 33
6. NORTH COAST REGION North Coast Region is comprised of the following LGAs: Ballina, Bellingen, Byron, Clarence Valley, Coffs Harbour, Greater Taree, Kempsey, Kyogle, Lismore, Nambucca, Port Macquarie-Hastings, Richmond Valley and Tweed. TABLE 13: SUMMARY INDICATORS, ABORIGINAL POPULATION PROJECTIONS BY SEX,
2006 TO 2021, NORTH COAST REGION
Projection Absolute Numbers Annual Vital Rates
(per 1000) Year Indices Males Females Total Males Females Total
2006 Population 10,652 10,753 21,405 2006 Births 208 192 401 19.6 17.9 18.7 2006 Deaths 49 41 89 4.6 3.8 4.2 2006 Migrants(1) 113 120 233 10.6 11.2 10.9 2006 Growth 273 272 545 25.6 25.3 25.4 2006 Median Age 19.1 20.6 19.7 2009 Population 11,431 11,539 22,970 2009 Births 105 97 202 20.7 19.0 19.9 2009 Deaths 23 19 42 4.6 3.8 4.2 2009 Migrants(1) 113 120 233 11.8 12.7 12.3 2009 Growth 142 143 285 28.0 28.0 28.0 2009 Median Age 19.9 21.3 20.5 2011 Population 11,991 12,100 24,091 2011 Births 113 105 218 21.1 19.4 20.3 2011 Deaths 24 21 45 4.6 3.8 4.2 2011 Migrants(1) 113 120 233 11.2 12.0 11.6 2011 Growth 149 149 298 27.8 27.6 27.7 2011 Median Age 20.5 21.3 20.5 2016 Population 13,539 13,644 27,183 2016 Births 133 123 255 21.6 19.9 20.7 2016 Deaths 29 25 54 4.7 4.0 4.4 2016 Migrants(1) 113 120 233 9.8 10.5 10.1 2016 Growth 164 163 326 26.6 26.4 26.5 2016 Median Age 22.0 23.0 22.5 2021 Population 15,268 15,362 30,630 2021 Births 152 141 293 21.8 20.1 20.9 2021 Deaths 35 30 65 5.0 4.2 4.6 2021 Migrants(1) 113 120 233 8.6 9.3 8.9 2021 Growth 177 176 353 25.3 25.1 25.2 2021 Median Age 23.0 24.2 23.6
(1) Migrants include net inter-state migration and parental fertility - Aboriginal births to non-Aboriginal mothers. Map 7 shows the LGAs in the North Coast Region. The map also shows the percent of Aboriginal people in the region who are in each LGA.

NSW Department of Aboriginal Affairs Aboriginal Population Projections, NSW, 2006-2021 34
MAP 7: NORTH COAST REGION
NSW Department of Aboriginal Affairs Aboriginal Population Projections, NSW, 2006-2021 34
MAP 7: NORTH COAST REGION
Local Government Area (LGA) by Indigenous Status (INGP)Counting: Persons, Place of Usual ResidenceAboriginal in Local Government AreasData Source: 2006 Census of Population and Housing

NSW Department of Aboriginal Affairs Aboriginal Population Projections, NSW, 2006-2021 35
PROJECTED POPULATION AGE PYRAMIDS – NORTH COAST REGION
Males Females
5 Year Age Groups (see data Appendix 8)
Indigenous Projections, NSW North Coast Region, 2021
Age
-Gro
ups
18
16
14
12
10
8
6
4
2
0
Indigenous Projections, NSW North Coast Region, 2016
Age-
Gro
ups
18
16
14
12
10
8
6
4
2
0
Indigenous Projections, NSW North Coast Region, 2011
Age-
Gro
ups
18
16
14
12
10
8
6
4
2
0
Indigenous Population, NSW North Coast Region, 2006A
ge-G
roup
s
18
16
14
12
10
8
6
4
2
0
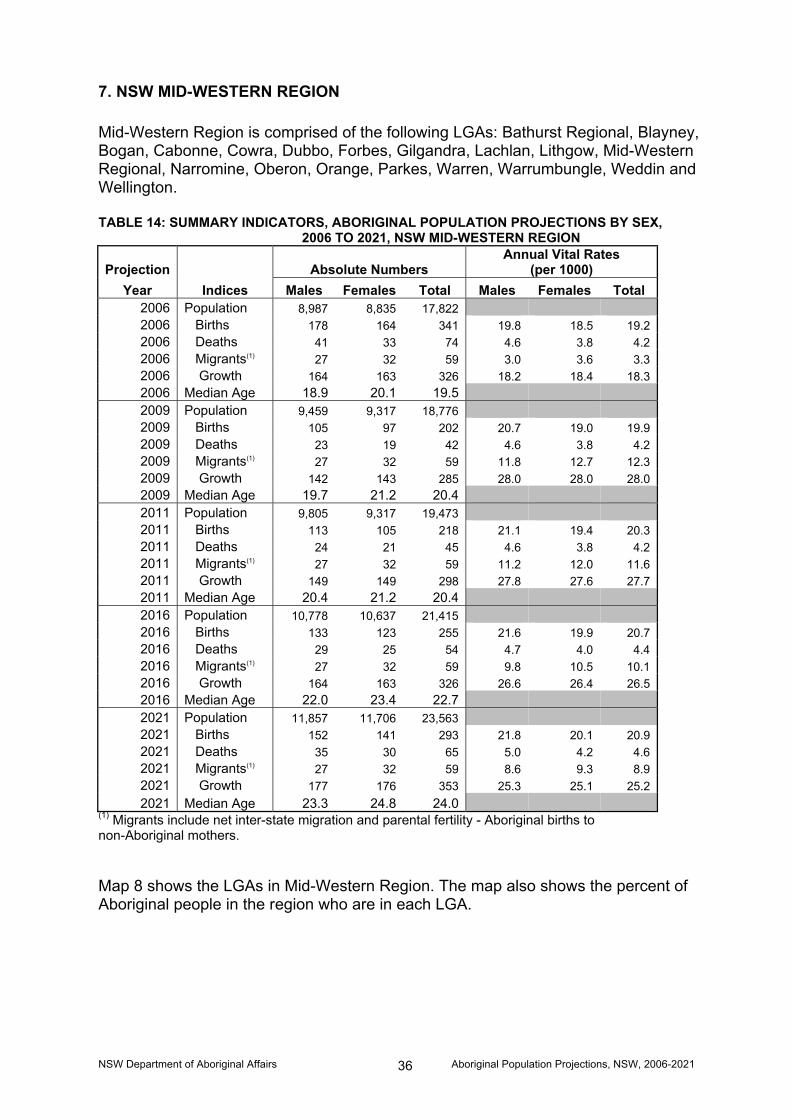
NSW Department of Aboriginal Affairs Aboriginal Population Projections, NSW, 2006-2021 36
7. NSW MID-WESTERN REGION Mid-Western Region is comprised of the following LGAs: Bathurst Regional, Blayney, Bogan, Cabonne, Cowra, Dubbo, Forbes, Gilgandra, Lachlan, Lithgow, Mid-Western Regional, Narromine, Oberon, Orange, Parkes, Warren, Warrumbungle, Weddin and Wellington. TABLE 14: SUMMARY INDICATORS, ABORIGINAL POPULATION PROJECTIONS BY SEX,
2006 TO 2021, NSW MID-WESTERN REGION
Projection Absolute Numbers Annual Vital Rates
(per 1000) Year Indices Males Females Total Males Females Total
2006 Population 8,987 8,835 17,822 2006 Births 178 164 341 19.8 18.5 19.2 2006 Deaths 41 33 74 4.6 3.8 4.2 2006 Migrants(1) 27 32 59 3.0 3.6 3.3 2006 Growth 164 163 326 18.2 18.4 18.3 2006 Median Age 18.9 20.1 19.5 2009 Population 9,459 9,317 18,776 2009 Births 105 97 202 20.7 19.0 19.9 2009 Deaths 23 19 42 4.6 3.8 4.2 2009 Migrants(1) 27 32 59 11.8 12.7 12.3 2009 Growth 142 143 285 28.0 28.0 28.0 2009 Median Age 19.7 21.2 20.4 2011 Population 9,805 9,317 19,473 2011 Births 113 105 218 21.1 19.4 20.3 2011 Deaths 24 21 45 4.6 3.8 4.2 2011 Migrants(1) 27 32 59 11.2 12.0 11.6 2011 Growth 149 149 298 27.8 27.6 27.7 2011 Median Age 20.4 21.2 20.4 2016 Population 10,778 10,637 21,415 2016 Births 133 123 255 21.6 19.9 20.7 2016 Deaths 29 25 54 4.7 4.0 4.4 2016 Migrants(1) 27 32 59 9.8 10.5 10.1 2016 Growth 164 163 326 26.6 26.4 26.5 2016 Median Age 22.0 23.4 22.7 2021 Population 11,857 11,706 23,563 2021 Births 152 141 293 21.8 20.1 20.9 2021 Deaths 35 30 65 5.0 4.2 4.6 2021 Migrants(1) 27 32 59 8.6 9.3 8.9 2021 Growth 177 176 353 25.3 25.1 25.2 2021 Median Age 23.3 24.8 24.0
(1) Migrants include net inter-state migration and parental fertility - Aboriginal births to non-Aboriginal mothers.
Map 8 shows the LGAs in Mid-Western Region. The map also shows the percent of Aboriginal people in the region who are in each LGA.
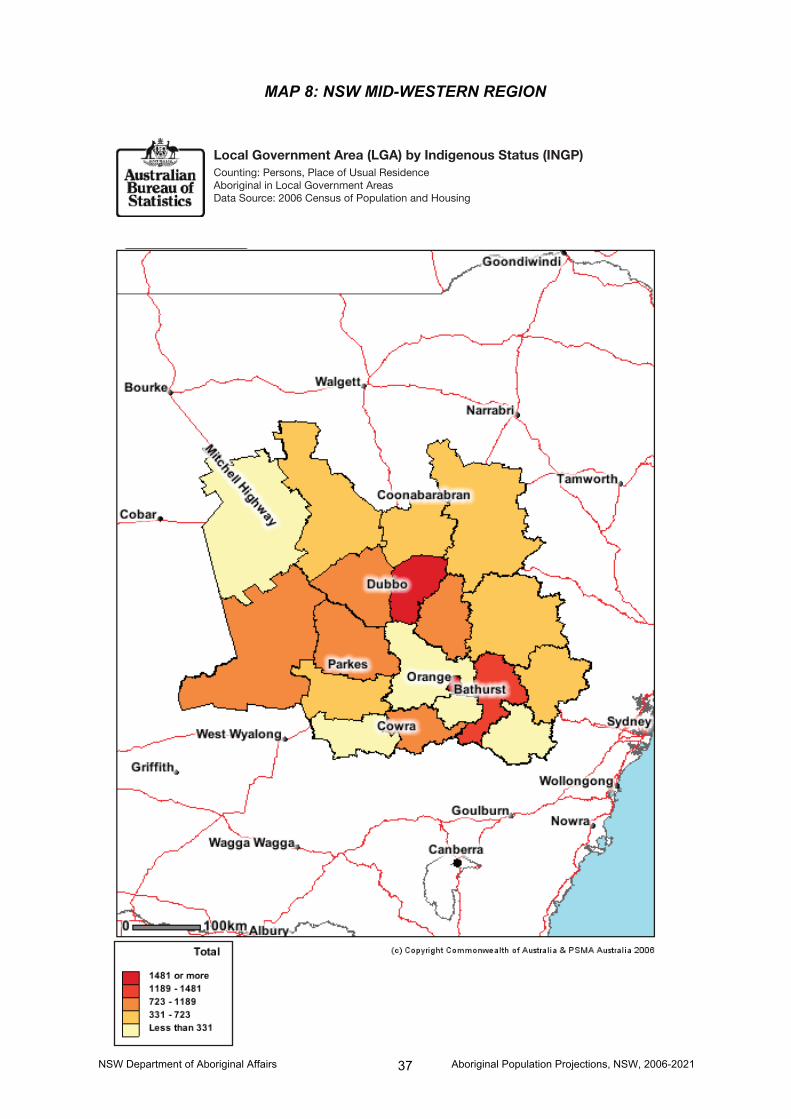
NSW Department of Aboriginal Affairs Aboriginal Population Projections, NSW, 2006-2021 37
MAP 8: NSW MID-WESTERN REGION
NSW Department of Aboriginal Affairs Aboriginal Population Projections, NSW, 2006-2021 37
MAP 8: NSW MID-WESTERN REGION
Local Government Area (LGA) by Indigenous Status (INGP)Counting: Persons, Place of Usual ResidenceAboriginal in Local Government AreasData Source: 2006 Census of Population and Housing

NSW Department of Aboriginal Affairs Aboriginal Population Projections, NSW, 2006-2021 38
PROJECTED POPULATION AGE PYRAMIDS – MID-WESTERN REGION
Males Females
5 Year Age Groups (see data Appendix 6)
Indigenous Projections, NSW Mid-Western Region, 2021A
ge-G
roup
s18
16
14
12
10
8
6
4
2
0
Indigenous Projections, NSW Mid-Western Region, 2016
Age
-Gro
ups
18
16
14
12
10
8
6
4
2
0
Indigenous Projections, NSW Mid-Western Region, 2011
Age
-Gro
ups
18
16
14
12
10
8
6
4
2
0
Indigenous Population, NSW Mid-Western Region, 2006
Age
-Gro
ups
18
16
14
12
10
8
6
4
2
0

NSW Department of Aboriginal Affairs Aboriginal Population Projections, NSW, 2006-2021 39
8. RIVERINA-MURRAY REGION Riverina-Murray Region is comprised of the following LGAs: Albury, Balranald, Berrigan, Bland, Carrathool, Conargo, Coolamon, Cootamundra, Corowa, Deniliquin, Greater Hume, Griffith, Gundagai, Hay, Jerilderie, Junee, Leeton, Lockhart, Murray, Murrumbidgee, Narrandera, Temora, Tumbarumba, Tumut, Urana, Wagga Wagga and Wakool. TABLE 15: SUMMARY INDICATORS, ABORIGINAL POPULATION PROJECTIONS BY SEX,
2006 TO 2021, RIVERINA-MURRAY REGION
Projection Absolute Numbers Annual Vital Rates
(per 1000) Year Indices Males Females Total Males Females Total
2006 Population 4,634 4,589 9,223 2006 Births 92 85 176 19.8 18.4 19.1 2006 Deaths 21 17 38 4.6 3.8 4.2 2006 Migrants(1) 113 120 233 24.4 26.1 25.3 2006 Growth 184 187 371 39.6 40.8 40.2 2006 Median Age 19.7 20.2 19.9 2009 Population 4,915 4,868 9,783 2009 Births 105 97 202 20.7 19.0 19.9 2009 Deaths 23 19 42 4.6 3.8 4.2 2009 Migrants(1) 113 120 233 11.8 12.7 12.3 2009 Growth 142 143 285 28.0 28.0 28.0 2009 Median Age 20.4 21.1 20.6 2011 Population 5,118 5,069 10,187 2011 Births 113 105 218 21.1 19.4 20.3 2011 Deaths 24 21 45 4.6 3.8 4.2 2011 Migrants(1) 113 120 233 11.2 12.0 11.6 2011 Growth 149 149 298 27.8 27.6 27.7 2011 Median Age 21.1 21.1 20.6 2016 Population 5,682 5,626 11,308 2016 Births 133 123 255 21.6 19.9 20.7 2016 Deaths 29 25 54 4.7 4.0 4.4 2016 Migrants(1) 113 120 233 9.8 10.5 10.1 2016 Growth 164 163 326 26.6 26.4 26.5 2016 Median Age 22.6 23.1 22.8 2021 Population 6,316 6,250 12,565 2021 Births 152 141 293 21.8 20.1 20.9 2021 Deaths 35 30 65 5.0 4.2 4.6 2021 Migrants(1) 113 120 233 8.6 9.3 8.9 2021 Growth 177 176 353 25.3 25.1 25.2 2021 Median Age 24.0 24.4 24.1
(1) Migrants include net inter-state migration and parental fertility - Aboriginal births to non-Aboriginal mothers. Map 9 shows the LGAs in Riverina-Murray Region. The map also shows the percent of Aboriginal people in the region who are in each LGA.

NSW Department of Aboriginal Affairs Aboriginal Population Projections, NSW, 2006-2021 40
MAP 9: RIVERINA-MURRAY REGION
NSW Department of Aboriginal Affairs Aboriginal Population Projections, NSW, 2006-2021 40
MAP 9: RIVERINA-MURRAY REGION
Local Government Area (LGA) by Indigenous Status (INGP)Counting: Persons, Place of Usual ResidenceAboriginal in Local Government AreasData Source: 2006 Census of Population and Housing

NSW Department of Aboriginal Affairs Aboriginal Population Projections, NSW, 2006-2021 41
PROJECTED POPULATION AGE PYRAMIDS –RIVERINA-MURRAY REGION
Males Females
5 Year Age Groups (see data Appendix 9)
Indigenous Projections, NSW Riverina-Murray Region, 2021
Age
-Gro
ups
18
16
14
12
10
8
6
4
2
0
Indigenous Projections, NSW Riverina-Murray Region, 2016
Age-
Gro
ups
18
16
14
12
10
8
6
4
2
0
Indigenous Projections, NSW Riverina-Murray Region, 2011
Age
-Gro
ups
18
16
14
12
10
8
6
4
2
0
Indigenous Population, NSW Riverina-Murray Region, 2006A
ge-G
roup
s
18
16
14
12
10
8
6
4
2
0
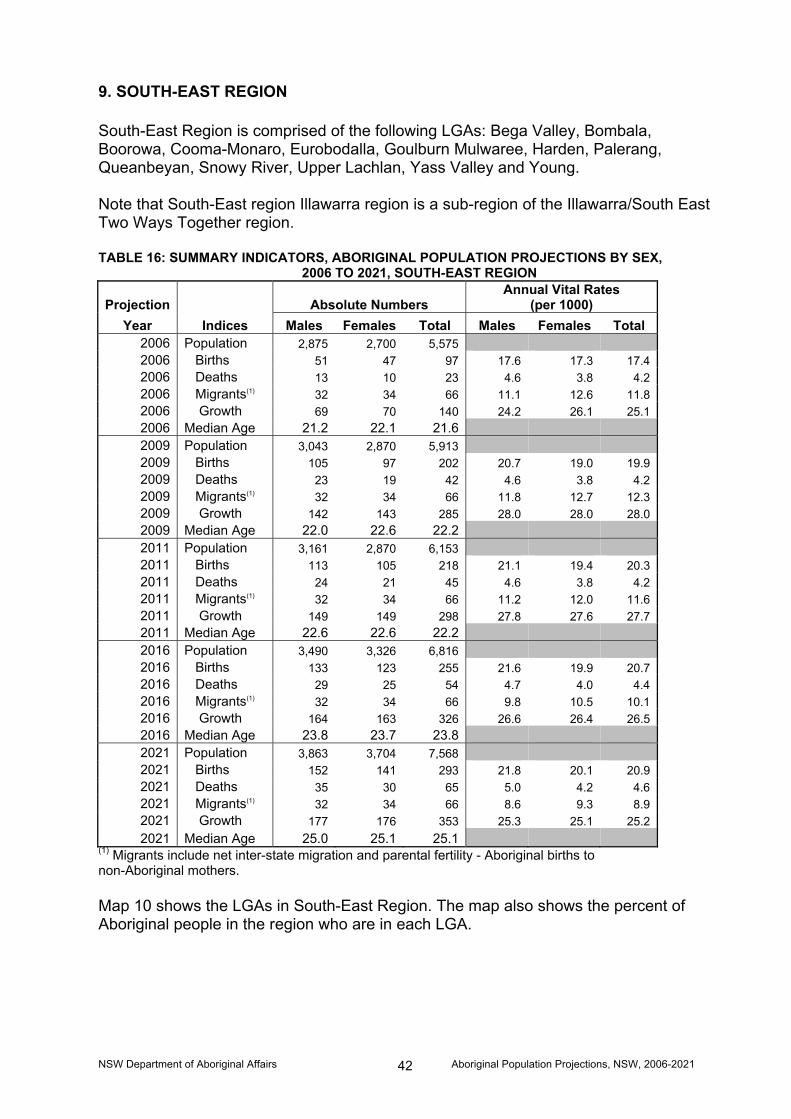
NSW Department of Aboriginal Affairs Aboriginal Population Projections, NSW, 2006-2021 42
9. SOUTH-EAST REGION South-East Region is comprised of the following LGAs: Bega Valley, Bombala, Boorowa, Cooma-Monaro, Eurobodalla, Goulburn Mulwaree, Harden, Palerang, Queanbeyan, Snowy River, Upper Lachlan, Yass Valley and Young. Note that South-East region Illawarra region is a sub-region of the Illawarra/South East Two Ways Together region. TABLE 16: SUMMARY INDICATORS, ABORIGINAL POPULATION PROJECTIONS BY SEX,
2006 TO 2021, SOUTH-EAST REGION
Projection Absolute Numbers Annual Vital Rates
(per 1000) Year Indices Males Females Total Males Females Total
2006 Population 2,875 2,700 5,575 2006 Births 51 47 97 17.6 17.3 17.4 2006 Deaths 13 10 23 4.6 3.8 4.2 2006 Migrants(1) 32 34 66 11.1 12.6 11.8 2006 Growth 69 70 140 24.2 26.1 25.1 2006 Median Age 21.2 22.1 21.6 2009 Population 3,043 2,870 5,913 2009 Births 105 97 202 20.7 19.0 19.9 2009 Deaths 23 19 42 4.6 3.8 4.2 2009 Migrants(1) 32 34 66 11.8 12.7 12.3 2009 Growth 142 143 285 28.0 28.0 28.0 2009 Median Age 22.0 22.6 22.2 2011 Population 3,161 2,870 6,153 2011 Births 113 105 218 21.1 19.4 20.3 2011 Deaths 24 21 45 4.6 3.8 4.2 2011 Migrants(1) 32 34 66 11.2 12.0 11.6 2011 Growth 149 149 298 27.8 27.6 27.7 2011 Median Age 22.6 22.6 22.2 2016 Population 3,490 3,326 6,816 2016 Births 133 123 255 21.6 19.9 20.7 2016 Deaths 29 25 54 4.7 4.0 4.4 2016 Migrants(1) 32 34 66 9.8 10.5 10.1 2016 Growth 164 163 326 26.6 26.4 26.5 2016 Median Age 23.8 23.7 23.8 2021 Population 3,863 3,704 7,568 2021 Births 152 141 293 21.8 20.1 20.9 2021 Deaths 35 30 65 5.0 4.2 4.6 2021 Migrants(1) 32 34 66 8.6 9.3 8.9 2021 Growth 177 176 353 25.3 25.1 25.2 2021 Median Age 25.0 25.1 25.1
(1) Migrants include net inter-state migration and parental fertility - Aboriginal births to non-Aboriginal mothers. Map 10 shows the LGAs in South-East Region. The map also shows the percent of Aboriginal people in the region who are in each LGA.

NSW Department of Aboriginal Affairs Aboriginal Population Projections, NSW, 2006-2021 43
MAP 10: SOUTH-EAST REGION
NSW Department of Aboriginal Affairs Aboriginal Population Projections, NSW, 2006-2021 43
MAP 10: SOUTH-EAST REGION
Local Government Area (LGA) by Indigenous Status (INGP)Counting: Persons, Place of Usual ResidenceAboriginal in Local Government AreasData Source: 2006 Census of Population and Housing

NSW Department of Aboriginal Affairs Aboriginal Population Projections, NSW, 2006-2021 44
PROJECTED POPULATION AGE PYRAMIDS – SOUTH-EAST REGION
Males Females
5 Year Age Groups (see data Appendix 10)
Indigenous Projections, NSW South-Coast Region, 2021
Age-
Gro
ups
18
16
14
12
10
8
6
4
2
0
Indigenous Projections, NSW South-Coast Region, 2011
Age
-Gro
ups
18
16
14
12
10
8
6
4
2
0
Indigenous Projections, NSW South-Coast Region, 2016
Age-
Gro
ups
18
16
14
12
10
8
6
4
2
0
Indigenous Population, NSW South-Coast Region, 2006
Age
-Gro
ups
18
16
14
12
10
8
6
4
2
0

NSW Department of Aboriginal Affairs Aboriginal Population Projections, NSW, 2006-2021 45
10. WESTERN AND SOUTH-WEST SYDNEY REGION Western and South-West Sydney Region comprised of the following LGAs: Auburn, Bankstown, Baulkham Hills, Blacktown, Blue Mountains, Camden, Campbelltown, Fairfield, Hawkesbury, Holroyd, Liverpool, Parramatta, Penrith and Wollondilly. TABLE 17: SUMMARY INDICATORS, ABORIGINAL POPULATION PROJECTIONS BY SEX,
2006 TO 2021, WESTERN AND SOUTH-WEST SYDNEY REGION
Projection Absolute Numbers Annual Vital Rates
(per 1000) Year Indices Males Females Total Males Females Total
2006 Population 14,410 14,040 28,450 2006 Births 299 276 574 20.7 19.6 20.2 2006 Deaths 78 37 115 5.4 2.7 4.0 2006 Migrants(1) -8 1 -7 -0.5 0.1 -0.2 2006 Growth 213 239 452 14.8 17.0 15.9 2006 Median Age 21.5 19.0 20.1 2009 Population 15,140 14,822 29,962 2009 Births 335 310 645 22.3 21.1 21.7 2009 Deaths 81 39 120 5.4 2.7 4.0 2009 Migrants(1) -8 1 -7 -0.5 0.1 -0.2 2009 Growth 256 271 527 17.0 18.5 17.7 2009 Median Age 22.4 20.3 21.3 2011 Population 15,689 14,822 31,084 2011 Births 363 336 698 23.3 22.0 22.7 2011 Deaths 84 44 128 5.4 2.9 4.1 2011 Migrants(1) -8 1 -7 -0.5 0.1 -0.2 2011 Growth 280 292 573 18.0 19.2 18.6 2011 Median Age 23.0 20.3 21.3 2016 Population 17,251 16,998 34,248 2016 Births 426 394 820 24.9 23.4 24.2 2016 Deaths 97 57 153 5.7 3.4 4.5 2016 Migrants(1) -8 1 -7 -0.5 0.1 -0.2 2016 Growth 331 337 668 19.4 20.1 19.7 2016 Median Age 24.3 23.3 23.8 2021 Population 18,991 18,772 37,763 2021 Births 471 436 907 25.0 23.4 24.2 2021 Deaths 116 72 189 6.2 3.9 5.0 2021 Migrants(1) -8 1 -7 -0.4 0.1 -0.2 2021 Growth 356 363 720 18.9 19.6 19.2 2021 Median Age 25.9 25.1 25.5
(1) Migrants include net inter-state migration and parental fertility - Aboriginal births to non-Aboriginal mothers. Map 11 shows the LGAs in the Western and South-West Sydney Region. The map also shows the percent of Aboriginal people in the region who are in each LGA.

NSW Department of Aboriginal Affairs Aboriginal Population Projections, NSW, 2006-2021 46
MAP 11: WESTERN AND SOUTH-WEST SYDNEY REGION
NSW Department of Aboriginal Affairs Aboriginal Population Projections, NSW, 2006-2021 46
MAP 11: WESTERN AND SOUTH-WEST SYDNEY REGION
Local Government Area (LGA) by Indigenous Status (INGP)Counting: Persons, Place of Usual ResidenceAboriginal in Local Government AreasData Source: 2006 Census of Population and Housing
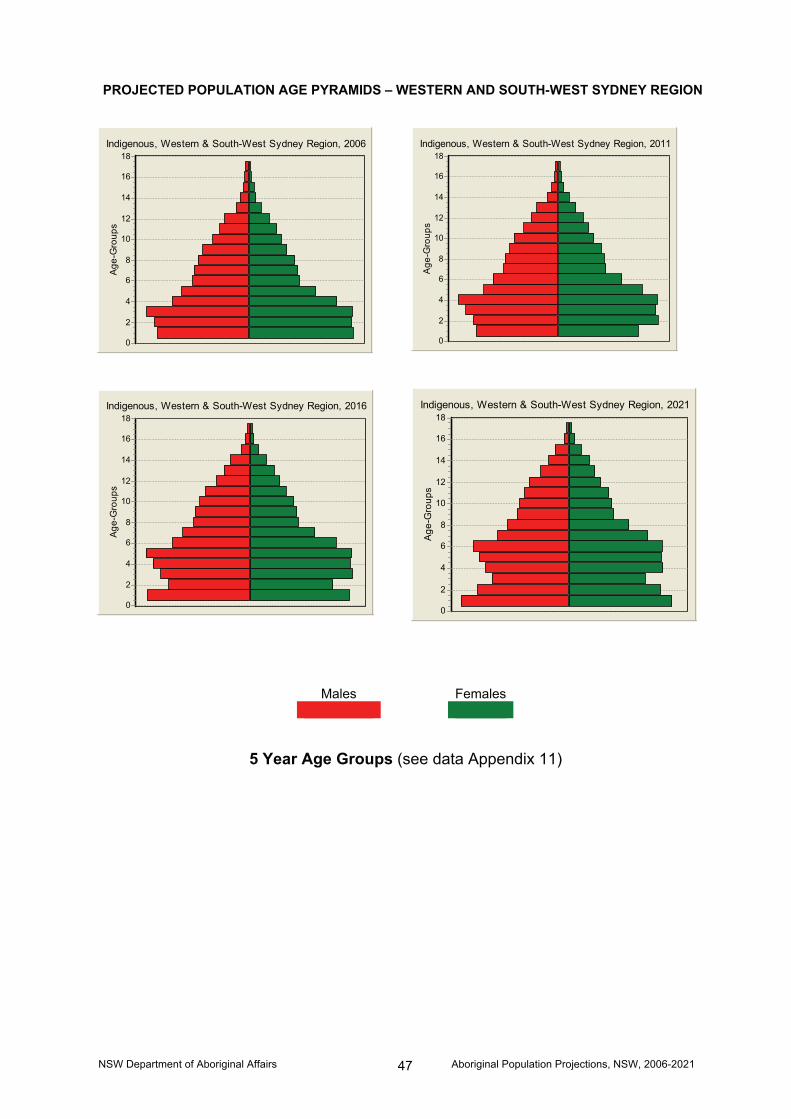
NSW Department of Aboriginal Affairs Aboriginal Population Projections, NSW, 2006-2021 47
PROJECTED POPULATION AGE PYRAMIDS – WESTERN AND SOUTH-WEST SYDNEY REGION
Males Females
5 Year Age Groups (see data Appendix 11)
Indigenous, Western & South-West Sydney Region, 2021
Age
-Gro
ups
18
16
14
12
10
8
6
4
2
0
Indigenous, Western & South-West Sydney Region, 2011
Age
-Gro
ups
18
16
14
12
10
8
6
4
2
0
Indigenous, Western & South-West Sydney Region, 2016
Age-
Gro
ups
18
16
14
12
10
8
6
4
2
0
Indigenous, Western & South-West Sydney Region, 2006
Age-
Gro
ups
18
16
14
12
10
8
6
4
2
0

NSW Department of Aboriginal Affairs Aboriginal Population Projections, NSW, 2006-2021 48
11. WESTERN NSW REGION Western NSW Region comprised of the following LGAs: Bourke, Brewarrina, Broken Hill, Central Darling, Cobar, Coonamble, Unincorporated Area, Walgett and Wentworth. TABLE 18: SUMMARY INDICATORS, ABORIGINAL POPULATION PROJECTIONS BY SEX,
2006 TO 2021, WESTERN NSW REGION
Projection Absolute Numbers Annual Vital Rates
(per 1000) Year Indices Males Females Total Males Females Total
2006 Population 4,505 4,515 9,020 2006 Births 89 83 172 19.8 18.3 19.1 2006 Deaths 26 20 46 5.8 4.5 5.1 2006 Migrants(1) -18 -15 -33 -4.0 -3.3 -3.7 2006 Growth 45 47 92 10.1 10.4 10.2 2006 Median Age 21.5 22.5 22.0 2009 Population 4,784 4,756 9,540 2009 Births 105 97 202 21.2 19.7 20.4 2009 Deaths 23 19 42 5.8 4.5 5.1 2009 Migrants(1) -18 -15 -33 -3.8 -3.2 -3.5 2009 Growth 142 143 285 20.3 17.7 19.0 2009 Median Age 23.1 23.8 23.4 2011 Population 4,986 4,756 9,919 2011 Births 113 105 218 22.1 20.7 21.4 2011 Deaths 24 21 45 6.0 4.7 5.3 2011 Migrants(1) -18 -15 -33 -3.6 -3.1 -3.4 2011 Growth 149 149 298 20.9 18.5 19.7 2011 Median Age 24.0 23.8 23.4 2016 Population 5,548 5,431 10,979 2016 Births 133 123 255 23.8 22.5 23.2 2016 Deaths 29 25 54 6.5 5.1 5.8 2016 Migrants(1) -18 -15 -33 -3.3 -2.8 -3.0 2016 Growth 164 163 326 21.5 19.6 20.6 2016 Median Age 26.2 26.6 26.4 2021 Population 6,164 5,989 12,153 2021 Births 152 141 293 24.0 22.9 23.4 2021 Deaths 35 30 65 7.3 5.6 6.5 2021 Migrants(1) -18 -15 -33 -3.0 -2.5 -2.7 2021 Growth 177 176 353 20.5 19.2 19.9 2021 Median Age 28.2 28.4 28.3
(1) Migrants include net inter-state migration and parental fertility, Aboriginal births to non-Aboriginal mothers.
Map 12shows the LGAs in Western NSW Region. The map also shows the percent of Aboriginal people in the region in each LGA.
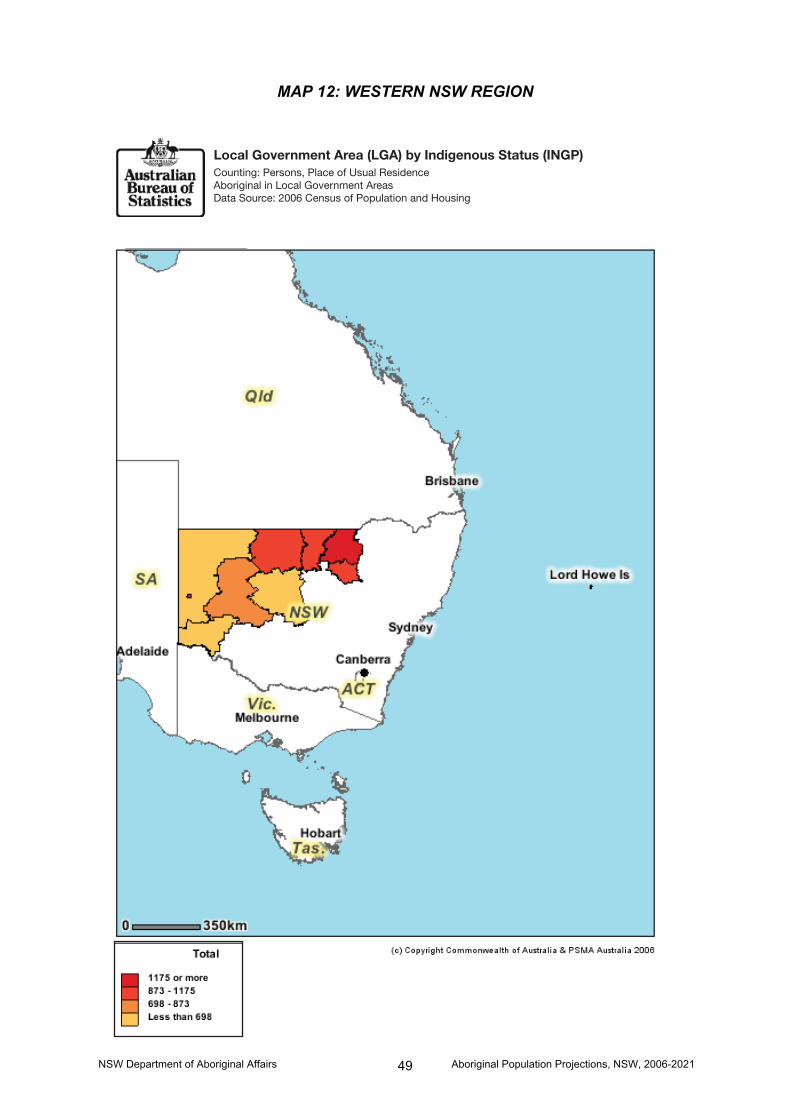
NSW Department of Aboriginal Affairs Aboriginal Population Projections, NSW, 2006-2021 49
MAP 12: WESTERN NSW REGION
NSW Department of Aboriginal Affairs Aboriginal Population Projections, NSW, 2006-2021 49
MAP 12: WESTERN NSW REGION
Local Government Area (LGA) by Indigenous Status (INGP)Counting: Persons, Place of Usual ResidenceAboriginal in Local Government AreasData Source: 2006 Census of Population and Housing

NSW Department of Aboriginal Affairs Aboriginal Population Projections, NSW, 2006-2021 50
PROJECTED POPULATION AGE PYRAMIDS - WESTERN REGION
Males Females
5 Year Age Groups (see data Appendix 12)
Indigenous Projections, Western NSW Region, 2021
Age
-Gro
ups
18
16
14
12
10
8
6
4
2
0
Indigenous Projections, Western NSW Region, 2011
Age-
Gro
ups
18
16
14
12
10
8
6
4
2
0
Indigenous Projections, Western NSW Region, 2016
Age
-Gro
ups
18
16
14
12
10
8
6
4
2
0
Indigenous Population, Western NSW Region, 2006A
ge-G
roup
s
18
16
14
12
10
8
6
4
2
0

NSW Department of Aboriginal Affairs Aboriginal Population Projections, NSW, 2006-2021 51
EXPLANATORY NOTES
Projection Method The population projection was carried out using standard cohort-component methods. The procedure carries out a single-year projection of a population by age and sex, based on initial male and female populations in five-year age groups and assumed changes in fertility, mortality and migration. The United Nations MORTPACK for Windows V4 Software package was used to generate population projections. This package was developed by the United Nations Population Division for Demographic Measurements. The steps are:
• estimation of projected levels and age patterns of mortality, fertility and migration for each single-year projection period;
• estimation of the male and female populations by single years of age and from the data in five-year age groups given as input; and
• sequential application of these annual age-specific mortality and fertility rates and migration to the population to provide annual projected populations by age and sex and demographic indicators.
Estimates of Fertility Registered birth data were aggregated for three years (2004-2006) and averaged to produce a smooth annual estimate of the number of births. Given that in 2006, the estimated coverage of the Aboriginal births registration in NSW was 89% (ABS, Births Australia, 3301.0, 2006, p.77), the registered births were then inflated by a correction factor (a ratio of 1.236) to compensate for under coverage. In order to obtain fertility rates, the numbers of Aboriginal females aged 15 to 49 in 5 yearly age groups were used as denominators. Application of the above process results in an estimation of the Total Fertility Rate (TFR) of 2.26 births during the reproductive life of an Aboriginal female, compared to a TFR of 1.83 (ABS, 3301.0, 2006) for all NSW women. This rate translates to a Net Reproduction Rate (NRR) of just 1. This means an Aboriginal woman in NSW produces only one baby girl during her entire reproductive life who will replace her under the current fertility regime. In 2006 the NRR for all women in NSW is estimated at 0.859, which is below fertility replacement level.

NSW Department of Aboriginal Affairs Aboriginal Population Projections, NSW, 2006-2021 52
TABLE 19: OBSERVED FERTILITY PATTERN USING BIRTH REGISTRATION DATA (2004-2006)
Age Groups Aboriginal
MothersAboriginal
Paternal Total NSW 15-19 68.1 - 13.2 20-24 130.5 33.9 49.9 25-29 113.0 76.9 100.1 30-34 88.7 79.0 120.0 35-39 41.6 59.7 64.7 40-44 10.2 26.9 11.9 45-49 0.3 5.8 6.0 50-54 2.5 Total Fertility Rate (TFR) 2.262 1.412 1.829
Table 19 and Figure1 show that the observed aged related fertility patterns of Aboriginal fathers (births with father Aboriginal and mother non-Aboriginal) differ to those of Aboriginal mothers.
By applying indirect techniques of fertility estimation using data on number of mothers by age groups by number of children ever born from Census 2006 and Census 1996, two very consistent sets of age-specific fertility rates (ASFRs) and the corresponding Total Fertility Rates (TFR) for 1996 and 2006 were obtained (See Table 19 and Figure 1).
Figure 1: Age Pattern of Fertility in NSW 2004-2006
0.0
20.0
40.0
60.0
80.0
100.0
120.0
140.0
15-19 20-24 25-29 30-34 35-39 40-44 45-49 50-54
Age Groups
AboriginalMothersAboriginalPaternal Total NSW
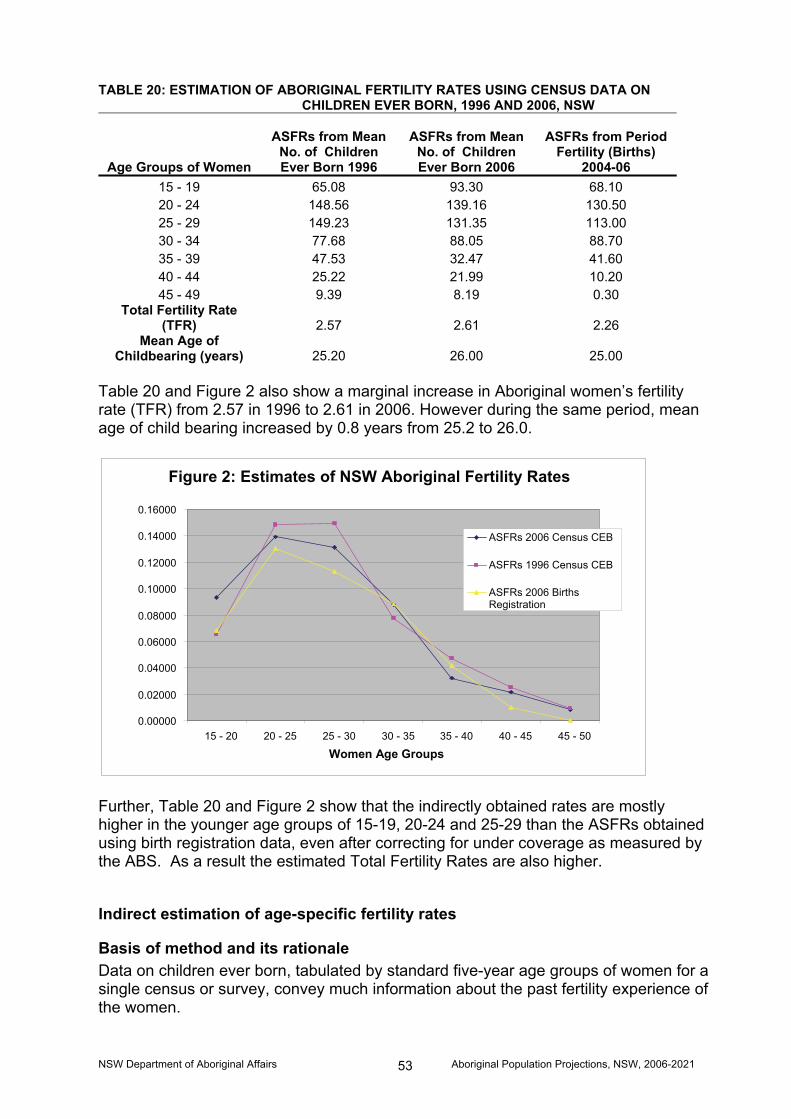
NSW Department of Aboriginal Affairs Aboriginal Population Projections, NSW, 2006-2021 53
TABLE 20: ESTIMATION OF ABORIGINAL FERTILITY RATES USING CENSUS DATA ON CHILDREN EVER BORN, 1996 AND 2006, NSW
Age Groups of Women
ASFRs from Mean
No. of Children Ever Born 1996
ASFRs from Mean No. of Children Ever Born 2006
ASFRs from Period Fertility (Births)
2004-06 15 - 19 65.08 93.30 68.10 20 - 24 148.56 139.16 130.50 25 - 29 149.23 131.35 113.00 30 - 34 77.68 88.05 88.70 35 - 39 47.53 32.47 41.60 40 - 44 25.22 21.99 10.20 45 - 49 9.39 8.19 0.30
Total Fertility Rate (TFR) 2.57 2.61 2.26
Mean Age of Childbearing (years) 25.20 26.00 25.00
Table 20 and Figure 2 also show a marginal increase in Aboriginal women’s fertility rate (TFR) from 2.57 in 1996 to 2.61 in 2006. However during the same period, mean age of child bearing increased by 0.8 years from 25.2 to 26.0.
Further, Table 20 and Figure 2 show that the indirectly obtained rates are mostly higher in the younger age groups of 15-19, 20-24 and 25-29 than the ASFRs obtained using birth registration data, even after correcting for under coverage as measured by the ABS. As a result the estimated Total Fertility Rates are also higher.
Indirect estimation of age-specific fertility rates
Basis of method and its rationale Data on children ever born, tabulated by standard five-year age groups of women for a single census or survey, convey much information about the past fertility experience of the women.
Figure 2: Estimates of NSW Aboriginal Fertility Rates
0.00000 0.02000
0.04000 0.06000 0.08000
0.10000 0.12000
0.14000 0.16000
15 - 20 20 - 25 25 - 30 30 - 35 35 - 40 40 - 45 45 - 50 Women Age Groups
ASFRs 2006 Census CEB
ASFRs 1996 Census CEB
ASFRs 2006 BirthsRegistration
NSW Department of Aboriginal Affairs Aboriginal Population Projections, NSW, 2006-2021 54
Conventionally, children ever born data (CEB) as collected from censuses or surveys, refer to children borne alive. This naturally includes children who at least cried at birth but died a few seconds later. All stillbirths are excluded and also children not borne by the woman such as foster children, adopted children and step-children. It is not possible to evaluate to what extent the latter category of children might have been included. However, experience has shown that CEB data from censuses or surveys are generally underreported due to omissions of children rather than over-reported due to erroneous inclusions of children. Suffice it to say that the fertility data from the 2006 Census are of fairly good quality and both the methodology and the results appear satisfactory.
Information on Aboriginal vital statistics is incomplete. It requires the use of indirect estimation techniques to estimate fertility rates. There are a number of methods proposed by Mortara, Brass and Arretx to estimate fertility using census or survey data. Eduardo Arriaga, a demographer with the US Census Bureau, has proposed an alternative technique for estimating fertility when information exists from two consecutive surveys about live-born children, classified according to the mother's age. To the contrary of the Brass technique, which assumes constant fertility, the hypothesis implicit in Arriaga's method is that the average number of children born per woman varies linearly in the time interval under consideration. In the case of the Aboriginal population case, where assumption of constant fertility is doubtful, application of Arriaga's technique seems more appropriate.
Arriaga (1983) observed that under conditions of declining fertility the number of children ever born by age of mother also changes almost linearly with the mothers' age under 35 years. Based on this empirical observation, Arriaga proposed that linear interpolation of children ever born by age of mother from two or more censuses can provide an estimate of the children ever born for one year prior to the date of the census.
When information on children ever born by age of mother and the pattern of fertility are available for one census or survey, the technique can also be used. The results in this case, are practically the same as the Brass and Trussell techniques since fertility is assumed to be constant. Similarly, as in the case of the previous techniques, if an age pattern of fertility is available, such a pattern can be adjusted to the fertility level implied by the fertility rates derived from the information on children ever born. The advantage in this case is that no adjustment is required when comparing children ever born with the cumulative pattern of fertility since in this technique the comparison is made between two sets of cumulative fertility rates. Thus, one set represents the pattern and the other, which is derived from the children ever born data, represents the level of fertility.
By and large, the technique uses the same information as the Brass technique but can be applied also in cases where the pattern of fertility is not available. However, this technique is also sensitive to age misreporting especially for women in the older ages.
In these projections, Arriaga's method is applied to information on children ever born from 1996 and 2006 censuses to arrive at estimates of Aboriginal fertility levels and pattern in NSW.

NSW Department of Aboriginal Affairs Aboriginal Population Projections, NSW, 2006-2021 55
Estimates of Mortality ABS Indigenous Life Tables As mentioned in the text, in these projections, levels of mortality were taken from the most recent ABS estimates (ABS: 17 NOV 2008, Discussion Paper, 3302.0.55.002, PAGE 4). The Discussion Paper on Indigenous Mortality introduced a new method for calculating Aboriginal life expectancies. The use of this method results in considerable reduction in the life expectancy gap between Aboriginal and non-Aboriginal Australians. New estimates for Aboriginal life expectancy are 66.9 years for males and 72.6 years for females. The difference between Aboriginal and non-Aboriginal life expectancy at the national level using this method is 11.8 years for males (previously estimated at 18 years) and 10.0 years for females (previously 17 years). TABLE 21: ABORIGINAL LIFE EXPECTANCY AT BIRTH, 2005–2007 (
State/Territory Males Females (Years) (Years) NSW 69.6 74.8 Qld 68.1 73.5 WA 64.9 70.2 NT 61.5 69.2 Australia (a) 66.9 72.6
(a) Includes all states/territories. ABS: 17 NOV 2008, DISCUSSION PAPER, 3302.0.55.002, PAGE 4.
The age pattern of Aboriginal mortality is taken from the ABS estimated Indicative Indigenous Life Table for 1996-2001 (ABS is yet to publish a full set of Indigenous life tables based on the recent (November 2008) estimates and method).
Probabilities of dying values for Aboriginal males and Aboriginal females by age groups and the corresponding life expectancy figures at birth were incorporated in the population projection procedures (ABS, Deaths Australia, 3302.0, 2006, p.77).

NSW Department of Aboriginal Affairs Aboriginal Population Projections, NSW, 2006-2021 56
Some Definitions
Live Birth The delivery of a child, irrespective of the duration of pregnancy, who, after being born, breathes or shows any other evidence of life such as heartbeat.
Age-specific fertility rates Age-specific fertility rates are the number of live births (occurred or registered) during the calendar year, according to age of mother, per 1,000 of the female estimated resident population of the same age at 30 June. For calculating these rates, births to mothers under 15 years are included in the 15–19 years age group, and births to mothers aged 50 years and over are included in the 45–49 years age group. Pro rata adjustment is made in respect of births for which age of mother is not given.
Natural increase Excess of births over deaths.
Net interstate migration The difference between the number of persons who have changed their place of usual residence by moving into a given state or territory and the number who have changed their place of usual residence by moving out of that state or territory during a specified period. This difference can be either positive or negative.
Population growth For Australia, population growth is the sum of natural increase and net overseas migration. For states and territories, population growth also includes net interstate migration. After the Census, intercensal population growth also includes an allowance for intercensal discrepancy.
Total fertility rate The sum of age-specific fertility rates (live births at each age of mother per female population of that age). It represents the number of children a woman would bear during her lifetime if she experienced current age-specific fertility rates at each age of her reproductive life.
Death Death is the permanent disappearance of all evidence of life after birth has taken place. The definition excludes deaths prior to live birth. For the purposes of the Deaths and Causes of Death collections conducted by the ABS, a death refers to any death which occurs in or en route to Australia and is registered with a state or territory Registry of Births, Deaths and Marriages.
Age-specific death rates Age-specific death rates are the number of deaths (occurred or registered) during the calendar year at a specified age per 1,000 of the estimated resident population of the same age at the mid-point of the year (30 June). Pro rata adjustment is made in respect of deaths for which the age of the deceased is not given.
The crude death rate The crude death rate is the number of deaths registered during the calendar year per 1,000 estimated resident population at 30 June. For years prior to 1992, the crude

NSW Department of Aboriginal Affairs Aboriginal Population Projections, NSW, 2006-2021 57
death rate was based on the mean estimated resident population for the calendar year.
Aboriginal death The death of a person who is identified as being of Aboriginal or Torres Strait Islander origin on the death registration form.
Infant death An infant death is the death of a live-born child who dies before reaching his/her first birthday.
Infant mortality rate The number of deaths of children under one year of age in a financial year per 1,000 live births in the same financial year.
Life table A life table is a statistical model used to show the life expectancy and hence levels of mortality at different ages. It depicts the mortality experience of a hypothetical group of newborn babies throughout their lifetimes. Life tables may be complete or abridged, depending on the age interval used in their compilation. Complete life tables such as those for the Australian population contain data by single years of age, while abridged life tables, such as those for the Aboriginal population, contain data for five-year age groups. Life tables are presented separately for males and females.
Life expectancy Life expectancy refers to the average number of additional years a person of a given age and sex might expect to live if the age-specific death rates of the given period continued throughout his/her lifetime. Abridged life tables Abridged life tables are generally constructed in preference to complete life tables when reliable age-specific death rates are not available by single years of age. Reliable single year age-specific deaths rates are not available for the Aboriginal population. However, abridged life tables are generally sufficient for most purposes of demographic analysis.
Experimental Indigenous life tables The life tables are experimental because of the nature of the base population estimates used in constructing them. These estimates are affected by intercensal volatility in census counts of the Aboriginal population, as well as deficiencies in birth and death registration data which reduce the quality of Aboriginal estimates.
The sex ratio The sex ratio relates to the number of males per 100 females. The sex ratio is defined for total population, at birth, at death and among age groups by appropriately selecting the numerator and denominator of the ratio.
Average household size Average household size refers to the number of persons per household in private dwellings.
NSW Department of Aboriginal Affairs Aboriginal Population Projections, NSW, 2006-2021 58
Estimated resident population (ERP) The concept of estimated resident population (ERP) links people to a place of usual residence within Australia. Usual residence is that place where each person has lived or intends to live for six months or more in a reference year. The ERP is an estimate of the Australian population obtained by adding to the estimated population at the beginning of each period the components of natural increase (on a usual residence basis) and net overseas migration. For the states and territories, account is also taken of the estimated interstate movements involving a change of usual residence. Estimates of the resident population are based on census counts by place of usual residence, to which are added the estimated net census undercount and Australian residents estimated to have been temporarily overseas at the time of the census. Overseas visitors in Australia are excluded from this calculation. After each census, estimates for the preceding intercensal period are revised by incorporating an additional adjustment (intercensal discrepancy) to ensure that the total intercensal increase agrees with the difference between the ERPs at the two respective census dates.
Household A household is a group of two or more related or unrelated people who usually reside in the same dwelling, who regard themselves as a household and who make common provision for food or other essentials for living; or a person living in a dwelling who makes provision for his or her own food and other essentials for living, without combining with any other person. Households include group households of unrelated persons, same-sex couple households, single-parent households as well as one-person households. A household usually resides in a private dwelling (including caravans etc. in caravan parks). Persons usually resident in non-private dwellings, such as hotels, motels, boarding houses, jails and hospitals, are not included in household estimates. This definition of a household is consistent with the definition used in the Census. The number of households can be either based on count or estimated resident population.
Household estimate Household estimate is a measure of the number of households of the usually resident population. It is based on the census count of households which is adjusted for missed households, households of overseas visitors, households of Australian residents where all members were temporarily overseas at the time of the Census and households of Australian residents where all members were not home on census night and spent census night in a non-private dwelling in Australia.

NSW Department of Aboriginal Affairs Aboriginal Population Projections, NSW, 2006-2021 59
REFERENCES
Australian Bureau of Statistics, 19 August 2008, Experimental Estimates of Resident Australian Indigenous Population, Cat. No. 32380.55.001. ABS, 17 Nov 2008, Discussion Paper: Assessment of Methods, for Developing Life Tables, for Aboriginal and Torres, Strait Islander Australians, Cat. No. 3302.0.55.002. ABS & Australian Institute of Health and Welfare, 2005, The Health and Welfare of Australia’s Aboriginal and Torres Strait Islander Peoples. ABS, August 2007, Population Distribution, Aboriginal and Torres Strait Islander Australians, Cat. No. 470 5.0. ABS, September 2004, Demography Working Paper 2004/3 - Calculating Experimental Life Tables for Use in Population Estimates and Projections of Aboriginal and Torres Strait Islander Australians, 1991 to 2001, Cat. No. 3106.0.55.003. ABS, March 2001, Aboriginal and Torres Strait islander Mortality: Evaluation of Experimental Indigenous Life Tables. Demography working paper, Cat. No. 3124.0. ABS, 2000, Draft Experimental Aboriginal and Torres Strait Islander Life Tables, Australia, State and Territories, 1995 to 1997. Demography Working Paper, Cat. No. 3120.0 ABS, 2006 Census of Population and Housing, Indigenous Community Profiles. ABS, 2006 Census of Population and Housing, Special tables produced for this projection. ABS, March 2007, Australian Demographic Statistics, 3101.0, ABS, 2006 Census of Population and Housing: Media Releases and Fact Sheets, 2006, Released 27/06/2007. Cat. No. 2914.0.55.002. ABS, Births Australia, Cat. No. 3301.0, 2004. ABS, Births Australia, Cat. No. 3301.0, 2005. ABS, Births Australia, Cat. No. 3301.0, 2006. ABS, Births Australia, Cat. No. 3301.0, 2001. ABS, Deaths Australia, Cat. No. 3301.0, 2006. ABS, Experimental Estimates and Projections, Indigenous Australians, 1991 to 2009, Cat. No. 3238.0, Aboriginal Housing Office, 2008, Indicative NSW Indigenous Population Projections 2006 to 2021. Arriaga, E, 1983 Estimating Fertility from Data on Children Ever Born by Age of Mother, International Research Document No. 11 U.S. Bureau of the Census, Washington D C. Australian Institute of Health and Welfare (AIHW) and ABS, 2006, Recent Developments in the Collection of Aboriginal and Torres Strait Islander Health and Welfare Statistics. AIHW, June 2007, Aboriginal and Torres Strait islander Health Performance Framework 2006 Report, Canberra.
NSW Department of Aboriginal Affairs Aboriginal Population Projections, NSW, 2006-2021 60
AIHW, March 2006, National Summary of the 2003 and 2004 jurisdictional reports against Aboriginal and Torres Strait Islander Health Performance Indicators, Canberra. Brass, William, 1975, 'Fertility Estimates' in: Methods for Estimating Fertility and Mortality from Limited and Defective Data, Chaple Hill, North Carolina pp 11-21. Brass, William, Coale, Ansley J, Demeny, Paul, Heisel, Don F, Lorimer, Frank, Romaniuk, Anatole and van de Walle, Etienne,1968, The Demography of Tropical Africa, Princeton University Press, Princeton, New Jersey. Khalidi, Noor Ahmad, 1989, Aboriginal mortality in Central Australia, 1975-77 to 1985-86: a comparative analysis of levels and trends. National Centre for Epidemiology and Population Health, ANU, Canberra. Kinfu, Y., and Taylor, J., 2002, Estimating the components of Indigenous Population change, 1996–2001, CAEPR, Discussion Paper No. 240/2002, ANU, Canberra. NSW Health, February 2007, NSW Mothers and Babies 2005, NSW Public Health Bulletin Supplement, Volume 18, Number S-1. Ring, I and Firman, D, 1998, Reducing Indigenous Mortality in Australia: lessons from other countries, Medical Journal of Australia, 169:528-533. Spectrum Policy Modelling System, Version 3.14., Futures Institute, USAID. United Nations, 1983, Manual X: Indirect Techniques for Demographic Estimation, Department of International Economic and Social Affairs, Population Studies, No. 81, New York. United Nations, MORTPACK for Windows V4, Population Division, New York, USA. Woolford D, 2001, Australia: Aboriginal Identity Problems, Townsville Bulletin, February 17, p.40.

NS
W D
epar
tmen
t of A
borig
inal
Affa
irs
Abo
rigin
al P
opul
atio
n P
roje
ctio
ns, N
SW
, 200
6-20
21
61
APP
END
ICES
App
endi
x 1:
Pop
ulat
ion
Proj
ectio
ns b
y Si
ngle
Yea
rs o
f Age
and
Sex
, NSW
3
0 J
une
2006
30
Jun
e 20
09
3
0 J
une
2011
30
Jun
e 20
16
3
0 J
une
2021
Age
s
Mal
es
Fem
ales
To
tal
M
ales
Fe
mal
es
Tota
l
Mal
es
Fem
ales
To
tal
Mal
es
Fem
ales
To
tal
M
ales
Fe
mal
es
Tota
l 0
1,94
0 1,
790
3,73
0 1,
761
1,64
1 3,
402
1,87
5 1,
746
3,62
1 2,
144
1,99
5 4,
139
2,38
7 2,
221
4,60
8 1
1,96
8 1,
844
3,81
3 1,
821
1,71
4 3,
536
1,93
1 1,
816
3,74
8 2,
208
2,07
3 4,
281
2,45
0 2,
297
4,74
7 2
1,98
1 1,
870
3,85
2 1,
886
1,79
3 3,
679
1,98
9 1,
888
3,87
6 2,
270
2,14
8 4,
418
2,51
4 2,
374
4,88
8 3
1,98
4 1,
877
3,86
0 2,
281
2,16
1 4,
442
2,04
9 1,
962
4,01
1 2,
329
2,22
1 4,
551
2,57
9 2,
452
5,03
1 4
1,98
0 1,
871
3,85
1 2,
310
2,21
6 4,
526
2,11
5 2,
040
4,15
5 2,
388
2,29
3 4,
681
2,64
6 2,
532
5,17
8 0-
4 9,
853
9,25
2 19
,105
10
,061
9,
524
19,5
85
9,95
9 9,
452
19,4
11
11,3
39
10,7
30
22,0
69
12,5
76
11,8
76
24,4
52
5 1,
975
1,86
2 3,
837
2,26
4 2,
178
4,44
2 2,
450
2,34
4 4,
794
2,38
5 2,
300
4,68
6 2,
654
2,54
9 5,
203
6 1,
975
1,85
8 3,
833
2,14
7 2,
056
4,20
3 2,
360
2,27
1 4,
631
2,32
3 2,
243
4,56
6 2,
600
2,49
9 5,
099
7 1,
983
1,86
6 3,
849
2,02
5 1,
921
3,94
6 2,
255
2,16
9 4,
423
2,26
2 2,
186
4,44
8 2,
543
2,44
6 4,
989
8 2,
002
1,89
0 3,
892
1,96
1 1,
848
3,80
9 2,
138
2,04
7 4,
184
2,20
4 2,
132
4,33
5 2,
484
2,39
1 4,
875
9 2,
029
1,92
7 3,
956
1,96
1 1,
844
3,80
5 2,
015
1,91
2 3,
928
2,15
0 2,
082
4,23
2 2,
423
2,33
5 4,
758
5-9
9,96
5 9,
402
19,3
67
10,3
58
9,84
7 20
,206
11
,218
10
,743
21
,961
11
,324
10
,943
22
,267
12
,703
12
,221
24
,924
10
2,
057
1,96
7 4,
024
1,96
9 1,
852
3,82
1 1,
951
1,83
9 3,
791
2,42
6 2,
321
4,74
7 2,
361
2,27
8 4,
639
11
2,07
3 1,
993
4,06
6 1,
987
1,87
6 3,
863
1,95
1 1,
835
3,78
6 2,
336
2,24
8 4,
584
2,29
9 2,
220
4,51
9 12
2,
065
1,98
4 4,
049
2,01
4 1,
913
3,92
7 1,
959
1,84
3 3,
801
2,23
0 2,
146
4,37
6 2,
237
2,16
3 4,
400
13
2,02
3 1,
929
3,95
2 2,
042
1,95
3 3,
995
1,97
7 1,
866
3,84
4 2,
113
2,02
3 4,
136
2,17
9 2,
109
4,28
7 14
1,
955
1,83
9 3,
794
2,05
8 1,
979
4,03
7 2,
004
1,90
4 3,
907
1,99
0 1,
889
3,87
9 2,
125
2,05
9 4,
183
10-1
4 10
,173
9,
712
19,8
85
10,0
70
9,57
3 19
,642
9,
842
9,28
7 19
,129
11
,094
10
,627
21
,722
11
,200
10
,827
22
,028
15
1,
878
1,73
6 3,
615
2,05
0 1,
970
4,02
0 2,
032
1,94
4 3,
976
1,92
6 1,
816
3,74
2 2,
400
2,29
8 4,
698
16
1,80
2 1,
640
3,44
1 2,
009
1,91
6 3,
925
2,04
9 1,
971
4,01
9 1,
926
1,81
3 3,
739
2,31
1 2,
226
4,53
6 17
1,
720
1,55
0 3,
270
1,94
1 1,
827
3,76
8 2,
041
1,96
3 4,
003
1,93
5 1,
821
3,75
6 2,
205
2,12
4 4,
330
18
1,63
7 1,
474
3,11
1 1,
864
1,72
5 3,
589
1,99
9 1,
908
3,90
7 1,
953
1,84
6 3,
799
2,08
9 2,
003
4,09
1 19
1,
552
1,40
9 2,
961
1,78
7 1,
628
3,41
5 1,
932
1,81
9 3,
750
1,98
0 1,
883
3,86
3 1,
966
1,86
9 3,
835
15-1
9 8,
589
7,80
9 16
,398
9,
652
9,06
6 18
,718
10
,051
9,
605
19,6
56
9,72
1 9,
180
18,9
00
10,9
72
10,5
20
21,4
91
20
1,46
7 1,
348
2,81
4 1,
706
1,53
8 3,
244
1,85
5 1,
717
3,57
2 2,
008
1,92
4 3,
932
1,90
3 1,
796
3,69
9 21
1,
381
1,28
4 2,
665
1,62
3 1,
463
3,08
6 1,
778
1,62
1 3,
399
2,02
5 1,
951
3,97
6 1,
903
1,79
4 3,
696
22
1,29
7 1,
222
2,51
9 1,
539
1,39
9 2,
938
1,69
7 1,
531
3,22
8 2,
017
1,94
4 3,
960
1,91
1 1,
803
3,71
3 23
1,
216
1,16
3 2,
378
1,45
4 1,
338
2,79
2 1,
614
1,45
6 3,
070
1,97
5 1,
890
3,86
5 1,
929
1,82
8 3,
757
24
1,13
9 1,
107
2,24
6 1,
368
1,27
5 2,
642
1,53
0 1,
393
2,92
2 1,
907
1,80
2 3,
709
1,95
6 1,
866
3,82
2 20
-24
6,50
0 6,
123
12,6
23
7,69
0 7,
012
14,7
02
8,47
4 7,
718
16,1
92
9,93
1 9,
511
19,4
42
9,60
1 9,
086
18,6
88

NS
W D
epar
tmen
t of A
borig
inal
Affa
irs
Abo
rigin
al P
opul
atio
n P
roje
ctio
ns, N
SW
, 200
6-20
21
62
3
0 J
une
2006
30
Jun
e 20
09
3
0 J
une
2011
30
Jun
e 20
16
3
0 J
une
2021
Age
s
Mal
es
Fem
ales
To
tal
M
ales
Fe
mal
es
Tota
l
Mal
es
Fem
ales
To
tal
Mal
es
Fem
ales
To
tal
M
ales
Fe
mal
es
Tota
l 25
1,
063
1,05
2 2,
115
1,28
4 1,
213
2,49
7 1,
444
1,33
2 2,
776
1,83
1 1,
701
3,53
1 1,
983
1,90
8 3,
890
26
994
1,00
5 1,
999
1,20
3 1,
154
2,35
7 1,
359
1,26
9 2,
628
1,75
4 1,
605
3,35
9 1,
999
1,93
5 3,
934
27
948
978
1,92
6 1,
127
1,09
8 2,
226
1,27
5 1,
208
2,48
3 1,
673
1,51
6 3,
189
1,99
0 1,
928
3,91
8 28
93
1 97
6 1,
907
1,05
1 1,
044
2,09
5 1,
195
1,14
8 2,
343
1,59
0 1,
442
3,03
2 1,
948
1,87
5 3,
823
29
936
993
1,92
8 98
3 99
7 1,
979
1,11
9 1,
093
2,21
2 1,
506
1,37
8 2,
885
1,88
1 1,
787
3,66
8 25
-29
4,87
2 5,
003
9,87
5 5,
648
5,50
6 11
,154
6,
393
6,05
0 12
,443
8,
354
7,64
2 15
,996
9,
801
9,43
3 19
,233
30
94
9 1,
017
1,96
7 93
6 97
0 1,
906
1,04
3 1,
038
2,08
1 1,
421
1,31
8 2,
739
1,80
4 1,
686
3,49
0 31
96
1 1,
040
2,00
1 91
9 96
8 1,
886
974
991
1,96
5 1,
336
1,25
4 2,
590
1,72
7 1,
590
3,31
7 32
96
9 1,
057
2,02
6 92
3 98
4 1,
907
928
964
1,89
2 1,
252
1,19
3 2,
445
1,64
6 1,
501
3,14
7 33
96
9 1,
064
2,03
3 93
7 1,
009
1,94
5 91
1 96
2 1,
872
1,17
2 1,
134
2,30
5 1,
563
1,42
6 2,
989
34
961
1,06
3 2,
024
948
1,03
1 1,
979
915
978
1,89
3 1,
096
1,07
8 2,
174
1,47
9 1,
363
2,84
2 30
-34
4,81
0 5,
241
10,0
51
4,66
4 4,
960
9,62
4 4,
770
4,93
2 9,
702
6,27
7 5,
977
12,2
53
8,21
9 7,
566
15,7
84
35
954
1,06
1 2,
015
956
1,04
8 2,
004
928
1,00
2 1,
930
1,02
0 1,
023
2,04
3 1,
394
1,30
2 2,
696
36
950
1,06
0 2,
010
955
1,05
4 2,
009
939
1,02
4 1,
963
952
976
1,92
8 1,
309
1,23
8 2,
547
37
940
1,05
4 1,
995
947
1,05
3 2,
000
947
1,04
1 1,
988
906
948
1,85
4 1,
226
1,17
7 2,
403
38
925
1,04
4 1,
968
940
1,05
1 1,
991
946
1,04
8 1,
993
888
946
1,83
4 1,
146
1,11
7 2,
263
39
905
1,02
8 1,
933
935
1,04
9 1,
985
938
1,04
6 1,
983
892
961
1,85
3 1,
071
1,06
1 2,
132
35-3
9 4,
674
5,24
7 9,
921
4,73
4 5,
255
9,98
9 4,
697
5,16
1 9,
858
4,65
8 4,
853
9,51
1 6,
146
5,89
4 12
,040
40
88
2 1,
010
1,89
2 92
6 1,
044
1,96
9 93
0 1,
044
1,97
4 90
4 98
5 1,
889
995
1,00
6 2,
001
41
859
989
1,84
8 91
0 1,
033
1,94
3 92
5 1,
042
1,96
7 91
5 1,
007
1,92
2 92
8 95
8 1,
886
42
837
965
1,80
1 89
0 1,
017
1,90
7 91
6 1,
036
1,95
2 92
2 1,
023
1,94
4 88
2 93
0 1,
812
43
816
936
1,75
2 86
7 99
8 1,
865
900
1,02
5 1,
924
920
1,02
9 1,
949
863
927
1,79
1 44
79
7 90
3 1,
700
843
978
1,82
1 87
9 1,
009
1,88
7 91
1 1,
026
1,93
8 86
6 94
2 1,
809
40-4
4 4,
190
4,80
3 8,
993
4,43
5 5,
069
9,50
4 4,
550
5,15
5 9,
705
4,57
2 5,
069
9,64
2 4,
534
4,76
4 9,
298
45
777
868
1,64
6 82
1 95
3 1,
773
856
990
1,84
5 90
3 1,
023
1,92
7 87
8 96
5 1,
843
46
756
833
1,58
8 80
0 92
3 1,
723
832
969
1,80
1 89
7 1,
021
1,91
8 88
7 98
6 1,
873
47
732
796
1,52
9 78
0 89
1 1,
671
809
944
1,75
3 88
7 1,
014
1,90
1 89
3 1,
001
1,89
4 48
70
7 76
0 1,
467
760
856
1,61
6 78
8 91
4 1,
702
870
1,00
2 1,
872
889
1,00
6 1,
895
49
680
723
1,40
3 73
8 81
9 1,
557
768
881
1,64
9 84
8 98
5 1,
833
879
1,00
3 1,
882
45-4
9 3,
652
3,98
0 7,
632
3,89
9 4,
441
8,34
1 4,
053
4,69
8 8,
751
4,40
5 5,
046
9,45
0 4,
426
4,96
1 9,
387

NS
W D
epar
tmen
t of A
borig
inal
Affa
irs
Abo
rigin
al P
opul
atio
n P
roje
ctio
ns, N
SW
, 200
6-20
21
63
3
0 J
une
2006
30
Jun
e 20
09
3
0 J
une
2011
30
Jun
e 20
16
3
0 J
une
2021
Age
s
Mal
es
Fem
ales
To
tal
M
ales
Fe
mal
es
Tota
l
Mal
es
Fem
ales
To
tal
Mal
es
Fem
ales
To
tal
M
ales
Fe
mal
es
Tota
l 50
65
2 68
6 1,
338
714
783
1,49
7 74
7 84
6 1,
593
823
966
1,78
9 87
0 99
8 1,
868
51
624
648
1,27
2 68
8 74
6 1,
434
725
810
1,53
4 79
9 94
4 1,
742
862
995
1,85
7 52
59
5 61
4 1,
209
661
709
1,37
0 70
0 77
3 1,
473
775
917
1,69
2 84
9 98
6 1,
836
53
565
585
1,14
9 63
2 67
1 1,
303
674
735
1,40
9 75
2 88
7 1,
639
830
973
1,80
3 54
53
4 55
9 1,
092
603
633
1,23
6 64
5 69
8 1,
344
730
852
1,58
2 80
7 95
4 1,
760
50-5
4 2,
969
3,09
1 6,
060
3,29
8 3,
542
6,84
1 3,
491
3,86
2 7,
353
3,87
8 4,
565
8,44
4 4,
218
4,90
6 9,
124
55
502
535
1,03
7 57
3 59
9 1,
172
616
660
1,27
6 70
7 81
6 1,
523
780
932
1,71
2 56
47
2 51
0 98
2 54
3 56
9 1,
111
587
622
1,20
9 68
3 77
8 1,
461
753
908
1,66
1 57
44
2 48
2 92
3 51
1 54
2 1,
054
557
587
1,14
3 65
6 74
0 1,
396
727
880
1,60
6 58
41
3 44
8 86
1 47
9 51
8 99
7 52
5 55
6 1,
082
628
701
1,32
9 70
1 84
7 1,
548
59
386
410
797
448
492
940
493
529
1,02
2 59
8 66
3 1,
260
676
810
1,48
7 55
-59
2,21
5 2,
385
4,60
0 2,
554
2,72
0 5,
274
2,77
9 2,
954
5,73
3 3,
272
3,69
8 6,
970
3,63
8 4,
377
8,01
5 60
36
0 37
2 73
2 41
7 46
3 88
0 46
1 50
4 96
5 56
6 62
3 1,
190
651
772
1,42
2 61
33
5 33
7 67
1 38
8 42
9 81
7 42
9 47
8 90
7 53
5 58
4 1,
119
623
732
1,35
5 62
30
9 30
7 61
6 36
0 39
2 75
2 39
7 44
9 84
6 50
2 54
8 1,
050
593
692
1,28
5 63
28
3 28
4 56
7 33
3 35
3 68
7 36
8 41
4 78
2 46
9 51
6 98
4 56
1 65
1 1,
212
64
258
267
525
307
318
625
339
377
716
435
487
921
527
611
1,13
8 60
-64
1,54
5 1,
567
3,11
2 1,
806
1,95
6 3,
761
1,99
4 2,
222
4,21
6 2,
506
2,75
7 5,
263
2,95
4 3,
458
6,41
2 65
23
3 25
2 48
5 28
1 28
8 56
9 31
2 33
8 65
1 40
1 46
0 86
0 49
3 56
9 1,
063
66
209
237
447
255
265
520
286
303
589
367
432
799
459
528
987
67
190
223
413
230
247
478
260
273
533
335
401
736
424
490
914
68
175
208
383
205
232
437
234
250
484
304
366
670
389
456
844
69
164
193
357
182
216
398
209
232
441
275
328
603
353
425
778
65-6
9 97
1 1,
114
2,08
5 1,
154
1,24
8 2,
403
1,30
1 1,
396
2,69
7 1,
683
1,98
6 3,
669
2,11
8 2,
468
4,58
6 70
15
4 17
9 33
3 16
2 20
1 36
3 18
4 21
6 40
0 24
8 29
0 53
8 31
8 39
5 71
3 71
14
4 16
6 31
0 14
7 18
6 33
3 16
1 19
9 36
1 22
1 25
6 47
6 28
4 36
5 64
9 72
13
4 15
4 28
8 13
5 17
0 30
5 14
2 18
4 32
6 19
5 22
6 42
1 25
2 33
3 58
4 73
12
1 14
3 26
5 12
4 15
6 28
0 12
7 16
8 29
5 17
0 20
2 37
2 22
1 29
7 51
8 74
10
8 13
3 24
1 11
4 14
2 25
6 11
4 15
3 26
7 14
6 18
3 32
9 19
3 26
0 45
3 70
-74
661
776
1,43
7 68
3 85
4 1,
537
728
920
1,64
8 97
9 1,
157
2,13
6 1,
269
1,65
0 2,
919

NS
W D
epar
tmen
t of A
borig
inal
Affa
irs
Abo
rigin
al P
opul
atio
n P
roje
ctio
ns, N
SW
, 200
6-20
21
64
3
0 J
une
2006
30
Jun
e 20
09
3
0 J
une
2011
30
Jun
e 20
16
3
0 J
une
2021
Age
s
Mal
es
Fem
ales
To
tal
M
ales
Fe
mal
es
Tota
l
Mal
es
Fem
ales
To
tal
Mal
es
Fem
ales
To
tal
M
ales
Fe
mal
es
Tota
l 75
93
12
4 21
7 10
3 13
0 23
2 10
3 13
8 24
1 12
4 16
6 29
0 16
7 22
4 39
1 76
79
11
4 19
2 91
11
8 20
9 93
12
4 21
7 10
4 15
0 25
3 14
3 19
2 33
5 77
65
10
3 16
8 78
10
8 18
6 82
11
2 19
4 87
13
4 22
1 12
0 16
4 28
4 78
53
90
14
3 65
98
16
3 70
10
1 17
1 74
11
8 19
2 99
14
2 24
1 79
43
75
11
8 53
88
14
1 59
90
14
9 63
10
3 16
6 80
12
4 20
4 75
-79
333
505
838
389
542
931
408
564
972
451
671
1,12
2 60
9 84
7 1,
456
80+
257
446
703
217
443
661
216
454
670
234
489
722
259
562
821
Tota
l 76
,229
76
,456
15
2,68
5 81
,312
81
,559
16
2,87
1 84
,924
85
,172
17
0,09
6 94
,678
94
,901
18
9,58
0 10
5,24
4 10
5,41
5 21
0,65
9

NS
W D
epar
tmen
t of A
borig
inal
Affa
irs
Abo
rigin
al P
opul
atio
n P
roje
ctio
ns, N
SW
, 200
6-20
21
65
App
endi
x 2:
Pop
ulat
ion
Proj
ectio
ns b
y Si
ngle
Yea
rs o
f Age
and
Sex
, Cen
tral
Coa
st R
egio
n
30
Jun
e 20
06
3
0 J
une
2009
30
Jun
e 20
11
3
0 J
une
2016
30
Jun
e 20
21
Age
s
Mal
es
Fem
ales
To
tal
M
ales
Fe
mal
es
Tota
l
Mal
es
Fem
ales
To
tal
M
ales
Fe
mal
es
Tota
l
M
ales
Fem
ales
To
tal
0 89
80
16
9 86
80
16
6 94
87
18
1 11
2 10
5 21
7 12
8 11
9 24
8 1
88
82
171
88
83
171
96
90
186
115
108
224
131
123
255
2 89
84
17
3 91
87
17
8 98
94
19
2 11
8 11
2 23
0 13
4 12
7 26
2 3
92
84
176
108
101
208
101
97
198
120
115
236
138
131
269
4 95
85
17
9 10
7 10
3 21
0 10
4 10
0 20
4 12
3 11
8 24
1 14
1 13
5 27
6 0-
4 45
3 41
5 86
8 48
0 45
3 93
3 49
2 46
9 96
1 58
9 55
8 11
47
672
635
1308
5
98
85
183
106
101
207
118
111
229
122
118
241
141
136
277
6 10
1 86
18
6 10
2 95
19
8 11
2 10
7 21
9 11
9 11
5 23
4 13
8 13
3 27
2 7
103
87
190
100
90
189
107
102
209
116
112
228
136
130
266
8 10
4 89
19
3 10
0 87
18
7 10
4 97
20
1 11
3 10
9 22
2 13
3 12
7 26
0 9
105
92
196
103
88
191
101
91
192
110
107
217
130
124
254
5-9
510
439
949
511
460
971
542
508
1050
58
1 56
2 11
43
678
651
1329
10
10
4 95
19
9 10
5 89
19
4 10
2 88
19
0 12
2 11
4 23
6 12
6 12
2 24
8 11
10
4 97
20
1 10
7 91
19
8 10
5 89
19
4 11
6 11
1 22
6 12
3 11
9 24
2 12
10
4 97
20
1 10
7 94
20
1 10
7 91
19
8 11
1 10
6 21
7 12
0 11
6 23
6 13
10
5 95
20
0 10
7 97
20
4 10
8 93
20
1 10
8 10
0 20
8 11
7 11
3 23
0 14
10
6 92
19
8 10
6 99
20
5 10
9 96
20
4 10
5 95
20
0 11
4 11
1 22
5 10
-14
522
476
998
532
471
1003
53
0 45
7 98
7 56
2 52
6 10
88
601
579
1181
15
10
7 88
19
5 10
6 10
0 20
6 10
8 99
20
7 10
6 92
19
8 12
6 11
8 24
4 16
10
7 84
19
2 10
7 98
20
5 10
8 10
1 20
8 10
9 93
20
2 12
0 11
4 23
4 17
10
4 80
18
3 10
8 94
20
2 10
8 10
1 20
8 11
1 94
20
5 11
5 10
9 22
5 18
95
75
17
0 11
0 90
19
9 10
9 99
20
7 11
2 96
20
9 11
2 10
4 21
6 19
83
70
15
2 11
0 86
19
6 10
9 95
20
5 11
2 99
21
2 10
9 98
20
7 15
-19
496
396
892
540
467
1007
54
2 49
4 10
36
550
475
1025
58
2 54
4 11
25
20
69
64
133
106
81
187
111
91
202
112
102
213
109
95
204
21
56
59
115
97
76
173
111
87
197
111
103
214
112
96
207
22
47
55
101
84
71
155
107
82
189
110
103
214
114
97
210
23
42
51
93
70
65
135
97
77
174
111
101
212
114
99
213
24
41
49
89
57
60
117
84
72
156
111
97
208
114
101
215
20-2
4 25
4 27
8 53
2 41
3 35
4 76
7 51
0 40
8 91
8 55
5 50
6 10
61
563
487
1050
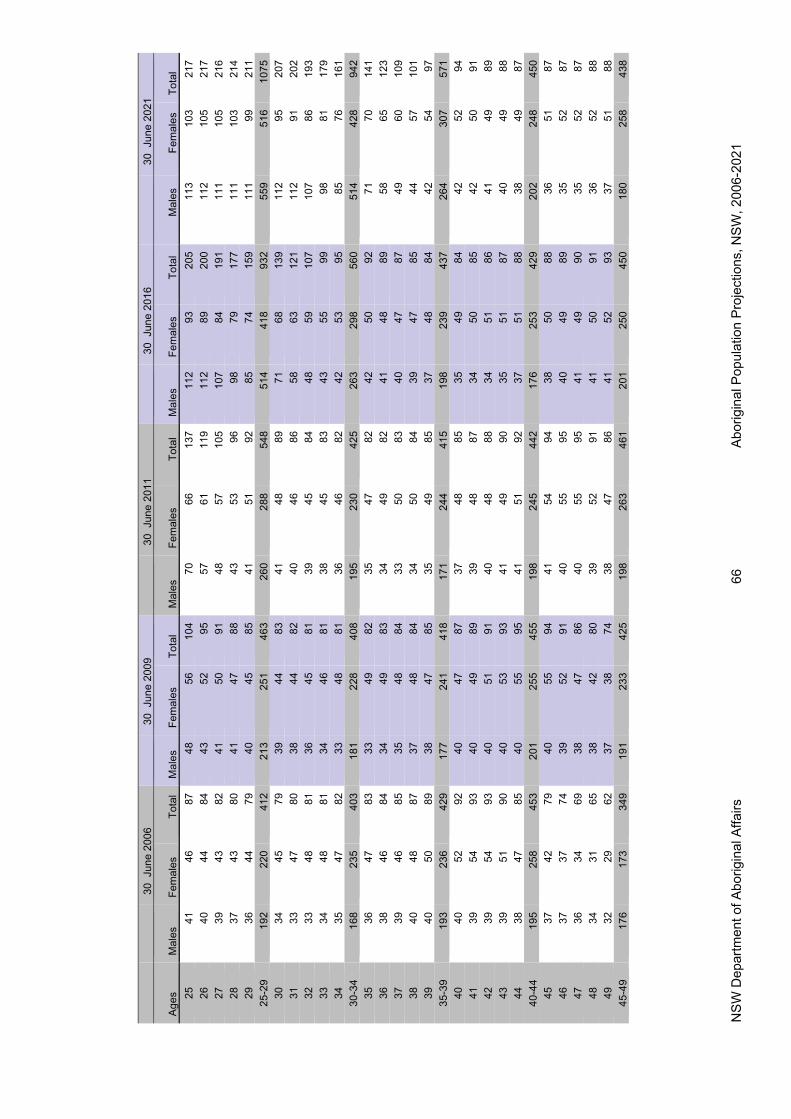
NS
W D
epar
tmen
t of A
borig
inal
Affa
irs
Abo
rigin
al P
opul
atio
n P
roje
ctio
ns, N
SW
, 200
6-20
21
66
3
0 J
une
2006
30
Jun
e 20
09
3
0 J
une
2011
30
Jun
e 20
16
3
0 J
une
2021
Age
s
Mal
es
Fem
ales
To
tal
M
ales
Fe
mal
es
Tota
l
Mal
es
Fem
ales
To
tal
M
ales
Fe
mal
es
Tota
l
M
ales
Fem
ales
To
tal
25
41
46
87
48
56
104
70
66
137
112
93
205
113
103
217
26
40
44
84
43
52
95
57
61
119
112
89
200
112
105
217
27
39
43
82
41
50
91
48
57
105
107
84
191
111
105
216
28
37
43
80
41
47
88
43
53
96
98
79
177
111
103
214
29
36
44
79
40
45
85
41
51
92
85
74
159
111
99
211
25-2
9 19
2 22
0 41
2 21
3 25
1 46
3 26
0 28
8 54
8 51
4 41
8 93
2 55
9 51
6 10
75
30
34
45
79
39
44
83
41
48
89
71
68
139
112
95
207
31
33
47
80
38
44
82
40
46
86
58
63
121
112
91
202
32
33
48
81
36
45
81
39
45
84
48
59
107
107
86
193
33
34
48
81
34
46
81
38
45
83
43
55
99
98
81
179
34
35
47
82
33
48
81
36
46
82
42
53
95
85
76
161
30-3
4 16
8 23
5 40
3 18
1 22
8 40
8 19
5 23
0 42
5 26
3 29
8 56
0 51
4 42
8 94
2 35
36
47
83
33
49
82
35
47
82
42
50
92
71
70
14
1 36
38
46
84
34
49
83
34
49
82
41
48
89
58
65
12
3 37
39
46
85
35
48
84
33
50
83
40
47
87
49
60
10
9 38
40
48
87
37
48
84
34
50
84
39
47
85
44
57
10
1 39
40
50
89
38
47
85
35
49
85
37
48
84
42
54
97
35
-39
193
236
429
177
241
418
171
244
415
198
239
437
264
307
571
40
40
52
92
40
47
87
37
48
85
35
49
84
42
52
94
41
39
54
93
40
49
89
39
48
87
34
50
85
42
50
91
42
39
54
93
40
51
91
40
48
88
34
51
86
41
49
89
43
39
51
90
40
53
93
41
49
90
35
51
87
40
49
88
44
38
47
85
40
55
95
41
51
92
37
51
88
38
49
87
40-4
4 19
5 25
8 45
3 20
1 25
5 45
5 19
8 24
5 44
2 17
6 25
3 42
9 20
2 24
8 45
0 45
37
42
79
40
55
94
41
54
94
38
50
88
36
51
87
46
37
37
74
39
52
91
40
55
95
40
49
89
35
52
87
47
36
34
69
38
47
86
40
55
95
41
49
90
35
52
87
48
34
31
65
38
42
80
39
52
91
41
50
91
36
52
88
49
32
29
62
37
38
74
38
47
86
41
52
93
37
51
88
45
-49
176
173
349
191
233
425
198
263
461
201
250
450
180
258
438

NS
W D
epar
tmen
t of A
borig
inal
Affa
irs
Abo
rigin
al P
opul
atio
n P
roje
ctio
ns, N
SW
, 200
6-20
21
67
3
0 J
une
2006
30
Jun
e 20
09
3
0 J
une
2011
30
Jun
e 20
16
3
0 J
une
2021
Age
s
Mal
es
Fem
ales
To
tal
M
ales
Fe
mal
es
Tota
l
Mal
es
Fem
ales
To
tal
M
ales
Fe
mal
es
Tota
l
M
ales
Fem
ales
To
tal
50
30
28
58
35
34
69
37
42
80
41
54
94
38
50
88
51
28
26
55
34
31
65
37
38
74
40
55
95
40
49
89
52
27
25
52
32
30
62
35
34
69
40
55
94
40
49
89
53
25
25
50
30
28
58
34
31
65
39
52
91
41
50
91
54
24
24
49
28
26
55
32
30
62
38
47
85
40
51
92
50-5
4 13
5 12
8 26
3 16
0 14
9 30
9 17
5 17
5 35
0 19
7 26
3 45
9 19
9 25
0 44
9 55
23
25
48
27
25
52
30
28
58
37
42
79
40
53
93
56
22
25
47
25
25
50
28
26
54
36
38
73
39
54
94
57
21
24
45
24
25
48
26
25
51
34
34
68
38
54
92
58
19
22
41
23
25
48
25
25
49
33
31
64
37
51
88
59
18
19
36
22
25
47
24
24
48
31
29
60
36
46
82
55
-59
103
115
218
120
124
244
133
129
261
171
174
344
191
259
450
60
16
15
31
20
24
44
22
25
47
29
28
56
35
41
76
61
14
12
26
19
22
40
21
24
46
27
26
52
34
36
70
62
13
10
23
17
18
35
20
23
43
25
24
49
32
32
65
63
12
9 21
15
15
30
18
21
39
23
23
47
30
29
60
64
11
10
21
14
11
25
17
18
34
22
23
45
28
27
56
60
-64
66
56
122
85
90
175
99
111
209
125
124
249
160
166
326
65
10
10
21
12
9 22
15
14
29
21
23
43
26
25
52
66
10
11
21
11
9
20
13
11
24
19
22
41
24
23
47
67
9 11
20
10
9
19
11
9 20
17
21
38
22
22
43
68
9
10
19
9 10
19
10
8
18
16
19
34
20
21
40
69
9 9
17
9 10
19
9
8 18
14
15
29
18
20
38
65
-69
47
51
98
51
47
98
58
51
109
86
100
186
109
111
220
70
8 7
16
8 10
18
8
9 17
12
12
24
16
20
36
71
8
6 14
8
9 17
8
9 17
10
9
19
15
19
34
72
8 6
13
7 8
15
7 9
16
9 7
16
13
18
31
73
7 5
12
7 6
13
7 8
15
7 7
14
11
15
27
74
6 6
12
6 5
12
6 7
13
7 7
13
10
12
22
70-7
4 37
30
67
36
39
74
36
43
78
44
42
87
65
84
14
9

NS
W D
epar
tmen
t of A
borig
inal
Affa
irs
Abo
rigin
al P
opul
atio
n P
roje
ctio
ns, N
SW
, 200
6-20
21
68
3
0 J
une
2006
30
Jun
e 20
09
3
0 J
une
2011
30
Jun
e 20
16
3
0 J
une
2021
Age
s
Mal
es
Fem
ales
To
tal
M
ales
Fe
mal
es
Tota
l
Mal
es
Fem
ales
To
tal
M
ales
Fe
mal
es
Tota
l
M
ales
Fem
ales
To
tal
75
5 6
11
6 5
11
6 6
11
6 7
13
8 9
17
76
4 6
11
5 4
10
5 5
10
5 7
12
7 7
14
77
3 7
10
5 5
9 5
4 9
4 7
11
5 5
11
78
2 6
8 4
5 8
4 4
8 4
6 10
4
5 9
79
0 6
6 3
5 8
3 4
7 3
5 8
4 5
8 75
-79
14
31
45
22
23
46
23
22
45
22
31
54
28
31
59
80+
13
19
32
9 24
33
10
24
35
13
22
35
13
26
39
To
tal
3574
35
56
7130
39
23
3909
78
31
4172
41
59
8331
48
47
4840
96
87
5581
55
80
1116
1

NS
W D
epar
tmen
t of A
borig
inal
Affa
irs
Abo
rigin
al P
opul
atio
n P
roje
ctio
ns, N
SW
, 200
6-20
21
69
App
endi
x 3:
Pop
ulat
ion
Proj
ectio
ns b
y Si
ngle
Yea
rs o
f Age
and
Sex
, Coa
stal
Syd
ney
Reg
ion
3
0 J
une
2006
30
Jun
e 20
09
3
0 J
une
2011
30
Jun
e 20
16
3
0 J
une
2021
Age
s
Mal
es
Fem
ales
To
tal
M
ales
Fe
mal
es
Tota
l
Mal
es
Fem
ales
To
tal
M
ales
Fe
mal
es
Tota
l
Mal
es
Fem
ales
To
tal
0 14
9 12
3 27
1 15
5 14
4 29
9 15
5 14
4 29
9 15
0 14
0 29
1 15
1 14
1 29
1 1
137
119
256
163
154
318
163
155
318
160
152
312
158
149
307
2 12
8 11
4 24
2 17
2 16
4 33
6 17
2 16
5 33
7 17
0 16
3 33
3 16
6 15
9 32
5 3
120
110
230
175
153
328
181
175
355
179
174
353
175
169
344
4 11
4 10
6 22
0 16
3 14
9 31
2 18
9 18
5 37
4 18
9 18
5 37
3 18
4 18
0 36
4 0-
4 64
8 57
1 1,
219
827
766
1,59
3 86
0 82
3 1,
683
849
813
1,66
2 83
3 79
8 1,
632
5 11
1 10
3 21
3 14
9 13
9 28
9 18
7 16
8 35
6 19
3 19
0 38
3 18
9 18
6 37
5 6
108
101
209
133
124
257
167
154
321
193
190
383
190
187
377
7 10
8 10
1 20
9 11
8 11
0 22
8 14
8 13
9 28
7 19
3 18
9 38
2 19
1 18
7 37
8 8
109
102
211
109
101
211
132
124
255
192
189
381
191
188
379
9 11
2 10
5 21
7 10
7 10
0 20
7 11
7 10
9 22
6 19
2 18
8 38
0 19
1 18
8 37
9 5-
9 54
8 51
1 1,
059
617
575
1,19
1 75
2 69
3 1,
445
964
945
1,90
9 95
3 93
5 1,
888
10
115
109
224
107
99
206
109
101
209
186
166
352
192
188
379
11
119
112
231
108
101
209
107
99
205
165
152
317
191
188
379
12
122
115
237
111
104
214
106
99
205
147
137
283
191
187
378
13
125
115
240
114
107
221
107
100
207
130
122
251
190
187
377
14
128
114
242
118
111
229
110
103
213
115
107
222
190
186
376
10-1
4 60
9 56
5 1,
174
557
522
1,07
9 53
8 50
1 1,
039
742
683
1,42
5 95
4 93
5 1,
889
15
130
113
243
121
113
235
113
107
220
107
99
205
184
164
348
16
132
112
244
124
114
238
117
110
227
105
97
201
163
150
313
17
133
112
246
126
113
240
120
113
233
104
97
201
145
134
279
18
133
114
247
129
112
240
123
113
236
105
98
203
128
119
247
19
132
118
249
131
111
242
126
112
238
108
101
208
113
105
218
15-1
9 66
0 56
9 1,
229
631
563
1,19
4 59
9 55
5 1,
154
529
491
1,01
9 73
2 67
3 1,
405
20
130
122
252
132
111
243
128
111
239
111
104
215
105
97
201
21
128
125
253
132
113
245
130
110
240
115
108
223
102
95
197
22
125
125
250
130
116
246
131
110
241
118
110
229
102
94
196
23
120
123
243
128
120
249
131
112
243
121
111
232
103
96
199
24
115
118
232
127
123
250
129
116
245
123
110
233
105
99
204
20-2
4 61
8 61
2 1,
230
649
584
1,23
3 64
9 55
8 1,
207
588
544
1,13
2 51
7 48
0 99
7
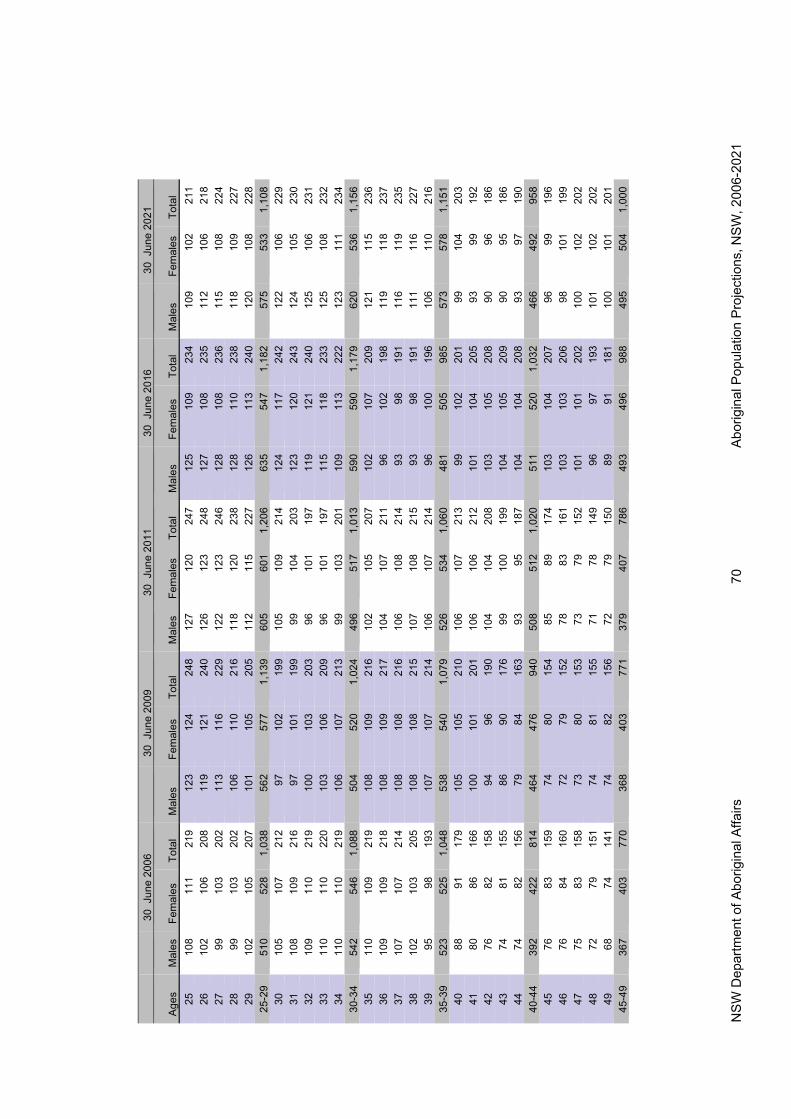
NS
W D
epar
tmen
t of A
borig
inal
Affa
irs
Abo
rigin
al P
opul
atio
n P
roje
ctio
ns, N
SW
, 200
6-20
21
70
3
0 J
une
2006
30
Jun
e 20
09
3
0 J
une
2011
30
Jun
e 20
16
3
0 J
une
2021
Age
s
Mal
es
Fem
ales
To
tal
M
ales
Fe
mal
es
Tota
l
Mal
es
Fem
ales
To
tal
M
ales
Fe
mal
es
Tota
l
Mal
es
Fem
ales
To
tal
25
108
111
219
123
124
248
127
120
247
125
109
234
109
102
211
26
102
106
208
119
121
240
126
123
248
127
108
235
112
106
218
27
99
103
202
113
116
229
122
123
246
128
108
236
115
108
224
28
99
103
202
106
110
216
118
120
238
128
110
238
118
109
227
29
102
105
207
101
105
205
112
115
227
126
113
240
120
108
228
25-2
9 51
0 52
8 1,
038
562
577
1,13
9 60
5 60
1 1,
206
635
547
1,18
2 57
5 53
3 1,
108
30
105
107
212
97
102
199
105
109
214
124
117
242
122
106
229
31
108
109
216
97
101
199
99
104
203
123
120
243
124
105
230
32
109
110
219
100
103
203
96
101
197
119
121
240
125
106
231
33
110
110
220
103
106
209
96
101
197
115
118
233
125
108
232
34
110
110
219
106
107
213
99
103
201
109
113
222
123
111
234
30-3
4 54
2 54
6 1,
088
504
520
1,02
4 49
6 51
7 1,
013
590
590
1,17
9 62
0 53
6 1,
156
35
110
109
219
108
109
216
102
105
207
102
107
209
121
115
236
36
109
109
218
108
109
217
104
107
211
96
102
198
119
118
237
37
107
107
214
108
108
216
106
108
214
93
98
191
116
119
235
38
102
103
205
108
108
215
107
108
215
93
98
191
111
116
227
39
95
98
193
107
107
214
106
107
214
96
100
196
106
110
216
35-3
9 52
3 52
5 1,
048
538
540
1,07
9 52
6 53
4 1,
060
481
505
985
573
578
1,15
1 40
88
91
17
9 10
5 10
5 21
0 10
6 10
7 21
3 99
10
2 20
1 99
10
4 20
3 41
80
86
16
6 10
0 10
1 20
1 10
6 10
6 21
2 10
1 10
4 20
5 93
99
19
2 42
76
82
15
8 94
96
19
0 10
4 10
4 20
8 10
3 10
5 20
8 90
96
18
6 43
74
81
15
5 86
90
17
6 99
10
0 19
9 10
4 10
5 20
9 90
95
18
6 44
74
82
15
6 79
84
16
3 93
95
18
7 10
4 10
4 20
8 93
97
19
0 40
-44
392
422
814
464
476
940
508
512
1,02
0 51
1 52
0 1,
032
466
492
958
45
76
83
159
74
80
154
85
89
174
103
104
207
96
99
196
46
76
84
160
72
79
152
78
83
161
103
103
206
98
101
199
47
75
83
158
73
80
153
73
79
152
101
101
202
100
102
202
48
72
79
151
74
81
155
71
78
149
96
97
193
101
102
202
49
68
74
141
74
82
156
72
79
150
89
91
181
100
101
201
45-4
9 36
7 40
3 77
0 36
8 40
3 77
1 37
9 40
7 78
6 49
3 49
6 98
8 49
5 50
4 1,
000
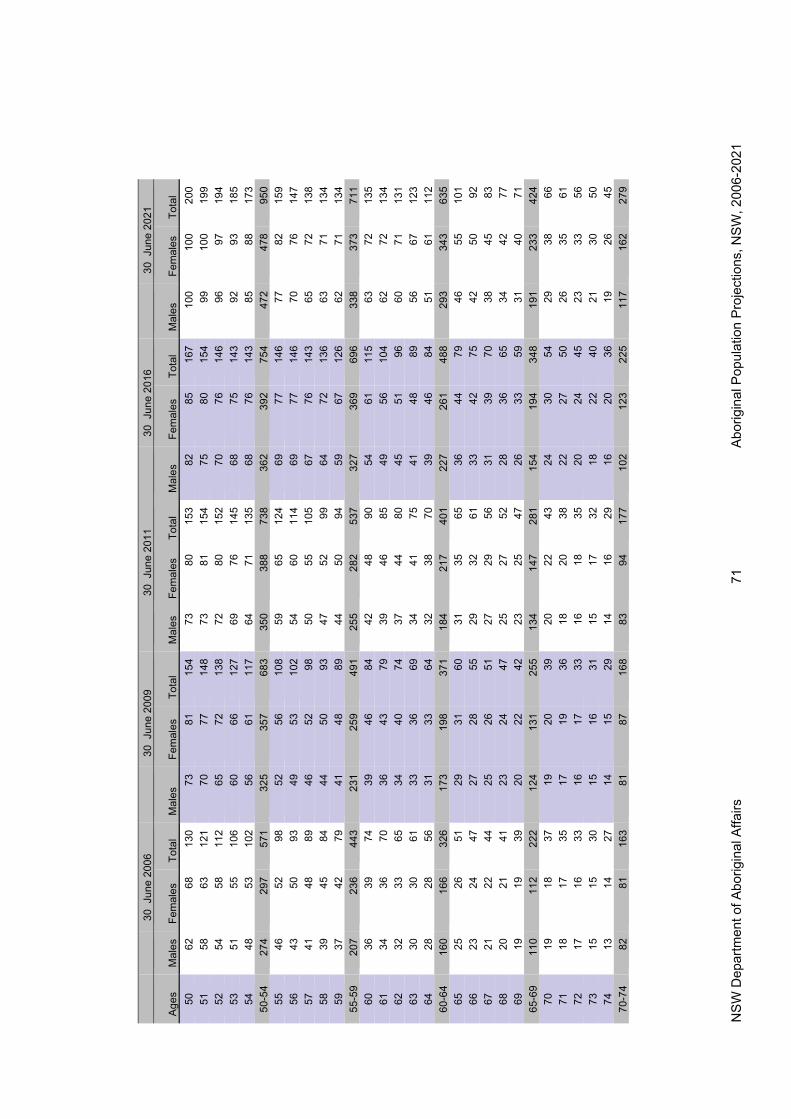
NS
W D
epar
tmen
t of A
borig
inal
Affa
irs
Abo
rigin
al P
opul
atio
n P
roje
ctio
ns, N
SW
, 200
6-20
21
71
3
0 J
une
2006
30
Jun
e 20
09
3
0 J
une
2011
30
Jun
e 20
16
3
0 J
une
2021
Age
s
Mal
es
Fem
ales
To
tal
M
ales
Fe
mal
es
Tota
l
Mal
es
Fem
ales
To
tal
M
ales
Fe
mal
es
Tota
l
Mal
es
Fem
ales
To
tal
50
62
68
130
73
81
154
73
80
153
82
85
167
100
100
200
51
58
63
121
70
77
148
73
81
154
75
80
154
99
100
199
52
54
58
112
65
72
138
72
80
152
70
76
146
96
97
194
53
51
55
106
60
66
127
69
76
145
68
75
143
92
93
185
54
48
53
102
56
61
117
64
71
135
68
76
143
85
88
173
50-5
4 27
4 29
7 57
1 32
5 35
7 68
3 35
0 38
8 73
8 36
2 39
2 75
4 47
2 47
8 95
0 55
46
52
98
52
56
10
8 59
65
12
4 69
77
14
6 77
82
15
9 56
43
50
93
49
53
10
2 54
60
11
4 69
77
14
6 70
76
14
7 57
41
48
89
46
52
98
50
55
10
5 67
76
14
3 65
72
13
8 58
39
45
84
44
50
93
47
52
99
64
72
13
6 63
71
13
4 59
37
42
79
41
48
89
44
50
94
59
67
12
6 62
71
13
4 55
-59
207
236
443
231
259
491
255
282
537
327
369
696
338
373
711
60
36
39
74
39
46
84
42
48
90
54
61
115
63
72
135
61
34
36
70
36
43
79
39
46
85
49
56
104
62
72
134
62
32
33
65
34
40
74
37
44
80
45
51
96
60
71
131
63
30
30
61
33
36
69
34
41
75
41
48
89
56
67
123
64
28
28
56
31
33
64
32
38
70
39
46
84
51
61
112
60-6
4 16
0 16
6 32
6 17
3 19
8 37
1 18
4 21
7 40
1 22
7 26
1 48
8 29
3 34
3 63
5 65
25
26
51
29
31
60
31
35
65
36
44
79
46
55
10
1 66
23
24
47
27
28
55
29
32
61
33
42
75
42
50
92
67
21
22
44
25
26
51
27
29
56
31
39
70
38
45
83
68
20
21
41
23
24
47
25
27
52
28
36
65
34
42
77
69
19
19
39
20
22
42
23
25
47
26
33
59
31
40
71
65
-69
110
112
222
124
131
255
134
147
281
154
194
348
191
233
424
70
19
18
37
19
20
39
20
22
43
24
30
54
29
38
66
71
18
17
35
17
19
36
18
20
38
22
27
50
26
35
61
72
17
16
33
16
17
33
16
18
35
20
24
45
23
33
56
73
15
15
30
15
16
31
15
17
32
18
22
40
21
30
50
74
13
14
27
14
15
29
14
16
29
16
20
36
19
26
45
70-7
4 82
81
16
3 81
87
16
8 83
94
17
7 10
2 12
3 22
5 11
7 16
2 27
9

NS
W D
epar
tmen
t of A
borig
inal
Affa
irs
Abo
rigin
al P
opul
atio
n P
roje
ctio
ns, N
SW
, 200
6-20
21
72
3
0 J
une
2006
30
Jun
e 20
09
3
0 J
une
2011
30
Jun
e 20
16
3
0 J
une
2021
Age
s
Mal
es
Fem
ales
To
tal
M
ales
Fe
mal
es
Tota
l
Mal
es
Fem
ales
To
tal
M
ales
Fe
mal
es
Tota
l
Mal
es
Fem
ales
To
tal
75
11
12
24
13
14
27
13
14
27
14
18
31
17
23
40
76
9 11
20
11
13
24
12
13
25
12
15
27
15
21
35
77
7
10
16
10
11
21
10
12
22
10
14
24
13
18
31
78
4 8
13
8 10
18
9
11
20
9 12
21
11
16
26
79
2
7 9
6 9
15
7 9
17
8 11
18
9
13
22
75-7
9 33
49
82
48
56
10
4 51
60
11
1 52
69
12
1 64
91
15
4 80
+ 35
77
11
2 25
63
87
25
58
83
29
56
86
31
61
92
To
tal
6,31
8 6,
270
12,5
88
6,72
6 6,
676
13,4
02
6,99
4 6,
946
13,9
40
7,63
3 7,
598
15,2
31
8,22
3 8,
205
16,4
28

NS
W D
epar
tmen
t of A
borig
inal
Affa
irs
Abo
rigin
al P
opul
atio
n P
roje
ctio
ns, N
SW
, 200
6-20
21
73
App
endi
x 4:
Pop
ulat
ion
Proj
ectio
ns b
y Si
ngle
Yea
rs o
f Age
and
Sex
, Hun
ter R
egio
n
30
Jun
e 20
06
3
0 J
une
2009
30
Jun
e 20
11
3
0 J
une
2016
30
Jun
e 20
21
Age
s
Mal
es
Fem
ales
To
tal
M
ales
Fe
mal
es
Tota
l
Mal
es
Fem
ales
To
tal
M
ales
Fe
mal
es
Tota
l
Mal
es
Fem
ales
To
tal
0 22
4 21
6 44
0 19
8 18
5 38
3 21
5 20
0 41
5 25
2 23
5 48
7 28
7 26
7 55
4 1
222
215
437
204
192
397
220
207
428
259
243
503
293
275
568
2 21
8 21
3 43
1 21
1 20
1 41
2 22
6 21
5 44
1 26
6 25
2 51
8 30
0 28
3 58
3 3
213
212
425
265
261
526
232
222
455
272
259
532
307
292
599
4 20
8 21
1 41
9 26
4 26
0 52
3 23
9 23
1 47
0 27
8 26
7 54
6 31
5 30
1 61
5 0-
4 1,
084
1,06
7 2,
151
1,14
3 1,
099
2,24
2 1,
133
1,07
5 2,
208
1,32
8 1,
256
2,58
5 1,
502
1,41
7 2,
919
5 20
4 21
0 41
4 25
3 25
1 50
4 28
7 28
4 57
0 27
8 26
8 54
5 31
5 30
2 61
8 6
203
209
412
235
235
470
271
268
540
270
261
531
309
297
606
7 20
4 21
0 41
4 21
7 22
0 43
6 25
4 25
2 50
6 26
3 25
4 51
6 30
2 29
0 59
3 8
209
211
420
206
211
418
236
236
472
255
247
502
295
284
579
9 21
7 21
3 43
0 20
5 21
1 41
6 21
8 22
1 43
8 24
9 24
1 48
9 28
8 27
7 56
5 5-
9 1,
038
1,05
2 2,
090
1,11
5 1,
128
2,24
4 1,
266
1,26
2 2,
527
1,31
4 1,
270
2,58
4 1,
510
1,45
1 2,
961
10
226
215
440
206
211
418
207
213
420
290
287
576
281
270
551
11
233
216
449
211
213
424
206
212
418
275
271
546
273
264
537
12
236
215
451
219
214
434
208
213
420
257
255
513
266
257
523
13
232
212
444
228
216
444
213
214
427
239
239
479
259
250
509
14
224
207
431
235
217
453
221
216
436
221
224
445
252
244
496
10-1
4 1,
150
1,06
5 2,
215
1,10
0 1,
072
2,17
2 1,
055
1,06
7 2,
122
1,28
2 1,
276
2,55
9 1,
331
1,28
4 2,
615
15
214
202
416
238
217
455
229
218
447
211
215
427
293
290
583
16
204
196
401
234
214
448
236
219
455
210
215
425
278
274
552
17
195
189
384
225
209
435
239
218
457
211
215
427
261
258
519
18
186
180
366
215
204
419
235
215
450
216
217
432
242
242
485
19
178
169
348
206
198
404
226
210
437
223
218
442
224
226
451
15-1
9 97
8 93
6 1,
914
1,11
9 1,
041
2,16
0 1,
166
1,07
9 2,
246
1,07
1 1,
081
2,15
2 1,
298
1,29
1 2,
589
20
170
159
329
197
190
387
216
205
421
232
220
452
214
218
432
21
161
148
310
188
181
369
207
199
405
238
221
459
212
217
429
22
152
138
290
179
170
350
197
191
388
241
220
461
213
218
431
23
143
128
271
171
160
330
188
182
370
236
217
454
217
219
436
24
134
118
252
162
149
311
179
171
351
228
212
439
224
220
445
20-2
4 76
0 69
1 1,
451
896
851
1,74
7 98
7 94
7 1,
934
1,17
5 1,
090
2,26
5 1,
080
1,09
2 2,
172
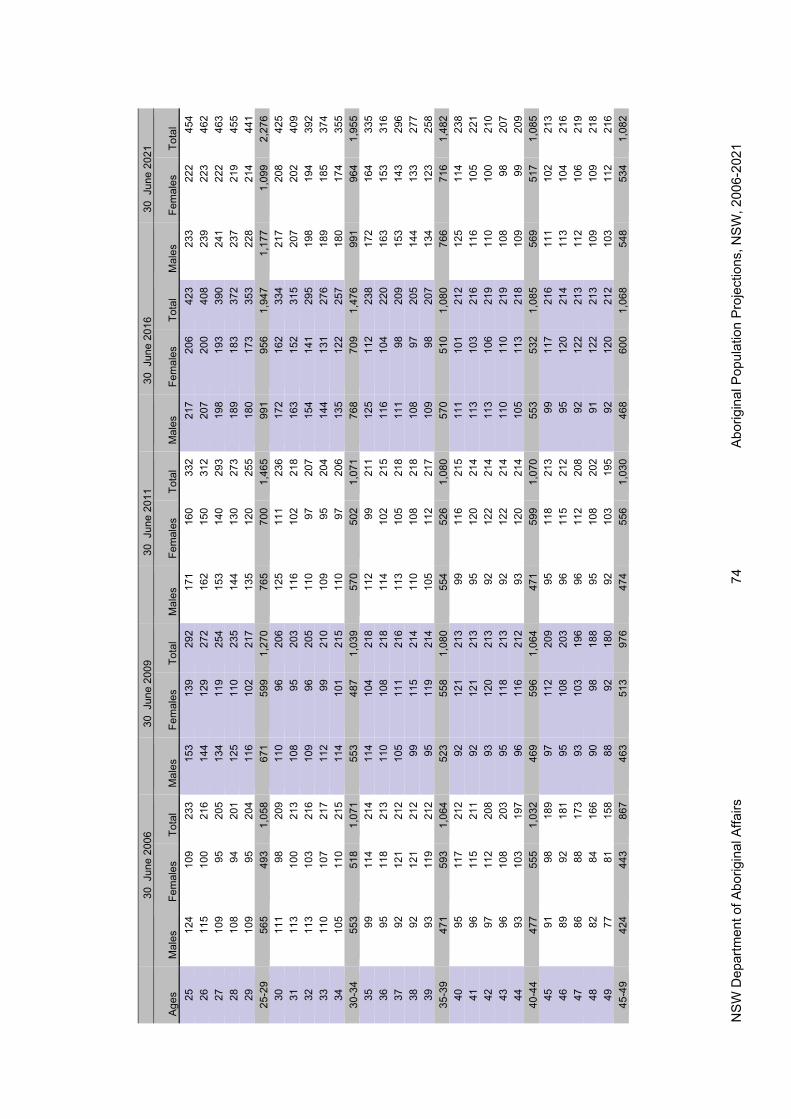
NS
W D
epar
tmen
t of A
borig
inal
Affa
irs
Abo
rigin
al P
opul
atio
n P
roje
ctio
ns, N
SW
, 200
6-20
21
74
3
0 J
une
2006
30
Jun
e 20
09
3
0 J
une
2011
30
Jun
e 20
16
3
0 J
une
2021
Age
s
Mal
es
Fem
ales
To
tal
M
ales
Fe
mal
es
Tota
l
Mal
es
Fem
ales
To
tal
M
ales
Fe
mal
es
Tota
l
Mal
es
Fem
ales
To
tal
25
124
109
233
153
139
292
171
160
332
217
206
423
233
222
454
26
115
100
216
144
129
272
162
150
312
207
200
408
239
223
462
27
109
95
205
134
119
254
153
140
293
198
193
390
241
222
463
28
108
94
201
125
110
235
144
130
273
189
183
372
237
219
455
29
109
95
204
116
102
217
135
120
255
180
173
353
228
214
441
25-2
9 56
5 49
3 1,
058
671
599
1,27
0 76
5 70
0 1,
465
991
956
1,94
7 1,
177
1,09
9 2,
276
30
111
98
209
110
96
206
125
111
236
172
162
334
217
208
425
31
113
100
213
108
95
203
116
102
218
163
152
315
207
202
409
32
113
103
216
109
96
205
110
97
207
154
141
295
198
194
392
33
110
107
217
112
99
210
109
95
204
144
131
276
189
185
374
34
105
110
215
114
101
215
110
97
206
135
122
257
180
174
355
30-3
4 55
3 51
8 1,
071
553
487
1,03
9 57
0 50
2 1,
071
768
709
1,47
6 99
1 96
4 1,
955
35
99
114
214
114
104
218
112
99
211
125
112
238
172
164
335
36
95
118
213
110
108
218
114
102
215
116
104
220
163
153
316
37
92
121
212
105
111
216
113
105
218
111
98
209
153
143
296
38
92
121
212
99
115
214
110
108
218
108
97
205
144
133
277
39
93
119
212
95
119
214
105
112
217
109
98
207
134
123
258
35-3
9 47
1 59
3 1,
064
523
558
1,08
0 55
4 52
6 1,
080
570
510
1,08
0 76
6 71
6 1,
482
40
95
117
212
92
121
213
99
116
215
111
101
212
125
114
238
41
96
115
211
92
121
213
95
120
214
113
103
216
116
105
221
42
97
112
208
93
120
213
92
122
214
113
106
219
110
100
210
43
96
108
203
95
118
213
92
122
214
110
110
219
108
98
207
44
93
103
197
96
116
212
93
120
214
105
113
218
109
99
209
40-4
4 47
7 55
5 1,
032
469
596
1,06
4 47
1 59
9 1,
070
553
532
1,08
5 56
9 51
7 1,
085
45
91
98
189
97
112
209
95
118
213
99
117
216
111
102
213
46
89
92
181
95
108
203
96
115
212
95
120
214
113
104
216
47
86
88
173
93
103
196
96
112
208
92
122
213
112
106
219
48
82
84
166
90
98
188
95
108
202
91
122
213
109
109
218
49
77
81
158
88
92
180
92
103
195
92
120
212
103
112
216
45-4
9 42
4 44
3 86
7 46
3 51
3 97
6 47
4 55
6 1,
030
468
600
1,06
8 54
8 53
4 1,
082

NS
W D
epar
tmen
t of A
borig
inal
Affa
irs
Abo
rigin
al P
opul
atio
n P
roje
ctio
ns, N
SW
, 200
6-20
21
75
3
0 J
une
2006
30
Jun
e 20
09
3
0 J
une
2011
30
Jun
e 20
16
3
0 J
une
2021
Age
s
Mal
es
Fem
ales
To
tal
M
ales
Fe
mal
es
Tota
l
Mal
es
Fem
ales
To
tal
M
ales
Fe
mal
es
Tota
l
Mal
es
Fem
ales
To
tal
50
71
79
150
85
87
172
90
97
187
94
117
211
97
116
213
51
66
76
142
81
84
164
87
92
179
94
114
209
93
119
211
52
61
72
134
76
81
156
84
87
171
94
111
205
90
120
210
53
58
67
125
70
78
148
80
83
163
92
106
199
89
120
209
54
55
62
117
65
75
140
74
80
155
89
101
191
89
118
207
50-5
4 31
2 35
6 66
8 37
6 40
5 78
1 41
5 43
9 85
4 46
3 55
0 1,
013
458
592
1,05
0 55
53
56
10
9 60
72
13
2 69
78
14
7 87
96
18
2 90
11
5 20
5 56
50
50
10
1 57
67
12
3 64
75
13
8 84
90
17
4 90
11
2 20
2 57
48
46
94
54
61
11
5 59
71
13
0 80
85
16
5 90
10
8 19
8 58
45
42
88
51
55
10
6 56
66
12
1 76
81
15
7 88
10
3 19
1 59
42
40
82
49
49
98
53
60
11
3 70
78
14
8 84
98
18
2 55
-59
239
234
473
271
303
574
300
349
649
397
429
826
443
536
979
60
40
38
78
46
45
91
50
54
104
65
75
140
81
92
173
61
37
36
73
43
41
85
47
49
96
59
72
131
78
86
164
62
35
34
69
40
39
79
45
44
88
55
68
122
74
81
155
63
32
32
65
38
37
74
42
41
82
51
62
113
69
77
146
64
30
31
61
35
35
70
39
38
77
48
57
104
64
73
137
60-6
4 17
4 17
1 34
5 20
2 19
7 39
9 22
2 22
5 44
7 27
8 33
3 61
1 36
6 40
9 77
5 65
28
29
58
32
33
65
36
36
71
45
51
95
58
70
12
8 66
26
28
55
30
31
60
33
33
66
42
45
86
52
66
11
8 67
24
27
51
27
29
56
30
31
61
38
40
78
47
61
10
8 68
22
25
46
25
27
52
27
29
56
35
36
71
43
56
99
69
19
22
41
23
26
49
25
27
52
32
34
65
39
50
89
65
-69
120
131
251
137
145
283
150
156
307
191
205
397
238
303
541
70
17
20
37
21
24
45
23
26
48
28
31
59
36
44
79
71
15
17
32
19
22
41
20
24
44
25
28
54
32
38
71
72
13
15
28
16
20
36
18
22
41
23
26
49
29
33
62
73
11
14
25
14
17
31
16
20
36
20
24
44
26
30
55
74
10
13
23
12
15
27
14
18
31
18
22
39
22
27
49
70-7
4 66
79
14
5 81
98
17
9 91
11
0 20
1 11
4 13
1 24
5 14
5 17
2 31
7
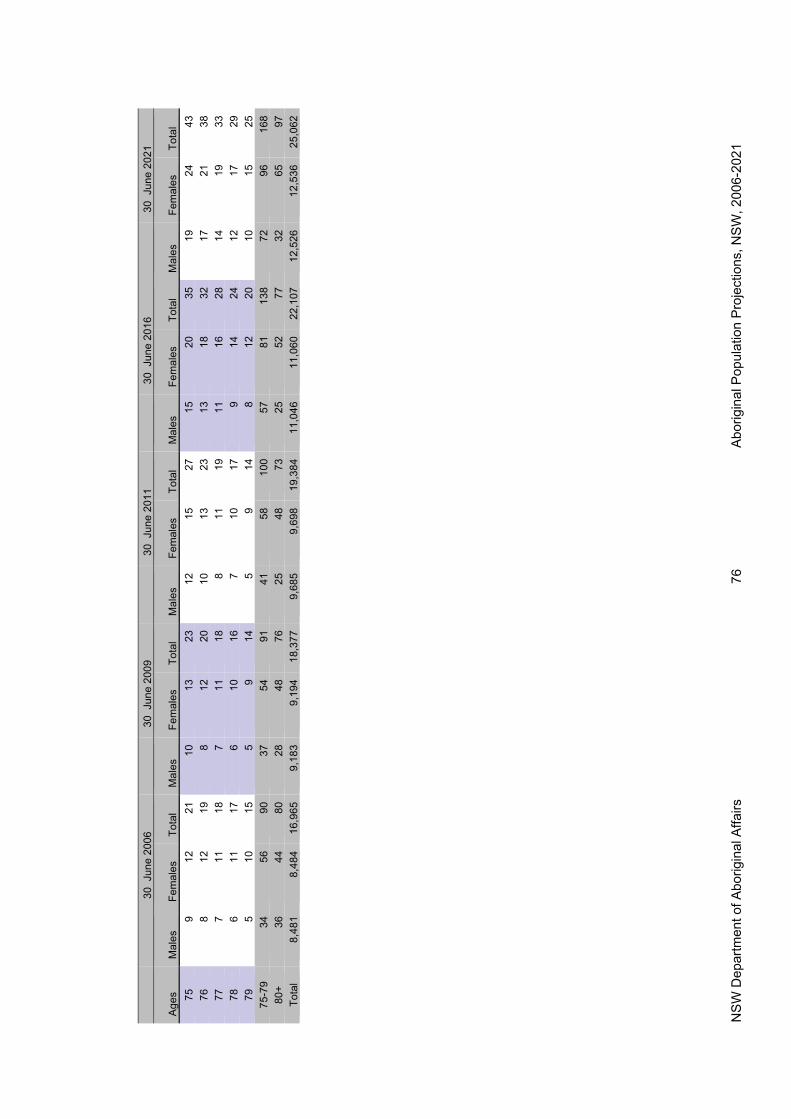
NS
W D
epar
tmen
t of A
borig
inal
Affa
irs
Abo
rigin
al P
opul
atio
n P
roje
ctio
ns, N
SW
, 200
6-20
21
76
3
0 J
une
2006
30
Jun
e 20
09
3
0 J
une
2011
30
Jun
e 20
16
3
0 J
une
2021
Age
s
Mal
es
Fem
ales
To
tal
M
ales
Fe
mal
es
Tota
l
Mal
es
Fem
ales
To
tal
M
ales
Fe
mal
es
Tota
l
Mal
es
Fem
ales
To
tal
75
9 12
21
10
13
23
12
15
27
15
20
35
19
24
43
76
8
12
19
8 12
20
10
13
23
13
18
32
17
21
38
77
7
11
18
7 11
18
8
11
19
11
16
28
14
19
33
78
6 11
17
6
10
16
7 10
17
9
14
24
12
17
29
79
5 10
15
5
9 14
5
9 14
8
12
20
10
15
25
75-7
9 34
56
90
37
54
91
41
58
10
0 57
81
13
8 72
96
16
8 80
+ 36
44
80
28
48
76
25
48
73
25
52
77
32
65
97
To
tal
8,48
1 8,
484
16,9
65
9,18
3 9,
194
18,3
77
9,68
5 9,
698
19,3
84
11,0
46
11,0
60
22,1
07
12,5
26
12,5
36
25,0
62
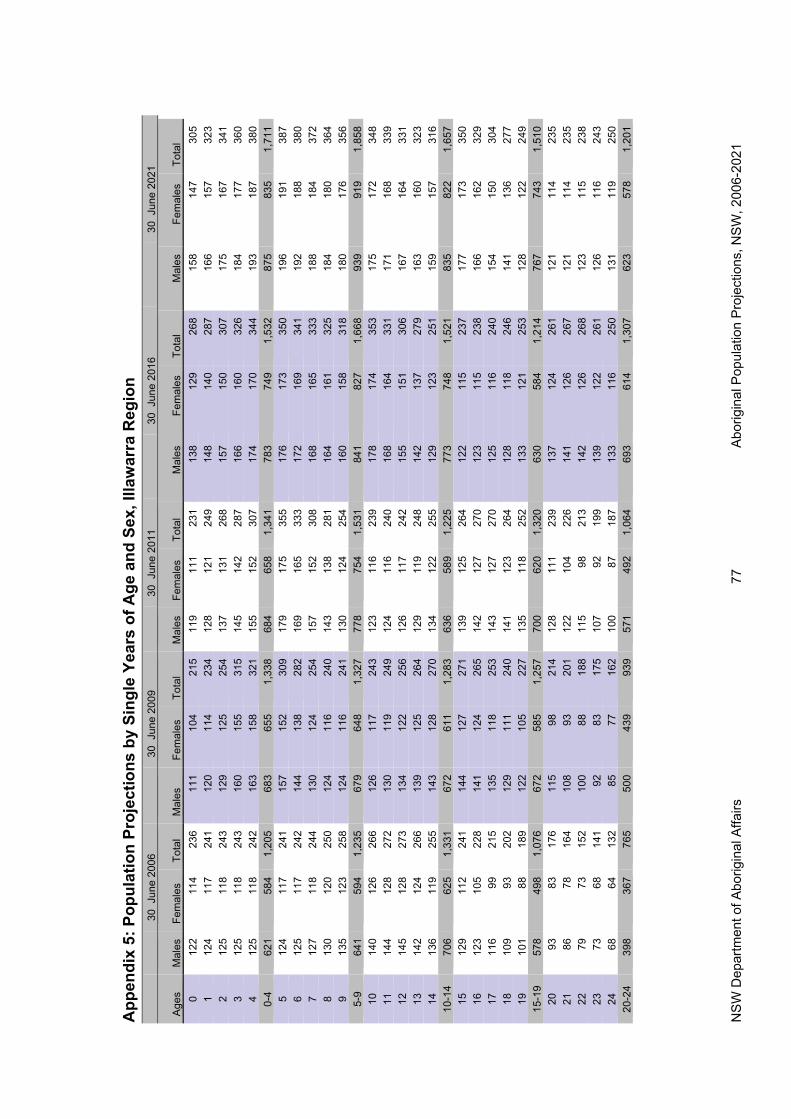
NS
W D
epar
tmen
t of A
borig
inal
Affa
irs
Abo
rigin
al P
opul
atio
n P
roje
ctio
ns, N
SW
, 200
6-20
21
77
App
endi
x 5:
Pop
ulat
ion
Proj
ectio
ns b
y Si
ngle
Yea
rs o
f Age
and
Sex
, Illa
war
ra R
egio
n
30
Jun
e 20
06
3
0 J
une
2009
30
Jun
e 20
11
3
0 J
une
2016
30
Jun
e 20
21
Age
s
Mal
es
Fem
ales
To
tal
M
ales
Fe
mal
es
Tota
l
Mal
es
Fem
ales
To
tal
Mal
es
F
emal
es
Tota
l
M
ales
Fem
ales
To
tal
0 12
2 11
4 23
6 11
1 10
4 21
5 11
9 11
1 23
1 13
8 12
9 26
8 15
8 14
7 30
5 1
124
117
241
120
114
234
128
121
249
148
140
287
166
157
323
2 12
5 11
8 24
3 12
9 12
5 25
4 13
7 13
1 26
8 15
7 15
0 30
7 17
5 16
7 34
1 3
125
118
243
160
155
315
145
142
287
166
160
326
184
177
360
4 12
5 11
8 24
2 16
3 15
8 32
1 15
5 15
2 30
7 17
4 17
0 34
4 19
3 18
7 38
0 0-
4 62
1 58
4 1,
205
683
655
1,33
8 68
4 65
8 1,
341
783
749
1,53
2 87
5 83
5 1,
711
5 12
4 11
7 24
1 15
7 15
2 30
9 17
9 17
5 35
5 17
6 17
3 35
0 19
6 19
1 38
7 6
125
117
242
144
138
282
169
165
333
172
169
341
192
188
380
7 12
7 11
8 24
4 13
0 12
4 25
4 15
7 15
2 30
8 16
8 16
5 33
3 18
8 18
4 37
2 8
130
120
250
124
116
240
143
138
281
164
161
325
184
180
364
9 13
5 12
3 25
8 12
4 11
6 24
1 13
0 12
4 25
4 16
0 15
8 31
8 18
0 17
6 35
6 5-
9 64
1 59
4 1,
235
679
648
1,32
7 77
8 75
4 1,
531
841
827
1,66
8 93
9 91
9 1,
858
10
140
126
266
126
117
243
123
116
239
178
174
353
175
172
348
11
144
128
272
130
119
249
124
116
240
168
164
331
171
168
339
12
145
128
273
134
122
256
126
117
242
155
151
306
167
164
331
13
142
124
266
139
125
264
129
119
248
142
137
279
163
160
323
14
136
119
255
143
128
270
134
122
255
129
123
251
159
157
316
10-1
4 70
6 62
5 1,
331
672
611
1,28
3 63
6 58
9 1,
225
773
748
1,52
1 83
5 82
2 1,
657
15
129
112
241
144
127
271
139
125
264
122
115
237
177
173
350
16
123
105
228
141
124
265
142
127
270
123
115
238
166
162
329
17
116
99
215
135
118
253
143
127
270
125
116
240
154
150
304
18
109
93
202
129
111
240
141
123
264
128
118
246
141
136
277
19
101
88
189
122
105
227
135
118
252
133
121
253
128
122
249
15-1
9 57
8 49
8 1,
076
672
585
1,25
7 70
0 62
0 1,
320
630
584
1,21
4 76
7 74
3 1,
510
20
93
83
176
115
98
214
128
111
239
137
124
261
121
114
235
21
86
78
164
108
93
201
122
104
226
141
126
267
121
114
235
22
79
73
152
100
88
188
115
98
213
142
126
268
123
115
238
23
73
68
141
92
83
175
107
92
199
139
122
261
126
116
243
24
68
64
132
85
77
162
100
87
187
133
116
250
131
119
250
20-2
4 39
8 36
7 76
5 50
0 43
9 93
9 57
1 49
2 1,
064
693
614
1,30
7 62
3 57
8 1,
201

NS
W D
epar
tmen
t of A
borig
inal
Affa
irs
Abo
rigin
al P
opul
atio
n P
roje
ctio
ns, N
SW
, 200
6-20
21
78
3
0 J
une
2006
30
Jun
e 20
09
3
0 J
une
2011
30
Jun
e 20
16
3
0 J
une
2021
Age
s
Mal
es
Fem
ales
To
tal
M
ales
Fe
mal
es
Tota
l
Mal
es
Fem
ales
To
tal
Mal
es
F
emal
es
Tota
l
M
ales
Fem
ales
To
tal
25
63
60
123
78
73
150
92
82
174
127
110
236
136
123
259
26
59
56
116
72
68
140
84
77
162
120
103
224
140
125
265
27
56
54
111
68
64
132
78
73
150
113
97
211
141
125
266
28
54
55
109
63
60
123
72
68
140
106
92
198
138
122
260
29
54
57
111
59
56
115
67
64
131
99
87
186
132
116
248
25-2
9 28
7 28
3 57
0 34
0 32
1 66
0 39
3 36
4 75
7 56
5 48
9 1,
054
686
611
1,29
7 30
53
60
11
4 56
54
11
0 63
60
12
3 91
82
17
3 12
6 11
0 23
5 31
53
63
11
6 54
55
10
9 59
56
11
5 84
77
16
1 11
9 10
3 22
2 32
53
65
11
8 53
57
11
1 56
54
11
0 77
72
14
9 11
2 97
20
9 33
54
65
11
9 53
60
11
3 54
55
10
9 71
68
13
9 10
5 92
19
7 34
54
65
11
9 53
63
11
6 53
57
11
0 67
64
13
0 98
87
18
4 30
-34
268
319
587
269
290
559
284
282
567
389
363
752
560
488
1,04
8 35
56
63
11
9 53
65
11
8 53
60
11
3 62
60
12
2 90
82
17
2 36
57
63
11
9 53
65
11
9 52
63
11
6 58
56
11
4 83
77
15
9 37
56
62
11
9 54
65
11
9 53
65
11
8 55
54
10
9 76
72
14
8 38
54
63
11
7 55
63
11
8 53
65
11
8 53
55
10
8 70
68
13
8 39
51
64
11
5 56
62
11
9 54
64
11
8 52
57
10
9 66
64
12
9 35
-39
273
316
589
272
321
592
265
318
583
281
281
562
384
362
746
40
47
66
113
56
62
118
55
63
118
52
60
112
61
59
121
41
43
67
110
54
63
116
56
62
118
52
63
114
57
56
113
42
41
66
107
50
64
114
55
62
117
52
64
116
54
54
108
43
40
64
104
46
65
112
53
63
116
52
65
117
52
54
107
44
40
61
101
43
66
109
50
64
114
53
64
117
51
56
108
40-4
4 21
1 32
3 53
4 24
9 32
1 56
9 26
9 31
4 58
3 26
1 31
6 57
6 27
6 27
9 55
6 45
40
57
97
40
66
10
6 46
65
11
1 54
63
11
6 51
59
11
0 46
40
54
93
39
64
10
3 43
66
10
8 55
62
11
6 51
62
11
3 47
40
50
90
39
60
10
0 40
65
10
5 54
61
11
5 51
64
11
4 48
40
46
87
39
57
96
39
63
10
2 52
62
11
4 51
64
11
5 49
40
43
83
39
53
92
39
60
99
49
63
11
1 51
63
11
4 45
-49
200
250
450
198
299
497
206
319
526
263
310
573
255
312
567

NS
W D
epar
tmen
t of A
borig
inal
Affa
irs
Abo
rigin
al P
opul
atio
n P
roje
ctio
ns, N
SW
, 200
6-20
21
79
3
0 J
une
2006
30
Jun
e 20
09
3
0 J
une
2011
30
Jun
e 20
16
3
0 J
une
2021
Age
s
Mal
es
Fem
ales
To
tal
M
ales
Fe
mal
es
Tota
l
Mal
es
Fem
ales
To
tal
Mal
es
F
emal
es
Tota
l
M
ales
Fem
ales
To
tal
50
41
39
80
39
49
89
39
56
95
45
64
109
52
62
114
51
41
36
77
39
46
85
39
53
91
41
65
106
53
61
113
52
41
33
74
40
42
82
38
49
87
39
64
103
52
60
112
53
38
32
70
40
39
79
39
45
84
38
62
99
50
60
111
54
35
31
66
40
35
76
39
42
81
37
58
96
47
61
108
50-5
4 19
6 17
2 36
8 19
8 21
2 41
0 19
3 24
5 43
8 20
0 31
3 51
3 25
4 30
4 55
8 55
31
31
62
39
33
72
39
38
78
37
55
92
43
62
10
5 56
28
31
58
37
31
68
39
35
74
37
51
88
39
63
10
2 57
25
30
54
34
31
64
38
32
71
36
47
84
37
62
99
58
23
28
51
30
30
60
36
31
67
36
44
80
35
59
95
59
22
26
48
26
30
56
33
30
63
36
40
76
35
56
91
55
-59
128
145
273
166
154
321
185
166
351
183
237
419
189
302
491
60
21
24
44
23
29
52
29
30
58
36
37
73
34
52
86
61
20
22
41
22
27
49
25
29
54
36
33
69
34
48
82
62
18
20
38
20
25
45
22
28
50
35
30
65
33
45
78
63
17
18
35
19
23
42
21
26
47
32
29
61
33
41
74
64
15
17
32
18
21
39
19
24
43
29
28
57
32
37
69
60-6
4 91
10
0 19
1 10
3 12
4 22
7 11
7 13
7 25
3 16
9 15
6 32
5 16
6 22
3 38
9 65
13
15
29
17
19
36
18
22
40
25
27
52
32
34
65
66
12
14
26
15
17
32
17
20
37
22
26
48
31
30
61
67
11
13
23
14
16
29
16
18
34
19
25
44
30
27
57
68
10
12
22
12
14
26
14
16
30
17
23
40
27
26
53
69
9
12
21
10
13
23
12
15
27
16
21
37
24
24
48
65-6
9 54
66
12
0 68
78
14
6 77
90
16
8 99
12
3 22
2 14
3 14
1 28
4 70
8
12
20
9 12
21
11
13
24
15
19
33
20
24
44
71
7
12
19
8 11
19
9
12
21
13
17
30
17
22
39
72
7 12
18
7
11
18
8 11
19
12
15
27
14
21
35
73
6
11
17
7 11
17
7
10
17
10
13
24
13
19
32
74
6 10
16
6
10
16
6 10
16
9
12
20
11
17
28
70-7
4 34
57
91
37
54
91
41
55
96
59
75
13
4 75
10
3 17
8

NS
W D
epar
tmen
t of A
borig
inal
Affa
irs
Abo
rigin
al P
opul
atio
n P
roje
ctio
ns, N
SW
, 200
6-20
21
80
3
0 J
une
2006
30
Jun
e 20
09
3
0 J
une
2011
30
Jun
e 20
16
3
0 J
une
2021
Age
s
Mal
es
Fem
ales
To
tal
M
ales
Fe
mal
es
Tota
l
Mal
es
Fem
ales
To
tal
Mal
es
F
emal
es
Tota
l
M
ales
Fem
ales
To
tal
75
5 9
14
5 10
15
5
9 15
7
10
18
10
15
25
76
5 8
12
5 9
14
5 9
14
6 9
15
9 13
21
77
4
6 11
4
8 12
4
9 13
5
8 13
7
11
18
78
4 5
9 4
7 11
4
8 11
4
7 11
6
9 15
79
5
4 8
3 6
9 3
7 10
3
7 10
5
8 13
75
-79
23
32
55
21
40
61
21
42
63
26
41
66
37
56
93
80+
16
27
43
16
26
42
14
29
43
13
34
48
15
36
51
Tota
l 4,
725
4,75
8 9,
483
5,14
1 5,
178
10,3
19
5,43
5 5,
473
10,9
09
6,22
6 6,
262
12,4
88
7,08
1 7,
115
14,1
96

NS
W D
epar
tmen
t of A
borig
inal
Affa
irs
Abo
rigin
al P
opul
atio
n P
roje
ctio
ns, N
SW
, 200
6-20
21
81
App
endi
x 6:
Pop
ulat
ion
Proj
ectio
ns b
y Si
ngle
Yea
rs o
f Age
and
Sex
, Mid
-Wes
tern
NSW
Reg
ion
30
Jun
e 20
06
30
Jun
e 20
09
30
Jun
e 20
11
30
Jun
e 20
16
30
Jun
e 20
21
Age
s
Mal
es
Fem
ales
To
tal
M
ales
Fe
mal
es
Tota
l
Mal
es
Fem
ales
To
tal
M
ales
Fe
mal
es
Tota
l
Mal
es
Fem
ales
To
tal
0 22
821
7 44
5 20
018
638
621
620
041
625
223
448
728
026
053
91
239
220
460
198
186
384
213
200
413
252
235
487
281
262
543
2 24
822
2 47
0 19
718
638
321
219
941
125
023
548
628
226
454
63
254
224
477
246
238
483
210
199
409
249
235
484
282
266
548
4 25
722
4 48
2 25
724
149
820
919
940
924
723
548
228
226
754
90-
4 1,
226
1,10
8 2,
334
1,09
81,
035
2,13
31,
060
998
2,05
71,
250
1,17
42,
425
1,40
61,
319
2,72
45
259
225
485
262
239
501
254
247
502
242
230
472
279
265
543
6 26
022
6 48
7 26
223
349
525
924
350
223
322
245
627
125
852
97
260
228
488
259
226
485
261
238
499
225
215
440
264
251
514
8 25
923
1 48
9 25
822
448
126
023
249
221
720
742
425
624
349
99
257
233
490
258
225
483
258
225
483
209
200
410
247
235
483
5-9
1,29
51,
144
2,43
9 1,
299
1,14
62,
445
1,29
31,
185
2,47
81,
126
1,07
52,
201
1,31
71,
251
2,56
810
25
423
6 49
0 25
822
648
425
622
247
925
124
449
623
922
746
611
25
023
7 48
8 25
722
948
625
722
448
125
624
049
623
022
045
012
24
423
6 48
1 25
523
248
725
722
548
225
823
549
322
221
243
413
23
623
2 46
8 25
323
448
725
622
848
325
822
948
621
420
441
814
22
622
5 45
2 24
923
648
425
423
048
525
522
247
720
619
740
410
-14
1,21
21,
167
2,37
9 1,
272
1,15
72,
428
1,28
01,
129
2,40
91,
278
1,17
02,
448
1,11
21,
060
2,17
215
21
621
8 43
3 24
323
547
725
123
348
525
421
947
324
824
149
016
20
521
0 41
5 23
523
046
524
823
548
225
422
147
525
323
749
117
19
420
0 39
4 22
522
444
924
223
447
525
422
247
625
523
248
718
18
418
7 37
1 21
421
643
023
422
946
325
322
547
825
522
648
119
17
517
2 34
7 20
320
841
122
422
344
625
122
847
925
222
047
115
-19
973
987
1,96
0 1,
119
1,11
32,
232
1,19
81,
153
2,35
11,
266
1,11
52,
381
1,26
41,
156
2,42
020
16
615
7 32
3 19
219
839
121
321
542
824
923
047
925
121
746
821
15
814
2 30
0 18
318
636
820
220
841
024
523
247
725
221
847
022
14
813
0 27
9 17
417
134
519
119
838
923
923
147
025
122
047
123
13
712
2 25
9 16
515
632
118
218
536
723
122
745
825
022
347
324
12
611
7 24
3 15
614
129
817
317
134
322
122
144
224
922
647
520
-24
735
669
1,40
4 87
085
21,
722
961
976
1,93
61,
185
1,14
22,
326
1,25
31,
104
2,35
6

NS
W D
epar
tmen
t of A
borig
inal
Affa
irs
Abo
rigin
al P
opul
atio
n P
roje
ctio
ns, N
SW
, 200
6-20
21
82
30
Jun
e 20
06
30
Jun
e 20
09
30
Jun
e 20
11
30
Jun
e 20
16
30
Jun
e 20
21
Age
s
Mal
es
Fem
ales
To
tal
M
ales
Fe
mal
es
Tota
l
Mal
es
Fem
ales
To
tal
M
ales
Fe
mal
es
Tota
l
Mal
es
Fem
ales
To
tal
25
114
113
226
147
130
276
164
155
319
210
214
424
246
229
475
26
103
108
212
136
121
257
155
141
296
199
206
405
242
230
472
27
9710
6 20
4 12
411
624
014
612
927
518
919
638
523
622
946
528
97
107
203
112
112
224
135
121
255
179
183
362
228
225
453
29
100
109
209
102
107
210
123
115
239
170
169
339
218
219
437
25-2
9 51
154
3 1,
054
621
586
1,20
772
366
11,
384
947
967
1,91
51,
170
1,13
32,
303
30
105
112
217
9610
520
111
111
122
216
115
331
520
721
241
931
10
911
5 22
4 95
106
201
101
107
208
153
139
292
196
204
400
32
112
117
229
9810
820
695
105
200
143
127
270
186
194
379
33
112
118
230
104
111
214
9410
519
913
211
925
117
618
135
734
10
911
9 22
8 10
811
422
297
107
205
121
114
234
167
167
334
30-3
4 54
758
1 1,
128
501
544
1,04
449
953
51,
034
709
652
1,36
193
195
81,
889
35
106
119
225
110
116
226
102
110
213
109
109
218
158
152
310
36
104
119
223
110
117
227
107
113
220
9910
520
414
913
728
637
10
311
8 22
1 10
811
722
510
911
522
592
103
195
140
125
265
38
102
116
217
105
117
222
109
116
225
9210
319
512
911
724
639
10
111
3 21
4 10
311
722
010
611
722
395
105
200
118
112
229
35-3
9 51
658
4 1,
100
535
586
1,12
153
357
21,
105
486
525
1,01
169
464
21,
336
40
100
110
210
101
117
218
104
117
220
100
108
208
106
107
213
41
9910
6 20
5 10
011
521
510
211
721
810
411
121
596
103
199
42
9710
3 20
0 99
112
211
100
116
216
106
113
220
9010
119
143
95
99
194
9810
820
799
114
213
106
115
220
8910
119
044
93
96
188
9710
520
298
111
209
104
115
218
9210
319
540
-44
484
513
997
496
557
1,05
350
257
41,
076
519
562
1,08
147
351
698
945
90
92
182
9610
119
797
108
205
101
115
215
9710
620
346
87
88
175
9398
191
9610
420
099
115
213
101
109
210
47
8485
16
9 91
9418
594
100
195
9711
421
110
311
121
448
81
82
163
8891
179
9297
189
9611
120
710
311
221
549
79
79
157
8587
172
8993
183
9510
820
310
011
221
245
-49
421
425
846
453
471
924
469
502
971
487
563
1,04
950
455
01,
054

NS
W D
epar
tmen
t of A
borig
inal
Affa
irs
Abo
rigin
al P
opul
atio
n P
roje
ctio
ns, N
SW
, 200
6-20
21
83
30
Jun
e 20
06
30
Jun
e 20
09
30
Jun
e 20
11
30
Jun
e 20
16
30
Jun
e 20
21
Age
s
Mal
es
Fem
ales
To
tal
M
ales
Fe
mal
es
Tota
l
Mal
es
Fem
ales
To
tal
M
ales
Fe
mal
es
Tota
l
Mal
es
Fem
ales
To
tal
50
7676
15
1 82
8316
586
9017
694
105
199
9711
220
951
72
73
145
7980
159
8386
169
9210
119
395
112
206
52
7070
13
9 76
7715
381
8216
390
9818
893
110
203
53
6767
13
4 73
7414
778
7915
688
9418
291
108
199
54
6564
12
8 70
7114
174
7615
085
9017
590
105
195
50-5
4 34
934
9 69
8 38
138
576
640
241
281
444
948
893
646
654
71,
013
55
6261
12
3 67
6813
571
7314
482
8616
889
101
190
56
6058
11
8 64
6512
968
7013
879
8216
187
9718
457
57
55
111
6262
124
6567
132
7579
154
8593
178
58
5251
10
3 60
5911
962
6412
672
7514
782
9017
159
47
47
94
5756
113
6061
120
6972
141
7986
164
55-5
9 27
827
2 55
0 31
031
062
032
733
466
037
739
477
142
146
788
860
42
43
85
5453
106
5758
115
6669
134
7582
157
61
3740
77
49
4998
5554
109
6266
128
7277
149
62
3337
69
44
4589
5151
102
5962
121
6873
142
63
3034
64
39
4180
4747
9456
5911
565
7013
464
28
32
60
3438
7141
4385
5356
108
6166
127
60-6
4 16
918
6 35
5 21
922
644
525
125
450
529
531
260
634
136
970
965
26
30
57
3034
6436
3976
5052
102
5763
120
66
2529
53
27
3259
3136
6747
4996
5359
113
67
2327
50
25
3054
2733
6043
4688
5056
105
68
2225
47
23
2851
2430
5438
4280
4652
9869
21
23
44
2126
4722
2850
3338
7143
4891
65-6
9 11
613
4 25
0 12
615
027
514
216
530
721
122
643
824
927
852
770
19
21
41
2024
4421
2646
2934
6239
4584
71
1820
38
18
2241
1924
4324
3054
3641
7872
17
18
35
1721
3817
2239
2127
4732
3870
73
1617
32
16
1935
1620
3618
2442
2834
6274
14
15
29
1417
3114
1933
1622
3824
3054
70-7
4 84
91
175
8510
318
887
111
198
107
137
244
159
188
348

NS
W D
epar
tmen
t of A
borig
inal
Affa
irs
Abo
rigin
al P
opul
atio
n P
roje
ctio
ns, N
SW
, 200
6-20
21
84
30
Jun
e 20
06
30
Jun
e 20
09
30
Jun
e 20
11
30
Jun
e 20
16
30
Jun
e 20
21
Age
s
Mal
es
Fem
ales
To
tal
M
ales
Fe
mal
es
Tota
l
Mal
es
Fem
ales
To
tal
M
ales
Fe
mal
es
Tota
l
Mal
es
Fem
ales
To
tal
75
1214
26
13
1528
1317
3014
2034
1926
4676
10
12
22
1214
2612
1527
1218
3016
2339
77
710
18
10
1222
1113
2411
1627
1320
3378
4
8 13
9
1119
912
219
1424
1117
2879
1
6 7
79
168
1018
813
219
1524
75-7
9 35
50
85
5061
112
5267
119
5482
136
6710
116
880
+ 16
27
43
2536
6127
4167
3053
8432
6699
Tota
l 8,
967
8,83
0 17
,797
9,
459
9,31
718
,776
9,80
59,
667
19,4
7310
,778
10,6
3721
,415
11,8
5711
,706
23,5
63

NS
W D
epar
tmen
t of A
borig
inal
Affa
irs
Abo
rigin
al P
opul
atio
n P
roje
ctio
ns, N
SW
, 200
6-20
21
85
App
endi
x 7:
Pop
ulat
ion
Proj
ectio
ns b
y Si
ngle
Yea
rs o
f Age
and
Sex
, New
Eng
land
Nor
th-W
est R
egio
n
3
0 J
une
2006
3
0 J
une
2009
3
0 J
une
2011
3
0 J
une
2016
3
0 J
une
2021
A
ges
Mal
es
Fe
mal
es
Tota
l
M
ales
Fem
ales
To
tal
Mal
es
Fe
mal
es
Tota
l
M
ales
Fem
ales
To
tal
Mal
es
Fe
mal
es
Tota
l
0 20
118
5 38
7 16
715
632
317
916
734
621
019
540
423
621
945
5 1
205
192
397
167
156
324
179
167
346
209
195
405
237
221
457
2 20
619
6 40
1 16
815
832
617
816
834
620
919
640
423
722
245
9 3
205
196
402
218
204
421
178
169
347
208
196
404
237
223
460
4 20
419
5 39
9 22
121
043
217
917
034
920
719
740
423
722
446
1 0-
4 1,
021
965
1,98
6 94
188
41,
825
893
840
1,73
31,
043
979
2,02
11,
183
1,10
92,
292
5 20
219
4 39
6 21
921
143
022
621
243
820
419
439
723
422
245
6 6
201
193
394
213
205
418
223
213
436
197
188
385
228
216
444
7 20
119
3 39
4 20
619
740
321
821
042
819
118
237
322
121
043
1 8
202
195
397
201
193
394
212
204
416
185
176
361
215
204
419
9 20
519
8 40
3 20
019
239
220
519
740
118
017
135
120
819
840
6 5-
9 1,
012
973
1,98
5 1,
039
997
2,03
61,
084
1,03
62,
120
956
911
1,86
71,
106
1,04
92,
155
10
208
201
409
200
192
392
200
192
392
223
210
434
202
192
393
11
210
203
413
201
194
395
199
191
390
221
211
432
195
186
381
12
208
201
409
204
197
401
199
191
390
216
208
424
189
180
368
13
202
194
396
207
200
407
200
193
393
210
202
412
183
174
357
14
193
183
376
208
202
410
203
196
399
203
195
397
177
169
347
10-1
4 1,
020
982
2,00
2 1,
020
984
2,00
41,
001
963
1,96
41,
073
1,02
52,
099
946
900
1,84
6 15
18
217
1 35
3 20
720
040
620
619
940
519
819
038
822
120
843
0 16
17
315
9 33
2 20
119
339
320
720
140
919
718
938
621
920
942
8 17
16
314
8 31
1 19
218
237
320
619
940
519
718
938
621
420
642
0 18
15
414
0 29
3 18
117
035
120
019
239
219
819
138
920
820
040
8 19
14
513
2 27
8 17
115
832
919
118
137
220
119
439
520
119
339
4 15
-19
817
750
1,56
7 95
290
21,
853
1,01
097
31,
983
992
953
1,94
51,
063
1,01
62,
079
20
137
125
262
162
147
309
181
169
349
204
198
402
196
188
384
21
129
118
247
153
139
292
171
157
328
206
199
405
195
187
382
22
121
112
233
144
132
276
161
147
308
204
198
401
195
188
383
23
113
108
221
136
125
261
152
138
290
198
191
389
197
189
386
24
106
105
211
128
118
245
144
131
275
189
180
369
199
193
392
20-2
4 60
656
9 1,
175
723
660
1,38
380
874
31,
551
1,00
196
51,
965
982
945
1,92
7
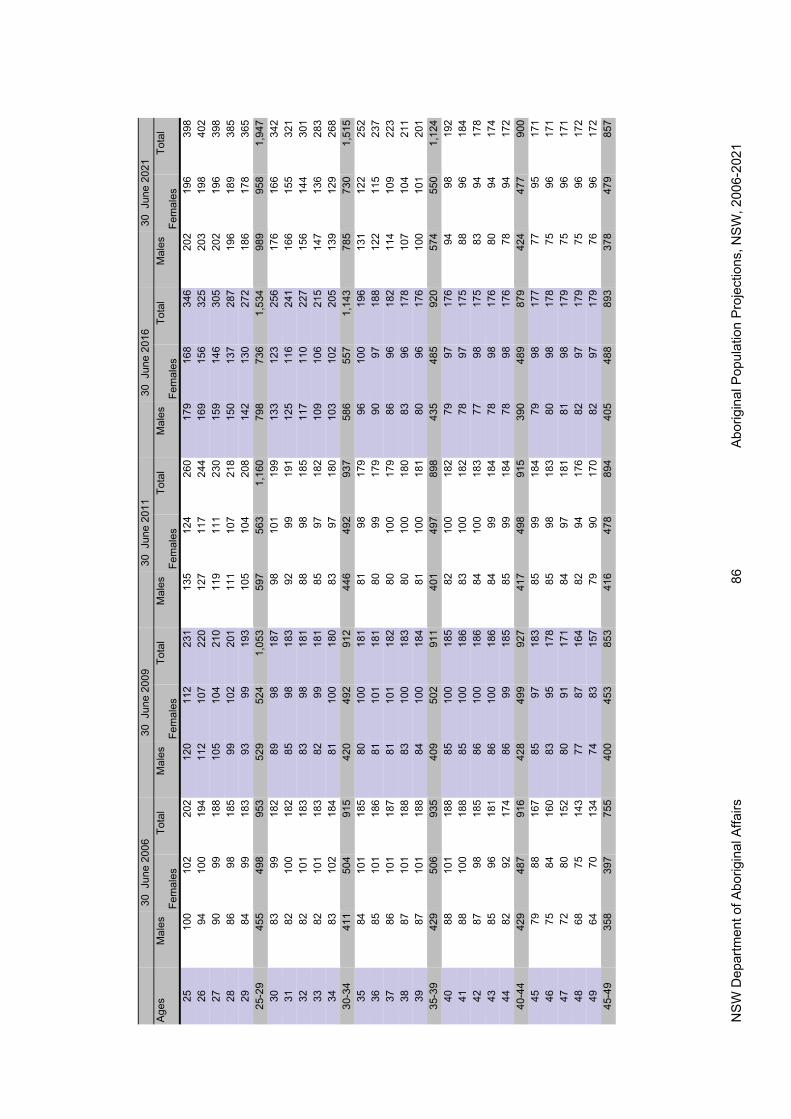
NS
W D
epar
tmen
t of A
borig
inal
Affa
irs
Abo
rigin
al P
opul
atio
n P
roje
ctio
ns, N
SW
, 200
6-20
21
86
30
Jun
e 20
06
30
Jun
e 20
09
30
Jun
e 20
11
30
Jun
e 20
16
30
Jun
e 20
21
Age
s
M
ales
Fem
ales
To
tal
Mal
es
Fe
mal
es
Tota
l
M
ales
Fem
ales
To
tal
Mal
es
Fe
mal
es
Tota
l
M
ales
Fem
ales
To
tal
25
100
102
202
120
112
231
135
124
260
179
168
346
202
196
398
26
9410
0 19
4 11
210
722
012
711
724
416
915
632
520
319
840
2 27
90
99
188
105
104
210
119
111
230
159
146
305
202
196
398
28
8698
18
5 99
102
201
111
107
218
150
137
287
196
189
385
29
8499
18
3 93
9919
310
510
420
814
213
027
218
617
836
5 25
-29
455
498
953
529
524
1,05
359
756
31,
160
798
736
1,53
498
995
81,
947
30
8399
18
2 89
9818
798
101
199
133
123
256
176
166
342
31
8210
0 18
2 85
9818
392
9919
112
511
624
116
615
532
1 32
82
101
183
8398
181
8898
185
117
110
227
156
144
301
33
8210
1 18
3 82
9918
185
9718
210
910
621
514
713
628
3 34
83
102
184
8110
018
083
9718
010
310
220
513
912
926
8 30
-34
411
504
915
420
492
912
446
492
937
586
557
1,14
378
573
01,
515
35
8410
1 18
5 80
100
181
8198
179
9610
019
613
112
225
2 36
85
101
186
8110
118
180
9917
990
9718
812
211
523
7 37
86
101
187
8110
118
280
100
179
8696
182
114
109
223
38
8710
1 18
8 83
100
183
8010
018
083
9617
810
710
421
1 39
87
101
188
8410
018
481
100
181
8096
176
100
101
201
35-3
9 42
950
6 93
5 40
950
291
140
149
789
843
548
592
057
455
01,
124
40
8810
1 18
8 85
100
185
8210
018
279
9717
694
9819
2 41
88
100
188
8510
018
683
100
182
7897
175
8896
184
42
8798
18
5 86
100
186
8410
018
377
9817
583
9417
8 43
85
96
181
8610
018
684
9918
478
9817
680
9417
4 44
82
92
174
8699
185
8599
184
7898
176
7894
172
40-4
4 42
948
7 91
6 42
849
992
741
749
891
539
048
987
942
447
790
0 45
79
88
167
8597
183
8599
184
7998
177
7795
171
46
7584
16
0 83
9517
885
9818
380
9817
875
9617
1 47
72
80
152
8091
171
8497
181
8198
179
7596
171
48
6875
14
3 77
8716
482
9417
682
9717
975
9617
2 49
64
70
134
7483
157
7990
170
8297
179
7696
172
45-4
9 35
839
7 75
5 40
045
385
341
647
889
440
548
889
337
847
985
7
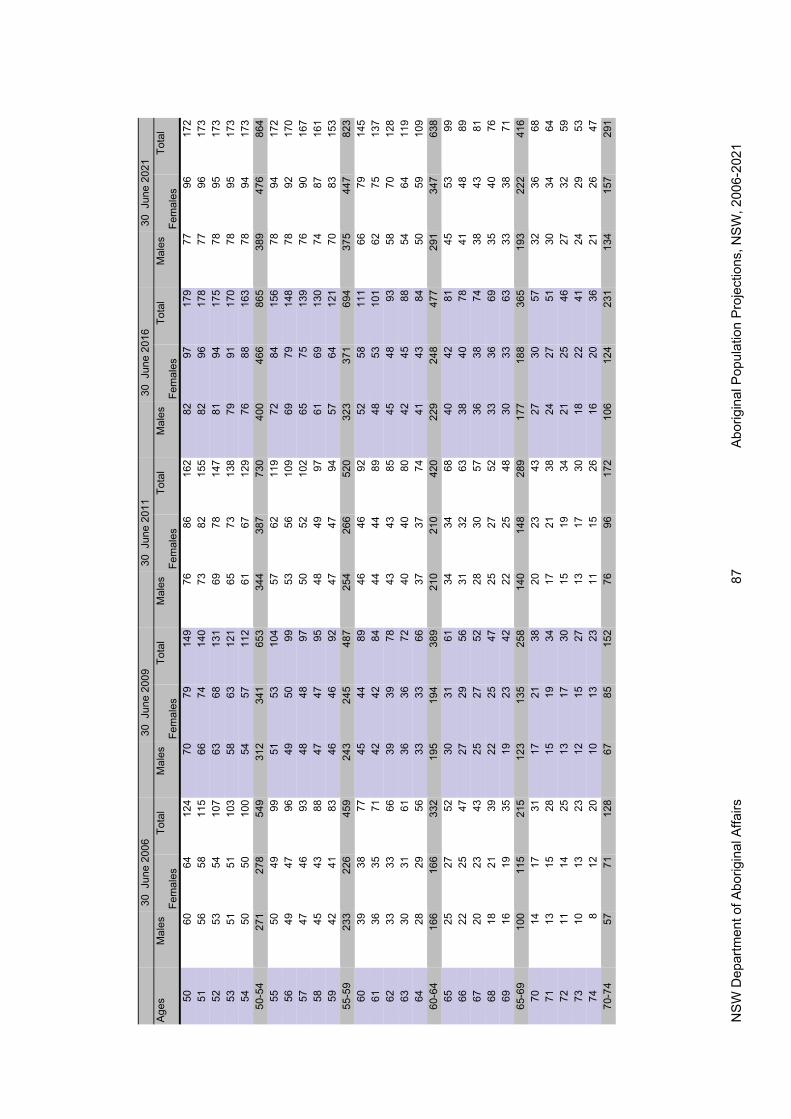
NS
W D
epar
tmen
t of A
borig
inal
Affa
irs
Abo
rigin
al P
opul
atio
n P
roje
ctio
ns, N
SW
, 200
6-20
21
87
30
Jun
e 20
06
30
Jun
e 20
09
30
Jun
e 20
11
30
Jun
e 20
16
30
Jun
e 20
21
Age
s
M
ales
Fem
ales
To
tal
Mal
es
Fe
mal
es
Tota
l
M
ales
Fem
ales
To
tal
Mal
es
Fe
mal
es
Tota
l
M
ales
Fem
ales
To
tal
50
6064
12
4 70
7914
976
8616
282
9717
977
9617
2 51
56
58
115
6674
140
7382
155
8296
178
7796
173
52
5354
10
7 63
6813
169
7814
781
9417
578
9517
3 53
51
51
103
5863
121
6573
138
7991
170
7895
173
54
5050
10
0 54
5711
261
6712
976
8816
378
9417
3 50
-54
271
278
549
312
341
653
344
387
730
400
466
865
389
476
864
55
5049
99
51
5310
457
6211
972
8415
678
9417
2 56
49
47
96
4950
9953
5610
969
7914
878
9217
0 57
47
46
93
4848
9750
5210
265
7513
976
9016
7 58
45
43
88
4747
9548
4997
6169
130
7487
161
59
4241
83
46
4692
4747
9457
6412
170
8315
3 55
-59
233
226
459
243
245
487
254
266
520
323
371
694
375
447
823
60
3938
77
45
4489
4646
9252
5811
166
7914
5 61
36
35
71
4242
8444
4489
4853
101
6275
137
62
3333
66
39
3978
4343
8545
4893
5870
128
63
3031
61
36
3672
4040
8042
4588
5464
119
64
2829
56
33
3366
3737
7441
4384
5059
109
60-6
4 16
616
6 33
2 19
519
438
921
021
042
022
924
847
729
134
763
8 65
25
27
52
3031
6134
3468
4042
8145
5399
66
22
25
47
2729
5631
3263
3840
7841
4889
67
20
23
43
2527
5228
3057
3638
7438
4381
68
18
21
39
2225
4725
2752
3336
6935
4076
69
16
19
35
1923
4222
2548
3033
6333
3871
65
-69
100
115
215
123
135
258
140
148
289
177
188
365
193
222
416
70
1417
31
17
2138
2023
4327
3057
3236
68
71
1315
28
15
1934
1721
3824
2751
3034
64
72
1114
25
13
1730
1519
3421
2546
2732
59
73
1013
23
12
1527
1317
3018
2241
2429
53
74
812
20
10
1323
1115
2616
2036
2126
47
70-7
4 57
71
128
6785
152
7696
172
106
124
231
134
157
291

NS
W D
epar
tmen
t of A
borig
inal
Affa
irs
Abo
rigin
al P
opul
atio
n P
roje
ctio
ns, N
SW
, 200
6-20
21
88
30
Jun
e 20
06
30
Jun
e 20
09
30
Jun
e 20
11
30
Jun
e 20
16
30
Jun
e 20
21
Age
s
M
ales
Fem
ales
To
tal
Mal
es
Fe
mal
es
Tota
l
M
ales
Fem
ales
To
tal
Mal
es
Fe
mal
es
Tota
l
M
ales
Fem
ales
To
tal
75
711
18
9
1221
1013
2313
1832
1823
42
76
611
17
7
1118
812
2011
1627
1621
36
77
511
16
6
1016
710
179
1423
1318
31
78
411
15
5
914
69
158
1220
1116
27
79
412
15
4
913
58
136
1017
914
23
75-7
9 25
57
82
3150
8136
5288
4871
119
6791
158
80+
2643
69
20
4969
1948
6721
4869
2759
86
Tota
l 7,
436
7,58
7 15
,023
7,
851
7,99
515
,846
8,15
18,
288
16,4
408,
981
9,10
418
,085
9,90
610
,013
19,9
19

NS
W D
epar
tmen
t of A
borig
inal
Affa
irs
Abo
rigin
al P
opul
atio
n P
roje
ctio
ns, N
SW
, 200
6-20
21
89
App
endi
x 8:
Pop
ulat
ion
Proj
ectio
ns b
y Si
ngle
Yea
rs o
f Age
and
Sex
, Nor
th C
oast
Reg
ion
3
0 J
une
2006
30
Jun
e 20
09
3
0 J
une
2011
30
Jun
e 20
16
3
0 J
une
2021
Age
s
Mal
es
Fem
ales
To
tal
M
ales
Fe
mal
es
Tota
l
Mal
es
Fem
ales
To
tal
M
ales
Fe
mal
es
Tota
l
Mal
es
Fem
ales
To
tal
0 25
7 24
9 50
7 23
9 22
3 46
2 26
0 24
2 50
2 31
4 29
2 60
6 36
1 33
5 69
6 1
269
261
529
243
228
472
263
247
509
317
297
614
366
342
708
2 27
7 26
9 54
7 24
8 23
5 48
3 26
6 25
2 51
8 32
0 30
1 62
1 37
0 34
8 71
8 3
284
275
559
298
293
591
270
258
528
322
306
628
374
354
728
4 28
9 27
9 56
8 30
9 30
5 61
4 27
5 26
4 54
0 32
5 31
0 63
5 37
8 35
9 73
7 0-
4 1,
377
1,33
3 2,
710
1,33
7 1,
284
2,62
1 1,
334
1,26
2 2,
596
1,59
7 1,
506
3,10
3 1,
848
1,73
8 3,
587
5 29
3 28
2 57
5 31
2 30
6 61
8 31
8 31
5 63
4 32
1 30
8 62
9 37
5 35
8 73
2 6
296
284
579
305
298
603
317
313
630
311
299
610
365
349
714
7 29
8 28
5 58
3 29
8 28
8 58
5 31
3 30
7 62
0 30
1 29
0 59
1 35
5 33
9 69
4 8
300
287
587
295
283
578
307
299
606
293
282
574
344
330
674
9 30
1 28
9 59
0 29
8 28
5 58
3 29
9 28
9 58
8 28
5 27
4 55
9 33
4 32
0 65
4 5-
9 1,
487
1,42
7 2,
914
1,50
7 1,
460
2,96
7 1,
553
1,52
3 3,
077
1,51
0 1,
452
2,96
3 1,
773
1,69
6 3,
469
10
301
290
591
300
287
587
296
285
581
321
319
640
324
311
635
11
299
290
589
301
289
591
299
287
585
320
316
636
314
302
616
12
295
286
581
302
291
594
301
288
589
316
310
626
304
293
597
13
288
277
565
303
292
595
303
290
593
310
302
612
295
285
580
14
278
266
544
301
292
592
304
292
596
302
292
594
288
277
565
10-1
4 1,
461
1,40
9 2,
870
1,50
7 1,
451
2,95
8 1,
502
1,44
2 2,
944
1,56
8 1,
539
3,10
7 1,
525
1,46
8 2,
993
15
268
253
521
297
287
584
304
293
597
299
287
586
324
321
646
16
256
241
497
289
279
568
302
292
594
301
289
591
322
319
641
17
243
226
470
279
267
547
297
288
586
303
291
594
318
313
631
18
229
210
439
269
255
523
290
280
570
305
293
597
312
304
616
19
214
193
406
257
242
499
280
268
548
305
294
600
304
294
598
15-1
9 1,
210
1,12
3 2,
333
1,39
2 1,
330
2,72
2 1,
473
1,42
2 2,
895
1,51
4 1,
455
2,96
9 1,
580
1,55
1 3,
131
20
198
175
373
244
227
472
269
255
525
305
295
600
300
289
590
21
183
158
341
230
211
441
258
242
500
303
294
597
303
291
594
22
168
145
313
214
194
408
245
228
472
298
290
588
304
292
597
23
155
137
292
199
175
374
230
211
441
291
281
572
305
294
599
24
143
134
276
183
159
342
214
194
408
281
269
550
306
296
601
20-2
4 84
7 74
9 1,
596
1,07
0 96
6 2,
036
1,21
6 1,
131
2,34
7 1,
478
1,43
0 2,
907
1,51
8 1,
463
2,98
1

NS
W D
epar
tmen
t of A
borig
inal
Affa
irs
Abo
rigin
al P
opul
atio
n P
roje
ctio
ns, N
SW
, 200
6-20
21
90
3
0 J
une
2006
30
Jun
e 20
09
3
0 J
une
2011
30
Jun
e 20
16
3
0 J
une
2021
Age
s
Mal
es
Fem
ales
To
tal
M
ales
Fe
mal
es
Tota
l
Mal
es
Fem
ales
To
tal
M
ales
Fe
mal
es
Tota
l
Mal
es
Fem
ales
To
tal
25
130
132
262
169
146
315
199
176
375
269
257
526
305
296
602
26
119
130
249
155
138
293
183
159
343
258
244
501
303
295
598
27
113
130
243
143
135
278
169
146
315
245
229
474
298
291
589
28
112
131
243
130
133
263
155
139
294
230
213
442
290
282
572
29
116
133
249
120
131
251
143
135
278
214
195
409
280
270
550
25-2
9 59
1 65
6 1,
247
717
683
1,39
9 84
9 75
6 1,
605
1,21
6 1,
137
2,35
3 1,
476
1,43
5 2,
911
30
122
136
258
113
131
244
131
133
264
198
177
376
269
258
526
31
127
139
267
113
132
244
120
131
251
183
161
344
257
245
502
32
131
142
273
116
134
250
113
131
245
169
148
316
244
230
474
33
133
144
277
122
137
259
113
132
245
155
140
295
229
214
443
34
132
146
278
127
140
267
117
134
251
143
136
279
213
196
410
30-3
4 64
5 70
8 1,
353
592
673
1,26
5 59
3 66
2 1,
255
849
762
1,61
1 1,
212
1,14
3 2,
354
35
132
147
279
131
143
274
122
137
259
131
134
265
198
178
376
36
132
148
281
133
145
278
127
140
268
120
133
252
183
162
344
37
131
148
280
132
146
279
131
143
274
114
132
246
168
149
317
38
129
147
276
132
148
280
132
145
278
113
133
246
155
141
296
39
126
144
270
132
149
281
132
147
279
117
135
252
143
137
280
35-3
9 65
0 73
5 1,
385
660
731
1,39
0 64
5 71
3 1,
358
594
668
1,26
1 84
6 76
7 1,
613
40
121
141
263
131
149
280
132
148
280
122
138
260
130
135
266
41
117
138
255
129
147
276
132
149
281
127
141
268
120
133
253
42
115
135
249
125
145
270
131
149
280
131
144
275
113
133
246
43
113
131
244
121
141
263
128
147
276
132
146
278
113
134
246
44
113
127
241
117
138
255
125
145
270
131
147
278
116
136
252
40-4
4 58
0 67
2 1,
252
623
720
1,34
3 64
8 73
8 1,
386
643
716
1,35
9 59
2 67
1 1,
263
45
114
123
237
114
135
249
121
141
262
131
148
279
121
138
260
46
113
119
232
113
131
244
117
138
255
131
149
280
126
141
267
47
111
115
226
113
127
240
114
135
248
130
149
278
129
144
273
48
108
112
219
113
123
236
112
131
243
127
147
274
130
146
276
49
102
109
211
112
119
231
112
127
239
123
144
267
130
146
276
45-4
9 54
8 57
7 1,
125
565
635
1,19
9 57
5 67
2 1,
247
641
737
1,37
9 63
6 71
5 1,
352
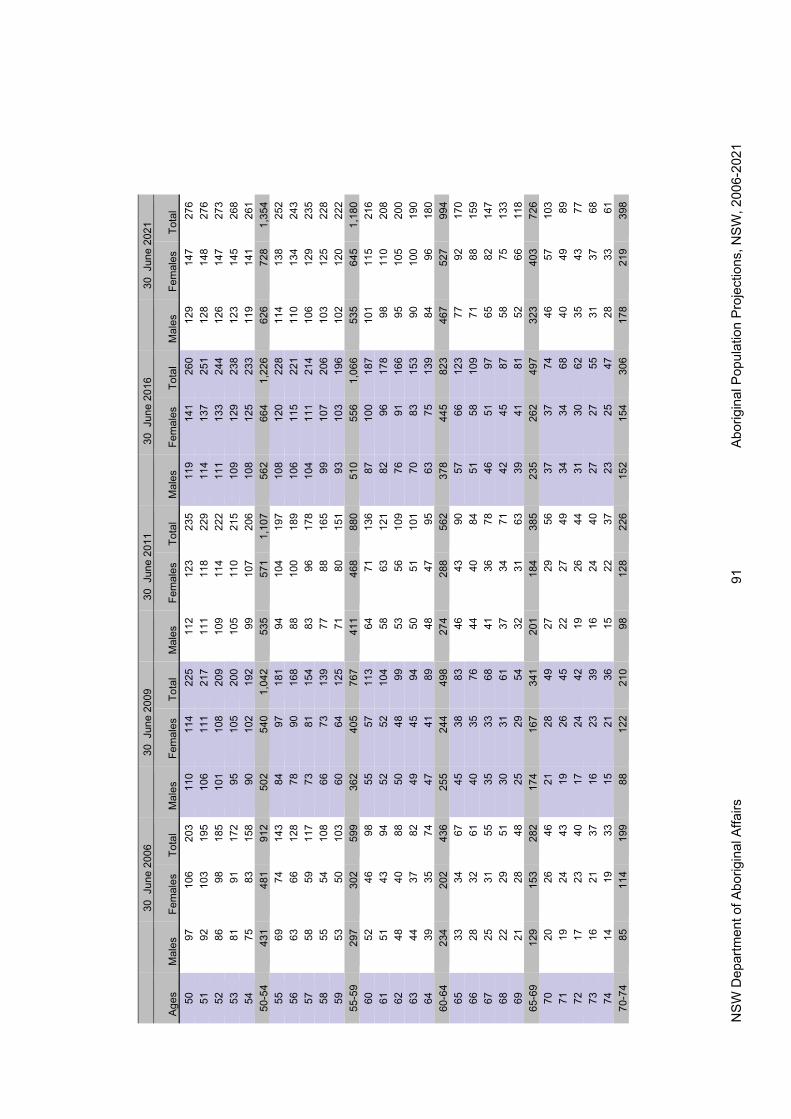
NS
W D
epar
tmen
t of A
borig
inal
Affa
irs
Abo
rigin
al P
opul
atio
n P
roje
ctio
ns, N
SW
, 200
6-20
21
91
3
0 J
une
2006
30
Jun
e 20
09
3
0 J
une
2011
30
Jun
e 20
16
3
0 J
une
2021
Age
s
Mal
es
Fem
ales
To
tal
M
ales
Fe
mal
es
Tota
l
Mal
es
Fem
ales
To
tal
M
ales
Fe
mal
es
Tota
l
Mal
es
Fem
ales
To
tal
50
97
106
203
110
114
225
112
123
235
119
141
260
129
147
276
51
92
103
195
106
111
217
111
118
229
114
137
251
128
148
276
52
86
98
185
101
108
209
109
114
222
111
133
244
126
147
273
53
81
91
172
95
105
200
105
110
215
109
129
238
123
145
268
54
75
83
158
90
102
192
99
107
206
108
125
233
119
141
261
50-5
4 43
1 48
1 91
2 50
2 54
0 1,
042
535
571
1,10
7 56
2 66
4 1,
226
626
728
1,35
4 55
69
74
14
3 84
97
18
1 94
10
4 19
7 10
8 12
0 22
8 11
4 13
8 25
2 56
63
66
12
8 78
90
16
8 88
10
0 18
9 10
6 11
5 22
1 11
0 13
4 24
3 57
58
59
11
7 73
81
15
4 83
96
17
8 10
4 11
1 21
4 10
6 12
9 23
5 58
55
54
10
8 66
73
13
9 77
88
16
5 99
10
7 20
6 10
3 12
5 22
8 59
53
50
10
3 60
64
12
5 71
80
15
1 93
10
3 19
6 10
2 12
0 22
2 55
-59
297
302
599
362
405
767
411
468
880
510
556
1,06
6 53
5 64
5 1,
180
60
52
46
98
55
57
113
64
71
136
87
100
187
101
115
216
61
51
43
94
52
52
104
58
63
121
82
96
178
98
110
208
62
48
40
88
50
48
99
53
56
109
76
91
166
95
105
200
63
44
37
82
49
45
94
50
51
101
70
83
153
90
100
190
64
39
35
74
47
41
89
48
47
95
63
75
139
84
96
180
60-6
4 23
4 20
2 43
6 25
5 24
4 49
8 27
4 28
8 56
2 37
8 44
5 82
3 46
7 52
7 99
4 65
33
34
67
45
38
83
46
43
90
57
66
12
3 77
92
17
0 66
28
32
61
40
35
76
44
40
84
51
58
10
9 71
88
15
9 67
25
31
55
35
33
68
41
36
78
46
51
97
65
82
14
7 68
22
29
51
30
31
61
37
34
71
42
45
87
58
75
13
3 69
21
28
48
25
29
54
32
31
63
39
41
81
52
66
11
8 65
-69
129
153
282
174
167
341
201
184
385
235
262
497
323
403
726
70
20
26
46
21
28
49
27
29
56
37
37
74
46
57
103
71
19
24
43
19
26
45
22
27
49
34
34
68
40
49
89
72
17
23
40
17
24
42
19
26
44
31
30
62
35
43
77
73
16
21
37
16
23
39
16
24
40
27
27
55
31
37
68
74
14
19
33
15
21
36
15
22
37
23
25
47
28
33
61
70-7
4 85
11
4 19
9 88
12
2 21
0 98
12
8 22
6 15
2 15
4 30
6 17
8 21
9 39
8

NS
W D
epar
tmen
t of A
borig
inal
Affa
irs
Abo
rigin
al P
opul
atio
n P
roje
ctio
ns, N
SW
, 200
6-20
21
92
3
0 J
une
2006
30
Jun
e 20
09
3
0 J
une
2011
30
Jun
e 20
16
3
0 J
une
2021
Age
s
Mal
es
Fem
ales
To
tal
M
ales
Fe
mal
es
Tota
l
Mal
es
Fem
ales
To
tal
M
ales
Fe
mal
es
Tota
l
Mal
es
Fem
ales
To
tal
75
12
17
29
13
19
33
13
20
34
18
23
41
25
29
54
76
10
15
25
12
18
29
12
19
31
14
21
35
22
25
48
77
10
12
22
10
16
26
11
17
28
12
19
30
19
22
42
78
10
9 19
8
14
22
9 15
24
10
17
26
16
19
35
79
11
5
17
7 12
19
8
13
21
8 15
23
13
17
29
75
-79
53
59
112
51
78
129
53
84
137
62
94
156
96
113
209
80+
27
53
80
31
50
81
30
55
85
32
68
100
36
79
115
Tota
l 10
,652
10
,753
21
,405
11
,431
11
,539
22
,970
11
,991
12
,100
24
,091
13
,539
13
,644
27
,183
15
,268
15
,362
30
,630

NS
W D
epar
tmen
t of A
borig
inal
Affa
irs
Abo
rigin
al P
opul
atio
n P
roje
ctio
ns, N
SW
, 200
6-20
21
93
App
endi
x 9:
Pop
ulat
ion
Proj
ectio
ns b
y Si
ngle
Yea
rs o
f Age
and
Sex
, Riv
erin
a-M
urra
y R
egio
n
30
Jun
e 20
06
3
0 J
une
2009
30
Jun
e 20
11
3
0 J
une
2016
30
Jun
e 20
21
Age
s
Mal
es
Fem
ales
To
tal
M
ales
Fe
mal
es
Tota
l
Mal
es
Fem
ales
To
tal
M
ales
Fe
mal
es
Tota
l
Mal
es
Fem
ales
To
tal
0 25
7 24
9 50
7 23
9 22
3 46
2 26
0 24
2 50
2 31
4 29
2 60
6 36
1 33
5 69
6 1
269
261
529
243
228
472
263
247
509
317
297
614
366
342
708
2 27
7 26
9 54
7 24
8 23
5 48
3 26
6 25
2 51
8 32
0 30
1 62
1 37
0 34
8 71
8 3
284
275
559
298
293
591
270
258
528
322
306
628
374
354
728
4 28
9 27
9 56
8 30
9 30
5 61
4 27
5 26
4 54
0 32
5 31
0 63
5 37
8 35
9 73
7 0-
4 1,
377
1,33
3 2,
710
1,33
7 1,
284
2,62
1 1,
334
1,26
2 2,
596
1,59
7 1,
506
3,10
3 1,
848
1,73
8 3,
587
5 29
3 28
2 57
5 31
2 30
6 61
8 31
8 31
5 63
4 32
1 30
8 62
9 37
5 35
8 73
2 6
296
284
579
305
298
603
317
313
630
311
299
610
365
349
714
7 29
8 28
5 58
3 29
8 28
8 58
5 31
3 30
7 62
0 30
1 29
0 59
1 35
5 33
9 69
4 8
300
287
587
295
283
578
307
299
606
293
282
574
344
330
674
9 30
1 28
9 59
0 29
8 28
5 58
3 29
9 28
9 58
8 28
5 27
4 55
9 33
4 32
0 65
4 5-
9 1,
487
1,42
7 2,
914
1,50
7 1,
460
2,96
7 1,
553
1,52
3 3,
077
1,51
0 1,
452
2,96
3 1,
773
1,69
6 3,
469
10
301
290
591
300
287
587
296
285
581
321
319
640
324
311
635
11
299
290
589
301
289
591
299
287
585
320
316
636
314
302
616
12
295
286
581
302
291
594
301
288
589
316
310
626
304
293
597
13
288
277
565
303
292
595
303
290
593
310
302
612
295
285
580
14
278
266
544
301
292
592
304
292
596
302
292
594
288
277
565
10-1
4 1,
461
1,40
9 2,
870
1,50
7 1,
451
2,95
8 1,
502
1,44
2 2,
944
1,56
8 1,
539
3,10
7 1,
525
1,46
8 2,
993
15
268
253
521
297
287
584
304
293
597
299
287
586
324
321
646
16
256
241
497
289
279
568
302
292
594
301
289
591
322
319
641
17
243
226
470
279
267
547
297
288
586
303
291
594
318
313
631
18
229
210
439
269
255
523
290
280
570
305
293
597
312
304
616
19
214
193
406
257
242
499
280
268
548
305
294
600
304
294
598
15-1
9 1,
210
1,12
3 2,
333
1,39
2 1,
330
2,72
2 1,
473
1,42
2 2,
895
1,51
4 1,
455
2,96
9 1,
580
1,55
1 3,
131
20
198
175
373
244
227
472
269
255
525
305
295
600
300
289
590
21
183
158
341
230
211
441
258
242
500
303
294
597
303
291
594
22
168
145
313
214
194
408
245
228
472
298
290
588
304
292
597
23
155
137
292
199
175
374
230
211
441
291
281
572
305
294
599
24
143
134
276
183
159
342
214
194
408
281
269
550
306
296
601
20-2
4 84
7 74
9 1,
596
1,07
0 96
6 2,
036
1,21
6 1,
131
2,34
7 1,
478
1,43
0 2,
907
1,51
8 1,
463
2,98
1

NS
W D
epar
tmen
t of A
borig
inal
Affa
irs
Abo
rigin
al P
opul
atio
n P
roje
ctio
ns, N
SW
, 200
6-20
21
94
3
0 J
une
2006
30
Jun
e 20
09
3
0 J
une
2011
30
Jun
e 20
16
3
0 J
une
2021
Age
s
Mal
es
Fem
ales
To
tal
M
ales
Fe
mal
es
Tota
l
Mal
es
Fem
ales
To
tal
M
ales
Fe
mal
es
Tota
l
Mal
es
Fem
ales
To
tal
25
130
132
262
169
146
315
199
176
375
269
257
526
305
296
602
26
119
130
249
155
138
293
183
159
343
258
244
501
303
295
598
27
113
130
243
143
135
278
169
146
315
245
229
474
298
291
589
28
112
131
243
130
133
263
155
139
294
230
213
442
290
282
572
29
116
133
249
120
131
251
143
135
278
214
195
409
280
270
550
25-2
9 59
1 65
6 1,
247
717
683
1,39
9 84
9 75
6 1,
605
1,21
6 1,
137
2,35
3 1,
476
1,43
5 2,
911
30
122
136
258
113
131
244
131
133
264
198
177
376
269
258
526
31
127
139
267
113
132
244
120
131
251
183
161
344
257
245
502
32
131
142
273
116
134
250
113
131
245
169
148
316
244
230
474
33
133
144
277
122
137
259
113
132
245
155
140
295
229
214
443
34
132
146
278
127
140
267
117
134
251
143
136
279
213
196
410
30-3
4 64
5 70
8 1,
353
592
673
1,26
5 59
3 66
2 1,
255
849
762
1,61
1 1,
212
1,14
3 2,
354
35
132
147
279
131
143
274
122
137
259
131
134
265
198
178
376
36
132
148
281
133
145
278
127
140
268
120
133
252
183
162
344
37
131
148
280
132
146
279
131
143
274
114
132
246
168
149
317
38
129
147
276
132
148
280
132
145
278
113
133
246
155
141
296
39
126
144
270
132
149
281
132
147
279
117
135
252
143
137
280
35-3
9 65
0 73
5 1,
385
660
731
1,39
0 64
5 71
3 1,
358
594
668
1,26
1 84
6 76
7 1,
613
40
121
141
263
131
149
280
132
148
280
122
138
260
130
135
266
41
117
138
255
129
147
276
132
149
281
127
141
268
120
133
253
42
115
135
249
125
145
270
131
149
280
131
144
275
113
133
246
43
113
131
244
121
141
263
128
147
276
132
146
278
113
134
246
44
113
127
241
117
138
255
125
145
270
131
147
278
116
136
252
40-4
4 58
0 67
2 1,
252
623
720
1,34
3 64
8 73
8 1,
386
643
716
1,35
9 59
2 67
1 1,
263
45
114
123
237
114
135
249
121
141
262
131
148
279
121
138
260
46
113
119
232
113
131
244
117
138
255
131
149
280
126
141
267
47
111
115
226
113
127
240
114
135
248
130
149
278
129
144
273
48
108
112
219
113
123
236
112
131
243
127
147
274
130
146
276
49
102
109
211
112
119
231
112
127
239
123
144
267
130
146
276
45-4
9 54
8 57
7 1,
125
565
635
1,19
9 57
5 67
2 1,
247
641
737
1,37
9 63
6 71
5 1,
352

NS
W D
epar
tmen
t of A
borig
inal
Affa
irs
Abo
rigin
al P
opul
atio
n P
roje
ctio
ns, N
SW
, 200
6-20
21
95
3
0 J
une
2006
30
Jun
e 20
09
3
0 J
une
2011
30
Jun
e 20
16
3
0 J
une
2021
Age
s
Mal
es
Fem
ales
To
tal
M
ales
Fe
mal
es
Tota
l
Mal
es
Fem
ales
To
tal
M
ales
Fe
mal
es
Tota
l
Mal
es
Fem
ales
To
tal
50
97
106
203
110
114
225
112
123
235
119
141
260
129
147
276
51
92
103
195
106
111
217
111
118
229
114
137
251
128
148
276
52
86
98
185
101
108
209
109
114
222
111
133
244
126
147
273
53
81
91
172
95
105
200
105
110
215
109
129
238
123
145
268
54
75
83
158
90
102
192
99
107
206
108
125
233
119
141
261
50-5
4 43
1 48
1 91
2 50
2 54
0 1,
042
535
571
1,10
7 56
2 66
4 1,
226
626
728
1,35
4 55
69
74
14
3 84
97
18
1 94
10
4 19
7 10
8 12
0 22
8 11
4 13
8 25
2 56
63
66
12
8 78
90
16
8 88
10
0 18
9 10
6 11
5 22
1 11
0 13
4 24
3 57
58
59
11
7 73
81
15
4 83
96
17
8 10
4 11
1 21
4 10
6 12
9 23
5 58
55
54
10
8 66
73
13
9 77
88
16
5 99
10
7 20
6 10
3 12
5 22
8 59
53
50
10
3 60
64
12
5 71
80
15
1 93
10
3 19
6 10
2 12
0 22
2 55
-59
297
302
599
362
405
767
411
468
880
510
556
1,06
6 53
5 64
5 1,
180
60
52
46
98
55
57
113
64
71
136
87
100
187
101
115
216
61
51
43
94
52
52
104
58
63
121
82
96
178
98
110
208
62
48
40
88
50
48
99
53
56
109
76
91
166
95
105
200
63
44
37
82
49
45
94
50
51
101
70
83
153
90
100
190
64
39
35
74
47
41
89
48
47
95
63
75
139
84
96
180
60-6
4 23
4 20
2 43
6 25
5 24
4 49
8 27
4 28
8 56
2 37
8 44
5 82
3 46
7 52
7 99
4 65
33
34
67
45
38
83
46
43
90
57
66
12
3 77
92
17
0 66
28
32
61
40
35
76
44
40
84
51
58
10
9 71
88
15
9 67
25
31
55
35
33
68
41
36
78
46
51
97
65
82
14
7 68
22
29
51
30
31
61
37
34
71
42
45
87
58
75
13
3 69
21
28
48
25
29
54
32
31
63
39
41
81
52
66
11
8 65
-69
129
153
282
174
167
341
201
184
385
235
262
497
323
403
726
70
20
26
46
21
28
49
27
29
56
37
37
74
46
57
103
71
19
24
43
19
26
45
22
27
49
34
34
68
40
49
89
72
17
23
40
17
24
42
19
26
44
31
30
62
35
43
77
73
16
21
37
16
23
39
16
24
40
27
27
55
31
37
68
74
14
19
33
15
21
36
15
22
37
23
25
47
28
33
61
70-7
4 85
11
4 19
9 88
12
2 21
0 98
12
8 22
6 15
2 15
4 30
6 17
8 21
9 39
8

NS
W D
epar
tmen
t of A
borig
inal
Affa
irs
Abo
rigin
al P
opul
atio
n P
roje
ctio
ns, N
SW
, 200
6-20
21
96
3
0 J
une
2006
30
Jun
e 20
09
3
0 J
une
2011
30
Jun
e 20
16
3
0 J
une
2021
Age
s
Mal
es
Fem
ales
To
tal
M
ales
Fe
mal
es
Tota
l
Mal
es
Fem
ales
To
tal
M
ales
Fe
mal
es
Tota
l
Mal
es
Fem
ales
To
tal
75
12
17
29
13
19
33
13
20
34
18
23
41
25
29
54
76
10
15
25
12
18
29
12
19
31
14
21
35
22
25
48
77
10
12
22
10
16
26
11
17
28
12
19
30
19
22
42
78
10
9 19
8
14
22
9 15
24
10
17
26
16
19
35
79
11
5
17
7 12
19
8
13
21
8 15
23
13
17
29
75
-79
53
59
112
51
78
129
53
84
137
62
94
156
96
113
209
80+
27
53
80
31
50
81
30
55
85
32
68
100
36
79
115
Tota
l 10
,652
10
,753
21
,405
11
,431
11
,539
22
,970
11
,991
12
,100
24
,091
13
,539
13
,644
27
,183
15
,268
15
,362
30
,630
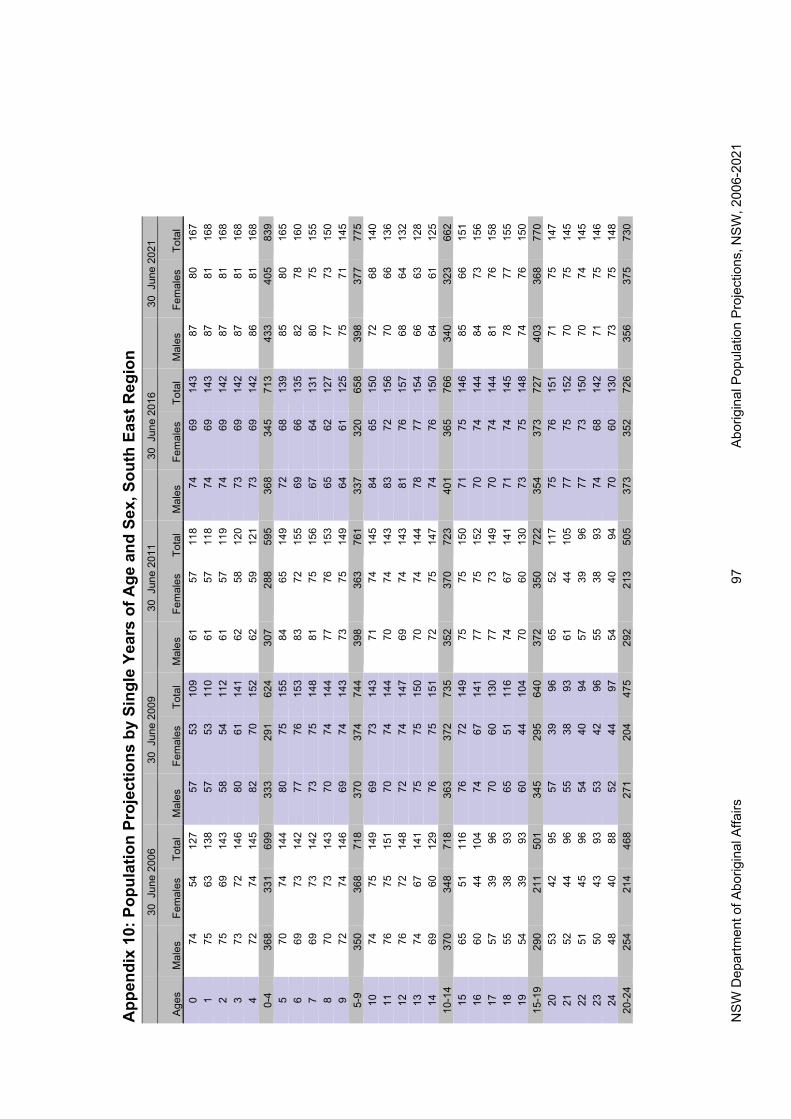
NS
W D
epar
tmen
t of A
borig
inal
Affa
irs
Abo
rigin
al P
opul
atio
n P
roje
ctio
ns, N
SW
, 200
6-20
21
97
App
endi
x 10
: Pop
ulat
ion
Proj
ectio
ns b
y Si
ngle
Yea
rs o
f Age
and
Sex
, Sou
th E
ast R
egio
n
30
Jun
e 20
06
3
0 J
une
2009
30
Jun
e 20
11
3
0 J
une
2016
30
Jun
e 20
21
Age
s
Mal
es
Fem
ales
To
tal
M
ales
Fe
mal
es
Tota
l
Mal
es
Fem
ales
To
tal
M
ales
Fe
mal
es
Tota
l
Mal
es
Fem
ales
To
tal
0 74
54
12
7 57
53
10
9 61
57
11
8 74
69
14
3 87
80
16
7 1
75
63
138
57
53
110
61
57
118
74
69
143
87
81
168
2 75
69
14
3 58
54
11
2 61
57
11
9 74
69
14
2 87
81
16
8 3
73
72
146
80
61
141
62
58
120
73
69
142
87
81
168
4 72
74
14
5 82
70
15
2 62
59
12
1 73
69
14
2 86
81
16
8 0-
4 36
8 33
1 69
9 33
3 29
1 62
4 30
7 28
8 59
5 36
8 34
5 71
3 43
3 40
5 83
9 5
70
74
144
80
75
155
84
65
149
72
68
139
85
80
165
6 69
73
14
2 77
76
15
3 83
72
15
5 69
66
13
5 82
78
16
0 7
69
73
142
73
75
148
81
75
156
67
64
131
80
75
155
8 70
73
14
3 70
74
14
4 77
76
15
3 65
62
12
7 77
73
15
0 9
72
74
146
69
74
143
73
75
149
64
61
125
75
71
145
5-9
350
368
718
370
374
744
398
363
761
337
320
658
398
377
775
10
74
75
149
69
73
143
71
74
145
84
65
150
72
68
140
11
76
75
151
70
74
144
70
74
143
83
72
156
70
66
136
12
76
72
148
72
74
147
69
74
143
81
76
157
68
64
132
13
74
67
141
75
75
150
70
74
144
78
77
154
66
63
128
14
69
60
129
76
75
151
72
75
147
74
76
150
64
61
125
10-1
4 37
0 34
8 71
8 36
3 37
2 73
5 35
2 37
0 72
3 40
1 36
5 76
6 34
0 32
3 66
2 15
65
51
11
6 76
72
14
9 75
75
15
0 71
75
14
6 85
66
15
1 16
60
44
10
4 74
67
14
1 77
75
15
2 70
74
14
4 84
73
15
6 17
57
39
96
70
60
13
0 77
73
14
9 70
74
14
4 81
76
15
8 18
55
38
93
65
51
11
6 74
67
14
1 71
74
14
5 78
77
15
5 19
54
39
93
60
44
10
4 70
60
13
0 73
75
14
8 74
76
15
0 15
-19
290
211
501
345
295
640
372
350
722
354
373
727
403
368
770
20
53
42
95
57
39
96
65
52
117
75
76
151
71
75
147
21
52
44
96
55
38
93
61
44
105
77
75
152
70
75
145
22
51
45
96
54
40
94
57
39
96
77
73
150
70
74
145
23
50
43
93
53
42
96
55
38
93
74
68
142
71
75
146
24
48
40
88
52
44
97
54
40
94
70
60
130
73
75
148
20-2
4 25
4 21
4 46
8 27
1 20
4 47
5 29
2 21
3 50
5 37
3 35
2 72
6 35
6 37
5 73
0

NS
W D
epar
tmen
t of A
borig
inal
Affa
irs
Abo
rigin
al P
opul
atio
n P
roje
ctio
ns, N
SW
, 200
6-20
21
98
3
0 J
une
2006
30
Jun
e 20
09
3
0 J
une
2011
30
Jun
e 20
16
3
0 J
une
2021
Age
s
Mal
es
Fem
ales
To
tal
M
ales
Fe
mal
es
Tota
l
Mal
es
Fem
ales
To
tal
M
ales
Fe
mal
es
Tota
l
Mal
es
Fem
ales
To
tal
25
47
37
84
51
45
96
53
43
96
65
52
117
75
76
151
26
46
34
80
50
43
93
52
45
97
61
45
105
77
76
153
27
45
32
77
48
40
89
51
45
96
57
40
97
77
73
150
28
43
32
75
47
37
84
50
43
93
55
39
94
74
68
142
29
42
32
74
46
34
80
48
40
89
54
40
94
70
61
131
25-2
9 22
3 16
7 39
0 24
3 20
0 44
2 25
5 21
6 47
1 29
2 21
5 50
8 37
3 35
4 72
8 30
40
33
73
45
33
77
47
37
84
53
43
96
65
52
11
7 31
39
34
72
43
32
75
46
34
81
52
45
97
61
45
10
6 32
38
34
72
42
33
74
45
33
78
51
45
97
57
40
97
33
37
35
72
40
33
73
43
32
76
50
44
94
55
39
94
34
37
35
73
39
34
73
42
33
75
48
41
89
54
41
95
30
-34
191
171
362
209
164
373
223
169
392
255
218
473
292
217
509
35
38
36
74
38
34
72
40
34
74
47
37
85
53
43
97
36
38
36
74
37
35
72
39
34
73
46
35
81
52
45
97
37
38
36
74
37
35
73
38
35
72
45
33
78
51
46
97
38
37
36
73
38
36
74
37
35
72
43
33
76
50
44
94
39
36
36
72
38
36
74
37
36
73
42
33
75
48
41
89
35-3
9 18
7 18
0 36
7 18
8 17
7 36
5 19
1 17
3 36
4 22
3 17
1 39
4 25
4 22
0 47
4 40
35
35
70
38
37
74
38
36
74
40
34
74
47
38
85
41
34
34
68
37
36
73
38
36
74
39
34
73
46
35
81
42
33
34
66
36
36
72
38
37
74
38
35
72
45
33
78
43
31
33
64
35
35
70
37
36
73
37
35
73
43
33
76
44
30
32
62
34
34
68
36
36
72
37
36
73
42
33
75
40
-44
162
168
330
180
178
357
187
181
368
191
174
365
222
172
395
45
28
32
60
32
34
66
35
35
70
38
36
74
40
34
74
46
27
31
58
31
33
64
33
34
68
38
37
74
38
34
73
47
25
31
56
29
33
62
32
34
66
37
37
74
37
35
72
48
24
30
54
28
32
60
31
33
64
36
36
73
37
35
72
49
23
29
52
26
31
58
29
32
62
35
36
71
36
36
72
45-4
9 12
8 15
3 28
1 14
7 16
2 30
9 16
0 16
9 32
8 18
4 18
2 36
5 18
8 17
5 36
2

NS
W D
epar
tmen
t of A
borig
inal
Affa
irs
Abo
rigin
al P
opul
atio
n P
roje
ctio
ns, N
SW
, 200
6-20
21
99
3
0 J
une
2006
30
Jun
e 20
09
3
0 J
une
2011
30
Jun
e 20
16
3
0 J
une
2021
Age
s
Mal
es
Fem
ales
To
tal
M
ales
Fe
mal
es
Tota
l
Mal
es
Fem
ales
To
tal
M
ales
Fe
mal
es
Tota
l
Mal
es
Fem
ales
To
tal
50
22
29
51
25
31
56
27
32
59
34
35
69
37
36
73
51
21
28
49
24
30
54
26
31
57
32
34
67
36
36
73
52
20
27
47
23
29
52
25
30
55
31
33
64
36
36
72
53
20
26
46
21
28
50
23
30
53
29
33
62
35
36
71
54
21
24
45
20
28
48
22
29
51
28
32
60
34
35
69
50-5
4 10
4 13
3 23
7 11
3 14
6 25
9 12
4 15
2 27
6 15
4 16
8 32
2 17
8 18
0 35
8 55
22
23
44
20
27
46
21
28
49
26
31
58
32
34
67
56
22
21
43
20
25
45
20
27
47
25
31
55
31
33
64
57
22
20
42
20
24
44
19
26
45
23
30
53
29
33
62
58
20
18
39
21
22
43
19
25
44
22
29
51
28
32
59
59
18
17
35
21
21
42
19
23
43
21
28
49
26
31
57
55
-59
104
99
203
101
118
219
98
130
228
117
148
265
146
163
309
60
15
16
31
21
19
40
20
22
42
19
27
46
24
30
54
61
13
14
27
19
18
37
20
20
40
18
26
44
23
29
52
62
11
13
24
17
16
33
20
19
39
17
25
42
21
28
49
63
10
12
22
14
15
29
18
17
35
17
23
40
20
27
47
64
10
11
21
12
14
25
16
16
32
17
22
39
18
26
44
60-6
4 59
66
12
5 82
82
16
4 95
93
18
8 89
12
2 21
1 10
6 14
0 24
6 65
11
9
20
10
12
22
13
14
28
18
20
37
17
25
42
66
11
8 19
9
11
20
11
13
24
18
18
36
16
24
39
67
11
7 18
9
10
19
9 12
21
17
17
34
15
22
37
68
10
7
17
10
9 18
9
11
19
15
15
31
14
21
35
69
8 6
14
10
8 17
9
9 18
13
14
27
14
19
33
65
-69
51
38
89
48
50
98
50
60
110
80
84
164
76
110
186
70
6 6
12
9 7
16
9 8
17
11
13
23
14
17
31
71
5 6
11
8 6
14
9 7
16
8 11
20
14
16
29
72
4
5 9
7 6
12
8 6
14
7 10
17
13
14
27
73
3
5 8
5 5
10
7 5
13
6 9
15
11
12
24
74
3 4
7 4
5 9
6 5
11
6 7
14
9 11
20
70
-74
21
26
47
34
28
62
39
32
70
38
50
88
61
70
131

NS
W D
epar
tmen
t of A
borig
inal
Affa
irs
Abo
rigin
al P
opul
atio
n P
roje
ctio
ns, N
SW
, 200
6-20
21
100
3
0 J
une
2006
30
Jun
e 20
09
3
0 J
une
2011
30
Jun
e 20
16
3
0 J
une
2021
Age
s
Mal
es
Fem
ales
To
tal
M
ales
Fe
mal
es
Tota
l
Mal
es
Fem
ales
To
tal
M
ales
Fe
mal
es
Tota
l
Mal
es
Fem
ales
To
tal
75
3 4
6 3
4 7
4 5
9 6
6 12
7
10
17
76
2 3
6 2
4 6
3 4
7 6
5 11
5
8 14
77
2
3 5
2 3
5 2
4 6
5 4
10
4 7
12
78
1 2
4 2
3 5
2 3
5 4
4 8
4 6
10
79
0 2
2 2
2 4
2 3
4 3
3 7
3 5
8 75
-79
9 13
22
11
17
28
13
19
32
24
23
48
24
37
61
80
+ 4
14
18
4 13
17
5
13
18
7 16
23
13
19
32
To
tal
2,87
5 2,
700
5,57
5 3,
043
2,87
0 5,
913
3,16
1 2,
992
6,15
3 3,
490
3,32
6 6,
816
3,86
3 3,
704
7,56
8

NS
W D
epar
tmen
t of A
borig
inal
Affa
irs
Abo
rigin
al P
opul
atio
n P
roje
ctio
ns, N
SW
, 200
6-20
21
101
App
endi
x 11
: Pop
ulat
ion
Proj
ectio
ns b
y Si
ngle
Yea
rs o
f Age
and
Sex
, Wes
tern
and
Sou
th W
est S
ydne
y R
egio
n
30
Jun
e 20
06
3
0 J
une
2009
30
Jun
e 20
11
3
0 J
une
2016
30
Jun
e 20
21
Age
s
Mal
es
Fem
ales
To
tal
M
ales
Fe
mal
es
Tota
l
Mal
es
Fem
ales
To
tal
M
ales
Fe
mal
es
Tota
l
Mal
es
Fem
ales
To
tal
0 31
8 38
5 70
3 33
1 31
0 64
1 35
8 33
5 69
3 42
1 39
3 81
5 46
6 43
5 90
1 1
339
386
726
312
298
609
339
323
662
404
383
787
453
428
881
2 35
0 38
6 73
5 29
3 28
6 57
9 31
9 31
1 63
0 38
6 37
3 75
8 43
9 42
1 86
0 3
352
384
736
300
386
687
300
299
599
367
361
729
424
414
837
4 35
1 38
1 73
1 32
2 38
8 71
0 28
1 28
8 56
9 34
8 35
0 69
8 40
8 40
5 81
3 0-
4 1,
710
1,92
1 3,
631
1,55
7 1,
668
3,22
6 1,
597
1,55
5 3,
152
1,92
6 1,
860
3,78
7 2,
189
2,10
4 4,
293
5 34
7 37
8 72
5 33
5 38
7 72
3 29
2 38
7 67
9 33
2 33
8 67
0 39
5 39
6 79
1 6
346
376
722
345
384
729
320
388
708
319
325
644
385
385
770
7 34
9 37
6 72
5 35
0 38
1 73
1 33
7 38
7 72
4 30
7 31
2 61
9 37
3 37
4 74
7 8
357
379
736
350
377
728
347
384
731
294
299
594
362
362
724
9 37
1 38
3 75
4 34
9 37
6 72
5 35
2 38
0 73
2 28
2 28
8 57
0 34
9 35
0 69
9 5-
9 1,
770
1,89
2 3,
662
1,72
9 1,
905
3,63
5 1,
648
1,92
7 3,
575
1,53
5 1,
562
3,09
6 1,
864
1,86
7 3,
731
10
386
388
774
351
376
727
352
377
729
297
387
684
337
337
674
11
397
390
787
360
378
738
351
376
726
325
388
713
324
324
649
12
397
389
786
374
383
756
353
376
729
342
387
728
311
311
623
13
382
381
762
389
387
776
362
378
740
352
383
735
299
299
598
14
355
368
724
400
390
790
376
382
758
357
380
736
287
287
574
10-1
4 1,
917
1,91
6 3,
833
1,87
4 1,
915
3,78
8 1,
794
1,88
9 3,
683
1,67
2 1,
924
3,59
6 1,
559
1,55
9 3,
117
15
325
354
679
400
388
788
391
387
778
357
377
733
302
386
688
16
298
340
637
384
381
765
401
390
791
355
375
730
329
387
716
17
277
325
602
358
368
726
401
388
789
358
375
733
346
386
732
18
266
310
576
327
354
681
386
380
766
366
378
743
356
383
738
19
263
294
558
300
340
639
359
368
727
379
382
761
360
379
739
15-1
9 1,
429
1,62
3 3,
052
1,76
8 1,
830
3,59
8 1,
938
1,91
3 3,
851
1,81
5 1,
886
3,70
1 1,
693
1,92
1 3,
614
20
263
279
541
279
325
603
328
353
682
394
386
780
360
376
736
21
260
263
523
268
309
577
301
339
640
404
389
793
358
374
732
22
255
247
502
265
294
559
280
324
604
403
387
791
360
374
734
23
246
232
478
264
278
542
269
309
578
387
379
767
368
377
745
24
235
218
453
261
263
523
265
293
559
361
367
728
381
381
762
20-2
4 1,
258
1,23
9 2,
497
1,33
6 1,
468
2,80
4 1,
443
1,61
9 3,
062
1,95
0 1,
908
3,85
8 1,
827
1,88
2 3,
709
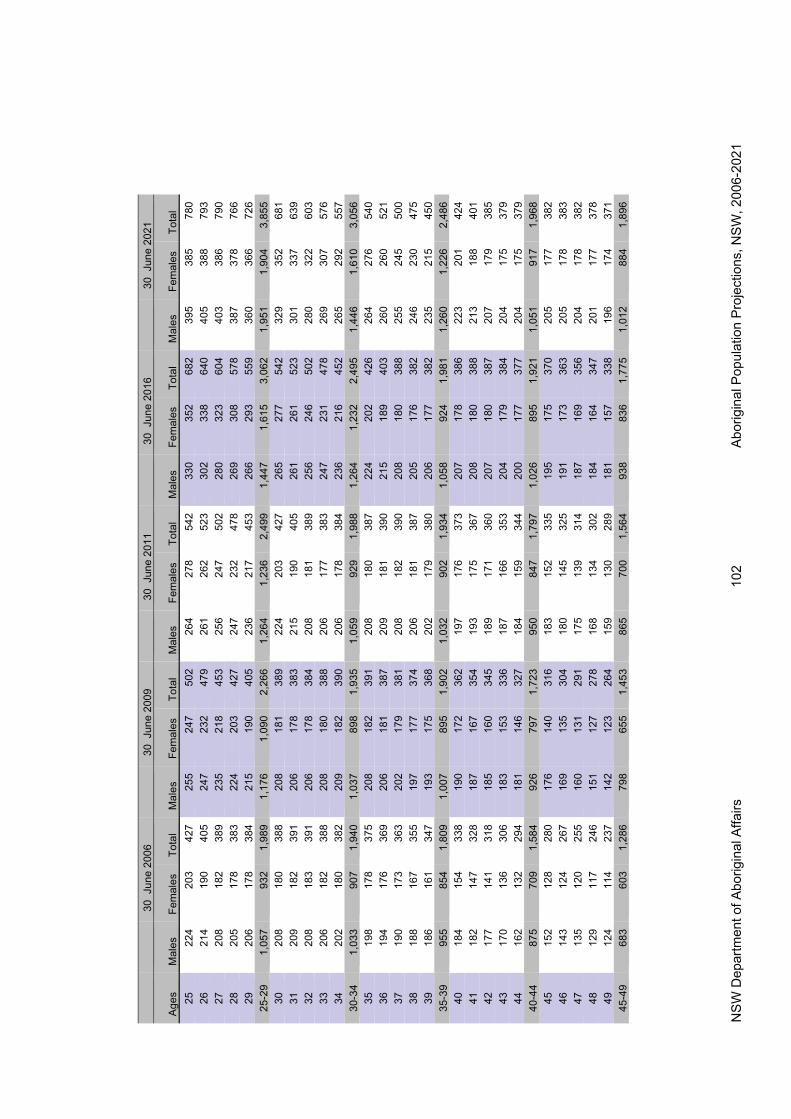
NS
W D
epar
tmen
t of A
borig
inal
Affa
irs
Abo
rigin
al P
opul
atio
n P
roje
ctio
ns, N
SW
, 200
6-20
21
102
3
0 J
une
2006
30
Jun
e 20
09
3
0 J
une
2011
30
Jun
e 20
16
3
0 J
une
2021
Age
s
Mal
es
Fem
ales
To
tal
M
ales
Fe
mal
es
Tota
l
Mal
es
Fem
ales
To
tal
M
ales
Fe
mal
es
Tota
l
Mal
es
Fem
ales
To
tal
25
224
203
427
255
247
502
264
278
542
330
352
682
395
385
780
26
214
190
405
247
232
479
261
262
523
302
338
640
405
388
793
27
208
182
389
235
218
453
256
247
502
280
323
604
403
386
790
28
205
178
383
224
203
427
247
232
478
269
308
578
387
378
766
29
206
178
384
215
190
405
236
217
453
266
293
559
360
366
726
25-2
9 1,
057
932
1,98
9 1,
176
1,09
0 2,
266
1,26
4 1,
236
2,49
9 1,
447
1,61
5 3,
062
1,95
1 1,
904
3,85
5 30
20
8 18
0 38
8 20
8 18
1 38
9 22
4 20
3 42
7 26
5 27
7 54
2 32
9 35
2 68
1 31
20
9 18
2 39
1 20
6 17
8 38
3 21
5 19
0 40
5 26
1 26
1 52
3 30
1 33
7 63
9 32
20
8 18
3 39
1 20
6 17
8 38
4 20
8 18
1 38
9 25
6 24
6 50
2 28
0 32
2 60
3 33
20
6 18
2 38
8 20
8 18
0 38
8 20
6 17
7 38
3 24
7 23
1 47
8 26
9 30
7 57
6 34
20
2 18
0 38
2 20
9 18
2 39
0 20
6 17
8 38
4 23
6 21
6 45
2 26
5 29
2 55
7 30
-34
1,03
3 90
7 1,
940
1,03
7 89
8 1,
935
1,05
9 92
9 1,
988
1,26
4 1,
232
2,49
5 1,
446
1,61
0 3,
056
35
198
178
375
208
182
391
208
180
387
224
202
426
264
276
540
36
194
176
369
206
181
387
209
181
390
215
189
403
260
260
521
37
190
173
363
202
179
381
208
182
390
208
180
388
255
245
500
38
188
167
355
197
177
374
206
181
387
205
176
382
246
230
475
39
186
161
347
193
175
368
202
179
380
206
177
382
235
215
450
35-3
9 95
5 85
4 1,
809
1,00
7 89
5 1,
902
1,03
2 90
2 1,
934
1,05
8 92
4 1,
981
1,26
0 1,
226
2,48
6 40
18
4 15
4 33
8 19
0 17
2 36
2 19
7 17
6 37
3 20
7 17
8 38
6 22
3 20
1 42
4 41
18
2 14
7 32
8 18
7 16
7 35
4 19
3 17
5 36
7 20
8 18
0 38
8 21
3 18
8 40
1 42
17
7 14
1 31
8 18
5 16
0 34
5 18
9 17
1 36
0 20
7 18
0 38
7 20
7 17
9 38
5 43
17
0 13
6 30
6 18
3 15
3 33
6 18
7 16
6 35
3 20
4 17
9 38
4 20
4 17
5 37
9 44
16
2 13
2 29
4 18
1 14
6 32
7 18
4 15
9 34
4 20
0 17
7 37
7 20
4 17
5 37
9 40
-44
875
709
1,58
4 92
6 79
7 1,
723
950
847
1,79
7 1,
026
895
1,92
1 1,
051
917
1,96
8 45
15
2 12
8 28
0 17
6 14
0 31
6 18
3 15
2 33
5 19
5 17
5 37
0 20
5 17
7 38
2 46
14
3 12
4 26
7 16
9 13
5 30
4 18
0 14
5 32
5 19
1 17
3 36
3 20
5 17
8 38
3 47
13
5 12
0 25
5 16
0 13
1 29
1 17
5 13
9 31
4 18
7 16
9 35
6 20
4 17
8 38
2 48
12
9 11
7 24
6 15
1 12
7 27
8 16
8 13
4 30
2 18
4 16
4 34
7 20
1 17
7 37
8 49
12
4 11
4 23
7 14
2 12
3 26
4 15
9 13
0 28
9 18
1 15
7 33
8 19
6 17
4 37
1 45
-49
683
603
1,28
6 79
8 65
5 1,
453
865
700
1,56
4 93
8 83
6 1,
775
1,01
2 88
4 1,
896

NS
W D
epar
tmen
t of A
borig
inal
Affa
irs
Abo
rigin
al P
opul
atio
n P
roje
ctio
ns, N
SW
, 200
6-20
21
103
3
0 J
une
2006
30
Jun
e 20
09
3
0 J
une
2011
30
Jun
e 20
16
3
0 J
une
2021
Age
s
Mal
es
Fem
ales
To
tal
M
ales
Fe
mal
es
Tota
l
Mal
es
Fem
ales
To
tal
M
ales
Fe
mal
es
Tota
l
Mal
es
Fem
ales
To
tal
50
118
111
229
134
119
253
149
126
275
179
149
328
191
172
363
51
113
108
221
127
115
243
140
122
262
176
142
318
186
169
356
52
108
104
212
122
112
234
132
118
250
171
136
307
182
165
348
53
105
99
204
116
109
225
125
114
240
163
131
294
178
160
338
54
103
93
196
110
106
217
120
111
231
154
127
280
175
153
328
50-5
4 54
7 51
5 1,
062
609
562
1,17
1 66
7 59
0 1,
257
843
685
1,52
8 91
4 81
9 1,
733
55
102
86
188
106
102
208
114
108
222
144
122
266
172
145
317
56
100
80
180
102
97
199
108
105
213
135
118
252
168
138
306
57
96
74
170
100
91
190
103
100
204
126
114
240
163
131
294
58
88
68
156
98
84
182
100
95
195
119
110
229
154
126
280
59
77
62
139
96
78
174
97
89
186
113
106
219
145
121
266
55-5
9 46
2 37
1 83
3 50
2 45
1 95
4 52
2 49
7 1,
019
636
569
1,20
5 80
2 66
1 1,
463
60
66
57
122
91
72
163
95
82
177
106
103
209
134
116
251
61
55
52
107
83
66
149
93
76
168
100
99
199
124
111
236
62
47
46
94
73
60
133
88
70
157
95
94
189
115
107
222
63
43
42
84
61
54
116
79
64
143
90
89
179
108
103
210
64
40
37
78
51
49
100
69
58
127
87
82
169
101
98
199
60-6
4 25
1 23
4 48
5 36
0 30
1 66
1 42
4 34
9 77
3 47
9 46
7 94
6 58
2 53
5 1,
118
65
39
33
72
44
44
88
58
52
110
84
75
160
94
94
188
66
37
29
66
39
39
78
48
47
95
81
69
150
87
90
177
67
35
26
61
36
35
71
41
42
82
75
63
138
81
85
166
68
33
24
57
35
31
65
36
37
73
67
57
123
76
79
155
69
30
23
54
33
27
59
33
33
66
57
51
108
71
72
144
65-6
9 17
5 13
6 31
1 18
7 17
5 36
2 21
6 21
1 42
7 36
3 31
4 67
7 40
9 42
1 83
0 70
28
23
51
31
24
54
31
29
60
47
45
92
67
65
13
3 71
26
22
48
28
22
50
29
25
54
38
40
78
63
59
12
2 72
24
21
45
25
21
46
27
22
49
31
35
66
57
52
10
9 73
23
19
42
23
20
43
24
20
44
27
30
57
49
46
95
74
22
17
39
21
19
40
22
19
40
24
26
50
40
41
81
70
-74
122
103
225
128
105
233
134
114
248
166
176
342
277
263
540
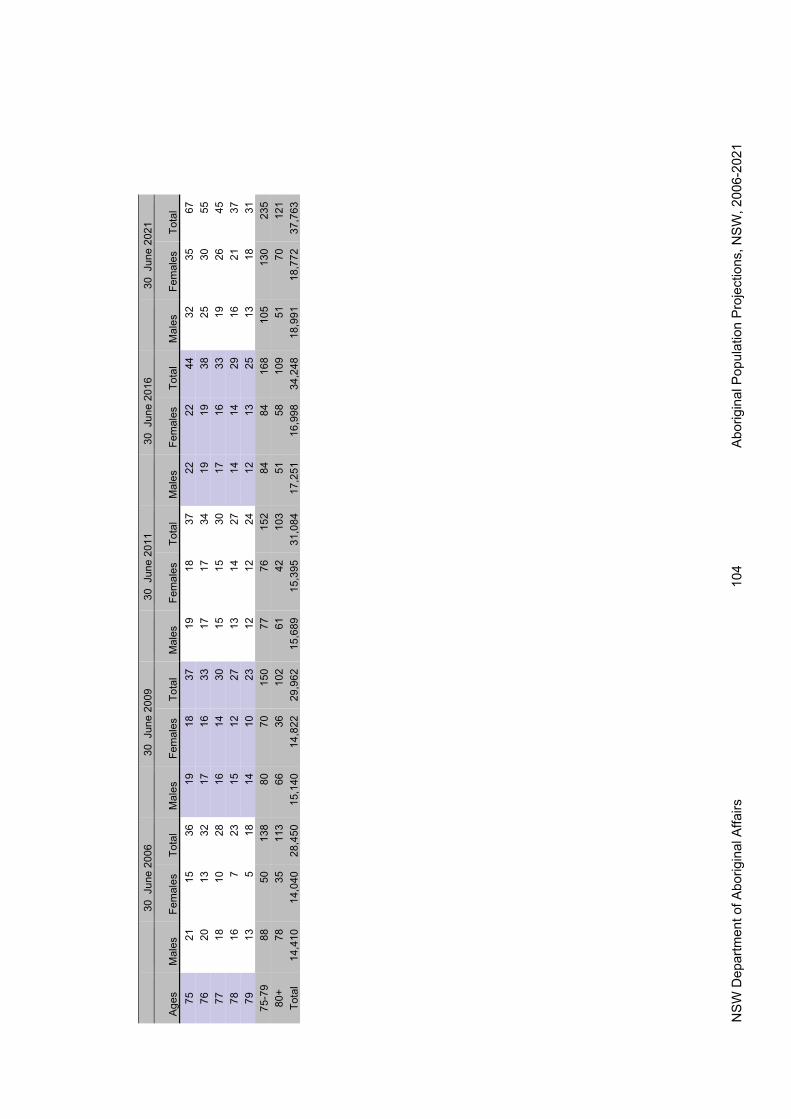
NS
W D
epar
tmen
t of A
borig
inal
Affa
irs
Abo
rigin
al P
opul
atio
n P
roje
ctio
ns, N
SW
, 200
6-20
21
104
3
0 J
une
2006
30
Jun
e 20
09
3
0 J
une
2011
30
Jun
e 20
16
3
0 J
une
2021
Age
s
Mal
es
Fem
ales
To
tal
M
ales
Fe
mal
es
Tota
l
Mal
es
Fem
ales
To
tal
M
ales
Fe
mal
es
Tota
l
Mal
es
Fem
ales
To
tal
75
21
15
36
19
18
37
19
18
37
22
22
44
32
35
67
76
20
13
32
17
16
33
17
17
34
19
19
38
25
30
55
77
18
10
28
16
14
30
15
15
30
17
16
33
19
26
45
78
16
7 23
15
12
27
13
14
27
14
14
29
16
21
37
79
13
5
18
14
10
23
12
12
24
12
13
25
13
18
31
75-7
9 88
50
13
8 80
70
15
0 77
76
15
2 84
84
16
8 10
5 13
0 23
5 80
+ 78
35
11
3 66
36
10
2 61
42
10
3 51
58
10
9 51
70
12
1 To
tal
14,4
10
14,0
40
28,4
50
15,1
40
14,8
22
29,9
62
15,6
89
15,3
95
31,0
84
17,2
51
16,9
98
34,2
48
18,9
91
18,7
72
37,7
63

NS
W D
epar
tmen
t of A
borig
inal
Affa
irs
Abo
rigin
al P
opul
atio
n P
roje
ctio
ns, N
SW
, 200
6-20
21
105
App
endi
x 12
: Pop
ulat
ion
Proj
ectio
ns b
y Si
ngle
Yea
rs o
f Age
and
Sex
, Wes
tern
NSW
Reg
ion
30
Jun
e 20
06
30
Jun
e 20
09
30
Jun
e 20
11
30
Jun
e 20
16
30
Jun
e 20
21
Age
s
M
ales
Fem
ales
To
tal
Mal
es
Fe
mal
es
Tota
l
M
ales
Fem
ales
To
tal
M
ales
Fe
mal
es
Tota
l
M
ales
Fem
ales
To
tal
0 12
111
3 23
4 96
9018
610
598
204
127
118
245
142
133
275
1 11
911
4 23
3 85
8116
693
8918
3 11
511
022
513
312
625
92
116
113
229
7473
147
8280
162
104
101
205
123
118
241
3 11
411
0 22
4 99
9919
870
7214
2 92
9218
411
311
022
34
112
107
219
9799
196
6063
123
8183
164
102
102
204
0-4
581
558
1,13
9 45
144
289
441
140
381
3 51
950
31,
022
612
589
1,20
25
110
105
214
9910
120
089
9218
1 73
7715
095
9719
26
108
103
212
105
104
210
9698
194
7174
144
9294
186
7 10
810
3 21
1 11
210
721
910
210
320
5 68
7013
890
9118
18
108
105
213
114
108
222
108
106
215
6567
133
8788
175
9 10
910
8 21
8 11
310
621
911
510
922
4 63
6512
884
8516
95-
9 54
452
4 1,
068
543
526
1,06
951
050
81,
018
340
353
693
448
454
902
10
111
113
223
113
106
218
117
109
227
9797
193
8182
163
11
112
116
227
113
108
221
116
108
224
103
103
207
7878
157
12
111
116
228
114
112
226
116
108
224
110
108
218
7576
151
13
109
113
222
115
116
231
116
110
226
116
112
228
7373
145
14
106
106
213
116
119
235
117
114
231
122
115
237
7070
141
10-1
4 54
956
4 1,
113
571
561
1,13
158
255
01,
132
548
534
1,08
237
837
975
715
10
399
20
2 11
611
923
511
811
823
6 12
511
524
010
410
220
616
99
92
191
114
116
230
119
121
240
124
113
237
111
108
219
17
9586
18
1 11
110
922
011
912
124
0 12
311
323
611
711
323
018
90
82
172
107
101
209
117
117
234
124
114
238
124
116
239
19
8579
16
4 10
494
198
114
110
224
125
118
242
130
119
249
15-1
9 47
343
8 91
1 55
253
91,
091
587
587
1,17
4 62
057
31,
193
586
557
1,14
320
79
76
156
100
8818
811
010
321
3 12
512
224
713
211
925
121
74
73
148
9484
178
106
9620
2 12
612
425
013
011
724
722
69
70
140
8881
169
101
9019
1 12
512
424
912
911
624
523
66
66
132
8278
161
9685
181
122
120
243
129
118
247
24
6262
12
5 77
7515
290
8217
2 11
911
323
212
912
125
020
-24
351
349
700
441
407
848
504
455
959
617
604
1,22
165
059
01,
240

NS
W D
epar
tmen
t of A
borig
inal
Affa
irs
Abo
rigin
al P
opul
atio
n P
roje
ctio
ns, N
SW
, 200
6-20
21
106
30
Jun
e 20
06
30
Jun
e 20
09
30
Jun
e 20
11
30
Jun
e 20
16
30
Jun
e 20
21
Age
s
M
ales
Fem
ales
To
tal
Mal
es
Fe
mal
es
Tota
l
M
ales
Fem
ales
To
tal
M
ales
Fe
mal
es
Tota
l
M
ales
Fem
ales
To
tal
25
5958
11
8 72
7214
484
7916
3 11
410
622
013
012
525
426
57
55
112
6868
136
7876
155
110
9820
913
012
725
727
56
53
109
6564
129
7373
146
105
9219
712
912
725
528
56
54
110
6260
121
6969
138
9988
187
126
123
248
29
5756
11
3 59
5611
566
6513
1 93
8417
812
211
623
725
-29
285
277
562
325
320
645
371
362
733
523
468
991
635
617
1,25
330
59
59
118
5855
113
6361
124
8782
169
117
108
225
31
6161
12
2 58
5611
461
5811
8 82
7916
111
310
121
432
63
63
126
6058
118
5956
116
7775
153
109
9520
333
63
65
128
6261
123
6057
117
7372
145
103
9019
434
63
65
128
6463
127
6259
121
7068
138
9787
185
30-3
4 30
931
3 62
2 30
229
259
430
529
059
5 39
037
576
554
048
11,
021
35
6266
12
8 65
6513
064
6212
6 67
6413
191
8517
636
61
67
129
6666
132
6664
130
6561
125
8682
168
37
6167
12
8 65
6713
267
6613
3 64
5912
381
7816
038
61
65
126
6568
133
6767
135
6460
124
7775
152
39
6161
12
3 64
6913
367
6813
5 66
6212
874
7114
535
-39
307
326
633
325
335
660
331
328
658
326
305
631
411
390
800
40
6257
11
9 64
6813
266
6913
5 68
6513
271
6613
841
62
54
115
6366
129
6570
135
6967
136
6963
132
42
6051
11
2 63
6312
665
6913
4 70
6813
967
6112
943
57
51
108
6358
122
6467
131
7070
140
6862
129
44
5352
10
5 63
5511
864
6312
7 70
7014
069
6413
340
-44
294
265
559
317
310
627
325
338
662
348
339
687
344
317
660
45
4853
10
2 62
5211
464
5912
4 69
7113
971
6613
746
44
54
98
5952
111
6455
120
6871
139
7268
140
47
4153
94
55
5310
863
5311
6 67
7113
873
7014
348
40
50
91
5054
104
6053
112
6768
135
7371
144
49
4146
87
46
5510
156
5310
9 66
6513
172
7114
345
-49
215
257
472
271
266
537
307
274
580
337
345
682
360
347
706
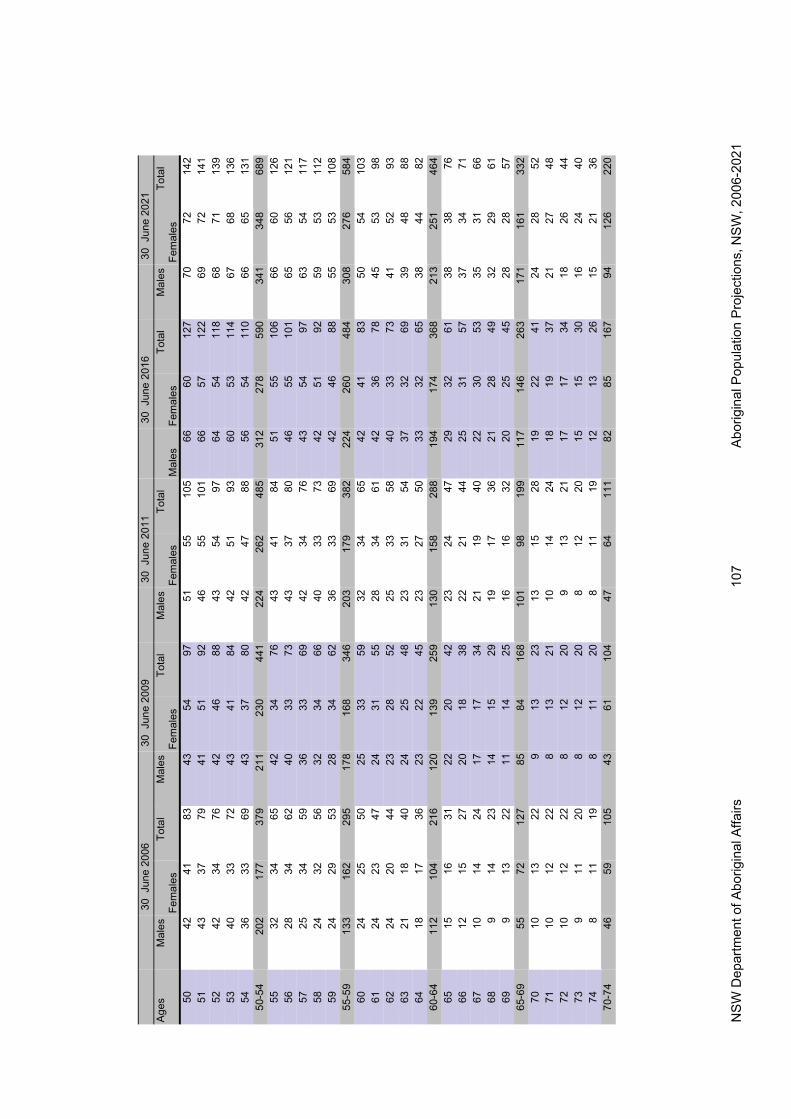
NS
W D
epar
tmen
t of A
borig
inal
Affa
irs
Abo
rigin
al P
opul
atio
n P
roje
ctio
ns, N
SW
, 200
6-20
21
107
30
Jun
e 20
06
30
Jun
e 20
09
30
Jun
e 20
11
30
Jun
e 20
16
30
Jun
e 20
21
Age
s
M
ales
Fem
ales
To
tal
Mal
es
Fe
mal
es
Tota
l
M
ales
Fem
ales
To
tal
M
ales
Fe
mal
es
Tota
l
M
ales
Fem
ales
To
tal
50
4241
83
43
5497
5155
105
6660
127
7072
142
51
4337
79
41
5192
4655
101
6657
122
6972
141
52
4234
76
42
4688
4354
97
6454
118
6871
139
53
4033
72
43
4184
4251
93
6053
114
6768
136
54
3633
69
43
3780
4247
88
5654
110
6665
131
50-5
4 20
217
7 37
9 21
123
044
122
426
248
5 31
227
859
034
134
868
955
32
34
65
4234
7643
4184
51
5510
666
6012
656
28
34
62
4033
7343
3780
46
5510
165
5612
157
25
34
59
3633
6942
3476
43
5497
6354
117
58
2432
56
32
3466
4033
73
4251
9259
5311
259
24
29
53
2834
6236
3369
42
4688
5553
108
55-5
9 13
316
2 29
5 17
816
834
620
317
938
2 22
426
048
430
827
658
460
24
25
50
2533
5932
3465
42
4183
5054
103
61
2423
47
24
3155
2834
61
4236
7845
5398
62
2420
44
23
2852
2533
58
4033
7341
5293
63
2118
40
24
2548
2331
54
3732
6939
4888
64
1817
36
23
2245
2327
50
3332
6538
4482
60-6
4 11
210
4 21
6 12
013
925
913
015
828
8 19
417
436
821
325
146
465
15
16
31
2220
4223
2447
29
3261
3838
7666
12
15
27
2018
3822
2144
25
3157
3734
7167
10
14
24
1717
3421
1940
22
3053
3531
6668
9
14
23
1415
2919
1736
21
2849
3229
6169
9
13
22
1114
2516
1632
20
2545
2828
5765
-69
5572
12
7 85
8416
810
198
199
117
146
263
171
161
332
70
1013
22
9
1323
1315
28
1922
4124
2852
71
1012
22
8
1321
1014
24
1819
3721
2748
72
1012
22
8
1220
913
21
1717
3418
2644
73
911
20
8
1220
812
20
1515
3016
2440
74
811
19
8
1120
811
19
1213
2615
2136
70-7
4 46
59
105
4361
104
4764
111
8285
167
9412
622
0

NS
W D
epar
tmen
t of A
borig
inal
Affa
irs
Abo
rigin
al P
opul
atio
n P
roje
ctio
ns, N
SW
, 200
6-20
21
108
30
Jun
e 20
06
30
Jun
e 20
09
30
Jun
e 20
11
30
Jun
e 20
16
30
Jun
e 20
21
Age
s
M
ales
Fem
ales
To
tal
Mal
es
Fe
mal
es
Tota
l
M
ales
Fem
ales
To
tal
M
ales
Fe
mal
es
Tota
l
M
ales
Fem
ales
To
tal
75
710
17
8
1018
711
18
1012
2214
1731
76
68
15
710
177
1017
7
1118
1315
2777
6
7 13
6
915
69
15
69
1511
1224
78
66
12
58
136
814
5
913
911
2079
7
4 12
4
711
57
12
48
127
916
75-7
9 33
35
68
3043
7331
4576
32
4881
5464
118
80+
1635
51
19
3251
1834
52
1938
5719
4262
Tota
l 4,
505
4,51
5 9,
020
4,78
44,
756
9,54
04,
986
4,93
39,
919
5,54
85,
431
10,9
796,
164
5,98
912
,153